news release gray reports record operating results … · news release gray reports record...
TRANSCRIPT

4370 Peachtree Road, NE, Atlanta, GA 30319 | P 404.504.9828 F 404.261.9607 | www.gray.tv
NEWS RELEASE
Gray Reports Record Operating Results
Atlanta, Georgia – November 6, 2017. . . Gray Television, Inc. (“Gray,” “we,” “us” or “our”) (NYSE: GTN and
GTN.A) today announces record-setting results of operations for the third quarter and year-to-date periods ended
September 30, 2017, including record revenue and net income.
Our total advertising revenue for the third quarter of 2017 was near the high end of our guidance range. In
particular, our combined local and national advertising revenue increased by approximately $13.5 million, or 11%, in the
third quarter of 2017 compared to the third quarter of 2016. On a Combined Historical Basis (as defined below), our
aggregate local and national revenue (excluding approximately $8.2 million of advertising revenue attributable to the
broadcast of the 2016 Summer Olympics) increased by approximately 3% in the third quarter of 2017 compared to the
third quarter of 2016. In addition, our political advertising revenue significantly exceeded the high end of our guidance.
We recorded broadcast and corporate and administrative expenses that were below the low end of our guidance. That
range for broadcast expenses included the assumption that non-cash stock based compensation awards of approximately
$3.4 million would be granted to certain non-executive employees during the third quarter. However, those awards were
not made until October 2017. This performance produced fully diluted net income per share in the third quarter and first
nine months of 2017 of $0.21 and $1.33, respectively.
As of September 30, 2017, our Total Leverage Ratio, Net of all Cash (as defined below) has improved to 4.99 times,
on a trailing eight-quarter basis.
Looking forward, on a Combined Historical Basis, we believe that our fourth quarter of 2017 combined local and
national advertising revenue will increase in the low single digit percentage range, when compared to the fourth quarter of
2016.
Financial Highlights:
Record Revenue - The following table presents certain of our record As Reported revenue and our Combined
Historical Basis revenue for the third quarter of 2017 and the respective percentage change from the third quarter
of 2016 (dollars in millions):
% Combined %
As-Reported Change Historical Change
Revenue (less agency commissions):
Local (including internet/digital/mobile) 110.0$ 8 % 110.0$ (4)%
National 31.0 22 % 31.0 3 %
Political 4.0 (82)% 4.0 (86)%
Retransmission consent 70.2 37 % 70.2 23 %
Other 3.8 7 % 3.8 0 %
Total 219.0$ 7 % 219.0$ (6)%
Three Months Ended September 30, 2017
Record Net Income - Our net income of $15.3 million for the third quarter of 2017 was the highest net income for
any third quarter in our history. Our Broadcast Cash Flow was $79.9 million for the third quarter of 2017 ($79.8
million on a Combined Historical Basis). Our Free Cash Flow was $38.1 million for the third quarter of 2017
($38.0 million on a Combined Historical Basis).
Other Highlights:
On August 1, 2017, we acquired WCAX-TV (CBS) in the Burlington, Vermont - Plattsburgh, New York
market (DMA 97) for $29.0 million (the “Vermont Acquisition”). We had operated this station under a local
marketing agreement (“LMA”) since June 1, 2017, and the LMA expired upon completion of the acquisition.
On October 2, 2017, we announced that we renewed and extended all network affiliation agreements for our 39
stations affiliated with the CBS Network through December 31, 2021.

Gray Television, Inc.
Earnings Release for the three-month and nine-month periods ended September 30, 2017 Page 2 of 20
Effects of Acquisitions and Divestitures on Our Results of Operations
From October 31, 2013 through September 30, 2017, we completed 23 acquisition transactions and
three divestiture transactions. As more fully described in our Form 10-Q to be filed with the Securities and
Exchange Commission today and in our prior disclosures, these transactions added a net total of 51
television stations in 31 television markets, including 26 new television markets, to our operations.
We refer to the eight stations we acquired (excluding the stations acquired in the Clarksburg
Acquisition) during the first nine-months of 2017 and the stations we commenced operating under an LMA
during that period as the “2017 Acquisitions.” We refer to the 13 stations acquired in 2016, and that we
retained in those transactions, as well as the stations in the Clarksburg Acquisition that we commenced
operating under an LMA on June 1, 2016, as the “2016 Acquisitions.” During 2015, we completed six
acquisitions, which collectively added seven television stations in six markets (four new markets) to our
operations, and we refer to those stations as the “2015 Acquisitions.” Unless the context of the following
discussion requires otherwise, we refer to the stations acquired in the 2017 Acquisitions, the 2016
Acquisitions and the 2015 Acquisitions, collectively, as the “Acquisitions.”
Due to the significant effect that our acquisitions and divestitures have had on our results of operations,
and in order to provide more meaningful period over period comparisons, we present herein certain financial
information on a “Combined Historical Basis.” Unless otherwise defined, Combined Historical Basis reflects
financial results that have been compiled by adding Gray’s historical revenue and broadcast expenses to the
historical revenue and broadcast expenses of the Acquisitions and subtracting the historical revenues and
broadcast expenses of divested stations as if they had been acquired or divested, respectively, on January 1,
2015 (the beginning of the earliest period presented) (the “Completed Transactions”).
Combined Historical Basis financial information does not include any adjustments for other events
attributable to the Completed Transactions except “Broadcast Cash Flow,” “Broadcast Cash Flow Less Cash
Corporate Expenses,” “Operating Cash Flow as Defined in the Senior Credit Agreement” and “Total
Leverage Ratio, Net of All Cash” each give effect to expected synergies, and “Free Cash Flow” on a
Combined Historical Basis gives effect to the financings and certain expected operating synergies related to
the Completed Transactions. “Operating Cash Flow as Defined in the Senior Credit Agreement” and “Total
Leverage Ratio, Net of All Cash” on a Combined Historical Basis also reflect the add-back of legal and other
professional fees incurred in completing acquisitions. Certain of the Combined Historical Basis financial
information has been derived from, and adjusted based on, unaudited, unreviewed financial information
prepared by other entities, which Gray cannot independently verify. We cannot assure you that such financial
information would not be materially different if such information were audited or reviewed and no
assurances can be provided as to the accuracy of such information, or that our actual results would not differ
materially from the Combined Historical Basis financial information if the Completed Transactions had been
completed at the stated date. In addition, the presentation of Combined Historical Basis, “Broadcast Cash
Flow,” “Broadcast Cash Flow Less Cash Corporate Expenses,” “Operating Cash Flow as Defined in the
Senior Credit Agreement,” “Total Leverage Ratio, Net of All Cash,” “Free Cash Flow” and the adjustments
to such information, including expected synergies resulting from such transactions, may not comply with
GAAP or the requirements for pro forma financial information under Regulation S-X under the Securities
Act.

Gray Television, Inc.
Earnings Release for the three-month and nine-month periods ended September 30, 2017 Page 3 of 20
Selected Operating Data on As-Reported Basis (unaudited)
% Change % Change
2017 to 2017 to
2017 2016 2016 2015 2015
Revenue (less agency commissions):
Total 218,977$ 204,490$ 7 % 151,102$ 45 %
Political 4,005$ 22,272$ (82)% 4,594$ (13)%
Operating expenses (1):
Broadcast 139,430$ 120,717$ 16 % 98,921$ 41 %
Corporate and administrative 8,318$ 7,223$ 15 % 10,022$ (17)%
Net (loss) income 15,316$ (213)$ 7291 % 6,609$ 132 %
Non-GAAP Cash Flow (2):
Broadcast Cash Flow 79,936$ 84,170$ (5)% 52,667$ 52 %
Broadcast Cash Flow Less Cash Corporate Expenses 72,794$ 77,916$ (7)% 43,434$ 68 %
Free Cash Flow 38,145$ 29,495$ 29 % 15,609$ 144 %
% Change % Change
2017 to 2017 to
2017 2016 2016 2015 2015
Revenue (less agency commissions):
Total 649,119$ 574,846$ 13 % 427,869$ 52 %
Political 9,034$ 41,576$ (78)% 7,950$ 14 %
Operating expenses (1):
Broadcast 406,446$ 346,620$ 17 % 272,213$ 49 %
Corporate and administrative 24,436$ 31,425$ (22)% 23,313$ 5 %
Net income 96,382$ 26,439$ 265 % 24,314$ 296 %
Non-GAAP Cash Flow (2):
Broadcast Cash Flow 243,639$ 229,332$ 6 % 156,635$ 56 %
Broadcast Cash Flow Less Cash Corporate Expenses 222,431$ 200,817$ 11 % 135,652$ 64 %
Free Cash Flow 130,622$ 79,640$ 64 % 64,988$ 101 %
(1) Excludes depreciation, amortization, and loss on disposal of assets.
(2) See definition of non-GAAP terms and reconciliation of the non-GAAP amounts to net income included elsewhere herein.
(dollars in thousands)
Nine Months Ended September 30,
(dollars in thousands)
Three Months Ended September 30,

Gray Television, Inc.
Earnings Release for the three-month and nine-month periods ended September 30, 2017 Page 4 of 20
% Change % Change
2017 to 2017 to
2017 2016 2016 2015 2015
Revenue (less agency commissions):
Total 218,977$ 233,798$ (6)% 203,223$ 8 %
Political 4,005$ 28,181$ (86)% 5,535$ (28)%
Operating expenses (1):
Broadcast 139,430$ 135,810$ 3 % 133,512$ 4 %
Corporate and administrative 8,318$ 7,223$ 15 % 10,022$ (17)%
Non-GAAP Cash Flow (2):
Broadcast Cash Flow 79,818$ 97,715$ (18)% 76,549$ 4 %
Broadcast Cash Flow Less
Cash Corporate Expenses 72,676$ 91,464$ (21)% 67,316$ 8 %
Operating Cash Flow as defined in
our Senior Credit Agreement 72,488$ 90,587$ (20)% 69,300$ 5 %
Free Cash Flow 37,963$ 45,868$ (17)% 36,723$ 3 %
% Change % Change
2017 to 2017 to
2017 2016 2016 2015 2015
Revenue (less agency commissions):
Total 661,472$ 670,473$ (1)% 596,891$ 11 %
Political 9,074$ 54,169$ (83)% 9,846$ (8)%
Operating expenses (1):
Broadcast 419,461$ 406,653$ 3 % 385,468$ 9 %
Corporate and administrative 24,436$ 31,425$ (22)% 23,313$ 5 %
Non-GAAP Cash Flow (2):
Broadcast Cash Flow 246,043$ 270,909$ (9)% 234,462$ 5 %
Broadcast Cash Flow Less
Cash Corporate Expenses 224,835$ 242,394$ (7)% 213,479$ 5 %
Operating Cash Flow as defined in
our Senior Credit Agreement 224,873$ 247,209$ (9)% 218,220$ 3 %
Free Cash Flow 133,319$ 125,654$ 6 % 123,659$ 8 %
(1) Excludes depreciation, amortization, and loss on disposal of assets.
(2) See definition of non-GAAP terms and reconciliation of the non-GAAP amounts to net income included elsewhere herein.
Nine Months Ended September 30,
(dollars in thousands)
Selected Operating Data on Combined Historical Basis (unaudited)
Three Months Ended September 30,
(dollars in thousands)

Gray Television, Inc.
Earnings Release for the three-month and nine-month periods ended September 30, 2017 Page 5 of 20
Results of Operations for the Third Quarter of 2017
Revenue (less agency commissions) on As-Reported Basis.
The table below presents our revenue (less agency commissions) by type for the third quarter of 2017 and
2016 (dollars in thousands):
Percent Percent
Amount of Total Amount of Total
Revenue (less agency commissions):
Local (including internet/digital/mobile) 110,033$ 50.2% 102,172$ 50.0%
National 31,027 14.2% 25,426 12.4%
Political 4,005 1.8% 22,272 10.9%
Retransmission consent 70,150 32.0% 51,096 25.0%
Other 3,762 1.8% 3,524 1.7%
Total 218,977$ 100.0% 204,490$ 100.0%
2017 2016
Three Months Ended September 30,
Total revenue increased $14.5 million, or 7%, to $219.0 million for the third quarter of 2017 compared to the
third quarter of 2016. Total revenue from the 2017 Acquisitions and the 2016 Acquisitions, collectively, accounted
for approximately $59.3 million of our total revenue in the third quarter of 2017 compared to $37.1 million in the
third quarter of 2016.
The changes in revenue for the third quarter of 2017 compared to the third quarter of 2016 were
approximately as follows:
• Local advertising revenue (including internet/digital/mobile) increased $7.9 million, or 8%, to $110.0
million.
• National advertising revenue increased $5.6 million, or 22%, to $31.0 million.
• Political advertising revenue decreased $18.3 million, or 82%, to $4.0 million.
• Retransmission consent revenue increased $19.1 million, or 37%, to $70.2 million.
• Other revenue increased $0.2 million, or 7%, to $3.8 million.
Excluding the revenue contributed by the 2017 Acquisitions and 2016 Acquisitions, our total revenue
decreased by $7.7 million in the third quarter of 2017 as compared to the third quarter of 2016. This was primarily
the result of a decrease in political advertising revenue of approximately $14.2 million due to 2017 being the “off-
year” of the two-year election cycle. These decreases were partially offset by an increase in retransmission consent
revenue of approximately $10.0 million primarily due to higher retransmission consent rates.
Local and national advertising revenue for the third quarter of 2017 decreased by approximately $3.3 million
primarily because the third quarter of 2016 included approximately $8.2 million of revenue from the 2016
Olympic Games.
Revenue on Combined Historical Basis.
On a Combined Historical Basis, total revenue decreased $14.8 million, or 6%, to $219.0 million in the third
quarter of 2017 compared to the third quarter of 2016 as a result of the following:
• Local advertising revenue (including internet/digital/mobile) decreased $4.8 million, or 4%, to $110.0
million.
• National advertising revenue increased $0.9 million, or 3%, to $31.0 million.
• Political advertising revenue decreased $24.2 million, or 86%, to $4.0 million.
• Retransmission consent revenue increased $13.2 million, or 23%, to $70.2 million.

Gray Television, Inc.
Earnings Release for the three-month and nine-month periods ended September 30, 2017 Page 6 of 20
• Other revenue was consistent at $3.8 million.
Local and national advertising revenue decreased primarily because the third quarter of 2016 included
approximately $8.2 million of advertising revenue from the 2016 Olympic Games.
Broadcast Operating Expenses on As-Reported Basis.
Broadcast operating expenses (before depreciation, amortization and loss on disposal of assets) increased
$18.7 million, or 16%, to $139.4 million for the third quarter of 2017 compared to the third quarter of 2016. The
2017 Acquisitions and 2016 Acquisitions, collectively, accounted for approximately $34.9 million of our
broadcast operating expenses in the third quarter of 2017, and the 2016 Acquisitions accounted for approximately
$20.9 million of our broadcast operating expenses in the third quarter of 2016. Including the impact of the 2017
Acquisitions and the 2016 Acquisitions, total retransmission expense increased $9.7 million, or 39%, to $34.7
million in the third quarter of 2017 compared to the third quarter of 2016.
Excluding the impact of the 2017 Acquisitions and the 2016 Acquisitions:
• Non-compensation expenses increased $5.9 million, or 10%, in the third quarter of 2017, primarily due to
retransmission expense increases of $5.3 million as well as net increases in programming, licensing and
professional fees and certain other items.
• Compensation expenses decreased $1.2 million, or 2%, in the third quarter of 2017.
Broadcast Operating Expenses on Combined Historical Basis.
On a Combined Historical Basis, broadcast operating expenses (before depreciation, amortization and loss on
disposal of assets) increased $3.6 million, or 3%, to $139.4 million for the third quarter of 2017 compared to the
third quarter of 2016. The increase reflects, in part, the following:
• Retransmission expense increased $6.8 million, or 24%, to $34.7 million in the third quarter of 2017
compared to the third quarter of 2016, consistent with increases in retransmission consent revenue.
• Syndicated programming and licensing expenses decreased $1.4 million, or 21%, in the third quarter of
2017 compared to the third quarter of 2016.
• Professional fees increased $1.5 million, or 67%, in the third quarter of 2017 compared to the third
quarter of 2016.
• Compensation expenses decreased by approximately $1.9 million, or 3%, in the third quarter of 2017
compared to the third quarter of 2016.
Corporate and Administrative Operating Expenses on As-Reported Basis.
Corporate and administrative expenses (before depreciation, amortization and gain or loss on disposal of
assets) increased $1.1 million, or 15%, to $8.3 million in the third quarter of 2017 as compared to the third quarter
of 2016, primarily as a result of increased professional services and promotional expenses. Non-cash share based
compensation expenses were $1.2 million and $1.0 million in the third quarters of 2017 and 2016, respectively.
Loss from Early Extinguishment of Debt.
In the three-months ended September 30, 2016, we recorded a loss from early extinguishment of debt of
approximately $32.0 million, or $19.5 million after tax, related to the tender offer and redemption of our 7½%
senior notes due 2020.
Taxes.
During the third quarter of 2017, the Company made aggregate federal and state tax payments of $0.3 million
compared to $0.5 million in the third quarter of 2016. During the remainder of 2017, we anticipate making income
tax payments (net of refunds) of approximately $0.6 million. We anticipate making significant federal and state
income tax payments beginning in 2018, assuming no significant changes to the corporate tax code as currently in
effect.

Gray Television, Inc.
Earnings Release for the three-month and nine-month periods ended September 30, 2017 Page 7 of 20
Results of Operations for the Nine-Months Ended September 30, 2017
Revenue (less agency commissions) on As-Reported Basis.
The table below presents our revenue (less agency commissions) by type for the nine-month periods
ended September 30, 2017 and 2016 (dollars in thousands):
Percent Percent
Amount of Total Amount of Total
Revenue (less agency commissions):
Local (including internet/digital/mobile) 330,547$ 50.9% 296,253$ 51.5%
National 86,822 13.4% 73,575 12.8%
Political 9,034 1.4% 41,576 7.2%
Retransmission consent 207,094 31.9% 148,914 25.9%
Other 15,622 2.4% 14,528 2.6%
Total 649,119$ 100.0% 574,846$ 100.0%
Nine Months Ended September 30,
2017 2016
Total revenue increased $74.3 million, or 13%, to $649.1 million for the nine-months ended September
30, 2017 compared to the nine-months ended September 30, 2016. Revenue from the 2017 Acquisitions and
2016 Acquisitions, collectively, accounted for approximately $167.9 million of our total revenue in the nine-
months ended September 30, 2017, compared to $87.9 million in the nine-months ended September 30,
2016.
The changes in revenue for the nine-months ended September 30, 2017 compared to the nine-months
ended September 30, 2016 were approximately as follows:
• Local advertising revenue (including internet/digital/mobile) increased $34.3 million, or 12%, to
$330.5 million.
• National advertising revenue increased $13.2 million, or 18%, to $86.8 million.
• Political advertising revenue decreased $32.5 million, or 78%, to $9.0 million.
• Retransmission consent revenue increased $58.2 million, or 39%, to $207.1 million.
• Other revenue increased $1.1 million, or 8%, to $15.6 million.
Excluding the total revenue contributed by the 2017 Acquisitions and 2016 Acquisitions, our total
revenue decreased by $5.7 million in the nine-months ended September 30, 2017 as compared to the nine-
months ended September 30, 2016. This was primarily the result of political advertising revenue that
decreased by $28.9 million due to 2017 being the “off-year” of the two-year election cycle, offset by
retransmission consent revenue that increased by $28.9 million primarily due to increased retransmission
consent rates.
Local and national advertising revenue declined $5.5 million, in part, as a result of the impact of the
broadcast of the 2017 Super Bowl on our FOX-affiliated stations generating approximately $0.6 million of
local and national advertising revenue, compared to $1.6 million that we earned from the broadcast of the
2016 Super Bowl on our CBS-affiliated stations. Local and national advertising also declined because the
nine-months ended September 30, 2016 included approximately $8.2 million of revenue from the 2016
Olympic Games.
Gray Television, Inc.
Earnings Release for the three-month and nine-month periods ended September 30, 2017 Page 8 of 20
Revenue on Combined Historical Basis.
On a Combined Historical Basis, total revenue decreased $9.0 million, or 1%, to $661.5 million in the
nine-months ended September 30, 2017 compared to the nine-months ended September 30, 2016, as a result
of the following:
• Local advertising revenue (including internet/digital/mobile) decreased $5.9 million, or 2%, to $338.9
million.
• National advertising revenue increased $0.1 million, or less than 1%, to $90.1 million.
• Political advertising revenue decreased $45.1 million, or 83%, to $9.1 million.
• Retransmission consent revenue increased $41.8 million, or 25%, to $210.3 million.
• Other revenue decreased $0.1 million, or less than 1%, to $13.1 million.
Local and national advertising revenue decreased, in part, as a result of the impact of the broadcast of
the 2017 Super Bowl on our FOX-affiliated stations generating approximately $0.6 million of local and
national advertising revenue, compared to $2.1 million that we earned from the broadcast of the 2016 Super
Bowl on our CBS-affiliated stations. Local and national advertising also decreased because the nine-months
ended September 30, 2016 included approximately $8.2 million of revenue from the 2016 Olympic Games.
Broadcast Operating Expenses on As-Reported Basis.
Broadcast operating expenses (before depreciation, amortization and gain on disposal of assets)
increased $59.8 million, or 17%, to $406.4 million for the nine-months ended September 30, 2017 compared
to the nine-months ended September 30, 2016. The 2017 Acquisitions and 2016 Acquisitions, collectively,
accounted for approximately $95.1 million of our broadcast operating expenses in the nine-months ended
September 30, 2017, and the 2016 Acquisitions accounted for approximately $52.6 million of our broadcast
operating expenses for the nine-months ended September 30, 2016. Including the impact of the 2017
Acquisitions and the 2016 Acquisitions, total retransmission expense increased $29.4 million, or 41%, to
$100.8 million in the nine-months ended September 30, 2017 compared to the nine-months ended September
30, 2016.
Excluding the impact of the 2017 Acquisitions and the 2016 Acquisitions:
Non-compensation expenses increased by $18.5 million, or 11%, in the nine-months ended September
30, 2017 primarily due to retransmission expense increases of $15.7 million and professional fee
increases of $5.2 million.
• Compensation expenses decreased $1.2 million, or 1%, in the nine-months ended September 30, 2017
compared to the nine-months ended September 30, 2016.
Broadcast Operating Expenses on Combined Historical Basis.
On a Combined Historical Basis, broadcast operating expenses (before depreciation, amortization and
gain on disposal of assets) increased $12.8 million, or 3%, to $419.5 million for the nine-months ended
September 30, 2017 compared to the nine-months ended September 30, 2016. The increase reflects, in part,
the following:
• Retransmission expense increased $21.0 million, or 26%, to $103.2 million for the nine-months ended
September 30, 2017 compared to the nine-months ended September 30, 2016, consistent with
increases in retransmission consent revenue.
• Syndicated programming and licensing expenses decreased $1.8 million, or 10%, in the nine-months
ended September 30, 2017 compared to the nine-months ended September 30, 2016.
• Professional fees increased $2.8 million, or 46%, in the nine-months ended September 30, 2017
compared to the nine-months ended September 30, 2016.
• Compensation expense decreased by approximately $4.3 million, or 2%, for the nine-months ended
September 30, 2017 compared to the nine-months ended September 30, 2016.
Gray Television, Inc.
Earnings Release for the three-month and nine-month periods ended September 30, 2017 Page 9 of 20
Corporate and Administrative Operating Expenses on As-Reported Basis.
Corporate and administrative expenses (before depreciation, amortization and loss (gain) on disposal of
assets) decreased $7.0 million, or 22%, to $24.4 million in the nine-months ended September 30, 2017
compared to the nine-months ended September 30, 2016. The net decrease reflects, in part, the following:
• Non-compensation expenses decreased $6.3 million in the nine-months ended September 30, 2017
primarily due to decreases of $7.7 million of professional fees related to acquisition activities,
partially offset by increases of $1.0 million in promotional expenses.
• Non-cash share based compensation expenses were $3.2 million in the nine-months ended
September 30, 2017 compared to $2.9 million in the nine-months ended September 30, 2016.
Loss from Early Extinguishment of Debt.
In the nine-months ended September 30, 2017, we recorded a loss from early extinguishment of debt of
approximately $2.9 million, or $1.7 million after tax, related to the amendment and restatement of our senior
credit facility. In the nine-months ended September 30, 2016, we recorded a loss from early extinguishment
of debt of approximately $32.0 million, or $19.5 million after tax, related to the tender offer and redemption
of our 7½% senior notes due 2020.
Gain on Disposal of Assets.
We reported gains on disposals of assets of $75.1 million and $0.1 million in the nine-months ended
September 30, 2017 and 2016 respectively. On May 30, 2017, we tendered two of our broadcast licenses and
made other modifications to our broadcast spectrum related to our participation in the FCC’s reverse auction
for broadcast spectrum. Our proceeds from this auction, which were received on August 7, 2017, were $90.8
million while the combined cost of the disposed assets was $13.1 million.
Taxes.
During the nine-months ended September 30, 2017, the Company made aggregate federal and state tax
payments totaling $1.2 million compared to $14.6 million in the nine-months ended September 30, 2016.

Gray Television, Inc.
Earnings Release for the three-month and nine-month periods ended September 30, 2017 Page 10 of 20
Detailed table of operating results
2017 2016 2017 2016
Revenue (less agency commissions) 218,977$ 204,490$ 649,119$ 574,846$
Operating expenses before depreciation, amortization
and loss on disposal of assets, net:
Broadcast 139,430 120,717 406,446 346,620
Corporate and administrative 8,318 7,223 24,436 31,425
Depreciation 13,085 11,494 38,555 34,237
Amortization of intangible assets 6,460 4,235 18,684 12,365
Loss (gain) on disposal of assets, net 1,660 354 (75,139) (66)
Operating expenses 168,953 144,023 412,982 424,581
Operating income 50,024 60,467 236,137 150,265
Other income (expense):
Miscellaneous income, net 28 30 36 740
Interest expense (24,207) (27,926) (71,189) (73,470)
Loss from early extinguishment of debt - (31,987) (2,851) (31,987)
Income before income tax 25,845 584 162,133 45,548
Income tax expense 10,529 797 65,751 19,109
Net (loss) income 15,316$ (213)$ 96,382$ 26,439$
Basic per share information:
Net (loss) income 0.21$ -$ 1.34$ 0.37$
Weighted-average shares outstanding 71,636 71,879 71,777 71,850
Diluted per share information:
Net (loss) income 0.21$ -$ 1.33$ 0.36$
Weighted-average shares outstanding 72,454 71,879 72,491 72,723
Political advertising revenue (less agency commissions) 4,005$ 22,272$ 9,034$ 41,576$
Revenue from broadcast of Olympic games (less
agency commissions) -$ 8,192$ -$ 8,192$
Nine Months Ended
September 30,
Gray Television, Inc.
Selected Operating Data (Unaudited)
(in thousands except for net income per share data)
Three Months Ended
September 30,
Gray Television, Inc.
Earnings Release for the three-month and nine-month periods ended September 30, 2017 Page 11 of 20
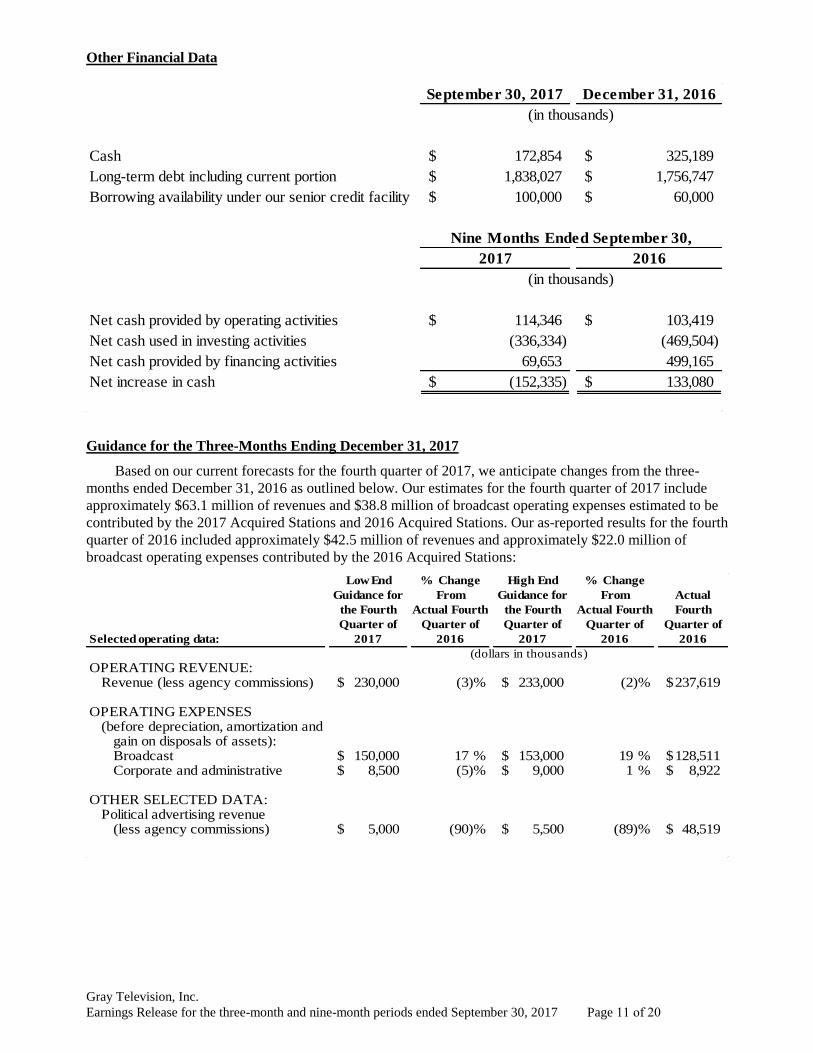
Other Financial Data
September 30, 2017 December 31, 2016
Cash 172,854$ 325,189$
Long-term debt including current portion 1,838,027$ 1,756,747$
Borrowing availability under our senior credit facility 100,000$ 60,000$
2017 2016
Net cash provided by operating activities 114,346$ 103,419$
Net cash used in investing activities (336,334) (469,504)
Net cash provided by financing activities 69,653 499,165
Net increase in cash (152,335)$ 133,080$
(in thousands)
Nine Months Ended September 30,
(in thousands)
Guidance for the Three-Months Ending December 31, 2017
Based on our current forecasts for the fourth quarter of 2017, we anticipate changes from the three-
months ended December 31, 2016 as outlined below. Our estimates for the fourth quarter of 2017 include
approximately $63.1 million of revenues and $38.8 million of broadcast operating expenses estimated to be
contributed by the 2017 Acquired Stations and 2016 Acquired Stations. Our as-reported results for the fourth
quarter of 2016 included approximately $42.5 million of revenues and approximately $22.0 million of
broadcast operating expenses contributed by the 2016 Acquired Stations:
Low End % Change High End % Change
Guidance for From Guidance for From Actual
the Fourth Actual Fourth the Fourth Actual Fourth Fourth
Quarter of Quarter of Quarter of Quarter of Quarter of
Selected operating data: 2017 2016 2017 2016 2016
OPERATING REVENUE:Revenue (less agency commissions) 230,000$ (3)% 233,000$ (2)% 237,619$
OPERATING EXPENSES(before depreciation, amortization and
gain on disposals of assets):Broadcast 150,000$ 17 % 153,000$ 19 % 128,511$ Corporate and administrative 8,500$ (5)% 9,000$ 1 % 8,922$
OTHER SELECTED DATA:Political advertising revenue
(less agency commissions) 5,000$ (90)% 5,500$ (89)% 48,519$
(dollars in thousands)

Gray Television, Inc.
Earnings Release for the three-month and nine-month periods ended September 30, 2017 Page 12 of 20
Comments on Fourth Quarter of 2017 Guidance on As-Reported Basis
Revenue on As-Reported Basis.
Based on our current forecasts for the fourth quarter of 2017, we anticipate the following changes from
the fourth quarter of 2016:
We believe our fourth quarter of 2017 local advertising revenue (including internet/digital/mobile)
will increase by 12% to 14%.
We expect our fourth quarter of 2017 national advertising revenue will increase by 25% to 30%.
We believe our fourth quarter of 2017 political advertising revenue will decrease to within a range of
approximately $5.0 million to $5.5 million, due to 2017 being an off-year of the political advertising
revenue cycle.
We believe our fourth quarter of 2017 retransmission consent revenue will be approximately $70.0
million.
Broadcast Operating Expenses (before depreciation, amortization and loss (gain) on disposal of assets) on
As-Reported Basis.
For the fourth quarter of 2017, we anticipate our broadcast operating expenses will increase from the
fourth quarter of 2016, reflecting the additional broadcast operating expenses of the 2017 Acquired Stations
and the 2016 Acquired Stations. We anticipate that our broadcast operating expenses will also reflect an
increase in retransmission expense of approximately $10.0 million to approximately $36.0 million and an
increase in non-cash stock based compensation of approximately $2.6 million reflecting certain non-cash
stock based compensation awards made in October 2017 to certain non-executive employees. Our fourth
quarter 2017 operating expenses will also include approximately $4.1 million of expense for discretionary
company contributions to our 401(k) plan.
Corporate and Administrative Operating Expenses (before depreciation, amortization and loss (gain) on
disposal of assets) on As-Reported Basis.
For the fourth quarter of 2017, we anticipate our corporate and administrative operating expense will
decrease to within a range of approximately $8.5 million to $9.0 million, primarily attributable to decreases
in professional services fees related to acquisitions.
Comments on Fourth Quarter of 2017 Guidance on Combined Historical Basis
Based on our current forecasts for the fourth quarter of 2017, we anticipate the following changes from
the Combined Historical Basis for the fourth quarter of 2016. For the purposes hereof, our Combined
Historical Basis for the fourth quarter of 2016 has been adjusted to give effect to the 2017 Acquisitions and
the 2016 Acquisitions as if they had been acquired in the first day of the earliest period presented.
Revenue on Combined Historical Basis.
We believe our fourth quarter of 2017 total revenue will decrease in a mid-double digit percentage
range, due primarily to 2017 being an off-year of the political advertising revenue cycle.
We believe our fourth quarter of 2017 local advertising revenue will be consistent with, or increase in
the low single digit percentage range, when compared to the fourth quarter of 2016.
We believe our fourth quarter of 2017 national advertising revenue will increase in the mid to upper
single digit percentage range, when compared to the fourth quarter of 2016.
We believe that our fourth quarter of 2017 combined local and national advertising revenue will
increase in the low single digit percentage range, when compared to the fourth quarter of 2016.

Gray Television, Inc.
Earnings Release for the three-month and nine-month periods ended September 30, 2017 Page 13 of 20
We believe our fourth quarter of 2017 political advertising revenue will be within a range of
approximately $5.0 million to $5.5 million, decreasing by approximately $58.0 million to $59.0
million, due to 2017 being an off-year of the political advertising revenue cycle.
We believe our fourth quarter of 2017 retransmission consent revenue will increase by approximately
$12.0 million to approximately $70.0 million.
Broadcast Operating Expenses (before depreciation, amortization and loss (gain) on disposal of assets) on
Combined Historical Basis.
Our total broadcast operating expenses for the fourth quarter of 2017 are anticipated to increase from
the fourth quarter of 2016 on a Combined Historical Basis by approximately 2% to 5%, or $4.0 million to
$7.0 million. This increase reflects an expected increase of $6.0 million in retransmission expense to
approximately $36.0 million and an increase in non-cash stock based compensation of approximately $2.6
million reflecting certain non-cash stock based compensation awards made in October 2017 to certain non-
executive employees. Our fourth quarter 2017 operating expenses will also include approximately $4.1
million of expense for discretionary company contributions to our 401(k) plan.
Gray Television, Inc.
Earnings Release for the three-month and nine-month periods ended September 30, 2017 Page 14 of 20
Non-GAAP Terms
From time to time, Gray supplements its financial results prepared in accordance with accounting principles
generally accepted in the United States of America (“GAAP”) by disclosing the non-GAAP financial measures
Broadcast Cash Flow, Broadcast Cash Flow Less Cash Corporate Expenses, Operating Cash Flow as defined in
the Senior Credit Agreement, Free Cash Flow and Total Leverage Ratio, Net of All Cash. These non-GAAP
amounts are used by us to approximate the amount used to calculate key financial performance covenants
contained in our debt agreements and are used with our GAAP data to evaluate our results and liquidity. These
non-GAAP amounts may be provided on an As-Reported Basis as well as a Combined Historical Basis.
We define Broadcast Cash Flow as net income plus loss from early extinguishment of debt, corporate and
administrative expenses, broadcast non-cash stock based compensation, depreciation and amortization (including
amortization of intangible assets and program broadcast rights), any loss on disposal of assets, any miscellaneous
expense, interest expense, any income tax expense, non-cash 401(k) expense less any gain on disposal of assets,
any miscellaneous income, any income tax benefits, payments for program broadcast obligations and network
compensation revenue.
We define Broadcast Cash Flow Less Cash Corporate Expenses as net income plus loss from early
extinguishment of debt, non-cash stock based compensation, depreciation and amortization (including
amortization of intangible assets and program broadcast rights), any loss on disposal of assets, any miscellaneous
expense, interest expense, any income tax expense, and non-cash 401(k) expense, less any gain on disposal of
assets, any miscellaneous income, any income tax benefits, payments for program broadcast obligations and
network compensation revenue.
We define Operating Cash Flow as defined in the Senior Credit Agreement as Combined Historical Basis net
income plus loss from early extinguishment of debt, non-cash stock based compensation, depreciation and
amortization (including amortization of intangible assets and program broadcast rights), any loss on disposal of
assets, any miscellaneous expense, interest expense, any income tax expense, non-cash 401(k) expense and
pension expenses less any gain on disposal of assets, any miscellaneous income, any income tax benefits,
payments for program broadcast obligations, network compensation revenue and cash contributions to pension
plans.
We define Free Cash Flow as net income plus loss from early extinguishment of debt, non-cash stock based
compensation, depreciation and amortization (including amortization of intangible assets and program broadcast
rights), any loss on disposal of assets, any miscellaneous expense, amortization of deferred financing costs, any
income tax expense, non-cash 401(k) expense and pension expense, less any gain on disposal of assets, any
miscellaneous income, any income tax benefits, payments for program broadcast obligations, network
compensation revenue, contributions to pension plans, amortization of original issue discount on our debt, capital
expenditures (net of any insurance proceeds) and the payment of income taxes (net of any refunds received).
Our Total Leverage Ratio, Net of All Cash is the total outstanding principal of our long-term debt and certain
other obligations as defined in the Senior Credit Agreement less all cash divided by our average Operating Cash
Flow as defined in the Senior Credit Agreement for the preceding eight quarters. This average is calculated by
dividing the sum of our Operating Cash Flow as defined in the Senior Credit Agreement for the preceding eight
quarters by two.
These non-GAAP terms are not defined in GAAP and our definitions may differ from, and therefore not be
comparable to, similarly titled measures used by other companies, thereby limiting their usefulness. Such terms are
used by management in addition to and in conjunction with results presented in accordance with GAAP and
should be considered as supplements to, and not as substitutes for, net income and cash flows reported in
accordance with GAAP.

Gray Television, Inc.
Earnings Release for the three-month and nine-month periods ended September 30, 2017 Page 15 of 20
Reconciliation on As-Reported Basis, in thousands – Quarter
2017 2016 2015
Net income (loss) 15,316$ (213)$ 6,609$
Adjustments to reconcile from net income (loss) to
Broadcast Cash Flow Less Cash Corporate Expenses:
Depreciation 13,085 11,494 9,354
Amortization of intangible assets 6,460 4,235 3,213
Non-cash stock based compensation 1,531 1,271 1,009
Loss on disposal of assets, net 1,660 354 248
Miscellaneous income, net (28) (30) (28)
Interest expense 24,207 27,926 18,645
Loss from early extinguishment of debt - 31,987 -
Income tax expense 10,529 797 4,118
Amortization of program broadcast rights 5,209 4,817 3,677
Common stock contributed to 401(k) plan
excluding corporate 401(k) contributions 1 7 6
Payments for program broadcast rights (5,176) (4,729) (3,417)
Corporate and administrative expenses before
depreciation, amortization of intangible assets and
non-cash stock based compensation 7,142 6,254 9,233
Broadcast Cash Flow 79,936 84,170 52,667
Corporate and administrative expenses before
depreciation, amortization of intangible assets and
non-cash stock based compensation (7,142) (6,254) (9,233)
Broadcast Cash Flow Less Cash Corporate Expenses 72,794 77,916 43,434
Pension (income) expense (124) 40 -
Contributions to pension plans - (1,405) (2,483)
Interest expense (24,207) (27,926) (18,645)
Amortization of deferred financing costs 1,157 1,397 799
Amortization of original issue premium
on senior notes (153) (194) (215)
Purchase of property and equipment (11,011) (19,763) (6,854)
Income taxes paid, net of refunds (311) (570) (427)
Free Cash Flow 38,145$ 29,495$ 15,609$
Three Months Ended
September 30,

Gray Television, Inc.
Earnings Release for the three-month and nine-month periods ended September 30, 2017 Page 16 of 20
Reconciliation on As-Reported Basis, in thousands – Year to Date
2017 2016 2015
Net income 96,382$ 26,439$ 24,314$
Adjustments to reconcile from net income to
Broadcast Cash Flow Less Cash Corporate Expenses:
Depreciation 38,555 34,237 26,906
Amortization of intangible assets 18,684 12,365 8,715
Non-cash stock based compensation 4,303 3,827 3,011
(Gain) loss on disposal of assets, net (75,139) (66) 562
Miscellaneous income, net (36) (739) (102)
Interest expense 71,189 73,470 55,762
Loss from early extinguishment of debt 2,851 31,987 -
Income tax expense 65,751 19,109 16,186
Amortization of program broadcast rights 15,444 14,026 10,837
Common stock contributed to 401(k) plan
excluding corporate 401(k) contributions 16 21 19
Payments for program broadcast rights (15,569) (13,859) (10,558)
Corporate and administrative expenses before
depreciation, amortization of intangible assets and
non-cash stock based compensation 21,208 28,515 20,983
Broadcast Cash Flow 243,639 229,332 156,635
Corporate and administrative expenses before
depreciation, amortization of intangible assets and
non-cash stock based compensation (21,208) (28,515) (20,983)
Broadcast Cash Flow Less Cash Corporate Expenses 222,431 200,817 135,652
Pension (income) expense (371) 120 4,190
Contributions to pension plans (624) (3,038) (3,916)
Interest expense (71,189) (73,470) (55,762)
Amortization of deferred financing costs 3,466 3,664 2,396
Amortization of original issue premium
on senior notes (458) (626) (647)
Purchase of property and equipment (21,426) (33,238) (15,250)
Income taxes paid, net of refunds (1,207) (14,589) (1,675)
Free Cash Flow 130,622$ 79,640$ 64,988$
September 30,
Nine Months Ended

Gray Television, Inc.
Earnings Release for the three-month and nine-month periods ended September 30, 2017 Page 17 of 20
Reconciliation on Combined Historical Basis, in thousands – Quarter
2017 2016 2015
Net income 15,316$ 13,951$ 12,317$
Adjustments to reconcile from net income to Broadcast Cash
Flow Less Cash Corporate Expenses:
Depreciation 13,085 12,821 12,975
Amortization of intangible assets 6,460 4,344 4,979
Non-cash stock-based compensation 1,531 1,271 1,009
Loss on disposal of assets, net 1,660 395 532
Miscellaneous income, net (28) (36) 1,443
Interest expense 24,207 25,589 24,161
Loss from early extinguishment of debt - 31,987 -
Income tax expense 10,529 1,712 3,279
Amortization of program broadcast rights 5,209 5,253 5,304
Common stock contributed to 401(k) plan
excluding corporate 401(k) contributions 1 7 6
Payments for program broadcast rights (5,176) (5,165) (5,044)
Corporate and administrative expenses before
depreciation, amortization of intangible assets and
non-cash stock-based compensation 7,142 6,251 9,233
Other (118) (665) 6,355
Broadcast Cash Flow 79,818 97,715 76,549
Corporate and administrative expenses before
depreciation, amortization of intangible assets and
non-cash stock-based compensation (7,142) (6,251) (9,233)
Broadcast Cash Flow Less Cash Corporate Expenses 72,676 91,464 67,316
Pension (income) expense (124) 40 -
Contributions to pension plans - (1,405) (2,483)
Other (64) 488 4,467
Operating Cash Flow as defined in the Senior Credit Agreement 72,488 90,587 69,300
Interest expense (24,207) (25,589) (24,161)
Amortization of deferred financing costs 1,157 1,397 799
Amortization of net original issue premium
on senior notes (153) (194) (215)
Purchase of property and equipment (11,011) (19,763) (7,750)
Income taxes paid, net of refunds (311) (570) (1,250)
Free Cash Flow 37,963$ 45,868$ 36,723$
Three Months Ended
September 30,

Gray Television, Inc.
Earnings Release for the three-month and nine-month periods ended September 30, 2017 Page 18 of 20
Reconciliation on Combined Historical Basis, in thousands – Year to Date
2017 2016 2015
Net income 94,563$ 52,083$ 43,914$
Adjustments to reconcile from net income to Broadcast Cash
Flow Less Cash Corporate Expenses:
Depreciation 39,292 39,036 38,704
Amortization of intangible assets 18,710 13,563 14,111
Non-cash stock-based compensation 4,303 3,827 3,011
Loss on disposal of assets, net (75,189) 179 1,058
Miscellaneous (income) expense, net (45) 196 4,364
Interest expense 71,929 76,766 72,310
Loss from early extinguishment of debt 2,851 31,987 -
Income tax expense 65,465 18,584 13,647
Amortization of program broadcast rights 15,707 15,998 15,924
Common stock contributed to 401(k) plan
excluding corporate 401(k) contributions 16 21 19
Payments for program broadcast rights (15,832) (15,831) (15,645)
Corporate and administrative expenses before
depreciation, amortization of intangible assets and
non-cash stock-based compensation 21,208 28,515 20,983
Other 3,065 5,985 22,062
Broadcast Cash Flow 246,043 270,909 234,462
Corporate and administrative expenses before
depreciation, amortization of intangible assets and
non-cash stock-based compensation (21,208) (28,515) (20,983)
Broadcast Cash Flow Less Cash Corporate Expenses 224,835 242,394 213,479
Pension (income) expense (371) 120 4,190
Contributions to pension plans (624) (3,038) (3,916)
Other 1,033 7,733 4,467
Operating Cash Flow as defined in the Senior Credit Agreement 224,873 247,209 218,220
Interest expense (71,929) (76,766) (72,310)
Amortization of deferred financing costs 3,466 3,664 2,396
Amortization of net original issue premium
on senior notes (458) (626) (647)
Purchase of property and equipment (21,426) (33,238) (20,250)
Income taxes paid, net of refunds (1,207) (14,589) (3,750)
Free Cash Flow 133,319$ 125,654$ 123,659$
Nine Months Ended
September 30,

Gray Television, Inc.
Earnings Release for the three-month and nine-month periods ended September 30, 2017 Page 19 of 20
Reconciliation of Total Leverage Ratio, Net of All Cash, in thousands except for ratio
Combined Historical Basis Operating Cash Flow Eight Quarters Ended
as defined in the Senior Credit Agreement: September 30, 2017
Net income 221,374$
Adjustments to reconcile from net income to Broadcast Cash
Flow Less Cash Corporate Expenses:
Depreciation 104,473
Amortization of intangible assets 41,764
Non-cash stock-based compensation 10,413
(Gain) loss on disposals of assets, net (73,916)
Miscellaneous income, net 1,439
Interest expense 198,570
Loss from early extinguishment of debt 34,838
Income tax expense 116,434
Amortization of program broadcast rights 42,931
Common stock contributed to 401(k) plan
excluding corporate 401(k) contributions 52
Payments for program broadcast rights (42,736)
Corporate and administrative expenses before depreciation, amortization
of intangible assets and non-cash stock-based compensation 67,917
Other 14,868
Broadcast Cash Flow 738,421
Corporate and administrative expenses before depreciation, amortization
depreciation, amortization of intangible assets and
non-cash stock-based compensation (67,917)
Broadcast Cash Flow Less Cash Corporate Expenses 670,504
Pension expense (189)
Contributions to pension plans (5,177)
Other 11,496
Operating Cash Flow as defined in the Senior Credit Agreement 676,634$
Operating Cash Flow as defined in the Senior Credit Agreement,
divided by two 338,317$
September 30, 2017
Adjusted Total Indebtedness:
Long term debt, including current portion 1,838,027$
Capital leases and other debt 607
Total deferred financing costs, net 29,151
Premium on subordinated debt, net (5,339)
Cash (172,854)
Adjusted Total Indebtedness, Net of All Cash 1,689,592$
Total Leverage Ratio, Net of All Cash 4.99
Gray Television, Inc.
Earnings Release for the three-month and nine-month periods ended September 30, 2017 Page 20 of 20
The Company
We are a television broadcast company headquartered in Atlanta, Georgia, that owns and operates over
100 television stations and leading digital assets in markets throughout the United States. As of the date of
this release, we own and/or operate television stations in 57 television markets that broadcast more than 200
separate program streams, including over 100 channels affiliated with the CBS Network, the NBC Network,
the ABC Network and the FOX Network. Our portfolio, including pending acquisitions, includes the
number-one and/or number-two ranked television station operations in essentially all of our markets, which
collectively cover approximately 10.4 percent of total United States television households.
Cautionary Statements for Purposes of the “Safe Harbor” Provisions of the Private Securities
Litigation Reform Act
This press release contains statements that constitute “forward-looking statements” within the meaning
of the Private Securities Litigation Reform Act of 1995 and the federal securities laws. These “forward-
looking statements” are not statements of historical facts, and may include, among other things, statements
regarding our current expectations and beliefs of operating results for the fourth quarter of 2017 or other
periods, the impact of recently completed transactions, future operating expenses, future income tax
payments and other future events. Actual results are subject to a number of risks and uncertainties and may
differ materially from the current expectations and beliefs discussed in this press release. All information set
forth in this release is as of November 6, 2017. We do not intend, and undertake no duty, to update this
information to reflect future events or circumstances. Information about certain potential factors that could
affect our business and financial results and cause actual results to differ materially from those expressed or
implied in any forward-looking statements are included under the captions "Risk Factors" and
"Management's Discussion and Analysis of Financial Condition and Results of Operations," in our Annual
Report on Form 10-K for the year ended December 31, 2016 and may be contained in reports subsequently
filed with the U.S. Securities and Exchange Commission (the “SEC”) and available at the SEC's website at
www.sec.gov.
Conference Call Information
We will host a conference call to discuss our third quarter operating results on November 6, 2017. The
call will begin at 11:00 AM Eastern Time. The live dial-in number is 1 (888) 259-8544 and the confirmation
code is 2354575. The call will be webcast live and available for replay at www.gray.tv. The taped replay of
the conference call will be available at 1 (888) 203-1112, Confirmation Code: 2354575 until
December 6, 2017.
Gray Contacts
Web site: www.gray.tv
Hilton H. Howell, Jr., Chairman, President and Chief Executive Officer, 404-266-5512
Jim Ryan, Executive Vice President and Chief Financial Officer, 404-504-9828
Kevin P. Latek, Executive Vice President, Chief Legal and Development Officer, 404-266-8333