newpark resources presentation - · pdf filenyse: nr 4 drilling fluids – market share...
TRANSCRIPT
NYSE: NR 1
NEWPARK RESOURCESPRESENTATION
November 2012
NYSE: NR 2
Forward Looking Statements
This presentation contains forward-looking statements within the meaning of the Private Securities Litigation Reform Act that are based on management's current expectations, estimates and projections. All statements that address expectations or projections about the future, including Newpark's strategy for growth, product development, market position, expected expenditures and financial results are forward-looking statements. Some of the forward-looking statements may be identified by words like "expects," "anticipates," "plans," "intends," "projects," "indicates," and similar expressions. These statements are not guarantees of future performance and involve a number of risks, uncertainties and assumptions. Many factors, including those discussed more fully elsewhere in this presentation and in documents filed with the Securities and Exchange Commission by Newpark, particularly its Annual Report on Form 10-K, its Quarterly Reports on Form 10-Q, as well as others, could cause results to differ materially from those stated. These risk factors include, but are not limited to, the availability of raw materials, including barite ore, the availability of skilled personnel, the impact of restrictions on offshore drilling activity in the Gulf of Mexico, our customer concentration, the cyclical nature of our industry, our market competition, the cost and continued availability of borrowed funds, our international operations, political and social unrest in North Africa and the Middle East, legal and regulatory matters, including environmental regulations, inherent limitations in insurance coverage, potential impairments of long-lived intangible assets, technological developments in our industry, the impact of severe weather, particularly in the U.S. Gulf Coast and our ability to realize the anticipated benefits from capital investments and business acquisitions. Newpark's filings with the Securities and Exchange Commission can be obtained at no charge at www.sec.gov, as well as through our website at www.newpark.com.
NYSE: NR 3
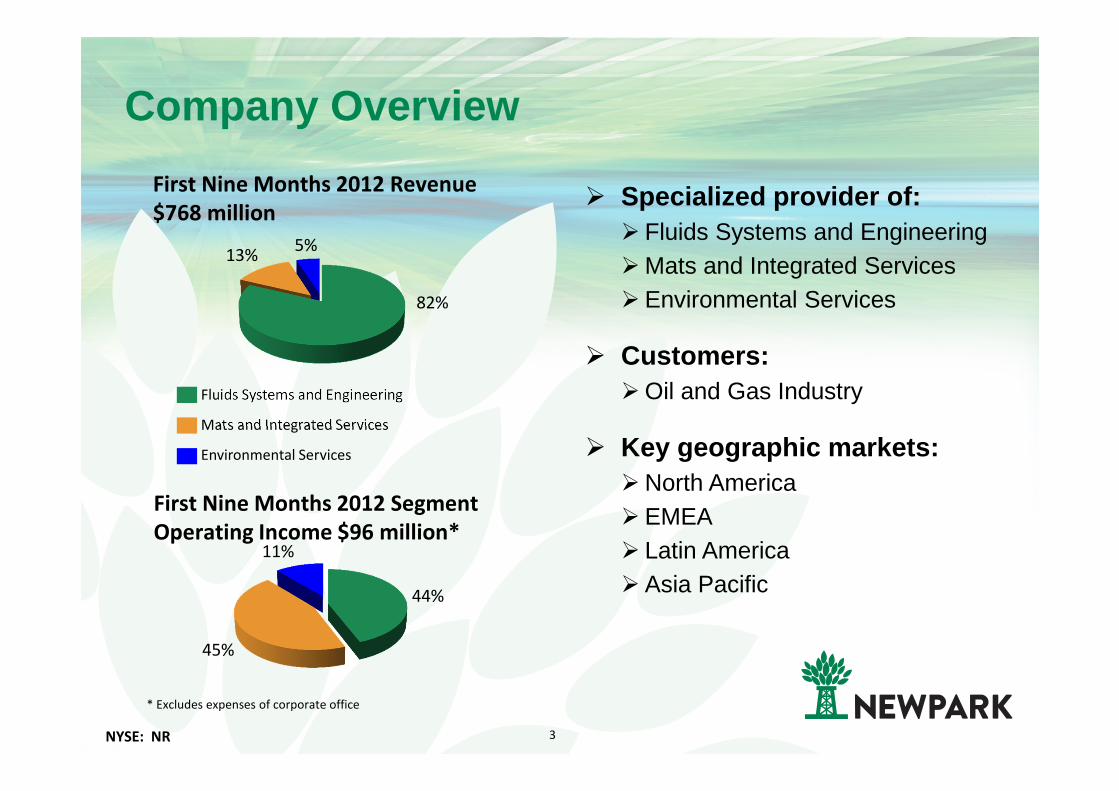
Company Overview
� Specialized provider of:� Fluids Systems and Engineering� Mats and Integrated Services� Environmental Services
� Customers:� Oil and Gas Industry
� Key geographic markets: � North America � EMEA� Latin America� Asia Pacific
Fluids Systems and Engineering
Mats and Integrated Services
Environmental Services
82%
13%5%
First Nine Months 2012 Revenue
$768 million
44%
45%
11%
First Nine Months 2012 Segment
Operating Income $96 million*
* Excludes expenses of corporate office

NYSE: NR 4
Drilling Fluids – Market Share
� Demonstrated our ability to
grow worldwide market
share over the past decade
� Our growth has been driven by
independents, major
international oil companies
and national oil companies
� As of 2011, the third largest
drilling fluids provider in North
America (based on Company
data)3.5%
4.3%
5.8% 5.6% 5.9% 6.0%
7.2% 7.1%6.6%
7.6%
5.4%
7.0%
8.1%
0%
2%
4%
6%
8%
10%
1999 2000 2001 2002 2003 2004 2005 2006 2007 2008 2009 2010 2011
Worldwide Fluids Market Share 1999 - 2011
Source: Spears & Associates - Oilfield Market Report, September 2012
2011 Worldwide Fluids Market
Newpark Resources 8.1%
Baker Hughes 11.1%
Halliburton Corp. 23.7%
Schlumberger 35.7%
Others 21.5%
$10 billion market

NYSE: NR 5
Technology� Focused on providing customized solutions for E&P
operators to improve their drilling economics
� Offshore - Deepwater and Shelf
� Deepdrill® water-based system used extensively in Brazil’s
deepwater market
� In early 2011, completed our deepest offshore well for a major
IOC in over 7000 feet of water
� Land – Conventional and Unconventional Formations
� In 2010, introduced Evolution®, our family of high-performance
water-based systems
� Proprietary and Patented Technology
� High Performance Water-Based Systems
� High Performance Synthetic-Based Systems
� Traditional and Hybrid Oil-Based Systems
� New worldwide technology center scheduled to
open mid-2013

NYSE: NR 6
Evolution ®
� Award-winning Evolution system continues to demonst rate superior performance vs. oil based mud� Higher lubricity
� Improves rate of penetration� Increases length of lateral sections� Minimizes days on well
� Environmentally friendly� Reduces disposal cost for cuttings� Reduces associated environmental
spread cost
� Reduced circulating temperatures� Increases drilling tool life� Safer work environment

NYSE: NR 7
Evolution
� After 2010 introduction in the Haynesville shale, w e have since expanded into most North American basins.
� First Evolution well outside of North America (EMEA region) being drilled in Q4 2012
30%
31%14%
11%
8%6% East Texas
Mid-Continent
Permian
Rockies
South Texas
Other
First Nine Months 2012 Revenue by Region
0
5
10
15
20
25
30
35
Q3 10 Q4 10 Q1 11 Q2 11 Q3 11 Q4 11 Q1 12 Q2 12 Q3 12
($ m
illi
on
s)
Total Revenue from Evolution

NYSE: NR 8
Customer Support
�Focused on backing our leading
technology with superior customer
support� Over 600 fluids technicians customize and deliver
our technology worldwide
� Advanced training programs for fluid technicians
continue to enhance product and service
knowledge
�Newpark recognized by EnergyPoint
Research, an independent customer
service survey company
NYSE: NR 9
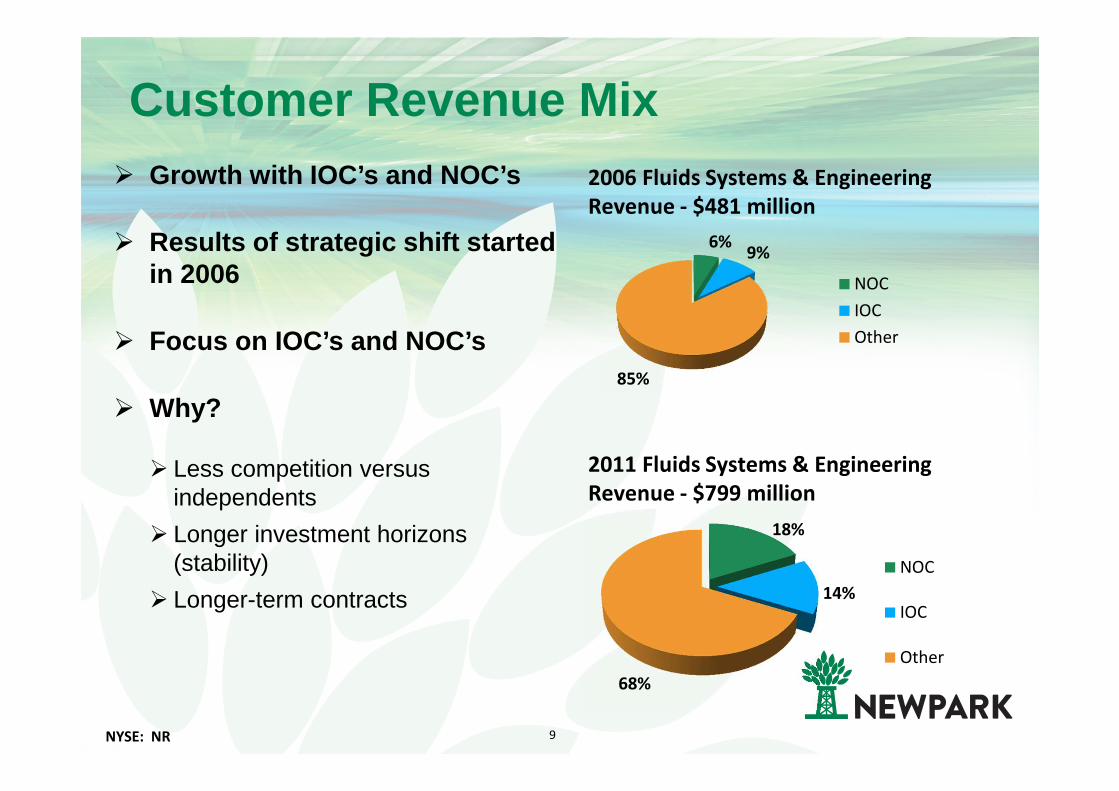
Customer Revenue Mix� Growth with IOC’s and NOC’s
� Results of strategic shift started in 2006
� Focus on IOC’s and NOC’s
� Why?
� Less competition versus independents
� Longer investment horizons (stability)
� Longer-term contracts
6%9%
85%
NOC
IOC
Other
2006 Fluids Systems & Engineering
Revenue - $481 million
18%
14%
68%
NOC
IOC
Other
2011 Fluids Systems & Engineering
Revenue - $799 million
NYSE: NR 10
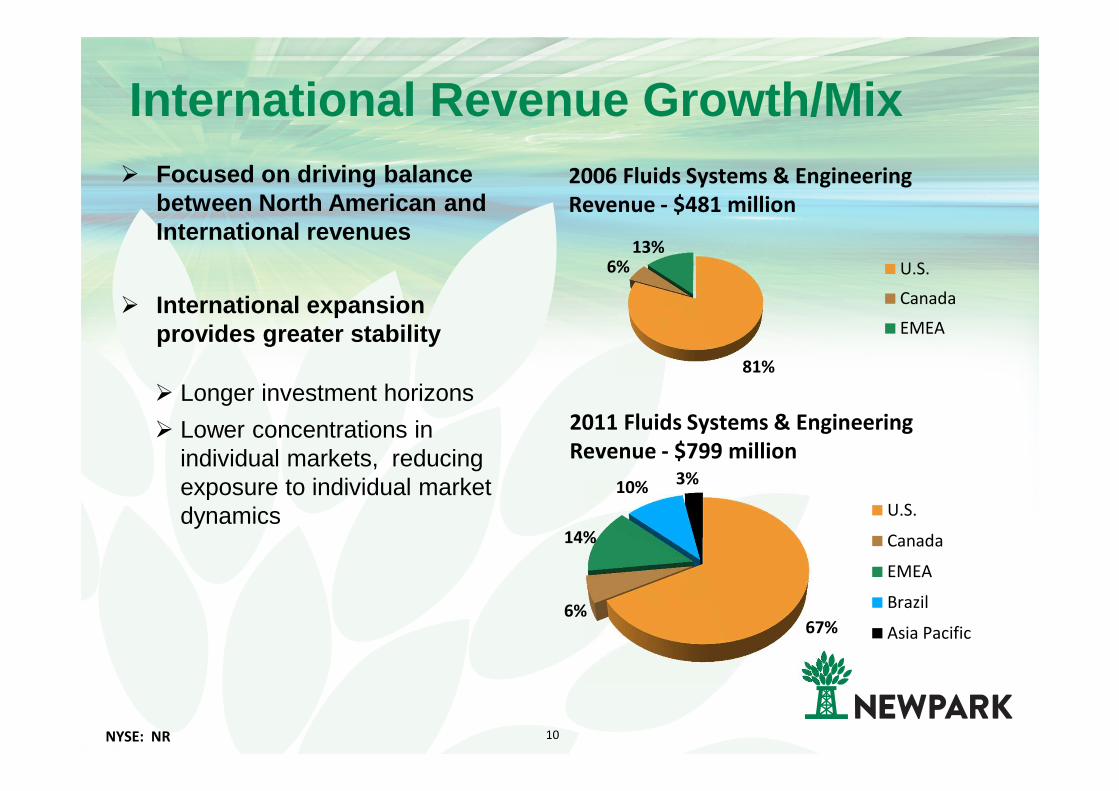
International Revenue Growth/Mix� Focused on driving balance
between North American and International revenues
� International expansion provides greater stability
� Longer investment horizons
� Lower concentrations in individual markets, reducing exposure to individual market dynamics
81%
6%13%
U.S.
Canada
EMEA
2006 Fluids Systems & Engineering
Revenue - $481 million
67%6%
14%
10%3%
U.S.
Canada
EMEA
Brazil
Asia Pacific
2011 Fluids Systems & Engineering
Revenue - $799 million
NYSE: NR 11
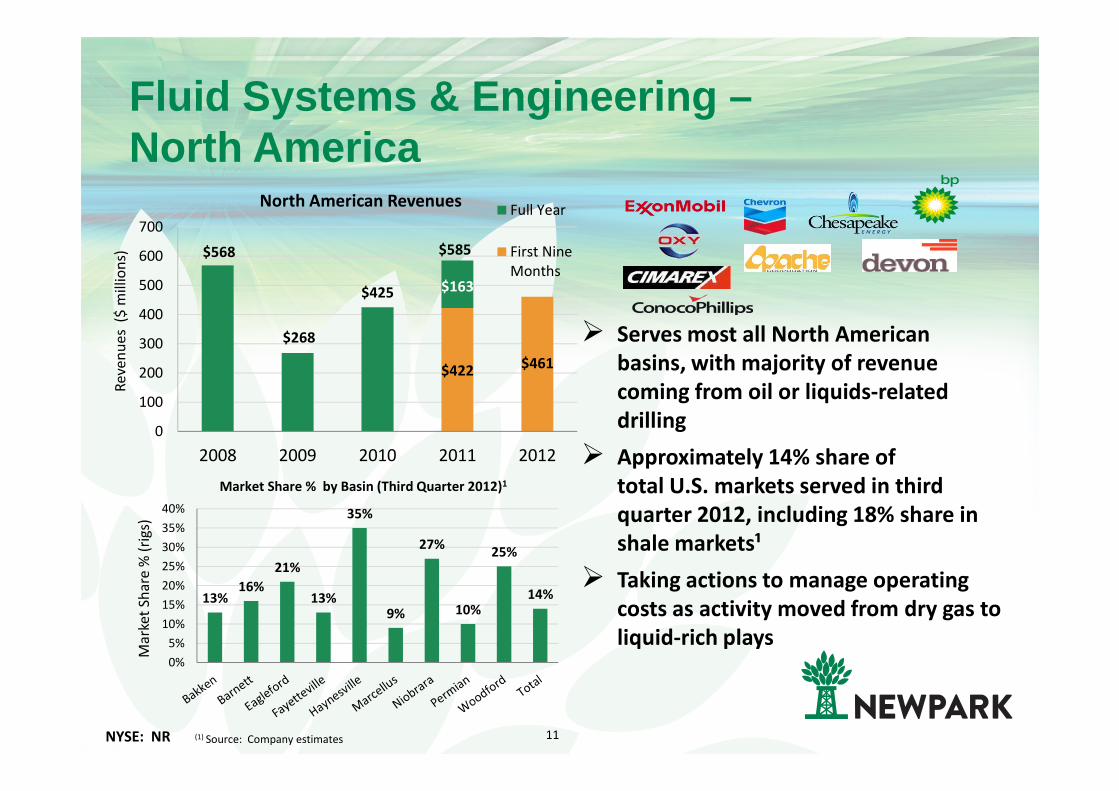
Fluid Systems & Engineering –North America
� Serves most all North American
basins, with majority of revenue
coming from oil or liquids-related
drilling
� Approximately 14% share of
total U.S. markets served in third
quarter 2012, including 18% share in
shale markets¹
� Taking actions to manage operating
costs as activity moved from dry gas to
liquid-rich plays
(1) Source: Company estimates
$422 $461
$568
$268
$425 $163
0
100
200
300
400
500
600
700
2008 2009 2010 2011 2012
Re
ven
ue
s (
$ m
illio
ns)
North American RevenuesFull Year
First Nine
Months
$585
13%16%
21%
13%
35%
9%
27%
10%
25%
14%
0%
5%
10%
15%
20%
25%
30%
35%
40%
Ma
rke
t Sh
are
% (
rig
s)
Market Share % by Basin (Third Quarter 2012)1
NYSE: NR 12
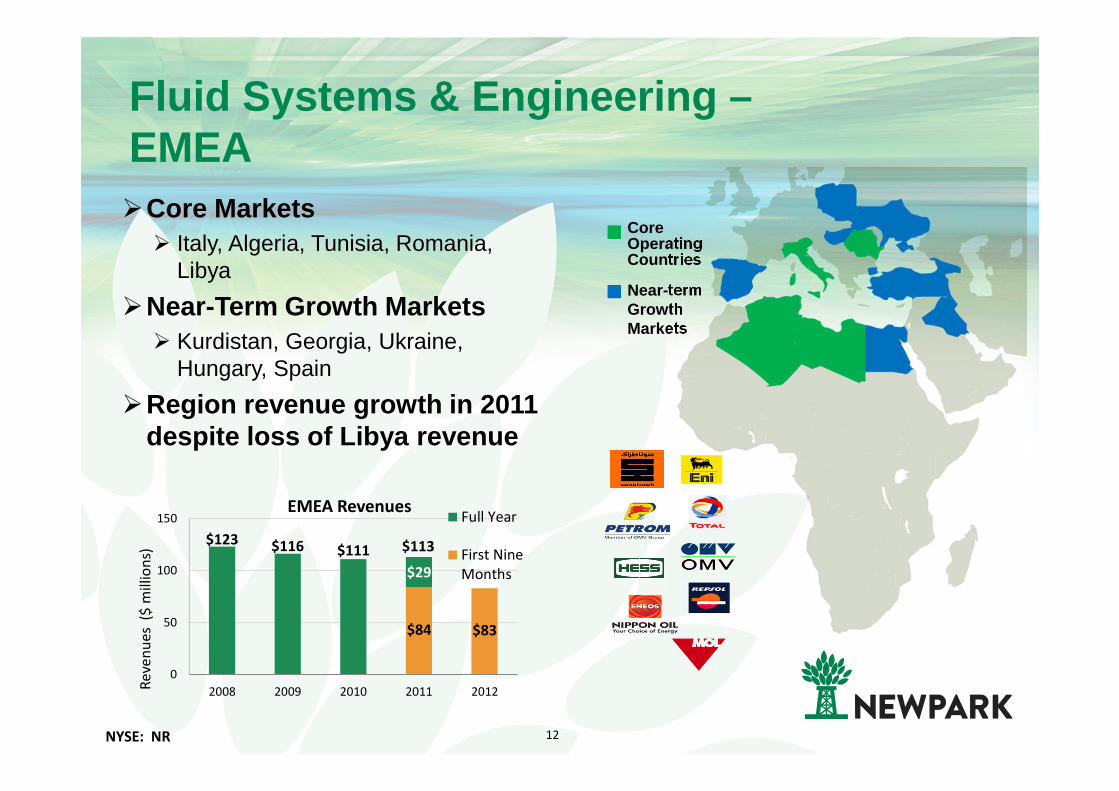
Fluid Systems & Engineering –EMEA�Core Markets
� Italy, Algeria, Tunisia, Romania,Libya
�Near-Term Growth Markets� Kurdistan, Georgia, Ukraine,
Hungary, Spain
�Region revenue growth in 2011 despite loss of Libya revenue
$84 $83
$123 $116 $111
$29
0
50
100
150
2008 2009 2010 2011 2012Re
ven
ue
s (
$ m
illio
ns)
EMEA RevenuesFull Year
First Nine
Months
$113
Core Operating Countries
Near-term Growth Markets
NYSE: NR 13
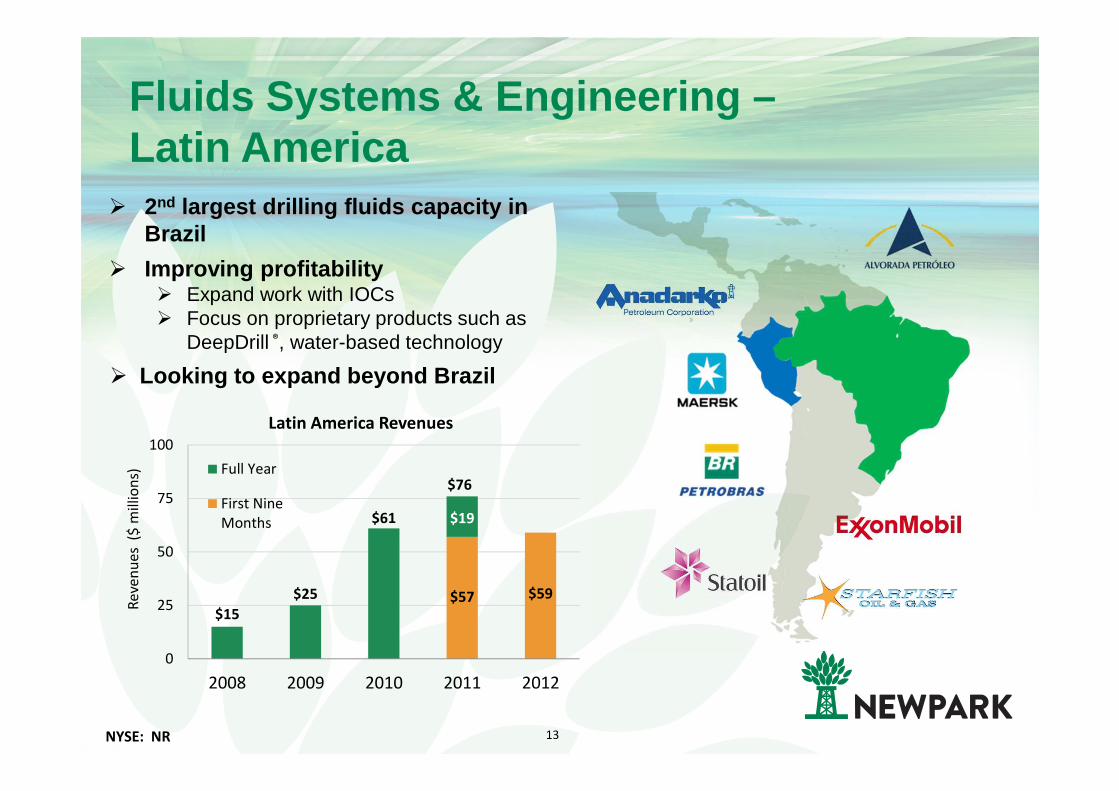
Fluids Systems & Engineering –Latin America
� 2nd largest drilling fluids capacity in Brazil
� Improving profitability� Expand work with IOCs� Focus on proprietary products such as
DeepDrill ®, water-based technology
� Looking to expand beyond Brazil
$57 $59
$15
$25
$61 $19
0
25
50
75
100
2008 2009 2010 2011 2012
Re
ven
ue
s (
$ m
illio
ns)
Latin America Revenues
Full Year
First Nine
Months
$76
NYSE: NR 14
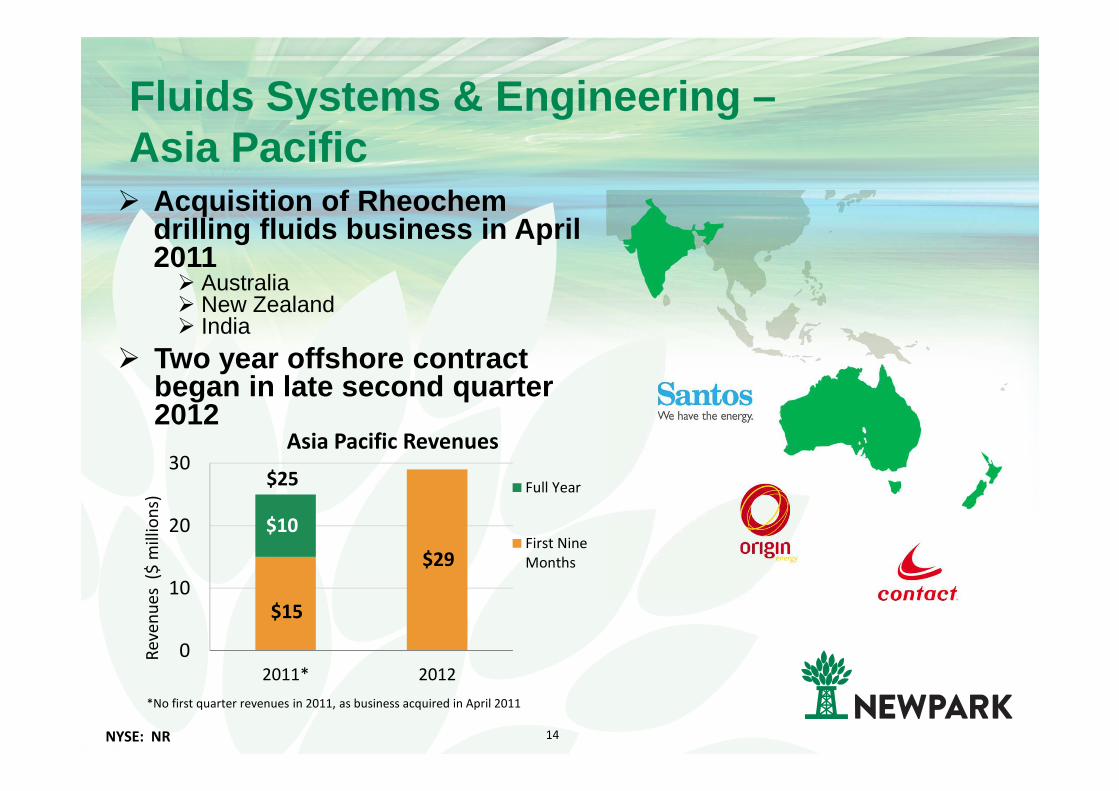
Fluids Systems & Engineering –Asia Pacific� Acquisition of Rheochem
drilling fluids business in April 2011
� Australia � New Zealand� India
� Two year offshore contract began in late second quarter 2012
$15
$29
$10
0
10
20
30
2011* 2012
Re
ven
ue
s (
$ m
illi
on
s)
Asia Pacific Revenues
Full Year
First Nine
Months
*No first quarter revenues in 2011, as business acquired in April 2011
$25
NYSE: NR 15
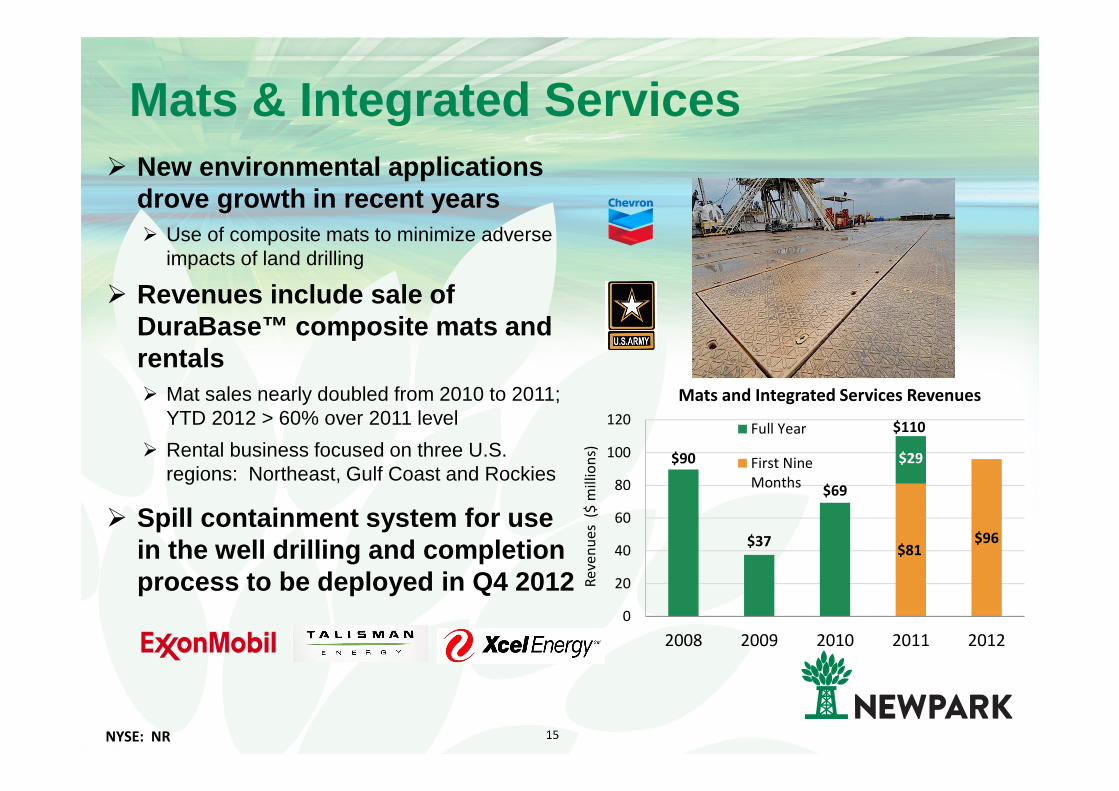
Mats & Integrated Services� New environmental applications
drove growth in recent years� Use of composite mats to minimize adverse
impacts of land drilling
� Revenues include sale of DuraBase™ composite mats and rentals� Mat sales nearly doubled from 2010 to 2011;
YTD 2012 > 60% over 2011 level
� Rental business focused on three U.S. regions: Northeast, Gulf Coast and Rockies
� Spill containment system for use in the well drilling and completion process to be deployed in Q4 2012
$81 $96
$90
$37
$69
$29
0
20
40
60
80
100
120
2008 2009 2010 2011 2012
Re
ven
ue
s (
$ m
illio
ns)
Mats and Integrated Services Revenues
Full Year
First Nine
Months
$110
NYSE: NR 16
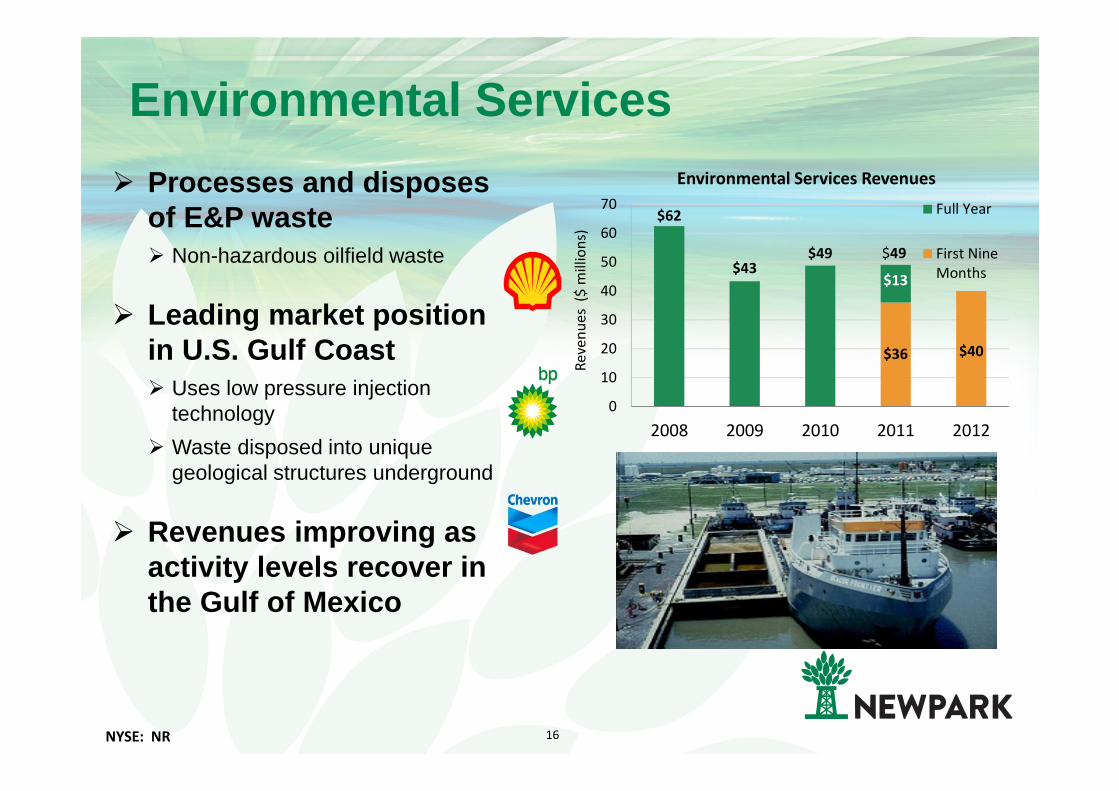
Environmental Services
� Processes and disposes of E&P waste� Non-hazardous oilfield waste
� Leading market position in U.S. Gulf Coast� Uses low pressure injection
technology
� Waste disposed into unique geological structures underground
� Revenues improving as activity levels recover in the Gulf of Mexico
$36 $40
$62
$43 $49
$13
0
10
20
30
40
50
60
70
2008 2009 2010 2011 2012
Re
ven
ue
s (
$ m
illio
ns)
Environmental Services Revenues
Full Year
First Nine
Months
$49
NYSE: NR 17
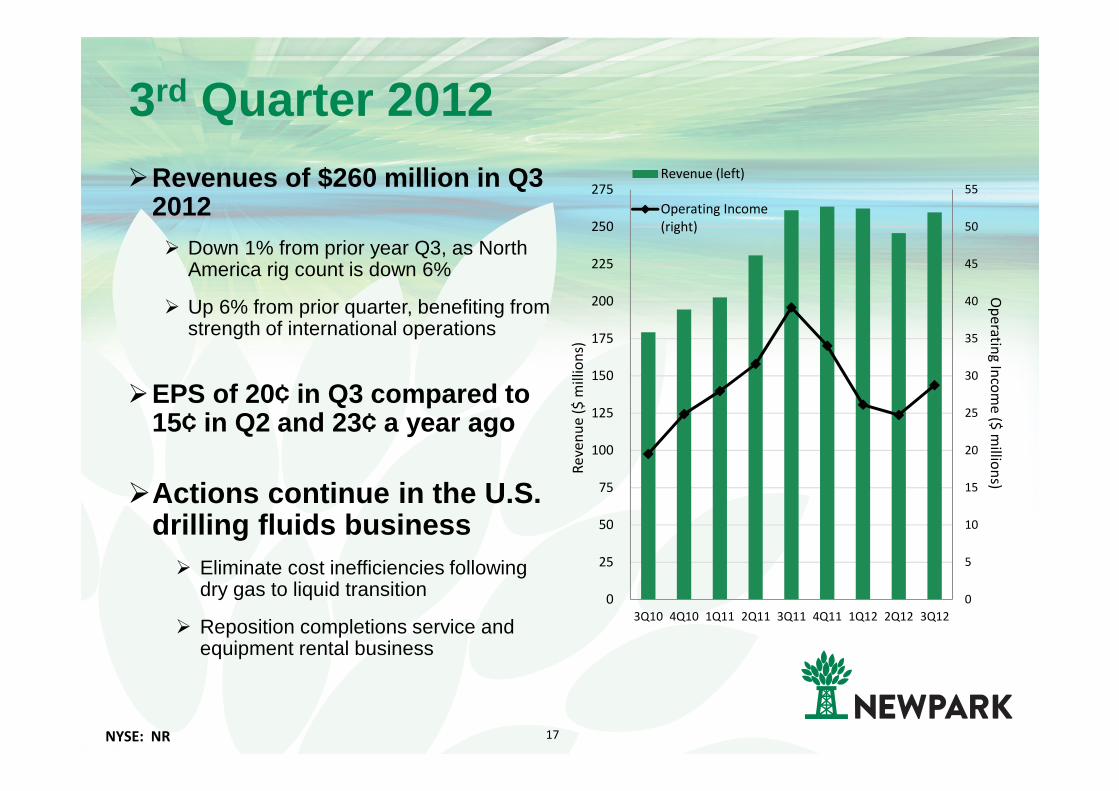
3rd Quarter 2012�Revenues of $260 million in Q3
2012� Down 1% from prior year Q3, as North
America rig count is down 6%
� Up 6% from prior quarter, benefiting from strength of international operations
�EPS of 20¢ in Q3 compared to 15¢ in Q2 and 23¢ a year ago
�Actions continue in the U.S. drilling fluids business
� Eliminate cost inefficiencies following dry gas to liquid transition
� Reposition completions service and equipment rental business
0
5
10
15
20
25
30
35
40
45
50
55
0
25
50
75
100
125
150
175
200
225
250
275
3Q10 4Q10 1Q11 2Q11 3Q11 4Q11 1Q12 2Q12 3Q12
Op
era
ting
Inco
me
($ m
illion
s)
Re
ven
ue
($
mill
ion
s)
Revenue (left)
Operating Income
(right)

NYSE: NR 18
Capital Structure� Solid balance sheet
� Debt/Capitalization ratio of 28.2%
� Cash balance of $35 million at
September 30, 2012
� $50 million share re-purchase
program initiated in the first
quarter of 2012
� $44 million repurchased through
October 2012, reducing
outstanding shares by 6.5
million
� Continued focus on customer
invoicing following ERP System
conversion in U.S. Fluids
business expected to drive
further debt reductions in the
near-term
15%
20%
25%
30%
35%
40%
$0
$50
$100
$150
$200
$250
$300
De
bt to
Ca
pita
lizatio
n
Tota
l De
bt
($ in
mill
ion
s)
Total Debt (left) Debt to Capital (right)
Capital Structure - September 30, 2012$ in millions
Convertible Senior Notes $ 172.5 Other 29.1
Total Debt 201.6 Equity 513.1
Total Capitalization $ 714.7
Debt / Capitalization 28.2%

NYSE: NR 19
Outlook
� Oil & gas liquids driving U.S. drilling activity� We are participating in the move
toward liquids
� Evolution Technology� Continue deploying across North
America and into international markets
� Continue international growth -build on recent success in Brazil and Rheochem acquisition
� Work to maximize rental utilization of mats across all U.S. regions
� Return of drilling in the Gulf of Mexico should benefit our fluids and environmental services businesses
0%
10%
20%
30%
40%
50%
60%
70%U.S. Drilling Rigs by Type*
Horizontal Vertical Directional
0%
10%
20%
30%
40%
50%
60%
70%
80%
90%Oil vs Gas Rig Mix*
Oil
Gas
* Source: Baker Hughes

NYSE: NR 20
APPENDIX

NYSE: NR 21
Consolidated Statements of Operations
(Unaudited) Three Months Ended Nine Months Ended(In thousands, except per share data)
Sep 30, 2012 Jun 30, 2012 Sep 30, 2011 Sep 30, 2012 Sep 30, 2011
Revenues $ 259,599 $ 245,756 $ 261,193 $ 767,691 $ 694,666
Cost of revenues 210,276 201,534 201,272 626,712 539,185
Selling, general and administrative expenses 20,878 19,944 20,802 62,135 57,770
Other operating income, net (311) (477) (60) (802) (1,012)
Operating income 28,756 24,755 39,179 79,646 98,723
Foreign currency exchange loss 185 461 485 416 340
Interest expense, net 2,416 2,553 2,464 7,337 6,821
Income from operations before income taxes 26,155 21,741 36,230 71,893 91,562
Provision for income taxes 7,413 7,278 13,233 23,054 33,431
Net income $ 18,742 $ 14,463 $ 22,997 $ 48,839 $ 58,131
Income per common share -basic: $ 0.22 $ 0.16 $ 0.25 $ 0.55 $ 0.65
Income per common share -diluted: $ 0.20 $ 0.15 $ 0.23 $ 0.50 $ 0.58
NYSE: NR 22
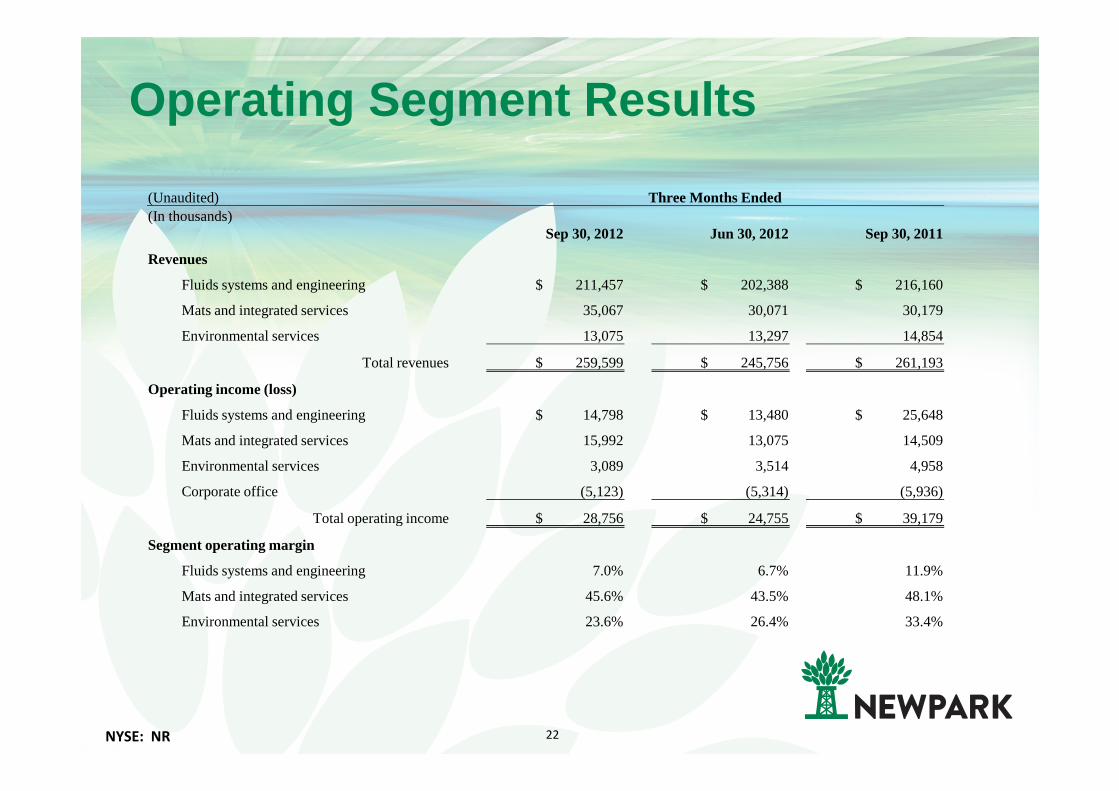
Operating Segment Results
(Unaudited) Three Months Ended(In thousands)
Sep 30, 2012 Jun 30, 2012 Sep 30, 2011
Revenues
Fluids systems and engineering $ 211,457 $ 202,388 $ 216,160
Mats and integrated services 35,067 30,071 30,179
Environmental services 13,075 13,297 14,854
Total revenues $ 259,599 $ 245,756 $ 261,193
Operating income (loss)
Fluids systems and engineering $ 14,798 $ 13,480 $ 25,648
Mats and integrated services 15,992 13,075 14,509
Environmental services 3,089 3,514 4,958
Corporate office (5,123) (5,314) (5,936)
Total operating income $ 28,756 $ 24,755 $ 39,179
Segment operating margin
Fluids systems and engineering 7.0% 6.7% 11.9%
Mats and integrated services 45.6% 43.5% 48.1%
Environmental services 23.6% 26.4% 33.4%
NYSE: NR 23
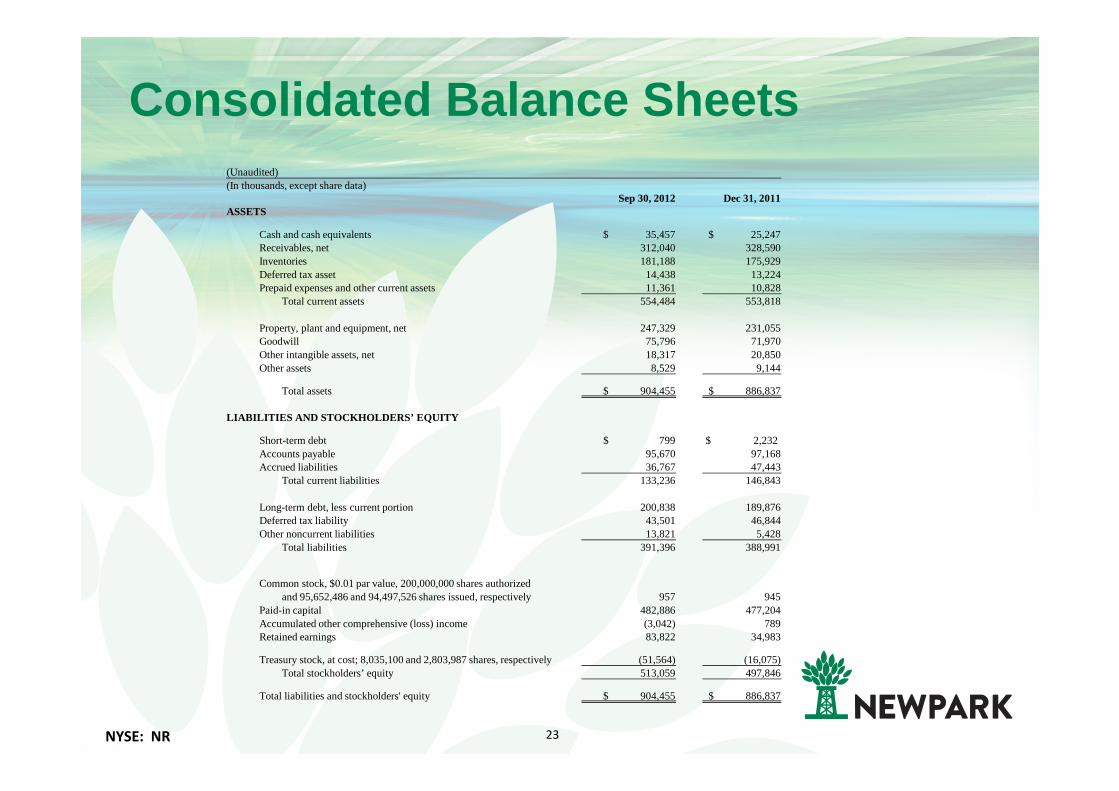
Consolidated Balance Sheets(Unaudited)(In thousands, except share data)
Sep 30, 2012 Dec 31, 2011ASSETS
Cash and cash equivalents $ 35,457 $ 25,247 Receivables, net 312,040 328,590 Inventories 181,188 175,929 Deferred tax asset 14,438 13,224 Prepaid expenses and other current assets 11,361 10,828
Total current assets 554,484 553,818
Property, plant and equipment, net 247,329 231,055 Goodwill 75,796 71,970 Other intangible assets, net 18,317 20,850 Other assets 8,529 9,144
Total assets $ 904,455 $ 886,837
LIABILITIES AND STOCKHOLDERS’ EQUITY
Short-term debt $ 799 $ 2,232 Accounts payable 95,670 97,168 Accrued liabilities 36,767 47,443
Total current liabilities 133,236 146,843
Long-term debt, less current portion 200,838 189,876 Deferred tax liability 43,501 46,844 Other noncurrent liabilities 13,821 5,428
Total liabilities 391,396 388,991
Common stock, $0.01 par value, 200,000,000 shares authorized and 95,652,486 and 94,497,526 shares issued, respectively 957 945
Paid-in capital 482,886 477,204 Accumulated other comprehensive (loss) income (3,042) 789 Retained earnings 83,822 34,983
Treasury stock, at cost; 8,035,100 and 2,803,987 shares, respectively (51,564) (16,075)Total stockholders’ equity 513,059 497,846
Total liabilities and stockholders' equity $ 904,455 $ 886,837

NYSE: NR 24
Consolidated Statements of Cash Flow(Unaudited) Nine Months Ended September 30,(In thousands) 2012 2011Cash flows from operating activities:Net income $ 48,839 $ 58,131 Adjustments to reconcile net income to net cash provided by operations:Depreciation and amortization 24,406 21,162 Stock-based compensation expense 5,027 3,396 Provision for deferred income taxes (4,654) 16,363 Net provision for doubtful accounts 1,282 1,165 Loss on sale of assets 512 22 Change in assets and liabilities:Decrease (increase) in receivables 11,964 (57,603)Increase in inventories (6,446) (27,921)Increase in other assets (98) (5,226)Increase in accounts payable 2,905 28,893 Decrease in accrued liabilities and other (3,085) (3,655)
Net cash provided by operating activities 80,652 34,727
Cash flows from investing activities:Capital expenditures (34,858) (28,136)Business acquisition, net of cash acquired - (26,775)Proceeds from sale of property, plant and equipment 823 434
Net cash used in investing activities (34,035) (54,477)
Cash flows from financing activities:Borrowings on lines of credit 222,868 5,891 Payments on lines of credit (213,221) (5,754)Proceeds from employee stock plans 1,007 1,768 Purchase of treasury stock (35,698) (599)Post-closing payment for business acquisition (11,892) (2,055)Other financing activities (48) (147)
Net cash used in financing activities (36,984) (896)
Effect of exchange rate changes on cash 577 538
Net increase (decrease) in cash and cash equivalents 10,210 (20,108)Cash and cash equivalents at beginning of year 25,247 83,010
Cash and cash equivalents at end of period $ 35,457 $ 62,902
NYSE: NR 25
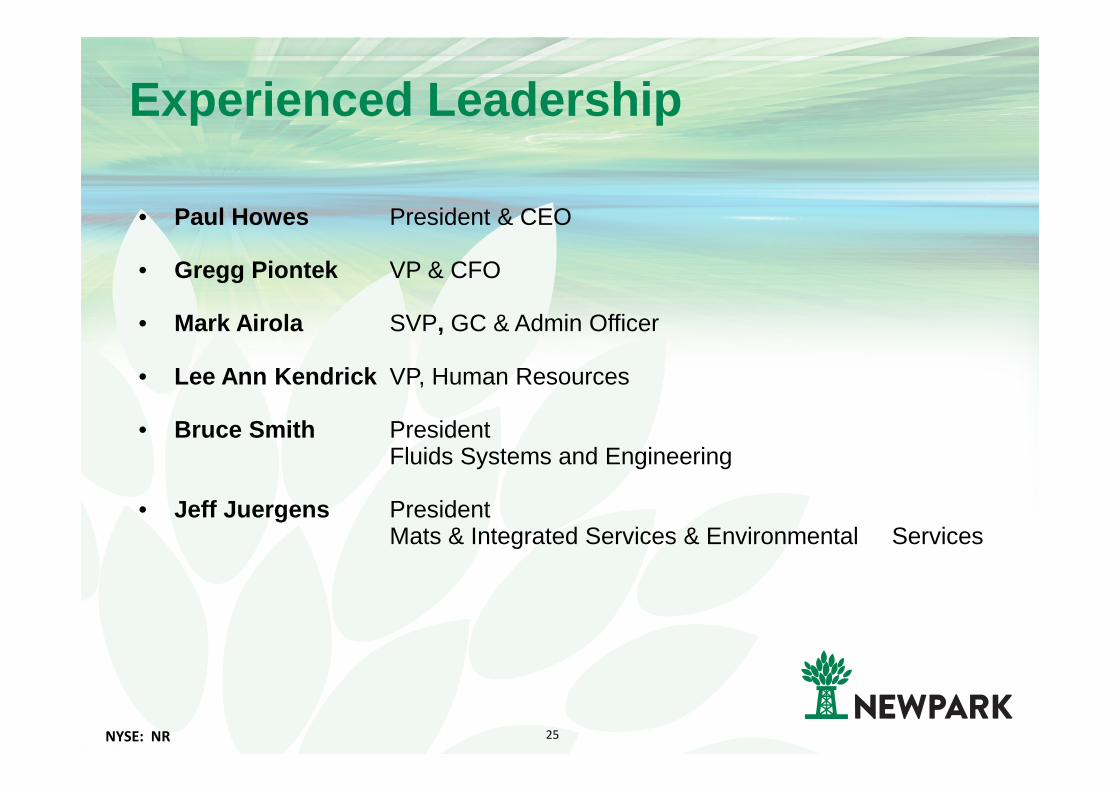
Experienced Leadership
• Paul Howes President & CEO
• Gregg Piontek VP & CFO
• Mark Airola SVP, GC & Admin Officer
• Lee Ann Kendrick VP, Human Resources
• Bruce Smith President Fluids Systems and Engineering
• Jeff Juergens President Mats & Integrated Services & Environmental Services
NYSE: NR 26
Management Biographies
Paul L. Howes, President & CEO : Paul joined Newpark’s Board of Directors and was appointed its Chief Executive Officer in March 2006. In June 2006, Mr. Howes also was appointed as Newpark’s President. Mr. Howes’ career has included experience in the defense industry, chemicals and plastics manufacturing, and the packaging industry. From 2002 until October 2005, he served as President and Chief Executive Officer of Astaris LLC, a primary chemicals company headquartered in St. Louis, Missouri, with operations in North America, Europe and South America. Prior to this, from 1997 until 2002, he served as Vice President and General Manager, Packaging Division, for Flint Ink Corporation, a global ink company headquartered in Ann Arbor, Michigan with operations in North America, Europe, Asia Pacific and Latin America.
Gregg S. Piontek, VP & CFO : Joined Newpark in April 2007 and served as Vice President, Controller and Chief Accounting Officer from April 2007 to October 2011. Prior to joining Newpark, Mr. Piontek was Vice President and Chief Accounting Officer of Stewart & Stevenson LLC from 2006 to 2007, where he served as the lead executive financial officer for the asset acquisition from Stewart & Stevenson Services, Inc. and $150 million public debt offering. From 2001 to 2006, Mr. Piontek held the positions of Assistant Corporate Controller and Division Controller for Stewart & Stevenson Services, Inc. Prior to that, Mr. Piontek served in various financials roles at General Electric and CNH Global N.V., after beginning his career as an auditor for Deloitte & Touche LLP. Mr. Piontek is a Certified Public Accountant and holds a bachelor degree in Accountancy from Arizona State University and a Master of Business Administration degree from Marquette University.
Mark J. Airola, Sr. VP, GC & Admin Officer : Mark joined Newpark in October 2006 as its Vice President, General Counsel and Chief Administrative Officer. Mr. Airola was named Senior Vice President in February of 2011. Mr. Airola has practiced law for 22 years, primarily with large, publicly traded companies. Most recently, Mr. Airola was Assistant General Counsel and Chief Compliance Officer for BJ Services Company, a leading provider of pressure pumping and other oilfield services to the petroleum industry, serving as an executive officer since 2003. From 1988 to 1995, he held the position of Senior Litigation Counsel at Cooper Industries, Inc., a global manufacturer of electrical products and tools, with initial responsibility for managing environmental regulatory matters and litigation and subsequently managing the company’s commercial litigation.
NYSE: NR 27
Management Biographies
Lee Ann Kendrick, Vice President, Human Resources: Lee Ann joined Newpark in January 2012 as Vice President of Human Resources. Prior to joining Newpark, Ms. Kendrick was responsible for human resources for The Americas with Lloyd's Register, a risk management and safety assurance organization in energy, utilities, general engineering and manufacturing industries. Prior to that, Ms. Kendrick spent seven years at CGGVeritas, a leading oil and gas services company that provides seismic solutions to exploration and production companies. At CGGVeritas, Ms. Kendrick held numerous roles including Director of HR Services, Latin America HR Manager and Corporate Benefits Manager. From 1992 to 2001, Ms. Kendrick worked in the financial services industry where she started her career with MetLife Financial Services, a leading provider of financial services and insurance to individual and institutional clients.
Bruce C. Smith, Executive VP and President Fluids S ystems and Engineering : Bruce joined Newpark in April 1998 as Vice President, International. Since October 2000, he has served as President of its subsidiary Newpark Drilling Fluids, L.P. Prior to joining Newpark, Mr. Smith was the Managing Director of the U.K. operations of M-I Swaco, a competitor of Newpark Drilling Fluids, where he was responsible for two business units, including their drilling fluids unit.
Jeffery L. Juergens, President Mats and Integrated Services & Environmental Services : Jeff joined Newpark in October 2010 as President of Newpark Mats and Integrated Services and Newpark Environmental Services. Prior to joining Newpark, Mr. Juergens was the Chief Executive Officer of B&B Oilfield Services, an oilfield equipment manufacturing company which was acquired by Halliburton. Mr. Juergens has also held the position of Vice President, International Operations/Regional Manager with SPS International, a global company specializing in wellbore cleanup equipment and services, subsequently acquired by M-I Swaco.