newmont mining corp /de/ of contents page part i item 1. financial statements 1 condensed...
TRANSCRIPT

NEWMONT MINING CORP /DE/
FORM 10-Q(Quarterly Report)
Filed 04/27/10 for the Period Ending 03/31/10
Address 6363 SOUTH FIDDLERS GREEN CIRCLE
GREENWOOD VILLAGE, CO 80111Telephone 303-863-7414
CIK 0001164727Symbol NEM
SIC Code 1040 - Gold And Silver OresIndustry Gold & Silver
Sector Basic MaterialsFiscal Year 12/31
http://www.edgar-online.com© Copyright 2010, EDGAR Online, Inc. All Rights Reserved.
Distribution and use of this document restricted under EDGAR Online, Inc. Terms of Use.

Table of Contents

Table of Contents
UNITED STATES SECURITIES AND EXCHANGE COMMISSION
Washington, D. C. 20549
Form 10-Q (Mark One)
For the Quarterly Period Ended March 31, 2010
or
For the transition period from to
Commission File Number: 001-31240
NEWMONT MINING CORPORATION (Exact name of registrant as specified in its chart er)
Registrant’s telephone number, including area code (303) 863-7414
Indicate by check mark whether the registrant (1) has filed all reports required to be filed by Section 13 or 15(d) of the Securities Exchange Act of 1934 during the preceding 12 months (or for such shorter period that the registrant was required to file such reports), and (2) has been subject to such filing requirements for the past 90 days. � Yes � No
Indicate by check mark whether the registrant has submitted electronically and posted on its corporate Web site, if any, every Interactive Data File required to be submitted and posted pursuant to Rule 405 of Regulation S-T (§ 232.405 of this chapter) during the preceding 12 months (or for such shorter period that the registrant was required to submit and post such files). � Yes � No
Indicate by check mark whether the registrant is a large accelerated filer, an accelerated filer, a non-accelerated filer, or a smaller reporting company. See definition of “accelerated filer” and “large accelerated filer” in Rule 12-b2 of the Exchange Act. (Check one):
Indicate by check mark whether the registrant is a shell company (as defined in Rule 12-b2 of the Exchange
� QUARTERLY REPORT PURSUANT TO SECTION 13 OR 15(d) OF THE SECURITIES EXCHANGE ACT OF 1934
� TRANSITION REPORT PURSUANT TO SECTION 13 OR 15(d) O F THE
SECURITIES EXCHANGE ACT OF 1934
Delaware 84-1611629
(State or Other Jurisdiction of (I.R.S. Employer Incorporation or Organization) Identification No.)
6363 South Fiddler ’s Green Circle
Greenwood Village, Colorado 80111 (Address of Principal Executive Offices) (Zip Code)
Large accelerated filer � Accelerated filer � Non-accelerated filer � Smaller reporting company �
(Do not check if a smaller reporting company)

Act). � Yes � No
There were 483,457,696 shares of common stock outstanding on April 20, 2010 (and 7,846,441 exchangeable shares).

TABLE OF CONTENTS Page
PART I ITEM 1. FINANCIAL STATEMENTS 1
Condensed Consolidated Statements of Income 1
Condensed Consolidated Statements of Cash Flows 2
Condensed Consolidated Balance Sheets 3
Notes to Condensed Consolidated Financial Statements 4 ITEM 2. MANAGEMENT’S DISCUSSION AND ANALYSIS OF RESULTS OF OPERATIONS AND
FINANCIAL CONDITION 37
Selected Financial and Operating Results 38
Consolidated Financial Results 38
Results of Consolidated Operations 44
Liquidity and Capital Resources 47
Environmental 50
Accounting Developments 50
Non-GAAP Financial Measures 50
Safe Harbor Statement 52 ITEM 3. QUANTITATIVE AND QUALITATIVE DISCLOSURES ABOUT MARKET RISK 53 ITEM 4. CONTROLS AND PROCEDURES 55
PART II ITEM 1. LEGAL PROCEEDINGS 56 ITEM 1A. RISK FACTORS 56 ITEM 2. ISSUER PURCHASES OF EQUITY SECURITIES 56 ITEM 3. DEFAULTS UPON SENIOR SECURITIES 56 ITEM 5. OTHER INFORMATION 56 ITEM 6. EXHIBITS 56 SIGNATURES 57 EXHIBIT INDEX 58 Exhibit 12.1 Exhibit 31.1 Exhibit 31.2 Exhibit 32.1 Exhibit 32.2 EX-101 INSTANCE DOCUMENT EX-101 SCHEMA DOCUMENT

EX-101 CALCULATION LINKBASE DOCUMENT EX-101 LABELS LINKBASE DOCUMENT EX-101 PRESENTATION LINKBASE DOCUMENT

Table of Contents
PART I—FINANCIAL INFORMATION
ITEM 1. FINANCIAL STATEMENTS.
NEWMONT MINING CORPORATION
CONDENSED CONSOLIDATED STATEMENTS OF INCOME (unaudited, in millions except per share)
The accompanying notes are an integral part of the condensed consolidated financial statements.
1
Three Months Ended March 31, 2010 2009 Sales (Note 3) $ 2,242 $ 1,536 Costs and expenses
Costs applicable to sales (1) (Note 3) 875 739 Amortization (Note 3) 224 191 Reclamation and remediation (Note 4) 13 12 Exploration 43 41 Advanced projects, research and development (Note 5) 46 31 General and administrative 45 39 Other expense, net (Note 6) 89 73
1,335 1,126
Other income (expense) Other income, net (Note 7) 48 9 Interest expense, net (75 ) (32 )
(27 ) (23 )
Income before income tax and other items 880 387 Income tax expense (Note 10) (135 ) (105 ) Equity loss of affiliates (2 ) (5 )
Net income 743 277 Net income attributable to noncontrolling interests (Note 12) (197 ) (88 )
Net income attributable to Newmont stockholders $ 546 $ 189
Income per common share, basic and diluted (Note 13) $ 1.11 $ 0.40 Cash dividends declared per common share $ 0.10 $ 0.10
(1) Exclusive of Amortization and Reclamation and remediation .
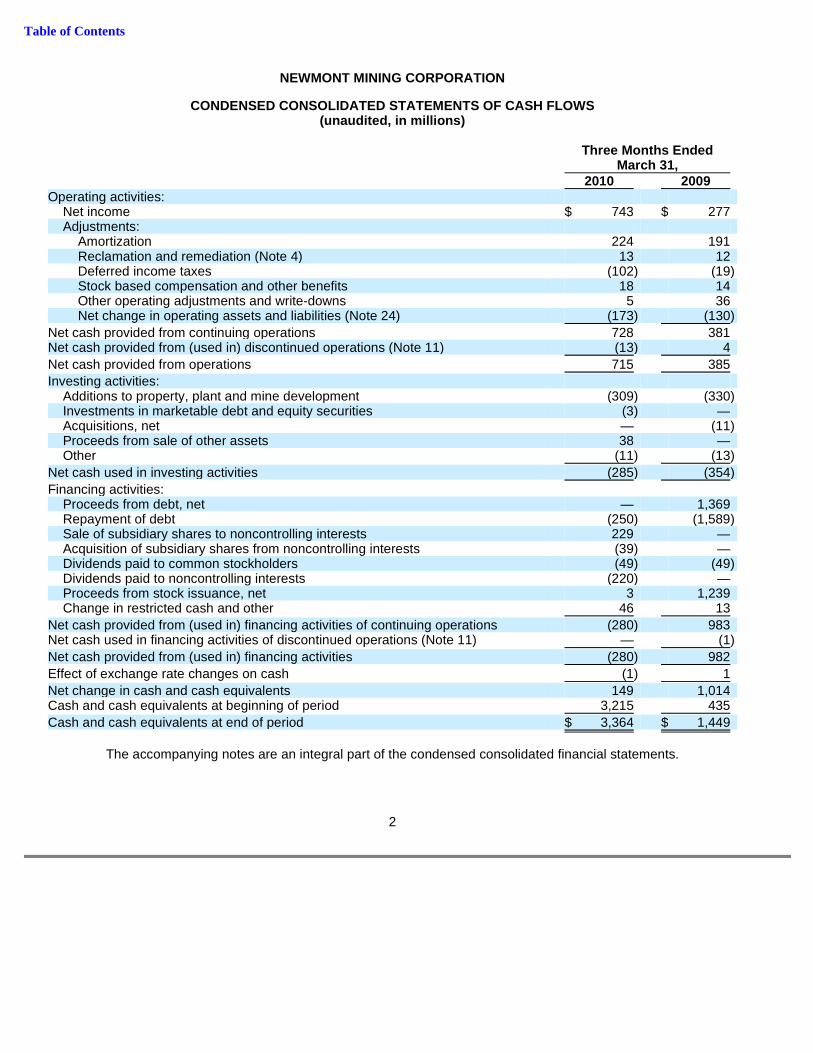
Table of Contents
NEWMONT MINING CORPORATION
CONDENSED CONSOLIDATED STATEMENTS OF CASH FLOWS (unaudited, in millions)
The accompanying notes are an integral part of the condensed consolidated financial statements.
2
Three Months Ended March 31, 2010 2009 Operating activities:
Net income $ 743 $ 277 Adjustments:
Amortization 224 191 Reclamation and remediation (Note 4) 13 12 Deferred income taxes (102 ) (19 ) Stock based compensation and other benefits 18 14 Other operating adjustments and write-downs 5 36 Net change in operating assets and liabilities (Note 24) (173 ) (130 )
Net cash provided from continuing operations 728 381 Net cash provided from (used in) discontinued operations (Note 11) (13 ) 4
Net cash provided from operations 715 385
Investing activities: Additions to property, plant and mine development (309 ) (330 ) Investments in marketable debt and equity securities (3 ) — Acquisitions, net — (11 ) Proceeds from sale of other assets 38 — Other (11 ) (13 )
Net cash used in investing activities (285 ) (354 )
Financing activities: Proceeds from debt, net — 1,369 Repayment of debt (250 ) (1,589 ) Sale of subsidiary shares to noncontrolling interests 229 — Acquisition of subsidiary shares from noncontrolling interests (39 ) — Dividends paid to common stockholders (49 ) (49 ) Dividends paid to noncontrolling interests (220 ) — Proceeds from stock issuance, net 3 1,239 Change in restricted cash and other 46 13
Net cash provided from (used in) financing activities of continuing operations (280 ) 983 Net cash used in financing activities of discontinued operations (Note 11) — (1 )
Net cash provided from (used in) financing activities (280 ) 982
Effect of exchange rate changes on cash (1 ) 1
Net change in cash and cash equivalents 149 1,014 Cash and cash equivalents at beginning of period 3,215 435
Cash and cash equivalents at end of period $ 3,364 $ 1,449
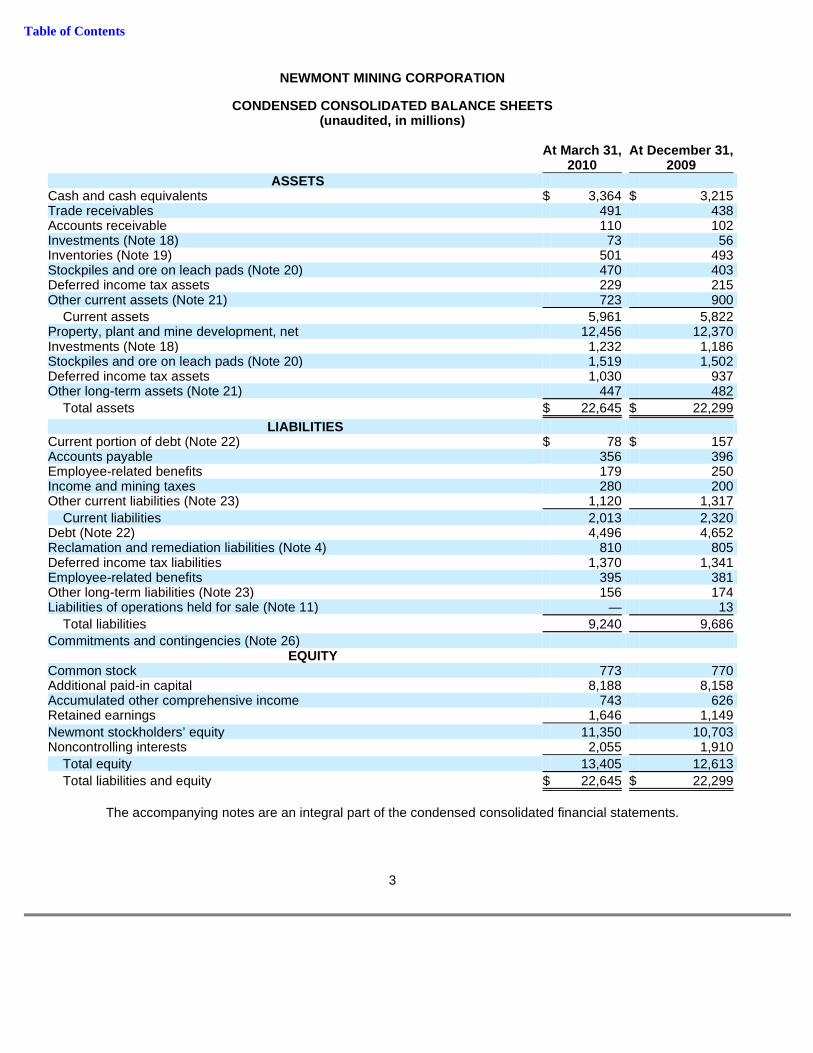
Table of Contents
NEWMONT MINING CORPORATION
CONDENSED CONSOLIDATED BALANCE SHEETS (unaudited, in millions)
The accompanying notes are an integral part of the condensed consolidated financial statements.
3
At March 31, At December 31, 2010 2009
ASSETS Cash and cash equivalents $ 3,364 $ 3,215 Trade receivables 491 438 Accounts receivable 110 102 Investments (Note 18) 73 56 Inventories (Note 19) 501 493 Stockpiles and ore on leach pads (Note 20) 470 403 Deferred income tax assets 229 215 Other current assets (Note 21) 723 900
Current assets 5,961 5,822 Property, plant and mine development, net 12,456 12,370 Investments (Note 18) 1,232 1,186 Stockpiles and ore on leach pads (Note 20) 1,519 1,502 Deferred income tax assets 1,030 937 Other long-term assets (Note 21) 447 482
Total assets $ 22,645 $ 22,299
LIABILITIES Current portion of debt (Note 22) $ 78 $ 157 Accounts payable 356 396 Employee-related benefits 179 250 Income and mining taxes 280 200 Other current liabilities (Note 23) 1,120 1,317
Current liabilities 2,013 2,320 Debt (Note 22) 4,496 4,652 Reclamation and remediation liabilities (Note 4) 810 805 Deferred income tax liabilities 1,370 1,341 Employee-related benefits 395 381 Other long-term liabilities (Note 23) 156 174 Liabilities of operations held for sale (Note 11) — 13
Total liabilities 9,240 9,686
Commitments and contingencies (Note 26) EQUITY
Common stock 773 770 Additional paid-in capital 8,188 8,158 Accumulated other comprehensive income 743 626 Retained earnings 1,646 1,149
Newmont stockholders’ equity 11,350 10,703 Noncontrolling interests 2,055 1,910
Total equity 13,405 12,613
Total liabilities and equity $ 22,645 $ 22,299

Table of Contents
NEWMONT MINING CORPORATION
NOTES TO CONDENSED CONSOLIDATED FINANCIAL STATEMENT S (Unaudited) (dollars in millions, except per share, per ounce and per pound amounts)
NOTE 1 BASIS OF PRESENTATION
The interim Condensed Consolidated Financial Statements (“interim statements”) of Newmont Mining Corporation and its subsidiaries (collectively, “Newmont” or the “Company”) are unaudited. In the opinion of management, all adjustments and disclosures necessary for a fair presentation of these interim statements have been included. The results reported in these interim statements are not necessarily indicative of the results that may be reported for the entire year. These interim statements should be read in conjunction with Newmont’s Consolidated Financial Statements for the year ended December 31, 2009 filed February 25, 2010. The year-end balance sheet data was derived from the audited financial statements, but does not include all disclosures required by U.S. generally accepted accounting principles (“GAAP”).
References to “A$” refer to Australian currency, “C$” to Canadian currency, “IDR” to Indonesian currency, “NZ$” to New Zealand currency and “$” to United States currency.
NOTE 2 SUMMARY OF SIGNIFICANT ACCOUNTING POLICIES
Recently Adopted Accounting Pronouncements
Variable Interest Entities
In June 2009, the Accounting Standards Codification (“ASC”) guidance for consolidation accounting was updated to require an entity to perform a qualitative analysis to determine whether the enterprise’s variable interest gives it a controlling financial interest in a Variable Interest Entity (“VIE”). This qualitative analysis identifies the primary beneficiary of a VIE as the entity that has both of the following characteristics: (i) the power to direct the activities of a VIE that most significantly impact the entity’s economic performance and (ii) the obligation to absorb losses or receive benefits from the entity that could potentially be significant to the VIE. The updated guidance also requires ongoing reassessments of the primary beneficiary of a VIE.
The Company identified Nusa Tenggara Partnership (“NTP”), a partnership between Newmont and an affiliate of Sumitomo, that owns a 56% interest in PT Newmont Nusa Tenggara (“PTNNT” or “Batu Hijau”), as a VIE due to certain capital structures and contractual relationships. In December 2009, Newmont entered into a transaction with P.T. Pukuafu Indah (“PTPI”), an unrelated noncontrolling partner of PTNNT, whereby the Company agreed to advance certain funds to PTPI in exchange for a pledge of the noncontrolling partner’s 20% share of PTNNT dividends, net of withholding tax, and the assignment of its voting rights to the Company. As a result, PTPI was also determined to be a VIE as it has minimal equity capital and the voting rights associated with its interest in PTNNT reside with Newmont. The Company is considered the primary beneficiary of these entities and therefore consolidates them in the Company’s financial statements. Adoption of the updated guidance, effective for the Company’s fiscal year beginning January 1, 2010, had no impact on the Company’s condensed consolidated financial position, results of operations or cash flows.
Fair Value Accounting
In January 2010, ASC guidance for fair value measurements and disclosure was updated to require additional disclosures related to transfers in and out of level 1 and 2 fair value measurements and enhanced detail in the level 3 reconciliation. The guidance was amended to clarify the level of disaggregation required for assets and liabilities and the disclosures required for inputs and valuation techniques used to measure the fair value of assets and liabilities that fall in either level 2 or level 3. The updated guidance was effective for the Company’s fiscal year beginning January 1, 2010, with the exception of the level 3 disaggregation which is effective for the Company’s fiscal year beginning January 1, 2011. The adoption had no impact on the Company’s condensed consolidated financial position, results of operations or cash flows. Refer to Note 16 for further details regarding the Company’s assets and liabilities measured at fair value.
4

Table of Contents
NEWMONT MINING CORPORATION
NOTES TO CONDENSED CONSOLIDATED FINANCIAL STATEMENT S (Unaudited) (Continued) (dollars in millions, except per share, per ounce and per pound amounts)
NOTE 3 SEGMENT INFORMATION
The Company’s reportable segments are based upon the Company’s management organization structure that is focused on the geographic region for the company’s operations. The financial information relating to Newmont’s segments is as follows:
5
Costs Advanced Applicable to Projects and Pre-Tax Total Capital Sales Sales Amortization Exploration Income Assets Expenditures (1) Three Months Ended
March 31, 2010 Nevada $ 468 $ 258 $ 62 $ 17 $ 121 $ 3,250 $ 48 La Herradura 44 14 4 1 25 155 14 Hope Bay — — 3 17 (20 ) 1,965 9 Other North America — — — — (1 ) 55 —
North America 512 272 69 35 125 5,425 71
Yanacocha 460 154 37 7 242 2,621 57 Other South America — — — 5 (5 ) 25 —
South America 460 154 37 12 237 2,646 57
Boddington
Gold 167 80 22 Copper 38 24 6
Total Boddington 205 104 28 1 68 4,108 48
Other Australia/New Zealand 314 156 31 5 126 864 36
Batu Hijau: Gold 165 34 10 Copper 455 91 27
Total Batu Hijau 620 125 37 — 407 2,988 28
Other Asia Pacific — — 1 5 17 314 2
Asia Pacific 1,139 385 97 11 618 8,274 114
Africa 131 64 17 7 38 1,195 27
Corporate and Other — — 4 24 (138 ) 5,105 3
Consolidated $ 2,242 $ 875 $ 224 $ 89 $ 880 $ 22,645 $ 272
(1) Accrual basis which includes a decrease in accrued capital of $37; consolidated capital expenditures on a cash
basis were $309.

Table of Contents
NEWMONT MINING CORPORATION
NOTES TO CONDENSED CONSOLIDATED FINANCIAL STATEMENT S (Unaudited) (Continued) (dollars in millions, except per share, per ounce and per pound amounts)
NOTE 4 RECLAMATION AND REMEDIATION
At March 31, 2010 and December 31, 2009, $704 and $698, respectively, were accrued for reclamation obligations relating to mineral properties. In addition, the Company is involved in several matters concerning environmental obligations associated with former, primarily historic, mining activities. Generally, these matters concern developing and implementing remediation plans at the various sites involved. At March 31, 2010 and December 31, 2009, $157 and $161, respectively, were accrued for such obligations.
The following is a reconciliation of reclamation and remediation liabilities:
6
Costs Advanced Applicable to Projects and Pre-Tax Total Capital Sales Sales Amortization Exploration Income Assets Expenditures (2) Three Months Ended
March 31, 2009 Nevada $ 468 $ 263 $ 61 $ 14 $ 121 $ 3,201 $ 53 La Herradura 23 10 2 — 13 95 9 Hope Bay — — 3 14 (17 ) 1,574 1 Other North America — — — 1 (3 ) 52 —
North America 491 273 66 29 114 4,922 63
Yanacocha 427 152 41 4 204 2,023 33 Other South America — — — 6 (4 ) 24 —
South America 427 152 41 10 200 2,047 33
Boddington — — — 5 (7 ) 1,928 216 Other Australia/New
Zealand 269 145 32 6 77 816 18 Batu Hijau:
Gold 59 27 7 Copper 161 85 21
Total Batu Hijau 220 112 28 — 64 2,460 6
Other Asia Pacific — — 1 2 (8 ) 152 1
Asia Pacific 489 257 61 13 126 5,356 241
Africa 129 57 18 6 46 1,190 10
Corporate and Other (1) — — 5 14 (99 ) 3,510 3
Consolidated $ 1,536 $ 739 $ 191 $ 72 $ 387 $ 17,025 $ 350
(1) Corporate and Other includes $69 of Assets held for sale.
(2) Accrual basis which includes an increase in accrued capital of $20; consolidated capital expenditures on a cash basis were $330.
Three Months Ended March 31, 2010 2009 Balance at beginning of period $ 859 $ 757 Additions, changes in estimates and other (3 ) (2 ) Liabilities settled (8 ) (13 ) Accretion expense 13 12
Balance at end of period $ 861 $ 754


Table of Contents
NEWMONT MINING CORPORATION
NOTES TO CONDENSED CONSOLIDATED FINANCIAL STATEMENT S (Unaudited) (Continued) (dollars in millions, except per share, per ounce and per pound amounts)
The current portion of Reclamation and remediation liabilities of $51 and $54 at March 31, 2010 and December 31, 2009, respectively, are included in Other current liabilities (see Note 23).
The Company’s reclamation and remediation expenses consisted of:
Asset retirement cost amortization is a component of Amortization .
NOTE 5 ADVANCED PROJECTS, RESEARCH AND DEVELOPMENT
NOTE 6 OTHER EXPENSE, NET
7
Three Months Ended March 31, 2010 2009 Accretion — operating $ 11 $ 9 Accretion — non-operating 2 3
$ 13 $ 12
Asset retirement cost amortization $ 7 $ 7
Three Months Ended March 31, 2010 2009 Major projects:
Hope Bay $ 10 $ 5 Akyem 3 1 Conga 1 — Boddington — 3
Other projects: Technical and project services 12 5 Corporate 12 4 Nevada growth 3 6 Other 5 7
$ 46 $ 31
Three Months Ended March 31, 2010 2009 Community development $ 48 $ 10 Regional administration 13 12 Peruvian royalty 6 6 Western Australia power plant 6 3 World Gold Council dues 3 3 Workforce reduction — 14 Boddington acquisition costs — 8 Batu Hijau divestiture — 5 Other 13 12
$ 89 $ 73

Table of Contents
NEWMONT MINING CORPORATION
NOTES TO CONDENSED CONSOLIDATED FINANCIAL STATEMENT S (Unaudited) (Continued) (dollars in millions, except per share, per ounce and per pound amounts)
NOTE 7 OTHER INCOME, NET
NOTE 8 EMPLOYEE PENSION AND OTHER BENEFIT PLANS
NOTE 9 STOCK BASED COMPENSATION
No stock option awards were granted during the three months ended March 31, 2010 or 2009. At March 31, 2010, there was $16 of unrecognized compensation cost related to unvested stock options. This cost is expected to be recognized on a weighted-average basis for a period of approximately 2 years.
8
Three Months Ended March 31, 2010 2009 Gain on asset sales, net $ 33 $ 1 Canadian Oil Sands Trust income 10 4 Interest income 3 3 Write-down of investments (Note 18) — (6 ) Foreign currency exchange losses, net (9 ) (3 ) Other 11 10
$ 48 $ 9
Three Months Ended March 31, 2010 2009 Pension benefit costs, net
Service cost $ 5 $ 5 Interest cost 9 8 Expected return on plan assets (7 ) (7 ) Amortization of loss 4 3
$ 11 $ 9
Three Months Ended March 31, 2010 2009 Other benefit costs, net
Service cost $ 1 $ 1 Interest cost 1 1
$ 2 $ 2
Three Months Ended March 31, 2010 2009 Stock options $ 3 $ 3 Restricted stock units 4 1 Performance leveraged stock units 3 — Common stock 1 1 Restricted stock 1 1 Deferred stock 2 3
$ 14 $ 9
Table of Contents
NEWMONT MINING CORPORATION
NOTES TO CONDENSED CONSOLIDATED FINANCIAL STATEMENT S (Unaudited) (Continued) (dollars in millions, except per share, per ounce and per pound amounts)
For the three months ended March 31, 2010 and 2009, 325,962 and 252,363 restricted stock units, respectively, were granted, at the weighted-average fair market value of $50 and $43, respectively, per underlying share of the Company’s common stock. At March 31, 2010, there was $24 of unrecognized compensation cost related to unvested restricted stock units. This cost is expected to be recognized on a weighted-average basis for a period of approximately 3 years.
For the three months ended March 31, 2010 and 2009, 64,646 and 39,853 shares of common stock, respectively, were granted under the Company’s financial performance share plan at the weighted-average fair market value of $50 and $43, respectively. In addition, for the three months ended March 31, 2010 and 2009, 129,302 and 80,172 restricted stock units, respectively, which were included in the restricted stock unit grants above, were awarded under this plan.
Beginning in 2010, the Company granted performance leveraged stock units (“PSUs”) to eligible executives. The actual number of PSUs earned will be determined at the end of a three year performance period (except two partial awards that will be based on a one and two year performance period, respectively), based upon certain measures of shareholder return. At March 31, 2010, there was $11 of unrecognized compensation cost related to unvested PSUs. This cost is expected to be recognized on a weighted-average basis for a period of approximately 2 years.
NOTE 10 INCOME TAXES
During the first quarter of 2010, the Company recorded estimated income tax expense of $135 resulting in an effective tax rate of 15%. Estimated tax expense during the first quarter of 2009 was $105 for an effective tax rate of 27%. The decrease of 12% in the effective tax rate from 2009 to 2010 was the result of a tax benefit of $127 being recorded from the conversion of non-US tax-paying entities to entities currently subject to U.S. income tax resulting in an increase in net deferred tax assets. The effective tax rates in the first quarter of 2010 and 2009 are different from the United States statutory rate of 35% primarily due to the above mentioned tax benefit in 2010, U.S. percentage depletion and the effect of different income tax rates in countries where earnings are indefinitely reinvested.
The Company operates in numerous countries around the world and accordingly it is subject to, and pays annual income taxes under, the various income tax regimes in the countries in which it operates. Some of these tax regimes are defined by contractual agreements with the local government, and others are defined by the general corporate income tax laws of the country. The Company has historically filed, and continues to file, all required income tax returns and paid the taxes reasonably determined to be due. The tax rules and regulations in many countries are highly complex and subject to interpretation. From time to time the Company is subject to a review of its historic income tax filings and in connection with such reviews, disputes can arise with the taxing authorities over the interpretation or application of certain rules to the Company’s business conducted within the country involved. At March 31, 2010, the Company’s total unrecognized tax benefit was $127 for uncertain tax positions taken or expected to be taken on tax returns. Of this, $62 represents the amount of unrecognized tax benefits that, if recognized, would affect the Company’s effective income tax rate.
As a result of (i) statute of limitations that expire in the next 12 months in various jurisdictions, and (ii) possible settlements of audit-related issues with taxing authorities in various jurisdictions with respect to which none of the issues are individually significant, the Company believes that it is reasonably possible that the total amount of its net unrecognized income tax benefits will decrease by approximately $12 to $15 in the next 12 months.
In March 2010, the Patient Protection and Affordable Care Act, as amended by the Health Care and Education Reconciliation Act, was signed into law. This law did not have a material effect on the Company’s financial statements for the quarter.
On January 1, 2010, various U.S. tax provisions expired, and as of March 31, 2010, the provisions have not been reinstated. These expired tax provisions do not have a material effect on the Company’s financial statements.
9

Table of Contents
NEWMONT MINING CORPORATION
NOTES TO CONDENSED CONSOLIDATED FINANCIAL STATEMENT S (Unaudited) (Continued) (dollars in millions, except per share, per ounce and per pound amounts)
NOTE 11 DISCONTINUED OPERATIONS
Discontinued operations include the Kori Kollo, Bolivia operation sold in July 2009.
The Company has reclassified the 2009 balance sheet amounts and income statement results from the historical presentation to Assets and Liabilities of operations held for sale on the Condensed Consolidated Balance Sheets and to Income from discontinued operations in the Condensed Consolidated Statements of Income. The Condensed Consolidated Statements of Cash Flows have been reclassified for assets held for sale and discontinued operations for all periods presented.
For the three months ended March 31, 2009, Sales at Kori Kollo were $16 offset by operating costs of $16, resulting in Net income from discontinued operations of $nil.
Liabilities of operations held for sale include Other liabilities of $13 at December 31, 2009.
Net operating cash provided from (used in) discontinued operations was $(13) and $4 in the first quarter of 2010 and 2009, respectively.
Net cash used in financing activities of discontinued operations was $1 in the first quarter of 2009 for repayment of debt.
NOTE 12 NET INCOME ATTRIBUTABLE TO NONCONTROLLING I NTERESTS
In March 2010, the Company (through NTP) completed the sale and transfer of shares for a 7% interest in PTNNT, the Indonesian subsidiary that operates Batu Hijau, to PT Multi Daerah Bersaing (“PTMDB”) in compliance with divestiture obligations under the Contract of Work, reducing NTP’s ownership interest to 56% from 63%. In 2009, the Company (through NTP) completed the sale and transfer of shares for a 17% interest in PTNNT to PTMDB in compliance with divestiture obligations under the Contract of Work, reducing NTP’s ownership interest to 63% from 80%. The 2010 and 2009 share transfers resulted in gains of approximately $15 (after tax of $34) and $63 (after tax of $115), respectively, that were recorded in Additional paid-in capital .
In December 2009, the Company entered into a transaction with PTPI, whereby the Company agreed to advance certain funds to PTPI in exchange for a pledge of the noncontrolling partner’s 20% share of PTNNT dividends, net of withholding tax, and the assignment of its voting rights to the Company. As a result, PTPI was determined to be a VIE as it has minimal equity capital and the voting rights associated with its 20% interest in PTNNT reside with the Company. Based on the transaction with PTPI, the Company recognized an additional 17% effective economic interest in PTNNT.
At March 31, 2010, Newmont had a 48.50% effective economic interest in PTNNT. Based on the accounting guidance for variable interest entities, Newmont continues to consolidate PTNNT in its Consolidated Financial Statements.
Newmont has a 51.35% ownership interest in Minera Yanacocha SR.L. (“Yanacocha”), with the remaining interests held by Compañia de Minas Buenaventura, S.A.A. (43.65%) and the International Finance Corporation (5%).
10
Three Months Ended March 31, 2010 2009 Batu Hijau $ 118 $ 21 Yanacocha 80 67 Other (1 ) —
$ 197 $ 88
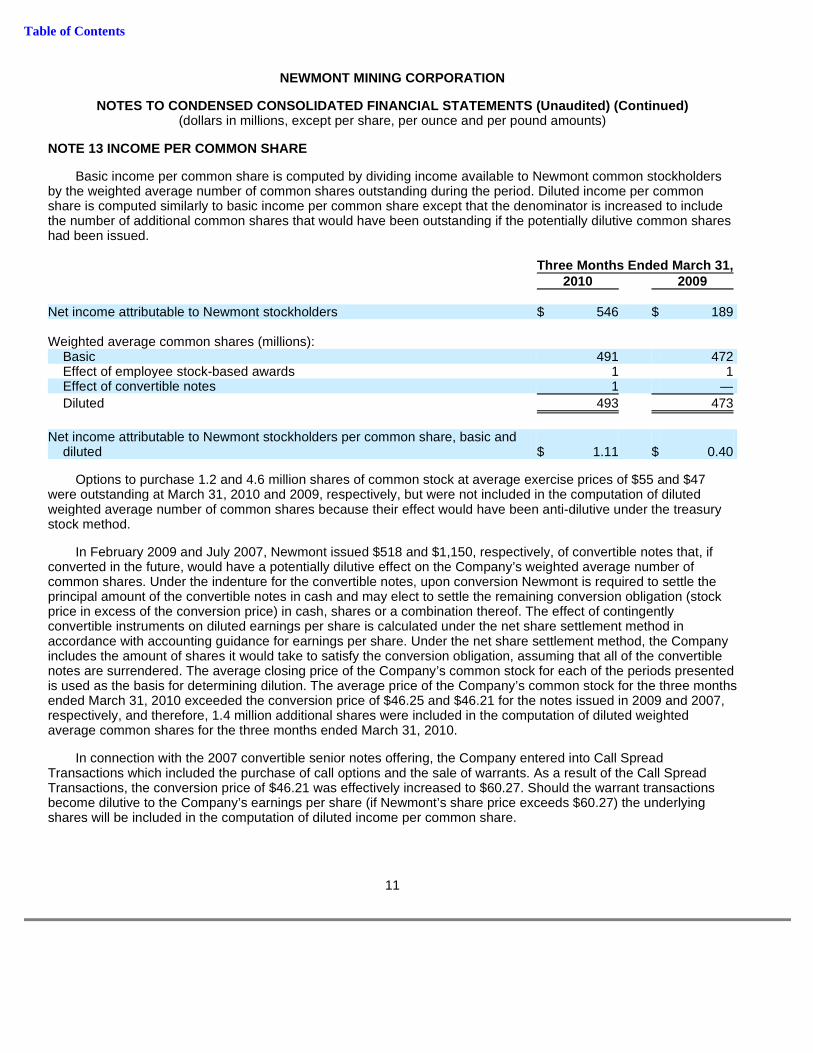
Table of Contents
NEWMONT MINING CORPORATION
NOTES TO CONDENSED CONSOLIDATED FINANCIAL STATEMENT S (Unaudited) (Continued) (dollars in millions, except per share, per ounce and per pound amounts)
NOTE 13 INCOME PER COMMON SHARE
Basic income per common share is computed by dividing income available to Newmont common stockholders by the weighted average number of common shares outstanding during the period. Diluted income per common share is computed similarly to basic income per common share except that the denominator is increased to include the number of additional common shares that would have been outstanding if the potentially dilutive common shares had been issued.
Options to purchase 1.2 and 4.6 million shares of common stock at average exercise prices of $55 and $47 were outstanding at March 31, 2010 and 2009, respectively, but were not included in the computation of diluted weighted average number of common shares because their effect would have been anti-dilutive under the treasury stock method.
In February 2009 and July 2007, Newmont issued $518 and $1,150, respectively, of convertible notes that, if converted in the future, would have a potentially dilutive effect on the Company’s weighted average number of common shares. Under the indenture for the convertible notes, upon conversion Newmont is required to settle the principal amount of the convertible notes in cash and may elect to settle the remaining conversion obligation (stock price in excess of the conversion price) in cash, shares or a combination thereof. The effect of contingently convertible instruments on diluted earnings per share is calculated under the net share settlement method in accordance with accounting guidance for earnings per share. Under the net share settlement method, the Company includes the amount of shares it would take to satisfy the conversion obligation, assuming that all of the convertible notes are surrendered. The average closing price of the Company’s common stock for each of the periods presented is used as the basis for determining dilution. The average price of the Company’s common stock for the three months ended March 31, 2010 exceeded the conversion price of $46.25 and $46.21 for the notes issued in 2009 and 2007, respectively, and therefore, 1.4 million additional shares were included in the computation of diluted weighted average common shares for the three months ended March 31, 2010.
In connection with the 2007 convertible senior notes offering, the Company entered into Call Spread Transactions which included the purchase of call options and the sale of warrants. As a result of the Call Spread Transactions, the conversion price of $46.21 was effectively increased to $60.27. Should the warrant transactions become dilutive to the Company’s earnings per share (if Newmont’s share price exceeds $60.27) the underlying shares will be included in the computation of diluted income per common share.
11
Three Months Ended March 31, 2010 2009 Net income attributable to Newmont stockholders $ 546 $ 189 Weighted average common shares (millions):
Basic 491 472 Effect of employee stock-based awards 1 1 Effect of convertible notes 1 —
Diluted 493 473
Net income attributable to Newmont stockholders per common share, basic and
diluted $ 1.11 $ 0.40
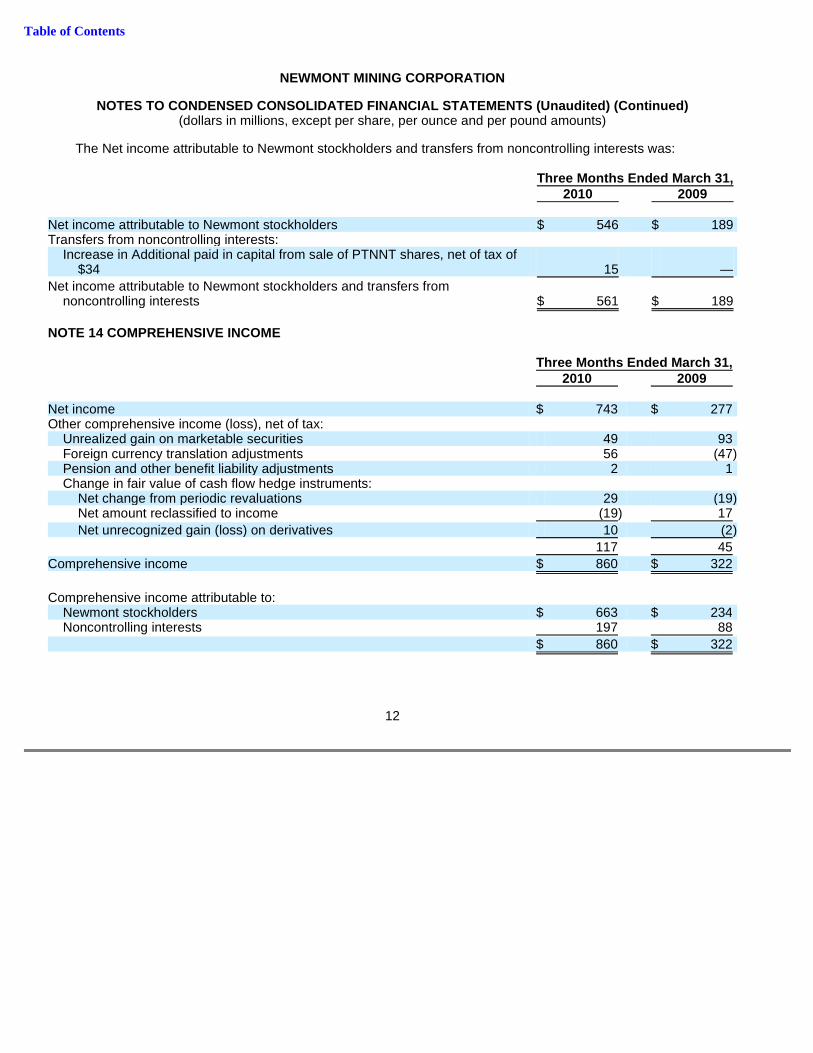
Table of Contents
NEWMONT MINING CORPORATION
NOTES TO CONDENSED CONSOLIDATED FINANCIAL STATEMENT S (Unaudited) (Continued) (dollars in millions, except per share, per ounce and per pound amounts)
The Net income attributable to Newmont stockholders and transfers from noncontrolling interests was:
NOTE 14 COMPREHENSIVE INCOME
12
Three Months Ended March 31, 2010 2009 Net income attributable to Newmont stockholders $ 546 $ 189 Transfers from noncontrolling interests:
Increase in Additional paid in capital from sale of PTNNT shares, net of tax of $34 15 —
Net income attributable to Newmont stockholders and transfers from noncontrolling interests $ 561 $ 189
Three Months Ended March 31, 2010 2009 Net income $ 743 $ 277 Other comprehensive income (loss), net of tax:
Unrealized gain on marketable securities 49 93 Foreign currency translation adjustments 56 (47 ) Pension and other benefit liability adjustments 2 1 Change in fair value of cash flow hedge instruments:
Net change from periodic revaluations 29 (19 ) Net amount reclassified to income (19 ) 17
Net unrecognized gain (loss) on derivatives 10 (2 )
117 45
Comprehensive income $ 860 $ 322
Comprehensive income attributable to:
Newmont stockholders $ 663 $ 234 Noncontrolling interests 197 88
$ 860 $ 322

Table of Contents
NEWMONT MINING CORPORATION
NOTES TO CONDENSED CONSOLIDATED FINANCIAL STATEMENT S (Unaudited) (Continued) (dollars in millions, except per share, per ounce and per pound amounts)
NOTE 15 CHANGES IN EQUITY
13
Three Months Ended March 31, 2010 2009 Common stock:
At beginning of period $ 770 $ 709 Common stock offering — 55 Stock based compensation 1 1 Shares issued in exchange for exchangeable shares 2 1
At end of period 773 766
Additional paid-in capital:
At beginning of period 8,158 6,831 Common stock offering — 1,179 Convertible debt issuance — 46 Common stock dividends — (45 ) Stock based compensation 17 14 Shares issued in exchange for exchangeable shares (2 ) (1 ) Sale of subsidiary shares to noncontrolling interests 15 —
At end of period 8,188 8,024
Accumulated other comprehensive (loss) income:
At beginning of period 626 (253 ) Other comprehensive (loss) income (Note 14) 117 45
At end of period 743 (208 )
Retained earnings:
At beginning of period 1,149 4 Net income attributable to Newmont stockholders 546 189 Common stock dividends (49 ) (4 )
At end of period 1,646 189
Noncontrolling interests:
At beginning of period 1,910 1,370 Net income attributable to noncontrolling interests 197 88 Dividends paid to noncontrolling interests (220 ) — Sale of subsidiary shares to noncontrolling interests, net 168 —
At end of period 2,055 1,458
Total equity $ 13,405 $ 10,229
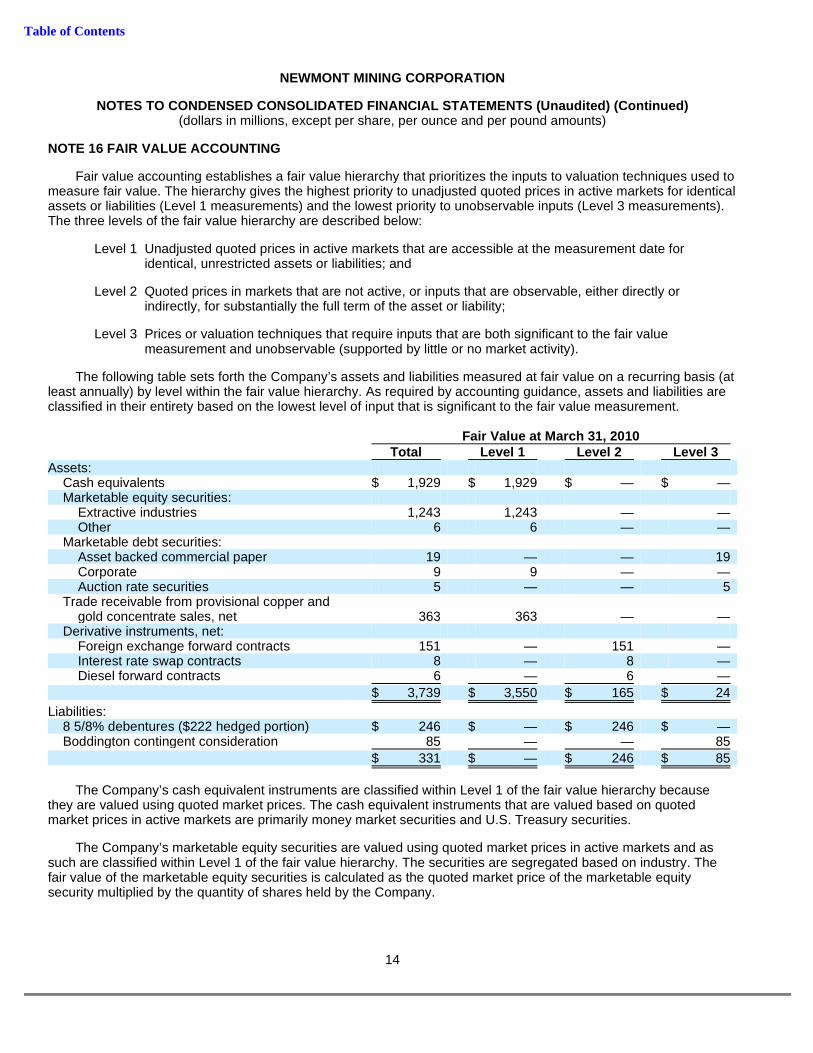
Table of Contents
NEWMONT MINING CORPORATION
NOTES TO CONDENSED CONSOLIDATED FINANCIAL STATEMENT S (Unaudited) (Continued) (dollars in millions, except per share, per ounce and per pound amounts)
NOTE 16 FAIR VALUE ACCOUNTING
Fair value accounting establishes a fair value hierarchy that prioritizes the inputs to valuation techniques used to measure fair value. The hierarchy gives the highest priority to unadjusted quoted prices in active markets for identical assets or liabilities (Level 1 measurements) and the lowest priority to unobservable inputs (Level 3 measurements). The three levels of the fair value hierarchy are described below:
The following table sets forth the Company’s assets and liabilities measured at fair value on a recurring basis (at least annually) by level within the fair value hierarchy. As required by accounting guidance, assets and liabilities are classified in their entirety based on the lowest level of input that is significant to the fair value measurement.
The Company’s cash equivalent instruments are classified within Level 1 of the fair value hierarchy because they are valued using quoted market prices. The cash equivalent instruments that are valued based on quoted market prices in active markets are primarily money market securities and U.S. Treasury securities.
The Company’s marketable equity securities are valued using quoted market prices in active markets and as such are classified within Level 1 of the fair value hierarchy. The securities are segregated based on industry. The fair value of the marketable equity securities is calculated as the quoted market price of the marketable equity security multiplied by the quantity of shares held by the Company.
14
Level 1 Unadjusted quoted prices in active markets that are accessible at the measurement date for identical, unrestricted assets or liabilities; and
Level 2 Quoted prices in markets that are not active, or inputs that are observable, either directly or indirectly, for substantially the full term of the asset or liability;
Level 3 Prices or valuation techniques that require inputs that are both significant to the fair value measurement and unobservable (supported by little or no market activity).
Fair Value at March 31, 2010 Total Level 1 Level 2 Level 3 Assets:
Cash equivalents $ 1,929 $ 1,929 $ — $ — Marketable equity securities:
Extractive industries 1,243 1,243 — — Other 6 6 — —
Marketable debt securities: Asset backed commercial paper 19 — — 19 Corporate 9 9 — — Auction rate securities 5 — — 5
Trade receivable from provisional copper and gold concentrate sales, net 363 363 — —
Derivative instruments, net: Foreign exchange forward contracts 151 — 151 — Interest rate swap contracts 8 — 8 — Diesel forward contracts 6 — 6 —
$ 3,739 $ 3,550 $ 165 $ 24
Liabilities: 8 5/8% debentures ($222 hedged portion) $ 246 $ — $ 246 $ — Boddington contingent consideration 85 — — 85
$ 331 $ — $ 246 $ 85

Table of Contents
NEWMONT MINING CORPORATION
NOTES TO CONDENSED CONSOLIDATED FINANCIAL STATEMENT S (Unaudited) (Continued) (dollars in millions, except per share, per ounce and per pound amounts)
The Company’s marketable debt securities include investments in auction rate securities and asset backed commercial paper. The Company reviews fair value for auction rate securities and asset backed commercial paper on at least a quarterly basis. The auction rate securities are traded in markets that are not active, trade infrequently and have little price transparency. The Company estimated the fair value of the auction rate securities based on weighted average risk calculations using probabilistic cash flow assumptions. In January 2009, the investments in the Company’s asset backed commercial paper were restructured by court order. The restructuring allowed an interest distribution to be made to investors. The Company estimated the fair value of the asset backed commercial paper using a probability of return to each class of notes reflective of information reviewed regarding the separate classes of securities. The auction rate securities and asset backed commercial paper are classified within Level 3 of the fair value hierarchy. The Company’s corporate marketable debt securities are valued using quoted market prices in active markets and as such are classified within Level 1 of the fair value hierarchy.
The Company’s net trade receivable from provisional copper and gold concentrate sales is valued using quoted market prices based on forward curves and, as such, is classified within Level 1 of the fair value hierarchy.
The Company’s derivative instruments are valued using pricing models and the Company generally uses similar models to value similar instruments. Where possible, the Company verifies the values produced by its pricing models to market prices. Valuation models require a variety of inputs, including contractual terms, market prices, yield curves, credit spreads, measures of volatility, and correlations of such inputs. The Company’s derivatives trade in liquid markets, and as such, model inputs can generally be verified and do not involve significant management judgment. Such instruments are classified within Level 2 of the fair value hierarchy.
The Company has fixed to floating swap contracts to hedge a portion of the interest rate risk exposure of its 8 5/8% debentures due May 2011. The hedged portion of the Company’s 8 5/8% debentures are valued using pricing models which require inputs, including risk-free interest rates and credit spreads. Because the inputs are derived from observable market data, the hedged portion of the 8 5/8% debentures is classified within Level 2 of the fair value hierarchy.
The Company has recorded a contingent consideration liability related to the 2009 acquisition of the final 33.33% interest in Boddington. The value of the contingent consideration was determined using a valuation model which simulates future gold and copper prices and costs applicable to sales to estimate fair value. The contingent consideration liability is classified within Level 3 of the fair value hierarchy.
The table below sets forth a summary of changes in the fair value of the Company’s Level 3 financial assets and liabilities for the three months ended March 31, 2010.
Unrealized gains of $1 for the period were included in Accumulated other comprehensive income (loss) as a result of changes in C$ exchange rates from December 31, 2009. At March 31, 2010, the assets and liabilities classified within Level 3 of the fair value hierarchy represent 1% and 26% of the total assets and liabilities measured at fair value.
15
Asset Backed Boddington Auction Rate Commercial Contingent Securities Paper Consideration Total Balance at beginning of period $ 5 $ 18 $ 85 $ 108
Unrealized gain — 1 — 1
Balance at end of period $ 5 $ 19 $ 85 $ 109

Table of Contents
NEWMONT MINING CORPORATION
NOTES TO CONDENSED CONSOLIDATED FINANCIAL STATEMENT S (Unaudited) (Continued) (dollars in millions, except per share, per ounce and per pound amounts)
NOTE 17 DERIVATIVE INSTRUMENTS
The Company’s strategy is to provide shareholders with leverage to changes in gold and copper prices by selling its production at spot market prices. Consequently, the Company does not hedge its gold and copper sales. Newmont continues to manage risks associated with commodity input costs, interest rates and foreign currencies using the derivative market. All of the cash flow and fair value derivative instruments were transacted for risk management purposes and qualify as hedging instruments. The maximum period over which hedged transactions are expected to occur is three years.
Cash Flow Hedges
The foreign currency and diesel contracts are designated as cash flow hedges, and as such, the effective portion of unrealized changes in market value have been recorded in Accumulated other comprehensive income (loss) and are recorded in earnings during the period in which the hedged transaction affects earnings. Gains and losses from hedge ineffectiveness are recognized in current earnings .
Foreign Currency Contracts
Newmont utilizes foreign currency contracts to reduce the variability of the US dollar amount of forecasted foreign currency expenditures caused by changes in exchange rates. Newmont hedges a portion of the Company’s A$, NZ$ and IDR denominated operating expenditures which results in a blended rate realized each period. The hedging instruments are fixed forward contracts with expiration dates ranging up to three years from the date of issue. The principal hedging objective is reduction in the volatility of realized period-on-period $/A$, $/NZ$ and IDR/$ rates, respectively.
Newmont had the following foreign currency derivative contracts outstanding at March 31, 2010:
16
Expected Maturity Date Total/ 2010 2011 2012 2013 Average A$ Fixed Forward Contracts:
$ (millions) $ 489 $ 432 $ 195 $ 12 $ 1,128 Average rate ($/A$) 0.79 0.77 0.79 0.81 0.78 A$ notional (millions) 618 563 246 15 1,442 Expected hedge ratio 66 % 44 % 20 % 5 % 38 %
NZ$ Fixed Forward Contracts: $ (millions) $ 33 $ 23 $ 1 $ — $ 57 Average rate ($/NZ$) 0.65 0.67 0.66 — 0.66 NZ$ notional (millions) 51 34 2 — 87 Expected hedge ratio 63 % 27 % 5 % — 37 %
IDR Fixed Forward Contracts: $ (millions) $ 38 $ — $ — $ — $ 38 Average rate (IDR/$) 9,944 — — — 9,944 IDR notional (millions) 258,537 — — — 258,537 Expected hedge ratio 27 % — — — 27 %

Table of Contents
NEWMONT MINING CORPORATION
NOTES TO CONDENSED CONSOLIDATED FINANCIAL STATEMENT S (Unaudited) (Continued) (dollars in millions, except per share, per ounce and per pound amounts)
Diesel Fixed Forward Contracts
Newmont hedges a portion of its operating cost exposure related to diesel consumed at its Nevada operations to reduce the variability in realized diesel prices. The hedging instruments consist of a series of financially settled fixed forward contracts with expiration dates ranging up to two years from the date of issue.
Newmont had the following diesel derivative contracts outstanding at March 31, 2010:
Fair Value Hedges
Interest Rate Swap Contracts
At March 31, 2010, Newmont had $222 fixed to floating swap contracts designated as a hedge against its 8 5/8% debentures due 2011. The interest rate swap contracts assist in managing the Company’s targeted mix of fixed and floating rate debt. Under the hedge contract terms, Newmont receives fixed-rate interest payments at 8.63% and pays floating-rate interest amounts based on periodic London Interbank Offered Rate (“LIBOR”) settings plus a spread, ranging from 2.60% to 7.63%. The interest rate swap contracts were designated as fair value hedges and changes in fair value have been recorded in income in each period, consistent with recording changes to the mark-to-market value of the underlying hedged liability in income.
17
Expected Maturity Date Total/ 2010 2011 2012 Average Diesel Fixed Forward Contracts:
$ (millions) $ 32 $ 21 $ 1 $ 54 Average rate ($/gallon) 2.01 2.18 2.31 2.08 Diesel gallons (millions) 16 10 — 26 Expected Nevada hedge ratio 55 % 25 % 4 % 34 %
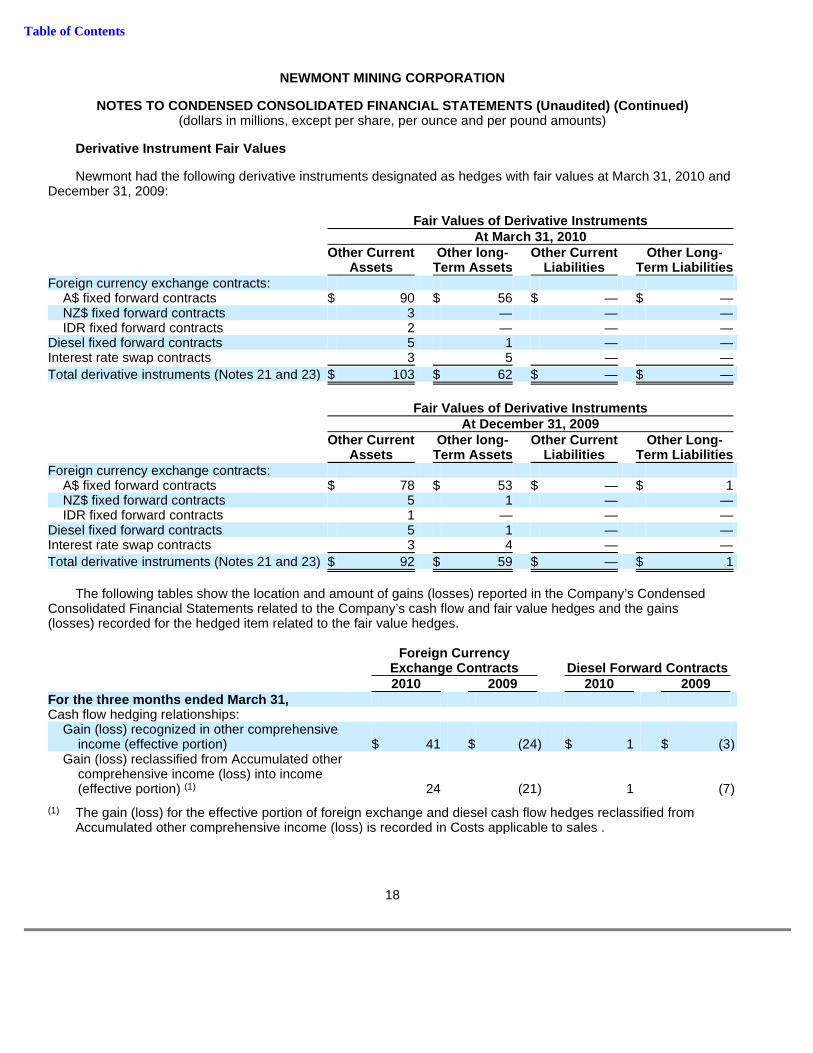
Table of Contents
NEWMONT MINING CORPORATION
NOTES TO CONDENSED CONSOLIDATED FINANCIAL STATEMENT S (Unaudited) (Continued) (dollars in millions, except per share, per ounce and per pound amounts)
Derivative Instrument Fair Values
Newmont had the following derivative instruments designated as hedges with fair values at March 31, 2010 and December 31, 2009:
The following tables show the location and amount of gains (losses) reported in the Company’s Condensed Consolidated Financial Statements related to the Company’s cash flow and fair value hedges and the gains (losses) recorded for the hedged item related to the fair value hedges.
18
Fair Values of Derivative Instruments At March 31, 2010 Other Current Other long - Other Current Other Long - Assets Term Assets Liabilities Term Liabilities Foreign currency exchange contracts:
A$ fixed forward contracts $ 90 $ 56 $ — $ — NZ$ fixed forward contracts 3 — — — IDR fixed forward contracts 2 — — —
Diesel fixed forward contracts 5 1 — — Interest rate swap contracts 3 5 — —
Total derivative instruments (Notes 21 and 23) $ 103 $ 62 $ — $ —
Fair Values of Derivative Instruments At December 31, 2009 Other Current Other long - Other Current Other Long - Assets Term Assets Liabilities Term Liabilities Foreign currency exchange contracts:
A$ fixed forward contracts $ 78 $ 53 $ — $ 1 NZ$ fixed forward contracts 5 1 — — IDR fixed forward contracts 1 — — —
Diesel fixed forward contracts 5 1 — — Interest rate swap contracts 3 4 — —
Total derivative instruments (Notes 21 and 23) $ 92 $ 59 $ — $ 1
Foreign Currency Exchange Contracts Diesel Forward Contracts 2010 2009 2010 2009 For the three months ended March 31, Cash flow hedging relationships:
Gain (loss) recognized in other comprehensive income (effective portion) $ 41 $ (24 ) $ 1 $ (3 )
Gain (loss) reclassified from Accumulated other comprehensive income (loss) into income (effective portion) (1) 24 (21 ) 1 (7 )
(1) The gain (loss) for the effective portion of foreign exchange and diesel cash flow hedges reclassified from
Accumulated other comprehensive income (loss) is recorded in Costs applicable to sales .
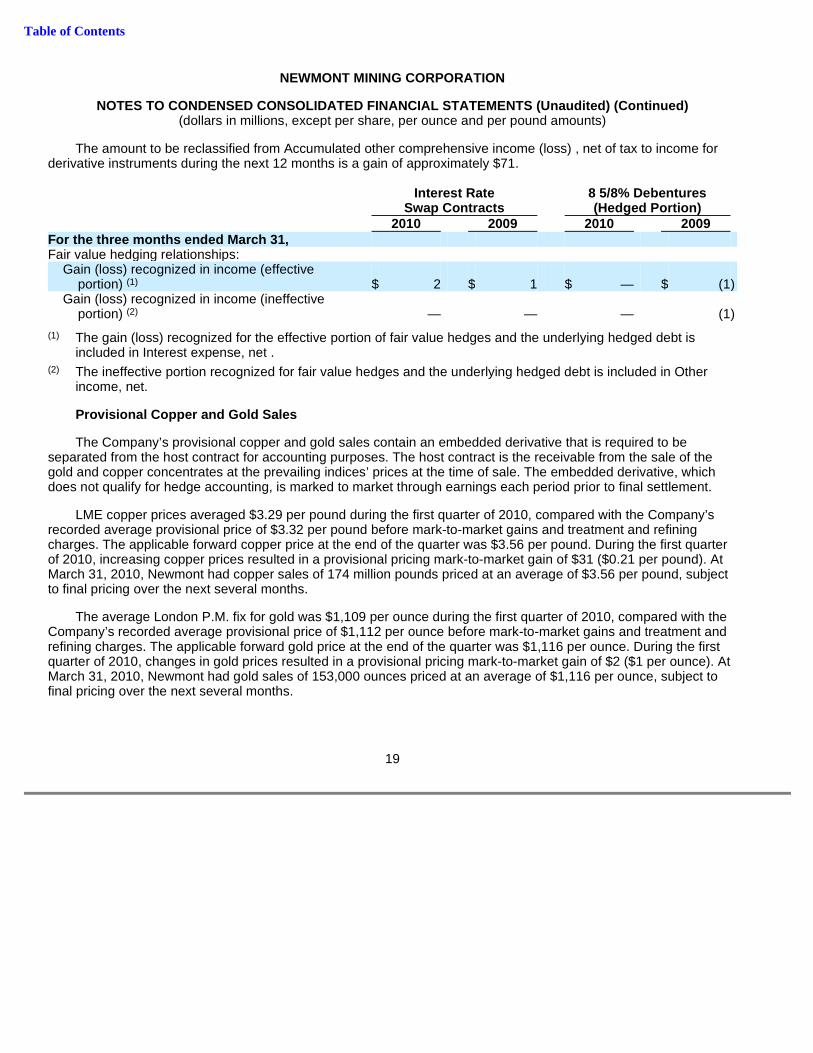
Table of Contents
NEWMONT MINING CORPORATION
NOTES TO CONDENSED CONSOLIDATED FINANCIAL STATEMENT S (Unaudited) (Continued) (dollars in millions, except per share, per ounce and per pound amounts)
The amount to be reclassified from Accumulated other comprehensive income (loss) , net of tax to income for derivative instruments during the next 12 months is a gain of approximately $71.
Provisional Copper and Gold Sales
The Company’s provisional copper and gold sales contain an embedded derivative that is required to be separated from the host contract for accounting purposes. The host contract is the receivable from the sale of the gold and copper concentrates at the prevailing indices’ prices at the time of sale. The embedded derivative, which does not qualify for hedge accounting, is marked to market through earnings each period prior to final settlement.
LME copper prices averaged $3.29 per pound during the first quarter of 2010, compared with the Company’s recorded average provisional price of $3.32 per pound before mark-to-market gains and treatment and refining charges. The applicable forward copper price at the end of the quarter was $3.56 per pound. During the first quarter of 2010, increasing copper prices resulted in a provisional pricing mark-to-market gain of $31 ($0.21 per pound). At March 31, 2010, Newmont had copper sales of 174 million pounds priced at an average of $3.56 per pound, subject to final pricing over the next several months.
The average London P.M. fix for gold was $1,109 per ounce during the first quarter of 2010, compared with the Company’s recorded average provisional price of $1,112 per ounce before mark-to-market gains and treatment and refining charges. The applicable forward gold price at the end of the quarter was $1,116 per ounce. During the first quarter of 2010, changes in gold prices resulted in a provisional pricing mark-to-market gain of $2 ($1 per ounce). At March 31, 2010, Newmont had gold sales of 153,000 ounces priced at an average of $1,116 per ounce, subject to final pricing over the next several months.
19
Interest Rate 8 5/8% Debentures Swap Contracts (Hedged Portion) 2010 2009 2010 2009 For the three months ended March 31, Fair value hedging relationships:
Gain (loss) recognized in income (effective portion) (1) $ 2 $ 1 $ — $ (1 )
Gain (loss) recognized in income (ineffective portion) (2) — — — (1 )
(1) The gain (loss) recognized for the effective portion of fair value hedges and the underlying hedged debt is
included in Interest expense, net .
(2) The ineffective portion recognized for fair value hedges and the underlying hedged debt is included in Other income, net.

Table of Contents
NEWMONT MINING CORPORATION
NOTES TO CONDENSED CONSOLIDATED FINANCIAL STATEMENT S (Unaudited) (Continued) (dollars in millions, except per share, per ounce and per pound amounts)
NOTE 18 INVESTMENTS
20
At March 31, 2010 Cost/Equity Unrealized Fair/Equity Basis Gain Loss Basis Current:
Marketable Equity Securities: Regis Resources $ 5 $ 48 $ — $ 53 Other 9 11 — 20
$ 14 $ 59 $ — $ 73
Long-term: Marketable Debt Securities:
Asset backed commercial paper $ 25 $ — $ (6 ) $ 19 Auction rate securities 7 — (2 ) 5 Corporate 7 2 — 9
39 2 (8 ) 33
Marketable Equity Securities: Canadian Oil Sands Trust 303 621 — 924 Gabriel Resources Ltd. 76 134 — 210 Shore Gold Inc. 5 12 — 17 Other 16 9 — 25
400 776 — 1,176
Other investments, at cost 11 — — 11
Investment in Affiliates:
La Zanja 12 — — 12
$ 462 $ 778 $ (8 ) $ 1,232

Table of Contents
NEWMONT MINING CORPORATION
NOTES TO CONDENSED CONSOLIDATED FINANCIAL STATEMENT S (Unaudited) (Continued) (dollars in millions, except per share, per ounce and per pound amounts)
The AGR Matthey Joint Venture (“AGR”), in which Newmont held a 40% equity interest, was dissolved on March 30, 2010. The remaining interests were held by West Australian Mint (“WAM”) (40%) and Johnson Matthey Australia (“JMA”) (20%). Newmont received consideration of $10 from the dissolution and recorded a gain of $2 in the first quarter of 2010.
Included in Investments at March 31, 2010 and December 31, 2009 are $9 and $10, respectively, of long-term marketable debt securities and $6 and $5 of long-term marketable equity securities, respectively, that are legally pledged for purposes of settling asset retirement obligations related to the San Jose Reservoir at Yanacocha.
During the first quarter of 2009, the Company recognized impairments for other-than temporary declines in value of $2 for Shore Gold Inc. and $4 for other marketable equity securities.
21
At December 31, 2009 Cost/Equity Unrealized Fair/Equity Basis Gain Loss Basis Current:
Marketable Equity Securities: Regis Resources $ 5 $ 29 $ — $ 34 Other 10 12 — 22
$ 15 $ 41 $ — $ 56
Long-term: Marketable Debt Securities:
Asset backed commercial paper $ 24 $ — $ (6 ) $ 18 Auction rate securities 7 — (2 ) 5 Corporate 8 2 — 10
39 2 (8 ) 33
Marketable Equity Securities: Canadian Oil Sands Trust 292 584 — 876 Gabriel Resources Ltd. 74 136 — 210 Shore Gold Inc. 4 11 — 15 Other 11 7 — 18
381 738 — 1,119
Other investments, at cost 6 — — 6
Investment in Affiliates:
AGR Matthey Joint Venture 20 — — 20 La Zanja 8 — — 8
$ 454 $ 740 $ (8 ) $ 1,186

Table of Contents
NEWMONT MINING CORPORATION
NOTES TO CONDENSED CONSOLIDATED FINANCIAL STATEMENT S (Unaudited) (Continued) (dollars in millions, except per share, per ounce and per pound amounts)
The following tables present the gross unrealized losses and fair value of the Company’s investments with unrealized losses that are not deemed to be other-than-temporarily impaired, aggregated by length of time that the individual securities have been in a continuous unrealized loss position:
The unrealized loss of $8 at March 31, 2010 and December 31, 2009, respectively, relate to the Company’s investments in asset backed commercial paper and auction rate securities as listed in the tables above. While the fair values of these investments are below their respective cost, the Company views these declines as temporary. The Company intends to hold its investment in auction rate securities and asset backed commercial paper until maturity or such time that the market recovers and therefore considers these losses temporary.
NOTE 19 INVENTORIES
NOTE 20 STOCKPILES AND ORE ON LEACH PADS
At March 31, 2010, stockpiles were primarily located at Batu Hijau ($824), Nevada ($284), Other Australia/New Zealand ($111), Boddington ($100) and Ahafo ($76), while leach pads were primarily located at Yanacocha ($364) and Nevada ($175).
22
Less than 12 Months 12 Months or Greater Total Unrealized Unrealized Unrealized At March 31, 2010 Fair Value Losses Fair Value Losses Fair Value Losses Asset backed commercial
paper $ — $ — $ 19 $ 6 $ 19 $ 6 Auction rate securities — — 5 2 5 2
$ — $ — $ 24 $ 8 $ 24 $ 8
Less than 12 Months 12 Months or Greater Total Unrealized Unrealized Unrealized At December 31, 2009 Fair Value Losses Fair Value Losses Fair Value Losses Asset backed commercial
paper $ — $ — $ 18 $ 6 $ 18 $ 6 Auction rate securities — — 5 2 5 2
$ — $ — $ 23 $ 8 $ 23 $ 8
At March 31, At December 31, 2010 2009 In-process $ 67 $ 80 Concentrate 32 10 Precious metals 9 9 Materials, supplies and other 393 394
$ 501 $ 493
At March 31, At December 31, 2010 2009 Current:
Stockpiles $ 255 $ 206 Ore on leach pads 215 197
$ 470 $ 403
Long-term: Stockpiles $ 1,189 $ 1,181 Ore on leach pads 330 321
$ 1,519 $ 1,502


Table of Contents
NEWMONT MINING CORPORATION
NOTES TO CONDENSED CONSOLIDATED FINANCIAL STATEMENT S (Unaudited) (Continued) (dollars in millions, except per share, per ounce and per pound amounts)
NOTE 21 OTHER ASSETS
NOTE 22 DEBT
On February 23, 2010, PTNNT repaid the $220 remaining balance under the PTNNT project financing facility. As a result, the Company is no longer required to maintain letters of credit to secure 56.25% of the PTNNT project financing facility and PTNNT’s assets are no longer pledged as collateral.
Scheduled minimum debt repayments are $39 for the remainder of 2010, $290 in 2011, $570 in 2012, $72 in 2013, $540 in 2014 and $3,063 thereafter.
23
At March 31, At December 31, 2010 2009 Other current assets:
Refinery metal inventory and receivable $ 473 $ 671 Derivative instruments (Note 17) 103 92 Prepaid assets 88 70 Other 59 67
$ 723 $ 900
Other long-term assets:
Goodwill $ 188 $ 188 Derivative instruments (Note 17) 62 59 Debt issuance costs 46 50 Restricted cash 23 70 Other 128 115
$ 447 $ 482
At March 31, 2010 At December 31, 2009 Current Non-Current Current Non-Current Sale-leaseback of refractory ore treatment plant $ 30 $ 134 $ 24 $ 164 8 5/8% debentures, net of discount (due 2011) — 218 — 218 2012 convertible senior notes, net of discount — 469 — 463 2014 convertible senior notes, net of discount — 473 — 468 2017 convertible senior notes, net of discount — 421 — 417 5 1/8% senior notes, net of discount (due 2019) — 896 — 896 5 7/8% senior notes, net of discount (due 2035) — 597 — 597 6 1/4% senior notes, net of discount (due 2039) — 1,087 — 1,087 PTNNT project financing facility — — 87 133 Yanacocha credit facility 14 45 14 48 Yanacocha senior notes 12 88 8 92 Ahafo project facility 10 65 10 65 Other project financings and capital leases 12 3 14 4
$ 78 $ 4,496 $ 157 $ 4,652

Table of Contents
NEWMONT MINING CORPORATION
NOTES TO CONDENSED CONSOLIDATED FINANCIAL STATEMENT S (Unaudited) (Continued) (dollars in millions, except per share, per ounce and per pound amounts)
NOTE 23 OTHER LIABILITIES
NOTE 24 NET CHANGE IN OPERATING ASSETS AND LIABILIT IES
Net cash provided from operations attributable to the net change in operating assets and liabilities is composed of the following:
24
At March 31, At December 31, 2010 2009 Other current liabilities:
Refinery metal payable $ 473 $ 671 Accrued operating costs 190 131 Interest 101 72 Accrued capital expenditures 78 115 Boddington acquisition costs 52 52 Reclamation and remediation costs (Note 4) 51 54 Boddington contingent consideration 23 16 Other 152 206
$ 1,120 $ 1,317
Other long-term liabilities:
Boddington contingent consideration $ 62 $ 69 Income and mining taxes 40 38 Other 54 67
$ 156 $ 174
Three Months Ended March 31, 2010 2009 Decrease (increase) in operating assets:
Trade and accounts receivable $ (52 ) $ 28 Inventories, stockpiles and ore on leach pads (69 ) (34 ) EGR refinery assets 185 (72 ) Other assets (23 ) 5
Increase (decrease) in operating liabilities: Accounts payable and other accrued liabilities (21 ) (116 ) EGR refinery liabilities (185 ) 72 Reclamation liabilities (8 ) (13 )
$ (173 ) $ (130 )
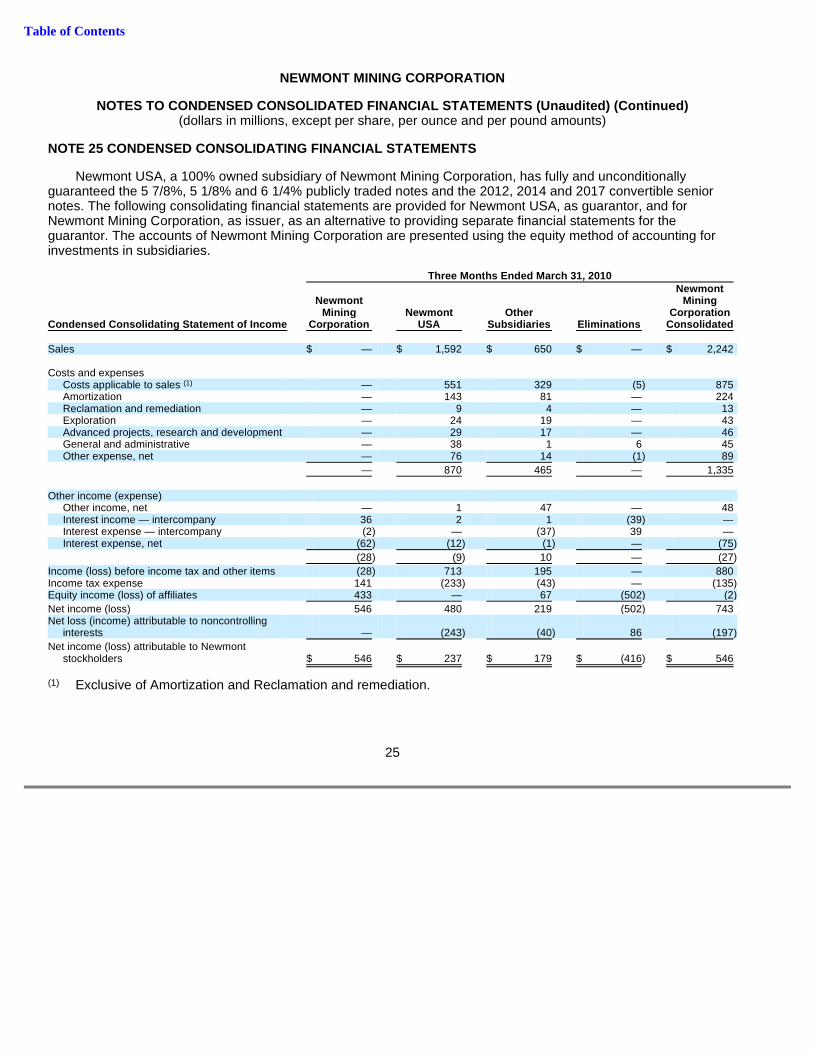
Table of Contents
NEWMONT MINING CORPORATION
NOTES TO CONDENSED CONSOLIDATED FINANCIAL STATEMENT S (Unaudited) (Continued) (dollars in millions, except per share, per ounce and per pound amounts)
NOTE 25 CONDENSED CONSOLIDATING FINANCIAL STATEMENT S
Newmont USA, a 100% owned subsidiary of Newmont Mining Corporation, has fully and unconditionally guaranteed the 5 7/8%, 5 1/8% and 6 1/4% publicly traded notes and the 2012, 2014 and 2017 convertible senior notes. The following consolidating financial statements are provided for Newmont USA, as guarantor, and for Newmont Mining Corporation, as issuer, as an alternative to providing separate financial statements for the guarantor. The accounts of Newmont Mining Corporation are presented using the equity method of accounting for investments in subsidiaries.
25
Three Months Ended March 31, 2010 Newmont Newmont Mining Mining Newmont Other Corporation Condensed Consolidating Statement of Income Corporation USA Subsidiaries Eliminations Consolidated Sales $ — $ 1,592 $ 650 $ — $ 2,242 Costs and expenses
Costs applicable to sales (1) — 551 329 (5 ) 875 Amortization — 143 81 — 224 Reclamation and remediation — 9 4 — 13 Exploration — 24 19 — 43 Advanced projects, research and development — 29 17 — 46 General and administrative — 38 1 6 45 Other expense, net — 76 14 (1 ) 89
— 870 465 — 1,335
Other income (expense)
Other income, net — 1 47 — 48 Interest income — intercompany 36 2 1 (39 ) — Interest expense — intercompany (2 ) — (37 ) 39 — Interest expense, net (62 ) (12 ) (1 ) — (75 )
(28 ) (9 ) 10 — (27 )
Income (loss) before income tax and other items (28 ) 713 195 — 880 Income tax expense 141 (233 ) (43 ) — (135 ) Equity income (loss) of affiliates 433 — 67 (502 ) (2 )
Net income (loss) 546 480 219 (502 ) 743 Net loss (income) attributable to noncontrolling
interests — (243 ) (40 ) 86 (197 )
Net income (loss) attributable to Newmont stockholders $ 546 $ 237 $ 179 $ (416 ) $ 546
(1) Exclusive of Amortization and Reclamation and remediation.
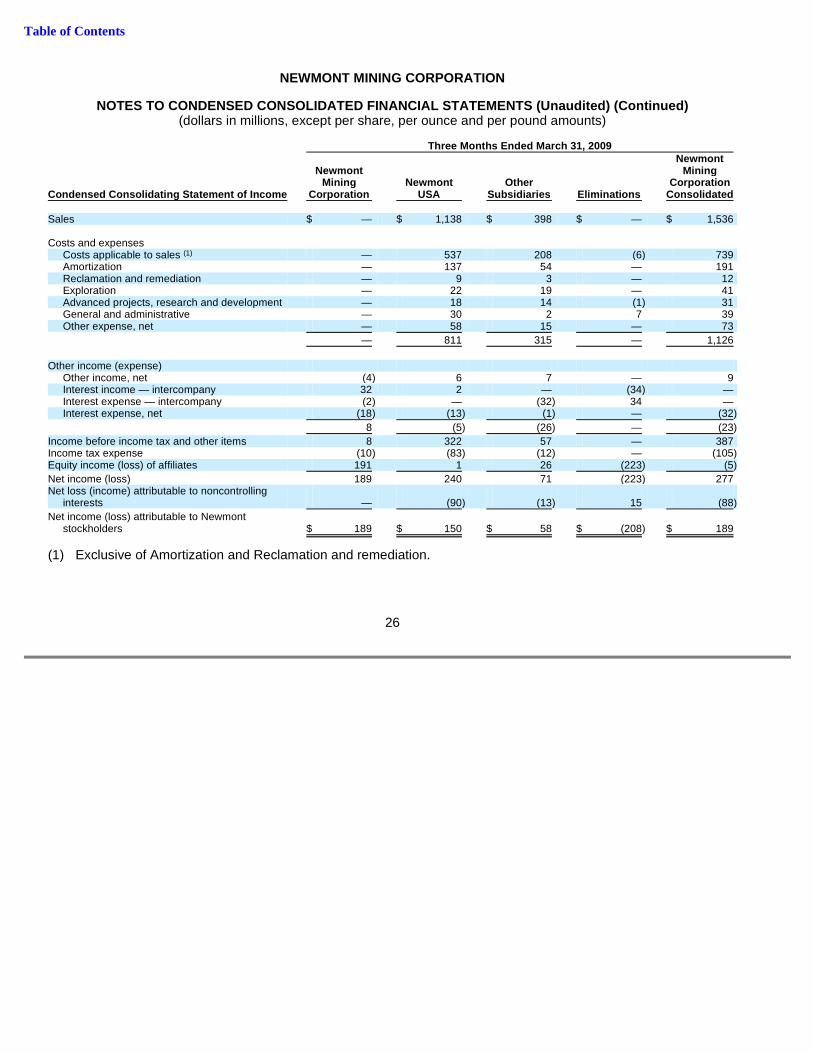
Table of Contents
NEWMONT MINING CORPORATION
NOTES TO CONDENSED CONSOLIDATED FINANCIAL STATEMENT S (Unaudited) (Continued) (dollars in millions, except per share, per ounce and per pound amounts)
26
Three Months Ended March 31, 2009 Newmont Newmont Mining Mining Newmont Other Corporation Condensed Consolidating Statement of Income Corporation USA Subsidiaries Eliminations Consolidated Sales $ — $ 1,138 $ 398 $ — $ 1,536 Costs and expenses
Costs applicable to sales (1) — 537 208 (6 ) 739 Amortization — 137 54 — 191 Reclamation and remediation — 9 3 — 12 Exploration — 22 19 — 41 Advanced projects, research and development — 18 14 (1 ) 31 General and administrative — 30 2 7 39 Other expense, net — 58 15 — 73
— 811 315 — 1,126
Other income (expense)
Other income, net (4 ) 6 7 — 9 Interest income — intercompany 32 2 — (34 ) — Interest expense — intercompany (2 ) — (32 ) 34 — Interest expense, net (18 ) (13 ) (1 ) — (32 )
8 (5 ) (26 ) — (23 )
Income before income tax and other items 8 322 57 — 387 Income tax expense (10 ) (83 ) (12 ) — (105 ) Equity income (loss) of affiliates 191 1 26 (223 ) (5 )
Net income (loss) 189 240 71 (223 ) 277 Net loss (income) attributable to noncontrolling
interests — (90 ) (13 ) 15 (88 )
Net income (loss) attributable to Newmont stockholders $ 189 $ 150 $ 58 $ (208 ) $ 189
(1) Exclusive of Amortization and Reclamation and remediation.

Table of Contents
NEWMONT MINING CORPORATION
NOTES TO CONDENSED CONSOLIDATED FINANCIAL STATEMENT S (Unaudited) (Continued) (dollars in millions, except per share, per ounce and per pound amounts)
27
Three Months Ended March 31, 2010 Newmont Newmont Mining Mining Newmont Other Corporation Condensed Consolidating Statement of Cash Flows Corporation USA Subsidiaries Eliminations Consolidated Operating activities:
Net income (loss) $ 546 $ 480 $ 219 $ (502 ) $ 743 Adjustments (121 ) 174 (397 ) 502 158 Net change in operating assets and liabilities 30 (98 ) (105 ) — (173 )
Net cash provided from (used in) continuing operations 455 556 (283 ) — 728 Net cash used in discontinued operations — (13 ) — — (13 )
Net cash provided from (used in) operations 455 543 (283 ) — 715
Investing activities: Additions to property, plant and mine development — (146 ) (163 ) — (309 ) Investment in marketable debt and equity securities — — (3 ) — (3 ) Proceeds from sale of other assets — — 38 — 38 Other — — (11 ) — (11 )
Net cash used in investing activities — (146 ) (139 ) — (285 )
Financing activities: Net repayments — (250 ) — — (250 ) Net intercompany borrowings (repayments) (417 ) (28 ) 445 — — Sale of subsidiary shares to noncontrolling interests — 229 — — 229 Acquisition of subsidiary shares from noncontrolling
interests — — (39 ) — (39 ) Dividends paid to common stockholders (49 ) — — — (49 ) Dividends paid to noncontrolling interests — (267 ) 47 — (220 ) Proceeds from stock issuance, net 3 — — — 3 Change in restricted cash and other — 47 (1 ) — 46
Net cash provided from (used in) financing activities (463 ) (269 ) 452 — (280 )
Effect of exchange rate changes on cash — — (1 ) — (1 )
Net change in cash and cash equivalents (8 ) 128 29 — 149 Cash and cash equivalents at beginning of period 8 3,067 140 — 3,215
Cash and cash equivalents at end of period $ — $ 3,195 $ 169 $ — $ 3,364
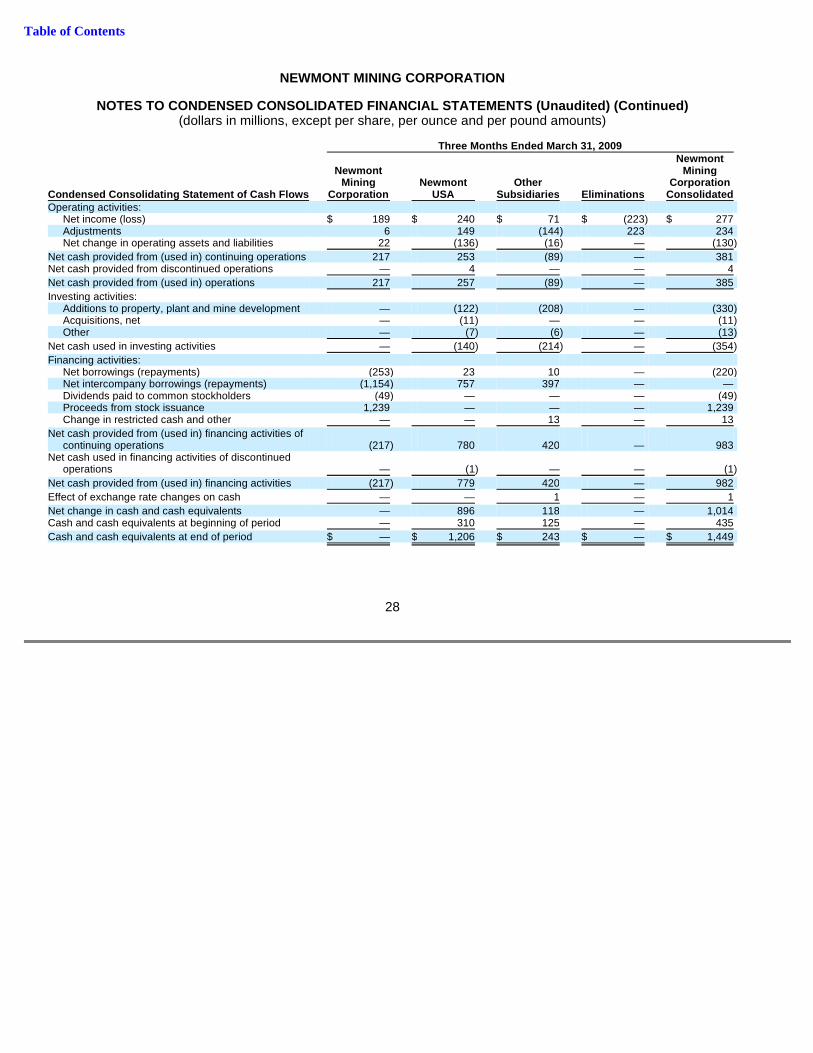
Table of Contents
NEWMONT MINING CORPORATION
NOTES TO CONDENSED CONSOLIDATED FINANCIAL STATEMENT S (Unaudited) (Continued) (dollars in millions, except per share, per ounce and per pound amounts)
28
Three Months Ended March 31, 2009 Newmont Newmont Mining Mining Newmont Other Corporation Condensed Consolidating Statement of Cash Flows Corporation USA Subsidiaries Eliminations Consolidated Operating activities:
Net income (loss) $ 189 $ 240 $ 71 $ (223 ) $ 277 Adjustments 6 149 (144 ) 223 234 Net change in operating assets and liabilities 22 (136 ) (16 ) — (130 )
Net cash provided from (used in) continuing operations 217 253 (89 ) — 381 Net cash provided from discontinued operations — 4 — — 4
Net cash provided from (used in) operations 217 257 (89 ) — 385
Investing activities: Additions to property, plant and mine development — (122 ) (208 ) — (330 ) Acquisitions, net — (11 ) — — (11 ) Other — (7 ) (6 ) — (13 )
Net cash used in investing activities — (140 ) (214 ) — (354 )
Financing activities: Net borrowings (repayments) (253 ) 23 10 — (220 ) Net intercompany borrowings (repayments) (1,154 ) 757 397 — — Dividends paid to common stockholders (49 ) — — — (49 ) Proceeds from stock issuance 1,239 — — — 1,239 Change in restricted cash and other — — 13 — 13
Net cash provided from (used in) financing activities of continuing operations (217 ) 780 420 — 983
Net cash used in financing activities of discontinued operations — (1 ) — — (1 )
Net cash provided from (used in) financing activities (217 ) 779 420 — 982
Effect of exchange rate changes on cash — — 1 — 1
Net change in cash and cash equivalents — 896 118 — 1,014 Cash and cash equivalents at beginning of period — 310 125 — 435
Cash and cash equivalents at end of period $ — $ 1,206 $ 243 $ — $ 1,449
Table of Contents
NEWMONT MINING CORPORATION
NOTES TO CONDENSED CONSOLIDATED FINANCIAL STATEMENT S (Unaudited) (Continued) (dollars in millions, except per share, per ounce and per pound amounts)
29
At March 31, 2010 Newmont Newmont Mining Mining Newmont Other Corporation Condensed Consolidating Balance Sheet Corporation USA Subsidiaries Eliminations Consolidated Assets
Cash and cash equivalents $ — $ 3,195 $ 169 $ — $ 3,364 Trade receivables — 405 86 — 491 Accounts receivable 2,307 658 356 (3,211 ) 110 Investments — 4 69 — 73 Inventories — 316 185 — 501 Stockpiles and ore on leach pads — 403 67 — 470 Deferred income tax assets — 170 59 — 229 Other current assets — 102 621 — 723
Current assets 2,307 5,253 1,612 (3,211 ) 5,961 Property, plant and mine development,
net — 5,191 7,283 (18 ) 12,456 Investments — 26 1,206 — 1,232 Investments in subsidiaries 10,445 33 1,163 (11,641 ) — Stockpiles and ore on leach pads — 1,298 221 — 1,519 Deferred income tax assets 106 870 54 — 1,030 Other long-term assets 2,559 312 432 (2,856 ) 447
Total assets $ 15,417 $ 12,983 $ 11,971 $ (17,726 ) $ 22,645
Liabilities
Current portion of debt $ — $ 68 $ 10 $ — $ 78 Accounts payable 29 1,134 2,396 (3,203 ) 356 Employee-related benefits — 138 41 — 179 Income and mining taxes — 277 3 — 280 Other current liabilities 88 298 2,704 (1,970 ) 1,120
Current liabilities 117 1,915 5,154 (5,173 ) 2,013 Debt 3,943 487 66 — 4,496 Reclamation and remediation liabilities — 570 240 — 810 Deferred income tax liabilities — 528 842 — 1,370 Employee-related benefits 4 334 57 — 395 Other long-term liabilities 339 63 2,628 (2,874 ) 156
Total liabilities 4,403 3,897 8,987 (8,047 ) 9,240
Equity Preferred stock — — 61 (61 ) — Common stock 773 — — — 773 Additional paid-in capital 7,852 2,725 3,882 (6,271 ) 8,188 Accumulated other comprehensive
income (loss) 743 (122 ) 851 (729 ) 743 Retained earnings (deficit) 1,646 4,039 (1,901 ) (2,138 ) 1,646
Newmont stockholders’ equity 11,014 6,642 2,893 (9,199 ) 11,350 Noncontrolling interests — 2,444 91 (480 ) 2,055
Total equity 11,014 9,086 2,984 (9,679 ) 13,405
Total liabilities and equity $ 15,417 $ 12,983 $ 11,971 $ (17,726 ) $ 22,645
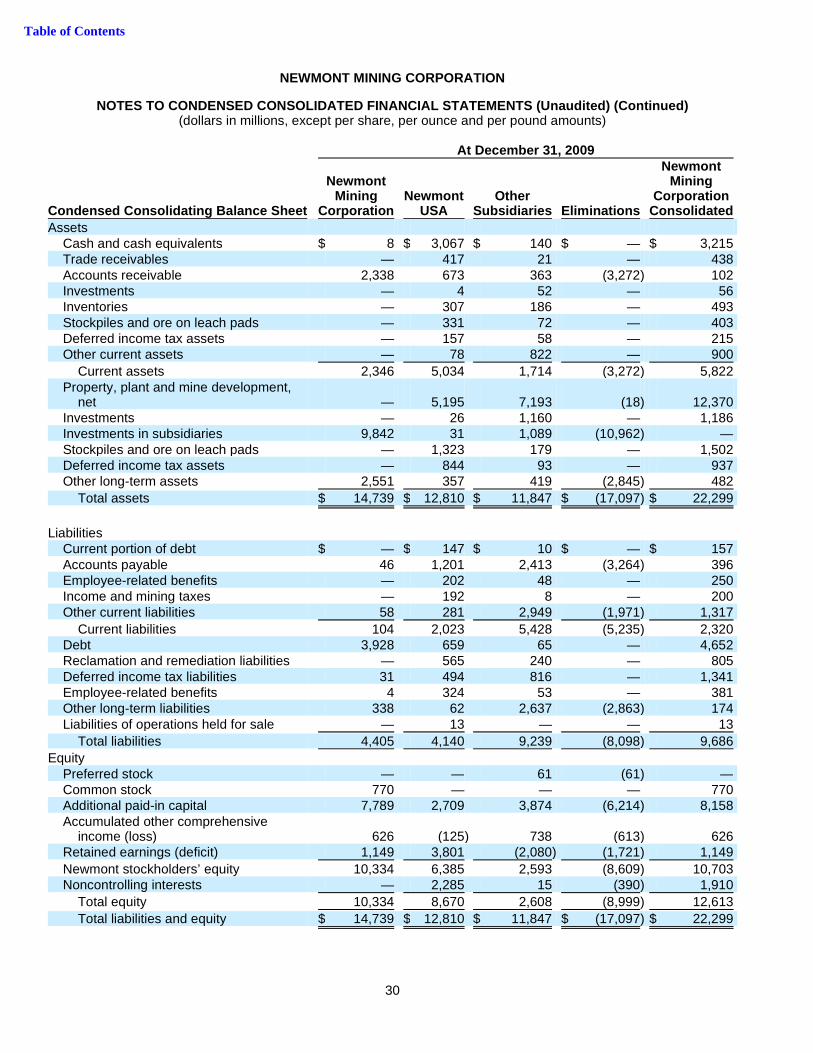
Table of Contents
NEWMONT MINING CORPORATION
NOTES TO CONDENSED CONSOLIDATED FINANCIAL STATEMENT S (Unaudited) (Continued) (dollars in millions, except per share, per ounce and per pound amounts)
30
At December 31, 2009 Newmont Newmont Mining Mining Newmont Other Corporation Condensed Consolidating Balance Sheet Corporation USA Subsidiaries Eliminations Consolidated Assets
Cash and cash equivalents $ 8 $ 3,067 $ 140 $ — $ 3,215 Trade receivables — 417 21 — 438 Accounts receivable 2,338 673 363 (3,272 ) 102 Investments — 4 52 — 56 Inventories — 307 186 — 493 Stockpiles and ore on leach pads — 331 72 — 403 Deferred income tax assets — 157 58 — 215 Other current assets — 78 822 — 900
Current assets 2,346 5,034 1,714 (3,272 ) 5,822 Property, plant and mine development,
net — 5,195 7,193 (18 ) 12,370 Investments — 26 1,160 — 1,186 Investments in subsidiaries 9,842 31 1,089 (10,962 ) — Stockpiles and ore on leach pads — 1,323 179 — 1,502 Deferred income tax assets — 844 93 — 937 Other long-term assets 2,551 357 419 (2,845 ) 482
Total assets $ 14,739 $ 12,810 $ 11,847 $ (17,097 ) $ 22,299
Liabilities
Current portion of debt $ — $ 147 $ 10 $ — $ 157 Accounts payable 46 1,201 2,413 (3,264 ) 396 Employee-related benefits — 202 48 — 250 Income and mining taxes — 192 8 — 200 Other current liabilities 58 281 2,949 (1,971 ) 1,317
Current liabilities 104 2,023 5,428 (5,235 ) 2,320 Debt 3,928 659 65 — 4,652 Reclamation and remediation liabilities — 565 240 — 805 Deferred income tax liabilities 31 494 816 — 1,341 Employee-related benefits 4 324 53 — 381 Other long-term liabilities 338 62 2,637 (2,863 ) 174 Liabilities of operations held for sale — 13 — — 13
Total liabilities 4,405 4,140 9,239 (8,098 ) 9,686
Equity Preferred stock — — 61 (61 ) — Common stock 770 — — — 770 Additional paid-in capital 7,789 2,709 3,874 (6,214 ) 8,158 Accumulated other comprehensive
income (loss) 626 (125 ) 738 (613 ) 626 Retained earnings (deficit) 1,149 3,801 (2,080 ) (1,721 ) 1,149
Newmont stockholders’ equity 10,334 6,385 2,593 (8,609 ) 10,703 Noncontrolling interests — 2,285 15 (390 ) 1,910
Total equity 10,334 8,670 2,608 (8,999 ) 12,613
Total liabilities and equity $ 14,739 $ 12,810 $ 11,847 $ (17,097 ) $ 22,299

Table of Contents
NEWMONT MINING CORPORATION
NOTES TO CONDENSED CONSOLIDATED FINANCIAL STATEMENT S (Unaudited) (Continued) (dollars in millions, except per share, per ounce and per pound amounts)
NOTE 26 COMMITMENTS AND CONTINGENCIES
General
The Company follows ASC guidance in determining its accruals and disclosures with respect to loss contingencies. Accordingly, estimated losses from loss contingencies are accrued by a charge to income when information available prior to issuance of the financial statements indicates that it is probable (greater than a 75% probability) that a liability could be incurred and the amount of the loss can be reasonably estimated. Legal expenses associated with the contingency are expensed as incurred. If a loss contingency is not probable or reasonably estimable, disclosure of the loss contingency is made in the financial statements when it is at least reasonably possible that a material loss could be incurred.
Operating Segments
The Company’s operating segments are identified in Note 3. Except as noted in this paragraph, all of the Company’s commitments and contingencies specifically described in this Note 26 relate to the Corporate and Other reportable segment. The Nevada Operations matters under Newmont USA Limited relate to the North America reportable segment. The PT Newmont Minahasa Raya matters relate to the Asia Pacific reportable segment. The Yanacocha matters relate to the South America reportable segment. The Newmont Yandal Operations Pty Limited matter relates to the Asia Pacific reportable segment. The PTNNT matters relate to the Asia Pacific reportable segment.
Environmental Matters
The Company’s mining and exploration activities are subject to various laws and regulations governing the protection of the environment. These laws and regulations are continually changing and are generally becoming more restrictive. The Company conducts its operations so as to protect the public health and environment and believes its operations are in compliance with applicable laws and regulations in all material respects. The Company has made, and expects to make in the future, expenditures to comply with such laws and regulations, but cannot predict the full amount of such future expenditures.
Estimated future reclamation costs are based principally on legal and regulatory requirements. At March 31, 2010 and December 31, 2009, $704 and $698, respectively, were accrued for reclamation costs relating to mineral properties in accordance with asset retirement obligation guidance. The current portions of $34 and $36 at March 31, 2010 and December 31, 2009, respectively, are included in Other current liabilities .
In addition, the Company is involved in several matters concerning environmental obligations associated with former mining activities. Generally, these matters concern developing and implementing remediation plans at the various sites involved. The Company believes that the related environmental obligations associated with these sites are similar in nature with respect to the development of remediation plans, their risk profile and the compliance required to meet general environmental standards. Based upon the Company’s best estimate of its liability for these matters, $157 and $161 were accrued for such obligations at March 31, 2010 and December 31, 2009, respectively. These amounts are included in Other current liabilities and Reclamation and remediation liabilities . Depending upon the ultimate resolution of these matters, the Company believes that it is reasonably possible that the liability for these matters could be as much as 154% greater or 3% lower than the amount accrued at March 31, 2010. The amounts accrued for these matters are reviewed periodically based upon facts and circumstances available at the time. Changes in estimates are recorded in Reclamation and remediation in the period estimates are revised.
Details about certain of the more significant matters involved are discussed below.
Dawn Mining Company LLC (“Dawn”) — 51% Newmont Owne d
Midnite Mine Site. Dawn previously leased an open pit uranium mine, currently inactive, on the Spokane Indian Reservation in the State of Washington. The mine site is subject to regulation by agencies of the U.S. Department of Interior (the Bureau of Indian Affairs and the Bureau of Land Management), as well as the United States Environmental Protection Agency (“EPA”).
31


Table of Contents
NEWMONT MINING CORPORATION
NOTES TO CONDENSED CONSOLIDATED FINANCIAL STATEMENT S (Unaudited) (Continued) (dollars in millions, except per share, per ounce and per pound amounts)
In 1991, Dawn’s mining lease at the mine was terminated. As a result, Dawn was required to file a formal mine closure and reclamation plan. The Department of Interior commenced an analysis of Dawn’s proposed plan and alternate closure and reclamation plans for the mine. Work on this analysis has been suspended indefinitely. In mid-2000, the mine was included on the National Priorities List under the Comprehensive Environmental Response, Compensation and Liability Act (“CERCLA”). In March 2003, the EPA notified Dawn and Newmont that it had thus far expended $12 on the Remedial Investigation/Feasibility Study (“RI/FS”) under CERCLA. In October 2005, the EPA issued the RI/FS on this property in which it indicated a preferred remedy that it estimated to cost approximately $150. Newmont and Dawn filed comments on the RI/FS with the EPA in January 2006. On October 3, 2006, the EPA issued a final Record of Decision in which it formally selected the preferred remedy identified in the RI/FS.
On January 28, 2005, the EPA filed a lawsuit against Dawn and Newmont under CERCLA in the U.S. District Court for the Eastern District of Washington. The EPA has asserted that Dawn and Newmont are liable for reclamation or remediation work and costs at the mine. Dawn does not have sufficient funds to pay for the reclamation plan it proposed or for any alternate plan, or for any additional remediation work or costs at the mine.
On July 14, 2008, after a bench trial, the Court held Newmont liable under CERCLA as an “operator” of the Midnite Mine. The Court previously ruled on summary judgment that both the U.S. Government and Dawn were liable under CERCLA. On October 17, 2008 the Court issued its written decision in the bench trial. The Court found Dawn and Newmont jointly and severally liable under CERCLA for past and future response costs, and ruled that each of Dawn and Newmont are responsible to pay one-third of such costs. The Court also found the U.S. Government liable on Dawn’s and Newmont’s contribution claim, and ruled that the U.S. Government is responsible to pay one-third of all past and future response costs. In November 2008, all parties appealed the Court’s ruling. Also in November 2008, the EPA issued an Administrative Order pursuant to Section 106 of CERCLA ordering Dawn and Newmont to conduct water treatment, testing and other preliminary remedial actions. Newmont has initiated those preliminary remedial actions.
Newmont intends to continue to vigorously defend this matter and cannot reasonably predict the outcome of this lawsuit or the likelihood of any other action against Dawn or Newmont arising from this matter.
Dawn Mill Site. Dawn also owns a uranium mill site facility, located on private land near Ford, Washington, which is subject to state and federal regulation. In late 1999, Dawn sought and later received approval from the State of Washington for a revised closure plan that expedites the reclamation process at the site. The currently approved plan for the site is guaranteed by Newmont.
Newmont Canada Limited (“Newmont Canada”) — 100% Ne wmont Owned
On November 11, 2008, St. Andrew Goldfields Ltd. (“St. Andrew”) filed an Application in the Superior Court of Justice in Ontario, Canada, seeking a declaration to clarify St. Andrew’s royalty obligations regarding certain mineral rights and property formerly owned by Newmont Canada and now owned by St. Andrew.
Newmont Canada purchased the property, called the Holt-McDermott property (“Holt Property”), from Barrick Gold Corporation (“Barrick”) in October 2004. At that time, Newmont Canada entered into a royalty agreement with Barrick (the “Barrick Royalty”), allowing Barrick to retain a royalty on the Holt Property. In August 2006, Newmont Canada sold all of its interests in the Holt Property to Holloway Mining Company (“Holloway”) in exchange for common stock issued by Holloway. In September 2006, Newmont Canada entered into a purchase and sale agreement with St. Andrew (the “2006 Agreement”), under which St. Andrew acquired all the common stock of Holloway. In 2008, Barrick sold its Barrick Royalty to Royal Gold, Inc. (“Royal Gold”).
In the court proceedings, St. Andrew alleged that in the 2006 Agreement it only agreed to assume royalty obligations equal to 0.013% of net smelter returns from operations on the Holt Property. Such an interpretation of the 2006 Agreement would make Newmont responsible for any royalties exceeding that amount payable to Royal Gold pursuant to the Barrick Royalty. On July 23, 2009, the Court issued a decision finding in favor of St. Andrews’ interpretation. On August 21, 2009, Newmont Canada appealed the decision. Newmont Canada intends to continue to vigorously defend this matter but cannot reasonably predict the outcome.
32


Table of Contents
NEWMONT MINING CORPORATION
NOTES TO CONDENSED CONSOLIDATED FINANCIAL STATEMENT S (Unaudited) (Continued) (dollars in millions, except per share, per ounce and per pound amounts)
Newmont Capital Limited (“Newmont Capital”) — 100% Newmont Owned
In February 1999, the EPA placed the Lava Cap mine site in Nevada County, California on the National Priorities List under CERCLA. The EPA then initiated a RI/FS under CERCLA to determine environmental conditions and remediation options at the site. Newmont Capital owned the property for approximately three years from 1984 to 1986 but never mined or conducted exploration at the site. The EPA asserted that Newmont Capital was responsible for clean up costs incurred at the site. In February 2009, the U.S. District Court for the Northern District of California approved the related consent decree and the settlement with respect to all aspects of this matter, except for future potential Natural Resource Damage claims, was completed.
Newmont USA Limited — 100% Newmont Owned
Pinal Creek. Newmont was a defendant in a lawsuit brought on November 5, 1991 in U.S. District Court in Arizona by the Pinal Creek Group, alleging that Newmont and others are responsible for some portion of costs incurred to address groundwater contamination emanating from copper mining operations located in the area of Globe and Miami, Arizona. Two former subsidiaries of Newmont, Pinto Valley Copper Corporation and Magma Copper Company (now known as BHP Copper Inc.) owned some of the mines in the area between 1983 and 1987. In March 2010, the court approved Newmont’s settlement of all claims and liabilities in this matter.
Gray Eagle Mine Site . By letter dated September 3, 2002, the EPA notified Newmont that the EPA had expended $3 in response costs to address environmental conditions associated with a historic tailings pile located at the Grey Eagle Mine site near Happy Camp, California, and requested that Newmont pay those costs. The EPA has identified four potentially responsible parties, including Newmont. Newmont does not believe it has any liability for environmental conditions at the Grey Eagle Mine site, and intends to vigorously defend any formal claims by the EPA. Newmont cannot reasonably predict the likelihood or outcome of any future action against it arising from this matter.
Ross-Adams Mine Site. By letter dated June 5, 2007, the U.S. Forest Service notified Newmont that it had expended approximately $0.3 in response costs to address environmental conditions at the Ross-Adams mine in Prince of Wales, Alaska, and requested Newmont USA Limited pay those costs and perform an Engineering Evaluation/Cost Analysis (“EE/CA”) to assess what future response activities might need to be completed at the site. Newmont intends to vigorously defend any formal claims by the EPA. Newmont has agreed to perform the EE/CA. Newmont cannot reasonably predict the likelihood or outcome of any future action against it arising from this matter.
PT Newmont Minahasa Raya (“PTNMR”) — 80% Newmont Ow ned
On March 22, 2007, an Indonesian non-governmental organization named Wahana Lingkungan Hidup Indonesia (“WALHI”) filed a civil suit against PTNMR, the Newmont subsidiary that operated the Minahasa mine in Indonesia, and Indonesia’s Ministry of Energy and Mineral Resources and Ministry for the Environment, alleging pollution from the disposal of mine tailings into Buyat Bay, and seeking a court order requiring PTNMR to fund a 25-year monitoring program in relation to Buyat Bay. In December 2007, the court ruled in PTNMR’s favor and found that WALHI’s allegations of pollution in Buyat Bay were without merit. In March 2008, WALHI appealed this decision to the Indonesian High Court. The case is currently being reviewed by the Indonesian High Court.
Independent sampling and testing of Buyat Bay water and fish, as well as area residents, conducted by the World Health Organization and the Australian Commonwealth Scientific and Industrial Research Organization, confirm that PTNMR has not polluted the Buyat Bay environment, and, therefore, has not adversely affected the fish in Buyat Bay or the health of nearby residents. The Company remains steadfast that it has not caused pollution or health problems.
33

Table of Contents
NEWMONT MINING CORPORATION
NOTES TO CONDENSED CONSOLIDATED FINANCIAL STATEMENT S (Unaudited) (Continued) (dollars in millions, except per share, per ounce and per pound amounts)
Newmont Ghana Gold Limited (“NGGL”) — 100% Newmont Owned
On October 8, 2009, an overflow of processing solution occurred at the Ahafo Mines in Ghana operated by Newmont’s subsidiary, NGGL. A panel of the Minister of Environment, Science & Technology of the Government of Ghana (the “Panel”) was appointed to evaluate the overflow incident. In January 2010, NGGL received notification of the findings of the Panel, which recognized that there was no regulatory framework by which to assess compensation or penalties relating to such incidents. However, the Panel recommended that compensation of seven million Ghana Cedis (approximately $5) be paid by NGGL to the Ghanaian Government to be used for community compensation and for other uses by the Government. In April 2010, NGGL made such payment and also confirmed that it is implementing appropriate corrective measures related to the incident.
Other Legal Matters
Minera Yanacocha S.R.L. (“Yanacocha”) — 51.35% Newm ont Owned
Choropampa . In June 2000, a transport contractor of Yanacocha spilled approximately 151 kilograms of elemental mercury near the town of Choropampa, Peru, which is located 53 miles (85 kilometers) southwest of the Yanacocha mine. Elemental mercury is not used in Yanacocha’s operations but is a by-product of gold mining and was sold to a Lima firm for use in medical instruments and industrial applications. A comprehensive health and environmental remediation program was undertaken by Yanacocha in response to the incident. In August 2000, Yanacocha paid under protest a fine of 1,740,000 Peruvian soles (approximately $0.5) to the Peruvian government. Yanacocha has entered into settlement agreements with a number of individuals impacted by the incident. As compensation for the disruption and inconvenience caused by the incident, Yanacocha entered into agreements with and provided a variety of public works in the three communities impacted by this incident. Yanacocha cannot predict the likelihood of additional expenditures related to this matter.
Additional lawsuits relating to the Choropampa incident were filed against Yanacocha in the local courts of Cajamarca, Peru, in May 2002 by over 900 Peruvian citizens. A significant number of the plaintiffs in these lawsuits entered into settlement agreements with Yanacocha prior to filing such claims. In April 2008, the Peruvian Supreme Court upheld the validity of these settlement agreements, which should result in the dismissal of all claims brought by previously settled plaintiffs. Yanacocha has also entered into settlement agreements with approximately 350 additional plaintiffs. The claims asserted by approximately 200 plaintiffs remain. Neither Newmont nor Yanacocha can reasonably estimate the ultimate loss relating to such claims.
PT Newmont Nusa Tenggara (“PTNNT”) — 31.5% Newmont Direct Ownership
Under the Batu Hijau Contract of Work, beginning in 2006 and continuing through 2010, a portion of PTNNT’s shares were required to be offered for sale, first, to the Indonesian government or, second, to Indonesian nationals, equal to the difference between the following percentages and the percentage of shares already owned by the Indonesian government or Indonesian nationals (if such number is positive): 23% by March 31, 2006; 30% by March 31, 2007; 37% by March 31, 2008; 44% by March 31, 2009; and 51% by March 31, 2010. As PT Pukuafu Indah (“PTPI”), an Indonesian national, has owned a 20% interest in PTNNT, in 2006, a 3% interest was required to be offered for sale and, in each of 2007 through 2010, an additional 7% interest was required to be offered (for an aggregate 31% interest). The price at which such interests were to be offered for sale to the Indonesian parties is the highest of the then-current replacement cost, the price at which shares would be accepted for listing on the Indonesian Stock Exchange, or the fair market value of such interest as a going concern, as agreed with the Indonesian government.
In accordance with the Contract of Work, an offer to sell a 3% interest was made to the Indonesian government in 2006 and an offer for an additional 7% interest was made in each of 2007, 2008 and 2009, and the offer for the final 7% interest was made in March 2010. While the central government declined to participate in the 2006 and 2007 offers, local governments in the area in which the Batu Hijau mine is located expressed interest in acquiring shares, as did various Indonesian nationals. After disagreement with the government over whether the government’s first right to purchase had expired and receipt of Notices of Default from the government claiming breach and threatening termination of the Contract of Work, on March 3, 2008, the Indonesian government filed for international arbitration as provided under the Contract of Work, as did PTNNT. In the arbitration proceeding, PTNNT sought a declaration that the Indonesian government was not entitled to terminate the Contract of Work and additional declarations pertaining to the procedures for divesting the shares. For its part, the Indonesian government sought declarations that PTNNT was in default of its divestiture obligations that the government may terminate the Contract of Work and recover damages for breach of the Contract of Work, and that PTNNT must cause shares subject to divestiture to be

sold to certain local governments.
34

Table of Contents
NEWMONT MINING CORPORATION
NOTES TO CONDENSED CONSOLIDATED FINANCIAL STATEMENT S (Unaudited) (Continued) (dollars in millions, except per share, per ounce and per pound amounts)
An international arbitration panel (the “Panel”) was appointed to resolve these claims and other claims that had arisen in relation to divestment and a hearing was held in Jakarta in December 2008. On March 31, 2009, the Panel issued its final award and decision on the matter. In its decision, the Panel determined that PTNNT’s foreign shareholders had not complied with the divestiture procedure required by the Contract of Work in 2006 and 2007, but the Panel ruled that the Indonesian government was not entitled to immediately terminate the Contract of Work and rejected the Indonesian government’s claim for damages. The Panel granted PTNNT 180 days from the date of notification of the final award to transfer the 2006 3% interest and the 2007 7% interest in PTNNT to the local governments or their respective nominees. The Panel also applied a 180-day cure period to the 2008 7% interest, requiring that PTNNT offer the 2008 7% interest to the Indonesian government or its nominee within such 180-day period, and transfer such shares if, after agreement on the transfer price, the Indonesian government invoked its right of first refusal under the Contract of Work. The Panel ruled that shares offered to the Indonesian government pursuant to the Contract of Work must be offered free of any pledge or obligation to re-pledge the shares to the Senior Lenders to PTNNT. Finally, the Panel directed PTNNT to pay to the Indonesian government an allocated portion of certain legal fees and costs of the arbitration. PTNNT submitted payment of $2 for legal fees and costs. The Company also entered a formal agreement with the Senior Lenders under which the Senior Lenders released the pledge on the aggregate 31% of shares in PTNNT that were subject to divestiture requirements in exchange for the Company and Sumitomo agreeing to provide joint and several guarantees, thus allowing the Company to transfer these shares free of any pledge or obligation to re-pledge the shares to the lenders. The Company subsequently replaced this joint and several guarantee in October 2009 with letters of credit supporting 56.25% of the obligations under the PTNNT project financing facility. In February 2010, PTNNT repaid the Senior Lenders in full and the Company’s letter of credit was terminated. On July 14, 2009, the Company reached agreement with the Indonesian government on the price of the 2008 7% interest and the 2009 7% interest. PTNNT reoffered the 2008 7% interest and the 2009 7% interest to the Indonesian government at this newly agreed price. In November and December 2009, sale agreements were concluded pursuant to which the 2006, 2007 and 2008 shares were transferred to PTMDB, the nominee of the local governments, and the 2009 shares were transferred to PTMDB in February 2010, resulting in PTMDB owning a 24% interest in PTNNT. Although the Indonesian government has acknowledged that PTNNT is no longer in breach of the Contract of Work, future disputes may arise as to the final divestiture of the 2010 shares. It is uncertain who will acquire the divestiture shares in the future, and the nature of our relationship with the new owners of the 2010 shares and any future owners of the divested shares remain uncertain.
As part of the negotiation of the sale agreements with PTMDB, the parties executed an operating agreement (the “Operating Agreement”) under which each recognizes the rights of the Company and Sumitomo to apply their operating standards to the management of PTNNT’s operations, including standards for safety, environmental stewardship and community responsibility. The Operating Agreement became effective upon the completion of the sale of the 2009 shares in February 2010 and will continue for so long as the Company and Sumitomo own more shares of PTNNT than PTMDB. If the Operating Agreement terminates, then the Company may lose control over the applicable operating standards for Batu Hijau and will be at risk for operations conducted in a manner that either detracts from value or results in safety, environmental or social standards below those adhered to by the Company and Sumitomo.
In the event of any future disputes under the Contract of Work or Operating Agreement, there can be no assurance that the Company would prevail in any such dispute and any termination of such contracts could result in substantial diminution in the value of the Company’s interests in PTNNT.
Additionally, in February 2010, PTNNT was notified by the tax authorities of the Indonesian government, that PTNNT may be obligated to pay value added taxes on certain goods imported after the year 2000. PTNNT believes that, pursuant to the terms of its Contract of Work, it is only required to pay value added taxes on these types of goods imported after February 28, 2010. The Company and PTNNT are working cooperatively with the applicable government authorities to resolve this matter.
35

Table of Contents
NEWMONT MINING CORPORATION
NOTES TO CONDENSED CONSOLIDATED FINANCIAL STATEMENT S (Unaudited) (Continued) (dollars in millions, except per share, per ounce and per pound amounts)
Other Commitments and Contingencies
Tax contingencies are provided for in accordance with ASC income tax guidance (see Note 10).
In a 1993 asset exchange, a wholly-owned subsidiary transferred a coal lease under which the subsidiary had collected advance royalty payments totaling $484. From 1994 to 2018, remaining advance payments under the lease to the transferee total $390. In the event of title failure as stated in the lease, this subsidiary has a primary obligation to refund previously collected payments and has a secondary obligation to refund any of the $390 collected by the transferee, if the transferee fails to meet its refund obligation. The subsidiary has title insurance on the leased coal deposits of $240 covering the secondary obligation. The Company and the subsidiary regard the circumstances entitling the lessee to a refund as remote.
The Company has minimum royalty obligations on one of its producing mines in Nevada for the life of the mine. Amounts paid as a minimum royalty (where production royalties are less than the minimum obligation) in any year are recoverable in future years when the minimum royalty obligation is exceeded. Although the minimum royalty requirement may not be met in a particular year, the Company expects that over the mine life, gold production will be sufficient to meet the minimum royalty requirements. Minimum royalty payments payable are $23 per year in 2010 through 2014 and $117 thereafter.
As part of its ongoing business and operations, the Company and its affiliates are required to provide surety bonds, bank letters of credit and bank guarantees as financial support for various purposes, including environmental reclamation, exploration permitting, workers compensation programs and other general corporate purposes. At March 31, 2010 and December 31, 2009, there were $999 and $1,073, respectively, of outstanding letters of credit, surety bonds and bank guarantees. The surety bonds, letters of credit and bank guarantees reflect fair value as a condition of their underlying purpose and are subject to fees competitively determined in the market place. The obligations associated with these instruments are generally related to performance requirements that the Company addresses through its ongoing operations. As the specific requirements are met, the beneficiary of the associated instrument cancels and/or returns the instrument to the issuing entity. Certain of these instruments are associated with operating sites with long-lived assets and will remain outstanding until closure. Generally, bonding requirements associated with environmental regulation are becoming more restrictive. In addition, the surety markets for certain types of environmental bonding used by the Company have become increasingly constrained. The Company, however, believes it is in compliance with all applicable bonding obligations and will be able to satisfy future bonding requirements, through existing or alternative means, as they arise.
Newmont is from time to time involved in various legal proceedings related to its business. Except in the above-described proceedings, management does not believe that adverse decisions in any pending or threatened proceeding or that amounts that may be required to be paid by reason thereof will have a material adverse effect on the Company’s financial condition or results of operations.
NOTE 27 SUPPLEMENTARY DATA
Ratio of Earnings to Fixed Charges
The ratio of earnings to fixed charges for the three months ended March 31, 2010 was 11.7. The ratio of earnings to fixed charges represents income before income tax expense, equity loss of affiliates and noncontrolling interests in subsidiaries, divided by interest expense. Interest expense includes amortization of capitalized interest and the portion of rent expense representative of interest. Interest expense does not include interest on income tax liabilities. The computation of the ratio of earnings to fixed charges can be found in Exhibit 12.1.
36

Table of Contents
ITEM 2. MANAGEMENT’S DISCUSSION AND ANALYSIS OF RES ULTS OF OPERATIONS AND FINANCIAL CONDITION (dollars in millions, except per share, per ounce and per pound amounts)
The following discussion provides information that management believes is relevant to an assessment and understanding of the consolidated financial condition and results of operations of Newmont Mining Corporation and its subsidiaries (collectively, “Newmont,” the “Company,” “our” and “we”). We use certain non-GAAP financial performance measures in our MD&A. For a detailed description of each of the non-GAAP financial measures used in this MD&A, please see the discussion under “Non-GAAP Financial Performance Measures” beginning on page 50. References to “A$” refer to Australian currency, “C$” to Canadian currency, “IDR” to Indonesian currency, “NZ$” to New Zealand currency and “$” to United States currency.
This item should be read in conjunction with our interim unaudited Condensed Consolidated Financial Statements and the notes thereto included in this quarterly report. Additionally, the following discussion and analysis should be read in conjunction with Management’s Discussion and Analysis of Consolidated Financial Condition and Results of Operations and the consolidated financial statements included in Part II of our Annual Report on Form 10-K for the year ended December 31, 2009.
Overview
Newmont is one of the world’s largest gold producers and is the only gold company included in the S&P 500 Index and Fortune 500, and was the first gold company included in the Dow Jones Sustainability Index-World. We are also engaged in the exploration for and acquisition of gold and gold/copper properties. We have significant assets or operations in the United States, Australia, Peru, Indonesia, Ghana, Canada, New Zealand and Mexico. Our vision is to be the most valued and respected mining company through industry leading performance.
Delivering strong operating performance.
Advancing the development of our project pipeline.
37
• Consolidated production of approximately 1.6 million ounces of gold and 159 million pounds of copper;
• Costs applicable to sales of $480 per ounce of gold and $0.78 per pound of copper;
• Sales of $2,242, an increase of 46% over the first quarter of 2009;
• Gold operating margin (realized price per ounce less Costs applicable to sales per ounce) of $626 per ounce in 2010, an increase of 32% over the first quarter of 2009 compared to an increase of 22% in the realized gold price for the same period;
• Net income attributable to Newmont stockholders of $1.11 per share;
• Net cash provided from continuing operations of $728, an increase of 91% from the first quarter of 2009; and
• Adjusted net income of $408 (See “Non-GAAP Financial Measures” on page 50).
• Akyem, Ghana — Currently in the development phase with a construction decision expected in the second half of 2010. In January 2010 we received the Mining Lease from the Ghanaian government. During the first quarter of 2010 we have continued with detailed engineering activities, developed an execution approach to construction and land access and advanced exploration and in-fill drilling. This project is expected to be in production in late 2013 to 2014 producing between 480,000 and 550,000 ounces of gold per year for the first full five years at Costs applicable to sales of $350 to $450 per ounce. Initial capital in constant dollars is expected to be $700 to $1,000 (excluding capitalized interest);
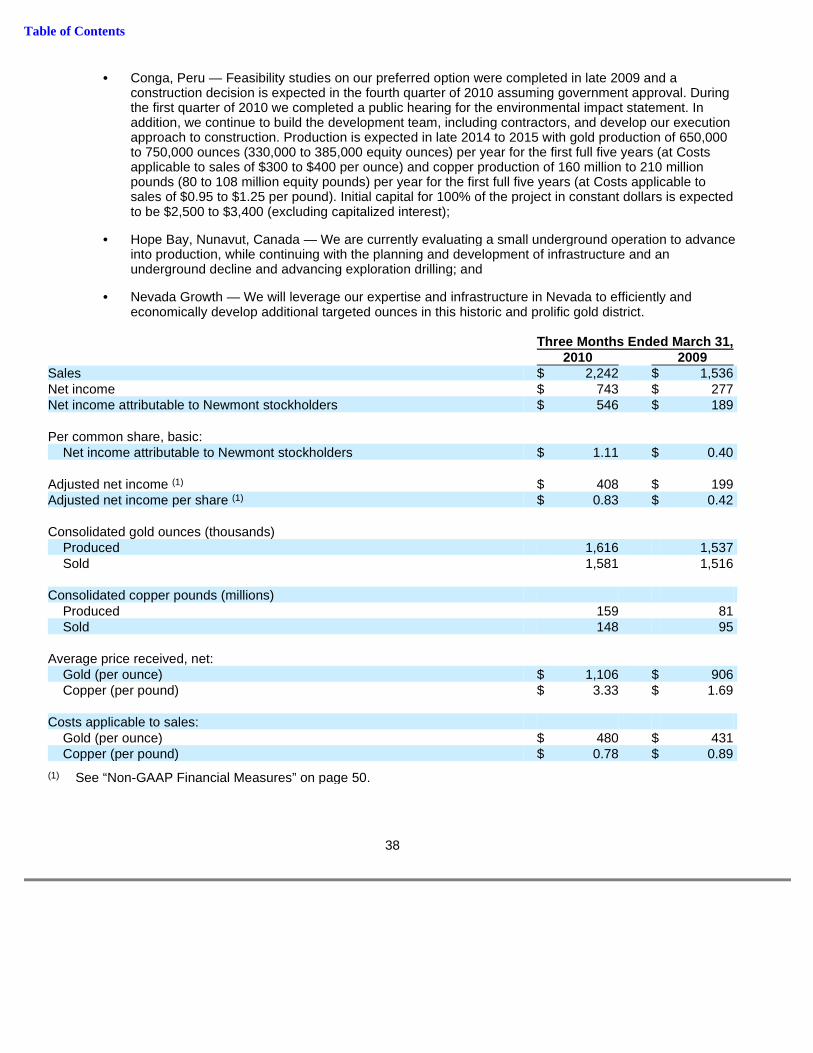
Table of Contents
38
• Conga, Peru — Feasibility studies on our preferred option were completed in late 2009 and a construction decision is expected in the fourth quarter of 2010 assuming government approval. During the first quarter of 2010 we completed a public hearing for the environmental impact statement. In addition, we continue to build the development team, including contractors, and develop our execution approach to construction. Production is expected in late 2014 to 2015 with gold production of 650,000 to 750,000 ounces (330,000 to 385,000 equity ounces) per year for the first full five years (at Costs applicable to sales of $300 to $400 per ounce) and copper production of 160 million to 210 million pounds (80 to 108 million equity pounds) per year for the first full five years (at Costs applicable to sales of $0.95 to $1.25 per pound). Initial capital for 100% of the project in constant dollars is expected to be $2,500 to $3,400 (excluding capitalized interest);
• Hope Bay, Nunavut, Canada — We are currently evaluating a small underground operation to advance into production, while continuing with the planning and development of infrastructure and an underground decline and advancing exploration drilling; and
• Nevada Growth — We will leverage our expertise and infrastructure in Nevada to efficiently and economically develop additional targeted ounces in this historic and prolific gold district.
Three Months Ended March 31, 2010 2009 Sales $ 2,242 $ 1,536 Net income $ 743 $ 277 Net income attributable to Newmont stockholders $ 546 $ 189 Per common share, basic:
Net income attributable to Newmont stockholders $ 1.11 $ 0.40 Adjusted net income (1) $ 408 $ 199 Adjusted net income per share (1) $ 0.83 $ 0.42 Consolidated gold ounces (thousands)
Produced 1,616 1,537 Sold 1,581 1,516
Consolidated copper pounds (millions)
Produced 159 81 Sold 148 95
Average price received, net:
Gold (per ounce) $ 1,106 $ 906 Copper (per pound) $ 3.33 $ 1.69
Costs applicable to sales:
Gold (per ounce) $ 480 $ 431 Copper (per pound) $ 0.78 $ 0.89
(1) See “Non-GAAP Financial Measures” on page 50.

Table of Contents
Consolidated Financial Results
Net income attributable to Newmont stockholders for the first quarter of 2010 was $546, or $1.11 per share, compared to $189, or $0.40 per share, for the first quarter of 2009. Results for the first quarter of 2010 compared to the first quarter of 2009 were impacted by higher realized gold and copper prices, higher sales volumes and a $127 tax benefit related to the conversion of non-U.S. entities for income tax purposes.
Sales — gold, net for the first quarter of 2010 increased $374, or 27%, compared to the first quarter of 2009, due to higher realized prices and increased sales volume. The following analysis summarizes the change in consolidated gold sales revenue:
The change in consolidated gold sales is due to:
39
Three Months Ended March 31, 2010 2009 Consolidated gold sales:
Gross before provisional pricing $ 1,759 $ 1,376 Provisional pricing mark-to-market 2 1
Gross after provisional pricing 1,761 1,377 Less: Treatment and refining charges (12 ) (2 )
Net $ 1,749 $ 1,375
Average realized gold price (per ounce):
Gross before provisional pricing $ 1,113 $ 908 Provisional pricing mark-to-market 1 —
Gross after provisional pricing 1,114 908 Less: Treatment and refining charges (8 ) (2 )
Net $ 1,106 $ 906
Three Months Ended March 31, 2010 vs. 2009 Increase in consolidated ounces sold $ 59 Increase in average realized gold price 325 Increase in treatment and refining charges (10 )
$ 374

Table of Contents
Sales — copper, net for the first quarter of 2010 increased $332, or 206%, compared to the first quarter of 2009 due to higher realized prices and increased sales volume. The following analysis summarizes the change in consolidated copper sales revenue:
The change in consolidated copper sales is due to:
40
Three Months Ended March 31, 2010 2009 Consolidated copper sales:
Gross before provisional pricing $ 492 $ 154 Provisional pricing mark-to-market gain 31 29
Gross after provisional pricing 523 183 Less: Treatment and refining charges (30 ) (22 )
Net $ 493 $ 161
Average realized copper price (per pound):
Gross before provisional pricing $ 3.32 $ 1.62 Provisional pricing mark-to-market gain 0.21 0.30
Gross after provisional pricing 3.53 1.92 Less: Treatment and refining charges (0.20 ) (0.23 )
Net $ 3.33 $ 1.69
Three Months Ended March 31, 2010 vs. 2009 Increase in consolidated pounds sold $ 100 Increase in average realized copper price 240 Increase in treatment and refining charges (8 )
$ 332

Table of Contents
The following is a summary of consolidated gold and copper sales, net:
Costs applicable to sales increased in the first quarter of 2010 compared to the first quarter of 2009, as detailed in the table below. The increase in Costs applicable to sales for gold is due to the commencement of commercial production at Boddington in November 2009 and higher production at Batu Hijau and Kalgoorlie. The increase in Costs applicable to sales for copper is due to the commencing of commercial production at Boddington in November 2009 and higher production at Batu Hijau. For a complete discussion regarding variations in operations, see Results of Consolidated Operations below.
Amortization increased in the first quarter of 2010 compared to the first quarter of 2009, as detailed in the table below. The increase in Amortization is due to the commencement of commercial production at Boddington in November 2009 and higher production at Batu Hijau. We expect 2010 Amortization to be approximately $970 to $1,000.
41
Three Months Ended March 31, 2010 2009 Gold North America:
Nevada $ 468 $ 468 La Herradura 44 23
512 491
South America:
Yanacocha 460 427 Asia Pacific:
Boddington 167 Batu Hijau 165 59 Jundee 105 88 Kalgoorlie 119 67 Tanami 60 77 Waihi 30 37
646 328
Africa:
Ahafo 131 129
1,749 1,375
Copper Asia Pacific:
Batu Hijau 455 161 Boddington 38
493 161
$ 2,242 $ 1,536

Table of Contents
The following is a summary of Costs applicable to sales and Amortization :
Exploration expense increased $2 in the first quarter of 2010 compared to the first quarter of 2009 due to additional expenditures in the Asia Pacific region. We expect 2010 Exploration expense to be approximately $190 to $220.
42
Costs Applicable to Sales Amortization Three Months Ended March 31, Three Months Ended March 31, 2010 2009 2010 2009 Gold North America:
Nevada $ 258 $ 263 $ 62 $ 61 La Herradura 14 10 4 2
272 273 66 63 South America:
Yanacocha 154 152 37 41 Asia Pacific:
Boddington 80 22 Batu Hijau 34 27 10 7 Jundee 36 33 10 9 Kalgoorlie 57 48 4 4 Tanami 45 49 11 10 Waihi 18 15 6 9
270 172 63 39 Africa:
Ahafo 64 57 17 18
760 654 183 161 Copper Asia Pacific:
Batu Hijau 91 85 27 21 Boddington 24 6
115 85 33 21 Other Hope Bay — — 3 3 Asia Pacific — — 1 1 Corporate and other — — 4 5
— — 8 9
$ 875 $ 739 $ 224 $ 191

Table of Contents
Advanced projects, research and development in the first quarter of 2010 and 2009 is summarized as follows:
We expect Advanced projects, research and development expenses to increase to approximately $230 to $250 in 2010 due to higher spending at Hope Bay as preparations are being made to develop the decline in the second half of 2010.
General and administrative expenses increased by $6 in the first quarter of 2010 compared to the first quarter of 2009 due to higher compensation and benefit costs. We expect 2010 General and administrative expenses to be approximately $160 to $170.
Other expense, net was $89, and $73 for the three months ended March 31, 2010 and March 31, 2009, respectively. The increase is due to $38 of additional community development commitments at PTNNT, partially offset by the absence of expenses related to a workforce reduction and the Boddington acquisition incurred during the first quarter of 2009.
Other income, net was $48 and $9 for the three months ended March 31, 2010 and March 31, 2009, respectively. The increase is primarily related to the sale of non-core assets in Asia Pacific and an increase in Canadian Oil Sands Trust income due to higher oil prices in 2010.
Interest expense, net increased by $43 in the first quarter of 2010 compared to the first quarter of 2009 due to additional interest related to the 2019 and 2039 senior notes issued during the third quarter of 2009. Capitalized interest decreased $12 to $3 in the first quarter of 2010 compared to the first quarter of 2009 due to completion of the Boddington project in November 2009. We expect 2010 Interest expense, net to be approximately $270 to $290.
Income tax expense during the first quarter of 2010 was $135 resulting in an effective tax rate of 15%. Income tax expense during the first quarter of 2009 was $105 for an effective tax rate of 27%. The decrease of 12% in the effective tax rate from 2009 to 2010 was the result of a tax benefit of $127 being recorded from the conversion of non-US tax-paying entities to entities currently subject to U.S. income tax resulting in an increase in net deferred tax assets. The effective tax rates in the first quarter of 2010 and 2009 are different from the United States statutory rate of 35% primarily due to the above mentioned tax benefit in 2010, U.S. percentage depletion and the effect of different income tax rates in countries where earnings are indefinitely reinvested. For a complete discussion of the factors that influence our effective tax rate, see Management’s Discussion and Analysis of Consolidated Financial Condition and Results of Operations in Newmont’s Annual Report on Form 10-K for the year ended December 31, 2009 filed February 25, 2010. We expect the 2010 full year tax rate to be approximately 24% to 28%, assuming an average gold price of $1,100 per ounce.
Net income attributable to noncontrolling interests increased to $197 in the first quarter of 2010 compared to $88 in the first quarter of 2009 as a result of increased earnings at Yanacocha and Batu Hijau.
43
Three Months Ended March 31, 2010 2009 Major projects:
Hope Bay $ 10 $ 5 Akyem 3 1 Conga 1 — Boddington — 3
Other projects: Technical and project services 12 5 Corporate 12 4 Nevada growth 3 6 Other 5 7
$ 46 $ 31

Table of Contents
Results of Consolidated Operations
Consolidated gold ounces produced increased 5% in the first quarter of 2010 from 2009 due to the start-up of Boddington and higher production at Batu Hijau, partially offset by lower production in North America and South America. Consolidated copper pounds produced increased 96% in the first quarter of 2010 from 2009, due to higher throughput at Batu Hijau and the start-up of Boddington.
Costs applicable to sales per consolidated gold ounce sold increased 11% in the first quarter of 2010 from 2009, due to higher mining and milling costs and lower production in North America and South America. Costs applicable to sales per consolidated copper pound sold decreased 12% in the first quarter of 2010 from 2009, due to higher production at Batu Hijau, partially offset by higher cost production from Boddington.
Our 2010 guidance for consolidated gold production is approximately 6.3 to 6.8 million ounces at Costs applicable to sales per ounce of approximately $450 to $480. Our Costs applicable to sales guidance for 2010 assumes an oil price of $80 per barrel and an A$ exchange rate of 0.90 for the remainder of the year. Our Costs applicable to sales per ounce for the year are expected to change by approximately $5 for every $10 change in the oil price and by approximately $5 for every $0.10 change in the A$ exchange rate, net of existing hedges.
Our 2010 guidance for consolidated copper production is approximately 540 to 600 million pounds at Costs applicable to sales per pound of approximately $0.85 to $0.95.
North America Operations
44
Gold Ounces or Copper Pounds Produced Costs Applicable to Sales (1) Amortization 2010 2009 2010 2009 2010 2009 (ounces in thousands) ($ per ounce) ($ per ounce) Three Months Ended March 31, Gold North America 473 543 $ 587 $ 503 $ 142 $ 117 South America (2) 423 499 372 324 90 87 Asia Pacific (2) 600 365 459 476 107 108 Africa 120 130 542 399 145 126
Total/Weighted-Average 1,616 1,537 $ 480 $ 431 $ 116 $ 106
Equity (3) 1,332 1,276
(pounds in millions) ($ per pound) ($ per pound) Copper Asia Pacific (2) 159 81 $ 0.78 $ 0.89 $ 0.23 $ 0.22
Equity 90 37 (1) Excludes Amortization and Reclamation .
(2) Consolidated gold ounces or copper pounds produced includes noncontrolling interests’ share for Yanacocha and Batu Hijau.
(3) Includes 15 ounces from discontinued operations for the three months ended March 31, 2009.
Gold Ounces Produced Costs Applicable to Sales (1) Amortization 2010 2009 2010 2009 2010 2009 (in thousands) ($ per ounce) ($ per ounce) Three Months Ended March 31, Nevada 433 518 $ 610 $ 509 $ 147 $ 118 La Herradura (44% owned) 40 25 344 387 95 89
Total/Weighted-Average 473 543 $ 587 $ 503 $ 142 $ 117
(1) Excludes Amortization and Reclamation .

Table of Contents
Nevada, USA. Gold ounces produced decreased 16% in the first quarter of 2010 from 2009 due to lower grade, throughput and recovery. Throughput was impacted by ongoing geotechnical issues related to pit wall movement in December 2009 at Gold Quarry, harder ore at Phoenix and the completion of mining activity at Deep Post in 2009. Costs applicable to sales per ounce increased to $610 in the first quarter of 2010 from $509 in the first quarter of 2009 due to lower production and higher surface mining costs related to geotechnical issues at Gold Quarry and lower capitalized mine development activities. Amortization per ounce sold increased in the first quarter of 2010 from the first quarter of 2009 due to lower production.
La Herradura, Mexico . Gold ounces produced increased 60% in the first quarter of 2010 from 2009 due to the commencement of production from the Soledad and Dipolos pits in January 2010. Costs applicable to sales per ounce decreased to $344 in the first quarter of 2010 from $387 in the first quarter of 2009 due to higher production. Amortization per ounce sold increased in the first quarter of 2010 from the first quarter of 2009 due to the use of additional mining equipment and leach pads.
We expect gold production in North America of approximately 1.7 to 1.9 million ounces at Costs applicable to sales per ounce of approximately $575 to $615 in 2010.
South America Operations
Yanacocha, Peru . Gold ounces produced decreased 15% in the first quarter of 2010 from 2009 due to lower mill grade and recovery combined with lower leach tons placed related to mine sequencing. Costs applicable to sales per ounce increased to $372 in the first quarter of 2010 from $324 in the first quarter of 2009 due to lower production, higher waste mining and higher costs related to maintenance, workers’ participation and royalties.
We expect consolidated gold production in South America of approximately 1.5 to 1.6 million ounces at Costs applicable to sales per ounce of approximately $360 to $400 in 2010.
45
Gold Ounces Produced (1) Costs Applicable to Sales (2) Amortization 2010 2009 2010 2009 2010 2009 (in thousands) ($ per ounce) ($ per ounce) Three Months Ended March 31, Yanacocha 423 499 $ 372 $ 324 $ 90 $ 87
Equity (3) 217 256 (1) Consolidated gold ounces produced includes noncontrolling interests’ share (51.35% owned).
(2) Excludes Amortization and Reclamation .
(3) Gold ounces produced attributable to Newmont after noncontrolling interests.

Table of Contents
Asia Pacific Operations
Boddington, Australia. Commercial production began in November 2009 and we continue to ramp-up towards full production. Gold and copper produced in the first quarter of 2010 were 158 thousand ounces and 14 million pounds, respectively. Costs applicable to sales were $532 per ounce and $2.15 per pound, respectively. Amortization was $146 per ounce sold and $0.56 per pound sold, respectively.
Batu Hijau, Indonesia. Copper and gold produced increased 79% and 181% in the first quarter of 2010 from 2009, respectively, due to higher throughput and grade as a result of mining in the bottom of Phase 5. In late 2010 or in 2011, we will complete mining the bottom of Phase 5. In 2011, we anticipate processing ore from stockpiles as mining will be primarily for waste removal in Phase 6. Costs applicable to sales decreased to $0.67 per pound and $215 per ounce, from $0.89 and $406, respectively, in the first quarter of 2010 from 2009 due to higher production and lower mining costs attributable to the suspension of mining from January 17 th through February 25 th , 2010 due to a geotechnical event.
For information on the Batu Hijau Contract of Work and divestiture requirements, see the discussion in Note 26 to the Condensed Consolidated Financial Statements.
Other Australia/New Zealand . Gold ounces produced decreased 10% in the first quarter of 2010 from 2009, due to lower production at Tanami, Jundee and Waihi, partially offset by increased production at Kalgoorlie. Production decreased due to lower grade at Tamami, Jundee and Waihi and lower throughput as a result of mill maintenance at Tanami. Production increased at Kalgoorlie due to higher grade and throughput. Costs applicable to sales per ounce increased to $558 in the first quarter of 2010 from $492 in the first quarter of 2009 due to lower production and the stronger Australian dollar.
Gold Ounces Produced Costs Applicable to Sales (1) Amortization 2010 2009 2010 2009 2010 2009 (in thousands) ($ per ounce) ($ per ounce) Three Months Ended March 31, Gold Boddington 158 — $ 532 $ — $ 146 $ — Batu Hijau (2)(3) 166 59 215 406 63 103 Other
Jundee 92 102 386 353 113 96 Kalgoorlie (50% owned) 104 76 539 643 40 48 Tanami 53 89 844 574 202 123 Waihi 27 39 655 367 210 223
276 306 558 492 112 109
Total/Weighted-Average 600 365 $ 459 $ 476 $ 107 $ 108
Equity (4) 522 332
Copper Pounds Produced Costs Applicable to Sales (1) Amortization 2010 2009 2010 2009 2010 2009 (in millions) ($ per pound) ($ per pound) Three Months Ended March 31, Copper Boddington 14 — $ 2.15 $ — $ 0.56 $ — Batu Hijau (2)(3) 145 81 0.67 0.89 0.20 0.22
Total/Weighted-Average 159 81 $ 0.78 $ 0.89 $ 0.23 $ 0.22
Equity (4) 90 37
(1) Excludes Amortization and Reclamation .
(2) Consolidated gold ounces or copper pounds produced includes noncontrolling interests’ share.
(3) Our economic interest in Batu Hijau was 45% in the first quarter of 2009. As a result of transactions with noncontrolling partners, our economic interest in Batu Hijau was 52.44% in the first quarter of 2010. See Note 12 to the Condensed Consolidated Financial Statements for a discussion of the changes in our ownership and economic interest in Batu Hijau.
(4) Gold ounces and copper pounds produced attributable to Newmont after noncontrolling interests.

46

Table of Contents
We expect consolidated gold production for Asia Pacific of approximately 2.6 to 2.8 million ounces at Costs applicable to sales of approximately $400 to $440 per ounce in 2010. We expect consolidated copper production for Asia Pacific to be approximately 540 to 600 million pounds of copper at Costs applicable to sales of approximately $0.85 to $0.95 per pound in 2010.
Africa Operations
Ahafo, Ghana. Gold ounces produced decreased 8% in the first quarter of 2010 from 2009 due to lower grade and recovery, partially offset by higher throughput. Costs applicable to sales per ounce increased to $542 in the first quarter of 2010 from $399 in the first quarter of 2009 due to lower production and higher labor and fuel costs. Amortization per ounce sold increased to $145 in the first quarter of 2010 from $126 in the first quarter of 2009 due to lower production.
We continue to expect gold production in Africa of approximately 460,000 to 500,000 ounces at Costs applicable to sales per ounce of approximately $515 to $555 in 2010.
Foreign Currency Exchange Rates
Our foreign operations sell their gold and copper production based on U.S. dollar metal prices. Approximately 39% and 22% of our Costs applicable to sales were paid in local currencies during the first quarter of 2010 and 2009, respectively. Variations in the local currency exchange rates in relation to the U.S. dollar at our foreign mining operations increased consolidated Costs applicable to sales per ounce by approximately $25, net of hedging gains and losses, during the first quarter of 2010 as compared to the first quarter of 2009.
Liquidity and Capital Resources
Cash Provided from Operating Activities
Net cash provided from continuing operations increased to $728 for the first quarter of 2010 from $381 for the first quarter of 2009 due to higher realized gold and copper prices and higher sales volumes, as discussed above in Consolidated Financial Results .
47
Gold Ounces Produced Costs Applicable to Sales (1) Amortization 2010 2009 2010 2009 2010 2009 (in thousands) ($ per ounce) ($ per ounce) Three Months Ended March 31, Ahafo, Ghana 120 130 $ 542 $ 399 $ 145 $ 126 (1) Excludes Amortization and Reclamation .

Table of Contents
Investing Activities
Net cash used in investing activities was $285 during the first quarter of 2010 compared to $354 during the same period of 2009, driven largely by the construction of Boddington in 2009. Additions to property, plant and mine development were as follows:
Capital expenditures in North America are primarily related to the Hope Bay Project, the Turf/Leeville underground project, and sustaining mine development. Capital expenditures in South America are primarily related to the Conga project and leach pad development at Yanacocha. The majority of capital expenditures in Asia Pacific are for surface and underground development, mining equipment, and infrastructure improvements. Capital expenditures in Africa are primarily related to the development of the Akyem project, tailings dam construction, and sustaining mine development at Ahafo. We expect to spend $1,400 to $1,600 on consolidated capital expenditures in 2010.
Capital expenditures in North America during the first quarter of 2009 were primarily related to sustaining mine development at Nevada. Capital expenditures in South America primarily related to the Conga project and dewatering activity and leach pad development at Yanacocha. The vast majority of capital expenditures in Asia Pacific were for the Boddington project, with other sustaining capital expenditures for tailings facilities and mine development at Australia and equipment purchases at Batu Hijau. Capital expenditures in Africa primarily related to sustaining mine development at Ahafo.
Investments in marketable debt and equity securities, net. During the first quarter of 2010 we purchased marketable equity securities for $3.
48
Three Months Ended March 31, 2010 2009 North America:
Nevada $ 48 $ 53 La Herradura 14 9 Hope Bay 9 1
71 63
South America:
Yanacocha 40 27 Conga 17 6
57 33
Asia Pacific:
Boddington 48 216 Jundee 10 5 Tanami 19 10 Kalgoorlie 4 2 Waihi 3 1 Batu Hijau 28 6 Other 2 1
114 241
Africa:
Ahafo 21 9 Akyem 6 1
27 10 Corporate and Other 3 3
Accrual basis 272 350 Decrease (increase) in accrual 37 (20 )
Cash basis $ 309 $ 330


Table of Contents
Acquisitions. During the first quarter of 2009 we paid $11 for a mining property near the La Herradura, Mexico operation.
Proceeds from sale of other assets. During the first quarter of 2010 we received $6 from the sale of our 40% interest in AGR Matthey Joint Venture (“AGR”). We also received $32 from the sale of other assets including non-core assets held at Tanami.
Financing Activities
Net cash provided from (used in) financing activities of continuing operations was $(280) and $983 during the first quarter of 2010 and 2009, respectively.
Proceeds from and repayment of debt, net. During the first quarter of 2010, we repaid $250 of debt, including scheduled debt repayments of $24 related to the sale-leaseback of the refractory ore treatment plant (classified as a capital lease) and $6 on other credit facilities and capital leases. In addition, PTNNT repaid the entire $220 balance under its project financing facility. At March 31, 2010, $280 of the revolving credit facility is currently used to secure the issuance of letters of credit, primarily supporting reclamation obligations (see “Off-Balance Sheet Arrangements” below).
Scheduled minimum debt repayments are $39 for the remainder of 2010, $290 in 2011, $570 in 2012, $72 in 2013, $540 in 2014, and $3,063 thereafter. We expect to be able to fund maturities of debt from Net cash provided by operating activities , short-term investments, existing cash balances and available credit facilities.
At March 31, 2010, we were in compliance with all required debt covenants and other restrictions related to debt agreements.
Sale of subsidiary shares to noncontrolling interests. In March 2010, Nusa Tenggara Partnership (“NTP”) completed the sale of 7% of shares in PTNNT to a third party buyer. This transaction reduced our direct ownership interest in PTNNT to 31.5%. Cash proceeds from the sale were $229, with our 56.25% share being $129 and the balance of $100 was paid to our NTP partner.
Acquisition of subsidiary shares from noncontrolling interests. On December 22, 2009, we entered into a transaction with P.T. Pukuafu Indah (“PTPI”), an unrelated noncontrolling partner of PTNNT whereby we agreed to advance certain funds to PTPI in exchange for a pledge of the noncontrolling partner’s 20% share of PTNNT dividends, net of withholding tax, and the assignment of its voting rights to us. As a result, our effective economic interest in PTNNT increased by 17%. In connection with the above transaction, we advanced additional funds to PTPI during the first quarter of 2010.
Dividends paid to common stockholders. We declared a regular quarterly dividend of $0.10 per common share. Additionally, Newmont Mining Corporation of Canada Limited, a subsidiary of the Company, declared regular quarterly dividends on its exchangeable shares totaling C$0.1055 per share. We paid dividends of $49 and $49 to common stockholders in the first quarter of 2010 and 2009, respectively.
Dividends paid to noncontrolling interest. We paid dividends of $220 to noncontrolling interests during the first quarter of 2010. The dividends included $100 for our NTP partner’s share of the sale of the 7% interest in Batu Hijau and $120 for our partners’ share of a $276 PTNNT dividend.
Proceeds from stock issuance. We received proceeds of $3 and $1,239 during the first quarter of 2010 and 2009, respectively, from the issuance of common stock. In February 2009 we completed a public offering of 34,500,000 shares of common stock for net proceeds of $1,236.
Discontinued Operations
Net operating cash provided from (used in) discontinued operations was $(13) and $4 in the first quarter of 2010 and 2009, respectively, related to the Kori Kollo, Bolivia operation sold in 2009.
Net cash used in financing activities of discontinued operations was $1 in the first quarter of 2009 for repayment of debt at Kori Kollo.
49
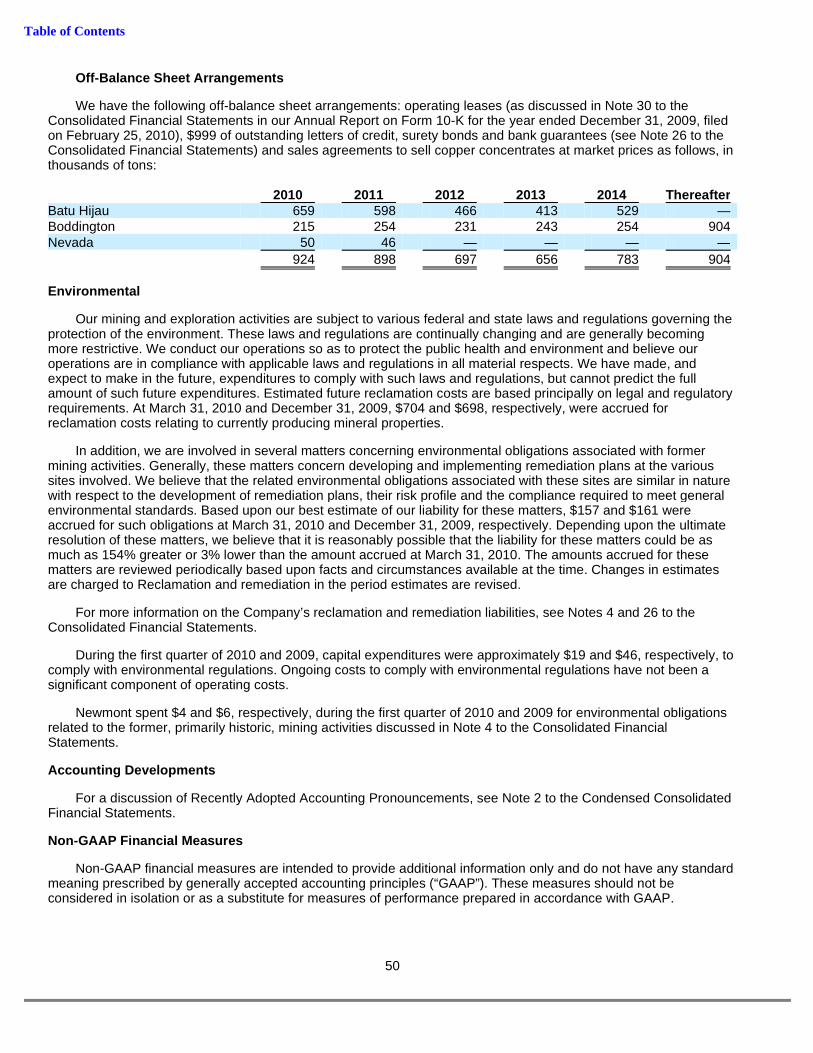
Table of Contents
Off-Balance Sheet Arrangements
We have the following off-balance sheet arrangements: operating leases (as discussed in Note 30 to the Consolidated Financial Statements in our Annual Report on Form 10-K for the year ended December 31, 2009, filed on February 25, 2010), $999 of outstanding letters of credit, surety bonds and bank guarantees (see Note 26 to the Consolidated Financial Statements) and sales agreements to sell copper concentrates at market prices as follows, in thousands of tons:
Environmental
Our mining and exploration activities are subject to various federal and state laws and regulations governing the protection of the environment. These laws and regulations are continually changing and are generally becoming more restrictive. We conduct our operations so as to protect the public health and environment and believe our operations are in compliance with applicable laws and regulations in all material respects. We have made, and expect to make in the future, expenditures to comply with such laws and regulations, but cannot predict the full amount of such future expenditures. Estimated future reclamation costs are based principally on legal and regulatory requirements. At March 31, 2010 and December 31, 2009, $704 and $698, respectively, were accrued for reclamation costs relating to currently producing mineral properties.
In addition, we are involved in several matters concerning environmental obligations associated with former mining activities. Generally, these matters concern developing and implementing remediation plans at the various sites involved. We believe that the related environmental obligations associated with these sites are similar in nature with respect to the development of remediation plans, their risk profile and the compliance required to meet general environmental standards. Based upon our best estimate of our liability for these matters, $157 and $161 were accrued for such obligations at March 31, 2010 and December 31, 2009, respectively. Depending upon the ultimate resolution of these matters, we believe that it is reasonably possible that the liability for these matters could be as much as 154% greater or 3% lower than the amount accrued at March 31, 2010. The amounts accrued for these matters are reviewed periodically based upon facts and circumstances available at the time. Changes in estimates are charged to Reclamation and remediation in the period estimates are revised.
For more information on the Company’s reclamation and remediation liabilities, see Notes 4 and 26 to the Consolidated Financial Statements.
During the first quarter of 2010 and 2009, capital expenditures were approximately $19 and $46, respectively, to comply with environmental regulations. Ongoing costs to comply with environmental regulations have not been a significant component of operating costs.
Newmont spent $4 and $6, respectively, during the first quarter of 2010 and 2009 for environmental obligations related to the former, primarily historic, mining activities discussed in Note 4 to the Consolidated Financial Statements.
Accounting Developments
For a discussion of Recently Adopted Accounting Pronouncements, see Note 2 to the Condensed Consolidated Financial Statements.
Non-GAAP Financial Measures
Non-GAAP financial measures are intended to provide additional information only and do not have any standard meaning prescribed by generally accepted accounting principles (“GAAP”). These measures should not be considered in isolation or as a substitute for measures of performance prepared in accordance with GAAP.
50
2010 2011 2012 2013 2014 Thereafter Batu Hijau 659 598 466 413 529 — Boddington 215 254 231 243 254 904 Nevada 50 46 — — — —
924 898 697 656 783 904

Table of Contents
Adjusted net income
Management of the Company uses the non-GAAP financial measure Adjusted net income to evaluate the Company’s operating performance, and for planning and forecasting future business operations. The Company believes the use of Adjusted net income allows investors and analysts to compare results of the continuing operations of the Company and its direct and indirect subsidiaries relating to the production and sale of minerals to similar operating results of other mining companies, by excluding exceptional or unusual items, income or loss from discontinued operations and the permanent impairment of assets, including marketable securities and goodwill. Management’s determination of the components of Adjusted net income are evaluated periodically and based, in part, on a review of non-GAAP financial measures used by mining industry analysts. Net income attributable to Newmont stockholders is reconciled to Adjusted net income as follows:
By-product costs applicable to sales
Sales and Costs applicable to sales for Boddington are presented in the Condensed Consolidated Financial Statements for both gold and copper due to the significant portion of copper production (approximately 15-20% of total sales based on the latest life-of-mine plan and metal price assumptions). The co-product method allocates costs applicable to sales to each metal based on specifically identifiable costs where applicable and on a relative proportion of sales values for other costs. Management also assesses the performance of the Boddington mine on a by-product basis due to the majority of sales being derived from gold and to determine contingent consideration payments to AngloGold. The by-product method deducts copper sales from costs applicable to sales as shown in the following table:
51
Three Months Ended March 31, 2010 2009 Net income attributable to Newmont stockholders $ 546 $ 189
Income tax benefit from internal restructuring (127 ) — Net gain on asset sales (25 ) — PTNNT community contribution 13 — Impairment of assets 1 5 Boddington acquisition costs — 5
Adjusted net income $ 408 $ 199
Adjusted net income per share (1) $ 0.83 $ 0.42 (1) Calculated using weighted average number of shares outstanding, basic and diluted.
By-Product Method Co-Product Method For the three months ended March 31, 2010 Gold Gold Copper Total Sales $ 167 $ 167 $ 38 $ 205 Production costs:
Direct mining and production costs 131 103 28 131 By-product credits (39 ) (1 ) — (1 ) Royalties and production taxes 7 5 2 7 Other (33 ) (27 ) (6 ) (33 )
Costs applicable to sales 66 80 24 104 Amortization and accretion 29 23 6 29
Total production costs 95 103 30 133
Gross margin $ 72 $ 64 $ 8 $ 72
Gold ounces sold (000) 150 150 Costs applicable to sales per ounce $ 436 $ 532 Copper pounds sold (millions) N/A 11 Costs applicable to sales per pound N/A $ 2.15

Table of Contents
Safe Harbor Statement
Certain statements contained in this report (including information incorporated by reference) are “forward-looking statements” within the meaning of Section 27A of the Securities Act of 1933, as amended, and Section 21E of the Securities Exchange Act of 1934, as amended, and are intended to be covered by the safe harbor provided for under these sections. Our forward-looking statements include, without limitation: (a) statements regarding future earnings, and the sensitivity of earnings to gold and other metal prices; (b) estimates of future mineral production and sales for specific operations and on a consolidated basis; (c) estimates of future production costs and other expenses, for specific operations and on a consolidated basis; (d) estimates of future cash flows and the sensitivity of cash flows to gold and other metal prices; (e) estimates of future capital expenditures and other cash needs for specific operations and on a consolidated basis and expectations as to the funding thereof; (f) statements as to the projected development of certain ore deposits, including estimates of development and other capital costs, financing plans for these deposits, and expected production commencement dates; (g) estimates of future costs and other liabilities for certain environmental matters; (h) estimates of reserves, and statements regarding future exploration results and reserve replacement; (i) statements regarding modifications to Newmont’s hedge positions; (j) statements regarding future transactions relating to portfolio management or rationalization efforts; and (k) projected synergies and costs associated with acquisitions and related matters.
Where we express an expectation or belief as to future events or results, such expectation or belief is expressed in good faith and believed to have a reasonable basis. However, our forward-looking statements are subject to risks, uncertainties, and other factors, which could cause actual results to differ materially from future results expressed, projected, or implied by those forward-looking statements. Important factors that could cause actual results to differ materially from such forward-looking statements (“cautionary statements”) are disclosed under “Risk Factors” in the Newmont Annual Report on Form 10-K for the year ended December 31, 2009, as well as in other filings with the Securities and Exchange Commission. Many of these factors are beyond Newmont’s ability to control or predict. Given these uncertainties, readers are cautioned not to place undue reliance on our forward-looking statements.
All subsequent written and oral forward-looking statements attributable to Newmont or to persons acting on its behalf are expressly qualified in their entirety by the cautionary statements. Newmont disclaims any intention or obligation to update publicly any forward-looking statements, whether as a result of new information, future events or otherwise, except as may be required under applicable securities laws.
52

Table of Contents
ITEM 3. QUANTITATIVE AND QUALITATIVE DISCLOSURES AB OUT MARKET RISK (dollars in millions, except per ounce and per pound amounts).
Metal Prices
Changes in the market price of gold significantly affect our profitability and cash flow. Gold prices can fluctuate widely due to numerous factors, such as demand; forward selling by producers; central bank sales, purchases and lending; investor sentiment; the strength of the U.S. dollar; inflation, deflation, or other general price instability; and global mine production levels. Changes in the market price of copper also affect our profitability and cash flow. Copper is traded on established international exchanges and copper prices generally reflect market supply and demand, but can also be influenced by speculative trading in the commodity or by currency exchange rates.
Hedging
Our strategy is to provide shareholders with leverage to changes in gold and copper prices by selling our production at spot market prices. Consequently, we do not hedge our gold and copper sales. We continue to manage risks associated with commodity input costs, interest rates and foreign currencies using the derivative market.
By using derivatives, we are affected by credit risk, market risk and market liquidity risk. Credit risk is the risk that a third party might fail to fulfill its performance obligations under the terms of a financial instrument. We mitigate credit risk by entering into derivatives with high credit quality counterparties, limiting the amount of exposure to each counterparty, and monitoring the financial condition of the counterparties. Market risk is the risk that the fair value of a derivative might be adversely affected by a change in underlying commodity prices, interest rates, or currency exchange rates, and that this in turn affects our financial condition. We manage market risk by establishing and monitoring parameters that limit the types and degree of market risk that may be undertaken. We mitigate this risk by establishing trading agreements with counterparties under which we are not required to post any collateral or make any margin calls on our derivatives. Our counterparties cannot require settlement solely because of an adverse change in the fair value of a derivative. Market liquidity risk is the risk that a derivative cannot be eliminated quickly, by either liquidating it or by establishing an offsetting position. Under the terms of our trading agreements, counterparties cannot require us to immediately settle outstanding derivatives, except upon the occurrence of customary events of default such as covenant breeches, including financial covenants, insolvency or bankruptcy. We generally mitigate market liquidity risk by spreading out the maturity of our derivatives over time.
Cash Flow Hedges
We utilize foreign currency contracts to reduce the variability of the US dollar amount of forecasted foreign currency expenditures caused by changes in exchange rates. We hedge a portion of our A$, NZ$ and IDR denominated operating expenditures which results in a blended rate realized each period. The hedging instruments are fixed forward contracts with expiration dates ranging up to three years from the date of issue. The principal hedging objective is reduction in the volatility of realized period-on-period $/A$, $/NZ$ and IDR/$ rates, respectively. We use diesel contracts to reduce the variability of our operating cost exposure related to diesel prices of fuel consumed at our Nevada operations. All of the currency and diesel contracts have been designated as cash flow hedges of future expenditures, and as such, changes in the market value have been recorded in Accumulated other comprehensive income (loss) . Gains and losses from hedge ineffectiveness are recognized in current earnings .
53

Table of Contents
Foreign Currency Exchange Risk
We had the following derivative instruments designated as hedges with fair values at March 31, 2010 and December 31, 2009:
Diesel Price Risk
We had the following diesel derivative contracts outstanding at March 31, 2010:
Fair Value Hedges
Interest Rate Risk
At March 31, 2010, we had $222 fixed to floating swap contracts designated as a hedge against our 8 5/8% debentures due 2011. The interest rate swap contracts assist in managing our targeted mix of fixed and floating rate debt. Under the hedge contract terms, we receive fixed-rate interest payments at 8.63% and pay floating-rate interest amounts based on periodic London Interbank Offered Rate (“LIBOR”) settings plus a spread, ranging from 2.60% to 7.63%. The interest rate swap contracts were designated as fair value hedges and changes in fair value have been recorded in income in each period, consistent with recording changes to the mark-to-market value of the underlying hedged liability in income. The fair value of the interest rate swaps was $8 and $7 at March 31, 2010 and December 31, 2009, respectively.
54
Expected Maturity Date Fair Value, Net Total At March 31, At December 31, 2010 2011 2012 2013 Average 2010 2009 A$ Fixed Forward Contracts:
$ (millions) $ 489 $ 432 $ 195 $ 12 $ 1,128 146 130 Average rate ($/A$) 0.79 0.77 0.79 0.81 0.78 A$ notional (millions) 618 563 246 15 1,442 Expected hedge ratio 66 % 44 % 20 % 5 % 38 %
NZ$ Fixed Forward Contracts: $ (millions) $ 33 $ 23 $ 1 $ — $ 57 3 6 Average rate ($/NZ$) 0.65 0.67 0.66 — 0.66 NZ$ notional (millions) 51 34 2 — 87 Expected hedge ratio 63 % 27 % 5 % — 37 %
IDR Fixed Forward Contracts: $ (millions) $ 38 $ — $ — $ — $ 38 2 1 Average rate (IDR/$) 9,944 — — — 9,944 IDR notional (millions) 258,537 — — — 258,537 Expected hedge ratio 27 % — — — 27 %
Expected Maturity Date Fair Value, Net Total At March 31, At December 31, 2010 2011 2012 Average 2010 2009 Diesel Fixed Forward Contracts:
$ (millions) $ 32 $ 21 $ 1 $ 54 6 6 Average rate ($/gallon) 2.01 2.18 2.31 2.08 Diesel gallons (millions) 16 10 — 26 Expected Nevada hedge ratio 55 % 25 % 4 % 34 %
Table of Contents
Commodity Price Risk
Our provisional copper and gold sales contain an embedded derivative that is required to be separated from the host contract for accounting purposes. The host contract is the receivable from the sale of the gold and copper concentrates at the prevailing indices’ prices at the time of sale. The embedded derivative, which does not qualify for hedge accounting, is marked to market through earnings each period prior to final settlement.
LME copper prices averaged $3.29 per pound during the first quarter of 2010, compared with our recorded average provisional price of $3.32 per pound before mark-to-market gains and treatment and refining charges. The applicable forward copper price at the end of the quarter was $3.56 per pound. During the first quarter of 2010, increasing copper prices resulted in a provisional pricing mark-to-market gain of $31 ($0.21 per pound). At March 31, 2010, we had copper sales of 174 million pounds priced at an average of $3.56 per pound, subject to final pricing over the next several months.
The average London P.M. fix for gold was $1,109 per ounce during the first quarter of 2010, compared with our recorded average provisional price of $1,112 per ounce before mark-to-market gains and treatment and refining charges. The applicable forward gold price at the end of the quarter was $1,116 per ounce. During the first quarter of 2010, changes in gold prices resulted in a provisional pricing mark-to-market gain of $2 ($1 per ounce). At March 31, 2010, we had gold sales of 153,000 ounces priced at an average of $1,116 per ounce, subject to final pricing over the next several months.
ITEM 4. CONTROLS AND PROCEDURES.
During the fiscal period covered by this report, the Company’s management, with the participation of the Chief Executive Officer and Chief Financial Officer of the Company, carried out an evaluation of the effectiveness of the design and operation of the Company’s disclosure controls and procedures (as defined in Rules 13a-15(e) and 15d-15(e) of the Securities Exchange Act of 1934, as amended (the “Exchange Act”)). Based on such evaluation, the Company’s Chief Executive Officer and Chief Financial Officer have concluded that, as of the end of the period covered by this report, the Company’s disclosure controls and procedures are effective to ensure that information required to be disclosed by the Company in reports that it files or submits under the Exchange Act is recorded, processed, summarized and reported within the required time periods and are designed to ensure that information required to be disclosed in its reports is accumulated and communicated to the Company’s management, including the Chief Executive Officer and Chief Financial Officer, as appropriate to allow timely decisions regarding required disclosure.
55

Table of Contents
PART II—OTHER INFORMATION
ITEM 1. LEGAL PROCEEDINGS.
Information regarding legal proceedings is contained in Note 26 to the Condensed Consolidated Financial Statements contained in this Report and is incorporated herein by reference.
ITEM 1A. RISK FACTORS.
There were no material changes to the risk factors disclosed in Item 1A of Part 1 in our Annual Report on Form 10-K for the year ended December 31, 2009, as filed with the SEC on February 25, 2010.
ITEM 2. ISSUER PURCHASES OF EQUITY SECURITIES.
ITEM 3. DEFAULTS UPON SENIOR SECURITIES.
None.
ITEM 5. OTHER INFORMATION.
None.
ITEM 6. EXHIBITS.
56
(a) (b) (c) (d) Total Number of Maximum Number (or Shares Purchased Approximate Dollar Value) Total Number Average as Part of Publicly of Shares that may yet be of Shares Price Paid Announced Plans Purchased under the Period Purchased (1) Per Share or Programs Plans or Programs January 1, 2010 through January 31,
2010 — — — N/A February 1, 2010 through
February 28, 2010 232 $ 47.03 — N/A March 1, 2010 through March 31,
2010 — — — N/A
(1) Represents shares delivered to the Company from restricted stock units held by a Company employee upon
vesting for purpose of covering the recipient’s tax withholding obligations. No other issuer purchases of equity securities occurred during the periods set forth.
(a) The exhibits to this report are listed in the Exhibit Index.
Table of Contents
SIGNATURES
Pursuant to the requirements of the Securities Exchange Act of 1934, the registrant has duly caused this report to be signed on its behalf by the undersigned thereunto duly authorized.
57
N EWMONT M INING C ORPORATION
(Registrant)
Date: April 27, 2010 /s/ RUSSELL BALL Russell Ball
Executive Vice President and Chief Financial Officer (Principal Financial Officer)
Date: April 27, 2010 /s/ ROGER P. JOHNSON Roger P. Johnson
Vice President and Chief Accounting Officer (Principal Accounting Officer)

Table of Contents
NEWMONT MINING CORPORATION
EXHIBIT INDEX
Exhibit Number Description 12.1 Computation of Ratio of Earnings to Fixed Charges, filed herewith 31.1
Certification Pursuant to Rule 13A-14 or 15-D-14 of the Securities Exchange Act of 1934, as Adopted Pursuant to Section 302 of the Sarbanes-Oxley Act of 2002 signed by the Principal Executive Officer, filed herewith.
31.2
Certification Pursuant to Rule 13A-14 or 15-D-14 of the Securities Exchange Act of 1934, as Adopted Pursuant to Section 302 of the Sarbanes-Oxley Act of 2002 signed by the Chief Financial Officer, filed herewith.
32.1
Statement Required by 18 U.S.C. Section 1350, as Adopted Pursuant to Section 906 of the Sarbanes-Oxley Act of 2002 signed by Principal Executive Officer, filed herewith. (1)
32.2
Statement Required by 18 U.S.C. Section 1350, as Adopted Pursuant to Section 906 of the Sarbanes-Oxley Act of 2002 signed by Chief Financial Officer, filed herewith. (1)
101
The following materials from the Quarterly Report on Form 10-Q of Newmont Mining Corporation for the three months ended March 31, 2010, filed on April, 27, 2010, formatted in XBRL (eXtensible Business Reporting Language): (i) Condensed Consolidated Statements of Income, (ii) Condensed Consolidated Balance Sheets, (iii) Condensed Consolidated Statements of Cash Flows, (iv) document and entity information, and (v) related notes to these financial statements. Users of this data are advised pursuant to Rule 401 of Regulation S-T that the financial information contained in the XBRL document is unaudited and these are not the officially publicly filed financial statements of Newmont Mining Corporation. The purpose of submitting these XBRL formatted documents is to test the related format and technology and, as a result, investors should continue to rely on the official filed version of the furnished documents and not rely on this information in making investment decisions. In accordance with Rule 402 of Regulation S-T, the information in this Exhibit 101 shall not be deemed “filed” for the purposes of section 18 of the Securities Exchange Act of 1934, as amended (the “Exchange Act”), or otherwise subject to the liability of that section, and shall not be incorporated by reference into any registration statement or other document filed under the Securities Act of 1933, as amended, or the Exchange Act, except as shall be expressly set forth by the specific reference in such filing.
(1) This document is being furnished in accordance with SEC Release Nos. 33-8212 and 34-47551.
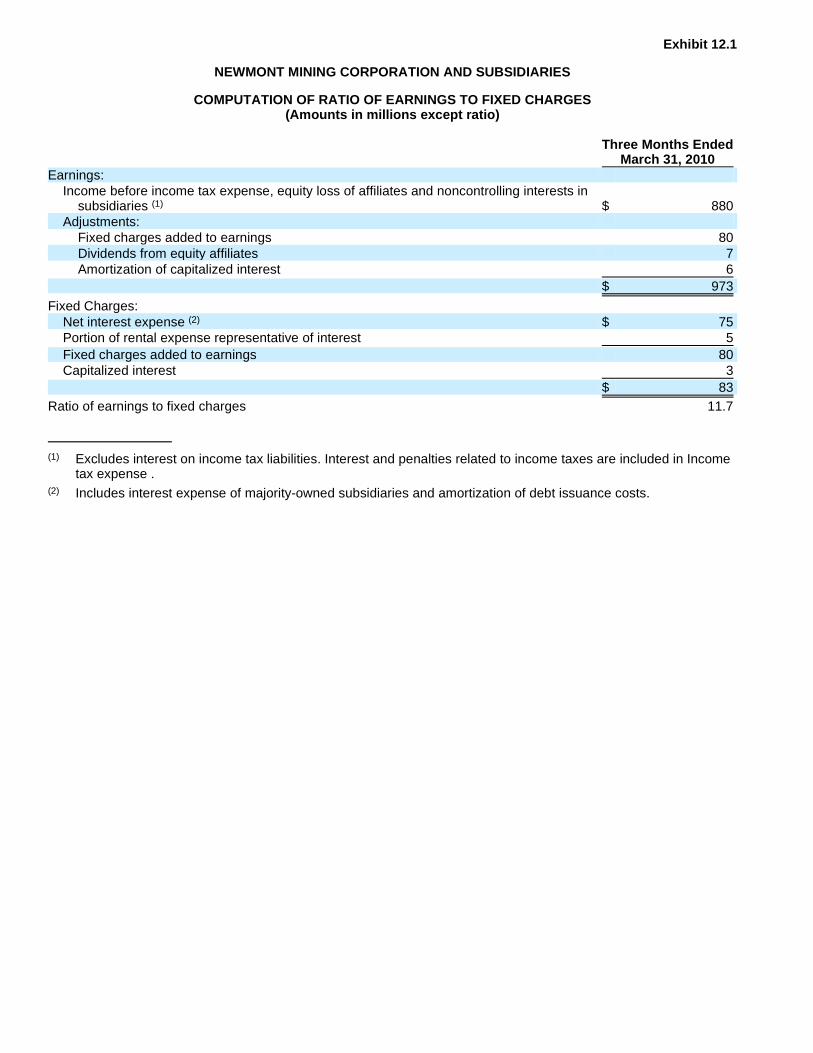
Exhibit 12.1
NEWMONT MINING CORPORATION AND SUBSIDIARIES
COMPUTATION OF RATIO OF EARNINGS TO FIXED CHARGES (Amounts in millions except ratio)
Three Months Ended March 31, 2010 Earnings:
Income before income tax expense, equity loss of affiliates and noncontrolling interests in subsidiaries (1) $ 880
Adjustments: Fixed charges added to earnings 80 Dividends from equity affiliates 7 Amortization of capitalized interest 6
$ 973
Fixed Charges: Net interest expense (2) $ 75 Portion of rental expense representative of interest 5
Fixed charges added to earnings 80 Capitalized interest 3
$ 83
Ratio of earnings to fixed charges 11.7
(1) Excludes interest on income tax liabilities. Interest and penalties related to income taxes are included in Income
tax expense .
(2) Includes interest expense of majority-owned subsidiaries and amortization of debt issuance costs.

Exhibit 31.1
CERTIFICATION OF PRINCIPAL EXECUTIVE OFFICER (Pursuant to Section 302 of the Sarbanes-Oxley Act of 2002)
I, Richard T. O’Brien, certify that:
1. I have reviewed this Quarterly Report on Form 10-Q of Newmont Mining Corporation;
2. Based on my knowledge, this report does not contain any untrue statement of a material fact or omit to state a material fact necessary to make the statements made, in light of the circumstances under which such statements were made, not misleading with respect to the period covered by this report;
3. Based on my knowledge, the financial statements, and other financial information included in this report, fairly present in all material respects the financial condition, results of operations and cash flows of the registrant as of, and for, the periods presented in this report;
4. The registrant’s other certifying officer(s) and I are responsible for establishing and maintaining disclosure controls and procedures (as defined in Exchange Act Rules 13a-15(e) and 15d-15(e)) for the registrant and internal control over financial reporting (as defined in Exchange Act Rules 13a-15(f) and 15d-15(f)) for the registrant and have:
(a) Designed such disclosure controls and procedures, or caused such disclosure controls and procedures to be designed under our supervision, to ensure that material information relating to the registrant, including its consolidated subsidiaries, is made known to us by others within those entities, particularly during the period in which this report is being prepared;
(b) Designed such internal control over financial reporting, or caused such internal control over financial reporting to be designed under our supervision, to provide reasonable assurance regarding the reliability of financial reporting and the preparation of financial statements for external purposes in accordance with generally accepted accounting principles;
(c) Evaluated the effectiveness of the registrant’s disclosure controls and procedures and presented in this report our conclusions about the effectiveness of the disclosure controls and procedures, as of the end of the period covered by this report based on such evaluation; and
(d) Disclosed in this report any change in the registrant’s internal control over financial reporting that occurred during the registrant’s most recent fiscal quarter (the registrant’s fourth fiscal quarter in the case of an annual report) that has materially affected, or is reasonably likely to materially affect, the registrant’s internal control over financial reporting; and
5. The registrant’s other certifying officer(s) and I have disclosed, based on our most recent evaluation of internal control over financial reporting, to the registrant’s auditors and the audit committee of the registrant’s board of directors (or persons performing the equivalent functions):
(a) All significant deficiencies and material weaknesses in the design or operation of internal control over financial reporting which are reasonably likely to adversely affect the registrant’s ability to record, process, summarize and report financial information; and
(b) Any fraud, whether or not material, that involves management or other employees who have a significant role in the registrant’s internal control over financial reporting.
April 27, 2010
/s/ R ICHARD T. O’ BRIEN Richard T. O ’Brien Chief Executive Officer
Exhibit 31.2
CERTIFICATION OF PRINCIPAL FINANCIAL OFFICER (Pursuant to Section 302 of the Sarbanes-Oxley Act of 2002)
I, Russell Ball, certify that:
1. I have reviewed this Quarterly Report on Form 10-Q of Newmont Mining Corporation;
2. Based on my knowledge, this report does not contain any untrue statement of a material fact or omit to state a material fact necessary to make the statements made, in light of the circumstances under which such statements were made, not misleading with respect to the period covered by this report;
3. Based on my knowledge, the financial statements, and other financial information included in this report, fairly present in all material respects the financial condition, results of operations and cash flows of the registrant as of, and for, the periods presented in this report;
4. The registrant’s other certifying officer(s) and I are responsible for establishing and maintaining disclosure controls and procedures (as defined in Exchange Act Rules 13a-15(e) and 15d-15(e)) for the registrant and internal control over financial reporting (as defined in Exchange Act Rules 13a-15(f) and 15d-15(f)) for the registrant and have:
(a) Designed such disclosure controls and procedures, or caused such disclosure controls and procedures to be designed under our supervision, to ensure that material information relating to the registrant, including its consolidated subsidiaries, is made known to us by others within those entities, particularly during the period in which this report is being prepared;
(b) Designed such internal control over financial reporting, or caused such internal control over financial reporting to be designed under our supervision, to provide reasonable assurance regarding the reliability of financial reporting and the preparation of financial statements for external purposes in accordance with generally accepted accounting principles;
(c) Evaluated the effectiveness of the registrant’s disclosure controls and procedures and presented in this report our conclusions about the effectiveness of the disclosure controls and procedures, as of the end of the period covered by this report based on such evaluation; and
(d) Disclosed in this report any change in the registrant’s internal control over financial reporting that occurred during the registrant’s most recent fiscal quarter (the registrant’s fourth fiscal quarter in the case of an annual report) that has materially affected, or is reasonably likely to materially affect, the registrant’s internal control over financial reporting; and
5. The registrant’s other certifying officer(s) and I have disclosed, based on our most recent evaluation of internal control over financial reporting, to the registrant’s auditors and the audit committee of the registrant’s board of directors (or persons performing the equivalent functions):
(a) All significant deficiencies and material weaknesses in the design or operation of internal control over financial reporting which are reasonably likely to adversely affect the registrant’s ability to record, process, summarize and report financial information; and
(b) Any fraud, whether or not material, that involves management or other employees who have a significant role in the registrant’s internal control over financial reporting.
April 27, 2010
/s/ R USSELL B ALL Russell Ball Chief Financial Officer
Exhibit 32.1
CERTIFICATION PURSUANT TO 18 U.S.C. SECTION 1350 (Pursuant to Section 906 of the Sarbanes-Oxley Act of 2002)
In connection with the Quarterly Report on Form 10-Q for the quarter ended March 31, 2010 of Newmont Mining Corporation (the “Company”) as filed with the Securities and Exchange Commission on the date hereof (the “Report”) and pursuant to 18. U.S.C. Section 1350, as adopted pursuant to Section 906 of the Sarbanes-Oxley Act of 2002, I, Richard T. O’Brien, Chief Executive Officer of the Company, certify, that to my knowledge:
1. The Report fully complies with the requirements of Section 13(a) or 15(d) of the Securities Exchange Act of 1934, as amended; and
2. The information contained in the Report fairly presents, in all material respects, the financial condition and results of operations of the Company.
April 27, 2010
Note: A signed original of this written statement required by Section 906 has been provided to the Company and will be retained by the Company and furnished to the Securities and Exchange Commission or its staff upon request.
/s/ RICHARD T. O’BRIEN Richard T. O ’Brien Chief Executive Officer

Exhibit 32.2
CERTIFICATION PURSUANT TO 18 U.S.C. SECTION 1350 (Pursuant to Section 906 of the Sarbanes-Oxley Act of 2002)
In connection with the Quarterly Report on Form 10-Q for the quarter ended March 31, 2010 of Newmont Mining Corporation (the “Company”) as filed with the Securities and Exchange Commission on the date hereof (the “Report”) and pursuant to 18. U.S.C. Section 1350, as adopted pursuant to Section 906 of the Sarbanes-Oxley Act of 2002, I, Russell Ball, Chief Financial Officer of the Company, certify, that to my knowledge:
1. The Report fully complies with the requirements of Section 13(a) or 15(d) of the Securities Exchange Act of 1934, as amended; and
2. The information contained in the Report fairly presents, in all material respects, the financial condition and results of operations of the Company.
April 27, 2010
Note: A signed original of this written statement required by Section 906 has been provided to the Company and will be retained by the Company and furnished to the Securities and Exchange Commission or its staff upon request.
/s/ RUSSELL BALL Russell Ball Chief Financial Officer