new york state workforce development system york state workforce development system ... project will...
TRANSCRIPT

1
New York State Workforce Investm
ent Act Annual Report for Program Year 2015
New York StateWorkforce Development SystemAnnual Report
2015

New
York
Stat
e Wor
kfor
ce In
vest
men
t Act
Annu
al Re
port
for P
rogr
am Ye
ar 20
15
2

3
New York State Workforce Investm
ent Act Annual Report for Program Year 2015
Contents
Introduction ..............................................................................................1
Regional Workforce Planning .......................................................2
Consolidated Funding Application .................................... 2
WIOA Regional Planning ...................................................... 2
Participant Levels And Performance .........................................5
Common Measures Performance ....................................... 5
Customer Service Indicators ................................................ 6
Career Center Services ...................................................................... 7
Job Seeker Services ................................................................7
Businesses Engagement ...................................................... 12
State Workforce Investment Board .......................................... 14
New York State Combined State Plan ........................................ 14
Building System Capacity ................................................................. 15
New York State Workforce Innovation and Opportunity Act Annual Report for Program Year 2015

New
York
Stat
e Wor
kfor
ce In
vest
men
t Act
Annu
al Re
port
for P
rogr
am Ye
ar 20
15
4

1
New York State Workforce Investm
ent Act Annual Report for Program Year 2015
INTRODUCTIONWorkforce Innovation and Opportunity Act (WIOA) implementation was the primary emphasis for Program Year 2015. The State is working toward a more unified workforce development system that is regionally coordinated and programmatically seamless, delivering workforce training, business services, and statewide job linkages to all New Yorkers.
Statewide Implementation focused on three components.
1. Governance – Administering programs in a seamless system that is coordinated with regional sector-based workforce strategies that align with New York State (NYS) Regional Economic Development Council (REDC) strategic planning.
2. Service Delivery – Meeting the needs of businesses through public-private sector partnerships with education, labor, government, and the community. In addition, giving priority to removing barriers to employment for special populations such as individuals with disabilities, veterans, the formerly incarcerated, disconnected youth, adults with limited literacy or English language proficiency who lack a High School Equivalency (HSE), New Americans including immigrants and refugees, and others.
3. Accountability – Using meaningful performance metrics to support evidence-based and data-driven workforce investments and decisions, and accountable and transparent programs. This includes alignment of technology, metrics, and data systems across programs.
Implementation is driven by a New York State Workforce Investment Board (SWIB) which better aligns with REDCs and focuses on job growth in the state. The SWIB membership is fully briefed on WIOA responsibilities and has organized itself into committees to assist in the important work of recommending state policy. Additionally, the 2016-2019 WIOA Combined State Plan was developed in conjunction with the SWIB and the WIOA Interagency Workgroup, a sub-committee of the Aligning Workforce Program committee made up of the WIOA Core partners.
New York State is proud to be the recipient of grant monies which support the important efforts of the workforce system:
• Reemployment Services and Eligibility Assessment Program (RESEA) – a $20 million award to modify the NYS Reemployment and Eligibility Assessment (REA) program.
• Job-Driven National Emergency Grant (NEG) Award – a $6,175,000 award to fund work-based training programs and employment tools which has been extended through June 30, 2017.
• Sector Partnership NEG (SP-NEG) – A $7 million award devoted to regional planning activities consistent with the development of sector strategy and partnership development.
• NYS Disability Employment Initiative (DEI) – Round 6 Grant ($2.5 million) which builds upon best practices from Rounds 1 and 4. The focus is on Pathways to Employment, enabling individuals with disabilities to obtain the skills and credentials necessary to achieve living-wage employment in high-growth fields including healthcare, technology and manufacturing.
New
York
Stat
e Wor
kfor
ce In
vest
men
t Act
Annu
al Re
port
for P
rogr
am Ye
ar 20
15
2
• Short Time Compensation Program and Promotion Grant - $4 million award to inform businesses of the benefit of the program and increase enrollment in the Shared Work program.
• Apprenticeship Awards – a two year, $200,000 award under the USDOL Accelerator Grant.
REGIONAL WORKFORCE PLANNINGNew York State continues to align WIOA regional planning with the Governor’s Regional Economic Development Council (REDC) Strategic Planning Initiative implemented in 2011. REDCs are public-private partnerships made up of local experts and stakeholders from business, academia, local government, labor, and non-governmental organizations. REDC strategic plans and general information on the REDCs are available at http://regionalcouncils.ny.gov/.
Through the REDC competitive process, a total of over $3.65 billion was awarded from 2011 through 2015. Another $750 million will be available in 2016. The Governor also awarded an additional $1.5 billion through the Upstate Revitalization Initiative (URI), part of an overall program aimed at systematically revitalizing the economy of Upstate New York, to the Central, Finger Lakes, and Mohawk Valley regions ($500 million each).
Consolidated Funding Application The NYS Consolidated Funding Application (CFA) is another mechanism to make funding available under the REDC Strategic Planning Initiative. The CFA is a unique collaboration across State agencies where each agency identifies grant solicitations to support regional economic development, and entities apply for one or more grants through a single application. The 2016 CFA involved 11 state agencies including the NYS Department of Labor.
NYSDOL’s part in the CFA was to make state-level WIOA funds available to support four types of training initiatives: the Existing Employee Program to train incumbent workers in specific occupational skills that lead to job retention and/or advancement in middle-skills occupations; the New Hire Program to train dislocated workers who require on-the-job training upon being hired; the Unemployed Worker Program to provide occupational skills training to dislocated workers to prepare them for full-time jobs needed by businesses in the region; and the Special Populations Program to provide occupational skills training, job retention and placement, career development, and supportive services to dislocated workers with additional barriers to employment. Businesses could apply for any or all of these programs, depending upon their needs. In the 2015 CFA program, NYSDOL made 91 awards totaling $6.33 million to train 7,777 workers. Over the entire five years of the CFA, NYSDOL has made 443 awards totaling $26 million to train 29,844 workers.
WIOA Regional Planning NYS has been conducting regional workforce planning with Local Workforce Development Boards (LWDBs) over the past three years. For 2016 WIOA Regional Planning, NYSDOL required LWDBs to highlight sector-based workforce partnerships to assist REDCs with regional workforce needs in the 2016 REDC Progress Reports. The following presents examples from current WIOA regional planning partnerships.

3
New York State Workforce Investm
ent Act Annual Report for Program Year 2015
New York CityThe New York City (NYC) region is unique in that it is a single LWDA, but provides approximately half of the WIOA participants in the State. The Regional Plan for NYC identifies several priority industries that represent half the jobs available in the Region. They are: Healthcare; Technology; Industrial/Manufacturing; Foodservice; Construction; and Retail. Key projects include:
• New York Alliance for Careers in Healthcare (NYACH) – Provides industry-informed training programs that target the ambulatory care, acute care, home care, and nursing and residential facility care subsectors that reflect the changing workforce and training needs of local healthcare employers as a result of the federal Affordable Care Act and the State’s Medicaid Redesign.
• Tech Talent Pipeline (TTP) – Launched in May 2014, participants are enrolled in programs that test a variety of objectives, such as demonstrating the effectiveness of non-traditional educational paths (i.e. accelerated boot camps) in fulfilling high-demand occupations like Web Development, Mobile Development, and Server and Cloud Administration, creating access for incumbent workers without tech experience to fill entry level Data, IT, and QA opportunities, and increasing the competitiveness of CUNY graduates through additional technical support and internships for local tech positions in software engineering
In addition to these two well established projects, the NYC Regional plan identifies industry partnerships in the initial phase of development. These projects include partnerships focused on:
• Food service – The goal is to convene an advisory board of businesses representative of the various sub-sectors of food service such as fine dining, quick service, and catering to develop new and innovative form of training that combines work-based learning with the necessary classroom skills and certificates (including the Food Handlers certificate).
• Construction – An advisory board of construction firms and unions representing organized labor and other local stakeholders will be convened to help shape solutions related to equity of access to career pathways in the unionized skilled trades; safety; and up-skilling. The Industry Partnership will also work with sector stakeholders to re-imagine/re-brand the image of the industry to attract a greater diversity of workers, including younger workers.
• Retail – The retail partnership includes national/international chains with a wide range of products (department or general merchandise stores), national/international specialty chains (appliances and electronics, office supplies, etc.), small specialty chains, and small independent specialty stores. The focus will be on creating formal paths for advancement, supporting equity of access to advancement opportunities, and a model for understanding skills applicable inside and outside of the sector.
New
York
Stat
e Wor
kfor
ce In
vest
men
t Act
Annu
al Re
port
for P
rogr
am Ye
ar 20
15
4
Long IslandThe Long Island Region has identified key priority sectors including: Manufacturing; Technology; Health care and Social Assistance; Agriculture and Aquaculture; and Leisure and Hospitality. Regionally significant projects sited in the plan include:
• The LI STEM Hub has brought together employers, government agencies, and existing workforce collaborations to support education and training programs in forming industry council groups that have been successful particularly in the health care sector.
• The EngINE initiatives at Hofstra and Stony Brook University have enhanced engineering education at both universities through facilities improvement, hiring faculty and increasing capacity. Students who decide to pursue undergraduate degrees in STEM fields have their choice of programs that will prepare them for jobs with innovative businesses in the region.
There are numerous formal and informal business partnerships that support the regional workforce planning in Long Island. The LWDBs are represented on a variety of business associations and consortia that work together to support workforce planning in the region. Representatives network for job opportunities, publicize WIOA funded business services, increase Career Center visibility, and identify opportunities to collaborate on projects that are important to the region’s economic development efforts. Such partnerships include, but are not limited to:
• Partners in the Long Island Manufacturing Strategies Initiative meet with local companies in order to better understand hiring trends/needs. Once the labor shortage and corresponding skills have been identified, local employers drive the training content of a curriculum to prepare individuals for entry level opportunities. Thus, curriculum development will incorporate the proficiencies from local business, education and the workforce system, encouraging a strong partnership.
• LWDB members and Career Center staff are active on several Hauppauge Industrial Association (HIA) sub-committees; and
• LWDBs work in partnership with the Long Island Association (LIA) as well as Aerospace and Defense Diversification Alliance in Peacetime Transition (ADDAPT). LIA supports growth, economic development and infrastructure investments in order to create employment opportunities while strengthening the region’s business community. ADDAPT is an organization representing local aerospace and defense manufacturers which is also in alliance with LIFT, the HIA and the LWDBs to promote technology-based industries.
Western NYLWDBs in the Western Region are committed to working closely with all partners. Regional industry concentrations include: Advanced Manufacturing, Hospitality/Tourism, Energy and Life & Health Sciences. These sectors continue to have job opportunities as well as projected forecasts for future demand. This region has many key projects under development which include:
• The WNY Hotspot, which is a consortium of regional business development organizations leveraging University at Buffalo’s award-winning technology incubator to enhance and improve the business climate in the region. The WNY Hot Spot will impact 20 regional colleges and universities, allowing

5
New York State Workforce Investm
ent Act Annual Report for Program Year 2015
their students enhanced access to entrepreneurship opportunities. This project will tie together the diversity of the region with a proven metrics-driven process to ensure students and entrepreneurs have the opportunity for success in starting new businesses.
• The Buffalo and Erie WDB was awarded a second 5 year grant by the Administration for Children and Families, the U.S. Department of Health and Human Services. This grant provides TANF and other low-income individuals the opportunity to obtain training for healthcare occupations that are in high demand, thus addressing the need for health care workers in Western New York. The focus is on training for: LPN, Medical Secretary, Community Health Worker, Pharmacy Technician, C.N.A., R.N, Physical Therapy Assistant and other demand driven occupations. According to NYSDOL’s Labor Market Analyst in WNY, there are 700 job openings in health care in Erie County on any given day. The grant runs until September 29, 2020 so ample progress should be made toward addressing the need for health care workers.
• Hospitality and Tourism Center – Niagara Community College will renovate 90,000 square feet, including equipment for a world class center for training in hospitality, tourism and culinary arts along with an incubator and small business center to support growth of new tourism/culinary businesses.
• Solar City, the country’s # 1 full service solar provider, is working with stakeholders to develop an educational pathway into employment. Educational partners include Erie Community College, where a certification course is being developed to prepare job seekers for careers in solar energy. Solar City is also a partner in Pathways in Technology Early College High School (P-Tech), along with the Buffalo Public School District. Through this collaboration, high school students at South Park High School will be educated about the solar industry and earn an associate’s degree at Erie Community College following high school graduation. These students will also be first in line for a manufacturing position with Solar City.
PARTICIPANT LEVELS AND PERFORMANCE For PY 2015 (July 1, 2015 – June 30, 2016), our preliminary data indicates participant levels for Adult and Dislocated Worker (DW) programs were 476,624 and 179,266 respectively. This reflects an increase in the Adult participant levels of approximately 40%, and an decrease in DW participant levels of approximately 17% from PY 2014. Under the Youth Program, 8,978 have been served, which is a decrease from PY 2014 of approximately 6%. These figures are based on reported participant levels included in the WIA Standard Record Data (WIASRD) Reports.
Common Measures PerformanceAs a whole, New York State passed all nine Common Measures. However, 10 local areas failed 13 Common Measures in PY 2015, as follows.
• Albany/Rensselaer/Schenectady: Youth Literacy and Numeracy Gains.
• Cayuga/Cortland: Youth Literacy and Numeracy Gains.
• Ontario/Seneca/Wayne/Yates: Youth Literacy and Numeracy Gains.
• Hempstead/Long Beach: Youth Literacy and Numeracy Gains.
• Putnam/Westchester: Youth Literacy and Numeracy Gains.

New
York
Stat
e Wor
kfor
ce In
vest
men
t Act
Annu
al Re
port
for P
rogr
am Ye
ar 20
15
6
• Sullivan: Youth Placement in Employment or Education, Youth Attainment of a Degree or Certificate, and Youth Literacy and Numeracy Gains.
• Yonkers: Youth Literacy and Numeracy Gains.
• Jefferson/Lewis: Youth Literacy and Numeracy Gains.
• Tompkins: Youth Attainment of a Degree or Certificate and Youth Literacy and Numeracy Gains.
• Erie: Youth Attainment of a Degree or Certificate.
PY2015 was the last year that the Common Measures will be used to monitor program performance and as such, technical assistance will be focused on the Primary Indicators of Performance for PY16 rather than requiring performance improvement plans for the Common Measures.
Customer Service IndicatorsCustomer Service Indicators (CSIs) were implemented in 2007 and are designed to move the Career Center System in New York toward specific goals that align with state workforce priorities and/or that assist local areas in meeting Common Measure performance goals. Since 2007, NYSDOL implemented a variety of CSIs to reflect customer service priorities. In PY 2015, CSIs covered the following priorities.
• Initial Assessment – The goal for this indicator is for 95% or more of all customers who receive staff-assisted services to receive an initial assessment service. NYSDOL feels it is important to assess a customer’s skills, needs, and desires as soon as possible to deliver services effectively.
• Employability Profile – Collect all of the information required for a successful job search, Including job history, education level, and occupational goals. The participant’s JobZone account is also updated with the profile information, expediting the job search process.
• Job Search Ready Services (JSRS) Referral – As the economy improves the NYSDOL’s focus shifts from career development to a quick turnaround on the delivery of job referrals. This measure states that all newly enrolled JSRS customers must receive a job referral within 5 business days of their initial assessment.
• JSRS JobZone Resume Search – All JSRS customers should have a resume uploaded into JobZone and use the resume based search technology to improve the quality of their job search results. This also serves the purpose of creating a more robust Talent Bank for business customers to find potential candidates.
• CareerZone Portfolio – Provide youth participants with quality services through the completion of a CareerZone Portfolio. The information in the portfolio can help guide the career planning and/or job search for the youth participants. The modules also fulfill the required Labor Market Information and Financial Literacy Education youth program elements.
• Training on Regional Priority Occupations List – This measure assesses whether training supported through Individual Training Accounts (ITAs) leads to occupations on the Regional Priority Occupations list. This measure encourages LWIAs in the same region to coordinate and communicate to effectively find employment for their customers in high demand occupations.
7
New York State Workforce Investm
ent Act Annual Report for Program Year 2015
• Business Job Referral Follow Up – The highest level of service a business customer can receive is for business engagement staff to take a job order from them directly and refer specific participants who are likely to suit the businesses needs. This measure ensures that these business customers receive follow up from staff so that their needs continue to be met.
CAREER CENTER SERVICESJob Seeker Services
Information Technology IntegrationNYSDOL’s online career planning systems, CareerZone and JobZone (www.careerzone.ny.gov; www.jobzone.ny.gov) are now the self-service customer interface for the One-Stop Operating System (OSOS) case management system. The integration between JobZone and OSOS ensures that the right data and information is available to both the job seeker and the workforce system at every point in the service delivery cycle. Customers have access to a greater array of online self-service options and have these activities documented appropriately in their OSOS records. Customers can record their work search efforts in JobZone, create weekly work search reports, track their activities and keep their business contacts safe and secure in one self-service location which staff can access and provide appropriate assistance as needed. The following are technical tools that NYSDOL employs with customers.
• Integrated Workforce Registration – All job seekers, including UI claimants, register through the same online portal, which collects the information required for both UI and Employment Service registration. This improves customer service and efficiency while reducing data entry duplication.
• Self Service Modules – Job Seekers are provided with a personalized landing page after registration which integrates JobZone, Two-Way Communication (a secure email system), and the UI Benefits System. JobZone is a self-service tool that serves as a virtual Career Center. The application stores job searches, work search history, labor market information, Career Center Locations, resumes, career exploration activity, contact information and the employability score. JobZone is also fully integrated with OSOS. UI recipients can also file their claims, track work search records, and receive tax documents from within this service.
• Real Time Triage – Within the JobZone application there is also a Live Chat component in which users can interface in real time with Career Center staff. Staff can provide assistance and referrals to services that include (but are not limited to): JobZone technical assistance, career development assistance, resume preparation assistance, job search assistance, local Career Center location assistance and work search history assistance.
• Social Media Tools and Mobile Applications – To better connect unemployed job seekers with employment opportunities, NYSDOL will continue to explore strategies to create a Virtual Career Center where job seekers can connect with a multitude of Career Center services online. In addition to JobZone virtual services currently include live chat with career counselors, virtual job fairs, direct link to the NYS Job Bank, resume development support, and a large array of job seeker services. NYSDOL purchased online video interviewing software that allows jobseekers to conduct practice interviews online via video. This product can also

New
York
Stat
e Wor
kfor
ce In
vest
men
t Act
Annu
al Re
port
for P
rogr
am Ye
ar 20
15
8
be used as a recruitment tool to conduct video interviews. NYSDOL would serve as the conduit between the business and the job seeker by providing the tool as a resource for interviews.
• New York Employment Services System (NYESS) – Revolutionizes employment supports for New Yorkers with disabilities and generates funding for disability-related employment services and supports. NYESS was developed using the New York State Medicaid Infrastructure Grant, New York Makes Work Pay, as the catalyst, and is administered as a joint effort of NYSDOL as the state lead agency for workforce services and the Office of Mental Health (OMH) as the lead agency for the Medicaid Infrastructure Grant.
NYESS provides system access to the following six State agencies and their network of service providers: OMH; the Office of People with Developmental Disabilities; Adult Career and Continuing Education Services – Vocational Rehabilitation; the Commission for the Blind; the Office of Alcohol and Substance Abuse Services; Office for the Aging; and Division of Veteran’s Affairs. In addition, since February 2012, NYESS has operated as the statewide Administrative Employment Network (EN) providing the ability to document employment outcomes for individuals with disabilities participating in the Ticket to Work program.
Reemployment Services and Eligibility AssessmentThe Reemployment Services and Eligibility Assessment (RESEA) program, formerly known as REA- Reemployment and Eligibility Assessment, is framed around four major customer service principles intended to provide intensive case management and a heightened level of services to Unemployment Insurance claimants – expeditious entry to the Workforce Development Career Center system, assessment/identification of needs, individual reemployment plans, and continuous engagement.
The current RESEA program operates in 65 select Career Center locations in all 33 Local Workforce Development Areas and all 10 economic development regions of New York State. The program design has been shown to increase RESEA participants’ competitive advantage by returning claimants to work earlier than non-RESEA claimants. This reduces the average duration of their UI claim resulting in a savings to the UI Trust Fund. New York State received the largest share of RESEA federal grant dollars in the country for the past seven years. New York received just over $20 million in grant year 2016, which runs January 1, 2016 until December 31, 2016.
Services to Veterans Veterans’ services in New York are delivered through the Career Centers either under priority of service or the Jobs for Veterans State Grant (JVSG). Seventy-two (72) Disabled Veteran Outreach Program specialists (DVOPs) and Local Veterans Employment Representatives (LVERs) funded through the JVSG are located in Career Centers throughout the state. The Career Center system ensures veterans receive priority of service as provided in guidance issued by NYSDOL in 2012 and 2016 (http://labor.ny.gov/workforcenypartners/ta/ta12-12-4-veterans-priority-of-service.pdf).

9
New York State Workforce Investm
ent Act Annual Report for Program Year 2015
DVOP Specialist Service Model to JVSG VeteransOn April, 2014 the United States Department of Labor’s (USDOL) Employment and Training Administration (ETA) and Veteran’s Employment and Training Service (VETS) released joint guidance from each agency providing information on the refocused roles and responsibilities for JVSG DVOP specialists and LVER staff. As a result of the refocusing, DVOP specialists only serve those veterans and eligible spouses with significant barriers to employment (SBE), ages 18-24 and other veterans as defined by the Secretary of Labor, therefore reducing their caseload. Those not eligible to meet with a DVOP are served on a priority basis by other Career Center staff. LVER staff’s primary functions are to conduct job matching, job placement and business outreach on behalf of all veterans served by their Career Center. Due to the USDOL policy, LVER staff members no longer provide one-on-one services to veterans.
The DVOP specialist service model provides early intervention; services tailored to individual veteran needs, and expedited referral of veterans who need additional assistance to services available within the workforce system.
Through a continuous engagement of one-on-one appointments and between appointment contacts, veteran customers receive an Initial Assessment, Comprehensive Assessment, and job search support by a DVOP specialist. The veteran is provided with resume assistance, career guidance/coaching, job leads, and referrals.
Case ConferenceIf the veteran is not successful in finding a job after the second appointment, a staff case conference is held, whether the veteran was served by a DVOP specialist or Career Center Staff, to determine the job readiness of the veteran in the current labor market. This case conference occurs within four weeks of the veteran’s second appointment and serves to inform the type and intensity of services to be delivered at subsequent appointments. The Case Conference will include, at a minimum, office manager/supervisor, veteran program staff (DVOP specialist and LVER), an employment counselor, and any other applicable Career Center staff.
The outcome of the Case Conference is a plan of service to make the veteran more competitive in the labor market. The nature of the services for subsequent appointments will be outlined in the plan of service developed at the discretion of the Career Center staff during the Case Conference. Veterans may be encouraged to attend training to enhance their skills to broaden the range of opportunities available to them. If significant employment barriers related to behavioral health are identified, veterans will be referred to appropriate local services. If vocational rehabilitation is identified as a need, veterans will be referred to the United States Department of Veterans Affairs Vocational Rehabilitation and Employment program (VR&E).
Local Veterans’ Employment RepresentativeLVER staff members are qualified veterans who provide services consistent with their roles and responsibilities as mandated in the Jobs for Veterans Act and refocusing guidelines. LVER staff members specialize in advocating on behalf of veterans with business, industry, and community organizations to promote employment and training opportunities for veterans. They often work in conjunction with other Career Center staff, including DVOP specialists to

New
York
Stat
e Wor
kfor
ce In
vest
men
t Act
Annu
al Re
port
for P
rogr
am Ye
ar 20
15
10
promote the skills and strengths that veterans bring to the civilian workforce. LVER staff members play an important role in assisting with the development of the service delivery strategies for veterans in their assigned Career Centers, as well as educating all Career Center partner staff with current employment initiatives and programs for veterans. Some of the daily activities of the LVER include, job matching and job placement for veterans serviced by their Career Center, planning and participating in job fairs, conducting employer outreach, informing Federal contractors of the process to hire qualified veterans, promoting credentialing and licensing opportunities for veterans, and in conjunction with employers, conducting Job Search and LMI workshops.
Metrics for JVSG ProgramWeekly DVOP and LVER reports are run. The DVOP report outlines how many DVOP appointments were scheduled from the UI Download, how many DVOP follow-up appointments were attended, and the total number of case conferences held. The LVER report shows the number of business and veteran customers served, total business outreaches conducted, job developments, job orders matched, job referrals, workshops conducted and the number of veterans placed.
Monthly DVOP reports are received from the One Stop Operating System (OSOS) Unit detailing program performance for services to veterans at the LWIA, office, and individual staff member level. This report details veteran appointment information, services provided, number of veterans served, exiter data, and entered employment rates.
Quarterly reports are received from the Research and Statistics Unit which are generated per specific parameters defined by USDOL. The ETA 9002 Reports and the VETS 200 Reports detail the veteran, eligible persons, and transitioning service member demographics, employment and wage data, and services received statewide.
Services to Post 9/11 VeteransUnder the Gold Card Initiative, post 9/11 veterans seeking services are offered both intensive services and case management for up to six months from their initial service. Post 9/11 veterans not using services through the Gold Card Initiative still have available to them the full range of services offered through the Career Centers. Staff assisted services begin with an Initial Assessment to determine the level and types of services that would be most beneficial to the customer. These services include career counseling, resume and job search assistance, federal resume assistance, interviewing skills, and various workshops. The vast majority of post 9/11 veterans (over 90%) receive staff assisted services through the Career Centers in New York. New York State issued policy regarding the Gold Card program to the Career Center system in December 2011 (http://labor.ny.gov/workforcenypartners/ta/TA11-15-1-Gold-Card-Services.pdf ).
Service to Veterans Undergoing Vocational Rehabilitation and EmploymentNew York State has a Memorandum of Understanding (MOU) with USDOL VETS and the US Division of Veterans Affairs (VA) to provide job search assistance to those veterans completing vocational rehabilitation and employment under Chapter 31. Under this MOU, a DVOP specialist or Career Center staff provides case management and employment services to assist veterans in finding employment once they have completed training. Department of Labor Intensive Services Coordinators provide VA counselors with monthly case management
11
New York State Workforce Investm
ent Act Annual Report for Program Year 2015
updates on each veteran, ensuring that the services provided by the VA and the services provided by the DVOP specialist or Career Center staff are coordinated and complementary.
Services to Returning National Guard MembersCareer Centers serve as an integral part of the reintegration of returning National Guard members. JVSG-funded staff participate in all facets of the Yellow Ribbon program. Services begin at the pre-deployment event where service members are made aware of the services available to them. They are provided information on how to access services while deployed. Deployed service members can receive resume assistance via email and be enrolled in the JobZone system to obtain job leads by email. When service members return, they are provided with information on services at the demobilization site and asked to complete an employment screening questionnaire to determine their status following release from active duty. Those that are unemployed, underemployed, or attending school are contacted by the closest Career Center. At the 30-day post deployment Yellow Ribbon event, each transitioning service member in need of intensive services may meet with a DVOP specialist or Career Center staff member to conduct a one-on-one employment assessment. During this assessment, the questionnaire is reviewed to determine if there have been any changes and to discuss the specifics of each service member’s situation. This information is forwarded to the Career Center to ensure the service member has a strong local connection for employment and training assistance. A career fair is included in the 60- day post deployment event for units with significant numbers of unemployed service members. This career fair is open only to members of the unit and includes businesses whose employment opportunities match as closely as possible with the skills possessed by unit members.
Services to Transitioning Service MembersTransitioning service members typically receive services when they return to New York while on terminal leave from the military and seek out services as a result of the USDOL Employment Workshop, provided as a part of the Transition GPS Program. At Fort Drum, services are also provided through the Army Career and Alumni Program (ACAP). DVOP specialists work in conjunction with ACAP staff to assist transitioning service members in post military career planning. They are provided with information to help them: make educational choices and choices as to which career has the most demand for their skills. They are also provided with assistance on preparing resumes, interview preparation, job search, and transferability of their particular skills, as well as information on how to use Career Center services in the state to which they return.
Experience CountsAs part of the Governor’s Experience Counts Initiative, which helps returning Veterans get jobs in New York, NYSDOL has partnered with the Division of Criminal Justice Services (DCJS), the Department of State (DOS) and the Division of Veterans Affairs to help recently returning Veterans obtain security guard training using their military experience. Eligible Veterans include those that were Army Infantryman and Army Indirect Fire Infantryman, Army CID Specialist, Army Combat Engineer, Army Small Arms Master Gunner, Army Resettlement Specialist (a.k.a. Corrections Specialist), USMC and Army Military Police, Air Force Security Specialist, Navy Master-At-Arms and Naval Corrections Specialist.
New
York
Stat
e Wor
kfor
ce In
vest
men
t Act
Annu
al Re
port
for P
rogr
am Ye
ar 20
15
12
In lieu of the standard DCJS security guard curriculum, which consisted of 8-hour pre-assignment training and 16-hour on-the-job training, NYSDOL created a 2 hour on-line training video. Veterans with the required military experience can complete the online training, take a written test based on the online video, complete an online National Incident Management System (NIMS) training, and become registered with NYS to work as a security guard. There are currently more than 1,384 available security jobs statewide.
NYSDOL has also partnered with the Division of Motor Vehicles (DMV) to make eligible transitioning service members, National Guard members, and recently separated veterans aware of the opportunity to obtain a Commercial Driver License without having to take the road test. This program removes a significant barrier to licensure for individuals with the requisite military training and experience. As of June 30, 2016, DMV granted 1,080 of these waivers.
Businesses Engagement
Business ServicesThrough improved communications with businesses on their specific needs, New York’s Career Center system continues to build on its successful outreach efforts with the business community. Business Service staff are connecting with new and repeat business customers to offer targeted programs and services. By doing so, they have been able to increase the usage of OJT programs and other hiring incentives such as the Work Opportunity Tax Credit, NYS Workers with Disabilities Employment Tax Credit, and the NYS Urban Youth Jobs Program Tax Credit.
Regional Business Services TeamsRegional Business Services Teams are established throughout the State to support alignment of Career Center services to sector initiatives/strategies in the region. This structure brings Wagner-Peyser and business service staff together to discuss common problems and share promising practices. It also allows them to share workforce intelligence and strategies for marketing services, as well as hiring and training incentives for business customers.
On-the-Job Training ProgramsIn PY 2015 New York State operated several OJT programs to provide businesses with incentives to hire target populations such as the long-term unemployed. Not only have these programs enabled New Yorkers to get back to work, they provided businesses with the opportunity to invest in their workforce and remain competitive. These OJT programs are proving to be successful vehicles for workforce development and the response from the business community continues to be very positive.
Jobs ExpressJobs Express is an online database for businesses to post available jobs. Local workforce areas use the Jobs Express system as a lead generation source to grow the state’s database of business customers. For PY 2015, staff contacted more than 30,528 businesses and, since the effort began in December 2012, reached out to 97,124 businesses.

13
New York State Workforce Investm
ent Act Annual Report for Program Year 2015
Customized RecruitmentsCustomized Recruitments are no-cost, targeted events built around the specific needs of each business. Career Center staff search the Talent Bank for candidates that best meet the needs of the business and then set up a meeting where the business can interview these candidates. In PY 2015, 1,628 customized recruitments and 134 career fairs were conducted statewide.
Rapid ResponseNYS experienced a decrease in the number of affected workers impacted by Workers’ Adjustment and Retraining Notifications (WARN) as filed in PY 2015. During PY 2015, NYSDOL received 272 WARN notices impacting 24,210 affected workers. In comparison, during PY 2014, NYSDOL received 361 WARN notices impacting 37,324 affected workers. Additionally, during PY 2015, NYSDOL conducted workforce intelligence and provided Expeditious Response for 228 (non-WARN) layoff events which impacted 11,959 affected workers. This is an increase in comparison with PY 2014, when NYSDOL provided Expeditious Response for 265 (non-WARN) layoff events which impacted 8,291 affected workers.
Shared WorkNew York’s unemployment rate (seasonally adjusted) decreased to 4.7% by June 2016, compared to 5.2% in June 2015. During PY 2015, 552 Shared Work plans were approved to begin and 7,652 participants were registered. This represents an increase of 4% and 7% respectively, when compared on a statewide basis with PY 2014. This experience is illustrated in the Table 1.
Region
Plans Approved to Begin
Projected Number of Workers
Number of Participants
PY 2015 PY 2014 PY 2015 PY 2014 PY 2015 PY 2014
Statewide552 529 17,782 15,110 7,652 5,567
4% 18% 37%
Capital Region 56 47 1,128 842 271 308
Central 50 40 1,582 1,094 557 540
Finger Lakes 87 83 2,876 2,464 1,089 1,004
Mid-Hudson 45 48 630 542 173 210
Long Island 68 71 1,045 1,478 345 360
Mohawk Valley 36 41 2,010 1,914 745 625
New York City 43 44 956 906 391 450
North Country 20 17 731 472 443 300
Southern 43 42 2,967 2,528 1,063 781
Western 99 84 3,765 2,325 2,194 853
Address Unknown 5 12 92 545 381 136 Note: The numbers for PY 2014 are revised to capture the online plans not originally captured in the database.
In addition, USDOL awarded NYSDOL a $4 million Short Time Compensation Program and Promotion Grant in 2014 to: promote enrollment activities; implement and/or improve administration; and create awareness regarding Shared Work.

New
York
Stat
e Wor
kfor
ce In
vest
men
t Act
Annu
al Re
port
for P
rogr
am Ye
ar 20
15
14
STATE WORKFORCE INVESTMENT BOARDThe State Workforce Investment Board (SWIB) has been fully appointed by the Governor, a chairperson is actively engaged and meetings are convened regularly. The Board has been primarily tasked with supporting efforts of the State’s REDC Strategic Planning Initiative, and guiding WIOA implementation. The SWIB is organized into six committees chaired by business membership, as follows.
• Executive Committee – To oversee the other five subcommittees and ensure that the SWIB as a whole is addressing the various requirements of WIOA.
• Aligning Workforce Programs – Comprised of Executive staff from partner agencies (ESD, OTDA, SED, DOL, OCFS, and SUNY) to focus on interagency coordination of services and ensure all agencies meet requirements under WIOA.
• Communications and Improving Regional Planning – To improve communication between the LWDBs, REDCs, and the SWIB, and ensure optimal workforce planning and coordination.
• Education and Credentials – To help ensure education and credentials are demand-driven and industry-recognized. They also focus on the development of career pathways.
• Significant Industries – To evaluate the needs of significant industries across the State and helping to foster connections with business intermediaries and support sector strategies.
• Outcomes and Metrics – To help ensure the State meets reporting requirements under WIOA and to evaluate performance results to identify best practices or areas for improvement.
NEW YORK STATE COMBINED STATE PLANNew York State prepared a Combined State Plan which included the WIOA core programs and the TAA program. The Plan was prepared by the state agencies that administer these programs (NYSDOL, NYS Education Department, and Office of Child and Family Services, Commission for the Blind) under guidance of the SWIB, Aligning Workforce Programs Committee. It serves as the State’s vehicle to outline its vision of the workforce development system and how it will align and integrate the workforce development system to achieve four goals:
• Align and integrate federal education, employment, and training programs;
• Guide investments to ensure services meet the needs of businesses and job seekers;
• Apply consistent, job-driven strategies across all relevant federal programs; and
• Engage economic, education and workforce partners.
The draft NYS Combined Plan was submitted to the federal government on April 1, 2016. The Plan was approved, contingent upon minor modifications. The Final Combined State Plan was submitted to the federal government on August 31, 2016, and will be amended within two years.

15
New York State Workforce Investm
ent Act Annual Report for Program Year 2015
BUILDING SYSTEM CAPACITYThe Department continues to provide training and capacity-building activities to the State’s workforce system. Training opportunities are provided to all levels of workforce professionals, from state and local board members to front-line direct service delivery staff in the Career Centers, program providers and stakeholders. Capacity-building activities are delivered through a variety of methods including videoconferencing, conference calls, webinars, online training modules and classroom training.

New
York
Stat
e Wor
kfor
ce In
vest
men
t Act
Annu
al Re
port
for P
rogr
am Ye
ar 20
15
16

17
New York State Workforce Investm
ent Act Annual Report for Program Year 2015
Adult Program Results
Reported InformationNegotiated
Performance Level
Actual Performance Level
Entered Employment Rate 59 64.2 88,069137,201
Employment Retention Rate 81 82.1106,016129,126
Average Earnings $13,401 $13,604 $1,441,657,599105,973
Outcomes for Adult Special Populations
Reported Information
Public Assistance Recipients Receiving Intensive or Training
ServicesVeterans Individuals With
Disabilities Older Individuals
Entered Employment Rate
57.65,896
62.45,810
43.83,935
53.911,198
10,239 9,310 8,989 20,782Employment Retention Rate
78.14,838
81.26,492
76.74,187
80.212,034
6,192 7,991 5,456 15,012
Average Earnings $9,629 $46,509,846 $15,508 $100,567,798 $10,979 $45,935,811 $15,131 $181,982,950
4,830 6,485 4,184 12,027
Outcome Information by Service Level for the Adult Program
Reported Information
Individuals Who Only Received Core Services
Individuals Who Only Received Core and Intensive
ServicesIndividuals Who Received
Training Services
Entered Employment Rate 63.2
45,29964.3
38,01274.6
4,75871,688 59,133 6,380
Employment Retention Rate 80.9 65,208 83.4 34,372 88.4 6,436
80,607 41,235 7,284
Average Earnings $12,840 $837,206,214 $14,809 $508,788,049 $14,917 $95,663,33665,203 34,357 6,413

New
York
Stat
e Wor
kfor
ce In
vest
men
t Act
Annu
al Re
port
for P
rogr
am Ye
ar 20
15
18
Dislocated Worker Program Results
Reported InformationNegotiated
Performance Level
Actual Performance Level
Entered Employment Rate 53.4 62.7 94,064150,132
Employment Retention Rate 82.0 84.1 96,935115,234
Average Earnings $19,587 $19,151$1,855,477,191
96,887
Outcomes for Dislocated Worker Special Populations
Reported Information Veterans Individuals With
Disabilities Older Individuals Displaced Homemakers
Entered Employment Rate
57.44,966
51.22,868
50.415,189
65.61,148
8,646 5,605 30,140 1,751Employment Retention Rate
81.44,886
78.32,868
79.214,972
76.41,067
6,005 3,663 18,913 1,396
Average Earnings $18,104
$88,383,021$14,262
$40,874,688$19,294
$288,645,185$8,140
$8,685,3804,882 2,866 14,960 1,067
Outcome Information by Service Level for the Dislocated Worker Program
Reported Information
Individuals Who Only Received Core Services
Individuals Who Received Only Core and Intensive Services
Individuals Who Received Training Services
Entered Employment Rate 60.1 42,071 64.3 48,391 74.0 3,602
69,986 75,276 4,870Employment
Retention Rate 83.0 56,810 85.5 35,789 88.4 4,33668,449 41,879 4,906
Average Earnings $19,242 $1,093,102,144 $19,420 $694,449,317 $15,724 $67,925,73056,808 35,759 4,320

19
New York State Workforce Investm
ent Act Annual Report for Program Year 2015
Youth (14-21) Program Results
Reported InformationNegotiated
Performance Level
Actual Performance Level
Placement in Employment or Education 70.5 74.03,2114,338
Attainment of Degree or Certificate 65.9 71.1 2,7813,913
Literacy and Numeracy Gains 56.7 54.61,1642,132
Outcomes for Youth Special Populations
Reported Information
Public Assistance Recipients Veterans Individuals With
Disabilities Out-of-School Youth
Placement in Employment or Education
71.2664
100.02
68.5393
69.91,742
932 2 574 2,491Attainment of Degree or Certificate
63.6490
0.00
63.1284
68.21,365
770 0 450 2,002
Literacy and Numeracy Gains 55.2
3150.0
059.4
19054.6
1,164571 0 320 2,132
Other Reported Information
Reported Information
12 Month Employment
Retention Rate
12 Months Earnings Increase
(Adults and Older Youth)or
12 Months Earnings Replacement
(Dislocated Workers)
Placements in
Non-traditional
Employment
Wages at Entry IntoEmployment for Those
Individuals Who Entered
UnsubsidizedEmployment
Entry IntoUnsubsidizedEmployment
Related to the Training Received
of Those WhoCompleted
Training Services
Adults 83.4 117,276 $1,724 $242,018,933 0.0 2 $5,780 $508,546,153 4.5 216140,604 140,374 88,069 87,986 4,758
Dislocated Workers 85.2
107,77987.0
$2,084,543,4600.0
2$8,277
$777,721,2184.8
174126,561 $2,396,125,016 94,064 93,961 3,602
Older Youth 76.0 911 $4,089 $4,436,255 0.2 2 $2,538 $2,702,4371,199 1,085 1,152 1,065

New
York
Stat
e Wor
kfor
ce In
vest
men
t Act
Annu
al Re
port
for P
rogr
am Ye
ar 20
15
20
Participation Levels
Reported Information Total Participants Served Total ExitersTotal Adult Customers 502,629 413,768
Total Adults (self-service only) 139,134 107,019WIA Adults 337,490 272,956WIA Dislocated Workers 179,266 146,949
Total Youth (14-21) 8,978 4,535Younger Youth (14-18) 5,743 2,650Older Youth (19-21) 3,235 1,885Out-of-School Youth 4,734 2,715In-School Youth 4,244 1,820
Cost of Program Activities
Program Activity Total Federal SpendingLocal Adults $39,031,039Local Dislocated Workers $38,695,263Local Youth $40,103,929Rapid Response (up to 25%) WIA Section 134(a)(2)(B) $15,245,063Statewide Required Activities (up to 15%) WIA Section 134(a)(2)(B) $7,484,224
Statewide AllowableActivitiesWIA Section 134(a)(3)
Program Activity DescriptionMiscellaneous $1,827,852Indirect Admin $3,114,699WIOA Implementation $80,871
Total of All Federal Spending Listed Above $145,582,940
21
New York State Workforce Investm
ent Act Annual Report for Program Year 2015
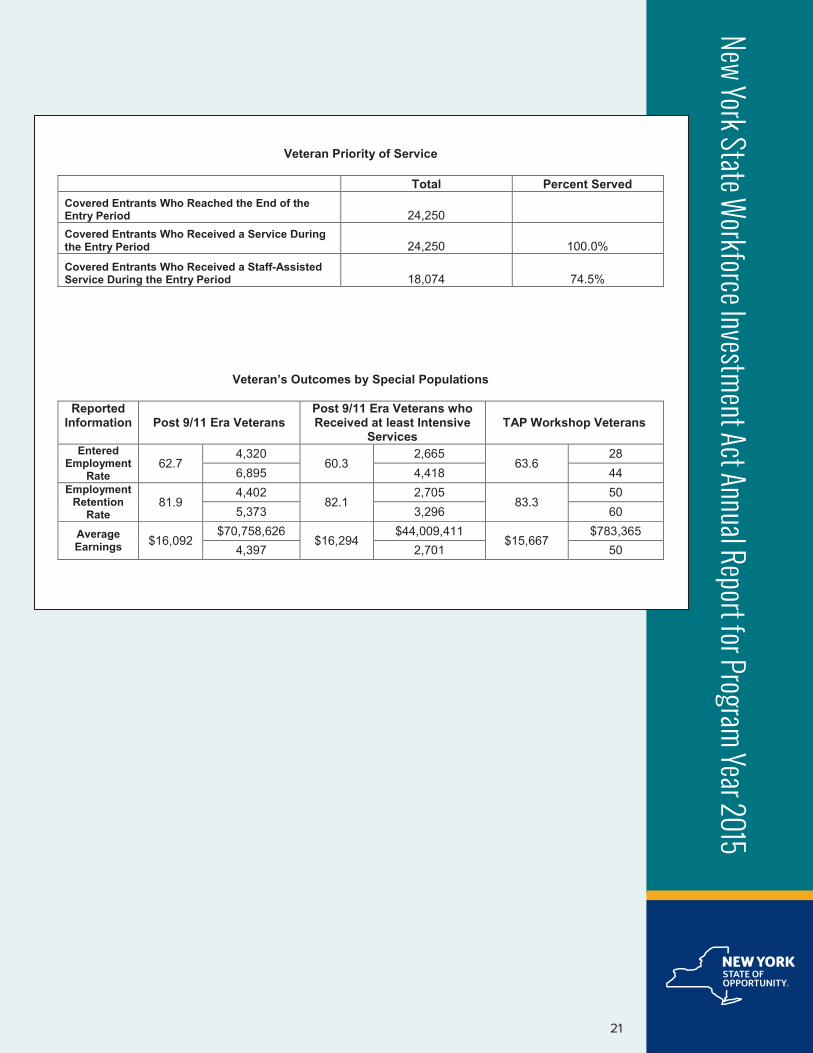
Veteran Priority of Service
Total Percent ServedCovered Entrants Who Reached the End of the Entry Period 24,250Covered Entrants Who Received a Service During the Entry Period 24,250 100.0%Covered Entrants Who Received a Staff-Assisted Service During the Entry Period 18,074 74.5%
Veteran’s Outcomes by Special Populations
Reported Information Post 9/11 Era Veterans
Post 9/11 Era Veterans who Received at least Intensive
ServicesTAP Workshop Veterans
Entered Employment
Rate62.7
4,32060.3
2,66563.6
286,895 4,418 44
Employment Retention
Rate81.9
4,40282.1
2,70583.3
505,373 3,296 60
Average Earnings $16,092
$70,758,626$16,294
$44,009,411$15,667
$783,3654,397 2,701 50
New
York
Stat
e Wor
kfor
ce In
vest
men
t Act
Annu
al Re
port
for P
rogr
am Ye
ar 20
15
22
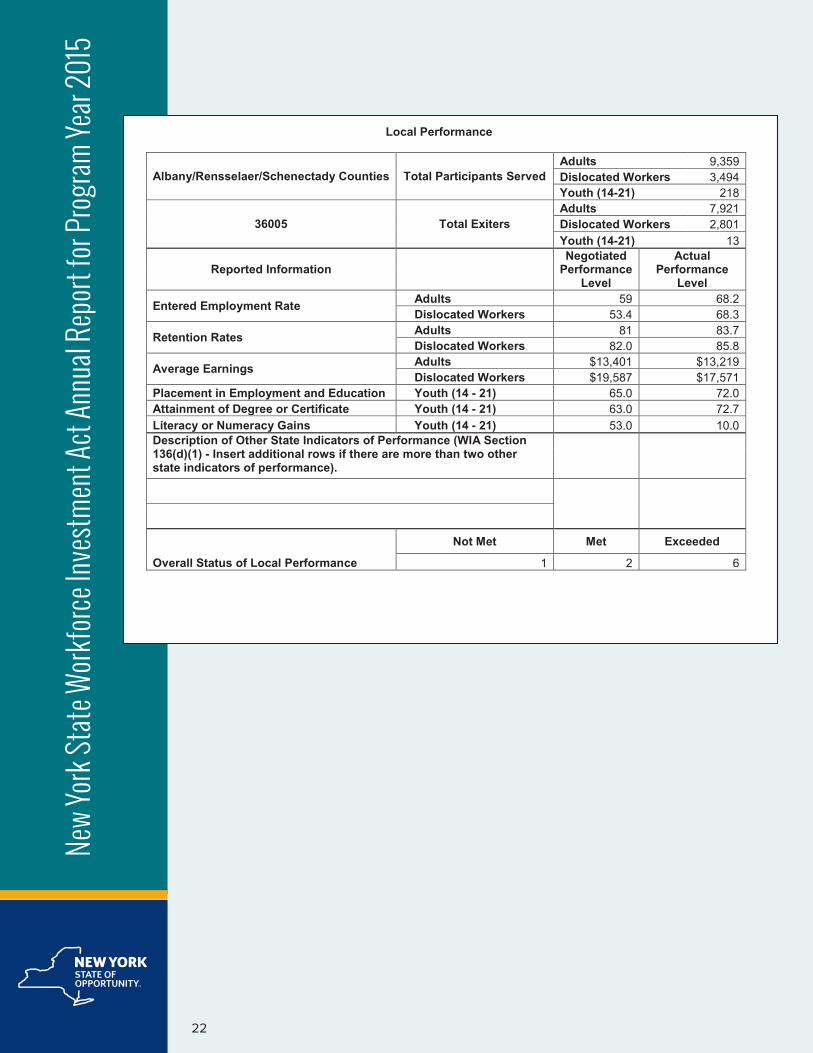
Local Performance
Albany/Rensselaer/Schenectady Counties Total Participants ServedAdults 9,359Dislocated Workers 3,494Youth (14-21) 218
36005 Total ExitersAdults 7,921Dislocated Workers 2,801Youth (14-21) 13
Reported InformationNegotiated
Performance Level
Actual Performance
Level
Entered Employment Rate Adults 59 68.2Dislocated Workers 53.4 68.3
Retention Rates Adults 81 83.7Dislocated Workers 82.0 85.8
Average Earnings Adults $13,401 $13,219Dislocated Workers $19,587 $17,571
Placement in Employment and Education Youth (14 - 21) 65.0 72.0Attainment of Degree or Certificate Youth (14 - 21) 63.0 72.7Literacy or Numeracy Gains Youth (14 - 21) 53.0 10.0Description of Other State Indicators of Performance (WIA Section 136(d)(1) - Insert additional rows if there are more than two other state indicators of performance).
Overall Status of Local Performance
Not Met Met Exceeded
1 2 6
23
New York State Workforce Investm
ent Act Annual Report for Program Year 2015
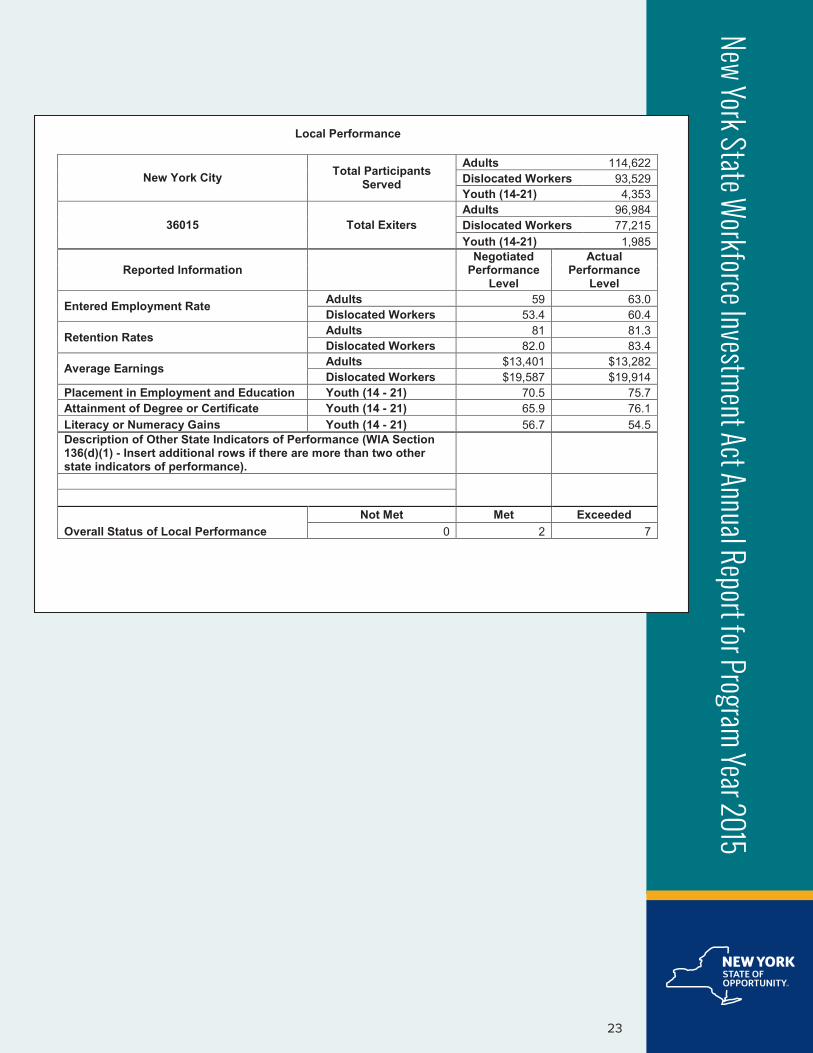
Local Performance
New York City Total Participants Served
Adults 114,622Dislocated Workers 93,529Youth (14-21) 4,353
36015 Total ExitersAdults 96,984Dislocated Workers 77,215Youth (14-21) 1,985
Reported InformationNegotiated
Performance Level
Actual Performance
Level
Entered Employment Rate Adults 59 63.0Dislocated Workers 53.4 60.4
Retention Rates Adults 81 81.3Dislocated Workers 82.0 83.4
Average Earnings Adults $13,401 $13,282Dislocated Workers $19,587 $19,914
Placement in Employment and Education Youth (14 - 21) 70.5 75.7Attainment of Degree or Certificate Youth (14 - 21) 65.9 76.1Literacy or Numeracy Gains Youth (14 - 21) 56.7 54.5Description of Other State Indicators of Performance (WIA Section 136(d)(1) - Insert additional rows if there are more than two other state indicators of performance).
Overall Status of Local PerformanceNot Met Met Exceeded
0 2 7

New
York
Stat
e Wor
kfor
ce In
vest
men
t Act
Annu
al Re
port
for P
rogr
am Ye
ar 20
15
24
Local Performance
City of Yonkers Total Participants ServedAdults 1,174Dislocated Workers 1,999Youth (14-21) 88
36030 Total ExitersAdults 817Dislocated Workers 1,576Youth (14-21) 87
Reported InformationNegotiated
Performance Level
Actual Performance
Level
Entered Employment Rate Adults 59 63.9Dislocated Workers 53.4 62.9
Retention Rates Adults 81 81.8Dislocated Workers 82.0 83.3
Average Earnings Adults $13,401 $16,524Dislocated Workers $19,587 $18,894
Placement in Employment and Education Youth (14 - 21) 69.0 65.0Attainment of Degree or Certificate Youth (14 - 21) 65.9 90.0Literacy or Numeracy Gains Youth (14 - 21) 56.7 44.7Description of Other State Indicators of Performance (WIA Section 136(d)(1) - Insert additional rows if there are more than two other state indicators of performance).
Overall Status of Local PerformanceNot Met Met Exceeded
1 2 6

25
New York State Workforce Investm
ent Act Annual Report for Program Year 2015
Local Performance
Chemung/Schuyler/Steuben Counties Total Participants ServedAdults 5,554Dislocated Workers 2,077Youth (14-21) 129
36045 Total ExitersAdults 4,308Dislocated Workers 1,423Youth (14-21) 58
Reported InformationNegotiated
Performance Level
Actual Performance
Level
Entered Employment Rate Adults 59 66.2Dislocated Workers 53.4 69.0
Retention Rates Adults 81 84.3Dislocated Workers 82.0 85.9
Average Earnings Adults $13,401 $13,694Dislocated Workers $18,134 $14,708
Placement in Employment and Education Youth (14 - 21) 70.5 75.0Attainment of Degree or Certificate Youth (14 - 21) 65.9 70.4Literacy or Numeracy Gains Youth (14 - 21) 56.7 51.4Description of Other State Indicators of Performance (WIA Section136(d)(1) - Insert additional rows if there are more than two other state indicators of performance).
Overall Status of Local PerformanceNot Met Met Exceeded
0 2 7

New
York
Stat
e Wor
kfor
ce In
vest
men
t Act
Annu
al Re
port
for P
rogr
am Ye
ar 20
15
26
Local Performance
Hempstead/Long Beach Total Participants ServedAdults 3,202Dislocated Workers 5,090Youth (14-21) 126
36060 Total ExitersAdults 2,724Dislocated Workers 4,363Youth (14-21) 56
Reported InformationNegotiated
Performance Level
Actual Performance
Level
Entered Employment Rate Adults 59 63.9Dislocated Workers 53.4 62.5
Retention Rates Adults 81 81.8Dislocated Workers 82.0 85.0
Average Earnings Adults $13,401 $17,007Dislocated Workers $19,587 $21,555
Placement in Employment and Education Youth (14 - 21) 70.5 92.0Attainment of Degree or Certificate Youth (14 - 21) 65.9 87.0Literacy or Numeracy Gains Youth (14 - 21) 56.7 43.5Description of Other State Indicators of Performance (WIA Section136(d)(1) - Insert additional rows if there are more than two other state indicators of performance).
Overall Status of Local PerformanceNot Met Met Exceeded
1 0 8

27
New York State Workforce Investm
ent Act Annual Report for Program Year 2015
Local Performance
Jefferson/Lewis Counties Total Participants ServedAdults 2,041Dislocated Workers 905Youth (14-21) 52
36065 Total ExitersAdults 1,787Dislocated Workers 689Youth (14-21) 29
Reported InformationNegotiated
Performance Level
Actual Performance
Level
Entered Employment Rate Adults 59 66.6Dislocated Workers 53.4 63.2
Retention Rates Adults 81 81.3Dislocated Workers 82.0 78.2
Average Earnings Adults $13,401 $12,430Dislocated Workers $15,575 $13,742
Placement in Employment and Education Youth (14 - 21) 70.5 75.0Attainment of Degree or Certificate Youth (14 - 21) 65.9 72.0Literacy or Numeracy Gains Youth (14 - 21) 56.7 33.3Description of Other State Indicators of Performance (WIA Section136(d)(1) - Insert additional rows if there are more than two other state indicators of performance).
Overall Status of Local PerformanceNot Met Met Exceeded
1 3 5

New
York
Stat
e Wor
kfor
ce In
vest
men
t Act
Annu
al Re
port
for P
rogr
am Ye
ar 20
15
28
Local Performance
Oyster Bay/North Hempstead/Glen Cove Total Participants ServedAdults 1,584Dislocated Workers 6,233Youth (14-21) 90
36075 Total ExitersAdults 1,413Dislocated Workers 5,137Youth (14-21) 81
Reported InformationNegotiated
Performance Level
Actual Performance
Level
Entered Employment Rate Adults 59 62.5Dislocated Workers 53.4 62.5
Retention Rates Adults 81 82.4Dislocated Workers 82.0 83.4
Average Earnings Adults $13,401 $19,117Dislocated Workers $19,587 $28,838
Placement in Employment and Education Youth (14 - 21) 70.5 86.7Attainment of Degree or Certificate Youth (14 - 21) 65.9 97.6Literacy or Numeracy Gains Youth (14 - 21) 56.7 82.4Description of Other State Indicators of Performance (WIA Section136(d)(1) - Insert additional rows if there are more than two other state indicators of performance).
Overall Status of Local PerformanceNot Met Met Exceeded
0 0 9
29
New York State Workforce Investm
ent Act Annual Report for Program Year 2015
Local Performance
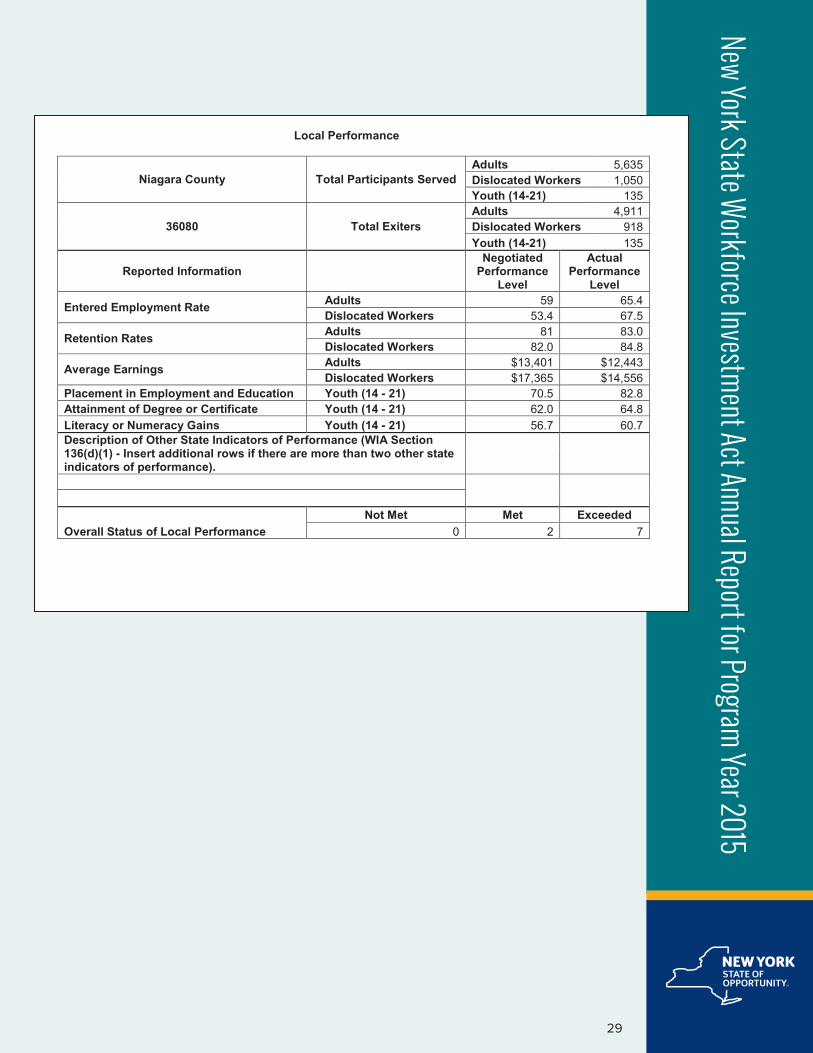
Niagara County Total Participants ServedAdults 5,635Dislocated Workers 1,050Youth (14-21) 135
36080 Total ExitersAdults 4,911Dislocated Workers 918Youth (14-21) 135
Reported InformationNegotiated
Performance Level
Actual Performance
Level
Entered Employment Rate Adults 59 65.4Dislocated Workers 53.4 67.5
Retention Rates Adults 81 83.0Dislocated Workers 82.0 84.8
Average Earnings Adults $13,401 $12,443Dislocated Workers $17,365 $14,556
Placement in Employment and Education Youth (14 - 21) 70.5 82.8Attainment of Degree or Certificate Youth (14 - 21) 62.0 64.8Literacy or Numeracy Gains Youth (14 - 21) 56.7 60.7Description of Other State Indicators of Performance (WIA Section136(d)(1) - Insert additional rows if there are more than two other state indicators of performance).
Overall Status of Local PerformanceNot Met Met Exceeded
0 2 7

New
York
Stat
e Wor
kfor
ce In
vest
men
t Act
Annu
al Re
port
for P
rogr
am Ye
ar 20
15
30
Local Performance
Oneida/Herkimer/Madison Counties Total Participants ServedAdults 5,720Dislocated Workers 4,520Youth (14-21) 148
36090 Total ExitersAdults 5,433Dislocated Workers 4,206Youth (14-21) 70
Reported InformationNegotiated
Performance Level
Actual Performance
Level
Entered Employment Rate Adults 59 63.8Dislocated Workers 53.4 68.7
Retention Rates Adults 81 83.2Dislocated Workers 82.0 85.3
Average Earnings Adults $13,401 $12,208Dislocated Workers $17,350 $14,591
Placement in Employment and Education Youth (14 - 21) 70.5 60.7Attainment of Degree or Certificate Youth (14 - 21) 65.9 66.7Literacy or Numeracy Gains Youth (14 - 21) 56.7 60.0Description of Other State Indicators of Performance (WIA Section136(d)(1) - Insert additional rows if there are more than two other state indicators of performance).
Overall Status of Local PerformanceNot Met Met Exceeded
0 3 6

31
New York State Workforce Investm
ent Act Annual Report for Program Year 2015
Local Performance
Orange County Total Participants ServedAdults 3,162Dislocated Workers 2,367Youth (14-21) 279
36095 Total ExitersAdults 2,371Dislocated Workers 1,918Youth (14-21) 36
Reported InformationNegotiated
Performance Level
Actual Performance
Level
Entered Employment Rate Adults 59 68.5Dislocated Workers 53.4 63.9
Retention Rates Adults 81 85.2Dislocated Workers 82.0 84.9
Average Earnings Adults $13,401 $16,065Dislocated Workers $19,587 $17,560
Placement in Employment and Education Youth (14 - 21) 70.5 77.8Attainment of Degree or Certificate Youth (14 - 21) 65.9 82.6Literacy or Numeracy Gains Youth (14 - 21) 56.7 56.8Description of Other State Indicators of Performance (WIA Section136(d)(1) - Insert additional rows if there are more than two other state indicators of performance).
Overall Status of Local PerformanceNot Met Met Exceeded
0 1 8

New
York
Stat
e Wor
kfor
ce In
vest
men
t Act
Annu
al Re
port
for P
rogr
am Ye
ar 20
15
32
Local Performance
Oswego County Total Participants ServedAdults 2,446Dislocated Workers 957Youth (14-21) 92
36100 Total ExitersAdults 2,227Dislocated Workers 738Youth (14-21) 67
Reported InformationNegotiated
Performance Level
Actual Performance
Level
Entered Employment Rate Adults 59 66.2Dislocated Workers 53.4 62.6
Retention Rates Adults 81 83.8Dislocated Workers 82.0 86.1
Average Earnings Adults $13,401 $13,770Dislocated Workers $16,950 $15,711
Placement in Employment and Education Youth (14 - 21) 70.5 77.3Attainment of Degree or Certificate Youth (14 - 21) 65.9 69.4Literacy or Numeracy Gains Youth (14 - 21) 56.7 61.9Description of Other State Indicators of Performance (WIA Section136(d)(1) - Insert additional rows if there are more than two other state indicators of performance).
Overall Status of Local PerformanceNot Met Met Exceeded
0 1 8

33
New York State Workforce Investm
ent Act Annual Report for Program Year 2015
Local Performance
Rockland County Total Participants ServedAdults 1,506Dislocated Workers 2,017Youth (14-21) 119
36105 Total ExitersAdults 1,262Dislocated Workers 1,539Youth (14-21) 46
Reported InformationNegotiated
Performance Level
Actual Performance
Level
Entered Employment Rate Adults 59 60.4Dislocated Workers 53.4 57.4
Retention Rates Adults 81 83.3Dislocated Workers 82.0 83.3
Average Earnings Adults $13,401 $18,704Dislocated Workers $19,587 $31,017
Placement in Employment and Education Youth (14 - 21) 70.5 74.3Attainment of Degree or Certificate Youth (14 - 21) 65.9 90.7Literacy or Numeracy Gains Youth (14 - 21) 56.7 60.0Description of Other State Indicators of Performance (WIA Section136(d)(1) - Insert additional rows if there are more than two other state indicators of performance).
Overall Status of Local PerformanceNot Met Met Exceeded
0 0 9

New
York
Stat
e Wor
kfor
ce In
vest
men
t Act
Annu
al Re
port
for P
rogr
am Ye
ar 20
15
34
Local Performance
St. Lawrence County Total Participants ServedAdults 2,069Dislocated Workers 664Youth (14-21) 37
36110 Total ExitersAdults 2,049Dislocated Workers 609Youth (14-21) 33
Reported InformationNegotiated
Performance Level
Actual Performance
Level
Entered Employment Rate Adults 59 66.2Dislocated Workers 53.4 65.5
Retention Rates Adults 81 76.0Dislocated Workers 82.0 76.6
Average Earnings Adults $13,401 $12,125Dislocated Workers $15,575 $12,993
Placement in Employment and Education Youth (14 - 21) 70.5 73.7Attainment of Degree or Certificate Youth (14 - 21) 65.9 67.7Literacy or Numeracy Gains Youth (14 - 21) 56.7 50.0Description of Other State Indicators of Performance (WIA Section136(d)(1) - Insert additional rows if there are more than two other state indicators of performance).
Overall Status of Local PerformanceNot Met Met Exceeded
0 5 4

35
New York State Workforce Investm
ent Act Annual Report for Program Year 2015
Local Performance
Saratoga/Warren/Washington Counties Total Participants ServedAdults 3,513Dislocated Workers 1,429Youth (14-21) 91
36115 Total ExitersAdults 2,944Dislocated Workers 1,075Youth (14-21) 17
Reported InformationNegotiated
Performance Level
Actual Performance
Level
Entered Employment Rate Adults 59 71.0Dislocated Workers 53.4 68.4
Retention Rates Adults 81 84.6Dislocated Workers 82.0 83.0
Average Earnings Adults $13,401 $14,478Dislocated Workers $18,000 $17,230
Placement in Employment and Education Youth (14 - 21) 70.5 66.7Attainment of Degree or Certificate Youth (14 - 21) 65.9 68.6Literacy or Numeracy Gains Youth (14 - 21) 56.7 47.8Description of Other State Indicators of Performance (WIA Section136(d)(1) - Insert additional rows if there are more than two other state indicators of performance).
Overall Status of Local PerformanceNot Met Met Exceeded
0 3 6

New
York
Stat
e Wor
kfor
ce In
vest
men
t Act
Annu
al Re
port
for P
rogr
am Ye
ar 20
15
36
Local Performance
Suffolk County Total Participants ServedAdults 6,766Dislocated Workers 9,473Youth (14-21) 303
36120 Total ExitersAdults 5,650Dislocated Workers 7,934Youth (14-21) 253
Reported InformationNegotiated
Performance Level
Actual Performance
Level
Entered Employment Rate Adults 59 61.0Dislocated Workers 53.4 59.4
Retention Rates Adults 81 84.0Dislocated Workers 82.0 86.0
Average Earnings Adults $13,401 $16,685Dislocated Workers $19,587 $19,854
Placement in Employment and Education Youth (14 - 21) 70.5 69.4Attainment of Degree or Certificate Youth (14 - 21) 65.9 73.4Literacy or Numeracy Gains Youth (14 - 21) 56.7 84.7Description of Other State Indicators of Performance (WIA Section136(d)(1) - Insert additional rows if there are more than two other state indicators of performance).
Overall Status of Local PerformanceNot Met Met Exceeded
0 1 8

37
New York State Workforce Investm
ent Act Annual Report for Program Year 2015
Local Performance
Ulster County Total Participants ServedAdults 1,640Dislocated Workers 502Youth (14-21) 59
36125 Total ExitersAdults 1,569Dislocated Workers 458Youth (14-21) 43
Reported InformationNegotiated
Performance Level
Actual Performance
Level
Entered Employment Rate Adults 59 56.5Dislocated Workers 53.4 53.6
Retention Rates Adults 81 82.9Dislocated Workers 82.0 82.9
Average Earnings Adults $13,401 $13,229Dislocated Workers $15,587 $15,090
Placement in Employment and Education Youth (14 - 21) 70.5 90.6Attainment of Degree or Certificate Youth (14 - 21) 65.9 88.9Literacy or Numeracy Gains Youth (14 - 21) 56.7 100.0Description of Other State Indicators of Performance (WIA Section 136(d)(1) - Insert additional rows if there are more than two other state indicators of performance).
Overall Status of Local PerformanceNot Met Met Exceeded
0 3 6

New
York
Stat
e Wor
kfor
ce In
vest
men
t Act
Annu
al Re
port
for P
rogr
am Ye
ar 20
15
38
Local Performance
Columbia/Greene Counties Total Participants ServedAdults 800Dislocated Workers 391Youth (14-21) 62
36135 Total ExitersAdults 670Dislocated Workers 302Youth (14-21) 36
Reported InformationNegotiated
Performance Level
Actual Performance
Level
Entered Employment Rate Adults 59 67.5Dislocated Workers 53.4 67.4
Retention Rates Adults 81 84.0Dislocated Workers 82.0 80.3
Average Earnings Adults $13,401 $14,502Dislocated Workers $17,125 $16,082
Placement in Employment and Education Youth (14 - 21) 70.5 63.8Attainment of Degree or Certificate Youth (14 - 21) 65.9 62.2Literacy or Numeracy Gains Youth (14 - 21) 56.7 70.0Description of Other State Indicators of Performance (WIA Section136(d)(1) - Insert additional rows if there are more than two other state indicators of performance).
Overall Status of Local PerformanceNot Met Met Exceeded
0 4 5

39
New York State Workforce Investm
ent Act Annual Report for Program Year 2015
Local Performance
Sullivan County Total Participants ServedAdults 777Dislocated Workers 364Youth (14-21) 24
36140 Total ExitersAdults 602Dislocated Workers 320Youth (14-21) 20
Reported InformationNegotiated
Performance Level
Actual Performance
Level
Entered Employment Rate Adults 59 63.0Dislocated Workers 53.4 59.6
Retention Rates Adults 81 82.9Dislocated Workers 82.0 87.6
Average Earnings Adults $13,401 $12,598Dislocated Workers $17,860 $14,592
Placement in Employment and Education Youth (14 - 21) 70.5 33.3Attainment of Degree or Certificate Youth (14 - 21) 65.9 12.5Literacy or Numeracy Gains Youth (14 - 21) 56.7 41.2Description of Other State Indicators of Performance (WIA Section136(d)(1) - Insert additional rows if there are more than two other state indicators of performance).
Overall Status of Local PerformanceNot Met Met Exceeded
3 2 4
New
York
Stat
e Wor
kfor
ce In
vest
men
t Act
Annu
al Re
port
for P
rogr
am Ye
ar 20
15
40
Local Performance
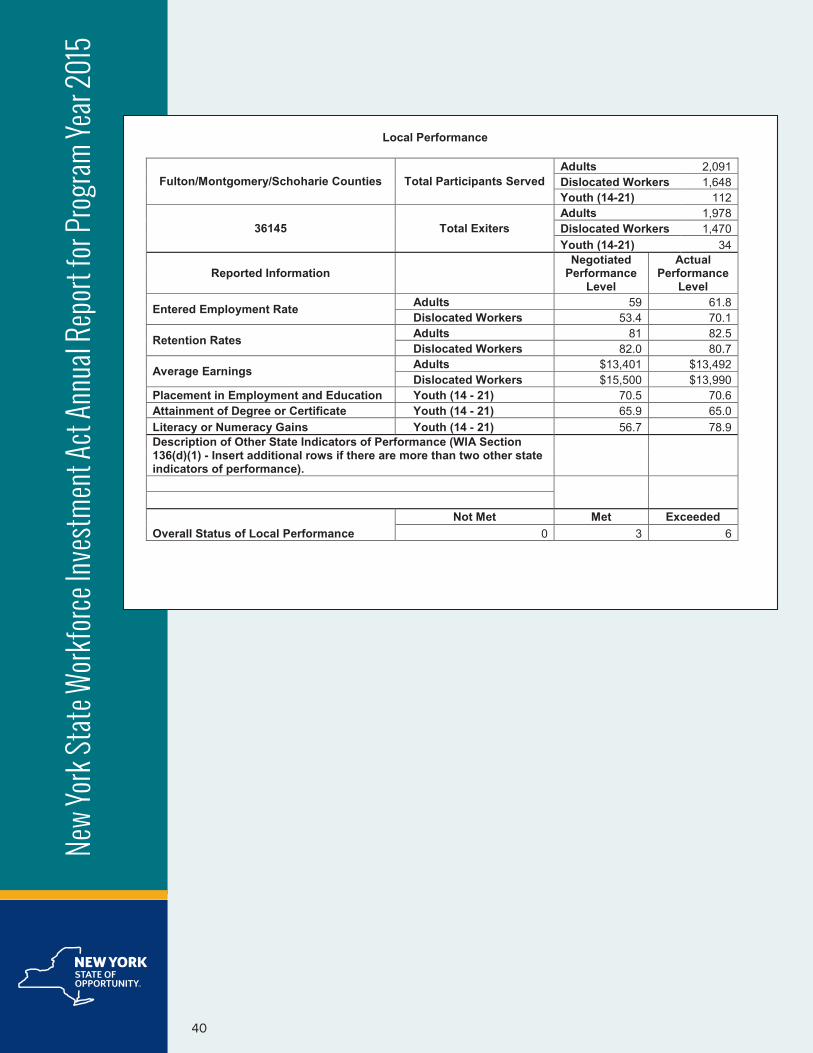
Fulton/Montgomery/Schoharie Counties Total Participants ServedAdults 2,091Dislocated Workers 1,648Youth (14-21) 112
36145 Total ExitersAdults 1,978Dislocated Workers 1,470Youth (14-21) 34
Reported InformationNegotiated
Performance Level
Actual Performance
Level
Entered Employment Rate Adults 59 61.8Dislocated Workers 53.4 70.1
Retention Rates Adults 81 82.5Dislocated Workers 82.0 80.7
Average Earnings Adults $13,401 $13,492Dislocated Workers $15,500 $13,990
Placement in Employment and Education Youth (14 - 21) 70.5 70.6Attainment of Degree or Certificate Youth (14 - 21) 65.9 65.0Literacy or Numeracy Gains Youth (14 - 21) 56.7 78.9Description of Other State Indicators of Performance (WIA Section136(d)(1) - Insert additional rows if there are more than two other state indicators of performance).
Overall Status of Local PerformanceNot Met Met Exceeded
0 3 6

41
New York State Workforce Investm
ent Act Annual Report for Program Year 2015
Local Performance
North Country Total Participants ServedAdults 6,182Dislocated Workers 1,119Youth (14-21) 115
36150 Total ExitersAdults 5,537Dislocated Workers 1,064Youth (14-21) 41
Reported InformationNegotiated
Performance Level
Actual Performance
Level
Entered Employment Rate Adults 59 68.4Dislocated Workers 53.4 73.2
Retention Rates Adults 81 80.3Dislocated Workers 82.0 77.6
Average Earnings Adults $13,250 $11,733Dislocated Workers $16,400 $14,111
Placement in Employment and Education Youth (14 - 21) 70.5 100.0Attainment of Degree or Certificate Youth (14 - 21) 65.9 80.8Literacy or Numeracy Gains Youth (14 - 21) 56.7 55.6Description of Other State Indicators of Performance (WIA Section 136(d)(1) - Insert additional rows if there are more than two other state indicators of performance).
Overall Status of Local PerformanceNot Met Met Exceeded
0 5 4

New
York
Stat
e Wor
kfor
ce In
vest
men
t Act
Annu
al Re
port
for P
rogr
am Ye
ar 20
15
42
Local Performance
Chenango/Delaware/Otsego Counties Total Participants ServedAdults 1,607Dislocated Workers 1,446Youth (14-21) 154
36155 Total ExitersAdults 1,388Dislocated Workers 1,280Youth (14-21) 75
Reported InformationNegotiated
Performance Level
Actual Performance
Level
Entered Employment Rate Adults 59 61.9Dislocated Workers 53.4 71.8
Retention Rates Adults 81 77.3Dislocated Workers 82.0 84.2
Average Earnings Adults $13,401 $11,974Dislocated Workers $16,780 $13,747
Placement in Employment and Education Youth (14 - 21) 70.5 75.4Attainment of Degree or Certificate Youth (14 - 21) 65.9 64.7Literacy or Numeracy Gains Youth (14 - 21) 56.7 65.8Description of Other State Indicators of Performance (WIA Section136(d)(1) - Insert additional rows if there are more than two other state indicators of performance).
Overall Status of Local PerformanceNot Met Met Exceeded
0 4 5

43
New York State Workforce Investm
ent Act Annual Report for Program Year 2015
Local Performance
Finger Lakes Total Participants ServedAdults 2,545Dislocated Workers 1,366Youth (14-21) 122
36165 Total ExitersAdults 2,296Dislocated Workers 1,154Youth (14-21) 82
Reported InformationNegotiated
Performance Level
Actual Performance
Level
Entered Employment Rate Adults 59 71.3Dislocated Workers 53.4 69.9
Retention Rates Adults 81 82.4Dislocated Workers 82.0 82.8
Average Earnings Adults $13,401 $13,800Dislocated Workers $17,925 $15,355
Placement in Employment and Education Youth (14 - 21) 70.5 75.0Attainment of Degree or Certificate Youth (14 - 21) 65.9 62.0Literacy or Numeracy Gains Youth (14 - 21) 56.7 22.2Description of Other State Indicators of Performance (WIA Section136(d)(1) - Insert additional rows if there are more than two other state indicators of performance).
Overall Status of Local PerformanceNot Met Met Exceeded
1 2 6

New
York
Stat
e Wor
kfor
ce In
vest
men
t Act
Annu
al Re
port
for P
rogr
am Ye
ar 20
15
44
Local Performance
GLOW Total Participants ServedAdults 2,930Dislocated Workers 1,350Youth (14-21) 106
36170 Total ExitersAdults 2,526Dislocated Workers 1,126Youth (14-21) 91
Reported InformationNegotiated
Performance Level
Actual Performance
Level
Entered Employment Rate Adults 59 73.1Dislocated Workers 53.4 71.5
Retention Rates Adults 81 81.9Dislocated Workers 82.0 84.8
Average Earnings Adults $13,401 $13,185Dislocated Workers $17,000 $14,368
Placement in Employment and Education Youth (14 - 21) 70.5 76.5Attainment of Degree or Certificate Youth (14 - 21) 65.9 81.5Literacy or Numeracy Gains Youth (14 - 21) 56.7 52.6Description of Other State Indicators of Performance (WIA Section136(d)(1) - Insert additional rows if there are more than two other state indicators of performance).
Overall Status of Local PerformanceNot Met Met Exceeded
0 3 6

45
New York State Workforce Investm
ent Act Annual Report for Program Year 2015
Local Performance
Erie County Total Participants ServedAdults 10,655Dislocated Workers 7,695Youth (14-21) 387
36175 Total ExitersAdults 7,988Dislocated Workers 6,871Youth (14-21) 350
Reported InformationNegotiated
Performance Level
Actual Performance
Level
Entered Employment Rate Adults 59 65.5Dislocated Workers 53.4 69.9
Retention Rates Adults 81 84.0Dislocated Workers 82.0 85.6
Average Earnings Adults $13,401 $13,402Dislocated Workers $19,587 $15,670
Placement in Employment and Education Youth (14 - 21) 70.5 56.8Attainment of Degree or Certificate Youth (14 - 21) 65.9 35.5Literacy or Numeracy Gains Youth (14 - 21) 56.7 52.0Description of Other State Indicators of Performance (WIA Section 136(d)(1) - Insert additional rows if there are more than two other state indicators of performance).
Overall Status of Local PerformanceNot Met Met Exceeded
1 3 5
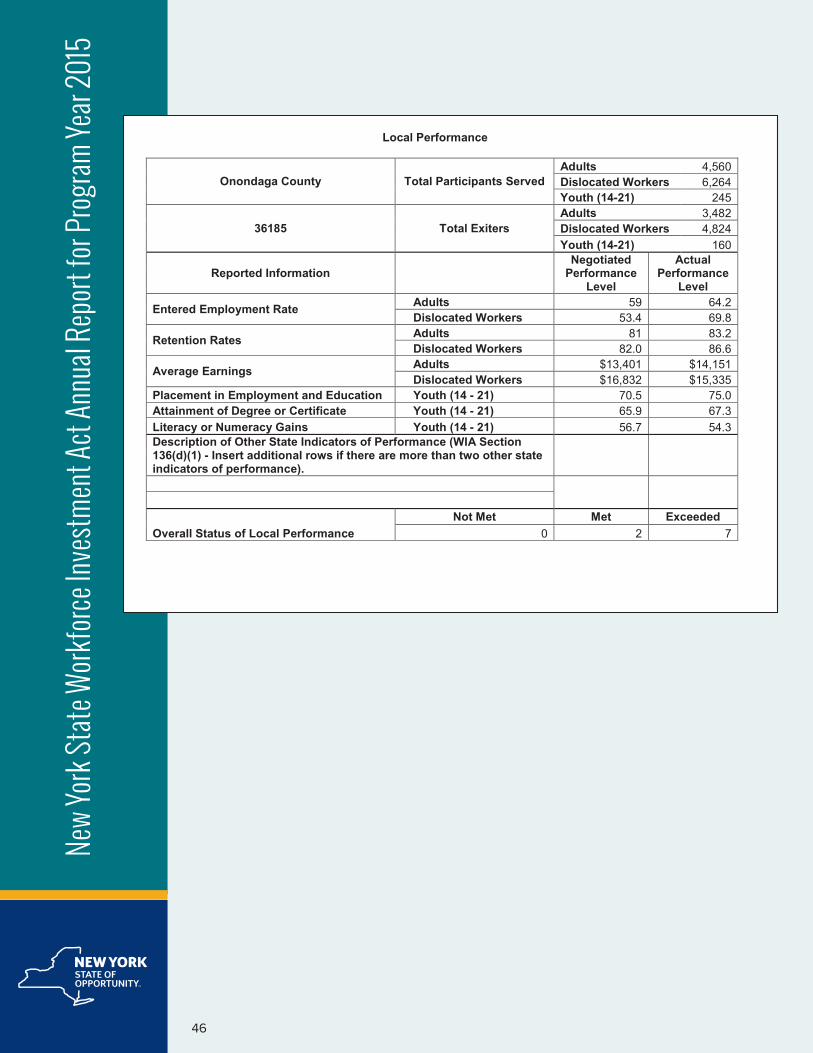
New
York
Stat
e Wor
kfor
ce In
vest
men
t Act
Annu
al Re
port
for P
rogr
am Ye
ar 20
15
46
Local Performance
Onondaga County Total Participants ServedAdults 4,560Dislocated Workers 6,264Youth (14-21) 245
36185 Total ExitersAdults 3,482Dislocated Workers 4,824Youth (14-21) 160
Reported InformationNegotiated
Performance Level
Actual Performance
Level
Entered Employment Rate Adults 59 64.2Dislocated Workers 53.4 69.8
Retention Rates Adults 81 83.2Dislocated Workers 82.0 86.6
Average Earnings Adults $13,401 $14,151Dislocated Workers $16,832 $15,335
Placement in Employment and Education Youth (14 - 21) 70.5 75.0Attainment of Degree or Certificate Youth (14 - 21) 65.9 67.3Literacy or Numeracy Gains Youth (14 - 21) 56.7 54.3Description of Other State Indicators of Performance (WIA Section136(d)(1) - Insert additional rows if there are more than two other state indicators of performance).
Overall Status of Local PerformanceNot Met Met Exceeded
0 2 7

47
New York State Workforce Investm
ent Act Annual Report for Program Year 2015
Local Performance
Cayuga/Cortland Counties Total Participants ServedAdults 2,670Dislocated Workers 949Youth (14-21) 42
36195 Total ExitersAdults 2,202Dislocated Workers 675Youth (14-21) 15
Reported InformationNegotiated
Performance Level
Actual Performance
Level
Entered Employment Rate Adults 59 69.7Dislocated Workers 53.4 69.4
Retention Rates Adults 81 81.8Dislocated Workers 82.0 85.5
Average Earnings Adults $13,401 $12,563Dislocated Workers $17,821 $15,874
Placement in Employment and Education Youth (14 - 21) 70.5 82.4Attainment of Degree or Certificate Youth (14 - 21) 65.9 82.4Literacy or Numeracy Gains Youth (14 - 21) 56.7 40.0Description of Other State Indicators of Performance (WIA Section136(d)(1) - Insert additional rows if there are more than two other state indicators of performance).
Overall Status of Local PerformanceNot Met Met Exceeded
1 2 6

New
York
Stat
e Wor
kfor
ce In
vest
men
t Act
Annu
al Re
port
for P
rogr
am Ye
ar 20
15
48
Local Performance
Allegany/Cattaraugus Counties Total Participants ServedAdults 2,524Dislocated Workers 569Youth (14-21) 73
36210 Total ExitersAdults 2,224Dislocated Workers 429Youth (14-21) 41
Reported InformationNegotiated
Performance Level
Actual Performance
Level
Entered Employment Rate Adults 59 63.0Dislocated Workers 53.4 64.5
Retention Rates Adults 81 80.5Dislocated Workers 82.0 83.6
Average Earnings Adults $13,100 $11,006Dislocated Workers $14,920 $11,935
Placement in Employment and Education Youth (14 - 21) 70.5 71.9Attainment of Degree or Certificate Youth (14 - 21) 65.9 68.0Literacy or Numeracy Gains Youth (14 - 21) 56.7 50.0Description of Other State Indicators of Performance (WIA Section 136(d)(1) - Insert additional rows if there are more than two other state indicators of performance).
Overall Status of Local PerformanceNot Met Met Exceeded
0 4 5

49
New York State Workforce Investm
ent Act Annual Report for Program Year 2015
Local Performance
Chautauqua County Total Participants ServedAdults 3,443Dislocated Workers 1,081Youth (14-21) 134
36215 Total ExitersAdults 1,731Dislocated Workers 464Youth (14-21) 44
Reported InformationNegotiated
Performance Level
Actual Performance
Level
Entered Employment Rate Adults 59 66.8Dislocated Workers 53.4 66.6
Retention Rates Adults 81 81.3Dislocated Workers 82.0 83.7
Average Earnings Adults $13,100 $12,129Dislocated Workers $15,900 $14,504
Placement in Employment and Education Youth (14 - 21) 70.5 85.2Attainment of Degree or Certificate Youth (14 - 21) 65.9 61.1Literacy or Numeracy Gains Youth (14 - 21) 53.0 42.9Description of Other State Indicators of Performance (WIA Section136(d)(1) - Insert additional rows if there are more than two other state indicators of performance).
Overall Status of Local PerformanceNot Met Met Exceeded
0 4 5

New
York
Stat
e Wor
kfor
ce In
vest
men
t Act
Annu
al Re
port
for P
rogr
am Ye
ar 20
15
50
Local Performance
Broome/Tioga Counties Total Participants ServedAdults 3,332Dislocated Workers 1,925Youth (14-21) 83
36220 Total ExitersAdults 2,646Dislocated Workers 1,576Youth (14-21) 58
Reported InformationNegotiated
Performance Level
Actual Performance
Level
Entered Employment Rate Adults 59 64.4Dislocated Workers 53.4 68.1
Retention Rates Adults 81 81.7Dislocated Workers 82.0 82.2
Average Earnings Adults $13,401 $11,477Dislocated Workers $16,090 $13,432
Placement in Employment and Education Youth (14 - 21) 70.5 92.5Attainment of Degree or Certificate Youth (14 - 21) 65.9 81.4Literacy or Numeracy Gains Youth (14 - 21) 56.7 95.8Description of Other State Indicators of Performance (WIA Section136(d)(1) - Insert additional rows if there are more than two other state indicators of performance).
Overall Status of Local PerformanceNot Met Met Exceeded
0 2 7

51
New York State Workforce Investm
ent Act Annual Report for Program Year 2015
Local Performance
Tompkins County Total Participants ServedAdults 1,098Dislocated Workers 436Youth (14-21) 80
36225 Total ExitersAdults 848Dislocated Workers 280Youth (14-21) 20
Reported InformationNegotiated
Performance Level
Actual Performance
Level
Entered Employment Rate Adults 59 67.3Dislocated Workers 53.4 63.3
Retention Rates Adults 81 81.5Dislocated Workers 82.0 86.3
Average Earnings Adults $13,401 $13,209Dislocated Workers $19,587 $16,390
Placement in Employment and Education Youth (14 - 21) 70.5 75.0Attainment of Degree or Certificate Youth (14 - 21) 65.9 48.6Literacy or Numeracy Gains Youth (14 - 21) 56.7 26.9Description of Other State Indicators of Performance (WIA Section136(d)(1) - Insert additional rows if there are more than two other state indicators of performance).
Overall Status of Local PerformanceNot Met Met Exceeded
2 2 5

New
York
Stat
e Wor
kfor
ce In
vest
men
t Act
Annu
al Re
port
for P
rogr
am Ye
ar 20
15
52
Local Performance
Dutchess County Total Participants ServedAdults 2,940Dislocated Workers 1,267Youth (14-21) 101
36230 Total ExitersAdults 2,433Dislocated Workers 1,099Youth (14-21) 40
Reported InformationNegotiated
Performance Level
Actual Performance
Level
Entered Employment Rate Adults 59 64.5Dislocated Workers 53.4 62.7
Retention Rates Adults 81 85.4Dislocated Workers 82.0 86.6
Average Earnings Adults $13,401 $16,562Dislocated Workers $19,587 $19,892
Placement in Employment and Education Youth (14 - 21) 70.5 80.6Attainment of Degree or Certificate Youth (14 - 21) 65.9 70.6Literacy or Numeracy Gains Youth (14 - 21) 56.7 70.0Description of Other State Indicators of Performance (WIA Section136(d)(1) - Insert additional rows if there are more than two other state indicators of performance).
Overall Status of Local PerformanceNot Met Met Exceeded
0 0 9

53
New York State Workforce Investm
ent Act Annual Report for Program Year 2015
Local Performance
Putnam County/Balance of Westchester County Total Participants ServedAdults 5,463Dislocated Workers 7,292Youth (14-21) 534
36235 Total ExitersAdults 3,853Dislocated Workers 4,987Youth (14-21) 257
Reported InformationNegotiated
Performance Level
Actual Performance
Level
Entered Employment Rate Adults 59 58.2Dislocated Workers 53.4 59.9
Retention Rates Adults 81 82.8Dislocated Workers 82.0 85.7
Average Earnings Adults $13,401 $17,793Dislocated Workers $19,587 $26,327
Placement in Employment and Education Youth (14 - 21) 70.5 79.2Attainment of Degree or Certificate Youth (14 - 21) 65.9 67.5Literacy or Numeracy Gains Youth (14 - 21) 56.7 34.4Description of Other State Indicators of Performance (WIA Section136(d)(1) - Insert additional rows if there are more than two other state indicators of performance).
Overall Status of Local PerformanceNot Met Met Exceeded
1 1 7

New
York
Stat
e Wor
kfor
ce In
vest
men
t Act
Annu
al Re
port
for P
rogr
am Ye
ar 20
15
54
Local Performance
Monroe County Total Participants ServedAdults 7,212Dislocated Workers 7,482Youth (14-21) 424
36240 Total ExitersAdults 6,735Dislocated Workers 6,319Youth (14-21) 197
Reported InformationNegotiated
Performance Level
Actual Performance
Level
Entered Employment Rate Adults 59 62.8Dislocated Workers 53.4 65.6
Retention Rates Adults 81 84.2Dislocated Workers 82.0 87.0
Average Earnings Adults $13,401 $13,503Dislocated Workers $18,385 $15,968
Placement in Employment and Education Youth (14 - 21) 70.5 63.5Attainment of Degree or Certificate Youth (14 - 21) 63.0 66.9Literacy or Numeracy Gains Youth (14 - 21) 53.0 47.6Description of Other State Indicators of Performance (WIA Section136(d)(1) - Insert additional rows if there are more than two other state indicators of performance).
Overall Status of Local PerformanceNot Met Met Exceeded
0 3 6

55
New York State Workforce Investm
ent Act Annual Report for Program Year 2015

New
York
Stat
e Wor
kfor
ce In
vest
men
t Act
Annu
al Re
port
for P
rogr
am Ye
ar 20
15
56