new york state common core 7 mathematics curriculum from math-g7-m1... · 05.08.2013 · grade new...
TRANSCRIPT

7
G R A D E
New York State Common Core
Mathematics Curriculum GRADE 7 • MODULE 1
Topic B:
Unit Rate and Constant of Proportionality
7.RP.2b, 7.RP.2c, 7.RP.2d, 7.EE.4a
Focus Standard: 7.RP.2b 7.RP.2c 7.RP.2d
Recognize and represent proportional relationships between quantities. b. Identify the constant of proportionality (unit rate) in tables, graphs,
equations, diagrams, and verbal descriptions of proportional relationships.
c. Represent proportional relationships by equations. For example, if total cost t is proportional to the number n of items purchased at a constant price p, the relationship between the total cost and the number of items can be expressed as t = pn.
d. Explain what a point (x, y) on the graph of a proportional relationship means in terms of the situation, with special attention to the points (0, 0) and (1, r) where r is the unit rate.
7.EE.4a Use variables to represent quantities in a real-world or mathematical problem, and construct simple equations and inequalities to solve problems by reasoning about the quantities. a. Solve word problems leading to equations of the form px + q = r and p(x +
q) = r, where p, q, and r are specific rational numbers. Solve equations of these forms fluently. Compare an algebraic solution to an arithmetic solution, identifying the sequence of the operations used in each approach. For example, the perimeter of a rectangle is 54 cm. Its length is 6 cm. What is its width?
Instructional Days: 4
Lesson 7: Unit Rate as the Constant of Proportionality (P)1
Lessons 8–9: Representing Proportional Relationships with Equations (P)
Lesson 10: Interpreting Graphs of Proportional Relationships (P)
1 Lesson Structure Key: P-Problem Set Lesson, M-Modeling Cycle Lesson, E-Exploration Lesson, S-Socratic Lesson
Topic B: Unit Rate and Constant of Proportionality Date: 7/8/13
57
© 2013 Common Core, Inc. Some rights reserved. commoncore.org This work is licensed under a Creative Commons Attribution-NonCommercial-ShareAlike 3.0 Unported License.
7•1 Topic B NYS COMMON CORE MATHEMATICS CURRICULUM
In Topic B, students learn to identify the constant of proportionality by finding the unit rate in the collection of equivalent ratios. They represent this relationship with equations of the form y = kx, where k is the constant of proportionality (7.RP.2, 7.RP.2c). In Lessons 8 and 9, students derive the constant of proportionality from the description of a real-world context and relate the equation representing the relationship to a corresponding ratio table and/or graphical representation (7.RP.2b, 7.EE.4). Topic B concludes with students consolidating their graphical understandings of proportional relationships as they interpret the meanings of the points (0,0) and (1, r), where r is the unit rate, in terms of the situation or context of a given problem (7.RP.2d).
Topic B: Unit Rates and the Constant of Proportionality Date: 7/8/13
58
© 2013 Common Core, Inc. Some rights reserved. commoncore.org This work is licensed under a Creative Commons Attribution-NonCommercial-ShareAlike 3.0 Unported License.

Lesson 7: Unit Rate as the Constant of Proportionality Date: 7/8/13
59
© 2013 Common Core, Inc. Some rights reserved. commoncore.org This work is licensed under a Creative Commons Attribution-NonCommercial-ShareAlike 3.0 Unported License.
NYS COMMON CORE MATHEMATICS CURRICULUM 7•1 Lesson 7
PENDING FINAL EDITORIAL REVIEW
Lesson 7: Unit Rate as the Constant of Proportionality
Student Outcomes
Students identify the same value relating the measures of x and the measures of y in a proportional relationship as the constant of proportionality and recognize it as the unit rate in the context of a given situation.
Students find and interpret the constant of proportionality within the contexts of problems.
Classwork
Example 1 (20 minutes): National Forest Deer Population in Danger?
Begin this lesson by presenting the following situation: Wildlife conservationists are concerned that the deer population might not be constant across the National Forest. The scientists found that there were 144 deer in a 16 square mile area of the forest. In another part of the forest, conservationists counted 117 deer in a 13 square mile area. Yet a third conservationist counted 24 deer in a 216 square acre plot of the forest. Do conservationists need to be worried?
Questions for Discussion: Guide students to complete necessary information on student handout.
a. Why does it matter if the deer population is not constant in a certain area of the national forest?
Have students generate as many theories as possible (food supply, overpopulation, damage to land, etc.)
b. What is the population density of deer per square mile?
See chart below.
Encourage students to make a chart to organize the data from the problem and then explicitly model finding the constant of proportionality. Students have already found unit rate in earlier lessons but have not identified it as the constant of proportionality. Remember that the constant of proportionality is also like a scalar and will be used in an equation as the constant.
When we find the number of deer per 1 square mile, what is this called?
Unit rate.
When we look at the relationship between square miles and number of deer in the table below, how do we know if the relationship is proportional? The square miles is always multiplied by the same value, 9 in this case.
Scaffolding:
Use a map of a national forest in your area so that students who are not familiar with square miles can view a model.
MP.1
Lesson 7: Unit Rate as the Constant of Proportionality Date: 7/8/13
60
© 2013 Common Core, Inc. Some rights reserved. commoncore.org This work is licensed under a Creative Commons Attribution-NonCommercial-ShareAlike 3.0 Unported License.
NYS COMMON CORE MATHEMATICS CURRICULUM 7•1 Lesson 7
PENDING FINAL EDITORIAL REVIEW
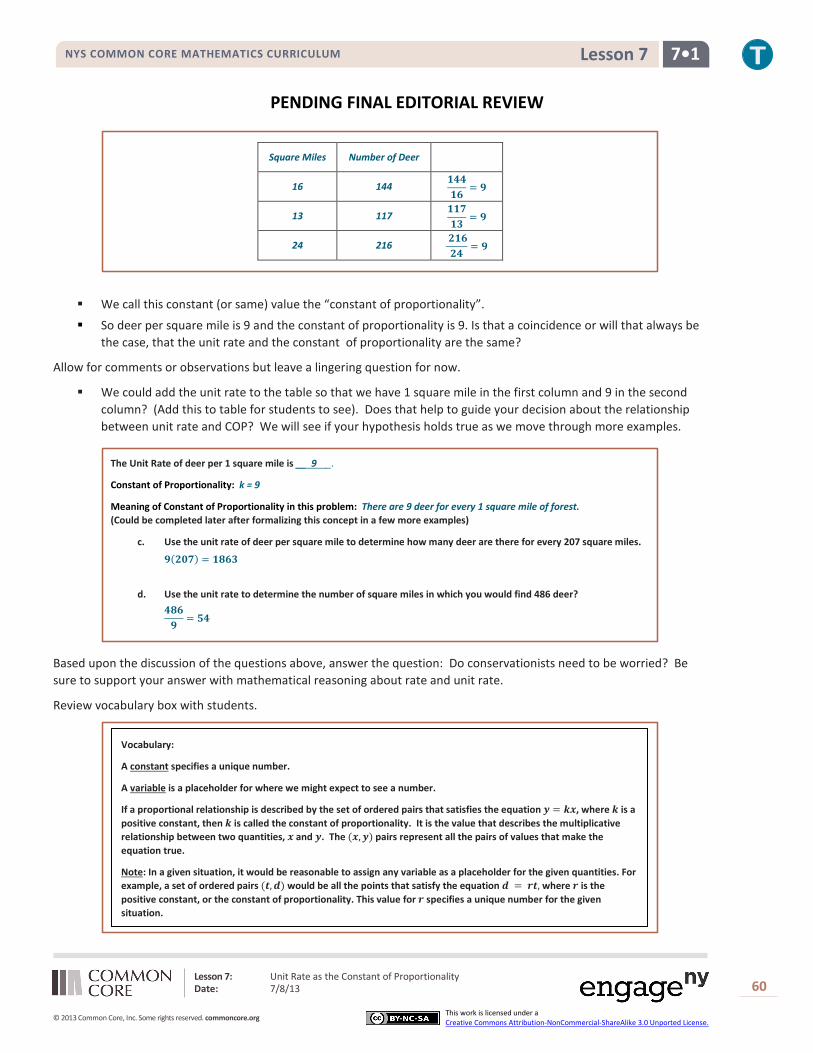
Square Miles Number of Deer
16 144 𝟏𝟒𝟒𝟏𝟔
= 𝟗
13 117 𝟏𝟏𝟕𝟏𝟑
= 𝟗
24 216 𝟐𝟏𝟔𝟐𝟒
= 𝟗
We call this constant (or same) value the “constant of proportionality”.
So deer per square mile is 9 and the constant of proportionality is 9. Is that a coincidence or will that always be the case, that the unit rate and the constant of proportionality are the same?
Allow for comments or observations but leave a lingering question for now.
We could add the unit rate to the table so that we have 1 square mile in the first column and 9 in the second column? (Add this to table for students to see). Does that help to guide your decision about the relationship between unit rate and COP? We will see if your hypothesis holds true as we move through more examples.
The Unit Rate of deer per 1 square mile is __ 9 _.
Constant of Proportionality: k = 9
Meaning of Constant of Proportionality in this problem: There are 9 deer for every 1 square mile of forest. (Could be completed later after formalizing this concept in a few more examples)
c. Use the unit rate of deer per square mile to determine how many deer are there for every 207 square miles.
𝟗(𝟐𝟎𝟕) = 𝟏𝟖𝟔𝟑
d. Use the unit rate to determine the number of square miles in which you would find 486 deer? 𝟒𝟖𝟔𝟗
= 𝟓𝟒
Based upon the discussion of the questions above, answer the question: Do conservationists need to be worried? Be sure to support your answer with mathematical reasoning about rate and unit rate.
Review vocabulary box with students.
Vocabulary:
A constant specifies a unique number.
A variable is a placeholder for where we might expect to see a number.
If a proportional relationship is described by the set of ordered pairs that satisfies the equation 𝒚 = 𝒌𝒙, where 𝒌 is a positive constant, then 𝒌 is called the constant of proportionality. It is the value that describes the multiplicative relationship between two quantities, 𝒙 and 𝒚. The (𝒙,𝒚) pairs represent all the pairs of values that make the equation true.
Note: In a given situation, it would be reasonable to assign any variable as a placeholder for the given quantities. For example, a set of ordered pairs (𝒕,𝒅) would be all the points that satisfy the equation 𝒅 = 𝒓𝒕, where 𝒓 is the positive constant, or the constant of proportionality. This value for 𝒓 specifies a unique number for the given situation.

Lesson 7: Unit Rate as the Constant of Proportionality Date: 7/8/13
61
© 2013 Common Core, Inc. Some rights reserved. commoncore.org This work is licensed under a Creative Commons Attribution-NonCommercial-ShareAlike 3.0 Unported License.
NYS COMMON CORE MATHEMATICS CURRICULUM 7•1 Lesson 7
PENDING FINAL EDITORIAL REVIEW
Remind students that in the example with the deer population, we are looking for deer per square mile so the number of square miles could be defined as x, and the number of deer could be defined as 𝑦, so the unit rate in deer per square
mile is 14416
, or 9.The constant of proportionality, 𝑘, is 9. The meaning in the context of Example 1 is: There are 9 deer
for every 1 square mile of forest.
Discussion
How are the constant of proportionality and the unit rate alike?
They are the same. They both represent the same number that is the value of the ratio of y to x.
Example 2 (18 minutes): You need WHAT???
Brandon came home from school and informed his mother that he had volunteered to make cookies for his entire grade level. He needed 3 cookies for each of the 96 students in 7th grade. Unfortunately, he needed the cookies for an event at school on the very next day! Brandon and his mother determined that they can fit 36 cookies on two cookie sheets. Encourage students to make a chart to organize the data from the problem.
a. Is the number of cookies proportional to the number of sheets used in baking? Create a table that shows data for the number of sheets needed for the total number of cookies needed.
Table:
The unit rate is 18 cookies per sheet.
The constant of proportionality is 18.
Meaning of Constant of Proportionality in this problem: There are 18 cookies per 1 sheet.
b. It took 2 hours to bake 8 sheets of cookies. If Brandon and his mother begin baking at 4:00 pm, when will they finish baking the cookies?
If it takes 2 hours to bake 8 sheets, it will take 4 hours to bake 16 sheets of cookies. They will finish baking at 8:00 pm.
96 students (3 cookies each) = 288 cookies
𝟐𝟖𝟖 𝒄𝒐𝒐𝒌𝒊𝒆𝒔
𝟏𝟖 𝒄𝒐𝒐𝒌𝒊𝒆𝒔 𝒑𝒆𝒓 𝒔𝒉𝒆𝒆𝒕 = 16 sheets of cookies
# of cookie sheets
# of cookies baked
2 36 𝟑𝟔𝟐
= 𝟏𝟖
4 72 𝟕𝟐𝟒
= 𝟏𝟖
10 180 𝟏𝟖𝟎𝟏𝟎
= 𝟏𝟖
16 288 𝟐𝟖𝟖𝟏𝟔
= 𝟏𝟖
Scaffolding:
For students who need more challenge, have them create a problem in which the constant rate is a fraction.

Lesson 7: Unit Rate as the Constant of Proportionality Date: 7/8/13
62
© 2013 Common Core, Inc. Some rights reserved. commoncore.org This work is licensed under a Creative Commons Attribution-NonCommercial-ShareAlike 3.0 Unported License.
NYS COMMON CORE MATHEMATICS CURRICULUM 7•1 Lesson 7
PENDING FINAL EDITORIAL REVIEW
Example 3: French Class Cooking
Suzette and Margo want to prepare crepes for all of the students in their French class. A recipe makes 20 crepes with a certain amount of flour, milk, and 2 eggs. The girls know that they already have plenty of flour and milk but need to determine the number of eggs needed to make 50 crepes because they are not sure they have enough eggs for the recipe.
a. Considering the amount of eggs necessary to make the crepes, what is the constant of proportionality?
The constant of proportionality is 𝟏𝟏𝟎
.
b. What does the constant or proportionality mean in the context of this problem? 𝟐 𝒆𝒈𝒈𝒔
𝟐𝟎 𝒄𝒓𝒆𝒑𝒆𝒔=
𝟏 𝒆𝒈𝒈𝟏𝟎 𝒄𝒓𝒆𝒑𝒆𝒔
; One egg is needed to make 𝟏𝟎 crepes.
c. How many eggs will be needed for 50 crepes?
𝟓𝟎 � 𝟏𝟏𝟎� = 𝟓; Five eggs will be needed to make 𝟓𝟎 crepes.
Closing Question (2 minutes)
What is another name for the constant that relates the measures of two quantities?
Constant of Proportionality
How is the Constant of Proportionality related to the unit rate?
They are the same.
Exit Ticket (5 minutes)
Lesson Summary
If a proportional relationship is described by the set of ordered pairs that satisfies the equation 𝒚 = 𝒌𝒙, where 𝒌 is a positive constant, then 𝒌 is called the constant of proportionality.
Lesson 7: Unit Rate as the Constant of Proportionality Date: 7/8/13
63
© 2013 Common Core, Inc. Some rights reserved. commoncore.org This work is licensed under a Creative Commons Attribution-NonCommercial-ShareAlike 3.0 Unported License.
NYS COMMON CORE MATHEMATICS CURRICULUM 7•1 Lesson 7
PENDING FINAL EDITORIAL REVIEW Name ___________________________________________________ Date____________________
Lesson 7: Unit Rate as the Constant of Proportionality
Exit Ticket
Susan and John are buying cold drinks for a neighborhood picnic. Each person is expected to drink one can of soda. Susan says that if you multiply the unit price for a can of soda by the number of people attending the picnic, you will be able to determine the total cost of the soda. John says that if you divide the cost of a 12-pack of soda by the number of sodas, you will be able to determine the total cost of the sodas. Who is right and why?
Lesson 7: Unit Rate as the Constant of Proportionality Date: 7/8/13
64
© 2013 Common Core, Inc. Some rights reserved. commoncore.org This work is licensed under a Creative Commons Attribution-NonCommercial-ShareAlike 3.0 Unported License.
NYS COMMON CORE MATHEMATICS CURRICULUM 7•1 Lesson 7
PENDING FINAL EDITORIAL REVIEW
Exit Ticket Sample Solutions
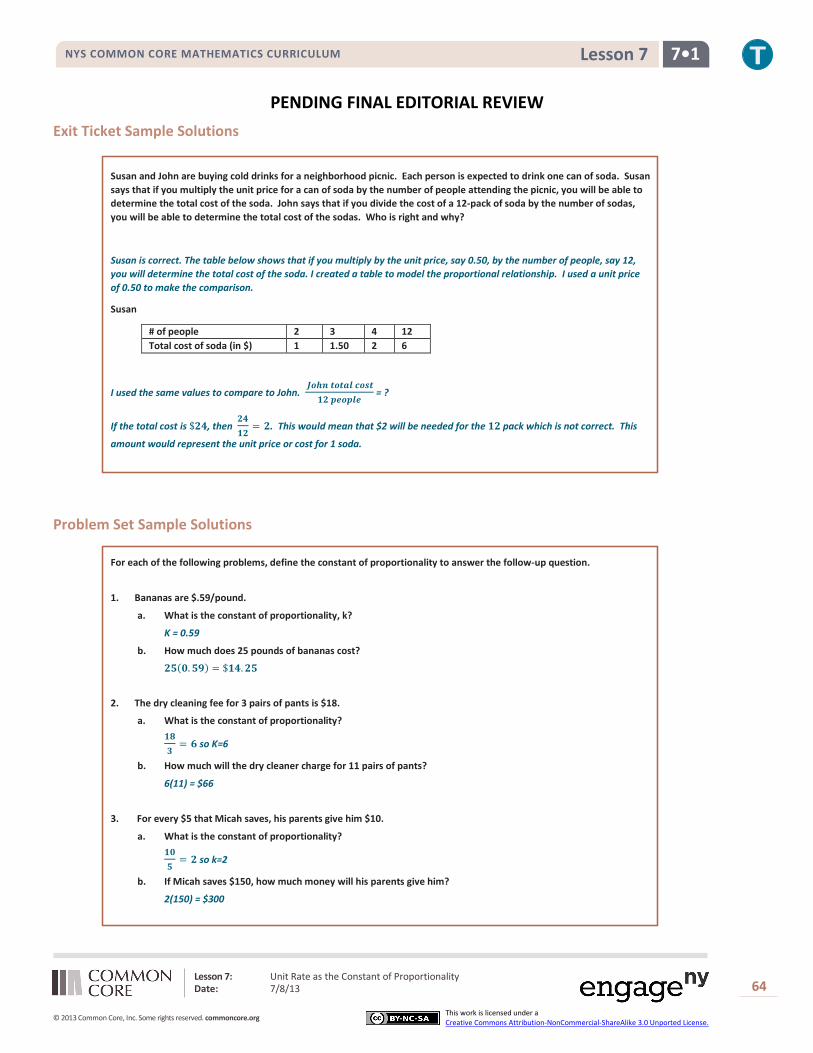
Susan and John are buying cold drinks for a neighborhood picnic. Each person is expected to drink one can of soda. Susan says that if you multiply the unit price for a can of soda by the number of people attending the picnic, you will be able to determine the total cost of the soda. John says that if you divide the cost of a 12-pack of soda by the number of sodas, you will be able to determine the total cost of the sodas. Who is right and why?
Susan is correct. The table below shows that if you multiply by the unit price, say 0.50, by the number of people, say 12, you will determine the total cost of the soda. I created a table to model the proportional relationship. I used a unit price of 0.50 to make the comparison.
Susan
# of people 2 3 4 12 Total cost of soda (in $) 1 1.50 2 6
I used the same values to compare to John. 𝑱𝒐𝒉𝒏 𝒕𝒐𝒕𝒂𝒍 𝒄𝒐𝒔𝒕
𝟏𝟐 𝒑𝒆𝒐𝒑𝒍𝒆 = ?
If the total cost is $𝟐𝟒, then 𝟐𝟒𝟏𝟐
= 𝟐. This would mean that $2 will be needed for the 𝟏𝟐 pack which is not correct. This
amount would represent the unit price or cost for 1 soda.
Problem Set Sample Solutions
For each of the following problems, define the constant of proportionality to answer the follow-up question.
1. Bananas are $.59/pound.
a. What is the constant of proportionality, k?
K = 0.59
b. How much does 25 pounds of bananas cost?
𝟐𝟓(𝟎.𝟓𝟗) = $𝟏𝟒.𝟐𝟓
2. The dry cleaning fee for 3 pairs of pants is $18.
a. What is the constant of proportionality? 𝟏𝟖𝟑
= 𝟔 so K=6
b. How much will the dry cleaner charge for 11 pairs of pants?
6(11) = $66
3. For every $5 that Micah saves, his parents give him $10.
a. What is the constant of proportionality? 𝟏𝟎𝟓
= 𝟐 so k=2
b. If Micah saves $150, how much money will his parents give him?
2(150) = $300

Lesson 7: Unit Rate as the Constant of Proportionality Date: 7/8/13
65
© 2013 Common Core, Inc. Some rights reserved. commoncore.org This work is licensed under a Creative Commons Attribution-NonCommercial-ShareAlike 3.0 Unported License.
NYS COMMON CORE MATHEMATICS CURRICULUM 7•1 Lesson 7
PENDING FINAL EDITORIAL REVIEW
4. Each school year, the 7th graders who study Life Science participate in a special field trip to the city zoo. In 2010, the school paid $1260 for 84 students to enter the zoo. In 2011, the school paid $1050 for 70 students to enter the zoo. In 2012, the school paid $1395 for 93 students to enter the zoo.
a. Is the price the school pays each year in entrance fees proportional to the number of students entering the zoo?
b. Why or why not?
Because the ratio of the entrance fee paid per student was the same. 𝟏,𝟐𝟔𝟎𝟖𝟒
= 𝟏𝟓
c. Identify the constant of proportionality and explain what it means in the context of this situation.
K = 15. the price per student
d. What would the school pay if 120 students entered the zoo?
120(15) = $1,800
e. How many students would enter the zoo if the school paid $1,425? 𝟏,𝟒𝟐𝟓𝟏𝟓
= 𝟗𝟓 𝒔𝒕𝒖𝒅𝒆𝒏𝒕𝒔
# of students Price
84 1,260
𝟏,𝟐𝟔𝟎𝟖𝟒
= 𝟏𝟓
70 1,050 𝟏,𝟎𝟓𝟎𝟕𝟎
= 𝟏𝟓
93 1,395 𝟏,𝟑𝟗𝟓𝟗𝟑
= 𝟏𝟓
YES
Lesson 8: Representing Proportional Relationships with Equations Date: 7/9/13
66
© 2013 Common Core, Inc. Some rights reserved. commoncore.org This work is licensed under a Creative Commons Attribution-NonCommercial-ShareAlike 3.0 Unported License.
NYS COMMON CORE MATHEMATICS CURRICULUM 7•1 Lesson 8
PENDING FINAL EDITORIAL REVIEW
Lesson 8: Representing Proportional Relationships with
Equations
Student Outcomes
Students use the constant of proportionality to represent proportional relationships by equations in real world contexts, as they relate the equations to a corresponding ratio table and/or graphical representation.
Classwork
Discussion (5 minutes)
Discuss important facts.
Encourage students to begin to think about how we can model a proportional relationship by using an equation by framing with the following probing questions:
If we know that the constant of proportionality, 𝑘, to be equal to 𝑦/𝑥 for a given set of ordered pairs, 𝑥 and 𝑦, then we can write 𝑘 = 𝑦/𝑥. How else could we write this equation? What if we know the 𝑥-values, and the constant of proportionality, but do not know the 𝑦-values. Could we re-write this equation to solve for 𝑦?
Elicit ideas from students. Apply ideas in examples below. Provide the context of the examples below to encourage students to test their thinking.
Students should note the following in their materials: 𝑘 = 𝑦/𝑥 and eventually 𝑦 = 𝑘𝑥 (may need to add this second equation after Example 1)
Examples 1 and 2 (33 minutes)
Write an equation that will model the real world situation.
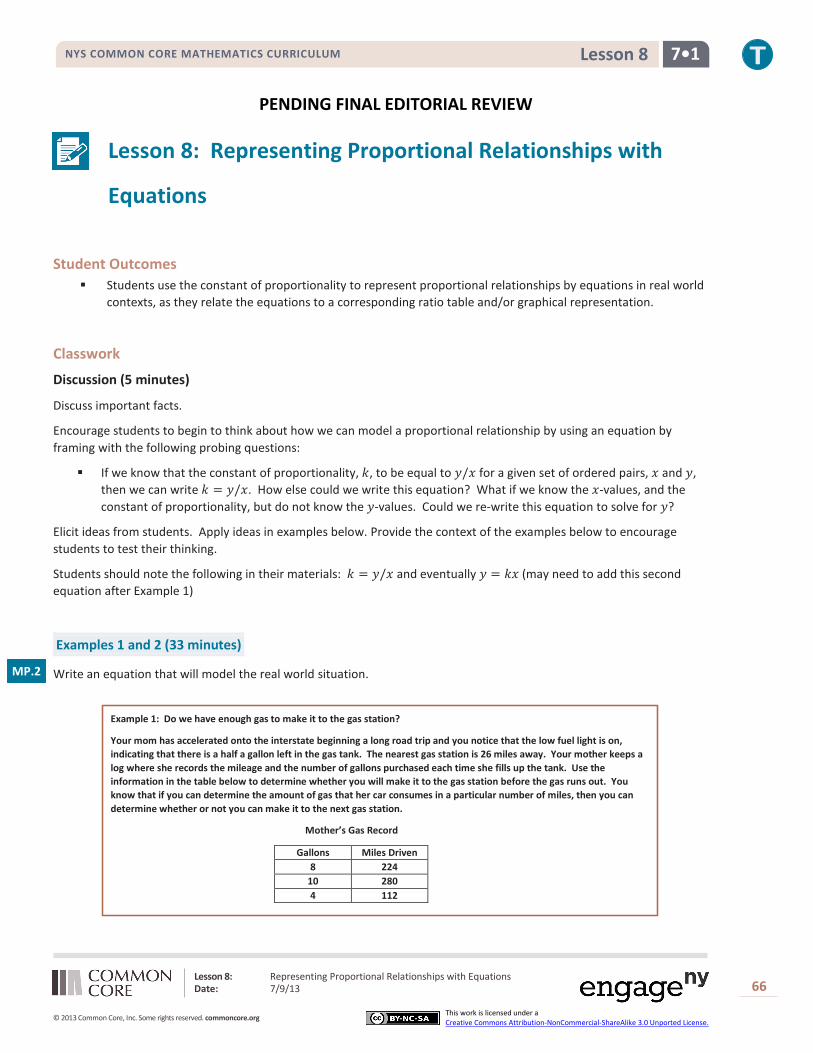
Example 1: Do we have enough gas to make it to the gas station?
Your mom has accelerated onto the interstate beginning a long road trip and you notice that the low fuel light is on, indicating that there is a half a gallon left in the gas tank. The nearest gas station is 26 miles away. Your mother keeps a log where she records the mileage and the number of gallons purchased each time she fills up the tank. Use the information in the table below to determine whether you will make it to the gas station before the gas runs out. You know that if you can determine the amount of gas that her car consumes in a particular number of miles, then you can determine whether or not you can make it to the next gas station.
Mother’s Gas Record
Gallons Miles Driven 8 224
10 280 4 112
MP.2

Lesson 8: Representing Proportional Relationships with Equations Date: 7/9/13
67
© 2013 Common Core, Inc. Some rights reserved. commoncore.org This work is licensed under a Creative Commons Attribution-NonCommercial-ShareAlike 3.0 Unported License.
NYS COMMON CORE MATHEMATICS CURRICULUM 7•1 Lesson 8
PENDING FINAL EDITORIAL REVIEW
a. Find the constant of proportionality and explain what it represents in this situation.
Gallons Miles Driven
𝟖 𝟐𝟐𝟒 𝟐𝟐𝟒𝟖
= 𝟐𝟖
𝟏𝟎 𝟐𝟖𝟎 𝟐𝟖𝟎𝟏𝟎
= 𝟐𝟖
𝟒 𝟏𝟏𝟐 𝟏𝟏𝟐𝟒
= 𝟐𝟖
Constant of proportionality is 𝒌 = 𝟐𝟖. The car travels 28 miles for every one gallon of gas.
b. Write equation(s) that will relate the miles driven to the number of gallons of gas.
𝒚 = 𝟐𝟖𝒙 or 𝒎 = 𝟐𝟖𝒈
c. Knowing that there is a half gallon left in the gas tank when the light comes on, will she make it to the nearest gas station? Explain why or why not.
No, she will not make it because she gets 28 miles to one gallon. Since she has ½ gallon remaining in the gas tank, she can travel 14 miles. Since the nearest gas station is 26 miles away, she will not have enough gas.
d. Using the equation found in part b, determine how far Mom can travel on 18 gallons of gas. Solve the problem in two ways.
Using arithmetic: 𝟐𝟖(𝟏𝟖) = 𝟓𝟎𝟒
Using Algebra: 𝒎 = 𝟐𝟖𝒈 – use substitution to replace the g (gallons of gas) with 18.
𝒎 = 𝟐𝟖(𝟏𝟖) – this is the same as multiplying by the constant of proportionality.
𝒎 = 𝟓𝟎𝟒
Your mom can travel 504 miles on 18 gallons of gas.
e. Using the equation found in part b, determine how many gallons of gas would be needed to travel 750 miles.
Using arithmetic: 𝟕𝟓𝟎𝟐𝟖
= 𝟐𝟔.𝟖
Using algebra: 𝒎 = 𝟐𝟖𝒈 – use substitution to replace the m (miles driven) with 750.
𝟕𝟓𝟎 = 𝟐𝟖𝒈 – This equation demonstrates the same as dividing by the Constant of
Proportionality or algebraically, use the multiplicative inverse (making one) to solve the equation.
� 𝟏𝟐𝟖�𝟕𝟓𝟎 = � 𝟏
𝟐𝟖�𝟐𝟖𝒈
𝟐𝟔.𝟖 = 𝟏𝒈
26.8 (rounded to the nearest tenth) gallons would be needed to drive 750 miles.
Have students write the pairs of numbers in the chart as ordered pairs. Explain that in this example 𝑥 = gallons and 𝑦 = miles driven. Remind students to think of the constant of proportionality as 𝑘 = 𝑦
𝑥. The ratio is a certain number of
miles divided by a certain number of gallons. This constant is the same as the unit rate of miles per gallon. Remind students that you will use the constant of proportionality (or unit rate) as a multiplier in your equation.
Write equation(s) that will relate the miles driven to the number of gallons of gas.
In order to write the equation to represent this situation, direct students to think of the independent and dependent variables that are implied in this problem.
Lesson 8: Representing Proportional Relationships with Equations Date: 7/9/13
68
© 2013 Common Core, Inc. Some rights reserved. commoncore.org This work is licensed under a Creative Commons Attribution-NonCommercial-ShareAlike 3.0 Unported License.
NYS COMMON CORE MATHEMATICS CURRICULUM 7•1 Lesson 8
PENDING FINAL EDITORIAL REVIEW Which part depends on the other for its outcome?
The number of miles driven depends on the number of gallons of gas that are in the gas tank.
Which is the dependent variable – gallons of gas or miles driven?
The number of miles is the dependent variable while the number of gallons is the independent variable.
Tell students that 𝑥 is usually known as the independent variable and 𝑦 is known as the dependent variable.
Remind students the constant of proportionality can also be expressed as 𝑦𝑥 from an ordered pair. It is the ratio
of the dependent variable to the independent variable.
Ask, when 𝑥 and 𝑦 are graphed on a coordinate grid, which axis would show the values of the dependent variable? 𝑦-axis
The independent variable?
𝑥- axis
Tell students that any variable may be used to represent the situation as long as it is known that in showing a proportional relationship in an equation that the constant of proportionality is multiplied by the independent variable. In this problem students can write 𝑦 = 28𝑥 or 𝑚 = 28𝑔. We are substituting the 28 for 𝑘 in the equation 𝑦 = 𝑘𝑥 or 𝑚 = 𝑘𝑔.
Tell students that this equation models the situation and will provide us with a way to determine either variable when the other is known. If the equation is written so that the known information is substituted in to the equation, then students can use algebra to solve the equation.
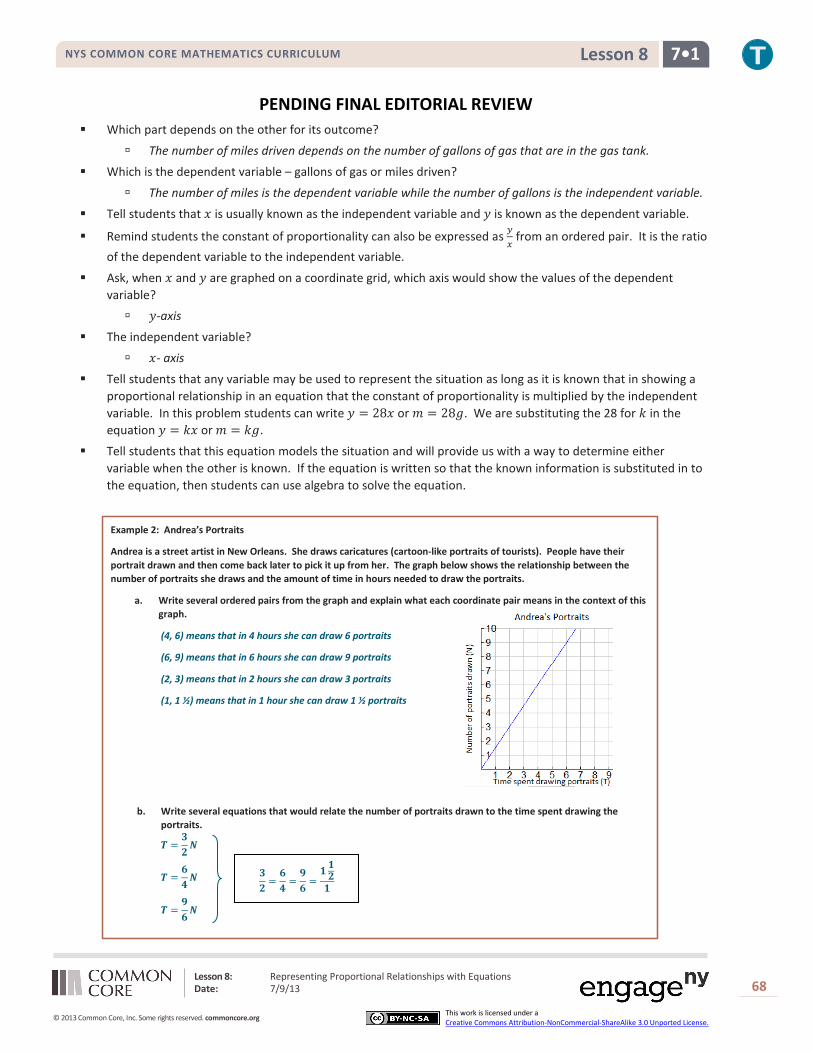
Example 2: Andrea’s Portraits
Andrea is a street artist in New Orleans. She draws caricatures (cartoon-like portraits of tourists). People have their portrait drawn and then come back later to pick it up from her. The graph below shows the relationship between the number of portraits she draws and the amount of time in hours needed to draw the portraits.
a. Write several ordered pairs from the graph and explain what each coordinate pair means in the context of this graph.
(4, 6) means that in 4 hours she can draw 6 portraits
(6, 9) means that in 6 hours she can draw 9 portraits
(2, 3) means that in 2 hours she can draw 3 portraits
(1, 1 ½) means that in 1 hour she can draw 1 ½ portraits
b. Write several equations that would relate the number of portraits drawn to the time spent drawing the portraits.
𝑻 =𝟑𝟐𝑵
𝑻 =𝟔𝟒𝑵
𝑻 =𝟗𝟔𝑵
𝟑𝟐
=𝟔𝟒
=𝟗𝟔
=𝟏𝟏𝟐𝟏

Lesson 8: Representing Proportional Relationships with Equations Date: 7/9/13
69
© 2013 Common Core, Inc. Some rights reserved. commoncore.org This work is licensed under a Creative Commons Attribution-NonCommercial-ShareAlike 3.0 Unported License.
NYS COMMON CORE MATHEMATICS CURRICULUM 7•1 Lesson 8
PENDING FINAL EDITORIAL REVIEW
c. Determine the constant of proportionality and explain what it means in this situation.
The constant of proportionality is 𝟑/𝟐 which means that Andrea can draw 𝟑 portraits in 𝟐 hours or can complete 𝟏 ½ portrait in 1 hour.
Tell students these ordered pairs can be used to generate the constant of proportionality and write the
equation for this situation. Remember that 𝑘 = 𝑦𝑥
.
Closing (2 minutes)
How can unit rate be used to write an equation relating two variables that are proportional? The unit rate is the constant of proportionality, 𝑘. After computing the value for 𝑘, it may be
substituted in place of 𝑘 in the equation 𝑦 = 𝑘𝑥. The Constant of Proportionality can be multiplied by the independent variable to find the dependent variable and the dependent variable can be divided by the constant of proportionality to find the dependent variables.
Exit Ticket (5 minutes)
Lesson Summary:
If a proportional relationship is described by the set of ordered pairs that satisfies the equation 𝒚 = 𝒌𝒙, where 𝒌 is a positive constant, then 𝒌 is called the constant of proportionality. The constant of proportionality expresses the multiplicative relationship between each 𝒙-value and its corresponding 𝒚-value.
Lesson 8: Representing Proportional Relationships with Equations Date: 7/9/13
70
© 2013 Common Core, Inc. Some rights reserved. commoncore.org This work is licensed under a Creative Commons Attribution-NonCommercial-ShareAlike 3.0 Unported License.
NYS COMMON CORE MATHEMATICS CURRICULUM 7•1 Lesson 8
PENDING FINAL EDITORIAL REVIEW Name ___________________________________________________ Date____________________
Lesson 8: Representing Proportional Relationships with
Equations
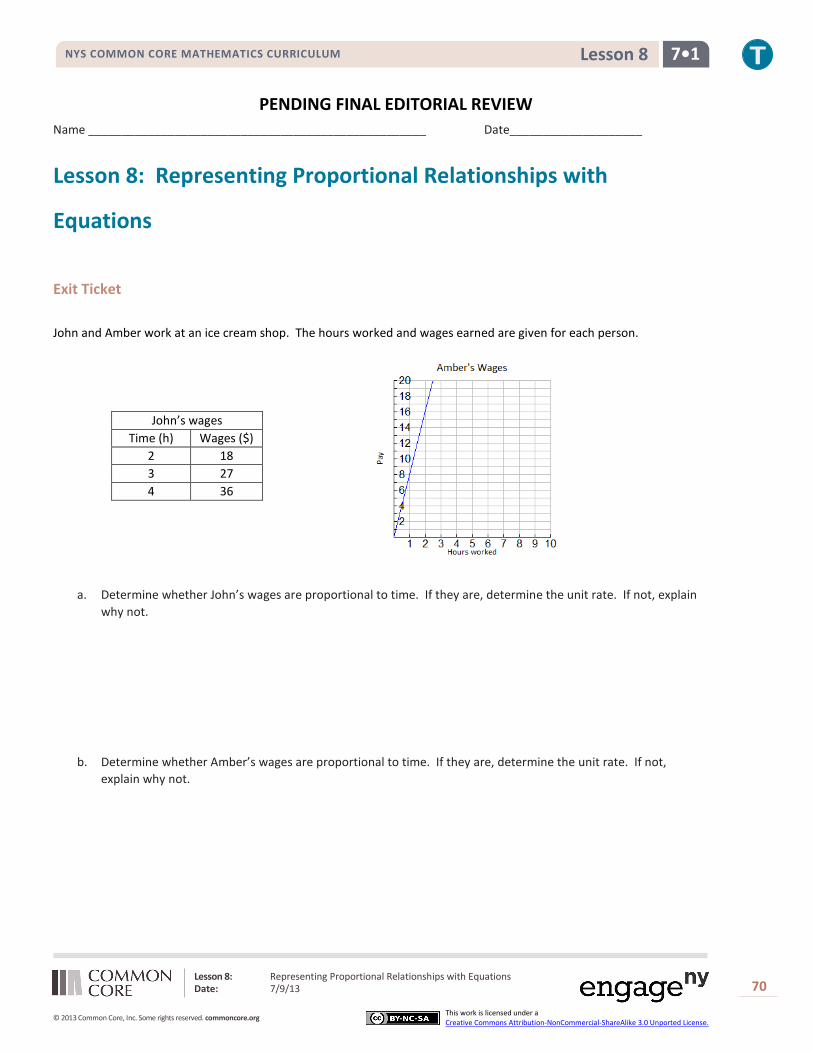
Exit Ticket John and Amber work at an ice cream shop. The hours worked and wages earned are given for each person.
a. Determine whether John’s wages are proportional to time. If they are, determine the unit rate. If not, explain why not.
b. Determine whether Amber’s wages are proportional to time. If they are, determine the unit rate. If not, explain why not.
John’s wages Time (h) Wages ($)
2 18 3 27 4 36

Lesson 8: Representing Proportional Relationships with Equations Date: 7/9/13
71
© 2013 Common Core, Inc. Some rights reserved. commoncore.org This work is licensed under a Creative Commons Attribution-NonCommercial-ShareAlike 3.0 Unported License.
NYS COMMON CORE MATHEMATICS CURRICULUM 7•1 Lesson 8
PENDING FINAL EDITORIAL REVIEW c. Write an equation to model the relationship between each person’s wages. Identify constant of proportionality
for each. Explain what it means in the context of the situation.
d. How much would each worker make after working 10 hours? Who will earn more money?
e. How long will it take each worker to earn $50?

Lesson 8: Representing Proportional Relationships with Equations Date: 7/9/13
72
© 2013 Common Core, Inc. Some rights reserved. commoncore.org This work is licensed under a Creative Commons Attribution-NonCommercial-ShareAlike 3.0 Unported License.
NYS COMMON CORE MATHEMATICS CURRICULUM 7•1 Lesson 8
PENDING FINAL EDITORIAL REVIEW
Exit Ticket Sample Solutions The following solutions indicate an understanding of the objectives of this lesson:
John and Amber work at an ice cream shop. The hours worked and wages earned are given for each person.
a. Determine whether John’s wages are proportional to time. If they are, determine the unit rate. If not, explain why not.
Yes. The unit rate is 9. The collection of ratios is equivalent.
b. Determine whether Amber’s wages are proportional to time. If they are, determine the unit rate. If not, explain why not.
Yes. The unit rate is 8. The collection of ratios is equivalent.
c. Write an equation to model the relationship between each person’s wages. Identify constant of proportionality for each. Explain what it means in the context of the situation.
John: 𝒘 = 𝟗𝒉; constant of proportionality is 𝟗; John earns $𝟗 for every hour he works.
Amber: 𝒘 = 𝟖𝒉; constant of proportionality is 𝟗; Amber earns $𝟖 for every hour she works.
d. How much would each worker make after working 10 hours? Who will earn more money?
After 𝟏𝟎 hours John will earn $90 because 10 hours is the value of the independent variable which should be multiplied by 𝒌 the constant of proportionality. 𝒘 = 𝟗𝒉; 𝒘 = 𝟗(𝟏𝟎); 𝒘 = 𝟗𝟎. After 𝟏𝟎 hours Amber will earn $𝟖𝟎 because her equation is 𝒘 = 𝟖𝒉; 𝒘 = 𝟖(𝟏𝟎); 𝒘 = 𝟖𝟎. John will earn more money than Amber in the same amount of time.
e. How long will it take each worker to earn $50?
To determine how long it will take John to earn $𝟓𝟎, the dependent value will be divided by 9, the constant of
proportionality. Algebraically, this can be shown as a one-step equation: 𝟓𝟎 = 𝟗𝒉; �𝟏𝟗� 𝟓𝟎 = �𝟏
𝟗� 𝟗𝒉;
𝟓𝟎𝟗
= 𝟏 𝒉; 𝟓.𝟓𝟔 = 𝒉 (round to the nearest hundredth). It will take John nearly 𝟔 hours to earn $𝟓𝟎. To find
out how long it will take Amber to earn $𝟓𝟎 divide by 𝟖, her constant of proportionality. 𝟓𝟎 = 𝟖𝒉; �𝟏𝟖� 𝟓𝟎 = �𝟏
𝟖� 𝟖𝒉; 𝟓𝟎
𝟖= 𝟏𝒉; 𝟔.𝟐𝟓 = 𝒉. It will take Amber 𝟔.𝟐𝟓 hours to earn $𝟓𝟎.
John’s wages Time (h) Wages ($)
2 18 18/2 = 9 3 27 27/3 = 9 4 36 36/4 = 9
𝟏𝟔𝟐
= 𝟖
𝟖𝟏
= 𝟖
Lesson 8: Representing Proportional Relationships with Equations Date: 7/9/13
73
© 2013 Common Core, Inc. Some rights reserved. commoncore.org This work is licensed under a Creative Commons Attribution-NonCommercial-ShareAlike 3.0 Unported License.
NYS COMMON CORE MATHEMATICS CURRICULUM 7•1 Lesson 8
PENDING FINAL EDITORIAL REVIEW Problem Set Sample Solutions
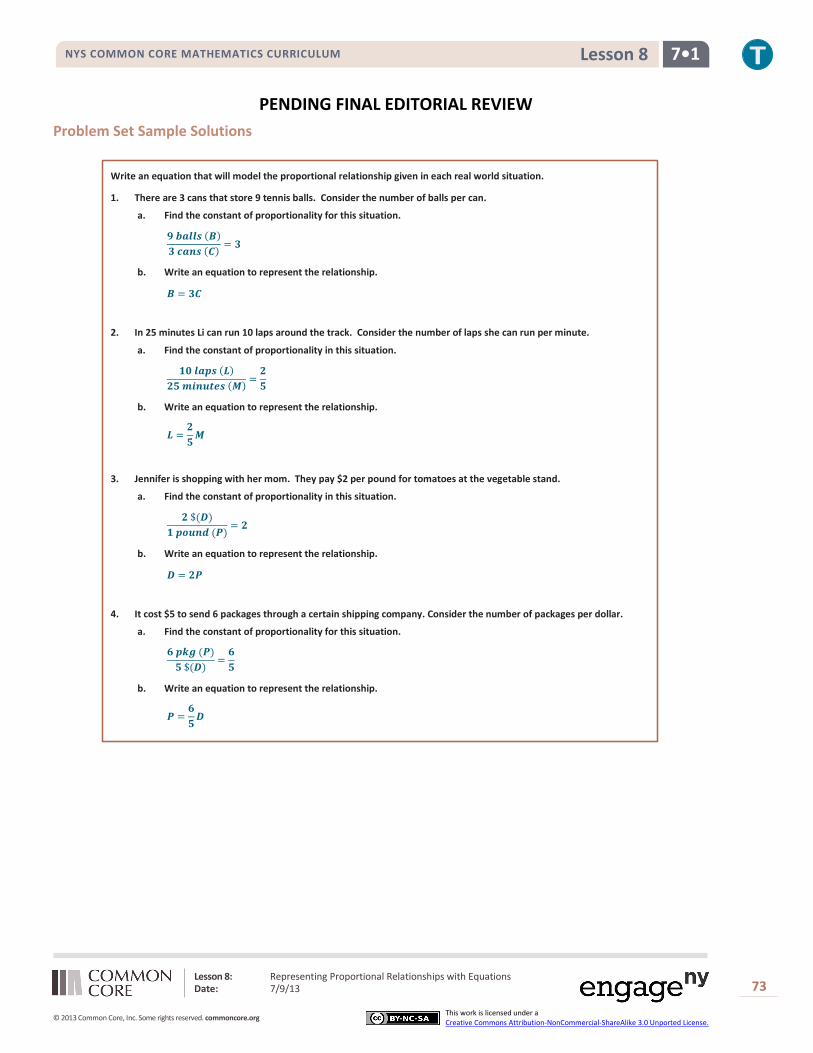
Write an equation that will model the proportional relationship given in each real world situation.
1. There are 3 cans that store 9 tennis balls. Consider the number of balls per can.
a. Find the constant of proportionality for this situation.
𝟗 𝒃𝒂𝒍𝒍𝒔 (𝑩)𝟑 𝒄𝒂𝒏𝒔 (𝑪) = 𝟑
b. Write an equation to represent the relationship.
𝑩 = 𝟑𝑪
2. In 25 minutes Li can run 10 laps around the track. Consider the number of laps she can run per minute.
a. Find the constant of proportionality in this situation.
𝟏𝟎 𝒍𝒂𝒑𝒔 (𝑳)𝟐𝟓 𝒎𝒊𝒏𝒖𝒕𝒆𝒔 (𝑴) =
𝟐𝟓
b. Write an equation to represent the relationship.
𝑳 =𝟐𝟓𝑴
3. Jennifer is shopping with her mom. They pay $2 per pound for tomatoes at the vegetable stand.
a. Find the constant of proportionality in this situation.
𝟐 $(𝑫)𝟏 𝒑𝒐𝒖𝒏𝒅 (𝑷)
= 𝟐
b. Write an equation to represent the relationship.
𝑫 = 𝟐𝑷
4. It cost $5 to send 6 packages through a certain shipping company. Consider the number of packages per dollar.
a. Find the constant of proportionality for this situation.
𝟔 𝒑𝒌𝒈 (𝑷)𝟓 $(𝑫)
=𝟔𝟓
b. Write an equation to represent the relationship.
𝑷 =𝟔𝟓𝑫

Lesson 8: Representing Proportional Relationships with Equations Date: 7/9/13
74
© 2013 Common Core, Inc. Some rights reserved. commoncore.org This work is licensed under a Creative Commons Attribution-NonCommercial-ShareAlike 3.0 Unported License.
NYS COMMON CORE MATHEMATICS CURRICULUM 7•1 Lesson 8
PENDING FINAL EDITORIAL REVIEW
5. On average, Susan downloads 60 songs per month. An online music vendor sells package prices for songs that can be downloaded on to personal digital devices. The graph below shows the package prices for the most popular promotions. Susan wants to know if she should buy her music from this company or pay a flat fee of $58.00 for the month offered by another company. Which is the better buy?
a. Find the constant of proportionality for this situation.
𝒌 = 𝟎.𝟗
b. Write an equation to represent the relationship.
𝑪 = 𝟎.𝟗𝑺
c. Use your equation to find the answer to Susan’s question above. Justify your answer with mathematical evidence and a written explanation.
Compare the flat fee of $58 per month for songs to $.90 per song. If 𝑪 = 𝟎.𝟗𝑺 and we substitute 60 for 𝑺 (number of songs), then the result is 𝑪 = 𝟎.𝟗(𝟔𝟎) = 𝟓𝟒. She would spend $54 on songs when she bought 60 songs. If she maintains the same number of songs the $0.90 cost per song would be cheaper than the flat fee of $58 per month.
6. Allison’s middle school team has designed t-shirts containing their team name and color. Allison and her friend Nicole have volunteered to call local stores to get an estimate on the total cost of purchasing t-shirts. Print-o-Rama charges a set-up fee as well as a fixed amount for each shirt ordered. The total cost is shown below for the given number of shirts. Value T’s and More charges $8 per shirt. Which company should they use?
a. Does either pricing model represent a proportional relationship between quantity of t-shirts and total cost? Explain.
The unit rate for Print-o-Rama is not constant. The graph for Value T’s and More is proportional since the ratios are equivalent (8) and the graph shows a straight line through the origin.
S = # of songs purchased
C = total cost
Constant of proportionality
40 36 𝟑𝟔𝟒𝟎
=𝟗𝟏𝟎
= 𝟎.𝟗𝟎
20 18 𝟏𝟖𝟐𝟎
=𝟗𝟏𝟎
= 𝟎.𝟗𝟎
12 10.80 𝟏𝟎.𝟖𝟎𝟏𝟐
=𝟗𝟏𝟎
= 𝟎.𝟗𝟎
5 4.50 𝟒.𝟓𝟎𝟓
=𝟗𝟏𝟎
= 𝟎.𝟗𝟎
Print-o-Rama
# Shirts (S) Total Cost
(C)
10 95 𝟗𝟓𝟏𝟎
=𝟗.𝟓𝟏
25
50 375 𝟑𝟕𝟓𝟓𝟎
=𝟕.𝟓𝟏
75
100
Not Proportional

Lesson 8: Representing Proportional Relationships with Equations Date: 7/9/13
75
© 2013 Common Core, Inc. Some rights reserved. commoncore.org This work is licensed under a Creative Commons Attribution-NonCommercial-ShareAlike 3.0 Unported License.
NYS COMMON CORE MATHEMATICS CURRICULUM 7•1 Lesson 8
PENDING FINAL EDITORIAL REVIEW
b. Write an equation relating cost and shirts for Value T’s and More.
𝑪 = 𝟖𝑺 for Value T’s and More
c. What is the constant of proportionality ValueT’s and More? What does it represent?
8; the cost of a shirt.
d. How much is Print-o-Rama’s set up fee?
Guess and Check: C= price of a shirt (# of shirts) + set up fee
95 = ______ 10 + _____ or 375 = _______ 50 + ______
Attempt #1 95 = (8) 10 + 15 375 = (8) 50 + 15
95 = 95 𝟑𝟕𝟓 ≠ 𝟒𝟎𝟎+ 𝟏𝟓
Attempt #2 95 = (7) 10 + 25 375 = (7) 50+ 25
95 = 95 375 = 375
Set up fee = $25
e. Write a proposal to your teacher indicating which company the team should use. Be sure to support your choice. Determine the number of shirts that you need for your team.
Since we plan on a purchase of 90 shirts, we should choose Print-o-Rama.
Print-o-Rama: 𝑪 = 𝟕𝑺+ 𝟐𝟓; 𝑪 = 𝟕(𝟗𝟎) + 𝟐𝟓; 𝑪 = 𝟔𝟓𝟓
Value T’s and More: 𝑪 = 𝟖𝑺; 𝑪 = 𝟖(𝟗𝟎); 𝑪 = 𝟕𝟐𝟎

Lesson 9: Representing Proportional Relationships with Equations Date: 7/9/13
76
© 2013 Common Core, Inc. Some rights reserved. commoncore.org This work is licensed under a Creative Commons Attribution-NonCommercial-ShareAlike 3.0 Unported License.
NYS COMMON CORE MATHEMATICS CURRICULUM 7•1 Lesson 9
PENDING FINAL EDITORIAL REVIEW
Lesson 9: Representing Proportional Relationships with
Equations
Student Outcomes
Students use the constant of proportionality to represent proportional relationships by equations in real world contexts, as they relate the equations to a corresponding ratio table and/or graphical representation.
Classwork (35 minutes) Students will begin to write equations in two variables. They will analyze data that will help them understand the constant of proportionality and write the equation with two variables. The teacher may need to explicitly connect the graphical and tabular representations by modeling them side-by-side.
Example 1: Jackson’s Birdhouses
Jackson and his grandfather constructed a model for a birdhouse. Many of their neighbors offered to buy the birdhouses. Jackson decided that building birdhouses could help him earn money for his summer camp but he is not sure how long it will take him to fill all of the requests for birdhouses. If Jackson can build 7 birdhouses in 5 hours, write an equation that will allow Jackson to calculate the time it will take him to build any given number of birdhouses.
1. Write an equation that you could use to find out how long it will take him to build any number of birdhouses.
𝑯 = 𝟓/𝟕 B
Define the variables. 𝐵= # of birdhouses and 𝐻 = number of hours (time constructing birdhouses)
Ask the students: Does it matter which of these variables is independent or dependent?
No If it is important to determine the number of birdhouses can be built in one hour, what is the constant of
proportionality?
# of birdhouses/hours is 7/5 or 1.4.
What does that mean in the context of this situation?
It means that Jackson can build 1.4 birdhouses in one hour or one entire house and part of a second birdhouse in one hour.
If it is important to determine the number of hours it takes to build one birdhouse, what is the constant of proportionality?
# of hours / # of birdhouses is 5/7 or . 71 which means that it takes him 5/7 of an hour to build one bird house or (5/7)(60) = 43 minutes to build one bird house.
MP.2
Lesson 9: Representing Proportional Relationships with Equations Date: 7/9/13
77
© 2013 Common Core, Inc. Some rights reserved. commoncore.org This work is licensed under a Creative Commons Attribution-NonCommercial-ShareAlike 3.0 Unported License.
NYS COMMON CORE MATHEMATICS CURRICULUM 7•1 Lesson 9
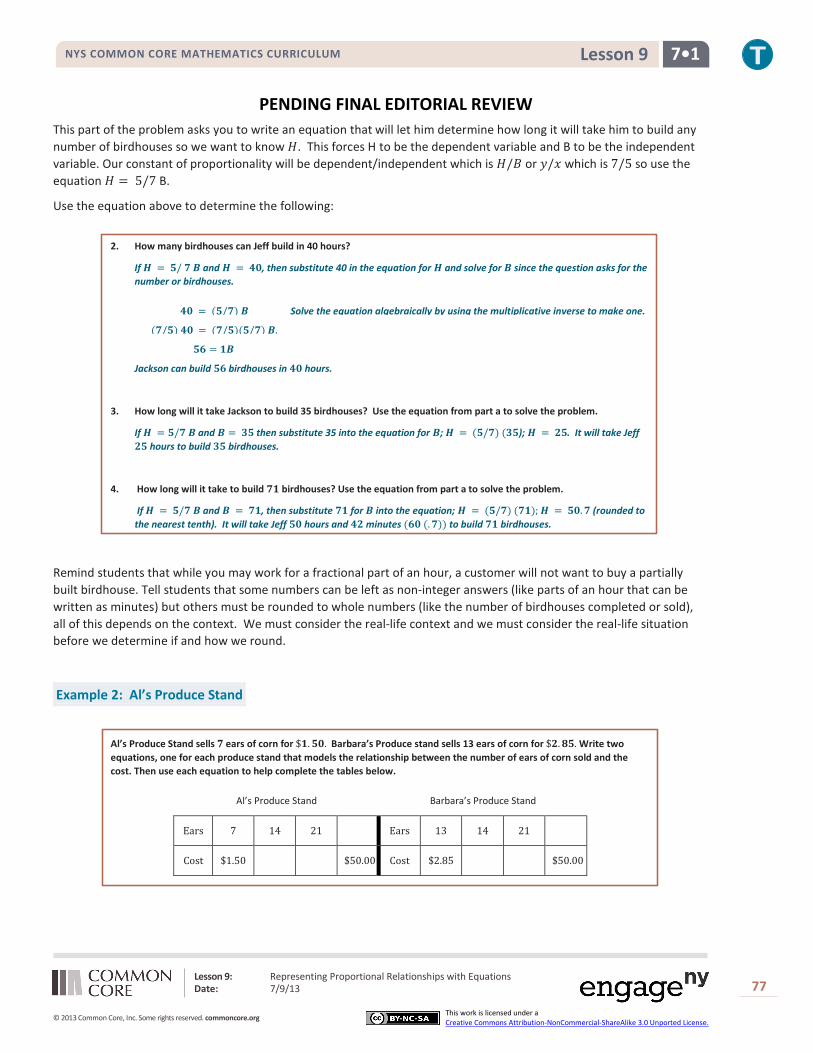
PENDING FINAL EDITORIAL REVIEW This part of the problem asks you to write an equation that will let him determine how long it will take him to build any
number of birdhouses so we want to know 𝐻. This forces H to be the dependent variable and B to be the independent variable. Our constant of proportionality will be dependent/independent which is 𝐻/𝐵 or 𝑦/𝑥 which is 7/5 so use the equation 𝐻 = 5/7 B.
Use the equation above to determine the following:
2. How many birdhouses can Jeff build in 40 hours?
If 𝑯 = 𝟓/ 𝟕 𝑩 and 𝑯 = 𝟒𝟎, then substitute 40 in the equation for 𝑯 and solve for 𝑩 since the question asks for the number or birdhouses.
𝟒𝟎 = (𝟓/𝟕) 𝑩 Solve the equation algebraically by using the multiplicative inverse to make one.
(𝟕/𝟓) 𝟒𝟎 = (𝟕/𝟓)(𝟓/𝟕) 𝑩.
𝟓𝟔 = 𝟏𝑩
Jackson can build 𝟓𝟔 birdhouses in 𝟒𝟎 hours.
3. How long will it take Jackson to build 35 birdhouses? Use the equation from part a to solve the problem.
If 𝑯 = 𝟓/𝟕 𝑩 and 𝑩 = 𝟑𝟓 then substitute 35 into the equation for 𝑩; 𝑯 = (𝟓/𝟕) (𝟑𝟓); 𝑯 = 𝟐𝟓. It will take Jeff 𝟐𝟓 hours to build 𝟑𝟓 birdhouses.
4. How long will it take to build 𝟕𝟏 birdhouses? Use the equation from part a to solve the problem.
If 𝑯 = 𝟓/𝟕 𝑩 and 𝑩 = 𝟕𝟏, then substitute 𝟕𝟏 for 𝑩 into the equation; 𝑯 = (𝟓/𝟕) (𝟕𝟏); 𝑯 = 𝟓𝟎.𝟕 (rounded to the nearest tenth). It will take Jeff 𝟓𝟎 hours and 𝟒𝟐 minutes (𝟔𝟎 (.𝟕)) to build 𝟕𝟏 birdhouses.
Remind students that while you may work for a fractional part of an hour, a customer will not want to buy a partially built birdhouse. Tell students that some numbers can be left as non-integer answers (like parts of an hour that can be written as minutes) but others must be rounded to whole numbers (like the number of birdhouses completed or sold), all of this depends on the context. We must consider the real-life context and we must consider the real-life situation before we determine if and how we round.
Example 2: Al’s Produce Stand
Al’s Produce Stand sells 𝟕 ears of corn for $𝟏.𝟓𝟎. Barbara’s Produce stand sells 13 ears of corn for $𝟐.𝟖𝟓. Write two equations, one for each produce stand that models the relationship between the number of ears of corn sold and the cost. Then use each equation to help complete the tables below.
Al’s Produce Stand Barbara’s Produce Stand
Ears 7 14 21 Ears 13 14 21
Cost $1.50 $50.00 Cost $2.85 $50.00

Lesson 9: Representing Proportional Relationships with Equations Date: 7/9/13
78
© 2013 Common Core, Inc. Some rights reserved. commoncore.org This work is licensed under a Creative Commons Attribution-NonCommercial-ShareAlike 3.0 Unported License.
NYS COMMON CORE MATHEMATICS CURRICULUM 7•1 Lesson 9
PENDING FINAL EDITORIAL REVIEW Let students select any two pairs of numbers from either Al’s Produce stand or Barbara’s Produce stand to calculate the
constant of proportionality (𝑘 = dependent/independent). In order to determine the unit price, students need to divide the cost (dependent variable) by the #of ears of corn (independent variable). Lead them through the following questions to organize their thinking.
Which makes more sense: to use a unit rate of ”ears of corn per dollar” or of “dollars/cents per ear of corn”? Cost per ear of corn makes more sense because corn is sold as an entire ear of corn not part of an ear of
corn.
Based on the previous question, which would be the independent variable?
# of ears of corn
Which would be the dependent variable and why? Cost, because the cost depends on the number of ears of corn purchased.
Have students volunteer to share the pair of numbers they used to determine their unit rate or constant of proportionality and compare the values for Al’s and for Barbara’s.
𝐴𝑙’𝑠 = 0.21 and 𝐵𝑎𝑟𝑏𝑎𝑟𝑎’𝑠 = 0.22
How do you write an equation for a proportional relationship? 𝑦 = 𝑘𝑥
Write the equation for Al’s Produce Stand: 𝑦 = 0.21𝑥
Write the equation for Barbara’s Produce Stand: 𝑦 = 0.22 𝑥
If you used 𝐸 = number of ears of corn and 𝐶 = 𝑐𝑜𝑠𝑡 for the variables instead of 𝑥 and 𝑦, how would you write the equations?
𝐶 = 0.21 𝐸 and 𝐶 = 0.22 𝐸
Closing Questions (5 minutes)
What type of relationship can be modeled using an equation in the form 𝑦 = 𝑘𝑥 and what do you need to know to write an equation in this form?
A proportional relationship can be modeled using an equation in the form 𝑦 = 𝑘𝑥. You need to know the constant of proportionality, which is represented by 𝑘 in the equation.
Give an example of real-world relationships that can be modeled using this type of equation and explain why. Distance equals rate multiplied by time. If the rate of a vehicle is going at an unchanging speed (constant)
then the distance will depend on time elapsed.
How do you determine which value is 𝑥 (independent) and which value is 𝑦 (dependent)?
The value that is determined by multiplying a constant to a value is the dependent variable.
Give an example of real-world relationships that cannot be modeled using this type of equation and explain why.
The distance is the dependent variable and the time the independent variable because time is being multiplied by the rate.
Lesson 9: Representing Proportional Relationships with Equations Date: 7/9/13
79
© 2013 Common Core, Inc. Some rights reserved. commoncore.org This work is licensed under a Creative Commons Attribution-NonCommercial-ShareAlike 3.0 Unported License.
NYS COMMON CORE MATHEMATICS CURRICULUM 7•1 Lesson 9
PENDING FINAL EDITORIAL REVIEW
Lesson Summary:
How do you find the constant of proportionality? Divide to find the unit rate, 𝒚/𝒙 = 𝒌
How do you write an equation for a proportional relationship? 𝒚 = 𝒌𝒙, substituting the value of the constant of proportionality in place of 𝒌.
What is the structure of proportional relationship equations and how do we use them? 𝒙 and 𝒚 values are always left as variables and when one of them is known, they are substituted into 𝒚 = 𝒌𝒙 to find the unknown using algebra.
Exit Ticket (5 minutes)
Problem Set Directions: Print each question on a sheet of paper. Post the questions around the room. Have students work in groups of four and progress from problem to problem. Give students a student record sheet as a place to record their solutions. Use a timer to help students pace the activity and stay on task from one problem to the next. Students within a group should discuss the problem and its solution and agree on the solution as they move from problem to problem.
Lesson 9: Representing Proportional Relationships with Equations Date: 7/9/13
80
© 2013 Common Core, Inc. Some rights reserved. commoncore.org This work is licensed under a Creative Commons Attribution-NonCommercial-ShareAlike 3.0 Unported License.
NYS COMMON CORE MATHEMATICS CURRICULUM 7•1 Lesson 9
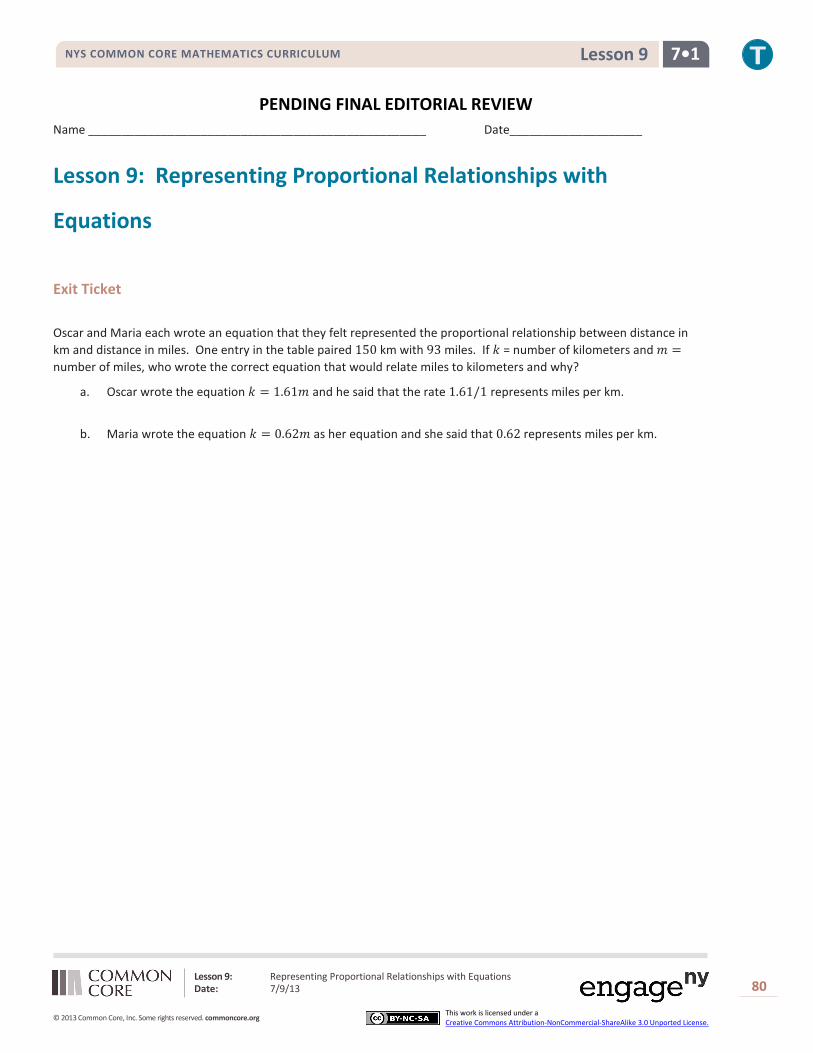
PENDING FINAL EDITORIAL REVIEW Name ___________________________________________________ Date____________________
Lesson 9: Representing Proportional Relationships with
Equations
Exit Ticket Oscar and Maria each wrote an equation that they felt represented the proportional relationship between distance in km and distance in miles. One entry in the table paired 150 km with 93 miles. If 𝑘 = number of kilometers and 𝑚 = number of miles, who wrote the correct equation that would relate miles to kilometers and why?
a. Oscar wrote the equation 𝑘 = 1.61𝑚 and he said that the rate 1.61/1 represents miles per km.
b. Maria wrote the equation 𝑘 = 0.62𝑚 as her equation and she said that 0.62 represents miles per km.
Lesson 9: Representing Proportional Relationships with Equations Date: 7/9/13
81
© 2013 Common Core, Inc. Some rights reserved. commoncore.org This work is licensed under a Creative Commons Attribution-NonCommercial-ShareAlike 3.0 Unported License.
NYS COMMON CORE MATHEMATICS CURRICULUM 7•1 Lesson 9
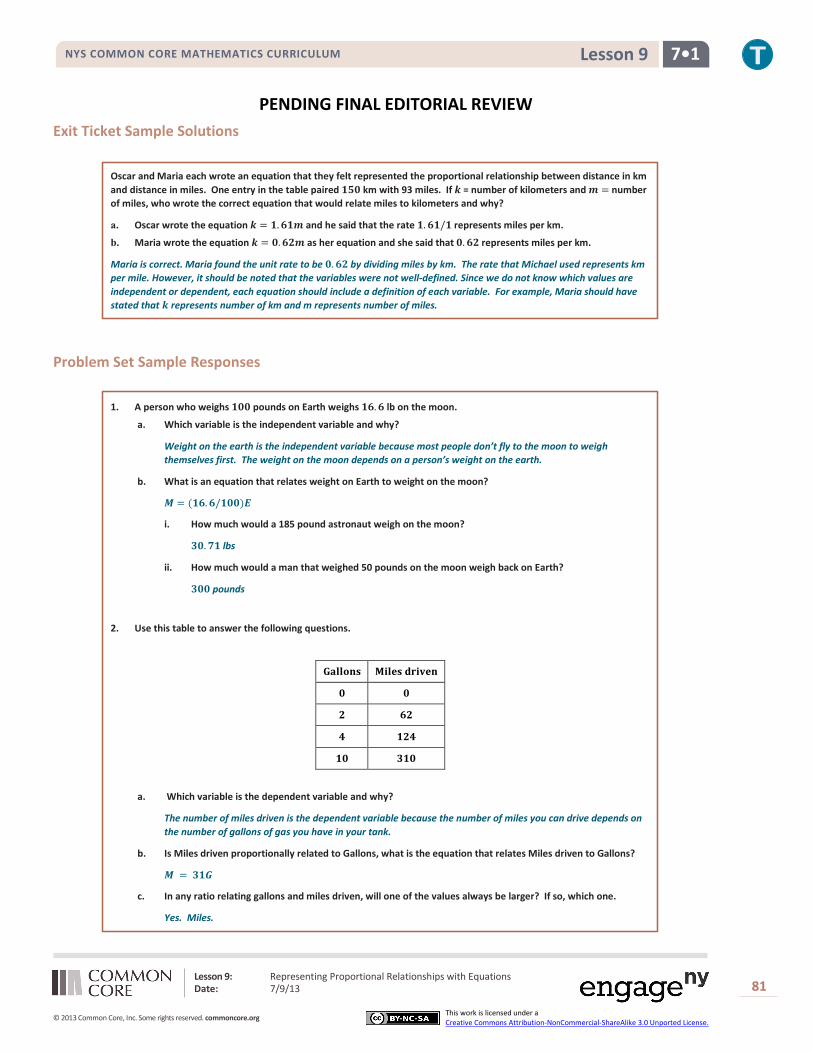
PENDING FINAL EDITORIAL REVIEW Exit Ticket Sample Solutions
Oscar and Maria each wrote an equation that they felt represented the proportional relationship between distance in km and distance in miles. One entry in the table paired 𝟏𝟓𝟎 km with 93 miles. If 𝒌 = number of kilometers and 𝒎 = number of miles, who wrote the correct equation that would relate miles to kilometers and why?
a. Oscar wrote the equation 𝒌 = 𝟏.𝟔𝟏𝒎 and he said that the rate 𝟏.𝟔𝟏/𝟏 represents miles per km.
b. Maria wrote the equation 𝒌 = 𝟎.𝟔𝟐𝒎 as her equation and she said that 𝟎.𝟔𝟐 represents miles per km.
Maria is correct. Maria found the unit rate to be 𝟎.𝟔𝟐 by dividing miles by km. The rate that Michael used represents km per mile. However, it should be noted that the variables were not well-defined. Since we do not know which values are independent or dependent, each equation should include a definition of each variable. For example, Maria should have stated that 𝒌 represents number of km and m represents number of miles.
Problem Set Sample Responses
1. A person who weighs 𝟏𝟎𝟎 pounds on Earth weighs 𝟏𝟔.𝟔 lb on the moon.
a. Which variable is the independent variable and why?
Weight on the earth is the independent variable because most people don’t fly to the moon to weigh themselves first. The weight on the moon depends on a person’s weight on the earth.
b. What is an equation that relates weight on Earth to weight on the moon?
𝑴 = (𝟏𝟔.𝟔/𝟏𝟎𝟎)𝑬
i. How much would a 185 pound astronaut weigh on the moon?
𝟑𝟎.𝟕𝟏 lbs
ii. How much would a man that weighed 50 pounds on the moon weigh back on Earth?
𝟑𝟎𝟎 pounds
2. Use this table to answer the following questions.
𝐆𝐚𝐥𝐥𝐨𝐧𝐬 𝐌𝐢𝐥𝐞𝐬 𝐝𝐫𝐢𝐯𝐞𝐧
𝟎 𝟎
𝟐 𝟔𝟐
𝟒 𝟏𝟐𝟒
𝟏𝟎 𝟑𝟏𝟎
a. Which variable is the dependent variable and why?
The number of miles driven is the dependent variable because the number of miles you can drive depends on the number of gallons of gas you have in your tank.
b. Is Miles driven proportionally related to Gallons, what is the equation that relates Miles driven to Gallons?
𝑴 = 𝟑𝟏𝑮
c. In any ratio relating gallons and miles driven, will one of the values always be larger? If so, which one.
Yes. Miles.

Lesson 9: Representing Proportional Relationships with Equations Date: 7/9/13
82
© 2013 Common Core, Inc. Some rights reserved. commoncore.org This work is licensed under a Creative Commons Attribution-NonCommercial-ShareAlike 3.0 Unported License.
NYS COMMON CORE MATHEMATICS CURRICULUM 7•1 Lesson 9
PENDING FINAL EDITORIAL REVIEW
d. If the number of gallons is known, can you find the miles driven? Explain how this value would be calculated?
Yes. Multiply the constant of proportionality (31 mpg) by the number of gallons.
e. If the number of miles driven is known, can you find the number of gallons consumed?
Explain how this value would be calculated? Yes. Divide the number of miles driven by constant of proportionality (31 mpg).
f. How many miles could be driven with 18 gallons of gas?
558 miles
g. How many gallons are used when the car has been driven 18 miles?
𝟏𝟖/𝟑𝟏 of a gallon
h. How many miles have been driven when ½ of a gallon is used?
𝟑𝟏/𝟐 miles
i. How many gallons have been used when the car has been driven ½ mile?
𝟏/𝟔𝟐 of a gallon
3. Suppose that the cost of renting a snowmobile is $𝟑𝟕.𝟓𝟎 for 5 hours.
a. If the 𝒄 = cost and 𝒉 = hours, which variable is the dependent variable and why?
𝑪 is the dependent variable because the cost of using the snowmobile depends on the number of hours you use it. 𝒄 = 𝟕.𝟓𝒉
b. What would be the cost of renting 2 snow mobiles for 5 hours?
𝒄 = 𝟕.𝟓𝒉
$𝟔𝟎
4. In mom’s car, the number of miles driven is proportional to the number of gallons of gas used.
Gallons Miles
driven
0 0
4 112
6 168
224
10 280
a. Write the equation that will relate the number of miles driven to the gallons of gas.
𝑴 = 𝟐𝟖𝑮
b. What is the constant of proportionality?
𝟐𝟖 miles per gallon
Lesson 9: Representing Proportional Relationships with Equations Date: 7/9/13
83
© 2013 Common Core, Inc. Some rights reserved. commoncore.org This work is licensed under a Creative Commons Attribution-NonCommercial-ShareAlike 3.0 Unported License.
NYS COMMON CORE MATHEMATICS CURRICULUM 7•1 Lesson 9
PENDING FINAL EDITORIAL REVIEW
c. How many miles could you go if you filled your 22-gallon tank?
𝟔𝟏𝟔 miles
d. If your family takes a trip of 600 miles, how many gallons of gas would be needed to make the trip?
𝟏𝟒𝟕 𝟑/𝟕 gallons
e. If you drive 𝟐𝟐𝟒 miles during one week or commuting to school and work, how many gallons of gas would you use?
𝟖 gallons

Lesson 10: Interpreting Graphs of Proportional Relationships Date: 7/9/13
84
© 2013 Common Core, Inc. Some rights reserved. commoncore.org This work is licensed under a Creative Commons Attribution-NonCommercial-ShareAlike 3.0 Unported License.
7•1 Lesson 10 NYS COMMON CORE MATHEMATICS CURRICULUM
PENDING FINAL EDITORIAL REVIEW
Lesson 10: Interpreting Graphs of Proportional
Relationships
Student Outcomes
Students consolidate their understanding of equations representing proportional relationships as they interpret what points on the graph of a proportional relationship mean in terms of the situation or context of the problem, including the point (0, 0).
Students are able to identify and interpret in context, the point (1, 𝑟) on the graph of a proportional relationship, where 𝑟 is the unit rate.
Classwork
Example 1 & 2 (15 minutes)
Example 1 is a review of previously taught concepts but lesson will be built upon this example. Pose the challenge to the students to complete the table.
Have students work individually and then compare and critique each other’s work with a partner.
Example 1
Grandma’s Special Chocolate Chip Cookie recipe calls for 2 cups of flour which yields 9 dozen cookies. Using this information, complete the chart:
Table – Create a chart comparing the amount of flour used to the amount of cookies.
Table – Is the number of cookies proportional to the amount of flour used? Explain
Yes, because there exists a constant = 𝟒/𝟑 or 𝟏 𝟏/𝟑 such that each measure of the cups of flour multiplied by the constant gives the corresponding measure of cookies
Unit Rate – What is the unit rate and what is the meaning in the context of the problem?
1 1/3
1 1/3 dozen cookies or 16 cookies for 1 cup of flour
MP.1 &
MP.2

Lesson 10: Interpreting Graphs of Proportional Relationships Date: 7/9/13
85
© 2013 Common Core, Inc. Some rights reserved. commoncore.org This work is licensed under a Creative Commons Attribution-NonCommercial-ShareAlike 3.0 Unported License.
7•1 Lesson 10 NYS COMMON CORE MATHEMATICS CURRICULUM
PENDING FINAL EDITORIAL REVIEW
Graph – Model the relationship on a graph.
Does the graph show the two quantities being proportional to each other? Explain
The points lie on a line that passes through the origin (0,0).
Equation – Write an equation that can be used to represent the relationship.
𝑫 = 𝟏 𝟏/𝟑𝑭
Or
𝑫 = 𝟏.𝟑�F
D = Number of Dozen Cookies
F = Number of cups of Flour
Example 2
Below is a graph modeling the amount of sugar required to make Grandma’s Chocolate Chip Cookies.
1. Record the coordinates of flour of the points from the graph in a table. What do these ordered pair (values) represent?
(𝟎,𝟎;, O cups of sugar will give 0 dozen cookies
(𝟐,𝟑); 2 cups of sugar yields 3 dozen cookies
(𝟒,𝟔); 4 cups of sugar yields 6 dozen cookies
(𝟖,𝟏𝟐); 8 cups of sugar yields 12 dozen cookies
(𝟏𝟐,𝟏𝟖); 12 cups of sugar yields 18 dozen cookies
(𝟏𝟔,𝟐𝟒); 16 cups of sugar yields 24 dozen cookies
2. Grandma has 1 remaining cup of sugar, how many dozen cookies will she be able to make? Plot the point on the graph above.
1.5 dozen cookies
3. How many dozen cookies can grandma make if she has no sugar? Can you graph this on the grid provided above? What do we call this point?
(𝟎,𝟎); 0 cup of sugar = 0 dozen cookies, point is called the origin
MP.1 &
MP.2

Lesson 10: Interpreting Graphs of Proportional Relationships Date: 7/9/13
86
© 2013 Common Core, Inc. Some rights reserved. commoncore.org This work is licensed under a Creative Commons Attribution-NonCommercial-ShareAlike 3.0 Unported License.
7•1 Lesson 10 NYS COMMON CORE MATHEMATICS CURRICULUM
PENDING FINAL EDITORIAL REVIEW Generate class discussion using the following questions to lead to the conclusion the point (1, 𝑟) must be on the graph
and what it means.
How is the unit rate related to the graph?
The unit rate must be the value of the 𝑦-coordinate of the point on the graph, which has an 𝑥-coordinate of one.
What quantity is measured along the horizontal axis?
sugar
When you plot the ordered pair (𝐴,𝐵), what does 𝐴 represent?
The amount of sugar in cups What quantity is measured along the vertical axis?
The amount of cookies (dozens)
When you plot the point (𝐴,𝐵), what does 𝐵 represent?
The total amount of cookies
What is the unit rate for this proportional relationship?
1.5 Starting at the origin, if you move one unit along the horizontal axis, how far would you have to move vertically
to reach the line you graphed?
1.5 units
Why are we always moving 1.5 units vertically?
The unit rate is 1.5 dozen cookies for every 1 cup of sugar. The vertical axis or 𝑦 value represents the
number of cookies. Since the unit rate is 1.5 𝑑𝑜𝑧𝑒𝑛 𝑐𝑜𝑜𝑘𝑖𝑒𝑠 1 𝑐𝑢𝑝 𝑜𝑓 𝑠𝑢𝑔𝑎𝑟
every vertical move would equal the unit
rate of 1.5 units. Continue moving one unit at a time along the horizontal axis. What distance vertically do you move?
1.5 units
Does this number look familiar? Is it the unit rate? Do you think this will always be the case, whenever two quantities that are proportional are graphed?
The vertical distance is the same as the unit rate. Yes the vertical distance will always be the equal to the unit rate when moving one unit horizontally on the axis.
Graphs of different proportional relationship have different points but what point must be on every graph of a proportional relationship and why?
The point (1, 𝑟) or unit rate must be on every graph because the unit rate describes the change in the vertical distance for every 1 unit change in the horizontal axis.

Lesson 10: Interpreting Graphs of Proportional Relationships Date: 7/9/13
87
© 2013 Common Core, Inc. Some rights reserved. commoncore.org This work is licensed under a Creative Commons Attribution-NonCommercial-ShareAlike 3.0 Unported License.
7•1 Lesson 10 NYS COMMON CORE MATHEMATICS CURRICULUM
PENDING FINAL EDITORIAL REVIEW Exercises (15 minutes)
Sample responses to the questions:
1. The graph below shows the amount of time a person can shower with a certain amount of water.
a. Can you determine by looking at the graph whether the length of the shower is proportional to the number of gallons of water? Explain how you know.
Yes, the quantities are proportional to each other since it is a line containing all points that passes through the origin (𝟎,𝟎)
b. How long can a person shower with 15 gallons of water? With 60 gallons of water?
𝟓 minutes, 𝟐𝟎 minutes
c. What are the coordinates of point A? Describe point A in the context of the problem.
(𝟑𝟎,𝟏𝟎) If there is 30 gallons of water then a person can shower for 10 minutes.
d. Can you use the graph to identify the unit rate?
Since the graph is a line that passes through (𝟎,𝟎) and (𝟏, 𝒓), you can take a point on
the graph, such as (𝟏𝟓,𝟓) and get 𝟏𝟑
.
e. Plot the unit rate on the graph. Is the point on the line of this relationship?
Yes the unit rate is a point on the graph of the relationship.
f. Write the equation to represent the relationship between the number of gallons used and the length of a shower.
𝒎 = 𝟏𝟑
𝒈 where 𝒎 is minutes and 𝒈 is gallons
2. Your friend uses the equation 𝑪 = 𝟓𝟎𝑷 to find the total cost of P people entering the local Amusement Park.
a. Create a table and record the cost of entering the amusement park for several different-sized groups of people.
b. Is the cost of admission proportional to the amount of people entering the Amusement Park? Why or why not?
Yes, because there exists a constant = 50 such that each measure of the amount of people multiplied by the constant gives the corresponding measures of cost.
Scaffolding:
Is it possible to switch the labels on the 𝑥 and 𝑦 axis? Can the gallons depend on
the minutes? How would this change the
problem?
Lesson 10: Interpreting Graphs of Proportional Relationships Date: 7/9/13
88
© 2013 Common Core, Inc. Some rights reserved. commoncore.org This work is licensed under a Creative Commons Attribution-NonCommercial-ShareAlike 3.0 Unported License.
7•1 Lesson 10 NYS COMMON CORE MATHEMATICS CURRICULUM
PENDING FINAL EDITORIAL REVIEW
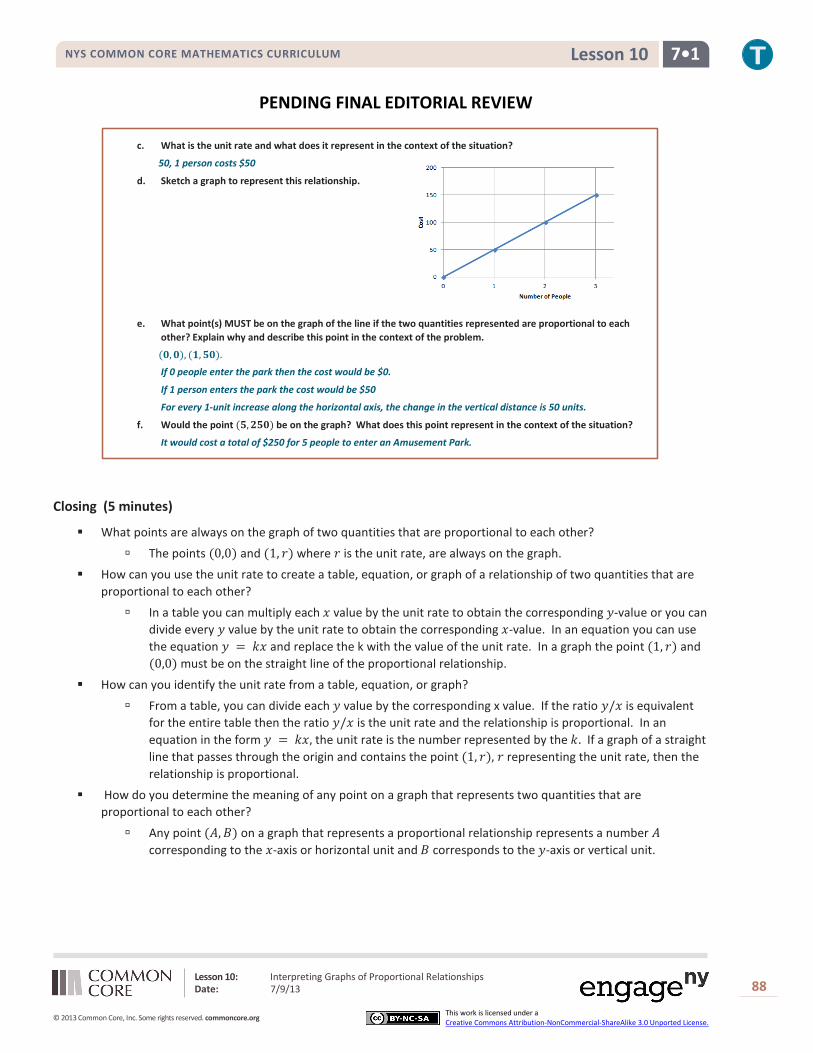
c. What is the unit rate and what does it represent in the context of the situation?
50, 1 person costs $50
d. Sketch a graph to represent this relationship.
e. What point(s) MUST be on the graph of the line if the two quantities represented are proportional to each
other? Explain why and describe this point in the context of the problem.
(𝟎,𝟎), (𝟏,𝟓𝟎). If 0 people enter the park then the cost would be $0.
If 1 person enters the park the cost would be $50
For every 1-unit increase along the horizontal axis, the change in the vertical distance is 50 units.
f. Would the point (𝟓,𝟐𝟓𝟎) be on the graph? What does this point represent in the context of the situation?
It would cost a total of $250 for 5 people to enter an Amusement Park.
Closing (5 minutes)
What points are always on the graph of two quantities that are proportional to each other?
The points (0,0) and (1, 𝑟) where 𝑟 is the unit rate, are always on the graph.
How can you use the unit rate to create a table, equation, or graph of a relationship of two quantities that are proportional to each other?
In a table you can multiply each 𝑥 value by the unit rate to obtain the corresponding 𝑦-value or you can divide every 𝑦 value by the unit rate to obtain the corresponding 𝑥-value. In an equation you can use the equation 𝑦 = 𝑘𝑥 and replace the k with the value of the unit rate. In a graph the point (1, 𝑟) and (0,0) must be on the straight line of the proportional relationship.
How can you identify the unit rate from a table, equation, or graph?
From a table, you can divide each 𝑦 value by the corresponding x value. If the ratio 𝑦/𝑥 is equivalent for the entire table then the ratio 𝑦/𝑥 is the unit rate and the relationship is proportional. In an equation in the form 𝑦 = 𝑘𝑥, the unit rate is the number represented by the 𝑘. If a graph of a straight line that passes through the origin and contains the point (1, 𝑟), 𝑟 representing the unit rate, then the relationship is proportional.
How do you determine the meaning of any point on a graph that represents two quantities that are proportional to each other?
Any point (𝐴,𝐵) on a graph that represents a proportional relationship represents a number 𝐴 corresponding to the 𝑥-axis or horizontal unit and 𝐵 corresponds to the 𝑦-axis or vertical unit.
Lesson 10: Interpreting Graphs of Proportional Relationships Date: 7/9/13
89
© 2013 Common Core, Inc. Some rights reserved. commoncore.org This work is licensed under a Creative Commons Attribution-NonCommercial-ShareAlike 3.0 Unported License.
7•1 Lesson 10 NYS COMMON CORE MATHEMATICS CURRICULUM
PENDING FINAL EDITORIAL REVIEW
Lesson Summary:
The points (𝟎,𝟎) and (𝟏, 𝒓), where r is the unit rate, will always fall on the line representing two quantities that are proportional to each other.
The unit rate r in the point (𝟏, 𝒓) represents the amount of vertical increase for every horizontal increase of 1 unit on the graph.
The point (𝟎,𝟎) indicates that when there is zero amount of one quantity, there will also be zero amount of the second quantity.
These two points may not always be given as part of the set of data for a given real-world or mathematical situation, but they will always fall on the line that passes through the given data points.
Exit Ticket (5 minutes)
Lesson 10: Interpreting Graphs of Proportional Relationships Date: 7/9/13
90
© 2013 Common Core, Inc. Some rights reserved. commoncore.org This work is licensed under a Creative Commons Attribution-NonCommercial-ShareAlike 3.0 Unported License.
7•1 Lesson 10 NYS COMMON CORE MATHEMATICS CURRICULUM
PENDING FINAL EDITORIAL REVIEW Name ___________________________________________________ Date____________________
Lesson 10: Interpreting Graphs of Proportional Relationships
Exit Ticket Great Rapids White Watering Company rents rafts for $125 per hour. Explain why the point (0,0) and (1,125) are on the graph of the relationship and what these points mean in the context of the problem.
Lesson 10: Interpreting Graphs of Proportional Relationships Date: 7/9/13
91
© 2013 Common Core, Inc. Some rights reserved. commoncore.org This work is licensed under a Creative Commons Attribution-NonCommercial-ShareAlike 3.0 Unported License.
7•1 Lesson 10 NYS COMMON CORE MATHEMATICS CURRICULUM
PENDING FINAL EDITORIAL REVIEW Exit Ticket Sample Solutions
The following responses indicate an understanding of the objectives of this lesson:
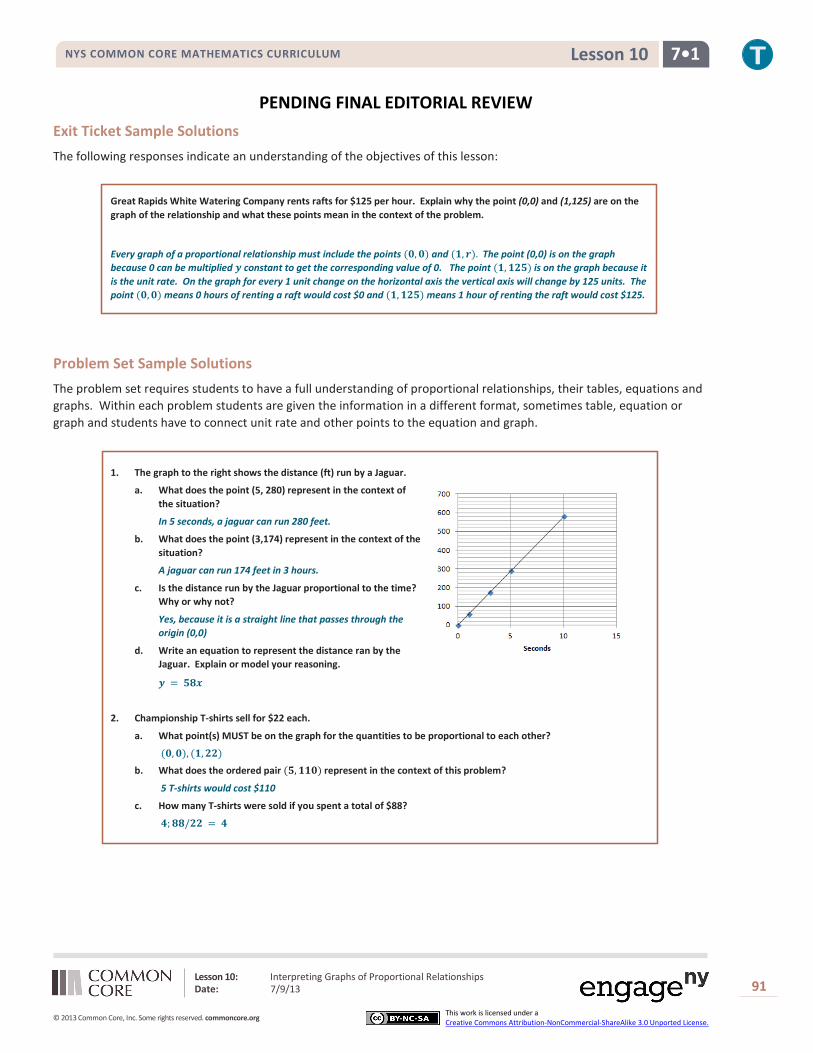
Great Rapids White Watering Company rents rafts for $125 per hour. Explain why the point (0,0) and (1,125) are on the graph of the relationship and what these points mean in the context of the problem.
Every graph of a proportional relationship must include the points (𝟎,𝟎) and (𝟏,𝒓). The point (0,0) is on the graph because 0 can be multiplied 𝒚 constant to get the corresponding value of 0. The point (𝟏,𝟏𝟐𝟓) is on the graph because it is the unit rate. On the graph for every 1 unit change on the horizontal axis the vertical axis will change by 125 units. The point (𝟎,𝟎) means 0 hours of renting a raft would cost $0 and (𝟏,𝟏𝟐𝟓) means 1 hour of renting the raft would cost $125.
Problem Set Sample Solutions The problem set requires students to have a full understanding of proportional relationships, their tables, equations and graphs. Within each problem students are given the information in a different format, sometimes table, equation or graph and students have to connect unit rate and other points to the equation and graph.
1. The graph to the right shows the distance (ft) run by a Jaguar.
a. What does the point (5, 280) represent in the context of the situation?
In 5 seconds, a jaguar can run 280 feet.
b. What does the point (3,174) represent in the context of the situation?
A jaguar can run 174 feet in 3 hours.
c. Is the distance run by the Jaguar proportional to the time? Why or why not?
Yes, because it is a straight line that passes through the origin (0,0)
d. Write an equation to represent the distance ran by the Jaguar. Explain or model your reasoning.
𝒚 = 𝟓𝟖𝒙
2. Championship T-shirts sell for $22 each.
a. What point(s) MUST be on the graph for the quantities to be proportional to each other?
(𝟎,𝟎), (𝟏,𝟐𝟐)
b. What does the ordered pair (𝟓,𝟏𝟏𝟎) represent in the context of this problem?
5 T-shirts would cost $110
c. How many T-shirts were sold if you spent a total of $88?
𝟒;𝟖𝟖/𝟐𝟐 = 𝟒

Lesson 10: Interpreting Graphs of Proportional Relationships Date: 7/9/13
92
© 2013 Common Core, Inc. Some rights reserved. commoncore.org This work is licensed under a Creative Commons Attribution-NonCommercial-ShareAlike 3.0 Unported License.
7•1 Lesson 10 NYS COMMON CORE MATHEMATICS CURRICULUM
PENDING FINAL EDITORIAL REVIEW
3. The following graph represents the total cost of renting a car. The cost of renting a car is a fixed amount each day, regardless of how many miles the car is driven. It doesn’t matter how many miles you drive, you just pay an amount per day.
a. What does the ordered pair (4,250) represent?
It would cost $250 to rent a car for 4 days.
b. What would be the cost to rent the car for a week? Explain or model your reasoning.
Since the unit rate is 62.5, the cost for a week would be
𝟔𝟐.𝟓(𝟕) = 𝟒𝟑𝟕.𝟓𝟎
4. Jackie is making a snack mix for a party. She is using M&M’s and peanuts. The table below shows how many
packages of M&M’s she needs to how many cans of peanuts she needs to make the mix.
a. What points MUST be on the graph for the number of cans of peanuts to be proportional to the packages of M&M’s? Explain why.
(0,0) (1,2), All graphs of proportional relationships are straight lines that passes through the origin (0,0) and the unit rate (1,r)
b. Write an equation to represent this relationship.
𝒚 = 𝟐𝒙 c. Describe the ordered pair (12,24) in the context of the problem.
In the mixture you will need 12 packages of M&M’s to 24 cans of peanuts
5. The following table shows the amount of candy and price paid.
Amount of Candy (pounds) 2 3 5
Cost (Dollars) 5 7.5 12.5
a. Is the cost of candy proportional to the amount of candy?
Yes, because there exists a constant = 2.5 such that each measure of the amount of candy multiplied by the constant gives the corresponding measure of cost.
b. Write an equation to illustrate the relationship between the amount of candy and the cost.
𝒚 = 𝟐.𝟓𝒙 c. Using the equation, predict how much it will cost for 12
pounds of candy?
𝟐.𝟓(𝟏𝟐) = $𝟑𝟎 d. What is the maximum amount of candy you can buy
with $60?
𝟔𝟎/𝟐.𝟓 = 𝟐𝟒 𝒑𝒐𝒖𝒏𝒅𝒔 e. Graph the relationship
Packages of M&M’s
Cans of Peanuts
0 0
1 2
2 4
3 6
4 8
Module 1: Ratios and Proportional Relationships Date: 7/9/13
93
© 2013 Common Core, Inc. Some rights reserved. commoncore.org This work is licensed under a Creative Commons Attribution-NonCommercial-ShareAlike 3.0 Unported License.
7•1 Mid-Module Assessment Task NYS COMMON CORE MATHEMATICS CURRICULUM
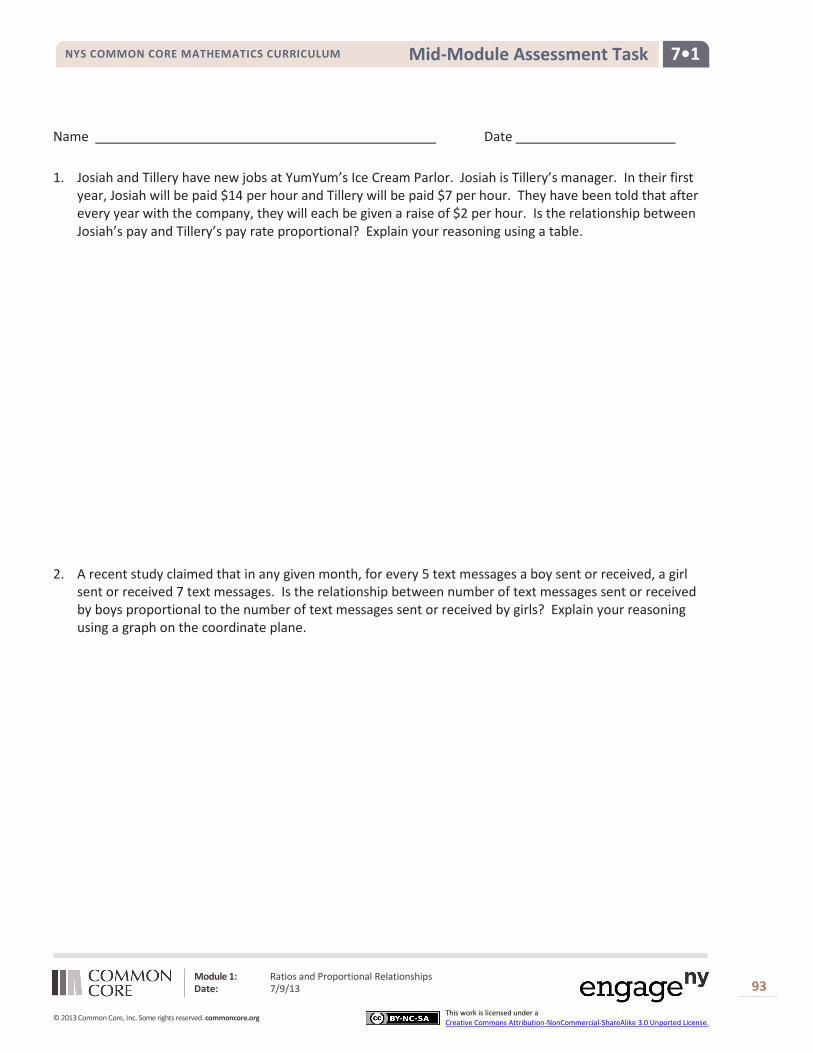
Name Date 1. Josiah and Tillery have new jobs at YumYum’s Ice Cream Parlor. Josiah is Tillery’s manager. In their first
year, Josiah will be paid $14 per hour and Tillery will be paid $7 per hour. They have been told that after every year with the company, they will each be given a raise of $2 per hour. Is the relationship between Josiah’s pay and Tillery’s pay rate proportional? Explain your reasoning using a table.
2. A recent study claimed that in any given month, for every 5 text messages a boy sent or received, a girl sent or received 7 text messages. Is the relationship between number of text messages sent or received by boys proportional to the number of text messages sent or received by girls? Explain your reasoning using a graph on the coordinate plane.

Module 1: Ratios and Proportional Relationships Date: 7/9/13
94
© 2013 Common Core, Inc. Some rights reserved. commoncore.org This work is licensed under a Creative Commons Attribution-NonCommercial-ShareAlike 3.0 Unported License.
7•1 Mid-Module Assessment Task NYS COMMON CORE MATHEMATICS CURRICULUM
3. When a song is sold by an online music store, the store takes some of the money and the singer gets the rest. The graph below shows how much money a pop singer makes given the total amount of money brought in by one popular online music store from sales of the song.
a. Identify the constant of proportionality between dollars earned by the pop singer and dollars brought in by sales of the song.
b. Write an equation relating dollars earned by the pop singer, y, to dollars brought in by sales of the song, x.

Module 1: Ratios and Proportional Relationships Date: 7/9/13
95
© 2013 Common Core, Inc. Some rights reserved. commoncore.org This work is licensed under a Creative Commons Attribution-NonCommercial-ShareAlike 3.0 Unported License.
7•1 Mid-Module Assessment Task NYS COMMON CORE MATHEMATICS CURRICULUM
c. According to the proportional relationship, how much money did the song bring in from sales in the first week, if the pop star earned $800 that week?
d. Describe what the point (0, 0) on the graph represents in terms of the situation being described by the graph.
e. Which point on the graph represents the amount of money the pop singer gets for $1 in money brought in from sales of the song by the store?

Module 1: Ratios and Proportional Relationships Date: 7/9/13
96
© 2013 Common Core, Inc. Some rights reserved. commoncore.org This work is licensed under a Creative Commons Attribution-NonCommercial-ShareAlike 3.0 Unported License.
7•1 Mid-Module Assessment Task NYS COMMON CORE MATHEMATICS CURRICULUM
A Progression Toward Mastery
Assessment Task Item
STEP 1 Missing or incorrect answer and little evidence of reasoning or application of mathematics to solve the problem.
STEP 2 Missing or incorrect answer but evidence of some reasoning or application of mathematics to solve the problem.
STEP 3 A correct answer with some evidence of reasoning or application of mathematics to solve the problem, or an incorrect answer with substantial evidence of solid reasoning or application of mathematics to solve the problem.
STEP 4 A correct answer supported by substantial evidence of solid reasoning or application of mathematics to solve the problem.
1
7.RP.2a Student answered incorrectly. Student was unable to complete at least two correct pairs of values in the table. Student was unable to respond or reason out their answer.
Student may or may not have answered that the relationship was not proportional. Student was able to complete at least two correct pairs of values in the table. Student provided a limited expression of reasoning.
Student correctly answered that the relationship was not proportional. The table was correctly set up with at least two correct entries. Student’s reasoning may have contained a minor error.
Student correctly answered that the relationship was not proportional. Student provided correct set-up and values of table with two or more correct entries. Student reasoned AND demonstrated that there was no constant of proportionality or that the constant of proportionality changes for each pair of values.
2 7.RP.2a Student answered incorrectly. Student was unable to give a complete graph AND/OR was unable to relate the proportional relationship to the graph.
Student may or may not have answered that the relationship was proportional. Student provided a graph with mistakes (unlabeled axis, incorrect points). Student provided a limited expression of reasoning.
Student correctly answered that the relationship was proportional. Student labeled the axis AND plotted points with minor error. Student explanation was slightly incomplete.
Student correctly answered that the relationship was proportional. Student correctly labeled the axis AND plotted the graph on the coordinate plane. Student explained that the proportional relationship was confirmed by the fact that the graph was a straight line going through the origin.

Module 1: Ratios and Proportional Relationships Date: 7/9/13
97
© 2013 Common Core, Inc. Some rights reserved. commoncore.org This work is licensed under a Creative Commons Attribution-NonCommercial-ShareAlike 3.0 Unported License.
7•1 Mid-Module Assessment Task NYS COMMON CORE MATHEMATICS CURRICULUM
3
a
7.RP.2b
Student was unable to answer 𝑘 = 1
5 AND no
work was shown.
Student was unable to answer 𝑘 = 1
5. Concept
of constant of proportionality was used incorrectly.
Student correctly answered 𝑘 = 1
5, but
provided no work to support answer.
Student correctly answered 𝑘 = 1
5.
Student provided error-free work to support answer.
b
7.RP.2c
Student was unable to write an equation or wrote an equation that was not in the form 𝑦 = 𝑘𝑥 or even 𝑥 = 𝑘𝑦 for any value k.
Student wrote an incorrect equation, such as 𝑦 = 5𝑥, or 𝑥 = 1
5𝑦,
AND/OR used an incorrect value of k from part (a) to write the equation in the form 𝑦 = 𝑘𝑥.
Student created an equation using the constant of proportionality, but wrote the equation in the form 𝑥 = 5𝑦 or some other equivalent equation.
Student correctly answered 𝑦 = 1
5𝑥.
c
7.RP.2d
Student answered incorrectly and shows no or little understanding of analyzing graphs.
Student answered incorrectly, but shows some understanding of analyzing graphs AND/OR solving equations.
Student answered $4,000 in sales, but student’s work was incomplete OR the student correctly demonstrated the steps taken to solve the equation from part (b), but with a computational error.
Student answered $4,000 in sales AND had no errors in the steps taken to arrive at the answer.
d
7.RP.2d
Student was unable to describe the situation correctly.
Student was able to explain that the zero was the dollar amount to either the singers’ earnings or sales, but was unable to describe the relationship.
Student describes the situation correctly, but with minor error.
Student correctly explains that (0,0) represents the situation that zero sales leads to zero earnings for the singer.
e
7.RP.2d
Student was unable to identify either of the x- or y-coordinate of the point.
Student answers only one of the ordered pair values correctly.
Student correctly identifies the x-coordinate as 1 and the y-coordinate as 1
5, but
does not put it in an ordered pair form.
Student correctly answered (1, 1
5).

Module 1: Ratios and Proportional Relationships Date: 7/9/13
98
© 2013 Common Core, Inc. Some rights reserved. commoncore.org This work is licensed under a Creative Commons Attribution-NonCommercial-ShareAlike 3.0 Unported License.
7•1 Mid-Module Assessment Task NYS COMMON CORE MATHEMATICS CURRICULUM

Module 1: Ratios and Proportional Relationships Date: 7/9/13
99
© 2013 Common Core, Inc. Some rights reserved. commoncore.org This work is licensed under a Creative Commons Attribution-NonCommercial-ShareAlike 3.0 Unported License.
7•1 Mid-Module Assessment Task NYS COMMON CORE MATHEMATICS CURRICULUM

Module 1: Ratios and Proportional Relationships Date: 7/9/13
100
© 2013 Common Core, Inc. Some rights reserved. commoncore.org This work is licensed under a Creative Commons Attribution-NonCommercial-ShareAlike 3.0 Unported License.
7•1 Mid-Module Assessment Task NYS COMMON CORE MATHEMATICS CURRICULUM