new york economic handbook 2009ageconsearch.umn.edu/bitstream/121831/2/cornell_aem… · ·...
TRANSCRIPT

December 2008 E.B. 2008-25
New York Economic Handbook
2009
Department of Applied Economics and Management College of Agriculture and Life Sciences
Cornell University Ithaca, NY 14853-7801

It is the Policy of Cornell University actively to support equality of educational and employment opportunity. No person shall be denied admission to any educational program or activity or be denied employment on the basis of any legally prohibited discrimination involving, but not limited to, such factors as race, color, creed, religion, national or ethnic origin, sex, age or handicap. The University is committed to the maintenance of affirmative action programs which will assure the continuation of such equality of opportunity. This material is based upon work supported by Smith Lever funds from the Cooperative State Research, Education, and Extension Service, U.S. Department of Agriculture. Any opinions, findings, conclusions, or recommendations expressed in this publication are those of the author(s) and do not necessarily reflect the view of the U.S. Department of Agriculture. Publication Price Per Copy: $10.00 For additional copies, contact:
Linda Putnam Dept. of Applied Economics and Management Agricultural Finance and Management Group 305 Warren Hall Cornell University Ithaca, New York 14853-7801
E-mail: [email protected] Fax: 607-255-1589 Phone: 607-255-8429 Or visit:
http://aem.cornell.edu/outreach/publications.htm

i
Table of Contents Chapter Topic Author(s)* Page
1 Websites for Economic Information and Commentary
Steven Kyle 1-1
2 The Marketing System Kristen Park 2-1
3 Cooperatives Brian Henehan and Todd Schmit 3-1
4 Finance Calum Turvey 4-1
5 Grain and Feed William Tomek and Todd Schmit 5-1
6 Dairy – Markets and Policy Mark Stephenson 6-1
7 Dairy – Farm Management Wayne Knoblauch, George Conneman and Linda Putnam
7-1
8 Labor Outlook for New York Agriculture 2009
Thomas Maloney, Marc Smith and Mary Jo Dudley
8-1
9 Agriculture and the Environment Nelson Bills and Gregory Poe 9-1
10 Specialty Crops Miguel Gómez and Bradley Rickard 10-1
____________________ *Faculty or staff in the Department of Applied Economics and Management, Cornell University, except Mary Jo Dudley, Department of Development Sociology, Cornell University.
This publication contains information pertaining to the general economic situation and New York agriculture. It is prepared primarily for use by professional agricultural workers in New York State. USDA reports provide current reference material pertaining to the nation’s agricultural situation. Many of these reports are available on the internet. Click on “Newsroom” at the following website: http://www.usda.gov/wps/portal/usdahome
The chapters in this handbook are available in PDF format on the Applied Economics and
Management outreach website: http://aem.cornell.edu/outreach/publications.htm

ii

S.C. Kyle Websites for Economic Information and Commentary
Chapter 1. Websites for Economic Information and Commentary
Steven C. Kyle, Associate Professor
1. http://rfe.org Resources for Economists This American Economics Association website has an encyclopedic list of all sorts of web-based economics sites.
2. http://www.economagic.com/ Economagic -- Economic Times Series PageEconomagic is an excellent site for all kinds of U.S. economic data, including national income accounts, the Federal Reserve, the Bureau of Labor Statistics and more. The site includes a very useful graphing function and allows downloads to excel worksheets as well as simple statistical functions.
3. http://www.econstats.com/ Economic Statistics EconStats is another site with links to all kinds of US data. It also has links to data for many other countries.
4. http://www.whitehouse.gov/fsbr/esbr.html Economics Statistics Briefing RoomThis is the White House site for overall economics statistics. This also includes links to other parts of the government.
5. http://www.cbpp.org/index.html Center on Budget and Policy PrioritiesThe Center on Budget and Policy Priorities is a non-partisan web site that focuses on economic policies related to the budget and their effects on low- and moderate-income people.
6. http://www.argmax.com/ ArgMaxThis is an excellent site for economic news, data links and analysis.
7. http://www.econlib.org/ Library of Economics and LibertyThe Library of Economics and Liberty web site features articles and links to many books and other economics related resources.
8. http://www.heritage.org/ Heritage FoundationThe Heritage Foundation comments on economic policy from a conservative viewpoint. This link takes you to a very useful federal budget calculator that will help you understand what the federal government spends its money on and where they get the money from.
9. http://www.kowaldesign.com/budget/ Budget ExplorerThis site contains a budget explorer which I like because it allows you not only to calculate your own budget but also links to the various executive branch departments with spending authority, so you can see exactly where the money is going.
10. http://www.concordcoalition.org/ The Concord CoalitionThe Concord Coalition is a non-partisan group advocating a balanced budget. Their site contains very useful graphs and projections showing what current taxing and spending proposals mean for the federal budget in the years ahead.
11. http://www.economy.com/dismal/ The Dismal ScientistThis is a very good web site for evaluations of current statistics and policy.

Page 1-2 2009 Outlook Handbook
Websites for Economic Information and Commentary S.C. Kyle
12. http://www.federalbudget.com/ National Debt Awareness CenterThe National Debt Awareness Center has a useful graph providing up to date information on the size of the national debt and what the Federal Government is spending money on.
13. http://www.ombwatch.org/ OMB WatchOMB Watch is another web site devoted to information on what is happening to the federal budget.
14. http://www.brook.edu/default.htm The Brookings InstitutionThe Brookings Institution publishes lots of good articles on current economic and political policy.
15. http://www.realtor.org National Assoc. of RealtorsCheck this site if you want information on real estate.
16. http://www.census.gov/ U.S. Census BureauThe U.S. Census Bureau web site provides demographic and population numbers.
17. http://www.briefing.com/Investor/Index.htm Briefing.comFor a more in-depth analysis of stock and bond markets and the factors that influence them, check out Briefing.com.
18. http://www.imf.org/ International Monetary FundThe International Monetary Fund is an excellent site for data on all member countries, with a particular emphasis on balance of payments, exchange rate and financial/monetary data.
19. http://worldbank.org/ The World Bank Group The World Bank has cross country data on a wide variety of subjects.
20. http://www.undp.org/ United Nations Development Programme The UNDP has cross country data with a particular focus on measures of human welfare and poverty.
21. http://www.fao.org/ Food and Agriculture Organization of the UNThe Food and Agriculture Organization of the UN has cross country information on food and agriculture.
22. http://datacentre2.chass.utoronto.ca/pwt/ Penn World TablesThe Penn World Tables are a useful source for a variety of economic data series not available from other sources.
23. http://www.bls.gov/fls/ U.S. Department of Labor, Foreign Labor StatisticsThe Foreign Labor Statistics program provides international comparisons of hourly compensation costs; productivity and unit labor costs; labor force, employment and unemployment rates; and consumer prices. The comparisons relate primarily to the major industrial countries, but other countries are included in certain measures.
24. http://www.kyle.aem.cornell.edu/ Professor Kyle’s Web SiteVisit my web site for information about me, material contained in this chapter, and my work in the area of economic policy.

K. S. Park The Marketing System
Chapter 2. The Marketing System Kristen S. Park, Extension Associate
Special Topic – The Economy’s Effect on Marketing and Promotion
One of the most important system issues is the economy. Banking, stock market, and fuel prices have sent shocks into all sectors, including food. Food price increases hit year-ago rates of 8-8.5% at times during 2008, and fuel costs are still high, although they continue to drop. As a matter of fact, after a year of higher than usual inflation, economists are now watching for signs of deflation.
The Department of Commerce’s Monthly
Retail Trade and Food Service Sales figures indicate that, during the month of September 2008, retail sales were down 0.3% from a year ago, September 2007 (Figure 2 – 1). Because people still need to eat, however, food retailers are doing better than the average retailer. Supermarket sales were up 3.7% and Warehouse Clubs and Supercenters (for example Costco and Walmart) were up 5.9%. Interestingly enough Beer, Wine, and Liquor store sales were up 5.6% and Drinking Establishment sales were up 7.4%.
Shoppers themselves are interested in self
preservation and in downsizing their purchasing. They are shopping discount stores and extreme discount stores (Aldi and Walmart are doing very well, thank you); some are using one-stop shopping to conserve fuel, others are shopping the deals. Many consumers are eschewing premium brands for private label; many are using coupons at a level unseen in years. And, for the first time in decades, consumers are increasingly brown bagging lunch and fixing meals at home, as restaurant sales have plummeted.
Almost 40 years ago, the situation was similar. There was rampant inflation – food in the 70s averaged 8.1% inflation (see table below) – fuel was rationed, and there were lines at the gas pumps.
FOOD PRICE INFLATION
Decades Average annual percent
change by decade 1970s 8.1% 1980s 4.6 1990s 2.8 2000s 2.7 2007 4.2 2008 est. 5.0 – 6.0
Source: Food Marketing Institute Speaks report, 2008 and USDA-ERS, Food CPI, Prices, and Expenditures, http://www.ers.usda.gov/Briefing/CPIFoodAndExpenditures/Data/cpiforecasts.htm
One of the results of the 70s? Generics in the black and white box and the further development of private labels.
Picture: Wikipedia, http://en.wikipedia.org/wiki/Generic_brand

Page 2-2 2009 Outlook Handbook
The Marketing System K. S. Park
What can marketers in this environment do? Discount retailers are doing extremely well in these
economic times. They already have streamlined supply chains, no-frills stores and are often EDLP (every day low price). Higher-end retailers, however, may not want to sacrifice their image of quality and service to start deep price wars, as shoppers become easily hooked on price discounts. For example, AC Nielsen reported that just over 35% of all product sales from food/drug/mass from July 2007-July2008 were on promotion (The Nielsen Company, Trade Promotions in the US, September 2008).
Displays and in-store advertising, ads in flyers, and shelf positioning. These merchandising tactics
can increase volume without sacrificing price. As a matter of fact, Nielsen also reported that features (ads in flyers, papers, in-store) generate a greater lift in sales (an added 87%) than do displays (an added 78%) or price reductions (and added 44%) (The Nielsen Company, Trade Promotions in the US, September 2008). In addition, retailers and suppliers should strategically promote items which appeal to the economizing shopper. Using up ad space to feature filet mignon may not make as much sense as using it for boneless breast of chicken.
Those with established private labels can and are supporting them prominently. Supporting their own
private labels can help their margins and also help satisfy their customers who are looking for those ways to economize and interested in trading down from the more expensive national brand to the less expensive private label.
Coupons, traditionally used by brand manufacturers, are being clipped, sorted, and used by
consumers. Coupons can provide a double benefit. They can provide sales incentive for the consumer looking for a deal or way to economize. They can also provide inexpensive, visible, print advertising for the manufacturer.
TABLE 2 – 1. MONTHLY RETAIL AND FOOD SERVICE SALES, PERCENT CHANGE FROM YEAR AGO
Kind of Retail Business
September 2008 sales – % change
from year ago Retail sales, total -0.3% Automobile dealers -23.5 Building mat. and supplies dealers -0.3 Supermarkets and other grocery (except convenience) stores 3.7 Beer, wine, and liquor stores 5.6 Pharmacies and drug stores 6.1 Gasoline stations 14.9 Clothing stores -5.2 Hobby, toy, and game stores 5.0 Department stores(excl. discount department stores) -14.3 Warehouse clubs and superstores 5.9 Used merchandise stores 9.7 Electronic shopping and mail-order houses 8.5 Food services and drinking places 2.7 Drinking places 7.4
Source: US Department of Commerce, Census Bureau. Monthly Retail Trade and Food Service Survey, September 2008. http://www.census.gov/mrts/www/mrts.html

2009 Outlook Handbook Page 2-3
K. S. Park The Marketing System
Differentiated promotions with targeted value may be especially appealing. Promotions tied to local organizations or charities—say, the local food banks—may attract consumers. Recently, a national jeweler offered a $25 off coupon to anyone who brought in a can of food for the local food pantry. A genuine offer that targets the holiday shopper.
The impact on consumers cannot be denied. Already, consumers have increased their savings rates,
something unheard of in the US in decades. Some have suggested that some shopping behavior changes—increased use of private label, shopping deep discount stores—could become permanent in our society. And the importance of the value in the cost/benefit ratio will be under the microscope as people adjust.
The U.S. Food Marketing System Update
2008 may have seen the greatest food inflation in recent decades. While the repercussions of high fuel
prices and high commodity prices are still being felt by some industries, food inflation, in general, is slowing down. The Economic Research Service at the USDA is forecasting 4 – 5% inflation for food in 2009, down from the estimate of 5 – 6% for 2008 (Figure 2 – 2).
TABLE 2 – 2. CHANGES IN FOOD PRICES, 2005 THROUGH 2009 2005 2006 2007 Forecast 2008 Forecast 2009
% changeAll food 2.4 2.4 4.0 5.0 to 6.0 4.0 to 5.0Food away from home 3.1 3.1 3.6 3.5 to 4.5 4.0 to 5.0Food at home 1.9 1.7 4.2 5.5 to 6.5 4.0 to 5.0 Beef and veal 2.6 0.8 4.4 3.0 to 4.0 6.0 to 7.0 Pork 2.0 ‐0.2 2.0 1.5 to 2.5 5.0 to 6.0 Other meats 2.4 1.8 2.3 1.0 to 2.0 2.5 to 3.5 Poultry 2.0 ‐1.8 5.2 4.0 to 5.0 5.0 to 6.0 Fish and seafood 3.0 4.7 4.6 5.5 to 6.5 4.0 to 5.0 Eggs ‐13.7 4.9 29.2 13.5 to 14.5 1.0 to 2.0 Dairy products 1.2 ‐0.6 7.4 8.0 to 9.0 4.0 to 5.0 Fats and oils ‐0.1 0.2 2.9 13.0 to 14.0 3.0 to 4.0 Fresh fruits 3.7 6.0 4.5 6.0 to 7.0 4.0 to 5.0 Fresh vegetables 4.0 4.6 3.2 6.0 to 7.0 3.5 to 4.5 Processed fruits and vegetables 3.3 2.9 3.6 8.5 to 9.5 3.0 to 4.0 Sugar and sweets 1.2 3.8 3.1 4.5 to 5.5 3.0 to 4.0 Cereals and bakery products 1.5 1.8 4.4 9.0 to 10.0 3.5 to 4.5 Nonalcoholic beverages 2.9 2.0 4.1 3.5 to 4.5 3.0 to 4.0
Source: USDA-ERS, Food CPI, Prices, and Expenditures, http://www.ers.usda.gov/Briefing/CPIFoodAndExpenditures/Data/cpiforecasts.htm

Page 2-4 2009 Outlook Handbook
The Marketing System K. S. Park
The Producer Price Index
The Producer Price Index (PPI), unlike the CPI, is based on prices received by producers from first
point of sale. This index is based off the year 1982. For example, a PPI of 100.0 reflects a farm price equal to that of the base year, 1982. For many years the PPIs, including that for all consumer foods, have all hovered between roughly 80 – 160%, a testimony perhaps to the great output and efficiencies of the agricultural system but also to the downward price pressures put on the system. Starting in 2006 and continuing sharply in 2008, increases in fuel prices and in corn and wheat prices drove up the costs and prices of many commodities.
PRODUCER PRICE INDICES, FARM PRODUCTS
Base Year = 1982
Source: USDA-ERS, Agricultural Outlook http://www.ers.usda.gov/publications/Agoutlook/AOTables/ last updated October 2008.
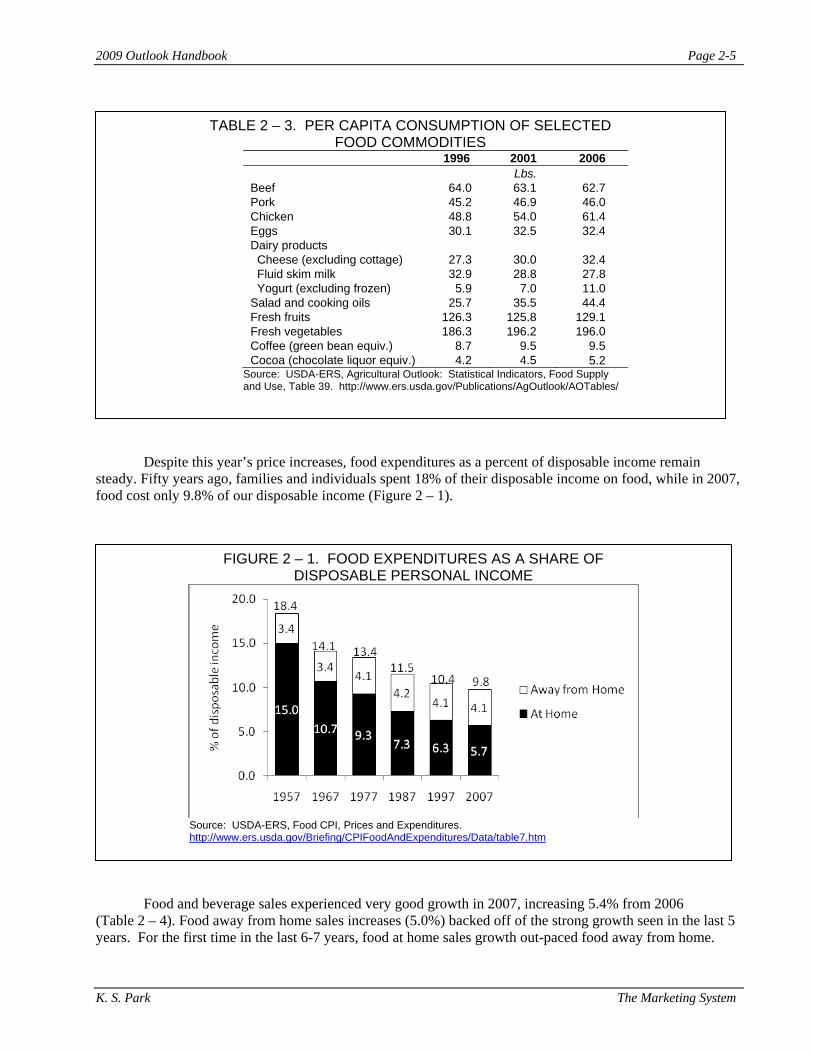
For several years, consumers have been decreasing their beef consumption and increasing their
consumption of chicken (Table 2 – 3). As a matter of fact, as consumers economize, they continue this “trade down”. Chicken consumption continues to increase, beef consumption continues to slide. Pork, the other white meat, appears to be holding its own.
Consumers continue their love affair with cheeses and yogurts. Cheese consumption has increased
from roughly 27 pounds per capita in 1996 to 32 pounds per capita in 2006. Yogurt consumption has climbed from almost 6 to 11 pounds per capita. Fluid milk consumption, however, continues to drop, even skim milk. Skim milk consumption fell from almost 33 to 28 pounds per capita.
Fresh fruit consumption has increased marginally (although processed consumption continues to drop
more quickly than the increase in fresh consumption) from 126 to 129 pounds per capita in the same time period. Fresh vegetables have increased quite nicely from 186 to 196 pounds per capita, although it has not increased since 2001.
Consumption of fresh commodities is more difficult to track over time as consumption in individual
years is greatly affected by commodity prices.
2009 Outlook Handbook Page 2-5
K. S. Park The Marketing System
Despite this year’s price increases, food expenditures as a percent of disposable income remain
steady. Fifty years ago, families and individuals spent 18% of their disposable income on food, while in 2007, food cost only 9.8% of our disposable income (Figure 2 – 1).
Food and beverage sales experienced very good growth in 2007, increasing 5.4% from 2006
(Table 2 – 4). Food away from home sales increases (5.0%) backed off of the strong growth seen in the last 5 years. For the first time in the last 6-7 years, food at home sales growth out-paced food away from home.
FIGURE 2 – 1. FOOD EXPENDITURES AS A SHARE OF DISPOSABLE PERSONAL INCOME
Source: USDA-ERS, Food CPI, Prices and Expenditures. http://www.ers.usda.gov/Briefing/CPIFoodAndExpenditures/Data/table7.htm
TABLE 2 – 3. PER CAPITA CONSUMPTION OF SELECTED FOOD COMMODITIES
1996 2001 2006 Lbs.
Beef 64.0 63.1 62.7 Pork 45.2 46.9 46.0 Chicken 48.8 54.0 61.4 Eggs 30.1 32.5 32.4 Dairy products Cheese (excluding cottage) 27.3 30.0 32.4 Fluid skim milk 32.9 28.8 27.8 Yogurt (excluding frozen) 5.9 7.0 11.0 Salad and cooking oils 25.7 35.5 44.4 Fresh fruits 126.3 125.8 129.1 Fresh vegetables 186.3 196.2 196.0 Coffee (green bean equiv.) 8.7 9.5 9.5 Cocoa (chocolate liquor equiv.) 4.2 4.5 5.2
Source: USDA-ERS, Agricultural Outlook: Statistical Indicators, Food Supply and Use, Table 39. http://www.ers.usda.gov/Publications/AgOutlook/AOTables/

Page 2-6 2009 Outlook Handbook
The Marketing System K. S. Park
The USDA calculates farm price or value and marketing costs for food produced and consumed in the
United States. In 2006, the latest year with data, consumer expenditures for food produced in the U.S. totaled $881 billion (Figure 2 – 2). Of that, the farm value portion was $163 or 19% of expenditures.
Of the $881 estimated expenditures for food produced and consumed in the U.S., $718 or 81% are
estimated to be for marketing costs.
The term “marketing” costs is a bit misleading to some. Marketing costs include much more than
advertising and promotion costs, which are only a small fraction of the marketing costs. Marketing costs include packing, shipping, and processing post farm gate, such as all food processing and manufacturing, as
FIGURE 2 – 2. U.S. FARM VALUE AND MARKETING BILL, 1996 - 20061
1 Marketing bill and farm value components of consumer expenditures for domestically produced farm foods Source: USDA-ERS Food Marketing and Price Spreads, http://www.ers.usda.gov/Data/FarmToConsumer/marketingbill.htm (updated November 2008).
TABLE 2 – 4. FOOD SALES1
Sector Sales 2006 Sales 2007 Increase Growth
--$ billion-- --$ billion-- --% change-- Total food and beverage sales 1,186,402 1,250,224 63,822 5.4% Total food sales (excluding alcohol) 1,032,325 1,087,685 55,360 5.4% Food at home sales 545,839 577,002 31,163 5.7% Food away from home sales 486,486 510,683 24,197 5.0% Alcoholic beverage sales 154,077 162,539 8,462 5.5%
1 Sales only. Does not include home production, donation, or school lunch program expenditures Source: USDA-ERS, http://www.ers.usda.gov/briefing/CPIFoodAndExpenditures/Data/table1.htm.

2009 Outlook Handbook Page 2-7
K. S. Park The Marketing System
well as distribution from production areas to the larger markets. The increasing portion of marketing costs is a reflection of the greater transformation of farm products to consumer ready-to-eat products. In addition, marketing costs associated with food away from home expenditures are greater than retail costs as they include chef preparation and restaurant overhead costs. And as consumers eat out more, these costs constitute a greater portion of the marketing bill.
Estimates of the components of the marketing bill from 1970 – 2006 are shown in Table 2 – 5. Since
1970, an increasing proportion of the “marketing bill” has been spent on labor. Packaging material costs have fluctuated somewhat. It is interesting to note the portion spent on shipping and energy since 1970. Each, in general, is not a large share of the marketing bill, and even combined, they represent less than 10% of marketing costs. Since 1980, in the period of the last energy “crisis”, energy costs as a portion of the total bill have dropped. Only recently has this increased. Recent surges in energy prices in 2007, however, are currently being felt in transportation, distribution, and manufacturing. Data for 2007 are not available at this time.
FIGURE 2 – 4. MARKETING BILL COMPONENTS FOR FOOD PRODUCED IN THE U.S., 1970 – 2006
Year Labor1 Packaging materials
Intercity rail and truck
transportationFuels and electricity
Corporate profits
before taxes Misc.2 % of marketing bill 1970 42.9 10.9 6.9 2.9 4.8 31.6 1980 44.6 11.5 7.1 4.9 5.4 26.4 1990 44.8 10.6 5.8 4.4 3.8 30.5 2000 47.0 9.9 4.9 4.3 5.8 28.0 2001 47.3 9.9 4.9 4.3 5.7 27.8 2002 47.3 9.8 4.9 4.3 5.7 27.9 2003 47.3 9.9 4.9 4.3 5.7 27.8 2004 47.9 10.0 5.0 4.4 5.6 27.1 2005 47.5 9.9 4.9 4.7 5.6 27.4 2006 47.5 9.8 4.9 4.7 5.5 27.5
“Other” includes depreciation, rent, advertising and promotion, interest, taxes, licenses, insurance, professional services, local for-hire transportation, food service in schools, colleges, hospitals, and other institutions, and miscellaneous items The marketing bill is the difference between the farm value and consumer expenditures and covers processing, wholesaling, transportation, retailing costs, and profits. Source: USDA-ERS, Food Marketing and Price Spreads, http://www.ers.usda.gov/Briefing/FoodPriceSpreads/bill/table2.htm (updated November 2008)

Notes

B. Henehan, T.M. Schmit Cooperatives
Chapter 3. Cooperatives Brian M. Henehan, Senior Extension Associate, & Todd M. Schmit, Assistant Professor
U.S. Situation
Higher commodity prices helped U.S. farmer cooperatives set new sales records, over $146 billion and record net income of $3.8 billion in 2007. Total business volume was up approximately 16 percent from $126 billion in 2006.
Table 3-1. U.S. FARMER COOPERATIVES, COMPARISON OF 2007 AND 2006
Item Sales Marketing Farm Supplies Service Total Balance sheet Assets Liabilities Equity Liabilities and net worth Income Statement Sales (Gross) Patronage income Net income before taxes Employees Full-time Part-time, seasonal Total Membership Cooperatives
2007
($ billion)
93.1 49.3
4.1 146.6
57.1 36.2 20.9 57.1
146.6 0.6 3.8
(Thousand)
125.2 56.2 181.4
(Million) 2.5
(Number)
2,594
2006 ($ billion)
76.5 45.9 4.1
126.5
47.9 28.0 19.9 47.9
126.5 0.5
3.2
(Thousand) 123.4 57.3
180.7
(Million) 2.6
(Number)
2,675
Change percent
21.76 7.52 0.38 15.90
19.31 29.42 5.13 19.31
15.90 29.79 21.10
1.44 -1.94 0.37
-4.27
-3.03 Source: Rural Cooperatives, Sept./Oct. 2008. USDA Rural Development, Washington, D.C. Higher prices of commodities significantly increased sales of marketing and supply cooperatives last year with cooperative marketing increasing 22 percent to $93.1 billion. Total sales by farm supply cooperatives amounted to just over $49 billion or a 7.5 percent increase from 2006. Related services of marketing and supply cooperatives remained level at $4.1 billion in 2007. Across all farmer cooperatives, total assets increased by 19.3 percent, liabilities increased by 29.4 percent and equity grew by 5.1 percent from 2006 to 2007. Total net income before taxes increased significantly by 21 percent to $3.8 billion. Patronage income increased by 30 percent, from $500 million in

Page 3-2 2009 Outlook Handbook
Cooperatives B. Henehan, T.M. Schmit
2006 to $600 million in 2007. Farmer cooperatives remain one of the largest employers in many rural communities. The total number of full-time and part-time employees increased slightly in 2007 to 181,400. New York State Situation
Data for agricultural cooperatives headquartered in New York State were obtained from a Cooperative Service survey cited below. The most current state level statistics available are for the years of 2005 and 2006. Table 3-2 summarizes cooperative numbers and business volume for New York State.
Table 3-2. NEW YORK STATE AGRICULTURAL COOPERATIVE NUMBERS AND NET BUSINESS VOLUME BY MAJOR BUSINESS, 2005 and 20061 Major Business Activity Marketing: Dairy Fruit & Vegetable Other Products2 TOTAL MARKETING Supply: Crop Protectants Feed Fertilizer Petroleum Seed Other Supplies TOTAL SUPPLY Related Service3 TOTAL
Number Headquartered in State 2005 2006 57 47 9 9 5 4 71 60 ___ ___ 7 7 4 5
_____ 82 72
Net Volume 2005 2006 ($ million) 1,676.3 1,707.6 37.0 38.7 142.7 100.3 ______ 1,856.0 1,846.6 1.2 1.0 39.3 43.6 11.9 12.5 5.0 5.7 2.3 2.3 28.3 29.0 88.0 94.1 88.2 22.7 ______ $ 2,032.2 $ 1,963.4
Source: Farmer Cooperative Statistics, 2005, Service Report 65, USDA, RBS, Washington, DC April, 2007 and Farmer Cooperative Statistics, 2006. Rural Development Report 67, USDA, Washington, DC November, 2007. 1 Totals may not add due to rounding. 2 Includes wool, poultry, dry bean, grains, livestock, maple syrup, and miscellaneous. 3 Includes those cooperatives that provide services related to cooperative marketing and purchasing.
The number of agricultural cooperatives headquartered in New York State in 2006 showed a net decrease of 10 cooperatives (12 percent) from 2005, primarily due to dairy cooperatives and a decrease in the number of other marketing cooperatives. However, total net business volume declined a more modest 3.4 percent from $2,032 million in 2005 to $1,963 million in 2006, a decrease of 3 percent. It should be noted that individual state data for agricultural cooperatives are becoming more difficult to obtain as more cooperatives operate across a broader multi-state area. For instance, cooperatives headquartered in New York State generate significant business volume outside of New York State and a number of cooperatives headquartered outside of New York generate significant volume in New York and include a large number of New York producers as members.

2009 Outlook Handbook Page 3-3
B. Henehan, T.M. Schmit Cooperatives
Total net volume for cooperatives headquartered in New York State decreased by $69 million, with marketing cooperatives reporting a decline of almost $10 million in net volume from 2005. While net business volumes for both dairy and fruit and vegetable marketing cooperatives. Dairy cooperatives showed an increase of $31 million from the previous year. Revenues for fruit and vegetable cooperatives increased by almost $2 million. Total net volume for other products marketed through cooperatives (e.g. poultry, dry beans, grain livestock, maple syrup and others) decreased significantly by almost $80 million.
Supply cooperative volume increased by over $6 million as cooperatives recover from the loss of
the Agway cooperative system. Total business volume for services related to marketing or purchasing decreased by almost 75 percent from about $88 million in 2005 to $23 million in 2006. Cooperative Share of Northeast Federal Milk Marketing Order 1
The proportion of milk receipts handled by dairy cooperatives fluctuated over the last 20 years, leveling off at about 67 percent from 1996 to 1999 under the old Federal Order 2 (Figure 3-1). However, the cooperative share of milk receipts increased significantly to 76 percent in 2000 under the new consolidated Order combining former Federal Order 1 (New England), Federal Order 2 (New York-New Jersey), and Federal Order 4 (Middle Atlantic) into the new Northeast Milk Marketing Order 1. The increase following the consolidation of Orders was primarily the result of pre-existing higher percentages of milk being shipped to cooperatives in the former Orders 1 and 4. Those higher percentages increased the total average of milk received by cooperatives in the new Order 1. The cooperative share of milk receipts for the first nine months of 2008 increased slightly to 78 percent from an average of 77 percent during the previous year.
FIGURE 3-1. COOPERATIVE SHARE OF PRODUCER MILK RECEIPTS, FEDERAL ORDER 2 (1988-1999) and NORTHEAST FEDERAL ORDER 1 (2000-2008) a
0
10
20
30
40
50
60
70
80
Perc
ent
88 89 90 91 92 93 94 95 96 97 98 99 00 01 02 03 04 05 06 07 08
Year
Federal Order 2 NE Federal Order 1
Source: Market Administrator's Office, Northeast Federal Milk Marketing Order 1. a Year 2008 is based on data for the first 8 months of the year. Data from 2000 forward represent the consolidated Federal Milk Marketing Order 1,( the merger of the old Federal Orders 1, 2, and 4).

Page 3-4 2009 Outlook Handbook
Cooperatives B. Henehan, T.M. Schmit
Cooperative Performance
The financial performance of agricultural cooperatives operating in New York State has on the whole been good. Due to the importance of dairy marketing and service cooperatives to New York producers, we will review their situation first.
As discussed above, the share of milk receipts accounted for by dairy marketing cooperatives under
Federal Milk Marketing Order 1 has remained stable at about 76 percent from 2000 through 2005. For the first eight months of 2008, the cooperative share has increased slightly by 1 percent. There is a volume of milk produced by farmers who are not members of cooperatives that is being marketed in Federal Order 1 by a cooperative marketing alliance that combines independent supplies of milk with that from cooperative members. This volume of non-member milk marketed is not included in the data for the cooperative share of producer receipts.
Wet weather conditions in scattered areas of New York during the planting season put pressure on
forage crop yields and milk production. Otherwise, weather during the growing and harvest seasons has been, in general, favorable. Isolated weather events have created some problems that might result in lowering the overall harvest of forage crops.
Milk prices continued to increase early in the year and then declined significantly. On average, milk
prices for the year supported continued positive performance of cooperatives offering dairy herd improvement or breeding genetics to members. Export sales of genetics and increased international operations continued to add to the revenues of the major genetics cooperative.
Dairy marketing cooperatives involved in value-added operations experienced mixed results. As milk prices declined, cooperatives involved in aging cheese experienced challenges in managing inventory values. Sales of cheese, yogurt and other soft dairy products remain relatively strong.
Cooperatives with manufacturing operations continued to see higher energy and packaging costs
early in the year. International markets for dry milk products remained strong in the beginning of the year but weakened as the value of the U.S. dollar strengthened and global demand softened. Mid-year changes in the export market brought declining international sales and an increasing surplus of dry milk products.
The bankruptcy settlement of Agway, the major supply cooperative in the Northeast continues as
unsecured creditors have received periodic distributions from 2004 through 2008. Payments are being made to unsecured creditors until the Trust created by the bankruptcy court is exhausted. Total payments to be made to unsecured creditors, many of whom were members or retired farmers, are estimated at between 60 cents and 66 cents on the dollar. As of February 2008, a total of seven payments have been made totaling 60 cents on the dollar. Until all outstanding accounts are identified and all costs are deducted from the Trust, the value of the total distribution cannot be determined. For more information, see the liquidating trust web site at: http://www.agwaylt.com
The major juice grape cooperative in New York continues to rebound from weak sales, higher
expenses, and lower returns to growers. Consumer dietary trends have hurt sales of fruit juices. The marketing arm continues to cut costs and implement new marketing strategies. Financial performance has been improving resulting in a larger advance payment made to growers this Fall than last year.
A fresh apple marketing cooperative continues to grow with new members joining from across a
broader geography. This organization works on improving the coordination of marketing and quality control on behalf of members. The apple crop is in general good. Some isolated weather problems resulted in lower

2009 Outlook Handbook Page 3-5
B. Henehan, T.M. Schmit Cooperatives
yields in selected production areas. In general, production in New York State was strong compared to other areas such as Michigan or Washington. Warmer weather in the Fall may have a negative impact on the storability of the crop resulting in downward pressure on prices.
The major vegetable processing cooperative continues to adjust operations following a change in its
relationship with a major food processing customer. When the processing and marketing assets of the cooperative were acquired by an investment group several years ago, a portion of member’s equity was converted to shares in the holding company that was created. That holding company has since sold some of the processing assets and made a distribution to shareholders, including cooperative members. Individual members received a cash distribution based on the cooperatives investment in the holding company that the equity investment group is currently managing.
A good working relation has been developed with the new frozen vegetable and fruit processing firm
that acquired several processing plants in New York and other states. The new owner is continuing to operate plants in New York State and maintain supplier relations with the growers cooperative that previously delivered to those plants. Acreage of processing vegetables delivered to the cooperative has increased as well as the price received by growers. In fact the total commercial market value (CMV) of processed fruits and vegetables in New York will reach records levels this year.
The Farm Credit associations experienced good financial performance during the year. Relatively
strong prices for a number of major commodities combined with favorable weather in most areas contributed to stronger farm financial performance and creditworthiness. The U.S. financial credit crisis and failure of investment banks involved in sub-prime mortgage financing did have a negative impact on the Federal Agricultural Mortgage Corp. known as “ Farmer MAC”. Farmer MAC which is a government sponsored entity, manages short term credit and investments for the Farm Credit System. Farmer MAC was exposed to high risk investments that affected the capital position and required an infusion of capital from various Farm Credit partners. For more information see www.farmermac.com.
The cooperative bank that lends to rural cooperatives in the U.S. and New York, reported record results during the most recent year that data are available. Net income, cash patronage distributions, and member equity all increased from the previous year. That said, recent fluctuations in commodity markets and the credit crisis have created more uncertainty. Cooperative Outlook
Most cooperatives operating in New York State had positive results in 2008. Weakening milk prices in 2009 may create more uncertainty for the performance of dairy marketing and service cooperatives. Milk prices and dairy farm income are projected to decline but stabilize from the relatively high levels of 2008. Dairy producers have seen their cost of production increase resulting in tighter profit margins. Dairy cooperatives continue to experience declining member numbers as farmers exit farming. Increased financial stress on dairy farms may tend to increase the rate of dairy farm sales and declining membership numbers.
Dairy cooperatives with value-added operations have experienced increasing costs for processing
milk, packaging, transportation, and ingredients as energy prices continue to increase. Recent declining costs of energy may bring more stable prices. It remains to be seen how energy prices unfold in 2009, but falling demand and an economic recession may cause energy costs to decline further.
Domestic consumer concerns over rising food prices and an economic recession may shift
purchasing to lower priced food products outlets as well as result in less food consumed away from home. On

Page 3-6 2009 Outlook Handbook
Cooperatives B. Henehan, T.M. Schmit
the export side, a strengthening dollar and global recession may limit exports in 2009. The dairy industry and dairy marketing cooperatives have relied on increasing exports to support farm prices and cooperative sales.
Although the last half of 2008 has brought a number of challenges for cooperatives operating in New York State - declining milk prices, downward pressure on farm income, shifting consumer purchasing patterns and a deepening recession, most cooperatives operating in New York State remain well positioned for solid performance in 2009.

C.G. Turvey Finance
Chapter 4. Finance Calum G. Turvey, Professor
Table 4-1. United States Farm Balance Sheet Current Dollars, December 31
Excluding Operator Households
Item 2002 2003 2004 2005 2006 2007 2008c billion dollars
Assets
Real Estate 1,046 1,112 1,341 1,549 1,756 1,912 2,052 Livestock 76 79 79 81 81 81 81 Machinery 94 96 102 107 108 109 110 Cropsa 23 24 24 24 23 23 28 Purchased Inputs 5 6 6 6 6 7 7 Financial Assets 60 62 66 67 74 79 82 Total 1,304 1,379 1,618 1,835 2,047 2,210 2,359
Liabilities & Equity Real Estate Debt 103 94 97 102 101 108 111 Nonreal Estate Debtb 90 81 86 92 95 104 101 Total 193 175 183 193 196 212 212 Owner Equity 1,111 1,204 1,435 1,642 1,851 1,998 2,147 Total 1,304 1,379 1,618 1,835 2,047 2,210 2,359 Percent Equity 85 87 89 89 90 90 91 a Excludes crops under CCC loan. b Excludes CCC loans. c Forecast
Table 4-2. Changes in Structure, United States Farm Balance Sheet Current Dollars, December 31
Excluding Operator Households
Item 2002 2003 2004 2005 2006 2007 2008c percent of total
Assets
Real Estate 80 81 83 84 86 87 87 Livestock 6 6 5 4 4 4 3 Machinery 7 7 6 6 5 5 5 All Othera 7 7 6 5 5 5 5 Total 100 100 100 100 100 100 100
Liabilities Real Estate Debt 53 54 53 53 52 51 52 Nonreal Estate Debtb 47 46 47 47 48 49 48 Total 100 100 100 100 100 100 100 a Excludes crops under CCC loan. b Excludes CCC loans. c Forecast Source: Agricultural Income and Finance Outlook, ERS, USDA; Agricultural Outlook: Statistical Indicators, ERS, USDA.

Page 4-2 2009 Outlook Handbook
_______________________________________________________________________________________ Finance C.G. Turvey
Table 4-3. Distribution of United States Farm Debt by Lender Current Dollars, December 31
Excluding Operator Households Item 2002 2003 2004 2005 2006 2007 2008b
billion dollars Real Estate Farm Credit System 29.7 37.8 37.7 40.1 40.9 45.4 46.8 Farm Service Agency 3.4 3.2 2.2 2.1 2.1 2.1 2.1 Commercial Banks 29.8 33.1 35.2 36.9 37.8 40.6 41.9 Insurance Companies 11 11.4 10.9 11.0 11.3 11.2 11.5 Individuals & Others 17.2 9.9 10.8 11.4 9.4 9.4 9.4 Total 91.1 95.4 96.9 101.5 101.5 108.6 111.7 Nonreal Estatea 16.7 20.5 21.9 24.2 27.5 32.3 31.3 Farm Credit System 4.2 4 3.2 3.0 2.7 2.9 2.8 Farm Service Agency 44.8 44.3 45.8 48.5 51.0 55.5 53.8 Commercial Banks 20.8 13 15.1 16.0 13.7 13.1 12.7 Individuals & Others 86.5 81.8 86.1 91.7 94.9 103.7 100.6 Total 29.7 37.8 37.7 40.1 40.9 45.4 46.8 a Excludes crops under CCC loan. b Forecast:
Table 4-4. Market Share of United States Farm Debt by Lender Current Dollars, December 31
Excluding Operator Households Item 2002 2003 2004 2005 2006 2007 2008b
percent of total
Farm Credit System 26.1 32.9 32.6 33.3 34.8 36.5 36.8 Farm Service Agency 4.3 4.1 3.0 2.6 2.5 2.3 2.3 Commercial Banks 42.0 43.7 44.3 44.2 45.2 45.2 45.1 Insurance Companies 6.2 6.4 6.0 5.7 5.7 5.3 5.4 Individuals & merchants 21.4 12.9 14.2 14.1 11.8 10.6 10.5 Totala 100 100 100 100 100 100 100 a Excludes crops under CCC loan. b Forecast: Source: Economic Research Service, USDA, Data, Farm Balance Sheet./ Author Calculations

2009 Outlook Handbook Page 4-3
C. G. Turvey Finance
The value of U.S. farm assets increased 6.7% in 2008 down from 12.3% in 2007, largely mobilized by a slow down in the rise from farm real estate values of which was 7.4% when compared to 13.4% in 2007. Still, real growth is significant since the changes are well in excess of the rate of inflation (Tables 4-1 and 4-2). Sector debt levels, however, remained constant at $212 billion indicating a slow down in the overall demand for farm credit. Farm credit increased by only 3.4% in 2007 which was nearly half the 6.7% increase that was observed between 2005 and 2006. The rate of growth in farm equity increased by 7.46% in 2007 which is lower than the 13% and 12.3% recorded in 2007 and 2006 respectively. Real estate debt increased by only 2.77% in comparison to a 9.8% increase in 2007. Following a 4.1% increase in non-real estate debt in 2007, nonreal estate debt actually decreased by 2.88%. Consequently with asset values increasing more than debt, farmers across the United Stated can now claim a 91% equity position in their farms (including unrealized capital gains). There is much room for leveraged growth and it is unlikely that any disturbances to the agricultural economy could not be withstood. New York typically has about 3-5% more debt than the U.S. average. The USDA has stopped providing state-level summaries.
Tables 4-3 and 4-4 show that the Farm Credit System continues to be the major provider of real-estate credit to agriculture, with a total of $46.8 billion in loans representing an increase of 3.1% in 2007. Commercial lenders are close with $41.9 billion in loans with an increase of 3.5% over 2006. By far commercial lenders provide the majority of non-real estate loans with a total of $53.8 billion in 2008. In 2007 the Farm Credit System provided 36.8% of credit to farmers with commercial lenders providing 45.1%, largely due to the non-real estate business. The Farm Service Agency, as well as other lenders, is actually decreasing its lending activities in proportion to commercial lenders and Farm Credit.
Table 4-5. Nonaccrual and Nonperforming Loans Farm Credit System, December 31
Year Nonaccrual Nonperforming percent of loan volume
1988 6.5 12.3 1989 5.1 11.0 1990 4.5 9.7 1991 3.7 8.0 1992 2.7
6.0
1993 2.3 4.2 1994 1.9 2.9 1995 1.4 2.1 1996 1.1 1.5 1997 0.9
1.3
1998 1.8 2.1 1999 1.4 1.6 2000 0.9 1.2 2001 0.9 1.2 2002 1.0
1.3
2003 1.1 1.3 2004 0.7 0.8
2005 0.6 0.6 2006 0.5 0.5
2007 0.358 0.434 2008 0.47 0.55
a Nonaccrual plus accrual that are restructured or 90 days or more past due (impaired loans). Source: Annual and Quarterly Reports of the Farm Credit System.

Page 4-4 2009 Outlook Handbook
_______________________________________________________________________________________ Finance C.G. Turvey
Credit quality of commercial lenders (Farm Credit and commercial banks) continues to be very high. There was a slight increase in non-accrual loans from 0.358% and 0.434% in 2007 to 0.47% and 0.55% in 2008, attributed to problems in the credit markets and residential real estate (Table 4-5). Still, the Farm Credit System is maintaining performance in non-accrual and non-performing loans in 2008, with only 1 in 200 loans being non-performing or non-accrual. Non-accrual and non-performing loans are at about as low levels as they could be expected to attain without severely restricting credit to a large group of people, most of whom are good credit risks. Throughout the farm credit system loan performance to borrowers is at a near all time high between 2006 and 2008. These conditions are largely mimicked in commercial lending (Table 4-6) which despite severe problems in non-farm real estate markets (to be discussed later) has a very low rate of delinquency (1.4% - 1.6%).
Table 4-6. Non-accrual, Non-performing, and Total Delinquent United States Commercial Banks, December 31
Farm Non Real Estate Loans Farm Real Estate Loans Year Non-accrual Non-performing Delinquent Non-accrual Non-performing Delinquent
percent of loan volume 2000 1.0 1.2 2.1 0.8 1.4 2.3 2001 1.3 1.5 2.7 1.2 1.5 2.6 2002 1.3 1.6 2.6 1.2 1.5 2.5 2003 1.2 1.5 2.3
1.1 1.3 2.1
2004 0.9 1.0 1.6 0.8 1.0 1.6 2005 0.5 0.7 1.3 0.6 0.7 1.3 2006 0.5 0.6 1.3 0.5 0.7 1.3 2007 0.5 0.8 1.9 0.5 0.7 1.6 2008 0.5 0.7 1.4 0.7 0.9 1.6 a Includes non-accrual and past due 90 days but accruing. b Includes non-performing and past due 30 to 89 days but accruing. Source: Agricultural Financial Databook, Board of Governors of the Federal Reserve System. 2008 Q2

2009 Outlook Handbook Page 4-5
C. G. Turvey Finance
Outlook on Credit Supply and Credit Risk
Ratio of Agricultural Production Loans to Consumer Mortgage Charge Offs and Delinquency
-1
0
1
2
3
4
5
1991
Q1
1991
Q4
1992
Q3
1993
Q2
1994
Q1
1994
Q4
1995
Q3
1996
Q2
1997
Q1
1997
Q4
1998
Q3
1999
Q2
2000
Q1
2000
Q4
2001
Q3
2002
Q2
2003
Q1
2003
Q4
2004
Q3
2005
Q2
2006
Q1
2006
Q4
2007
Q3
Quarter
Rat
io
Charge offDelinquencyPoly. (Charge off)Poly. (Delinquency)
The continued improvement in the credit quality of agricultural credit suggests a deeper look into how the agricultural sector compares with the non farm sector. In other words, how does the agricultural economy fare in terms of credit worthiness relative to consumers? History is replete with depressions that cause structural shifts in agriculture with randomness in commodity prices and weather patterns largely to blame. In the late 1990's and into this decade the average farm household income has met parity with non farm households. Equity is approaching 90% indicating that agriculture has significant credit reserves available to it. But coming out of the collapse ending in the late 1980's farmers attitudes towards credit changed and its use has, at least on average, been prudent. Using data available from the Federal Reserve Bank on consumer loans and agricultural production loans by commercial banks on charge offs and delinquencies we can get a sense, albeit incomplete, of the trend.
FIGURE 4-1. AGRICULTURAL PRODUCTION LOAN CHARGE OFFS AND DELINQUENCY COMPARED TO CONSUMER MORTGAGE LOANS

Page 4-6 2009 Outlook Handbook
_______________________________________________________________________________________ Finance C.G. Turvey
Ratio of Agricultural Production Loans to Consumer Credit Chargeoffs and Delinquency
-0.2
0
0.2
0.4
0.6
0.8
1
1.2
1991
Q1
1991
Q4
1992
Q3
1993
Q2
1994
Q1
1994
Q4
1995
Q3
1996
Q2
1997
Q1
1997
Q4
1998
Q3
1999
Q2
2000
Q1
2000
Q4
2001
Q3
2002
Q2
2003
Q1
2003
Q4
2004
Q3
2005
Q2
2006
Q1
2006
Q4
2007
Q3
Quarter
Rat
io
ChargeoffDelinquencyPoly. (Delinquency)Poly. (Chargeoff)
Up to the fourth quarter of 2004 the delinquency rate on agricultural production loans was always higher than consumer mortgage loans (Figure 4-1). This was as high as 149% in 2003, and between 1990 and 2003 the average was 121%. There is nothing critical about this since the timing and sequencing of cash flows in agriculture do not always match the terms of loan repayment. However in 2004 this trend reversed itself and delinquencies in agricultural loans fell dramatically so that in 2007 the delinquency rate is only half of that on consumer mortgages. More critically charge offs of agricultural production loans were twice that of consumer mortgages averaging 206% between 1990 and 2003. However this too reversed itself starting in 2003 where now in 2007 the charge off rates of agricultural loans is only 41% of charge offs on consumer loans. In terms of total consumer loans including credit cards and non revolving loans for auto and improvements, the delinquency rate and charge off rates in agriculture have always been lower (Figure 4-2). Delinquency rates peaked in 1991 at about 91% of consumer loans but has fallen steadily since so that today the delinquency rate relative to all consumer loans is only 0.366. The charge off ratio is much lower. The peak charge off ratio was 0.238 in late 1990, as farmers were coming off the collapse in the 1980s. Since then, the decline and the prudential use of agricultural credit has resulted in a charge off ratio of only 0.05 in 2007. In other words a consumer loan is nearly 20 times more likely to be charged off by a commercial lender than an
FIGURE 4-2. AGRICULTURAL PRODUCTION LOAN CHARGE OFFS AND DELINQUENCY COMPARED TO ALL CONSUMER LOANS

2009 Outlook Handbook Page 4-7
C. G. Turvey Finance
agricultural production loan. Two qualifications to this are required. The first is that the farm production loans do not include FSA loans but data we have for 2005 indicate that FSA delinquencies and charge offs are no worse than consumers. In other words, the most severe distresses in agriculture are no worse that the average of consumers. The second qualification is that only production credit is considered. This may not be critical. First, charge offs on agricultural production loans will most surely in most cases take place before charge offs on farm mortgages so the farm mortgage charge off rate will be much lower than consumer mortgages as presented here. Second, consumer credit includes not only mortgages but also credit cards and other non-revolving credit sources. It may be the case that a farmer has a delinquency on a personal credit card, but most commercial farms now operate off lines of credit from which cards are paid as well as equipment purchases and repairs and inputs and so on. It is therefore possible that a farmer can have both a consumer loan and a production loan, so at best we can say that the ratios so presented are lower bounds. Even so, we are seeing in 2007-2008 not only a continued parity with the non-farm sector in terms of income but overall improvement in credit quality. Outlook on Interest Rates Short term interest rates bottomed out at the lowest level in 50 years in late 2003 and early 2004 and have been rising throughout 2005, 2006 and 2007. The average 2004 prime rate was 4.3% but this increased to 6.19% in 2005, 7.96% in 2006 but fell slightly to 7.74% through October 2007 and below 5% through October 2008 (Figure 4-3). Rates are still historically low and have not been at this level since 2001 and before that 1967. In mid 2005 and continuing through the first part of 2007 the Federal Reserve Board pushed interest rates up from these historic levels in an effort to reach a more neutral monetary policy position and inflation pressure. The current credit crisis in sub prime lending has given pause to these increases causing the Federal Reserve to lower rates. On a calendar year basis, short term rates averaged 1.4% in 2004, increased to 3.22% for 2005, and averaged around 4.75% for 2006, exceeded 7% in 2007, and currently hovers around 4.56% (Figure 4-4).
FIGURE 4-3. ANNUAL AVERAGE SHORT TERM INTEREST RATES
0
5
10
15
20
1968 1973 1978 1983 1988 1993 1998 2003 2008
Perc
ent
Prime Rate Major Banks
3 Month Treasury

Page 4-8 2009 Outlook Handbook
_______________________________________________________________________________________ Finance C.G. Turvey
FIGURE 4-4. MONTHLY SHORT TERM INTEREST RATES
0
1
2
3
4
5
6
7
8
9
10
1993 1994 1995 1996 1997 1998 1999 2000 2001 2002 2003 2004 2005 2006 2007 2008
Perc
ent
Prime Rate Major Banks
3 Month Treasury Bills
There has been a sharp decline in the 3-month treasury bills throughout 2007 and 2008 with the more dramatic declines taking place in the last half of 2008. Currently treasury yields are at 0.67%, below the rate of inflation. The low rate reflects illiquidity in the credit markets, reductions in the Federal Reserve Rate. It is expected that the rates will remain low until the current financial crisis is ended.
High quality corporate bonds continue to be low (Figure 4-5). As of October 2008 the Aaa rate was
6.28% in comparison to 10-year bond rates of 3.81%. The spread, at 2.47% is higher that the October 2007 spread of 1.13% and the 0.78% spread observed in 2006. This increase in the spread indicates an increase in the riskiness of corporate bonds relative to government bonds. The 10-year bonds have hovered between 4.53% and 3.51% between October 2007 and October 2008 (Figure 4-5).
FIGURE 4-5. MONTHLY LONG TERM INTEREST RATES
0
2
4
6
8
10
12
14
16
1993 1994 1995 1996 1997 1998 1999 2000 2001 2002 2003 2004 2005 2006 2007 2008
Perc
ent
Corporate Aaa Bonds(Moody's)
U.S. Gov't Bonds10 Year Constant Maturities
3 Month Treasury Bills
2007 2008
Jan. 4.98 2.75 Feb. 5.03 2.12 Mar. 4.94 1.26 Apr. 4.87 1.29 May 4.73 1.73 June 4.61 1.86 July 4.82 1.63 Aug. 4.20 1.72 Sept 3.89 1.13 Oct. 3.90 0.67 Nov. 3.27
Dec. 3.00
U.S. Govt. Bonds
10 Year Constant Maturity
2007 2008 Jan. 4.76 3.74
Feb. 4.72 3.74 Mar. 4.56 3.51
Apr. 4.69 3.68 May 4.75 3.88 June 5.10 4.10 July 5.00 4.01 Aug. 4.67 3.89 Sept 4.52 3.69 Oct. 4.53 3.81 Nov. 4.15 Dec. 4.10

2009 Outlook Handbook Page 4-9
C. G. Turvey Finance
FIGURE 4-6. CONTRACT AND REAL INTEREST RATES
-5
0
5
10
15
20
1970 1973 1976 1979 1982 1985 1988 1991 1994 1997 2000 2003 2006
Perc
ent
Prime Rate
Real Prime
Inflation continues to be of concern. The 2007 inflation rate was 3.2% and this rose slightly to 3.7% in 2008. The real (inflation adjusted) prime rate has fallen from 4.46% in 2006 and 4.54% in 2007 to 3.49% as of October 2008 (Figure 4-6 and 4-7).

Page 4-10 2009 Outlook Handbook
_______________________________________________________________________________________ Finance C.G. Turvey
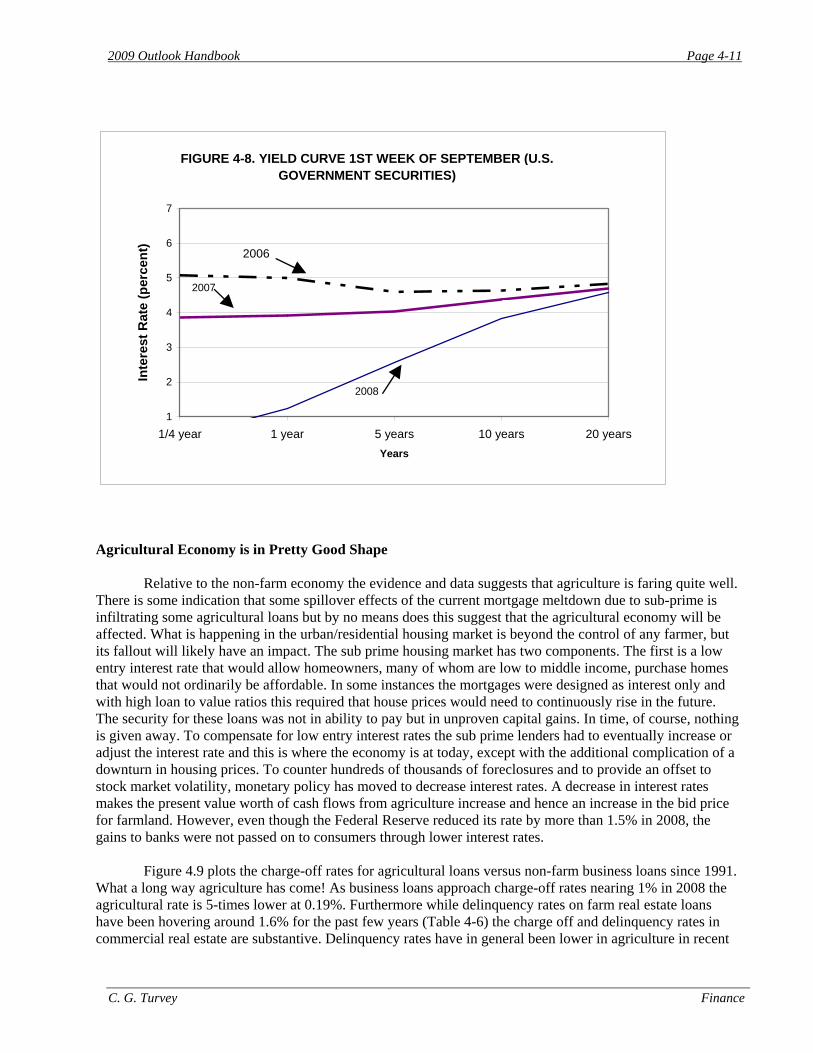
As with 2007-2008 there are many uncertainties in the market making it difficult to predict what interest rates are going to do in 2009. Figure 4-7 shows that 90-day inflation adjusted rates are below 10-year a rate which is the normal expectation. The spread between the 10-year notes and 90-day notes are increasing, largely due to the reduction in 90-day rates in the past 6 months to less than 1%. In real terms, the 90-day rates are negative (-2.94%) meaning that the return on short term bonds does not even cover inflation, and 10-year rates are very close to zero when adjusted for inflation.
Compared to 2007 the yield curve showing October bond yields at different maturities has shifted down and has become steeper (Figure 4-8). This is quite a shift from the inverted curve observed in 2006. The spread between 3-month and 1-year t-bills is only 1.32% and between 1-year and 5-year treasury bills the spread is only 1.26%. The spread between 5 and 10-year rates is only 0.76%.
Normally one would expect this yield curve to signal some very low interest rates in the next two or three years but under current conditions it is unlikely that they will be reflected in lending rates soon. Commercial banks are currently operating on tight credit schedules and are being extremely cautious. On the other hand, it does not appear that commercial, real estate, or agricultural loan rates are going to increase significantly in 2009.
FIGURE 4-7. LONG AND SHORT TERM REAL INTEREST RATES
-6
-4
-2
0
2
4
6
8
10
1967 1972 1977 1982 1987 1992 1997 2002 2007
Per
cent
U.S. Treasury Notes and BondsConstant Maturities - 10 year
3 Month Treasury Bills
2009 Outlook Handbook Page 4-11
C. G. Turvey Finance
FIGURE 4-8. YIELD CURVE 1ST WEEK OF SEPTEMBER (U.S. GOVERNMENT SECURITIES)
1
2
3
4
5
6
7
1/4 year 1 year 5 years 10 years 20 yearsYears
Inte
rest
Rat
e (p
erce
nt)
2006
2007
2008
Agricultural Economy is in Pretty Good Shape Relative to the non-farm economy the evidence and data suggests that agriculture is faring quite well. There is some indication that some spillover effects of the current mortgage meltdown due to sub-prime is infiltrating some agricultural loans but by no means does this suggest that the agricultural economy will be affected. What is happening in the urban/residential housing market is beyond the control of any farmer, but its fallout will likely have an impact. The sub prime housing market has two components. The first is a low entry interest rate that would allow homeowners, many of whom are low to middle income, purchase homes that would not ordinarily be affordable. In some instances the mortgages were designed as interest only and with high loan to value ratios this required that house prices would need to continuously rise in the future. The security for these loans was not in ability to pay but in unproven capital gains. In time, of course, nothing is given away. To compensate for low entry interest rates the sub prime lenders had to eventually increase or adjust the interest rate and this is where the economy is at today, except with the additional complication of a downturn in housing prices. To counter hundreds of thousands of foreclosures and to provide an offset to stock market volatility, monetary policy has moved to decrease interest rates. A decrease in interest rates makes the present value worth of cash flows from agriculture increase and hence an increase in the bid price for farmland. However, even though the Federal Reserve reduced its rate by more than 1.5% in 2008, the gains to banks were not passed on to consumers through lower interest rates.
Figure 4.9 plots the charge-off rates for agricultural loans versus non-farm business loans since 1991.
What a long way agriculture has come! As business loans approach charge-off rates nearing 1% in 2008 the agricultural rate is 5-times lower at 0.19%. Furthermore while delinquency rates on farm real estate loans have been hovering around 1.6% for the past few years (Table 4-6) the charge off and delinquency rates in commercial real estate are substantive. Delinquency rates have in general been lower in agriculture in recent

Page 4-12 2009 Outlook Handbook
_______________________________________________________________________________________ Finance C.G. Turvey
years, but the drama that is now unfolding in the non-farm real estate market is confounding. The stalling of real estate markets in late 2007 and through 2008, combined with adjustable sub-prime mortgages have caused the steep rise in delinquencies and charge-offs as shown in Figure 4-10. One can see the origination of the crisis in the 4th quarter of 2006, but it was not until after the first quarter in 2008 that politics took notice. By the first quarter of 2008 delinquency rates – a future look into home foreclosures— had increased to 3.73% increasing to 5.08% by October 2008. The fallout in charge offs was a rate of 0.84% by March 2008 and ending the 3rd quarter at 1.45%.
Figure 4-9 Delinquency Rates, Commercial Banks
0
1
2
3
4
5
6
7
8
9
10
1987
Q1
1987
Q4
1988
Q3
1989
Q2
1990
Q1
1990
Q4
1991
Q3
1992
Q2
1993
Q1
1993
Q4
1994
Q3
1995
Q2
1996
Q1
1996
Q4
1997
Q3
1998
Q2
1999
Q1
1999
Q4
2000
Q3
2001
Q2
2002
Q1
2002
Q4
2003
Q3
2004
Q2
2005
Q1
2005
Q4
2006
Q3
2007
Q2
2008
Q1
Quarter
Del
inqu
ency
Rat
e
Agricultural Production Loans Business Loans
FIGURE 4-9. DELINQUENCY RATES, COMMERCIAL BANKS

2009 Outlook Handbook Page 4-13
C. G. Turvey Finance
Figure 4-10 Charge-off rate on single family residential mortgages
0
1
2
3
4
5
6
1991
Q1
1991
Q4
1992
Q3
1993
Q2
1994
Q1
1994
Q4
1995
Q3
1996
Q2
1997
Q1
1997
Q4
1998
Q3
1999
Q2
2000
Q1
2000
Q4
2001
Q3
2002
Q2
2003
Q1
2003
Q4
2004
Q3
2005
Q2
2006
Q1
2006
Q4
2007
Q3
2008
Q2
Quarter
Cha
rge-
Off
Rat
e
Charge-off RateDelinquency Rate
The fallout in the consumer mortgage market is more dramatic than what Figure 4-10 portrays. The charge off rate is actually a function of outstanding loan balances. With rapidly increasing loan volume in the commercial sector an increase in ‘rates’ says little about the true carnage. Figure 4-11 plots real estate, credit card and agricultural loans in millions of dollars. Between October 2007 and October 2008 quarterly charge offs increased from $1,205 million to $7,059 million, with almost 5 times this amount at risk. Consumer credit-card charge-offs are falling in line with a trend increase being observed since 2006. In comparison, agricultural production loans, which are found on the right-hand axis amount to only $20 million in 2008 Q3 and indicate a downward trend. Of course Figures 4-9 to 4-11 present only a snap shot of the effects, since these represent bank charge offs. It says nothing of delinquency in the secondary mortgage market where heavily invested mortgage backed securities have created havoc amongst banks, investment banks, hedge funds, pension funds, and non-bank debt providers. Even Farmer-Mac was not immune with its investment in the equity of an investment bank that was heavily weighted by mortgage backed securities. The recent bailout of more than $700 billion by Congress and the Senate was intended to stabilize the real estate mortgage market, but the outcome is dubious.
FIGURE 4-10. CHARGE-OFF RATE ON SINGLE FAMILY RESIDENTIAL MORTGAGES

Page 4-14 2009 Outlook Handbook
_______________________________________________________________________________________ Finance C.G. Turvey
Figure 4-11 Loan Charge-offs Commercial Banks, $Million
0
1000
2000
3000
4000
5000
6000
7000
8000
1991
Q1
1991
Q4
1992
Q3
1993
Q2
1994
Q1
1994
Q4
1995
Q3
1996
Q2
1997
Q1
1997
Q4
1998
Q3
1999
Q2
2000
Q1
2000
Q4
2001
Q3
2002
Q2
2003
Q1
2003
Q4
2004
Q3
2005
Q2
2006
Q1
2006
Q4
2007
Q3
2008
Q2
Quarter
$ M
illio
n C
onsu
mer
-20
0
20
40
60
80
100
120
140
$ M
illio
n A
gric
ultu
ral P
rodu
ctio
n
Residential real estate Consumer Loans and Credit Cards Agricultural Production
Sub Prime and Interest Rates The sub-prime market melt-down will likely lead to a slowdown in the speculative value of farmland. Speculation in this context is tied to the development option to convert agricultural land into residential lots. The demand for housing in terms of housing starts features in this option, but so does the price of houses. The greater the demand for housing and the more that people are willing or able to pay for the houses, the greater will be the option value capitalized into farmland values. The value of this option increases with house prices and housing demand, and decreases with commuting distance. Nonetheless, to a large extent any inflation or deflation in urban land markets can have significant impacts on farmland prices. In many localities suffering from sub prime foreclosures and forced sale of housing the increased supply will cause a precipitous decline in residential home values. This in turn will reduce the development option and hence land prices. Table 4-6 shows recent USDA-ERS estimates of farmland prices in the U.S. Northeast, New York, and the USA. Land prices still tended to rise in 2008 indicating, at least for now, that the housing market has not had a great influence. This may be because most farms are so remote from residential zoning that the residential market has no influence. However it is notable that after a $400- $500/acre increase in each year between 2004 and 2007, real estate values in the Northeast increased by only $80 in 2008. This is likely due to the significant development value in New Jersey and Connecticut. Falling house prices, increased supply, and tight credit markets make the outlook for new residential development on farmland quite bleak in 2008 and 2009.
FIGURE 4-11. LOAN CHARGE-OFFS COMMERCIAL BANKS $MILLION

2009 Outlook Handbook Page 4-15
C. G. Turvey Finance
Table 4.7. Farmland Values and Cash Rents
State 2003 2004 2005 2006 2007 2008
Real Estate $/acre NE 3200 3550 4110 4550 5000 5080NY 1700 1780 1920 2050 2150 2400USA 1270 1360 1650 1900 2160 2350
Crop Land $/acre NE 3400 3800 4390 5040 5450 5900NY 1390 1470 1530 1820 1920 2200USA 1660 1770 2110 2390 2300 2970
Cash Rent $/acre
NE 42 44.5 46 47 48 51NY 37 40 41 39 39 44USA 73 76.5 78 79.5 85 96
Cropland Value to Rent Ratio
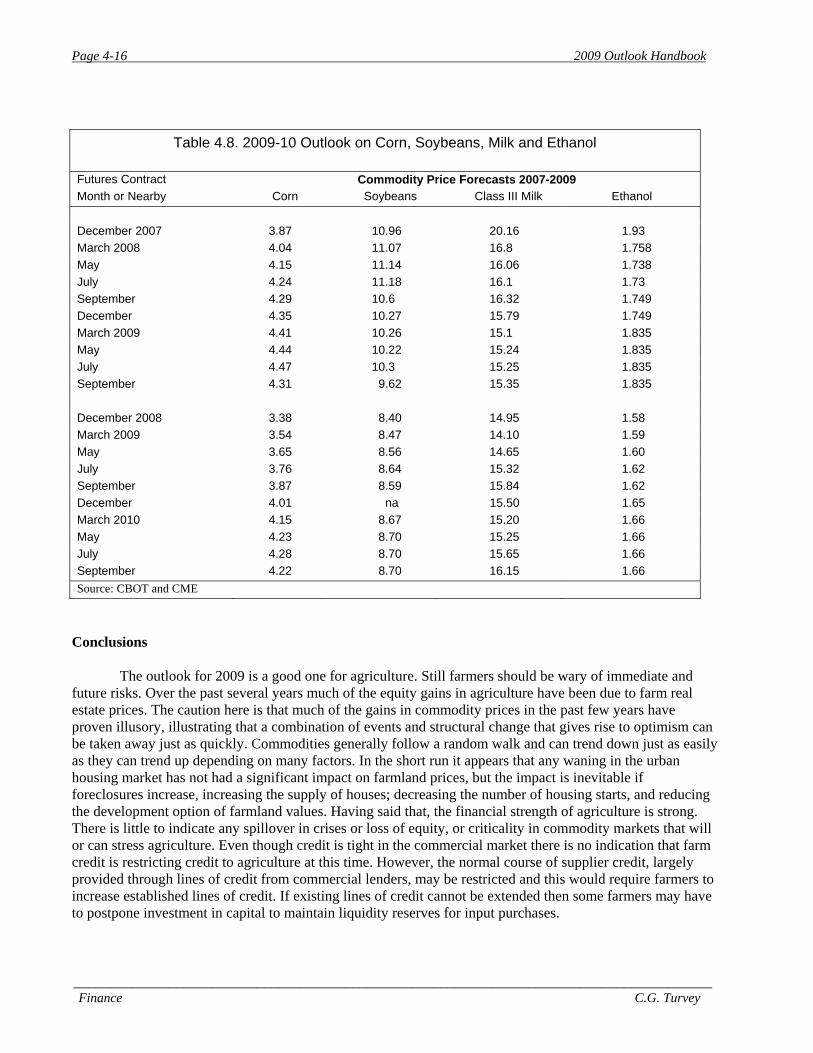
NE 80.95 85.39 95.43 107.23 113.54 115.68NY 37.57 36.75 37.32 46.67 49.23 50USA 22.74 23.14 27.05 30.06 27.06 30.94 Source: USDA ERS The Ethanol Factor In 2007 it was easily argued that rising oil prices increased the value of ethanol, which in turn increased the value of corn and by spillover effects from acreage adjustment, the price of other commodities as well. With oil prices currently below $50/barrel and gasoline prices falling to below 2005 prices, the ethanol effect may shrink. It is at least, less quite uncertain at this time. Corn and other commodity prices have fallen in the past year; Corn went from $4.35/bu for December 2008 futures as of November 2007 to $3.38 for December 2008 futures as of November 20, 2008. This is a reduction of almost 25%. Likewise, soybeans have fallen from $10.96/bu to $8.40/bu and milk has fallen from $20.16/cwt to $14.95/cwt. The market price of ethanol has fallen from $1.93/gallon to $1.58/gallon. At least in the short run, and depending on the price of oil and gasoline, it is unlikely that the ethanol factor will affect land prices beyond what is currently capitalized into land values.
Page 4-16 2009 Outlook Handbook
_______________________________________________________________________________________ Finance C.G. Turvey
Table 4.8. 2009-10 Outlook on Corn, Soybeans, Milk and Ethanol
Futures Contract Commodity Price Forecasts 2007-2009 Month or Nearby Corn Soybeans Class III Milk Ethanol December 2007 3.87 10.96 20.16 1.93 March 2008 4.04 11.07 16.8 1.758 May 4.15 11.14 16.06 1.738 July 4.24 11.18 16.1 1.73 September 4.29 10.6 16.32 1.749 December 4.35 10.27 15.79 1.749 March 2009 4.41 10.26 15.1 1.835 May 4.44 10.22 15.24 1.835 July 4.47 10.3 15.25 1.835 September 4.31 9.62 15.35 1.835 December 2008 3.38 8.40 14.95 1.58 March 2009 3.54 8.47 14.10 1.59 May 3.65 8.56 14.65 1.60 July 3.76 8.64 15.32 1.62 September 3.87 8.59 15.84 1.62 December 4.01 na 15.50 1.65 March 2010 4.15 8.67 15.20 1.66 May 4.23 8.70 15.25 1.66 July 4.28 8.70 15.65 1.66 September 4.22 8.70 16.15 1.66 Source: CBOT and CME
Conclusions The outlook for 2009 is a good one for agriculture. Still farmers should be wary of immediate and future risks. Over the past several years much of the equity gains in agriculture have been due to farm real estate prices. The caution here is that much of the gains in commodity prices in the past few years have proven illusory, illustrating that a combination of events and structural change that gives rise to optimism can be taken away just as quickly. Commodities generally follow a random walk and can trend down just as easily as they can trend up depending on many factors. In the short run it appears that any waning in the urban housing market has not had a significant impact on farmland prices, but the impact is inevitable if foreclosures increase, increasing the supply of houses; decreasing the number of housing starts, and reducing the development option of farmland values. Having said that, the financial strength of agriculture is strong. There is little to indicate any spillover in crises or loss of equity, or criticality in commodity markets that will or can stress agriculture. Even though credit is tight in the commercial market there is no indication that farm credit is restricting credit to agriculture at this time. However, the normal course of supplier credit, largely provided through lines of credit from commercial lenders, may be restricted and this would require farmers to increase established lines of credit. If existing lines of credit cannot be extended then some farmers may have to postpone investment in capital to maintain liquidity reserves for input purchases.

W.G. Tomek and T.M. Schmit Grain and Feed
Chapter 5. Grain and Feed Bill Tomek, Professor Emeritus, and Todd M. Schmit, Assistant Professor
In the past few years, the demand for grains and oilseeds was growing relative to supplies, with inventories declining. The sharp downturn in the world’s economies has brought a different focus on the demand side of commodity markets, at least for the short run. The slowing growth in consumers’ incomes is reflected in the demand for commodities. This year, more than most, uncertainty about prices is related to uncertainty about the future demands for commodities.
This chapter provides a status report on available supplies and the expected demands for wheat, corn, and soybeans. It is necessarily a snapshot based largely on the supply-demand estimates available as of November 10, and with a fluid, dynamic economy, this snapshot could change substantially. Wheat
Wheat production in the U.S. in 2008 was 2.5 billion bushels, 433 million bushels above last year and almost 700 million above the low of two years ago (Table 5-1). Production was larger for most classes of wheat, including hard winter and spring wheats, and also soft red and white wheats. Global wheat production is projected to be a record 682 million metric tons, and world rice production is forecast to be 434 million metric tons, up slightly from 2007-08 and up about 13 million tons from 2006-07. Hence, food grain supplies appear adequate for the world as a whole.
With larger supplies, the USDA is projecting somewhat larger uses of wheat for domestic food
consumption and for exports. U.S. exports will be influenced by competition from other wheat-producing countries and by the relationship of the U.S. dollar to other currencies. Considerable uncertainty exists about the export demand for U.S. wheat this year. Given the USDA supply-demand estimates, ending inventories are expected to double from 306 to 603 million bushels on June 30, 2009. Thus, inventories are expected to return to near normal levels (26% of annual use).
In this context, the USDA projection of a farm-level, marketing-year average price of $6.85 per
bushel is perhaps a bit high. Their estimate does reflect that a considerable portion of the wheat harvest was sold in July and August at high prices. But, prices of wheat (and other commodities) have dropped sharply since summer. As of November 10, the prices for futures contracts for wheat on the Chicago Board of Trade ranged from $5.21 for December 2008 delivery to $5.56 for May 2009 delivery. Prices received by the typical farmer would be less than these futures prices.
The futures market does expect wheat prices in forthcoming marketing years to be higher than this year. Thus, the harvest-time (July) price for 2009 is $5.70, for 2010 $6.29, and for 2011 $6.58 per bushel. These prices are, of course, subject to much change as time evolves and new information arrives, but traders in futures markets are clearly expecting upward pressure of demand on supply in future years.
Corn
The corn harvest this Fall in the U.S., at 12.0 billion bushels, is over one billion bushels less than in 2007-08 (Table 5-2), though still the second largest crop on record. (The average yield of 153.8 bushels per acre is also the second largest on record.) The smaller U.S. crop is reflected in a lower estimate of world output (Table 5-3).

Page 5-2 2009 Outlook Handbook
Grain and Feed W.G. Tomek and T.M. Schmit
TABLE 5-1. U.S. SUPPLY AND DEMAND BALANCE SHEET FOR WHEATa
2006-07 2007-08E 2008-09F Supply: Harvested Acres (million) 46.8 51.0 55.7 Yield (bushels per acre) 38.7 40.5 44.9
(Million Bushels) Beginning Stocks 571 456 306 Production 1,812 2,067 2,500 Imports 122 113 100 Total Supply 2,505 2,635 2,905 Use:
Food Seed Feed & Residual
938 82
121
948 88 30
960 82
260
Total Domestic Use 1,140 1,066 1,302 Exports 908 1,264 1,000 Total Use 2,049 2,330 2,302 Ending Stocks 456 306 603
Stocks/Use Ratio 22.3% 13.1% 26.1%
Avg. farm price, U.S., $bu. 3.42 6.48 6.85
Avg. farm price, NYS, $bu. 3.34 6.75 -
aData from USDA, “World Agricultural Supply and Demand Estimates,” (November 10,2008) WASDE-464, P. 11.
The smaller supply is offset, in part, by the expectation of smaller demands for feed use and exports. Ethanol use is forecast to grow from last year to this year, although the November estimate is 100 million bushels less than forecast in September. Nonetheless, if the USDA’s estimate is correct, ethanol production will use almost one billion more bushels of corn in 2008-09 than in 2007-08. The net result is that the total use of corn is forecast to decline only 200 million bushels, and hence ending stocks on August 31, 2009 will be 500 million bushels less than in the previous August. The stocks-to-use ratio is expected to be 9% on August 31, 2009 compared with 12.7% on August 31, 2008. A ratio of 10% or less is typically bullish for prices, and the USDA is projecting somewhat higher prices for the current marketing year than last.
Figure 5-1 depicts the relationship between the marketing-year average price of corn, for U.S.
farmers, and the stocks-to-use ratio at the end of each year. The line shown in the Figure is based on a statistical fit of the data for the 1989-90 through 2005-06 marketing years. The observation for 2006-07 is significantly above the previous average relationship, and the observation for 2007-08 is even further above the historical relationship. Indeed, last year’s price of $4.20 per bushel is estimated to be $1.87 higher than it would have been in the old regime, given an ending ratio of 12.7%.
The USDA’s forecast of a ratio of 9% and a price of $4.40 per bushel for 2008-09 is consistent with
the 2007-08 observation (see Figure 5-1). The corn market (and related markets) appear to be in a new price regime; for any given stocks-to-use ratio, prices are significantly higher than they were under the old regime. If the new regime holds, lower prices will require that the stocks-to-use ratio grows from the current level.

2009 Outlook Handbook Page 5-3
W.G. Tomek and T.M. Schmit Grain and Feed
TABLE 5-2. U.S. SUPPLY AND DEMAND BALANCE SHEET FOR CORNa 2006-07 2007-08E 2008-09F Supply: Harvested Acres (million) 70.6 86.5 78.2 Yield (bushels per acre) 149.1 151.5 153.8
(Million Bushels) Beginning Stocks 1,967 1,304 1,624 Production 10,535 13,074 12,020 Imports 12 20 15 Total Supply 12,514 14,398 13,659 Use: Feed & Residual 5,595 5,974 5,300 Food, Seed and Industrial 3,490 4,364 5,335 Ethanol for Fuelb 2,119 3,026 4,000 Total Domestic Use 9,085 10,338 10,635 Exports 2,125 2,436 1,900 Total Use 11,210 12,773 12,535 Ending Stocks 1,304 1,624 1,124
Stocks/Use Ratio 11.6% 12.7% 9.0%
Avg. farm price, U.S., $bu. 3.04 4.20 4.40
Avg. farm price, NYS, $bu. 3.42 4.30 -
aData from USDA, World Agricultural Outlook Board, (November 10, 2008) “World Agricultural Supply and Demand Estimates.” WASDE – 464, P. 12. bEthanol for fuel is included in the food, seed, and industrial category and presented for illustrative purposes.
TABLE 5-3. WORLD SUPPLY AND DEMAND BALANCE SHEET FOR CORNa 2006-07 2007-08E 2008-09F
(Million Metric Tons) Supply: Beginning Stocks 124.78 108.69 126.47 Production 712.44 791.96 781.36 Imports 90.92 96.64 80.43
Use: Feed, Domestic 478.29 498.39 488.02 Total, Domestic 728.53 774.18 797.71 Exports 93.80 95.38 82.33
Ending Stocks 108.69 126.47 110.12 Stocks/Use Ratio 14.9% 16.3% 13.8% aData from USDA, World Agricultural Outlook Board, (November 10, 2008) “World Agricultural Supply and Demand Estimates.” WASDE – 464

Page 5-4 2009 Outlook Handbook
Grain and Feed W.G. Tomek and T.M. Schmit
1.50
2.00
2.50
3.00
3.50
4.00
4.50
0% 5% 10% 15% 20% 25% 30%
U.S
. Ave
rage
Far
m P
rice,
$'s
per
Bus
hel
Stocks to Use Ratio
FIGURE 5-1. HISTORICAL RELATIONSHIP BETWEEN CORN PRICES AND THE STOCKS TO USE RATIO, 1989-2008. a
06/07
07/08E08/09F
A snapshot of futures prices, as of November 10, is provided in Table 5-4. Futures prices at this level–$4.00 to $4.25 for the current marketing year–imply that the USDA’s forecast of farm prices for 2008-09 is on the high side. Or, if the USDA forecast is correct, then futures prices should increase from their November 10 level.
TABLE 5-4 FUTURES PRICES FOR CORN, CHICAGO BOARD OF TRADE, NOVEMBER 10, 2008
Contract Month - $ per bu. - December 2008 3.935 March 2009 4.015 May 2009 4.1375 July 2009 4.2525 September 2009 4.360 December 2009 4.500 December 2010 4.510
In sum, the evidence about forthcoming corn prices is mixed. The USDA estimate is consistent with the previous year’s supply-demand conditions and with their estimates of expected conditions for the forthcoming year. But, as of this writing, traders in corn futures are expecting lower prices relative to those prevailing last year. Prices for new crop futures (for 2009-10 and 2010-11) are higher than those for this year, implying that traders expect tighter supply-demand balances in future years.

2009 Outlook Handbook Page 5-5
W.G. Tomek and T.M. Schmit Grain and Feed
Soybeans
The area planted to soybeans last spring rebounded about 10 million acres, but yields this year are about two bushels per acre below a year earlier (Table 5-5). The net effect is that soybean production of 2.92 billion bushels is about 250 million bushels larger this year than last. Carryover into the current marketing year was a meager 205 million bushels, and consequently the total supply this year is about 125 million bushels less than a year ago. World-wide production of soybeans is projected to be up around seven percent (Table 5-6).
The USDA expects the combined domestic and export uses of beans to decline by about 125 million
bushels, and if these estimates are correct, carryover will again be only 205 million bushels. Since use is projected to be smaller than last year, the stocks-to-use ratio is expected to increase slightly from 6.7% to 7.0%. The average farm-level price for 2008-09 is forecast to be $9.85 per bushel, down from the $10.10 of 2007-08.
TABLE 5-5. SUPPLY AND DEMAND BALANCE SHEET FOR SOYBEANSa
2006-07 2007-08E 2008-09F
Supply: Harvested Acres (millions) 74.6 64.1 74.4 Yield (bushels per acre) 42.7 41.7 39.3
(Million Bushels)
Beginning Stocks 449 574 205 Production 3,188 2,676 2,921 Imports 9 10 7 Total Supply 3,647 3,260 3,133
Use: Crushings 1,808 1,801 1,745 Exports 1,116 1,160 1,020 Seed 80 93 90 Residual 69 -1 72 Total Use 3,073 3,054 2,928 Ending Stocks 574 205 205 Stocks/Use Ratio 18.7% 6.7% 7.0% Avg. farm price, U.S., $bu. 6.43 10.10 9.85 Avg. farm price, NYS, $bu. 6.19 9.75 - aData from USDA, World Agricultural Outlook Board, (November 10, 2008) “World Agricultural Supply and Demand Estimates.” WASDE 464, P.15.
The estimated soybean price, like the price of corn, appears to be a little on the high side when compared to futures prices as of November 10. These prices range from $9.48 for January delivery to $9.77 for August delivery (Table 5-7). Typical farm prices will be below the futures quotes. New crop futures prices for beans, like those for wheat and corn, are above those for the current marketing year. From the perspective of grain producers, markets are “optimistic” about price levels in future years.

Page 5-6 2009 Outlook Handbook
Grain and Feed W.G. Tomek and T.M. Schmit
TABLE 5-6. WORLD SUPPLY AND USE BALANCE SHEET FOR SOYBEANSa 2006-07 2007-08E 2008-09F
(Million Metric Tons) Supply: Beginning Stocks 53.08 62.68 53.04 Production 237.33 220.89 235.74 Imports 69.05 78.86 77.11
Use: Crush, Domestic 195.90 201.96 203.60 Total, Domestic 225.28 229.96 233.96 Exports 71.50 79.43 77.87
Ending Stocks 62.68 53.04 54.06 Stocks/Use Ratio 27.8% 23.1% 23.1% aData from USDA, World Agricultural Outlook Board, (November 10, 2008) “World Agricultural Supply and Demand Estimates.” WASDE 464, P. 28.
TABLE 5-7. FUTURES PRICES FOR SOYBEANS AND SOYBEAN MEAL, THE CHICAGO BOARD OF TRADE, NOVEMBER 10, 2008
Contract Month Beans Meal $ per bu. $ per ton January 2009 9.48 276.90 March 2009 9.5725 279.50 May 2009 9.6725 282.20 July 2009 9.75 285.00 August 2009 9.77 286.20 September 2009 9.76 285.70 November 2009 9.74 284.50 (Dec) November 2010 9.78 283.50 (Dec)
The soybean meal price situation is similar to those for corn and soybeans. The average price in
2007-08 was $335.94 per ton, and the USDA projection is for a price of approximately $285 per ton in 2008-09 (range $255 to $315). The futures quotes (Table 5-7) suggest prices somewhat lower than the USDA projection, though not by a lot.
Feeds
As suggested in previous sections, feed ingredient prices are expected to be lower in 2008-09 than in 2007-08. But, looking out to future years, ingredient prices could very well be higher than 2008-09. Of course, these prices change from day to day and often by large amounts. This is demonstrated in Figure 5-2, which shows the weekly prices for the March 2009 soybean meal contract. Over the life of this contract, prices have been over $430 and below $250 per ton; as on November 14, the price was $271 per ton. Clearly, purchasing ingredients in current volatile markets is a challenge. Below, we provide some suggestions about managing purchases, but there are no easy solutions when prices are as variable as they currently are. Managing price risk is costly.

2009 Outlook Handbook Page 5-7
W.G. Tomek and T.M. Schmit Grain and Feed
Professor Schmit, graduate student Leslie Verteramo, and I have a model that can project selected mixed feed costs, conditional on an assumed set of ingredient costs. One set of estimates for dairy and layer feeds is shown in Table 5-8. They suggest, for example, that 18% protein dairy feed could be about $55 per ton lower this coming spring than a year earlier. As noted in the table’s footnote, this particular result assumes, among other things, that corn prices will be $4 per bushel ($133 per ton) and soybean meal $255 per ton. These prices are consistent with recent quotes for corn and soybean meal futures contracts for March delivery. Obviously, the actual ingredient prices next March may be higher or lower than the November quotes, and it is the volatility in the underlying ingredient prices that makes feed costs difficult to forecast.
TABLE 5-8. APRIL COMPLETE FEED PRICES FOR DAIRY AND LAYERS, NORTHEAST U.S., 1999-2008.a
Year Dairy (18%) Layer 1999 179 210 2000 181 212 2001 184 212 2002 192 215 2003 207 232 2004 221 260 2005 202 207 2006 217 237 2007 259 288 2008 312 332 2009F 256 288 a Historical prices from USDA Agricultural Prices. Authors’ 2009 forecasts assume $4/bu corn, $255/ton soybean meal, $150/ton distillers dried grains with solubles, and $255/ton meat & bone meal.
FIGURE 5-2. PRICES OF SOYBEAN MEAL MARCH 2009 FUTURES CONTRACT, WEEKLY, OCTOBER 2007 THROUGH NOVEMBER 14, 2008
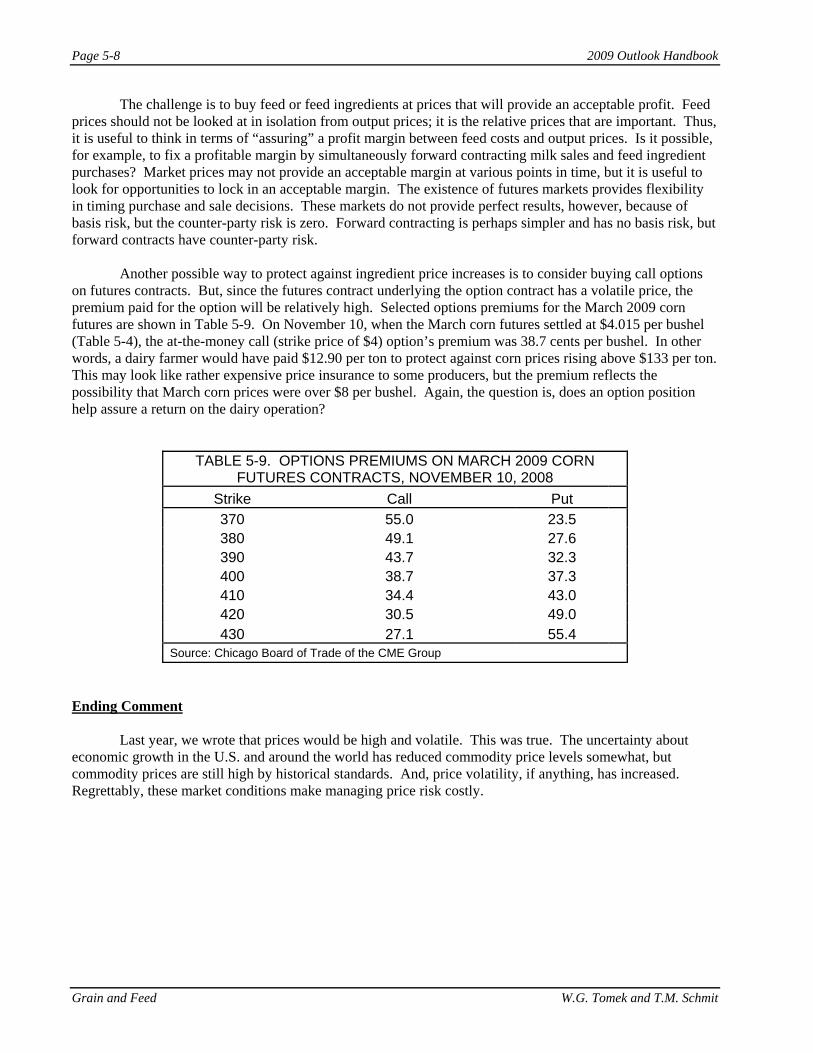
Page 5-8 2009 Outlook Handbook
Grain and Feed W.G. Tomek and T.M. Schmit
The challenge is to buy feed or feed ingredients at prices that will provide an acceptable profit. Feed prices should not be looked at in isolation from output prices; it is the relative prices that are important. Thus, it is useful to think in terms of “assuring” a profit margin between feed costs and output prices. Is it possible, for example, to fix a profitable margin by simultaneously forward contracting milk sales and feed ingredient purchases? Market prices may not provide an acceptable margin at various points in time, but it is useful to look for opportunities to lock in an acceptable margin. The existence of futures markets provides flexibility in timing purchase and sale decisions. These markets do not provide perfect results, however, because of basis risk, but the counter-party risk is zero. Forward contracting is perhaps simpler and has no basis risk, but forward contracts have counter-party risk.
Another possible way to protect against ingredient price increases is to consider buying call options on futures contracts. But, since the futures contract underlying the option contract has a volatile price, the premium paid for the option will be relatively high. Selected options premiums for the March 2009 corn futures are shown in Table 5-9. On November 10, when the March corn futures settled at $4.015 per bushel (Table 5-4), the at-the-money call (strike price of $4) option’s premium was 38.7 cents per bushel. In other words, a dairy farmer would have paid $12.90 per ton to protect against corn prices rising above $133 per ton. This may look like rather expensive price insurance to some producers, but the premium reflects the possibility that March corn prices were over $8 per bushel. Again, the question is, does an option position help assure a return on the dairy operation?
TABLE 5-9. OPTIONS PREMIUMS ON MARCH 2009 CORN FUTURES CONTRACTS, NOVEMBER 10, 2008
Strike Call Put 370 55.0 23.5 380 49.1 27.6 390 43.7 32.3 400 38.7 37.3 410 34.4 43.0 420 30.5 49.0 430 27.1 55.4 Source: Chicago Board of Trade of the CME Group
Ending Comment
Last year, we wrote that prices would be high and volatile. This was true. The uncertainty about economic growth in the U.S. and around the world has reduced commodity price levels somewhat, but commodity prices are still high by historical standards. And, price volatility, if anything, has increased. Regrettably, these market conditions make managing price risk costly.

Chapter 6. Dairy — Markets and PolicyMark W. Stephenson, Senior Extension Associate
2009 Dairy Outlook
Positive Factors:• Excellent quality and quantity of feeds in the Northeast• Lower feed, fuel and fertilizer prices
Negative Factors:• Lower exports of dairy products• Domestic economy in recession
Uncertainties:• New Administration• Length and depth of recession
Percent ChangeItem 2007 2008 2009 07-08 08-09
Number of milk cows (thousand head) 627 626 624 -0.2 -0.3
Milk per cow (lbs.) 19,303 19,900 20,000 3.1 0.5
Total milk production (million lbs.) 12,103 12,430 12480 2.7 0.4
Blended milk price ($/cwt.) 19.85 18.76 16.25 -5.5 -13.4
New York Dairy Situation and Outlook2007 Projected 2008, and Estimated 2009
a
a Northeast federal order statistical uniform price for farms shipping milk to Suffolk County, MA (Boston).
2009 Outlook Handbook Page 6-1
M.W. Stephenson Dairy—Markets & Policy

Tabl
e 6-
1. U
.S. M
ilk S
uppl
y an
d U
tiliz
atio
n, 2
000–
2008
2001
2002
2003
2004
2005
2006
2007
2008
2009
Sup
ply
Cow
s N
umbe
rs (t
hous
.)9,
115
9,13
79,
084
9,01
09,
043
9,11
29,
158
9,26
19,
200
Pro
duct
ion/
cow
(lbs
)18
,139
18,6
1218
,748
18,9
5819
,565
19,9
5120
,267
20,4
2320
,627
Pro
duct
ion
165.
516
9.8
170.
317
0.8
176.
918
1.8
185.
618
9.1
189.
8Fa
rm U
se1.
01.
01.
11.
01.
01.
01.
01.
01.
0M
arke
tings
164.
516
8.8
169.
216
9.8
175.
918
0.8
184.
618
8.2
188.
8
Beg
inni
ng C
omm
erci
al S
tock
s6.
86.
19.
98.
37.
28.
09.
510
.412
.8Im
ports
5.7
5.1
5.0
5.3
5.1
5.0
4.6
3.3
4.0
Tota
l Sup
ply
177.
018
0.0
184.
218
3.4
188.
219
3.8
198.
720
1.8
205.
6
Util
izat
ion
Com
mer
cial
Dis
appe
aran
ce16
9.8
169.
817
4.7
176.
418
0.2
184.
318
8.4
189.
018
9.5
End
ing
Com
mer
cial
Sto
cks
7.0
9.9
8.3
7.2
8.0
9.5
10.4
12.8
14.0
DE
IP0.
10.
00.
10.
10.
00.
00.
00.
00.
0N
et R
emov
als
(exc
ludi
ng D
EIP
)0.
10.
31.
1-0
.20.
00.
00.
00.
02.
1
Tota
l Use
177.
018
0.0
184.
218
3.4
188.
219
3.8
198.
720
1.8
205.
6ca
**b
2009 Outlook Handbook Page 6-2
M.W. Stephenson Dairy—Markets & Policy
Sour
ce:
Dai
ry S
ituat
ion
and
Out
look
, Milk
Pro
duct
ion,
and
Dai
ry M
arke
t New
s, U
.S. D
epar
tmen
t of A
gric
ultu
re.
Not
e th
at to
tal m
ay n
ot a
dd
exac
tly d
ue to
roun
ding
.
* Le
ap y
ear.
a Rev
ised.
b Bas
ed o
n pr
elim
inar
y U
SDA
data
and
Cor
nell
estim
ates
.c P
roje
cted
by
Mar
k St
ephe
nson
.

The Dairy Situation
2008 continued our emergence as a major dairy exporting country. It wasn’t many years ago that it was typical for us to export something like 2 to 3 percent of our milk solids and we imported about the same amount. Of course, we were typically importing very high value dairy products like specialty cheeses and exporting lower value products like butter or nonfat dry milk. This meant that from a dollar standpoint, we were always a trade deficit industry. In 2008 that changed.
For the first time ever, we will close the year as a net exporter in both volume and value, exporting something like 12 percent of our milk solids and close to $1 billion more than we imported. At the time of this writing we only have export data for the first three quarters of the year, but, through September 2008, export value stood at $3.09 billion, up 52 percent from year ago levels. Nonfat dry milk and skim milk powder exports were up 77 percent, cheese exports up 48 percent and butter shipments up an amazing 214 percent. The United States is capable of supplying a lot of dairy products into world markets
Monthly Value of Dairy Exports
$0
$50,000
$100,000
$150,000
$200,000
$250,000
$300,000
$350,000
$400,000
Jan-0
0
Jul-
00
Jan-0
1
Jul-
01
Jan-0
2
Jul-
02
Jan-0
3
Jul-
03
Jan-0
4
Jul-
04
Jan-0
5
Jul-
05
Jan-0
6
Jul-
06
Jan-0
7
Jul-
07
Jan-0
8
Jul-
08
U.S. Commerace and ITC Data
(1000s of Dollars)
There are three primary reasons that dairy exports have been such a big story for the U.S.: world demand, world supply, and exchange rates. Income in many countries of the world has increased dramatically. Of course we cite China and the dramatic growth in their gross domestic product. However, as the worldwide price of oil has soared, so have incomes in oil exporting countries like
2009 Outlook Handbook Page 6-3
M.W. Stephenson Dairy—Markets & Policy

Russia, Mexico and the Middle East. In many of these countries, increased income is spent on improving the quality of their diet and dairy products have featured prominently in this effort.
At a time when world demand for dairy products was increasing, the supply of dairy products from traditional dairy exporters was faltering. The European Union has been implementing their Common Agricultural Policy (CAP) reform which calls for the end of subsidized exports of dairy products. Europe had been the largest exporter of dairy products but their exports are dramatically decreased as milk prices seek equilibrium in this new policy environment. Prior to the CAP reforms, the second largest exporter of dairy products was Oceania—Australia and New Zealand. Australia’s milk production has been down by as much as 15 percent from the high water mark as they battle a prolonged drought (now in it’s seventh year). New Zealand began the 2007-08 production year with good pastures and increased milk production. However, they were also impacted by the drought during the latter half of their milk production cycle and ended the year with about an 8 percent decline in production.
Exchange rates have also been an important aspect of U.S. dairy trade. The value of the dollar had declined against most major currencies from 2002 through the first half of 2008. In fact, it had dropped to about half its value against the Euro. With no change in supply or demand, U.S. dairy products would cost half as much to purchase as they would have just a few years ago—good news for exporters.
All factors taken together, U.S. dairy exports have soared and positioned us as a major player in world markets. Dairy exports have helped to give dairy producers the second highest milk price year, down just about a dollar per hundredweight from the record year of 2007.
The Milk Supply
Don Kullmann of Prairie Farms Dairy Cooperative used to talk about his “3M”, “5M ”and “7M” theories of milk production: “money makes milk,” “more money makes more milk ”and “much more money makes much more milk.” Given that we have just passed through the highest and second highest milk price years, you would think that we should be headed into a tsunami of milk production. This hasn’t occurred largely because margins have not great. We should probably substitute the word “Margin” for “Money” in the Kullmann theory of milk production.
High fertilizer, fuel and feed costs have held down more dramatic increases in milk production. It has been typical for us to increase milk production by just more than 1 percent over year earlier levels. Adjusted for leap year, 2008 will have increased milk production by just about 1.6 percent which is a very ordinary long-run increase (we have increased by 2-3 percent in the prior three years).
By any measure—milk price or margin—2007 was a very good year for dairy farmers. Credit reserves were restored from the beating they took in 2006 when we last experienced low milk prices. However, 2007 was the year that we began to see a dramatic increase in oil prices. With the higher oil prices came a new interest in corn-based ethanol as a sustainable bio-fuel and with the new demand for corn in ethanol production came higher feed costs for dairy producers. The chart below shows the dramatic increase in feed prices.
2009 Outlook Handbook Page 6-4
M.W. Stephenson Dairy—Markets & Policy

NASS Feed Ration Value
$0.00
$2.00
$4.00
$6.00
$8.00
$10.00
$12.00
Jan-0
0
Apr-
00
Jul-
00
Oct
-00
Jan-0
1
Apr-
01
Jul-
01
Oct
-01
Jan-0
2
Apr-
02
Jul-
02
Oct
-02
Jan-0
3
Apr-
03
Jul-
03
Oct
-03
Jan-0
4
Apr-
04
Jul-
04
Oct
-04
Jan-0
5
Apr-
05
Jul-
05
Oct
-05
Jan-0
6
Apr-
06
Jul-
06
Oct
-06
Jan-0
7
Apr-
07
Jul-
07
Oct
-07
Jan-0
8
Apr-
08
Jul-
08
Soybean ValueCorn ValueAlfalfa Value
(per 100 lbs feed)
Because feed is the single largest cost category for milk producers, the National Agricultural Statistics Service (NASS) has published a Milk-Feed Price ratio to provide an indication of the well-being on dairy farms. The ratio was a reasonable indicator until we had a doubling of feed costs and a dramatic increase in milk prices. By historic standards of the milk-feed price ratio, 2008 looks like perhaps the worst year ever for dairy producers. However, it is probably more accurate to look at a milk-feed margin rather than a ratio. The margin also shows a good deal of tightening but not to the levels seen in 2006. That is probably why we have seen an ordinary increase in the milk supply.
The increase in milk supply has come about primarily because of increased milk cow numbers. Milk production per cow has a nearly linear trend of increasing about 260 pounds per year. In 2008, the increase will be about 160 pounds and is well off the long-term trend. It is more typical for cow numbers to decrease over the long-run but, since 2004, cow numbers have been increasing. Only in the last quarter of 2008 have we seen cow numbers begin to decline once again.
With high feed prices (particularly concentrate prices) dairy farmers have chosen to not push productivity as hard and to milk more cows. This allows cows to make better use of forages and keep purchased feed costs (if not feed prices) to a minimum.
2009 Outlook Handbook Page 6-5
M.W. Stephenson Dairy—Markets & Policy

Milk Per Cow Per Day
48.00
49.00
50.00
51.00
52.00
53.00
54.00
55.00
56.00
57.00
58.00Jan-03
Mar-03
May-03
Jul-03
Sep-03
Nov-03
Jan-04
Mar-04
May-04
Jul-04
Sep-04
Nov-04
Jan-05
Mar-05
May-05
Jul-05
Sep-05
Nov-05
Jan-06
Mar-06
May-06
Jul-06
Sep-06
Nov-06
Jan-07
Mar-07
May-07
Jul-07
Sep-07
Nov-07
Jan-08
Mar-08
May-08
Jul-08
Sep-08
U.S. Milk Cows(In 1000s)
8,800
8,850
8,900
8,950
9,000
9,050
9,100
9,150
9,200
9,250
9,300
9,350
Jan-03
Mar-03
May-03
Jul-03
Sep-03
Nov-03
Jan-04
Mar-04
May-04
Jul-04
Sep-04
Nov-04
Jan-05
Mar-05
May-05
Jul-05
Sep-05
Nov-05
Jan-06
Mar-06
May-06
Jul-06
Sep-06
Nov-06
Jan-07
Mar-07
May-07
Jul-07
Sep-07
Nov-07
Jan-08
Mar-08
May-08
Jul-08
Sep-08
2009 Outlook Handbook Page 6-6
M.W. Stephenson Dairy—Markets & Policy
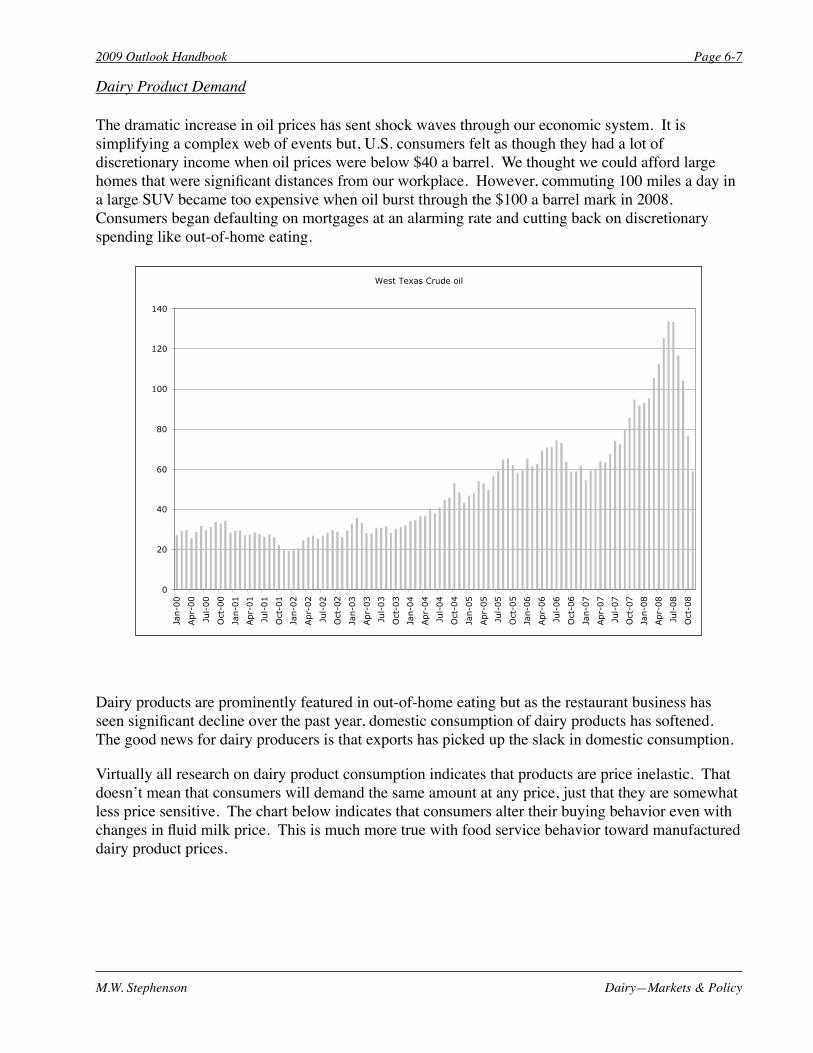
Dairy Product Demand
The dramatic increase in oil prices has sent shock waves through our economic system. It is simplifying a complex web of events but, U.S. consumers felt as though they had a lot of discretionary income when oil prices were below $40 a barrel. We thought we could afford large homes that were significant distances from our workplace. However, commuting 100 miles a day in a large SUV became too expensive when oil burst through the $100 a barrel mark in 2008. Consumers began defaulting on mortgages at an alarming rate and cutting back on discretionary spending like out-of-home eating.
West Texas Crude oil
0
20
40
60
80
100
120
140
Jan-0
0
Apr-
00
Jul-
00
Oct
-00
Jan-0
1
Apr-
01
Jul-
01
Oct
-01
Jan-0
2
Apr-
02
Jul-
02
Oct
-02
Jan-0
3
Apr-
03
Jul-
03
Oct
-03
Jan-0
4
Apr-
04
Jul-
04
Oct
-04
Jan-0
5
Apr-
05
Jul-
05
Oct
-05
Jan-0
6
Apr-
06
Jul-
06
Oct
-06
Jan-0
7
Apr-
07
Jul-
07
Oct
-07
Jan-0
8
Apr-
08
Jul-
08
Oct
-08
Dairy products are prominently featured in out-of-home eating but as the restaurant business has seen significant decline over the past year, domestic consumption of dairy products has softened. The good news for dairy producers is that exports has picked up the slack in domestic consumption.
Virtually all research on dairy product consumption indicates that products are price inelastic. That doesn’t mean that consumers will demand the same amount at any price, just that they are somewhat less price sensitive. The chart below indicates that consumers alter their buying behavior even with changes in fluid milk price. This is much more true with food service behavior toward manufactured dairy product prices.
2009 Outlook Handbook Page 6-7
M.W. Stephenson Dairy—Markets & Policy

Fluid Milk Sales Versus Price
-15%
-10%
-5%
0%
5%
10%
15%
20%
25%
30%
35%
Jan-2
005
Mar-20
05
May-20
05
Jul-2
005
Sep-20
05
Nov-20
05
Jan-2
006
Mar-20
06
May-20
06
Jul-2
006
Sep-20
06
Nov-20
06
Jan-2
007
Mar-20
07
May-20
07
Jul-2
007
Sep-20
07
Nov-20
07
Jan-2
008
Mar-20
08
May-20
08
Perc
ent C
hang
e in
Pric
e
-3%
-2%
-1%
0%
1%
2%
3%
Perc
ent C
hang
e in
Sal
es
Price ChangeSales Change
The Dairy Outlook
Many factors look different at the end of 2008 than they did at the beginning of the year. For instance, Oceania has begun their 2008-09 milk production season with a strong start. Both Australia and New Zealand have increased milk production and, barring a recurrence of last year’s drought, expect to export more milk products than they did last year. Also, the rest of the world’s economies are following the United States economy down into a recession. And, as if this weren’t bad enough news for U.S. exports, our dollar has strengthened significantly against most currencies. It is an almost sure thing that U.S. dairy exports will be well down in 2009.
If exports are down, the milk that would have been used to produce those products will be pushed back onto our domestic market. Unfortunately, I expect that our own domestic economy will suffer through all of 2009 and dairy products will not escape the consumer belt tightening. Table 6.1 is a U.S. Supply and Utilization table that tries to pull together these expected outcomes. I have commercial disappearance, which includes domestic consumption and non-government exports, as being up just slightly in 2009—well below trend. I also have U.S. milk production barely increasing over the year with cow numbers in decline and productivity below trend. Still, this causes an increase in commercial inventories which I think most manufacturers will be reluctant to do in the face of falling prices. Net Removals are the line item to pick up the slack.
Net Removals are purchases of dairy products by the Commodity Credit Corporation (CCC). In the two months since the beginning of October, 2008, the CCC has already purchased nearly 70 million pounds of nonfat dry milk. This is equivalent to nearly 1 billion pounds of milk production and I think that the CCC will be purchasing quite a bit more dairy product throughout the rest of 2009.
2009 Outlook Handbook Page 6-8
M.W. Stephenson Dairy—Markets & Policy

CCC purchases have implications for milk prices. If prices were to fall to support levels, then we would be looking at something like $10 milk. I don’t think that this is likely as exports would pick up at those levels of prices thus pushing market prices above support. However, I am expecting farm milk prices to drop by about $2.50 from year earlier levels and, 2008 prices were already more than a dollar below 2007 levels. Milk prices will have to be low enough to discourage milk production and clear the markets.
If there is a silver lining to this forecast, it is that oil prices have fallen from recent highs near $140 a barrel to below $50 a barrel. This will considerably ease dairy farm costs of fuel, fertilizer and feed and ultimately, it will help consumers to climb out from under the dark cloud of recession and begin to increase purchases again. As an example, December 08 futures for corn have fallen from a high above $6.00 a bushel in August of 2008 to less than $3.50 a bushel three months later.
Dairy Policy
2007 was a Farm Bill year and legislation was passed. The bill contained only minor changes for dairy but did include an extension of the Dairy Export Incentive Program which might see some usage this year and an alteration to the Milk Income Loss Contract (MILC) program. The new program raises the production cap from 2.4 million pounds to 2.985 million and it increases the percentage payout above the trigger price from 34 percent to 45 percent. However, the biggest change was a means of raising the trigger price based on changes in the feed price. Currently, using futures market values for milk and feed prices, I don’t expect any MILC payments in 2009. However, there are several months where the trigger price is close to being invoked and the possibility of payments exists if milk prices decline faster than feed prices.
The Farm Bill also called for the formation of a Federal Milk Marketing Order review commission. The commission was not funded in the Farm Bill and it is doubtful if it will ever be formed to carry out its task.
Federal Milk Marketing Orders did increase make allowances slightly in 2008 and there was an emergency hearing which resulted in changes to class I differentials in the Southeast. In the year ahead, I don’t expect many dramatic changes in the order system but there are folks across the country who are talking about a national hearing to consider the entire class I price surface again. It is possible that such a hearing would be convened but it is unlikely that any such changes in Federal Orders would be promulgated in the year ahead.
The results of recent elections raise several questions with regard to dairy policy. One is who will be named the next Secretary of Agriculture. Another is whether the recently passed Farm Bill would be opened up for new considerations. Having a Democratic House, Senate and Administration could bring new policy affecting dairy in the year ahead.
2009 Outlook Handbook Page 6-9
M.W. Stephenson Dairy—Markets & Policy

Tabl
e 6-
2. N
atio
nal F
arm
Pric
es fo
r Milk
; CC
C P
urch
ase,
Who
lesa
le, a
nd R
etai
l Pric
es fo
r Che
ddar
Che
ese,
But
ter,
and
Non
fat D
ry M
ilk; a
nd S
elec
ted
Ret
ail P
rice
Indi
ces,
199
8–20
08
1998
1999
2000
2001
2002
2003
2004
2005
2006
2007
2008
Farm
Milk
($/c
wt.)
All
Milk
(ave
. fat
)15
.50
14.3
812
.40
15.0
412
.18
12.5
516
.13
15.1
912
.96
19.2
118
.29
Cla
ss II
I (3.
5%)
14.2
012
.43
9.74
13.1
010
.42
11.4
215
.39
14.0
511
.89
18.0
417
.37
Sup
port
(3.5
%)
9.95
9.80
9.80
9.80
9.80
9.80
9.80
9.80
9.80
9.80
9.80
Milk
Pric
e: F
eed
Pric
e V
alue
3.34
3.59
3.05
3.39
2.60
2.61
3.10
3.24
2.56
2.80
2.17
MIL
C p
aym
ents
0.00
0.00
0.00
0.06
1.21
1.09
0.22
0.04
0.61
0.07
0.00
Che
ddar
Che
ese,
Blo
cks
($/lb
.)C
CC
Pur
chas
e1.
115
1.10
01.
122
1.13
11.
131
1.13
11.
131
1.13
11.
131
1.13
11.
131
Who
lesa
le, C
hica
go M
erca
ntile
Exc
hang
e1.
569
1.40
41.
149
1.43
91.
182
1.31
71.
649
1.49
21.
239
1.75
81.
862
But
ter (
$/lb
.)C
CC
Pur
chas
e, G
rade
A o
r hig
her,
Chi
cago
0.65
00.
650
0.66
80.
855
0.85
51.
050
1.05
01.
050
1.05
01.
050
1.05
0W
hole
sale
, Gr.
AA
, Chi
cago
Mer
c. E
xcha
nge
1.76
91.
229
1.17
71.
663
1.10
61.
145
1.81
71.
549
1.23
61.
368
1.49
8
Non
fat D
ry M
ilkC
CC
Pur
chas
e, U
nfor
tifie
d ($
/lb.)
1.02
81.
010
1.01
00.
900
0.90
00.
800
0.80
00.
800
0.80
00.
800
0.80
0W
hole
sale
, Cen
tral S
tate
s*1
.069
1.03
11.
015
1.00
40.
928
0.83
80.
858
0.98
51.
001
1.80
41.
300
Ret
ail P
rice
Indi
ces
(198
2–84
=100
.0)
1998
1999
2000
2001
2002
2003
2004
2005
Who
le M
ilk14
7.9
156.
215
6.9
165.
916
2.1
162.
518
3.4
184.
918
1.6
205.
421
8.6
Che
ese
152.
316
2.6
162.
816
7.6
170.
016
9.4
180.
818
3.3
180.
819
1.5
212.
7A
ll D
airy
Pro
duct
s15
0.8
159.
616
0.7
167.
116
8.1
167.
918
0.2
182.
418
1.4
194.
820
9.8
All
Food
161.
116
4.6
168.
417
3.6
176.
818
0.5
186.
619
1.2
195.
720
3.3
212.
7A
ll C
onsu
mer
Pric
es16
3.0
166.
617
2.2
177.
117
9.9
184.
018
8.9
195.
320
1.6
207.
321
6.0
c
ba
Sour
ce:
Dai
ry S
ituat
ion
and
Out
look
, Dai
ry M
arke
t New
s, an
d Fe
dera
l Milk
Ord
er M
arke
t Sta
tistic
s, U
.S. D
epar
tmen
t of A
gric
ultu
re.
a Re
vise
d.b
Estim
ated
by
Mar
k St
ephe
nson
.c
Milk
Inco
me
Loss
Con
tract
pay
men
ts be
gan
in O
ctob
er o
f 200
1.
2009 Outlook Handbook Page 6-10
M.W. Stephenson Dairy—Markets & Policy

The Northeast Dairy Situation and Outlook
Jan-07 Feb-07 Mar-07 Apr-07 May-07 Jun-07 Jul-07 Aug-07 Sep-07 Oct-07 Nov-07 Dec-07 TotalCT 31,049 28,383 31,580 30,427 31,085 29,150 29,141 28,756 27,577 28,193 27,329 28,796 351,466ME 48,091 42,662 47,506 46,409 49,188 49,199 50,401 49,593 47,756 48,492 46,618 48,375 574,290MA 20,949 18,665 20,674 20,088 20,711 19,539 19,806 19,453 18,533 19,021 18,289 19,212 234,940
MD 75,004 67,140 84,740 75,335 78,337 75,525 73,326 68,821 68,052 70,385 70,096 74,509 881,270NJ 13,684 12,311 13,694 13,167 13,723 12,583 12,780 23,205 22,481 22,955 22,271 13,004 195,858NY 790,799 711,246 798,168 779,669 816,907 743,663 810,212 906,372 856,321 905,442 859,864 868,770 9,847,433PA 633,885 573,395 684,456 673,559 708,775 668,492 681,273 653,055 628,187 654,903 645,275 678,530 7,883,785VT 214,962 192,010 212,638 206,830 215,751 208,117 213,498 211,602 202,489 208,972 202,786 213,203 2,502,858
VA 7,498 7,095 8,266 8,161 8,401 8,201 8,048 7,684 7,619 8,111 8,524 8,512 96,120Other Regional* 24,678 22,447 25,352 24,520 25,278 24,136 24,562 13,684 13,294 13,560 13,507 24,596 249,614
Other States** 18,560 16,997 21,853 23,292 20,286 17,973 17,946 16,158 14,438 16,322 18,056 17,942 219,823Total 1,879,159 1,692,351 1,948,927 1,901,457 1,988,442 1,856,578 1,940,993 1,998,383 1,906,747 1,996,356 1,932,615 1,995,449 23,037,457* Includes data for the states of New Hampshire, and Rhode Island.** Represents restricted data for the states of Delaware, Indiana, Iowa, Michigan, North Carolina, Ohio, West Virginia, and Wisconsin.
Receipts of Producer Milk by State, 1000s PoundsNortheast Federal Milk Marketing Order
Source: Northeast Monthly Federal Milk Order Market Statistics .
Dairy producer numbers have declined for many years as remaining farms have become larger. The Northeast is about 8 billion pounds of milk net deficit in total production. This can make pooling milk on this order attractive to distant producers. Producers from states as far away as Ohio, Michigan, Delaware, West Virginia and even North Carolina, Indiana and Iowa have pooled milk on this order.
It may be of interest to note that in July of 2008, Idaho surpassed New York as the number 3 milk producing state in the country.
Jan-07 Feb-07 Mar-07 Apr-07 May-07 Jun-07 Jul-07 Aug-07 Sep-07 Oct-07 Nov-07 Dec-07 TotalCT 142 140 141 141 139 140 138 136 135 134 137 135 138ME 339 337 336 338 335 338 336 333 333 332 333 334 335
MA 166 164 163 163 164 164 163 521 524 518 515 166 283MD 506 507 514 513 502 505 518 163 163 161 164 511 394
NJ 109 108 107 106 105 105 104 104 104 103 103 102 105NY 5,192 5,196 5,178 5,205 5,190 4,928 5,111 5,118 5,099 5,095 5,086 5,078 5,123
PA 5,908 5,879 5,970 5,928 5,911 5,954 5,999 6,005 5,956 5,960 5,957 5,964 5,949VT 1,121 1,112 1,105 1,110 1,118 1,094 1,085 1,086 1,087 1,090 1,087 1,082 1,098VA 69 59 72 74 74 84 85 80 84 77 73 72 75
Other Regional* 145 146 149 150 150 149 147 147 146 145 148 147 147Other States** 204 205 256 268 243 218 206 242 228 212 253 208 229
Total 13,901 13,853 13,991 13,996 13,931 13,679 13,892 13,935 13,859 13,827 13,856 13,799 13,877* Includes data for the states of New Hampshire, and Rhode Island.** Represents restricted data for the states of Delaware, Indiana, Iowa, Michigan, North Carolina, Ohio, West Virginia, and Wisconsin.
Northeast Federal Milk Marketing OrderNumber of Producers by State
Source: Northeast Monthly Federal Milk Order Market Statistics .
2009 Outlook Handbook Page 6-11
M.W. Stephenson Dairy—Markets & Policy

Jan-07 Feb-07 Mar-07 Apr-07 May-07 Jun-07 Jul-07 Aug-07 Sep-07 Oct-07 Nov-07 Dec-07Class I Utilization 48.6% 48.6% 47.4% 44.3% 44.6% 44.8% 42.0% 43.8% 44.5% 46.4% 46.7% 45.4%Class II Utilization 19.7% 20.0% 20.9% 21.6% 21.8% 21.9% 21.4% 21.3% 20.9% 20.3% 19.0% 17.3%Class III Utilization 23.0% 23.0% 23.4% 23.4% 22.8% 22.0% 24.2% 27.6% 27.0% 26.9% 26.1% 23.9%Class IV Utilization 8.7% 8.5% 8.4% 10.7% 10.7% 11.4% 12.4% 7.2% 7.6% 6.4% 8.2% 13.3%
Class I Price $16.84 $16.64 $17.50 $18.25 $19.17 $21.09 $24.16 $25.01 $25.16 $24.84 $24.70 $23.29Class II Price $12.85 $13.08 $13.60 $14.51 $16.62 $18.89 $21.40 $22.41 $22.16 $21.90 $22.07 $20.82Class III Price $13.56 $14.18 $15.09 $16.09 $17.60 $20.17 $21.38 $19.83 $20.07 $18.70 $19.22 $20.60Class IV Price $12.53 $12.71 $13.71 $16.12 $18.48 $20.76 $21.64 $21.87 $21.61 $21.31 $20.40 $19.18
Butterfat Price $1.30 $1.31 $1.38 $1.47 $1.57 $1.65 $1.61 $1.59 $1.51 $1.41 $1.41 $1.43Protein Price $2.41 $2.41 $2.43 $2.52 $2.94 $3.71 $4.21 $3.94 $4.39 $4.17 $4.31 $4.71Other Solids Price $0.32 $0.42 $0.53 $0.60 $0.58 $0.58 $0.55 $0.44 $0.29 $0.23 $0.25 $0.26PPD $1.53 $1.03 $0.99 $0.93 $1.00 $0.63 $1.56 $3.31 $2.92 $3.68 $3.09 $0.99
Class Utilization and PricesNortheast Federal Milk Marketing Order
Source: Northeast Monthly Federal Milk Order Market Statistics .
The graphs below are created from the data above. They illustrate the where the money in the Northeast Federal Order pool is coming from and how it is being paid out. The first graph shows the contribution of processors from the four classes of milk to the pool. The second graph shows the disbursement of the pool dollars to producers in component values and the Producer Price Differential. Protein values dominated the contribution of components in the second half of the year.
Makeup of 2007 Statistically Uniform Price by Class PricesNortheast Federal Milk Marketing Order
$0.00
$5.00
$10.00
$15.00
$20.00
$25.00
Jan-
07
Feb-
07
Mar
-07
Apr-0
7
May
-07
Jun-
07
Jul-0
7
Aug-
07
Sep-
07
Oct
-07
Nov
-07
Dec
-07
Class I
Class II
Class IIIClass IV
Location Adjustment
Makeup of 2007 Statistically Uniform Price by Component Values
Northeast Federal MilkMarketing Order
$0.00
$5.00
$10.00
$15.00
$20.00
$25.00
Jan-
07
Feb-
07
Mar
-07
Apr-0
7
May
-07
Jun-
07
Jul-0
7
Aug-
07
Sep-
07
Oct
-07
Nov
-07
Dec
-07
Butterfat Value
Protein Value
Other Solids ValuePPD
2009 Outlook Handbook Page 6-12
M.W. Stephenson Dairy—Markets & Policy

Month 2007 2008 Difference
October 22.38 17.44 -4.94November 22.31 17.56 -4.75December 21.59 16.44 -5.15Fourth Quarter Average 22.09 17.15 -4.95
Annual Average 19.85 18.76 -1.09
Month 2008 2009 Difference
January 20.97 16.01 -4.96February 19.54 15.50 -4.04March 17.89 15.26 -2.63First Quarter Average 19.47 15.59 -3.88
April 18.55 15.58 -2.97May 18.18 15.62 -2.56June 19.56 16.07 -3.49Second Quarter Average 18.76 15.76 -3.01
July 20.61 16.44 -4.17August 19.50 16.71 -2.79September 18.90 16.86 -2.04Third Quarter Average 19.67 16.67 -3.00
October 17.44 16.95 -0.49November 17.56 17.01 -0.55December 16.44 16.99 0.55Fourth Quarter Average 17.15 16.98 -0.16
Annual Average 18.76 16.25 -2.51
(dollars per hundredweight)
(dollars per hundredweight)
MILK PRICE PROJECTIONS*Northeast Federal Order Blend Price
3.5 Percent, Suffolk County, MassachusettsLast Quarter 2007-2008, Four Quarters 2008-2009
a
a
aa
a a
a
a
a
aaa
a
* Averages may not add due to rounding.a Projected.
2009 Outlook Handbook Page 6-13
M.W. Stephenson Dairy—Markets & Policy

Notes

W.A. Knoblauch/G.J. Conneman/L.D. Putnam Dairy--Farm Management
Chapter 7. Dairy -- Farm Management Wayne A. Knoblauch, Professor George J. Conneman, Professor
Linda D. Putnam, Extension Support Specialist
Herd Size Comparisons Data from the 250 New York dairy farms that participated in the Dairy Farm Business Summary (DFBS) Project in 2007 have been sorted into eight herd size categories and averages for the farms in each category are presented in Tables 7-1 and 7-2. Note that after the less than 50 cow category, the herd size categories increase by 25 cows up to 100 cows, by 100 cows up to 400 cows, and by 200 cows up to 600 cows. As herd size increases, the net farm income increases (Table 7-1). Net farm income without appreciation averaged $36,257 per farm for the less than 50 cow farms and $1,156,991 per farm for those with more than 600 cows. The return to all capital without appreciation also generally increased as herd size increased. It is more than size of herd that determines profitability on dairy farms. Farms with 600 and more cows averaged $1,136 net farm income per cow while the less than 50 cow dairy farms averaged $879 net farm income per cow. The 300 to 399 herd size category had the highest net farm income per cow at $1,376, while the 400 to 499 herd size category had the second highest net farm income per cow at $1,287. Other factors that affect profitability and their relationship to the size classifications are shown in Table 7-2.
TABLE 7-1. COWS PER FARM AND FARM FAMILY INCOME MEASURES 250 New York Dairy Farms, 2007
Number of Cows
Number
of Farms
Average Number
of Cows
Net Farm Income without
Appreciation
Net Farm Income per Cow
Labor & Management Income per Operator
Return to all Capital
without Appreciation
Under 50 26 41 $36,257 $879 $6,234 1.0% 50 to 74 32 63 55,492 878 18,162 2.9% 75 to 99 23 88 90,893 1,039 38,548 5.8% 100 to 199 54 142 132,264 929 47,317 6.9% 200 to 299 20 252 300,000 1,189 116,014 11.2% 300 to 399 17 351 483,595 1,376 228,039 17.1% 400 to 599 25 469 603,860 1,287 217,138 14.6% 600 & over 53 1,019 1,156,991 1,136 474,094 15.3% This year, net farm income per cow did not exhibit the usual increase as herd size increased. All herd size categories saw an increase in operating cost of producing milk from a year earlier (Table 7-2). Net farm income per cow will increase as farms become larger if the costs of increased purchased inputs are offset by greater and more efficient output. The farms with more than 600 cows averaged more milk sold per cow than any other size category (Table 7-2). With 24,024 pounds of milk sold per cow, farms in the largest herd size group averaged 17.6 percent more milk output per cow than the average of all herds in the summary with less than 600 cows. Note: All data in this section are from the New York Dairy Farm Business Summary and Analysis Project unless a specific source is specified. Publications reporting Dairy Farm Business Summary data for New York, six regions of the state, for large herds, small herds, grazing farms, and farms that rent are available from the Department of Applied Economics and Management website: http://aem.cornell.edu/outreach/publications.htm .

2009 Outlook Handbook
Dairy--Farm Management W.A. Knoblauch/G.J. Conneman/L.D. Putnam
Page 7-2
The ability to reach high levels of milk output per cow with a large herd is a major key to high profitability. Three times a day milking (3X) and supplementing with bST are herd management practices commonly used to increase milk output per cow in large herds. Many dairy farmers who have been willing and able to employ and manage the labor required to milk 3X have been successful. Only one percent of the 81 DFBS farms with less than 100 cows used a milking frequency greater than 2X. As herd size increased, the percent of herds using a higher milking frequency increased. Farms with 100 to 200 cows reported 11 percent of the herds milking more often than 2X, the 200-299 cow herds reported 35 percent, 300-399 cow herds reported 47 percent, 400-599 cow herds reported 52 percent, and the 600 cow and larger herds reported 72 percent exceeding the 2X milking frequency.
TABLE 7-2. COWS PER FARM AND RELATED FARM FACTORS 250 New York Dairy Farms, 2007
Number
Average Number
of
Milk Sold
Per Cow
Milk Sold Per Worker
Till- able
Acres
Forage DM Per
Cow
Farm Capital
Per
Cost of Producing Milk/Cwt.
of Cows Cows (lbs.) (cwt.) Per Cow (tons) Cow Operating Total Under 50 41 17,977 4,118 4.0 7.8 $13,618 $13.52 $23.73 50 to 74 63 17,842 4,747 3.4 7.7 10,328 13.87 21.56 75 to 99 88 18,538 5,505 2.9 8.8 9,863 13.54 20.43 100 to 199 142 19,369 7,368 2.7 8.5 9,675 14.20 19.71 200 to 299 252 22,571 9,460 2.5 8.9 9,270 13.83 17.83 300 to 399 351 22,902 9,058 2.1 7.9 7,712 13.47 16.80 400 to 599 469 22,886 9,316 2.4 8.9 8,772 13.39 17.01 600 & over 1,019 24,024 11,310 1.9 7.5 7,945 14.23 17.04 Bovine somatotropin (bST) was used to a greater extent on the large herd farms. bST was used consistently during 2007 on 12 percent of the herds with less than 100 cows, 30 percent of the farms with 100 to 299 cows and on 63 percent of the farms with 300 cows and more. Milk output per worker has always shown a strong correlation with net farm income. The farms with 100 cows or more averaged over 930,240 pounds of milk sold per worker while the farms with less than 100 cows averaged less than 479,000 pounds per worker. In achieving the highest productivity per cow and per worker, the largest farms had the fewest crop acres per cow and below average forage dry matter harvested per cow. However, the larger farms generally purchased more roughage per cow. The largest farms had the most efficient use of farm capital with an average investment of $7,945 per cow. The 17 farms with 300-399 cows had the lowest total cost of producing milk at $16.80 per hundredweight. The 53 farms with more than 600 cows held their average total costs of producing milk to $17.04 per hundredweight, $2.54 below the $19.58 average for the remaining 197 dairy farms. The lower average costs of production plus a similar milk price gave the managers of the largest dairy farms profit margins (milk price less total cost of producing milk) that averaged $0.93 per hundredweight above the average of the other 197 DFBS farms. All but the two lowest herd size categories averaged a positive profit margin in 2007. Ten-Year Comparisons The total cost of producing milk on DFBS farms has increased $3.23 per hundredweight over the past 10 years (Table 7-3). In the intervening years, total cost of production decreased 1998 through 1999, increased in 2000 and 2001, fell in 2002, again increased in 2003 and 2004, decreased in 2005 and 2006, and increased in 2007. It is interesting to note that costs of production decrease in low milk price years and increase in high milk price years. Over the 10 years, milk sold per cow and cows per worker increased 10 percent on DFBS farms (Table 7-4). Farm net worth has increased significantly, while percent equity has been fairly stable.

2009 Outlook Handbook
W.A. Knoblauch/G.J. Conneman/L.D. Putnam Dairy--Farm Management
Page 7-3

2009 Outlook Handbook
Dairy--Farm Management W.A. Knoblauch/G.J. Conneman/L.D. Putnam
Page 7-4

2009 Outlook Handbook
W.A. Knoblauch/G.J. Conneman/L.D. Putnam Dairy--Farm Management
Page 7-5
Dairy Operations and Milk Cow Inventory
TABLE 7-5. NUMBER OF DAIRY FARMS AND MILK COWS BY SIZE OF HERD
New York State, 2007 a, b
Size of Herd
Farms
Milk Cows
Number of Cows
Number
% of Total
Number
% of Total
1 - 29
1,300
21.0%
12,500
2.0%
30-49
1,300
21.0%
50,000
8.0%
50-99
2,100
33.9%
138,000
22.0%
100-199
890
14.3%
113,000
18.0%
200-499
410
6.6%
125,000
20.0%
500-749
95
1.5%
56,000
9.0%
750-999
43
0.7%
34,500
5.5%
1000-1499
38
0.6%
44,000
7.0%
1500 - 1999
9
0.15%
14,000
2.2%
2000 or more
15
0.25%
40,000
6.3%
Total
6,200
100.0%
627,000
100.0%
aThis information on number of farms and number of cows by size of herd is derived from several sources: - Dairy Statistics as published by the New York Agricultural Statistics Services for 2007. - CAFO (Concentrated Animal Feeding Operations) permit reports for 2007. Some small CAFO farms (farms with 200
to 700 milk cows) have not applied for or updated the permit. Estimates for these farms were made so as to reflect the total number of dairy farms in New York State.
b The author wishes to thank everyone who provided some data as well as providing valuable advice and perspectives: Lee Telega, Jacqueline Lendrum, and B. F. Stanton. However, any errors, omissions or misstatements are solely the responsibility of the author, Professor George Conneman, e-mail [email protected].
In 2007, there were 6,200 dairy farms in New York State, and 627,000 milk cows as reported by
the NYASS. The table above was prepared based on the NYASS data plus the CAFO permit filing for additional herd size categories.
Ninety percent of the farms (less than 200 cows per farm) had 50 percent of the milk cows. The
remaining ten percent of the farms had 50 percent of the cows. About 3 percent of the farms (those with 500 or more cows) had 30 percent of the cows. Farms with less than 50 cows represent 42 percent of all farms but kept only 10 percent of the
cows. Farms with 1,000 or more cows represent about 1 percent of the farms but kept over 15 percent of
the cows.

2009 Outlook Handbook
Dairy--Farm Management W.A. Knoblauch/G.J. Conneman/L.D. Putnam
Page 7-6

2009 Outlook Handbook
W.A. Knoblauch/G.J. Conneman/L.D. Putnam Dairy--Farm Management
Page 7-7
TABLE 7-7. FORTY YEARS OF CHANGES ON DAIRY FARMS
New York State, 1965 to 2005 Year
Item 1965 1975 1985 1995 2005 SIZE OF DAIRY BUSINESS Number of dairy farms 30,500 22,000 16,500 10,000 6,700
Farms with:
Less than 50 cows 25,450 14,350 9,550 4,300 2,700
200 or more cows 50 150 300 400 610
Number of milk cows (thousand head)
1,090 905 942 710 648
Total milk production (billion pounds)
11.0 10.0 11.7 11.6 12.1
Cows per farm 36 41 57 71 97
PRODUCTIVITY Milk sold per cow, lbs. 10,100 11,000 12,400 16,300 18,700
Milk sold per farm, lbs. 361,000 455,000 709,000 1,160,000 1,806,000
Worker equivalent per farm 2.0 2.2 2.5 2.7 3.0
Milk sold per worker, lbs. 180,000 207,000 284,000 430,000 602,000
Cows per worker 18 19 23 26 32
Price of milk, $/cwt. $4.39 $8.75 $12.80 $13.00 $15.90
Hay, all, per acre, tons 1.9 2.2 2.4 2.2 2.0 Hay, alfalfa, per acre, tons NA 2.6 2.8 2.7 2.5 Corn silage, per acre, tons 12.6 12.9 14.0 15.0 16.5 Corn grain, per acre, bushels 70 82 97 108 123 Sources: New York Agricultural Statistics Service; Cornell Producer Panel of Dairy Farms; estimates by G. J. Conneman
During the past 40 years (1965 to 2005) there have been dramatic changes on New York dairy farms in the number of farms, milk cows, production levels and efficiency of operations. The number of dairy farms decreased from 30,500 in 1965 to 6,700 in 2005, a decrease of 78 percent. The average size of farm increased from 36 cows to 97 cows. The number of dairy cows in 2005 was 648,000 head, a decrease of 41 percent from 1965. However, the total amount of milk produced increased from 11.0 billion pounds to 12.1 billion pounds as production per cow moved from 10,100 to 18,700 pounds, an increase of 85 percent in production per cow. Efficiency of production (as measured by milk sold per worker) increased from 180,000 pounds to 602,000 pounds, more than a tripling; cows per worker increased from 18 to 32 during the 40-year period. The number of farms with less than 50 cows decreased from 25,450 to 2,700; those with 200 or more cows increased from 50 to 610.

2009 Outlook Handbook
Dairy--Farm Management W.A. Knoblauch/G.J. Conneman/L.D. Putnam
Page 7-8
TABLE 7-8. COMPARISON OF FARM BUSINESS SUMMARY DATA
Same 54 New York Dairy Farms, 1998- 2007 Selected Factors
1998
1999
2000
2001
Milk receipts per cwt. milk $15.73 $15.22 $13.41 $15.92 Size of Business Average number of cows 289 307 325 351 Average number of heifers 224 230 245 266 Milk sold, cwt. 62,788 68,828 72,884 78,470 Worker equivalent 7.01 7.37 7.58 8.17 Total tillable acres 615 645 665 698 Rates of Production Milk sold per cow, lbs. 21,693 22,409 22,403 22,337 Hay DM per acre, tons 3.5 3.3 3.8 3.2 Corn silage per acre, tons 23 17 16 17 Labor Efficiency Cows per worker 41 42 43 43 Milk sold per worker, lbs. 895,694 933,892 961,528 960,462 Cost Control Grain & concentrate purchased as % of milk sales 25% 24% 27% 25% Dairy feed & crop expense per cwt. milk $4.96 $4.69 $4.54 $4.90 Operating cost of producing cwt. milk $11.36 $11.07 $11.23 $12.31 Total cost of producing cwt. milk $14.27 $12.29 $14.18 $15.38 Hired labor cost per cwt. $2.26 $2.33 $2.39 $2.60 Interest paid per cwt. $0.88 $0.77 $0.91 $0.80 Labor & machinery costs per cow $1,115 $1,190 $1,206 $1,286 Replacement livestock expense $13,446 $14,798 $19,061 $13,785 Expansion livestock expense $19,795 $18,402 $31,469 $36,592 Capital Efficiency Farm capital per cow $6,343 $6,531 $6,653 $6,653 Machinery & equipment per cow $1,220 $1,256 $1,288 $1,268 Real estate per cow $2,489 $2,505 $2,488 $2,508 Livestock investment per cow $1,517 $1,541 $1,602 $1,689 Asset turnover ratio 0.63 0.62 0.56 0.65 Profitability Net farm income without appreciation $200,089 $201,962 $68,769 $177,610 Net farm income with appreciation $244,451 $245,480 $120,631 $281,345 Labor & management income per operator/manager
$93,506
$87,181
$1,007
$62,132
Rate return on: Equity capital with appreciation 18.0% 15.7% 4.6% 15.7% All capital with appreciation 13.3% 11.9% 5.8% 11.9% All capital without appreciation 10.9% 9.7% 3.4% 7.5% Financial Summary, End Year Farm net worth $1,134,504 $1,249,460 $1,271,138 $1,462,927 Change in net worth with appreciation $171,007 $129,660 $16,515 $179,895 Debt to asset ratio 0.41 0.41 0.40 0.40 Farm debt per cow $2,671 $2,720 $2,732 $2,747 Farms participating in the DFBS each of the last 10 years have increased size of business, labor efficiency and milk sold per cow (Table 7-8). All measures of profitability exhibit wide variability from year-to-year and are highly correlated with milk price received.

2009 Outlook Handbook
W.A. Knoblauch/G.J. Conneman/L.D. Putnam Dairy--Farm Management
Page 7-9
TABLE 7-8. COMPARISON OF FARM BUSINESS SUMMARY DATA (Continued)
Same 54 New York Dairy Farms, 1998 - 2007
2002
2003
2004
2005
2006
2007 $12.96 $13.24 $16.57 $16.04 $13.89 $20.35 369 389 400 412 425 426 287 302 312 333 346 351 84,823 88,895 90,308 96,441 98,595 99,037 8.55 9.08 9.46 9.58 9.58 9.79 726 760 815 844 873 884 22,960 22,824 22,576 23,426 23,218 23,230 3.4 3.2 3.5 3.6 3.3 3.2 16 18 18 19 19 19 43 43 42 43 44 44 992,087 979,019 954,629 1,006,688 1,029,179 1,011,610 30% 30% 27% 26% 30% 25% $4.77 $5.01 $5.26 $5.18 $5.05 $6.23 $11.15 $11.49 $12.45 $12.17 $12.17 $14.23 $14.20 $14.30 $15.36 $15.22 $15.19 $17.51 $2.66 $2.68 $2.80 $2.69 $2.72 $2.90 $0.61 $0.53 $0.55 $0.61 $0.79 $0.80 $1,292 $1,255 $1,322 $1,379 $1,519 $1,519 $11,031 $16,173 $14,146 $14,649 $9,705 $13,173 $14,918 $15,252 $18,632 $15,401 $23,678 $4,691 $6,738 $6,589 $6,874 $7,281 $7,515 $8,175 $1,279 $1,227 $1,263 $1,345 $1,378 $1,495 $2,527 $2,496 $2,572 $2,653 $2,765 $2,940 $1,779 $1,773 $1,851 $1,961 $2,053 $2,236 0.54 0.56 0.66 0.63 0.54 0.70 $32,484 $44,235 $255,811 $241,313 $43,061 $471,387 $83,116 $107,244 $374,740 $356,409 $125,186 $643,289 $-26,854
$-21,676
$111,819
$92,100
$-38,968
$221,206
1.3%
2.9%
19.2%
15.4%
2.7%
25.0%
2.8% 3.5% 13.1% 11.5% 4.1% 18.5% 0.8% 1.2% 8.7% 7.7% 1.5% 13.6% $1.446.864 $1,486,533 $1,752,054 $1,991,647 $2,005,569 $2,516,182 $-27,066 $35,852 $278,514 $246,462 $13,631 $496,199 0.42 0.44 0.39 0.36 0.39 0.33 $2,817 $2,942 $2,766 $2,713 $2,908 $2,858
Debt to asset ratio and debt per cow have remained stable while farm net worth more than doubled. During this time, crop yields have fluctuated, largely due to weather. Purchased grain and concentrate as a percent of milk sales varied only from 24 to 30 percent, with the high in 2002, 2003 and 2006, and the low in 1999.

2009 Outlook Handbook
Dairy--Farm Management W.A. Knoblauch/G.J. Conneman/L.D. Putnam
Page 7-10
TABLE 7-9. COMPARISON OF DAIRY FARM BUSINESS DATA BY REGION 250 New York Dairy Farms, 2007
Item
Western & Central Plateau Region
Western & Central
Plain Region
Northern New York
Central Valleys
Northern Hudson &
South-eastern
New York Number of farms 40 64 39 35 72 ACCRUAL EXPENSES Hired labor $82,457 $471,796 $207,807 $148,298 $121,207 Feed 192,093 804,541 453,063 321,877 265,544 Machinery 75,554 280,866 160,715 138,013 108,870 Livestock 107,931 507,080 273,697 183,196 161,838 Crops 33,401 133,381 74,889 78,171 48,945 Real estate 33,730 136,709 62,006 55,904 36,785 Other 63,944 262,198 141,715 115,257 76,227 Total Operating Expenses $589,110 $2,596,571 $1,373,893 $1,040,717 $819,415 Expansion livestock 6,936 10,931 19,901 15,247 4,443 Extraordinary expense 793 905 1,236 0 106 Machinery depreciation 41,787 133,505 68,847 53,693 30,501 Building depreciation 16,336 81,329 51,329 28,143 19,210 Total Accrual Expenses $654,963 $2,823,241 $1,516,205 $1,137,800 $873,675 ACCRUAL RECEIPTS Milk sales $768,738 $3,178,014 $1,741,309 $1,330,254 $971,254 Livestock 53,753 199,520 117,354 93,670 64,447 Crops 18,638 70,834 60,565 54,502 38,452 Government receipts 13,423 41,204 23,174 23,348 18,131 All other 11,920 54,297 19,577 27,471 17,762 Total Accrual Receipts $866,472 $3,543,869 $1,961,978 $1,526,514 $1,110,046 PROFITABILITY ANALYSIS
Net farm income (w/o appreciation ) $211,509 $720,628 $455,773 $388,714 $236,370 Net farm income (w/ appreciation) $268,500 $1,022,512 $575,523 $503,443 $317,322 Labor & management income $151,276 $558,497 $338,111 $291,828 $157,741 Number of operators 1.46 1.79 1.75 1.76 1.42
Labor & mgmt. income/oper. $103,613 $312,010 $193,206 $165,812 $111,085 BUSINESS FACTORS Worker equivalent 4.44 14.36 8.61 6.97 5.87 Number of cows 168 673 372 289 210 Number of heifers 135 537 295 238 175 Acres of hay cropsa 246 506 444 327 278 Acres of corn silagea 111 447 283 206 184 Total tillable acres 417 1,241 848 707 495 Pounds of milk sold 3,727,555 15,816,491 8,680,284 6,404,857 4,636,394 Pounds of milk sold/cow 22,204 23,518 23,313 22,140 22,055 Tons hay crop dry matter/acre 2.4 3.3 3.1 3.2 2.8 Tons corn silage/acre 19.8 18.3 20.9 19.3 18.1 Cows/worker 38 47 43 42 36 Pounds of milk sold/worker 839,382 1,101,363 1,008,456 918,808 789,509 % grain & conc. of milk receipts 24% 23% 23% 23% 27% Feed & crop expense/cwt. milk $6.05 $5.92 $6.06 $6.24 $6.78 Fertilizer & lime/crop acre $39.74 $46.61 $28.39 $39.76 $40.63 Machinery cost/tillable acre $316 $365 $302 $306 $314 aExcludes farms that do not harvest forages.
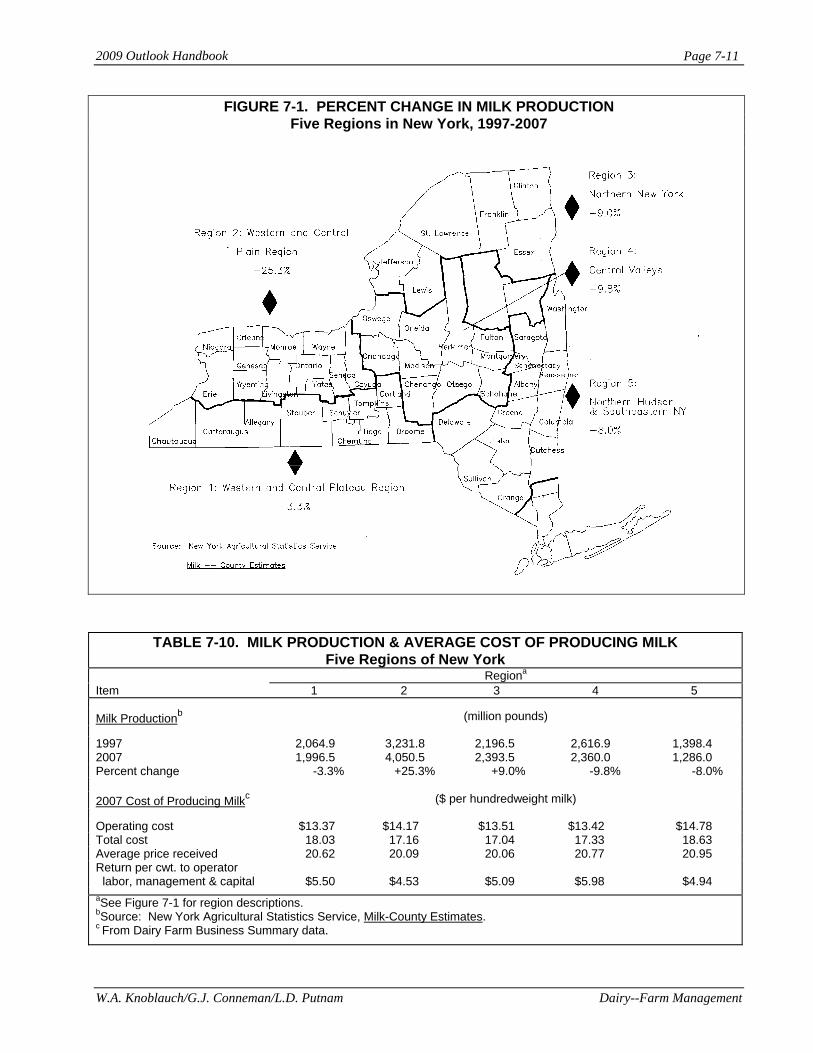
2009 Outlook Handbook
W.A. Knoblauch/G.J. Conneman/L.D. Putnam Dairy--Farm Management
Page 7-11
FIGURE 7-1. PERCENT CHANGE IN MILK PRODUCTION Five Regions in New York, 1997-2007
TABLE 7-10. MILK PRODUCTION & AVERAGE COST OF PRODUCING MILK Five Regions of New York
Regiona Item 1 2 3 4 5 Milk Productionb (million pounds) 1997 2,064.9 3,231.8 2,196.5 2,616.9 1,398.4 2007 1,996.5 4,050.5 2,393.5 2,360.0 1,286.0 Percent change -3.3% +25.3% +9.0% -9.8% -8.0% 2007 Cost of Producing Milkc ($ per hundredweight milk) Operating cost $13.37 $14.17 $13.51 $13.42 $14.78 Total cost 18.03 17.16 17.04 17.33 18.63 Average price received 20.62 20.09 20.06 20.77 20.95 Return per cwt. to operator labor, management & capital
$5.50
$4.53
$5.09
$5.98
$4.94
aSee Figure 7-1 for region descriptions. bSource: New York Agricultural Statistics Service, Milk-County Estimates. c From Dairy Farm Business Summary data.

2009 Outlook Handbook
Dairy--Farm Management W.A. Knoblauch/G.J. Conneman/L.D. Putnam
Page 7-12
Farm Business Charts The Farm Business Chart is a tool which can be used in analyzing a business by drawing a line through the figure in each column which represents the current level of management performance. The figure at the top of each column is the average of the top 10 percent of the 250 farms for that factor. The other figures in each column are the average for the second 10 percent, third 10 percent, etc. Each column of the chart is independent of the others. The farms which are in the top 10 percent for one factor would not necessarily be the same farms which make up the top 10 percent for any other factor. The cost control factors are ranked from low to high, but the lowest cost is not necessarily the most profitable. In some cases, the "best" management position is somewhere near the middle or average. Many things affect the level of costs, and must be taken into account when analyzing the factors.
TABLE 7-11. FARM BUSINESS CHART FOR FARM MANAGEMENT COOPERATORS
250 New York Dairy Farms, 2007Size of Business Rates of Production Labor Efficiency
Worker Equiv- alent
No. of
Cows
Pounds
Milk Sold
Pounds
Milk Sold Per Cow
Tons
Hay Crop DM/Acre
Tons Corn
Silage Per Acre
Cows Per
Worker
Pounds Milk Sold
Per Worker
28.1 1,314 32,322,710 26,645 5.2 26 61 1,309,445 17.1 773 18,291,548 24,891 4.0 23 50 1,121,656 11.9 494 11,182,833 23,916 3.5 21 46 1,026,711 8.1 346 7,739,127 23,029 3.1 20 43 943,700 5.2 217 4,765,001 21,916 2.8 19 40 849,317 4.0 149 2,798,701 20,742 2.6 18 36 764,401 3.2 108 2,051,550 19,708 2.4 17 34 662,962 2.7 80 1,444,394 18,062 2.1 16 30 569,954 2.2 60 1,035,063 15,732 1.8 15 25 454,811 1.6 41 684,234 12,412 1.2 12 20 314,396
Cost Control
Grain
Bought Per Cow
% Grain is of Milk
Receipts
Machinery Costs
Per Cow
Labor & Machinery
Costs Per Cow
Feed & Crop Expenses Per Cow
Feed & Crop Expenses Per
Cwt. Milk $515 15% $430 $1,088 $705 $4.28 726 19 551 1,294 948 4.96 814 20 605 1,373 1,067 5.45 894 22 648 1,436 1,160 5.77 991 23 700 1,513 1,262 5.95 1,066 25 757 1,595 1,341 6.22 1,134 26 821 1,693 1,426 6.60 1,205 27 899 1,817 1,511 7.00 1,305 29 995 2,020 1,609 7.44 1,492 35 1,251 2,388 1,831 9.03

2009 Outlook Handbook
W.A. Knoblauch/G.J. Conneman/L.D. Putnam Dairy--Farm Management
Page 7-13
The next section of the Farm Business Chart provides for comparative analysis of the value and costs of dairy production. The profitability section shows the variation in farm income by decile and enables a dairy farmer to determine where he or she ranks by using several measures of farm profitability. Remember that each column is independently established and the farms making up the top decile in the first column will not necessarily be on the top of any other column. The dairy farmer who ranks at or near the top of most of these columns is in a very enviable position.
TABLE 7-11. (CONTINUED) FARM BUSINESS CHART FOR
FARM MANAGEMENT COOPERATORS 250 New York Dairy Farms, 2007
Milk Receipts Per Cow
Milk Receipts Per Cwt.
Operating Cost Milk Production
Per Cow
Operating Cost Milk Production
Per Cwt.
Total Cost Milk Production
Per Cow
Total Cost Milk Prod. Per Cwt.
$5,473 $22.53 $1,631 $9.70 $2,801 $14.86 5,036 21.38 2,096 11.55 3,306 16.34 4,850 20.97 2,385 12.46 3,536 16.99 4,689 20.70 2,632 12.97 3,708 17.60 4,473 20.48 2,812 13.56 3,885 18.16 4,247 20.32 2,990 14.03 4,024 18.91 4,002 20.12 3,139 14.57 4,173 19.99 3,719 19.87 3,353 15.44 4,351 21.53 3,252 19.62 3,627 16.41 4,566 23.15 2,599 19.04 4,077 19.13 5,111 28.29
Profitability
Net Farm Income Without Appreciation
Net Farm Income With Appreciation
Labor & Management Income
Total
Per Cow
Operations Ratio
Total
Per Cow
Per Farm
Per Operator
$1,658,164 $1,985 0.37 $2,258,907 $2,580 $1,350,735 $828,820
881,033 1,602 0.31 1,159,819 2,039 690,457 422,319 593,261 1,424 0.28 786,149 1,861 459,165 250,521 385,119 1,262 0.26 537,897 1,674 267,642 163,957 227,152 1,131 0.23 323,558 1,540 154,444 94,290
142,549 1,021 0.21 182,217 1,407 91,721 57,044 102,171 909 0.19 131,539 1,231 56,345 42,053 68,086 722 0.16 97,870 987 30,338 23,345 43,034 467 0.11 63,898 733 2,284 1,427 3,007 67 0.01 21,902 280 -41,030 -36,506

2009 Outlook Handbook
Dairy--Farm Management W.A. Knoblauch/G.J. Conneman/L.D. Putnam
Page 7-14
Financial Analysis Chart The farm financial analysis chart is designed just like the farm business chart on the previous pages and may be used to measure the financial health of the farm business.
TABLE 7-12. FINANCIAL ANALYSIS CHART 250 New York Dairy Farms, 2007
Liquidity (repayment)
Planned Debt
Payments Per Cow
Available for
Debt Service Per Cow
Cash Flow Coverage
Ratio
Debt Coverage
Ratio
Debt Payments as Percent
of Milk Sales
Debt Per Cow
Working
Capital as % of Total Expenses
Current Ratio
$92 $1,522 6.22 9.80 2% $203 55% 36.91 233 1,106 2.82 4.47 6 992 38 5.77 315 977 2.24 3.60 8 1,678 30 4.12 387 881 1.91 3.09 10 2,100 26 3.23 454 813 1.65 2.74 11 2,515 23 2.59
517 737 1.44 2.29 12 2,881 19 2.21 566 655 1.26 1.88 13 3,265 14 1.83 626 534 1.08 1.60 15 3,711 10 1.52 735 377 0.84 1.11 19 4,170 4 1.07 1,007 -5 -0.08 0.02 28 5,777 -12 0.49
Solvency Operational Ratios Debt/Asset Ratio Operating Interest Depreciation
Leverage Percent Current & Long Expense Expense Expense Ratioa Equity Intermediate Term Ratio Ratio Ratio 0.02 98% 0.01 0.00 0.54 0.00 0.02 0.11 90 0.09 0.00 0.59 0.01 0.03 0.19 84 0.15 0.01 0.62 0.02 0.04 0.29 78 0.20 0.10 0.65 0.03 0.05 0.36 74 0.25 0.21 0.67 0.03 0.05
0.45 69 0.29 0.29 0.69 0.04 0.06 0.54 65 0.34 0.39 0.71 0.05 0.07 0.67 60 0.42 0.50 0.73 0.05 0.08 0.94 52 0.53 0.63 0.78 0.06 0.10 1.68 39 0.70 0.89 0.87 0.09 0.14
Efficiency (Capital) Profitability Asset
Turnover (ratio)
Real Estate Investment Per Cow
Machinery Investment Per Cow
Total Farm Assets
Per Cow
Change in Net Worth
With Appreciation
Percent Rate of Return with Appreciation on:
Equity Investmentb 0.95 $1,504 $634 $5,726 $1,980,666 55% 29% 0.78 2,240 876 6,959 969,490 36 24 0.72 2,696 1,111 7,431 612,376 29 21 0.68 3,012 1,358 7,894 396,561 23 18 0.62 3,388 1,559 8,452 238,455 19 15
0.57 3,752 1,792 9,113 137,890 14 12 0.50 4,339 2,003 10,060 98,507 11 10 0.44 5,105 2,256 11,046 69,452 7 7 0.37 6,374 2,599 12,687 37,054 3 4 0.26 10,220 3,766 16,830 -5,198 -7 -2
aDollars of debt per dollar of equity, computed by dividing total liabilities by total equity. bReturn on all farm capital (no deduction for interest paid) divided by total farm assets.

2009 Outlook Handbook
W.A. Knoblauch/G.J. Conneman/L.D. Putnam Dairy--Farm Management
Page 7-15
Prices Paid by New York Dairy Farmers and Values of Inventory Items
The prices dairy farmers pay for a given quantity of goods and services has a major influence on farm production costs. The astute manager will keep close watch on unit costs and utilize the most economical goods and services. The table below shows average prices of selected goods and services used on New York dairy farms.
TABLE 7-13. PRICES PAID BY NEW YORK FARMERS FOR SELECTED ITEMS, 1993 - 2007
Year
Mixed Dairy Feed
16% Proteina
Fertilizer, Urea
45-46%Na
Seed Corn,
Hybridb
Diesel Fuela
Tractor 50-59 PTOb
Wage Rate
All Hired Farm
Workersc ($/ton) ($/ton) ($/80,000 Kernels) ($/gallon) ($) ($/hour)
1993 171 226 72.70 0.900 19,200 6.76 1994 181 233 73.40 0.853 19,800 6.96 1995 175 316 77.10 0.850 20,100 6.92 1996 226 328 77.70 1.020 20,600 7.19 1997 216 287 83.50 0.960 21,200 7.63 1998 199 221 86.90 0.810 21,800 7.63 1999 175 180 88.10 0.750 21,900 8.12 2000 174 201 87.50 1.270 21,800 8.74 2001 176 270 92.20 1.260 22,000 8.72 2002 178 232 92.00 1.028 21,900 9.26 2003 194 283 102.00 1.516 21,300 9.93 2004 207 299 105.00 1.400 21,500 9.96 2005 190 365 111.00 2.020 23,400 9.88 2006 239 403 118.00 2.355 23,700 10.35 2007 300 480 133.00 3.773 24,300 10.49 SOURCE: NYASS, New York Agricultural Statistics. USDA, NASS, Agricultural Prices. aNortheast region average. bUnited States average. cNew York and New England combined.
Inflation, farm profitability, supply and demand all have a direct impact on the inventory values on New York dairy farms. The table below shows year-end (December) prices paid for dairy cows (replacements), an index of these cow prices, an index of new machinery prices (U.S. average), the average per acre value of farmland and buildings reported in January, and an index of the real estate prices.
TABLE 7-14. VALUES AND INDICES OF NEW YORK DAIRY FARM INVENTORY ITEMS, 1993 - 2007
Dairy Cows Machinerya Farm Real Estateb Year Value/Head 1977=100 1977=100 Value/Acre 1977=100 1993 1,100 222 235 1,237 211 1994 1,100 222 249 1,260 215 1995 1,010 204 258 1,280 218 1996 1,030 208 268 1,260 215 1997 980 198 276 1,250 213 1998 1,050 212 286 1,280 218 1999 1,250 253 294 1,340 228 2000 1,250 253 301 1,430 244 2001 1,600 323 312 1,520 259 2002 1,400 283 320 1,610 274 2003 1,300 263 325 1,700 290 2004 1,580 319 351 1,780 303 2005 1,690 341 373 1,920 327 2006 1,550 313 392 2,050 349 2007 1,930 390 412 2,220 378 SOURCE: NYASS, New York Agricultural Statistics and New York Crop and Livestock Report. USDA, ASB, Agricultural Prices. aUnited States average; 1995 - 2007 are estimated due to discontinuation of 1977=100 series. bNew York average for 2000 – 2007 excludes Native American reservation land.

Notes

Thomas R. Maloney, Marc A. Smith, Mary Jo Dudley Labor
Chapter 8: Labor Outlook for New York Agriculture 2009
Thomas R. Maloney 1
Marc A. Smith Mary Jo Dudley
Overview
New York State farm owners and agricultural representatives generally report that labor supplies were adequate in 2008 and in some cases farm managers had more applicants looking for work than they had jobs to fill. However, there continues to be considerable uncertainty over agricultural labor supplies largely due to persistent immigration enforcement activities. The presence of unauthorized workers on New York State farms is exacerbated by the fact that immigrants can easily purchase Social Security cards and present these fraudulent documents to their employers at the time of hire. Many farm managers fear that an immigration raid would substantially disrupt business during critical work periods. These concerns are compounded by the perceived scarcity of skilled agricultural labor. In late 2007 the New York State Department of Agriculture and Markets and New York State Agricultural Statistics Service collaborated with Cornell University to survey 1245 fruit, vegetable and dairy farmers in New York State on agricultural labor issues. Farm owners were asked how concerned they were about labor supplies over the next three years. Figure 8-1 shows the high level of concern among those surveyed and a particularly high level of concern among those farm owners who employ Hispanic workers.
FIGURE 8-1. FARM OWNER VIEWS ON LABOR AVAILABILITY, NEXT THREE YEARS
How concerned are you that there may not be sufficient workers over the next three years? (1245 NY farms)
Source: The New York State Agricultural Immigration and Human Resource Management Issues Study, 2008
5
4
9
13
61
9
29
5
10
11
33
12
Not concerned
Somewhat concerned
Concerned
Quite concerned
Very concerned
No response
Level of concern
0 10 20 30 40 50 60 70Percent of farms
All Farms Farms with Hispanic workers
1The authors are Senior Extension Associate in the Cornell Applied Economics and Management Department (AEM), Extension Associate in AEM, and Director of the Cornell Farmworker Program in the Cornell Department of Development Sociology, respectively.

Page 8-2 2009 Outlook Handbook
Labor Thomas R. Maloney, Marc A. Smith, Mary Jo Dudley
When considering the general outlook for agricultural labor in New York State it is also important to recognize that the economy is slowing and unemployment is increasing making more workers potentially available in various parts of the state. This appears to be particularly true in western New York. However, it is unclear if the newly unemployed will be willing and able to do farm work. Agricultural employers also express concern about the investment required to train workers who are unfamiliar with the physical demands of agricultural labor. Agricultural Labor Supply Uncertainty Due to Immigration Enforcement
While agricultural labor supplies appear adequate or better, there remains a great deal of uncertainty and anxiety over increasing immigration enforcement activities. The PEW Hispanic center in 2006 reported that 4% of the unauthorized workers in the United States worked in agriculture (Passel 2006). Other sectors such as construction, service industries, hospitality and others employ an even greater percentage of the unauthorized workforce nationwide.
The detention and deportation of agricultural workers in New York State appears to have increased in 2008 as indicated by farm manager reports, farm worker reports and media coverage. Perhaps the biggest reason for the perceived high level of enforcement activity is that New York is a border state and therefore has a higher number of immigration enforcement officials than non-border states. In addition, the Buffalo Federal Detention Center in Batavia, New York houses a 500+ bed facility for housing detained immigrants. Ongoing immigration raids, detention activities and deportation have been reported in western as well as northern New York over the past year. The Impact of the H-2A Program
The H-2A program is a national program providing seasonal workers for agricultural jobs. The program used primarily by fruit and vegetable growers was initiated in 1952. Table 8.1 shows the number of H-2A workers in New York over the past 6 years. TABLE 8-1. NUMBER OF H-2A WORKERS IN NEW YORK 2002-2007
H-2A Workers in New York at Peak Season Year Number of Workers 2002 1,413 2003 1,704 2004 1,825 2005 1,742 2006 2,105 2007 2,491
Source: Reports of Domestic Migrant-Seasonal Foreign Hired Agricultural Workers 1999-2006, New York State Department of Labor, 2007 Annual Report New York State Dept of Labor
It is important to note the increases in the number of H-2A workers hired in New York
over the last several years. As immigration enforcement has increased some farm employers have turned to H-2A to ensure that their workers are legal and will be available at critical production and harvest periods.
Still, H-2A workers represent only a small percentage of the seasonal workers in New York agriculture. In the past many farm managers were reluctant to use the program for three

2009 Outlook Handbook Page 8 - 3
Thomas R. Maloney, Marc A. Smith, Mary Jo Dudley Labor
reasons. First, the wage rate is generally set at a level considerably higher than the minimum wage. In 2008 the wage rate was set at $9.70 per hour. Second, farm employers often feel there is too much paperwork and bureaucracy in the program adding to administrative overhead and sometimes delaying workers’ arrival. Third, current regulations require the employer to provide housing for H-2A employees. This can be difficult in areas of the state where housing is scarce, and employer provided housing adds an additional expense to using the program. Despite these challenges, participation by New York State farmers is likely to continue to increase as long as immigration enforcement activities persist.
In recent years there have been numerous legislative proposals to change the H-2A program and make it easier to use. The most notable example is Title II of the AgJOBS Bill. It is also important to note that the most recent version of the AgJOBS bill includes dairy farms in the H-2A program for the first time. If the bill were passed into law this would be a significant benefit to dairy farmers providing some currently unauthorized workers with temporary visas permitting them to continue their work in the dairy industry and creating an optional path to citizenship. The change would also allow dairy employers to hire immigrants under the H-2A program.
Since the H-2A program has a longstanding history, future immigration reform proposals for agriculture are very likely to include a revised and updated version of H-2A rather than eliminate the program all-together. This could come in the form of a bill to simply revise the current program as some legislative proposals have done in the past. A revised program could also come in a more comprehensive bill for agriculture (like AgJOBS) or as part of comprehensive reform. Immigration Policy Issues Facing Agricultural Employers
Over the past four years Congress has tried and failed to enact comprehensive immigration reform. While separate immigration bills have passed in the House and the Senate, legislators are divided on a workable solution for dealing with the estimated 12 million unauthorized immigrants currently living in the United States. On December 16, 2005 the House of Representatives passed the Border Protection Anti-terrorism and Illegal Immigration Control Act. (HR-4437). The bill proposed multiple enforcement approaches to dealing with unauthorized workers including making illegal presence in the United States a felony. On May 25, 2006 the Senate passed the Comprehensive Immigration Reform Act of 2006 ( S-2611). The Senate bill would have provided a path to citizenship and a guest worker program for immigrant workers. Neither of these approaches gained political support and a comprehensive approach to solving the immigration problem is currently stalled.
Several versions of the AgJOBS bill have been reintroduced in Congress over the last 10
years. The bill covers only agricultural employers and would provide important options for agriculture. Title I provides a path to citizenship for immigrants who can demonstrate they worked in agriculture over a specified number of days and years. Title II provides for revisions in the H-2A program. Title II of the bill would streamline the H-2A program and provide a new method for calculating the wage rate, effectively lowering it.
Beginning in August 2007 the Department of Homeland Security attempted to implement new rules for dealing with employee Social Security numbers that do not show up in the social security database. Under the proposed rules an employee must provide verifiably legitimate work authorization documents to the employer within 90 days of receiving the letter. If they fail to do

Page 8-4 2009 Outlook Handbook
Labor Thomas R. Maloney, Marc A. Smith, Mary Jo Dudley
so the employer must terminate them. Penalties for non-compliance can range up to $11,000 per infraction. These new rules have been delayed from going into effect as a result of court action.
Farm Manager Views Regarding Immigration Reform
In the previously cited survey farm operators were also asked the level of importance they placed on three aspects of immigration reform. Figure 8-2 indicates that farm manager’s rated national immigration reform and access to a guest worker program as very high in importance. Less important but still rated highly was a path to citizenship for immigrant workers that are already working on New York State farms. FIGURE 8-2. RESPONDENT’S VIEWS ON NATIONAL IMMIGRATION
How important are the following immigration issues to your business? (1,245 NY farms)
Source: The New York State Agricultural Immigration and Human Resource Management Issues Study, 2008
4.43
3.34
4.29
3.20
2.58
3.21
National immigration reform policy
Path to citizenship
Guest worker program
0.00 1.00 2.00 3.00 4.00Average score (1=not important; 5=very important)
All farms Farms with Hispanic workers
Farm managers generally feel the agricultural workforce would be much more stable if immigration reform were implemented. Reflecting the concerns of farm managers, farm organizations across the state have taken strong immigration policy positions. Many New York State farm organizations provide financial support for the Agriculture Coalition for Immigration Reform (ACIR). ACIR is a Washington, DC based coalition of farm organizations that support immigration reform in agriculture. They have worked very hard on developing and supporting AgJOBS legislation as well as other related legislative initiatives. New York Farm Bureau has also actively supported immigration reform proposals for agriculture. Immigration Issues Facing Farmworkers
Interviews conducted by the Cornell Farmworker Program with 50 farmworkers from June 2007-August 2008 illustrate the perceived negative influence of the current immigration enforcement environment on farmworkers. The farmworkers surveyed identified immigration reform and information on immigrants’ legal rights as their highest priority. Immigrant farmworkers described the substantial challenges related to their unauthorized status and the detrimental influence of those challenges on their physical and mental health and well-being. The

2009 Outlook Handbook Page 8 - 5
Thomas R. Maloney, Marc A. Smith, Mary Jo Dudley Labor
workers reported that they did not feel safe leaving the farm or their home for any reason for fear of being detained or deported. In light of this fear they expressed their inability to independently meet their basic needs or fully function in their new community. The interviews highlight the generalized sense of fear and loss of control among the farmworker population. Most farmworkers interviewed mentioned that since they do not have legally recognized drivers licenses, they rely on others for their transportation needs. Year round unauthorized workers stressed their strong reliance on employers or others to transport them for medical care, grocery and clothes shopping, banking, and to attend social events or religious services. Farmworkers expressed their fear of leaving the farm to seek opportunities for social interactions, English classes, or other activities that could improve their quality of life. Several farmworkers said they primarily limit their off-farm activities to locally organized soccer games that require no transportation and occasional attendance at religious services.
Some migrant farmworkers are recruited by crew leaders and brought to New York. Interviews with workers employed under the crew leader system often reveal a sense of loss of control due to their reliance on crew leaders. Migrants interviewed stated that the crew leader controls almost every aspect of their lives including work assignments, hours, dismissals, housing assignments, paychecks, and off-farm transportation. Unauthorized migrants often mentioned that the crew leader used the threat of calling Immigration and Custom Enforcement to silence labor complaints and disputes about housing or transportation fees deducted from their paycheck. In some camps farmworkers also cited excessive use of physical force by crew leaders and an apparent lack of oversight by authorities.
A primary concern among farmworkers is that an immigration detention has the potential to separate family members. This is particularly important to those immigrant farmworkers who have children born in the United States. In their accounts of various arrests, they also noted that the detainees were not allowed to return to their homes to say goodbye to their family or friends, and they had no opportunity to collect the few belongings they own. They also reported the obstacles they encounter when trying to locate family and friends once they are detained. The Cornell Farmworker Program interviews also pointed to the generalized impression that immigrant farmworkers are pursued because they are from Mexico or Guatemala and are easily identified due to their race.
When asked what would make it possible to remain in agriculture in New York State, there was universal agreement among the respondents that in order to stay, immigration policy would have to change. Even those farmworkers who were in New York State on a guest worker visa made reference to the need to develop a more flexible program for entering and leaving the country, citing their concern over the assignment to a single employer with no option to pursue other opportunities in agriculture.
Farmworker service providers primarily from health and education professions were also interviewed. Service providers even more strongly emphasized the increased role of immigration enforcement on creating an environment of fear among the current farmworker population. They shared accounts of farmworkers afraid to leave their homes because of immigration enforcement and immigration officials waiting outside of churches, clinics, and stores in order to apprehend unauthorized immigrants. They also noted that farmworkers who desire or need to leave the state have few transportation options since immigration officials often detain immigrants at airports and bus and train stations. Several noted that farmworker participation in their services declined drastically as immigration enforcement increased over the last several years, and that on-farm services are often the only services that farmworkers are willing to use.

Page 8-6 2009 Outlook Handbook
Labor Thomas R. Maloney, Marc A. Smith, Mary Jo Dudley
Farm Management Implication
During the long legislative stalemate on immigration reform and the resulting period of uncertainty created by enforcement activity, New York State’s fruit, vegetable and dairy producers have considered and implemented significant adjustments in their management practices and strategic plans for the future. These changes represent classic responses to risk and, depending on how the legislative and enforcement situation continues to unfold, could alter the agricultural economic landscape in New York and nationally in important ways.
With a new Congress and a new Administration in Washington, farm advocates will redouble their efforts to focus on changing the laws that govern labor availability in agriculture. In the meantime, farmers will continue to make major, as well as more routine decisions to keep their businesses viable under existing law.
It is important that farm managers consider a variety of means to alleviate the stress on their businesses caused by the uncertain availability of workers. For example, existing vehicles for documented workers to fill positions in other United States industries, such as the TN visa authorized in the North American Free Trade Agreement (NAFTA), might be adapted to match workers with appropriate skills to agricultural jobs. The serious downturn in the national economy could also present unexpected opportunities. Developing closer ties with regional workforce development agencies so that those agencies can better explain farm opportunities to local job seekers and modifying farm operations to accommodate job candidates from other sectors could also yield positive results.
Three additional options available to farm managers dealing with chronic seasonal and year-round labor supply uncertainty are:
• Substitution of capital for labor (robotics and mechanization) • Shifting away from labor intensive crops to crops and enterprises less dependent
on labor • Shifting operations to locations where the labor supply is more certain
These alternatives are examined in more depth below. 1. Capital and Labor
Uncertainty about the availability of farmworkers has increased risk and effectively driven up the cost of labor for many of New York State’s diverse agricultural enterprises. This has led farmers to consider and, in a growing number of cases, adopt labor saving technologies. Investment in automated systems can be expensive and carries its own set of risks with respect to the effective performance of farm production tasks and processes.
Dairy farmers concerned about the availability of immigrant and local workers to milk cows and care for livestock have shown growing interest in automated, or robotic milking systems that could reduce dependence on labor. For some, this is a direct response to their belief that the likelihood of more immigration enforcement raids on farms will lead to the loss of a labor force needed for critical work in round-the-clock operations. In a broader sense, farmers assess further automation of milking systems as part of a perpetual effort to find the optimum balance of equipment, land and buildings, credit, labor, and new technology in order to increase farm profitability. Decisions to adopt and invest in robotic systems will depend on a host of factors,

2009 Outlook Handbook Page 8 - 7
Thomas R. Maloney, Marc A. Smith, Mary Jo Dudley Labor
including cost, adaptability to existing farm size and milking configuration, herd health considerations, reliability of the new technology, the expected life of new systems and the remaining useful life of milking parlors and equipment now in use, and farmers’ ability to manage the new systems effectively. Robotic milking systems are popular in Europe where labor costs are high. Cornell engineers and dairy business specialists report that there are only six robotic milking systems on New York farms, with many other dairy farm operators closely watching and evaluating the performance and development of this technology.
Fruit and vegetable growers in New York State and nationwide face similar choices related to the mechanization of growing and harvesting their crops. Uncertain labor availability implies higher labor cost, which provides incentives to research, evaluate, and possibly invest in technology to reduce dependence on labor. Pressure to change the mix of inputs employed to produce fruit and vegetable crops and products appears to have increased during the long, unresolved debate over immigration reform.
Planting, pruning, thinning, harvesting, sorting and packing are tasks that lend themselves, with various degrees of difficulty, to change through labor-saving technology. Farm operators often invest in machinery and equipment to increase the productivity of their existing labor force, not to eliminate the need for hand labor. Sometimes innovative approaches to the tasks listed above result in reductions in workers needed for those tasks; but more often the goal is to make these tasks less onerous for workers, thus improving efficiency and working conditions. Increased adoption of mechanized harvest technologies for fruit and vegetable crops is sharply limited by consumer expectations of fresh market quality. Currently available mechanized harvesting systems can cause serious bruising and other product and value loss problems for crops (melons, peppers, squash, table grapes, apples, and salad tomatoes) destined for fresh produce markets.
If seasonal labor shortages and overall uncertainty in agricultural labor markets persist, demand will grow for more intensive research and development of mechanized systems and crop varieties that can be mechanically planted, cared for and harvested without diminishing the value of fresh produce in the marketplace. 2. Shifting the Mix of Crop Enterprises
Early last spring, National Public Radio joined a variety of other media outlets to broadcast a story called, “Immigration’s Fallout: Fewer Fresh Tomatoes?” The owner of the largest fresh market tomato growing operation in Pennsylvania withdrew from the business, started by his father in 1949, because he couldn’t count on enough labor to harvest the crop. Keith Eckel decided not to risk the $1.5-$2.0 million annual investment in 2.3 million tomato plants, while ending production of pumpkins and cutting the farm’s fresh sweet corn acreage in half. Field corn, easily harvested mechanically, now grows on the land once devoted to fresh market vegetables.
As New York State farm managers seek to adjust to the uncertainties created by immigration enforcement they too are making economically rational decisions to shift away from labor intensive crops. In Orleans County, sweet cherry trees that require hand pruning and harvest have been cut down and replaced by blueberry bushes and tart cherry orchards that can be managed with fewer hired workers. In Ontario County, growers have reduced labor intensive asparagus plantings in favor of more conventional crops. In a December 2006 New York Farm Viability Institute survey, cabbage growers cited “immigration issues relative to obtaining and keeping employees” as the greatest five-year threat to the success of their industry (NYFVI,

Page 8-8 2009 Outlook Handbook
Labor Thomas R. Maloney, Marc A. Smith, Mary Jo Dudley
2006); and western New York State producers report significant reductions in acres planted to cabbage as a measure to limit risks associated with labor availability.
The anecdotal observations above suggest that, unless the immigration policy and enforcement environment changes, production of high-value, fresh market fruits and vegetables in New York State could decline. Such a trend could reduce gross farm receipts and limit the variety of locally grown specialty crops available to consumers. 3. Migration of Production Enterprises across Borders
“We’ll either import the labor or import the food” is a conclusion many New York State growers and their counterparts nationally have drawn from their experiences with the current farm labor situation. The Western Growers Association reports that a few large farms with base operations in Arizona and California currently grow 84,000 acres of vegetables in Mexico. This small percentage shift in acreage from these important vegetable growing states has been driven by a variety of food safety and environmental regulations, as well as concerns about labor availability. In New York State, the option of moving production across the northern border to Ontario has received little consideration, despite some grower speculation about the comparative benefits of the Canadian immigration system and exchange rate advantages that have since disappeared.
More important than the developments noted above is the fact that the value of fresh produce imports has grown almost threefold since 1994, reaching nearly $9 billion in 2006, with Mexico shipping fresh produce valued at close to $4 billion to the United States (Huang and Huang, 2007). Given strong and growing demand for year-round fresh fruit and vegetables, we are already “importing the food”, regardless of immigration and agricultural labor issues at home. Public Perceptions
Farmers’ impressions of the importance of immigration issues to their businesses were documented in “The New York State Agricultural Immigration and Human Resource Management Issues Study” (Maloney and Bills, 2008). The views of farmers notwithstanding, public perceptions of these issues, as expressed through the legislative process, will significantly influence potential changes to federal immigration policy. In a practical sense, non-farmers’ understanding of immigration and the contributions of immigrant workers to the economic prosperity of local communities will strongly affect the level of public scrutiny and the impact of immigration law enforcement actions on farms, farmworkers and agricultural production.
The Empire State Poll, 2007 (Pfeffer and Parra, 2007) provides a perhaps surprising indication of how fluid New Yorkers’ opinions regarding immigration might be. A key question in the survey asked questions about whether New Yorkers considered immigrants to be an “asset or a burden” to their communities, Figure 8-3.

2009 Outlook Handbook Page 8 - 9
Thomas R. Maloney, Marc A. Smith, Mary Jo Dudley Labor
FIGURE 8-3. PORTION OF NEW YORKERS WHO CONSIDER IMMIGRANTS TO BE AN ASSET OR A BURDEN
In this context, New Yorkers, as well as Americans in general, are likely to define “asset” and “burden” based on their views of other issues that fuel the immigration debate. Those who view immigrant workers as a burden associate crime, strained health care and educational resources, depressed wages and job competition. This outlook is tempered in the overall public view by the perception that immigrants, as community assets, comprise a reliable work force spend at least some of their income in local communities and contribute to the production of safe, locally-grown, affordable food.
The formation of public opinion regarding immigration in New York State is influenced by reporting and editorial opinion from a variety of media, advocates on both sides of the issue, political leaders, business associations, family, friends, church organizations, neighbors and co-workers. New York State is home to the “media capital of the world” and high quality information on agricultural immigration issues is readily available, from coverage by the New York Times to North Country Public Radio, the Rochester Democrat & Chronicle and many other print and broadcast media outlets across the state. Even in the national coverage of the immigration story, which often emanates from New York City, news outlets have focused on the importance of immigrant workers to New York State farms and the challenges workers and farmers alike face in the current environment.
Beyond the media, a multitude of farmworker advocacy groups, chambers of commerce and statewide associations, such as the New York State Business Council, share an interest in the welfare of workers and the prosperity of farm businesses and rural communities. These groups, while not traditional allies of one another, nor of farmers and farm organizations, have platforms from which to influence grassroots opinion on immigration issues. New coalitions among these groups will continue to grow in response to the current environment and as vehicles to effect changes in federal policy under a new Congress and Administration.

Page 8-10 2009 Outlook Handbook
Labor Thomas R. Maloney, Marc A. Smith, Mary Jo Dudley
References Huang, Sophia and Kuo Huang. 2007. Increased U.S. Imports of Fresh Fruit and Vegetables, USDA-ERS, FTS-328-01, September, available at http://www.ers.usda.gov/Publications/fts/2007/08Aug/fts32801/fts32801.pdf Maloney, Thomas R. and Nelson L. Bills, RB08-01, The New York State Agricultural Immigration and Human Resource Management Issues Study, Department of Applied Economics and Management, College of Agriculture and Life Sciences, Cornell University, Ithaca, N.Y., August 2008. Passel, Jeffrey S., The Size and Character of the Authorized Migrant Population in the U.S., PEW Hispanic Center Report, Washington, D.C., March 7, 2006 Pfeffer, Max J. and Pilar A. Parra, Empire State Poll 2007, Report 3: Immigration and Community Response, Cornell University Survey Research Institute 2008.

N. Bills and G. Poe Agriculture and the Environment
Chapter 9. Agriculture and the Environment
Trends in New York Land Use and Highlights of the 2008 Farm Bill
Nelson Bills, Professor, AEM Gregory Poe, Associate Professor, AEM
When preparing last year's 2008 Agriculture and the Environment Outlook Chapter, our intention was to report on a 2007 Farm Bill. An initial bill had been introduced and passed by the House in May 2007 and the Senate was deliberating on the farm legislation. However, it was not until mid-December that the Senate passed their version of the Farm Bill, and it then took over six months, of what has been referred to as a “long and contentious” conference, for the House and the Senate to come to terms. Congress passed the conference version in May 2008, which was promptly vetoed by President Bush. It was only in June, after a technical complication was addressed, that the President’s veto was finally overridden by Congress and the 2008 Farm Bill (H.R. 6124, Public Law:110-246), entitled the “Food, Conservation and Energy Act of 2008”, was enacted into law.
Much of the debate over the 2008 Farm Bill centered on what President Bush referred to as fiscal
discipline and a lack of program reform “in a time of record high food prices and record farm income”, but there were many other voices wielding influence over program direction; all clearly understand that this legislation is sweeping and addresses numerous concerns beyond agricultural commodity programs. The concern we address here relates to environmental management. The 2008 legislation follows precedent established in the mid-1980s and enshrines environmental programming for agriculture in a separate conservation title. Although many groups would have liked the conservation title to have taken a different direction from what was ultimately enacted, the Conservation Title of the 2008 Farm Bill, we see only marginal shifts in emphases. There are modifications, outlined later in this chapter, but the palate of conservation programs follows the same trajectory as the 2002 Farm Bill, with provisions for farmland retirement, stewardship of land and water resources, and farmland protection.
Despite the lack of major shift in direction, this is an opportune time for us to showcase the Farm Bill
Conservation Title. This legislation will govern the bulk of Federal agriculture and related programs for the next five years, interacting with and complementing other initiatives at both the state and Federal levels. That is, the direction of Federal farm programs for conservation and the authorities granted the USDA to fund them are absolutely critical elements in the emergent policy mosaic in New York. Moreover, in recent years, largely because of the expansion of the working lands programs, instead of land retirement efforts, this legislation has emerged as a relatively important financial input to New York State farmers. With $4 Bil. in additional and conservation program funding under the 2008 Farm Bill, this role could increase. Beyond immediate financial considerations, these programs offer assistance to and opportunities for farmers and landowners to adopt practices that meet water quality and other environmental demands that have become more prominent in recent years, with new program offerings that will become available to New York State farmers in targeted areas.

Page 9-2 2009 Outlook Handbook
Agriculture and the Environment N. Bills and G. Poe
To begin the discussion here, we review broad trends in land use in New York State by updating some information provided in this chapter in years past. I. Agricultural Land Use in New York
New York's land resources are key ingredients for agricultural commodity production. Crop and livestock production has always been a predominant feature of the New York State landscape. After the American Civil War, New York State led the nation in farmland acreage. As late as a century ago, about three-fourths of the State land base was counted as land in farms. But during much of the twentieth century, agricultural lands in New York, indeed throughout the Northeast, have slowly been converted or reverted to alternate uses and, due to consolidation and other socio-economic trends, the number of farms has declined. Some of the acreage released from farm use has been converted to a developed use, but millions of acres sprouted brush, then small trees and, over time, woodland that can again reclaim the title of forest.
Corresponding trends in farm numbers and farm acreage in New York are shown in Figure 9-1. For
2007, the USDA farm estimate for New York is 34,200 farms, down 800 farms from the number reported in 2006. The farmland base--acreage used for crops, pasture, and support land-- stabilized in the early 2000s at about 7.5 million acres across New York State.1
FIGURE 9-1. FARMS AND LAND IN FARMS, NEW YORK, 1969-2007
1969
1974
1978
198219
8719
9219
97
1997
-adj.20
0220
0320
0420
0520
0620
070
10,000
20,000
30,000
40,000
50,000
60,000
Farms
1969
1974
1978
1982
198719
9219
97
1997
-adj.20
0220
0320
0420
0520
0620
070
2,000
4,000
6,000
8,000
10,000
12,000
Acres (1,000)
Source: 2002 Census of Agriculture, NYS Agriculture Statistics Service, and UDSA-National Agricultural Statistics Service
The value of crops and livestock produced on these farms hovered in the $3 Bil. range during the 1990s and into this decade with some variation due to fluctuating milk and crop prices. Since 2000 total receipts have trended upward, with gross farm income increasing sharply to $4.5 Bil. in calendar 2007, largely fueled by increased commodity prices. Farm businesses also support industries that process raw farm
1 Some of these land-use developments are masked by changes in data management. For the 2002 Census of Agriculture, the USDA adopted new measures to correct for under-counting of farm operations. As indicated in Figure 9-1 these adjustments led to a notable rise, for calendar 2002, of approximately 20% in the estimated number of farm operations and a corresponding, but lesser, increase (8%) in estimated farm acreage.

2009 Outlook Handbook Page 9-3
N. Bills and G. Poe Agriculture and the Environment
commodities and supply inputs needed for commercial farm production. Statistics of these data are less frequently reported. In 2007, the value of gross output originating on New York farms and with businesses classified as agricultural services or food/beverage manufacturing totaled $31.2 billion.
New York State has not conducted a comprehensive inventory of land uses since the late 1960s,
making for a good deal of uncertainty over the status of overall land use. Two USDA agencies—the Economic Research Service (ERS) and the Natural Resources Conservation Service (NRCS)—attempt to fill that void with published estimates of land use and land cover. Because of budget considerations, the Federal land-use estimates are either dated, published only for multistate areas, or both. Widely circulated trend data estimated in a consistent manner by ERS since the late 1940s are shown in Figure 9-2. They showed land-use estimates through 2002 and indicate that, as in years past, forest cover predominates for New York State as a whole; more than six of every 10 acres are classified as forest by the USDA. USDA crop and pasture estimates track the census data reported above and show marginal decreases in both categories moving into this decade. This USDA data series uses a conservative estimate of urbanized land, using Census definitions. Urbanized land by Census definition includes incorporated cities and villages with a population of 2,500 or more and adjacent densely populated territory. In 2002, slightly more than 2.5 million acres fell into this urban land category as shown in Figure 9-2. USDA estimates from the 2003 NRCS National Resources Inventory (NRI) are more expansive in definition and put urban and built-up acreage in the range of 3.7 million acres five years ago.
FIGURE 9-2. MAJOR USES OF LAND, NEW YORK, 1945-2002
43% 45% 48% 48% 48% 59% 59% 58% 63% 64% 64%61% 61%
27% 28% 26%23% 22% 21% 20% 20% 19% 17% 15% 14% 15%
1945 1949 1954 1959 1964 1969 1974 1978 1982 1987 1992 1997 20020
5,000
10,000
15,000
20,000
25,000
30,000
Acres (1,000)
All other usesUrban/transport
Forest & parks Pasture Cropland
Source: USDA-ERS.

Page 9-4 2009 Outlook Handbook
Agriculture and the Environment N. Bills and G. Poe
II. The Conservation Title of the Farm Bill, Federal Funds in Perspective
The interplay between food production, land use and the environment has always been part of the American conservation movement. Today, even though many state and local governments are active partners, the larger discussion about public support to achieve satisfactory environmental outcomes on US farm and ranchland typically centers on a suite of USDA programs designed to secure environmental services from farmers and ranchers with Federal funds. Federal cost sharing and technical assistance on the installation and maintenance conservation practices on farms dates to the Great Depression. On several occasions in more recent years, long-lived programs have been repackaged and rolled out under new names. Despite unprecedented amounts of discussion about new program directions, the 2008 Farm Bill and its conservation title are very much in step with past efforts
For some time the authors of this chapter have argued that New York State’s share of the
conservation title program funding has been disproportionately small relative to other states, particularly the Midwest. On grounds related to the relatively large environmental benefits that would accrue in the northeast, it would make economic sense to target New York State and the Northeast for many of these programs. However, such academic arguments have paled in respect to the political powers that govern the allocation of Federal Agricultural Dollars. While there has been some shift in interregional allocations over the last decade, the momentum of funding continues, and New York State’s claim on major conservation title programs remains small relative to the rest of the country. This comparison is provided in Figure 9-3.
Figure 9-3 Average per farm federal expenditures for direct payments and technical assistance by conservation program, FY 2007
$440
$479
$107
$876
$843
$1,634
New York State
US
$0 $250 $500 $750 $1,000 $1,250 $1,500 $1,750Cash and Technical assistance: average per farm
Conservation Reserve ProgramEnvironmental Quality Incentive ProgramConservation Security Program
Wetlands Reserve ProgramFarm & Ranchland/Grassland Reserve ProgramsWildlife Habitat Incentives Program
Source: USDA-NRCS; USDA-FSA

2009 Outlook Handbook Page 9-5
N. Bills and G. Poe Agriculture and the Environment
Nevertheless the amount of Federal expenditures averaged across all New York State farmers is not inconsequential. Moreover, averages only tell part of the story: because programs are concentrated in certain areas and subscription to the programs is not universal, Federal Conservation expenditures do play a major financial role in the operations of some farms (and are non-existent on others).
It is useful to compare these expenditures to other Federal sources of flows to New York State
landowners. Figure 9-4 provides one perspective of conservation title expenditures vis-à-vis other major Federal farm payments. A broad trend is that nominal conservation program payments have consistently increase over the 12 years covered in the figure. As a result of this trend and rising commodity prices in recent years (with the subsequent drop in crop program expenditures) the relative role on conservation payments in New York State Federal farm expenditures is now prominent. Indeed, in 2007, conservation program expenditures in New York State, estimated at $26.1 Mil., approximated that of the commodity programs ($27.7 Mil.) While the monies allocated to conservation programs are scheduled to rise with the 2008 Farm Bill, sometimes in mandated amounts, it remains to be seen whether high crop prices and corresponding low commodity payments will be sustained over the five year life of the 2008 legislation.
Figure 9-4 Federal farm payments for New York State, 1996-2007
$30,714$37,147 $35,964
$52,153$47,250
$37,884
$23,068
$39,498$47,832
$94,401
$60,315
$27,707
$40,864 $42,902
$60,833
$120,243
$160,212
$114,008
$159,238 $162,280
$82,162
$142,823
$127,916
$62,891
1996 1997 1998 1999 2000 2001 2002 2003 2004 2005 2006 2007$0
$50,000
$100,000
$150,000
$200,000
Dollars ($1,000)
Conservation Ad hoc/emergency Milk income loss Crop programs
Source: USDA-ERS.
Some perspective is also gained by comparing the expenditures associated with these Federal programs with selected conservation expenditures by the State of New York, which has an impressive history in the conservation arena. For example, as we have emphasized in previous years, New York State has a 40-year history of leadership and investment in farmland protection. More recently, a statewide Agricultural Environmental Management (AEM) Program and Nonpoint Source Pollution Grants have forged new opportunities to reduce agricultural nutrient runoff and other environmental impacts. Table 9-1 provides a listing of major Conservation Title expenditures averaged across New York State’s 34,200 farms and a like listing of key New York State conservation programs. This direct comparison on a per farm basis for 2007 shows that New York State’s contribution far exceeds that of the USDA. On a per farm basis, we estimate that the State generates more than $5,700 in benefits, compared to an estimated $843 at the Federal level, a nearly seven-fold advantage from State sources.

Page 9-6 2009 Outlook Handbook
Agriculture and the Environment N. Bills and G. Poe
These results are surprising and beg for elaboration. First, like recent trends in crop prices and consequent effects on Federal crop payments, this ratio has been overtaken by events in the last few years. Specifically, the total value of tax relief encompassed by the Farmers School Tax Credit and Agricultural and Farm Building Assessments has ballooned in the last three years as local governments have dramatically increased local property tax levies. These levy increases have been largely offset by larger exemptions afforded farm operators and landowners under New York State law. According to our calculations, the aggregate amount of property taxes avoided during the 2007 tax year was $36.0 Mil., $128.4 Mil., and $14.4 Mil., respectively for the Farmers School Tax Credit, agricultural (farmland) and farm building assessments. This aggregate amount-$178.8 Mil.-is up from $135 Mil. in 2004 (a 32% increase in the 3-year span). These increases are driven, to varying degrees depending on the local jurisdiction, by increases in property values and increases in local property tax levies as local governments scramble to secure the funds needed to supply local services. Similarly, higher property taxes levies for local schools have dramatically increased the benefits generated by the refundable income tax credit available for farm operators who qualify for the Farmers School Tax Credit. Secondly, the primary New York State expenditure categories focus on programs to provide tax relief and keep farmers on the land. Although conservation programs often have a similar auxiliary motivation, their paramount objective is to reduce the environmental effects of agricultural practices. Thus, the Federal and state expenditures are to some extent non-comparable, and instead can be viewed as part of a complete package addressing both the positive and negative external effects of agriculture in New York State. As such, we argue that it is most appropriate to view past, present and future Federal conservation expenditures in the context of a larger suite of programs intended to address or enhance the environmental contribution of agriculture to society.
TABLE 9-1. ESTIMATED AVERAGE, PER FARM BENEFITS FROM FEDERAL AND NEW YORK STATE CONSERVATION PROGRAMS IN 2007 Item Dollars
Conservation Reserve (CRP) $107 Environmental Quality Incentives (EQIP) 440 Conservation Security (CSP) 51 Wetlands Reserve (WRP) 171 Farm and Ranch Lands Protection (FRPP) & Grassland Reserve (GRP) 62 Wildlife Habitat Incentives (WHIP) 12 Total-Federal Programs $843 Purchase of Development Rights (PDR) $420 Reduced State Income Taxes: Farmers School Tax Credit 1,053 Reduced Property Taxes: Agricultural Assessments 3,754 Reduced Property Taxes: Farm Building Exemptions 428 NYS-Agricultural Environmental Management (AEM) 77 Total-New York State Programs $5,733
Source: Derived from data obtained from USDA-ERS, USDA-NASS, NYS Dept. of Agriculture and Markets, NYS Office of the State Comptroller, NYS Dept. of Taxation and Finance, and the NYS Office of Real Property Services

2009 Outlook Handbook Page 9-7
N. Bills and G. Poe Agriculture and the Environment
III. The 2008 Farm Bill and Conservation
Following the current USDA nomenclature, Federal Conservation Title payment programs can be conveniently grouped around land retirement, working lands, and land preservation. Federal outlays for those programs were about $3.7 Bil. in 2007, according to USDA budget data, and is expected to grow to over $5 Bil. by 2012. As indicated above, this expansion largely follows the path laid out in the 2002 Farm Bill. However, there are some directional changes at the national level, notably: there is an increased emphasis on working lands programs as evidenced by growth in EQIP and shrinkage of Conservation Reserve Program acreage; the Conservation Security Program (now the Conservation Stewardship Program) is no longer limited to specific watersheds but will now be offered on a broader scale; and New York State landowners in the Susquehanna River basin are eligible to participate in a new Chesapeake Bay Watershed Program.
Here we summarize major Conservation Title programs affecting New York State, noting that the
details on some of the new programs, and the implementation for conservation programming in New York State, will not emerge until rulemaking is completed next spring. Land Retirement Programs Conservation Reserve Program (CRP): Created by the 1985 Farm Bill, the CRP is the Nation’s flagship land conservation program. The CRP offers annual rental payments and cost-share assistance to landowners to establish long-term resource conserving land covers (e.g., grass and trees) on eligible land to improve the quality of water, control soil erosion, and enhance wildlife habitat. Having evolved through subsequent Farm Bills, the CRP now consists of three programs. The most established program is the General Sign-Up CRP, which in 2007 contracted over 32.9 million acres on more than 276,000 farms nationwide. Participants enroll in the General Sign-Up CRP by contracting their land for 10 to 15 years. The rental contracts are competitive, operating through periodic sign ups in which landowners submit offers indicating the amount that they would be willing to accept as compensation for retiring their land (annual compensation or rental rates must be equal to or less than the average dry land soil rental rate for the county in which the land is located). Each offer is compared to an environmental benefits index calculated for the specific parcel under consideration, placed in a nationwide pool, and then ranked on the basis of relative costs and benefits of enrolling individual parcels.
Beginning in 1996, the Continuous Sign-Up was added to the CRP. This program offers greater financial incentive than the general CRP, and it allows landowners to sign up at any time as opposed to the one or two announced sign-ups each year. It targets highly valued environmental practices including filter and contour grass strips, riparian, wildlife and wetland buffers and a number of other specified practices. Like the CRP, farmers receive cost share assistance and land is enrolled for 10 to 15 years. Additional incentives for specific practices are available.
The Conservation Reserve Enhancement Program (CREP) represents the third leg of the CRP.
Established at local or state levels through individual Federal/State partnerships, the CREP program currently operates in 24 states, implementing projects designed to address specific environmental objectives. The program retains the essential characteristics of general CRP, establishing 10 to 15-year contracts with landowners to retire environmentally sensitive land. Like the continuous sign-up, enrollment is available on a continuous basis. However, the CREP program differs from the other programs previously described in that, recognizing that land enrollment decisions are sensitive to contract prices, it offers substantially higher incentives for enrollment. Recent research by the co-authors demonstrates that landowners are responsive to these incentives. Since 2003, New York has had three CREP programs: the Syracuse/Skaneateles Lake Watershed Program (1,000 acres enrollment), the New York City Watershed Program (5,000 acres enrollment target), and the New York State CREP program (40,000 acres enrollment target).

Page 9-8 2009 Outlook Handbook
Agriculture and the Environment N. Bills and G. Poe
In New York State the pattern of CRP enrollment across the three programs has varied substantially from the national averages. As indicated in Table 9-2, the general CRP, continuous CRP and CREP programs respectively constituted approximately 88 percent, 8 percent and 3 percent of total national CRP acreage enrolled in 2007. Comparative figures for New York State were 67 percent, 15 percent and 18 percent. In terms of total CRP acreage, New York State has closely followed national trends in recent years. Most notably as indicated in Figure 9-6, total CRP acreage in New York State fell by almost 10 percent from 2006 to 2007 after inching up for several years. This is largely attributed to the expiration of long-term contracts and lack of reenrollment of those lands.
Although continuing the authorization of the CRP program, the 2008 Farm Bill reduced the national
cap to 32 million acres, down from the previous cap of 39.2 million acres. Actual enrollment was 34.7 million acres as of April 2008, reflecting some exiting of the program at the national level. As in New York this drop in national CRP acreage is most likely driven by elevated commodity prices and the consequent opportunity cost of reenrolling land once original contracts had expired.
TABLE 9-2 CONSERVATION RESERVE ENROLLLMENTS, NEW YORK STATE AND THE US, 2008
Item Number of Farms Acres
Annual Rental
($1,000) $/Acre
New York General Sign Up 1,052 39,851 1,640 $41.16
Continuous, Non CREP 590 8,988 472 $52.56 CREP 623 10,913 1,677 $153.68
United States
General Sign Up 253,892 30,542,941 1,346,017 $44.07 Continuous, Non CREP 183,413 2,864,736 255,477 $89.18
CREP 42,376 1,126,710 143,424 $127.29 Source: USDA-FSA

2009 Outlook Handbook Page 9-9
N. Bills and G. Poe Agriculture and the Environment
Wetlands Reserve Program (WRP): The (WRP) pays landowners, and provides cost-share assistance, to retire marginal land from agricultural production if those lands are restored to wetlands and protected with 30-year or permanent easements. Landowners receive appraised fair market value for land placed in permanent easements (and 75 percent of appraised value for 30 year easements) and are provided with cost-share assistance to cover restoration expenses. The WRP offers continuous signups in a manner analogous to the continuous CRP.
WRP enrollment in New York State has been quite successful, particularly in comparison to the CRP. Nationwide the CRP to WRP ratio is almost 15 to 1. In New York State it is approaching one-to-one with over 49,000 acres enrolled across over 1,200 WRP contracts in New York State up through 2007.
In contrast to lowering the national cap for CRP, the 2008 Farm Bill lifts the cap for WRP to 3.04
million acres, up from 2.27 million acres in the 2002 Farm Bill. This implies $1.3 Bil. in additional spending in the new Farm Bill. Through 2007, 1.95 Mil. acres had been enrolled nationwide. Assuming continued enrollment in the New York State program, it is likely that in the future WRP acreage in New York State will exceed that of CRP.
In addition to increasing the acreage cap, the 2008 Farm Bill authorizes a Wetlands Reserve
Enhancement Program that follows the success of the CREP initiatives by allowing Federal/State partnerships in the design and selection of contracts. Working Land Payment Programs The Environmental Quality Incentives Program (EQIP): First authorized in the 1996 Farm Bill and expanded in the 2002 Farm Bill, EQIP provides assistance to farmers to install or implement conservation practices on eligible agricultural land to protect water, air and soil quality as well as wildlife habitat. Eligible lands include cropland, grassland, rangeland and pastureland, non-industrial private forestland and other farm
FIGURE 9-6. CONSERVATION RESERVE PROGRAM ACREAGE, NEW YORK STATE, 2003-2008
60,14857,542
60,80663,912
65,992
59,752
2003 2004 2005 2006 2007 20080
10,000
20,000
30,000
40,000
50,000
60,000
70,000
Total CRP acreage
Source: USDA-FSA

Page 9-10 2009 Outlook Handbook
Agriculture and the Environment N. Bills and G. Poe
lands as determined by the Secretary of Agriculture. Importantly, from the perspective of New York agriculture, EQIP is the only conservation program that sets aside a portion, a minimum of 60 percent nationally, of its funding for livestock producers and serves as a critical source of funding for the development of comprehensive nutrient management plans. Under the 2008 Farm Bill, conservation practices related to organic production and transition to organic production are also eligible for funding.
In New York State EQIP tends to be oversubscribed, with perhaps twice the number of applications than are ultimately funded. Enrollment in EQIP is determined by a ranking program based on four criteria: national, state, and local resource concerns, and an efficiency score. In New York the state technical committee establishes resource concerns to be identified as priorities for funding. Consistent with national priorities, in 2007 these were the reduction of nonpoint source pollutants, reduction of soil erosion and sedimentation, reduction of emissions, and promotion of at-risk species habitat. Local workgroups representing each of the thirteen waterbasins establish local resource concerns. The efficiency score is based on the lifespan and cost of the conservation practices. A procedure consistent with meeting these priority objectives and using approved conservation practices is applied to rank applications and determine funding: each watershed has unique local ranking criteria, eligible practices, and separate funding pools. While EQIP is a continuous signup program, New York State NRCS established ranking periods, to ensure adequate time to process applications, and ultimately sign contracts.
Much of the dramatic rise observed for Conservation Title expenditures in New York State since
2004 can be attributed to a surge in EQIP contract payments over that period. In 2004, statewide payments for 1997 contracts and after were just over $2.54 Mil By 2007 these contract payments had risen almost four-fold to over $9.26 Mil.,2 with over $5.20 Bil. of these funds direct to Animal Waste Management Practices. This upward trend is expected to continue as national EQIP funding as authorized in the 2008 Farm Bill will rise from $1.2 Bil. in fiscal year 2008 to $1.75 Bil. in year 2012. In 2007, EQIP allocations were just over $1 Bil. nationwide. The Conservation Security Program (CSP)/ Conservation Stewardship Program (CStP): The Conservation Security Program (CSP) was first authorized by the 2002 Farm Bill and provides financial and technical assistance on agricultural working lands to support ongoing conservation stewardship and additional conservation practices or activities that provide increased resource benefits. In many ways this program can be viewed as a first step or experiment in European -like Green Payment schemes that supplant commodity programs with environmental-based support programs. The CSP provides payments to producers who maintain and enhance the condition of natural resources. USDA was directed to implement this program on a pilot basis in 2002-07, resulting in annual enrollments in 331 watersheds, including six in New York (Ausable, Buffalo-Eighteenmile, Niagara, Northern Long Island, Southern Long Island, and Onondaga).
The CSP was structured around three different tiers of eligibility, which are described as follows on NRCS fact sheets. For Tier I, the producer must have addressed soil quality and water quality to the described minimum level of treatment for eligible land uses on part of the agricultural operation prior to acceptance. Soil quality practices include crop rotations, cover crops, tillage practices, prescribed grazing, and providing adequate wind barriers. For Tier II, the producer must have addressed soil quality and water quality to the described minimum level of treatment on all eligible land uses on the entire agricultural operation prior to acceptance and agree to address one additional resource (e.g. wildlife habitat) by the end of the contract period. For Tier III, the producer must have addressed all applicable resource concerns (e.g. soil quality, water quality, wildlife habitat etc.) to a resource management system level that meets the NRCS Field Office Technical Guide standards on all eligible land uses on the entire agricultural operation before acceptance into
2 In addition to new contracts, the upward trend was reinforced by increase implementation and enforcement of earlier contracts.

2009 Outlook Handbook Page 9-11
N. Bills and G. Poe Agriculture and the Environment
the program and have riparian zones. Producers could receive four types of payments (annual stewardship payments; annual existing practice payment, new practice payments, and annual enhancement payments for adopting additional practices that go beyond basic conservation standard or address local resource concerns) with the maximum level of payment per contract ($20,000 to $45,000), and the length of the contract (5-10 years) varying with the tier. Total CSP financial and technical assistance expenditures in New York State were just over $1.73 Mil. in fiscal year 2007.
The 2008 farm bill replaced CSP with the Conservation Stewardship Program (CStP). The CStP is
intended to be rolled out nationwide, and not restricted to a limited number of watersheds. Allocations across states will hopefully be more equitable: under the 2002 Farm Bill, about 1/3 of total CSP funds were distributed to just four states.
Under this program the USDA is directed to enroll 12.77 million acres/year at average cost of
$18/acre/year including financial assistance technical assistance and other expenditures. Payments are to be based on costs for installation, adoption and maintenance, will include income foregone by producer, and will be related to expected environmental benefits as determined by conservation measurement tools. While some basic parameters have been specified in the law (e.g., a $200,000 cap to any one person or legal entity during any 5-year period;) and new opportunities will exist (nonindustrial private forest land incidental to agricultural land is now eligible as agricultural operations are defined as all acres of the operation of a producers), the allocation of funds across states, the dimensions of the incentives involved, the prioritization of areas, and numerous other factors will have to be resolved in rulemaking, expected in Spring 2009.
The amounts to be allocated to this program were not specified in the act, but the Congressional
Budget Office estimated in May 2008 that spending on existing CSP contracts and new CStP contracts will be $3.8 billion for FY 2009-12. Flows to New York landowners will be somewhat encumbered by the explicit wording in the act that that “payments cannot be made for expenses related to the design, construction, or maintenance of animal waste storage or treatment facilities or associated waste transport or transfer devices for animal feeding operations.” However, because CStP will be statewide, rather than concentrated in a small number of watersheds, the relative contribution to New York State farms indicated in Table 9-1 is expected to rise. Wildlife Habitat Incentives Program (WHIP): The WHIP provides cost-sharing for landowners to apply an array of wildlife practices to develop habitat that will support upland wildlife, wetland wildlife, threatened and endangered species, fisheries, and other types of wildlife. Land eligible for WHIP includes private agricultural land, non-industrial private forest land, and tribal land. Applications are accepted year round, and contracts are generally 5-10 years although longer term agreements exist for “essential” habitat land. As suggested in Table 9-1 and Figure 9-4, participation in this program is limited in New York State, with only 1,266 enrolled acres in 2007. While national level funding for WHIP is slated to double with the new farm bill, it is unlikely that the acreage enrolled in this program will increase appreciably in New York State. Chesapeake Bay Program. Like the CStP, the full dimensions of the Chesapeake Bay Program will not be known until rulemaking is completed. Nevertheless, our hopes are that this EQIP-like program will provide a source of meaningful conservation funding for producers in the Susquehanna River Basin. Indirectly, this targeted program may lead to more diffuse benefits in New York State if the geographical allocation of funding for other programs is adjusted in response. The program is intended to help producers enhance land and water resources by: controlling erosion and reducing sediments and nutrient levels in round and surface water; planning, designing implementing, and evaluating habitat conservation, restoration and enhancement measures where there is significant ecological value for retaining the land in its current use or restoring the land to its natural condition. The 2008 Farm Bill provides $438 million in new funding, to be allocated across

Page 9-12 2009 Outlook Handbook
Agriculture and the Environment N. Bills and G. Poe
the States in the Chesapeake Bay watershed. New York State is expected to receive 8 to 10 percent of such funding. Farm and Ranch Land Protection Program (FRPP) and Grassland Reserve Program (GRP): Policy interest in poorly timed or excessive conversion of farmland to developed uses is a “baby boomer” issue and evolved out of settlement patterns witnessed in the aftermath of World War II. Those years generated population spillovers from urban cores that coincided with dramatic changes in the structure of commodity agriculture. Those developments created a perfect storm for many rural communities, especially in the more densely populated Northeastern states. An immediate pressure point was the local property tax, a lynchpin source of funds for public services in the Region. New rural residents, along with the courts, pressured local governments to upgrade their property assessment procedures and update the market values assigned to farm real estate for taxing purposes. Tax levies also increased dramatically to fund growing public service needs. In response, State legislatures enacted programs to give farmland owners tax relief by capping or reducing tax liabilities realized by farmers and farmland owners. In New York State, taxes can be reduced with exemptions on new or reconstructed farm buildings, assessment of farmland at use rather than market value, or a refundable state income tax credit for local school property tax levies.
The policy discussion over farmland protection has evolved and deepened over the years. Most notably, several states (and a few local governments) operate farmland purchase of development rights (PDR) programs, which ensure an open space use in perpetuity. Efforts to ‘ease development rights on farmland began in the 1970s when Suffolk County, New York launched the nation's inaugural PDR program. Since that time, according to the American Farmland Trust, 1.8 million farmland acres nationwide have been brought under this form of easement at an estimated cost of about $2 billion (a great deal more if expressed in present value terms). This effort has been fueled primarily with public funds. Nonprofit organizations (organized as land trusts in many cases) acquire farmland easements as well, either through outright purchase, owner donations, or partnerships with state and local governments.
Parallel to these private and state/local government initiatives, the Federal Government is increasingly
partnering with these entities to protect farmland. Federal efforts to protect farmland began later and with a protracted debate over actually incurring any direct Treasury costs. The Agriculture and Food Act of 1981 required Federal agencies to evaluate the impact of federally funded programs that converted farmland to nonagricultural uses and to consider alternative actions that would lessen the adverse impacts. Direct Federal involvement in permanent farmland protection only began with the 1996 Farm Bill, which overcame longstanding concerns about the Federal interest in farmland conversion and established the Farmland Protection Program (FPP). This program provided cash assistance to State, local, and tribal governments interested in acquiring farmland development rights. The FPP operated on a very modest financial basis in the early years but did distribute about $50 million in Federal funds during the 1996–2001 span to match state and local dollars.
The 2002 Farm Security and Rural Investment Act reauthorized the FPP and renamed it the Farm and
Ranch Land Protection Program (FRPP). FRPP provided funds up to 50 percent of easement costs on qualified, privately owned agricultural land. The 2002 Farm Act authorized funding of $597 million over FY 2002-07. However, annual appropriations lagged behind the amount of funding authorized for most of those years. The 2002 legislation also established the Grassland Reserve Program (GRP), with a focus on efforts to improve and conserve native-grass grazing lands through long-term rental agreements or 30-year or permanent easements. During FY 2003-05, according to the USDA, $177 million in financial assistance was made available to landowners through the GRP.
The 2008 Farm Bill returns to language used in the late 1990s and authorizes the USDA to operate a
Farmland Protection Program (FPP), along with the ongoing GRP. The new legislation authorizes an

2009 Outlook Handbook Page 9-13
N. Bills and G. Poe Agriculture and the Environment
additional 1.22 million acres for GRP enrollment during FY 2009-12. More germane to the New York State scene, the law mandates new Federal spending amounting to $743 million for FY 2008-12; this is a sizable increase compared to the 2002 Farm Bill.
Program scope appears to be broader under the new legislation, because eligible land now includes
forestland and other land that contributes to economic viability of agricultural operation or that serves as buffer from development. In addition, a provision in the 2002 Farm Bill that proved to be troublesome and controversial in the Northeast was eliminated: a 2% limitation on impervious surfaces as a fraction of total easement area. Going forward, eligible entities will be allowed to specify their own limit on impervious surfaces, which should help facilitate program entry for smaller land parcels or parcels with substantial land improvements needed to support livestock, livestock products, or high-value crop production in the Northeast. IV. Some Concluding Comments
In the realm of conservation and environmental management, an old economic adage appears to hold true: “follow the money”. Improved conservation behavior on farms has been a well recognized social need in the United States for nearly a century. Billions of taxpayer dollars have been obligated in support of that objective, and today, as in years past, thousands of US farm families act as Conservation Title supported stewards of the nation's land and water resources. Continuing public support is a well-established organizing principal for agricultural conservation policy. This chapter fully acknowledges that legacy and focuses on drawing contrasts and providing perspective on the allocation of scarce public funds for this purpose.
Interest is high this year because the U.S. Congress has re-upped the Federal Farm Bill for another
five years. Our assessment shows that the new Farm Bill promises more of the same on the conservation front, with no real changes in the fundamentals of Federal conservation initiatives. We have pointed out several significant, albeit marginal changes in program direction, and we have speculated on what some of these changes might mean to the financial circumstances for farmers and landowners in New York State. But we recognize that the vagaries of Federal funding and rule making will ultimately dictate results in New York State and elsewhere. Namely, only a portion of the monies specified in this legislation are mandated and we will have to wait to see what level of Federal funding is ultimately appropriated for these purposes in upcoming years of expected tight budgets. If appropriations match up well with congressional intent, we expect to see an expanded (renamed) Conservation Security Program and fairly robust increases in funding for farmland protection and EQIP. But, because perceived needs are great, we think it's likely that these programs will continue to be oversubscribed and hence underfunded. While we expect a drop-off in CRP enrollment, there are likely to be increased opportunities for enrollment in the WRP.

Notes

M.I. Gómez and B.J. Rickard Specialty Crops
Chapter 10. Specialty Crops Miguel I. Gómez, Assistant Professor and Bradley J. Rickard, Assistant Professor
Specialty crops are an important component of New York State’s agricultural economy. In
2007 the total farm value of all agricultural products produced in New York was approximately $4.5 billion; nearly 25% of the total value was derived from production of fruits and vegetables and 5% was generated by ornamental crops. Nationally, New York State continues to be a significant producer of nine fruit crops and ten vegetable crops. Apples and grapes are the two highest revenue fruit crops in New York while cabbage, sweet corn, and onions have been the three highest revenue vegetable crops in recent years. New York ranks sixth on the value of ornamental production.
Fruits and vegetables continue to gain share in consumer food expenditures, as retailers
employ fresh products to differentiate from competitors. According to Park and Kaufman, retail produce sales in 2007 were about $63 billion, an increase of 25% from the 2002 estimate of nearly $51 billion. While all retail formats saw an increase in sales, Warehouse Clubs and Supercenters also experienced an increase in the share of total produce sales. Foodservice sales attributed to produce for 2007 were $47.2 billion, an increase of 42.5% compared to the 2002 estimate of $33.1 billion. Consumer stated preferences for local produce represent a unique opportunity for New York State specialty crop growers to develop alternative ways to access markets.
Below we divide specialty crop markets into four categories and take a closer look at market
conditions in each category. We examine patterns, and provide an outlook, for fruit and berries, vegetables (fresh and processing), grapes and wine, and ornamental products in New York. In each case we review production and price data in recent years, provide some thoughts about 2008, and then provide a summary of projections to 2011. 10.1 Fruit and Berry Outlook
Here we take a closer look at the 2007 market conditions for major fruit crops produced in New York State. In addition, based on preliminary information about 2008, we summarize some of the patterns that are expected to unfold in 2009 and beyond. Furthermore, we isolate grapes as a separate fruit category and examine them in detail in section 10.3. Overall, the total production of fruit (including grapes) in New York in 2007 exceeded 850 thousand tons and reached a 10-year high. Likewise, the value of all fruit produced in New York in 2007 was nearly $370 million; it was up 14% over the value in 2006 and was the highest valued fruit crop in New York’s history. Record prices for agricultural products in 2008 indicate that the value of some fruit crops will be higher in 2008 than in 2007.
Relative to other states, New York continued to be a major national producer of apples in 2007. As shown in Table 10-1, U.S. apple production in 2007 was 217 million bushels, and it is expected to be approximately 218 million bushels in 2008 based on conditions in late-August according to the USDA, NASS, New York Field Office. The 2008 USApple Forecast predicts a 5% decline in production in 2008 relative to 2007 due to much smaller production forecasts in Washington State and New York State. Washington State typically produces approximately 55 to 60% of the U.S. apple crop and New York State is the second largest producer growing about 15% of the national crop. In New York, apple production was 31 million bushels in 2007 and was valued at $285 million.

Page 10-2 2009 Outlook Handbook
Specialty Crops M.I. Gómez and B.J. Rickard
Unlike the national trend, New York production in 2008 is expected to be lower than it was in 2007. New York production of apples is expected to fall by at least 12% from 2007 levels to no more than 27.4 million bushels. The 2008 USApple Forecast is projecting a bigger fall in production during 2008 for New York State. The reduced production level is due to unfavorable weather during the growing season. A hail storm in June 2008 reduced much of the fresh fruit crop in all of the major production areas in Wayne County, the Hudson Valley fruit region, and in the Lake Champlain region. In 2007 approximately 37% of the New York apple crop was used for processed products which includes juice as well as cider, applesauce, and frozen products.
In addition to apples, New York State is also a top ten producer of several other tree fruit and berry
crops; in 2007 New York was the fourth largest producer of tart cherries and pears, and a top ten producer of sweet cherries, peaches, blueberries, and strawberries. Table 10-1 shows that sweet and tart cherry production in New York increased in 2007 relative to 2006; national production levels of tart cherries fell during the period while U.S. sweet cherry production was rising. New York peach and pear production was down in 2007 relative to 2006, but up substantially relative to 2005. The USDA forecasts that national pear production will fall to 1.6 billion pounds in 2008 (from 1.75 billion pounds in 2007) and that New York’s production level will also fall in 2008 to 19 million pounds (from 32 million pounds in 2006). The peach crop is also projected to be lower in 2008 relative to 2007; both nationally and in New York the USDA estimates that the 2008 peach crop will be approximately 10% lower than levels recorded in 2007.
TABLE 10-1. COMMERCIAL NONCITRUS AND NONGRAPE FRUIT PRODUCTION
NEW YORK AND UNITED STATES
New York U.S. 2005 2006 2007 2005 2006 2007
------ Thousand tons ------Apples 523 625 635 4,853 4,926 4,671 Fresh 245 345 340 Processed 273 280 310 Tart Cherries 3.8 5.2 6.5 135 132 126 Pears 8.5 16.0 11.2 823 842 880 Peaches 4.2 6.7 6.3 700 651 610 Fresh 2.0 3.1 3.0 Processed 2.2 3.6 3.3 Sweet Cherries 0.8 1.0 1.2 250.8 294.2 323.7
Sources: New York Agricultural Statistics, 2008; USDA Agricultural Statistics, 2008.
Table 10-2 shows that the average price for New York apples used in processing market was $174 per
ton in 2007, and this was significantly higher than the five-year average of $144 per ton between 2002 and 2006. Although apple production is expected to drop in New York this year, changes in prices for processing apples are expected to be minimal due to growth in imported quantities of apple juice products.
Average prices for fresh apples produced in New York also increased in 2007; the fresh apple price
was $0.341 per pound in 2007, and this was also significantly higher than the five-year average of $0.261 per pound between 2002 and 2006. Due to low levels of carry over fruit from 2007, reductions in imports, lower levels of imports, and another small crop in 2008, the average price for fresh apples is expected to increase in 2008 from prices reported in 2007. USDA projections in July and August 2008 indicate that fresh apple prices may end up being in the range of $0.40 to $0.50 per pound in 2008.

2009 Outlook Handbook Page 10-3
M.I. Gómez and B.J. Rickard Specialty Crops
Prices for sweet cherries were up in 2007, however, prices for other tree fruits grown in New York
State were down relative to levels seen in 2007 and especially 2006. National prices for selected tree fruits show less variability over the period between 2005 and 2007, and in some cases, national prices for tree fruits are higher in 2007 relative to recent years. Overall, prices for New York tree fruits (other than apples) tend to be higher than those recorded in other states. This observation may be due, in part, to the fact that a greater share of New York tree fruit is dedicated to the fresh market. The USDA projects that national pear prices will rise slightly in 2008 to 20.8 cents per pound; the price for pears in New York State is also expected to increase from 21.5 cents per pound in 2007 to nearly 25 cents per pound in 2008. Price changes in the pear market are responding to less domestic supply and less product entering the United States from exporters.
TABLE 10-2. FARM PRICES FOR NONCITRUS AND NONGRAPE FRUITS
NEW YORK AND UNITED STATES
New York U.S. 2005 2006 2007 2005 2006 2007
------ Dollars per ton ------Apples 324 400 426 348 458 516 Fresh 528 604 682 Processed 141 152 174 Tart Cherries 864 622 672 476 432 536 Pears 499 429 497 358 397 393 Peaches 690 667 634 588 650 578 Fresh 900 784 754 Processed 499 570 525 Sweet Cherries 1710 2290 2980 1990 1620 1830
Sources: New York Agricultural Statistics, 2008; USDA Agricultural Statistics, 2008.
TABLE 10-3. VALUE OF NONCITRUS AND NONGRAPE FRUITS
NEW YORK AND UNITED STATES
New York U.S. 2005 2006 2007 2005 2006 2007
------ Million dollars ------Apples 169.3 250.0 270.5 1689.7 2255.9 2410.2 Fresh 129.4 208.4 231.9 Processed 38.4 42.6 53.9 Tart Cherries 3.2 3.2 4.4 64.4 57.0 67.5 Pears 4.2 6.9 5.5 294.6 334.3 345.8 Peaches 2.9 4.6 3.9 411.6 423.2 352.6 Fresh 1.8 2.4 2.2 Processed 1.1 2.2 1.7 Sweet Cherries 1.4 2.3 3.6 499.1 476.6 592.4 Total 181.0 266.9 287.9 2958.4 3546.9 3768.6
Sources: New York Agricultural Statistics, 2008; USDA Agricultural Statistics, 2008.
Page 10-4 2009 Outlook Handbook
Specialty Crops M.I. Gómez and B.J. Rickard
Table 10-3 highlights the values of tree fruit sectors in New York between 2005 and 2007. The value of both the U.S. and New York’s apple crop has grown over the last three years as prices and production levels increase. The total value of other tree fruits and berries is expanding rapidly in New York State, and exceeded $30 million in 2007. Anecdotal evidence suggests that the bulk of other fruit produced in New York is sold through direct marketing channels, and it is expected that direct marketing will continue to be an important distribution channel for tree fruit and berries grown in the State. In 2007 the value of New York cherries expanded significantly, while the value of peach and pear production remained stable relative to the 5-year average and was lower than the value reported in 2006. The value of New York berries (strawberries, raspberries, and blueberries) has been growing in recent years and was valued at approximately $15 million in 2007. Much of the growth in the berry sector has occurred with red raspberries and blueberries.
The National Food and Agricultural Policy Project (NFAPP) at Arizona State University provides
ten-year economic forecasts for apples, sweet cherries, peaches, and strawberries. NFAPP provides projections for yields, acreage, value of production, international trade, and per capita consumption rates; they also disaggregate national projections to highlight some state-specific and product-specific trends. Although many of the projections are simply based on trends observed between 1996 and 2006, the forecasts shed some light on the general effects that we are likely to observe over the next decade. We include some highlights from the NFAPP study below for apples, sweet cherries, and peaches in Table 10-4.
The NFAPP forecasts that U.S. apple production will reach 9.8 billion pounds by 2011; production is expected to rise in Washington and New York, but fall in other regions. Nearly all of the increased production is expected to be utilized in the fresh market; apples used for canned products, juice, frozen, and dried purposes are expected to remain relatively flat between now and 2016. Producer prices for fresh apples are expected to be approximately $0.25 per pound in 2011 and retail prices are expected to remain close to $1 per pound in 2011 and remain mostly unchanged until 2016. Imports of fresh apples are expected to grow to over 600 million pounds by 2016 and exports of fresh apples will reach 1,315 million pounds by 2016. Per capita consumption rates of fresh and processed apple products are expected to remain constant through to 2016.
NFAPP projections for sweet cherries and peaches indicate that, unlike apples, U.S. acreage and
production will increase over the next three years. Grower and retail prices will remain relatively flat for peaches but are expected to increase for sweet cherries. Per capita consumption rates for sweet cherries and peaches are much lower than the rate for apples, and overall, the per capita consumption rates for all three fruit crops are not expected to change much over the period between 2009 and 2011. Between 2009 and 2016 total trade (imports plus exports) of sweet cherries and peaches are expected to increase slightly.

2009 Outlook Handbook Page 10-5
M.I. Gómez and B.J. Rickard Specialty Crops
TABLE 10-4. ECONOMIC OUTLOOK FOR SELECTED U.S. FRUITS
U.S. (unless noted otherwise) 2009 2010 2011
Apples Acres 375,408 373,571 370,554 Yield (pounds per acre) 25,877 26,233 26,397 Total U.S. production (million pounds) 9,715 9,800 9,782 Total N.Y. production 1,374 1,393 1,418 Fresh Production 5,997 6,036 6,062 Fresh Price (cents per pound) 25.52 24.37 25.15 Retail Price (dollars per pound) 1.03 1.02 1.03 Fresh exports (million pounds) 1,196 1,213 1,233 Fresh imports (million pounds) 501 516 532 Per capita consumption 17.24 17.22 17.14 Sweet Cherries Acres 80,900 82,400 83,500 Yield (tons per acre) 3.4 3.3 3.3 Fresh production 389 390 390 Fresh Price 119 123 127 Fresh exports 100 101 102 Fresh imports 14 14 15 Per capita consumption 1 1 1 Peaches Acres 143,800 144,500 145,200 Fresh production 1,514 1,535 1,549 Fresh price 34 34 35 Retail price 1.85 1.84 1.86 Fresh exports 275 273 275 Fresh imports 171 173 175 Per capita consumption 5.08 5.09 5.07
Sources: National Food and Agricultural Policy Project, 2007.

Page 10-6 2009 Outlook Handbook
Specialty Crops M.I. Gómez and B.J. Rickard
10.2 Vegetable Outlook
The value of New York vegetable production (including principal vegetables for fresh and processing markets but not including potatoes and dry beans) increased from $395 million in 2006 to $422 million in 2007. Fresh market vegetables contributed $383 million to the total in 2007 (up from $352 in 2006) while processed market vegetables contributed $39 million in 2007 (down from $43 million in 2006). Overall, the increase in the total value of New York’s vegetable crop in 2007 was driven by a combination of expanded acreage and better yields rather than higher prices.
Preliminary market conditions suggest that 2008 will be a better year for vegetable growers than
2007, although market conditions in 2009 may be more similar to the average experienced between 2002 and 2006. During the first nine months of 2008, fresh vegetable prices were 6% higher than those during the same period in 2007; prices of processing vegetables were up 8% over the same time period. Much of the price increase occurring during 2008 is due to acreage reductions for vegetable crops and increased export activity. New York continues to be a significant producer of onions, cabbage, snap beans, and sweet corn; for each of these commodities, New York State has consistently produced crops that have a value of $50 million or more. Here we focus on recent economic conditions, and provide some outlook, for nine fresh vegetable products and four processed vegetable products that are important markets in New York.
Table 10-5 shows production patterns for key vegetables in New York between 2005 and 2007, and
also compares New York production levels to national levels. New York sweet corn production was up in 2007 due to record high yields and slightly increased acreage relative to 2006. The national and global markets for processed sweet corn remain strong with growth in the market for frozen corn. New York was the second largest producer of cabbage in the United States and this sector also experienced substantial growth in 2007. Processed cabbage represents less than 10% of the value in New York State’s cabbage sector, and nearly all of the recent growth has been for fresh cabbage. Snap bean production (fresh and processed) and onion production also have a large presence in New York, and both sectors saw an increase in production in 2007. New York onion production in 2008 is expected to be down due to crop damage from hail. Of the other five fresh vegetables that are listed in Table 10-5, production patterns remain relatively constant with the exception of pumpkins which experienced greater production levels in 2007. Potato production was up nationally in 2007, however, fewer potatoes were produced in New York during 2007 relative to 2005 and 2006.
Overall, prices for fresh and processed vegetable products were higher in 2007 compared to those recorded in 2005 and 2006. Table 10-6 outlines prices for selected fresh and processed vegetables between 2005 and 2007. Anecdotal evidence suggests that prices for selected vegetables in 2008 will increase and, in some cases, will increase by more than 20% relative to prices received in 2007. Vegetable prices increased in 2008 due to price spikes in markets for grains and oilseeds, products that compete for land with some vegetable crops. One exception to the general price patterns observed for vegetables in 2007 was onions; the onion price fell substantially in 2007 but is expected to reach 2006 levels again in 2008. USDA data has not yet released price data for New York processing vegetables in 2007, but given national price trends for processing vegetables, 2007 prices are also expected to have increased in New York.
Given the trends in production and prices in Tables 10-5 and 10-6, it should come as no surprise that
the values of key vegetables in New York are higher in 2007 relative to 2005 for nearly all crops, and are higher than values in 2006 for many crops. The value of cabbage saw a big increase in 2007 yet the value of onions fell substantially in 2007. Although prices for processed vegetables likely increased in New York in 2007, lower levels of production led to a decrease in the value of processing vegetables in New York. Table 10-7 provides an overview of the value of vegetable crops produced in New York between 2005 and 2007. Assuming a relatively constant supply of vegetables in New York in 2008, coupled with higher prices, we expect that the 2008 vegetable crop will be worth more than $400 million.

2009 Outlook Handbook Page 10-7
M.I. Gómez and B.J. Rickard Specialty Crops
TABLE 10-5. COMMERCIAL VEGETABLE PRODUCTION
NEW YORK AND UNITED STATES
New York U.S. 2005 2006 2007 2005 2006 2007
Fresh ------ Thousand cwt ------ Sweet corn 2,679 3,216 3,300 27,023 26,690 28,234 Cabbage 4,606 4,620 5,796 24,275 24,823 25,824 Onions 3,808 4,224 4,428 50,459 51,487 57,836 Snap beans 300 587 554 5,541 6,365 6,465 Cucumbers 540 760 714 9,691 9,709 9,352 Tomatoes 360 400 432 38,268 36,800 37,032 Pumpkins 795 798 1152 10,756 10,340 11,164 Squash 796 756 731 8,334 9,224 7,888 Cauliflower 104 67 114 7,285 7,013 6,990 Processing ------ Thousand tons ------Sweet corn 116 115 - 3,175 3,086 2,897 Snap beans 69 74 - 819 786 768 Green peas 30 39 - 383 410 436 Cabbage 76 72 72 - - -
Sources: New York Agricultural Statistics, 2008; USDA Agricultural Statistics, 2008.
TABLE 10-6. FARM PRICES FOR COMMERCIAL VEGETABLES
NEW YORK AND UNITED STATES
New York U.S. 2005 2006 2007 2005 2006 2007
Fresh ------ Dollars per cwt ------Sweet corn 22.60 23.5 22.00 22.10 22.90 22.20 Cabbage 15.90 15.70 19.40 13.70 14.10 16.40 Onions 15.20 19.40 12.60 9.34 15.20 6.21 Snap beans 76.80 82.00 89.80 54.20 50.50 60.50 Cucumbers 28.30 34.70 34.30 23.00 25.30 24.40 Tomatoes 59.60 76.90 75.20 41.80 44.00 34.50 Pumpkins 27.60 23.60 19.70 9.64 9.89 10.50 Squash 36.60 37.40 38.90 25.70 24.20 28.80 Cauliflower 32.20 42.00 34.10 30.50 31.50 34.00 Processing ------ Dollars per ton ------ Sweet corn 80.40 77.30 - 68.40 66.80 81.80 Snap beans 186.00 204.00 - 140.00 157.00 169.00 Green peas 385.00 345.00 - 266.00 243.00 256.00 Cabbage 50.80 55.10 61.60 - - -
Sources: New York Agricultural Statistics, 2008; USDA Agricultural Statistics, 2008.

Page 10-8 2009 Outlook Handbook
Specialty Crops M.I. Gómez and B.J. Rickard
TABLE 10-7. VALUE OF COMMERCIAL VEGETABLE PRODUCTION
NEW YORK AND UNITED STATES
New York U.S. 2005 2006 2007 2005 2006 2007
Fresh ------ Million dollars ------ Sweet corn 60.5 75.6 72.6 597.2 611.2 626.8 Cabbage 73.2 72.5 112.4 332.6 350.0 423.5 Onions 57.9 81.9 55.8 471.3 782.6 359.2 Snap beans 23.0 48.1 49.7 300.3 321.4 391.1 Cucumbers 15.3 26.4 24.5 222.9 245.6 228.2 Tomatoes 21.5 30.8 32.5 1,599.6 1,619.2 1,277.6 Pumpkins 21.9 18.8 22.7 103.7 102.3 117.2 Squash 29.1 28.3 28.4 214.2 223.2 227.2 Cauliflower 3.3 2.8 3.9 222.2 220.9 237.7 Processing Sweet corn 9.3 8.9 - 217.2 206.1 237.0 Snap beans 12.8 15.1 - 114.7 123.4 129.8 Green peas 11.6 13.5 - 101.9 99.6 111.6 Cabbage 3.9 4.0 4.5 - - -
Sources: New York Agricultural Statistics, 2008; USDA Agricultural Statistics, 2008.
Similar to the ten-year projections discussed for selected fruit products in section 10.1, NFAPP also
provides ten-year outlooks for vegetable products that are important in the United States. Table 10-8 provides some of the key results from the NFAPP studies for summer storage onions, fall potatoes, and sweet corn. Production during the period between 2009 and 2011 will remain relatively constant for onions and sweet corn, yet is expected to rise for fall potatoes. In each case, grower and retail prices will be close to the five year average between 2002 and 2006, and expected prices in New York will be above national averages. The level of trade activity for summer storage onions is expected to increase over the next three years, however, actual trade patterns in the near term depend substantially on exchange rate movements.
Dr. Steven Reiners from the Department of Horticultural Sciences at the Agricultural Experiment
Station in Geneva summarizes 2008 as “overall, a very profitable year for vegetable growers”. Dr. Reiners points to the fact that high commodity prices led to contracts from vegetable processors this spring that were paying record prices. With the exception of some isolated hail, weather this summer was very good as were yields. On the input side, Dr. Reiners mentions that a dampened demand for oil (and for corn used to produce ethanol) will likely lead to lower crop prices (including vegetable prices) in 2009. Furthermore, the recent rise in the value of the U.S. dollar relative to the Canadian dollar is expected to renew competition between vegetable growers in New York State and Ontario. Lastly, New York State vegetable growers continue to be concerned about labor availability and fuel costs. Higher energy prices increased the cost of production and the cost of delivering produce to market, however, the overall impact will be felt more by firms exporting to New York rather than those producing and selling locally. A growing consumer demand for local produce and the negative impact of higher energy prices on imports should allow New York State vegetable growers to market a larger share of their products in the Northeast.

2009 Outlook Handbook Page 10-9
M.I. Gómez and B.J. Rickard Specialty Crops
TABLE 10-8. ECONOMIC OUTLOOK FOR SELECTED U.S. VEGETABLES
U.S. (unless noted otherwise) 2009 2010 2011
Summer Storage Onions Acres 167,171 167,909 169,165 Yield (cwt) 460 456 460 Production (thousand cwt) 76,902 76,591 77,736 U.S. grower price (dollars per cwt) 10.92 11.61 11.32 N.Y. grower price 14.17 15.06 14.68 Exports (thousand cwt) 5,581 5,507 5,484 Imports 7,319 7,626 7,534 Per capita consumption 20.2 20.4 20.7 Fall Potatoes Acres 1,017,500 1,018,200 1,019,300 Yield 388 394 399 Production 412,816 417,120 421,722 U.S. grower price 6.07 6.07 6.08 N.Y. grower price 8.89 8.88 8.90 Retail price (fresh) 0.58 0.61 0.63 Per capita consumption (fresh) 42.1 42.0 41.9 Per capita consumption (frozen) 54.2 54.0 53.9 Sweet corn Acres 396,800 393,800 391,400 Yield (tons) 7.6 7.7 7.7 Production (thousand tons) 2,860 2,853 2,847 U.S. grower price (dollars per ton) 67.95 67.70 67.69 N.Y. grower price 72.15 71.93 71.92 Frozen exports (thousand tons) 236 238 241 Frozen imports 846 854 861 Per capita consumption (frozen) 7.8 7.8 7.8 Canned exports (thousand tons) 248 242 235 Canned imports 297 287 277 Per capita consumption (canned) 6.3 6.1 5.9
Sources: National Food and Agricultural Policy Project, 2007.

Page 10-10 2009 Outlook Handbook
Specialty Crops M.I. Gómez and B.J. Rickard
10.3 Grapes and Wine
According National Agricultural Statistical Service, the 2008 New York grape crop is forecast to be 165 thousand tons, which is about 8% lower than last year’s production of 180 thousand tons. Climatic conditions impacted grape production in major producing regions across the state. Spring frost affected a considerable number of growers in the Lake Eire fruit region. There were reports of hail and disease during the production season. Earlier hail damage hurt production for some growers in the Finger Lakes, and heavy rains resulted in higher than normal disease incidence in Long Island. Nonetheless, the latest report from Veraison to Harvest from Cornell Cooperative Extension indicates that this year’s crop will be larger relative to 2007 driven mostly by higher yields, contrary to forecasts of 8% reduction made by New York Agricultural Statistics Service (NASS). The New York crop value has increased in the past four years from $32.1 million in 2004 to $49.2 million in 2007 (Figure 10-1). Crop values for 2008 are not available yet, but they may be slightly higher than 2007 crop values.
The National Agricultural Statistical Service forecasts a U.S. grape crop of 7.2 million tons in 2008, or 3% above the 2006 crop. California’s estimated grape crop is 3% larger than a year ago, driven primarily by increased utilization of wine and raisin grapes. NASS reports that grape prices have maintained high levels and grape exports have been reduced.
Source: New York Agricultural Statistics, 2008. Wine The U.S. wine industry continues it expansion driven by increased table wine consumption (Figure 10-2). This growth is due to a combination of supply and demand factors. According to the Wine Institute, many wine firms are starting to focus on direct sales, in particular after the favorable 2005 U.S. Supreme Court decision. Since then, at least nine states have opened to this direct channel, considerably expanding the ability of wine firms to reach consumers in the U.S. As a result, direct sales increased by more than 7% from 2006 to 2007. Demographic factors such as higher incomes and increasing wine consumption from specific
26.2
39.8 37.2
47.240.0 38.9
58.4
45.9 47.7 47.0
38.332.1
38.5 40.4
49.2
0
10
20
30
40
50
60
70
1993 1994 1995 1996 1997 1998 1999 2000 2001 2002 2003 2004 2005 2006 2007
Million Dollars
Year
FIGURE 10-1. VALUE OF UTILIZED PRODUCTION OF GRAPES, NEW YORK1993-2007

2009 Outlook Handbook Page 10-11
M.I. Gómez and B.J. Rickard Specialty Crops
ethnic groups (e.g., Hispanics) are also important drivers of industry growth. However, as the economy slows down, it is possible that innovations in supply arrangements play a more important role in the future expansion of the industry.
The U.S. is the largest wine market in the world. Compared to 2006, total sales of wine in the United States increased by 4% in 2007, yielding a total retail value of about $30 billion. According to a recent ACNielsen report, wine in food retail outlets continues to expand and grew 4% between 2006 and 2007. By volume, Chardonnay is the most purchased wine in retail outlets, followed by Cabernet Sauvignon, Merlot and White Zinfandel. These four wine types comprise nearly 50% of consumer expenditures in table wine. U.S. wine exports, which originate mostly from California, have increased by 12% between 2006 and 2007, and the fastest growing export market is Canada.
Source: Wine Institute; Department of Commerce; Gomberg, Fredrickson and Associates Grapes and Prices in New York State
Relative to 2007, grape prices were slightly up for native varieties, flat for French-American hybrids, and moderately lower for Vitis Vinifera (Table 10-9). Average listed prices for major native varieties such as Concord and Niagara increased by 6% and 1% between 2007 and 2008, respectively. In contrast, the average list price for Vitis Vinifera varieties dropped from $1,664 per ton in 2007 to $1,627 per ton in 2008, a reduction of about 2%. Nonetheless, the average price for Vitis Vinifera varieties in 2008 is higher than the 2004-2008 average. Prices for French-American hybrids remained mainly flat compared to 2007, with slight price increases for Aurore, Baco Noir, de Chaunac and Rougeon; moderate price declines were recorded for Cayuga White and Seyval Blanc.
Concords are the predominant variety grown and processed in New York (Table 10-10). There were 131,000 tons of Concords New York-grown grapes processed in 2007, up 20% from 2006 and above the 2003-2007 average. Over the past five years, Concords comprised 75% of total tonnage utilized in the state in 2007. The second leading variety is Niagara followed by Catawba. About one fifth of the total tonnage of Concord and Niagara grapes is used for wine production. Vitis Vinifera, with an average of 4,714 tons utilized over the past five years, accounted for 3% of the NY crush over the last five years. However, Vitis
464500 519 526 543 570 572
612643 668
703 717 745
0.0
100.0
200.0
300.0
400.0
500.0
600.0
700.0
800.0
1995 1996 1997 1998 1999 2000 2001 2002 2003 2004 2005 2006 2007
Mill
ion
Gal
lons
Year
Figure 10-2. TOTAL WINE CONSUMPTION, U.S. 1995-2007
Other Table

Page 10-12 2009 Outlook Handbook
Specialty Crops M.I. Gómez and B.J. Rickard
Vinifera production has increased substantially in the past two years, from 3.5 thousand tons in 205 to 35.8 thousand tons in 2007.
TABLE 10-9. GRAPES: PRICES PAID FOR NEW YORK GROWN GRAPES PROCESSED 2004-2008
Variety 2004 2005 2006 2007 2008 5-Year Avg. American Varieties Catawba 234 317 315 330 338 325 Concord 193 274 279 285 302 285 Delaware 338 365 380 378 389 378 Elvira 259 255 276 255 270 264 Ives 371 402 451 410 415 420 Niagara 231 310 320 329 333 323
French American Hybrid Aurore 279 345 358 380 381 366 Baco Noir 470 575 601 631 636 611 Cayuga White 375 574 596 632 622 606 de Chaunac 301 457 497 521 526 500 Rougeon 433 489 525 534 538 522 Seyval Blanc 388 584 600 627 625 609
Vitis Vinifera All varieties 1,295 1,616 1,442 1,664 1,627 1,587 Source: Cornell Cooperative Extension, 2008 (based on list prices paid by wineries in the Finger Lakes region).
TABLE 10-10. GRAPES: NEW YORK GROWNReceived By Wineries and Processing Plants, 2003-2007
Variety 2003 2004 2005 2006 2007 5-Year Avg. - - - - - - - - - - - - - - - - - - - - - - - - - tons - - - - - - - - - - - - - - - - - - - - - - - - - Concord 104,000 99,300 137,100 108,600 131,000 116,000 Niagara 18,000 19,800 18,000 18,500 21,000 19,060 Catawba 7,650 4,760 5,000 4,412 4,930 5,350 Elvira 5,250 5,000 5,025 3,820 4,810 4,781 Delaware 550 300 375 510 430 433 Aurora 3,620 2,225 1,600 3,300 2,480 2,645 de Chaunac 320 160 130 110 180 180 Baco Noir 1220 375 400 350 430 555 Seyval Blanc 480 425 430 650 430 483 Cayuga White 650 625 500 1,020 1,090 777 Rougeon 530 175 440 320 270 347 Vitis Vin.(all) 4,550 4,550 3,500 5,200 5,770 4,714 Other varieties 2,180 2,175 2,600 3,500 3,180 2,727 Total, all varieties 149,000 140,000 175,000 150,000 176,000 158,000 Source: New York Agricultural Statistics, 2008 Recent trends suggest that demand for grapes in NYS is driven by the continued presence of small wineries across the state. Growers selling to such wineries are likely to be in a stronger position relative to growers focusing on grapes for the juice market. The challenge for NYS grape growers is to identify

2009 Outlook Handbook Page 10-13
M.I. Gómez and B.J. Rickard Specialty Crops
appropriate product portfolios to seize market opportunities in the appropriate market channels. That is, growers focusing on grape juice should focus on strategies to be lowest-cost suppliers while growers selling to small winemakers should focus their production efforts on quality. Although the market for NYS table grapes has been traditionally small, increased consumer awareness of, and interest in, food that is locally grown is an interesting alternative for grape growers. Outlook
New York grapes are employed mostly in either wine of juice production, while a very small percentage is allocated to table grapes. According to USDA forecasts, the supply of U.S. grapes for winemakers will go up in 2008-2009. Wine grape production has increased primarily in California and Washington and this is likely to reduce grape farm prices. With a total of 7.84 billion pounds (3.92 million tons), the quantity of grapes utilized for wine production in 2007-2008 increased 5%, compared to the 2006-2007 season. Consequently, the average prices received by farmers were nearly 3% lower in 2008-2007 in comparison to 2006-2007.
Considering the grape fruit market, New York, Michigan and Washington produce over 85% of grapes employed by the juice industry. Forecasts for this year suggest that lower juice grape production in all three producing states will result in less juice for the processing sector in 2008-2009. Lower production, in turn, is likely to drive prices of varieties destined for juice production up. According to the Agricultural Marketing Service (USDA), the inverse relationship between prices and production typically holds for the grape juice sector. Beginning in 2002-2003, prices have been in the decline for four consecutive cropping seasons. As a result, juice grape prices achieved their lowest levels of $148 per ton in the 2005-2006 season, largely driven by a record-high grape production. Subsequently, prices went up to $192 per ton, as domestic production decreased and grape juice imports reached a record high. Official estimates of prices for the 2007/08 season do not exist; what is known is that U.S. grape production utilized by juice processors increased 39% from the previous year and imports increased dramatically to new record high.
Fresh-market grapes are expected to be in short supply for 2008-2009 and, consequently, their prices are likely to prices remain strong. This represents an opportunity for those growers that are able to develop marketing strategies for locally grown supply chains.
Table 10-11 shows forecasts for the period 2009- 2011 from the National Food and Agricultural Policy Project (NFAPP), prepared in 2007. According to NFAPP, total grape output will grow steadily driven primarily by increased acreage. The additional output is likely to be for wine and table grapes, as indicated by moderate increases in per capita consumption of these two items. The juice grape projections present a pretty stable outlook, perhaps due to the fact that the projections do not take into account the cycles that exist in the processing sector, as explained earlier.

Page 10-14 2009 Outlook Handbook
Specialty Crops M.I. Gómez and B.J. Rickard
TABLE 10-11. ECONOMIC OUTLOOK FOR GRAPES
U.S. (unless noted otherwise) 2009 2010 2011
Total Acres (1,000) 981 1,000 1,014 Yield (tons per acre) 7.5 7.6 7.6 Total U.S. Production (1,000 tons) 7,381 7,563 7,722 Total Production Outside California (1,000 tons) 144 148 153 Table Grapes Production (million pounds) 3,784 3.901 4,004 Farm Price (dollars per ton) 675 705 730 Retail Price (dollars per pound) 2.18 2.28 2.35 Exports (million pounds) 847 868 833 Imports (million pounds) 1,703 1,766 1,825 Per capita consumption (pounds) 9.6 9.8 10.0 Wine Production (million gallons) 826 840 855 Farm Price (dollars per ton) 609 629 653 Retail Price (dollars per gallon) 30.01 30.68 31.49 Exports (million gallons) 86 85 85 Imports (million gallons) 221 225 230 Per capita consumption (gallons) 2.4 2.4 2.5 Raisins Production (million pounds) 658 667 675 Farm Price (dollars per ton) 279 281 284 Retail Price (dollars per pound) 0.92 0.92 0.92 Exports (million pounds) 291 296 303 Imports (million pounds) 56 59 62 Per capita consumption (pounds) 4.5 4.5 4.5 Grape Juice Production (million gallons) 166 170 173 Farm Price (dollars per ton) 319 323 327 Retail Price (dollars per gallon) 4.5 4.5 4.6 Exports (million gallons) 28 29 30 Imports (million gallons) 166 170 173 Per capita consumption (gallons) 0.5 0.5 0.5
Sources: National Food and Agricultural Policy Project, 2007.

2009 Outlook Handbook Page 10-15
M.I. Gómez and B.J. Rickard Specialty Crops
10.4 Ornamentals
In 2007, the commercial sales value of New York floriculture production totaled $199 million, a 2% decrease from the year before, ranking New York 6th in the nation (Table 10-12). The number of commercial growers of floriculture products decreased to 698 in 2007 (Table 10-13). The open ground area used to produce floriculture crops in the state was 838 acres, down 11% from 2006, and greenhouse space decreased slightly to 24.2 million square feet in 2007. Nursery cash receipts increased by 15% from 2005 to 2006, but estimates for 2007 are not available. The total value of floriculture/nursery crops in New York increased by 7% during the period 2006-2007.
TABLE 10-12. GROWER CASH RECEIPTS OF FLORICULTURE AND NURSERY CROPS, NEW YORK, 2002-2007
2002 2003 2004 2005 2006 2007 --- Million dollars --- Floriculturea, b
186.9 194.9 183.0 200.6 203.5 199.0 Nurseryc 153.7 159.6 172.4 181.3 205.5 NA Floriculture and nursery crops 340.6 354.5 355.4 381.9 409.0 NA a Includes growers with $10,000 or more in floriculture sales. b Includes ornamental plants without woody stems, grouped into bedding/garden plants, cut cultivated greens, cut
flowers, potted flowering plants, indoor foliage plants, and propagative floriculture material. c Includes ornamental plants and trees with woody stems, including broadleaf evergreens, coniferous evergreens,
deciduous shade trees, deciduous flowering trees, deciduous shrubs and other ornamentals, fruit and nut plants for home use, cut and to-be-cut Christmas trees, and propagation material or lining-out stock. Also includes other ornamental crops not classified as floriculture.
NA Not available
Source: Floriculture and Nursery Crops Situation and Outlook Yearbook, Economic Research Service, USDA, various years.
TABLE 10-13. GROWING AREA FOR FLORICULTURE CROPS IN NEW
YORKa, 2002-2007
Year
Total greenhouse
cover
Shade and temporary
cover
Total covered
area
Covered area per grower
Open ground
Total covered &
open ground
-- 1,000 square feet -- --- acres --- 2003 24,154 696 24,850 76 1,058 1,629 2004 24,457 708 26,165 80 934 1,536 2005 24,743 573 25,320 80 800 1,382 2006 25,121 507 25,628 84 942 1,531 2007 24,231 613 24,848 85 838 1,409
a Includes operations with $10,000+ in annual floriculture sales. Crops include cut flowers, cut cultivated greens, potted flowering plants, potted foliage plants, bedding and garden plants, and propagative materials. Total may not add due to rounding.
p Preliminary.
Source: Floriculture Crops, NASS, USDA, various years.

Page 10-16 2009 Outlook Handbook
Specialty Crops M.I. Gómez and B.J. Rickard
An important distinction in floricultural production is the size of operation. The U.S. value of floriculture production was $4.1 billion in 2007, a 1.5% increase compared to 2006 (Table 10-14). The value of production for large growers increased by 2% whereas the value of production from small growers decreased by 4.3%. These statistics indicate that the industry continues in a process of concentration, with fewer operations in the market producing a large amount of products. At the national level, all floriculture crop groups experienced lower sales except cut flowers, herbaceous perennials, and cut cultivated greens, which together accounted for 27% of total grower sales in 2007. The value of production from small growers is larger in New York in comparison to the national market. Small growers’ share of production in New York is 10.9%, which is high compared to the 3.7% in the U.S. In New York, the value of production from small growers remained unchanged, while the value of production from large farms decreased slightly.
When reading the published U.S. floriculture and nursery crop statistics, it should be noted that only 15 states were surveyed by the USDA in 2006 and thereafter, compared to 36 states prior to 2006. Consequently, the 2002-2005 data in Table 10-15 were adjusted to include only the 15 states surveyed in 2006 and 2007 for comparison. The 15 states selected in the USDA survey accounted for about 75 percent of cash receipts received by greenhouse and nursery crop farmers in 2007. In 2007, bedding and garden plants continued to top the list of floriculture commodity categories in New York, and sales by operations with $100,000 or more annual sales increased 2.4% to $110.2 million from the year before (Table 10-15). Potted flowering plants were second with sales valued at $41.1 million, a reduction of 15.3% in comparison to 2006. The value of New York cut flower products in 2007 was up from 2006 but in line with the average value of production experienced between 2002 and 2006 (valued at $4.2 million). The wholesale value of foliage plants in New York was $3.3 million in 2006, a decrease of 35.3% from 2006. The value of production from operations with annual sales between $10,000 and $99,999 increased slightly. Overall, the total value of production in 2007 was 2% higher than the five-year average.
TABLE 10-14. WHOLESALE VALUES OF FLORICULTURE PRODUCTION,
BY GROWER SIZEa, NEW YORK AND UNITED STATES, 2005-2007b
New York U.S. 2005 2006 2007 2005 2006 2007
------ Million dollars ------Small growers 22.5 21.7 21.8 94.9 160.7 153.5 Large growers 178.1 181.8 177.4 4,052.7 3,866.5 3,941.8 All growers 200.6 203.5 199.2 4,147.6 4,027.2 4,095.6 a Small growers have between $10,000 and $100,000 in annual floriculture sales; large growers have at least $100,000. b Wholesale value of sales of growers with at least $10,000 in annual floriculture sales. Growers are located in the 36 surveyed states. p Preliminary.
Source: Floriculture Crop, National Agricultural Statistic Service (NASS), USDA, 2008.

2009 Outlook Handbook Page 10-17
M.I. Gómez and B.J. Rickard Specialty Crops
TABLE 10-15. VALUE OF FLORICULTURE PRODUCTION BY PLANT CATEGORY,
NEW YORK, 2002-2007
2002 2003 2004 2005 2006 2007 5-yr. avg.
2002-2007
2007 vs.
5-yr. avg.
2007 vs.
2006 --- Million dollars --- % % Bedding/garden
plantsa 99.3 107.5 101.1 110.0 107.6 110.2 106.0 -4 -1.5 Potted flowering
plantsa 47.9 43.1 40.2 49.9 48.9 41.1 45.2 -9 -15.9 Cut flowersa
5.6 5.0 4.7 2.7 2.9 4.2 4.2 0 44.9 Foliage Plantsa
3.9 4.1 3.5 3.1 5.1 3.3 3.8 -13 -35.2 Propagative materialsa 5.4 9.0 8.2 12.3 17.4 18.3 11.8 58 5.2 Grower sales
$10,000-$99,999 (Unspecified crops) 25.0 26.3 25.3 22.6 21.6 22.1 23.8 -7 2.3
Totalb 186.9 194.9 183.0 200.6 203.5 199.2 194.7 2 -2.1 a Sales by operations with annual sales of $100,000 or more. b Total reported crops includes categories not listed – cut cultivated greens and propagative materials. p Preliminary. Source: Floriculture and Nursery Crops, Situation and Outlook Yearbook, Economic Research Service, USDA, various years.
Outlook
According to industry executives, higher freight costs (largely by air), higher energy and fertilizer costs, plus the depreciation of the U.S. dollar resulted in higher import prices. That helped U.S. growers to be more competitive in the global market. However, the ornamental industry growth could be hampered by higher energy costs and housing market slowdowns in 2009. According to Professor Nina Bassuk, various municipalities have plans in place to plant more street trees as a strategy to reduce energy use, decrease storm water runoff and store carbon. Nonetheless, with the uncertainties about the economy these plans may have to be revised. While well-managed firms will weather tighter profits, smaller firms could face exit or consolidation. Service-oriented firms, like landscapers and retail centers, however, may be better positioned for strong sales growth in 2009.
Over the past few years, homeowners have developed different attitudes about gardening activities. Much of this is related to shifting demographic dynamics, such as the aging baby boomer generation and a younger homeowner who has different ideas about how to spend discretionary income. The Baby Boomers have been the driving force behind the huge growth in gardening activities over past decades. Now, as the leading edge of this generation approaches 60, these former do-it-yourself gardeners have become more service-focused. Dollars that used to be spent at the local garden center have been reallocated to the lawn and garden service segment such as lawn and landscaping companies. Homeowners in the 25-40 age brackets seem more interested in using available discretionary dollars for activities other than gardening, such as travel or other leisure-related activities.
In the near future, households are likely to commit less discretionary expenditure at local garden centers. Business models need to be re-examined in order to remain competitive in a changing industry environment. First, the industry should find ways to expand services that appeal to a service-oriented

Page 10-18 2009 Outlook Handbook
Specialty Crops M.I. Gómez and B.J. Rickard
generation. Second, retailers must target new groups of consumers, such as first-time homebuyers, condominium dwellers or the ethnic consumer. Third, retailers must recognize they can no longer expect the same kind of robust growth they experienced in the past.
