new york city’s meal gap 2016 trends report york city’s meal gap 2016 trends report prepared by:...
TRANSCRIPT

New York City’s Meal Gap
2016 Trends Report

PREPARED BY: Triada Stampas, Vice President for Research & Public Affairs William Guillaume Koible, Research Coordinator
foodbanknyc.org 1
What Is the Meal Gap? Food security is an indicator of whether, within a household, all household members have access to adequate, healthy food at all times. The United States Department of Agriculture (USDA) measures household food security every year, in partnership with the U.S. Census, through an 18-item survey.1 Based on their responses to those 18 questions, households are grouped into one of three categories: food security; low food security (characterized by reduced quality, variety or desirability of food); and very low food security (evidence of disrupted eating patterns and reduced food intake). Households are classified as food insecure if they fall into the second or third group.2 Food insecurity indicates a lack of access, at times, to enough food for an active, healthy life for all household members, and limited or uncertain availability of nutritionally adequate foods. In the United States, food insecurity is primarily a function of insufficient financial resources for food. The Meal Gap represents food insecurity as a number of missing meals that result from insufficient household resources to purchase food.3 In short, the Meal Gap is the difference, measured in meals, between a household being food insecure and food secure. Because it accounts for variation in food costs across the country, it provides a clearer illustration of the effects of resource shortfalls in households experiencing food insecurity. As a metric, the Meal Gap is therefore highly useful to policymakers, advocates and service providers because it can estimate food insecurity at various geographies: from the state level down to the county level, and even, in New York City, the community district or neighborhood level. Because the Meal Gap can be mapped, it shows us where hunger lives, helping public and private anti-hunger efforts direct food and services to communities where need is highest. The City of New York adopted the Meal Gap as its official metric of food insecurity in 2014.4 The Meal Gap also creates a common metric – the meal – against which both food and non-food interventions can be measured. For example, Food Bank For New York City supplies food for approximately 63 million meals every year, but also connects eligible New Yorkers to the Supplemental Nutrition Assistance Program (SNAP, formerly known as food stamps), which provides an average benefit of $147 per person – enough for 43 meals – every month.
1 “U.S. Household Food Security Survey Module: Three-Stage Design, With Screeners.” United States Department of Agriculture, 2012. 2 “Definitions of Food Security.” United States Department of Agriculture, 2014. A fourth category, “marginal food
security,” is sometimes used to identify households at or very near the threshold between food security and food insecurity. 3 Gundersen, C., A. Dewey, A. Crumbaugh, M. Kato & E. Engelhard. Map the Meal Gap 2016: Food Insecurity and Child Food Insecurity Estimates at the County Level. Feeding America, 2016. 4 New York City Food Policy: 2014 Food Metrics Report. http://www1.nyc.gov/assets/foodpolicy/downloads/pdf/2014-food-metrics-report.pdf (accessed September 6, 2016).
foodbanknyc.org 2
What Does the Meal Gap Look Like in New York City?
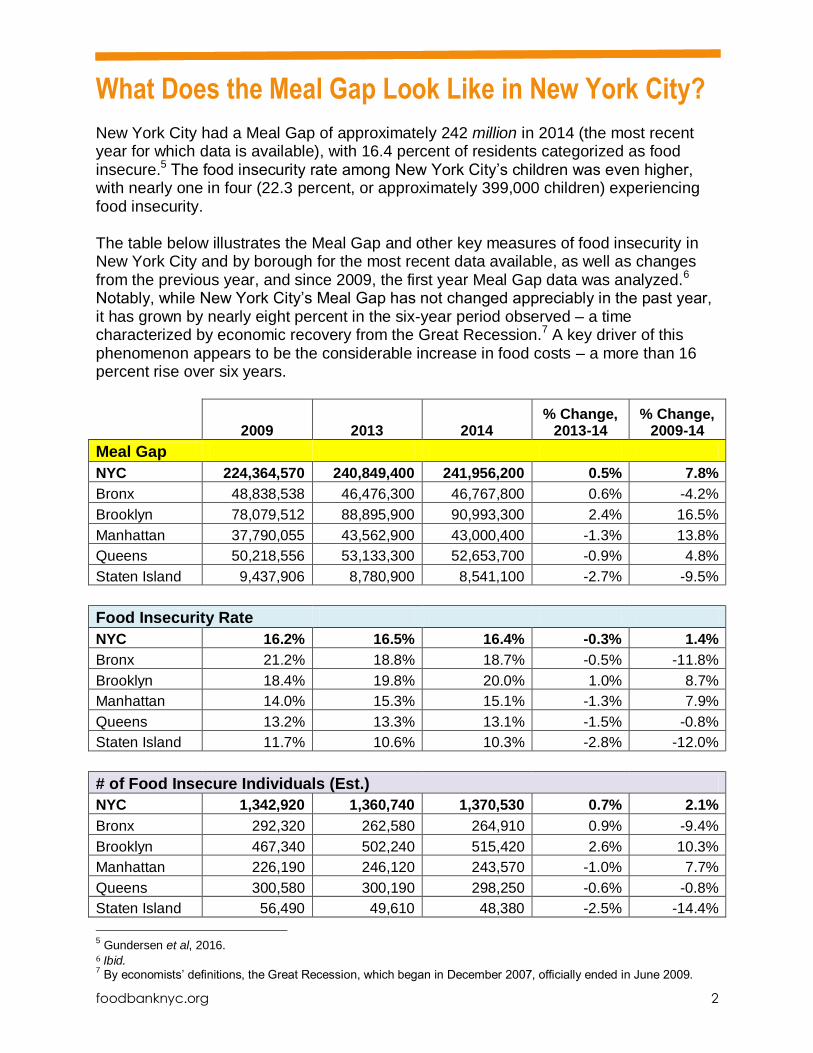
New York City had a Meal Gap of approximately 242 million in 2014 (the most recent year for which data is available), with 16.4 percent of residents categorized as food insecure.5 The food insecurity rate among New York City’s children was even higher, with nearly one in four (22.3 percent, or approximately 399,000 children) experiencing food insecurity. The table below illustrates the Meal Gap and other key measures of food insecurity in New York City and by borough for the most recent data available, as well as changes from the previous year, and since 2009, the first year Meal Gap data was analyzed.6 Notably, while New York City’s Meal Gap has not changed appreciably in the past year, it has grown by nearly eight percent in the six-year period observed – a time characterized by economic recovery from the Great Recession.7 A key driver of this phenomenon appears to be the considerable increase in food costs – a more than 16 percent rise over six years.
2009 2013 2014 % Change,
2013-14 % Change,
2009-14
Meal Gap
NYC 224,364,570 240,849,400 241,956,200 0.5% 7.8%
Bronx 48,838,538 46,476,300 46,767,800 0.6% -4.2%
Brooklyn 78,079,512 88,895,900 90,993,300 2.4% 16.5%
Manhattan 37,790,055 43,562,900 43,000,400 -1.3% 13.8%
Queens 50,218,556 53,133,300 52,653,700 -0.9% 4.8%
Staten Island 9,437,906 8,780,900 8,541,100 -2.7% -9.5%
Food Insecurity Rate
NYC 16.2% 16.5% 16.4% -0.3% 1.4%
Bronx 21.2% 18.8% 18.7% -0.5% -11.8%
Brooklyn 18.4% 19.8% 20.0% 1.0% 8.7%
Manhattan 14.0% 15.3% 15.1% -1.3% 7.9%
Queens 13.2% 13.3% 13.1% -1.5% -0.8%
Staten Island 11.7% 10.6% 10.3% -2.8% -12.0%
# of Food Insecure Individuals (Est.)
NYC 1,342,920 1,360,740 1,370,530 0.7% 2.1%
Bronx 292,320 262,580 264,910 0.9% -9.4%
Brooklyn 467,340 502,240 515,420 2.6% 10.3%
Manhattan 226,190 246,120 243,570 -1.0% 7.7%
Queens 300,580 300,190 298,250 -0.6% -0.8%
Staten Island 56,490 49,610 48,380 -2.5% -14.4%
5 Gundersen et al, 2016.
6 Ibid. 7 By economists’ definitions, the Great Recession, which began in December 2007, officially ended in June 2009.
foodbanknyc.org 3
2009 2013 2014 % Change,
2013-14 % Change,
2009-14
Weighted Cost per Meal
NYC $ 2.91 $ 3.26 $ 3.38 3.8% 16.4%
Bronx $ 2.71 $ 3.13 $ 3.32 6.1% 22.4%
Brooklyn $ 2.63 $ 3.13 $ 3.23 3.2% 22.7%
Manhattan $ 3.72 $ 4.37 $ 4.58 4.8% 23.0%
Queens $ 2.79 $ 3.06 $ 3.17 3.6% 13.8%
Staten Island $ 2.77 $ 3.19 $ 3.33 4.4% 20.1%
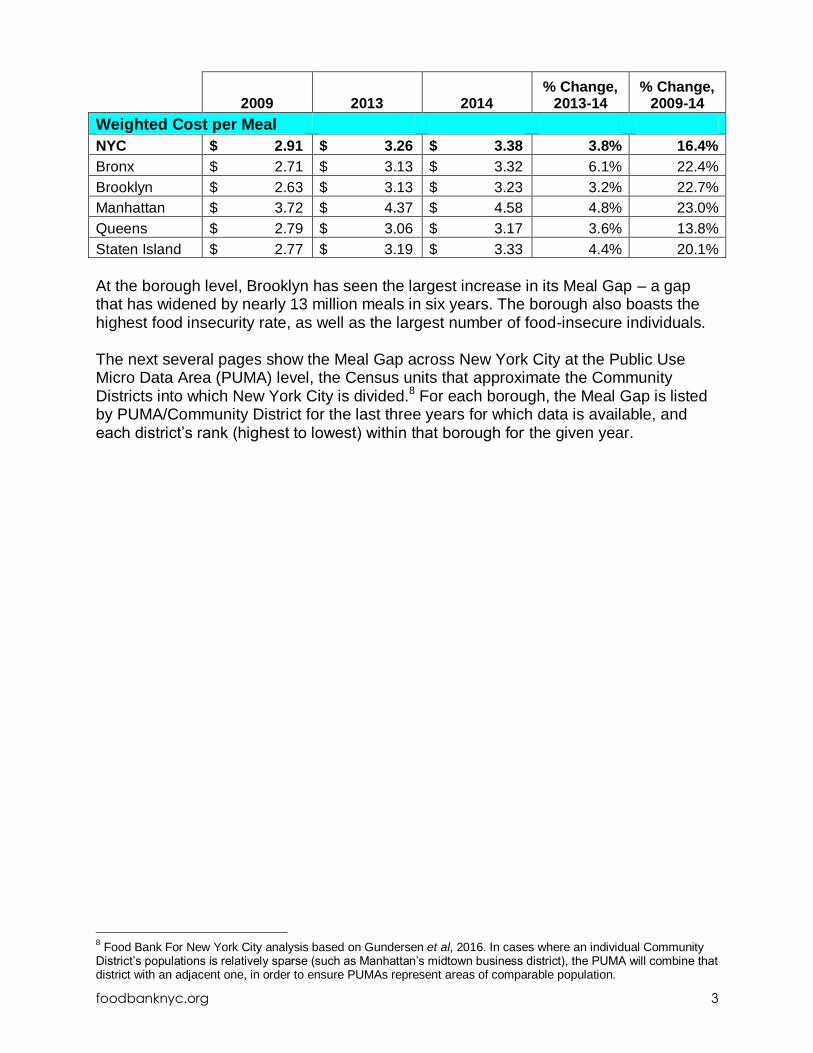
At the borough level, Brooklyn has seen the largest increase in its Meal Gap – a gap that has widened by nearly 13 million meals in six years. The borough also boasts the highest food insecurity rate, as well as the largest number of food-insecure individuals. The next several pages show the Meal Gap across New York City at the Public Use Micro Data Area (PUMA) level, the Census units that approximate the Community Districts into which New York City is divided.8 For each borough, the Meal Gap is listed by PUMA/Community District for the last three years for which data is available, and each district’s rank (highest to lowest) within that borough for the given year.
8 Food Bank For New York City analysis based on Gundersen et al, 2016. In cases where an individual Community
District’s populations is relatively sparse (such as Manhattan’s midtown business district), the PUMA will combine that district with an adjacent one, in order to ensure PUMAs represent areas of comparable population.

foodbanknyc.org 4
New York City’s Meal Gap by Community District

foodbanknyc.org 5
The Bronx
Community District(s) 2012 Meal Gap
(Number/Rank)
2013 Meal Gap
(Number/Rank)
2014 Meal Gap
(Number/Rank)
Change, 2013-14
Change, 2012-14
Bronx Community Districts 1 & 2: Hunts Point, Longwood & Melrose
7,016,611 5,788,676 5,637,546 -151,130 -1,379,065
2 2 4 -3% -20%
Bronx Community Districts 3 & 6: Belmont, Crotona Park East & East Tremont
7,552,253 6,386,901 6,700,229 313,328 -852,024
1 1 1 5% -11%
Bronx Community District 4: Concourse, Highbridge & Mount Eden
6,169,139 5,107,135 5,126,873 19,738 -1,042,266
4 6 5 0% -17%
Bronx Community District 5: Morris Heights, Fordham South & Mount Hope
6,293,361 5,276,449 5,105,643 -170,806 -1,187,718
3 5 6 -3% -19%
Bronx Community District 7: Bedford Park, Fordham North & Norwood
4,774,531 3,978,990 3,808,397 -170,593 -966,134
7 7 7 -4% -20%
Bronx Community District 8: Riverdale, Fieldston & Kingsbridge
2,815,584 2,433,796 2,448,908 15,112 -366,676
10 10 10 1% -13%
Bronx Community District 9: Castle Hill, Clason Point & Parkchester
6,120,933 5,596,070 5,667,139 71,069 -453,794
5 4 3 1% -7%
Bronx Community District 10: Co-op City, Pelham Bay & Schuylerville
3,045,671 2,834,925 2,890,426 55,501 -155,245
9 9 9 2% -5%
Bronx Community District 11: Pelham Parkway, Morris Park & Laconia
3,930,026 3,446,205 3,532,469 86,264 -397,557
8 8 8 3% -10%
Bronx Community District 12: Wakefield, Williamsbridge & Woodlawn
6,056,245 5,627,151 5,850,169 223,018 -206,076
6 3 2 4% -3%
Totals 53,774,356 46,476,300 46,767,800 291,500 -7,006,556
Note: Due to rounding error, the sums of the Meal Gaps by community district may not equal the borough totals.

foodbanknyc.org 6
Brooklyn
Community District(s) 2012 Meal Gap
(Number/Rank)
2013 Meal Gap
(Number/Rank)
2014 Meal Gap
(Number/Rank)
Change, 2013-14
Change, 2012-14
Brooklyn Community District 1: Greenpoint & Williamsburg
4,473,881 4,405,189 4,230,546 -174,643 -243,335
12 11 12 -4% -5%
Brooklyn Community District 2: Brooklyn Heights & Fort Greene
3,860,880 3,911,824 3,995,959 84,135 135,079
14 14 13 2% 3%
Brooklyn Community District 3: Bedford-Stuyvesant
6,353,787 6,483,486 6,831,068 347,582 477,281
2 2 3 5% 8%
Brooklyn Community District 4: Bushwick
4,612,234 4,132,580 4,269,443 136,863 -342,791
11 13 11 3% -7%
Brooklyn Community District 5: East New York & Starrett City
6,372,279 6,149,149 6,373,047 223,898 768
1 5 5 4% 0%
Brooklyn Community District 6: Park Slope, Carroll Gardens & Red Hook
2,476,748 2,396,421 2,155,509 -240,912 -321,239
18 18 18 -10% -13%
Brooklyn Community District 7: Sunset Park & Windsor Terrace
4,355,595 4,141,288 3,830,870 -310,418 -524,725
13 12 15 -7% -12%
Brooklyn Community District 8: Crown Heights North & Prospect Heights
5,572,643 5,652,124 5,898,863 246,739 326,220
7 7 6 4% 6%
Brooklyn Community District 9: Crown Heights South, Prospect Lefferts & Wingate
5,500,676 5,490,639 5,857,514 366,875 356,838
8 8 8 7% 6%
Brooklyn Community District 10: Bay Ridge & Dyker Heights
3,162,481 3,389,452 3,260,522 -128,930 98,041
17 17 17 -4% 3%
Brooklyn Community District 11: Bensonhurst & Bath Beach
4,770,935 5,044,853 4,955,978 -88,875 185,043
10 10 10 -2% 4%
Brooklyn Community District 12: Borough Park, Kensington & Ocean Parkway
5,074,588 5,256,714 5,046,774 -209,940 -27,814
9 9 9 -4% -1%
Brooklyn Community District 13: Brighton Beach & Coney Island
3,688,754 3,794,759 3,798,001 3,242 109,247
15 16 16 0% 3%

foodbanknyc.org 7
Community District(s) 2012 Meal Gap (Number/Rank)
2013 Meal Gap (Number/Rank)
2014 Meal Gap
(Number/Rank)
Change, 2013-14
Change, 2012-14
Brooklyn Community District 14: Flatbush & Midwood
5,729,884 5,812,747 5,873,204 60,457 143,320
6 6 7 1% 3%
Brooklyn Community District 15: Sheepshead Bay, Gerritsen Beach & Homecrest
3,491,434 3,876,558 3,865,084 -11,474 373,650
16 15 14 0% 11%
Brooklyn Community District 16: Brownsville & Ocean Hill
6,252,176 6,235,505 6,890,757 655,252 638,581
4 3 2 11% 10%
Brooklyn Community District 17: East Flatbush, Farragut & Rugby
6,077,495 6,208,186 6,616,561 408,375 539,066
5 4 4 7% 9%
Brooklyn Community District 18: Canarsie & Flatlands
6,332,043 6,514,425 7,243,599 729,174 911,556
3 1 1 11% 14%
Brooklyn Totals 88,158,512 88,895,900 90,993,300 2,097,400 2,834,788
Note: Due to rounding error, the sums of the Meal Gaps by community district may not equal the borough totals.
foodbanknyc.org 8
Manhattan
Community District(s) 2012 Meal Gap
(Number/Rank)
2013 Meal Gap
(Number/Rank)
2014 Meal Gap
(Number/Rank)
Change, 2013-14
Change, 2012-14
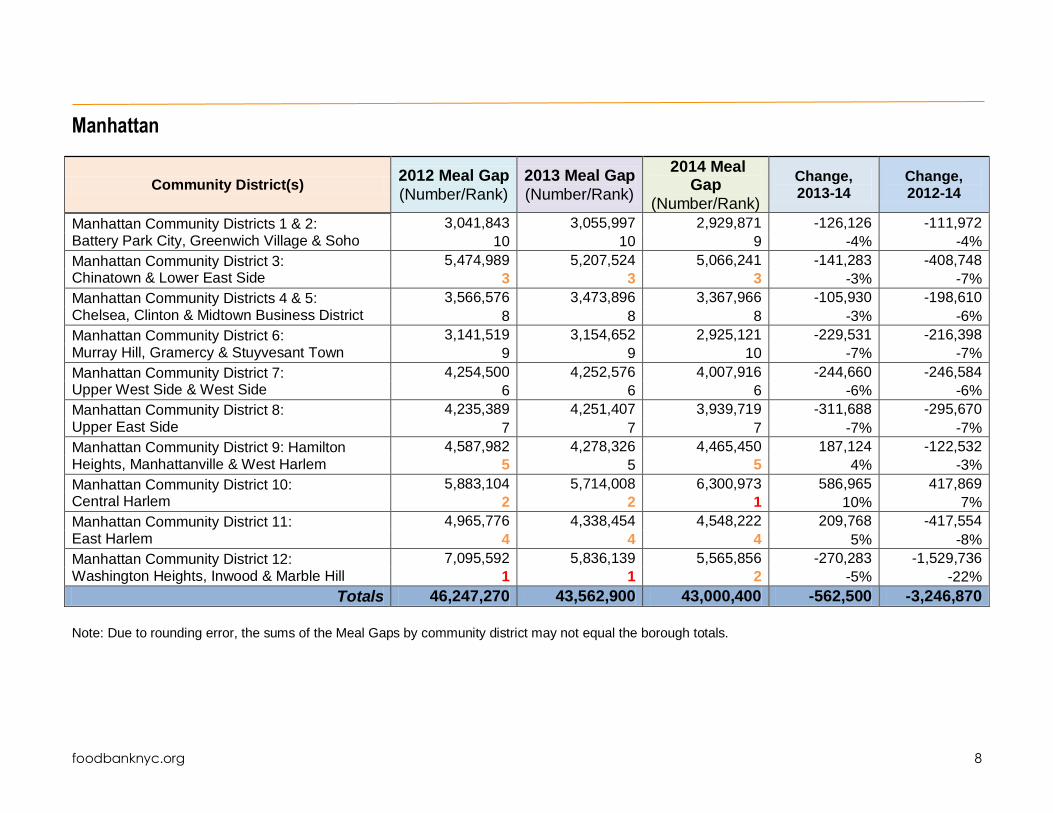
Manhattan Community Districts 1 & 2: Battery Park City, Greenwich Village & Soho
3,041,843 3,055,997 2,929,871 -126,126 -111,972
10 10 9 -4% -4%
Manhattan Community District 3: Chinatown & Lower East Side
5,474,989 5,207,524 5,066,241 -141,283 -408,748
3 3 3 -3% -7%
Manhattan Community Districts 4 & 5: Chelsea, Clinton & Midtown Business District
3,566,576 3,473,896 3,367,966 -105,930 -198,610
8 8 8 -3% -6%
Manhattan Community District 6: Murray Hill, Gramercy & Stuyvesant Town
3,141,519 3,154,652 2,925,121 -229,531 -216,398
9 9 10 -7% -7%
Manhattan Community District 7: Upper West Side & West Side
4,254,500 4,252,576 4,007,916 -244,660 -246,584
6 6 6 -6% -6%
Manhattan Community District 8: Upper East Side
4,235,389 4,251,407 3,939,719 -311,688 -295,670
7 7 7 -7% -7%
Manhattan Community District 9: Hamilton Heights, Manhattanville & West Harlem
4,587,982 4,278,326 4,465,450 187,124 -122,532
5 5 5 4% -3%
Manhattan Community District 10: Central Harlem
5,883,104 5,714,008 6,300,973 586,965 417,869
2 2 1 10% 7%
Manhattan Community District 11: East Harlem
4,965,776 4,338,454 4,548,222 209,768 -417,554
4 4 4 5% -8%
Manhattan Community District 12: Washington Heights, Inwood & Marble Hill
7,095,592 5,836,139 5,565,856 -270,283 -1,529,736
1 1 2 -5% -22%
Totals 46,247,270 43,562,900 43,000,400 -562,500 -3,246,870
Note: Due to rounding error, the sums of the Meal Gaps by community district may not equal the borough totals.

foodbanknyc.org 9
Queens
Community District(s) 2012 Meal Gap
(Number/Rank)
2013 Meal Gap
(Number/Rank)
2014 Meal Gap
(Number/Rank)
Change, 2013-14
Change, 2012-14
Queens Community District 1: Astoria & Long Island City
4,953,217 4,713,362 4,755,505 42,143 -197,712
4 4 4 1% -4%
Queens Community District 2: Sunnyside & Woodside
2,961,271 2,638,241 2,661,962 23,721 -299,309
11 12 12 1% -10%
Queens Community District 3: Jackson Heights & North Corona
3,913,388 2,857,220 2,715,853 -141,367 -1,197,535
6 10 11 -5% -31%
Queens Community District 4: Elmhurst & South Corona
3,487,699 2,924,943 2,851,549 -73,394 -636,150
8 8 9 -3% -18%
Queens Community District 5: Ridgewood, Glendale & Middle Village
3,433,215 3,164,857 2,929,390 -235,467 -503,825
9 7 7 -7% -15%
Queens Community District 6: Forest Hills & Rego Park
2,301,607 2,327,074 2,240,495 -86,579 -61,112
13 13 13 -4% -3%
Queens Community District 7: Flushing, Murray Hill & Whitestone
5,813,568 5,775,432 5,543,537 -231,895 -270,031
2 2 3 -4% -5%
Queens Community District 8: Briarwood, Fresh Meadows & Hillcrest
3,863,023 3,936,672 3,992,143 55,471 129,120
7 5 5 1% 3%
Queens Community District 9: Richmond Hill & Woodhaven
3,393,088 2,895,683 2,810,093 -85,590 -582,995
10 9 10 -3% -17%
Queens Community District 10: Howard Beach & Ozone Park
2,732,320 2,740,369 2,924,411 184,042 192,091
12 11 8 7% 7%
Queens Community District 11: Bayside, Douglaston & Little Neck
1,829,994 1,957,428 1,819,042 -138,386 -10,952
14 14 14 -7% -1%
Queens Community District 12: Jamaica, Hollis & St. Albans
8,433,639 8,352,412 9,464,831 1,112,419 1,031,192
1 1 1 13% 12%
Queens Community District 13: Queens Village, Cambria Heights & Rosedale
5,069,417 5,069,873 5,682,579 612,706 613,162
3 3 2 12% 12%

foodbanknyc.org 10
Community District(s) 2012 Meal Gap (Number/Rank)
2013 Meal Gap (Number/Rank)
2014 Meal Gap
(Number/Rank)
Change, 2013-14
Change, 2012-14
Queens Community District 14: Far Rockaway, Breezy Point & Broad Channel
3,984,438 3,779,785 3,963,909 184,124 -20,529
5 6 6 5% -1%
Totals 56,169,885 53,133,300 52,653,700 -479,600 -3,516,185
Note: Due to rounding error, the sums of the Meal Gaps by community district may not equal the borough totals.

foodbanknyc.org 11
Staten Island
Community District(s) 2012 Meal Gap
(Number/Rank)
2013 Meal Gap
(Number/Rank)
2014 Meal Gap
(Number/Rank)
Change, 2013-14
Change, 2012-14
Staten Island Community District 1: Port Richmond, Stapleton & Mariner's Harbor
4,237,335 4,316,053 4,256,215 -59,838 18,880
1 1 1 -1% 0%
Staten Island Community District 2: New Springville & South Beach
1,897,753 2,220,292 2,119,272 -101,020 221,519
2 3 3 -5% 12%
Staten Island Community District 3: Tottenville, Great Kills & Annadale
1,856,733 2,244,573 2,244,509 -64 387,776
3 2 2 0% 21%
Totals 7,991,821 8,780,900 8,541,100 -239,800 549,279
Note: Due to rounding error, the sums of the Meal Gaps by community district may not equal the borough totals.

About Food Bank For New York City
Food Bank For New York City has been the city’s major hunger-relief organization working to end hunger throughout the
five boroughs for more than 30 years. Nearly one in five New Yorkers relies on Food Bank for food and other resources.
Food Bank takes a strategic, multifaceted approach that provides meals and builds capacity in the neediest
communities, while raising awareness and engagement among all New Yorkers. Through its network of more than 1,000
charities and schools citywide, Food Bank provides food for approximately 63 million free meals per year for New
Yorkers in need. Food Bank For New York City’s income support services, including food stamps (also known as SNAP)
and free tax assistance for the working poor, put more than $150 million each year into the pockets of New Yorkers,
helping them to afford food and achieve greater dignity and independence. In addition, Food Bank’s nutrition education
programs and services empower more than 45,000 children, teens and adults to sustain a healthy diet on a low
budget. Working toward long-term solutions to food poverty, Food Bank develops policy and conducts research to
inform community and government efforts. Learn how you can help at foodbanknyc.org.
Board of Directors
CHAIR, Rev. Henry Belin
VICE CHAIR, Gloria Pitagorsky
TREASURER, Arthur J. Stainman
SECRETARY, John F. Fritts, Esq.
Mario Batali Michael Smith
Kevin Frisz Lary Stromfeld
Seraina Macia Stanley Tucci
Nicholas Poitevin Rev. Michael Walrond
Lee Schrager Robert Weinmann
Margarette Purvis
President and CEO
Food Bank For New York City
Main Office 39 Broadway, 10th Floor, New York, NY 10006 t: 212.566.7855 | f: 212.566.1463
Warehouse / Distribution Center Hunts Point Cooperative Market 355 Food Center Drive, Bronx, NY 10474 t: 718.991.4300 | f: 718.893.3442
Community Kitchen & Food Pantry 252 West 116th Street, New York, NY 10026 t: 212.566.7855 | f: 212.662.1945