new yor k s tate asthma s urveillance summa ry repo rt yor k s tate asthma s urveillance summa ry...
TRANSCRIPT

Public Health Information GroupCenter for Community HealthNew York State Department of Health
New York State
Asthma Surveillance
Summary Report
October 2013

1
1. IntroductionAsthma Surveillance in New York StateSummary of Indicators and Data Sources in This Report
2. Executive Summary
3. New York State Department of Health Asthma Plan and Asthma InitiativesOverview
4. Tracking Healthy People 2020 Asthma-Specific Objectives in New York StateAsthma Emergency Department VisitsAsthma Hospital DischargesAsthma Mortality
5. Asthma Survey DataHighlightsBehavioral Risk Factor Surveillance System, 2002-2011Youth Tobacco Survey, 2012
6. Asthma Emergency Department VisitsHighlightsTrends in Asthma Emergency Department VisitsAsthma Emergency Department Visits by Socio-demographic CharacteristicsAsthma Emergency Department Visit Rates by CountyAsthma Emergency Department Visit Rates by ZIP Code for CountiesAt-risk Based Rates for Asthma Emergency Department Visits
7. Asthma Hospital DischargesHighlightsTrends in Asthma Hospital DischargesAsthma Hospital Discharges by Socio-demographic CharacteristicsAsthma Hospital Discharge Rates by CountyAsthma Hospital Discharge Rates by ZIP Code for CountiesAt-risk Based Rates for Asthma Hospital Discharges
8. Asthma DeathsHighlightsTrends in Asthma DeathsAsthma Deaths by Socio-demographic CharacteristicsAsthma Deaths Rates by CountyAt-risk Based Rates for Asthma Deaths
121314
16
2525
31313232
33333548
56565963727880
88889094
103108110
118118120121122127
Table of Contents

2
9. Program-Based Asthma SurveillanceHighlightsNew York State Medicaid PopulationAsthma Universe Prevalence Among the Medicaid Managed Care PopulationPersistent Asthma Prevalence Among the Medicaid Managed Care PopulationUtilization of Health Services by the Medicaid Managed Care Asthma Universe PopulationAsthma Universe Prevalence Among the Child Health Plus PopulationPersistent Asthma Prevalence Among the Child Health Plus PopulationUtilization of Health Services by the Child Health Plus Asthma Universe PopulationManaged Care Quality Assurance Reporting Requirement Asthma-Specific IndicatorsPrevention Quality Indicators and Pediatric Quality Indicators for the Medicaid Managed Care Asthma Universe Population
10. Work-Related AsthmaHighlightsWork-Related Asthma Emergency Department VisitsWork-Related Asthma Hospital DischargesWork-Related Asthma Incidence – New York State Occupational Health Clinic NetworkWork-Related Asthma Incidence – New York State Occupational Lung Disease Registry
11. Asthma CostsHighlightsAsthma Hospitalization CostsAsthma Medicaid Managed Care Costs
12. Asthma and the EnvironmentHighlightsNew York State Building Condition SurveyOutdoor Air QualityPollen
References
AppendicesAppendix 1: Glossary of TermsAppendix 2: Technical Notes
Acknowledgments
133134139140148155162168173178185
189189190192 197199
201201202214
222223224229236
242
245246249
250

3
List of Figures
Figure 1-1The Asthma Surveillance Pyramid
Figure 5-1Prevalence of Current Asthma Among Adults (18+ Years), New York State, BRFSS, 2002-2011
Figure 5-2Prevalence of Current Asthma Among Adults (18+ Years) by Region and Combined Survey Years,New York State, BRFSS, 2003-2011
Figure 5-3Prevalence of Current Asthma Among Adults (18+Years) by Age Group and Combined Survey Years, New York State, BRFSS, 2003-2011
Figure 5-4Prevalence of Current Asthma Among Adults (18+ Years) by Gender and Combined Survey Years,New York State, BRFSS, 2003-2011
Figure 5-5Prevalence of Current Asthma Among Adults (18+ Years) by Race/Ethnicity and CombinedSurvey Years, New York State, BRFSS, 2003-2011
Figure 5-6Prevalence of Current Asthma Among Adults (18+ Years) by Educational Attainment and CombinedSurvey Years, New York State, BRFSS, 2003-2011
Figure 5-7Prevalence of Current Asthma Among Adults (18+ Years) by Household Income and CombinedSurvey Years, New York State, BRFSS, 2003-2011
Figure 5-8Percent of Adult (18+ Years) New Yorkers WhoCurrently Smoke by Asthma Status and CombinedSurvey Years, New York State, BRFSS, 2003-2011
Figure 5-9Percent of Adult (18+ Years) New Yorkers Who HaveNot Participated in Recent Leisure Time PhysicalActivity by Asthma Status and Combined SurveyYears, New York State, BRFSS, 2003-2011
13
36
37
38
39
40
41
42
43
44
Figure 5-10Percent of Adult (18+ Years) New Yorkers Who Are Obese by Asthma Status and Combined SurveyYears, New York State, BRFSS, 2003-2011
Figure 5-11Prevalence of Current Asthma Among Children (0-17 Years) by Age Group, Gender and Region,New York State, BRFSS, Combined Survey Years2006-2010
Figure 5-12Prevalence of Current Asthma Among Children (0-17 Years) by Race/Ethnicity and HouseholdIncome, New York State, BRFSS, Combined SurveyYears 2006-2010
Figure 5-13Prevalence of Current Asthma Among Middle andHigh School Students by Region, New York State,YTS, 2012
Figure 5-14Prevalence of Current Asthma Among Middle andHigh School Students by Gender, New York State,YTS, 2012
Figure 5-15Prevalence of Current Asthma Among Middle and High School Students by Race/Ethnicity, New York State, YTS, 2012
Figure 5-16Prevalence of Asthma Episodes/Attacks for the Past 12 Months Among Middle and High School Students with Current Asthma by Region, New York State, YTS, 2012
Figure 5-17Prevalence of Asthma Episodes/Attacks for the Past 12 Months Among Middle and High School Students with Current Asthma by Gender, New York State, YTS, 2012
45
46
47
49
50
51
52
53
4
Figure 5-18 Prevalence of Asthma Episodes/Attacks for the Past 12 Months Among Middle and High SchoolStudents with Current Asthma by Race/Ethnicity,New York State, YTS, 2012
Figure 5-19 Percentages of Middle and High School StudentsWho Smoked in the Past 30 Days by AsthmaStatus, New York State, YTS, 2012
Figure 6-1 Annual Asthma Emergency Department Visits, New York State, 2005-2011
Figure 6-2 Annual Asthma Emergency Department Visit Rateper 10,000 Residents, New York State, 2005-2011
Figure 6-3 Asthma Emergency Department Visits by Month,New York State, 2009-2011
Figure 6-4 Asthma Emergency Department Visits by Month,Ages 0-14 Years, New York State, 2009-2011
Figure 6-5 Asthma Emergency Department Visit Rate per 10,000 Residents by Age Group and Year, New York State, 2005-2011
Figure 6-6 Asthma Emergency Department Visits by Age Group,New York State, 2009-2011
Figure 6-7 Asthma Emergency Department Visit Rate per 10,000 Residents by Gender and Year, New York State, 2005-2011
Figure 6-8 Asthma Emergency Department Visits by Gender,New York State, 2005-2007
Figure 6-9 Percent of Asthma Emergency Department Visits byAge Group and Gender, New York State, 2009-2011
Figure 6-10 Asthma Emergency Department Visit Rate per10,000 Residents by Region and Year, New YorkState, 2005-2011
Figure 6-11 Asthma Emergency Department Visits by Region,New York State, 2009-2011
54
55
59
60
61
62
64
65
66
67
68
69
70
Figure 6-12 Asthma Emergency Department Visits by Source of Payment, New York State, 2009-2011
Figure 6-13 Age-Adjusted Asthma Emergency Department VisitRate per 10,000 Residents by County, New YorkState, 2008-2010
Figure 6-14 Albany County: Asthma Emergency Department Visit Rate per 10,000 Residents, 2006-2010
Figure 6-15 Albany County: Total Asthma Emergency DepartmentVisit Rate per 10,000 Residents by ZIP Code,2008-2010
Figure 6-16 Asthma Emergency Department Visit Rate per 100 Adults (18+ Years) with Current Asthma,New York State, 2005-2010
Figure 6-17 Asthma Emergency Department Visit Rate per 100 Adults (18+ Years) with Current Asthma by Age Group and Year, New York State, 2005-2011
Figure 6-18 Asthma Emergency Department Visit Rate per 100 Adults (18+ Years) with Current Asthma byGender and Year, New York State, 2005-2011
Figure 6-19 Asthma Emergency Department Visit Rate per 100 Adults (18+ Years) with Current Asthma byRace/Ethnicity and Year, New York State, 2005-2011
Figure 6-20 Asthma Emergency Department Visit Rate per 100 Adults (18+ Years) with Current Asthma byRegion and Year, New York State, 2005-2011
Figure 6-21 Asthma Emergency Department Visit Rate per 100Children (0-17 Years) with Current Asthma by AgeGroup and Gender, New York State, 2006-2010
Figure 6-22 Asthma Emergency Department Visit Rate per 100 Children (0-17 Years) with Current Asthma by Race/Ethnicity and Region, New York State,2006-2010
Figure 7-1 Annual Asthma Hospital Discharges, New York State,2002-2011
71
75
77
78
81
82
83
84
85
86
87
90

5
Figure 7-2 Annual Asthma Hospital Discharge Rate per 10,000Residents, New York State, 2002-2011
Figure 7-3 Asthma Hospital Discharges by Month, New York State, 2009-2011
Figure 7-4 Asthma Hospital Discharges by Month, Ages 0-14 Years, New York State, 2009-2011
Figure 7-5 Asthma Hospital Discharge Rate per 10,000Residents by Age Group and Year, New York State,2002-2011
Figure 7-6 Asthma Hospital Discharges by Age Group, New York State, 2009-2011
Figure 7-7 Asthma Hospital Discharge Rate per 10,000Residents by Gender and Year, New York State,2002-2011
Figure 7-8 Asthma Hospital Discharges by Gender, New York State, 2009-2011
Figure 7-9 Percentages of Asthma Hospital Discharges by AgeGroup and Gender, New York State, 2009-2011
Figure 7-10 Asthma Hospital Discharge Rate per 10,000Residents by Region and Year, New York State,2002-2011
Figure 7-11 Asthma Hospital Discharges by Region, New York State, 2009-2011
Figure 7-12 Asthma Hospital Discharges by Source of Payment,New York State, 2009-2011
Figure 7-13 Age-Adjusted Asthma Hospital Discharge Rate per 10,000 Residents by County, New York State,2008-2010
Figure 7-14 Albany County: Asthma Hospital Discharge Rate per 10,000 Residents, 2002-2010
91
92
93
95
96
97
98
99
100
101
102
106
107
Figure 7-15 Albany County: Total Asthma Hospital Discharge Rateper 10,000 Residents by ZIP Code, 2008-2010
Figure 7-16 Asthma Hospital Discharge Rate per 100 Adults(18+ Years) with Current Asthma, New York State,2002-2011
Figure 7-17 Asthma Hospital Discharge Rate per 100 Adults(18+ Years) with Current Asthma by Age Group and Year, New York State, 2002-2011
Figure 7-18 Asthma Hospital Discharge Rate per 100 Adults(18+ Years) with Current Asthma by Gender and Year, New York State, 2002-2011
Figure 7-19 Asthma Hospital Discharge Rate per 100 Adults(18+ Years) with Current Asthma by Race/Ethnicityand Year, New York State, 2002-2011
Figure 7-20 Asthma Hospital Discharge Rate per 100 Adults(18+ Years) with Current Asthma by Region and Year, New York State, 2002-2011
Figure 7-21 Asthma Hospital Discharge Rate per 100 Children(0-17 Years) with Current Asthma by Age Group and Gender, New York State, 2006-2010
Figure 7-22 Asthma Hospital Discharge Rate per 100 Children(0-17 Years) with Current Asthma by Race/Ethnicityand Region, New York State, 2006-2010
Figure 8-1 Asthma Death Rate per 1,000,000 Residents by Region, New York State, 2002-2011
Figure 8-2 Age-Adjusted Asthma Death Rate per 1,000,000Residents, New York State, 2009-2011
Figure 8-3 Albany County: Asthma Death Rate Per 1,000,000Residents, 2002-2011
Figure 8-4 Asthma Death Rate per 100,000 Adults (18+ Years)with Current Asthma, New York State, 2002-2011
108
111
112
113
114
115
116
117
120
125
126
128

6
Figure 8-5 Asthma Death Rate per 100,000 Adults (18+ Years) with Current Asthma by Age Group and Year, New York State, 2002-2011
Figure 8-6 Asthma Death Rate per 100,000 Adults (18+ Years) with Current Asthma by Gender and Year, New York State, 2002-2011
Figure 8-7 Asthma Death Rate per 100,000 Adults (18+ Years)with Current Asthma by Race/Ethnicity and Year,New York State, 2002-2011
Figure 8-8 Asthma Death Rate per 100,000 Adults (18+ Years)with Current Asthma by Region and Year, New YorkState, 2002-2011
Figure 9-1 New York State Medicaid Managed Care andMedicaid Fee-for-Service Enrollees Aged 0-64 Yearsby Month, January 2009–December 2010
Figure 9-2 Asthma Universe Prevalence by Age Group,Medicaid Managed Care Population, New York State,2006-2010
Figure 9-3 Asthma Universe Prevalence by Gender, MedicaidManaged Care Population, New York State, 2006-2010
Figure 9-4 Asthma Universe Prevalence by Race/Ethnicity,Medicaid Managed Care Population, New York State, 2006-2010
Figure 9-5 Asthma Universe Prevalence by Region, MedicaidManaged Care Population, New York State, 2006-2010
Figure 9-6 Asthma Universe Prevalence by County, MedicaidManaged Care Population, New York State, 2009-2010
Figure 9-7 Persistent Asthma Prevalence by Age Group,Medicaid Managed Care Population, New York State,2009-2010
129
130
131
132
139
141
142
143
144
145
148
Figure 9-8 Persistent Asthma Prevalence by Gender, Medicaid Managed Care Population, New York State,2009-2010
Figure 9-9 Persistent Asthma Prevalence by Race/Ethnicity,Medicaid Managed Care Population, New York State,2009-2010
Figure 9-10 Persistent Asthma Prevalence by Region, Medicaid Managed Care Population, New York State,2009-2010
Figure 9-11 Persistent Asthma Prevalence by County, Medicaid Managed Care Population, New York State,2009-2010
Figure 9-12 Asthma Universe Prevalence by County, Child Health Plus Population, New York State, 2010
Figure 9-13 Persistent Asthma Prevalence by County, Child Health Plus Population, New York State, 2010
Figure 9-14Percentages of Children (5–11 Years) with PersistentAsthma Who Received Appropriate Medications by Type of Plan, New York State, 2010
Figure 9-15Percentages of Individuals (12-50 Years) withPersistent Asthma Who Received AppropriateMedications by Type of Plan, New York State, 2010
Figure 9-16Percentages of Individuals (5-50 Years) withPersistent Asthma Who Received AppropriateMedications by County, New York State, 2010
Figure 9-17Percentages of Children (5-11 Years) with Persistent Asthma Who Had Three or More ControllerMedication Dispensing Events in the Past Year by Type of Plan, New York State, 2010
Figure 9-18Percentages of Individuals (12-50 Years) withPersistent Asthma Who Had Three or More ControllerMedications Dispensing Events in the Past Year by Type of Plan, New York State, 2010
149
150
151
152
165
170
179
180
181
182
183

7
Figure 9-19Percentages of Children (5-11 Years) with Persistent Asthma Who Had Three or More ControllerMedication Dispensing Events in the Past Year by County, New York State, 2010
Figure 10-1Annual Work-Related Asthma EmergencyDepartment Visits, New York State, 2005-2010
Figure 10-2Annual Work-Related Asthma Hospital Discharges,New York State, 2001-2010
Figure 10-3Average Length of Stay for Work-Related AsthmaHospitalizations, New York State, 2001-2010
Figure 10-4Average Cost of Work-Related AsthmaHospitalizations, New York State, 2001-2010
Figure 10-5Total Cost of Work-Related Asthma Hospitalizations,New York State, 2001-2010
Figure 10-6Number of Work-Related Asthma Patients Seen by the New York State Occupational Health ClinicNetwork, by Year of First Visit, 2001-2010
Figure 10-7Number of Suspected or Confirmed Work-RelatedAsthma Patients Reported to the New York StateOccupational Lung Disease Registry by Year of First Report, 2001-2010
Figure 11-1Total Crude and Adjusted Cost of AsthmaHospitalizations, New York State, 2002-2011
Figure 11-2Average Crude and Adjusted Cost per AsthmaHospitalization, New York State, 2002-2011
Figure 11-3Average Length of Stay for Asthma Hospitalizations,New York State, 2002-2011
Figure 11-4Average Cost per Asthma Hospitalization by AgeGroup, New York State, 2002-2011
Figure 11-5Comparison of Number of Asthma Hospitalizationsto Cost Incurred by Age Group, New York State,2009-2011
184
191
193
194
195
196
198
200
203
204
205
206
207
Figure 11-6Average Cost per Asthma Hospitalization by Gender,New York State, 2002-2011
Figure 11-7Comparison of Number of Asthma Hospitalizationsto Cost Incurred by Gender, New York State, 2009-2011
Figure 11-8Average Cost per Asthma Hospitalization by Region,New York State, 2002-2011
Figure 11-9Comparison of Number of Asthma Hospitalizations toCost Incurred by Region, New York State, 2009-2011
Figure 11-10Average Cost per Asthma Hospitalization by Sourceof Payment, New York State, 2002-2011
Figure 11-11Comparison of Number of Asthma Hospitalizationsto Cost Incurred by Source of Payment, New YorkState, 2009-2011
Figure 11-12Medicaid Managed Care Average Asthma-RelatedService Cost per Enrollee by Age Group for theAsthma Universe Population, New York State, 2010
Figure 11-13Medicaid Managed Care Average Asthma-RelatedService Cost per Enrollee by Gender for the AsthmaUniverse Population, New York State, 2010
Figure 11-14Medicaid Managed Care Average Asthma-RelatedService Cost per Enrollee by Race/Ethnicity for theAsthma Universe Population, New York State, 2010
Figure 11-15Medicaid Managed Care Average Asthma-RelatedService Cost per Enrollee Among the AsthmaUniverse Population by Region, New York State, 2010
Figure 11-16Distribution of Asthma Medicaid Managed CareCosts Among the Asthma Universe Population by Region, New York State, 2010
Figure 12-1Percentages of Public School Buildings ReportingVentilation System Problems, New York State(Excluding New York City), 2010 (N=3,021)
208
209
210
211
212
213
216
217
218
219
221
226

8
Figure 12-2Percentages of Public School Buildings ReportingMold or Moisture Problems, New York State(Excluding New York City), 2010 (N=3,021)
Figure 12-3Percentages of Public School Buildings ReportingActive Infestations of Vermin, New York State(Excluding New York City), 2010 (N=3,021)
Figure 12-4Average Number of Days per Year That AmbientOzone Levels Were Unhealthy for People withAsthma, New York State, 2007-2009
Figure 12-5Trends in Average Summer Temperature and AverageNumber of Days per Year that Ambient Ozone LevelsWere Unhealthy for People with Asthma, New YorkState (excluding New York City), 2000-2009
227
228
231
232
Figure 12-6Trends in Average Summer Temperature and AverageNumber of Days per Year that Ambient Ozone LevelsWere Unhealthy for People with Asthma, New YorkCity, 2000-2009
Figure 12-7Estimated Average Number of Days per Year that Fine Particles Were Unhealthy for People with Asthma, New York State, 2007-2009
Figure 12-8Trends in Estimated Average Number of Days perYear that Fine Particles Were Unhealthy for Peoplewith Asthma by Region and Year, New York State,2000-2009
Figure 12-9National Allergy Bureau Certified Pollen CountingStations With High Concentrations of Pollen, New York State, 2003-2010
233
234
235
238

9
List of Tables
Table 1-1 Asthma Indicators and Data Sources in New York State
Table 4-1Asthma Emergency Department Visit Rate per10,000 Residents by Age Group for New York State(2005-2011), United States (2009), and HealthyPeople 2020 Objectives
Table 4-2Asthma Hospital Discharge Rate per 10,000Residents by Age Group for New York State (2001-2011), Healthy People 2020 Objectives, and United States (2009)
Table 4-3Asthma Mortality Rate per 1,000,000 Residents byAge Group for New York State (2001-2009), UnitedStates (2009), and Healthy People 2020 Objectives
Table 6-1Crude and Age-Adjusted Asthma EmergencyDepartment Visit Rate per 10,000 Residents byGender, Race/Ethnicity and Region, New York State,2009-2011
Table 6-2Crude and Age-Adjusted Asthma EmergencyDepartment Visit Rates per 10,000 Residents byRegion and County, New York State, 2008-2010
Table 6-3Albany County: Asthma Emergency Department VisitRate per 10,000 Residents, 2006-2010
Table 6-4Total Asthma Emergency Department Visit Rate per10,000 Residents by ZIP Code, Three-Year Average2009-2011
Table 7-1Crude and Age-Adjusted Asthma Hospital DischargeRate per 10,000 Residents by Gender, Race/Ethnicityand Region, New York State, 2009-2011
Table 7-2Crude and Age-Adjusted Asthma Hospital DischargeRate per 10,000 Residents by Region and County,New York State, 2008-2010
Table 7-3Albany County: Asthma Hospital Discharge Rate per10,000 Residents, 2002-2011
Table 7-4Albany County: Total Asthma Hospital DischargeRate per 10,000 Residents by ZIP Code, Three-YearAverage 2008-2010
Table 8-1Asthma Death Rate per Million by Age Group, NewYork State, 2009-2011
Table 8-2Crude and Age-Adjusted Asthma Death Rate per Million Residents by Gender, Race/Ethnicity and Region, New York State, 2009-2011
Table 8-3Crude and Age-Adjusted Asthma Death Rate PerMillion Residents by Region and County, New YorkState, 2009-2011
Table 8-4Albany County: Asthma Death Rate Per 1,000,000Residents, from 2002-2011
Table 9-1Number of Asthma Universe and Medicaid ManagedCare Enrollees by Age Group, New York State, 2009to 2010
Table 9-2Asthma Universe Prevalence by Age Group,Medicaid Managed Care Population, New York State,2006-2010
Table 9-3Asthma Universe Prevalence by Gender, MedicaidManaged Care Population, New York State, 2006-2010
Table 9-4Asthma Universe Prevalence by Race/Ethnicity,Medicaid Managed Care Population, New York State,2006-2010
Table 9-5Asthma Universe Prevalence by Region, MedicaidManaged Care Population, New York State, 2006-2010
107
109
121
121
122
126
140
141
142
143
144
14
31
32
32
63
72
77
79
94
103

10
Table 9-6Asthma Universe Prevalence by County, MedicaidManaged Care Population, New York State, 2009-2010
Table 9-7Persistent Asthma Prevalence by Age Group,Medicaid Managed Care Population, New York State,from 2009-2010
Table 9-8Persistent Asthma Prevalence by Gender, MedicaidManaged Care Population, New York State, 2009-2010
Table 9-9Persistent Asthma Prevalence by Race/Ethnicity,Medicaid Managed Care Population, New York State,2009-2010
Table 9-10Persistent Asthma Prevalence by Region, MedicaidManaged Care Population, New York State, 2009-2010
Table 9-11Persistent Asthma Prevalence by County, MedicaidManaged Care Population, New York State, 2009-2010
Table 9-12Asthma-Related Utilization by Type of Health CareService and Age Group, Medicaid Managed CareAsthma Universe Population, New York State, 2009-2010
Table 9-13Asthma-Related Utilization Rate (per 100 AsthmaUniverse Enrollees) by Type of Health Care Serviceand Age Group, Medicaid Managed Care AsthmaUniverse Population, New York State, 2009-2010
Table 9-14Asthma-Related Utilization by Type of Health CareService and Gender, Medicaid Managed CareAsthma Universe Population, New York State, 2009-2010
Table 9-15Asthma-Related Utilization Rate (per 100 AsthmaUniverse Enrollees) by Type of Health Care Serviceand Gender, Medicaid Managed Care AsthmaUniverse Population, New York State, 2009-2010
Table 9-16Asthma-Related Utilization by Type of Health CareService and Race/Ethnicity, Medicaid ManagedCare Asthma Universe Population, New York State,2009-2010
146
148
149
150
151
153
156
157
158
158
159
Table 9-17Asthma-Related Utilization Rate (per 100 AsthmaUniverse Enrollees) by Type of Health Care Serviceand Race/Ethnicity, Medicaid Managed CareAsthma Universe Population, New York State, 2009-2010
Table 9-18Asthma-Related Utilization by Type of Health CareService and Region, Medicaid Managed CareAsthma Universe Population, New York State, 2009-2010
Table 9-19Asthma-Related Utilization Rate (per 100 AsthmaUniverse Enrollees) by Type of Health Service andRegion, Medicaid Managed Care Asthma UniversePopulation, New York State, 2009-2010
Table 9-20Asthma Universe Prevalence by Age Group, ChildHealth Plus Population, New York State, 2010
Table 9-21Asthma Universe Prevalence by Gender, Child HealthPlus Population, New York State, 2010
Table 9-22Asthma Universe Prevalence by Race/Ethnicity,Child Health Plus Population, New York State, 2010
Table 9-23Asthma Universe Prevalence by Region, Child HealthPlus Population, New York State, 2010
Table 9-24Asthma Universe Prevalence by County, Child HealthPlus Population, New York State, 2010
Table 9-25Persistent Asthma Prevalence by Age Group, ChildHealth Plus Population, New York State, 2010
Table 9-26Persistent Asthma Prevalence by Gender, Child Health Plus Population, New York State, 2010
Table 9-27Persistent Asthma Prevalence by Race/Ethnicity,Child Health Plus Population, New York State, 2010
Table 9-28Persistent Asthma Prevalence by Region, Child Health Plus Population, New York State, 2010
Table 9-29Persistent Asthma Prevalence by County, Child Health Plus Population, New York State, 2010
160
161
161
163
163
164
164
166
168
168
169
169
171

11
Table 9-30Asthma-Related Health Care Service Utilization by Age Group, Child Health Plus Population, New York State, 2010
Table 9-31Asthma-Related Health Care Service Utilization per 100 Asthma Universe Enrollees by Age Group, Child Health Plus Population, New York State, 2010
Table 9-32Asthma-Related Health Care Service Utilization by Gender, Child Health Plus Population, New York State, 2010
Table 9-33Asthma-Related Health Care Service Utilization per 100 Asthma Universe Enrollees by Gender, Child Health Plus Population, New York State, 2010
Table 9-34Asthma-Related Health Service Utilization by Race/Ethnicity, Child Health Plus Population, New York State, 2010
Table 9-35Asthma-Related Health Care Service Utilization per 100 Asthma Universe Enrollees byRace/Ethnicity, Child Health Plus Population, New York State, 2010
Table 9-36Asthma-Related Health Service Utilization by Region,Child Health Plus Population, New York State, 2010
Table 9-37Asthma-Related Health Care Service Utilization per 100 Asthma Universe Enrollees by Region, Child Health Plus Population, New York State, 2010
Table 9-38Preventable Hospital Admissions for Asthma AmongMedicaid Managed Care Asthma Universe Population,Children (2-17 Years), New York State, 2010
Table 9-39Preventable Hospital Admissions for Asthma Among Medicaid Managed Care Asthma UniversePopulation, Young Adults (18-39 Years), New YorkState, 2010
Table 9-40Preventable Hospital Admission Rate for ChronicObstructive Pulmonary Disease/Asthma, MedicaidManaged Care Asthma Universe Population, OlderAdults (40+ Years), New York State, 2010
Table 11-1Total Crude and Adjusted Cost of AsthmaHospitalizations, New York State, 2002-2011
174
174
175
175
176
176
177
177
186
187
188
215
Table 11-2Medicaid Managed Care Total Cost, Average Costper Service and Average Cost per Enrollee by Typeof Asthma-Related Service for the Asthma UniversePopulation, New York State, 2010
Table 11-3Medicaid Managed Care Average Asthma-RelatedService Cost per Enrollee by Age Group and Type of Asthma-Related Service for the Asthma UniversePopulation, New York State, 2010
Table 11-4Medicaid Managed Care Average Asthma-RelatedService Cost per Enrollee by Gender and Type ofAsthma-Related Service for the Asthma UniversePopulation, New York State, 2010
Table 11-5Medicaid Managed Care Average Asthma-RelatedService Cost per Enrollee by Race/Ethnicity and Type of Asthma-Related Service for the AsthmaUniverse Population, New York State, 2010
Table 11-6Medicaid Managed Care Average Asthma-RelatedService Cost per Enrollee by Region and Type ofAsthma-Related Service for the Asthma UniversePopulation, New York State, 2010
Table 11-7Medicaid Managed Care Total Asthma-RelatedService Cost and Number of Enrollees by Region for the Asthma Universe Population, New York State, 2010
Table 12-1Percentages of Public School Buildings ReportingVentilation System Problems, New York State(Excluding New York City), 2010 (N=3,021)
Table 12-2Average Duration, Intensity and Start Date of Tree Pollen Season for All Trees, New York State,2003-2010
Table 12-3Average Duration, Intensity and Start Date of GrassPollen Season for All Grasses, New York State,2003-2010
Table 12-4Average Duration, Intensity and Start Date of Weed Pollen Season for All Weeds, New York State,2003-2010
215
216
217
218
219
220
236
239
240
241

12
Introduction
Asthma has emerged as a significant chronic disease over the past 25 years and continues to be a major publichealth problem in the United States. In 2011, approximately18.9 million (8.2%) adults and 7.1 million (9.5%) childrenindicated they currently had asthma.1 During 2001-2009,the proportion of persons of all ages with asthma nation -wide increased significantly (12.3%), from 7.3% (20.3million persons) to 8.2% (24.6 million persons) of thepopulation.2 In 2010, there were 1.8 million emergencydepartment visits for asthma nationally.3
Asthma hospitalization rates decreased nationally from 2000 to 2004, and remained stable during 2005 to 2009.4,5,6 The number of asthma deaths nationwidedeclined steadily from 2001 to 2009 at a rate of 3.3%annually.4 However, in 2010, there were still 439,000asthma hospitalizations and 3,404 deaths nationally due to asthma.3 In 2008, persons with asthma missed 10.5million school days and 14.2 million work days due to their asthma.9 The direct costs of high levels of healthcareutilization and the indirect costs of premature death andabsenteeism from school and work total a staggering $56 billion per year.10
Asthma remains a major problem in New York State (NYS) with significant public health and financial conse -quences. In 2011, an estimated 1.4 million adults currentlyhad asthma.1 Current asthma prevalence among adultsincreased from 7.7% in 2000 to 9.7% in 2011 and was
higher than the national average for every year in thedecade.1 Current asthma prevalence for children (0-17years) was 10.4% during 2006-2010 (an estimated456,000 children).11 There were more than 160,000emergency department visits and over 38,000 hospital -izations per year due to asthma during 2009-2011. Therates of asthma emergency department visits and hospital -izations in NYS are higher than the national rates for all agegroups and higher than the Healthy People 2020 objectives.During 2009-2011, an average of 258 deaths occurredannually due to asthma in NYS, which is an age-adjustedasthma mortality rate of 12.3 per 1 million residents.Additionally, only 30% of New Yorkers have an asthma self-management plan to help them control their asthma.11
The NYS Asthma Surveillance Summary Report wascreated in 2005 to better understand the burden of asthma in NYS. It is updated every four years. Information is generally presented on a statewide level and, whereappropriate, at the county level, to help public healthprograms, policy makers and other health care providersrecognize the scope of the problem and design solutions toreduce the burden of asthma in NYS. Data are presented forchildren and adults related to asthma prevalence, asthma-related risk behaviors, asthma emergency department visits, asthma hospitalizations, asthma mortality, Medicaidmanaged care and Child Health Plus, work-related asthma,asthma costs and asthma environmental triggers.
1

13
Asthma Prevalence/Severity
Scheduled Office Visits
Unscheduled Office Visits
ED/Urgent Care
Hospitalization
Qualityof Life
Cost
PharmacyTriggers
Mortality
CausalFactors
Figure 1-1The Asthma Surveillance Pyramid
Source: Centers for Disease Control and Prevention. “A Public Health Response to Asthma,” PHTN Satellite Broadcast, Course Materials 2001.
CDC defines surveillance as the “ongoing, systematiccollection, analysis and interpretation of health-related dataessential to the planning, implementation and evaluation of public health practice, closely integrated with the timelydissemination of these data to those responsible for
prevention and control.”12 Using various databases withinformation about asthma, the New York State Departmentof Health (NYSDOH) has constructed estimates for keyindicators in the Asthma Surveillance Pyramid shown below.
Asthma Prevalence
Asthma prevalence is assessed through the Behavioral Risk Factor Surveillance System (BRFSS), Youth RiskBehavior Survey (YRBS), Youth Tobacco Survey (YTS),BRFSS Asthma Call-Back Survey and program-based data, including Medicaid managed care and Child HealthPlus. The Occupational Health Clinic Network and theOccupational Lung Disease Registry also collect infor -mation about the incidence of work-related asthma.
Scheduled and Unscheduled Office Visits
The Medicaid managed care Quality Assurance ReportingRequirements (QARR) consist of measures from the NationalCommittee for Quality Assurance’s Healthcare EffectivenessData Information Set (HEDIS®) and NYS-specific measures.This version of QARR incorporates measures from HEDIS.®
The major areas of performance included in 2010 QARRare: Effectiveness of Care, Access to/Availability of Care,Satisfaction with the Experience of Care, Health PlanStability, Use of Services, and Health Plan Descriptive Infor -mation. The BRFSS Asthma Call-Back Survey also hasinformation on scheduled and unscheduled office visits.
Emergency Department/Urgent Care
Information about asthma-related emergency departmentvisits is available from the SPARCS Outpatient Database.Medicaid managed care and Child Health Plus data alsoinclude emergency department visit information. The BRFSSAsthma Call-Back Survey has self-reported information on emergency department and urgent care visits.
Asthma Surveillance in New York State

14
The data presented in this report are useful in characterizingthe population(s) affected by asthma. The following table
summarizes the source(s) of data used for each asthmaindicator:
Most RecentIndicator Type Source Year of Data
Asthma Prevalence in Children Behavioral Risk Factor Surveillance 2010(0-17 Years) System (BRFSS)
BRFSS Asthma Call-Back Survey 2010
New York State Youth Tobacco Survey 2012
Asthma Prevalence in Adults BRFSS 2011(18+ Years)
Asthma Emergency Department Visits Statewide Planning and Research • Population-based rates Cooperative System (SPARCS) Hospital 2011• At-risk based rates Inpatient and Outpatient Databases
Asthma Hospitalizations • Population-based rates SPARCS Hospital Inpatient Database 2011• At-risk based rates
Asthma Deaths Vital Records 2011
Summary of Indicators and Data Sources in This Report
Hospital Discharges
Asthma hospital discharge data are available through the Statewide Planning and Research Cooperative System(SPARCS) Hospital Inpatient Database. Medicaid managedcare and Child Health Plus data include information aboutasthma hospital discharges. The BRFSS Asthma Call-BackSurvey has self-reported information on asthma-relatedhospitalizations.
Mortality
Information on asthma mortality is available through theNYS Vital Statistics database.
Quality of Life
The BRFSS assessed the self-reported quality of life among adults currently suffering from asthma. The BRFSSAsthma Call-Back Survey collects data for several quality of life measures in both children and adults with asthma.
Cost
Hospital billing data are available through the SPARCSdatabase. The Medicaid managed care data system has cost information for emergency department visits, hospitalizations, outpatient visits and pharmacy use.
Pharmacy
Medicaid managed care and Child Health Plus health insurance programs have detailed information about phar-macy dispensing events and costs. The BRFSS AsthmaCall-Back Survey collects information about asthma med-ication used by both children and adults with asthma.
Triggers
The BRFSS Asthma Call-Back Survey collects informationabout the household environment for people with asthma.The NYS School Building Condition Survey has informationabout the indoor air quality in schools with regard to venti-lation system problems, visible mold, moisture or humidityproblems, and the presence of vermin. The EnvironmentalProtection Agency Air Quality System collects informationon daily levels of ozone and fine particulate matter (PM2.5)in each state. The National Allergy Bureau, a section of theAmerican Academy of Allergy, Asthma and Immunology’sAeroallergen Network, certifies pollen counters who operatepollen stations across the United States, including six in NYS that provide counts of mold spores and tree, grass and weed pollen.
Table 1-1 Asthma Indicators and Data Sources in New York State

15
Most RecentIndicator Type Source Year of Data
Asthma Prevalence Among Medicaid 2006-2010
Managed Care (MMC) and NYSDOH Office of Health Insurance (MMC)
Child Health Plus (CHP) Enrollees Programs (OHIP) Datamart 2010 (CHP)
Asthma-Related Healthcare 2009-2010Utilization: (MMC)• Asthma outpatient visits NYSDOH Office of Health Insurance • Emergency department visits Programs (OHIP) Datamart 2010• Hospitalizations (CHP)• Pharmacy
Quality of Asthma Care: Appropriate Use of Asthma NYSDOH OHIP Datamart 2010Medication Among People NYS Commercial Insurance Data 2010with Persistent Asthma
Asthma-Related Healthcare Costs Among Medicaid Managed Care Enrollees: • Asthma outpatient visits NYSDOH OHIP Datamart 2010• Emergency department visits• Hospitalizations• Pharmacy
Prevention Quality Indicators (PQIs) and Pediatric Quality Indicators (PDIs) NYSDOH OHIP Datamart 2010for Medicaid Managed Care Enrollees
Asthma Hospitalization Costs SPARCS Hospital Inpatient Database 2011
Work-Related Asthma (WRA) SPARCS Outpatient Database 2010Emergency Department Visits
Work-Related Asthma (WRA) SPARCS Hospital Inpatient Database 2010Hospital Discharges
WRA Incidence NYS Occupational Health Clinic Network 2010
NYS Occupational Lung Disease Registry 2010
School Indoor Air Quality • Problems in the ventilation system• Visible mold NYS Building Condition Survey 2010• Moisture/humidity problems• Vermin/pests
Outdoor Air Quality Environmental Protection Agency 2009• Ozone Air Quality System• Particulate Matter (PM2. 5) National Allergy Bureau 2003-2010• Pollen NYS Counting Stations
Table 1-1 continuedAsthma Indicators and Data Sources in New York State

16
Executive Summary
The New York State Asthma Surveillance Summary Report(October 2013) examines the prevalence and impact ofasthma in NYS, and compares NYS asthma data to U.S. dataand to the Healthy People 2020 asthma-specific objectives.In addition, this report provides detailed information regardingasthma prevalence in children and adults through 2011, and data on risk behaviors, emergency department visits,asthma hospitalizations, asthma mortality, Medicaid managedcare asthma prevalence, asthma-related utilization of health
services and costs, work-related asthma, and asthma coststhrough 2011.
This Executive Summary offers highlights of the asthma-related information in New York State detailed throughoutthe report. Results are often presented for single years as well as for combined years (e.g., results for combinedthree-year datasets 2009 through 2011 are indicated as 2009-2011). Refer to individual chapters for detailedasthma-related information.
2
� One in every 10 adults and one in every 10 children in New York State currently have asthma. This chronicdisease remains an epidemic in New York with significantpublic health and financial consequences.
� Overall, there has been an upward trend in the prevalenceof current asthma among New York State residents from2001through 2010. New York State asthma prevalencehas also been higher than the national average.
� The asthma hospital discharge rate in New York Statedecreased approximately 11% from 2002 to 2011. In addition, New York State’s asthma mortality ratedecreased 24% in the past 10 years. The asthmaemergency department rate, however, increased 6% from 2005-2011.
� Compared to the nation, New York has higher asthmaemergency department and hospital discharge rates forall age groups. New York State’s rates are roughly twicethe levels targeted in Healthy People 2020.
� Disparities exist among certain age groups. Children aged 5-9 years in New York State had the highest currentasthma prevalence for 2006-2010. From 2005 to 2011,children aged 0-4 years had the highest emergencydepartment visit and hospital discharge rates comparedto all other age groups.
� Geographic differences continue to be seen. Adults who live in New York City had higher current asthma
prevalence in 2011, and also had higher age-adjustedasthma emergency department visit, hospital discharge,and mortality rates for 2009-2011 when compared toresidents in the Rest of State. At the county level, asthmaemergency department visit and hospital discharge ratesvaried across New York State for 2009- 2011, with thehighest rates in the Bronx.
� Disparities persist among racial and ethnic groups. Non-Hispanic black adults and children experience some ofthe highest asthma prevalence rates in New York State.Non-Hispanic black and Hispanic middle and high schoolstudents also experience higher asthma prevalence rateswhen compared to all other racial and ethnic groups. In addition, for 2009-2011, the age-adjusted asthmaemergency department visit, hospital discharge andmortality rates were higher among non-Hispanic blackand Hispanic New Yorkers than non-Hispanic whites.
� The total cost of asthma hospitalizations for 2011 wasapproximately $660 million, a 61% increase since 2002.The average cost per hospitalization was $17,954 in2011, a 78% increase from 2002. Among the New YorkState Medicaid managed care population with asthma,more than $276 million were spent in 2010 for asthma-related services; the average cost was $1,109 perasthma enrollee.
Key Findings

17
� Compared to the 2005-2007 time period, the mostrecent data for NYS (2009-2011) showed an increase in asthma emergency department visit rates for all agegroups, ranging from 3% to 7%. NYS asthma emergencydepartment visit rates were higher for all age groups when compared to the nation. NYS asthma emergencydepartment visit rates were also higher than the HealthyPeople 2020 objectives for all age groups, especiallyamong children aged 0-4 years.
� Compared to the 2001-2003 time period, 2009-2011New York State asthma hospital discharge rates were lower(13-19%) for those aged 0-64 years. However, New York
State asthma hospital discharge rates remained higherthan the United States rates for all age groups. New Yorkrates were roughly two to three times higher than theHealthy People 2020 objectives for each age group.
� Compared to the 2001-2003 time period, 2009-2011New York State asthma mortality rates showed a decreasefor all age groups, ranging from 13% to 27%. Comparedto the nation, New York State asthma mortality rates werehigher for all age groups, and were two to three timeshigher than the Healthy People 2020 objectives for the35-year and older age groups.
Tracking Healthy People 2020 Asthma-Specific Objectives in New York State
Current Asthma Prevalence and Risk Behaviors in Adults(Behavioral Risk Factor Surveillance System), 2002-2011
� There has been an upward trend in the prevalence ofcurrent asthma among New York State residents from2002 through 2010.
� In 2011, approximately 1.4 million adult New Yorkers(9.7%) had self-reported current diagnosed asthma.
� Current asthma prevalence was consistently higher forfemales than males. The 2011 prevalence of currentasthma among New York State women (12.3%) was 78% higher than the prevalence in men (6.9%).
� Current asthma prevalence in New York State for 2011was inversely related to annual household income andeducational attainment.
� Adults who live in New York City had higher currentasthma prevalence (10.2%) than adults in the Rest of State (9.3%) in 2011.
� In 2011, the percentage of current smoking was higherfor adult New Yorkers with asthma (23.2%) compared to those without asthma (17.6%).
� The prevalence of obesity in 2011 was higher amongadults with asthma (33.4%) compared to non-asthmaticadult New Yorkers (23.5%).
Current Asthma Prevalence in Children (Behavioral RiskFactor Surveillance System), 2006-2010
� For 2006-2010, approximately 456,022 (10.4%) children(0-17 years) in New York State had current asthma.
� Children aged 0-4 years in New York State had the lowestcurrent asthma prevalence (7.3%) in 2006-2010, whilechildren aged 5-9 years had the highest current asthmaprevalence (13.7%).
� In 2006-2010, the current asthma prevalence amongboys (11.2%) in New York State was higher than theprevalence among girls (9.6%).
� The prevalence of current asthma was slightly higher forchildren who live outside New York City (the Rest of State)(10.5%) compared to those in New York City (10.3%) for 2006-2010.
� The prevalence of current asthma was higher among non-Hispanic black children (14.3%) in 2006-2010compared to non-Hispanic white (8.5%) and Hispanic(11.7%) children.
� In 2006-2010, New York children from households withannual incomes less than $25,000 had higher currentasthma prevalence compared to children from familieswith annual household incomes of greater than $75,000(14.4% and 8.2%, respectively.)
Prevalence and Risk Behavior Information, New York State Asthma Survey Data

18
� The number of emergency department visits due toasthma in New York State increased 7% in the past sevenyears from 153,784 in 2005 to 164,810 in 2011.
� Asthma emergency department visit rates showed a 6% increase from 79.9 per 10,000 residents in 2005 to 84.7 per 10,000 in 2011.
� Overall, asthma emergency department visits showed a seasonal pattern with peaks in the spring and fall, and declines in the summer.
� From 2005 to 2011, the 0-4 year age group consistentlyhad the highest emergency department visit rate comparedto all other age groups. Each age group showed a slightincrease from 2005 to 2011 with the exception of the 25-44 year age group.
� For 2009-2011, female New Yorkers had higher crudeand age-adjusted asthma emergency department visitrates (crude rate 88.4 per 10,000; adjusted rate 92.3per 10,000) compared to males (80.8 per 10,000; 83.8 per 10,000).
� For the period 2009-2011, crude and age-adjustedasthma emergency department visit rates for non-Hispanic black (220.0 per 10,000; 219.5 per 10,000)and Hispanic (115.6 per 10,000; 112.8 per 10,000)New York State residents were higher than the rates fornon-Hispanic white residents (30.4 per 10,000; 33.1 per 10,000).
� New York City residents had crude and age-adjustedasthma emergency department visit rates (crude rate129.6 per 10,000; adjusted rate 135.0 per 10,000) in 2009-2011 that were approximately 2.5 times higherthan residents in the Rest of State (50.9 per 10,000;54.2 per 10,000).
� Asthma emergency department visit rates at the countylevel varied across New York State for 2009-2011. New York City residents of the Bronx had the highest age-adjusted emergency department visit rate of 231.4 per10,000 residents. Among counties in the Rest of State,Clinton County had the highest age-adjusted emergencydepartment visit rate of 110.6 per 10,000 residents.
Asthma Emergency Department Visit Rates for Adultswith Current Asthma (At-Risk Based Rates), 2005-2011
� From 2005 to 2011, the annual at-risk based rate forasthma emergency department visits in New York Stateremained relatively stable. The annual at-risk based ratewas 6.9 per 100 adults with current asthma in 2011.
� From 2005 to 2011, among adults with current asthma,non-Hispanic blacks and Hispanics (15.5 and 8.5 per100 in 2011, respectively) consistently had higher at-riskbased rates for asthma emergency department visitscompared to non-Hispanic whites (3.0 per 100 in 2011)in New York State.
Asthma Emergency Department Visits, 2005-2011
Current Asthma Prevalence and Asthma Episodes/Attacks in Middle and High School Students (New York State Youth Tobacco Survey), 2012
� In 2012, current asthma prevalence was 23.3% for middleschool students and 24.0% for high school students.
� Current asthma prevalence for middle school non-Hispanicother (18.1%) students was lower than Hispanic (29.9%)and non-Hispanic white (20.2%) students. Similarly,among high school students, prevalence of current asthmaamong non-Hispanic other (17.5%) students was lowercompared to non-Hispanic blacks (27.7%) and Hispanics(26.1%). These differences were statistically significant.
� Among New York State middle school students withcurrent asthma, 28.2% reported having had an asthmaepisode/attack in the past 12 months. The asthmaepisode/attack prevalence was 30.3% among high school students with current asthma.
� Female New York State high school students with currentasthma reported significantly more asthma episodes/attacks in the past 12 months (38.0%) compared to their male counterparts (22.7%).
� There was no significant difference in the prevalence of asthma episodes/attacks by race and ethnicity among New York State middle school and high school students.
� In 2012, 4.3% of middle school students with asthmareported that they smoked cigarettes during the past 30 days, compared to 2.7% of those without asthma. The percentage of high school students who reportedthat they smoked cigarettes for the past 30 days was similar among students with asthma (11.9%) and those without asthma (12.0%).

19
� From 2005 to 2011, among adults with current asthma, New York City (9.8 per 100 in 2011) residentsconsistently had a higher at-risk based rate for asthmaemergency department visits compared to those in theRest of State (4.6 per 100 in 2011). The New York Cityrate decreased 25% from 13.0 per 100 in 2005 to 9.8 per 100 in 2011.
Asthma Emergency Department Visit Rates for Childrenwith Current Asthma (At-Risk Based Rates), 2006-2010
� For 2006-2010, there were approximately 13.5 asthmaemergency department visits each year per 100 childrenwith current asthma in New York State.
� Among New York State children with current asthma in 2006-2010, the 0-4 year age group had the highest
at-risk based rate for asthma emergency departmentvisits (29.4 per 100) compared to all other age groups.
� The at-risk based rate for asthma emergency departmentvisits for 2006-2010 was higher among boys (15.0 per100) than girls (12.0 per 100).
� Among children with current asthma, the 2006-2010 at-risk based rate for asthma emergency departmentvisits was highest for Hispanic children (59.5 per 100),followed by non-Hispanic black children (31.5 per 100).
� The at-risk based rate for asthma emergency departmentvisits for 2006-2010 was five times higher for children with current asthma living in New York City (30.2 per 100)compared to those living in the Rest of State (6.0 per 100).
� The number of hospital discharges in New York State due to asthma decreased approximately 9% in the past10 years from 40,585 in 2002 to 36,778 in 2011.
� Asthma hospital discharge rates showed an 11% declinefrom 21.2 per 10,000 residents in 2002 to 18.9 per10,000 in 2011.
� Overall, asthma hospital discharges showed a seasonalpattern, with peaks in the spring and fall and a decline in the summer.
� From 2002 to 2011, the 0-4 year age group had the highest asthma hospital discharge rate compared to all other age groups in NYS. Each age group showed a downward trend over time with the exception of the 65 year and older age group.
� From 2009 to 2011, the crude and age-adjusted asthmahospital discharge rates for female New Yorkers (23.4 per 10,000; 22.5 per 10,000) were higher compared to males (16.4 per 10,000; 17.0 per 10,000).
� For the period 2009-2011, crude and age-adjustedasthma hospital discharge rates for non-Hispanic black(42.4 per 10,000; 43.2 per 10,000) and Hispanic (38.1per 10,000; 42.7 per 10,000) New York State residentswere at least four times higher than non-Hispanic whiteresidents (9.4 per 10,000; 8.9 per 10,000).
� New York City residents had crude and age-adjustedasthma hospital discharge rates (30.2 per 10,000; 31.0 per 0,000) in 2009-2011 that were more than 2.5 times higher than residents in the Rest of State (12.2 per 10,000; 12.1 per 10,000).
� Asthma hospital discharge rates for 2009-2011 variedacross New York State, with the highest in the Bronx (63.3 per 10,000) and the lowest in Tioga County (2.7 per 10,000).
Asthma Hospital Discharge Rates for Adults with Current Asthma (At-Risk Based Rates), 2002-2011
� From 2002 to 2011, the annual at-risk based rate forasthma hospital discharges in New York State decreasedfrom 2.25 asthma hospital discharges per 100 adultswith current asthma in 2002 to 1.76 per 100 in 2011.
� Asthma hospital discharges among those with currentasthma increased with age. The 65 year and older age group (3.6 per 100 in 2011) consistently had the highest at-risk based rate for asthma hospital dischargescompared to other adult age groups in New York State.
� From 2002 to 2011, among adults with current asthmain New York State, women consistently had higher at-riskbased rates for asthma hospital discharges compared to men (1.90 versus 1.51 per 100 in 2011, respectively).However, the rate decreased for both women and menduring this period.
� From 2002 to 2011, among adults with current asthma, non-Hispanic Blacks (2.9 per 100 in 2011) and Hispanics (2.4 per 100 in 2011) consistently hadhigher at-risk based rates for asthma hospital dischargescompared to non-Hispanic whites (1.02 per 100 in 2011) in New York State.
Asthma Hospital Discharges, 2002-2011

20
� From 2002 to 2011, the at-risk based rate for hospitaldischarges among adults with current asthma living inNew York City was higher compared to those in the Restof State (2.46 vs. 1.20 per 100 in 2011).
Asthma Hospital Discharge Rates for Children withCurrent Asthma (At-Risk Based Rates), 2006-2010
� For 2006-2010, there was an annual average of 3.5asthma hospital discharges per 100 children with currentasthma in New York State.
� For 2006-2010, among New York State children withcurrent asthma, the 0-4 year age group had the highestat-risk based rate for asthma hospital discharges (10.1per 100) compared to all other child age groups.
� The at-risk based rate for asthma hospital discharges for2006-2010 was higher for boys (4.0 per 100) comparedto girls with current asthma (3.0 per 100).
� Among children with current asthma, the 2006-2010 at-risk based rate for asthma hospital discharges washighest for Hispanic children (15.4 per 100) followed by non-Hispanic black children (7.1 per 100).
� The at-risk based rate for asthma hospital discharges for 2006-2010 was almost five times higher for childrenwith current asthma living in New York City (7.7 per 100)compared to those living in the Rest of State (1.6 per 100).
� New York had an annual average of 258 deaths fromasthma for 2009-2011, for a rate of 13.3 deaths per 1 million residents.
� In the past 10 years, New York State’s asthma death ratedecreased 24% from 17.2 per 1 million residents in2002 to 13.1 per 1 million residents in 2011. Similardecreases were seen for residents of the Rest of Stateand New York City.
� For 2009-2011, New York State women had a slightlylower 2009-2011 age-adjusted asthma death rate (12.1per 1 million) compared to men (12.3 per 1 million).
� For 2009-2011, non-Hispanic black (31.7 per 1 million)and Hispanic (22.1 per 1 million) New York Stateresidents had higher age-adjusted mortality ratescompared to non-Hispanic white residents (6.7 per 1 million).
� For 2009-2011, New York City’s age-adjusted asthmamortality rate (19.8 per 1 million) was more than doublethe rate for the Rest of State (7.2 per 1 million). WithinNew York City, Bronx County had the highest age-adjustedasthma death rate (43.5 per 1 million.
Asthma Death Rates for Adults with Current Asthma (At-Risk Based Rates), 2002-2011
� From 2002 to 2011, the annual at-risk based rate forasthma deaths in New York State decreased from 27.2asthma deaths per 100,000 adults with current asthma in2002 to 16.7 per 100,000 in 2011. Similar decreases wereseen for residents of the Rest of State and New York City.
� From 2002 to 2011, the at-risk based rate for asthmadeaths decreased for both women and men. Women hadthe highest at-risk based asthma death rate for 2004 to2006. However, in more recent years from 2007 through2011, men had higher rates than women.
� From 2002 to 2011, among adults with current asthma,non-Hispanic blacks (37.3 per 100,000 in 2011) andHispanics (18.8 per 100,000 in 2011) consistently hadhigher at-risk based rates for asthma deaths compared to non-Hispanic whites (10.7 per 100,000 in 2011).
� Among adults with current asthma, the 2011 at-riskbased rate for asthma deaths was approximately two times higher for residents with current asthma in New York City compared to those in the Rest of State(24.5 vs.10.3 per 100,000).
Asthma Deaths, 2002-2011
21
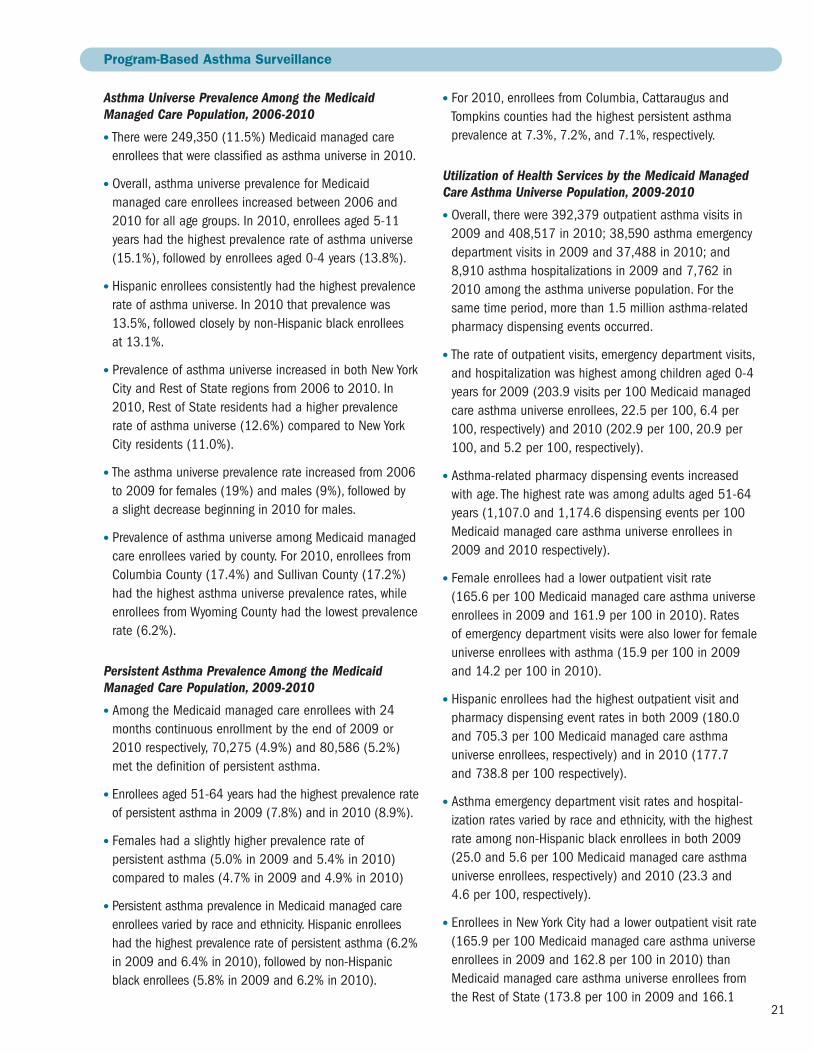
Asthma Universe Prevalence Among the MedicaidManaged Care Population, 2006-2010
� There were 249,350 (11.5%) Medicaid managed careenrollees that were classified as asthma universe in 2010.
� Overall, asthma universe prevalence for Medicaidmanaged care enrollees increased between 2006 and2010 for all age groups. In 2010, enrollees aged 5-11years had the highest prevalence rate of asthma universe(15.1%), followed by enrollees aged 0-4 years (13.8%).
� Hispanic enrollees consistently had the highest prevalencerate of asthma universe. In 2010 that prevalence was13.5%, followed closely by non-Hispanic black enrollees at 13.1%.
� Prevalence of asthma universe increased in both New YorkCity and Rest of State regions from 2006 to 2010. In2010, Rest of State residents had a higher prevalencerate of asthma universe (12.6%) compared to New YorkCity residents (11.0%).
� The asthma universe prevalence rate increased from 2006to 2009 for females (19%) and males (9%), followed by a slight decrease beginning in 2010 for males.
� Prevalence of asthma universe among Medicaid managedcare enrollees varied by county. For 2010, enrollees fromColumbia County (17.4%) and Sullivan County (17.2%)had the highest asthma universe prevalence rates, whileenrollees from Wyoming County had the lowest prevalencerate (6.2%).
Persistent Asthma Prevalence Among the MedicaidManaged Care Population, 2009-2010
� Among the Medicaid managed care enrollees with 24months continuous enrollment by the end of 2009 or2010 respectively, 70,275 (4.9%) and 80,586 (5.2%)met the definition of persistent asthma.
� Enrollees aged 51-64 years had the highest prevalence rateof persistent asthma in 2009 (7.8%) and in 2010 (8.9%).
� Females had a slightly higher prevalence rate ofpersistent asthma (5.0% in 2009 and 5.4% in 2010)compared to males (4.7% in 2009 and 4.9% in 2010)
� Persistent asthma prevalence in Medicaid managed careenrollees varied by race and ethnicity. Hispanic enrolleeshad the highest prevalence rate of persistent asthma (6.2%in 2009 and 6.4% in 2010), followed by non-Hispanicblack enrollees (5.8% in 2009 and 6.2% in 2010).
� For 2010, enrollees from Columbia, Cattaraugus andTompkins counties had the highest persistent asthmaprevalence at 7.3%, 7.2%, and 7.1%, respectively.
Utilization of Health Services by the Medicaid ManagedCare Asthma Universe Population, 2009-2010
� Overall, there were 392,379 outpatient asthma visits in2009 and 408,517 in 2010; 38,590 asthma emergencydepartment visits in 2009 and 37,488 in 2010; and8,910 asthma hospitalizations in 2009 and 7,762 in2010 among the asthma universe population. For thesame time period, more than 1.5 million asthma-relatedpharmacy dispensing events occurred.
� The rate of outpatient visits, emergency department visits,and hospitalization was highest among children aged 0-4years for 2009 (203.9 visits per 100 Medicaid managedcare asthma universe enrollees, 22.5 per 100, 6.4 per100, respectively) and 2010 (202.9 per 100, 20.9 per100, and 5.2 per 100, respectively).
� Asthma-related pharmacy dispensing events increasedwith age. The highest rate was among adults aged 51-64years (1,107.0 and 1,174.6 dispensing events per 100Medicaid managed care asthma universe enrollees in2009 and 2010 respectively).
� Female enrollees had a lower outpatient visit rate (165.6 per 100 Medicaid managed care asthma universeenrollees in 2009 and 161.9 per 100 in 2010). Rates of emergency department visits were also lower for femaleuniverse enrollees with asthma (15.9 per 100 in 2009and 14.2 per 100 in 2010).
� Hispanic enrollees had the highest outpatient visit andpharmacy dispensing event rates in both 2009 (180.0and 705.3 per 100 Medicaid managed care asthmauniverse enrollees, respectively) and in 2010 (177.7 and 738.8 per 100 respectively).
� Asthma emergency department visit rates and hospital -ization rates varied by race and ethnicity, with the highestrate among non-Hispanic black enrollees in both 2009(25.0 and 5.6 per 100 Medicaid managed care asthmauniverse enrollees, respectively) and 2010 (23.3 and 4.6 per 100, respectively).
� Enrollees in New York City had a lower outpatient visit rate(165.9 per 100 Medicaid managed care asthma universeenrollees in 2009 and 162.8 per 100 in 2010) thanMedicaid managed care asthma universe enrollees fromthe Rest of State (173.8 per 100 in 2009 and 166.1
Program-Based Asthma Surveillance

22
per 100 in 2010). However, rates of asthma emergencydepartment visits, hospitalizations, and pharmacydispensing events were higher for those who reside inNew York City for both 2009 (18.2, 4.2, and 693.3 per100, respectively) and 2010 (16.8, 3.5, and 734.6 per100, respectively) compared to those in the Rest of Statein 2009 (12.4, 2.8, and 566.6 per 100, respectively) and 2010 (11.0, 2.1, and 598.4 per 100, respectively).
Asthma Universe Prevalence Among the Child Health Plus Population, 2010
� A total of 226,019 children aged 0-18 were enrolled inthe Child Health Plus program (CHP) in 2010, and 23,553(10.4%) enrollees were classified as asthma universe.
� In 2010, the asthma universe prevalence rate was highestamong the 0-4 age category (12.9%), and the 5-11 year age category (12.8%). The highest asthma universeprevalence rate by gender, race and ethnicity, region andcounty was observed among male enrollees (11.7%);non-Hispanic black enrollees (11.5%); residents of theRest of State (11.6%); and residents of Livingston County(16.4%) respectively.
Persistent Asthma Prevalence Among the Child Health Plus Population, 2010
� In 2010, there were 9,320 (6.4%) Child Health Plusenrollees classified as having persistent asthma.
� The highest persistent asthma prevalence was seenamong those aged 5-11 years (8.3%), male enrollees(7.4%), non-Hispanic black enrollees (7.4%), Rest ofState residents (7.4%), and residents of St. LawrenceCounty (10.6%).
Utilization of Health Services by the Child Health PlusAsthma Universe Population, 2010
� In 2010, there were 35,899 outpatient visits; 2,218emergency department visits; and 537 hospitalizationsdue to asthma among the asthma universe population forChild Health Plus enrollees. In addition, 104,046 asthma-related dispensing events occurred in 2010.
� The highest rate of outpatient visits, emergencydepartment visits, and hospitalizations were seen amongchildren aged 0-4 years (182.6, 14.5, and 5.8 per 100Child Health Plus asthma universe enrollees, respectively).
� Asthma-related pharmacy dispensing event rates variedby age group. The highest rate was among the 5-11 yearold age group (478.6 dispensing events per 100 ChildHealth Plus asthma universe enrollees).
� Child Health Plus asthma universe female enrollees had a lower outpatient visit rates, emergency department visit rates, and pharmacy dispensing events (148.5, 8.7, and 422.1 per 100 CHP asthma universe enrollees,respectively) than male enrollees (155.3, 10.0, and456.3 per 100, respectively). Asthma hospitalizationswere the same across gender for 2010 (2.3 per 100).
� Non-Hispanic black enrollees had the lowest outpatientvisit rate (147.7 per 100 Child Health Plus asthmauniverse enrollees). Non-Hispanic white and Hispanicenrollees had the highest outpatient visit rates (154.4and 154.2 per 100, respectively).
� Asthma emergency department visit and hospitalizationrates were highest among non-Hispanic black enrollees(16.6 and 4.7 per 100 Child Health Plus asthma universeenrollees, respectively).
� The highest rate of asthma-related pharmacy dispensingevents was among Hispanic and non-Hispanic otherenrollees (406.6 and 407.9 dispensing events per 100Child Health Plus asthma universe enrollees, respectively).
� Those living in Rest of State had a higher outpatient visitrate and rates of pharmacy dispensing events (156.7 and 465.0 per 100 Child Health Plus asthma universeenrollees, respectively) than those living in New York City(143.3 and 392.3 per 100, respectively). However, rates ofasthma emergency department visits and hospitalizationswere higher for those living in New York City (13.3 and 2.8per 100, respectively) compared to those living in the Restof State (7.6 and 2.1 per 100, respectively).
Managed Care Quality Assurance Reporting Requirement Asthma-Specific Indicator, 2010
� Among children with persistent asthma ages 5-11, 96%of enrollees of Commercial plans and 95% of enrollees ofChild Health Plus plans received appropriate medicationsfor asthma, compared to 92% for children with persistentasthma in Medicaid managed care plans.
� In 2010, Commercial HMO plans showed a slightly higherproportion of enrollees aged 12-50 years with persistentasthma receiving appropriate medications (91%) com -pared to enrollees in Medicaid (88%) or Commercial PPO (82%) plans.
� In 2010, children aged 5-11 years with persistent asthmawho were enrolled in Commercial (82%) health plans andChild Health Plus (81%) were more likely to have three or more controller medications dispensed in the past yearcompared to those enrolled in Medicaid managed careplans (76%).

23
� In 2010, a higher proportion of individuals aged 12-50years with persistent asthma who were enrolled inCommercial health plans had three or more controllermedications dispensed in the past year (81%) comparedto those enrolled in Medicaid managed care plans (77%).
� In 2010, among individuals aged 5-50 years withpersistent asthma, Orleans County had the lowestpercentage of individuals (less than 80%) who receivedappropriate medications to control their asthma.
� In 2010, among children aged 5-11 years with persistentasthma, children in Orleans and Genesee counties hadthe lowest percentage of children (less than 70%) whohad three or more controller medication dispensingevents in the past year.
Prevention Quality Indicators and Pediatric QualityIndictors for the Medicaid Managed Care AsthmaUniverse Population, 2010
� In 2010, among the asthma universe population aged 2-17 years, 44.2% of asthma hospital admissions in NewYork State could potentially have been avoided throughmore effective outpatient care. The number of preventableasthma hospital admissions was nearly two times higher forchildren (0-17 years) than adults (18-39 and 40+ years).
� In 2010, among the asthma universe population aged18-39 years, 22.5% of asthma hospital admissions inNew York State could potentially have been avoidedthrough more effective outpatient care.
� In 2010, among the asthma universe population aged 40 years and older, 23.7% of asthma hospital admissionsin New York State could potentially have been avoidedthrough more effective outpatient care.
� For 2005-2010, approximately 14.9% of adults withcurrent asthma in New York State indicated that either a health professional had informed them they had work-related asthma, or they had informed a healthprofessional of such.
� For 2001 to 2010, annual work-related asthma hospitaldischarges ranged from 41 to 90 per year in New York State.
� The average length of stay for a work-related asthmahospitalization increased over time from 3.8 to 4.1 days,and the average cost increased for the 2001 to 2010 timeperiod. The total cost of all work-related asthma hospital -izations in 2010 was approximately $1.085 million.
Work-Related Asthma, 2001-2010
� The total cost of asthma hospitalizations in New YorkState for 2011 was approximately $660 million, a 61% increase in cost since 2002 ($409 million). The Consumer Price Index-adjusted asthma hospitalizationcost increased 19% from the 2002 adjusted cost of$556 million.
� The average cost per asthma hospitalization increased78% from $10,080 in 2002 to $17,954 in 2011. Theaverage adjusted asthma hospitalization cost increased27% over this time. This occurred despite the averagelength of stay for an asthma hospitalization decreasing5%, from 3.8 days to 3.6 days, for the same time period.
� The average cost per asthma hospitalization increasedwith age. The 2011 average costs ranged from $10,308for the 0-4 year age group to $26,459 for those aged 65 years and older.
� In 2010, among the Medicaid managed care population,more than $276 million was spent on more than 249,350asthma universe individuals for asthma-related services.The average cost was $1,109 per asthma enrollee.
� The average asthma-related service cost among theMedicaid managed care asthma universe population was highest for patients aged 51-64 ($1,864), for non-Hispanic black and Hispanic patients ($1,187 and $1,182, respectively) and for patients who reside in New York City ($1,191).
Asthma Costs, 2002-2011

24
2010 NYS Building Condition Survey
The NYS Building Condition Survey tracks conditions inNYS public schools that may affect school indoor air quality.
Although relatively few school buildings reported havingnoticeable moldy odors (3.8%) in 2010, about 35% reportedat least one type of moisture or humidity problem, which can indicate the potential for mold growth.
Various ventilation-related problems, which can affectindoor air quality, were reported by schools in 2010. Aboutone-fifth of schools reported inadequate outside air intake,about 13% reported problems with malfunctioning dampers,and about 10% reported potential diesel intrusion, blockedair intakes and dirt or dust near or in the system.
About 5% of buildings reported rodents, cockroaches,wood eating insects or other pests in 2010.
Ozone and PM2.5
For 2007-2009, there were unhealthy ozone days eachyear at several locations across the state. Elevated ozonelevels occurred most commonly near and downwind ofmajor cities. Unhealthy ozone days mainly occur from Maythrough September. The frequency of unhealthy ozone days per year tended to decline from 2000 to 2009.
For 2007-2009, the number of days when fine particleconcentrations were unhealthy for sensitive groups, such aspeople with asthma, was greatest in the New York City area,less in the smaller-sized cities and lowest in rural areas. The frequency of unhealthy fine particle days per yeartended to decline from 2000 to 2009.
Pollen
Tree pollen season typically begins in the spring andends in early summer. For 2003 to 2010, the averagepercentage of days in late March to mid-June when treepollen counts were at or above the national threshold for a “high” pollen count ranged from 49% to 84%.
Grass pollen season typically begins later in the spring andcontinues through late summer or early fall. For 2003 to 2010the average percentage of days in late April to mid-Septemberwhen grass pollen counts were at or above the nationalthreshold for a “high” pollen count ranged from 3% to 67%.
Weed pollen season typically begins mid to late summerand continues through the fall. For 2003 to 2010, theaverage percentage of days in late May to early October whenweed pollen counts were at or above the national thresholdfor a “high” pollen count ranged from none to 37%.
Asthma and the Environment

25
New York State Department of Health Asthma Initiatives
The New York State Department of Health (NYSDOH) aims toreduce the burden of asthma, as demonstrated by a reduc-tion in asthma emergency department visits, a reduction inasthma hospital discharge rates, and an increase in thequality of life for all New Yorkers with asthma, especiallythose disproportionately impacted by asthma. To accomplishthis, the NYSDOH is committed to:
� Promoting a healthy and safe environment for NewYorkers with asthma,
� Increasing access to quality, guideline-concordantasthma care,
� Eliminating disparities in health outcomes for New Yorkers with asthma,
� Using NYS asthma surveillance data in the develop -ment and monitoring of asthma policies, programsand actions implemented throughout the state, and
� Maintaining a coordinated approach to achievingstated outcomes.
Overview of New York State Department of Health Asthma Initiatives
Asthma Partnership of New York (APNY)
The Asthma Partnership of New York (APNY), a public and private collaboration, has mobilized a coalition of partners across the state to plan, implement and evaluatecommunity-based and patient-centered strategies toimprove asthma-associated outcomes. The APNY connectsan expansive network of organizations and experts toimplement key asthma initiatives, focusing on areas with a high burden of asthma. Partners include the New York City Department of Health and Mental Hygiene, the NewYork State Education Department, the Business Council of New York State, medical societies, regional asthma coalitions, professional societies and associations, healthplans, hospitals, clinics, home intervention programs and community organizations.
Surveillance and Program Evaluation
� Maintaining and updating asthma measures for thefollowing datasets: Behavioral Risk Factor SurveillanceSystem (BRFSS); BRFSS Asthma Call-Back Survey;emergency department visit data; hospital discharge data;mortality data; Medicaid encounter data; OccupationalLung Disease Registry; Occupational Health Clinic Networkdata; and the New York State Youth Tobacco Survey.
� Asthma population-based survey surveillance: Collectdata and analyze lifetime and current asthma prevalence,age at diagnosis, symptoms/episodes, knowledge ofasthma/management plan, medications, modifications to environment, school/work-related asthma, and access to care information annually using the BRFSSCore Survey and the BRFSS (Child and Adult) AsthmaCall-Back Survey.
� Asthma emergency department visit surveillance: Obtaindata and analyze asthma ED emergency department visitrates by socio-demographic categories as well as generateasthma emergency department visit rates at the state,regional, county and ZIP code levels
� Asthma hospital discharge surveillance: Obtain data and analyze asthma hospital discharge rates by socio-demographic categories as well as generate asthmahospital discharge rates at the state, regional, county and ZIP code levels.
� Asthma mortality surveillance: Obtain and analyze crude and age-adjusted asthma mortality rates by socio -demographic categories as well as generate asthmamortality rates at the state, regional and county levels.
3

26
� Asthma Medicaid and Child Health Plus surveillance:Utilize Medicaid and Child Health Plus encounter andclaim data derived from the Office of Health InsurancePrograms to assess asthma prevalence, costs, health care utilization, and quality of care among the Medicaidand Child Health Plus populations.
� Work-related asthma surveillance: Assess work-relatedasthma incidence utilizing the Occupational Lung DiseaseRegistry and the Occupational Health Clinic Network. Work-related asthma hospitalizations and costs in NYS aregenerated using hospital discharge data, the BRFSS CoreSurvey, and the BRFSS Adult Asthma Call-Back Survey.
� Disseminating current NYS asthma surveillanceinformation via surveillance reports, presentations and articles, and the NYSDOH public website (see www.health.ny.gov/statistics/ny_asthma/index.htm). The following asthma information is presented on theNYSDOH public website:
– Lifetime and current asthma prevalence by selectedsocio-demographic groups are presented for theUnited States and NYS. Asthma prevalence data areproduced from the responses to two asthma questionson the BRFSS Core Questionnaire.
– Emergency department and hospital discharge data are used to create county-specific and ZIP codelevel asthma emergency department and hospitaldischarge data tables, graphs, and maps organized by NYS regions.
– Death certificate data from the NYS Vital Statisticsdatabase are used to create both crude and age-adjusted county-specific asthma death rates,organized by NYS regions.
� Providing technical assistance: Technical assistanceregarding needs assessment, program targeting, evidence-based interventions and program monitoring andevaluation are provided to local health departments,hospitals, regional asthma coalitions and other partners.
� Evaluating the NYS Asthma Program: NYS has developedand implemented a five-year strategic evaluation plan for the Asthma Program based on the CDC Framework for Program Evaluation in Public Health. A comprehensiveevaluation is under way of the NYS asthma partnership,asthma surveillance system and key asthmainterventions. Findings will be used to guide program and policy efforts and will be shared with local, statewideand national audiences.
Health Care
� Child Health Plus: Child Health Plus provides coverage to children under the age of 19 residing in NYS withlimited family incomes and no health insu rance (see www.health.ny.gov/health_care/child_health_plus/).
� Healthy New York: This program provides reduced-cost,comprehensive health insurance to small employers,uninsured working individuals, and sole proprietors. (A sole proprietor is a person who owns a business in which he or she is the only employee). (See www.health.ny.gov/publications/0548/healthy_new_ york.htm)
� Medicaid: Medicaid recipients have access to a benefitpackage covering services necessary to manage asthma,including but not limited to medications and prescriptiondrugs, spacers, pulmonary diagnostic tests, doctor visits and hospital care (see www.nyhealth.gov/health_care/ medicaid/index.htm).
� Quality Assurance Reporting Requirements (QARR)Report: The most recent version of this report identifieshow Medicaid managed care plans and commercialinsurance plans perform on specific health measures,including use of appropriate medications for asthma. The report represents one of the most comprehensivereport cards for managed care in the nation (see www.health.ny.gov/health_care/managed_care/reports/ quality_performance_improvement.htm#link2).
� Clinical Guidelines for the Diagnosis, Evaluation, and Management of Adults and Children with Asthmais a clinical decision support tool produced by a NYS expert panel, and is based on the Clinical Application of the National Asthma Education and PreventionProgram’s (NAEPP) Expert Panel Report-3 (EPR-3), which provides guidelines for the diagnosis andmanagement of asthma. This decision support tool has established a common standard of care for providers and health plans, has been endorsed byprofessional societies, associations and health plans, and distributed to more than 24,000 physicians in NYS (see www.health.ny.gov/diseases/asthma/).
� Asthma in Primary Care Practice: This tutorial is based on the NAEPP EPR-3 and promotes the translation of the asthma guidelines into primary care practice. The course was reviewed and is acceptable for threeevidenced-based CME credits by the American Academyof Family Physicians. To order the course on DVD, seewww.health.ny.gov/forms/order_forms/asthma.pdf.To access the on-line course, see http://jeny.ipro.org/ files/Asthma/.

27
� Asthma Self-Management Education: Medicaid coveragefor Asthma Self- Management Training (ASMT) services is provided in NYS for Medicaid beneficiaries diagnosedwith asthma when these services are ordered by aphysician, registered physician’s assistant, registerednurse practitioner, or a licensed midwife. ASMT servicesmust be provided by a New York State licensed,registered, or certified health care professional, holding a current certification as an educator by the NationalAsthma Educator Certification Board. Certified AsthmaEducators (AE-Cs) are required to enroll in the NYSMedicaid program as non-billing providers and must beemployed by or contracted with an appropriate billingprovider. For more information about AE-C enrollment forms and instructions see www.emedny.org/info/ ProviderEnrollment/index.aspx. For detailed information regarding asthma education services, refer to the October 2008 Medicaid Update (see www.nyhealth.gov/ health_care/medicaid/program/update/2008/2008-10.htm#dia).
Community-Based Initiatives
� Asthma Website: The NYSDOH maintains a public asthma website (see www.health.ny.gov/diseases/asthma/) withinformation on asthma surveillance, interventions, care and educational materials.
� Regional Asthma Coalitions: The NYSDOH funds regionalasthma coalitions in areas with a high burden of asthmaacross the state. The coalitions bring healthcare andcommunity partners together, including hospitals, clinics,primary care health providers, asthma specialists, healthplans, schools, community organizations, public health,businesses and other public and private groups, torespond to the asthma epidemic that must be addressedand solved locally. The coalitions develop, implement,spread and sustain population-based, policy and systemlevel changes with and for their communities. For more information and to contract your regional asthma coalition, see www.health.ny.gov/diseases/asthma/ coalitions.htm
� NYS Asthma Outcomes Learning Network: Implementationof this large scale, population based, system changeintervention is accomplished in collaboration with theregional asthma coalitions. Teams of local health care and community partners receive training and coaching on using evidence based approaches to to translate theNAEPP EPR-3 guidelines into practice. Key learning princi -ples, tools, and results are shared through the network.
� Asthma and Influenza: NYSDOH launched an Asthma and Influenza Education Campaign to raise awarenessabout the importance of receiving influenza vaccination,especially for those with asthma. Educational materialsfor providers, people with asthma and their families, and the community were developed and are available on the public web site (see www.health.ny.gov/diseases/ asthma/influenza).
� Winning with Asthma Coaches Clipboard Program:This 30-minute online educational program was createdto train coaches about asthma, how asthma affects an athlete’s ability to compete, and how a coach can help athletes control their asthma while playing their very best (see www.health.ny.gov/diseases/asthma/ athletic_field.htm). The Asthma Program is promoting this program among coaches of youth sports and activities,athletic directors, physical education teachers and school nurses.
� Students with Asthma: NYS Legislation passed in 1998(Education Law 16, Article 19, Section 916) requiresschools and Boards of Cooperative Educational Services(BOCES) to allow students who have been diagnosed by a physician with a severe asthmatic condition to carryand use prescribed inhalers for the school day.
Environmental and Occupational Health
� Healthy Neighborhoods Program: The Healthy Neighbor -hoods Program provides in-home assessments andinterventions for asthma, tobacco cessation, indoor air quality, lead and fire safety in selected communitiesthroughout NYS. For residents with asthma, interventionsmay include asthma trigger education; dust, mold, andpest control measures; distribution of pillow and mattresscovers; and smoking cessation education. An evaluation of the asthma component of this program for 1997-2000found that it reduced hospitalizations and was cost-effective. A more recent program evaluation indicates significant improvements in exposure to environmentaltriggers, patient self-management and short-term asthmamorbidity. The program received the National Environ -mental Leadership in Asthma Management Award from the U.S. Environmental Protection Agency in 2011 (see www.asthmacommunitynetwork.org/node/6163, www.health.ny.gov/environmental/indoors/healthy_neighborhoods/, and https://health.data.ny.gov/ Health/Healthy-Neighborhoods-Revisited-Dwellings-Initial-49ua-zw9a).

28
� Healthy Home Environments for New Yorkers with Asthma (HHENYA): People with asthma frequently live in environments that exacerbate their symptoms andminimize their ability to control their asthma. In WesternNY, NYSDOH collaborated with four managed care plansand the Erie County Healthy Neighborhoods Program to develop and implement a pilot program to integratemanagement of environmental triggers into routine asthmacare. Participating health plans identified and referredeligible patients to the HHENYA program, which providedeach patient with an in-home assessment, education,supplies and referrals to address environmental and otherproblems identified for the home visit. To reinforce theeducation provided, a summary of the home visit was sentto each patient, his or her doctor and the referring healthplan. Preliminary findings suggest that this may be aneffective approach for reducing exposure to environmentalasthma triggers, improving patient self-management and reducing short-term asthma morbidity (see www.publichealthreports.org/EOH-abstracts/Places.cfm).
� School AIR Collaborative (Addressing Indoor Air Quality(IAQ) Roadblocks): Many resources are available to helpschools identify and fix IAQ problems that may affectstudents and staff with asthma, but these resources arenot always used. Findings from earlier NYSDOH surveyssuggest that even when policies or practices exist, they are not always enforced or fully implemented. Aninterdisciplinary team within the NYS Asthma Programworked with 10 schools in the Capital District region tolearn more about potential barriers to implementation of IAQ programs and to identify strategies for overcomingthose barriers. The majority of staff rated IAQ as a highpriority, comparable in importance to other health andsafety issues, felt that IAQ had an impact on studentsand staff and reported a willingness to take responsibilityfor IAQ in their schools. However, there were notabledifferences in the IAQ challenges faced by different school types (e.g., elementary vs. high school) and in the perceptions, beliefs and attitudes of differentoccupational groups (e.g., teachers vs. facilities staff). An improved understanding of potential differences andsimilarities between occupational groups and schooltypes may improve programs and materials at theindividual school level and for programs developingregional or statewide approaches to improving schoolindoor air quality.
� School Environmental Assessment Project: This projectconsisted of surveying school nurses, custodians anddistrict facilities managers to determine the influence of
the school environment on childhood asthma, and theprograms, practices and policies in place to address theschool environment. The NYS Education Department’s(NYSED) 2000 Building Condition Survey (BCS) providedinformation about the overall condition of NYS schoolbuildings and the condition of building systems, such asventilation, plumbing, building envelope, etc. Hospitalizationdata were analyzed to identify patterns that may be linkedto these school building conditions. A summary report,Asthma and the School Environment in NYS, wasdisseminated to school districts and stakeholders acrossNYS to share project findings and statewide informationthat may help schools to create asthma-friendly learning environments (see www.health.ny.gov/diseases/asthma/ asthma_in_schools.htm). Since the BCS is conducted every five years, Bureau of Environmental and OccupationalEpidemiology staff have added questions to subsequentBCS’s that are specific to indoor air quality; staff continueto monitor changing school conditions over time using this instrument.
� Green Schools Project: The relationship between occupanthealth and performance and “green” school character -istics such as indoor air quality, dryness, well-maintainedsystems, good acoustics and lighting were examinedthrough data sources. These data are obtained from the2005 school Building Condition Survey, attendance andacademic test score data from New York State EducationDepartment, hospitalization data, teacher surveys and selected school walkthroughs. When examining thepotential relationship between building conditions andschool district asthma hospitalization rates, resultsindicated that lower admission rates were associated with school districts that had a higher “cleanliness score” even after controlling for potential confounders.
� In a statewide teacher survey that was conducted in collaboration with New York State United Teachers in 2010, almost 10% of surveyed teachers reported they had asthma. In this random sample of almost 500 teachers, they frequently reported conditions known to be asthma triggers in their classroom. Lastly, manyteachers (43.5%) reported experiencing one or moreallergic symptoms during the 2010-2011 school year.
� EPA STAR Grant (Environmental Protection AgencyScience to Achieve Results grant): A new project,Assessing the Linkage Between School-RelatedEnvironment, Children’s School Performance and Health,and Environmental Policies Through Public HealthTracking, will develop new and improve existing Environ -mental Public Health Indicators (EPHIs) related to
29
the school environment. It will also evaluate the linkagebetween school and children’s health and schoolperformance (test scores, attendance), as well as theimpacts of environmental policy on these outcomes. Thedevelopment and evaluation of school-related environ -mental health indicators could help enhance the capacityof NYS’s Environmental Public Health Tracking (EPHT)program to monitor school environments and theirpotential impacts. Also, indoor and outdoor schoolenvironmental hazards will be examined in relation toasthma hospital admissions, emergency department visits and other school-related outcomes.
� Work-Related Asthma: Work-related asthma (WRA) affects at least one out of every six individuals withasthma, and is the most prevalent occupational lungdisease in developed countries. The NYSDOH conductssurveillance of WRA, provides education on WRA tophysicians and individuals with asthma, and conductsinterventions to help prevent ongoing and futureexposures. Physicians are provided information on thediagnosis of WRA and encouraged to consider workplacefactors with every case of adult-onset asthma or asthmathat worsens in adulthood. The program follows up withworkers and employers to help prevent ongoing and futureexposures, using phone consultations, industrial hygiene site visits and hazard alerts (see www.health.ny.gov/ diseases/asthma/work_related_asthma.htm).
� American Academy of Allergy Asthma and Immunology(AAAAI) ARTrust Mini-grant: A project titled CleaningProducts and Asthma: Education and Information for theHospitality Industry will develop educational materialsregarding cleaning products and asthma to be distributedto the hospitality industry in NYS. Materials will bedeveloped for workers and employers. Worker materialswill be translated into Spanish. The educational materialswill include information on the association betweencleaning products and asthma, symptoms that mayindicate asthma, how to choose and safely use less toxiccleaning products, proper use of personal protectiveequipment and a list of additional resources. Materialswill be distributed to the approximately 5,500 permittedtemporary residences in NYS. The availability of theeducational materials will be promoted througheducational webinars for businesses that are part ofprofessional organizations. The materials will also bemade available through the NYSDOH website.
� Air Quality Health Advisories: The Commissioners ofNYSDOH and the NYS Department of EnvironmentalConservation (NYSDEC) issue a joint press release when
forecasted levels of outdoor ground-level ozone or fineparticle concentrations are of concern, especially forpeople with health conditions such as asthma. Localhealth units and media outlets are notified of advisoriesin their regions and are directed to the NYSDOH andNYSDEC websites for advice on ways to reduce exposureand steps that citizens can take to reduce air pollution (see www.health.ny.gov/environmental/air_quality/ index.htm#outdoor_air, www.dec.ny.gov/public/ 43563.html and www.dec.ny.gov/cfmx/extapps/aqi/ aqi_forecast.cfm).
� Asthma-Related NYSDEC Enforcement Programs and Initiatives: NYSDEC’s Stop Smoking Trucks and IdlingVehicles Initiative addresses heavy duty diesel vehicleemissions in environmental justice communities (SeeAppendix 1) experiencing high asthma hospitalizationrates by conducting enforcement activities that targetvehicle emissions. Under the initiative, NYSDEC lawenforcement officers issue tickets to diesel trucks that fail to comply with state standards on emissions and totrucks or buses idling illegally. After piloting the initiativein New York City in 2007, NYSDEC expanded the programstatewide in November 2008. NYSDEC’s targetedenforcement operations continue in environmental justicecommunities across New York. Building on the success of the Stop Smoking and Idling Trucks Initiative, NYSDECdeveloped and launched Operation ECO-Quality PilotProgram in Westchester County in Fall 2010. WhileOperation ECO-Quality continues to focus on addressingthe air quality impacts of diesel trucks on communitieswith elevated asthma rates, the Pilot Program expands thescope of enforcement efforts to include activities relatedto selected large and smaller regulated facilities. (See www.dec.ny.gov/docs/permits_ej_operations_pdf/ecoqualrpt.pdf).
� Environmental Education and Outreach Project: Throughthis project, a statewide asthma educational needsassessment was conducted to determine key messagesand best-practice educational materials regarding theenvironmental and occupational triggers of asthma. Theassessment found persistent problems in communicationbetween providers and their patients. As a result, NYSDOHand partners developed new educational materials toenhance communication between patients and providers,including the new Have Asthma? brochure and TriggerTracker tool. These materials are designed to meet arange of literacy skills and are available in English and Spanish (see www.health.ny.gov/publications/4990/). The Pediatric/Adult Asthma Coalition of New Jersey recentlyproduced a video series, Six Steps to Controlling Your

30
Asthma, which features the NYSDOH Trigger Tracker as atool for helping doctors and patients communicate about asthma triggers (see www.pacnj.org/triggers.html).
� Environmental Public Health Tracking (EPHT): EPHT is theongoing collection, integration, analysis and interpretationof data on environmental hazards and potential healtheffects related to exposures to these hazards. For nineyears, NYSDOH has received funding from the Centers forDisease Control and Prevention (CDC) to develop an EPHTnetwork that tracks a core set of nationally consistentdata relating to issues such as asthma, ambient airconcentrations of ozone and fine particles. The NYS EPHT program is collaborating with the NYSDOH AsthmaProgram, the NYSDEC, CDC and the U.S. EnvironmentalProtection Agency to disseminate coherent public healthmessages based on the analyses of these data, and haspartnered with Emory University, University of Medicineand Dentistry New Jersey, National Aeronautics and SpaceAdministration (NASA) and the University of California atBerkeley in projects to better understand the impact of airpollution on health outcomes, including asthma (see www.health.ny.gov/environmental/public_health_tracking/)
� Environmental Health Research: The NYSDOH supportscontinuing analysis and exploration to determine the key
environmental factors contributing to asthma developmentand morbidity.
– www.health.ny.gov/environmental/ public_health_ tracking/program/publications Some research included studies of the potential health effectsassociated with ambient air contaminants; a study of the potential health impact of residential proximityto large NYS airports; a study of meteorologicalconditions (e.g., extreme heat) and health outcomes;assessment of asthma and contributing factors in the school and home environments.
– www.health.ny.gov/diseases/asthma/asthma_ in_schools.htm A study of green school building attributes and occupant health and performance; and follow-up health studies of World Trade Centerresponders and community residents.
– www.health.ny.gov/environmental/investigations/ wtc/health_studies/ Multiple projects assessing climate change on different health outcomes. TheNYSDOH builds upon information from environmentalasthma research to develop more effective publichealth programs aimed at reducing or eliminatingexposure to environmental factors.

31
Tracking Healthy People 2020 Asthma-Specific Objectives in New York State
The Healthy People 2020 initiative provides a comprehensiveset of national objectives for disease prevention and healthpromotion to be achieved over the second decade of this century. Sponsored by the U.S. Department of Health and Human Services, the objectives were developed through a broad consultation process and are built on the bestscientific knowledge about population health. The objectivesinclude public health priorities that can be used byindividuals, states, communities and professional organi -zations to develop health improvement programs.13
Healthy People 2020 objectives are national bench -marks. Its Focus Area 24: Respiratory Diseases14 includes
objectives for asthma emergency department visits, asthmahospitalizations, activity limitations, school or work days lost due to asthma, patient education, appropriate asthmacare, asthma mortality and maintaining and improvingasthma surveillance systems. NYS uses the Healthy People2020 asthma-related objectives to guide asthma preventionand control efforts, compare our progress with other statesand, ultimately, document New York’s contribution towardachieving national objectives.
This section provides the Healthy People 2020 nationalobjectives and updated data for asthma ED visits, asthmahospitalizations and asthma mortality for NYS and the nation.
Compared to the 2005-2007 time period, the mostrecent data for NYS (2009-2011) showed an increase inasthma emergency department visit rates for all age groups,ranging from 3% to 7%. NYS asthma emergency departmentvisit rates were higher for all age groups when compared
to the nation. NYS asthma emergency department visit rates were also higher than the Healthy People 2020objectives for all age groups, especially among childrenaged 0-4 years (Table 4-1).
Asthma Emergency Department Visits
4
Table 4-1 Asthma Emergency Department Visit Rate per 10,000 Residents by Age Group for New York State (2005-2011), United States (2009), and Healthy People 2020 Objectives
New York United Healthy States People Age Group 2005-2007 2007-2009 2009-2011 2009 2020
0–4 215.5 218.5 230.7 131.5 95.6
5–64 80.1 81.7 82.6 N/A 49.7
65+ 31.4 31.5 32.8 22.8 13.8

32
Asthma Mortality
Compared to the 2001-2003 time period, the mostrecent data for NYS (2009-2011) showed a reduction for asthma hospital discharge rates for those aged 0-64 years, ranging from 13% to 19%. However, asthma hospitaldischarge rates increased 21% for the population aged
65 years and older. Compared to the nation, NYS asthmahospital discharge rates were higher for all age groups. The 2009-2011 figures show that New York rates were still roughly two to three times higher than the HealthyPeople 2020 objectives for each age group (Table 4-2).
Asthma Hospital Discharges
Table 4-2 Asthma Hospital Discharge Rate per 10,000 Residents by Age Group for New York State (2001-2011), Healthy People 2020 Objectives, and United States (2009)
Compared to the 2001-2003 time period, the mostrecent data for NYS (2009-2011) showed a decrease inasthma mortality rates for all age groups, ranging from 15% to 27%. However, compared to the nation, NYS asthmamortality rates were higher for each age group with the
exception of the population aged 65 years and older. Also,NYS mortality rates were roughly two to three times higherthan the Healthy People 2020 objectives for the 35 yearand older age groups (Table 4-3).
Table 4-3 Asthma Mortality Rate per 1,000,000 Residents by Age Group for New York State (2001-2009), United States (2009), and Healthy People 2020 Objectives
New York United Healthy States People Age Group 2001-2003 2003-2005 2005-2007 2007-2009 2009-2011 2009 2020
0–4 71.5 67.2 59.1 58.8 58.0 40.6 18.1
5–64 17.3 17.0 15.3 15.5 15.1 N/A 8.6
65+ 26.7 30.0 29.9 31.2 32.2 29.0 20.3
New York United Healthy States People Age Group 2001-2003 2003-2005 2005-2007 2007-2009 2009-2011 2009 2020
0–34 5.4 4.7 4.2 4.0 4.6 N/A N/A
35–64 21.2 17.5 14.3 13.6 15.4 10.9 6.0
65+ 50.1 50.1 42.3 35.3 36.9 38.8 22.9

33
Asthma Survey Data
There are several different sources for asthma prevalencedata. However, population-based surveys are among themost commonly used sources for estimating asthmaprevalence. The wording of questions may differ betweensurveys, or can change from year to year.15 Asthmaprevalence from survey data for children and adults in New York State (NYS) and/or the United States (U.S.) is presented in this chapter.
The following surveys are included:
� Behavioral Risk Factor Surveillance System, 2002-2011
� Youth Tobacco Survey, 2012
Highlights: Asthma Survey Data
Behavioral Risk Factor Surveillance System, 2002-2011
Current Asthma Prevalence and Risk Behaviors in Adults,2002-2011
• In 2011, approximately 1.4 million adult New Yorkers(9.7%) had self-reported current asthma.
• From 2002 to 2010, there was an upward trend in theprevalence of current asthma among NYS residents.
• Adults who lived in New York City had a highercurrent asthma prevalence rate (10.2%) comparedto adults who lived in Rest of State (9.3%) in 2011.
• For the past 10 years, current asthma prevalencevaried by age group and fluctuated over time. In 2011, adults aged 18-24 years had the highestcurrent asthma prevalence (11.2%), while adultsaged 35-44 and 65+ years had the lowestprevalence (8.9% and 8.7%, respectively).
• Current asthma prevalence was consistently higherfor females than males. The 2011 prevalence ofcurrent asthma among NYS women (12.3%) was78% higher than the prevalence in men (6.9%).
• From 2003 to 2011, current asthma prevalencevaried by race and ethnicity. In 2011, Hispanic(10.9%) and non-Hispanic white (9.0%) New Yorkers
had lower asthma prevalence than non-Hispanicblack (12.9%) New Yorkers.
• Current asthma prevalence in 2011 was highest in adults who had not graduated from high school(12.3%). College graduates had the lowestprevalence (8.0%). This pattern was consistent from 2003 to 2010.
• From 2003 to 2010, current asthma prevalence wasinversely proportional to annual household income.In 2011, current asthma prevalence was highest for adults with annual household income levels less than $15,000 (17.2%). Adults in householdswith incomes of $75,000 or more had the lowestprevalence (7.4%).
• The 2011 prevalence of current smoking was higher for adult New Yorkers with asthma (23.2%)compared to those without asthma (17.6%).
• In 2011, 28.9% of adult New Yorkers with asthmareported no leisure-time physical activity for the pastmonth compared to 26.0% of those without asthma.
• In 2011, 33.4% of adults with asthma were obese,compared to 23.5% of adults without asthma in New York State.
5

34
Current Asthma Prevalence in Children, 2006-2010
• For 2006-2010, approximately 456,022 (10.4%)children (0-17 years) in NYS had current asthma.
• For 2006-2010, children aged 0-4 years in NYS had the lowest current asthma prevalence at 7.3%,while children aged 5-9 years had the highestcurrent asthma prevalence at 13.7%.
• For 2006-2010, the asthma prevalence among boys(11.2%) was higher than the prevalence among girls(9.6%) residing in NYS.
• Children who live in New York City had slightly lowercurrent asthma prevalence (10.3%) in 2006-2010compared to children in the Rest of State (10.5%).
• The prevalence of current asthma was higher among non-Hispanic blacks (14.3%) in 2006-2010compared to non-Hispanic white (8.5%) andHispanic (11.7%) New Yorkers.
• For 2006-2010, New York children from householdswith an annual income less than $25,000 hadhigher current asthma prevalence compared tochildren from families with annual householdincomes of $25,000 or more (14.4% and 8.2%respectively).
Youth Tobacco Survey, 2012
Current Asthma Prevalence and Asthma Episodes/Attacks in Middle and High School Students
• In 2012, current asthma prevalence was 23.3% for middle school students and 24.0% for highschool students.
• Current asthma prevalence for 2012 was 24.9% for middle school students in New York City and22.3% for middle school students in the Rest ofState. Among high school students, current asthmaprevalence for those in New York City was 23.2% and24.4% for students in the Rest of State.
• Among middle school students, current asthmaprevalence was 24.3% for males and 22.3% formales. The prevalence among high school males was 24.1% compared to 23.8% among females.
• In 2012, current asthma prevalence for middleschool non-Hispanic other (18.1%) students waslower than Hispanic (29.9%) and non-Hispanic white (20.2%) students. Similarly, among high schoolstudents, prevalence of current asthma among non-Hispanic other (17.5%) students was lowercompared to non-Hispanic blacks (27.7%) and Hispanics (26.1%). These differences werestatistically significant.
• Among New York State middle school students with current asthma, 28.2% reported having had an asthma episode/attack in the past 12 months.The asthma episode/attack prevalence was 30.3%among high school students with current asthma.
• The asthma episode/attack prevalence for 2012 was 26.8% for middle school students in New YorkCity and 29.1% for middle school students in theRest of State. Among high school students, asthmaepisode/attack prevalence for those in New York City was 27.1% and 32.0% for students in the Rest of State.
• In New York State, female high school students withcurrent asthma reported a greater number of asthmaepisodes/attacks in the past 12 months (38.0%)compared to their male counterparts (22.7%).
• The prevalence of having had asthma episodes/attacks in the past 12 months for NYS middle school students was highest for non-Hispanic whites (32.6%), and lowest for non-Hispanic black(23.0%), and non-Hispanic other students (23.3%).
• Among high school students with current asthma,non-Hispanic black students had the highestprevalence of having had asthma episodes/attacksin the past 12 months (31.1%), while non-Hispanicother high school students had the lowest prevalence(23.0%).
• Among middle school students, the prevalence of adolescent smoking was higher for those withasthma (4.3%) compared to those without asthma(2.7%). The prevalence rates were similar for highschool students with asthma (11.9%) and thosewithout (12.0%).

35
Behavioral Risk Factor Surveillance System, 2002-2011
Methodology
The Behavioral Risk Factor Surveillance System (BRFSS) is a statewide random-digit-dialing telephone survey of the non-institutionalized population living in New York State (NYS). The BRFSS, which began in NYS in 1983, has been conductedannually since 1985 following procedures established by the CDC. Data are collected from a representative sample of about 5,700 adults (aged 18 years and older) each year,and then weighted to adjust for the selection probabilitiesand estimates of the socio-demographic distribution of adultsin NYS for each calendar year. This survey provides infor -mation on behaviors and risk factors for chronic diseases(including asthma), infectious diseases, and other healthconditions for NYS adults.
For 2002 through 2011, the NYS BRFSS survey includedtwo questions for assessing both lifetime and currentasthma prevalence among adults: “Have you ever been toldby a doctor, nurse, or other health professional that youhad asthma?” and [If Yes] “Do you still have asthma?”
Beginning in 2006, NYS added questions to this surveyabout asthma prevalence and demographic characteristicsfor children (0-17 years) including two questions for assess -ing both lifetime and current asthma prevalence amongchildren: “Has a doctor or other medical professional eversaid that the child has asthma?” and [If Yes] “Does the childstill have asthma?”
Based on responses to these questions, successiveyears of data were combined to generate more stableestimates for subgroup comparisons among both adultsand children. Estimates are considered statistically “signifi -cantly different” from each other when they do not have
overlapping confidence intervals (CIs). Stable estimate arecalculated by combining two consecutive years of data foradults for years 2002 through 2010, and by combining fiveconsecutive years of results for children from survey years2006 through 2010. Prevalence estimates for adults arepresented as a single year for 2011.
Beginning in 2011, BRFSS data included data frominterviews completed by people living in cell phone onlyhouseholds in addition to interviews completed by peopleliving in households with landlines. The data also reflectchanges in CDC’s weighting methodology. Weighting ensuresthat the data collected are as representative of New York’spopulation as possible. The new method of weightingensures that the weighted results will be consistent withknown distributions for more socio-demographic variables.While these two changes improve the accuracy of theBRFSS, they can result in prevalence estimates that aresignificantly different from those calculated previously.Because of the differences in data collection and theweighting methodology, it is not appropriate to makecomparisons of 2011 data to prior years.
Limitations of the BRFSS data include the following: (1) information about an asthma diagnosis was obtained by self-report and may be subject to recall bias; (2) house -holds that did not have a telephone were not represented in this survey; (3) data were not available at the countylevel; and (4) a low response rate was observed (41% for2010 and 38% for 2011); (4) the inability to comparebetween pre-2011 and 2011 data, including the inability to determine trends between these two periods.

36
Current asthma prevalence increased 24% among adultNew Yorkers from 7.9% in 2002 to 9.8% in 2010. In 2011,current asthma prevalence was 9.7%.
Current asthma prevalence for NYS was higher than the U.S. prevalence for most years, except 2003 and 2008,when the asthma prevalence was the same (Figure 5-1).
Figure 5-1 Prevalence* of Current Asthma Among Adults (18+ Years), New York State, BRFSS, 2002-2011
2002 2003 2004 2005 2006 2007 2008 2009 2010 2011**
New York State 7.9 7.6 8.9 9.3 8.5 8.7 8.7 9.8 9.8 9.7
United States 7.6 7.6 8.3 8.0 8.4 8.3 8.7 8.8 9.0 9.1
2002 2003 2004 2005 2006 2007 2008 2009 2010 2011**0
2
4
6
8
10
12
7.9 7.6
8.9
9.38.5 8.7
8.79.8 9.8
9.7
Perc
ent
**Prevalence rates were obtained from the CDC BRFSS Trends Data Query website16 and are presented with 95% Confidence Intervals.
**2011 data should not be compared to data from prior years because of the differences in data collection and weighting methodology.

37
An estimated 1.4 million (9.7%) NYS adults reportedthat they currently had asthma in 2011.
From 2003 to 2010, current asthma prevalence increasedslightly for adults living in New York City and the Rest of
State. In 2011, adults in New York City had higher currentasthma prevalence (10.2%) compared to those living in the Rest of State (9.3%) (Figure 5-2).
Figure 5-2 Prevalence* of Current Asthma Among Adults (18+ Years) by Region and Combined Survey Years,** New York State, BRFSS, 2003-2011
2003-2004 2005-2006 2007-2008 2009-2010 2011**0
2
4
6
8
10
12
14Pe
rcen
t
New York StateRest of StateNew York City
7.5 8.7 8.3 8.2 9.4 8.9 7.6 9.4 8.8 9.6 10.0 9.8 10.2 9.3 9.7
**Prevalence rates are presented with 95% Confidence Intervals.
**2011 data should not be compared to data from prior years because of the differences in data collection and weighting methodology.
2003–2004 2005–2006 2007-2008 2009-2010 2011**
Weighted Weighted Weighted Weighted Weighted Prevalence Prevalence Prevalence Prevalence Prevalence Region (%) 95% CI (%) 95% CI (%) 95% CI (%) 95% CI (%) 95% CI
New York City 7.5 6.5–8.5 8.2 7.1–9.3 7.6 6.5–8.7 9.6 8.5–10.6 10.2 8.9–11.5
Rest of State 8.7 8.0–9.4 9.4 8.6–10.1 9.4 8.6–10.1 10.0 9.2–10.8 9.3 8.0–10.6
New York State 8.3 7.7–8.9 8.9 8.2–9.6 8.8 8.1–9.5 9.8 9.1–10.5 9.7 8.8–10.2

38
From 2003 to 2010, current asthma prevalence variedby age group and fluctuated over time.
In 2011, adults aged 35-44 years and 65 years andolder had the lowest current asthma prevalence, at 8.9%
and 8.7%, respectively. Adults aged 18-24 years had thehighest current asthma prevalence at 11.2% (Figure 5-3).
Figure 5-3 Prevalence* of Current Asthma Among Adults (18+ Years) by Age Group and Combined Survey Years,** New York State, BRFSS, 2003-2011
2003-2004 2005-2006 2007-2008 2009-2010 2011**0
2
4
6
8
10
12
14
16
18
Perc
ent
35–44 45–54 65+55–6425–3418–24
9.0 8.3 8.0 8.6 10.3 6.6 13.0 8.1 9.0 8.4 8.6 7.8 12.310.5 8.6 10.410.1 8.7 11.210.2 8.9 9.0 9.9 8.79.3 8.2 8.6 9.3 10.1 7.6
**Prevalence rates are presented with 95% Confidence Intervals.
**2011 data should not be compared to data from prior years because of the differences in data collection and weighting methodology.
2003–2004 2005–2006 2007-2008 2009-2010 2011**
Weighted Weighted Weighted Weighted Weighted Prevalence Prevalence Prevalence Prevalence Prevalence Age Group (%) 95% CI (%) 95% CI (%) 95% CI (%) 95% CI (%) 95% CI
18-24 9.0 6.7–11.2 13.0 9.8–16.1 9.3 6.6–12.0 12.3 9.1–15.5 11.2 7.2–15.2
25-34 8.3 6.9–9.7 8.1 6.7–9.5 8.2 6.6–9.9 10.5 8.5–12.4 10.9 8.2–13.6
35-44 8.0 6.8–9.2 9.0 7.8–10.2 8.6 7.2–9.9 8.6 7.2–10.0 8.9 6.9–10.9
45-54 8.6 7.2–10.0 8.4 7.1–9.6 9.3 8.2–10.5 10.4 9.1–11.6 9.0 7.3–10.7
55-64 10.3 8.5–12.1 8.6 7.4–9.9 10.1 8.6–11.6 10.1 8.9–11.3 9.9 8.0–11.8
65+ 6.6 5.5–7.7 7.8 6.5–9.1 7.6 6.6–8.6 8.7 7.9–9.6 8.7 7.0–10.4

39
Figure 5-4 Prevalence* of Current Asthma Among Adults (18+ Years) by Gender and Combined Survey Years,** New York State, BRFSS, 2003-2011
2003-2004 2005-2006 2007-2008 2009-2010 2011**0
2
4
6
8
10
12
14Pe
rcen
t
FemaleMale
6.5 9.8 7.1 10.6 6.3 11.0 7.4 12.1 6.9 12.3
**Prevalence rates are presented with 95% Confidence Intervals.
**2011 data should not be compared to data from prior years because of the differences in data collection and weighting methodology.
2003–2004 2005–2006 2007-2008 2009-2010 2011**
Weighted Weighted Weighted Weighted Weighted Prevalence Prevalence Prevalence Prevalence Prevalence Gender (%) 95% CI (%) 95% CI (%) 95% CI (%) 95% CI (%) 95% CI
Male 6.5 5.7–7.4 7.1 6.1–8.0 6.3 5.4–7.2 7.4 6.4–8.3 6.9 5.6–8.2
Female 9.8 9.0–10.7 10.6 9.8–11.5 11.0 10.1–11.9 12.1 11.2–12.9 12.3 11.0–13.6
The NYS current adult asthma prevalence was higher in females than in males for all time periods. From 2003 to 2010, asthma prevalence increased for females from9.8% to 12.1%. The prevalence for males fluctuated during this period with rates ranging from 6.3% to 7.4%.
In 2011, the prevalence among females (12.3%) was 78% higher than the prevalence among males (6.9%)(Figure 5-4).

40
From 2003 to 2010, current asthma prevalence variedby race and ethnicity. In 2011, non-Hispanic black NewYorkers had the highest asthma prevalence rate at 12.9%,
Hispanic adults had a current asthma prevalence rate of 10.9%, while non-Hispanic whites had a rate of 9.0%(Figure 5-5).
Figure 5-5Prevalence* of Current Asthma Among Adults (18+ Years) by Race/Ethnicity and Combined Survey Years,**New York State, BRFSS, 2003-2011
Non-Hispanic Other***
2003-2004 2005-2006 2007-2008 2009-2010 2011**0
2
4
6
8
10
14
18
Perc
ent
HispanicNon-Hispanic BlackNon-Hispanic White
16
12
8.1 8.9 6.89.3 9.2 9.2 8.88.0 8.9 8.5 8.19.0 9.3 11.7 6.912.3 9.0 12.9 8.810.9
***Prevalence rates are presented with 95% Confidence Intervals.
***2011 data should not be compared to data from prior years because of the differences in data collection and weighting methodology.
***Non-Hispanic other race included American Indian, Alaskan Native, Asian, Native Hawaiian, Pacific Islander, Other race and Multiracial.
2003–2004 2005–2006 2007-2008 2009-2010 2011**
Weighted Weighted Weighted Weighted Weighted Prevalence Prevalence Prevalence Prevalence Prevalence Race/Ethnicity (%) 95% CI (%) 95% CI (%) 95% CI (%) 95% CI (%) 95% CI
Non-Hispanic White 8.1 7.4–8.8 9.2 8.5–9.9 8.9 8.2–9.6 9.3 8.6–10.0 9.0 7.9–10.1
Non-Hispanic Black 8.9 7.0–10.9 9.2 7.1–11.3 8.5 6.7–10.4 11.7 9.4–14.0 12.9 9.9–15.9
Hispanic 9.3 7.5–11.1 8.0 6.2–9.9 9.0 7.0–11.0 12.3 10.2–14.4 10.9 8.2–13.6
Non-Hispanic Other*** 6.8 4.8–8.9 8.8 6.1–11.4 8.1 5.8–10.5 6.9 4.6–9.2 8.8 5.7–11.9

41
From 2003 to 2010, current asthma prevalence variedby educational attainment. Prevalence remained highest for adults who reported that they had not graduated fromhigh school. Adult college graduates had the lowest currentasthma prevalence rate.
Adults with less than a high school education had current asthma prevalence at 12.3% in 2011, while adultswith a college education had the lowest current asthmaprevalence at 8.0% (Figure 5-6).
Figure 5-6 Prevalence* of Current Asthma Among Adults (18+ Years) by Educational Attainment and Combined Survey Years,**New York State, BRFSS, 2003-2011
2003-2004 2005-2006 2007-2008 2009-2010 2011**0
2
4
6
8
12
16
10
14
18Pe
rcen
t
Some College College GraduateHigh School GraduateHigh School Nongraduate
9.8 8.9 8.9 6.8 11.1 9.9 9.2 7.4 10.9 8.6 10.5 7.2 14.3 10.1 10.0 8.6 12.3 9.9 9.6 8.0
**Prevalence rates are presented with 95% Confidence Intervals.
**2011 data should not be compared to data from prior years because of the differences in data collection and weighting methodology.
2003–2004 2005–2006 2007-2008 2009-2010 2011**
Weighted Weighted Weighted Weighted Weighted Prevalence Prevalence Prevalence Prevalence Prevalence Educational Attainment (%) 95% CI (%) 95% CI (%) 95% CI (%) 95% CI (%) 95% CI
High School Nongraduate 9.8 7.9–11.7 11.1 8.6–13.5 10.9 8.4–13.3 14.3 11.5–17.1 12.3 9.1–15.5
High School Graduate 8.9 7.7–10.0 9.9 8.5–11.4 8.6 7.4–9.8 10.1 8.8–11.4 9.9 8.0–11.8
Some College 8.9 7.7–10.2 9.2 8.0–10.4 10.5 9.1–11.9 10.0 8.7–11.4 9.6 7.9–11.3
College Graduate 6.8 5.9–7.7 7.4 6.5–8.2 7.2 6.4–8.0 8.6 7.7–9.5 8.0 6.8–9.2

42
From 2003 to 2010, current asthma prevalence was inversely proportional to annual household income.Households with an annual income less than $15,000 had the highest current asthma prevalence.
In 2011, adults with an annual household income of less than $15,000 had the highest current asthmaprevalence at 17.2%, while adults with an annual
household income level of $75,000 or more had the lowest current asthma prevalence at 7.4%. In general,prevalence increased over time for adults with annualhousehold income levels less than $15,000.
Because income was not adjusted for inflation, comparisons of annual income categories across yearsshould be made with caution (Figure 5-7).
Figure 5-7Prevalence* of Current Asthma Among Adults (18+ Years) by Household Income and Combined Survey Years,** New York State, BRFSS, 2003-2011
2003-2004 2005-2006 2007-2008 2009-2010 2011**0
5
15
20
25
Perc
ent
$25,000-$49,999 $50,000-$74,999 ≥$75,000$15,000-$24,999<$15,000
10
11.2 7.9 8.3 8.2 7.2 12.4 11.2 8.0 8.7 7.2 15.2 10.8 8.7 8.4 6.8 16.0 10.4 10.1 8.1 8.1 17.2 9.7 10.3 7.5 7.4
**Prevalence rates are presented with 95% Confidence Intervals.
**2011 data should not be compared to data from prior years because of the differences in data collection and weighting methodology.
2003–2004 2005–2006 2007-2008 2009-2010 2011**
Weighted Weighted Weighted Weighted Weighted Prevalence Prevalence Prevalence Prevalence Prevalence Household Income (%) 95% CI (%) 95% CI (%) 95% CI (%) 95% CI (%) 95% CI
<$15,000 11.2 9.1–13.2 12.4 10.2–14.6 15.2 12.4–17.9 16.0 13.2–18.8 17.2 13.4–21.0
$15,000–$24,999 7.9 6.4–9.4 11.2 9.0–13.3 10.8 8.8–12.9 10.4 8.7–12.2 9.7 7.5–11.9
$25,000–$49,999 8.3 7.1–9.5 8.0 6.7–9.3 8.7 7.4–10.0 10.1 8.7–11.5 10.3 7.9–12.7
$50,000–$74,999 8.2 6.6–9.8 8.7 7.1–10.2 8.4 6.6–10.2 8.1 6.7–9.5 7.5 5.6–9.4
≥$75,000 7.2 6.0–8.4 7.2 6.2–8.2 6.8 5.8–7.7 8.1 7.0–9.2 7.4 5.8–9.0

43
For each survey period during 2003 to 2010, thepercentage of current smoking was consistently higher foradults with asthma compared to those without asthma.
In 2011, 23.2% of adults with asthma reported that theywere current smokers, compared to 17.6% of those withoutasthma (Figure 5-8).
Figure 5-8 Percentage* of Adult (18+ Years) New Yorkers Who Currently Smoke*** by Asthma Status and Combined Survey Years,** New York State, BRFSS, 2003-2011
2003-2004 2005-2006 2007-2008 2009-2010 2011**0
5
10
15
20
25
30
35Pe
rcen
t
No AsthmaAsthma
24.5 20.4 23.3 19.1 19.9 17.6 21.4 16.1 23.2 17.6
***Prevalence rates are presented with 95% Confidence Intervals.
***2011 data should not be compared to data from prior years because of the differences in data collection and weighting methodology.
***A person who has smoked at least 100 cigarettes in his/her lifetime and now smokes every day or some days.
Asthma No Asthma
Weighted Weighted Year Percentage (%) 95% CI Percentage (%) 95% CI
2003-2004 24.5 21.2–27.7 20.4 19.5–21.4
2005-2006 23.3 20.0–26.6 19.1 18.1–20.0
2007-2008 19.9 16.9–22.8 17.6 16.7–18.5
2009-2010 21.4 18.4–24.4 16.1 15.2–16.9
2011** 23.2 18.8–27.6 17.6 16.3–18.9

44
For 2003 to 2010, the percentage of respondents whoreported no leisure-time physical activity decreased in adultNew Yorkers with asthma. However, persons with asthmawere still more likely to report no leisure-time physicalactivity in the past month than those without asthma.
In 2011, 28.9% of adults with asthma reported noleisure-time physical activity compared to 26.0% for thosewithout asthma (Figure 5-9).
Figure 5-9 Percentage* of Adult (18+ Years) New Yorkers Who Have Not Participated in Recent Leisure Time Physical Activity*** by Asthma Status and Combined Survey Years,** New York State, BRFSS, 2003-2011
2003-2004 2005-2006 2007-2008 2009-2010 2011**0
5
10
15
20
25
30
35
40
45
Perc
ent
No AsthmaAsthma
33.5 26.1 31.3 26.2 31.4 24.8 31.5 24.2 28.9 26.0
***Prevalence rates are presented with 95% Confidence Intervals.
***2011 data should not be compared to data from prior years because of the differences in data collection and weighting methodology.
***A respondent who answered “No” when asked “For the past month, other than your regular job, did you participate in any physical activities or exercisessuch as running, calisthenics, golf, gardening, or walking for exercise?”
Asthma No Asthma
Weighted Weighted Year Percentage (%) 95% CI Percentage (%) 95% CI
2003-2004 33.5 30.0–37.1 26.1 24.4–26.6
2005-2006 31.3 27.8–34.8 26.2 25.4–27.4
2007-2008 31.4 28.0–34.9 24.8 23.8–25.9
2009-2010 31.5 28.4–34.7 24.2 23.2–25.2
2011** 28.9 24.5–33.3 26.0 24.5–27.5

45
For 2003 to 2010, the percentage of respondents who were obese was consistently greater among adults with asthma than adults without asthma.
In 2011, 33.4% of adults with asthma were obese compared to 23.5% for those without asthma (Figure 5-10).
Figure 5-10 Percentage* of Adult (18+ Years) New Yorkers Who Are Obese*** by Asthma Status and Combined Survey Years,**New York State, BRFSS, 2003-2011
2003-2004 2005-2006 2007-2008 2009-2010 2011**0
5
10
15
20
25
30
35
40
45Pe
rcen
t
No AsthmaAsthma
34.1 20.3 32.6 21.4 39.1 23.8 33.5 23.5 33.4 23.5
***Prevalence rates are presented with 95% Confidence Intervals.
***2011 data should not be compared to data from prior years because of the differences in data collection and weighting methodology.
***Obese individuals have a BMI > 30.0 kg/m.2
Asthma No Asthma
Weighted Weighted Year Percentage (%) 95% CI Percentage (%) 95% CI
2003-2004 34.1 30.4–37.8 20.3 19.4–21.3
2005-2006 32.6 29.2–36.1 21.4 20.5–22.4
2007-2008 39.1 35.4–42.8 23.8 22.8–24.8
2009-2010 33.5 30.3–36.7 23.5 22.5–24.5
2011** 33.4 28.8–37.9 23.5 22.1–24.9

46
For 2006-2010, approximately 456,000 (10.4%)children (0-17 years) in NYS had current asthma. For thistime period, children aged 0-4 years had the lowest currentasthma prevalence at 7.3%, while children aged 5-9 yearshad the highest current asthma prevalence at 13.7%.
The prevalence among boys (11.2%) was higher than the prevalence for girls (9.6%). Current asthma prevalencewas similar for children who live in New York City (10.3%)and the Rest of State (10.5%) (Figure 5-11).
Figure 5-11 Prevalence* of Current Asthma Among Children (0-17 Years) by Age Group, Gender and Region, New York State, BRFSS, Combined Survey Years 2006-2010
0
5
10
15
20
Perc
ent
0-4 5-9 10-14 15-17 Male Female New YorkCity
New YorkState
Rest ofState
Age Group Gender Region Total
7.3 13.7 11.4 9.5 11.2 9.6 10.3 10.5 10.4
*Prevalence rates are presented with 95% Confidence Intervals.
Weighted Prevalence (%) 95% CI
Age Group 0–4 7.3 5.6–9.0
5–9 13.7 11.6–15.8
10–14 11.4 9.6–13.2
15–17 9.5 7.8–11.2
Gender Male 11.2 9.9–12.5
Female 9.6 8.4–10.9
Region New York City 10.3 8.5–12.1
Rest of State 10.5 9.5–11.5
Total New York State 10.4 9.5–11.3

47
The 2006-2010 prevalence of current asthma washigher in non-Hispanic black children (14.3%) compared tonon-Hispanic white (8.5%) and Hispanic (11.7%) children.In 2006-2010, children from households with an annualincome between $15,000 and $24,999 had the highest
current asthma prevalence at 14.9%, while children fromhouseholds with annual household incomes of $75,000 or more had the lowest current asthma prevalence at 8.2%(Figure 5-12).
Figure 5-12 Prevalence* of Current Asthma Among Children (0-17 Years) by Race/Ethnicity and Household Income, New York State, BRFSS, Combined Survey Years 2006-2010
Non-Hispanic
White
Non-Hispanic
Black
Non-Hispanic Other**
Hispanic<
$15,000$15,000-$24,999
$25,000-$49,999
$50,000-$74,999
0
5
10
15
20
Perc
ent
Race and Ethnicity Household Income
8.5 14.3 10.1 11.7 14.4 14.9 10.6 8.5 8.2
**Prevalence rates are presented with 95% Confidence Intervals.
**Non-Hispanic other race included American Indian, Alaskan Native, Asian, Native Hawaiian, Pacific Islander, Other race and Multiracial.
Weighted Prevalence (%) 95% CI
Race/Ethnicity Non-Hispanic White 8.5 7.5–9.5
Non-Hispanic Black 14.3 10.8–17.8
Non-Hispanic Other** 10.1 6.2–14.1
Hispanic 11.7 9.3–14.1
Household Income <$15,000 14.4 10.6–18.3
$15,000–$24,999 14.9 11.6–18.2
$25,000–$49,999 10.6 8.5–12.6
$50,000–$74,999 8.5 6.5–10.5
≥$75,000 8.2 7.0–9.3

48
Youth Tobacco Survey, 2012
Methodology
The Youth Tobacco Survey (YTS) collects self-reportedinformation among middle and high school students aboutthe prevalence of current cigarette smoking, behaviors andattitudes toward smoking, and several health-related issuesincluding asthma.
The YTS is administered in NYS every two years tostudents in grades 6 through 12. For the 2012 survey, therewere 8,421 students from 74 schools across the state.Middle school surveys included students who reported theywere in grades 6, 7 or 8, while high school surveys includedstudents who reported they were in grades 9, 10, 11 or 12.
The 2012 YTS included two questions for assessinglifetime and current prevalence of asthma: “Has a doctor or nurse ever told you that you have asthma?” and “Duringthe past 12 months, have you had an episode of asthma or an asthma attack?”
Possible responses to the second question were: a) “I do not have asthma.”; b) “No, I have asthma but I havenot had an episode of asthma or an asthma attack during
the past 12 months.”; c) “Yes, I have had an episode ofasthma or an asthma attack during the past 12 months.”;and d) “Not sure.” This question allowed the estimation of current asthma prevalence (sum of responses b and cdivided by the sum of a, b, and c), as well as the prevalenceof having an asthma episode/attack among children with current asthma (response c divided by the sum ofresponses b and c). Unknown or missing values were notincluded in the sample sizes or analyses.
This report provides 2012 weighted estimates of currentasthma prevalence for middle and high school students for the total population and by gender, race and ethnicity,and geographic region (New York City and Rest of State). In addition, weighted estimates for asthma episodes/attacks in the past year among students with currentasthma are provided. The 95% confidence intervals (CIs) for these estimates are presented. Estimates are consideredstatistically “significantly different” from each other whenthey do not have overlapping CIs.
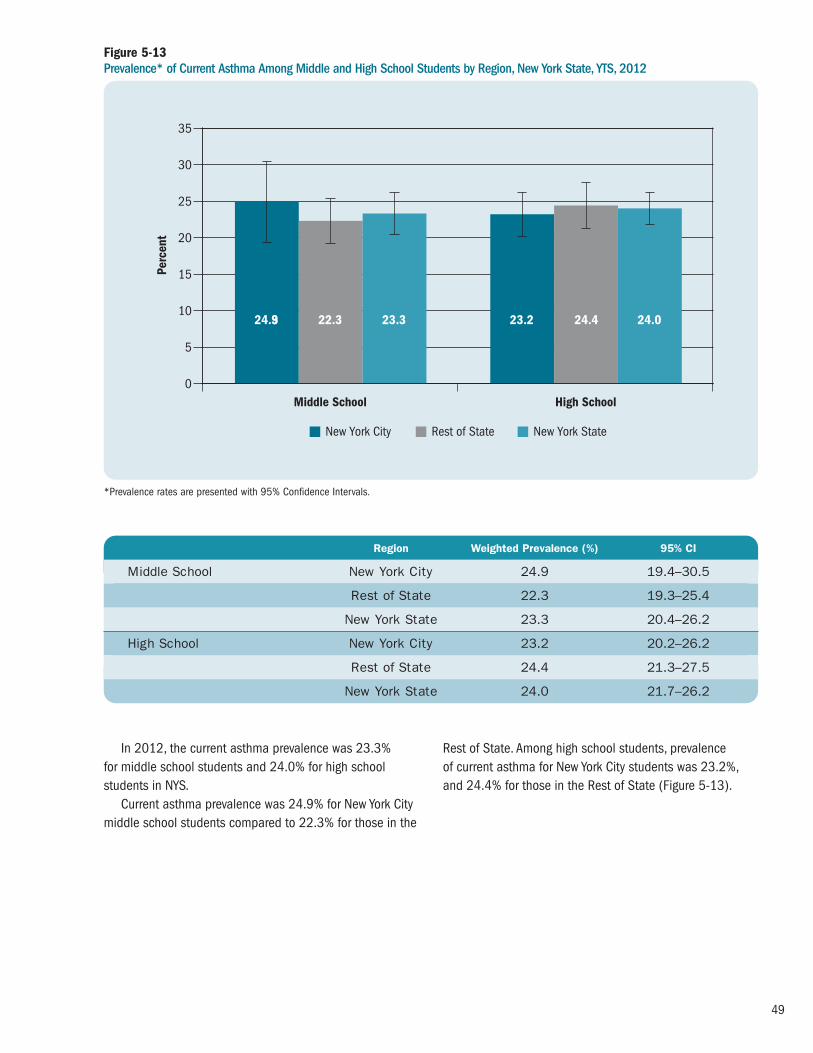
49
In 2012, the current asthma prevalence was 23.3% for middle school students and 24.0% for high schoolstudents in NYS.
Current asthma prevalence was 24.9% for New York Citymiddle school students compared to 22.3% for those in the
Rest of State. Among high school students, prevalence of current asthma for New York City students was 23.2%,and 24.4% for those in the Rest of State (Figure 5-13).
Figure 5-13 Prevalence* of Current Asthma Among Middle and High School Students by Region, New York State, YTS, 2012
Middle School High School0
5
10
15
20
25
35
Perc
ent
New York StateRest of StateNew York City
30
24.93 22.3 23.3 23.2 24.4 24.0
*Prevalence rates are presented with 95% Confidence Intervals.
Region Weighted Prevalence (%) 95% CI
Middle School New York City 24.9 19.4–30.5
Rest of State 22.3 19.3–25.4
New York State 23.3 20.4–26.2
High School New York City 23.2 20.2–26.2
Rest of State 24.4 21.3–27.5
New York State 24.0 21.7–26.2

50
Among middle school students, current asthmaprevalence was 24.3% for males and 22.3% for females.
The prevalence among high school males was 24.1%compared to 23.8% among females (Figure 5-14).
Figure 5-14 Prevalence* of Current Asthma Among Middle and High School Students by Gender, New York State, YTS, 2012
Middle School High School0
5
10
15
20
30
25
Perc
ent
FemaleMale
24.3 22.3 24.1 23.8
*Prevalence rates are presented with 95% Confidence Intervals.
Gender Weighted Prevalence (%) 95% CI
Middle School Male 24.3 21.4–27.3
Female 22.3 18.8–25.8
High School Male 24.1 21.4–26.8
Female 23.8 21.1–26.6

51
Current asthma prevalence for middle school non-Hispanic other (18.1%) students was lower than Hispanic(29.9%) and non-Hispanic white (20.2%) students. Thesedifferences were statistically significant.
Similarly, among high school students, prevalence ofcurrent asthma among non-Hispanic other (17.5%)
students was lower compared to non-Hispanic Blacks(27.7%) and Hispanics (26.1%). These differences werestatistically significant (Figure 5-15).
Figure 5-15 Prevalence* of Current Asthma Among Middle and High School Students by Race/Ethnicity,** New York State, YTS, 2012
Middle School High School0
5
10
15
20
25
40
35Pe
rcen
t
HispanicNon-Hispanic Black Non-Hispanic Other**Non-Hispanic White
30
20.2 26.1 29.9 18.1 22.9 27.7 26.1 17.5
**Prevalence rates are presented with 95% Confidence Intervals.
**Other race included American Indian/Alaskan Native, Asian, and Native Hawaiian/Pacific Islander.
Race/Ethnicity Weighted Prevalence (%) 95% CI
Middle School Non-Hispanic White 20.2 16.9–23.5
Non-Hispanic Black 26.1 22.4–29.8
Hispanic 29.9 23.8–35.9
Non-Hispanic Other** 18.1 12.3–23.8
High School Non-Hispanic White 22.9 20.0–25.9
Non-Hispanic Black 27.7 25.0–30.3
Hispanic 26.1 23.1–29.2
Non-Hispanic Other** 17.5 13.8–21.2

52
Among NYS middle school students with current asthma,28.2% reported having had an asthma episode/attack inthe past 12 months. For high school students with currentasthma, 30.3% reported having asthma episodes/attacksin the past 12 months.
When analyzed by region, 26.8% of New York City middleschool students with current asthma reported having had
asthma episodes/attacks for the past 12 months comparedto 29.1% of their counterparts in the Rest of State.
The proportion of high school students with currentasthma who reported having asthma episodes/attacksamong New York City and Rest of State students was 27.1%and 32.0%, respectively. (Figure 5-16).
Figure 5-16 Prevalence* of Asthma Episodes/Attacks** For the Past 12 Months Among Middle and High School Students with Current Asthma by Region, New York State, YTS, 2012
Middle School High School0
5
10
15
20
25
30
35
45
40
Perc
ent
New York StateRest of StateNew York City
26.8 29.1 28.2 27.1 32.0 30.3
**Prevalence of having had an asthma episode/attack is presented with 95% Confidence Intervals.
**The question asked of the respondent was: “During the past 12 months, have you had an episode of asthma or an asthma attack?”
Region Weighted Prevalence (%) 95% CI
Middle School New York City 26.8 22.0–31.6
Rest of State 29.1 23.5–34.8
New York State 28.2 24.2–32.2
High School New York City 27.1 20.8–33.5
Rest of State 32.0 25.1–38.9
New York State 30.3 25.3–35.4
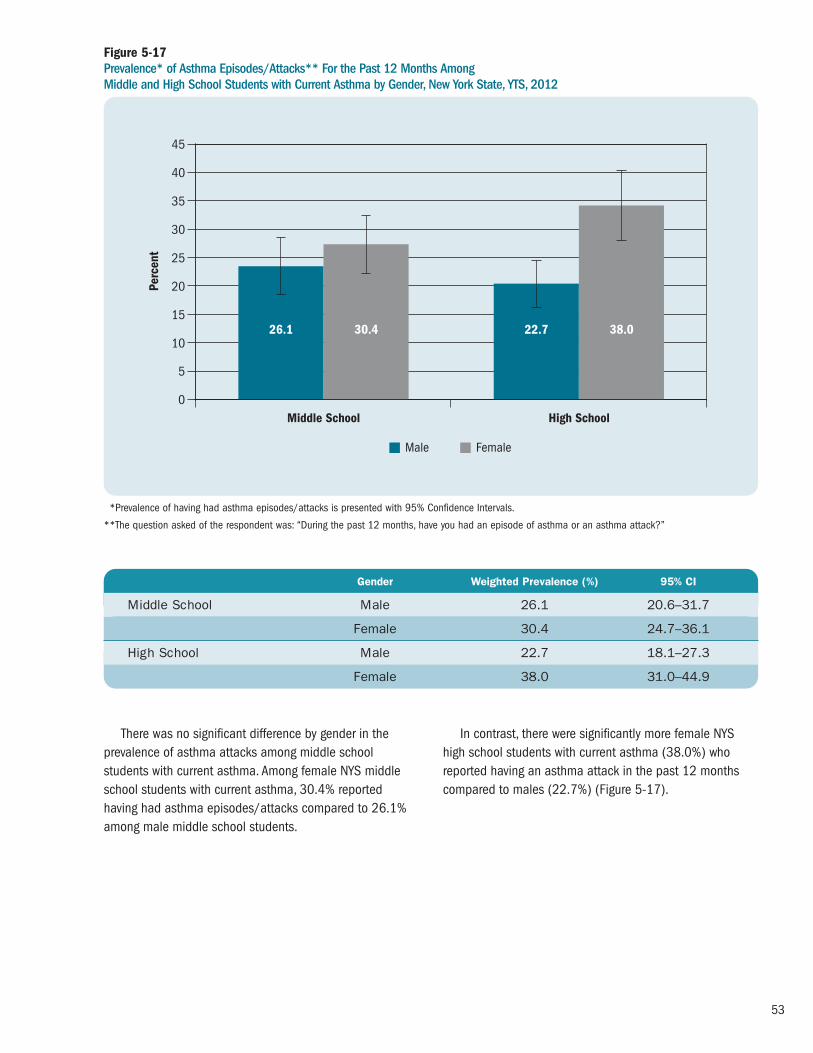
53
There was no significant difference by gender in theprevalence of asthma attacks among middle schoolstudents with current asthma. Among female NYS middleschool students with current asthma, 30.4% reportedhaving had asthma episodes/attacks compared to 26.1%among male middle school students.
In contrast, there were significantly more female NYShigh school students with current asthma (38.0%) whoreported having an asthma attack in the past 12 monthscompared to males (22.7%) (Figure 5-17).
Figure 5-17Prevalence* of Asthma Episodes/Attacks** For the Past 12 Months Among Middle and High School Students with Current Asthma by Gender, New York State, YTS, 2012
Middle School High School0
5
10
15
20
25
30
35
40
45Pe
rcen
t
FemaleMale
26.1 30.4 22.7 38.0
**Prevalence of having had asthma episodes/attacks is presented with 95% Confidence Intervals.
**The question asked of the respondent was: “During the past 12 months, have you had an episode of asthma or an asthma attack?”
Gender Weighted Prevalence (%) 95% CI
Middle School Male 26.1 20.6–31.7
Female 30.4 24.7–36.1
High School Male 22.7 18.1–27.3
Female 38.0 31.0–44.9

54
There were no significant differences in the prevalence ofasthma episodes/attacks by race and ethnicity among NYSmiddle school or high school students with current asthma.
The prevalence of having had an asthma episode/attackin the past 12 months for NYS middle school non-HispanicWhite, non-Hispanic Black, and Hispanic students was32.6%, 23.0%, and 26.7%, respectively.
Hispanic, non-Hispanic white, and non-Hispanic blackhigh school students with current asthma reported a similarprevalence of having had an asthma episode/attack in thepast 12 months (29.8%, 30.4% and 31.1%, respectively).These prevalence rates were not significantly different fromthose reported by non-Hispanic other high school students(23.0%) with current asthma (Figure 5-18).
Figure 5-18 Prevalence* of Asthma Episodes/Attacks** For the Past 12 Months Among Middle and High School Students with Current Asthma by Race/Ethnicity,*** New York State, YTS, 2012
Middle School High School0
5
10
15
20
25
30
35
40
45
Perc
ent
HispanicNon-Hispanic Black Non-Hispanic Other***Non-Hispanic White
32.6 23.0 26.7 23.3 30.4 31.1 29.8 23.0
***Prevalence of having had asthma episodes/attacks is presented with 95% Confidence Intervals.
***The question asked of the respondent was: “During the past 12 months, have you had an episode of asthma or an asthma attack?”
***Non-Hispanic other race included American Indian/Alaskan Native, Asian, and Native Hawaiian/Pacific Islander.
Race/Ethnicity Weighted Prevalence (%) 95% CI
Middle School Non-Hispanic White 32.6 26.79–38.33
Non-Hispanic Black 23.0 13.88–32.08
Hispanic 26.7 19.69–33.61
Non-Hispanic Other*** 23.3 12.75–33.85
High School Non-Hispanic White 30.4 23.38–37.39
Non-Hispanic Black 31.1 21.34–40.93
Hispanic 29.8 22.97–36.64
Non-Hispanic Other*** 23.0 11.54–34.52

In 2012, 4.3% of middle school students with asthmareported that they smoked cigarettes during the past 30days, compared to 2.7% of those without asthma.
The percentage of high school students who reportedthat they smoked cigarettes during the past 30 days wassimilar among students with asthma (11.9%) and thosewithout asthma (12.0%) (Figure 5-19).
Figure 5-19 Percentage* of Middle and High School Students Who Smoked** in the Past 30 Days by Asthma Status, New York State, YTS, 2012
Middle School High School0
2
4
6
8
10
12
14
16
18
Perc
ent
No AsthmaAsthma
4.3 2.7
11.9 12.0
**Percentages are presented with 95% Confidence Intervals.
**A respondent who answered 1 through 30 when asked: “For the past 30 days, on how many days did you smoke cigarettes?”
Asthma No Asthma
Weighted Weighted Percentage (%) 95% CI Percentage (%) 95% CI
Middle School 4.3 2.6–6.0 2.7 1.6–3.8
High School 11.9 8.5–15.2 12.0 8.6–15.3
55

56
Highlights: Asthma Emergency Department Visits
• The number of emergency department visits due to asthma in New York State increased 7% in thepast seven years from 153,784 in 2005 to 164,810in 2011.
• Asthma emergency department visit rates showed a 6% increase from 79.9 per 10,000 residents in 2005 to 84.7 per 10,000 in 2011.
• Overall, asthma emergency department visits showeda seasonal pattern, with peaks in the spring and falland a decline in the summer.
• For 2009-2011, 16% of asthma emergencydepartment visits were for children aged 0-4 years,24% were for adults 25-44 years of age and older,and 21% were for adults ages 45-64 years. Inaddition, 54% of asthma emergency departmentvisits were for females, and 66% were for New YorkCity residents.
• From 2005 to 2011, the 0-4 year age groupconsistently had the highest emergency departmentvisit rate compared to all other age groups. Each agegroup showed a slight increase from 2005 to 2011with the exception of the 25-44 year age group.
• For 2009-2011, female New Yorkers had highercrude and age-adjusted asthma emergencydepartment visit rates (88.4 per 10,000; 92.3 per 10,000) compared to males (80.8 per 10,000;83.8 per 10,000).
• For 2009-2011, males had a higher percentage ofasthma emergency department visits compared tofemales in the 0-4 year (64% vs. 36%) and 5-14
year (61% vs. 39%) age groups. However, males hadlower percentages for all remaining age groups.
• For the period 2009-2011, crude and age-adjustedasthma emergency department visit rates for non-Hispanic black (220.0 per 10,000; 219.5 per10,000) and Hispanic (115.6 per 10,000; 112.8per 10,000) New York State residents were higherthan the rates for non-Hispanic white residents (30.4 per 10,000; 33.1 per 10,000).
• New York City residents had crude and age-adjustedasthma emergency department visit rates (129.6 per 10,000; 135.0 per 10,000) in 2009-2011 that were approximately 2.5 times higher thanresidents in the Rest of State (50.9 per 10,000;54.2 per 10,000).
• Asthma emergency department visit rates at thecounty level varied across New York State for 2009-2011. New York City residents of the Bronx had thehighest age-adjusted emergency department visitrate of 231.4 per 10,000 residents. Among countiesin the Rest of State, Clinton County had the highestage-adjusted emergency department visit rate of 110.6 per 10,000 residents.
• For 2009-2011, other third party or privateinsurance payers were the source of payment for60% of the asthma emergency department visits in New York. Medicaid was the payment source for 19% of emergency department visits, whileMedicare was the payment source for 5% of visits.
Asthma Emergency Department Visits
6

57
Asthma Emergency Department Visit Rates for Adults with Current Asthma (At-Risk Based Rates), 2005-2011
• From 2005 to 2011, the annual at-risk based ratefor asthma emergency department visits in New YorkState remained relatively stable. The annual at-riskbased rate was 6.9 per 100 adults with currentasthma in 2011.
• From 2006 to 2011, the 18-34 year age group (7.7per 100 in 2011) had the highest at-risk based ratefor asthma emergency department visits comparedto other adult age groups in New York State.
• From 2006 to 2011, among adults with currentasthma in New York State, men had slightly higher at-risk based rates for asthma emergencydepartment visits compared to women (7.5 and 6.7 per 100 in 2011, respectively).
• From 2005 to 2011, among adults with currentasthma, non-Hispanic blacks and Hispanics (15.5and 8.5 per 100 in 2011, respectively) consistentlyhad higher at-risk based rates for asthma emergencydepartment visits compared to non-Hispanic whites(3.0 per 100 in 2011) in New York State.
• From 2005 to 2011, among adults with currentasthma, New York City (9.8 per 100 in 2011)residents consistently had a higher at-risk based ratefor asthma emergency department visits comparedto those in the Rest of State (4.6 per 100 in 2011).The New York City rate decreased 25% from 13.0 per100 in 2005 to 9.8 per 100 in 2011.
Asthma Emergency Department Visit Rates forChildren with Current Asthma (At-Risk Based Rates), 2006-2010
• For 2006-2010, there were 13.5 asthma emergencydepartment visits each year per 100 children withcurrent asthma in New York State.
• For 2006-2010, among New York State children with current asthma, the 0-4 year age group had thehighest at-risk based rate for asthma emergencydepartment visits (29.4 per 100) compared to allother child age groups.
• The at-risk based rate for asthma emergencydepartment visits for 2006-2010 was higher for boys (15.0 per 100) compared to girls (12.0 per 100).
• Among children with current asthma, the 2006-2010at-risk based rate for asthma emergency departmentvisits was highest for Hispanic children (59.5 per100), followed by non-Hispanic black children (31.5 per 100).
• The at-risk based rate for asthma emergencydepartment visits for 2006-2010 was five timeshigher for children living in New York City (30.2 per100) compared to those living in the Rest of State(6.0 per 100).

58
Asthma Emergency Department Visits
Methodology
This analysis examines emergency department (ED) visits due to asthma that occurred in New York State (NYS)hospitals, including patients who were admitted to thehospital directly from the ED. NYS ED visit information hasbeen obtained from two databases within the StatewidePlanning and Research Cooperative System (SPARCS): (1) the Hospital Inpatient Database and (2) the OutpatientDatabase. These two mutually exclusive files contain recordlevel detail on patient characteristics, diagnoses, services andresidence location for every ED visit to hospitals within NYS.
The SPARCS Hospital Inpatient Database collectsinformation on all hospital discharges from acute care andrehabilitation hospitals located in NYS. This database includesrecords for patients who are admitted to the hospital directlyfrom the ED and for those who are hospitalized without firstutilizing the ED. It is possible that the same patient may behospitalized for asthma multiple times and as a result couldbe counted more than once in these data.
The SPARCS Outpatient Database contains information on ED visits for patients who visit the ED but are not hospital -ized. It is possible that the same patient may visit the ED forasthma multiple times and as a result could be counted morethan once in these data. The ED data reporting began on a voluntary basis in September 2003, and was mandated in January 2005.
For the SPARCS Hospital Inpatient Database, an asthmaED visit was defined as having been admitted to the hospital
directly from the ED and having an admitting diagnosis withan International Classification of Diseases, 9th Revision,Clinical Modification (ICD-9-CM) code of 493. For the SPARCSOutpatient Database, an asthma ED visit was defined ashaving a principal diagnosis with an ICD-9-CM code of 493.Population estimates used for computing the asthma ED visitrates were obtained from the U.S. Census Bureau.
Crude and age-adjusted asthma ED visit rates werecalculated per 10,000 residents. The age-adjusted rateswere calculated using the 2000 U.S. Standard Population(see Appendix 2).
Trends in asthma ED visit data (2005-2011) arepresented for the state total, and by age group, gender andgeographic region (New York City and Rest of State). AsthmaED visit rates for a specific year were calculated by dividingthe number of asthma ED visits by the population of thatyear and then multiplying by 10,000.
Combined years (2009-2011) of data for asthma EDvisits are presented by age group, gender, race and ethnicityand geographic region (New York City and Rest of State).The combined asthma ED visit rates for 2009-2011 werecalculated as follows: the total number of asthma ED visitsfor the three-year period was divided by three to get theaverage number of asthma ED visits per year. The averagenumber of asthma ED visits was then divided by the middleyear population (2010) and multiplied by 10,000. AsthmaED visit data for 2009-2011 are also presented as tables,maps and graphs at the state and county level.

59
From 2005 to 2011, the annual number of asthma ED visits among NYS residents increased 7% from
Figure 6-1 Annual Asthma Emergency Department Visits, New York State, 2005-2011
0
20,000
40,000
60,000
80,000
100,000
120,000
140,000
160,000
180,000
2005 2006 2007 2008 2009 2010 2011
Asth
ma
ED V
isits
Trends in Asthma Emergency Department Visits
2005 2006 2007 2008 2009 2010 2011
Asthma ED Visits 153,784 162,867 160,032 160,760 167,212 160,441 164,810
153,784 in 2005 to 164,810 in 2011 with a peak in 2009 (Figure 6-1).

60
The annual asthma ED visit rate in NYS increased 6%from 79.9 asthma ED visits per 10,000 residents in 2005
to 84.7 asthma ED visits per 10,000 residents in 2011,with a peak in 2009 (Figure 6-2).
Figure 6-2 Annual Asthma Emergency Department Visit Rate per 10,000 Residents, New York State, 2005-2011
0
10
20
30
40
50
60
70
80
90
2005 2006 2007
Rate
per
10,
000
2008 2009 2010 2011
2005 2006 2007 2008 2009 2010 2011
Rate per 10,000 79.9 84.4 82.9 82.5 85.6 82.8 84.7
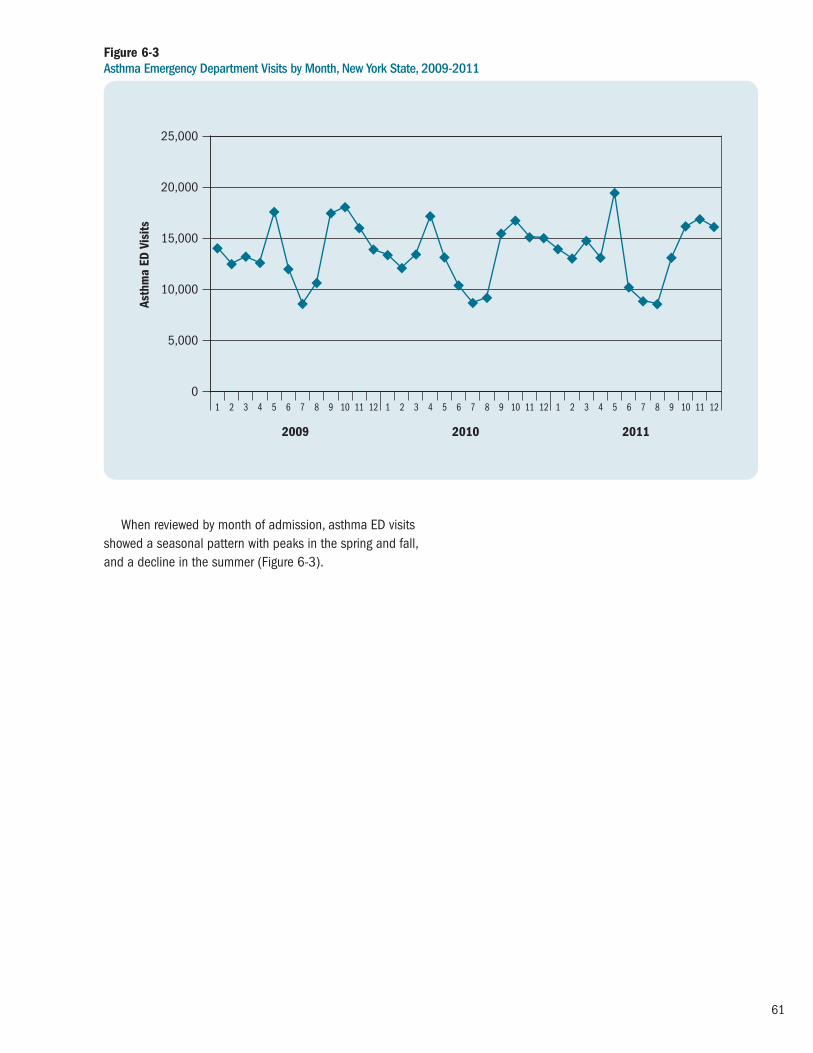
61
When reviewed by month of admission, asthma ED visitsshowed a seasonal pattern with peaks in the spring and fall,and a decline in the summer (Figure 6-3).
Figure 6-3 Asthma Emergency Department Visits by Month, New York State, 2009-2011
0
5,000
10,000
15,000
20,000
25,000
2009
1 2 3 4 5 6 7 8 9 10 11 12 1 2 3 4 5 6 7 8 9 10 11 12 1 2 3 4 5 6 7 8 9 10 11 12
2010 2011
Asth
ma
ED V
isits

62
From 2009 to 2011, asthma ED visits for those aged 0-14 years showed a similar seasonal pattern with peaks inthe spring and fall, and a decline in the summer (Figure 6-4).
Figure 6-4Asthma Emergency Department Visits by Month, Ages 0-14 Years, New York State, 2009-2011
0
5,000
10,000
15,000
20,000
25,000
2009
1 2 3 4 5 6 7 8 9 10 11 12 1 2 3 4 5 6 7 8 9 10 11 12 1 2 3 4 5 6 7 8 9 10 11 12
2010 2011
Asth
ma
ED V
isits

63
For 2009-2011, the crude asthma ED visit rate for NYS was 84.5 per 10,000 residents and the age-adjustedasthma ED visit rate was 88.3 per 10,000.
Female New Yorkers had higher crude and age-adjustedasthma ED visit rates (88.4 per 10,000; 92.3 per 10,000)compared to males (80.8 per 10,000; 83.8 per 10,000).
Non-Hispanic black New Yorkers had crude and age-adjusted ED visit rates (220.0 per 10,000; 219.5 per 10,000)that were approximately seven times higher than non-Hispanicwhite New Yorkers (30.4 per 10,000; 33.1 per 10,000).
Hispanic New Yorkers had crude and age-adjusted EDvisit rates (115.6 per 10,000; 112.8 per 10,000) that were
almost four times higher than non-Hispanic white residents(30.4 per 10,000; 33.1 per 10,000).
Non-Hispanic New Yorkers who were included in theother category (neither black nor white), had crude and age-adjusted ED visit rates (76.5 per 10,000; 82.0 per 10,000)that were 2.5 times higher than non-Hispanic white NewYorkers (30.4 per 10,000; 33.1 per 10,000).
New York City residents had crude and age-adjustedasthma ED visit rates (129.6 per 10,000; 135.0 per10,000) in 2009-2011 that were approximately 2.5 timeshigher than residents in the Rest of State (50.9 per 10,000;54.2 per 10,000) (Table 6-1).
Table 6-1 Crude and Age-Adjusted* Asthma Emergency Department Visit Rate per 10,000 Residents by Gender, Race/Ethnicity and Region, New York State, 2009-2011
Asthma Emergency Department Visits by Socio-demographic Characteristics
*Adjusted rates are age-adjusted to the 2000 United States population.
Crude Age-Adjusted*
Gender Male 80.8 83.8
Female 88.4 92.3
Race/Ethnicity Non-Hispanic White 30.4 33.1
Non-Hispanic Black 220.0 219.5
Non-Hispanic Other 76.5 82.0
Hispanic 115.6 112.8
Region New York City 129.6 135.0
Rest of State 50.9 54.2
Total New York State 84.5 88.3

64
From 2005 to 2011, the 0-4 year age group consistentlyhad the highest asthma ED visit rate compared to all otherage groups in NYS. Each age group showed a slight increase
Figure 6-5 Asthma Emergency Department Visit Rate per 10,000 Residents by Age Group and Year, New York State, 2005-2011
0
50
100
150
200
250
2005 2006 2007 2008 2009 2010
Rate
per
10,
000
0–4 5–14 15–24 25–44 45–64 65+
2011
Age Group 2005 2006 2007 2008 2009 2010 2011
0–4 201.9 224.8 219.7 213.7 221.5 228.4 227.9
5–14 118.9 129.4 127.7 120.9 131.6 127.2 137.5
15–24 80.7 81.4 81.3 79.8 89.1 80.9 85.0
25–44 75.3 78.1 76.6 77.9 77.8 74.4 72.8
45–64 58.5 61.9 62.9 65.1 65.7 65.4 66.4
65+ 30.7 32.6 30.8 32.7 31.5 31.7 34.5
from 2005 to 2011 with the exception of the 25-44 yearage group (Figure 6-5).

65
For 2009-2011, 16% of the asthma ED visits were forchildren aged 0-4 years; 24% of the asthma ED visits were
for the 25-44 year age group, and 21% were for the 45-64year age group (Figure 6-6).
Figure 6-6 Asthma Emergency Department Visits by Age Group, New York State, 2009-2011
Age 65+(N=17,504)
6%
Age 25-44(N=77,593)
24%
Age 5-14(N=62,562)19%
Age 45-64(N=68,780)
21%
Age 0-4(N=52,920)16%
Age 15-24(N=45,892)14%
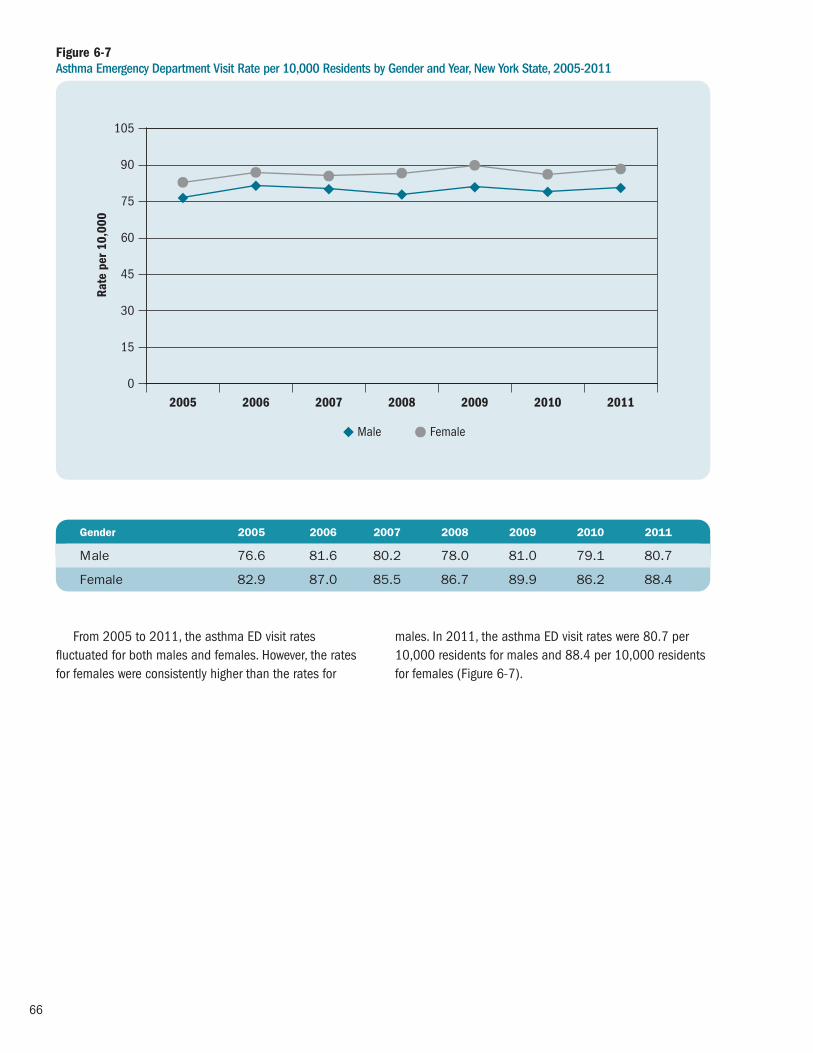
66
From 2005 to 2011, the asthma ED visit ratesfluctuated for both males and females. However, the ratesfor females were consistently higher than the rates for
males. In 2011, the asthma ED visit rates were 80.7 per10,000 residents for males and 88.4 per 10,000 residentsfor females (Figure 6-7).
Figure 6-7Asthma Emergency Department Visit Rate per 10,000 Residents by Gender and Year, New York State, 2005-2011
0
45
30
15
60
75
90
105
2005 2008 2009 2010 2011
Rate
per
10,
000
Male Female
2006 2007
Gender 2005 2006 2007 2008 2009 2010 2011
Male 76.6 81.6 80.2 78.0 81.0 79.1 80.7
Female 82.9 87.0 85.5 86.7 89.9 86.2 88.4

67
For 2009-2011, 54% of the asthma ED visits were byfemale New Yorkers (Figure 6-8).
Figure 6-8 Asthma Emergency Department Visits by Gender, New York State, 2009-2011
Female(N=174,883)54%
Male(N=150,367)
46%

68
For 2009-2011, there was a higher proportion ofasthma ED visits for males than females among those aged0-14 years (0-4 years: males-64%, females-36%; 5-14years: males-61%, females-39%).
In contrast, among those aged 15 years and older,females accounted for a higher proportion of asthma ED
Figure 6-9 Percent of Asthma Emergency Department Visits by Age Group and Gender, New York State, 2009-2011
0-4 5-14 15-24 25-44 45-64 65+0
10
20
30
40
50
60
70
80
Perc
ent
64 36 61 39 42 58 37 63 36 64 30 70
FemaleMale
visits compared to males (15-24 years: males-42%,females-58%; 25-44 years: males-37%, females-63%; 45-64 years: males-36%, females-64%; 65+ years: males-30%, females-70%) (Figure 6-9).

69
From 2005 to 2011, there was a 10% increase in theasthma ED visit rate for New York City residents, while therate remained relatively stable for those living in the Rest of State. New York City residents had consistently higherasthma ED visit rates compared to residents in the Rest
of State. In 2011, New York City residents had an asthmaED visit rate (131.6 per 10,000) that was 2.5 times higherthan the residents living in the Rest of State (50.2 per10,000) (Figure 6-10).
Figure 6-10Asthma Emergency Department Visit Rate per 10,000 Residents by Region and Year, New York State, 2005-2011
0
30
60
90
120
150
2005 2006 2007
Rate
per
10,
000
New York City Rest of State
2008 2009 2010 2011
Region 2005 2006 2007 2008 2009 2010 2011
New York City 119.7 129.4 127.1 125.4 127.7 129.2 131.6
Rest of State 50.7 51.0 49.8 50.2 53.9 49.0 50.2

70
For 2009-2011, New York City residents accounted for66% of all asthma ED visits in New York State (Figure 6-11).
Figure 6-11Asthma Emergency Department Visits by Region, New York State, 2009-2011
Rest of State(N=111,139)34%
New York City(N=214,112)
66%

71
Other third party or private insurance was the source of payment for 60% of all the 2009-2011 asthma-relatedED visits in NYS. Medicaid was the payment source for 19%
of asthma ED visits and Medicare was the source for only5% of asthma ED visits (Figure 6-12).
Figure 6-12 Asthma Emergency Department Visits by Source of Payment, New York State, 2009-2011
Self-pay(N=23,140)16%
Medicaid(N=26,280)
19%
Other Third Party/Private(N=84,477)60%
Medicare(N=6,556)
5%

72
Table 6-2 Crude and Age-Adjusted* Asthma Emergency Department Visit Rates per 10,000 Residents by Region and County, New York State, 2009-2011
ED Visits Average Population Crude AdjustedRegion/County 2009 2010 2011 Total 2009-2011 Rate Rate
REGION 1: WESTERN NEW YORK
Allegany 143 144 234 521 48,960 35.5 39.1
Cattaraugus 488 485 470 1,443 79,946 60.2 65.7
Chautauqua 866 860 833 2,559 134,259 63.5 69.7
Erie 5,519 5,058 4,942 15,519 915,438 56.5 61.1
Genesee 256 204 192 652 59,313 36.6 40.5
Niagara 1,305 1,023 979 3,307 215,679 51.1 56.2
Orleans 183 151 141 475 42,519 37.2 40.6
Wyoming 142 131 108 381 41,832 30.4 32.3
Region Total 8,902 8,056 7,899 24,857 1,537,947 53.9 58.4
REGION 2: FINGER LAKES
Chemung 632 580 681 1,893 88,667 71.2 76.6
Livingston 260 277 246 783 64,445 40.5 45.2
Monroe 4,477 4,341 4,487 13,305 741,224 59.8 63.7
Ontario 483 403 355 1,241 107,369 38.5 42.0
Schuyler 100 103 98 301 18,475 54.3 58.9
Seneca 114 96 98 308 34,833 29.5 31.4
Steuben 499 467 454 1,420 98,192 48.2 52.0
Wayne 456 340 389 1,185 92,833 42.5 46.9
Yates 140 93 90 323 25,095 42.9 49.0
Region Total 7,161 6,700 6,898 20,759 1,271,131 54.4 58.3
REGION 3: CENTRAL NEW YORK
Cayuga 337 251 209 797 79,763 33.3 36.1
Cortland 175 187 273 635 48,898 43.3 45.4
Herkimer 220 242 161 623 63,638 32.6 35.9
Jefferson 597 609 554 1,760 117,619 49.9 49.3
Lewis 92 125 113 330 26,772 41.1 43.5
Madison 359 407 356 1,122 72,254 51.8 57.1
Oneida 1,366 1,286 1,306 3,958 233,403 56.5 61.0
Onondaga 2,076 1,860 1,894 5,830 462,913 42.0 44.7
Oswego 415 401 390 1,206 121,905 33.0 35.1
St. Lawrence 726 683 861 2,270 111,116 68.1 71.7
Tompkins 295 221 246 762 101,689 25.0 28.2
Region Total 6,658 6,272 6,363 19,293 1,439,971 44.7 47.3
Asthma Emergency Department Visit Rates by County
*Adjusted rates are age-adjusted to the 2000 United States population.

73
*Adjusted rates are age-adjusted to the 2000 United States population.
ED Visits Average Population Crude AdjustedRegion/County 2009 2010 2011 Total 2009-2011 Rate Rate
REGION 4: NEW YORK-PENNSYLVANIA
Broome 880 837 1,008 2,725 198,087 45.9 49.2
Chenango 236 266 230 732 50,405 48.4 54.5
Tioga 64 55 81 200 50,744 13.1 14.4
Region Total 1,180 1,158 1,319 3,657 299,236 40.7 44.1
REGION 5: NORTHEASTERN NEW YORK
Albany 2,160 1,952 1,949 6,061 302,018 66.9 72.9
Clinton 891 803 455 2,149 81,897 87.5 89.4
Columbia 282 216 237 735 62,421 39.2 47.8
Delaware 187 177 185 549 47,018 38.9 44.5
Essex 197 173 192 562 38,746 48.3 53.3
Franklin 350 304 251 905 51,141 59.0 62.0
Fulton 407 337 365 1,109 55,255 66.9 74.3
Greene 178 128 128 434 49,041 29.5 34.1
Hamilton 18 12 22 52 4,851 35.7 49.8
Montgomery 371 417 503 1,291 49,584 86.8 93.4
Otsego 144 122 137 403 61,926 21.7 25.8
Rensselaer 1,010 933 983 2,926 158,122 61.7 66.6
Saratoga 677 670 630 1,977 220,186 29.9 32.1
Schenectady 1,136 1,055 1,159 3,350 153,985 72.5 78.1
Schoharie 56 77 52 185 32,285 19.1 22.1
Warren 335 339 291 965 65,853 48.8 55.4
Washington 246 232 208 686 63,045 36.3 38.6
Region Total 8,645 7,947 7,747 24,339 1,497,372 54.2 59.0
REGION 6: HUDSON VALLEY
Dutchess 1,570 1,312 1,479 4,361 296,350 49.1 50.8
Orange 2,594 2,495 2,482 7,571 377,072 66.9 67.5
Putnam 276 293 315 884 99,636 29.6 31.6
Rockland 1,088 1,105 1,121 3,314 309,006 35.7 36.1
Sullivan 434 399 406 1,239 76,758 53.8 59.7
Ulster 794 734 832 2,360 182,127 43.2 46.9
Westchester 5,826 5,714 5,875 17,415 953,658 60.9 63.5
Region Total 12,582 12,052 12,510 37,144 2,294,607 54.0 56.0
Table 6-2 continuedCrude and Age-Adjusted* Asthma Emergency Department Visit Rates per 10,000 Residents by Region and County, New York State, 2009-2011

74
*Adjusted rates are age-adjusted to the 2000 United States population.
ED Visits Average Population Crude AdjustedRegion/County 2009 2010 2011 Total 2009-2011 Rate Rate
REGION 7: NEW YORK CITY
Bronx 32,368 31,789 31,515 95,672 1,391,466 229.2 225.3
Kings 32,469 33,553 35,084 101,106 2,534,814 133.0 134.5
New York 20,509 19,081 20,132 59,722 1,605,625 124.0 147.2
Queens 18,067 17,610 18,170 53,847 2,261,761 79.4 85.2
Richmond 3,732 3,570 3,890 11,192 476,976 78.2 81.2
Region Total 107,145 105,603 108,791 321,539 8,270,641 129.6 135.0
REGION 8: NASSAU-SUFFOLK
Nassau 6,157 5,650 5,820 17,627 1,347,132 43.6 46.7
Suffolk 8,797 7,460 7,877 24,134 1,503,547 53.5 56.3
Region Total 14,954 13,110 13,697 41,761 2,850,679 48.8 51.8
New York State 167,227 160,898 165,224 493,349 19,461,584 84.5 88.3
Table 6-2 continuedCrude and Age-Adjusted* Asthma Emergency Department Visit Rates per 10,000 Residents by Region and County, New York State, 2009-2011

75
Asthma Emergency Department (ED) Visit Rate0 100 200 300
AlleganyCattaraugusChautauqua
ErieGeneseeNiagaraOrleans
Wyoming
ChemungLivingston
MonroeOntario
SchuylerSeneca
SteubenWayne
Yates
CayugaCortlandHerkimerJefferson
LewisMadison
OneidaOnondaga
OswegoSt. Lawrence
Tompkins
BroomeChenango
Tioga
AlbanyClinton
ColumbiaDelaware
EssexFranklin
FultonGreene
Hamilton*Montgomery
OtsegoRensselaer
SaratogaSchenectady
SchoharieWarren
Washington
DutchessOrangePutnam
RocklandSullivan
UlsterWestchester
BronxKings
New YorkQueens
Richmond
NassauSuffolk
Regi
on 1
Regi
on 2
Regi
on 3
Regi
on 4
Regi
on 5
Regi
on 6
Regi
on 7
Regi
on 8
New York State: 88.3
Figure 6-13 Age-Adjusted* Asthma Emergency Department Visit Rate per 10,000 Residents by County, New York State, 2009-2011
Source: SPARCS
*Adjusted rates are age-adjusted to the 2000 United States population.
Asthma Emergency Department (ED) Visit RateCounties are Shaded Based on Quartile Distribution
0 – <50.3: Q1 & Q250.3 – <65.7: Q365.7+: Q4

76
Table 6-2 presents the crude and age-adjusted county-specific asthma ED visit rates, and Figure 6-13 is a NYSmap that shows the age-adjusted NYS county-specificasthma ED visit rates for 2008-2010. Similar data forspecific age groups (e.g., 0-4 years, 0-14 years, 0-17 years,18-64 years, and 65+ years) are available at the NYSDOH Asthma Surveillance website (see: http://www.health.ny.gov/ statistics/ny_asthma/).
Asthma ED visit rates varied by region and county of residence. For New York City, the Bronx had the highest
age-adjusted asthma ED visit rate of 231.4 per 10,000residents followed by New York County with an age-adjustedrate of 144.3 per 10,000 residents.
For counties in the Rest of State, age-adjusted ratesranged from highs of 110.6 per 10,000 residents in ClintonCounty and 83.6 per 10,000 residents in MontgomeryCounty, to 12.8 per 10,000 residents in Tioga County and21.9 per 10,000 residents in Schoharie County.
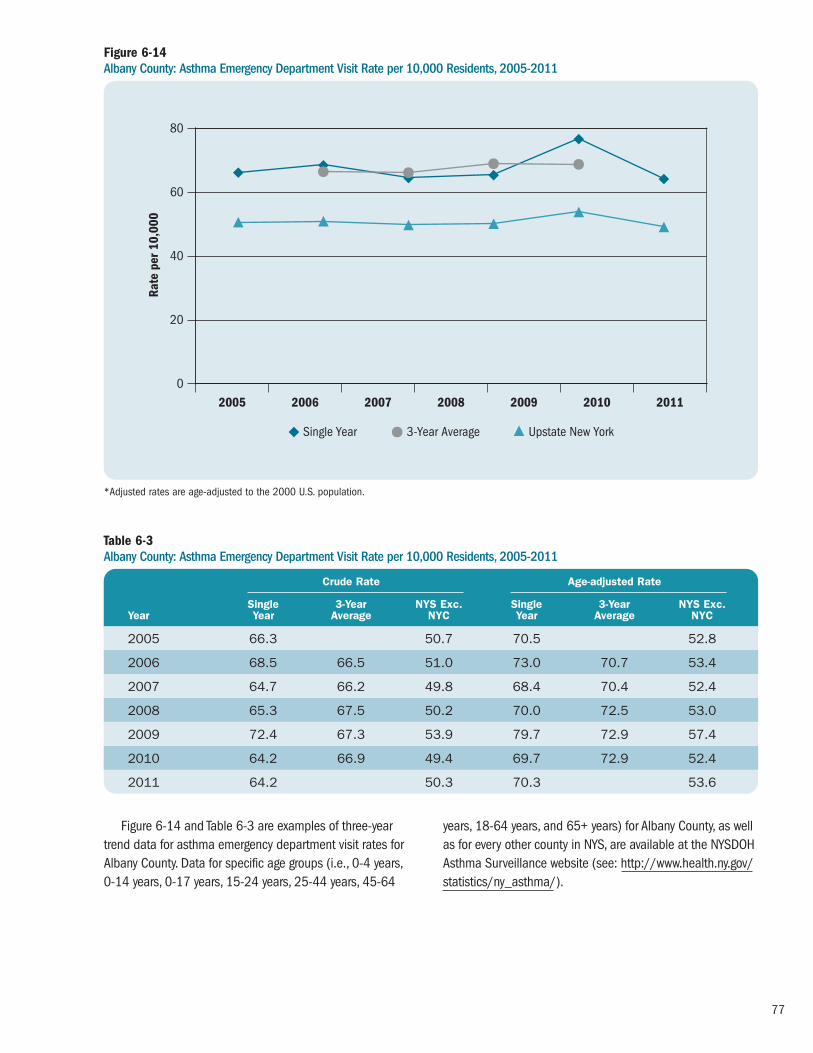
77
Figure 6-14 and Table 6-3 are examples of three-yeartrend data for asthma emergency department visit rates forAlbany County. Data for specific age groups (i.e., 0-4 years, 0-14 years, 0-17 years, 15-24 years, 25-44 years, 45-64
years, 18-64 years, and 65+ years) for Albany County, as wellas for every other county in NYS, are available at the NYSDOH Asthma Surveillance website (see: http://www.health.ny.gov/statistics/ny_asthma/).
Figure 6-14Albany County: Asthma Emergency Department Visit Rate per 10,000 Residents, 2005-2011
Table 6-3Albany County: Asthma Emergency Department Visit Rate per 10,000 Residents, 2005-2011
0
20
40
60
80
2005 2006 2007 2008 2009 2010 2011
Rate
per
10,
000
Single Year 3-Year Average Upstate New YorkH
Crude Rate Age-adjusted Rate
Single 3-Year NYS Exc. Single 3-Year NYS Exc.Year Year Average NYC Year Average NYC
2005 66.3 50.7 70.5 52.8
2006 68.5 66.5 51.0 73.0 70.7 53.4
2007 64.7 66.2 49.8 68.4 70.4 52.4
2008 65.3 67.5 50.2 70.0 72.5 53.0
2009 72.4 67.3 53.9 79.7 72.9 57.4
2010 64.2 66.9 49.4 69.7 72.9 52.4
2011 64.2 50.3 70.3 53.6
*Adjusted rates are age-adjusted to the 2000 U.S. population.

78
Figure 6-15 Albany County: Total Asthma Emergency Department Visit Rate per 10,000 Residents by ZIP Code, 2009-2011
12007*
12009
12023
12041*
12046*
12047
1205412059
12067
12077
12084
12110
12120
12143
12147*
12158
12159
12183
12186
12189
12193
12202
1220312204
12205
12206
1220712208
12209
12210
12211
12303
12469*
**Less than or equal to 10 emergency department visits, therefore rate may not be stable (Relative Standard Error >30%).
**Data is suppressed for confidentiality purposes if there are less than 6 emergency department visits per ZIP code.
A non-shaded area indicates that the ZIP code predominantly lies in an adjacent county.
Asthma ED Visit RateZip Codes are Shaded Based on Quartile Distribution
Albany County: 66.9New York State: 84.5New York State (Excluding NYC): 51.2
Data not available or do not meet reporting criteria** 0 – <33.3: Q1 & Q233.3 – <52.9: Q352.9+: Q4
Asthma Emergency Department Visit Rates by ZIP Code for Counties

79
Table 6-4 Albany County: Total Asthma Emergency Department Visit Rate per 10,000 Residents by ZIP Code, Three-Year Average 2009-2011
ED Visits ED VisitZIP Code 2009–2011 Rate
12007 s s
12009 74 32.6
12023 20 32.0
12041 s s
12046 s s
12047 377 70.7
12054 109 21.8
12059 13 24.4
12067 11 24.0
12077 47 25.4
12084 38 25.6
12110 150 25.2
12120 s s
12143 57 31.7
12147 s s
12158 63 32.3
12159 61 28.3
s: Data is suppressed for confidentiality purposes if there are less than 6 ED visits per ZIP code.
*Less than or equal to 10 ED visits, therefore rate may not be stable (RSE>30%).
Figure 6-15 and Table 6-4 are examples of three-yearcombined data for asthma emergency department visitrates for Albany County ZIP codes. Data for specific agegroups (i.e., 0-4 years, 0-14 years, 0-17 years, 18-64
years, and 65+ years) for Albany County, as well as for every other county in NYS, are available at the NYSDOHAsthma Surveillance website (see: http://www.health.ny.gov/statistics/ny_asthma/).
ED Visits ED VisitZIP Code 2009–2011 Rate
12183 40 53.3
12186 26 13.2
12189 308 59.7
12193* 10 16.0
12202 815 289.6
12203 267 26.3
12204 244 122.9
12205 404 51.0
12206 1,343 284.1
12207 158 254.1
12208 400 62.9
12209 349 115.4
12210 523 189.8
12211 76 18.5
12469* 7 28.1
12470 s s

80
At-risk Based Rates for Asthma Emergency Department Visits
Methodology
At-risk based rates (ARR) for asthma emergency department(ED) visits are the number of asthma-related ED visits forindividuals with current asthma rather than for the generalpopulation. Rates for a specific period of time were calcu -lated by dividing the number of asthma ED visits by theestimated number of people with current asthma for thattime period and then multiplying by 100.17-20
The number of asthma ED visits in NYS was generatedfrom two databases within the Statewide Planning andResearch Cooperative System (SPARCS). (See the Method -ology section on page 58 for a full description of the criteriafor selection of asthma ED visits.) The number of asthma ED visits was the numerator for the ARR.
The Behavioral Risk Factor Surveillance System (BRFSS)data were used to estimate the number of children (0-17years) and adults (18+ years) with current asthma. (See theMethodology section on page 35 for a full description ofhow current asthma was defined and how current asthmaprevalence was calculated). The number of people withcurrent asthma was estimated using the weighted currentasthma prevalence. The estimates were used as thedenominator for the ARR.
Beginning in 2011, BRFSS data included data frominterviews completed by people living in cell phone onlyhouseholds in addition to interviews completed by peopleliving in households with landlines. The data also reflectchanges in CDC’s weighting methodology. Weighting ensuresthat the data collected are as representative of New York’spopulation as possible. The new method of weightingensures that the weighted results will be consistent withknown distributions for more socio-demographic variables.
While these two changes improve the accuracy of theBRFSS, they can result in prevalence estimates that aresignificantly different from those calculated previously.Because of the differences in data collection and theweighting methodology, it is not appropriate to makecomparisons of 2011 data to prior years.
ARR for asthma ED visits for adults with current asthmaare presented by age group, gender, race and ethnicity, andgeographic region (New York City and Rest of State) forindividual years from 2005 through 2011.
ARR for asthma ED visits among children with asthma are also presented by age group, gender, race and ethnicity,and geographic region. However, for children the rates werecomputed for combined years due to the small sample sizeof children in the BRFSS. The BRFSS child data are availableonly for years 2006 through 2011, while SPARCS ED dataare available beginning in year 2005. In addition, 2011BRFSS data cannot be combined with previous years of datadue to a change in data collection methods and weightingthat occurred for the BRFSS Core survey in 2011 (e.g.,incorporation of households with cell phones and use ofiterative proportional weights). Therefore, the ARR for childrenwas calculated only for combined years 2006-2010. TheARR for asthma ED visits for children was calculated bydividing the average annual number of asthma ED visits for2006-2010 by the average estimated number of childrenwith current asthma in the same time period.
The 95% confidence intervals (CIs) for these estimatesare provided for both children and adults. Estimates areconsidered statistically “significantly different” from eachother when they do not have overlapping CIs.

81
The annual ARR for asthma ED visits in New York Statehas remained relatively constant since 2005. In 2011, theED ARR was 6.94 per 100 adults (Figure 6–16).
Figure 6-16Asthma Emergency Department Visit Rate per 100 Adults (18+ Years) with Current Asthma, New York State, 2005-2011
0
10
5
15
20
25
2005 2006 2007 2008 2009 2010 2011*
Rate
per
100
2005 2006 2007 2008 2009 2010 2011* Rate (95% CI) Rate (95% CI) Rate (95% CI) Rate (95% CI) Rate (95% CI) Rate (95% CI) Rate (95% CI)
New York State 6.8 (6.78-6.87) 7.8 (7.77-7.88) 7.5 (7.48-7.58) 7.8 (7.71-7.81) 7.05 (7.01-7.09) 6.7 (6.63-6.71) 6.9 (6.90-6.99)
*2011 data should not be compared to data from prior years because of the differences in BRFSS data collection and weighting methodology.

82
From 2006 to 2011, the 18-34 year age group had thehighest ARR for asthma ED visits compared to other adultage groups in NYS (Figure 6-17).
Figure 6-17Asthma Emergency Department Visit Rate per 100 Adults (18+ Years) with Current Asthma by Age Group and Year, New York State, 2005-2011
0
10
5
15
20
25
2005 2006 2007 2008 2009 2010 2011*
Rate
per
100
18-34 35-64 65+H
2005 2006 2007 2008 2009 2010 2011* Age Group Rate (95% CI) Rate (95% CI) Rate (95% CI) Rate (95% CI) Rate (95% CI) Rate (95% CI) Rate (95% CI)
18–34 7.0 (6.94-7.09) 9.2 (9.08-9.28) 9.9 (9.79-10.01) 9.3 (9.17-9.37) 8.0 (7.95-8.12) 9.1 (8.99-9.19) 7.7 (7.59-7.75)
35–64 7.8 (7.74-7.88) 8.1 (8.04-8.18) 7.4 (7.29-7.42) 8.0 (7.90-8.04) 7.5 (7.39-7.52) 6.5 (6.48-6.59) 7.6 (7.55-7.68)
65+ 3.7 (3.59-3.76) 4.5 (4.43-4.63) 4.1 (3.98-4.17) 4.4 (4.26-4.45) 3.7 (3.67-3.83) 3.5 (3.40-3.55) 4.0 (3.87-4.03)
*2011 data should not be compared to data from prior years because of the differences in BRFSS data collection and weighting methodology.

83
From 2006 to 2011, among adults with current asthmain NYS, men had slightly higher ARR for asthma ED visitscompared to women. (Figure 6-18).
Figure 6-18Asthma Emergency Department Visit Rate per 100 Adults (18+ Years) with Current Asthma by Gender and Year, New York State, 2005-2011
0
10
5
15
20
25
2005 2006 2007
Rate
per
100
Male Female
2008 2009 2010 2011*
2005 2006 2007 2008 2009 2010 2011* Gender Rate (95% CI) Rate (95% CI) Rate (95% CI) Rate (95% CI) Rate (95% CI) Rate (95% CI) Rate (95% CI)
Male 6.6 (6.56-6.70) 8.1 (7.98-8.15) 8.2 (8.09-8.27) 8.6 (8.50-8.68) 7.4 (7.33-7.49) 6.7 (6.66-6.81) 7.5 (7.44-7.60)
Female 6.9 (6.88-7.00) 7.7 (7.62-7.75) 7.2 (7.13-7.25) 7.3 (7.28-7.39) 6.9 (6.80-6.91) 6.6 (6.58-6.68) 6.66 (6.59-6.70)
*2011 data should not be compared to data from prior years because of the differences in BRFSS data collection and weighting methodology.

84
From 2005 to 2011, the ARR for asthma ED visitsamong adults with current asthma varied by race andethnicity. Non-Hispanic blacks consistently had the highestARR for asthma ED visits compared to other racial andethnic groups in NYS. This rate decreased from 19.9 per100 in 2002 to 15.5 per 100 in 2011, with a more drastic
decline seen beginning in 2008, which was predominantlydue to an increase in the number of non-Hispanic blackadults with self-reported current asthma. In 2011, the ARRfor Non-Hispanic black residents (15.5 per 100 adults) was 5 times the rate for Non-Hispanic white residents (3 per 100 adults) (Figure 6-19).
Figure 6-19Asthma Emergency Department Visit Rate per 100 Adults (18+ Years) with Current Asthma by Race/Ethnicity and Year, New York State, 2005-2011
0
10
5
15
20
25
2005 2006 2007 2008 2009 2010 2011*
Rate
per
100
Non-Hispanic White Non-Hispanic Black Non-Hispanic Other Hispanic
2005 2006 2007 2008 2009 2010 2011* Race/Ethnicity Rate (95% CI) Rate (95% CI) Rate (95% CI) Rate (95% CI) Rate (95% CI) Rate (95% CI) Rate (95% CI)
Non-Hispanic White 2.9 (2.89-2.96) 3.1 (3.09-3.17) 2.95 (2.91-2.98) 3.3 (3.24-3.32) 3.04 (3.00-3.08) 2.7 (2.64-2.79) 3.0 (2.96-3.03)
Non-Hispanic Black 19.9 (19.65-20.13) 19.9 (19.68-20.15) 20.2 (19.96-20.42) 22.3 (22.02-22.51) 19.7 (19.51-19.93) 16.2(16.02-16.37) 15.5 (15.35-15.68)
Non-Hispanic Other 2.2 (2.11-2.27) 3.5 (3.38-3.62) 4.9 (4.76-5.06) 4.0 (3.91-4.14) 4.5 (4.36-4.62) 6.6 (6.40-6.79) 7.0 (6.89-7.20)
Hispanic 7.7 (7.54-7.79) 10.1 (9.98-10.28) 10.9 (10.76-11.07) 10.4 (10.29-10.57) 9.0 (8.83-9.08) 8.6 (8.50-8.74) 8.5 (8.37-8.61)
*2011 data should not be compared to data from prior years because of the differences in BRFSS data collection and weighting methodology.

85
The ARR for New York City residents decreased 25% from13.0 in 2005 to 9.8 in 2011, with a more drastic declineoccurring during 2008 to 2010, which was predominantlydue to a substantial increase in the number of New York City
residents with self-reported current asthma. The ARR from2005 to 2011 for the Rest of State remained fairly constant(Table 6-20).
Figure 6-20Asthma Emergency Department Visit Rate per 100 Adults (18+ Years) with Current Asthma by Region and Year, New York State, 2005-2011
0
10
5
15
20
25
2005 2006 2007
Rate
per
100
New York City Rest of State
2008 2009 2010 2011*
2005 2006 2007 2008 2009 2010 2011* Region Rate (95% CI) Rate (95% CI) Rate (95% CI) Rate (95% CI) Rate (95% CI) Rate (95% CI) Rate (95% CI)
New York City 13.0 (12.89-13.11) 14.7 (14.53-14.78) 16.9 (16.79-17.08) 16.3 (16.15-16.43) 14.0 (13.93-14.16) 9.8 (9.71-9.87) 9.8 (9.74-9.90)
Rest of State 3.96 (3.92-4.00) 4.4 (4.37-4.47) 3.9 (3.84-3.92) 4.1 (4.10-4.18) 3.9 (3.85-3.93) 4.3 (4.25-4.34) 4.6 (4.55-4.65)
*2011 data should not be compared to data from prior years because of the differences in BRFSS data collection and weighting methodology.
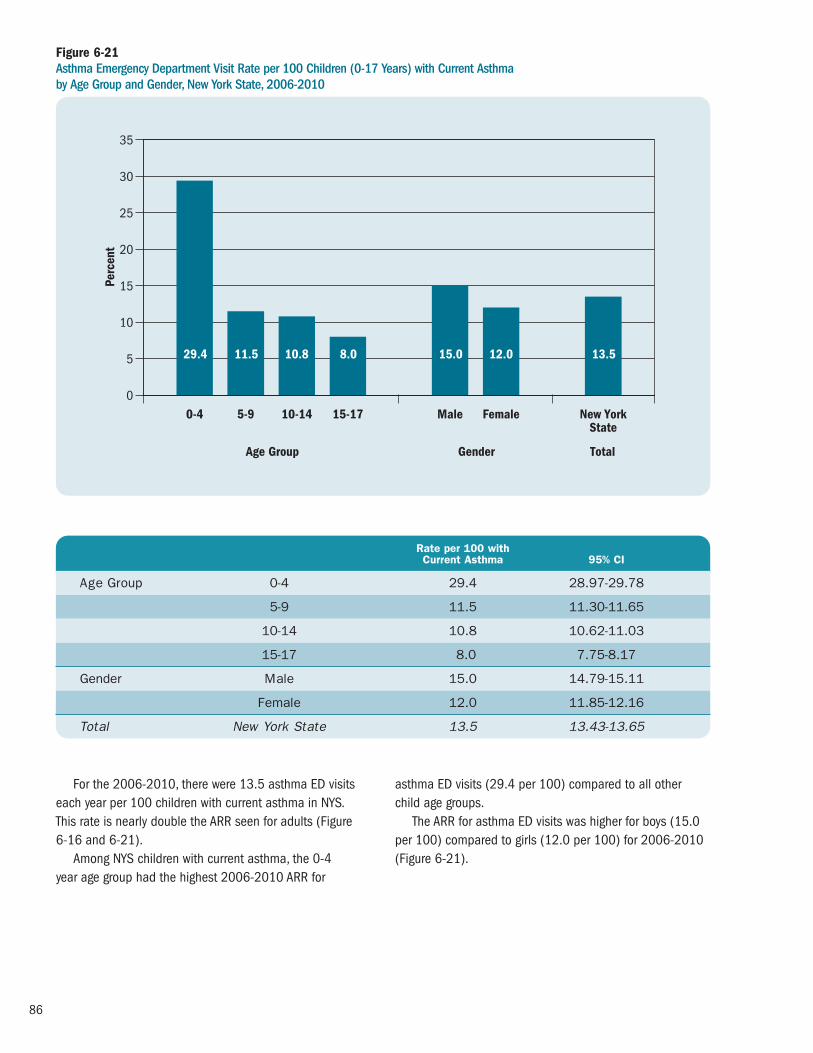
86
For the 2006-2010, there were 13.5 asthma ED visitseach year per 100 children with current asthma in NYS. This rate is nearly double the ARR seen for adults (Figure 6-16 and 6-21).
Among NYS children with current asthma, the 0-4 year age group had the highest 2006-2010 ARR for
asthma ED visits (29.4 per 100) compared to all other child age groups.
The ARR for asthma ED visits was higher for boys (15.0per 100) compared to girls (12.0 per 100) for 2006-2010(Figure 6-21).
Figure 6-21Asthma Emergency Department Visit Rate per 100 Children (0-17 Years) with Current Asthma by Age Group and Gender, New York State, 2006-2010
0
5
10
15
35
30
20
25
Perc
ent
0-4 5-9 10-14 15-17 Male Female New YorkState
Age Group Gender Total
29.4 11.5 10.8 8.0 15.0 12.0 13.5
Rate per 100 with Current Asthma 95% CI
Age Group 0-4 29.4 28.97-29.78
5-9 11.5 11.30-11.65
10-14 10.8 10.62-11.03
15-17 8.0 7.75-8.17
Gender Male 15.0 14.79-15.11
Female 12.0 11.85-12.16
Total New York State 13.5 13.43-13.65

87
For children with current asthma in 2006-2010, Hispanicshad the highest ARR for asthma ED visits at 59.5 per 100,followed by non-Hispanic black children at 31.5 per 100.Non-Hispanic other children had the lowest ARR at 3.3.
The 2006-2010 ARR for asthma ED visits was five times higher for children with asthma living in New York City(30.2 per 100) compared to those living in the Rest ofState (6.0 per 100) (Figure 6-22).
Figure 6-22Asthma Emergency Department Visit Rate per 100 Children (0-17 Years) with Current Asthma by Race/Ethnicity and Region, New York State, 2006-2010
0
30
20
10
40
70
50
60Pe
rcen
t
Non-Hispanic
White
Non-Hispanic
Black
Rest of State
New YorkCity
Race and Ethnicity Region
7.3 31.5 3.3 59.5 30.2 6.0
Non-Hispanic
Other
Hispanic
Rate per 100 with Current Asthma 95% CI
Race/Ethnicity Non-Hispanic White 7.3 7.20-7.49
Non-Hispanic Black 31.5 31.02-31.94
Non-Hispanic Other 3.3 3.25-3.45
Hispanic 59.5 58.39-60.69
Region New York City 30.2 29.92-30.56
Rest of State 6.0 5.94-6.12

88
Highlights: Asthma Hospital Discharges
� The number of hospital discharges due to asthma in New York State decreased 9% in the past 10 yearsfrom 40,585 in 2002 to 36,778 in 2011.
� Asthma hospital discharge rates showed an 11%decrease from 21.2 per 10,000 residents in 2002 to 18.9 per 10,000 in 2011.
� Overall, asthma hospital discharges showed a seasonalpattern with peaks in the spring and fall, and a declinein the summer.
� For 2009-2011, 17% of asthma hospital dischargeswere for children aged 0-4 years, 22% were for adults65 years of age and older, and 29% were for adultsages 25-44 years. In addition, 60% of asthma hospitaldischarges were for females, and 65% were for NewYork City residents.
� From 2002 to 2011, the 0-4 year age group had the highest hospital discharge rate compared to allother age groups. Each age group showed a down -ward trend over time with the exception of the 65year and older age group.
� For 2009-2011, the crude and age-adjusted asthmahospital discharge rates for female New Yorkers (23.4per 10,000; 22.5 per 10,000) were higher comparedto males (16.4 per 10,000; 17.0 per 10,000).
� Males had a higher percentage of asthma hospitaldischarges compared to females in the 0-4 year(64% vs,36%) and 5-14 year (59% vs.41%) agegroups. However, males had lower percentages for all remaining age groups.
� For the period 2009-2011, crude and age-adjustedasthma hospital discharge rates for non-Hispanicblack (42.4 per 10,000; 43.2 per 10,000) andHispanic (38.1 per 10,000; 42.7 per 10,000) NewYork State residents were at least four times higherthan non-Hispanic white residents (9.4 per 10,000;8.9 per 10,000).
� New York City residents had crude and age-adjustedasthma hospital discharge rates (30.2 per 10,000;31.0 per 1,000) in 2009-2011 that were 2.5 timeshigher than residents in the Rest of State (12.2 per10,000; 12.1 per 10,000).
� Asthma hospital discharge rates at the county levelvaried across New York State for 2009-2011. New York City residents of the Bronx had the highest age-adjusted hospital discharge rate of 63.3 per 10,000residents. Among counties in the Rest of State, OneidaCounty had the highest age-adjusted emergencydepartment visit rate of 16.0 per 10,000 residents.
� For 2009-2011, Medicaid was the source of paymentfor 41% of the asthma hospital discharges in NewYork State. Medicare was the payment source for 26%of the asthma hospital discharges. Other, third partyor private insurance payers were the payment sourcefor 25% of asthma hospital discharges.
Asthma Hospital Discharge Rates for Adults withCurrent Asthma (At-Risk Based Rates), 2002-2011� From 2002 to 2011, the annual at-risk based ratefor asthma hospital discharges in New York Statedecreased from 2.25 asthma hospital discharges per 100 adults with current asthma in 2002 to 1.76 per 100 in 2011.
� Asthma hospital discharges among those with currentasthma increased with age. The 65 year and olderage group (3.6 per 100 in 2011) consistently hadthe highest at-risk based rate for asthma hospitaldischarges compared to other adult age groups inNew York State.
� From 2002 to 2011, among adults with currentasthma in New York State, women consistently had higher at-risk based rates for asthma hospitaldischarges compared to men (1.90 and 1.51 per100 in 2011, respectively). The rates decreased for both women and men during this time period.
Asthma Hospital Discharges
7

89
� From 2002 to 2011, among adults with currentasthma, non-Hispanic blacks and Hispanics (2.9 and 2.4 per 100 in 2011, respectively) consistentlyhad higher at-risk based rates for asthma hospitaldischarges compared to non-Hispanic whites (1.02 per 100 in 2011) in New York State.
� From 2002 to 2011, the at-risk based rate forhospital discharges among adults with currentasthma was higher for residents in New York Citycompared to those in the Rest of State (2.46 and 1.20 per 100 in 2011, respectively).
Asthma Hospital Discharge Rates for Children withCurrent Asthma (At-Risk Based Rates), 2006-2010
� For 2006-2010, there was an annual average of 3.5 asthma hospital discharges per 100 childrenwith current asthma in New York State.
� For 2006-2010, among New York State children with current asthma, the 0-4 year age group had the highest at-risk based rate for asthma hospitaldischarges (10.1 per 100) compared to all otherchild age groups.
� The at-risk based rate for asthma hospital dischargesfor 2006-2010 was higher for boys (4.0 per 100)compared to girls with current asthma (3.0 per 100).
� Among children with current asthma, the 2006-2010at-risk based rate for asthma hospital discharges washighest for Hispanic children (15.4 per 100) followedby non-Hispanic black children (7.1 per 100).
� The at-risk based rate for asthma hospital dischargesfor 2006-2010 was almost five times higher forchildren with current asthma living in New York City(7.7 per 100) compared to those living in the Rest of State (1.6 per 100).
Asthma Hospital Discharges
Methodology
Asthma hospital discharge information for New York State(NYS) was obtained from the Statewide Planning andResearch Cooperative System (SPARCS) Hospital InpatientDatabase. This database contains information about allhospital discharges from acute care and rehabilitationhospitals located in NYS. It includes record-level detail onpatient characteristics, diagnoses and treatments, services,residence location and charges for every hospital dischargein NYS. An asthma hospital discharge was defined as havinga principal diagnosis with an International Classification of Diseases, 9th Revision, Clinical Modification (ICD-9-CM)code of 493. It is possible that a person may be hospitalizedfor asthma multiple times and as a result could be countedmore than once in these data. Population estimates used for computing the asthma hospital discharge rates wereobtained from the United States Census Bureau.
Crude and age-adjusted asthma hospital discharge rates were calculated per 10,000 residents. The age-adjusted rates were calculated using the 2000 U.S.Standard Population (see Appendix 2).
Ten-year trends of asthma hospital discharge data(2002-2011) are presented by state total, age group,gender, and geographic region (New York City and Rest ofState). Asthma hospital discharge rates for a specific yearwere calculated by dividing the number of asthma hospitaldischarges by the population of that year and thenmultiplying by 10,000.
Combined years (2009-2011) of data for asthma hospitaldischarges are presented by age group, gender, race andethnicity, and geographic region (New York City and Rest ofState). The combined asthma hospital discharge rates for2009-2011 were calculated as follows: the total number of asthma hospital discharges for the three-year period was divided by three to get the average number of asthmahospital discharges per year. The average number of asthmahospital discharges was then divided by the middle yearpopulation (2010) and multiplied by 10,000.
Asthma hospital discharge data for 2009-2011 are also presented as tables, maps and graphs at the state and county level. An example of asthma hospital dischargeZIP code level data for counties is also included.

90
From 2002 to 2011, the annual number of asthmahospital discharges among NYS residents decreased 9%
from 40,585 to 36,778, with peaks in 2003 and 2009(Figure 7–1).
Figure 7-1 Annual Asthma Hospital Discharges, New York State, 2002-2011
0
10,000
20,000
30,000
40,000
50,000
60,000
2002 2003 2004 2005 2006 2007 2008 2009 2010 2011
Asth
ma
Hos
pita
l Dis
char
ges
Trends in Asthma Hospital Discharges
2002 2003 2004 2005 2006 2007 2008 2009 2010 2011
Asthma Hospital Discharges 40,585 45,670 41,991 38,957 39,250 37,404 39,306 42,040 37,391 36,778

91
The annual asthma hospital discharge rate in NYSdecreased 11% from 21.2 asthma hospital discharges per 10,000 residents in 2002 to 18.9 asthma hospital
discharges per 10,000 residents in 2011, with peaks in 2003 and 2009 (Figure 7-2).
Figure 7-2 Annual Asthma Hospital Discharge Rate per 10,000 Residents, New York State, 2002-2011
0
5
10
15
20
25
30
2002 2003 2004 2005 2006 2007 2008 2009 2010 2011
Rate
per
10,
000
2002 2003 2004 2005 2006 2007 2008 2009 2010 2011
Rate per 10,000 21.2 23.8 21.8 20.2 20.3 19.4 20.2 21.5 19.3 18.9
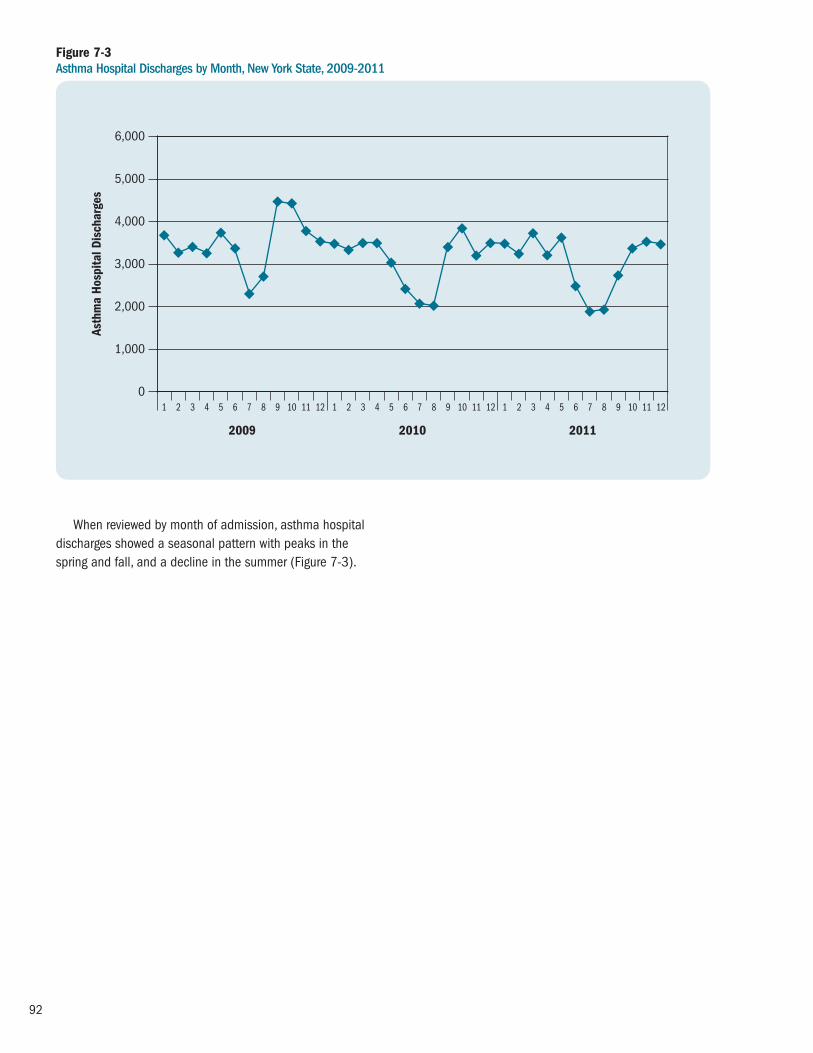
92
When reviewed by month of admission, asthma hospitaldischarges showed a seasonal pattern with peaks in thespring and fall, and a decline in the summer (Figure 7-3).
Figure 7-3 Asthma Hospital Discharges by Month, New York State, 2009-2011
0
1,000
2,000
3,000
4,000
5,000
6,000
2009
1 2 3 4 5 6 7 8 9 10 11 12 1 2 3 4 5 6 7 8 9 10 11 12 1 2 3 4 5 6 7 8 9 10 11 12
2010 2011
Asth
ma
Hos
pita
l Dis
char
ges

93
For 2009-2011, the number of asthma hospitaldischarges for those aged 0-14 years showed a similar
seasonal pattern with peaks in the spring and fall, and a decline in the summer (Figure 7–4).
Figure 7-4 Asthma Hospital Discharges by Month, Ages 0-14 Years, New York State, 2009-2011
0
500
1,000
1,500
2,500
2009
1 2 3 4 5 6 7 8 9 10 11 12 1 2 3 4 5 6 7 8 9 10 11 12 1 2 3 4 5 6 7 8 9 10 11 12
2010 2011
Asth
ma
Hos
pita
l Dis
char
ges 2,000

94
For 2009-2011, the crude and age-adjusted asthmahospital discharge rates for NYS were the same, at 19.9 per 10,000 residents.
Female New Yorkers had higher crude and age-adjustedasthma hospital discharge rates (23.4 per 10,000; 22.5 per 10,000) compared to males (16.4 per 10,000;17.0 per 10,000).
Non-Hispanic black New Yorkers had crude and age-adjusted hospital discharge rates (42.4 per 10,000; 43.2 per10,000) that were almost five times higher than non-Hispanicwhite New Yorkers (9.4 per 10,000; 8.9 per 10,000).
Hispanic New Yorkers had crude and age-adjustedhospital discharge rates (38.1 per 10,000; 42.7 per
10,000) that were at least four times higher than non-Hispanic white residents (9.4 per 10,000; 8.9 per 10,000).
Non-Hispanic New Yorkers who were included in theother category (neither black nor white), had crude and age-adjusted hospital discharge rates (18.9 per 10,000; 21.9per 10,000) that were double those of non-Hispanic whiteNew Yorkers (9.4 per 10,000; 8.9 per 10,000).
New York City residents had crude and age-adjustedasthma hospital discharge rates (30.2 per 10,000; 31.0per 10,000) in 2009-2010 that were 2.5 times higher thanresidents in the Rest of State (12.2 per 10,000; 12.1 per10,000) (Table 7-1).
Table 7-1 Crude and Age-Adjusted* Asthma Hospital Discharge Rate per 10,000 Residents by Gender, Race/Ethnicity and Region, New York State, 2009-2011
Asthma Hospital Discharges by Socio-demographic Characteristics
*Adjusted rates are age-adjusted to the 2000 United States population.
Crude Age-Adjusted*
Gender Male 16.4 17.0
Female 23.4 22.5
Race/Ethnicity Non-Hispanic White 9.4 8.9
Non-Hispanic Black 42.4 43.2
Non-Hispanic Other 18.9 21.9
Hispanic 38.1 42.7
Region New York City 30.2 31.0
Rest of State 12.2 12.1
Total New York State 19.9 19.9

95
Figure 7-5 Asthma Hospital Discharge Rate per 10,000 Residents by Age Group and Year, New York State, 2002-2011
0
20
40
60
80
100
Rate
per
10,
000
0–4 5–14 15–24 25–44 45–64 65+
2002 2003 2004 2005 2006 2007 2008 2009 2010 2011
From 2002 to 2011, the 0-4 year age group had the highest asthma hospital discharge rate compared to all other age groups in NYS. Each age group showed
Age Group 2002 2003 2004 2005 2006 2007 2008 2009 2010 2011
0 –4 68.4 77.1 67.4 58.7 62.2 56.0 58.4 61.7 56.0 52.1
5–14 22.6 27.7 25.3 22.7 22.4 21.1 20.0 23.2 19.4 19.7
15–24 9.5 10.5 8.6 8.0 7.8 7.4 7.3 8.8 6.6 6.9
25–44 13.7 14.6 12.7 11.5 11.6 11.1 11.1 11.7 9.6 9.2
45–64 21.3 23.5 21.8 20.5 20.7 20.4 21.4 22.6 21.3 20.7
65+ 25.8 29.4 30.0 30.3 29.9 29.3 32.6 32.3 31.8 31.9
a downward trend over time with the exception of the 65 year and older age group (Figure 7-5).

96
For 2009-2011, 17% of the asthma hospital dischargeswere for children aged 0-4 years, 29% of the asthma
hospital discharges were for the 25-44 year age group, and22% were for the 65 and older age group (Figure 7-6).
Figure 7-6 Asthma Hospital Discharges by Age Group, New York State, 2009-2011
Age 65+(N=25,252)
22%
Age 25-44(N=33,747)29%
Age 5-14(N=6,106)5%
Age 45-64(N=14,840)
13%
Age 0-4(N=20,116)17%
Age 15-24(N=16,118)14%

97
Asthma hospital discharge rates decreased over time,but fluctuated from year to year for both males and femalesfrom 2002 to 2011. The rate for females was consistentlyhigher than the rate for males. In 2011, the asthma hospital
discharge rate for females (22.3 per 10,000) was 32%higher than the asthma hospital discharge rate for males(15.2 per 10,000) (Figure 7-7).
Figure 7-7Asthma Hospital Discharge Rate per 10,000 Residents by Gender and Year, New York State, 2002-2011
0
15
10
5
20
25
30
35
Rate
per
10,
000
Male Female
2002 2003 2004 2005 2006 2007 2008 2009 2010 2011
Gender 2002 2003 2004 2005 2006 2007 2008 2009 2010 2011
Male 18.0 20.5 18.6 17.0 17.1 16.2 16.4 17.8 15.8 15.2
Female 24.1 26.9 24.8 23.2 23.4 22.4 23.7 25.1 22.6 22.3

98
For 2009-2011, 60% of asthma hospital dischargeswere by female New Yorkers (Figure 7-8).
Figure 7-8 Asthma Hospital Discharges by Gender, New York State, 2009-2011
Female(N=70,147)60%
Male(N=46,062)
40%

99
For 2009-2011, there was a higher proportion ofasthma hospital discharges for males than females amongthose aged 0-14 years (0-4 years: males-64%, females-36%; 5-14 years: males-59%, females-41%).
In contrast, among those aged 15 years and older,females accounted for a higher proportion of asthma
hospital discharges compared to males (15-24 years:males-39%, females-61%; 25-44 years: males-31%,females- 69%; 45-64 years: males-29%, females-71%;65+ years: males-28%, females-72%) (Figure 7-9).
Figure 7-9 Percentage of Asthma Hospital Discharges by Age Group and Gender, New York State, 2009-2011
0-4 5-14 15-24 25-44 45-64 65+0
10
20
30
40
50
60
70
80
Perc
ent
FemaleMale
64 36 60 40 39 61 32 68 29 71 28 72

100
From 2002 to 2011, there was a 17% decline in asthmahospital discharge rates for New York City residents, whilethe rate remained relatively stable for those living in the
Rest of State. New York City residents had consistentlyhigher asthma hospital discharges when compared toresidents in the Rest of State (Figure 7-10).
Figure 7-10 Asthma Hospital Discharge Rate per 10,000 Residents by Region and Year, New York State, 2002-2011
Region 2002 2003 2004 2005 2006 2007 2008 2009 2010 2011
New York City 34.4 38.5 34.9 30.9 31.1 30.0 31.0 32.2 29.8 28.7
Rest of State 11.5 13.1 12.3 12.4 12.3 11.4 12.0 13.4 11.6 11.7
2008 2009 2010 20112002 2003 2004 2005 2006 20070
10
20
30
40
50
Rate
per
10,
000
New York City Rest of State
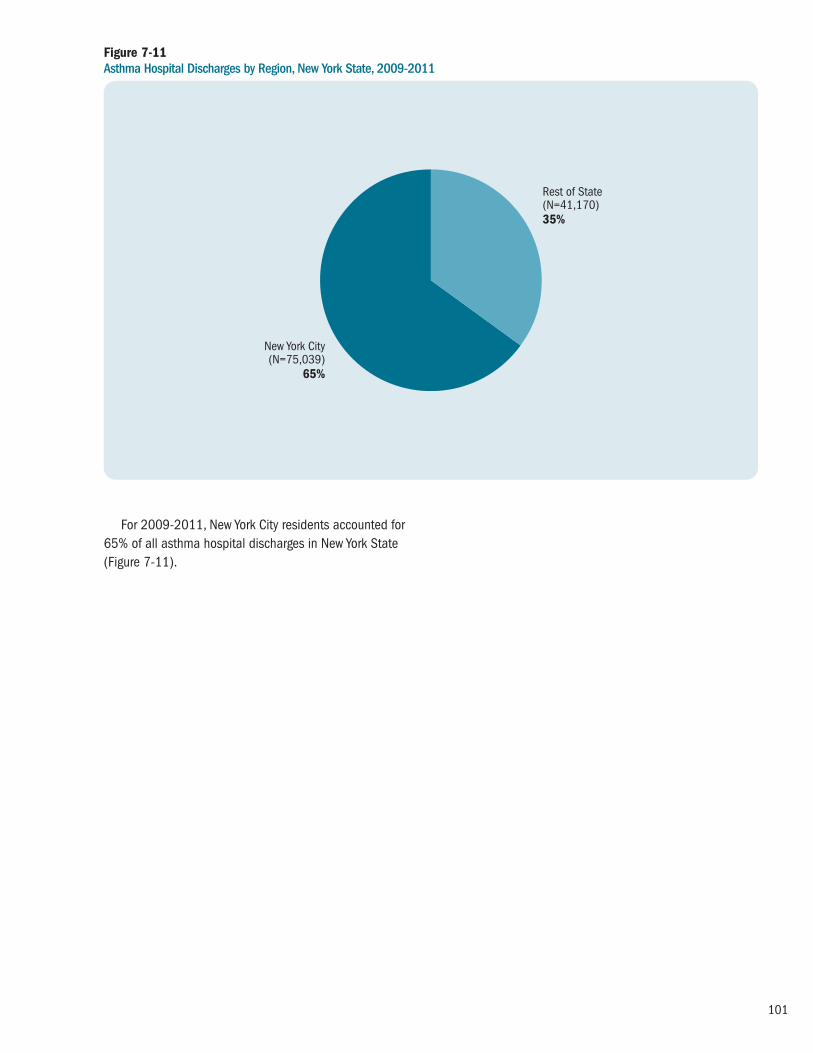
101
For 2009-2011, New York City residents accounted for65% of all asthma hospital discharges in New York State(Figure 7-11).
Figure 7-11 Asthma Hospital Discharges by Region, New York State, 2009-2011
Rest of State(N=41,170)35%
New York City(N=75,039)
65%

102
For 2009-2011, Medicaid was the source of payment for41% of the asthma hospital discharges in New York State.Medicare was the payment source for 26% of asthma
hospital discharges, and Other third party or privateinsurance was the payment source for 25% of the asthmahospital discharges (Figure 7-12).
Figure 7-12 Asthma Hospital Discharges by Source of Payment, New York State, 2009-2011
Self-pay(N=9,354)8%
Medicare(N=30,138)26%
Other Third Party/Private(N=29,067)25%
Medicaid(N=47,650)
41%

103
Table 7-2 Crude and Age-Adjusted* Asthma Hospital Discharge Rate per 10,000 Residents by Region and County, New York State, 2009-2011
Discharges Average Population Crude AdjustedRegion/County 2009 2010 2011 Total 2009-2011 Rate Rate
REGION 1: WESTERN NEW YORK
Allegany 54 47 51 152 48,960 10.3 10.9
Cattaraugus 106 90 80 276 79,946 11.5 12.0
Chautauqua 135 122 101 358 134,259 8.9 8.8
Erie 1,402 1,127 1,003 3,532 915,438 12.9 13.2
Genesee 54 49 45 148 59,313 8.3 8.0
Niagara 287 198 188 673 215,679 10.4 10.2
Orleans 35 33 20 88 42,519 6.9 6.7
Wyoming 41 46 48 135 41,832 10.8 10.4
Region Total 2,114 1,712 1,536 5,362 1,537,947 11.6 11.8
REGION 2: FINGER LAKES
Chemung 152 134 118 404 88,667 15.2 14.8
Livingston 59 45 41 145 64,445 7.5 8.0
Monroe 920 797 806 2,523 741,224 11.3 11.2
Ontario 83 55 52 190 107,369 5.9 5.6
Schuyler 19 21 15 55 18,475 9.9 9.4
Seneca 14 21 24 59 34,833 5.6 5.6
Steuben 116 93 72 281 98,192 9.5 9.4
Wayne 85 95 79 259 92,833 9.3 9.0
Yates 25 6 11 42 25,095 5.6 6.1
Region Total 1,473 1,267 1,218 3,958 1,271,131 10.4 10.2
REGION 3: CENTRAL NEW YORK
Cayuga 87 94 82 263 79,763 11.0 10.3
Cortland 30 25 30 85 48,898 5.8 6.3
Herkimer 51 66 44 161 63,638 8.4 7.8
Jefferson 84 78 80 242 117,619 6.9 6.7
Lewis 17 23 19 59 26,772 7.3 6.7
Madison 69 63 66 198 72,254 9.1 9.5
Oneida 418 357 336 1,111 233,403 15.9 15.0
Onondaga 416 383 349 1,148 462,913 8.3 8.3
Oswego 113 96 75 284 121,905 7.8 8.1
St. Lawrence 143 111 138 392 111,116 11.8 12.1
Tompkins 59 36 40 135 101,689 4.4 5.9
Region Total 1,487 1,332 1,259 4,078 1,439,971 9.4 9.5
Asthma Hospital Discharge Rates by County
*Adjusted rates are age-adjusted to the 2000 United States population.

104
Table 7-2 continuedCrude and Age-Adjusted* Asthma Hospital Discharge Rate per 10,000 Residents by Region and County, New York State, 2009-2011
ED Visits Average Population Crude AdjustedRegion/County 2009 2010 2011 Total 2009-2011 Rate Rate
REGION 4: NEW YORK-PENNSYLVANIA
Broome 227 186 226 639 198,087 10.8 10.9
Chenango 39 43 37 119 50,405 7.9 7.3
Tioga 17 12 12 41 50,744 2.7 2.7
Region Total 283 241 275 799 299,236 8.9 8.9
REGION 5: NORTHEASTERN NEW YORK
Albany 449 405 346 1,200 302,018 13.2 13.7
Clinton 127 142 126 395 81,897 16.1 15.8
Columbia 57 49 47 153 62,421 8.2 8.5
Delaware 49 37 56 142 47,018 10.1 9.6
Essex 28 32 24 84 38,746 7.2 6.5
Franklin 86 66 64 216 51,141 14.1 13.9
Fulton 120 93 91 304 55,255 18.3 19.2
Greene 48 40 45 133 49,041 9.0 9.2
Hamilton s s s s 4,851 s s
Montgomery 48 51 61 160 49,584 10.8 10.7
Otsego 77 55 60 192 61,926 10.3 10.6
Rensselaer 266 207 165 638 158,122 13.4 13.7
Saratoga 182 162 167 511 220,186 7.7 7.6
Schenectady 193 160 162 515 153,985 11.1 11.1
Schoharie 29 19 14 62 32,285 6.4 7.0
Warren 86 107 79 272 65,853 13.8 13.6
Washington 93 83 75 251 63,045 13.3 12.5
Region Total 1,939 1,710 1,584 5,233 1,497,372 11.6 11.7
REGION 6: HUDSON VALLEY
Dutchess 400 294 328 1,022 296,350 11.5 11.9
Orange 556 467 570 1,593 377,072 14.1 14.0
Putnam 105 79 99 283 99,636 9.5 9.7
Rockland 423 346 446 1,215 309,006 13.1 12.6
Sullivan 126 60 78 264 76,758 11.5 12.1
Ulster 219 174 187 580 182,127 10.6 10.5
Westchester 1,441 1,311 1,354 4,106 953,658 14.4 13.9
Region Total 3,270 2,731 3,062 9,063 2,294,607 13.2 12.9
*Adjusted rates are age-adjusted to the 2000 United States population.
s: Data do not meet reporting criteria
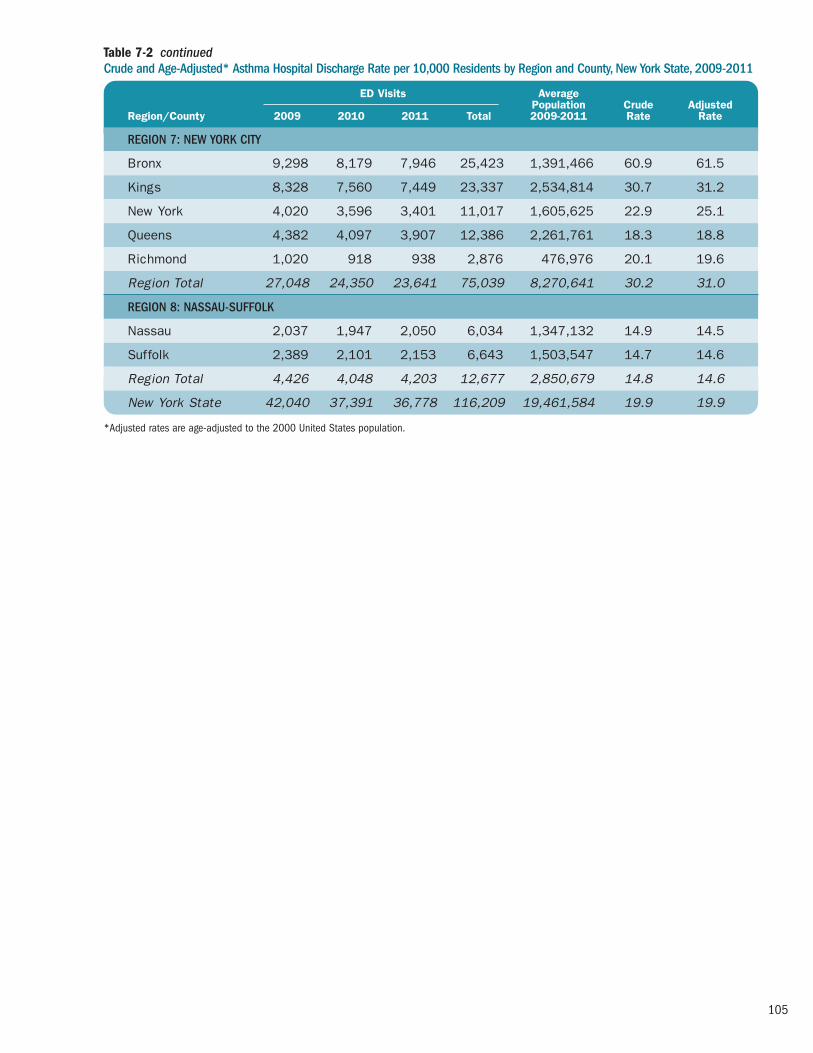
105
Table 7-2 continuedCrude and Age-Adjusted* Asthma Hospital Discharge Rate per 10,000 Residents by Region and County, New York State, 2009-2011
ED Visits Average Population Crude AdjustedRegion/County 2009 2010 2011 Total 2009-2011 Rate Rate
REGION 7: NEW YORK CITY
Bronx 9,298 8,179 7,946 25,423 1,391,466 60.9 61.5
Kings 8,328 7,560 7,449 23,337 2,534,814 30.7 31.2
New York 4,020 3,596 3,401 11,017 1,605,625 22.9 25.1
Queens 4,382 4,097 3,907 12,386 2,261,761 18.3 18.8
Richmond 1,020 918 938 2,876 476,976 20.1 19.6
Region Total 27,048 24,350 23,641 75,039 8,270,641 30.2 31.0
REGION 8: NASSAU-SUFFOLK
Nassau 2,037 1,947 2,050 6,034 1,347,132 14.9 14.5
Suffolk 2,389 2,101 2,153 6,643 1,503,547 14.7 14.6
Region Total 4,426 4,048 4,203 12,677 2,850,679 14.8 14.6
New York State 42,040 37,391 36,778 116,209 19,461,584 19.9 19.9
*Adjusted rates are age-adjusted to the 2000 United States population.

106
Asthma Hospital Discharge Rate0 4020 60 80
AlleganyCattaraugusChautauqua
ErieGeneseeNiagaraOrleans
Wyoming
ChemungLivingston
MonroeOntario
SchuylerSeneca
SteubenWayne
Yates
CayugaCortlandHerkimerJefferson
LewisMadison
OneidaOnondaga
OswegoSt. Lawrence
Tompkins
BroomeChenango
Tioga
AlbanyClinton
ColumbiaDelaware
EssexFranklin
FultonGreene
HamiltonMontgomery
OtsegoRensselaer
SaratogaSchenectady
SchoharieWarren
Washington
DutchessOrangePutnam
RocklandSullivan
UlsterWestchester
BronxKings
New YorkQueens
Richmond
NassauSuffolk
Regi
on 1
Regi
on 2
Regi
on 3
Regi
on 4
Regi
on 5
Regi
on 6
Regi
on 7
Regi
on 8
New York State: 19.9
Table 7-2 presents the crude and age-adjusted county-specific asthma hospital discharge rates, and Figure 7-13 is a NYS map that shows the age-adjusted NYS county-specific asthma hospital discharge rates for 2009-2011.Similar data for specific age groups (e.g., 0-4 years, 5-11 years, 12-17 years, 0-17 years, 18-64 years, and 65+ years) are available at the NYSDOH AsthmaSurveillance website (see: http://www.health.ny.gov/ statistics/ny_asthma/).
Asthma hospital discharge rates varied by region andcounty of residence. For New York City, the Bronx had thehighest age-adjusted asthma hospital discharge rate of61.5 per 10,000 residents, followed by Kings County withan age-adjusted rate of 31.2 per 10,000 residents.
For counties in the Rest of State, age-adjusted ratesranged from highs of 19.2 per 10,000 residents in FultonCounty and 15.8 per 10,000 residents in Clinton County to 2.7 per 10,000 residents in Tioga County.
Figure 7-13 Age-Adjusted* Asthma Hospital Discharge Rate per 10,000 Residents by County, New York State, 2009-2011
*Adjusted rates are age-adjusted to the 2000 United States population.
Asthma Hospital Discharge RateCounties are Shaded Based on Quartile Distribution
Data not available or do not meet reporting criteria 0 – <10.5: Q1 & Q210.5 – <13.7: Q313.7+: Q4

107
Figure 7-14 Albany County: Asthma Hospital Discharge Rate per 10,000 Residents, 2002-2011
0
4
8
12
16
20
2002 2003 2004 2005 2006 2007 2008 2009 2010 2011
Rate
Single Year Upstate New York3-Year AverageJ
Figure 7-14 and Table 7-3 are examples of 10-year trenddata for asthma hospital discharge rates for Albany County.Data for specific age groups (i.e., 0-4 years, 0-14 years, 0-17 years, 15-24 years, 25-44 years, 45-64 years, 18-64
years, and 65+ years) for Albany County, as well as for every other county in NYS, are available at the NYSDOH Asthma Surveillance website (see: http://www.health.ny.gov/statistics/ny_asthma/).
Table 7-3 Albany County: Asthma Hospital Discharge Rate per 10,000 Residents, 2002-2011
Crude Rate Age-Adjusted Rate
Year Single Year 3-Year Average NYS Exc. NYC Single Year 3-Year Average NYS Exc. NYC
2002 9.4 – 11.5 9.7 – 11.6
2003 11.9 11.6 13.1 12.3 12.1 13.3
2004 13.6 13.0 12.3 14.1 13.5 12.3
2005 13.4 13.3 12.4 14.1 13.9 12.4
2006 12.8 12.7 12.3 13.4 13.3 12.4
2007 11.9 11.9 11.4 12.5 12.4 11.4
2008 11.1 12.7 12.0 11.5 13.3 12.0
2009 15.1 13.2 13.4 15.9 13.5 13.4
2010 13.3 13.2 11.6 13.3 13.7 11.5
2011 11.4 – 11.7 11.9 – 11.5

108
Figure 7-15 Albany County: Total Asthma Hospital Discharge Rate per 10,000 Residents by ZIP Code, 2009-2011
12007*
12009
12023*
12041*
12046*
12047
1205412059*
12067*
12077*
12084
12110
12120*
12143
12147*
12158
12159
12183
12186
12189
12193*
12202
1220312204
12205
12206
1220712208
12209
12210
12211
12303
12469*
**Less than or equal to 10 hospital discharges, therefore rate may not be stable (Relative Standard Error >30%).
**Data is suppressed for confidentiality purposes if there are less than 6 hospital discharges per ZIP code.
A non-shaded area indicates that the ZIP code predominantly lies in an adjacent county.
Asthma Hospital Discharge RateZip Codes Are Shaded Based on Quartile Distribution
Albany County: 13.2New York State: 19.9New York State (Excluding NYC): 12.3
Data not available or do not meet reporting criteria 0 – <9.52: Q1 & Q29.52 – <14.3: Q314.3+: Q4
Asthma Hospital Discharge Rates by ZIP Code for Counties

109
Table 7-4 Albany County: Total Asthma Hospital Discharge Rate per 10,000 Residents by ZIP Code, Three-Year Average 2009–2011
s: Data is suppressed for confidentiality purposes if there are less than 6 discharges per ZIP code.
*Less than or equal to 10 discharges, therefore rate may not be stable (RSE>30%).
Discharges DischargeZIP Code 2009–2011 Rate
12007 s s
12009 17 7.5
12023 11 17.6
12041 s s
12046 s s
12047 82 15.4
12054 34 6.8
12059 s s
12067 s s
12077* 8 4.3
12084 16 10.8
12110 48 8.1
12120 s s
12143 13 7.2
12147 s s
12158 21 10.8
12159 15 7.0
Discharges DischargeZIP Code 2009–2011 Rate
12183 12 16.0
12186 11 5.6
12189 62 12.0
12193 s s
12202 145 51.5
12203 67 6.6
12204 20 10.1
12205 86 10.8
12206 204 43.1
12207 34 54.7
12208 92 14.5
12209 79 26.1
12210 69 25.0
12211 26 6.3
12303 79 9.3
12469 s s
Figure 7-15 and Table 7-4 are examples of three-yearcombined data for asthma hospital discharge rates forAlbany County ZIP codes. Data for specific age groups (i.e.,0-4 years, 0-14 years, 0-17 years, 18-64 years, and 65+
years) for Albany County, as well as for every other county in NYS, are available at the NYSDOH Asthma Surveillance website: (see: http://www.health.ny.gov/statistics/ny_asthma/).

110
At-risk Based Rates for Asthma Hospital Discharges
Methodology
At-risk based rates (ARR) for asthma hospital discharges are the number of asthma-related hospital discharges forindividuals with current asthma rather than for the generalpopulation. Rates for a specific period of time were calcu -lated by dividing the number of asthma hospital dischargesby the estimated number of people with current asthma for that time period and then multiplying by 100.17-20
The number of asthma hospital discharges in NYS wasgenerated from the inpatient database within the StatewidePlanning and Research Cooperative System (SPARCS). (See the Methodology section on page 89 for a fulldescription of the criteria for selection of asthma hospitaldischarges.) The number of asthma hospital discharges was the numerator for the ARR.
The Behavioral Risk Factor Surveillance System (BRFSS)data were used to estimate the number of children (0-17years) and adults (18+ years) with current asthma. (See the Methodology section on page 35 for a full description of how current asthma was defined and how current asthmaprevalence was calculated). The number of people withcurrent asthma was estimated using the weighted currentasthma prevalence. The estimates were used as thedenominator for the ARR.
Beginning in 2011, BRFSS data included data frominterviews completed by people living in cell phone onlyhouseholds in addition to interviews completed by peopleliving in households with landlines. The data also reflectchanges in CDC’s weighting methodology. Weighting ensuresthat the data collected are as representative of New York’spopulation as possible. The new method of weightingensures that the weighted results will be consistent withknown distributions for more socio-demographic variables.
While these two changes improve the accuracy of theBRFSS, they can result in prevalence estimates that aresignificantly different from those calculated previously.Because of the differences in data collection and theweighting methodology, it is not appropriate to makecomparisons of 2011 data to prior years
ARR for asthma hospital discharges for adults withcurrent asthma are presented by age group, gender, raceand ethnicity, and geographic region (New York City and Rest of State) for individual years from 2002 through 2011.
ARR for asthma hospital discharges among children withasthma are also presented by age group, gender, race andethnicity, and geographic region. However, for children, therates were computed for combined years due to the smallsample size of children in the BRFSS. The BRFSS data forchildren are only available for years 2006 through 2011,while SPARCS hospital discharge data are available begin -ning in 1995. In addition, 2011 BRFSS data cannot becombined with previous years of data due to a change in data collection methods and weighting that occurred for the BRFSS Core survey in 2011 (e.g., incorporation of households with cell phones and use of iterativeproportional weights). Therefore, the ARR for children wascalculated only for combined years 2006-2010. The ARR for asthma hospital discharges for children was calculatedby dividing the average annual number of asthma hospitaldischarges for 2006-2010 by the average estimated numberof children with current asthma in the same time period.
The 95% confidence intervals (CIs) for these estimatesare provided for both children and adults. Estimates areconsidered statistically “significantly different” from eachother when they do not have overlapping CIs.

111
From 2002 to 2011, the annual ARR for asthma hospitaldischarges in NYS decreased from 2.25 asthma hospital
discharges per 100 adults with current asthma in 2002 to 1.76 per 100 in 2011 (Figure 7-16).
Figure 7-16Asthma Hospital Discharge Rate per 100 Adults (18+ Years) with Current Asthma, New York State, 2002-2011
0
1
2
3
4
6
5
7
2002 2003 2004 2005 2006 2007
Rate
per
100
2008 2009 2010 2011*
2002 2003 2004 2005 2006 2007 2008 2009 2010 2011* Rate Rate Rate Rate Rate Rate Rate Rate Rate Rate (95% CI) (95% CI) (95% CI) (95% CI) (95% CI) (95% CI) (95% CI) (95% CI) (95% CI) (95% CI)
New York State 2.25 2.6 2.04 1.84 2.04 1.94 2.07 1.94 1.74 1.76 (2.22-2.28) (2.52-2.58) (2.01-2.06) (1.82-1.87) (2.02-2.07) (1.91-1.96) (2.05-2.10) (1.92-1.96) (1.72-1.76) (1.74-1.78)
*2011 data should not be compared to data from prior years because of the differences in BRFSS data collection and weighting methodology.

112
From 2002 to 2011, the 65 year and older age groupconsistently had the highest ARR for asthma hospitaldischarges compared to other adult age groups (Figure 7-17).
Figure 7-17Asthma Hospital Discharge Rate per 100 Adults (18+ Years) with Current Asthma by Age Group and Year, New York State, 2002-2011
0
1
2
3
4
6
5
7
Rate
per
100
18-34 65+35-64J
2002 2003 2004 2005 2006 2007 2008 2009 2010 2011*
2002 2003 2004 2005 2006 2007 2008 2009 2010 2011* Rate Rate Rate Rate Rate Rate Rate Rate Rate RateAge Group (95% CI) (95% CI) (95% CI) (95% CI) (95% CI) (95% CI) (95% CI) (95% CI) (95% CI) (95% CI)
18-34 Years 1.4 1.3 0.95 0.7 0.93 0.95 0.9 0.8 0.77 0.63 (1.33-1.42) (1.24-1.31) (0.92-0.98) (0.68-0.73) (0.90-0.96) (0.92-0.98) (0.85-0.91) (0.79-0.85) (0.75-0.80) (0.61-0.66)
35-64 Years 2.35 2.74 2.1 2.16 2.16 1.93 2.15 2.1 1.74 1.97 (2.31-2.39) (2.70-2.78) (2.09-2.15) (2.12-2.19) (2.12-2.19) (1.90-1.97) (2.11-2.18) (2.09-2.16) (1.71-1.77) (1.94-2.00)
65+ Years 3.6 5.0 4.1 3.6 4.2 3.9 4.3 3.8 3.5 3.6 (3.50-3.68) (4.88-5.12) (4.04-4.23) (3.55-3.71) (4.06-4.25) (3.78-3.96) (4.24-4.43) (3.76-3.93) (3.41-3.56) (3.57-3.73)
*2011 data should not be compared to data from prior years because of the differences in BRFSS data collection and weighting methodology.

113
Figure 7-18Asthma Hospital Discharge Rate per 100 Adults (18+ Years) with Current Asthma by Gender and Year, New York State, 2002-2011
0
1
2
3
4
5
6Ra
te p
er 1
00
Male FemaleJ
2002 2003 2004 2005 2006 2007 2008 2009 2010 2011*
*2011 data should not be compared to data from prior years because of the differences in BRFSS data collection and weighting methodology.
From 2002 to 2011, among adults with current asthmain NYS, women consistently had higher ARR for asthmahospital discharges compared to men. A decreasing trend
occurred for both men and women from 2003 to 2011(Figure 7-18).
2002 2003 2004 2005 2006 2007 2008 2009 2010 2011* Rate Rate Rate Rate Rate Rate Rate Rate Rate RateGender (95% CI) (95% CI) (95% CI) (95% CI) (95% CI) (95% CI) (95% CI) (95% CI) (95% CI) (95% CI)
Male 2.1 2.1 1.6 1.4 1.65 1.7 1.8 1.66 1.4 1.51 (2.05-2.15) (2.03-2.12) (1.52-1.59) (1.38-1.44) (1.62-1.69) (1.64-1.71) (1.75-1.83) (1.62-1.69) (1.37-1.44) (1.48-1.55)
Female 2.3 2.8 2.34 2.1 2.27 2.1 2.2 2.1 1.93 1.90 (2.28-2.35) (2.78-2.86) (2.31-2.37) (2.08-2.15) (2.23-2.30) (2.04-2.11) (2.18-2.24) (2.06-2.12) (1.90-1.96) (1.86-1.92)

114
Figure 7-19Asthma Hospital Discharge Rate per 100 Adults (18+ Years) with Current Asthma by Race/Ethnicity and Year, New York State, 2002-2011
0
1
2
3
4
6
5
7
Rate
per
100
HispanicNon-Hispanic Black Non-Hispanic OtherNon-Hispanic WhiteF J H 1
2002 2003 2004 2005 2006 2007 2008 2009 2010 2011*
*2011 data should not be compared to data from prior years because of the differences in BRFSS data collection and weighting methodology.
From 2002 to 2011, the ARR for asthma hospitaldischarges among adults with current asthma varied by race and ethnicity. Non-Hispanic blacks consistently had the highest ARR for asthma hospital discharges comparedto other racial and ethnic groups in NYS. This rate decreasedfrom 4.6 per 100 in 2002 to 2.9 per 100 in 2011, with
a more drastic decline beginning in 2008, which waspredominantly due to a slight decrease in the number of asthma hospital discharges among non-Hispanic blacks as well as a substantial increase in the number of non-Hispanic black adults with self-reported current asthma(Figure 7-19).
2002 2003 2004 2005 2006 2007 2008 2009 2010 2011* Rate Rate Rate Rate Rate Rate Rate Rate Rate RateRace/Ethnicity (95% CI) (95% CI) (95% CI) (95% CI) (95% CI) (95% CI) (95% CI) (95% CI) (95% CI) (95% CI)
Non-Hispanic White 1.1 1.3 1.08 1.0 1.05 0.94 1.1 1.04 0.9 1.02 (1.08-1.13) (1.25-1.31) (1.05-1.10) (0.97-1.02) (1.03-1.07) (0.92-0.96) (1.09-1.14) (1.02-1.06) (0.89-0.93) (1.00-1.04)
Non-Hispanic Black 4.6 4.6 5.1 4.4 4.4 4.1 4.6 4.3 3.2 2.9 (4.48-4.70) (4.51-4.72) (5.01-5.25) (4.32-4.53) (4.25-4.45) (4.02-4.22) (4.50-4.70) (4.21-4.40) (3.12-3.26) (2.83-2.96)
Non-Hispanic Other 1.0 2.0 1.0 0.75 1.1 1.6 1.3 1.5 2.3 1.9 (0.98-1.10) (1.89-2.12) (0.95-1.07) (0.70-0.79) (1.01-1.14) (1.54-1.71) (1.23-1.36) (1.42-1.56) (2.18-2.40) (1.79-1.94)
Hispanic 2.8 2.8 2.0 2.4 3.0 2.9 3.1 2.7 2.5 2.4 (2.71-2.87) (2.74-2.89) (1.98-2.09) (2.33-2.46) (2.90-3.06) (2.85-3.00) (3.00-3.15) (2.63-2.76) (2.40-2.53) (2.30-2.42)

115
From 2002 to 2011, the ARR for asthma hospitaldischarges among adults with current asthma wasconsistently higher for residents in New York City comparedto those in the Rest of State. The ARR for New York Cityresidents decreased 39% from 4.0 in 2002 to 2.5 in 2011,with a more drastic decline beginning in 2008 which was
due to a slight decrease in the number of asthma hospitaldischarges among New York City residents as well as asubstantial increase in the number of adults living in NewYork City who had self-reported current asthma. The ARRfrom 2002 to 2011 for the Rest of State remained fairlyconstant (Table 7-20).
Figure 7-20Asthma Hospital Discharge Rate per 100 Adults (18+ Years) with Current Asthma by Region and Year, New York State, 2002-2011
0
1
2
3
4
6
5
7Ra
te p
er 1
00
Rest of StateNew York CityF J
2002 2003 2004 2005 2006 2007 2008 2009 2010 2011*
*2011 data should not be compared to data from prior years because of the differences in BRFSS data collection and weighting methodology.
2002 2003 2004 2005 2006 2007 2008 2009 2010 2011* Rate Rate Rate Rate Rate Rate Rate Rate Rate RateRegion (95% CI) (95% CI) (95% CI) (95% CI) (95% CI) (95% CI) (95% CI) (95% CI) (95% CI) (95% CI)
New York City 4.0 4.7 4.4 3.6 3.9 4.5 4.5 3.9 2.6 2.46 (3.90-4.02) (4.66-4.79) (4.31-4.44) (3.57-3.68) (3.81-3.93) (4.39-4.53) (4.39-4.53) (3.89-4.00) (2.54-2.62) (2.42-2.50)
Rest of State 1.23 1.36 1.02 1.02 1.14 0.96 1.06 1.04 1.10 1.20 (1.20-1.25) (1.33-1.38) (1.00-1.04) (1.00-1.04) (1.11-1.16) (0.94-0.98) (1.04-1.08) (1.02-1.06) (1.07-1.12) (1.17-1.22)

116
For the 2006-2011, there were 3.5 asthma hospitaldischarges each year per 100 children with current asthmain New York State. This rate is nearly double the ARR seenfor adults (Figure 7-16 and Figure 7-21).
Among New York State children with current asthma, the 0-4 year age group had the highest 2006-2011 ARR
for asthma hospital discharges (10.1 per 100) compared to all other child age groups.
For 2006-2011, the ARR for asthma hospital dischargeswas higher for boys (4.0 per 100) compared to girls (3.0per 100) (Figure 7-21), while the adult ARRs were higher for women than men (Figure 7-18).
Figure 7-21Asthma Hospital Discharge Rate per 100 Children (0-17 Years) with Current Asthma by Age Group and Gender, New York State, 2006-2011
0
2
4
6
8
10
12
Rate
per
100
0-4 5-9 10-14 15-17 Male Female New YorkState
Age Group Gender Total
10.1 2.6 4.0 3.0 3.52.1 1.2
Rate per 100 with Current Asthma 95% CI
Age Group 0-4 10.1 9.90–10.34
5-9 2.6 2.48–2.64
10-14 2.1 2.05–2.22
15-17 1.2 1.11–1.26
Gender Male 4.0 3.93–4.09
Female 3.0 2.95–3.11
Total New York State 3.5 3.48–3.59

117
For children with current asthma in 2006-2011,Hispanic children had the highest ARR for asthma hospitaldischarges at 15.4 per 100, followed by non-Hispanic blackchildren at 7.1 per 100. Non-Hispanic white children hadthe lowest ARR at 2.3 per 100.
The 2006-2011 ARR for asthma hospital discharges wasalmost five times higher for children with asthma living inNew York City (7.7 per 100) compared to those living in theRest of State (1.6 per 100) (Figure 7-22).
Figure 7-22Asthma Hospital Discharge Rate per 100 Children (0-17 Years) with Current Asthma by Race/Ethnicity and Region, New York State, 2006-2011
0
2
4
6
8
10
12
14
16
Rate
per
100
Non-Hispanic
White
Non-Hispanic
Black
Rest of State
New YorkCity
Race and Ethnicity Region
Non-Hispanic
Other
Hispanic
2.3 7.1 1.0 15.4 7.7 1.6
Rate per 100 with Current Asthma 95% CI
Race/Ethnicity Non-Hispanic White 2.3 2.19–2.35
Non-Hispanic Black 7.1 6.95–7.34
Non-Hispanic Other 1.0 0.93–1.05
Hispanic 15.4 14.87–15.86
Region New York City 7.7 7.56–7.86
Rest of State 1.6 1.57–1.66

118
Highlights: Asthma Deaths
� An annual average of 258 deaths was due to asthma in New York for 2009-2011, for a rate of 13.3 deaths per one million residents.
� In the past 10 years, the New York State asthmadeath rate decreased 24% from 17.2 per one millionresidents in 2002 to 13.1 per one million residents in 2011. Similar decreases were seen for residents of the Rest of State and New York City.
� Asthma deaths increased with age. New York Statechildren aged 0-14 years had a 2009-2011 asthmadeath rate of 3.5 per one million residents, whileNew Yorkers 65 years of age and older had a deathrate of 36.9 per one million residents.
� New York State women had a slightly lower 2009-2011 age-adjusted asthma death rate of 12.1 perone million residents compared to men at 12.3 per one million residents.
� For 2009-2011, non-Hispanic black (31.7 per onemillion) and Hispanic (22.1 per one million) New York State residents had much higher age-adjusteddeath rates compared to non-Hispanic whiteresidents (6.7 per one million).
� New York City’s age-adjusted asthma death rate(19.8 per one million) for 2009-2011 was more than double the rate for the Rest of State (7.2 per one million). Within New York City, Bronx County had the highest age-adjusted asthma death rate (43.5 per one million).
Asthma Death Rates for Adults with Current Asthma (At-Risk Based Rates), 2002-2011
� From 2002 to 2011, the annual at-risk based ratefor asthma deaths in New York State decreased from 27.2 deaths per 100,000 adults with currentasthma in 2002 to 16.7 per 100,000 in 2011.Similar decreases were seen for residents of the Rest of State and New York City.
� Asthma deaths among those with current asthmaincreased with age. From 2002 to 2011, the 65 yearand older age group consistently had the highest at-risk based rate (42.1 per 100,000 in 2011) forasthma deaths compared to other adult age groupsin New York State.
� From 2002 to 2011, the at-risk based rate (ARR) for asthma deaths decreased for both women andmen. Women had the highest ARR for the asthmadeath rate during 2004 to 2006. However, in morerecent years from 2007 through 2011, men hadhigher rates than women.
� From 2002 to 2011, among adults with currentasthma, non-Hispanic blacks (37.3 per 100,000 in 2011) and Hispanics (18.8 per 100,000 in 2011) consistently had higher at-risk based rates for asthma deaths compared to non-Hispanic whites (10.7 per 100,000 in 2011).
� Among adults with current asthma, the 2011 at-riskbased rate for asthma deaths was approximately two times higher for residents in New York City (24.5 per 100,000 in 2011) compared to those in the Rest of State (10.3 per 100,000 in 2011).
Asthma Deaths
8

119
Asthma Deaths
Methodology
The source of the asthma death data is the NYSDOH Bureauof Biometrics and Health Statistics death files. Until 1998,asthma deaths were defined as having a primary cause of death with an International Classification of Diseases, 9th Revision, Clinical Modification (ICD-9-CM) code of 493. Since 1999, asthma deaths were defined as having a primary cause of death with ICD-10-CM of J45 to J46.Population estimates used for computing the asthma death rates were obtained from the U.S. Census Bureau.
Crude and age-adjusted asthma death rates (seeAppendix 1) were calculated per one million residents. Theage-adjusted asthma death rates were calculated using the 2000 U.S. Standard Population (see Appendix 2).
Ten-year trend data for asthma deaths (from 2002 to 2011) are presented for the state total and geographicregion (New York City and Rest of State). Asthma death
rates for a specific year were calculated by dividing thenumber of asthma deaths by the population of that yearand then multiplying by one million.
Combined years (2009-2011) of data for asthmadeaths are presented by age group, gender, race andethnicity and geographic region (New York City and Rest ofState). For the period 2009-2011, the three-year averageannual asthma death rates per one million residents werecalculated as follows: the total number of asthma deathsfor the three-year period was divided by three to get theaverage number of asthma deaths per year. The averagenumber of asthma deaths was then divided by the middleyear population (2010) and multiplied by one million.
Asthma death data for 2009-2011 are presented as tables, maps and graphs at the state and county level.An example of asthma death data at the county level is also presented.
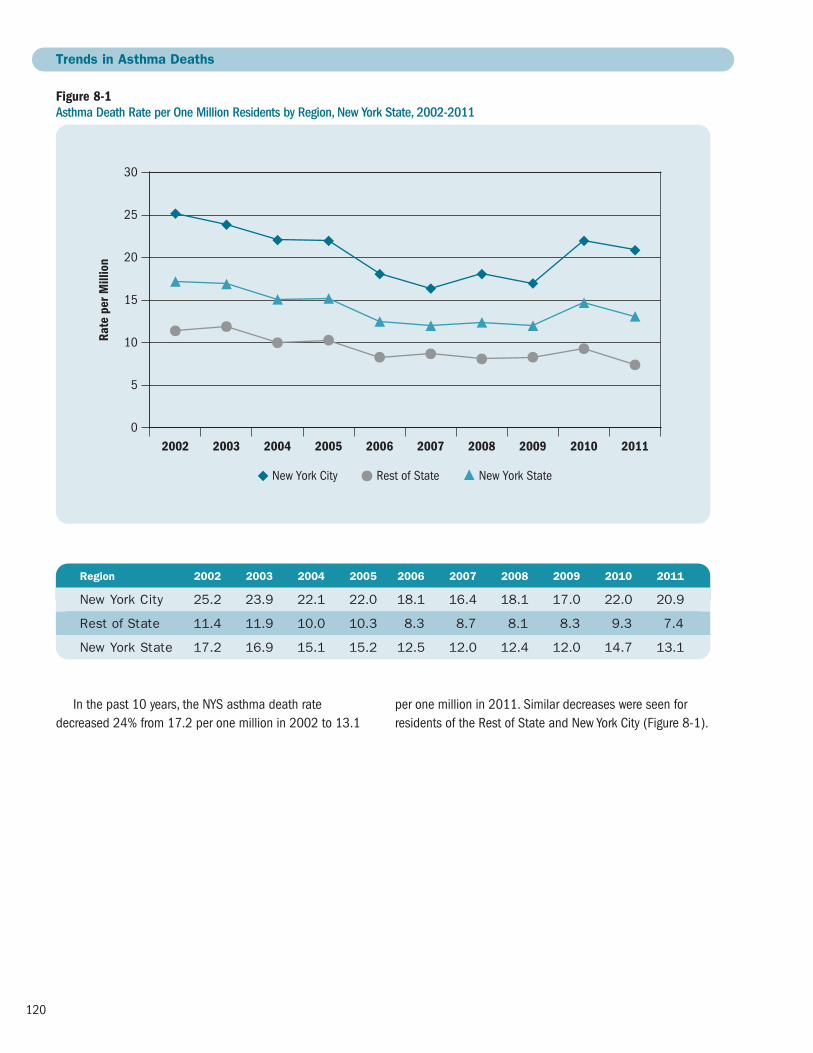
120
In the past 10 years, the NYS asthma death ratedecreased 24% from 17.2 per one million in 2002 to 13.1
Figure 8-1 Asthma Death Rate per One Million Residents by Region, New York State, 2002-2011
H
0
10
20
30
15
25
Rate
per
Mill
ion
New York City Rest of State New York State
5
2002 2003 2004 2005 2006 2007 2008 2009 2010 2011
Trends in Asthma Deaths
Region 2002 2003 2004 2005 2006 2007 2008 2009 2010 2011
New York City 25.2 23.9 22.1 22.0 18.1 16.4 18.1 17.0 22.0 20.9
Rest of State 11.4 11.9 10.0 10.3 8.3 8.7 8.1 8.3 9.3 7.4
New York State 17.2 16.9 15.1 15.2 12.5 12.0 12.4 12.0 14.7 13.1
per one million in 2011. Similar decreases were seen forresidents of the Rest of State and New York City (Figure 8-1).

121
There was an annual average of 258 deaths due toasthma in New York for 2009-2011, for a rate of 13.3 per one million residents. Asthma death rates increasedwith age among NYS residents.
For 2009-2011, NYS children aged 0-14 years had anasthma death rate of 3.5 per one million residents, whileNew Yorkers 65 years of age and older had a death rate of 36.9 per one million residents (Table 8-1).
For 2009-2011, the crude asthma death rate for NYSwas 13.3 per one million residents and the age-adjusteddeath rate was 12.2 per one million.
NYS women had a slightly lower age-adjusted asthmadeath rate for 2009-2011(12.1 per one million residents)compared to men (12.3 per one million).
Non-Hispanic black New Yorkers had an age-adjusteddeath rate of 31.7 per one million, which was approximately
five times the non-Hispanic white death rate (6.7 per one million).
Hispanic New Yorkers had an age-adjusted asthma death rate of 22.1 per one million, which was more thanthree times higher than non-Hispanic white residents.
New York City’s age-adjusted asthma death rate (19.8per one million) for 2009-2011 was almost three times therate for the Rest of State (7.2 per one million) (Table 8-2).
Table 8-1 Asthma Death Rate per One Million by Age Group, New York State, 2009-2011
Age Group Number Rate per One Million
0–14 37 3.5
15–34 87 5.3
35–64 360 15.4
65+ 290 36.9
Total 774 13.3
Table 8-2 Crude and Age-Adjusted* Asthma Death Rate per One Million Residents by Gender, Race/Ethnicity and Region, New York State, 2009-2011
Crude Age-Adjusted*
Gender Male 12.4 12.3
Female 14.2 12.1
Race/Ethnicity Non-Hispanic White 8.6 6.7
Non-Hispanic Black 31.1 31.7
Hispanic 16.7 22.1
Region New York City 20.2 19.8
Rest of State 8.3 7.2
Total New York State 13.3 12.2
Asthma Deaths by Socio-demographic Characteristics
*Adjusted rates are age adjusted to the 2000 United States population.
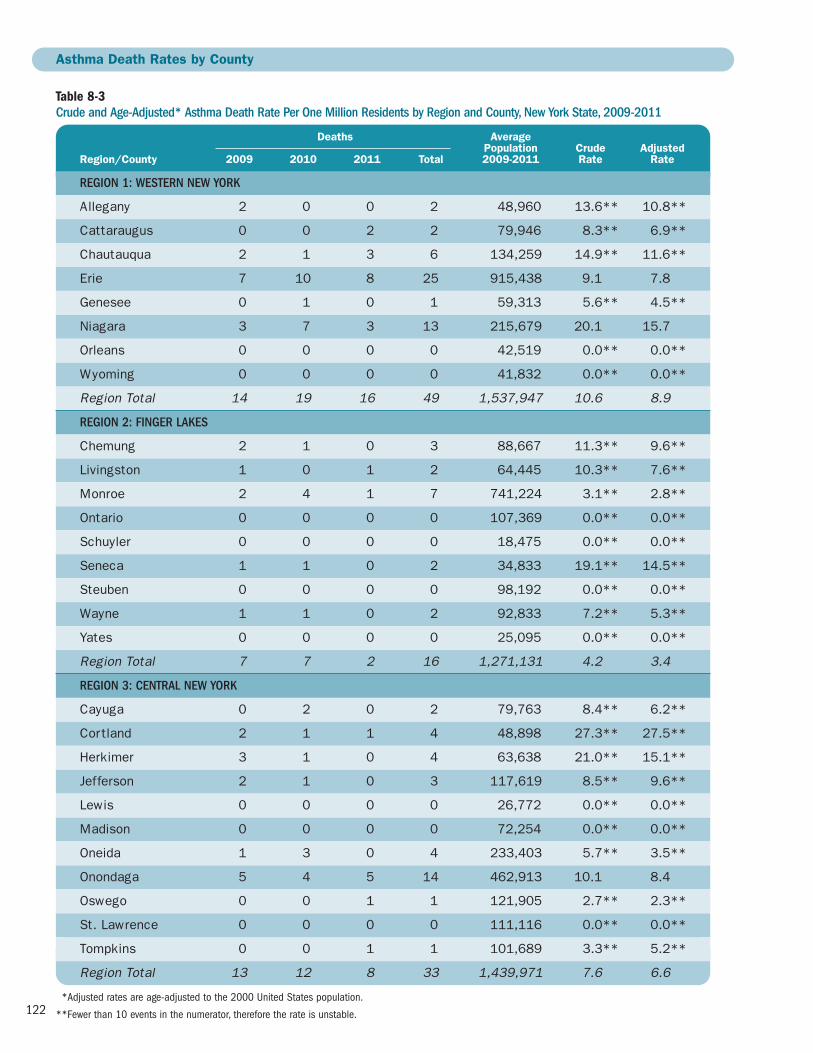
122
Table 8-3 Crude and Age-Adjusted* Asthma Death Rate Per One Million Residents by Region and County, New York State, 2009-2011
Deaths Average Population Crude AdjustedRegion/County 2009 2010 2011 Total 2009-2011 Rate Rate
REGION 1: WESTERN NEW YORK
Allegany 2 0 0 2 48,960 13.6** 10.8**
Cattaraugus 0 0 2 2 79,946 8.3** 6.9**
Chautauqua 2 1 3 6 134,259 14.9** 11.6**
Erie 7 10 8 25 915,438 9.1 7.8
Genesee 0 1 0 1 59,313 5.6** 4.5**
Niagara 3 7 3 13 215,679 20.1 15.7
Orleans 0 0 0 0 42,519 0.0** 0.0**
Wyoming 0 0 0 0 41,832 0.0** 0.0**
Region Total 14 19 16 49 1,537,947 10.6 8.9
REGION 2: FINGER LAKES
Chemung 2 1 0 3 88,667 11.3** 9.6**
Livingston 1 0 1 2 64,445 10.3** 7.6**
Monroe 2 4 1 7 741,224 3.1** 2.8**
Ontario 0 0 0 0 107,369 0.0** 0.0**
Schuyler 0 0 0 0 18,475 0.0** 0.0**
Seneca 1 1 0 2 34,833 19.1** 14.5**
Steuben 0 0 0 0 98,192 0.0** 0.0**
Wayne 1 1 0 2 92,833 7.2** 5.3**
Yates 0 0 0 0 25,095 0.0** 0.0**
Region Total 7 7 2 16 1,271,131 4.2 3.4
REGION 3: CENTRAL NEW YORK
Cayuga 0 2 0 2 79,763 8.4** 6.2**
Cortland 2 1 1 4 48,898 27.3** 27.5**
Herkimer 3 1 0 4 63,638 21.0** 15.1**
Jefferson 2 1 0 3 117,619 8.5** 9.6**
Lewis 0 0 0 0 26,772 0.0** 0.0**
Madison 0 0 0 0 72,254 0.0** 0.0**
Oneida 1 3 0 4 233,403 5.7** 3.5**
Onondaga 5 4 5 14 462,913 10.1 8.4
Oswego 0 0 1 1 121,905 2.7** 2.3**
St. Lawrence 0 0 0 0 111,116 0.0** 0.0**
Tompkins 0 0 1 1 101,689 3.3** 5.2**
Region Total 13 12 8 33 1,439,971 7.6 6.6
Asthma Death Rates by County
**Adjusted rates are age-adjusted to the 2000 United States population.
**Fewer than 10 events in the numerator, therefore the rate is unstable.

123
Table 8-3 continuedCrude and Age-Adjusted* Asthma Death Rate Per One Million Residents by Region and County, New York State, 2009-2011
Deaths Average Population Crude AdjustedRegion/County 2009 2010 2011 Total 2009-2011 Rate Rate
REGION 4: NEW YORK-PENNSYLVANIA
Broome 2 6 2 10 198,087 16.8 13.8
Chenango 0 0 0 0 50,405 0.0** 0.0**
Tioga 0 0 1 1 50,744 6.6** 8.7**
Region Total 2 6 3 11 299,236 12.3 10.8
REGION 5: NORTHEASTERN NEW YORK
Albany 1 6 3 10 302,018 11.0 10.2
Clinton 3 0 1 4 81,897 16.3** 16.0**
Columbia 0 2 0 2 62,421 10.7** 6.2**
Delaware 0 1 0 1 47,018 7.1** 6.2**
Essex 0 1 0 1 38,746 8.6** 7.1**
Franklin 0 0 0 0 51,141 0.0** 0.0**
Fulton 2 0 2 4 55,255 24.1** 23.4**
Greene 0 0 0 0 49,041 0.0** 0.0**
Hamilton 0 0 0 0 4,851 0.0** 0.0**
Montgomery 0 0 0 0 49,584 0.0** 0.0**
Otsego 0 0 1 1 61,926 5.4** 3.4**
Rensselaer 1 2 1 4 158,122 8.4** 6.5**
Saratoga 0 1 0 1 220,186 1.5** 1.0**
Schenectady 2 2 2 6 153,985 13.0** 11.2**
Schoharie 0 0 0 0 32,285 0.0** 0.0**
Warren 2 1 0 3 65,853 15.2** 13.0**
Washington 0 0 1 1 63,045 5.3** 4.2**
Region Total 11 16 11 38 1,497,372 8.5 7.2
REGION 6: HUDSON VALLEY
Dutchess 3 2 3 8 296,350 9.0** 8.0**
Orange 4 4 4 12 377,072 10.6 10.3
Putnam 2 1 0 3 99,636 10.0** 8.3**
Rockland 6 3 4 13 309,006 14.0 12.3
Sullivan 0 0 1 1 76,758 4.3** 4.1**
Ulster 3 2 5 10 182,127 18.3 16.6
Westchester 11 10 5 26 953,658 9.1 8.4
Region Total 29 22 22 73 2,294,607 10.6 9.5
**Adjusted rates are age-adjusted to the 2000 United States population.
**Fewer than 10 events in the numerator, therefore the rate is unstable.

124
Table 8-3 continuedCrude and Age-Adjusted* Asthma Death Rate Per One Million Residents by Region and County, New York State, 2009-2011
Deaths Average Population Crude AdjustedRegion/County 2009 2010 2011 Total 2009-2011 Rate Rate
REGION 7: NEW YORK CITY
Bronx 58 62 53 173 1,391,466 41.4 43.5
Kings 39 61 49 149 2,534,814 19.6 19.7
New York 24 22 33 79 1,605,625 16.4 15.7
Queens 13 33 32 78 2,261,761 11.5 10.9
Richmond 9 2 5 16 476,976 11.2 9.8
Region Total 143 180 172 495 8,270,641 20.0 19.6
REGION 8: NASSAU-SUFFOLK
Nassau 6 5 11 22 1,347,132 5.4 4.3
Suffolk 10 17 10 37 1,503,547 8.2 7.7
Region Total 16 22 21 59 2,850,679 6.9 6.0
New York State 235 284 255 774 19,461,584 13.3 12.2
*Adjusted rates are age-adjusted to the 2000 United States population.

125
Asthma Mortality Rate0 10 20 30 40 50 60
Allegany**Cattaraugus**Chautauqua**
ErieGenesee**Niagara**Orleans**
Wyoming**
Chemung**Livingston**
MonroeOntario**
Schuyler**Seneca**
Steuben**Wayne**Yates**
Cayuga**Cortland**Herkimer**Jefferson**
Lewis**Madison**Oneida
OnondagaOswego**
St. Lawrence**Tompkins**
BroomeChenango**
Tioga**
AlbanyClinton**
Columbia**Delaware**
Essex**Franklin**
Fulton**Greene**
Hamilton**Montgomery**
Otsego**Rensselaer**
Saratoga**Schenectady**
Schoharie**Warren**
Washington**
Dutchess**OrangePutnam**
RocklandSullivan**
Ulster**Westchester
BronxKings
New YorkQueens
Richmond
NassauSuffolk
Regi
on 1
Regi
on 2
Regi
on 3
Regi
on 4
Regi
on 5
Regi
on 6
Regi
on 7
Regi
on 8
New York State: 12.2
Table 8-3 presents the crude and age-adjusted county-specific death rate and Figure 8-2 presents the age-adjustedNYS county-specific asthma death rate for 2009-2011.
Asthma death rates varied by region and county ofresidence; however, some county death rates are potentiallyunstable because they are based on fewer than 10 asthmadeaths. For example, Seneca County had an age-adjustedasthma death rate of 14.5 per one million, but this rate is
based on approximately one asthma death per year.Therefore, these rates should be interpreted with caution.
The Finger Lakes region had the lowest crude (4.2 per onemillion) and age-adjusted (3.4 per one million) death rate.New York City had the highest crude (20.0 per one million)and age-adjusted (19.6 per one million) asthma death rate. Within New York City, Bronx County had the highest age-adjusted asthma death rate (43.5 per one million).
Figure 8-2 Age-Adjusted* Asthma Death Rate per One Million Residents, New York State, 2009-2011
Source: Vital Statistics
**Adjusted rates are age-adjusted to the 2000 United States population.
**Fewer than 10 events in the numerator, therefore the rate is unstable.
Age-Adjusted Asthma Death RateCounties are Shaded Based on Quartile Distribution
0 – <7.0: Q1 & Q27.0 – <10.9: Q310.9+: Q4

126
Figure 8-3 Albany County: Asthma Mortality Rate per One Million Residents, 2002-2011
0
5
10
15
20
25
30
Rate
Single Year Upstate New York3-Year AverageJ
2002 2003 2004 2005 2006 2007 2008 2009 2010 2011
Figure 8-3 and Table 8-4 are examples of ten-year trend data for asthma death rates for Albany County. These data are available for every county in NYS at the NYSDOH
Asthma Surveillance website (see: http://www.health.ny.gov/statistics/ny_asthma/).
Table 8-4Albany County: Asthma Mortality Rate per One Million Residents, 2002-2011
Crude Rate Age-Adjusted Rate
Year Single Year 3-Year Average NYS Exc. NYC Single Year 3-Year Average NYS Exc. NYC
2002 13.5 – 11.4 12.0 – 10.7
2003 16.8 16.8 11.9 14.8 14.6 10.8
2004 20.1 19.0 10.0 17.3 16.6 9.1
2005 20.2 16.8 10.3 18.1 14.8 9.5
2006 10.1 13.4 8.3 8.8 12.2 7.3
2007 10.0 11.2 8.7 10.0 10.5 7.7
2008 13.4 8.9 8.1 12.6 9.0 7.1
2009 3.4 12.2 8.3 4.4 11.5 7.3
2010 19.7 11.0 9.3 17.6 10.2 7.9
2011 9.9 – 7.4 8.4 – 6.4

127
At-risk Based Rates for Asthma Deaths
Methodology
At-risk based rates (ARR) for asthma deaths are the numberof asthma-related deaths among individuals with currentasthma rather than for the general population. Rates for a specific period of time were calculated by dividing the number of asthma deaths by the estimated number of people with current asthma for that time period and then multiplying by 100,000.17-20
The number of asthma deaths in NYS was generated bythe NYSDOH’s Bureau of Biometrics and Health Statistics(BBHS) death files. (See the Methodology section on page119 for a full description of the criteria for selection ofasthma deaths.) The number of asthma deaths was thenumerator for the ARR.
The Behavioral Risk Factor Surveillance System (BRFSS)data were used to estimate the number of adults (18+years) with current asthma. (See the Methodology sectionon page 35 for a full description of how current asthma was defined and how current asthma prevalence wascalculated). The number of people with current asthma wasestimated using the weighted current asthma prevalence.The estimates were the denominator for the ARR.
Beginning in 2011, BRFSS data included data from inter -views completed by people living in cell phone only house -holds in addition to interviews completed by people living inhouseholds with landlines. The data also reflect changes inCDC’s weighting methodology. Weighting ensures that the data collected are as representative of New York’s populationas possible. The new method of weighting ensures that theweighted results will be consistent with known distributions formore socio-demographic variables. While these two changesimprove the accuracy of the BRFSS, they can result in pre -valence estimates that are significantly different from thosecalculated previously. Because of the differences in data collection and the weighting methodology, it is not appropri-ate to make comparisons of 2011 data to prior years.
ARR for asthma deaths for adults with current asthma arepresented by age group, gender, race and ethnicity, and geo-graphic region (New York City and Rest of State) for individualyears from 2002 to 2011. Child rates are not presented due to the small number of asthma deaths in this population.The 95% confidence intervals (CIs) for adult estimates areprovided. Estimates are considered “significantly different”from each other when they do not have overlapping CIs.

128
From 2002 to 2011, the annual ARR for asthma deathsin NYS decreased 39% from 27.2 deaths per 100,000
adults with current asthma in 2002 to 16.7 per 100,000 in 2011 (Figure 8-4).
Figure 8-4Asthma Death Rate per 100,000 Adults (18+ Years) with Current Asthma, New York State, 2002-2011
0
20
40
60
80
100
Rate
per
10,
000
2002 2003 2004 2005 2006 2007 2008 2009 2010 2011*
*2011 data should not be compared to data from prior years because of the differences in BRFSS data collection and weighting methodology.
2002 2003 2004 2005 2006 2007 2008 2009 2010 2011* Rate Rate Rate Rate Rate Rate Rate Rate Rate Rate (95% CI) (95% CI) (95% CI) (95% CI) (95% CI) (95% CI) (95% CI) (95% CI) (95% CI) (95% CI)
New York State 27.2 27.4 21.1 20.3 18.6 17.2 17.3 15.2 18.2 16.7 (24.20-30.29) (24.31-30.47) (18.62-23.63) (17.92-22.70) (16.22-21.02) (14.98-19.51) (15.05-19.58) (13.21-17.23) (16.04-20.39) (14.57-18.78)

129
From 2002 to 2011, the 65 year and older age group consistently had the highest ARR for asthma deathscompared to other adult age groups in NYS. Overall, therates for the 18-34 and 35-64 year age groups fluctuatedover time, while the 65 year and older age group showed
a downward trend over time. At-risk based rates for all age groups showed a slight increase in 2010 which waspredominantly due to an increase in the actual number of asthma deaths among NYS adults (Figure 8-5).
Figure 8-5Asthma Death Rate per 100,000 Adults (18+ Years) with Current Asthma by Age Group and Year, New York State, 2002-2011
0
20
40
60
80
100
Rate
per
100
,000
18-34 65+35-64J
2002 2003 2004 2005 2006 2007 2008 2009 2010 2011*
2002 2003 2004 2005 2006 2007 2008 2009 2010 2011* Rate Rate Rate Rate Rate Rate Rate Rate Rate RateAge Group (95% CI) (95% CI) (95% CI) (95% CI) (95% CI) (95% CI) (95% CI) (95% CI) (95% CI) (95% CI)
18–34 8.9 7.5 6.1 4.7 6.5 7.7 4.3 4.5 7.2 6.1 (5.60-12.18) (4.67-10.32) (3.63-8.48) (2.77-6.61) (3.93-9.00) (4.88-10.61) (2.24-6.30) (2.64-6.44) (4.55-9.76) (3.92-8.29)
35–64 26.5 24.8 17.3 20.4 15.8 13.4 16.8 15.0 16.7 16.1 (22.45-30.51) (20.84-28.85) (14.23-20.50) (16.94-23.88) (12.76-18.84) (10.71-16.03) (13.77-19.90) (12.20-17.77) (13.85-19.45) (13.13-19.07)
65 + 64.2 87.4 69.6 57.6 56.1 50.3 46.4 40.0 43.5 42.1 (52.39-75.96) (72.22-102.50) (57.44-81.75) (47.32-67.85) (45.22-67.00) (40.31-60.35) (36.90-55.99) (31.65-48.38) (35.14-51.86) (33.77-50.44)
*2011 data should not be compared to data from prior years because of the differences in BRFSS data collection and weighting methodology.

130
Figure 8-6Asthma Death Rate per 100,000 Adults (18+ Years) with Current Asthma by Gender and Year, New York State, 2002-2011
Male FemaleJ
0
20
40
60
80
100
Rate
per
100
,000
2002 2003 2004 2005 2006 2007 2008 2009 2010 2011*
Overall, from 2002 to 2011, the ARR for asthma deaths decreased for both women and men. Women hadthe highest ARR for asthma deaths during 2004 to 2006.
However, in more recent years from 2007 through 2011,men had higher rates than women (Figure 8-6).
2002 2003 2004 2005 2006 2007 2008 2009 2010 2011* Rate Rate Rate Rate Rate Rate Rate Rate Rate RateGender (95% CI) (95% CI) (95% CI) (95% CI) (95% CI) (95% CI) (95% CI) (95% CI) (95% CI) (95% CI)
Male 35.3 30.5 17.1 19.3 16.6 20.9 20.5 17.6 22.6 21.2 (29.12-41.45) (25.05-35.87) (13.47-20.74) (15.51-23.03) (12.86-20.39) (16.69-25.15) (16.20-24.70) (13.92-21.23) (18.59- 26.61) (17.18-25.31)
Female 23.5 25.6 23.6 21.0 19.8 15.3 15.7 14.0 15.7 14.3 (20.11-26.95) (21.91-29.38) (20.26-27.03) (17.86-24.06) (16.66-22.87) (12.63-17.92) (13.07-18.38) (11.58-16.34) (13.15-18.22) (11.90-16.71)
*2011 data should not be compared to data from prior years because of the differences in BRFSS data collection and weighting methodology.

131
For adults with current asthma, the 2002 to 2011 ARRfor asthma deaths varied by race and ethnicity. Non-Hispanicblacks consistently had the highest ARR for asthma deathscompared to other racial and ethnic groups in NYS. This rate decreased from 62.4 per 100,000 in 2002 to 37.3 per 100,000 in 2011. The ARR for asthma deaths alsodecreased for Hispanics and for non-Hispanic whites
in NYS for 2002 to 2011. The ARR fluctuated greatly overtime for non-Hispanic other adults, with a markedly largepeak in 2010. This was due to an increase in the number of asthma deaths as well as a substantial decrease in thenumber of adults with self-reported current asthma who were categorized in the non-Hispanic other racial-ethnicgroup in 2010 (Figure 8-7).
Figure 8-7Asthma Death Rate per 100,000 Adults (18+ Years) with Current Asthma by Race/Ethnicity and Year, New York State, 2002-2011
HispanicNon-Hispanic Black Non-Hispanic OtherNon-Hispanic WhiteF J H 1
0
20
40
60
80
100Ra
te p
er 1
00,0
00
2002 2003 2004 2005 2006 2007 2008 2009 2010 2011*
*2011 data should not be compared to data from prior years because of the differences in BRFSS data collection and weighting methodology.
2002 2003 2004 2005 2006 2007 2008 2009 2010 2011* Rate Rate Rate Rate Rate Rate Rate Rate Rate RateRace/Ethnicity (95% CI) (95% CI) (95% CI) (95% CI) (95% CI) (95% CI) (95% CI) (95% CI) (95% CI) (95% CI)
Non-Hispanic White 19.6 18.9 14.3 13.0 13.8 13.0 11.7 10.4 13.5 10.7 (16.23-22.90) (15.58-22.18) (11.60-16.96) (10.61-15.49) (11.20-16.40) (10.58-15.52) (9.29-14.13) (8.26-12.59) (11.05-15.94) (8.40-12.93)
Non-Hispanic Black 62.4 51.6 58.9 62.2 45.6 36.7 36.4 32.1 35.4 37.3 (49.78-75.02) (40.83-62.41)(46.37-71.41) (49.80-74.55) (35.33-55.83) (27.73-45.72) (27.39-45.36) (24.22-39.94) (27.89-42.84) (29.83-44.75)
Non-Hispanic Other 4.6 26.0 13.1 10.4 6.0 9.2 7.4 6.4 19.6 10.4 (0.57-8.71) (12.82-39.10) (6.48-19.77) (5.13-15.64) (1.20-10.85) (2.82-15.58) (2.58-12.29) (1.65-11.09) (9.34-29.89) (4.74-16.02)
Hispanic 33.7 37.6 24.9 26.5 22.4 22.2 29.0 23.8 20.2 18.8 (25.26-42.18) (29.02-46.15) (18.83-31.05) (19.46-33.45) (15.53-29.24) (15.58-28.87) (21.77-36.19) (17.83-29.77) (14.68-25.64) (13.42-24.16)

132
Figure 8-8Asthma Death Rate per 100,000 Adults (18+ Years) with Current Asthma by Region and Year, New York State, 2002-2011
New York City Rest of StateJ
0
20
40
60
80
100
Rate
per
100
,000
2002 2003 2004 2005 2006 2007 2008 2009 2010 2011*
For adults with current asthma, the 2011 ARR for asthmadeaths was more than two times higher for residents in NewYork City compared to those in the Rest of State. During2002 to 2011, the rate decreased from 44.5 per 100,000
in 2002 to 24.5 per 100,000 in 2011 for New York Cityresidents and from 17.0 per 100,000 in 2002 to 10.3 per100,000 in 2011 for those in the Rest of State (Figure 8-8).
2002 2003 2004 2005 2006 2007 2008 2009 2010 2011* Rate Rate Rate Rate Rate Rate Rate Rate Rate RateRegion (95% CI) (95% CI) (95% CI) (95% CI) (95% CI) (95% CI) (95% CI) (95% CI) (95% CI) (95% CI)
New York City 44.5 44.4 42.8 38.2 34.2 35.8 35.6 29.9 26.2 24.5 (38.10-50.82) (37.78-50.97) (36.28-49.25) (32.41-44.08) (28.52-39.80) (29.61-41.97) (29.60-41.51) (24.84-34.93) (22.21-30.15) (20.72-28.35)
Rest of State 17.0 18.1 11.8 12.0 10.9 10.0 9.6 8.6 12.2 10.3 (13.92-19.99) (14.95-21.18) (9.52-14.00) (9.79-14.24) (8.63-13.12) (7.99-12.07) (7.57-11.59) (6.78-10.42) (9.80-14.52) (8.06-12.51)
*2011 data should not be compared to data from prior years because of the differences in BRFSS data collection and weighting methodology.

133
Program-Based Asthma Surveillance
9
The information in this section describes New York State(NYS) residents served by the Medicaid managed care(MMC) program. The majority of Medicaid enrollees areenrolled in MMC. Enrollees have access to preventive andprimary care, inpatient care, eye care, as well as additionalhealth services.
Information obtained from program-based surveillance is not representative of the general population, since onlyabout 16% of the NYS population is served by Medicaidmanaged care programs. However, these data provide usefulinformation about those who have asthma, including theburden of asthma and the use of health care services and medications prescribed for this population.
This section describes prevalence and health careutilization data for two asthma groups:
1. MMC enrollees in the asthma universe population
2. MMC enrollees in the persistent asthma population
Definitions for the asthma universe and persistentasthma groups are based on the technical specificationsestablished by the National Committee for QualityAssurance (NCQA) for the Healthcare Effectiveness Dataand Information Set (HEDIS®) 2011.21
Asthma Universe: Individuals are identified as being in the asthma universe of patients if they had at least:
� One outpatient visit with asthma (ICD-9 code 493.XX) as one of the listed diagnoses during a specified 12-month period; or
� One emergency department (ED) visit with asthma (ICD-9 code 493.XX) as the principal diagnosis during a specified 12-month period; or
� One acute inpatient discharge with asthma (ICD-9code 493.XX) as the principal diagnosis during aspecified 12-month period; or
� Four asthma medication dispensing events* (i.e., anasthma medication was dispensed on four occasions)during a specified 12-month period.
Persistent Asthma: Individuals are identified as persistentasthma patients if they met at least one of the criteria belowduring both 2009 and 2010 (criteria need not be the sameacross years):
� Four outpatient visits with asthma (ICD-9 code493.XX) as one of the listed diagnoses and at leasttwo asthma medication dispensing events during a specified 12-month period; or
� One ED visit with asthma (ICD-9 code 493.XX) as the principal diagnosis during a specified 12-monthperiod; or
� One acute inpatient discharge with asthma (ICD-9code 493.XX) as the principal diagnosis during a specified 12-month period; or
� Four asthma medication dispensing events* (i.e., anasthma medication was dispensed on four occasions)during a specified 12-month period.
*A dispensing event is one prescription of an amount lasting 30 days or less; multiple inhalers of the same medication filled on the same date of serviceshould be counted as one dispensing event. There is also a restriction regarding leukotriene dispensing events: for an individual identified as an asthmauniverse or persistent asthma because of at least four asthma medication dispensing events, and leukotriene modifiers were the sole asthma medicationdispensed, the member must meet any one of the other three criteria for inclusion in the asthma universe or persistent asthma population, or have at least one diagnosis of asthma in any setting.

134
Highlights: Program-Based Asthma Surveillance
Asthma Universe Prevalence Among the Medicaid Managed Care Population, 2006-2010
� There were 249,350 (11.5%) Medicaid managed care enrollees classified as asthma universe in 2010.
� Overall, asthma universe prevalence for Medicaidmanaged care enrollees increased between 2006and 2010 for all age groups. In 2010, enrollees aged 5-11 years had the highest prevalence rate of asthma universe (15.1%), followed by enrolleesaged 0-4 years (13.8%). Adult enrollees aged 12-50years had the lowest prevalence rate at 9.2%.
� The asthma universe prevalence rate increased from 2006 to 2009 for females (19%) and males(9%), followed by a slight decrease beginning in 2010 for males.
� Overall, the asthma universe prevalence for Medicaidmanaged care enrollees increased between 2006and 2010 for all racial and ethnic groups. Hispanicsconsistently had the highest prevalence rate ofasthma universe, and in 2010 that prevalence was13.5%, followed closely by non-Hispanic blackenrollees at 13.1%.
� Prevalence of asthma increased for New York City and Rest of State regions from 2006 to 2010. In 2010, Rest of State residents had a higherprevalence rate of asthma universe (12.6%)compared to New York City residents (11.0%).
� Prevalence of asthma universe among Medicaidmanaged care enrollees varied by county. For 2010,enrollees from Columbia County (17.4%) and SullivanCounty (17.2%) had the highest asthma universeprevalence rate, while enrollees from Wyoming Countyhad the lowest prevalence rate (6.2%).
Persistent Asthma Prevalence Among the MedicaidManaged Care Population, 2009-2010
� There were 70,275 (4.9%) and 80,586 (5.2%)Medicaid managed care enrollees classified aspersistent asthma in 2009 and 2010 respectively.
� Persistent asthma prevalence among Medicaid man -aged care enrollees varied by age. Enrollees aged 51-64 years had the highest prevalence rate of per -sistent asthma in 2009 (7.8%) and in 2010 (8.9%).
� Females had a slightly higher prevalence rate of persistent asthma (5.0% in 2009 and 5.4% in 2010) compared to males (4.7% in 2009 and 4.9% in 2010).
� Persistent asthma prevalence among Medicaidmanaged care enrollees was similar by region. For 2010, persistent asthma prevalence was 5.3%for Rest of State residents and 5.1% for those who reside in New York City.
� Persistent asthma prevalence in Medicaid managedcare enrollees varied by race and ethnicity. Hispanicenrollees had the highest prevalence rate ofpersistent asthma (6.2% in 2009 and 6.4% in2010), followed by non-Hispanic black enrollees(5.8% in 2009 and 6.2% in 2010).
Utilization of Health Services by the MedicaidManaged Care Asthma Universe Population, 2009-2010
� Overall, there were 392,379 outpatient asthma visits in 2009 and 408,517 in 2010; 38,590asthma emergency department visits in 2009 and37,488 in 2010; and 8,910 asthma hospitalizationsin 2009 and 7,762 in 2010 among the asthmauniverse population. For the same time period, more than 1.5 million asthma-related pharmacydispensing events occurred.
� The highest rate of outpatient visits was seen among children aged 0-4 years (203.9 visits per 100 Medicaid managed care asthma universeenrollees in 2009 and 202.9 per 100 in 2010).
� Asthma emergency department visit rates varied by age group with the highest rate among childrenaged 0-4 years (22.5 per 100 Medicaid managedcare asthma universe enrollees in 2009 and 20.9per 100 in 2010).
� Hospitalization rates due to asthma were highestamong young children aged 0-4 years (6.4 per 100Medicaid managed care asthma universe enrollees in 2009 and 5.2 per 100 in 2010).
� Asthma-related pharmacy dispensing rates increasedwith age. The highest rate was among adults aged51-64 years (1,107.0 and 1,174.6 dispensing
135
events per 100 Medicaid managed care asthmauniverse enrollees in 2009 and 2010, respectively).
� Medicaid managed care asthma universe femaleenrollees had a lower outpatient visit rate (165.6 per 100 asthma universe enrollees in 2009 and161.9 per 100 in 2010). Rates of emergencydepartment visits were also lower for female universeenrollees with asthma (15.9 per 100 in 2009 and14.2 per 100 in 2010).
� Asthma hospitalizations among Medicaid managedcare asthma universe female enrollees were similar in 2009 to the rate for males (3.9 and 3.7 per 100asthma universe enrollees) and in 2010 (3.1 per100). Asthma-related pharmacy dispensing rates forMedicaid managed care asthma universe femaleenrollees (699.9 per 100 asthma universe enrolleesin 2009 and 735.9 per 100 in 2010) were higherthe rates for male enrollees (603.5 per 100 in 2009and 636.6 per 100 in 2010).
� Medicaid managed care asthma universe non-Hispanic other enrollees had the lowest outpatientvisit rate in 2009 (148.4 per 100 asthma universeenrollees) whereas non-Hispanic white had thelowest outpatient visit rate in 2010 (142.6 per 100). Hispanic enrollees had a highest outpatientvisit rate (180.0 per 100 in 2009 and 177.7 per100 in 2010).
� Asthma emergency department visit rates varied byrace and ethnicity, with the highest rate among non-Hispanic black (25.0 per 100 Medicaid managedcare asthma universe enrollees in 2009 and 23.3per 100 in 2010) and the lowest rate among Non-Hispanic white (8.3 per 100 in 2009 and 7.6 per100 in 2010).
� Hospitalizations due to asthma were also highestamong non-Hispanic black (5.6 per 100 Medicaidmanaged care asthma universe enrollees in 2009and 4.6 per 100 in 2010).
� Asthma-related pharmacy dispensing rates alsovaried by race and ethnicity. The highest rate ofasthma-related pharmacy dispensing events wasamong Hispanic (705.3 dispensing events per 100 Medicaid managed care asthma universeenrollees in 2009 and 738.8 dispensing events per 100 in 2010).
� Medicaid managed care asthma universe enrollees in New York City had a lower outpatient visit rate(165.9 per 100 asthma universe enrollees in 2009 and 162.8 per 100 in 2010) than Medicaidmanaged care asthma universe enrollees from theRest of State (173.8 per 100 in 2009 and 166.1per 100 in 2010).
� Rates of asthma emergency department visits werehigher for Medicaid managed care enrollees withasthma who reside in New York City (18.2 per 100 in 2009 and 16.8 per 100 in 2010) compared tothose in the Rest of State (12.4 per 100 in 2009and 11.0 per 100 in 2010).
� Asthma hospitalizations among Medicaid managedcare enrollees were also slightly higher for thoseliving in New York City (4.2 per 100 asthma universeenrollees in 2009 and 3.5 per 100 in 2010) than in the Rest of State (2.8 per 100 in 2009 and 2.1per 100 in 2010).
� Asthma-related pharmacy dispensing rates forMedicaid managed care asthma universe enrolleeswere higher for those living in New York City (693.3per 100 asthma universe enrollees in 2009 and734.6 per 100 in 2010) than for those living in theRest of State (566.6 per 100 in 2009 and 598.4per 100 in 2010).
� Persistent asthma prevalence among Medicaidmanaged care enrollees varied by county. For 2010,enrollees from Columbia, Cattaraugus and Tompkinscounties had the highest persistent asthmaprevalence at 7.3%, 7.2% and 7.1%, respectively.
Asthma Universe Prevalence Among the Child Health Plus Population, 2010
� There were 23,553 (10.4%) Child Health Plus enrollees(0-18 years) classified as asthma universe in 2010.
� In 2010, the asthma universe prevalence rate washighest among the 0-4 age category (12.9%), andthe 5-11 year age category (12.8%). The highestasthma universe prevalence rate by gender, race and ethnicity, region and county was observedamong male enrollees (11.7%); non-Hispanic black enrollees (11.5%); residents of the Rest of State (11.6%); and residents of Livingston County (16.4%), respectively.

136
Persistent Asthma Prevalence Among the Child Health Plus Population, 2010
� In 2010, there were 9,320 (6.4%) Child Health Plus enrollees that were classified as havingpersistent asthma.
� The highest persistent asthma prevalence was seen among those aged 5-11 years (8.3%), maleenrollees (7.4%), non-Hispanic black enrollees(7.4%), Rest of State residents (7.4%), and residents of St. Lawrence County (10.6%).
Utilization of Health Services by the Child HealthPlus Asthma Universe Population, 2010
� In 2010, there were 35,899 outpatient visits; 2,218emergency department visits; and 537 hospitaliza -tions due to asthma among the asthma universepopulation for Child Health Plus enrollees. Inaddition, 104,046 asthma-related dispensing events occurred in 2010.
� The highest rate of outpatient visits was seen among children aged 0-4 years (182.6 visits per 100 Child Health Plus asthma universe enrollees).
� Asthma emergency department visit rates varied byage group with the highest rate among children aged0-4 years (14.5 per 100 Child Health Plus asthmauniverse enrollees).
� Hospitalization rates due to asthma were highestamong young children aged 0-4 years (5.8 per 100Child Health Plus asthma universe enrollees).
� Asthma-related pharmacy dispensing rates varied by age group. The highest rate was among the 5-11year old age group (478.6 dispensing events per 100 Child Health Plus asthma universe enrollees).
� Child Health Plus asthma universe female enrolleeshad the lowest outpatient visit rate (148.5 per 100asthma universe enrollees). Rates of emergencydepartment visits were also lowest for Child HeathPlus female enrollees with asthma (8.7 per 100).
� Asthma hospitalizations were the same for males asthey were for females in 2010 (2.3 per 100 ChildHealth Plus asthma universe enrollees). There werefewer asthma-related pharmacy dispensing events forChild Health Plus asthma universe female enrollees(422.1 per 100 Child Health Plus asthma universeenrollees) than male enrollees (456.3 per 100).
� Child Health Plus asthma universe non-Hispanicblack enrollees had the lowest outpatient visit rate(147.7 per 100 Child Health Plus asthma universeenrollees). Non-Hispanic white and Hispanicenrollees had the highest outpatient visit rate (154.4 and 154.2 per 100, respectively).
� Asthma emergency department visit rates varied byrace and ethnicity, with the highest rate among non-Hispanic black enrollees (16.6 per 100 Child HealthPlus asthma universe enrollees) and the lowest rateamong non-Hispanic other enrollees (5.8 per 100).
� Hospitalizations due to asthma were also highestamong non-Hispanic black enrollees (4.7 per 100Child Health Plus asthma universe enrollees).
� Asthma-related pharmacy dispensing rates alsovaried by race and ethnicity. The highest rate ofasthma-related pharmacy dispensing events wasamong Hispanic and non-Hispanic other enrollees(406.6 and 407.9 dispensing events per 100 ChildHealth Plus asthma universe enrollees, respectively).
� Child Health Plus asthma universe enrollees in New York City had a lower outpatient visit rate (143.3 per 100 asthma universe enrollees) thanChild Health Plus asthma universe enrollees from the Rest of State (156.7 per 100).
� Rates of asthma emergency department visits werehigher for Child Health Plus enrollees with asthmawho reside in New York City (13.3 per 100 asthmauniverse enrollees) compared to those in the Rest of State (7.6 per 100).
� Asthma hospitalizations among Child Health Plusenrollees were also slightly higher for those living in New York City (2.8 per 100 asthma universeenrollees) than in the Rest of State (2.1 per 100).
� Asthma-related pharmacy dispensing rates for ChildHealth Plus asthma universe enrollees where higherfor those living in the Rest of State (465.0 per 100asthma universe enrollees) than those living in NewYork City (392.3 per 100).

137
Managed Care Quality Assurance ReportingRequirement Asthma-Specific Indicator
� Among children aged 5-11 who had persistentasthma, 96% of enrollees of Commercial healthplans and 95% of enrollees of Child Health Plusplans received appropriate medications for asthma,compared to 92% for children with persistent asthmaenrolled in Medicaid managed care plans.
� In 2010, Commercial HMO plans showed a slightly higher proportion of enrollees individualsaged 12-50 years with persistent asthma receivingappropriate medications (91%) compared to thepercentages among enrollees in Medicaid (88%) or Commercial PPO (82%) plans.
� In 2010, children aged 5-11 years with persistentasthma who were enrolled in Commercial healthplans (82%) and Child Health Plus (81%) were morelikely to have three or more controller medicationsdispensed in the past year compared to thoseenrolled in Medicaid health plans (76%).
� In 2010, a higher proportion of individuals aged 12-50 years with persistent asthma who wereenrolled in Commercial health plans had three or more controller medications dispensed in the past year (81%) compared to those enrolled inMedicaid managed care plans (77%).
� In 2010, among individuals aged 5-50 years with persistent asthma, Orleans County had thelowest percentage of individuals (less than 80%) who received appropriate medications to control their asthma.
� In 2010, among children aged 5-11 years withpersistent asthma, children in Orleans and Geneseecounties had the lowest percentage of children (less than 70%) who had three or more controllermedication dispensing events in the past year.
Prevention Quality Indicators and Pediatric Quality Indicators for the Medicaid Managed CareAsthma Universe Population
� In 2010, among the asthma universe populationaged 2-17 years, 44.2% of asthma hospitaladmissions in NYS could potentially have beenavoided through more effective outpatient care.Preventable asthma hospital admissions were nearly two times higher for children (0-17 years) than adults (18-39 and 40+ years).
� In 2010, among the asthma universe populationaged 18-39 years, 22.5% of asthma hospitaladmissions in NYS could potentially have beenavoided through more effective outpatient care.
� In 2010, among the asthma universe populationaged 40 years and older, 23.7% of asthma hospitaladmissions in NYS could potentially have beenavoided through more effective outpatient care.

138
Asthma Prevalence Among the Medicaid Managed Care Population
Methodology
Asthma MMC information was obtained from the NYSDOHOffice of Health Insurance Programs Data Mart.
This report provides prevalence data for the asthmauniverse and for people with persistent asthma in the MMCpopulation. Asthma universe and persistent asthma preva -lence rates are presented for the total population, andstratified by age group, gender, race and ethnicity, county of residence, and geographic region (New York City and Rest of State).
Asthma universe prevalence rates were generated for individuals aged 0 to 64 years who were continuouslyenrolled in a MMC health plan (Health Maintenance Organi -zation (HMO) or Prepaid Health Services Plan (PHSP)) for 12 or more months, as of each reporting year.
Asthma universe prevalence rates were generated for single years (i.e., 2009 and 2010) by county ofresidence and as a five-year trend from 2006 to 2010 for the MMC asthma universe population by age group,gender, race and ethnicity and geographic region (New York City and Rest of State).
Persistent asthma prevalence was generated forindividuals aged 0 to 64 years who were continuouslyenrolled in a MMC health plan (HMO or PHSP) for 24 or more months, as of December 2010.
For consistency, the same methodology, based onHEDIS® 2011 specifications (see page 133 for additionalinformation), was applied to all years.

139
* Medicaid managed care enrollees exclude special populations such as AIDS special needs plans and long-term care plans.
In presenting asthma surveillance information for MMC,it is important to recognize the trend of enrollment for thispopulation as well as for the Medicaid Fee-for-Service (FFS)population. Figure 9-1 presents the number of enrollees bymonth for MMC and Medicaid FFS from January 2009 toDecember 2010. There was an increasing trend in
enrollment in the Medicaid MMC program over these twoyears. During this time period, the MMC populationincreased from approximately 2.7 million to nearly 3.2million, while the Medicaid FFS population remained stableat about 1 million enrollees per month (Figure 9-1).
Figure 9-1 New York State Medicaid Managed Care* and Medicaid Fee-for-Service Enrollees Aged 0-64 Years by Month, January 2009–December 2010
J
0
1,500,000
2,000,000
500,000
1,000,000
2,500,000
3,500,000
1 2 3 4 5 76 8 9 10 11 12 1 2 3 4 5 6 7 8 9 10 11 12
2009 2010
Num
ber o
f Enr
olle
es
Medicaid Managed Care Medicaid Fee-for-Service
3,000,000
New York State Medicaid Population

140
There were 249,350 (11.5%) individuals who met theasthma universe definition among the nearly 2.2 millionMMC enrollees in 2010 (Table 9-1).
Asthma Universe Prevalence Among the Medicaid Managed Care Population
Medicaid Managed Asthma Universe Asthma Universe Care Enrollees Prevalence Rate per 100
Age Group 2009 2010 2009 2010 2009 2010
0–4 39,446 41,450 283,968 301,446 13.9 13.8
5–11 58,348 59,508 368,708 392,975 15.8 15.1
12–50 101,306 109,793 1,096,890 1,193,806 9.2 9.2
51–64 34,267 38,599 264,523 288,006 13.0 13.4
Total 233,367 249,350 2,014,089 2,176,233 11.6 11.5
Asthma Universe Prevalence by Socio-demographic Characteristics, 2006-2010
Table 9-1 Number of Asthma Universe and Medicaid Managed Care Enrollees* by Age Group, New York State, 2009-2010
*12 months continuous enrollment.

141
*12 months continuous enrollment.
Overall, asthma universe prevalence for MMC enrolleesincreased between 2006 and 2010 for all age groups. The asthma prevalence for the 5-11 age group wasconsistently the highest, and 12-50 age group consistentlythe lowest over the 2006-2010 time period.
Asthma universe prevalence among MMC enrolleesvaried by age. For the year 2010, enrollees aged 5-11
years had the highest prevalence rate of asthma universe(15.1%), followed by enrollees aged 0-4 years (13.8%).Adult enrollees aged 12-50 years had the lowest prevalencerate at 9.2% in 2010. (Figure 9-2, Table 9-2).
Figure 9-2 Asthma Universe Prevalence* by Age Group, Medicaid Managed Care Population, New York State, 2006-2010
51–645–11 12–500–4F J H 1
0
2
4
6
8
10
12
14
16
18
Asth
ma
Uni
vers
e Pr
eval
ence
2006 2007 2008 2009 2010
Table 9-2 Asthma Universe Prevalence* by Age Group, Medicaid Managed Care Population, New York State, 2006-2010
*12 months continuous enrollment.
Age Group 2006 2007 2008 2009 2010
0–4 13.4 13.5 13.2 13.7 13.8
5–11 14.2 14.6 14.6 15.8 15.1
12–50 7.8 7.9 8.5 9.2 9.2
51–64 9.2 10.1 12.1 13.0 13.4
Total 10.0 10.3 10.8 11.6 11.5

142
*12 months continuous enrollment.
The asthma universe prevalence rate increased from2006 to 2009 for females (19%) and males (9%), followed
by a slight decrease beginning in 2010 for males (Figure 9-3, Table 9-3).
Figure 9-3 Asthma Universe Prevalence* by Gender, Medicaid Managed Care Population, New York State, 2006-2010
FemaleMaleF J
0
2
4
6
8
10
12
14
Asth
ma
Uni
vers
e Pr
eval
ence
2006 2007 2008 2009 2010
Table 9-3 Asthma Universe Prevalence* by Gender, Medicaid Managed Care Population, New York State, 2006-2010
*12 months continuous enrollment.
Gender 2006 2007 2008 2009 2010
Male 10.4 10.6 10.8 11.6 11.3
Female 9.7 10.0 10.7 11.6 11.5

143
***12 months continuous enrollment.
***Excludes enrollees with missing race/ethnicity.
***Non-Hispanic Other race included American Indian/Alaskan Native, Asian, and Pacific Islander.
From 2006 to 2010, asthma universe prevalence amongMMC enrollees varied by race and ethnicity. Hispanicsconsistently had the highest prevalence rate of asthmauniverse (13.5% in 2010), followed closely by non-Hispanicblack enrollees (13.1% in 2010). Non-Hispanic other
enrollees had the lowest prevalence rate at 8.0% in 2010.Overall, the asthma universe prevalence for MMC enrolleesincreased for all racial and ethnic groups during this time(Figure 9-4, Table 9-4).
Figure 9-4 Asthma Universe Prevalence* by Race/Ethnicity,** Medicaid Managed Care Population, New York State, 2006-2010
0
2
4
6
8
10
12
14
16
Asth
ma
Uni
vers
e Pr
eval
ence
2006 2007 2008 2009 2010
HispanicNon-Hispanic Black Non-Hispanic OtherNon-Hispanic WhiteF J H 1
Table 9-4 Asthma Universe Prevalence* by Race/Ethnicity,** Medicaid Managed Care Population, New York State, 2006-2010
***12 months continuous enrollment.
***Excludes enrollees with missing race/ethnicity.
***Non-Hispanic Other race included American Indian/Alaskan Native, Asian, and Pacific Islander.
Age Group 2006 2007 2008 2009 2010
Non-Hispanic White 8.7 8.9 9.3 10.0 10.1
Non-Hispanic Black 11.2 11.5 12.1 13.1 13.1
Non-Hispanic Other** 7.2 7.2 7.4 8.1 8.0
Hispanic 11.7 12.1 12.9 13.8 13.5
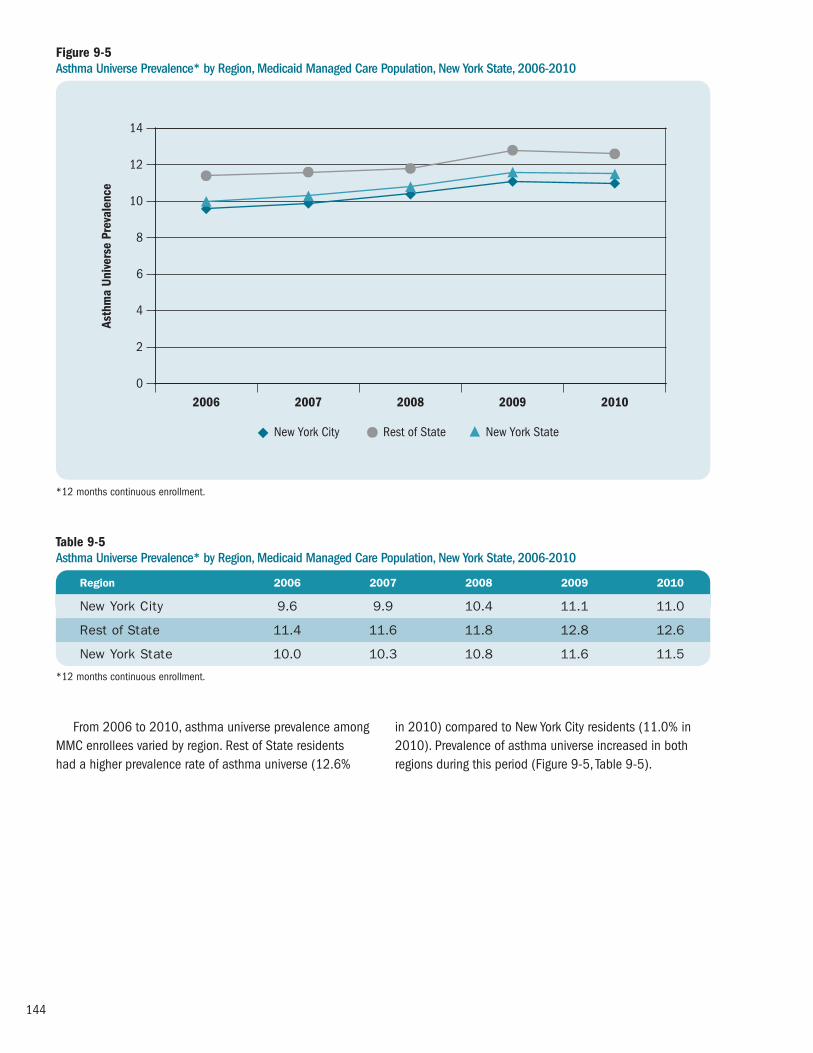
144
*12 months continuous enrollment.
From 2006 to 2010, asthma universe prevalence amongMMC enrollees varied by region. Rest of State residents had a higher prevalence rate of asthma universe (12.6%
in 2010) compared to New York City residents (11.0% in2010). Prevalence of asthma universe increased in bothregions during this period (Figure 9-5, Table 9-5).
Figure 9-5 Asthma Universe Prevalence* by Region, Medicaid Managed Care Population, New York State, 2006-2010
0
2
4
6
8
10
12
14
Asth
ma
Uni
vers
e Pr
eval
ence
2006 2007 2008 2009 2010
Rest of State New York StateNew York CityF J H
Table 9-5 Asthma Universe Prevalence* by Region, Medicaid Managed Care Population, New York State, 2006-2010
*12 months continuous enrollment.
Region 2006 2007 2008 2009 2010
New York City 9.6 9.9 10.4 11.1 11.0
Rest of State 11.4 11.6 11.8 12.8 12.6
New York State 10.0 10.3 10.8 11.6 11.5

145
Asthma Universe Prevalence0 1412 16 18642 8 10
AlleganyCattaraugusChautauqua
ErieGeneseeNiagaraOrleans
Wyoming
Regi
on 1
ChemungLivingston
MonroeOntario
SchuylerSeneca
SteubenWayne
Yates
Regi
on 2
CayugaCortlandHerkimerJeffersonMadison
OneidaOnondaga
OswegoSt. Lawrence
Tompkins
Regi
on 3
BroomeChenango
TiogaRegi
on 4
AlbanyClinton
ColumbiaDelaware
EssexFranklin
FultonGreene
MontgomeryOtsego
RensselaerSaratoga
SchenectadySchoharie
WarrenWashington
Regi
on 5
DutchessOrangePutnam
RocklandSullivan
UlsterWestchester
Regi
on 6
New York City
Regi
on 7
NassauSuffolk
Regi
on 8
New York State: 11.5
Figure 9-6 Asthma Universe Prevalence* by County, Medicaid Managed Care Population, New York State, 2010
Source: Office of Health Insurance Programs Data Mart
*12 months continuous enrollment.
Asthma Universe* PrevalenceMedicaid Managed Care Population, 0-64 Years, 2010Counties are Shaded Based on Quartile Distribution
Data not available or do not meet reporting criteria 0 – <12.3: Q1 & Q212.3 – <13.8: Q313.8+: Q4

146
Table 9-6 Asthma Universe Prevalence* by County, Medicaid Managed Care Population, New York State, 2009-2010
Asthma Universe Medicaid Managed Prevalence Asthma Universe Care Enrollees Rate per 100 County 2009 2010 2009 2010 2009 2010
Albany 2,049 2,275 14,287 16,437 14.3 13.8
Allegany 329 389 2,788 3,154 11.8 12.3
Broome 1,138 1,549 9,721 13,252 11.7 11.7
Cattaraugus 704 821 4,813 5,406 14.6 15.2
Cayuga 42 64 404 792 10.4 8.1
Chautauqua 1,812 2,044 11,836 13,389 15.3 15.3
Chemung 45 56 494 603 9.1 9.3
Chenango 23 32 256 457 9.0 7.0
Clinton 143 211 1,035 1,473 13.8 14.3
Columbia 389 530 2,334 3,044 16.7 17.4
Cortland 458 502 3,286 4,113 13.9 12.2
Delaware 23 29 201 282 11.4 10.3
Dutchess 1,289 1,646 8,794 11,026 14.7 14.9
Erie 7,202 8,033 57,248 64,639 12.6 12.4
Essex 54 71 582 727 9.3 9.8
Franklin 24 15 239 225 10.0 6.7
Fulton 681 741 4,238 5,137 16.1 14.4
Genesee 387 382 3,064 3,155 12.6 12.1
Greene 396 472 2,444 3,051 16.2 15.5
Hamilton ** ** ** ** ** **
Herkimer 565 668 4,567 5,419 12.4 12.3
Jefferson 50 71 584 635 8.6 11.2
Lewis ** ** 124 ** ** **
Livingston 390 457 2,530 3,078 15.4 14.8
Madison 34 84 360 667 9.4 12.6
Monroe 7,133 7,985 55,297 63,740 12.9 12.5
Montgomery 503 676 4,235 5,177 11.9 13.1
Nassau 3,795 4,991 29,572 43,540 12.8 11.5
Niagara 2,064 2,478 14,081 16,710 14.7 14.8
Oneida 2,573 2,962 18,432 21,668 14.0 13.7
Onondaga 3,847 4,350 28,478 34,388 13.5 12.6
Ontario 540 666 4,391 5,371 12.3 12.4
Orange 2,962 3,202 24,442 28,286 12.1 11.3
**12 months continuous enrollment.
**Data are suppressed for confidentiality purposes if there are fewer than 10 MMC enrollees that meet the criteria for asthma universe or when the number of MMC enrollees (denominator) is less than 50.

147
Table 9-6 continuedAsthma Universe Prevalence* by County, Medicaid Managed Care Population, New York State, 2009-2010
Asthma Universe Medicaid Managed Prevalence Asthma Universe Care Enrollees Rate per 100 County 2009 2010 2009 2010 2009 2010
Orleans 349 356 3,153 3,670 11.1 9.7
Oswego 1,213 1,396 9,951 11,562 12.2 12.1
Otsego 285 366 2,520 3,233 11.3 11.3
Putnam 173 248 1,269 1,449 13.6 17.1
Rensselaer 1,389 1,601 8,822 10,202 15.7 15.7
Rockland 2,535 2,717 31,410 35,859 8.1 7.6
St. Lawrence 44 55 514 521 8.6 10.6
Saratoga 768 1,022 5,989 7,712 12.8 13.3
Schenectady 1,060 1,283 6,985 8,861 15.2 14.5
Schoharie 47 52 410 576 11.5 9.0
Schuyler ** 11 99 136 ** 8.1
Seneca 163 187 1,693 1,963 9.6 9.5
Steuben 24 42 395 464 6.1 9.1
Suffolk 7,364 8,316 56,907 66,670 12.9 12.5
Sullivan 667 857 4,564 4,977 14.6 17.2
Tioga 48 54 572 561 8.4 9.6
Tompkins 324 352 2,107 2,784 15.4 12.6
Ulster 1,242 1,490 8,445 10,105 14.7 14.7
Warren 155 178 1,041 1,352 14.9 13.2
Washington 350 450 2,637 3,372 13.3 13.3
Wayne 324 406 2,667 3,401 12.1 11.9
Westchester 5,297 6,682 40,998 48,467 12.9 13.8
Wyoming 12 13 192 209 6.3 6.2
Yates 169 183 1,579 1,789 10.7 10.2
New York City*** 167,700 172,567 1,503,969 1,567,108 11.2 11.0
***12 months continuous enrollment.
***Data are suppressed for confidentiality purposes if there are fewer than 10 MMC enrollees that meet the criteria for asthma universe or when the number of MMC enrollees (denominator) is less than 50.
***Data for the five boroughs of New York City are combined.
Prevalence of asthma universe among MMC enrolleesvaried by county. For 2010, enrollees from Columbia County(17.4%) and Sullivan County (17.2%) had the highestasthma universe prevalence rates, while enrollees from
Wyoming County had the lowest prevalence rate (6.2%).New York City had an asthma universe prevalence rate of 11.0% in 2010 (Figure 9-6, Table 9-6).

148
Persistent Asthma Prevalence Among the Medicaid Managed Care Population
Persistent Asthma Prevalence by Socio-demographic Characteristics, 2009-2010
Figure 9-7Persistent Asthma Prevalence* by Age Group, Medicaid Managed Care Population, New York State, 2009-2010
Among the MMC enrollees with 24 months continuousenrollment by the end of 2009 or 2010, respectively,70,275 (4.9%) and 80,586 (5.2%) met the definition of persistent asthma.
Persistent asthma prevalence among MMC enrolleesvaried by age. Enrollees aged 51-64 years had the highest
prevalence rate of persistent asthma (7.8% in 2009 and 8.9% in 2010). Enrollees aged 12-50 years had the lowest prevalence rate at 3.7% in 2009 and 4.0% in 2010 (Figure 9-7, Table 9-7).
Persistent Asthma Number with Medicaid Managed Prevalence Rate Persistent Asthma Care Enrollees per 100
Age Group 2009 2010 2009 2010 2009 2010
0–4 6,625 7,155 160,058 173,364 4.1 4.1
5–11 18,611 19,462 292,416 311,500 6.4 6.2
12–50 29,023 33,913 788,724 842,776 3.7 4.0
51–64 16,016 20,056 205,968 224,772 7.8 8.9
Total 70,275 80,586 1,447,166 1,552,412 4.9 5.2
Table 9-7Persistent Asthma Prevalence* by Age Group, Medicaid Managed Care Population, New York State, 2009-2010
*24 months continuous enrollment.
*24 months continuous enrollment.
0-4 5-11 12-50 51-64 Total0
3
4
5
6
7
8
9
10
Pers
iste
nt A
sthm
a Pr
eval
ence
20102009
1
24.1 4.1 6.4 6.2 3.7 4.0 7.8 8.9 4.9 5.2

149
Figure 9-8Persistent Asthma Prevalence* by Gender, Medicaid Managed Care Population, New York State, 2009-2010
Prevalence of persistent asthma among MMC enrolleesvaried by gender. Females had a slightly higher prevalencerate of persistent asthma (5.0% in 2009 and 5.4% in
2010) compared to males (4.7% in 2009 and 4.9% in 2010) (Figure 9-8, Table 9-8).
Persistent Asthma Number with Medicaid Managed Prevalence Rate Persistent Asthma Care Enrollees per 100
Age Group 2009 2010 2009 2010 2009 2010
Male 29,307 33,006 627,374 675,098 4.7 4.9
Female 40,968 47,580 819,792 877,314 5.0 5.4
Table 9-8Persistent Asthma Prevalence* by Gender, Medicaid Managed Care Population, New York State, 2009-2010
*24 months continuous enrollment.
*24 months continuous enrollment.
Male Female0
3
4
5
6
Pers
iste
nt A
sthm
a Pr
eval
ence
20102009
1
2
4.7 4.9 5.0 5.4

150
Figure 9-9Persistent Asthma Prevalence* by Race/Ethnicity,** Medicaid Managed Care Population, New York State, 2009-2010
Persistent asthma prevalence in MMC enrollees varied by race and ethnicity.
Hispanic enrollees had the highest prevalence rate of persistent asthma (6.2% in 2009 and 6.4% in 2010),
followed by non-Hispanic black enrollees (5.8% in 2009 and 6.2% in 2010). Non-Hispanic other enrolleeshad the lowest prevalence rate in 2010 at 3.2% (Figure 9-9, Table 9-9).
Persistent Asthma Number with Medicaid Managed Prevalence Rate Persistent Asthma Care Enrollees per 100
Race/Ethnicity** 2009 2010 2009 2010 2009 2010
Non-Hispanic White 12,436 15,459 342,444 371,546 3.6 4.2
Non-Hispanic Black 17,303 19,281 296,161 311,560 5.8 6.2
Non-Hispanic Other*** 3,732 10,141 93,044 317,680 4.0 3.2
Hispanic 30,965 34,577 499,630 537,498 6.2 6.4
Table 9-9Persistent Asthma Prevalence* by Race/Ethnicity,** Medicaid Managed Care Population, New York State, 2009-2010
***24 months continuous enrollment.
***Excludes enrollees with missing race/ethnicity.
***Non-Hispanic Other race included American Indian/Alaskan Native, Asian, and Pacific Islander.
***24 months continuous enrollment.
***Excludes enrollees with missing race/ethnicity.
***Non-Hispanic Other race included American Indian/Alaskan Native, Asian, and Pacific Islander.
0
3
4
5
7Pe
rsis
tent
Ast
hma
Prev
alen
ce
20102009
1
2
Non-HispanicWhite
Non-HispanicBlack
Non-HispanicOther**
Hispanic
6
3.6 4.2 5.8 6.2 4.0 3.2 6.2 6.4

151
Figure 9-10Persistent Asthma Prevalence* by Region, Medicaid Managed Care Population, New York State, 2009-2010
Persistent asthma prevalence among MMC enrollees wassimilar by region. For 2010, persistent asthma prevalence
was 5.3% for Rest of State residents and 5.1% for thosewho reside in New York City (Figure 9-10, Table 9-10).
Persistent Asthma Number with Medicaid Managed Prevalence Rate Persistent Asthma Care Enrollees per 100
Region 2009 2010 2009 2010 2009 2010
New York City 54,690 60,307 1,127,915 1,171,827 4.8 5.1
Rest of State 15,585 20,279 319,251 380,585 4.9 5.3
Table 9-10Persistent Asthma Prevalence* by Region, Medicaid Managed Care Population, New York State, 2009-2010
*24 months continuous enrollment.
*24 months continuous enrollment.
New York City Rest of State0
3
4
5
6
Pers
iste
nt A
sthm
a Pr
eval
ence
20102009
1
2
4.8 5.1 4.9 5.3

152
Persistent Asthma Prevalence0 76 8321 4 5
AlleganyCattaraugusChautauqua
ErieGeneseeNiagaraOrleans
Regi
on 1
LivingstonMonroeOntarioSenecaWayneYates
Regi
on 2
CortlandHerkimerJefferson
OneidaOnondaga
OswegoSt. Lawrence
TompkinsRe
gion
3
BroomeTioga
Regi
on 4
AlbanyClinton
ColumbiaEssexFulton
GreeneMontgomery
OtsegoRensselaer
SaratogaSchenectady
SchoharieWarren
Washington
Regi
on 5
DutchessOrangePutnam
RocklandSullivan
UlsterWestchester
Regi
on 6
New York City
Regi
on 7
NassauSuffolk
Regi
on 8
New York State: 5.2
Figure 9-11 Persistent* Asthma Prevalence by County, Medicaid Managed Care Population, New York State, 2010
Source: Office of Health Insurance Programs Data Mart
*24 months continuous enrollment.
Persistent* Asthma PrevalenceMedicaid Managed Care Population, 0-64 Years, 2010Counties are Shaded Based on Quartile Distribution
Data not available or do not meet reporting criteria 0 – <5.5: Q1 & Q25.5 – <5.8: Q35.8+: Q4

153
Table 9-11 Persistent Asthma Prevalence* by County, Medicaid Managed Care Population, New York State, 2009-2010
Persistent Asthma Persistent Medicaid Managed Prevalence Asthma Care Enrollees Rate per 100 County 2009 2010 2009 2010 2009 2010
Albany 401 535 8,469 9,755 4.7 5.5
Allegany 60 98 1,634 2,004 3.7 4.9
Broome 210 358 5,080 7,001 4.1 5.1
Cattaraugus 191 246 2,980 3,402 6.4 7.2
Cayuga ** ** 181 ** ** **
Chautauqua 498 610 7,716 9,142 6.5 6.7
Chemung ** ** 264 ** ** **
Chenango ** ** 139 ** ** **
Clinton 14 36 465 656 3.0 5.5
Columbia 101 127 1,380 1,747 7.3 7.3
Cortland 101 143 1,730 2,443 5.8 5.9
Delaware ** ** 102 ** ** **
Dutchess 280 366 5,332 6,464 5.3 5.7
Erie 1,953 2,430 35,547 40,377 5.5 6.0
Essex ** 17 250 378 ** 4.5
Franklin 0 ** 109 ** 0.0 **
Fulton 113 166 2,310 3,099 4.9 5.4
Genesee 104 122 2,063 2,109 5.0 5.8
Greene 76 110 1,460 1,699 5.2 6.5
Hamilton 0 ** ** ** ** **
Herkimer 162 205 3,064 3,504 5.3 5.9
Jefferson ** 10 273 314 ** 3.2
Lewis ** ** 60 ** ** **
Livingston 88 122 1,501 1,879 5.9 6.5
Madison ** ** 184 ** ** **
Monroe 1,901 2,426 37,630 43,635 5.1 5.6
Montgomery 104 164 2,221 3,162 4.7 5.2
Nassau 809 1,150 16,620 21,236 4.9 5.4
Niagara 561 689 9,507 10,676 5.9 6.5
Oneida 659 768 12,102 14,250 5.4 5.4
Onondaga 1,010 1,277 18,106 21,905 5.6 5.8
Ontario 143 194 2,747 3,410 5.2 5.7
Orange 605 734 16,290 19,046 3.7 3.9
***24 months continuous enrollment.
***Data are suppressed for confidentiality purposes if there are fewer than 10 MMC enrollees that meet the criteria for asthma universe or when the number of MMC enrollees (denominator) is less than 50.

154
Table 9-11 continuedPersistent Asthma Prevalence* by County, Medicaid Managed Care Population, New York State, 2009-2010
Persistent Asthma Persistent Medicaid Managed Prevalence Asthma Care Enrollees Rate per 100 County 2009 2010 2009 2010 2009 2010
Orleans 73 112 2,030 2,465 3.6 4.5
Oswego 344 437 6,329 7,213 5.4 6.1
Otsego 42 78 1,151 1,732 3.6 4.5
Putnam 26 34 632 792 4.1 4.3
Rensselaer 296 361 5,269 6,198 5.6 5.8
Rockland 451 574 24,906 27,633 1.8 2.1
St. Lawrence ** 10 270 252 ** 4.0
Saratoga 139 202 3,472 4,360 4.0 4.6
Schenectady 231 321 3,680 4,753 6.3 6.8
Schoharie ** 14 241 321 ** 4.4
Schuyler ** ** 46 ** ** **
Seneca 35 45 1,025 1,199 3.4 3.8
Steuben ** ** 218 ** ** **
Suffolk 1,597 2,185 33,405 41,081 4.8 5.3
Sullivan 162 198 2,759 3,072 5.9 6.4
Tioga ** 21 338 380 ** 5.5
Tompkins 75 110 1,014 1,540 7.4 7.1
Ulster 286 356 5,060 6,177 5.7 5.8
Warren 28 47 530 708 5.3 6.6
Washington 61 99 1,276 1,815 4.8 5.5
Wayne 91 110 1,674 2,063 5.4 5.3
Westchester 1,396 1,743 25,250 30,768 5.5 5.7
Wyoming 0 ** 105 ** 0.0 **
Yates 52 65 1,029 1,186 5.1 5.5
New York City*** 54,690 60,307 1,127,915 1,171,827 4.8 5.1
***24 months continuous enrollment.
***Data are suppressed for confidentiality purposes if there are fewer than 10 MMC enrollees that meet the criteria for asthma universe or when the number of MMC enrollees (denominator) is less than 50.
***Data for the five boroughs of New York City are combined.
Prevalence of persistent asthma among MMC enrolleesvaried by county. For 2010, enrollees from Columbia,Cattaraugus and Tompkins counties had the highestpersistent asthma prevalence at 7.3%, 7.2%, and 7.1%,
respectively. Enrollees from Rockland County had the lowestprevalence rate at 2.1%. New York City had a persistentasthma prevalence rate of 5.1% in 2010 (Figure 9-11, Table 9-11).

155
Utilization of Health Services by the Medicaid Managed Care Asthma Universe Population
Methodology
Health service utilization data were generated for NYS MMCenrollees in the asthma universe population (see definitionon page 133), aged 0-64 years, who were continuouslyenrolled in a MMC health plan (Health MaintenanceOrganization [HMO] or Prepaid Health Services Plan[PHSP]) for 12 or more months as of December 2010.
Encounter (i.e., face-to-face) records were considered to be asthma-related if they had a primary diagnosis codeof asthma (International Classification of Diseases, 9thRevision, Clinical Modification (ICD-9 CM) code of 493.XX).Asthma-related pharmacy dispensing events were identifiedusing the National Drug Codes specified in the HEDIS®
201121 guidelines indicative of asthma. For the purpose of these health utilization analyses,
services were divided into outpatient, emergency
department, hospitalization, and pharmacy dispensingevents. A hierarchical approach was taken to categorize the services. All hospitalization records were identified first,followed by emergency department services, pharmacydispensing events and finally outpatient services. Becauseall records that were not identified as hospitalization,emergency room, or pharmacy were considered asoutpatient services, this category may contain additionalareas besides physician and clinic services (e.g., casemanagement, community and rehabilitation services,dentist and dental services and hospice care).
The number and rate of these services and dispensingevents per 100 asthma universe population is provided in thefollowing tables. Results are presented for the total popula -tion, and stratified by age group, gender, race and ethnicity,and geographic region (New York City and Rest of State).
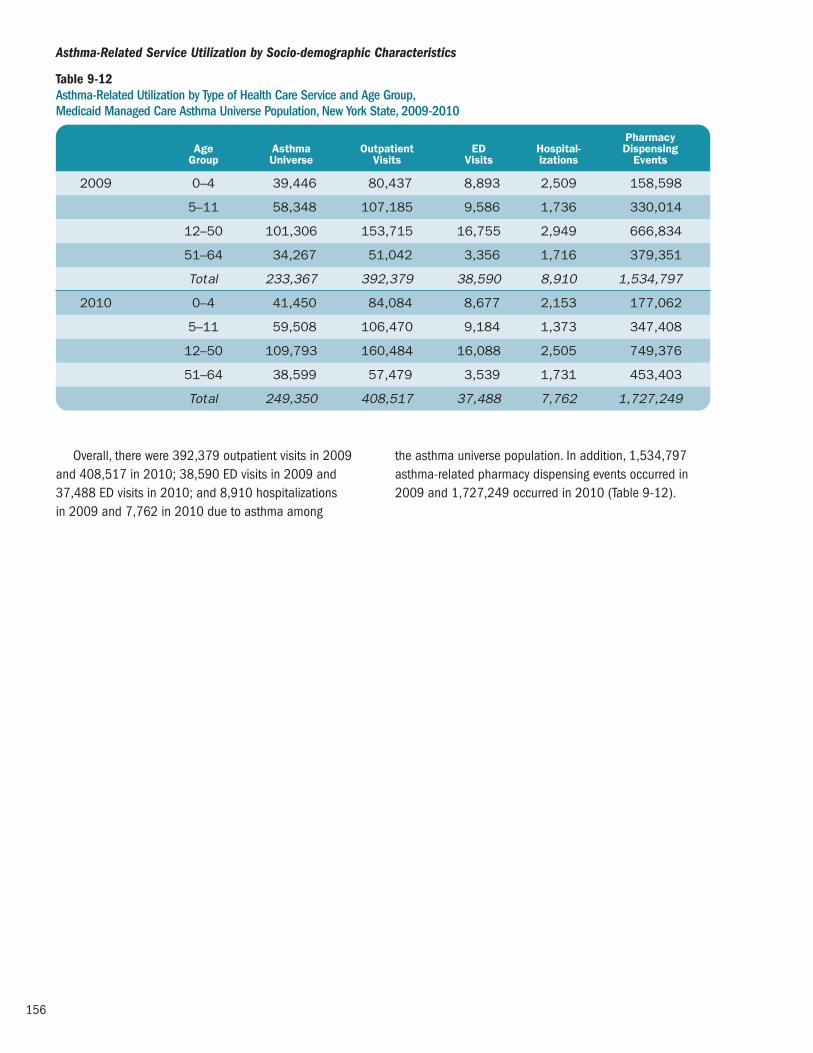
156
Pharmacy Age Asthma Outpatient ED Hospital- Dispensing Group Universe Visits Visits izations Events
2009 0–4 39,446 80,437 8,893 2,509 158,598
5–11 58,348 107,185 9,586 1,736 330,014
12–50 101,306 153,715 16,755 2,949 666,834
51–64 34,267 51,042 3,356 1,716 379,351
Total 233,367 392,379 38,590 8,910 1,534,797
2010 0–4 41,450 84,084 8,677 2,153 177,062
5–11 59,508 106,470 9,184 1,373 347,408
12–50 109,793 160,484 16,088 2,505 749,376
51–64 38,599 57,479 3,539 1,731 453,403
Total 249,350 408,517 37,488 7,762 1,727,249
Table 9-12 Asthma-Related Utilization by Type of Health Care Service and Age Group, Medicaid Managed Care Asthma Universe Population, New York State, 2009-2010
Asthma-Related Service Utilization by Socio-demographic Characteristics
Overall, there were 392,379 outpatient visits in 2009and 408,517 in 2010; 38,590 ED visits in 2009 and37,488 ED visits in 2010; and 8,910 hospitalizations in 2009 and 7,762 in 2010 due to asthma among
the asthma universe population. In addition, 1,534,797asthma-related pharmacy dispensing events occurred in2009 and 1,727,249 occurred in 2010 (Table 9-12).

157
Pharmacy Age Outpatient ED Hospital- Dispensing Group Visits Visits izations Events
2009 0-4 203.9 22.5 6.4 402.1
5-11 183.7 16.4 3.0 565.6
12-50 151.7 16.5 2.9 658.2
51-64 149.0 9.8 5.0 1,107.0
Total 168.1 16.5 3.8 657.7
2010 0-4 202.9 20.9 5.2 427.2
5-11 178.9 15.4 2.3 583.8
12-50 146.2 14.7 2.3 682.5
51-64 148.9 9.2 4.5 1,174.6
Total 163.8 15.0 3.1 692.7
Table 9-13 Asthma-Related Utilization Rate (per 100 Asthma Universe Enrollees) by Type of Health Care Service and Age Group, Medicaid Managed Care Asthma Universe Population, New York State, 2009-2010
The service and pharmacy-dispensing rates per 100asthma universe individuals in each service category varied by age.
Asthma outpatient visit rates were higher for younger age groups. The overall rate of outpatient visits was 168.1and 163.8 visits per 100 asthma universe individuals in 2009 and 2010, respectively.
Asthma ED visit rates varied by age group, with thehighest rate among children aged 0-4 years (22.5 per 100MMC asthma universe enrollees in 2009 and 20.9 per 100in 2010) and the lowest rate among adults aged 51-64years (9.8 per 100 in 2009 and 9.2 per 100 in 2010).
Hospitalizations due to asthma were also highest amongyoung children aged 0-4 years (6.4 per 100 MMC asthmauniverse enrollees in 2009 and 5.2 in 2010).
Asthma-related pharmacy dispensing rates increasedwith age group. The pharmacy dispensing rate was highestamong adults aged 51-64 years (1,107 pharmacy dispens -ing events per 100 MMC asthma universe enrollees in 2009 and 1,175 pharmacy dispensing events per 100 in 2010) (Table 9-13).

158
Pharmacy Age Asthma Outpatient ED Hospital- Dispensing Group Universe Visits Visits izations Events
2009 Male 102,177 175,112 17,794 3,801 616,594
Female 131,190 217,267 20,796 5,109 918,203
Total 233,367 392,379 38,590 8,910 1,534,797
2010 Male 108,428 180,412 17,483 3,360 690,244
Female 140,922 228,105 20,005 4,402 1,037,005
Total 249,350 408,517 37,488 7,762 1,727,249
Table 9-14 Asthma-Related Utilization by Type of Health Care Service and Gender, Medicaid Managed Care Asthma Universe Population, New York State, 2009-2010
For females, there were 217,267 outpatient visits in2009 and 228,105 in 2010; 20,796 ED visits in 2009 and 20,005 in 2010; 5,109 hospitalizations in 2009 and4,402 in 2010 due to asthma among the asthma universepopulation. In addition, 918,203 asthma-related pharmacydispensing events occurred in 2009 and 1,037,005occurred in 2010.
For males, there were 175,112 outpatient visits in 2009 and 180,412 in 2010; 17,794 ED visits in 2009 and 17,483 in 2010; 3,801 hospitalizations in 2009 and 3,360 in 2010 due to asthma among the asthmauniverse population. In addition, 616,594 asthma-relatedpharmacy dispensing events occurred in 2009 and690,244 occurred in 2010 (Table 9-14).
Pharmacy Age Outpatient ED Hospital- Dispensing Group Visits Visits izations Events
2009 Male 171.4 17.4 3.7 603.5
Female 165.6 15.9 3.9 699.9
2010 Male 166.4 16.1 3.1 636.6
Female 161.9 14.2 3.1 735.9
Table 9-15 Asthma-Related Utilization Rate (per 100 Asthma Universe Enrollees) by Type of Health Care Service and Gender, Medicaid Managed Care Asthma Universe Population, New York State, 2009-2010
The service or pharmacy-dispensing rates per 100asthma universe individuals in each service category variedby gender.
MMC asthma universe female enrollees had a loweroutpatient visit rate (165.6 per 100 MMC asthma universeenrollees in 2009 and 161.9 per 100 in 2010) than MMCasthma universe male enrollees (171.4 per 100 in 2009and 166.4 per 100 in 2010). In addition, rates of ED visitswere also lower for MMC female enrollees with asthma(15.9 per 100 in 2009 and 14.2 per 100 in 2010)
compared to male enrollees with asthma (17.4 per 100 in 2009 and 16.1 per 100 in 2010).
Asthma hospitalizations among MMC female enrolleeswere similar to male enrollees (3.9 and 3.7 per 100 MMCasthma universe enrollees in 2009 respectively and 3.1 per100 in 2010). MMC asthma universe female enrollees hadhigher asthma-related pharmacy dispensing rates (699.9pharmacy dispensing events per 100 in 2009 and 735.9per 100 in 2010) than male enrollees (603.5 per 100 in 2009 and 636.6 per 100 in 2010) (Table 9-15).

159
Pharmacy Race/ Asthma Outpatient ED Hospital- Dispensing Ethnicity* Universe Visits Visits izations Events
2009 Non-Hispanic White 48,679 73,154 4,045 1,059 299,486
Non-Hispanic Black 55,887 97,174 13,965 3,112 359,918
Non-Hispanic Other** 31,507 46,757 2,875 622 184,215
Hispanic 93,832 168,943 17,168 3,955 661,833
2010 Non-Hispanic White 54,137 77,179 4,110 844 356,117
Non-Hispanic Black 58,668 99,764 13,695 2,693 400,371
Non-Hispanic Other** 34,714 50,625 3,143 610 213,371
Hispanic 99,381 176,629 16,217 3,509 734,254
Table 9-16 Asthma-Related Utilization by Type of Health Care Service and Race/Ethnicity,* Medicaid Managed Care Asthma Universe Population, New York State, 2009-2010
MMC asthma universe non-Hispanic white enrollees had73,154 outpatient visits in 2009 and 77,179 outpatientvisits in 2010; non-Hispanic black enrollees had 97,174outpatient visits in 2009 and 99,764 outpatient visits in2010; non-Hispanic other enrollees had 46,757 outpatientvisits in 2009 and 50,625 outpatient visits in 2010 andHispanic enrollees had 168,943 outpatient visits in 2009and 176,629 outpatient visits in 2010.
There were 4,045 ED visits in 2009 and 4,110 ED visitsin 2010 for non-Hispanic white enrollees; 13,965 ED visitsin 2009 and 13,695 ED visits in 2010 for non-Hispanicblack enrollees; 2,875 ED visits in 2009 and 3,143 EDvisits in 2010 for non-Hispanic other enrollees and 17,168 ED visits in 2009 and 16,217 ED visits in 2010 for Hispanic enrollees.
Asthma hospitalizations among MMC non-Hispanic whiteenrollees were 1,059 in 2009 and 844 in 2010; for non-Hispanic black enrollees there were 3,112 in 2009 and2,693 in 2010; for non-Hispanic other enrollees there were622 in 2009 and 610 in 2010 and for Hispanic enrolleesthere were 3,955 in 2009 and 3,509 in 2010.
In addition, 299,486 asthma-related pharmacydispensing events occurred in 2009 and 356,117 occurredin 2010 for non-Hispanic white enrollees; 359,918 occurredin 2009 and 400,371 occurred in 2010 for non-Hispanicblack enrollees; 184,215 occurred in 2009 and 213,371occurred in 2010 for non-Hispanic other enrollees and661,833 occurred in 2009 and 734,254 occurred in 2010for Hispanic enrollees (Table 9-16).
*Excludes enrollees with missing race/ethnicity.
**Non-Hispanic Other race included American Indian/Alaskan Native, Asian, and Pacific Islander.

160
Pharmacy Race/ Outpatient ED Hospital- Dispensing Ethnicity* Visits Visits izations Events
2009 Non-Hispanic White 150.3 8.3 2.2 615.2
Non-Hispanic Black 173.9 25.0 5.6 644.0
Non-Hispanic Other** 148.4 9.1 2.0 584.7
Hispanic 180.0 18.3 4.2 705.3
2010 Non-Hispanic White 142.6 7.6 1.6 657.8
Non-Hispanic Black 170.0 23.3 4.6 682.4
Non-Hispanic Other** 145.8 9.1 1.8 614.7
Hispanic 177.7 16.3 3.5 738.8
Table 9-17 Asthma-Related Utilization Rate (per 100 Asthma Universe Enrollees) by Type of Health Care Service and Race/Ethnicity,* Medicaid Managed Care Asthma Universe Population, New York State, 2009-2010
The service or pharmacy-dispensing rates per 100asthma universe individuals in each service category variedby race and ethnicity.
Regarding asthma-related outpatient visits, MMC asthmauniverse Hispanic enrollees had the highest outpatient visit rate (180.0 per 100 MMC asthma universe enrollees in 2009 and 177.7 per 100 in 2010) while non-Hispanicother enrollees had the lowest outpatient visit rate (148.4per 100 in 2009 and 145.8 per 100 in 2010).
Asthma ED visit rates varied by race and ethnicity, withthe highest rate among non-Hispanic black MMC universeenrollees (25.0 per 100 MMC asthma universe enrollees in 2009 and 23.3 per 100 in 2010) and the lowest rate
among non-Hispanic white enrollees (8.3 per 100 in 2009and 7.6 per 100 in 2010). Hospitalizations due to asthmawere also highest among non-Hispanic black enrollees (4.6per 100 in 2010), and lowest among non-Hispanic whiteenrollees (1.6 in 2010).
Asthma-related pharmacy dispensing rates among MMC universe enrollees were highest for Hispanics (705.3pharmacy dispensing events per 100 MMC asthma universeenrollees in 2009 and 738.8 pharmacy dispensing eventsper 100 in 2010) and lowest among non-Hispanic otherenrollees in 2009 (584.7 per 100) and 2010 (614.7 per 100) (Table 9-17).
*Excludes enrollees with missing race/ethnicity.
**Non-Hispanic Other race included American Indian/Alaskan Native, Asian, and Pacific Islander.

161
Pharmacy Asthma Outpatient ED Hospital- Dispensing Region Universe Visits Visits izations Events
2009 New York City 167,700 278,243 30,464 7,072 1,162,700
Rest of State 65,667 114,136 8,126 1,838 372,097
2010 New York City 172,567 281,000 29,043 6,118 1,267,760
Rest of State 76,783 127,517 8,445 1,644 459,489
Table 9-18 Asthma-Related Utilization by Type of Health Care Service and Region, Medicaid Managed Care Asthma Universe Population, New York State, 2009-2010
MMC asthma universe enrollees in New York City had278,243 outpatient visits in 2009 and 281,000 outpatientvisits in 2010. MMC asthma universe enrollees from theRest of State had 114,136 outpatient visits in 2009 and127,517 outpatient visits in 2010.
In addition, there were 30,464 ED visits for MMC enrolleeswith asthma who resided in New York City in 2009 and29,043 ED visits in 2010. There were 8,126 ED visits in 2009and 8,445 ED visits in 2010 for those in the Rest of State.
Asthma hospitalizations among MMC enrollees living in New York City were 7,072 in 2009 and 6,118 in 2010;for enrollees living in the Rest of State there were 1,838 in 2009 and 1,644 in 2010.
In addition, 1,162,700 asthma-related pharmacy dis -pensing events occurred in 2009 and 1,267,760 occurredin 2010 for those living in New York City; 372,097 occurredin 2009 and 459,489 occurred in 2010 for those in theRest of State (Table 9-18).
Pharmacy Outpatient ED Hospital- Dispensing Region Visits Visits izations Events
2009 New York City 165.9 18.2 4.2 693.3
Rest of State 173.8 12.4 2.8 566.6
2010 New York City 162.8 16.8 3.5 734.6
Rest of State 166.1 11.0 2.1 598.4
Table 9-19 Asthma-Related Utilization Rate (per 100 Asthma Universe Enrollees) by Type of Health Service and Region, Medicaid Managed Care Asthma Universe Population, New York State, 2009-2010
The service and pharmacy-dispensing rates per 100asthma universe individuals in each service category variedby region.
MMC asthma universe enrollees in New York City had a lower outpatient visit rate (165.9 per 100 MMC asthmauniverse enrollees in 2009 and 162.8 per 100 in 2010)than MMC asthma universe enrollees from the Rest of State(173.8 per 100 in 2009 and 166.1 per 100 in 2010).
Conversely, rates of ED visits were also higher for MMCenrollees with asthma who reside in New York City (18.2 per 100 MMC asthma universe enrollees in 2009 and 16.8 per 100 in 2010) compared to those in the Rest ofState (12.4 per 100 in 2009 and 11.0 per 100 in 2010).
Asthma hospitalizations among MMC enrollees were also higher for those living in New York City (4.2 per 100MMC asthma universe enrollees in 2009 and 3.5 per 100 in 2010) than in the Rest of State (2.8 per 100 in 2009 and 2.1 per 100 in 2010).
There were differences in asthma-related pharmacydispensing rates for MMC asthma universe enrollees whencomparing New York City (693.3 pharmacy dispensingevents per 100 in 2009 and 734.6 per 100 in 2010) and Rest of State residents (566.6 per 100 in 2009 and 598.4 per 100 in 2010) (Table 9-19).

162
Asthma Prevalence Among the Child Health Plus Population
Methodology
This section presents prevalence data for New York State(NYS) residents enrolled in the Child Health Plus (CHP)program. CHP is a health insurance program for uninsuredNYS residents under the age of 19. (For detailed information,please refer to NYSDOH’s website at www.health.ny.gov/ health_care/child_health_plus.
Asthma universe and persistent asthma prevalence datafor the CHP population, aged 0-18 years, with continuousCHP enrollment of 12 or more months as of December2010, are presented. Prevalence data are shown for thetotal population, and stratified by age group, gender, raceand ethnicity, county of residence, and geographic region(New York City and Rest of State).

163
Asthma Universe Asthma Child Health Plus Prevalence Age Group Universe Enrollees Rate per 100
0–4 2,581 20,035 12.9
5–11 11,341 88,306 12.8
12–18 9,631 117,678 8.2
Total 23,553 226,019 10.4
There were 23,553 (10.4%) children who met theasthma universe definition among approximately 226,000CHP enrollees.
Asthma universe prevalence among CHP enrollees varied by age. In 2010, enrollees aged 0-4 and 5-11 years
had the highest prevalence rate of asthma universe (12.9% and 12.8%, respectively) (Table 9-20).
Asthma Universe Prevalence by Socio-demographic Characteristics
Table 9-20 Asthma Universe Prevalence by Age Group, Child Health Plus Population, New York State, 2010
Asthma Universe Asthma Child Health Plus Prevalence Gender Universe Enrollees Rate per 100
Male 13,535 116,078 11.7
Female 10,018 109,941 9.1
Asthma universe prevalence among CHP enrollees varied by gender. In 2010, boys had a higher prevalence
rate of asthma universe (11.7%) compared to girls (9.1%)(Table 9-21).
Table 9-21 Asthma Universe Prevalence by Gender, Child Health Plus Population, New York State, 2010
Asthma Universe Prevalence Among the Child Health Plus Population

164
Asthma Universe Asthma Child Health Plus Prevalence Race/Ethnicity* Universe Enrollees Rate per 100
Non-Hispanic White 7,601 71,306 10.7
Non-Hispanic Black 2,565 22,382 11.5
Non-Hispanic Other** 1,818 19,568 9.3
Hispanic 6,061 58,462 10.4
Asthma universe prevalence among CHP enrollees variedby race and ethnicity. Non-Hispanic black enrollees had thehighest prevalence rate of asthma universe (11.5%),
followed by non-Hispanic white enrollees (10.7%). Non-Hispanic other enrollees had the lowest rate of asthmauniverse prevalence (9.3%) (Table 9-22).
Table 9-22 Asthma Universe Prevalence by Race/Ethnicity*, Child Health Plus Population, New York State, 2010
Asthma Universe Asthma Child Health Plus Prevalence Region Universe Enrollees Rate per 100
New York City 7,526 88,092 8.5
Rest of State 16,027 137,927 11.6
Asthma universe prevalence among CHP enrollees variedby region. In 2010, Rest of State residents had a higher
prevalence rate of asthma universe (11.6%) compared to New York City residents (8.5%) (Table 9-23).
Table 9-23 Asthma Universe Prevalence by Region, Child Health Plus Population, New York State, 2010
**Excludes enrollees with missing race/ethnicity.
**Non-Hispanic Other race included American Indian/Alaskan Native, Asian, and Pacific Islander.

165
Asthma Universe Prevalence0 1311 15 17531 7 9
AlleganyCattaraugusChautauqua
ErieGeneseeNiagaraOrleans
Wyoming
Regi
on 1
ChemungLivingston
MonroeOntario
SchuylerSeneca
SteubenWayne
Yates
Regi
on 2
CayugaCortlandHerkimerJefferson
LewisMadison
OneidaOnondaga
OswegoSt. Lawrence
TompkinsRe
gion
3
BroomeTioga
Regi
on 4
AlbanyClinton
ColumbiaDelaware
EssexFranklin
FultonGreene
HamiltonMontgomery
OtsegoRensselaer
SaratogaSchenectady
SchoharieWarren
Washington
Regi
on 5
DutchessOrangePutnam
RocklandSullivan
UlsterWestchester
Regi
on 6
New York City
Regi
on 7
NassauSuffolk
Regi
on 8
New York State: 10.4
1412642 8 10 16
Figure 9-12 Asthma Universe Prevalence* by County, Child Health Plus Population, New York State, 2010
Source: Office of Health Insurance Programs Data Mart
**12 months continuous enrollment.
**Data for the five boroughs of New York City are combined.
Asthma Universe* PrevalenceChild Health Plus Population, 2010Counties are Shaded Based on Quartile Distribution
Data not available or do not meet reporting criteria 0 – <11.2: Q1 & Q211.2 – <13.0: Q313.0+: Q4

166
Table 9-24 Asthma Universe Prevalence* by County, Child Health Plus Population, New York State, 2010
Asthma Universe Asthma Child Health Plus Prevalence County Universe Enrollees Rate per 100
Albany 389 3,123 12.5
Allegany 44 502 8.8
Broome 230 2,213 10.4
Cattaraugus 106 979 10.8
Cayuga 114 1,172 9.7
Chautauqua 204 1,512 13.5
Chemung 61 648 9.4
Chenango ** ** **
Clinton 114 754 15.1
Columbia 143 1,037 13.8
Cortland 45 423 10.6
Delaware 32 321 10.0
Dutchess 337 2,811 12.0
Erie 1,223 9,759 12.5
Essex 59 476 12.4
Franklin 54 468 11.5
Fulton 128 944 13.6
Genesee 52 668 7.8
Greene 76 653 11.6
Hamilton 13 88 14.8
Herkimer 164 1,502 10.9
Jefferson 199 1,495 13.3
Lewis 56 543 10.3
Livingston 104 635 16.4
Madison 131 901 14.5
Monroe 1,004 9,139 11.0
Montgomery 95 964 9.9
Nassau 1,584 15,316 10.3
Niagara 327 2,581 12.7
Oneida 501 3,844 13.0
Onondaga 715 6,351 11.3
Ontario 178 1,376 12.9
Orange 515 4,392 11.7
**12 months continuous enrollment.
**Data are suppressed for confidentiality purposes if there are fewer than 10 CHP enrollees that meet the criteria for asthma universe or when the number of CHP enrollees (denominator) is less than 50.

167
Table 9-24 continuedAsthma Universe Prevalence* by County, Child Health Plus Population, New York State, 2010
Asthma Universe Asthma Child Health Plus Prevalence County Universe Enrollees Rate per 100
Orleans 41 615 6.7
Oswego 281 2,539 11.1
Otsego 58 600 9.7
Putnam 20 137 14.6
Rensselaer 251 1,917 13.1
Rockland 367 4,032 9.1
St. Lawrence 186 1,336 13.9
Saratoga 329 2,562 12.8
Schenectady 341 2,622 13.0
Schoharie 59 529 11.2
Schuyler 22 226 9.7
Seneca 36 396 9.1
Steuben 128 1,185 10.8
Suffolk 2,264 20,809 10.9
Sullivan 195 1,358 14.4
Tioga 50 514 9.7
Tompkins 108 881 12.3
Ulster 230 1,741 13.2
Warren 67 618 10.8
Washington 167 1,123 14.9
Wayne 177 1,483 11.9
Westchester 1,580 12,319 12.8
Wyoming 40 436 9.2
Yates 32 354 9.0
New York City*** 7,526 88,092 8.5
Total 23,552 226,014 10.4
***12 months continuous enrollment.
***Data for the five boroughs of New York City are combined.
Prevalence of asthma universe among CHP enrolleesvaried by county. For 2010, among counties in the Rest ofState, enrollees from Livingston County had the highestasthma universe prevalence rate (16.4%), while enrollees
from Orleans County had the lowest prevalence rate (6.7%). New York City had an asthma universe prevalencerate of 8.5% in 2010 (Figure 9-12, Table 9-24).

168
Persistent Persistent Asthma Asthma Child Health Plus Prevalence Age Group Prevalence Enrollees Rate per 100
0–4 576 8,088 7.1
5–11 4,633 55,654 8.3
12–18 4,111 81, 440 5.0
Total 9,320 145,182 6.4
Among the CHP enrollees with 24 months continuousenrollment by the end of 2010, 9,320 individuals (6.4%)met the definition of persistent asthma.
Persistent asthma prevalence among CHP enrolleesvaried by age. For 2010, CHP enrollees aged 5-11 years
had the highest prevalence rate of persistent asthma(8.3%), followed by enrollees aged 0-4 years (7.1%). CHPenrollees aged 12-18 years had the lowest prevalence rateat 5.0% (Table 9-25).
Persistent Asthma Prevalence by Socio-demographic Characteristics
Table 9-25 Persistent Asthma Prevalence by Age Group, Child Health Plus Population, New York State, 2010
Persistent Persistent Asthma Asthma Child Health Plus Prevalence Gender Universe Enrollees 2010 Rate per 100
Male 5,504 74,826 7.4
Female 3,816 70,356 5.4
Persistent asthma prevalence in CHP enrollees varied bygender. Boys had a higher prevalence rate of persistentasthma (7.4%) compared to girls (5.4%) (Figure 9-26).
Table 9-26 Persistent Asthma Prevalence by Gender, Child Health Plus Population, New York State, 2010
Persistent Asthma Prevalence Among the Child Health Plus Population

169
Persistent Persistent Asthma Asthma Child Health Plus Prevalence Race/Ethnicity* Prevalence Enrollees Rate per 100
Non-Hispanic White 3,099 46,072 6.7
Non-Hispanic Black 910 12,339 7.4
Non-Hispanic Other** 694 12,951 5.4
Hispanic 2,359 38,045 6.2
Persistent asthma prevalence in CHP enrollees varied byrace and ethnicity.
Non-Hispanic black CHP enrollees had the highestprevalence rate of persistent asthma at 7.4%. Non-Hispanic
other enrollees had the lowest prevalence rate in 2010 at 5.4% (Figure 9-27).
Table 9-27 Persistent Asthma Prevalence by Race/Ethnicity*, Child Health Plus Population, New York State, 2010
Persistent Persistent Asthma Asthma Child Health Plus Prevalence Region Prevalence Enrollees Rate per 100
New York City 2,920 58,186 5.0
Rest of State 6,400 86,996 7.4
Persistent asthma prevalence among CHP enrollees variedby region. For 2010, persistent asthma prevalence was higher
for Rest of State residents (7.4%) compared to CHP enrolleeswho reside in New York City (5.0%) (Figure 9-28).
Table 9-28 Persistent Asthma Prevalence by Region, Child Health Plus Population, New York State, 2010
**Excludes enrollees with missing race/ethnicity.
**Non-Hispanic Other race included American Indian/Alaskan Native, Asian, and Pacific Islander.

170
Asthma Universe Prevalence0 98 10 11543 6 7
AlleganyCattaraugusChautauqua
ErieGeneseeNiagaraOrleans
Wyoming
Regi
on 1
ChemungLivingston
MonroeOntarioSeneca
SteubenWayne
Yates
Regi
on 2
CayugaCortlandHerkimerJefferson
LewisMadison
OneidaOnondaga
OswegoSt. Lawrence
Tompkins
Regi
on 3
BroomeTioga
Regi
on 4
AlbanyClinton
ColumbiaDelaware
EssexFranklin
FultonGreene
MontgomeryOtsego
RensselaerSaratoga
SchenectadySchoharie
WarrenWashington
Regi
on 5
DutchessOrange
RocklandSullivan
UlsterWestchester
Regi
on 6
New York City
Regi
on 7
NassauSuffolk
Regi
on 8
New York State: 6.4
21
Figure 9-13 Persistent Asthma Prevalence* by County, Child Health Plus Population, New York State, 2010
Source: Office of Health Insurance Programs Data Mart
**24 months continuous enrollment.
**Data for the five boroughs of New York City are combined.
Persistent Asthma* PrevalenceChild Health Plus Population, 2010Counties are Shaded Based on Quartile Distribution
Data not available or do not meet reporting criteria 0 – <7.3: Q1 & Q27.3 – <8.2: Q38.2+: Q4

171
Table 9-29 Persistent Asthma Prevalence* by County, Child Health Plus Population, New York State, 2010
Persistent Persistent Asthma Asthma Child Health Plus Prevalence County Prevalence Enrollees Rate per 100
Albany 145 1,933 7.5
Allegany 17 321 5.3
Broome 85 1,275 6.7
Cattaraugus 41 603 6.8
Cayuga 50 719 7.0
Chautauqua 93 974 9.5
Chemung 32 408 7.8
Chenango ** ** **
Clinton 46 450 10.2
Columbia 58 617 9.4
Cortland 17 205 8.3
Delaware 10 213 4.7
Dutchess 112 1,603 7.0
Erie 538 6,233 8.6
Essex 21 305 6.9
Franklin 18 289 6.2
Fulton 52 588 8.8
Genesee 21 425 4.9
Greene 32 428 7.5
Hamilton ** ** **
Herkimer 74 1,032 7.2
Jefferson 94 919 10.2
Lewis 26 357 7.3
Livingston 37 385 9.6
Madison 45 536 8.4
Monroe 417 5,581 7.5
Montgomery 40 626 6.4
Nassau 636 9,351 6.8
Niagara 133 1,583 8.4
Oneida 201 2,568 7.8
Onondaga 328 4,046 8.1
Ontario 68 854 8.0
Orange 176 2,639 6.7
**12 months continuous enrollment.
**Data are suppressed for confidentiality purposes if there are fewer than 10 CHP enrollees that meet the criteria for asthma universe or when the number of CHP enrollees (denominator) is less than 50.

172
Table 9-29 continuedAsthma Universe Prevalence* by County, Child Health Plus Population, New York State, 2010
Persistent Persistent Asthma Asthma Child Health Plus Prevalence County Prevalence Enrollees Rate per 100
Orleans 18 369 4.9
Oswego 136 1,702 8.0
Otsego 21 364 5.8
Putnam ** ** **
Rensselaer 92 1,215 7.6
Rockland 116 2,499 4.6
St. Lawrence 92 869 10.6
Saratoga 121 1,638 7.4
Schenectady 157 1,747 9.0
Schoharie 25 338 7.4
Schuyler ** ** **
Seneca 16 256 6.3
Steuben 47 705 6.7
Suffolk 893 13,478 6.6
Sullivan 59 863 6.8
Tioga 16 297 5.4
Tompkins 43 555 7.7
Ulster 85 964 8.8
Warren 31 408 7.6
Washington 73 725 10.1
Wayne 74 903 8.2
Westchester 578 8,293 7.0
Wyoming 15 287 5.2
Yates 15 208 7.2
New York City*** 2,920 58,186 5.0
Total 9,306 144,935 6.4
***24 months continuous enrollment.
***Data are suppressed for confidentiality purposes if there are fewer than 10 CHP enrollees that meet the criteria for asthma universe or when the number of CHP enrollees (denominator) is less than 50.
***Data for the five boroughs of New York City are combined.
Persistent asthma prevalence among CHP enrolleesvaried by county. For 2010, among counties in the Rest of State, enrollees from St. Lawrence County, Clinton andJefferson counties had the highest persistent asthmaprevalence at 10.6%, 10.2%, and 10.2%, respectively.
Enrollees from Rockland County and Delaware County hadthe lowest prevalence rate at 4.6% and 4.7%, respectively.New York City had a persistent asthma prevalence rate of5.0% in 2010 (Figure 9-13, Table 9-29).

173
Utilization of Health Services by the Child Health Plus Asthma Universe Population
Methodology
This section presents health service utilization data for New York State (NYS) residents enrolled in the Child HealthPlus (CHP) program. CHP is a health insurance program for uninsured NYS residents under the age of 19. (Fordetailed information, please refer to NYSDOH’s website at www.health.ny.gov/health_care/child_health_plus ).
Health service utilization data were generated for NYSCHP enrollees in the asthma universe (see definition on page133), aged 0-18 years, who were continuously enrolled inCHP for 12 or more months as of December 2010.
Encounter records were considered to be asthma-relatedif they were submitted with a primary diagnosis code of asthma (International Classification of Diseases, 9thRevision, Clinical Modification (ICD-9 CM) code of 493.XX.Asthma-related pharmacy fillings were identified using
the National Drug Codes specified in the HEDIS® 201121
guidelines indicative of asthma. For the purpose of these health utilization analyses,
services were divided into inpatient, emergency department,outpatient, and pharmacy services. A hierarchical approachwas taken to categorize the services. All inpatient recordswere identified first, followed by emergency departmentservices, pharmacy records and finally outpatient services.Because all records that were not identified as inpatient,emergency room, or pharmacy were considered as out -patient services, this category may contain additional areas besides physician and clinic services.
The number of these services per 100 asthma universepopulation is also provided. Results are presented for totalpopulation, and stratified by age group, gender, race and eth -nicity, and geographic region (New York City and Rest of State).

174
Pharmacy Asthma Outpatient Hospitali- Dispensing Age Group Universe Visits ED Visits zations Events
0–4 2,581 4,714 375 149 9,697
5–11 11,341 18,634 1,096 248 54,282
12–18 9,631 12,551 747 140 40,067
Total 23,553 35,899 2,218 537 104,046
In 2010, there were 35,899 outpatient visits; 2,218 ED visits; and 537 hospitalizations due to asthma amongthe asthma universe population for CHP enrollees.
In addition, 104,046 asthma-related pharmacy dispensingevents occurred in 2010 (Table 9-30).
Asthma-Related Health Care Service Utilization by Socio-demographic Characteristics
Table 9-30 Asthma-Related Health Care Service Utilization by Age Group, Child Health Plus Population, New York State, 2010
Pharmacy Outpatient Hospitali- DispensingAge Group Visits ED Visits zations Events
0–4 182.6 14.5 5.8 375.7
5–11 164.3 9.7 2.2 478.6
12–18 130.3 7.8 1.5 416.0
Total 152.4 9.4 2.3 441.8
For 2010, the service or pharmacy-dispensing rates per 100 asthma universe individuals in each servicecategory varied by age. Asthma outpatient visit rates werehigher for younger age groups. The overall rate of outpatientvisits was 152.4 per 100 CHP asthma universe individualsin 2010. Asthma ED visit rates varied by age group, with the highest rate among children aged 0-4 years (15 per
100) and the lowest rate among children aged 12-18 years (8 per 100). Hospitalizations due to asthma were alsohighest among young children aged 0-4 years (6 per 100).Asthma-related pharmacy dispensing rates were highestamong the 5-11 year-old age group (479 dispensing eventsper 100) (Table 9-31).
Table 9-31 Asthma-Related Health Care Service Utilization per 100 Asthma Universe Enrollees by Age Group, Child Health Plus Population, New York State, 2010
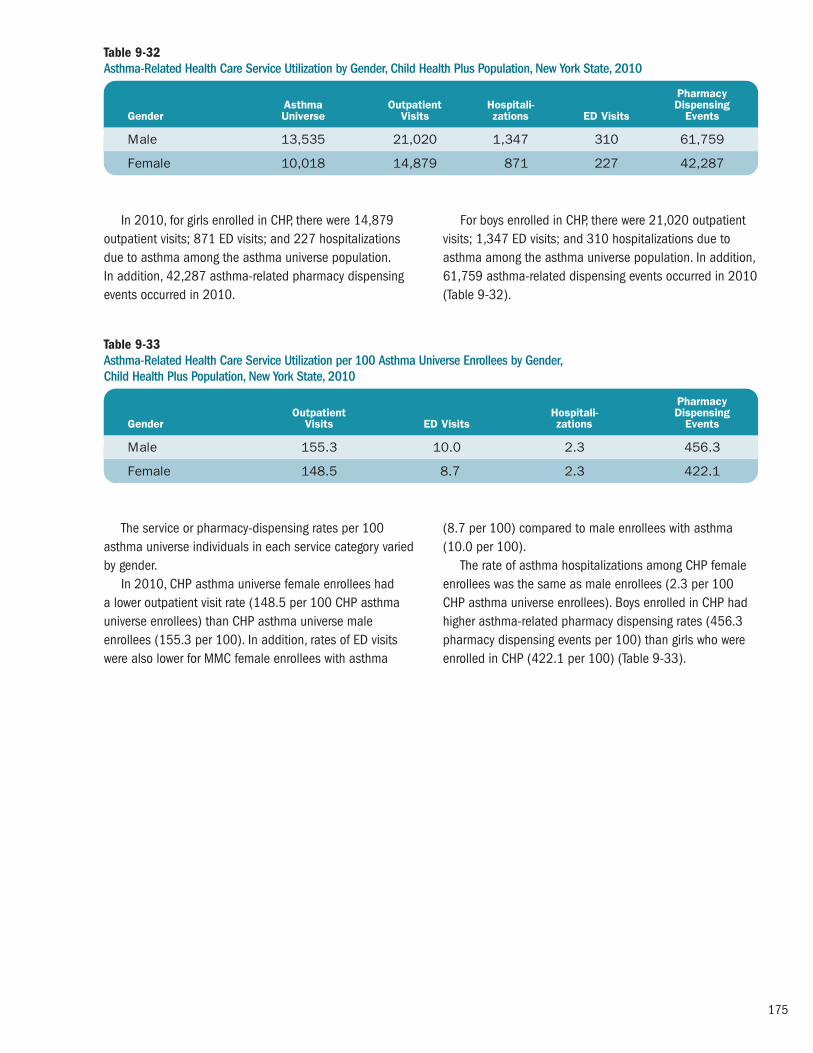
175
Pharmacy Asthma Outpatient Hospitali- Dispensing Gender Universe Visits zations ED Visits Events
Male 13,535 21,020 1,347 310 61,759
Female 10,018 14,879 871 227 42,287
In 2010, for girls enrolled in CHP, there were 14,879outpatient visits; 871 ED visits; and 227 hospitalizationsdue to asthma among the asthma universe population. In addition, 42,287 asthma-related pharmacy dispensingevents occurred in 2010.
For boys enrolled in CHP, there were 21,020 outpatientvisits; 1,347 ED visits; and 310 hospitalizations due toasthma among the asthma universe population. In addition,61,759 asthma-related dispensing events occurred in 2010(Table 9-32).
Table 9-32 Asthma-Related Health Care Service Utilization by Gender, Child Health Plus Population, New York State, 2010
Pharmacy Outpatient Hospitali- DispensingGender Visits ED Visits zations Events
Male 155.3 10.0 2.3 456.3
Female 148.5 8.7 2.3 422.1
The service or pharmacy-dispensing rates per 100asthma universe individuals in each service category variedby gender.
In 2010, CHP asthma universe female enrollees had a lower outpatient visit rate (148.5 per 100 CHP asthmauniverse enrollees) than CHP asthma universe maleenrollees (155.3 per 100). In addition, rates of ED visitswere also lower for MMC female enrollees with asthma
(8.7 per 100) compared to male enrollees with asthma(10.0 per 100).
The rate of asthma hospitalizations among CHP femaleenrollees was the same as male enrollees (2.3 per 100CHP asthma universe enrollees). Boys enrolled in CHP hadhigher asthma-related pharmacy dispensing rates (456.3pharmacy dispensing events per 100) than girls who wereenrolled in CHP (422.1 per 100) (Table 9-33).
Table 9-33 Asthma-Related Health Care Service Utilization per 100 Asthma Universe Enrollees by Gender, Child Health Plus Population, New York State, 2010

176
Pharmacy Asthma Outpatient ED Hospital- DispensingRace/Ethnicity* Universe Visits Visits izations Events
Non-Hispanic White 7,601 11,737 499 106 34,678
Non-Hispanic Black 2,565 3,789 427 121 12,141
Non-Hispanic Other** 1,818 2,752 105 25 7,416
Hispanic 6,061 9,346 714 167 24,644
In 2010, CHP asthma universe non-Hispanic whiteenrollees had 11,737 outpatient visits; non-Hispanic blackenrollees had 3,789 outpatient visits; Hispanic enrolleeshad 9,346 outpatient visits and non-Hispanic otherenrollees had 2,752 outpatient visits.
There were 499 ED visits in 2010 for non-Hispanic whiteenrollees; 427 ED visits in for non-Hispanic black enrollees;714 ED visits for Hispanic enrollees; and 105 ED visits in 2010 for non-Hispanic other CHP enrollees.
There were 106 asthma hospitalizations among CHP non-Hispanic white enrollees in 2010. There were 167 hospitalizations for Hispanic CHP enrollees and 121 asthma hospitalizations among non-Hispanic blackchildren enrolled in CHP.
In addition, 78,879 asthma-related pharmacy dispensing events occurred in 2010; 12,141 were filled fornon-Hispanic black CHP enrollees and 24,644 were filled for Hispanic children enrolled in CHP (Table 9-34).
Table 9-34 Asthma-Related Health Service Utilization by Race/Ethnicity,* Child Health Plus Population, New York State, 2010
**Excludes enrollees with missing race/ethnicity.
**Non-Hispanic Other race included American Indian/Alaskan Native, Asian, and Pacific Islander.
Pharmacy Outpatient ED Hospital- DispensingRace/Ethnicity* Visits Visits izations Events
Non-Hispanic White 154.4 6.6 1.4 456.2
Non-Hispanic Black 147.7 16.6 4.7 473.3
Non-Hispanic Other** 151.4 5.8 1.4 407.9
Hispanic 154.2 11.8 2.8 406.6
The service or pharmacy-dispensing rates per 100 CHPasthma universe individuals in each service category variedby race and ethnicity.
In 2010, CHP asthma universe non-Hispanic white and Hispanic enrollees had the highest outpatient visit rate (154.4 per 100 CHP asthma universe enrollees) whilenon-Hispanic black enrollees had the lowest outpatient visitrate (147.7 per 100).
Asthma ED visit rates varied by race and ethnicity, withthe highest rate among non-Hispanic black CHP universe
enrollees (16.6 per 100 CHP asthma universe enrollees)and the lowest rate among non-Hispanic other enrollees(5.8 per 100). Hospitalizations due to asthma were alsohighest among non-Hispanic black enrollees (4.7 per 100).
Asthma-related pharmacy dispensing rates among CHPuniverse enrollees were also higher for non-Hispanic blackchildren (473.3 pharmacy dispensing events per 100 CHPasthma universe enrollees) (Table 9-35).
Table 9-35 Asthma-Related Health Care Service Utilization per 100 Asthma Universe Enrollees by Race/Ethnicity,* Child Health Plus Population, New York State, 2010
**Excludes enrollees with missing race/ethnicity.
**Non-Hispanic Other race included American Indian/Alaskan Native, Asian, and Pacific Islander.

177
Pharmacy Asthma Outpatient Hospitali- Dispensing Region Universe Visits zations ED Visits Events
New York City 7,526 10,781 999 207 29,528
Rest of State 16,027 25,118 1,219 330 74,518
CHP asthma universe enrollees in New York City had10,781 outpatient visits in 2010. CHP asthma universeenrollees from the Rest of State had 25,118 outpatientvisits in 2010.
For 2010, there were 999 ED visits for CHP enrolleeswith asthma who resided in New York City. There were 1,219ED for children enrolled in CHP living in the Rest of State.
Asthma hospitalizations among CHP enrollees living inNew York City were 207; there were 330 in 2010 for thoseliving in the Rest of State.
In addition, 29,528 asthma-related pharmacy dis -pensing events occurred in 2010 for residents of New YorkCity; 74,518 were filled for those in the Rest of State (Table 9-36).
Table 9-36 Asthma-Related Health Service Utilization by Region, Child Health Plus Population, New York State, 2010
Pharmacy Outpatient Hospitali- DispensingRegion Visits ED Visits zations Events
New York City 143.3 13.3 2.8 392.3
Rest of State 156.7 7.6 2.1 465.0
The service utilization or pharmacy-dispensing rates per100 asthma universe individuals in each service categoryvaried by region.
For 2010, CHP asthma universe enrollees in New YorkCity had a lower outpatient visit rate (143.3 per 100) thanCHP asthma universe enrollees from the Rest of State(156.7 per 100).
Rates of ED visits were higher for CHP enrollees withasthma who reside in New York City (13.3 per 100 CHPasthma universe enrollees) compared to those in the Restof State (7.6 per 100).
Asthma hospitalizations among CHP enrollees wereslightly higher for those living in New York City (2.8 per 100CHP asthma universe enrollees) than in the Rest of State(2.1 per 100).
There were also differences in asthma-related pharmacydispensing rates for CHP asthma universe enrollees whencomparing New York City (392.3 dispensing events per 100 CHP asthma universe enrollees) and the Rest of State(465.0 dispensing events per 100) (Table 9-37).
Table 9-37 Asthma-Related Health Care Service Utilization per 100 Asthma Universe Enrollees by Region, Child Health Plus Population, New York State, 2010

178
Managed Care Quality Assurance Reporting Requirement Asthma-Specific Indicators
Methodology
Quality Assurance Reporting Requirements (QARR) consistof measures from the National Committee for QualityAssurance’s (NCQA) Health Plan Effectiveness Data and Information Set (HEDIS
®) 201022 and NYS-specific
measures. This report presents 2010 data for “Use of
Appropriate Medications for People with Asthma” and“Appropriate Asthma Medications – 3+ Controllers,” whichare two measures for asthma (see: www.health.ny.gov/ health_care/managed_care/qarrfull/qarr_2011/docs/ qarr2011.pdf). The QARR measures for asthma care are defined as follows:
Measure Description
Use of Appropriate Medications for People with Asthma
Appropriate Asthma Medications – 3+ Controllers
The percentage of enrollees (ages 5-50 years) with persist-ent asthma who have received appropriate medications (i.e., at least one prescription for inhaled corticosteroids,nedocromil, cromolyn sodium, leukotriene modifiers ormethylxanthines). This measure was generated for the Medicaid, Child HealthPlus and Commercial insurance populations that wereenrolled continuously for a 24-month period by December2009 and 2010.
The percentage of enrollees (ages 5-50 years) with persist-ent asthma who had three or more controller medicationdispensing events in the last year. This measure was generated for the Medicaid, Child HealthPlus and Commercial insurance populations that wereenrolled continuously for a 24-month period by December2009 and 2010.
The QARR measure for asthma in this report summarizesinformation about care received during 2010 from 27health plans. Twelve plans reported data about theirCommercial enrollees; 18 plans reported on their Medicaidenrollees; and 19 plans reported on Child Health Plusenrollees. Child Health Plus data for one plan are notincluded in the report due to small sample size. Elevenplans reported data on their Preferred Provider Organization(PPO) membership for year 2010.
The measures were generated for children aged 5-11years and adults aged 12-50 years by type of plan.
In addition, demographic variation is presented in mapsfor the following measures and age groups:
� “Use of Appropriate Medications for People with Asthma”measure for ages 5-50 years (see: www.health.ny.gov/ health_care/managed_care/reports/docs/demographic_variation_2011.pdf);
� “Appropriate Asthma Medications – 3+ Controllers” forages 5-11 years (see: www.health.ny.gov/health_care/ managed_care/qarrfull/qarr_2011/docs/qarr2011.pdf).

179
Figure 9-14Percentages of Children (5-11 Years) with Persistent Asthma Who Received Appropriate Medications by Type of Plan, New York State, 2010
In 2010, children aged 5-11 years with persistentasthma who were enrolled in Commercial HMO (96%) andPPO (96%) plans showed a slightly higher proportion
receiving appropriate medications compared to thoseenrolled in Medicaid managed care (MMC) (92%) and the Child Health Plus plan (95%) (Figure 9-14).
*Child Health Plus data includes children aged 5-18 years.
CommercialHMO
CommercialPPO
Medicaid Child Health Plus*0
40
60
80
100Pe
rcen
t
20
96 96 92 95

180
Figure 9-15Percentages of Individuals (12-50 Years) with Persistent Asthma Who Received Appropriate Medications by Type of Plan, New York State, 2010
In 2010, Commercial HMO plans showed a slightlyhigher proportion of enrollees aged 12-50 years withpersistent asthma receiving appropriate medications
(91%) compared to the percentages among enrollees in Medicaid (88%) or Commercial PPO (82%) plans (Figure 9-15).
CommercialHMO
CommercialPPO
Medicaid0
40
60
80
100
Perc
ent
20
91 82 88

181
Figure 9-16Percentages of Individuals (5-50 Years) with Persistent Asthma Who Received Appropriate Medications by County, New York State, 2010
In 2010, among individuals aged 5-50 years withpersistent asthma, there was variation by county regardingongoing use of appropriate medications to control their
asthma. Orleans County had the lowest percentage of individuals with persistent asthma (less than 80%) who received appropriate medications (Figure 9-16).
Counties are Shaded Based on Quartile Distribution
Insufficient dataLess than 80%80%-84%85%-89%90% and above
New York City by Neighborhood

182
Figure 9-17Percentages of Children (5-11 Years) with Persistent Asthma Who Had Three or More Controller Medication Dispensing Events in the Past Year by Type of Plan, New York State, 2010
In 2010, children aged 5-11 years with persistentasthma who were enrolled in Commercial (82%) healthplans and Child Health Plus (81%) were more likely to
have three or more controller medications dispensed in the past year compared to those enrolled in MMC (76%)(Figure 9-17).
CommercialHMO
CommercialPPO
Medicaid Child Health Plus0
40
60
80
100
Perc
ent
20
82 82 76 81
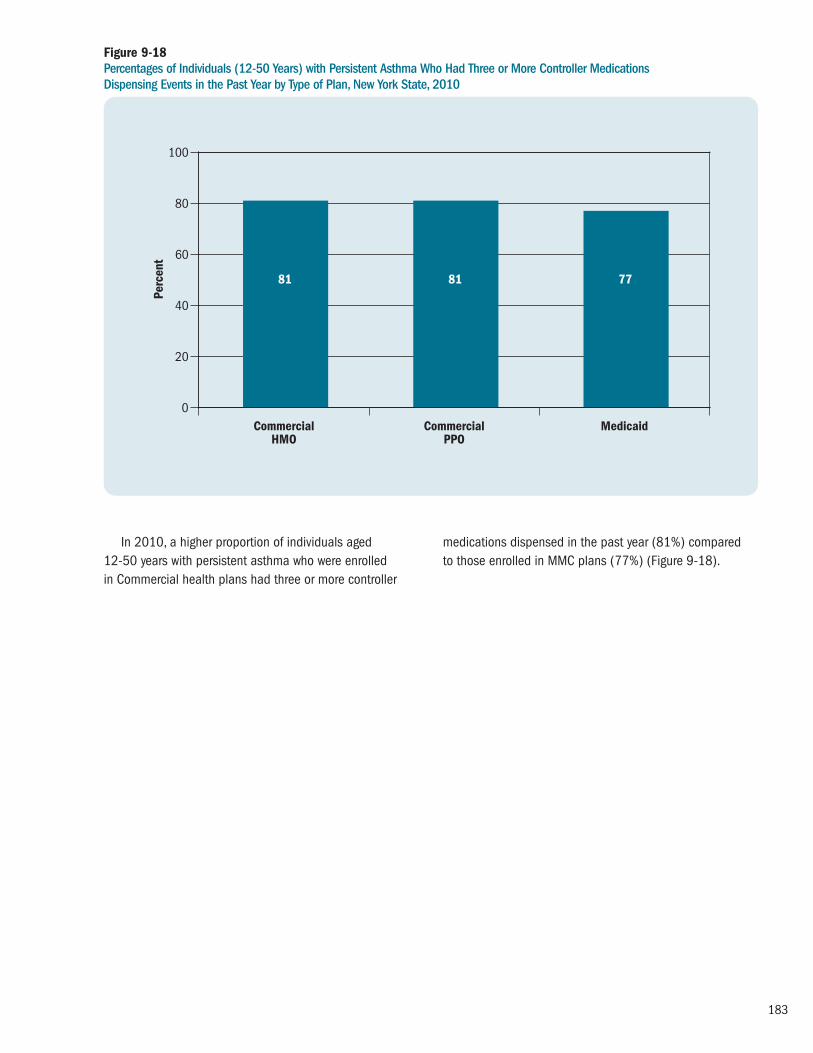
183
Figure 9-18Percentages of Individuals (12-50 Years) with Persistent Asthma Who Had Three or More Controller Medications Dispensing Events in the Past Year by Type of Plan, New York State, 2010
In 2010, a higher proportion of individuals aged 12-50 years with persistent asthma who were enrolled in Commercial health plans had three or more controller
medications dispensed in the past year (81%) compared to those enrolled in MMC plans (77%) (Figure 9-18).
CommercialHMO
CommercialPPO
Medicaid0
40
60
80
100Pe
rcen
t
20
81 81 77

184
Figure 9-19Percentages of Children* (5-11 Years) with Persistent Asthma Who Had Three or More Controller Medication Dispensing Events in the Past Year by County, New York State, 2010
In 2010, among children aged 5-11 years withpersistent asthma, there was variation by county regardinguse of appropriate medications to control their asthma as defined by having three or more asthma controllermedications dispensed during the past year. Oswego and
Sullivan counties had the highest percentage of children(85% and above) who had three or more controller medi -cation dispensing events in the past year while children inOrleans and Genesee counties had the lowest percentages(less than 70%) (Figure 9-19).
*These results represent children in Medicaid managed care and Child Health Plus combined. The child’s county of residence was used for this analysis. For areas in NYC, neighborhoods were used instead of counties for more localized results.
Counties are Shaded Based on Quartile Distribution
Insufficient dataLess than 70%70%-74%75%-79%80% and above
New York City by Neighborhood

185
Prevention Quality Indicators and Pediatric Quality Indicators for the Medicaid Managed Care Asthma Universe Population
Methodology
The Agency for Healthcare Research and Quality (AHRQ) has created a set of Quality Indicators (QIs) that usehospital inpatient discharge data to assess the quality of asthma care as well as other conditions (see:www.qualityindicators.ahrq.gov/). QIs are grouped into two modules: Prevention Quality Indicators (PQIs) andPediatric Quality Indicators (PDIs).
Even though these indicators are based on hospitalinpatient data, they provide insights about the communityhealth care system or services outside the hospital setting.For example, patients with asthma may be hospitalized forasthma complications if their conditions are not adequatelymonitored or if they do not receive the patient educationneeded for appropriate self-management.
The PQIs/PDIs can be used as a “screening tool” to help flag potential health care quality problem areas thatneed further investigation and provide a quick check onprimary care access or outpatient services in a communityby using patient data found in a typical hospital dischargeabstract. The information can also help public healthagencies, State data organizations, health care systems and others interested in improving health care quality in their communities.
The receipt of high-quality, community-based primarycare can often prevent hospitalizations for these illnesses.Admittedly, other factors outside the direct control of thehealth care system, such as poor environmental conditionsor lack of patient adherence to treatmentrecommendations, can result in hospitalization. However, the PQIs/PDIs provide a good starting point for assessingquality of health services in the community.
Two adult asthma-related PQI measures and one childasthma-related PDI measure were generated for the NYSMMC asthma universe population aged 2-64 years, whowere continuously enrolled in a MMC health plan (HealthMaintenance Organization [HMO] or Prepaid Health ServicesPlan [PHSP]) for 24 or more months as of December 2010.
The QI rates are presented for the total population, andstratified by gender, race/ethnicity, and geographic region
(New York City and Rest of State). Because the PQIs/PDIsestimate the number of potentially avoidable hospitaladmissions, a lower rate is desirable.
Hospital inpatient discharge data from 2010 were usedto calculate the following three measures:
Pediatric Quality Indicator #14 – Asthma Admission Rate
� Numerator: All discharges of children aged 2-17 yearswith ICD-9-CM principal diagnosis code of asthma.
� Denominator: All discharges ages 2-17 years for theasthma universe population, excluding transfers into thehospital, discharges for MDC 14 (pregnancy, childbirthand puerperium), or any discharge with a diagnosis codefor cystic fibrosis or anomalies of the respiratory system.
Prevention Quality Indicator #15 – Asthma in Younger AdultsAdmission Rate
� Numerator: All discharges of adults aged 18-39 yearswith ICD-9-CM principal diagnosis code of asthma.
� Denominator: All discharges of adults aged 18-39 yearsfor the asthma universe population, excluding transfersinto the hospital, discharges for MDC 14 (pregnancy,childbirth and puerperium), or any discharge with adiagnosis code for cystic fibrosis or anomalies of therespiratory system.
Prevention Quality Indicator #5 – Chronic ObstructivePulmonary Disease (COPD) or Asthma in Older AdultsAdmission Rate
� Numerator: All discharges of adults aged 40 years andolder with ICD-9-CM principal diagnosis code for COPD or asthma.
� Denominator: All discharges of adults aged 40 years and older for the asthma universe population, excludingtransfers into the hospital or discharges for MDC 14(pregnancy, childbirth and puerperium).

186
In 2010, among the asthma universe population aged 2-17 years, 44.2% of asthma hospital admissions in NYScould potentially have been avoided through more effectiveoutpatient care. Preventable asthma hospital admissionswere nearly two times higher for children (0-17 years) thanadults (18-39 and 40+ years) (Table 9-38, 9-39 and 9-40).
Among the asthma universe population aged 2-17 years, the percentage of asthma hospital admissions thatwere potentially avoidable was higher for boys (45.5 %)than girls (42.1%).
Among the asthma universe population aged 2-17 years, non-Hispanic black (49.5 %) and Hispanic (44.3 %)children had the highest percentage of asthma hospitaladmissions that were potentially avoidable; non-Hispanicwhite (28.6 %) children had the lowest percentage.
Among the asthma universe population aged 2-17 years, the percentage of asthma hospital admissions thatwere potentially avoidable was higher for New York Cityresidents (46.0 %) than those living in the Rest of State(36.7 %) (Table 9-38).
Table 9-38 Preventable Hospital Admissions for Asthma Among Medicaid Managed Care Asthma Universe Population, Children (2-17 Years), New York State, 2010
**Excludes enrollees with missing race/ethnicity.
**Non-Hispanic Other race included American Indian/Alaskan Native, Asian, and Pacific Islander.
Prevention Asthma Asthma Quality Indicator Hospitalizations Universe Rate per 100
Gender Male 1,093 2,403 45.5
Female 638 1,515 42.1
Non-Hispanic White 99 346 28.6
Non-Hispanic Black 676 1,367 49.5
Race/Ethnicity* Non-Hispanic Other** 132 336 39.3
Hispanic 808 1,822 44.3
New York City 1,452 3,158 46.0
Region Rest of State 279 760 36.7
NYS Total 1,731 3,918 44.2

187
In 2010, among the asthma universe population aged18-39 years, 22.5% of asthma hospital admissions in NYScould potentially have been avoided through more effectiveoutpatient care.
Among the asthma universe population aged 18-39years, the percentage of asthma hospital admissions thatwere potentially avoidable was higher for females (23.0%)than males (20.7%).
Among the asthma universe population aged 18-39years, the percentage of asthma hospital admissions that
were potentially avoidable was two times higher for Hispanic(26.8 %) and non-Hispanic black adults (26.0%) whencompared to non-Hispanic white (12.9%) adults.
Among the asthma universe population aged 18-39years, the percentage of asthma hospital admissions thatwere potentially avoidable was higher for New York Cityresidents (25.7%) than those living in the Rest of State(15.8%) (Table 9-39).
Table 9-39 Preventable Hospital Admissions for Asthma Among Medicaid Managed Care Asthma Universe Population, Adults (18-39 Years), New York State, 2010
**Excludes enrollees with missing race/ethnicity.
**Non-Hispanic Other race included American Indian/Alaskan Native, Asian, and Pacific Islander.
Prevention Asthma Asthma Quality Indicator Hospitalizations Universe Rate per 100
Gender Male 97 468 20.7
Female 397 1,726 23.0
Race/Ethnicity* Non-Hispanic White 65 505 12.9
Non-Hispanic Black 179 688 26.0
Non-Hispanic Other** 28 160 17.5
Hispanic 219 818 26.8
Region New York City 382 1,486 25.7
Rest of State 112 708 15.8
NYS Total 494 2,194 22.5

188
In 2010, among the asthma universe population aged40 years and older, 23.7% of asthma hospital admissionsin NYS could potentially have been avoided through moreeffective outpatient care.
Among the asthma universe population aged 40 yearsand older, the percentage of asthma hospital admissionsthat were potentially avoidable was higher for females(24.3%) than males (22.1%).
Among the asthma universe population aged 40 yearsand older, non-Hispanic black (24.9%) and Hispanic
(24.8%) adults had the highest percentage of asthmahospital admissions that were potentially avoidable; non-Hispanic white (20.1%) adults had the lowest percentage.
Among the asthma universe population aged 40 yearsand older, the percentage of asthma hospital admissionsthat were potentially avoidable was higher for New York Cityresidents (24.9%) than those living in the Rest of State(20.7%) (Table 9-40).
Table 9-40 Preventable Hospital Admission Rate for Chronic Obstructive Pulmonary Disease/Asthma, Medicaid Managed Care Asthma Universe Population, Older Adults (40+ Years), New York State, 2010
**Excludes enrollees with missing race/ethnicity.
**Non-Hispanic Other race included American Indian/Alaskan Native, Asian, and Pacific Islander.
Prevention Asthma Asthma Quality Indicator Hospitalizations Universe Rate per 100
Gender Male 561 2,538 22.1
Female 1,895 7,808 24.3
Non-Hispanic White 448 2,225 20.1
Non-Hispanic Black 755 3,032 24.9
Race/Ethnicity* Non-Hispanic Other** 158 685 23.1
Hispanic 1,026 4,133 24.8
New York City 1,866 7,502 24.9
Region Rest of State 590 2,844 20.7
NYS Total 2,456 10,346 23.7

189
Work-related asthma (WRA) is a term used to describeasthma that has a temporal association between asthmasymptoms and the work environment.23, 24 It can be a newcondition or it can be work-aggravated asthma. It has beenestimated that approximately 36% to 48% of adult asthmais caused or made worse by workplace exposures, whichtranslates to approximately 8.6 million adults in the UnitedStates.25-27 However, work-related asthma continues to beunderdiagnosed. Diagnosis of WRA is complicated by thedifficulty in distinguishing it from non-WRA. Physicians must be willing and able to recognize and document theworkplace exposures contributing to asthma, which involvestaking occupational histories and asking questions todetermine a temporal association between asthma andwork. It is important that physicians consider the possibilityof workplace exposure when treating an adult patient
with either adult-onset asthma or worsening of currentasthma. While the process may be complex, there isguidance available for physicians in the diagnosis andmanagement of WRA.28
If diagnosed early, the workers’ prognosis can improve if exposures can be identified and properly stopped orcontrolled.24 There have been more than 350 substancesidentified as causing asthma or making asthma worse bytriggering symptoms. The most effective approach is toidentify the substances causing the asthma or triggering the asthma symptoms, and to avoid or modify exposure.This can be accomplished by eliminating use of the sub -stance and substituting safer materials whenever possible. If this is not possible, engineering controls should be usedsuch as ventilation, or use of personal protective equipmentsuch as respirators, gloves, and goggles.
Highlights: Work-Related Asthma
Work-Related Asthma Emergency Department Visits
� The number of work-related asthma emergencydepartment visits showed a 24% increase from 240in 2005 to 297 in 2010 with a peak at 304 in 2006.
Work-Related Asthma Hospital Discharges
� For 2001 to 2010, the number of work-relatedasthma hospitalizations among NYS residentsdecreased approximately 26% from 74 to 55 with a peak at 90 in 2003.
� Over the last 10 years, the length of stay for a work-related asthma hospitalization ranged from 3.7 to 4.5 days, with a mean of 3.9 days.
� The average cost for a work-related asthmahospitalization was more than 2.5 times higher in 2010 ($19,729) than in 2001 ($7,410).
� In 2010, the total cost of work-related asthmahospitalizations in New York State exceeded $1 million.
Work-Related Asthma Incidence
New York State Occupational Health Clinic Network
� The number of definite or possible work-relatedasthma patients seen by the New York StateOccupational Health Clinic Network in the past 10 years, by year of first visit, ranged from 78 in 2010 to 329 in 2004.
New York State Occupational Lung Disease Registry
� The number of work-related asthma cases reportedto the New York State Occupational Lung DiseaseRegistry during 2001 to 2008, by year of first report,ranged from 51 in 2008 to 157 in 2005.
Work-Related Asthma
10

190
Work-Related Asthma Emergency Department Visits
Methodology
Asthma emergency department (ED) visit information fromthe Statewide Planning and Research Cooperative System(SPARCS) was reviewed for years 2005 to 2010 to identifyED visits related to WRA. These data were generated fromtwo mutually exclusive databases within SPARCS: theHospital Inpatient Database and the Outpatient Database.
The SPARCS Hospital Inpatient Database collectsinformation on all hospital discharges from acute care andrehabilitation hospitals in NYS. The database includesrecords for patients who are admitted to the hospital directlyfrom the ED and for those who are hospitalized without first utilizing the ED. It is possible that the same patient maybe hospitalized for asthma multiple times and, as a result,could be counted more than once in these data.
The SPARCS Outpatient Database contains informationon ED visits for patients who visited the ED but were nothospitalized. The ED data reporting began on a voluntarybasis in September 2003, and was mandated beginning in January 2005.
For the SPARCS Hospital Inpatient Database, a WRA ED visit was defined as having been admitted to the hospitaldirectly from the ED and having a discharge diag nosis withan International Classification of Diseases, 9th Revision,Clinical Modification (ICD-9-CM) code of 493 as well as the expected principal reimbursement or the primary sourceof payment code of Workers’ Compensation.
For the SPARCS Outpatient Database, a WRA ED visitwas defined as having a principal diagnosis with an ICD-9-CM code of 493 and the expected principalreimbursement or the primary source of payment code of Workers’ Compensation.
The majority of individuals with work-related illnesses do not file for Workers’ Compensation. Additionally, self-employed individuals such as farmers, independentcontractors, federal employees, and railroad, longshore and maritime workers are not covered by state Workers’Compensation systems. Therefore, the data are consideredto be an under-representation of the actual number ofindividuals visiting an ED with WRA.

191
Figure 10-1Annual Work-Related Asthma Emergency Department Visits, New York State, 2005-2010
The number of annual WRA emergency department visits among NYS residents increased approximately 24%
from 240 in 2005 to 297 in 2010 with a peak at 304 in 2006 (Figure 10-1).
2005 2006 20070
50
100
150
200
250
300
350As
thm
a ED
Vis
its
2008 2009 2010
2005 2006 2007 2008 2009 2010
Asthma ED Visits 240 304 261 287 277 297

192
Work-Related Asthma Hospital Discharges
Methodology
Hospital discharge information from the Statewide Planningand Research Cooperative System (SPARCS) was reviewedfor years 2001 through 2010 to identify hospitalizationsrelated to WRA.
A WRA hospital discharge was defined as having aprincipal diagnosis with an International Classification of Diseases, 9th Revision, Clinical Modification (ICD-9-CM)code of 493 and the expected principal reimbursement or the primary source of payment code of Workers’Compensation. It is possible that the same patient may
be hospitalized for asthma multiple times and, as a result,could be counted more than once in these data.
The majority of individuals with work-related illnesses do not file for Workers’ Compensation. Additionally, self-employed individuals such as farmers, independentcontractors, federal employees, and railroad, long shore and maritime workers are not covered by state Workers’Compensation systems. Therefore, the data are consideredan under-representation of the actual number of individualshospitalized with WRA.

193
Figure 10-2Annual Work-Related Asthma Hospital Discharges, New York State, 2001-2010
From 2001 to 2010, the number of annual WRAhospitalizations among NYS residents decreased
approximately 26% from 74 to 55 with a peak at 90 in 2003 (Figure 10-2).
2008 201020092001 2002 2003 2004 2005 2006 20070
20
10
30
40
50
60
70
100As
thm
a H
ospi
tal D
isch
arge
s 80
90
2001 2002 2003 2004 2005 2006 2007 2008 2009 2010
Asthma Hospital Discharges 74 81 90 60 61 82 55 41 47 55
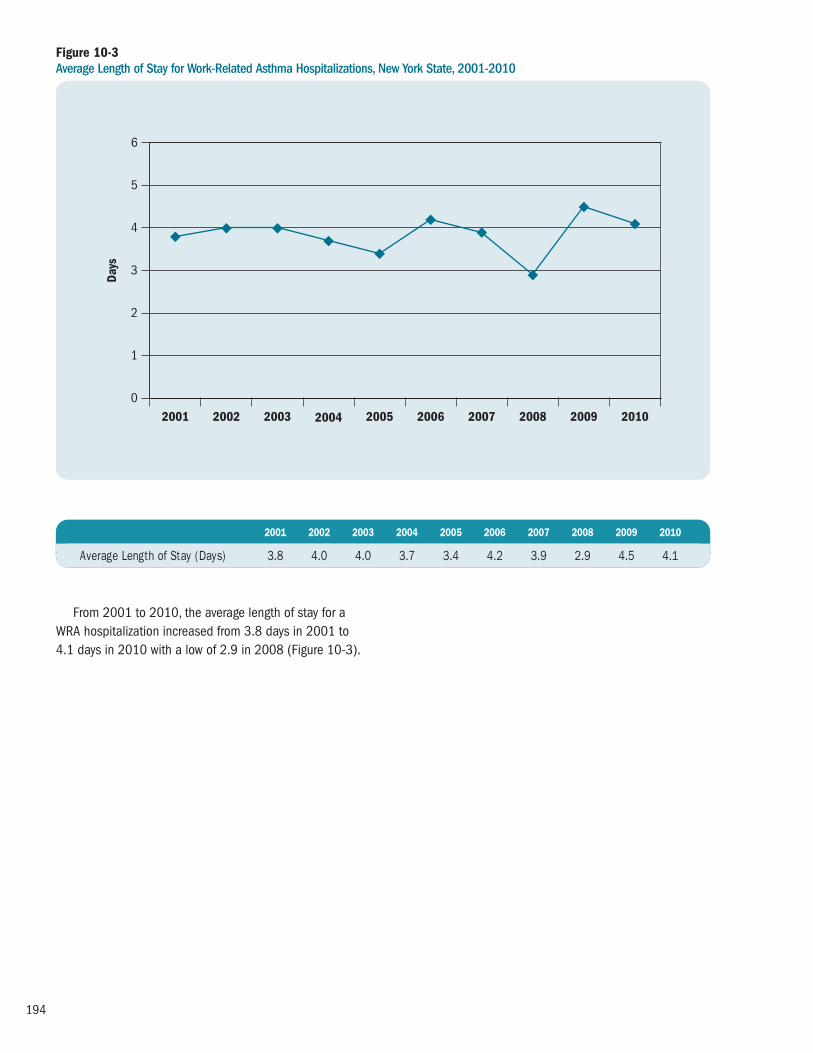
194
Figure 10-3Average Length of Stay for Work-Related Asthma Hospitalizations, New York State, 2001-2010
From 2001 to 2010, the average length of stay for aWRA hospitalization increased from 3.8 days in 2001 to 4.1 days in 2010 with a low of 2.9 in 2008 (Figure 10-3).
2008 201020092001 2002 2003 2004 2005 2006 20070
1
2
3
4
5
6
Days
2001 2002 2003 2004 2005 2006 2007 2008 2009 2010
Average Length of Stay (Days) 3.8 4.0 4.0 3.7 3.4 4.2 3.9 2.9 4.5 4.1

195
Figure 10-4Average Cost of Work-Related Asthma Hospitalizations, New York State, 2001-2010
The average cost of a WRA hospitalization increased166%, from $7,410 in 2001 to $19,729 in 2010.
Because the average cost for a WRA hospitalization wasnot adjusted for inflation, comparisons across years shouldbe made with caution (Figure 10-4).
2008 201020092001 2002 2003 2004 2005 2006 2007$0
$10,000
$8,000
$12,000
$14,000
$16,000
$18,000
$20,000
$22,000Av
erag
e Co
st
$6,000
$4,000
$2,000
2001 2002 2003 2004 2005 2006 2007 2008 2009 2010
Average Cost $7,410 $10,001 $12,151 $10,794 $11,834 $14,710 $13,295 $11,488 $17,253 $19,729
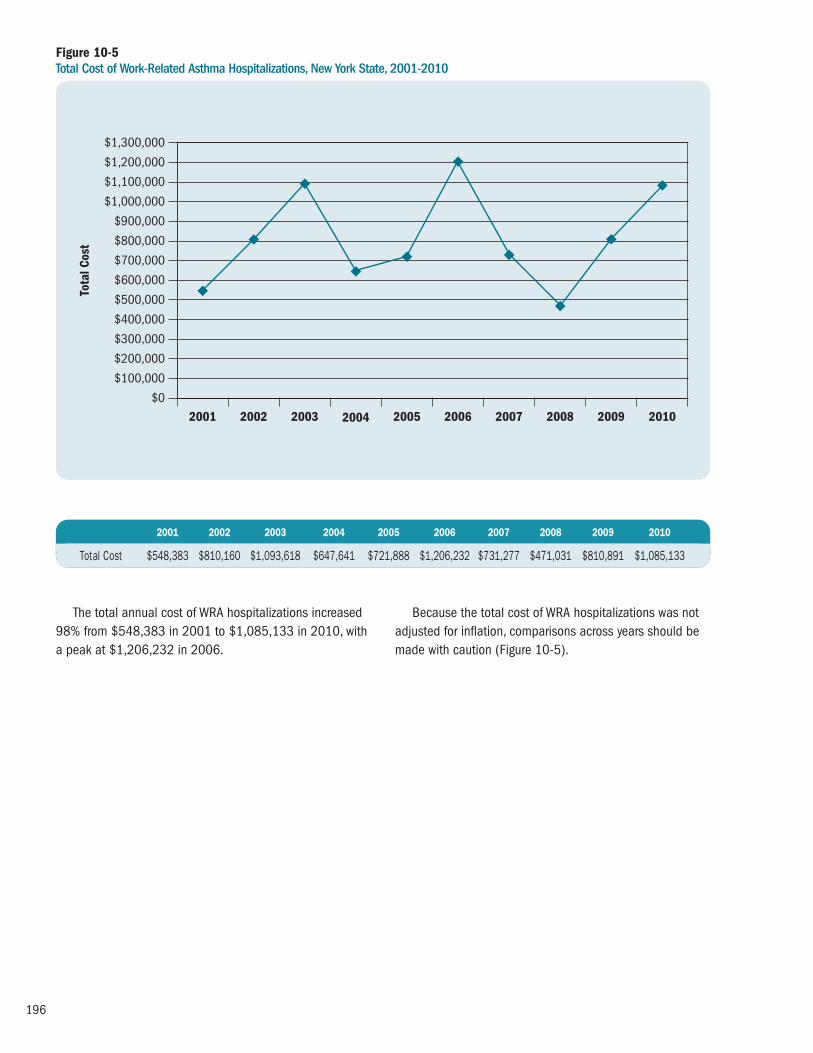
196
Figure 10-5Total Cost of Work-Related Asthma Hospitalizations, New York State, 2001-2010
The total annual cost of WRA hospitalizations increased98% from $548,383 in 2001 to $1,085,133 in 2010, witha peak at $1,206,232 in 2006.
Because the total cost of WRA hospitalizations was notadjusted for inflation, comparisons across years should bemade with caution (Figure 10-5).
2008 201020092001 2002 2003 2004 2005 2006 2007$0
$700,000
$600,000
$800,000
$900,000
$1,000,000
$1,100,000
$1,200,000
$1,300,000
Tota
l Cos
t
$500,000
$400,000
$300,000
$200,000
$100,000
2001 2002 2003 2004 2005 2006 2007 2008 2009 2010
Total Cost $548,383 $810,160 $1,093,618 $647,641 $721,888 $1,206,232 $731,277 $471,031 $810,891 $1,085,133

197
Work-Related Asthma Incidence – New York State Occupational Health Clinic Network
Methodology
The NYS Occupational Health Clinic Network (OHCN) is the nation’s only state-based occupational health clinicnetwork that includes a clinic specializing in farm workerhealth and safety. Each clinic is run independently withpartial funding from the State. The clinics are mandated to:provide an objective diagnosis of suspected work-relatedmedical problems; conduct medical screenings for groupsof workers who are at increased risk of occupational illness;make referrals for treatment to other medical specialists, ifnecessary; perform industrial hygiene evaluations of work -places of concern; and provide education and preventionprograms. In aggregate, the clinics see approximately 5,000workers each year from hundreds of workplaces. All theclinics use the same patient data software. Patient data are collected and maintained in a central database in the NYSDOH Bureau of Occupational Health.
A WRA case was defined if the patient record had adiagnosis of asthma that was determined to be definitely or possibly work-related according to the clinician. Each clinicindependently determined whether the visit was related to the World Trade Center (WTC) disaster. Many of the WTCpatients are being seen in specialty clinics that are not a partof the OHCN, and therefore are not reflected in this database.This report presents the number of cases seen in the clinicsfor 2001 to 2010 by year of the patient’s first visit.
It is recognized that clinic-based reporting suffers fromproblems with referral bias (i.e., individuals with a particularexposure or adverse health outcome are more likely tochoose certain physicians or health clinics than those whoare not similarly affected. Therefore, it is unknown whetherthe patients seen by the clinic network are representative of the state’s employed population.

198
Figure 10-6Number of Work-Related Asthma Patients Seen by the New York State Occupational Health Clinic Network, by Year of First Visit, 2001-2010
The number of patients with a diagnosis of asthma thatwas definitely or possibly associated with their work environ -ment who were seen by the NYS OHCN, by year of first visit,decreased 42% from 134 in 2001 to 78 in 2010, with a
peak of 329 in 2004. The large increase in the number ofpatients seen for the first time, between 2002 and 2004,resulted from the World Trade Center disaster (Figure 10-6).
2008 201020092001 2002 2003 2004 2005 2006 20070
50
100
150
200
250
Num
ber o
f Pat
ient
s
Patients (WTC*) Patients (Non-WTC**)
2001 2002 2003 2004 2005 2006 2007 2008 2009 2010
Patients (WTC*) 24 154 202 219 49 30 42 41 24 22
Patients (Non-WTC**) 110 116 86 110 96 92 85 73 59 56
Total Patients 134 270 288 329 145 122 127 114 83 78
**Patients whose asthma resulted from the World Trade Center disaster.
**Patients whose asthma did not result from the World Trade Center disaster.

199
Work-Related Asthma Incidence – New York State Occupational Lung Disease Registry
Methodology
The New York State Occupational Lung Disease Registry(OLDR) was established in 1981 to assist with the reductionof the morbidity and mortality of New York residents due toexposure to respirable toxic materials in the work environ ment.All physicians, health facilities and laboratories are required to report all cases of occupational lung disease to NYSDOH.
This section provides the number of work-related asthmapatients reported to the OLDR by year of first report for2001 to 2010. These patients may also have been countedas hospital discharges or NYS OHCN visits.
The data represents reports of work-related asthma in the OLDR and is not a complete accounting of alloccurrences of work-related asthma in New York State.Work-related asthma is under reported for several reasonsincluding 1) individuals not recognizing the workplace
exposures causing or contributing to their asthma; 2) healthcare providers not making a distinction between WRA andnon-WRA and 3) health care providers’ failure to reportpatients to public health authorities.
In 2010, NYSDOH received a grant from the NationalInstitute of Occupational Safety and Health to supportsurveillance of work-related asthma. As part of this grant,cases of suspected work-related asthma reported to the OLDR are confirmed by medical record review andpatient follow-up. In addition, more active case ascertain -ment activities were initiated. This endeavor began with 2009 cases, and only data on confirmed cases areincluded from 2009 forward. There are additional reportswhere case confirmation could not occur. Data from 2009forward should not be compared to data from prior years.

200
Figure 10-7Number of Suspected or Confirmed Work-Related Asthma Patients Reported to the New York State Occupational Lung Disease Registry by Year of First Report, 2001-2010
The number of WRA patients reported to the OLDRdecreased 25% from 68 in 2001 to 51 in 2008, with a peak at 157 in 2005. Thirty-six percent of the casesreported to the OLDR from 2002 to 2008 have resulted
from the World Trade Center disaster. The number of WRApatients reported to the OLDR was 167 in 2009 and 161 in 2010 (Figure 10-7).
2008 2010***2009***2001 2002 2003 2004 2005 2006 20070
40
60
80
100
160
Num
ber o
f Pat
ient
s
Patients (WTC*) Patients (Non-WTC**)
20
120
140
2001 2002 2003 2004 2005 2006 2007 2008 2009*** 2010***
Patients (WTC*) 0 8 63 20 80 70 28 7 21 21
Patients (Non-WTC**) 68 44 54 97 77 62 45 44 146 140
Total Patients 68 52 117 117 157 132 73 51 167 161
***Patients whose asthma resulted from the World Trade Center disaster.
***Patients whose asthma did not result from the World Trade Center disaster.
***It is not appropriate to make comparisons of 2009 and 2010 data to data from prior years because of the methodology differences for case ascertainment.

201
Highlights: Asthma Costs
Asthma Hospitalization Costs
� The total cost of asthma hospitalizations in New YorkState for 2011 was approximately $660 million, a61% increase in the cost since 2002 ($409 million).The Consumer Price Index-adjusted asthma hospital -ization cost increased 19% from the 2002 adjustedcost of $556 million.
� The average cost per asthma hospitalization increased78% from $10,080 in 2002 to $17,954 in 2011. The average adjusted asthma hospitalization costincreased 27% over this time period. This occurreddespite the average length of stay for an asthmahospitalization decreasing 5% from 3.8 days to 3.6days for the same time period.
� The average cost per asthma hospitalization increasedwith age. The 2011 average costs ranged from $10,308for the 0-4 year age group to $26,459 for those aged65 years and older.
� Females had consistently higher average asthmahospitalization costs compared to males throughout2002 to 2011. Females had a 2011 average cost of $19,611 compared to $15,371 for their malecounterparts.
� Residents of New York City had consistently higheraverage costs per asthma hospitalization thanresidents from the Rest of State from 2002 to 2010.However, in 2011, Rest of State residents had ahigher average cost of $18,670 compared to thoseliving in New York City ($17,556).
� Medicare had the highest average cost of $25,227among all sources of payment for 2011 asthmahospitalizations. This was followed by other third partyor private insurance ($16,725), Medicaid ($14,633),and self-pay ($11,382).
� For 2009-2011, Medicaid accounted for 41% of the total asthma hospitalizations and incurred35% of the total asthma hospitalization costs.Medicare accounted for 26% of the total asthmahospitalizations and incurred 37% of the totalasthma hospitalization costs.
Asthma Medicaid Managed Care Costs
� An estimated total of more than $276 million was spent on more than 249,350 asthma universeindividuals for asthma-related services in 2010 (anaverage cost of $1,109 per enrollee). This accountedfor 14% of the Medicaid managed care dollars for all health care services ($2 billion) that were spenton the asthma universe population.
� In 2010, hospitalizations comprised 19% of the totalasthma-related costs, with an average cost of $6,866per hospitalization and $8,677 per enrollee amongthe asthma universe population. Pharmacy costscomprised 64% of the total costs, with an average of $102 per claim and $817 per enrollee.
� An average of $1,109 was spent per asthma patientamong the Medicaid managed care population in2010. The average asthma-related service cost washighest for patients aged 51-64 ($1,864) and lowestfor patients aged 5-11 ($901).
� The average asthma-related service cost was highest for female patients ($1,159) than for malepatients ($1,044).
� The average asthma-related service cost among the MMC asthma universe population was highest for non-Hispanic black and Hispanic patients($1,187 and $1,182, respectively) and lowest for non-Hispanic other patients ($955).
Asthma Costs
11

202
� The average asthma-related service cost among theMMC asthma universe population was highest forpatients who reside in New York City ($1,191) thanfor patients who live in the Rest of State ($924).
� New York City accounted for 74% of the total New York State Medicaid managed care asthma-related costs while serving 69% of the asthmauniverse population.
� For 2010, about 69% of Medicaid managed careasthma-related costs were spent on pharmacy in the Rest of State and 62% of the asthma-relatedcosts were spent on pharmacy in New York City. The proportion of cost due to asthma hospitalizationswas more than 1.5 times higher for New York Citycompared to the Rest of State.
Asthma Hospitalization Costs
Methodology
Asthma hospitalization cost information was generated fromthe Statewide Planning and Research Cooperative System(SPARCS) database. The cost information from SPARCSrepresents billing data that were submitted by hospitals inNew York State (NYS). An asthma hospitalization was definedas having a principal diagnosis with an International Classi -fication of Diseases, 9th Revision, Clinical Modification(ICD-9-CM) code of 493.
The total asthma hospitalization costs included theaccommodation charge and the ancillary charge for allpatients hospitalized within a given year. The accommodationcharge is defined as the accommodation rate charged perday for a specific type of accommodation multiplied by thelength of stay in days. The rate charged per day depends on type of room (e.g., private, semi-private or within a ward),type of care (e.g., general, medical, rehabilitation, etc.) andlevel of care. The ancillary charge is the sum of all ancillarycosts, such as nursing, pharmacy, laboratory, respiratorytherapy, pulmonary function, etc.
The crude and Consumer Price Index (CPI)-adjustedasthma hospitalization costs and average asthma hospital -ization costs were calculated. Adjusted asthma hospitaliza tioncosts were calculated using the 2011 CPI29 to adjust forinflation (see Appendix 2).
This report provides 10-year trends from 2002 to 2011 for asthma hospitalization cost information: total cost, averagecost per asthma hospitalization, and average length of stay per hospitalization. The trends for average cost infor mationwere generated by age group, gender, source of payment and geographic region (New York City and Rest of State).
Pie charts that compare the number of asthma hospital -izations to the cost incurred for NYS residents for 2009-2011are presented by age group, gender, source of payment and geographic region (New York City and Rest of State).
The SPARCS database reflects billing information;therefore the hospitalization costs may overestimate theactual costs that are reimbursed.

203
There were increasing trends for both the crude andadjusted total cost of asthma hospitalizations from 2002 to 2011. The crude total cost of asthma hospitalizationsincreased 61% from $409 million in 2002 to $660 million
in 2011. The adjusted total cost of asthma hospitalizationsincreased 19% from $556 million in 2002 to $660 millionin 2011 (Figure11-1).
Figure 11-1Total Crude and Adjusted* Cost of Asthma Hospitalizations, New York State, 2002-2011
2008 20102009 20112002 2003 2004 2005 2006 20070
$200
$100
$300
$400
$500
$600
$800
Tota
l Cos
t (M
illio
ns)
Unadjusted Cost Adjusted Cost
$700
2002 2003 2004 2005 2006 2007 2008 2009 2010 2011
Total Cost (Millions) $409 $509 $490 $493 $515 $523 $597 $652 $620 $660
Adjusted Total Cost (Millions) $556 $665 $614 $593 $595 $579 $637 $674 $639 $660
*Cost-adjusted using the 2011 Consumer Price Index.

204
Increasing trends for both crude and adjusted averagecost per asthma hospitalization were seen from 2002 to 2011. The average cost per asthma hospitalizationincreased 78% from $10,080 in 2002 to $17,954 in
2011. The adjusted average cost per asthma hospitalizationincreased 27% from $14,127 in 2002 to $17,954 in 2011(Figure 11-2).
Figure 11-2Average Crude and Adjusted* Cost per Asthma Hospitalization, New York State, 2002-2011
2008 20102009 20112002 2003 2004 2005 2006 2007$0
$6,000
$4,000
$2,000
$8,000
$10,000
$12,000
$16,000
$20,000
$14,000
$18,000
Aver
age
Cost
Unadjusted Cost Adjusted Cost
2002 2003 2004 2005 2006 2007 2008 2009 2010 2011
Average Cost (Thousands) $10,080 $11,147 $11,678 $12,665 $13,131 $13,993 $15,194 $15,508 $16,580 $17,954
Adjusted Average Cost (Thousands) $14,127 $15,017 $15,073 $15,685 $15,633 $15,954 $16,704 $16,526 $17,085 $17,954
*Cost-adjusted using the 2011 Consumer Price Index.

205
For 2002 to 2011, the average length of stay for an asthma hospitalization decreased 5% from 3.8 days in 2002 to 3.6 days in 2011 (Figure11-3).
Figure 11-3Average Length of Stay for Asthma Hospitalizations, New York State, 2002-2011
2008 20102009 20112002 2003 2004 2005 2006 20070
1
2
3
4
5Da
ys
2002 2003 2004 2005 2006 2007 2008 2009 2010 2011
Average Length of Stay (Days) 3.8 3.7 3.7 3.6 3.5 3.5 3.6 3.5 3.6 3.6

206
Figure 11-4 Average Cost per Asthma Hospitalization by Age Group, New York State, 2002-2011
2008 20102009 20112002 2003 2004 2005 2006 20070
$5,000
$10,000
$15,000
$20,000
$30,000
Aver
age
Cost
0–4 5–14 15–24 25–44 45–64 65+
$25,000
Average cost per asthma hospitalization for all agegroups increased between 2002 and 2011 with theincreases being greatest among older age groups. In addition, the average cost per asthma hospitalization
Age Group 2002 2003 2004 2005 2006 2007 2008 2009 2010 2011
0–4 $ 6,293 $ 6,848 $ 7,105 $ 7,470 $ 7,873 $ 8,343 $ 8,777 $ 9,486 $ 9,863 $10,308
5–14 $ 7,008 $ 7,697 $ 7,820 $ 8,503 $ 9,239 $ 9,703 $10,558 $11,232 $11,423 $12,448
15–24 $ 7,910 $ 8,732 $ 8,524 $ 8,991 $ 9,886 $10,633 $11,147 $11,532 $11,792 $13,121
25–44 $ 9,385 $10,389 $10,502 $10,993 $11,655 $12,333 $12,945 $13,583 $14,258 $15,061
45–64 $12,542 $13,719 $14,037 $15,087 $15,320 $15,945 $17,172 $17,691 $18,780 $20,053
65+ $15,935 $17,914 $18,955 $20,030 $20,484 $21,562 $23,127 $23,198 $24,212 $26,459
increased with age in any given year. In 2011, the averagecost for those aged 0-4 years was $10,308; the 65 yearand older age group had an average cost of $26,459(Figure 11-4).

207
Figure 11-5 Comparison of Number of Asthma Hospitalizations to Cost Incurred by Age Group, New York State, 2009-2011
For 2009-2011, asthma hospital discharges for the 0-4 year age group comprised 17% of all discharges, yetcontributed only 10% to the total cost. Conversely, the 65
and older age group comprised 22% of the hospitalizations,yet accounted for 32% of the total cost (Figure 11-5).
Total Asthma Hospitalizations by Age Group, New York State, 2009–2011
Total Asthma Hospitalization Cost by Age Group, New York State, 2009–2011
Age 65+(N=25,282)
22%
Age 25-44(N=18,118)14%
Age 5-14(N=14,840)13%
Age 45-64(N=33,747)
29%
Age 0-4(N=20,116)17%
Age 15-24(N=6,106)5%
Age 65+($622,629,761)
32%
Age 25-44($229,473,865)12%
Age 5-14($173,212,200)9%
Age 45-64($634,718,838)
33%
Age 0-4($198,249,964)10%
Age 15-24($73,901,847)4%

208
For 2002 to 2011, females had consistently higheraverage asthma hospitalization costs compared to males. In 2011, the average female asthma hospitalization cost
of $19,611 was 28% higher than the male average cost of$15,371 (Figure 11-6).
Figure 11-6 Average Cost per Asthma Hospitalization by Gender, New York State, 2002-2011
2008 20102009 20112002 2003 2004 2005 2006 2007$0
$5,000
$10,000
$15,000
$20,000
$25,000
Aver
age
Cost
Male FemaleJ
Gender 2002 2003 2004 2005 2006 2007 2008 2009 2010 2011
Male $ 8,661 $ 9,599 $10,038 $10,995 $11,416 $12,005 $13,161 $13,678 $14,508 $15,371
Female $11,070 $12,253 $12,833 $13,815 $14,306 $15,343 $16,518 $16,734 $17,939 $19,611

209
Figure 11-7 Comparison of Number of Asthma Hospitalizations to Cost Incurred by Gender, New York State, 2009-2011
For 2009-2011, females comprised 60% of the asthma hospitalizations and incurred 65% of the totalhospitalization costs (Figure 11-7).
Asthma Hospitalizations by Gender, New York State, 2009–2011
Total Asthma Hospitalization Cost by Gender, New York State, 2009–2011
Female(N=70,147)60%
Male(N=46,062)
40%
Female($1,265,494,876)65%
Male($666,691,603)
35%

210
For 2002 through 2010, the average costs per asthmahospitalization were consistently higher for New York City($16,814 in 2010) than the Rest of State ($16,142).
However, in 2011, the average costs per asthmahospitalization were 6% higher for Rest of State residentsthan for those living in New York City (Figure 11-8).
Figure 11-8 Average Cost per Asthma Hospitalization by Region, New York State, 2002-2011
2008 20102009 20112002 2003 2004 2005 2006 2007$0
$8,000
$6,000
$4,000
$2,000
$10,000
$12,000
$16,000
$20,000
$14,000
$18,000
Aver
age
Cost
New York City Rest of StateJ
Region 2002 2003 2004 2005 2006 2007 2008 2009 2010 2011
New York City $10,624 $11,552 $11,962 $12,887 $13,320 $14,117 $15,399 $15,884 $16,814 $17,556
Rest of State $ 8,897 $10,284 $11,093 $12,257 $12,778 $13,748 $14,796 $14,830 $16,142 $18,670

211
Figure 11-9 Comparison of Number of Asthma Hospitalizations to Cost Incurred by Region, New York State, 2009-2011
For 2009-2011, New York City contributed 65% of the total number of asthma hospitalizations and incurred65% of the asthma hospitalization costs (Figure 11-9).
Asthma Hospitalizations by Region, New York State, 2009–2011
Total Asthma Hospitalization Cost by Region, New York State, 2009–2011
Rest of State(N=41,170)35%
New York City(N=77,039)
65%
Rest of State($678,115,581)35%
New York City($1,254,070,898)
65%

212
The average asthma hospitalization costs wereconsistently the highest for the Medicare population.Between 2002 and 2011, the increase in average cost
ranged from 54% for self-pay patients to 93% for other,third party or private patients (Figure 11-10).
Figure 11-10 Average Cost per Asthma Hospitalization by Source of Payment, New York State, 2002-2011
2008 20102009 20112002 2003 2004 2005 2006 2007$0
$15,000
$10,000
$5,000
$20,000
$30,000
Aver
age
Cost
Medicaid Medicare Self-pay Other, Third Party or Private
$25,000
2002 2003 2004 2005 2006 2007 2008 2009 2010 2011
Medicaid $ 9,415 $10,185 $10,097 $10,464 $11,097 $11,957 $13,001 $13,608 $14,392 $14,633
Medicare $15,339 $17,030 $17,950 $19,394 $20,055 $21,137 $22,011 $22,372 $23,704 $25,227
Self-pay $ 7,398 $ 7,554 $ 7,983 $ 8,169 $ 8,201 $ 8,644 $ 9,242 $ 9,446 $ 9,163 $11,382
Other, Third Party or Private $ 8,648 $ 9,884 $10,593 $11,580 $12,041 $12,716 $14,133 $14,420 $15,196 $16,725

213
Figure 11-11 Comparison of Number of Asthma Hospitalizations to Cost Incurred by Source of Payment, New York State, 2009-2011
For 2009-2011, Medicaid accounted for 41% of thetotal asthma hospitalizations and incurred 35% of the totalasthma hospitalization costs. Medicare accounted for
26% of the total asthma hospitalizations and incurred 37% of the total asthma hospitalization costs (Figure 11-11).
Asthma Hospitalizations by Source of Payment, New York State, 2009–2011
Total Asthma Hospitalization Cost by Source of Payment, New York State, 2009–2011
Self-pay(N=9,231)8%
Medicare(N=30,138)26%
Other Third Party or Private(N=29,067)25%
Medicaid(N=47,466)
41%
Self-pay($89,731,008)5%
Medicare($716,633,008)37%
Other Third Party or Private($447,530,896)23%
Medicaid($673,440,672)
35%

214
Asthma Medicaid Managed Care Costs
Methodology
Payment for Medicaid managed care (MMC) services is provided through a combination of capitation payments(See Appendix 1) and fee-for-service claim expenditures.
Services not covered under capitation are paid byMedicaid on a fee-for-service claim basis (e.g., pharmacy*and mental health). Fee-for-service claim data representtrue expenditures.
Services covered under the MMC benefit package and associated costs are reported by managed care plans as encounter records. Reported costs on encounter records are then standardized by the State to estimate the true cost of services provided under the capitated benefit (either as a “proxy cost” of a covered benefit, or as a within plan claim expenditure).
Costs for asthma-related services provided for the asthma universe enrollees (see page 133 for definition of asthma universe) among the MMC population wereestimated by adding the actual expenditures paid onasthma-related claims together with the standardized“proxy” costs for services reported on encounter records for the calendar year 2010 service period.
Encounter records were considered to be asthma-related if they were submitted with a primary diagnosis code of asthma (International Classification of Diseases,9th Revision, Clinical Modification (ICD-9 CM) code of493.XX). Asthma-related pharmacy claims were identifiedusing the National Drug Codes specified in the HEDIS®201022 guidelines indicative of asthma.
All members of the MMC asthma universe populationhad 12 continuous months of enrollment in a MMC health
plan (Health Maintenance Organization [HMO], PrepaidHealth Services Plans [PHSP], Partial Capitation plans) in 2010. Cost information, however, was only included inanalyses if the cost occurred while enrolled for at least onemonth in either and HMO or PHSP. Therefore, people whowere enrolled exclusively in a Partial Capitation plan for theentire 12-month period of 2010 were removed from thedenominator (asthma universe population), and no costsacquired for the enrollment period in a Partial Capitationplan were included.
For the purpose of these cost analyses, services were divided into inpatient/hospitalization, emergencydepartment, outpatient, and pharmacy services. A hier -archical approach was taken to categorize the services. All inpatient records were identified first, followed byemergency department services, pharmacy records andfinally outpatient services. Because all records that were not identified as inpatient, emergency room, or pharmacyfell into outpatient, this category contains additional areasbeyond physician and clinic services, including categoriessuch as case management, community and rehabilitationservices, dentist and dental services and hospice care.
This report provides 2010 estimated MMC costinformation for asthma-related services including: totalcost, average cost per asthma-related service, and averagecost per asthma universe enrollee. The average cost per enrollee was generated by age group, gender, race and ethnicity, and region. The distribution of total costs for asthma-related services was analyzed by geographic region (New York City and Rest of State).
*As of October 1, 2011, pharmacy benefits for Medicaid managed care enrollees were provided by health plans.

215
When interpreting MMC asthma costs, it is important to recognize that the majority of the cost information wasestimated based on Medicaid encounter data for differentservice categories. Also, cost information was generated for enrollees aged 0-64 years.
It was estimated that more than $260 million was spent on more than 233,000 asthma universe individualsfor asthma-related services in 2009 (an average cost of $1,125 per enrollee). This accounted for 16% of the
MMC dollars for all health care services ($1 billion) thatwere spent on the asthma universe population.
In 2010, it was estimated that more than $276 millionwas spent on approximately 249,350 asthma universeindividuals for asthma-related services (an average cost of $1,109 per enrollee). This accounted for 14% of theMMC dollars for all health care services (almost $2 billion)that were spent on the asthma universe population (Table 11-1).
Table 11-1 Medicaid Managed Care Costs for the Asthma Universe* Population, New York State, 2009-2010
Number of Total Cost Percent Asthma-Related Universe Asthma-Related (Asthma-Related and of Total Cost per MemberYear Asthmatics Cost Unrelated Services) Cost per Year
2009 233,367 $262,510,571 $1,683,732,342 16% $1,125
2010 249,350 $276,571,675 $1,929,029,077 14% $1,109
*12 months continuous enrollment.
In 2010, hospitalizations comprised 19% of the totalasthma-related costs, with an average cost of $6,866 perhospitalization and $8,667 per enrollee among the asthma
universe population. Pharmacy costs comprised 64% of the total costs, with an average of $102 per claim and$817 per enrollee (Table 11-2).
Table 11-2 Medicaid Managed Care Total Cost, Average Cost per Service and Average Cost per Enrollee by Type of Asthma-Related Service for the Asthma Universe* Population, New York State, 2010
Average Average Asthma-Related Percent Number of Cost per Number of Cost per Service Total Costs Total Services Service Enrollees Enrollee
Outpatient Visit $ 39,694,849 14.4% 408,517 $ 97 149,810 $ 265
ED Visit $ 6,732,135 2.4% 37,488 $ 180 26,937 $ 250
Hospitalization $ 53,295,721 19.3% 7,762 $6,866 6,149 $8,667
Pharmacy $176,848,970 63.9% 1,727,249 $ 102 216,556 $ 817
*12 months continuous enrollment.

216
There was great variation among age groups in theaverage asthma hospitalization and pharmacy cost perenrollee in the MMC asthma universe population. Theaverage asthma hospitalization costs increased more than49%, from $7,404 in the 0-4 year age group to $11,063 inthe 51-64 year age group. The average asthma pharmacy
costs increased almost three times, from $498 in the 0-4 year age group to $1,433 for adults with asthma aged51-64 years. The average asthma costs per enrollee foroutpatient visits increased with age. The average asthmacosts per enrollee for ED visits also increased slightly as age increased (Table 11-3).
Table 11-3 Medicaid Managed Care Average Asthma-Related Service Cost per Enrollee by Age Group and Type of Asthma-Related Service for the Asthma Universe* Population, New York State, 2010
Asthma-Related Service 0–4 5–11 12–50 51–64
Outpatient Visit $ 249 $ 245 $ 260 $ 355
ED Visit $ 238 $ 235 $ 260 $ 278
Hospitalization $7,404 $7,481 $9,045 $11,063
Pharmacy $ 498 $ 641 $ 803 $ 1,433
*12 months continuous enrollment.
*12 months continuous enrollment.
Overall, an average of $1,109 was spent per asthmauniverse patient among the MMC population in 2010. The
average cost was highest for patients aged 51-64 ($1,846)and lowest for patients aged 5-11 ($901) (Figure 11-12).
Figure 11-12Medicaid Managed Care Average Asthma-Related Service Cost per Enrollee by Age Group for the Asthma Universe* Population, New York State, 2010
0-4 5-11 12-50 51-64 0-64
$0
$1,600
$1,400
$1,200
$1,000
$800
$600
$1,800
$2,000
Aver
age
Cost
Age
$973 $901 $1,104 $1,846 $1,109
$400
$200

217
*12 months continuous enrollment.
Overall, the average asthma-related service cost among the MMC asthma universe population was higher
for female patients ($1,159) than male patients ($1,044)(Figure 11-13).
Figure 11-13Medicaid Managed Care Average Asthma-Related Service Cost per Enrollee by Gender for the Asthma Universe* Population, New York State, 2010
Male Female
$0
$1,000
$800
$600
$400
$200
$1,200
Aver
age
Cost
$1,044 $1,159
Table 11-4 Medicaid Managed Care Average Asthma-Related Service Cost per Enrollee by Gender and Type of Asthma-Related Service for the Asthma Universe* Population, New York State, 2010
Asthma-Related Service Male Female
Outpatient Visit $ 257 $ 272
ED Visit $ 251 $ 249
Hospitalization $8,257 $8,992
Pharmacy $ 749 $ 869
*12 months continuous enrollment.
There was slight variation among gender groups in the average asthma-related service cost per enrollee in the MMC asthma universe population. The average asthmacosts per enrollee among females for outpatient visits($272), hospitalizations ($8,992), and pharmacy costs
($869) were greater than those among males ($257,$8,257, and $869 respectively). The average asthma costsper enrollee for ED visits were similar for male ($251) andfemale enrollees ($249) (Table 11-4).

218
There was variation among racial-ethnic groups in the average asthma-related service cost per enrollee in theMMC asthma universe population. The highest averageasthma costs for outpatient visits ($269), ED visits ($262),
and hospitalization costs ($9,230) were found among non-Hispanic black enrollees in the MMC asthma universepopulation. Average pharmacy costs were highest amongnon-Hispanic white enrollees ($845) (Table 11-5).
Table 11-5 Medicaid Managed Care Average Asthma-Related Service Cost per Enrollee by Race/Ethnicity and Type of Asthma-Related Service for the Asthma Universe* Population, New York State, 2010
Non-Hispanic Non-Hispanic Non-Hispanic Asthma-Related Service White Black Other Hispanic
Outpatient Visit $ 238 $ 269 $ 231 $ 286
ED Visit $ 248 $ 262 $ 232 $ 244
Hospitalization $6,948 $9,230 $8,117 $8,778
Pharmacy $ 845 $ 763 $ 786 $ 836
*12 months continuous enrollment.
*12 months continuous enrollment.
Overall, the average asthma-related service cost amongthe MMC asthma universe population was highest for non-Hispanic black and Hispanic patients ($1,187 and
$1,182, respectively) and lowest for non-Hispanic otherpatients ($955) (Figure 11-14).
Figure 11-14Medicaid Managed Care Average Asthma-Related Service Cost per Enrollee by Race/Ethnicity for the Asthma Universe* Population, New York State, 2010
Non-HispanicWhite
Non-HispanicBlack
Non-HispanicOther
Hispanic
$0
$1,000
$800
$600
$400
$200
$1,200
Aver
age
Cost
$970 $1,187 $955 $1,182

219
New York City had the highest average asthma costs perenrollee within the MMC asthma universe population for all service categories. Average cost was approximately fivetimes higher than the Rest of State average for asthma
hospitalization costs, 2.5 times higher for outpatient visitsand pharmacy costs, and nearly three times higher for EDvisits. Of all service categories, average asthma pharmacycosts were the highest for both regions (Table 11-6).
Table 11-6 Medicaid Managed Care Average Asthma-Related Service Cost per Enrollee by Region and Type of Asthma-Related Service for the Asthma Universe* Population, New York State, 2010
Service Catagory New York City Rest of State
Outpatient Visit $ 27,995,711 $11,699,139
ED Visit $ 4,958,698 $ 1,773,437
Hospitalization $ 44,815,220 $ 8,480,501
Pharmacy $127,831,649 $49,017,321
*12 months continuous enrollment.
*12 months continuous enrollment.
Overall, the average asthma-related service cost amongthe MMC asthma universe population was higher for patients
who reside in New York City ($1,191) than patients who livein the Rest of State ($924) (Figure 11-15).
Figure 11-15Medicaid Managed Care Average Asthma-Related Service Cost per Enrollee Among the Asthma Universe* Population by Region, New York State, 2010
New York City Rest of State
$0
$1,000
$800
$600
$400
$200
$1,200
Aver
age
Cost
per
Rec
ipie
nt
$1,191 $924

220
New York City accounted for 74% of the total NYS MMCasthma-related cost while serving 69% of the asthmauniverse population (Table 11-7).
Table 11-7 Medicaid Managed Care Total Asthma-Related Service Cost and Number of Enrollees by Region for the Asthma Universe* Population, New York State, 2010
New York City Rest of State New York State
Asthma-Related Cost $205,601,278 (74%) $70,970,398 (26%) $276,571,676
Number of Enrollees 172,567 (69%) 76,783 (31%) 249,350

221
Figure 11-16 Distribution of Asthma Medicaid Managed Care Costs Among the Asthma Universe* Population by Region, New York State, 2010
New York City
ED Visits($4,958,698)
2%
Rest of State
ED Visits($1,773,437)
3%Hospitalizations($8,480,501)12%
There were regional differences in patterns of asthma-related cost by type of service among the asthma universepopulation. For 2010, about 62% of MMC asthma-relatedcosts were spent on pharmacy in New York City, and 69% ofthe asthma-related costs were spent on pharmacy in the
*12 months continuous enrollment.
Rest of State. The proportion of costs due to asthmahospitalizations was almost twice for New York Citycompared to the Rest of State (22% vs. 12%, respectively)(Figure 11-16).
Hospitalizations($44,815,220)22%
Outpatient Visits($27,995,711)14%
Pharmacy($127,831,649)
62%
Outpatient Visits($11,699,139)16%
Pharmacy($49,017,321)
69%

222
Asthma and the Environment
12
The New York State Department of Health’s (NYSDOH’s)environmental efforts to address asthma are focused onunderstanding which environmental factors are importantcontributors to asthma development and morbidity. Thatinformation is used to develop public health programsaimed at reducing or eliminating exposure to these factorsin and around homes, schools and workplaces. Becauseasthma is a respiratory disease, indoor and outdoor airquality are of particular interest. Contaminants in indoor or outdoor air that are related to asthma include environ -mental tobacco smoke; animal dander; allergens producedby dust mites, rodents and cockroaches; cleaning chemicals;pollen; mold; ozone; sulfur dioxide and fine particles.Exposure to many of these can trigger allergic reactions or cause respiratory irritation that exacerbates symptoms in those with existing asthma. Exposure to many indoor and outdoor pollutants – such as dust mite and cockroachallergens, environmental tobacco smoke, ozone and fineparticles – have also been associated, in some studies, with asthma development.30-37
Many asthma triggers vary with season, geography and other factors. Climate change may affect many environ -mental factors that contribute to asthma.38, 39 For example,a warmer and wetter climate in New York could extend theseasons for pollen and mold-spore production and increasedust mite populations. Tracking changes in climate and in concentrations of or exposure to specific triggers overtime will improve our understanding of these relationshipsand help public health professionals plan and prioritizeresources (e.g., to areas of the state most likely to beaffected or to address specific triggers).
Outdoor pollutants such as ozone, sulfur dioxide and fineparticles vary seasonally or with changes in meteorologicalconditions such as temperature. In the northeastern UnitedStates, summer ozone pollution has been associated with10% to 20% of summertime respiratory hospital visits andadmissions.40 In U.S. and Canadian studies, the ozone-associated increase in daily respiratory hospital admissionsranged from 2% to 30%, with daily ozone increments in the warm season that ranged from 20-40 parts per billion(ppb) for different ozone averaging times.40 The associationbetween ambient air particulate matter (PM) concentrations
and asthma, including increased hospital admissions, iswell documented.41, 42 Models demonstrate 5% to 15%increases in daily respiratory-related hospital admissionsper 25 µg/m
3(micrograms per cubic me ter of air) daily
increment of fine particles, with the largest effect on asthma admissions.43
The NYS Department of Environmental Conservationoperates a network of air monitors throughout NYS. Thisstatewide network provides real-time information aboutlevels of important air pollutants.44 This pollutant infor -mation, combined with weather forecasts, is used to issueAir Quality Health Advisories (see www.dec.ny.gov/cfmx/ extapps/aqi/aqi_forecast.cfm). These advisories inform people to take precautions to reduce exposure on days with expected high pollutant levels. Data gathered from themonitoring network are also used to track pollutant levelsover time. NYSDOH’s Environmental Public Health TrackingProgram uses air pollution data to generate public healthindicators, including county-level data and indicators thattake into account the size of the population potentiallyexposed to high levels of ozone or fine particles (see https://apps.nyhealth.gov/statistics/environmental/ public_health_tracking/tracker/air/mapaction.map)
Pollen is another important outdoor trigger for manypeople with asthma. Pollen is produced by coniferous and flowering plants (trees, grasses and weeds) during thespring, summer or fall. Like outdoor air pollutants, pollenlevels and types vary with season, location and weather.Insects and animals often spread pollen grains from plantto plant, but many grass, tree and weed species depend onthe wind to spread their pollen through the air. Some peoplewith asthma are sensitized to pollen from trees, grasses orweeds and can have their asthma aggravated by pollen inthe air. Studies have found that as pollen levels rise, asthmamedication use and asthma-related emergency department(ED) visits may also increase.45-49 Some studies have alsoobserved that higher fine particulate levels in outdoor air further increase the number of pollen-related ED visits,suggesting that more people may experience asthmasymptoms when both triggers are present.47, 49
The National Allergy Bureau (NAB), a section of theAmerican Academy of Allergy, Asthma and Immunology’s

223
Highlights: Asthma and the Environment
School Indoor Air Quality
2010 NYS School Building Condition Survey
� The NYS Building Condition Survey (BCS) tracksconditions in NYS public schools that may affectschool indoor air quality (IAQ).
� Although relatively few school buildings reportedhaving noticeable moldy odors (3.8%) in 2010,about 35% reported at least one type of moisture or humidity problem, which can indicate the potentialfor mold growth.
� Various ventilation-related problems, which can affectindoor air quality, were reported by schools in 2010.About one-fifth of schools reported inadequate out -side air intake, about 13% reported problems withmalfunctioning dampers, and about 10% reportedpotential diesel intrusion, blocked air intakes and dirt or dust near or in the system.
� About 5% of buildings reported rodents, cockroaches,wood-eating insects or other pests in 2010.
Outdoor Air Quality
Ozone and PM2.5
� For 2007-2009, there were a number of unhealthyozone days each year at several locations across thestate. Elevated ozone levels occurred most commonlynear and downwind of major cities. Unhealthy ozonedays mainly occur from May through September. Thefrequency of unhealthy ozone days per year tended to decline from 2000 to 2009.
� For 2007-2009, the number of days when fineparticle concentrations were unhealthy for sensitivegroups, such as people with asthma, was greatest in the New York City area, less in the smaller-sizedcities, and lowest in rural areas. The frequency of unhealthy fine particle days per year tended to decline from 2000 to 2009.
Pollen
� The duration, intensity and season of tree, grass andweed pollen varies across the state and between years.
� Tree pollen season typically begins in the spring and ends in early summer. For 2003 to 2010 the average percentage of days in late March to mid-June when tree pollen counts were at or above thenational threshold for a “high” pollen count rangedfrom 49% to 84%.
� Grass pollen season typically begins later in thespring and continues through late summer or earlyfall. For 2003 to 2010 the average percentage ofdays in late April to mid-September when grasspollen counts were at or above the national thresholdfor a “high” pollen count ranged from 3% to 67%.
� Weed pollen season typically begins mid to latesummer and continues through the fall. For 2003 to 2010 the average percentage of days in late Mayto early October when weed pollen counts were at or above the national threshold for a “high” pollen count ranged from zero to 37%.
Aeroallergen Network, oversees a pollen monitoring networkand certifies pollen counters who operate counting stationsacross the United States. Currently, there are six NABcounting stations in New York State that provide informationabout daily mold spore and tree, grass and weed pollen
counts. The NAB stations use pollen counts to report pollenlevels as low, medium, high or very high. The pollen reportsare available through the NAB website (see www.aaaai.org/ global/nab-pollen-counts.aspx), the Weather Channel and some local news media.
*There are many actions individuals and communities can take to reduce exposure to indoor and outdoor air pollutants (see www.health.ny.gov/diseases/ asthma/links.htm#trig for information, ideas and resources). Additionally, there are many actions individuals can take to reduce outdoor air pollution (see www.dec.ny.gov/public/43563.html).

224
New York State School Building Condition Survey
Methodology
Children and staff spend a considerable proportion of theirtime in and around school buildings, where they may beexposed to conditions that exacerbate asthma. Poor conditionof the school infrastructure and improper practices canpromote the existence of asthma triggers and thus impactstudents and staff with asthma. However, there are manythings that schools can do to minimize the presence ofenvironmental asthma triggers in the school setting, includingproper maintenance of buildings and grounds and manage -ment of other factors that can impact indoor air quality (IAQ).Therefore, it is important to assess conditions in schools that can promote the existence of these asthma triggers.
The Building Condition Survey (BCS) is a physicalinspection of NYS public school buildings that is performedevery five years. It is conducted by a licensed engineer and/or an architect. This inspection is mandated by a 1999regulation issued by the Commissioner of Education. The BCS is useful to track environmental conditions in NYS publicschools over time. The first BCS was completed in 2000, and revised versions were conducted in 2005 and 2010.
For each building or facility, inspectors rate the overallbuilding condition, as well as the condition of 53 individualbuilding systems, such as roof, plumbing and windows. Inaddition, NYSDOH worked with the NYS Education Depart -ment (NYSED) to incorporate a section pertaining to schoolIAQ beginning in 2005. The results of the inspection for eachschool are documented using a standardized form. Followingreview by the school board, completed forms for each school are submitted to NYSED, which maintains a database of all BCS records. This section describes an analysis ofsome results from the IAQ section of the 2005 BCS whichaddresses specific conditions that can affect school IAQ,including ventilation system problems, visible mold, moistureor humidity problems, and the presence of vermin.
1. Problems in the ventilation system.
A well-functioning ventilation system brings in enough freshair to dilute any allergens or irritants that may be present inthe school, avoids the intrusion of outdoor pollutants and isnot a reservoir for dirt or debris. Schools answered whetherthe following problems exist:
Ventilation System Problem Building Condition Survey Question(s)
Potential diesel exhaust intrusion Are there fresh air intakes near the following: • Near the bus loading areas? • Near the truck delivery areas? • Near the garbage storage/disposal areas?
Dirt and debris Is there accumulated dirt, dust or debris around fresh air intakes?
Is accumulated dirt, dust or debris in ductwork?
Fresh air unable to freely enter system Are fresh air intakes free of blockage?
Are dampers functioning as designed?
Not enough fresh air Is outside air adequate for occupant load?
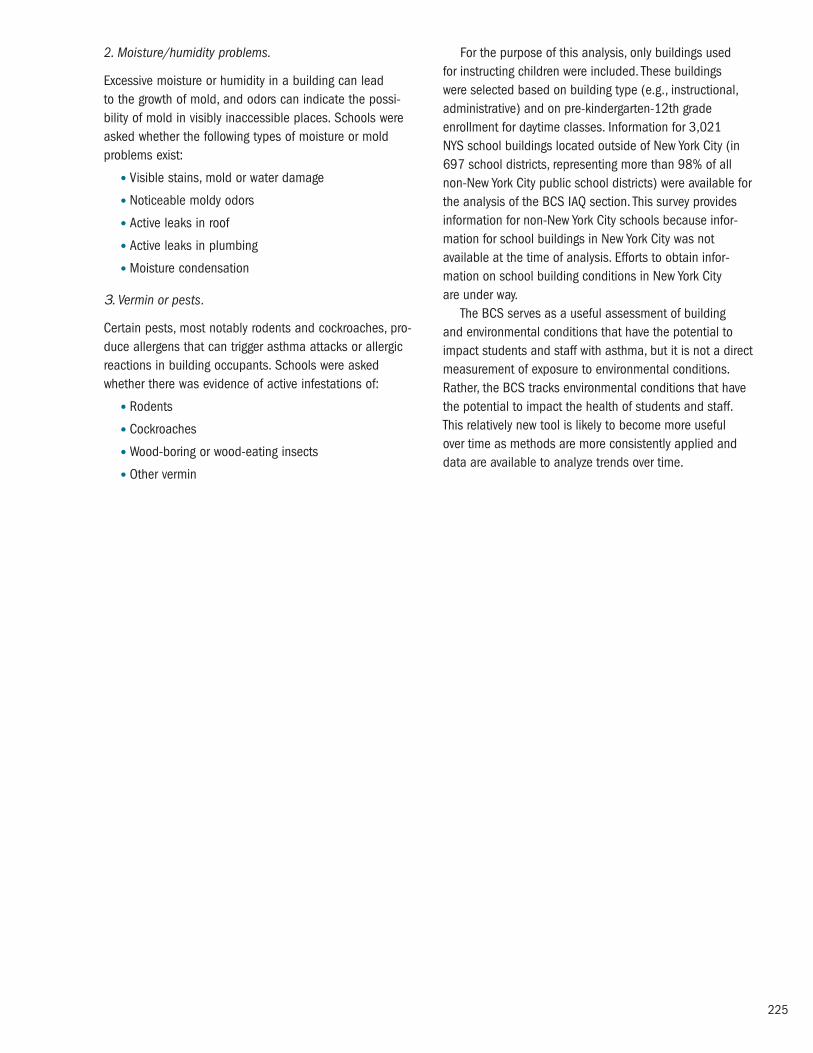
225
2. Moisture/humidity problems.
Excessive moisture or humidity in a building can lead to the growth of mold, and odors can indicate the possi -bility of mold in visibly inaccessible places. Schools wereasked whether the following types of moisture or moldproblems exist:
� Visible stains, mold or water damage
� Noticeable moldy odors
� Active leaks in roof
� Active leaks in plumbing
� Moisture condensation
3. Vermin or pests.
Certain pests, most notably rodents and cockroaches, pro-duce allergens that can trigger asthma attacks or allergicreactions in building occupants. Schools were askedwhether there was evidence of active infestations of:
� Rodents
� Cockroaches
� Wood-boring or wood-eating insects
� Other vermin
For the purpose of this analysis, only buildings used for instructing children were included. These buildings were selected based on building type (e.g., instructional,administrative) and on pre-kindergarten-12th gradeenrollment for daytime classes. Information for 3,021 NYS school buildings located outside of New York City (in697 school districts, representing more than 98% of allnon-New York City public school districts) were available forthe analysis of the BCS IAQ section. This survey providesinformation for non-New York City schools because infor -mation for school buildings in New York City was notavailable at the time of analysis. Efforts to obtain infor -mation on school building conditions in New York City are under way.
The BCS serves as a useful assessment of building and environmental conditions that have the potential toimpact students and staff with asthma, but it is not a directmeasurement of exposure to environmental conditions.Rather, the BCS tracks environmental conditions that havethe potential to impact the health of students and staff. This relatively new tool is likely to become more useful over time as methods are more consistently applied anddata are available to analyze trends over time.

226
Schools answered questions about the presence ofseveral different problems related to the ventilation system.The most commonly reported problem was inadequate freshair (20.1% of school buildings). The next most commonproblem reported was malfunctioning dampers (13.2% of school buildings). Dampers regulate the flow of fresh airinto the building. Blocked air intakes, which limit or preventfresh air from entering the building, was reported in 10%
of buildings. Potential diesel exhaust intrusion into thebuilding, reported in 10% of buildings, was assessed by asking whether fresh air intakes were near sources of diesel pollution, including school bus loading areas, truck delivery areas or garbage storage/disposal areas.Dust, dirt or debris near fresh air intakes or ductwork was reported in 9.1% of buildings (Figure 12-1).
Figure 12-1Percentage of Public School Buildings Reporting Ventilation System Problems, New York State (Excluding New York City), 2010 (N=3,021)
PotentialDiesel
ExhaustIntrusion
Dampers NotFunctioningas Designed
Dirt, Dust orDebris Around
Intakes or in Ductwork
BlockedAir Intakes
Outside AirIntake
Inadequate
0
20
15
10
25
Perc
ent
20.1 13.2 10.0 10.0 9.1

227
Almost 35% of schools reported at least one type ofmold or moisture problem in the building. Active roof leaks(19.4% of buildings), and visible stains, mold or waterdamage (18.1% of buildings) were the most commonlyreported problems, followed by moisture condensation
(8.4% of buildings) and active plumbing leaks (5.3% ofbuildings). Moldy odors were noticed in 3.8% of buildings.These conditions can indicate past or present problems(Figure 12-2).
Figure 12-2Percentage of Public School Buildings Reporting Mold or Moisture Problems, New York State (Excluding New York City), 2010 (N=3,021)
VisibleStains, Mold,
WaterDamage
ActiveLeaksin Roof
MoistureCondensation
ActiveLeaks inPlumbing
NoticeableMoldyOdors
AnyProblem
0
10
20
30
40Pe
rcen
t
19.4 18.1 8.4 5.3 3.8 34.8
5
15
25
35

228
Schools indicated whether there was evidence of activeinfestations of various types of vermin or pests. About 5.2% reported one or more types of infestation. Rodentinfestations were the most commonly reported (2.6%),
followed by cockroaches (0.7%), and wood-boring or wood-eating insects (0.6%). Other types of vermin werereported in 2.0% of buildings (Figure 12-3).
Figure 12-3Percentage of Public School Buildings Reporting Active Infestations of Vermin, New York State (Excluding New York City), 2010 (N=3,021)
Rodent Cockroaches Wood-boringor Wood-eating
Insects
Other Vermin
AnyVermin
0
5
4
3
2
1
6
Perc
ent
2.6 0.7 0.6 2.0 5.2

229
Outdoor Air Quality
Methodology
Outdoor Air Pollutants
Two important outdoor air pollutants that can trigger asthmaattacks are ozone and fine particulate matter (PM2.5).Scientific studies have linked exposure to these pollutantswith health effects, including eye and respiratory tractirritation, coughing, shortness of breath, reduced lungfunction, heart attack and premature death.40, 43
� Ozone, the principal component of smog, is produced by the reaction of sunlight on air contaminants fromautomobile exhausts, other combustion sources andindustrial emissions. Ozone levels are most likely to beelevated on hot, sunny afternoons. Ozone concentrationsare measured in parts per million (ppm).
� Particulate Matter (PM2.5), also called fine particulatematter, is particles or droplets in the air that are less than2.5 microns wide (or about 30 times smaller than widthof a human hair). Outdoor sources of PM2.5 primarilycome from combustion sources, such as motor vehicleexhausts, power plants and wildfires, and from thereaction of gases in the atmosphere. Indoor sourcesinclude tobacco smoke, cooking, fireplaces and candles.Fine particulates are measured in micrograms per cubicmeter of air or µg/m.3
National Air Quality Standards
The U.S. Environmental Protection Agency (EPA) regulatesthe levels of both pollutants through National Ambient AirQuality Standards (NAAQS) designed to protect publichealth and welfare. Under the federal Clean Air Act, primaryNAAQS are set by the EPA at levels “requisite to protect the public health.” The current level of the ozone NAAQS is 0.075 ppm (ppm, equivalent to 75 parts per billion)measured as a maximum daily eight-hour rolling average.The current level of the daily PM2.5 NAAQS is 35 µg/m
3
calculated as a 24-hour average. These values are used in this chapter to summarize trends in NYS air quality interms of potential public health effects. NAAQS have anindicator (e.g. PM2.5), an averaging time (e.g. 24 hours), a form (e.g., average of the 98th percentile value for eachyear in a three-year period) and a level (e.g. 35 µg/m3). All these factors have to be considered in comparing air quality to a NAAQS and determining whether an area meets a NAAQS standard. The summaries presented in this chapter are not intended to address regulatoryissues of standards attainment or implementation.
Measuring Air Quality in New York State
The NYS Department of Environmental Conservation(NYSDEC) measures air pollutants using a network ofmonitors across the state to track air quality. The locations of the monitoring sites are selected to measure ambient(outdoor) concentrations in populated areas state -wide. These locations provide ambient concentration datarepresentative of outdoor air where the majority of the state’spopulation lives. A few additional monitors are located insparsely populated areas to determine background levelsand the amount of pollution that comes into an area fromsources upwind. The monitoring network and full details of monitoring methods for each pollutant, as well as infor -mation on regulatory aspects of NAAQS implementation and attainment, are described on the NYSDEC web site (see www.dec.ny.gov/chemical/8406.html).
Data were only included for monitors when >75% oftheir potential results for a year were available. This avoidedpotential bias if too much of a monitor’s sampling recordwas missing. Because of this selection criterion andchanges in the operation of the monitoring network, thenumber of monitors used to create data summaries can change over time (www.dec.ny.gov/chemical/8540.html).
Ozone Data
To summarize recent spatial variability in high daily ozoneacross NYS, a map is presented to show the location ofozone monitors and the average number of days per yearfrom 2007 to 2009 when ambient ozone levels exceededthe current eight-hour NAAQS of 0.075 ppm at eachmonitor. The NAAQS for eight-hour ozone was reduced from0.08 ppm to 0.075 ppm in 2008.* Concentrations abovethe NAAQS level are considered unhealthy for sensitivegroups. The revised ozone NAAQS was used to identifyunhealthy days for all years.
To summarize temporal trends in the number ofunhealthy ozone days among all monitoring locations, datawere analyzed from the ozone monitors that had valid datafor at least 75% of all observations from 1997 to 2009.These data are presented in figures with the temperaturedata from the same time period for New York City and for NYS excluding New York City (Rest of State). For each year, the number of days that ambient ozone levels wereunhealthy for people with asthma (0.075 ppm or higher) at each monitor was determined. The averages over allmonitors in New York City and the Rest of State for eachyear are presented. The average summer temperatures for
*Because of differences in rounding procedures, the previous standard was effectively 0.084 ppm (equivalent to 84 parts per billion).

230
New York City and Rest of State were calculated using datafrom June-August each year at 10 NYSDEC weather monitorsin NYS, as reported to the EPA’s Air Quality System (AQS).50
Fine Particulate Matter (PM2.5) Data
To summarize recent spatial variability in high daily fineparticulate levels across NYS, a map is presented to showthe locations of fine particle monitors and the averagenumber of days per year from 2007 to 2009 that exceededthe current daily average NAAQS of 35 µg/m
3at each
monitor. Ambient air concentrations above this level areconsidered unhealthy for sensitive groups, such as peoplewith asthma. Most PM2.5 monitors collect data on aschedule of once every three days. For those monitors, thenumber of unhealthy days per year was multiplied by threeto estimate the expected total number of days in a year that PM2.5 levels would have been unhealthy for sensitivegroups.** Data from PM2.5 monitors that collect samplesevery day were not modified. There were 12 locations that measured PM2.5 once every three days and twolocations (one in NYC and one rural background locationoutside of NYC) that measured PM2.5 every day.
To summarize temporal trends in the number ofunhealthy fine particulate days among all monitoringlocations, data were analyzed from particulate monitors that had valid data for at least 75% of all observations from 2002 to 2009. These data are presented in a figureshowing the trend in New York City and the Rest of State.For each year, the number of days that ambient fineparticulate levels were unhealthy for people with asthma at each monitor is determined, by estimating the expectedtotal for the every-third-day monitors as described above or by using the entire set of observations for the continuous
monitors. A weighted average over all monitors was used to plot the time trend in New York City.*** For the timetrend in the Rest of State, a simple arithmetic average of all monitors is presented to avoid over-weighting the onecontinuous monitor outside New York City, which is sited to reflect rural background air quality.
Air Quality Health Advisories
The NYSDEC and NYSDOH issue “Air Quality Health Advisories”when air pollutant concentrations are forecast to increaseabove levels that pose health risks to sensitive groups, such as people with asthma. These levels are based on the NAAQSfor eight-hour ozone and daily PM2.5 concentrations. Air qualityhealth advisories for ozone and PM2.5 can occur on the sameday, but this has been uncommon.
High ozone levels are usually confined to the summerseason, while high particle days can occur at any time of year. On unhealthy ozone days, people with asthma can reduce symptoms by limiting their strenuous outdoor activity during afternoon hours when ozone levels are likelyto be the highest, and carefully following their asthmamanagement plan.
On unhealthy fine particle days, staying indoors mayreduce exposure, although some outdoor particles will comeindoors. If there are significant indoor sources of particles,levels inside may not be lower than outside. People withasthma can reduce symptoms by limiting indoor andoutdoor activities that produce fine particles and avoidingstrenuous activity in areas where fine particles are high.
More information about the health effects of air pollutionis available at: www.health.ny.gov/environmental/air_quality. Air pollution forecasts and monitoring results are posted at www.dec.ny.gov/chemical/34985.html).
***This procedure was used to compare monitors with different sampling schedules, but it is not used to evaluate whether a monitoring location is in compliance with the PM2.5 NAAQS.
***For each year, the average number of unhealthy days per monitor in New York City is a weighted mean of estimated numbers of days from the every-third-day monitors (N=4) and the observed numbers of days from the continuous monitor (N=1), where the weights are the number of sampling days per year at each location.

231
Figure 12-4 Average Number of Days per Year That Ambient Ozone Levels Were Unhealthy for People with Asthma, New York State, 2007-2009
New York CityArea l
l
l
l
l
l
l
ll
l l
l
l
lll
lllll
l
Unhealthy ozone days occurred each year at severallocations across the state. Elevated ozone levels occurredmost commonly near and downwind of major cities. Ozonepollution was also found in remote locations because
pollutants that are factors in ozone formation and ozoneitself are carried by the wind, hundreds of miles from theirsources (Figure 12-4). Unhealthy ozone days mainly occurduring May through September.
Number of Days of High Ozone LevelsMaximum 8-Hour Average >0.075 ppm
0 to 4
5 to 9
10 and Above
Note: The National Ambient Air Quality Standard (NAAQS) for eight-hour ozone was reduced from 0.08 parts per million to 0.075 parts per million in 2008.The revised NAAQS was used for all years.

232
Note: The National Ambient Air Quality Standard (NAAQS) for eight-hour ozone was reduced from 0.08 parts per million to 0.075 parts per million in 2008.The revised NAAQS was used for all years.
From 2000 to 2009, the average number of unhealthyozone days per year averaged across monitors in the Rest of State ranged from 1 to 17. There are generally more
unhealthy ozone days in years with hotter summers (Figure 12-5).
Figure 12-5 Trends in Average Summer Temperature and Average Number of Days per Year that Ambient Ozone Levels Were Unhealthy for People with Asthma, New York State (excluding New York City), 2000-2009
0
20
25
30
35
5
10
15
40
60
66
68
62
64
70
72
74
76
78
80
2008 20092000 2001 2002 2003 2004 2005 2006 2007
Aver
age
Num
ber o
f Day
s pe
r Yea
rof
Unh
ealth
y Oz
one
Aver
age
Sum
mer
Tem
pera
ture
(ºF
)
Rest of State Ozone Days J Rest of State Mean Temperature

233
Note: The National Ambient Air Quality Standard (NAAQS) for eight-hour ozone was reduced from 0.08 parts per million to 0.075 parts per million in 2008.The revised NAAQS was used for all years.
From 2000 to 2009, the average number of unhealthyozone days per year averaged across monitors in New YorkCity ranged from 1 to 18. While there are generally more
unhealthy ozone days in years with hotter summers, theaverage number of unhealthy ozone days per year in NewYork City declined over the time period (Figure 12-6).
Figure 12-6 Trends in Average Summer Temperature and Average Number of Days per Year that Ambient Ozone Levels Were Unhealthy for People with Asthma, New York City, 2000-2009
J
0
20
25
30
35
5
10
15
40
60
66
68
62
64
70
72
74
76
78
80
2008 20092000 2001 2002 2003 2004 2005 2006 2007
Aver
age
Num
ber o
f Day
s pe
r Yea
rof
Unh
ealth
y Oz
one
Aver
age
Sum
mer
Tem
pera
ture
(ºF
)
New York City Mean Temperature New York City Ozone Days
234
Figure 12-7 Estimated Average Number of Days per Year that Fine Particles Were Unhealthy for People with Asthma, New York State, 2007-2009
New York City Area
ll
l
l l
l
l
lll
lll
ll
l
l
Number of Days of High Fine Particle Levels24-Hour Average PM2.5 >35 µg/m3
0 to 3
4 to 9
10 to 18
The average number of days per year when fine particleconcentrations exceeded 35 µg/m
3was greatest at monitors
in the New York City area, less in the smaller-sized cities, and lowest in rural areas (Figure 12-7).
Note: The National Ambient Air Quality Standard (NAAQS) for daily fine particles was reduced from 65 µg/m3 to 35 µg/m3 in December 2006. The revised NAAQS was used for all years.

235
Note: The National Ambient Air Quality Standard (NAAQS) for daily fine particles was reduced from 65 µg/m3 to 35 µg/m3 in December 2006.The revised NAAQS was used for all years.
From 2000 to 2009, the average number of days per yearthat fine particles were unhealthy for people with asthmaranged from two to 18 across monitors in New York City,
and from zero to eight days across monitors in the Rest ofState (Figure 12-8). The average number of unhealthy daysper year has tended to decline over the period.
Figure 12-8 Trends in Estimated Average Number of Days per Year that Fine Particles Were Unhealthy for People with Asthma by Region and Year, New York State, 2000-2009
J
0
8
10
12
14
16
18
2
4
6
20
2000 2001 2002 2003 2004 2005 2006 2007
Aver
age
Num
ber o
f Day
s pe
r Yea
rof
Unh
ealth
y Fi
ne P
artic
les
New York City Rest of State
2008 2009

236
Pollen
Methodology
Pollen is an important outdoor trigger for some people withasthma. Pollen in the air outside can cause a wide range ofallergic and respiratory symptoms, including worseningasthma, for people who are sensitized to pollen from trees,grasses or weeds.51, 52 Studies have found that as pollenlevels rise, asthma medication use and asthma-relatedhospital and emergency department visits also increase.45-50
Some studies have also observed that higher fineparticulate levels in outdoor air further increase the numberof pollen-related hospitalizations, suggesting that morepeople may experience asthma symptoms when bothtriggers are present.47, 50
Pollen is produced by many plants (e.g., trees, grassesand weeds) during the spring, summer or fall. Like outdoorair pollutants, pollen levels and types vary with season,location and weather. Insects and animals often spreadpollen grains from plant to plant, but many grass, tree andweed species depend on the wind to spread their pollenthrough the air.
Pollen Monitoring Network
New York State government agencies do not currentlyoperate a pollen monitoring program*; however, theAmerican Academy of Allergy, Asthma and Immunology(AAAAI) certifies volunteer pollen counters who operatecounting stations across the United States as part of theNational Allergy Bureau (NAB). Currently, there are six NABcounting stations in New York State. Because the location of the stations is based on the availability of certified volun -teer counters, the network may not be representative of NYS as a whole. Certified stations are required to collectsamples at least three days per week using approvedsamplers. Additional information about the certificationprocess and sampling process is available on the NABwebsite (see www.aaaai.org/global/nab-pollen-counts/ counting-stations.aspx). Pollen counts are reported as the number of pollen grains per cubic meter of air (m3).
The NAB stations use pollen counts to report daily pollenlevels as low, medium, high or very high for trees, grassesand weeds (Table 12-1). These levels are derived fromecological measurements from counting stations across theUnited States and are not based on potential health effects.
Pollen Categories
Pollen counts for individual species of trees, grasses andweeds were collapsed into three pollen categories: all trees,all grasses and all weeds. Pollen counts for each categoryincluded the following types of pollen:
� All trees: Acer (Maple), Alnus (Alder), Betula (Birch),Carpinus/Ostrya (Hornbeam-hardwood tree),Carya (Hickory), Celtis (Hackberry), Corylus (Hazel),
Cupressaceae (Cypress-Juniper and Redwoods), Fagus(Beech), Fraxinus (Ash), Juglans (Walnut), Ligustrum(evergreen shrubs-privets), Liquidambar (Sweetgum tree),Morus (Mullberry tree), Myrica (Bayberry tree), Olea (Olive tree), Pinaceae (Cedars, Pine, Spruce), Platanus(Sycamore), Populus (Poplar, Aspen, Cottonwood),Pseudotsuga (Douglass Fir), Quercus (Oak), Salix(Willow), Tilia (Linden), Tsuga (Hemlock), Ulmus (Elm), Other tree pollen
Table 12-1 NAB Levels Based on Concentration (Grains per Cubic Meter of Air)
Absent Low Moderate High Very High
Tree 0 1-14 15-89 90-1499 >1500
Grass 0 1-4 5-19 20-199 >200
Weed 0 1-9 10-49 50-499 >500
Low levels: Concentrations that are less than the median or 50th percentile nationally.
Moderate levels: Concentrations between the 50th and 75th percentile nationally.
High levels: Between the 75th and 99th percentile nationally.
Very high levels: Above the 99th percentile nationally.

237
� All grasses: Cyperaceae (Sedges), Gramineae/Poaceae(flowering plants, Bamboo-grasses), Typha (Cat Tail),Other grass pollen
� All weeds: Ambrosia (Ragweed-bitterweeds, Bloodweeds),Artemisia (Sagebush, Wormwood, Mugworts), Asteraceae(excluding Ambrosia and Artemisia) (Daisy, Sunflower,Chrysanthemums), Chenopodiaceae/Amaranthaceae(Goosefoot family, Spinach, Beets, Chard, Quinoa,Pigweed, Lambsquarters), Plantago (Plantains-english,sharp, and elephant), Rumex (buckwheat, sheep sorrel,docks), Urticaceae (Nettles, Ramie, Mamaki, Ajlai), Other weed pollen
These pollen categories were used to characterize thepollen season in NYS, including duration and intensity of thetree, grass and weed pollen seasons, but this approach maymask important differences in which species are contributingto the total pollen count for each category and at differentcounting stations.
Pollen Season
The pollen season was defined using the 90% method.53
This method identifies the pollen season based on themiddle 90% of the total pollen count for the year. Using the90% method, the start date is defined as the date when 5% of the seasonal cumulative pollen has been countedand the end date as the date when 95% of the seasonalcumulative pollen has been counted. The average start and end dates are reported for each pollen category and by counting station along with the range of start andend dates (earliest and latest start and end dates).
Duration of Pollen Season
The number of days between the start date and end dateprovides an estimated duration of the pollen season eachyear. The duration of the pollen season was calculated for each pollen category (trees, grasses, weeds) and by counting station. The average duration over the 2003 to 2010 reporting period is shown along with the range(minimum and maximum duration). The variation from year to year is represented by the grey bars next to eachreporting station.
Intensity of Pollen Season
The intensity of the pollen season was calculated as themean daily pollen count (the total pollen count in grains/m3
divided by the number of observations during the pollenseason). Intensity was calculated for each pollen category(trees, grasses, weeds) and by counting station. The averageintensity over the 2003 to 2010 reporting period is shownalong with the range (minimum, maximum and annualmean between 2003 and 2010). The variation from year to year for each counting is represented by the dark bluebars and the red line indicates the NAB threshold for a “high” level of each type of pollen.
The average percentage of days at or above the NABthreshold for “high” pollen concentration was calculated by dividing the total number of days during the season thatexceeded the appropriate NAB threshold (90 grains/m3
for trees, 20 grains/m3 for grass, 50 grains/m3 for weeds)by the number of observed days. The average percentage of days exceeding the NAB threshold was calculated for each pollen category and by counting station.
Data Exclusions
Data for counting stations with fewer than four years of data were excluded from this report. As a result, data wereexcluded for one counting station based in New York City.Additionally, for specific pollen categories (tree, grass orweed), data for a reporting year were excluded if a countingstation did not begin counting until after the average startdate of the appropriate pollen season.
Daily Pollen Reports
Daily pollen reports are available through the NAB website(see www.aaaai.org/global/nab-pollen-counts.aspx), the Weather Channel and some local news media. For tips on how to reduce exposure to tree, grass and weed pollen, see the NAB’s Outdoor Allergens: Tips to Remember(see www.aaaai.org/conditions-and-treatments/library/ allergy-library/outdoor-allergens.aspx) or visit the National Institute of Environmental Health Science website (see www.niehs.nih.gov/health/topics/conditions/asthma/ allergens/pollen/index.cfm).
*From 1949 through 1975, New York State government agencies operated a monitoring program for ragweed pollen, a species of weed known to trigger allergy and asthma symptoms.

238
Figure 12-9 National Allergy Bureau Certified Pollen Counting Stations With High Concentrations of Pollen, New York State, 2003-2010
Rochester
Olean
Albany
Armonk
Brooklyn
25% or More Days ≥ 90 grains/m3
(NAB High Level for Tree Pollen)
25% or More Days ≥ 20 grains/m3
(NAB High Level for Grass Pollen)
25% or More Days ≥ 50 grains/m3
(NAB High Level for Weed Pollen)
For tree pollen, all pollen counting stations in NYSreported that the annual mean daily concentrations met or exceeded the National Allergy Bureau (NAB) threshold for high concentration of pollen on 25% or more days per season. For grass and weed pollen, pollen counting
stations in Albany and Rochester reported that the annualmean daily concentrations met or exceeded the NABthreshold for high concentration of pollen on 25% or moredays per season (Figure 12-9).

239
Table 12-2 Average Duration, Intensity and Start Date of Tree Pollen Season for All Trees, New York State, 2003-2010
From 2003-2010, the tree pollen season generallybegan in April and ended by mid-June at the NationalAllergy Bureau pollen counting stations in NYS. The meanduration of the pollen season ranged from 41 days inBrooklyn to 65 days in Rochester. The mean daily count
(intensity) ranged from 183 grains/m3 in Brooklyn to 1,088grains/m3 in Armonk. The mean daily count was at or abovecounts considered high nationally (≥ 90 grains/m3) for allpollen counting stations in NYS (Table 12-2).
*2003 data is not available for Brooklyn.
Duration Intensity Mean Length of Annual Mean Daily Season in Days Pollen Count for All Trees Season
Mean Mean Percent of 2003-2010 Daily Observed ( = NAB Concen- Days at Mean High Level, tration or Above 2003-2010 Length of = Mean (Grains/m3) NAB High Mean Mean ( = Duration Season Daily (Range of (Range of Annual Start End [Days] for in Days Concentration Annual Mean Percent of Date DateStation One Year) (Range) for One Year) Daily Mean) Observed Days) (Range) (Range)
56 507 76 Apr 13 Jun 7Albany (47-65) (137-840) (22-94) (Apr 2–Apr 23) (May 30-Jun 17)
53 1088 83 Apr 10 May 31Armonk (40-74) (273-2165) (56-100) (Mar 31–Apr 23) (May 18-Jun 12)
41 183 49 Apr 11 May 22Brooklyn* (30-47) (104-275) (25-64) (Mar 23–Apr 25) (May 7-May 27)
50 311 53 Apr 11 May 30Olean (14-78) (90-1269) (21-86) (Mar 26–Apr 30) (May 11-Jun 17)
65 367 84 Apr 2 Jun 7Rochester (56-77) (197-658) (65-94) (Mar 26–Apr 14) (May 26-Jun 12)

240
Table 12-3 Average Duration, Intensity and Start Date of Grass Pollen Season for All Grasses, New York State, 2003-2010
From 2003-2010, the grass pollen season generallybegan in late April or May and ended by late August to mid-September at the National Allergy Bureau pollen countingstations in NYS. The mean duration of the pollen seasonranged from 58 days in Olean and Rochester to 129 days in Armonk. The mean daily count (intensity) ranged from 4 grains/m3 in Armonk and Brooklyn to 100 grains/m3
in Albany. In Albany and Rochester, the mean daily concen -tration was at or above the concentration considered high
nationally (≥ 20 grains/m3), but the mean daily concen -tration was below this level for all other pollen countingstations (Table 12-3).
It is important to note that individual days may exceedthe threshold for a high concentration at these stations,even if the mean daily concentration does not. For instance,the mean daily concentration in Olean was below the NAB high level for grasses, but on average 20% of days still met or exceeded this threshold.
*2003 data is not available for Brooklyn. 2004 data for Brooklyn begins after the start of the grass and tree pollen season.
Duration Intensity Mean Length of Annual Mean Daily Season in Days Pollen Count for All Grasses Season
Mean Mean Percent of 2003-2010 Daily Observed ( = NAB Concen- Days at Mean High Level, tration or Above 2003-2010 Length of = Mean (Grains/m3) NAB High Mean Mean ( = Duration Season Daily (Range of (Range of Annual Start End [Days] for in Days Concentration Annual Mean Percent of Date DateStation One Year) (Range) for One Year) Daily Mean) Observed Days) (Range) (Range)
80 100 67 May 26 Aug 13Albany (53-109) (25-198) (31-92) (May 12-Jun 8) (Jul 23-Sep 8)
129 4 3 May 8 Sep 13Armonk (116-144) (3-6) (1-6) (Apr 27-May 17) (Sep 3–Sep 18)
127 4 4 Apr 24 Aug 28Brooklyn* (97-156) (2-9) (0-14) (Mar 31-May 12) (Aug 4-Sep 21)
58 12 20 May 25 Jul 20Olean (24-86) (5-22) (3-40) (May 12-Jun 6) (Jun 27-Aug 18)
58 37 51 May 24 Jul 20Rochester (41-71) (20-57) (29-69) (May 14-Jun 2) (Jul 8-Aug 11)

241
Table 12-4 Average Duration, Intensity and Start Date of Weed Pollen Season for All Weeds, New York State, 2003-2010
From 2003-2010, the start of the weed season varied by location but typically ended by mid-September to earlyOctober at the National Allergy Bureau pollen countingstations in NYS. The mean duration of the weed pollenseason ranged from 30 days in Albany to 120 days inArmonk. The mean daily count (intensity) ranged from 6 grains/m3 in Brooklyn and Olean to 71 grains/m3
in Rochester. In Albany and Rochester, the mean dailyconcentration was at or above the concentration
considered high nationally (≥ 50 grains/m3), but the meandaily concentration was below this level for all other pollencounting stations (Table 12-4).
It is important to note that individual days may exceedthe threshold for a high concentration at these stations,even if the mean daily concentration does not. For instance,the mean daily concentration in Armonk was below the NABhigh level for grasses, but on average 3% of days still met or exceeded this threshold.
*2003 data is not available for Brooklyn. 2004 data for Brooklyn begins after the start of the grass and tree pollen season.
Duration Intensity Mean Length of Annual Mean Daily Season in Days Pollen Count for All Weeds Season
Mean Mean Percent of 2003-2010 Daily Observed ( = NAB Concen- Days at Mean High Level, tration or Above 2003-2010 Length of = Mean (Grains/m3) NAB High Mean Mean ( = Duration Season Daily (Range of (Range of Annual Start End [Days] for in Days Concentration Annual Mean Percent of Date DateStation One Year) (Range) for One Year) Daily Mean) Observed Days) (Range) (Range)
30 40 28 Aug 14 Sep 12Albany (26-39) (14-76) (5-59) (Aug 11-Aug 20) (Sep 8-Sep 18)
120 11 3 May 28 Sep 24Armonk (93-144) (6-15) (0-9) (May 12-Jun 15) (Sep 15–Oct 8)
52 6 0 Aug 16 Oct 6Brooklyn* (44-66) (4-9) (0-0) (Aug 11-Aug 20) (Sep 28-Oct 21)
111 6 1 Jun 13 Sep 30Olean (92-156) (2-10) (0-3) (May 25-Jun 27) (Sep 19-Oct 27)
74 71 37 Jul 11 Sep 21Rochester (50-99) (18-134) (5-64) (Jun 26-Aug 2) (Sep 16-Oct 2)

242
1. Centers for Disease Control and Prevention. Behavioral Risk Factor Surveillance System (BRFSS) Prevalence Data. Available from: www.cdc.gov/asthma/brfss/default.htm#09 [Last accessed: April 8, 2013].
2. “Vital Signs: Asthma Prevalence, Disease Characteristics, and Self-Management Education — United States, 2001-2009” from CDC Morbidity and Mortality Weekly Report (MMWR), May 3, 2011 / 60;1-7. Available from: www.cdc.gov/mmwr/preview/mmwrhtml/mm6017a4.htm?s_cid=mm6017a4_w [Last accessed: April 8, 2013].
3. Centers for Disease Control and Prevention. Asthma’s Impact on the Nation. May 8, 2012. Available from: www.cdc.gov/ asthma/impacts_nation/AsthmaFactSheet.pdf [Last accessed: April 8, 2013].
4. Moorman JE, Akinbami LJ, Bailey CM, et al. National Surveillance of Asthma: United States, 2001–2010. National Center for Health Statistics. Vital Health Stat 3(35). 2012. www.cdc.gov/nchs/data/series/sr_03/sr03_035.pdf [Last accessed: April 8, 2013].
5. Moorman JE, Rudd RA, Johnson CA, King M, Minor P, Bailey C, Scalia MR, Akinbami LJ, “National Surveillance for Asthma – United States, 1980 –2004”. Morbidity & Mortality Weekly Report, 2007. 56(SS08): p. 1-14; 18-54. Available from: www.cdc.gov/mmwr/preview/mmwrhtml/ss5608a1.htm [Last accessed: April 8, 2013]
6. Akinbami LJ, “The State of Childhood Asthma, United States, 1980–2005”. Advance data from vital and health statistics; no 381, Hyattsville, MD: National Center for Health Statistics. 2006. Available from: www.cdc.gov/nchs/ data/ad/ad381.pdf [Last accessed: April 8, 2013].
7. Hall MJ, DeFrances CJ, Williams SN, Golosinskiy A, Schwartzman A. “National Hospital Discharge Survey: 2007 summary”(Table 2, 4). National health statistics reports; no 29. Hyattsville, MD: National Center for Health Statistics. 2010. Available from: www.cdc.gov/nchs/data/nhsr/nhsr029.pdf [Last accessed: April 8, 2013].
8. Xu JQ, Kochanek KD, Murphy SL, Tejada-Vera B. “Deaths: Final data for 2007.” National vital statistics reports; vol 58 no 19. Hyattsville, MD: National Center for Health Statistics. 2010. Available from: www.cdc.gov/nchs/data/nvsr/nvsr58/nvsr58_19.pdf [Last accessed: April 8, 2013].
9. Akinbami LJ, Moorman JE, Liu X. “Asthma prevalence, health care use, and mortality: United States, 2005–2009.”National health statistics reports; no 32. Hyattsville, MD: National Center for Health Statistics. 2011. Available from: www.cdc.gov/nchs/data/nhsr/nhsr032.pdf [Last accessed: April 8, 2013].
10. Center for Disease Control. Surveillance for Asthma: Morbidity & Mortality Weekly Report, 2002.
11. New York State Behavioral Risk Factor Surveillance System, Asthma Call-Back Survey data, 2006-2009
12. Centers for Disease Control and Prevention (CDC). Comprehensive Plan for Epidemiologic Surveillance. Atlanta, GA: CDC; 1986.
13. Centers for Disease Control and Prevention. About Healthy People 2020. Available from: www.healthypeople.gov/2020/about/default.aspx [Last accessed: April 8, 2013].
14. Centers for Disease Control and Prevention. Healthy People 2020 Objectives – Respiratory Diseases. Available from: www.healthypeople.gov/2020/topicsobjectives2020/objectiveslist.aspx?topicId=36 [Last accessed: April 8, 2013].
15. Centers for Disease Control and Prevention. Asthma Survey Questions. Available from: www.cdc.gov/asthma/ questions.htm [Last accessed: April 8, 2013].
References

243
16. Centers for Disease Control and Prevention, Behavioral Risk Factor Surveillance System, Prevalence and Trends Data.Asthma category (2002-2010) and Chronic Health Indicators category (2011). Available from: http://apps.nccd.cdc.gov/brfss/index.asp [Last accessed: April 8, 2013].
17. Kish L, Survey Sampling. New York: John Wiley, 1965.
18. Korn EL, Graubard BI, Analysis of Health Surveys, New York: Wiley, 1999.
19. Brian MM, Pugh TF, Epidemiology Principles and Methods, Boston: Little Brown, 1970.
20. Rudd RA, Moorman JE, Asthma Incidence: Data from the National Health Interview Survey, 1980-1996. Journal ofAsthma, 2007. 44: p. 65-70.
21. National Committee for Quality Assurance. HEDIS 2011 Volume 2: Technical Specifications. Washington, DC: NationalCommittee for Quality Assurance, 2010.
22. National Committee for Quality Assurance. HEDIS 2010 Volume 2: Technical Specifications. Washington, DC: NationalCommittee for Quality Assurance, 2009.
23. Vandenplas O, Malo J-L. Definitions and types of work-related asthma: a nosological approach. Eur Respir J 2003; 21: 706–712.
24. Tarlo SM, Balmes J, Balkissoon R, et al. Diagnosis and Management of Work-Related Asthma: ACCP ConsensusStatement. Chest 2008; 134: 1S-41S.
25. Knoeller GE, Mazurek JM, Moorman JE. Work-Related Asthma Among Adults with Current Asthma in 33 States and DC:Evidence from the Asthma Call-Back Survey, 2006–2007. Public Health Reports 2011; 126; 603-611.
26. American Thoracic Society Statement: Occupational Contribution to the Burden of Airway Disease. American Journal of Respiratory and Critical Care Medicine 2003; 167: 787-797.
27. Henneberger PK, Redlich CA, Callahan DB, Harber P, Lemière C, Martin J, Tarlo SM, Vandenplas O. An Official AmericanThoracic Society Statement: Work-Exacerbated Asthma. Am J Resp Crit Care Med 2011; 184:368-378.
28. Friedman-Jiménez G, Beckett WS, Szeinuk J, Petsonk EL. Clinical evaluation, management, and prevention of work-relatedasthma. Am J Ind Med 2001;37:121-141.
29. Consumer Price Index (CPI) for All Urban Consumers, Medical Care category. Available from: www.bls.gov/cpi/ cpi_dr.htm#2007 [Last accessed: April 8, 2013].
30. Institute of Medicine. Clearing the Air: Asthma and Indoor Air Exposures. 2000. Available at: http://iom.edu/Reports/ 2000/Clearing-the-Air-Asthma-and-Indoor-Air-Exposures.aspx [Last accessed: April 8, 2013].
31. Chen Y-C, Tsai C-H, Lee YL. Early-life indoor environmental exposures increase the risk of childhood asthma. InternationalJournal of Hygiene and Environmental Health. 2011;215(1):19–25.
32. Zeldin DC, Eggleston P, Chapman M, et al. How Exposures to Biologics Influence the Induction and Incidence of Asthma.Environ Health Perspect. 2006;114(4):620–626.
33. King ME, Mannino DM, Holguin F. Risk factors for asthma incidence. A review of recent prospective evidence. Panminervamedica. 2004 46(2):97.
34. Gilmour MI, Jaakkola MS, London SJ, Nel AE, Rogers CA. How exposure to environmental tobacco smoke, outdoor air pollutants, and increased pollen burdens influences the incidence of asthma. Environ. Health Perspect.2006;114(4):627–633.
35. Gehring U, Wijga AH, Brauer M, et al. Traffic-related Air Pollution and the Development of Asthma and Allergies during the First 8 Years of Life. American Journal of Respiratory and Critical Care Medicine. 2010;181(6):596–603.
36. Clark NA, Demers PA, Karr CJ, et al. Effect of Early Life Exposure to Air Pollution on Development of Childhood Asthma.Environ Health Perspect. 2010;118(2):284–290.

244
37. Arshad SH. Does Exposure to Indoor Allergens Contribute to the Development of Asthma and Allergy? Current Allergy andAsthma Reports. 2009;10(1):49–55.
38. Parry M, Canziani O, Palutikof J, van der Linden P, Hanson C. Climate Change 2007: Impacts, Adaptation and Vulnerability.Contribution of Working Group II to the Fourth Assessment Report of the Intergovernmental Panel on Climate Change.Intergovernmental Panel on Climate Change; 2007. Available at: www.ipcc.ch/publications_and_data/publications_ ipcc_fourth_assessment_report_wg2_report_impacts_adaptation_and_vulnerability.htm [Last accessed: April 8, 2013].
39. Institute of Medicine. Climate Change, the Indoor Environment, and Health. 2011. Available at: www.iom.edu/Reports/ 2011/Climate-Change-the-Indoor-Environment-and-Health.aspx [Last accessed: April 8, 2013].
40. U.S. Environmental Protection Agency, Air Quality Criteria for Ozone and Related Photochemical Oxidants – Volumes I, II & III. February 2006, EPA/600/R05/004aF.
41. Jorres RA, Magnussen H, Atmospheric pollutants, in Asthma: Basic Mechanisms and Clinical Management (3rd Ed),Barnes P, Roger IW, Thomson NC, Editor. 1998, Academic Press: London. p. 589-596.
42. Trasande L, Thurston GD, The role of air pollution in asthma and other pediatric morbidities. Journal of Allergy and Clinical Immunology, 2005. 115: p. 689-699.
43. U.S. Environmental Protection Agency, Air Quality Criteria for Particulate Matter – Volumes I & II. October 2004,EPA/600/P99/002aF.
44. New York State Department of Environmental Conservation, Ambient Air Quality monitoring data. Available from: www.dec.ny.gov/chemical/8406.html [Last accessed: April 8, 2013].
45. Sheffield P, Weinberger K, Ito K, Matte T, Mathes R, Robinson G, Kinney P. 2011 The Association of Tree PollenConcentration Peaks and Allergy Medication Sales in New York City: 2003-2008. International Scholarly ResearchNetwork Article ID 537194: 7 pp.
46. Dellavalle C, Triche E, Leaderer B, Bell, M. 2012 Effects of Ambient Pollen Concentrations on Frequency and Severity of Asthma Symptoms Among Asthmatic Children. Epidemiology 23(1):55-63.
47. Cakmak S, Dales R, Coates F. 2011. Does Air Pollution Increase the Effect of Aeroallergens on Hospitalization for Asthma?Journal of Allergy and Clinical Immunology 129(1):228-231.
48. Zhong W, Levin L, Reponen T, Hershey G, Adhikari A, Shukla R, LeMasters G. 2006 Analysis of Short-term Influences of Ambient Aeroallergens on Pediatric Asthma Hospital Visits. Science of the Total Environment 30:330-336.
49. Lierl M, Hornung R. 2003 Relationship of Outdoor Air Quality to Pediatric Asthma Exacerbations. Annals of Allergy Asthmaand Immunology 90(1):28-33.
50. U.S. Environmental Protection Agency, Technology Transfer Network (TTN) Air Quality System (AQS) Data Mart. Available from: www.epa.gov/ttn/airs/aqsdatamart/ [Last accessed: April 8, 2013].
51. National Institute of Environmental Health Sciences – National Institutes of Health. Allergens and Irritants. Available from: www.niehs.nih.gov/health/topics/conditions/asthma/allergens/index.cfm [Last accessed: April 8, 2013].
52. American Academy of Allergy Asthma and Immunology. Allergies: Symptoms, Diagnosis, Treatment and Management. Available from: www.aaaai.org/conditions-and-treatments/allergies.aspx [Last accessed: April 8, 2013].
53. Nilsson S, Persson S. Tree pollen spectra in the stockholm region (sweden), 1973–1980. Grana. 1981;20(3):179–182.

245
Appendix 1: Glossary of Terms
Appendix 2: Technical Notes
Appendices

246
Appendix 1: Glossary of Terms
Age-adjustment
A statistical process applied to rates of asthma emergency department visits, hospitalizations, deaths, disease, or otherhealth outcomes which allows areas with different age structures to be compared (see Technical Notes).
Asthma
A lung disease characterized by airway constriction, mucus secretion, and chronic inflammation, resulting in reduced airflow and wheezing, coughing, chest tightness, and difficulty breathing.
At-risk Based Rate (ARR) for Asthma Emergency Department (ED) Visits
ARR for asthma ED visits are the number of asthma ED visits divided by the estimated number of people with current asthma in the population.
At-risk Based Rate (ARR) for Asthma Hospital Discharges
ARR for asthma hospital discharges are the number of asthma hospital discharges divided by the estimated number of people with current asthma in the population.
At-risk Based Rate (ARR) for Asthma Mortality
ARR for asthma mortality are the number of deaths due to asthma divided by the estimated number of people with current asthma in the population.
Capitation
A flat monthly fee that a health plan pays to a provider (doctor, hospital, lab, etc.) to take care of a patient’s needs.Capitation is part of the provider-reimbursement mechanism (see www.sutterhealth.org/facilities/healthplan/ healthplans_glossary.html).
Confidence Interval (95%)
Range where the true prevalence is likely to fall with a 95% degree of assurance.
Cost-adjustment
A statistical process applied to the actual costs of a type of health service to adjust for financial inflation over time. This allows cost data from different years to be compared (see Technical Notes).
Emergency Department (ED) Visit Rate, Crude
Total number of ED visits per 10,000 population for a specified period. The crude ED visit rate represents the averagechance of visiting the ED during a specified period for persons for the entire population.
Emergency Department (ED) Visit, Age-adjusted
The ED visit rate used to make comparisons of relative risk of visiting the ED across groups and over time. This rate shouldbe viewed as a construct or an index rather than as direct or actual measure of risk of visiting the ED. Statistically, it is a weighted average of the age-specific ED visit rates, where the weights represent the fixed population proportions by age.
Environmental Justice Community
Environmental justice communities are commonly identified as those where residents are predominantly minorities or low-income; where residents have been excluded from the environmental policy setting or decision-making process; wherethey are subject to a disproportionate impact from one or more environmental hazards; and where residents experience disparate implementation of environmental regulations, requirements, practices and activities in their communities.Environmental justice efforts attempt to address the inequities of environmental protection in these communities (see www.energy.ca.gov/public_adviser/environmental_justice_faq.html).

247
HEDIS
The Health Plan Effectiveness Data and Information Set is the set of measures used by the nation’s health plans to measure and report on their performance.
Hospital Discharge Rate, Crude
Total number of hospital discharges per 10,000 population for a specified period. The crude hospital discharge rate represents the average chance of being hospitalized during a specified period for persons for the entire population.
Hospital Discharge Rate, Age-adjusted
The hospital discharge rate is used to make comparisons of relative risk for being hospitalized across groups and over time.This rate should be viewed as a construct or an index rather than as direct or actual measure of risk of being hospitalized.Statistically, it is a weighted average of the age-specific hospital discharge rates, where the weights represent the fixed population proportions by age.
Incidence Rate
A measure of new cases of a disease/condition that occur in a population in a given time period.
Number of new individuals developing disease/condition in given time period
Population at risk during the same time period
Morbidity
General term used to refer to illness due to the disease/condition in question.
Mortality
General term used to refer to death due to the disease/condition in question.
Mortality Rate, Crude
Total number of deaths per 1million population for a specified period. The crude mortality rate represents the averagechance of dying during a specified period for persons for the entire population.
Mortality Rate, Age-adjusted
The death rate used to make comparisons of relative mortality risks across groups and over time. This rate should be viewedas a construct or an index rather than as direct or actual measure of mortality risk. Statistically, it is a weighted average of the age-specific death rates, where the weights represent the fixed population proportions by age.
New York City
Includes the five counties of Bronx, Kings, New York, Queens and Richmond.
Prevalence
A measure of all cases of a disease/condition at a given point of time. The term “prevalence rate” is often used inter-changeably with “prevalence,” although by strict definition, prevalence is a proportion, not a rate. The prevalence proportionis the proportion of people in a population that has a disease.
Number of individuals with disease/condition in given time period
Population at risk for the same time period
Referral Bias
Individuals with a particular exposure or adverse health outcome are more likely to choose certain physicians or health clinics than those who are not similarly affected.
248
Rest of State
Refers to the 57 counties of New York State exclusive of New York City.
Surveillance
The ongoing, systematic collection, analysis and interpretation of health-related data essential to the planning, implementation and evaluation of public health practice, closely integrated with the timely dissemination of these data to those responsible for prevention and control (such as the federal Centers for Disease Control and Prevention).
Weighted Estimate
Results that have been adjusted to account for the survey design (including over-sampling), survey non-response and post-stratification. The weighted estimate represents the population from which the sample was drawn.

Appendix 2: Technical Notes
Age-adjustment
Age-adjustment is a statistical process applied to rates of emergency department visits, hospitalizations, deaths, disease or other health outcomes which allows areas with different age structures to be compared. Age confounding occurs whenthe two populations being compared have different age distributions, and the risk of the outcome varies across age groups.The process of age adjustment (Direct Method) used in this report changes the amount that each age group contributes to the average rate in each area, so that the overall rates are based on the same age structure. Rates based on the sameage distribution can be compared to each other without the presence of confounding by age. Adjustment was accomplishedby first multiplying the age-specific rates of death or hospitalization by age-specific weights. The weights used in the ageadjustment of asthma data are the proportion of the Standard Population (the U.S. population as enumerated by theBureau of the Census, 2000) within each age group. The weighted rates are then summed across the age groups to give the age-adjusted rate.
Cost-adjustment
Cost-adjustment is a statistical process applied to the actual costs of hospitalizations to adjust for financial inflation overtime. This allows cost data from different years to be compared. Data for the Medical Care category (1998-2011) from theConsumer Price Index (CPI) for All Urban Consumers were obtained from the U.S. Department of Labor (see www.bls.gov/cpi/cpi_dr.htm#2013) to use in this adjustment procedure. The 2011 annual average CPI for the Medical Care categorywas used as the reference year. The cost adjustment factors were calculated by dividing the 2011 annual average CPI bythe annual average CPI for each previous year. The cost adjustment factor was then multiplied by the actual hospitalizationcost to obtain the CPI-adjusted hospitalization cost for each year.
249

250
Howard A. Zucker, MD, JDActing Commissioner, New York State Department of Health
Guthrie S. Birkhead, MD, MPHDeputy Commissioner, Office of Public Heath, New York State Department of Health
Trang Nguyen, MD, DrPH, MPHDeputy Director, Office of Public Heath Practice, New York State Department of Health
Jennifer Mane, MSWAsthma Coordinator, New York State Department of Health
NYSDOH, ASTHMA SURVEILLANCE AND EVALUATION STAFF
Melissa Lurie, MPHAsthma Epidemiologist, Public Health Information Group
Samira Skochko, MSData Analyst, Public Health Information Group
Tarak ShresthaGraduate Student Intern, Public Health Information Group
Acknowledgments

251
We gratefully acknowledge the contributions of the following groups and individuals:
NYSDOH, PUBLIC HEALTH INFORMATION GROUP
Christopher Maylahn, MPHProgram Research Specialist, Public Health Information Group
Pamela SheehanProgram Research Specialist, Public Health Information Group
NYSDOH, DIVISION OF CHRONIC DISEASE PREVENTION AND ADULT HEALTH
Barbara Wallace, MD, MSPHDirector, Division of Chronic Disease Prevention
Pat Waniewski, RN, MSDirector, Bureau of Community Chronic Disease Prevention
Patricia Lillquist, PhDAssistant Director, Bureau of Chronic Disease Evaluation and Research
Colleen Baker, BSResearch Scientist, Bureau of Chronic Disease Evaluation and Research
Harlan R. Juster, PhDDirector, Bureau of Tobacco Control
Deepa T Rajulu, MSResearch Scientist, Evaluation and Research, Bureau of Chronic Disease Evaluation and Research
NYSDOH, OFFICE OF QUALITY AND PATIENT SAFETY
Patrick Roohan, MS Director, Office of Quality and Patient Safety
Joseph Anarella, MPH Deputy Director, Office of Quality and Patient Safety
Victoria Wagner, MS Research Scientist, Bureau of Outcomes Research, Office of Quality and Patient Safety
Tom Melnik, DrPH Director, Bureau of Outcomes Research, Office of Quality and Patient Safety
Changning Xu, MPH Research Scientist, Division of Quality and Evaluation, Office of Health Insurance Programs
NYSDOH, CENTER FOR ENVIRONMENTAL HEALTH
BUREAU OF ENVIRONMENTAL AND OCCUPATIONAL EPIDEMIOLOGY
SyniAn Hwang, PhD Bureau Director
Thomas Talbot, MPH Section Chief, Environmental Health Surveillance Section
Sanjaya Kumar, MS Research Scientist, Environmental Health Surveillance Section
Jessica Brown, MPH Research Scientist, Environmental Health Surveillance Section
Christine Kielb, MS Research Scientist, Epidemiologic Studies and Evaluation Section
BUREAU OF TOXIC SUBSTANCE ASSESSMENT
Dan Luttinger, PhD Bureau Director and Environmental Asthma Team Leader
Gregg Recer, PhD Research Scientist, Toxicological Assessment Section
Pat Fritz, M. Eng. Research Scientist, Toxicological Assessment Section
BUREAU OF OCCUPATIONAL HEALTH
Kitty H. Gelberg, PhD, MPH Bureau Director
Karen Cummings, MPH Occupational Lung Disease Registry Project Director
OUTREACH AND EDUCATION
Amanda Reddy, MSResearch Scientist
NEW YORK STATE DEPARTMENT OF ENVIRONMENTAL CONSERVATION
Division of Air Resources – Bureau of Air QualitySurveillance and Bureau of Air Quality Analysis andResearch

252
AMERICAN ACADEMY OF ALLERGY, ASTHMA AND IMMUNOLOGYNATIONAL ALLERGY BUREAU, NYS STATIONS
Long Island College HospitalStation Heads: Clifford W. Bassett, MD, FAAAAI; Arlene T. Schneider, MD, FAAAAI; Mehdi Vesaghi, MD339 Hicks St., Brooklyn, NY 11201
Fred H. Lewis, MD FAAAAIStation Heads: Fred H. Lewis, MD, FAAAAI535 Main St., Olean, NY 14760
Allergy, Asthma and Immunology of Rochester Station Heads: Donald W. Pulver, MD, FAAAAI300 Meridian Centre, Suite 300, Rochester, NY 14618
Certified Allergy ConsultantsStation Heads: David J. Shulan, MD FAAAAI8 Southwoods Blvd,, Albany, NY 12211
The Louis Calder CenterStation Heads: Guy Robinson, PhDDepartment of Natural Sciences, 53 Whipporwill Road, Armonk, NY 10504
Fordham College at Lincoln Center*Station Heads: Guy Robinson, PhDDepartment of Natural Sciences, 113 W. College St., New York, NY 10023
CENTERS FOR DISEASE CONTROL AND PREVENTION
Jeanne E. MoormanSurvey Statistician, Air Pollution and Respiratory Health Branch, National Center for Environmental Health

253
Funding for this report was provided by the Centers for Disease Control and Prevention (CDC) National Center for Environmental Health grant, Addressing Asthma from a Public Health Perspective (Cooperative Agreement#5U59EH000212-03). The contents are solely the responsibility of the authors and do not necessarily represent the official view of the CDC.

254

255

256
