new world records have bec ome less frequent (see, for
TRANSCRIPT
econstorMake Your Publications Visible.
A Service of
zbwLeibniz-InformationszentrumWirtschaftLeibniz Information Centrefor Economics
Kruse, Franziska K.; Maennig, Wolfgang
Working Paper
The future development of world records
Hamburg Contemporary Economic Discussions, No. 61
Provided in Cooperation with:University of Hamburg, Chair for Economic Policy
Suggested Citation: Kruse, Franziska K.; Maennig, Wolfgang (2017) : The futuredevelopment of world records, Hamburg Contemporary Economic Discussions, No. 61, ISBN978-3-942820-37-0, University of Hamburg, Faculty of Business, Economics and SocialSciences, Chair for Economic Policy, Hamburg
This Version is available at:http://hdl.handle.net/10419/175041
Standard-Nutzungsbedingungen:
Die Dokumente auf EconStor dürfen zu eigenen wissenschaftlichenZwecken und zum Privatgebrauch gespeichert und kopiert werden.
Sie dürfen die Dokumente nicht für öffentliche oder kommerzielleZwecke vervielfältigen, öffentlich ausstellen, öffentlich zugänglichmachen, vertreiben oder anderweitig nutzen.
Sofern die Verfasser die Dokumente unter Open-Content-Lizenzen(insbesondere CC-Lizenzen) zur Verfügung gestellt haben sollten,gelten abweichend von diesen Nutzungsbedingungen die in der dortgenannten Lizenz gewährten Nutzungsrechte.
Terms of use:
Documents in EconStor may be saved and copied for yourpersonal and scholarly purposes.
You are not to copy documents for public or commercialpurposes, to exhibit the documents publicly, to make thempublicly available on the internet, or to distribute or otherwiseuse the documents in public.
If the documents have been made available under an OpenContent Licence (especially Creative Commons Licences), youmay exercise further usage rights as specified in the indicatedlicence.
www.econstor.eu

Hamburg Contemporary Economic Discussions University of Hamburg Faculty of Business, Economics and Social Sciences Chair for Economic Policy Von-Melle-Park 5 20146 Hamburg | Germany Tel +49 40 42838 - 4622 Fax +49 40 42838 - 6251 https://www.wiso.uni-hamburg.de/en/fachbereich-vwl/professuren/maennig/home.html Editor: Wolfgang Maennig
Franziska K. Kruse University of Hamburg Faculty of Business, Economics and Social Sciences Chair for Economic Policy Von-Melle-Park 5 20146 Hamburg | Germany Tel +49 40 42838 - 4628 Fax +49 40 42838 - 6251 [email protected]
Wolfgang Maennig University of Hamburg Faculty of Business, Economics and Social Sciences Chair for Economic Policy Von-Melle-Park 5 20146 Hamburg | Germany Tel +49 40 42838 - 4622 Fax +49 40 42838 - 6251 [email protected]
ISSN 1865 - 2441 (Print) ISSN 1865 - 7133 (Online) ISBN 978-3-942820-36-3 (Print) ISBN 978-3-942820-37-0 (Online)
Franziska K. Kruse, Wolfgang Maennig
The future development of world records
Abstract: We conduct an innovative analysis of sporting world records by a) using economic instead of
sporting determinants and b) by using multivariate stochastic frontier functions. Using data from 48
different disciplines between 1970 and 2014, we show that world records are close to full efficiency and
therefore actual athletic frontiers. Forecasts including economic determinants imply that the dynamics
of world records largely depend on the dynamics of the frontiers and their driving forces, i.e., socio-
economic developments.
Keywords: World records, productivity growth, stochastic frontier function, technical efficiency
JEL: C10, C23, C53, L83
Version: September 2017
Introduction
New world records have become less frequent (see, for example, the table of valid world
records for track and field disciplines (IAAF, 2017c)). In recent decades, athletes have been
fighting to break world records that were set years, if not decades, ago. It is occasionally
argued that world records set in the 1990s and before may result from doping and can
barely be broken by today’s athletes who are under more effective doping control.1 In
other words, the athletic productivity of earlier decades is mis-measured, and athletic
productivity in recent times relative to earlier times is biased downward.
However, parallel to this athletic stagnation, economic productivity growth in leading
countries decreased significantly in recent decades. In the US/GB/Germany, average
productivity growth was at + 2.7%/2.5%/1.6%, respectively, from 2000 to 2007 and
1 The International Association of Athletics Federations, IAAF, decided to scrap the existing world records that were achieved before 2005 and start over with new, and “clean”, world records, IAAF (2017a)).
HCED 61 – The future development of world records
decreased to +1.1%/1.2%/+1.3%, respectively, from 2008 to 2017.2 There is, as with
athletics, a discussion of the measurement problems of economic productivity.3
Economic and productivity growth have been investigated for many decades, including
the pioneering contributions of (Solow, 1956), (Romer, 1986) and (Lucas, 1988). Nearly all
empirical studies find real GDP, population growth, and trade openness to be significant
determinants of economic growth and productivity growth (e.g., (Afonso & Jalles, 2013),
(Danquah, Moral-Benito, & Outtara, 2014), (Barro, 1991) and (Miller & Upadhyay, 2000)).
Note that similar determinants were also found to be of significance for Olympic medal
rankings. Publications as early as those of (Jokl, 1964), (Grimes, Kelly, & Rubin, 1974) as
well as more recent ones such as (Bernard & Busse, 2004), (Johnson & Ali, 2004), and
(Forrest, Sanz, & Tena, 2010) find that GDP per capita and population size impact
Olympic sporting success. A larger population implies a larger pool of talents, and larger
real GDP per capita may imply larger funds for the support of athletes, both facilitating
better athletic achievements.
This paper analyzes world record developments on the broadest available basis of
sporting disciplines and contributes to the world record literature as it begins from the
assumption that economic productivity growth and that world record developments are
driven by similar determinants. Earlier contributions on world records such as that by
(Kuper & Sterken, 2007), (Hanly, Sharp, & Friskin, 2012), (Péronnet & Thibault, 1985) and
(Volf, 2011) focus on the functional (model) form and the statistical distributions of
modeling world records or use determinants such as population size (Haake, Foster, &
James, 2014). Conversely, (Chang & Baek, 2011) analyze the remaining time in years for
world records to encounter a limit; however, none of these contributions include
2 Data were retrieved from the US Bureau of Labor Statistics (U.S. Bureau of Labor Statistics (2017), OECD Database (OECD (2017)) and Statistisches Bundesamt (2017)).
3 It has been noted that this may be a mismeasurement problem, particularly an underestimation of productivity growth in the computer industry (Byrne, Fernald, and Reinsdorf (2016)). To capture the various and, in several cases, unobservable aspects of productivity, different productivity indices were introduced, see Malmquist (1953)) and Moorsteen (1961)).
2/17
HCED 61 – The future development of world records
economic determinants to explain the progression of world records. We forecast world
records conditional on economic variables and find that world records are close to
efficiency frontiers, unless new technologies may enter the picture.
Section 2 describes the data and the empirical strategy. Section 3 presents the results of
our frontier approach and discusses our forecasts. Section 4 concludes.
Data and empirical strategy
We collected a database of world records for all disciplines, using official world record
websites (International Association of Athletics Federations ((IAAF, 2017b), Fédération
Internationale de natation (FINA, 2017), International Skating Union ((ISU, 2017) and
Union Cycliste Internationale (UCI, 2017)) and measuring world records by time in
seconds. A discipline was dismissed if there was no officially validated world record (e.g.,
triathlon). We restricted the sample to 1970-2014, due to the availability of control
variables, and excluded disciplines that experienced significant changes in regulations.
For disciplines with both indoor and outdoor records, we focus on the indoor records.
Swimming data are obtained from the Olympic long course (50 meters) data set, which
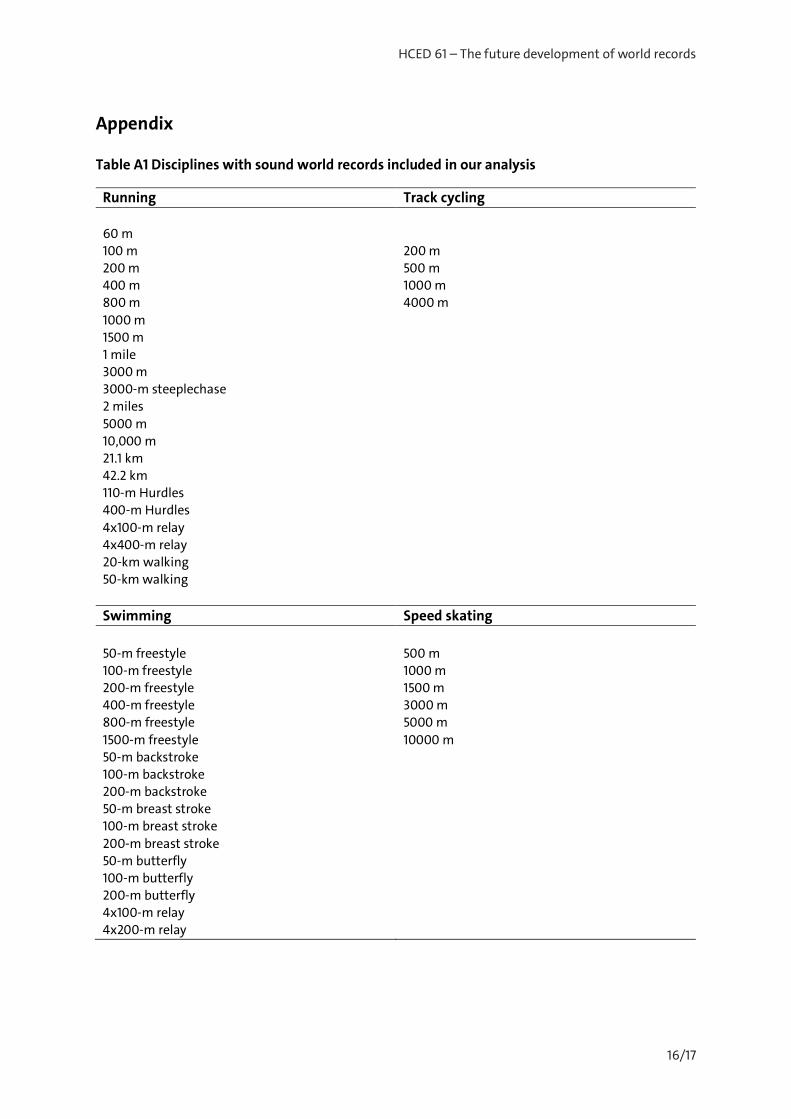
is historically older than the short track (25 meters). The full list of disciplines is displayed
in Table A1. The list includes 19 disciplines in running, two disciplines in walking, 17
different kinds of swimming disciplines, six speed skating disciplines and four track
cycling disciplines. If the records showed various observations for one discipline in one
year, in other words, when the world record was renewed more than one time in a year,
we used the fastest of all the observations in that year.
We collected data for women’s and men’s world records. However, since the variance in
women´s records is small and the women’s world records include fewer data points, a
stochastic frontier analysis did not converge. Therefore, we needed to restrict ourselves
to the analysis of men’s world records.
3/17
HCED 61 – The future development of world records
For the selection of control variables, we utilize the insights of the literature of economic
growth and use yearly data of GDP per capita, population and exports (in % of GDP)
((Barro, 1991), (Baltabaev, 2014), (Afonso & Jalles, 2013) and (Danquah et al., 2014)). Data
for the real GDP per capita were collected from the World Penn Tables 9.0 (Feenstra,
Inklaar, & Timmer, 2015)). Data for exports and population were taken from the World
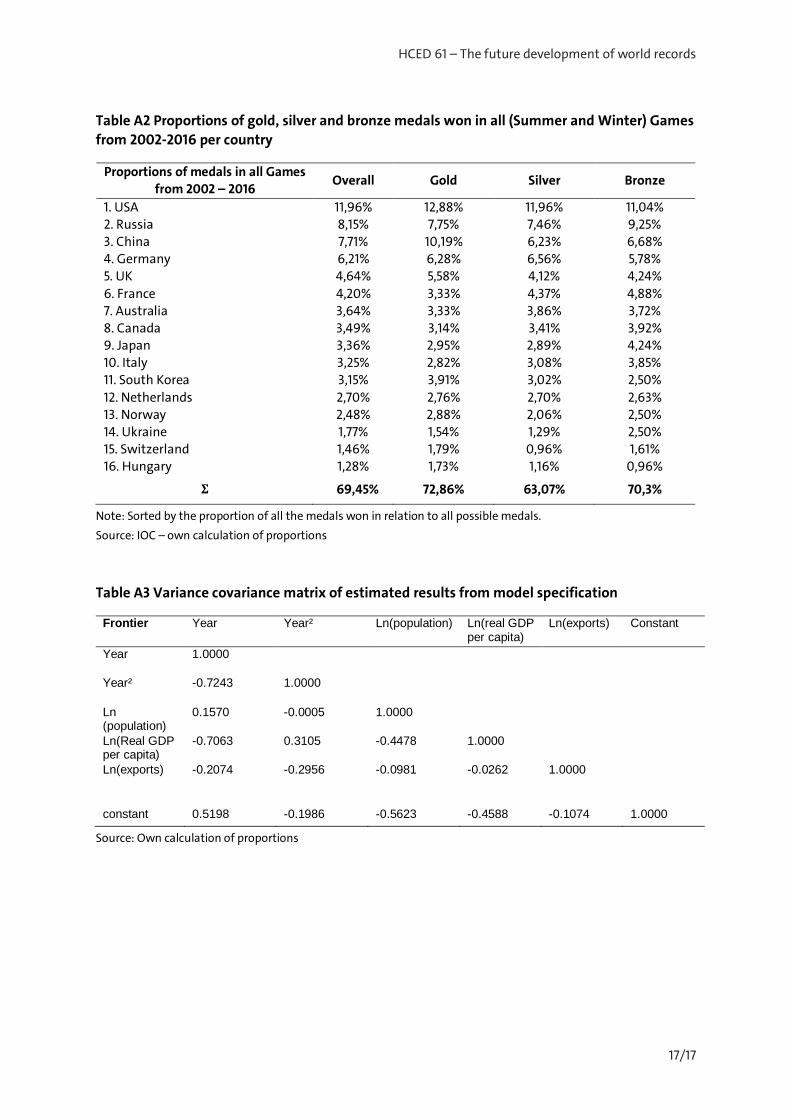
Bank Data Bank (World Bank, 2017)). The aggregates are calculated from the data of 13
of the 15 with the largest medal success in the Summer and Winter Games 2002-2016,
winning 73% of all gold medals (Table A2 in the appendix). Russia and the Ukraine
needed to be excluded as no complete economic data sets were available.
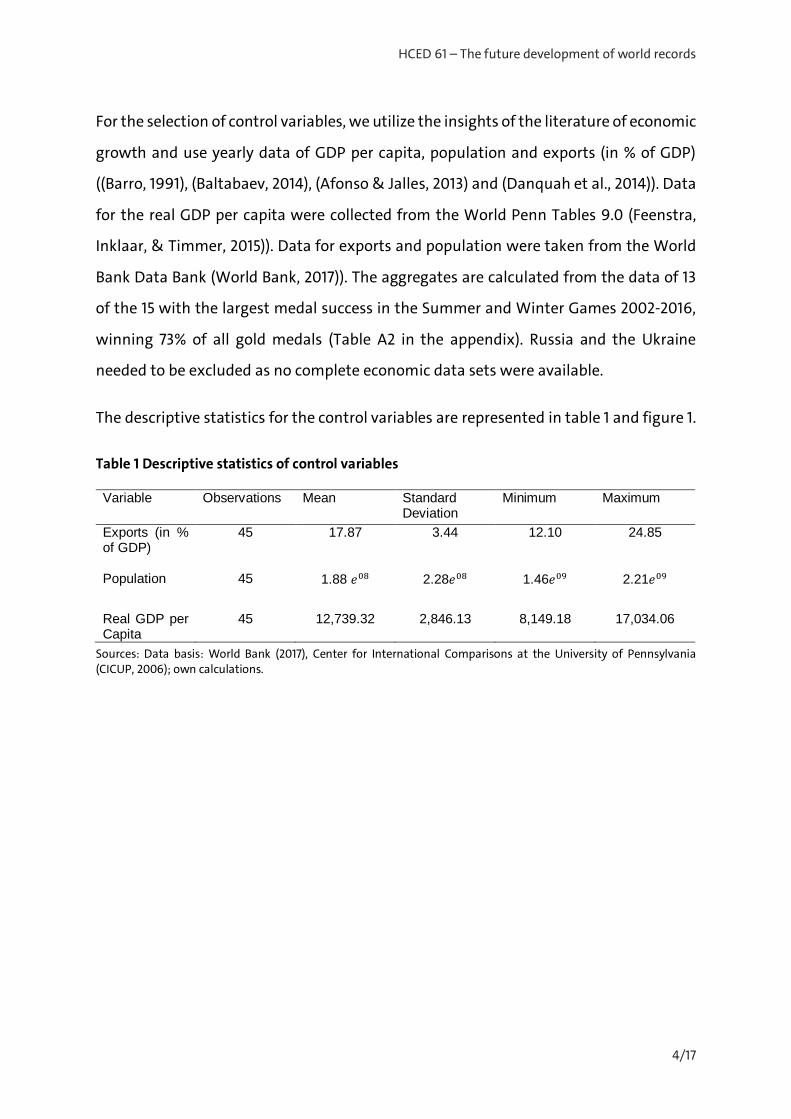
The descriptive statistics for the control variables are represented in table 1 and figure 1.
Table 1 Descriptive statistics of control variables
Variable Observations Mean Standard Deviation
Minimum Maximum
Exports (in % of GDP)
45 17.87 3.44 12.10 24.85
Population 45 1.88 𝑒𝑒08 2.28𝑒𝑒08 1.46𝑒𝑒09 2.21𝑒𝑒09
Real GDP per Capita
45 12,739.32 2,846.13 8,149.18 17,034.06
Sources: Data basis: World Bank (2017), Center for International Comparisons at the University of Pennsylvania (CICUP, 2006); own calculations.
4/17
HCED 61 – The future development of world records
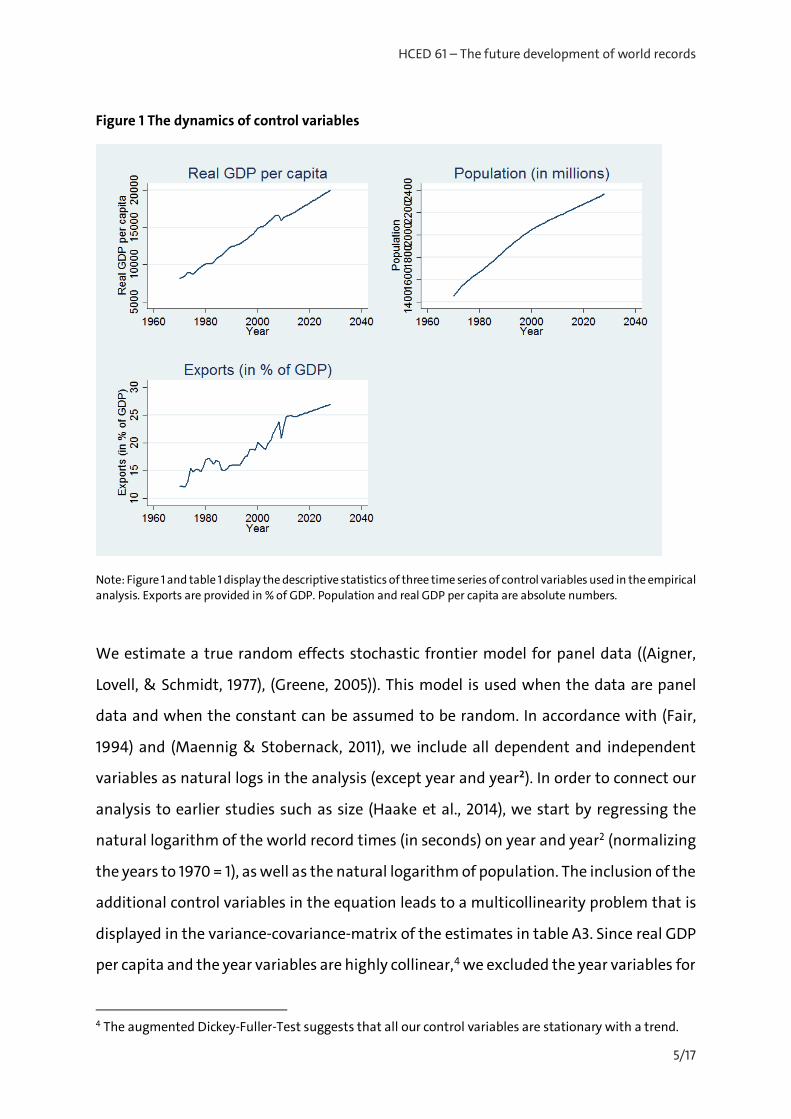
Figure 1 The dynamics of control variables
Note: Figure 1 and table 1 display the descriptive statistics of three time series of control variables used in the empirical analysis. Exports are provided in % of GDP. Population and real GDP per capita are absolute numbers.
We estimate a true random effects stochastic frontier model for panel data ((Aigner,
Lovell, & Schmidt, 1977), (Greene, 2005)). This model is used when the data are panel
data and when the constant can be assumed to be random. In accordance with (Fair,
1994) and (Maennig & Stobernack, 2011), we include all dependent and independent
variables as natural logs in the analysis (except year and year²). In order to connect our
analysis to earlier studies such as size (Haake et al., 2014), we start by regressing the
natural logarithm of the world record times (in seconds) on year and year2 (normalizing
the years to 1970 = 1), as well as the natural logarithm of population. The inclusion of the
additional control variables in the equation leads to a multicollinearity problem that is
displayed in the variance-covariance-matrix of the estimates in table A3. Since real GDP
per capita and the year variables are highly collinear,4 we excluded the year variables for
4 The augmented Dickey-Fuller-Test suggests that all our control variables are stationary with a trend.
5/17
HCED 61 – The future development of world records
further analyses. In addition, real GDP per capita and population are highly collinear.
Therefore, we first include population in the analysis to confirm the “negative” impact
of population from the earlier contributions noted above. Thereafter, we dismiss
population and include our economic variables. The estimation equations read as
follows:
M1: ln(𝑡𝑡𝑡𝑡𝑡𝑡𝑒𝑒)𝑖𝑖𝑖𝑖 = (𝛼𝛼0 +𝜔𝜔𝑖𝑖) + 𝛽𝛽1 ln(population)𝑖𝑖𝑖𝑖 + 𝜀𝜀𝑖𝑖𝑖𝑖
𝑀𝑀2: ln(𝑡𝑡𝑡𝑡𝑡𝑡𝑒𝑒) = (𝛼𝛼0 + 𝜔𝜔𝑖𝑖) + 𝛽𝛽1 ln(real GDP per capita)𝑖𝑖𝑖𝑖
𝑀𝑀3: ln(𝑡𝑡𝑡𝑡𝑡𝑡𝑒𝑒) = (𝛼𝛼0 +𝜔𝜔𝑖𝑖) + 𝛽𝛽1 ln(real GDP per capita)𝑖𝑖𝑖𝑖 + 𝛽𝛽2 ln(𝑒𝑒𝑒𝑒𝑒𝑒𝑒𝑒𝑒𝑒𝑡𝑡𝑒𝑒),
all specifications with
𝜀𝜀𝑖𝑖𝑖𝑖 = 𝜐𝜐𝑖𝑖𝑖𝑖 − 𝑢𝑢𝑖𝑖𝑖𝑖 , 𝑡𝑡 = 1, …𝑁𝑁,
𝑢𝑢𝑖𝑖𝑖𝑖 ~ ℕ+�0;𝜎𝜎𝑖𝑖𝑖𝑖2� = ℕ+�0, exp�𝜔𝜔𝑢𝑢0 + 𝑧𝑧𝑢𝑢,𝑖𝑖𝑖𝑖′ 𝜔𝜔𝑢𝑢��,
𝜐𝜐𝑖𝑖𝑖𝑖 ~ ℕ(0,𝜎𝜎𝜐𝜐2),
𝜔𝜔𝑖𝑖~ ℕ(0,𝜎𝜎𝜔𝜔2),
This symmetric normal and half-normal distribution of the error terms helps to define
the frontier in an appropriate manner (Aigner et al., 1977)). (Greene, 2005) focuses on the
modeling of the inefficiency that can be calculated from the model to overhaul the
shortcomings of the original model of (Aigner et al., 1977), since, in this specification, the
mean and variance of 𝑢𝑢𝑖𝑖𝑖𝑖 can depend on variables that are time-invariant. The constant
is also treated as random in this model (Greene, 2005), (Kumbhakar, Lien, & Hardaker,
2012)).
World record developments, 1970–2014: Results and discussion
Column 2 in Table 2 displays the results with ln(population) as only explanatory variable.
In further steps, we test the log of real GDP per capita (column 3) as well as the logarithm
6/17
HCED 61 – The future development of world records
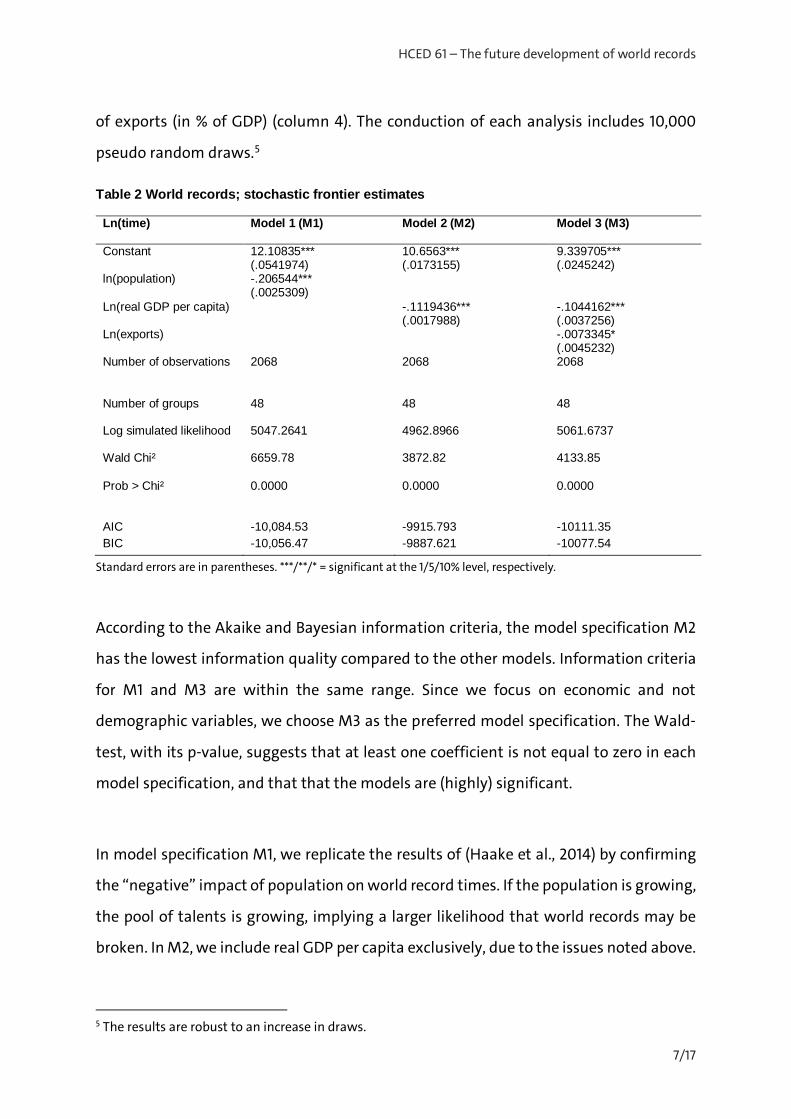
of exports (in % of GDP) (column 4). The conduction of each analysis includes 10,000
pseudo random draws.5
Table 2 World records; stochastic frontier estimates
Ln(time) Model 1 (M1)
Model 2 (M2) Model 3 (M3)
Constant 12.10835*** (.0541974)
10.6563*** (.0173155)
9.339705*** (.0245242)
ln(population) -.206544*** (.0025309)
Ln(real GDP per capita) -.1119436*** (.0017988)
-.1044162*** (.0037256)
Ln(exports) -.0073345* (.0045232)
Number of observations 2068 2068 2068
Number of groups 48 48 48
Log simulated likelihood 5047.2641 4962.8966 5061.6737
Wald Chi² 6659.78 3872.82 4133.85
Prob > Chi² 0.0000 0.0000 0.0000
AIC -10,084.53 -9915.793 -10111.35 BIC -10,056.47 -9887.621 -10077.54
Standard errors are in parentheses. ***/**/* = significant at the 1/5/10% level, respectively.
According to the Akaike and Bayesian information criteria, the model specification M2
has the lowest information quality compared to the other models. Information criteria
for M1 and M3 are within the same range. Since we focus on economic and not
demographic variables, we choose M3 as the preferred model specification. The Wald-
test, with its p-value, suggests that at least one coefficient is not equal to zero in each
model specification, and that that the models are (highly) significant.
In model specification M1, we replicate the results of (Haake et al., 2014) by confirming
the “negative” impact of population on world record times. If the population is growing,
the pool of talents is growing, implying a larger likelihood that world records may be
broken. In M2, we include real GDP per capita exclusively, due to the issues noted above.
5 The results are robust to an increase in draws.
7/17
HCED 61 – The future development of world records
In this model specification as well as in M3, real GDP per capita does have a significantly
negative coefficient in all models, implying a positive impact on athletic performance.
In the last specification, we add exports. The estimated coefficient is significantly
negative (on a 10*-level); higher exports represent a higher degree of openness of
countries trading new technologies and knowledge between each other. This exchange
can positively influence the world record times attained, since athletes may be able to
use these traded goods to improve their performance.
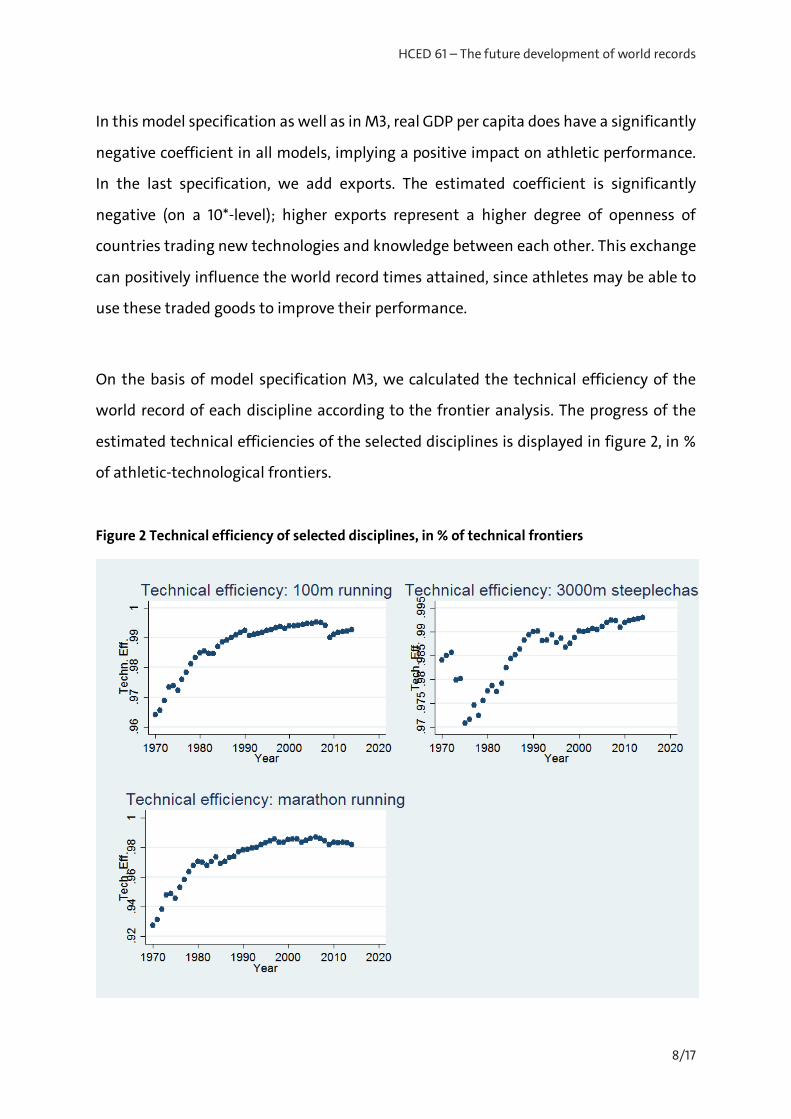
On the basis of model specification M3, we calculated the technical efficiency of the
world record of each discipline according to the frontier analysis. The progress of the
estimated technical efficiencies of the selected disciplines is displayed in figure 2, in %
of athletic-technological frontiers.
Figure 2 Technical efficiency of selected disciplines, in % of technical frontiers
8/17
HCED 61 – The future development of world records
The graphical illustration emphasizes that certain disciplines are close to their current
frontier (the technical efficiency of the 100-m dash and marathon are currently at
0.992/0.981, respectively, in 2014). A technical efficiency of 1 (or near one) indicates that
world records are very near or are at the frontier.
Forecasting world records
Next, we perform out-of-sample forecasting for the regressors and the dependent
variable. Since the real GDP per capita, population and exports (in % of GDP) are showing
an upward trend in the data, we used the non-seasonal Holt-Winter forecasting method
((Winters, 1960), (Chatfield, 1978), among others). We transformed the forecasted
variables in the same manner as in the first analysis to forecast new world record times
and the technical efficiency.
We could not forecast several disciplines since their estimations did not converge
(potentially due to minimal variance in the data). For the remaining disciplines, a point
forecast was estimated for 2022 (table 3). Our starting point in 2014 is the existing world
record.
9/17
HCED 61 – The future development of world records
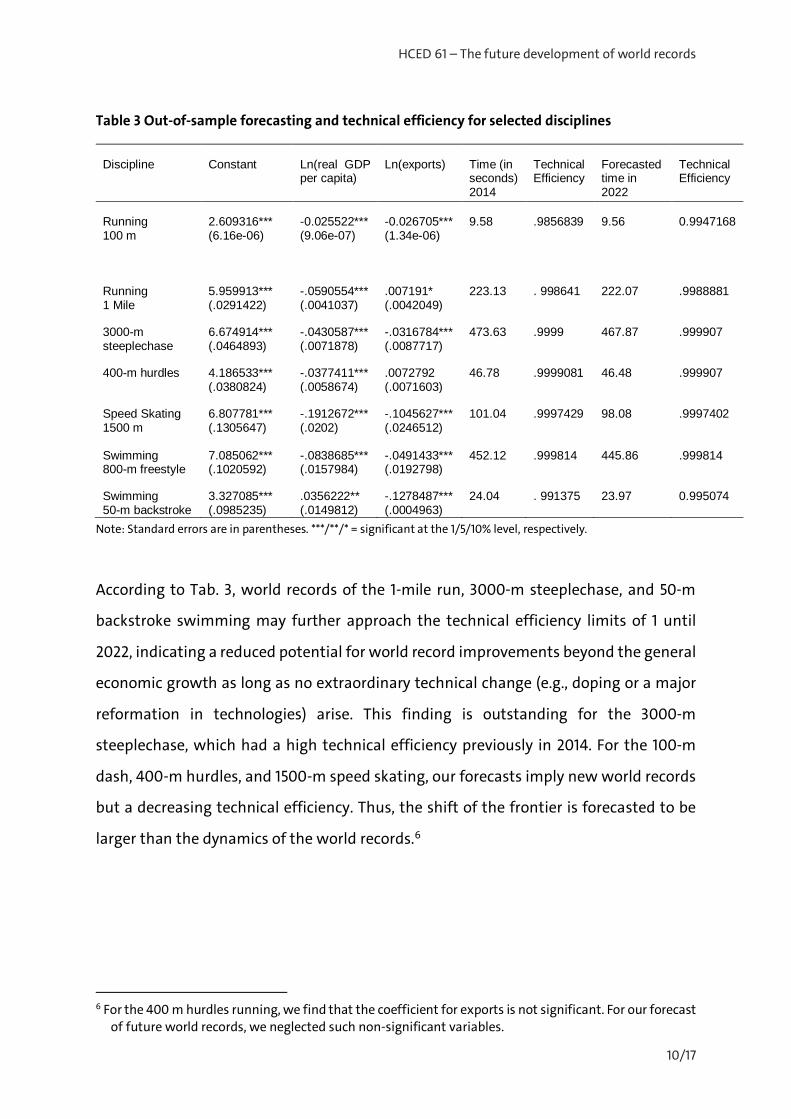
Table 3 Out-of-sample forecasting and technical efficiency for selected disciplines
Discipline Constant Ln(real GDP per capita)
Ln(exports) Time (in seconds) 2014
Technical Efficiency
Forecasted time in 2022
Technical Efficiency
Running 100 m
2.609316*** (6.16e-06)
-0.025522*** (9.06e-07)
-0.026705*** (1.34e-06)
9.58 .9856839 9.56 0.9947168
Running 1 Mile
5.959913*** (.0291422)
-.0590554*** (.0041037)
.007191* (.0042049)
223.13 . 998641 222.07 .9988881
3000-m steeplechase
6.674914*** (.0464893)
-.0430587*** (.0071878)
-.0316784*** (.0087717)
473.63 .9999 467.87 .999907
400-m hurdles 4.186533*** (.0380824)
-.0377411*** (.0058674)
.0072792 (.0071603)
46.78 .9999081 46.48 .999907
Speed Skating 1500 m
6.807781*** (.1305647)
-.1912672*** (.0202)
-.1045627*** (.0246512)
101.04 .9997429 98.08 .9997402
Swimming 800-m freestyle
7.085062*** (.1020592)
-.0838685*** (.0157984)
-.0491433*** (.0192798)
452.12 .999814 445.86 .999814
Swimming 50-m backstroke
3.327085*** (.0985235)
.0356222** (.0149812)
-.1278487*** (.0004963)
24.04 . 991375 23.97 0.995074
Note: Standard errors are in parentheses. ***/**/* = significant at the 1/5/10% level, respectively.
According to Tab. 3, world records of the 1-mile run, 3000-m steeplechase, and 50-m
backstroke swimming may further approach the technical efficiency limits of 1 until
2022, indicating a reduced potential for world record improvements beyond the general
economic growth as long as no extraordinary technical change (e.g., doping or a major
reformation in technologies) arise. This finding is outstanding for the 3000-m
steeplechase, which had a high technical efficiency previously in 2014. For the 100-m
dash, 400-m hurdles, and 1500-m speed skating, our forecasts imply new world records
but a decreasing technical efficiency. Thus, the shift of the frontier is forecasted to be
larger than the dynamics of the world records.6
6 For the 400 m hurdles running, we find that the coefficient for exports is not significant. For our forecast of future world records, we neglected such non-significant variables.
10/17
HCED 61 – The future development of world records
We forecast the largest improvement for world records for speed skating (improvement
of world record time of 2.92% until 2022). The least dynamic discipline, the 100-m dash,
enjoys a forecasted improvement of 0.2% of the world record time.
Conclusion
We conduct an innovative analysis and forecast athletic world records by using
economic variables and demonstrated that athletic and economic productivity are
driven by similar determinants, also implying potential parallels in their future
developments. We show that most current world records are close to their
technological/ athletic frontier. World record improvements will largely depend on the
extent of the growth in technical frontiers, i.e., of determinants that drive economic
growth as well. If those determinants only display a limited dynamic (as is suggested by
the economic growth literature and by our forecasts), a slowing of the dynamic of world
records may be expected as well.
There are certain caveats. If there are major technological changes and hidden abuses
of medical and pharmaceutical progress that are not in accordance with general
economic progress, such as a revolution in the bikes for track cycling, our result may be
biased downward.
There is one more insight from our analysis that may motivate further research: The low
rates of economic productivity growth in Western economies in recent years are less
surprising if contrasted with athletic developments.
11/17
HCED 61 – The future development of world records
References
Afonso, A., & Jalles, J. T. (2013). Growth and productivity - The role of government debt.
International Review of Economics and Finance, 25, 384-407.
Aigner, D., Lovell, C. K., & Schmidt, P. (1977). Formulation and estimation of stochastic
frontier production function models. Journal of Econometrics, 6, 21–37.
Baltabaev, B. (2014). Foreign Direct Investment and Total Factor Productivity growth:
New Macro-Evidence. The World Economy, 37(2), 311–334.
Barro, R. J. (1991). Economic Growth in a Cross Section of Countries. The Quarterly Journal
of Economics, 106(2), 407-443.
Bernard, A. B., & Busse, M. R. (2004). Who wins the Olympic Games: economic resources
and medal totals. The Review of Economics and Statistics, 86(1), 413–417.
Byrne, D. M., Fernald, J. G., & Reinsdorf, M. B. (2016). Does the United States Have a
Productivity Slowdown or a Measurement Problem? Brookings Papers on Economic
Activity, Spring, 109–157.
Center for International Comparisons at the University of Pennsylvania (CICUP). (2006).
The Penn World Table. Retrieved from http://pwt.econ.upenn.edu/aboutpwt2.html
Chang, Y. S., & Baek, S. J. (2011). Limit to improvement in running and swimming.
International Journal of Applied Management Science, 3(1), 97–120.
Chatfield, C. (1978). The Holt-Winters Forecasting Procedure. Journal of Royal Statistical
Society. Series C (Applied Statistics), 27(3), 264–279.
Danquah, M., Moral-Benito, E., & Outtara, B. (2014). TFP Growth and its determinants:
nonparametrics and model averaging. Empirical Economics, 47(1), 227–251.
Fair, R. C. (1994). How Fast Do Old Men Slow Down? The Review of Economics and
Statistics, 76(1), 103–118.
Feenstra, R. C., Inklaar, R., & Timmer, M. P. (2015). The Next Generation of the Penn World
Table. American Economic Review, 105(10), 3150–3182.
FINA. (2017). Swimming records. Retrieved from http://www.fina.org/content/
swimming-records
12/17
HCED 61 – The future development of world records
Forrest, D., Sanz, I., & Tena, J. D. (2010). Forecasting national team mdel totals at the
Summer Olympic Games. International Journal of Forecasting, 26, 576–588.
Greene, W. (2005). Fixed and random effects in stochastic frontier models. Journal of
Productivity Analysis, 23(1), 7–32.
Grimes, R. A., Kelly, W. J., & Rubin, P. H. (1974). A socioeconomic model of national
olympic performance. Social Science Quarterly, 55(3), 777–783.
Haake, S. J., Foster, L. I., & James, D. M. (2014). An improvement index to quantify the
evolution of performance in running. Journal of Sports Sciences, 32(7), 610–622.
Hanly, E., Sharp, G., & Friskin, D. (2012). Modelling track records using compound
distributions. Annual Proceedings of the South African Statistical Association
Conference, 1, 50–57.
IAAF. (2017a). European Athletics endorses record ‘revolution’ plan. Retrieved from
https://www.iaaf.org/news/news/european-athletics-records-plan
IAAF. (2017b). Records and lists. Retrieved from https://www.iaaf.org/records/
toplists/sprints/100-metres/outdoor/men/senior/2017
IAAF. (2017c). World Records. Retrieved from https://www.iaaf.org/records/by-cate-
gory/world-records
ISU. (2017). Biographies and Statistics. Retrieved from http://www.isu.org/inside-speed-
skating/entries-results-speed/biographies-
statistics#PageID%3D103004&SportID%3D103&SeasonID%3D-1&ClassID%3D-
1&GenderID%3D1&TaalCode%3D2&StyleID%3D0&Cache%3D2.html?967998
Johnson, D. K., & Ali, A. (2004). A Tale of Two Seasons: Participation and Medal Counts
at the Summer and Winter Olympic Games. Social Science Quarterly, 55(3), 974–993.
Jokl, E. (1964). Health, wealth and athletics. In E. Jokl (Ed.), International Research in sport
and physical education (pp. 218–222). Springfield.
Kumbhakar, S. C., Lien, G., & Hardaker, J. B. (2012). Technical efficiency in ceompting
panel data models: a study of Norwegian grain farming. Journal of Productivity
Analysis. Retrieved from DOI: 10.1007/s11123-012-0303-1
13/17
HCED 61 – The future development of world records
Kuper, G., & Sterken, E. (2007). Modelling the development of world records in running.
In J. Albert & R. H. Koning (Eds.), Statistical Thinking in Sports (pp. 7–32). Boca Raton:
CRC Press.
Lucas, R. E., JR. (1988). On the Mechanics of Economic Development. Journal of Monetary
Economics, 22(1), 3–42.
Maennig, W., & Stobernack, M. (2011). Do men slow down faster than women? Review
of Economics, 62(3), 263–278.
Malmquist, S. (1953). Index numbers and indifference surfaces. Trabajos de Estadistica,
4(2), 209–242.
Miller, S. M., & Upadhyay, M. P. (2000). The Effects of Openness, Trade Orientation and
Human Capital on Total Factor Productivity. Journal of Development Economics,
63(2), 399–423.
Moorsteen, R. H. (1961). On Measuring Productive Potential and Relative Efficiency. The
Quarterly Journal of Economics, 75(3), 451–467.
OECD. (2017). Growth in GDP per capita, productivity and ULC. Retrieved from
http://stats.oecd.org/Index.aspx?DataSetCode=PDB_GR
Péronnet, F., & Thibault, G. (1985). Mathematical analysis of running performance and
world running records. Journal of applied physiology, 67(1), 453–465.
Romer, P. M. (1986). Increasing Returns and Long-run Growth. Journal of Political
Economy, 94(4), 1002–1037.
Solow, R. M. (1956). A Contribution to the Theory of Economic Growth. The Quarterly
Journal of Economics, 70(1), 65–94.
Statistisches Bundesamt. (2017). Detailed gross domestic product results for the 2nd
quarter of 2017. Wiesbaden. Retrieved from https://www.destatis.de/EN/
PressServices/Press/pr/2017/08/PE17_294_811.html
U.S. Bureau of Labour Statistics. (2017). Major Sector Productivity and Costs. Retrieved
from https://data.bls.gov/cgi-bin/surveymost
14/17
HCED 61 – The future development of world records
UCI. (2017). World records. Retrieved from http://www.uci.ch/track/news/article/
world-records/
Volf, P. (2011). A stochastic model of progression of athletic records. IMA Journal of
Management Mathematics, 22, 157–169.
Winters, P. R. (1960). Forecasting Sales by Exponentially Weighted Moving Averages.
Management Science, 6(3), 324–342.
World Bank. (2017). Data Bank. Retrieved from http://databank.worldbank.org/data/
home.aspx
15/17
HCED 61 – The future development of world records
Appendix
Table A1 Disciplines with sound world records included in our analysis
Running Track cycling 60 m
100 m 200 m 200 m 400 m
500 m 1000 m
800 m 1000 m
4000 m
1500 m 1 mile
3000 m 3000-m steeplechase 2 miles
5000 m 10,000 m
21.1 km 42.2 km 110-m Hurdles 400-m Hurdles
4x100-m relay 4x400-m relay 20-km walking 50-km walking
Swimming Speed skating 50-m freestyle 100-m freestyle
500 m 1000 m
200-m freestyle 1500 m 400-m freestyle 3000 m 800-m freestyle 5000 m 1500-m freestyle 50-m backstroke 100-m backstroke 200-m backstroke 50-m breast stroke 100-m breast stroke
10000 m
200-m breast stroke 50-m butterfly 100-m butterfly 200-m butterfly
4x100-m relay 4x200-m relay
16/17
HCED 61 – The future development of world records
Table A2 Proportions of gold, silver and bronze medals won in all (Summer and Winter) Games from 2002-2016 per country
Proportions of medals in all Games from 2002 – 2016 Overall Gold Silver Bronze
1. USA 11,96% 12,88% 11,96% 11,04% 2. Russia 8,15% 7,75% 7,46% 9,25% 3. China 7,71% 10,19% 6,23% 6,68% 4. Germany 6,21% 6,28% 6,56% 5,78% 5. UK 4,64% 5,58% 4,12% 4,24% 6. France 4,20% 3,33% 4,37% 4,88% 7. Australia 3,64% 3,33% 3,86% 3,72% 8. Canada 3,49% 3,14% 3,41% 3,92% 9. Japan 3,36% 2,95% 2,89% 4,24% 10. Italy 3,25% 2,82% 3,08% 3,85% 11. South Korea 3,15% 3,91% 3,02% 2,50% 12. Netherlands 2,70% 2,76% 2,70% 2,63% 13. Norway 2,48% 2,88% 2,06% 2,50% 14. Ukraine 1,77% 1,54% 1,29% 2,50% 15. Switzerland 1,46% 1,79% 0,96% 1,61% 16. Hungary 1,28% 1,73% 1,16% 0,96%
𝚺𝚺 69,45% 72,86% 63,07% 70,3%
Note: Sorted by the proportion of all the medals won in relation to all possible medals. Source: IOC – own calculation of proportions
Table A3 Variance covariance matrix of estimated results from model specification
Frontier Year Year² Ln(population) Ln(real GDP per capita)
Ln(exports) Constant
Year 1.0000
Year² -0.7243 1.0000
Ln (population)
0.1570 -0.0005 1.0000
Ln(Real GDP per capita)
-0.7063 0.3105 -0.4478 1.0000
Ln(exports) -0.2074 -0.2956 -0.0981 -0.0262 1.0000
constant 0.5198 -0.1986 -0.5623 -0.4588 -0.1074 1.0000
Source: Own calculation of proportions
17/17
Hamburg Contemporary Economic Discussions (Download: https://www.wiso.uni-hamburg.de/en/fachbereich-vwl/professuren/maennig/research/hceds.html)
61 KRUSE, F. K. / MAENNIG, W.: The future development of world records, 2017.
60 MAENNIG, W.: Governance in Sports Organizations, 2017.
59 AHLFELDT, G. M. / MAENNIG, W. / FELIX J. RICHTER: Zoning in reunified Berlin, 2017.
58 MAENNIG, W.: Major Sports Events: Economic Impact, 2017.
57 MAENNIG, W.: Public Referenda and Public Opinion on Olympic Games, 2017.
56 MAENNIG, W. / WELLBROCK, C.: Rio 2016: Sozioökonomische Projektion des Olympischen Medaillenrankings, 2016.
55 MAENNIG, W. / VIERHAUS, C.: Which countries bid for the Olympic Games? Economic, political, and social factors and chances of winning, 2016.
54 AHLFELDT, G. M. / MAENNIG, W. / STEENBECK, M.: Après nous le déluge? Direct democracy and intergenerational conflicts in aging societies, 2016.
53 LANGER, V. C. E.: Good news about news shocks, 2015.
52 LANGER, V. C. E. / MAENNIG, W. / RICHTER, F. J.: News Shocks in the Data: Olympic Games and their Macroeconomic Effects – Reply, 2015.
51 MAENNIG, W.: Ensuring Good Governance and Preventing Corruption in the Planning of Major Sporting Events – Open Issues, 2015.
50 MAENNIG, W. / VIERHAUS, C.: Who Wins Olympic Bids? 2015 (3rd version).
49 AHLFELDT, G. M. / MAENNIG, W. / RICHTER, F.: Urban Renewal after the Berlin Wall, 2013.
48 BRANDT, S. / MAENNIG, W. / RICHTER, F.: Do Places of Worship Affect Housing Prices? Evidence from Germany, 2013.
47 ARAGÃO, T. / MAENNIG, W.: Mega Sporting Events, Real Estate, and Urban Social Economics – The Case of Brazil 2014/2016, 2013.
46 MAENNIG, W. / STEENBECK, M. / WILHELM, M.: Rhythms and Cycles in Happiness, 2013.
45 RICHTER, F. / STEENBECK, M. / WILHELM, M.: The Fukushima Accident and Policy Implications: Notes on Public Perception in Germany, 2014 (2nd version).
Hamburg Contemporary Economic Discussions (Download: https://www.wiso.uni-hamburg.de/en/fachbereich-vwl/professuren/maennig/research/hceds.html)
44 MAENNIG, W.: London 2012 – das Ende des Mythos vom erfolgreichen Sportsoldaten, 2012.
43 MAENNIG, W. / WELLBROCK, C.: London 2012 – Medal Projection – Medaillenvorausberechnung, 2012.
42 MAENNIG, W. / RICHTER, F.: Exports and Olympic Games: Is there a Signal Effect? 2012.
41 MAENNIG, W. / WILHELM, M.: Becoming (Un)employed and Life Satisfaction: Asymmetric Effects and Potential Omitted Variable Bias in Empirical Happiness Studies, 2011.
40 MAENNIG, W.: Monument Protection and Zoning in Germany: Regulations and Public Support from an International Perspective, 2011.
39 BRANDT, S. / MAENNIG, W.: Perceived Externalities of Cell Phone Base Stations – The Case of Property Prices in Hamburg, Germany, 2011.
38 MAENNIG, W. / STOBERNACK, M.: Do Men Slow Down Faster than Women? 2010.
37 DU PLESSIS, S. A. / MAENNIG, W.: The 2010 World Cup High-frequency Data Economics: Effects on International Awareness and (Self-defeating) Tourism, 2010.
36 BISCHOFF, O.: Explaining Regional Variation in Equilibrium Real Estate Prices and Income, 2010.
35 FEDDERSEN, A. / MAENNIG, W.: Mega-Events and Sectoral Employment: The Case of the 1996 Olympic Games, 2010.
34 FISCHER, J.A.V. / SOUSA-POZA, A.: The Impact of Institutions on Firms Rejuvenation Policies: Early Retirement with Severance Pay versus Simple Lay-Off. A Cross-European Analysis, 2010.
33 FEDDERSEN, A. / MAENNIG, W.: Sectoral Labor Market Effects of the 2006 FIFA World Cup, 2010.
32 AHLFELDT, G.: Blessing or Curse? Appreciation, Amenities, and Resistance around the Berlin “Mediaspree”, 2010.
Hamburg Contemporary Economic Discussions (Download: https://www.wiso.uni-hamburg.de/en/fachbereich-vwl/professuren/maennig/research/hceds.html)
31 FALCH, T. / FISCHER, J.A.V.: Public Sector Decentralization and School Performance: International Evidence, 2010.
30 AHLFELDT, G. / MAENNIG, W. / ÖLSCHLÄGER, M.: Lifestyles and Preferences for (Public) Goods: Professional Football in Munich, 2009.
29 FEDDERSEN, A. / JACOBSEN, S. / MAENNIG, W.: Sports Heroes and Mass Sports Participation – The (Double) Paradox of the “German Tennis Boom”, 2009.
28 AHLFELDT, G. / MAENNIG, W. / OSTERHEIDER, T.: Regional and Sectoral Effects of a Common Monetary Policy: Evidence from Euro Referenda in Denmark and Sweden, 2009.
27 BJØRNSKOV, C. / DREHER, A. / FISCHER, J.A.V. / SCHNELLENBACH, J.: On the Relation Between Income Inequality and Happiness: Do Fairness Perceptions Matter? 2009.
26 AHLFELDT, G. / MAENNIG, W.: Impact of Non-Smoking Ordinances on Hospitality Revenues: The Case of Germany, 2009.
25 FEDDERSEN, A. / MAENNIG, W.: Wage and Employment Effects of the Olympic Games in Atlanta 1996 Reconsidered, 2009.
24 AHLFELDT, G. / FRANKE, B. / MAENNIG, W.: Terrorism and the Regional and Religious Risk Perception of Foreigners: The Case of German Tourists, 2009.
23 AHLFELDT, G. / WENDLAND, N.: Fifty Years of Urban Accessibility: The Impact of Urban Railway Network on the Land Gradient in Industrializing Berlin, 2008.
22 AHLFELDT, G. / FEDDERSEN, A.: Determinants of Spatial Weights in Spatial Wage Equations: A Sensitivity Analysis, 2008.
21 MAENNIG, W. / ALLMERS, S.: South Africa 2010: Economic Scope and Limits, 2008.
20 MAENNIG, W. / WELLBROCK, C.-M.: Sozio-ökonomische Schätzungen Olympischer Medaillengewinne: Analyse-, Prognose- und Benchmark-möglichkeiten, 2008.
Hamburg Contemporary Economic Discussions (Download: https://www.wiso.uni-hamburg.de/en/fachbereich-vwl/professuren/maennig/research/hceds.html)
19 AHLFELDT, G.: The Train has Left the Station: Real Estate Price Effects of Mainline Realignment in Berlin, 2008.
18 MAENNIG, W. / PORSCHE, M.: The Feel-good Effect at Mega Sport Events – Recommendations for Public and Private Administration Informed by the Experience of the FIFA World Cup 2006, 2008.
17 AHLFELDT, G. / MAENNIG, W.: Monumental Protection: Internal and External Price Effects, 2008.
16 FEDDERSEN, A. / GRÖTZINGER, A. / MAENNIG, W.: New Stadia and Regional Economic Development – Evidence from FIFA World Cup 2006 Stadia, 2008.
15 AHLFELDT, G. / FEDDERSEN, A.: Geography of a Sports Metropolis, 2007.
14 FEDDERSEN, A. / MAENNIG, W.: Arenas vs. Multifunctional Stadia – Which Do Spectators Prefer? 2007.
13 AHLFELDT, G.: A New Central Station for a Unified City: Predicting Impact on Property Prices for Urban Railway Network Extension, 2007.
12 AHLFELDT, G.: If Alonso was Right: Accessibility as Determinant for Attractiveness of Urban Location, 2007.
11 AHLFELDT, G., MAENNIG, W.: Assessing External Effects of City Airports: Land Values in Berlin, 2007.
10 MAENNIG, W.: One Year Later: A Re-Appraisal of the Economics of the 2006 Soccer World Cup, 2007.
09 HAGN, F. / MAENNIG, W.: Employment Effects of the World Cup 1974 in Germany.
08 HAGN, F. / MAENNIG W.: Labour Market Effects of the 2006 Soccer World Cup in Germany, 2007.
07 JASMAND, S. / MAENNIG, W.: Regional Income and Employment Effects of the 1972 Munich Olympic Summer Games, 2007.
06 DUST, L. / MAENNIG, W.: Shrinking and Growing Metropolitan Areas – Asymmetric Real Estate Price Reactions? The Case of German Single-family Houses, 2007.
Hamburg Contemporary Economic Discussions (Download: https://www.wiso.uni-hamburg.de/en/fachbereich-vwl/professuren/maennig/research/hceds.html)
05 HEYNE, M. / MAENNIG, W. / SUESSMUTH, B.: Mega-sporting Events as Experience Goods, 2007.
04 DU PLESSIS, S. / MAENNIG, W.: World Cup 2010: South African Economic Perspectives and Policy Challenges Informed by the Experience of Germany 2006, 2007.
03 AHLFELDT, G. / MAENNIG, W.: The Impact of Sports Arenas on Land Values: Evidence from Berlin, 2007.
02 FEDDERSEN, A. / MAENNIG, W. / ZIMMERMANN, P.: How to Win the Olympic Games – The Empirics of Key Success Factors of Olympic Bids, 2007.
01 AHLFELDT, G. / MAENNIG, W.: The Role of Architecture on Urban Revitalization: The Case of “Olympic Arenas” in Berlin-Prenzlauer Berg, 2007.
04/2006 MAENNIG, W. / SCHWARTHOFF, F.: Stadium Architecture and Regional Economic Development: International Experience and the Plans of Durban, October 2006.
03/2006 FEDDERSEN, A. / VÖPEL, H.: Staatliche Hilfen für Profifußballclubs in fi-nanziellen Notlagen? – Die Kommunen im Konflikt zwischen Ima-geeffekten und Moral-Hazard-Problemen, September 2006.
02/2006 FEDDERSEN, A.: Measuring Between-season Competitive Balance with Markov Chains, July 2006.
01/2006 FEDDERSEN, A.: Economic Consequences of the UEFA Champions League for National Championships – The Case of Germany, May 2006.
04/2005 BUETTNER, N. / MAENNIG, W. / MENSSEN, M.: Zur Ableitung einfacher Multiplikatoren für die Planung von Infrastrukturkosten anhand der Aufwendungen für Sportstätten – eine Untersuchung anhand der Fußball-WM 2006, May 2005.
03/2005 SIEVERS, T.: A Vector-based Approach to Modeling Knowledge in Economics, February 2005.
02/2005 SIEVERS, T.: Information-driven Clustering – An Alternative to the Knowledge Spillover Story, February 2005.

Hamburg Contemporary Economic Discussions (Download: https://www.wiso.uni-hamburg.de/en/fachbereich-vwl/professuren/maennig/research/hceds.html)
01/2005 FEDDERSEN, A. / MAENNIG, W.: Trends in Competitive Balance: Is there Evidence for Growing Imbalance in Professional Sport Leagues? January 2005.