new power cost comparisons - garnaut climate … · new power cost comparisons levelised cost of...
TRANSCRIPT

NEW POWEr cOST cOMPAriSONS
Levelised Cost of Electricity for a Range of New Power Generating Technologies
rePort by the austraLiaN academy of techNoLoGicaL scieNces aNd eNGiNeeriNG (atse)
MArch 2011
New Power cost comParisoNsLevelised cost of electricity for a range of New Power Generating technologiesreport by the australian academy of technological sciences and engineering © Australian Academy of Technological Sciences and Engineering
the australian academy of technological sciences and engineering (atse)

New power cost comparisoNs
Levelised Cost of Electricity for a Range of New Power Generating Technologies
Australian Academy of Technological Sciences and Engineering (ATSE)
MARCh 2011

New Power cost comParisoNs Levelised cost of electricity for a range of New Power Generating technologies
report of a study by the australian academy of technological sciences and engineering (atse)
this work is copyright. apart from any use permitted under the copyright act 1968, no part of it may be reproduced by any process without written permission from the publisher. requests and inquiries concerning reproduction rights should be directed to the publisher.
Publisher:
australian academy of technological sciences and engineering
Level 1/ 1 Bowen crescent
melbourne Victoria 3004 australia
GPo Box 4055
melbourne Victoria 3001 australia
telephone +613/03 9864 0900
Facsimile +613/03 9864 0930
website www.atse.org.au
author: Dr John M Burgess FTSE
Project manager: Dr Vaughan Beck FTSE
this work is also available as a PDF document on the atse website, www.atse.org.au
this report was prepared for and funded by the Garnaut climate change review.
Design and production: coretext, www.coretext.com.au
Printing: FsG Print management, www.fsg.com.au
Date of Publication: march 2011
cover: istockphoto
Disclaimer
Use of the information contained in this report is at the user’s risk. while every effort has been made to ensure the accuracy of that information, the australian academy of technological sciences and engineering does not make any warranty, express or implied, regarding it.

LEVELISED COST OF ELECTRICITY w
ww
.atse.org.au
3the australian academy of technological sciences and engineering (atse)
Summary
Levelised cost of electricity (LCOE), which is used as a common cost measure for testing financial viability of power generation, is calculated here for a range of emerging power generation technologies using a financial model developed for a recent Australian Academy of Technological Sciences and Engineering report. The methodology allows data originating from different sources, in particular from that ATSE report and from earlier reviews from Garnaut and the Treasury, to be compared on a common basis, and recent cost trends to be identified.
In order to compare the LCOEs calculated in this report on a common basis, the capital costs, operating costs, and thermal efficiencies in two data sets have been used as input to the ATSE LCOE calculation. The two data sets considered are referred to in this report as the ‘AEMO’ data and the ‘previous Garnaut’ data. The ‘AEMO’ data set is based on a recent reference data set published by the Australian Energy Market Operator, while the ‘previous Garnaut’ data set is based on data published by the Australian Government Treasury in 2008. In order to undertake the levelised cost of electricity calculation, common financial assumptions have been made for both these data sets. This includes assuming a CO2 price according to scenario CPRS -5 defined in the previous Garnaut/Treasury studies, assuming a Renewable Energy Certificate price of $50/MWh, and assuming the cost of capital from the previous Garnaut/Treasury study. In this way, the calculated LCOEs in this report are essentially comparing the differences associated with the two data sets under the same calculation assumptions. Because of the specific financial assumptions assumed in this work, the LCOEs reported here cannot be directly compared with those reported in either the ATSE report or the Treasury report. Further details on the assumptions used may be found in the Appendix to this report.
The results in this report comprise two sets of calculated LCOEs based on the ‘previous Garnaut’ data and on the ‘AEMO’ data, together with the assumptions noted above. The results comparing these show that:
¢�The fossil fuel-based technologies based on extension of current technologies (such as Combined Cycle Gas Turbines and pulverised coal boilers under supercritical steam conditions, with and without Carbon Capture and Storage), have similar levelised costs of electricity, with the results from the ‘AEMO’ data being slightly higher in the short-to-medium term.
¢�Newer coal-based technologies, such as Integrated Gasification Combined Cycle, with and without carbon capture and storage, have higher levelised costs of electricity in the case of the ‘AEMO’ data.
¢�For the renewable technologies, geothermal has higher levelised electricity costs for the ‘AEMO’ data, while solar technologies are predicted to have lower costs for the ‘AEMO’ data due to increased rates of technology learning into the future in this recent data set.
¢�Although biomass combustion has a higher levelised cost using the ‘AEMO’ data, this technology still has lower calculated levelised costs than many of the other technologies.
The LCOE method, which assumes a constant real CO2 and electricity price after the investment year, tends to favour fossil fuel technologies emitting CO2.

LEVELISED COST OF ELECTRICITY
4
ww
w.a
tse.
org.
au
the australian academy of technological sciences and engineering (atse)
Costs of Electricity GenerationMethodologyAny organisation investing in technology, such as an electricity generating company, must earn at least the cost of the capital it has borrowed from both equity investors and lending institutions in order to remain financially viable. The capital cost is an important component but is only one constituent of the overall financial viability of a technology. In addition, other costs such as variable and fixed operating costs and charges such as a CO2 price must be taken into account.
The key parameter that is used to judge the investment success of a technology is the Net Present Value (NPV), which is the value of the investment today taking both the capital cost and other costs into account, together with revenue. The NPV is calculated by determining the free cash flows each year from the investment, including the negative cash flows while the facility is being constructed, and discounting these cash flows to the present time using the cost of capital of the company. Details of this method to calculate NPV may be found in an earlier ATSE report, Low Carbon Energy (ref. 1).
When the NPV is zero, the company is just earning the cost of capital, taking into account the tax deductibility of interest and the cost of equity. By adjusting the constant real electricity price over the life of the facility to achieve NPV = 0, the price of electricity to just make the technology economically viable can be obtained. This is termed the Levelised Cost of Electricity (LCOE). This parameter has been calculated in this report using the ATSE methodology. The assumptions used here are given in detail in the Appendix to this report.
technologies consideredThe following technologies are considered:¢�Combined Cycle Gas Turbine (CCGT)¢�Combined Cycle Gas Turbine plus Carbon Capture and Storage (CCGT + CCS)¢�Black Coal Supercritical (SC)¢�Brown Coal Supercritical (SC)¢�Black Coal Integrated Gasification Combined Cycle (IGCC)¢�Black Coal Supercritical (SC) plus Carbon Capture and Storage (CCS)¢�Black Coal IGCC plus Carbon Capture and Storage (CCS)¢�Brown Coal Supercritical (SC) plus Carbon Capture and Storage (CCS)¢�Wind¢�Solar (Thermal) Central Receiver, without heat storage¢�Solar Photovoltaic in a Flat Plate configuration¢�Solar Photovoltaic (PV) with twin axis tracking¢�Geothermal – Enhanced Geothermal System (EGS) or ‘Hot Rock Geothermal’¢�Biomass steam generation (e.g. bagasse)

LEVELISED COST OF ELECTRICITY w
ww
.atse.org.au
5the australian academy of technological sciences and engineering (atse)
Some other technologies, such as Nuclear Generation Three (Gen III), not considered in the earlier Garnaut study are not included here. While the reference data set compiled by the Australian Energy Market Operator/Department of Energy, Resources and Tourism (‘AEMO’ data) does not include any data for Nuclear Gen III, the earlier ATSE report (ref. 1) does contain comparisons of Nuclear Gen III with most of the above technologies based on EPRI data commissioned for a recent DRET report (see below) and concludes that in purely financial terms this technology is competitive with many of the others.
capital costs, therMal efficiencies and operating costsThe data from the previous Garnaut and Treasury reports (ref. 2 & 3) (‘previous Garnaut’ data) have been compared in this report with the recent (2010) data (‘AEMO’ data) published by the Australian Energy Market Operator (AEMO) (ref. 4) that relied on a report by the Electric Power Research Institute (EPRI) for DRET (ref. 5). This latter set of data was moderated by ACIL Tasman (ref. 6) and peer-reviewed by a reference group under the auspices of AEMO.
Recently (2011), the ‘AEMO’ data set has been further reviewed in a report by Worley Parsons (ref. 7), which mostly agreed with the data but noted that the future costs of the technologies will be affected by the $AU:$US exchange rate and future global scenarios.
There is the possibility for future rapid change in all these data sets depending on the development and penetration of the technologies into the market place and their success.
capital costsThe capital cost of a technology is expressed as the cost per unit generating capacity of a plant. It is an important component in influencing the cost of electrical energy (the LCOE as used here) from that plant, and it is useful to examine the differences in capital costs between the current reference AEMO data set and the previous Garnaut study. The raw data from the two studies show that capital costs and their learning curves have changed since the previous Garnaut report, as shown in Figures 1 to 3. In the case of brown coal with CCS, the ‘AEMO’ data used a pulverised coal supercritical steam boiler,
7000
6000
5000
4000
3000
2000
1000
0
$
Figure 1 Comparison of technology capital costs ($/kW) for 2015
Wind
CCGT + CCSCCGT
Solar Therm
al
Tower
Black Coal S
C
Black Coal
IGCC +CCS
Black Coal
SC+CCS
Biomass – Steam
Brown Coal S
C
Brown Coal
SC+CCSSolar P
V
Twin TrackSolar P
V
Flate plate
Black Coal IG
CC
Geotherm
al
(best
regions)
Garnaut Capital ($/kW) AEMO Capital ($/kW)

LEVELISED COST OF ELECTRICITY
6
ww
w.a
tse.
org.
au
the australian academy of technological sciences and engineering (atse)
while the ‘previous Garnaut’ data used gasification technologies. The two data sets are therefore not directly comparable, and only the ‘AEMO’ data for the Brown Coal SC + CCS is included in this report. Similarly, Solar PV Flat Plate was not considered in the ‘previous Garnaut’ data.
Fossil fuels: Capital costs for coal-based technologies have increased in the ‘AEMO’ data, especially for technologies using carbon capture and storage (CCS). This effect is more pronounced in the near- to medium-term and for technologies that are more embryonic, such as coal IGCC. Gas-based technology capital costs and learning curves have remained similar to the ‘previous Garnaut’ data.
Renewables: Capital cost comparisons for renewables vary depending on the technology. For wind, the capital costs are slightly higher in the near term in the ‘AEMO’ data, but almost equivalent in the longer term to the ‘previous Garnaut’ data. Solar capital costs, especially for concentrating solar thermal in the form of a central receiver, show steeper learning curves in the ‘AEMO’ data. Geothermal now has significantly higher capital costs in all years in the ‘AEMO’ data. Biomass capital costs have now increased and show a shallow learning curve when compared with the ‘previous Garnaut’ data.
7000
6000
5000
4000
3000
2000
1000
0
$
Figure 2 Comparison of technology capital costs ($/kW) for 2030
Garnaut Capital 2030 ($/kW) AEMO Capital 2030 ($/kW)
Wind
CCGT + CCSCCGT
Solar Therm
al
Tower
Black Coal S
C
Black Coal
IGCC +CCS
Black Coal
SC+CCS
Biomass – Steam
Brown Coal S
C
Brown Coal
SC+CCSSolar P
V
Twin TrackSolar P
V
Flate plate
Black Coal IG
CC
Geotherm
al
(best
regions)
7000
6000
5000
4000
3000
2000
1000
0
$
Figure 3 Comparison of technology capital costs ($/kW) for 2040
Garnaut Capital 2040 ($/kW) AEMO Capital 2040 ($/kW)
Wind
CCGT + CCSCCGT
Solar Therm
al
Tower
Black Coal S
C
Black Coal
IGCC +CCS
Black Coal
SC+CCS
Biomass – Steam
Brown Coal S
C
Brown Coal
SC+CCSSolar P
V
Twin TrackSolar P
V
Flate plate
Black Coal IG
CC
Geotherm
al
(best
regions)

LEVELISED COST OF ELECTRICITY w
ww
.atse.org.au
7the australian academy of technological sciences and engineering (atse)
thermal efficienciesThermal efficiencies used for gas-based technologies are slightly lower in the ‘AEMO’ data compared with the ‘previous Garnaut’ data. For the coal-based technologies, thermal efficiencies are slightly higher for the technologies that are an extension of current designs in the ‘AEMO’ data, such as supercritical pulverised coal boilers, but are lower for the new technologies such as IGCC compared with the ‘previous Garnaut’ data.
operating costsVariable and fixed operating costs are generally higher in the ‘AEMO’ data. In the case of IGCC and the technologies involving CCS, variable operating costs are significantly higher than the ‘previous Garnaut’ data.

LEVELISED COST OF ELECTRICITY
8
ww
w.a
tse.
org.
au
the australian academy of technological sciences and engineering (atse)
Levelised Costs of ElectricityGraphs of levelised costs of electricity for the different technologies, comparing the recent ‘AEMO’ data with the ‘previous Garnaut’ data, are shown in Figures 4 and 5 below. These LCOE calculations have been performed with common financial assumptions made for both data sets. This includes assuming a CO2 price according to scenario CPRS -5 defined in the previous Garnaut/Treasury studies, assuming a Renewable Energy Certificate price of $50/MWh to 2030, and assuming the cost of capital from the previous Garnaut/Treasury study. In this way, the calculated LCOEs in this report are essentially comparing the differences associated with the two data sets under the same calculation assumptions.
In summary, over the period 2015 to 2040, the levelised costs of electricity based on the ‘AEMO’ data and the ‘previous Garnaut’ data, both calculated by the ATSE free cash flow model under the assumptions outlined in the Summary and detailed in the Appendix, show that:¢�Gas-based technology has similar LCOE for both sets of data.¢�Coal-based technologies without CCS that are extensions of existing technology have calculated
LCOEs that are much the same for both the ‘AEMO’ and ‘previous Garnaut’ data, especially in the longer term.
¢�More complex coal-based technologies, including those with CCS, have higher LCOEs calculated using the ‘AEMO’ data.
¢�Geothermal EGS technology has a higher LCOE for the ‘AEMO’ data.¢�Solar technologies have lower LCOEs for the ‘AEMO’ data due to faster technology learning in this
data set.¢�Biomass generation with steam has a higher LCOE in the ‘AEMO’ data due to higher capital costs.
It is assumed in this report that geological sequestration of CO2 will not be ready for commercialisation before 2020 in Australia. In the detailed information that follows, the results for 2015 therefore do not contain LCOEs for technologies that include CCS.
More detailed comments on the LCOEs calculated from the two data sets are as follows:
lcoes for fossil fuel technologiesLCOEs for gas CCGT and gas CCGT+CCS calculated here from the ‘AEMO’ data and the ‘previous Garnaut’ data are essentially the same. The gas-based technologies both converge on a LCOE of around $100/MWh in 2040 with a real increase in gas prices of around 2% per year and the CPRS -5 CO2 price trajectory.
Coal-based technologies without CCS that are extensions of existing technology, such as supercritical pulverised coal boilers, similarly have LCOEs that are much the same for the ‘AEMO’ data and the ‘previous Garnaut’ data. These converge on around $110/MWh for black coal and $120/MWh for brown coal in 2040 from the calculations here. However, new coal technologies such as IGCC have significantly higher LCOEs in the near- and medium-term in the case of the ‘AEMO’ data. Coal technologies with CCS have a higher LCOE than those without CCS due to their higher capital costs. For the ‘AEMO’ data, these converge to around $150/MWh by 2040.

LEVELISED COST OF ELECTRICITY w
ww
.atse.org.au
9the australian academy of technological sciences and engineering (atse)
$
Figure 4 Levelised costs of electricity ($/MWh) for di�erent fossil fuel-based technologies from the two data sets
Year 2015 Year 2020
Figure 4a: Black Coal SC
Year 2030 Year 2040
LCOE ’previous Garnaut’ data ($/MWh)LCOE ’AEMO’ ($/MWh)
$
Year 2015 Year 2020
Figure 4b: Black Coal IGCC
Year 2030 Year 2040
$
Year 2015 Year 2020
Figure 4c: Brown Coal SC
Year 2030 Year 2040
$
Year 2015 Year 2020
Figure 4d: CCGT
Year 2030 Year 2040
$
Year 2020
Figure 4e: Black Coal SC + CCS
Year 2030 Year 2040
Year 2020 Year 2030 Year 2040
Year 2020 Year 2030 Year 2040
$Figure 4f: Black Coal IGCC + CCS
$Figure 4h: CCGT + CCS
Year 2020 Year 2030 Year 2040
$Figure 4g: Brown Coal SC + CCS
250
200
150
100
50
0
250
200
150
100
50
0
250
200
150
100
50
0
250
200
150
100
50
0
250
200
150
100
50
0
250
200
150
100
50
0
LCOE ’previous Garnaut’ data ($/MWh)LCOE ’AEMO’ ($/MWh)
LCOE ’previous Garnaut’ data ($/MWh)LCOE ’AEMO’ ($/MWh)
LCOE ’previous Garnaut’ data ($/MWh)LCOE ’AEMO’ ($/MWh)
LCOE ’previous Garnaut’ data ($/MWh)LCOE ’AEMO’ ($/MWh)
LCOE ’AEMO’ ($/MWh)
LCOE ’previous Garnaut’ data ($/MWh)LCOE ’AEMO’ ($/MWh)
LCOE ’previous Garnaut’ data ($/MWh)LCOE ’AEMO’ ($/MWh)
250
200
150
100
50
0
250
200
150
100
50
0

LEVELISED COST OF ELECTRICITY
10
ww
w.a
tse.
org.
au
the australian academy of technological sciences and engineering (atse)
The effect of an imposed CO2 price is to increase LCOEs over time for the technologies without CCS and to decrease LCOEs over time for the technologies with CCS. Coal technologies, both with and without CCS, converge on LCOEs between $120 and $150/MWh in 2040 with the imposition of the CO2 price given by the previous Garnaut/Treasury modelling studies (CPRS -5) and under the other assumptions given in the Appendix.
$
Figure 5 Levelised costs of electricity ($/Mwh) for di�erent renewable technologies from the two data sets
Year 2015 Year 2020
Figure 5a: Geothermal EGS
Year 2030 Year 2040
$
Year 2015 Year 2020
Figure 5b: Wind
Year 2030 Year 2040
300
250
200
150
100
50
0
$
Year 2015 Year 2020
Figure 5c: Solar Thermal Central Receiver
Year 2030 Year 2040
Year 2015 Year 2020 Year 2030 Year 2040
300
250
200
150
100
50
0
$
Year 2015 Year 2020
Figure 5d: Solar PV Twin Axis Tracking
Year 2030 Year 2040
$Figure 5f: Biomass – Steam
LCOE ’previous Garnaut’ data ($/MWh)LCOE ’AEMO’ ($/MWh)
LCOE ’previous Garnaut’ data ($/MWh)LCOE ’AEMO’ ($/MWh)
LCOE ’previous Garnaut’ data ($/MWh)LCOE ’AEMO’ ($/MWh)
350
300
250
200
150
100
50
0
$
Year 2015 Year 2020
Figure 5e: Solar PV Flat Plate
Year 2030 Year 2040
LCOE ’AEMO’ ($/MWh)
LCOE ’previous Garnaut’ data ($/MWh)LCOE ’AEMO’ ($/MWh)
LCOE ’previous Garnaut’ data ($/MWh)LCOE ’AEMO’ ($/MWh)
250
200
150
100
50
0
250
200
150
100
50
0
250
200
150
100
50
0

LEVELISED COST OF ELECTRICITY w
ww
.atse.org.au
11the australian academy of technological sciences and engineering (atse)
lcoes for renewable technologiesWith a reasonable assumed price on a Renewable Energy Certificate ($50/MWh) until 2030 in the calculations in this report, the LCOEs of wind and geothermal are relatively constant over the period from 2015 to 2040. For wind, the LCOE is similar when calculated from both the ‘AEMO’ data and the ‘previous Garnaut’ data, with a slightly higher value in the near term for the ‘AEMO’ data. Wind technology converges on an LCOE of around $90/MWh in 2040. For geothermal EGS, the ‘AEMO’ data shows a higher LCOE for the whole time period 2015-2040 at around $120/MWh, compared with around $80/MWh for the LCOE calculated from the ‘previous Garnaut’ data, a significant difference. This is due to the higher estimated capital costs in the ‘AEMO’ data.
For solar technologies, the most recent ‘AEMO’ data show an improved rate of learning for capital cost. Early in the period solar technologies have high calculated LCOEs at around $200 to $250/MWh, but this rapidly improves to around $120 to $150/MWh in 2040. Solar thermal technologies involving a central concentrating tower, in particular, show a higher rate of learning in the LCOEs calculated from the recent ‘AEMO’ data compared with those calculated from the ‘previous Garnaut’ data.
Biomass technologies generating steam in boilers show an increasing LCOE with time as RECs diminish, and also show a higher LCOE when calculated from the ‘AEMO’ data. Even so, biomass technologies have an LCOE in both cases of around $40 to $60/MWh in 2015 and $80 to $100/MWh in 2040 and are therefore competitive over the full time period provided biomass fuel prices are reasonably low.

LEVELISED COST OF ELECTRICITY
12
ww
w.a
tse.
org.
au
the australian academy of technological sciences and engineering (atse)
Technology Cost ComparisonsAs a summary, Figures 6 to 8 show the relativities between the various technology LCOEs for the years 2020, 2030 and 2040, sorted in terms of the ‘AEMO’ data from lowest LCOE to highest and comparing both the ‘AEMO’ data and the ‘previous Garnaut’ data in terms of calculated LCOE.
Comparing the years in question, it can be seen that the calculated LCOEs for the technologies generally decrease over time and this is attributable to technology learning. However, relativities are also modified by the influence of RECs for the renewable technologies and by the CO2 price for the fossil fuel technologies emitting CO2. In particular, the high rate of learning assumed for solar technologies in the ‘AEMO’ data compared to the LCOEs calculated from the ‘previous Garnaut’ data is evident in these diagrams.
The results show that, overall, the following technologies should have the lowest LCOEs in the short to medium term (10 to 20 years) under the assumptions used here:¢�Biomass firing¢�Gas firing with CCGT, with CCS later in the period¢�Wind¢�Black Coal firing with supercritical steam (even with a CO2 price penalty constant over the life of
the facility)
In the longer term (20 to 30 years), the results show that the following technologies should have the lowest LCOEs:¢�Wind¢�Gas firing with CCGT with and without CCS¢�Biomass firing¢�Solar thermal central receiver technologies¢�Geothermal technologies¢�Black Coal firing with supercritical steam (even with the associated CO2 price penalty).
350
300
250
200
150
100
50
0
$
Figure 6 LCOEs ($/MWh) for di�erent technologies in 2020
LCOE ‘AEMO’ dataLCOE ‘previous Garnaut’ data
Wind
CCGT + CCSCCGT
Solar Therm
al
Tower
Black Coal S
C
Black Coal S
C
+ CCS
Biomass –
Steam
Brown Coal S
C
Solar PV
Flat Plate
Solar PV
Twin Track
Black Coal IG
CC
Black Coal IG
CC
+CCS
Brown Coal S
C
+CCS
Geotherm
al
(best
regions)

LEVELISED COST OF ELECTRICITY w
ww
.atse.org.au
13the australian academy of technological sciences and engineering (atse)
It should be noted in these comparisons that the LCOE method, which assumes a constant real CO2 and electricity price after the investment year, tends to favour fossil fuel technologies emitting CO2. Also, the CPRS -5 assumption adopted for this report is at the low end of the possible CO2 price trajectories into the future, and this also tends to favour fossil fuel technologies without CCS. In the ATSE report, a new method based on Option Value Analysis, where both the electricity price and the CO2 price were assumed to increase during the life of the investment, gave very little, if any, value to the coal-based technologies without CCS. This was due to the large and increasing CO2 cost impost over time under the mid-range CO2 price scenario assumed in the option value method. The option value method may therefore give a better indication of the financial viability of these technologies than LCOE under these conditions.
350
300
250
200
150
100
50
0
$
Figure 7 LCOEs ($/MWh) for di�erent technologies in 2030
LCOE ‘AEMO’ dataLCOE ‘previous Garnaut’ data
Wind
CCGT + CCSCCGT
Solar Therm
al
Tower
Black Coal S
C
Black Coal S
C
+ CCSBiomass
–
Steam
Brown Coal S
C
Solar PV
Flat Plate
Solar PV
Twin Track
Black Coal IG
CC
Black Coal IG
CC
+CCS
Brown Coal S
C
+CCS
Geotherm
al
(best
regions)
350
300
250
200
150
100
50
0
$
Figure 8 LCOEs ($/MWh) for di�erent technologies in 2040
LCOE ‘AEMO’ dataLCOE ‘previous Garnaut’ data
Wind
CCGT + CCSCCGT
Solar Therm
al
Tower
Black Coal S
C
Black Coal S
C
+ CCSBiomass
–
Steam
Brown Coal S
C
Solar PV
Flat Plate
Solar PV
Twin Track
Black Coal IG
CC
Black Coal IG
CC
+CCS
Brown Coal S
C
+CCS
Geotherm
al
(best
regions)

LEVELISED COST OF ELECTRICITY
14
ww
w.a
tse.
org.
au
the australian academy of technological sciences and engineering (atse)
ConclusionsThe ATSE financial model allows future electricity costs derived from ‘previous Garnaut’ data and more recent ‘AEMO’ data to be compared on a consistent basis using common assumptions.
Fossil fuel-based technologies that can be regarded as further developments of current technologies have similar levelised costs of electricity in the two cases. They include combined cycle gas turbines and pulverised coal boilers under supercritical steam conditions, with and without carbon capture and storage. In the case of gas firing, however, this conclusion does depend on the future domestic price of natural gas in Australia.
Newer coal-based technologies, such as integrated gasification combined cycle, with and without carbon capture and storage, are calculated here using ‘AEMO’ data to have higher levelised costs of electricity than those calculated using the ‘previous Garnaut’ data. This is mainly because predicted capital costs of these technologies have increased over the intervening period.
The renewable technologies are shown to benefit from the renewable energy certificate scheme if REC prices are reasonably high in the short to medium term. Geothermal energy generation is estimated using ‘AEMO’ data to have higher levelised costs of electricity than the ‘previous Garnaut’ data, while solar technologies are predicted to have lower costs using the ‘AEMO’ data because the relevant rates of technology learning have recently increased. Wind is estimated to have higher initial costs using the ‘AEMO’ data than the ‘previous Garnaut’ data, but similar levelised cost of electricity in the longer term. Although biomass combustion has somewhat higher levelised costs using the ‘AEMO’ data, this technology still has lower levelised costs than many other technologies if biomass fuel prices remain low.
The levelised costs of electricity presented in this report are those estimated at a particular point in time with particular assumptions using two different data sets. These costs are likely to change with time and in some cases may change suddenly with technology breakthroughs or failures. An analysis of the type in this report should be repeated regularly with the latest data as input.
LEVELISED COST OF ELECTRICITY w
ww
.atse.org.au
15the australian academy of technological sciences and engineering (atse)
AppendixassuMptionsLCOE calculations were undertaken according to the methodology given in the ATSE report Low Carbon Energy (ref. 1) using a discounted free cash flow method for all years during the life of the facility, with the levelised costs of electricity being that constant real price received by the generator that yields sufficient revenue to meet the after tax cost of debt and the cost of equity (i.e. yields a zero net present value).
In all cases the capital costs, variable and fixed operating costs, and efficiencies from the above reports, over time, were incorporated into the financial model for the investment year in question. The ‘previous Garnaut’ data were taken from Table 2-1 ‘Technology costs and performance assumptions, mid 2007 dollar terms’ in the Treasury report (ref. 3, page 26).
For the ‘AEMO’ data, capital costs and parameters such as capacity factors were taken from the AEMO/DRET reference data set (ref. 4) and the report prepared by EPRI for DRET (ref. 5). An average value of the five AEMO scenarios was taken for the capital cost data. Parameter values for 2040 in the case of the AEMO data were extrapolated from the 2030 data, as in the ATSE report (ref. 1).
The capital costs used in the calculations are the average of the five AEMO scenarios given in the AEMO data set.
In the LCOE comparisons, the cost of capital (WACC) in all cases was taken from the 2008 Treasury report (ref. 3, page 70). That is, the cost of debt was assumed as 7.3%, the cost of equity 17% and the debt-to-equity ratio 75%. This gave a pre-tax cost of capital of 9.7% and a post-tax cost of capital of 8.1%. In the calculations in this report, discounting at the after-tax cost of capital was used to account for interest charges during construction and during the life of the facility. Since the cost of capital and the CO2 price assumed in this work are different from the previous ATSE study, the LCOE results presented here are not the same as in the previous ATSE work (ref 1).
Construction profiles for each technology (years to construct and proportion of capital expenditure each year) were taken from the ‘AEMO’ data (ref. 4) for both the ‘AEMO’ data and the ‘previous Garnaut’ data comparisons. Facility life after construction was taken from the previous Treasury report (ref. 3, Table 2-1, page 26) and ‘AEMO’ data (ref. 4), for the ‘AEMO’ data and ‘previous Garnaut’ data, respectively.
Thermal efficiencies (where appropriate) were taken from the previous Treasury and ‘AEMO’ data sets (refs. 3 and 4), including learning over time for each of the technologies.
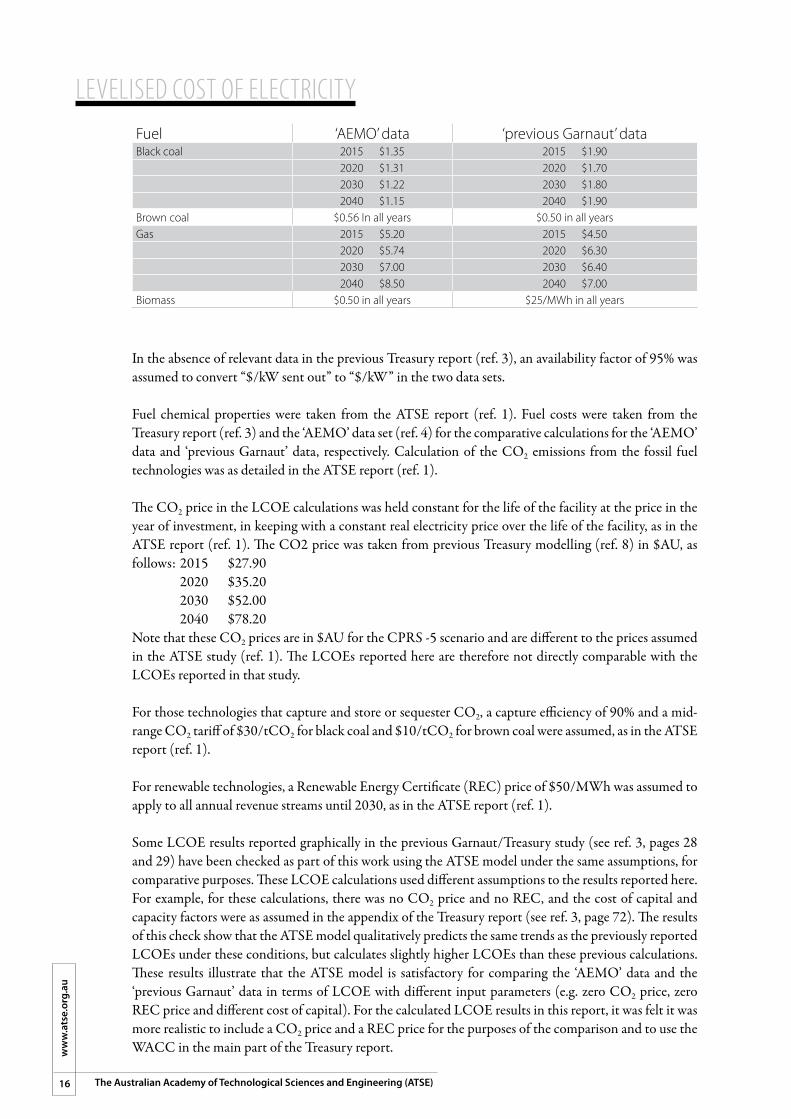
Fuel prices for the LCOE calculations were taken from the AEMO reference data (ref. 4) as an average for the ‘AEMO’ data, and from the Treasury report (ref. 3, page 23) for the ‘previous Garnaut’ data. The fuel prices assumed are shown in the table below in $/GJ, except for biomass in the ‘previous Garnaut’ data, which is expressed in $/MWh (ref. 3, page 74).
Capacity factors for solar energy in all cases were taken from the ‘AEMO’ data (ref. 4) incorporating the EPRI report data (ref. 5).
LEVELISED COST OF ELECTRICITY
16
ww
w.a
tse.
org.
au
the australian academy of technological sciences and engineering (atse)
In the absence of relevant data in the previous Treasury report (ref. 3), an availability factor of 95% was assumed to convert “$/kW sent out” to “$/kW” in the two data sets.
Fuel chemical properties were taken from the ATSE report (ref. 1). Fuel costs were taken from the Treasury report (ref. 3) and the ‘AEMO’ data set (ref. 4) for the comparative calculations for the ‘AEMO’ data and ‘previous Garnaut’ data, respectively. Calculation of the CO2 emissions from the fossil fuel technologies was as detailed in the ATSE report (ref. 1).
The CO2 price in the LCOE calculations was held constant for the life of the facility at the price in the year of investment, in keeping with a constant real electricity price over the life of the facility, as in the ATSE report (ref. 1). The CO2 price was taken from previous Treasury modelling (ref. 8) in $AU, as follows: 2015 $27.90 2020 $35.20 2030 $52.00 2040 $78.20Note that these CO2 prices are in $AU for the CPRS -5 scenario and are different to the prices assumed in the ATSE study (ref. 1). The LCOEs reported here are therefore not directly comparable with the LCOEs reported in that study.
For those technologies that capture and store or sequester CO2, a capture efficiency of 90% and a mid-range CO2 tariff of $30/tCO2 for black coal and $10/tCO2 for brown coal were assumed, as in the ATSE report (ref. 1).
For renewable technologies, a Renewable Energy Certificate (REC) price of $50/MWh was assumed to apply to all annual revenue streams until 2030, as in the ATSE report (ref. 1).
Some LCOE results reported graphically in the previous Garnaut/Treasury study (see ref. 3, pages 28 and 29) have been checked as part of this work using the ATSE model under the same assumptions, for comparative purposes. These LCOE calculations used different assumptions to the results reported here. For example, for these calculations, there was no CO2 price and no REC, and the cost of capital and capacity factors were as assumed in the appendix of the Treasury report (see ref. 3, page 72). The results of this check show that the ATSE model qualitatively predicts the same trends as the previously reported LCOEs under these conditions, but calculates slightly higher LCOEs than these previous calculations. These results illustrate that the ATSE model is satisfactory for comparing the ‘AEMO’ data and the ‘previous Garnaut’ data in terms of LCOE with different input parameters (e.g. zero CO2 price, zero REC price and different cost of capital). For the calculated LCOE results in this report, it was felt it was more realistic to include a CO2 price and a REC price for the purposes of the comparison and to use the WACC in the main part of the Treasury report.
Fuel ‘AEMO’ data ‘previous Garnaut’ dataBlack coal 2015 $1.35 2015 $1.90
2020 $1.31 2020 $1.702030 $1.22 2030 $1.802040 $1.15 2040 $1.90
Brown coal $0.56 In all years $0.50 in all yearsGas 2015 $5.20 2015 $4.50
2020 $5.74 2020 $6.302030 $7.00 2030 $6.402040 $8.50 2040 $7.00
Biomass $0.50 in all years $25/MWh in all years

LEVELISED COST OF ELECTRICITY w
ww
.atse.org.au
17the australian academy of technological sciences and engineering (atse)
References1 Low Carbon Energy: Evaluation of New Energy Technology Choices for Electric Power generation
in Australia, Australian Academy of Technological Sciences and Engineering (ATSE), November 2010. http://www.atse.org.au/events/55-public-lectures/226-official-launch-of-new-study-report-01-dec-2010
2 Garnaut Climate Change Review: Technical Paper 3 – Assumptions and Data Sources. http://www.garnautreview.org.au/CA25734E0016A131/WebObj/TechnicalPaper3-Assumptionsanddatasources/%24File/Technical%20Paper%203%20-%20Assumptions%20and%20data%20sources.PDF
3 Australia’s Low Pollution Future, Australian Commonwealth Government Treasury, Consultant’s Report, December 2008. http://www.treasury.gov.au/lowpollutionfuture/consultants_report/downloads/Electricity_Sector_Modelling_Report_updated.pdf
4 Australian Energy Market Operator (AEMO) spreadsheets, 2010. http://www.aemo.com.au/planning/ntndp2010consult.html
5 Australian Electricity Generation Technology Costs – Reference Case 2010, Australian Commonwealth Government Department of Resources, Energy and Tourism, February 2010. http://www.ret.gov.au/energy/Documents/AEGTC%202010.pdf
6 Preparation of Energy Market Modelling Data for the Energy White Paper: Supply Assumptions Report, ACIL Tasman, 13 September, 2010. http://www.aemo.com.au/planning/scenarios.html
7 AEMO Cost Data Forecast for the NEM: Review of Cost and Efficiency Curves, Worley Parsons, 31 January, 2011. http://www.aemo.com.au/planning/0419-0017.pdf
8 Australia’s Low Pollution Future: The Economics of Climate Change Mitigation Report Chapter 6: Mitigation Scenarios – Australian Results – 6.1.2 Emission Prices, Australian Commonwealth Government Treasury, 2009. http://www.treasury.gov.au/lowpollutionfuture/spreadsheets/report_charts/Chapter%206/Chart%206.3%20-%20%20Australian%20emission%20price.xls

ATSE – in briefThe Academy of Technological Sciences and Engineering (ATSE) is an independent, non-government organisation, promoting the development and adoption of existing and new technologies that will improve and sustain our society and economy.
ATSE consists of more than 800 eminent Australian Fellows and was founded in 1976 to recognise and promote the outstanding achievement of Australian scientists, engineers and technologists.
ATSE provides a national forum for discussion and debate of critical issues about Australia’s future, especially the impact of science, engineering and technology on quality of life.
ATSE links Australia with leading international bodies and worldwide expertise in the technological sciences and engineering.
ATSE fosters excellence in science, engineering and technology research and the critical education systems that underpin Australia’s capacity in these areas.
ATSE tackles many of the most difficult issues governing our future, by offering fresh ideas, practical solutions and sound policy advice – and putting them on the public record.

New Power cost comParisoNsLevelised cost of electricity for a range of New Power Generating technologiesreport by the australian academy of technological sciences and engineering © Australian Academy of Technological Sciences and Engineering
the australian academy of technological sciences and engineering (atse)
ATSE OfficeLevel 1, 1 Bowen CrescentMelbourne Victoria 3004AUSTRALIA
Mail addressGPO Box 4055Melbourne Victoria 3001AUSTRALIA
Phone+61 (0)3 9864 0900
Fax+61 (0)3 9864 0930
[email protected] [email protected]
Websiteswww.atse.org.auwww.crawfordfund.org www.cluniesross.org.au
PHOTO: iSTOCKPHOTO.COM