new perspectives on the system usage construct
TRANSCRIPT
Georgia State UniversityScholarWorks @ Georgia State University
Computer Information Systems Dissertations Department of Computer Information Systems
8-11-2005
New Perspectives on the System Usage ConstructAndrew Burton-Jones
Follow this and additional works at: https://scholarworks.gsu.edu/cis_diss
Part of the Management Information Systems Commons
This Dissertation is brought to you for free and open access by the Department of Computer Information Systems at ScholarWorks @ Georgia StateUniversity. It has been accepted for inclusion in Computer Information Systems Dissertations by an authorized administrator of ScholarWorks @Georgia State University. For more information, please contact [email protected].
Recommended CitationBurton-Jones, Andrew, "New Perspectives on the System Usage Construct." Dissertation, Georgia State University, 2005.https://scholarworks.gsu.edu/cis_diss/3
Permission to Borrow
In presenting this dissertation as a partial fulfillment of the requirements for an advanced degree from Georgia State University, I agree that the Library of the University shall make it available for inspection and circulation in accordance with its regulations governing materials of this type. I agree that permission to quote from, or to publish this dissertation may be granted by the author or, in his/her absence, the professor under whose direction it was written or, in his absence, by the Dean of the Robinson College of Business. Such quoting, copying, or publishing must be solely for scholarly purposes and does not involve potential financial gain. It is understood that any copying from or publication of this dissertation which involves potential gain will not be allowed without written permission of the author.
__________________________________ signature of author

Notice to Borrowers
All dissertations deposited in the Georgia State University Library must be used only in accordance with the stipulations prescribed by the author in the preceding statement. The author of this dissertation is: Name: Andrew Burton-Jones Address: Unit #308-6385 Hawthorne Lane, Vancouver, BC. V6T 124, Canada The director of this dissertation is: Name: Dr. Detmar Straub Department: Computer Information Systems Department Address: 9th Floor, 35 Broad Street, Atlanta, Georgia, 30302, USA Users of this dissertation not regularly enrolled as students at Georgia State University are required to attest acceptance of the preceding stipulations by signing below. Libraries borrowing this dissertation for the use of their patrons are required to see that each user records here the information requested. Name of User Address Date

NEW PERSPECTIVES ON THE SYSTEM USAGE CONSTRUCT
BY
ANDREW BURTON-JONES
A Dissertation Submitted in Partial Fulfillment of the Requirements for the Degree of
Doctor of Philosophy in the Robinson College of Business
of Georgia State University
Georgia State University J. Mack Robinson College of Business
2005

Copyright by Andrew Burton-Jones
2005
Acceptance
The dissertation was prepared under the direction of the candidate’s Dissertation Committee. It has been approved and accepted by all members of that committee, and it has been accepted in partial fulfillment of the requirements for the degree of Doctor of Philosophy in Business Administration in the Robinson College of Business Administration of Georgia State University.
________________________________________ Dean: H. Fenwick Huss Robinson College of Business
Dissertation Committee: ____________________________________________ Chair: Dr. Detmar Straub ____________________________________________ Dr. Michael Gallivan ____________________________________________ Dr. Geoffrey Hubona ____________________________________________ Dr. Arun Rai ____________________________________________ Dr. Daniel Robey
- iv -
Acknowledgments
I have many people to acknowledge and I am delighted to have the opportunity to do so:
• First, I thank Ron Weber for initiating me into the world of IS research. His seminar on IS research methods in 1997 was a watershed in my life. I think I knew it at the time; it just took me some years to finally acknowledge it and apply for the Ph.D. Since then, I have known what I want to do for the rest of my life. Thanks Ron, for this and more! My time at GSU has been wonderful. I need to thank:
• The entire CIS faculty and staff, led by Richard Baskerville, for making the CIS Department such a terrific place.
• Libby Crawley, Ashley Bush, Amrit Tiwana, and Emad Mohd for helping me start out. • My fellow PhD students, especially Lan Cao, Peng Xu, Kannan Mohan, Karlene Cousins,
Cecil Chua, Radhika Jain, Ricardo Checchi, JJ Hsieh, Ghi Im, Adriane Davis, Punit Ahluwalia, Lei Li, and Stacie Petter, for their friendship, humor, and support.
• Eph McLean, Veda Storey, and Bala Ramesh for teaching me a great deal about academia.
I have been incredibly fortunate to have Detmar Straub as my dissertation chair:
• Detmar has been constant source of encouragement, kindness, wisdom, optimism, and humor. My thesis profited immensely from his advice, both in substance and form. I also continue to benefit a great deal personally from his mentorship, friendship, support, and guidance. He is a wonderful man. Thanks Detmar, for everything!
This dissertation has benefited greatly from my committee:
• Mike Gallivan encouraged and accompanied me during my voyage into multilevel research. In an early meeting, he said something like “do something brilliant.” The statement uplifted me, and continues to do so. Thanks Mike!
• Jeff Hubona has been a great mentor and support. He has given excellent advice on the topic of system usage. He also gave me an opportunity early in my Ph.D. to learn how to write papers. This proved very beneficial for me during my Ph.D.
• Arun Rai has been a source of excellent advice. He particularly motivated me improve the conceptual basis of the thesis. Some of his ideas will keep me going for a long time in my future research.
• Dan Robey has been a great support throughout my Ph.D. His interpretive research helped me see the limits of what I could achieve in my thesis, his 1988 paper (with Lynne Markus) sparked my interest in multilevel research, and his seminar on writing conceptual papers gave me the confidence to give one a go!

- v -
Many others people have helped me during my thesis. I would like to thank the following:
• For assistance during data collection and data analysis: I owe a debt of gratitude to Ron Barden. Thanks also to Faye Borthick, Carol Springer, Maria Bullen, Emad Mohd, Catherine Cleaveland, and Frank Luo for their help and advice. I am indebted to my fellow PhD students for helping to supervise my experiments, to Hyunki Kim, Amit Patel, Haiying Lin, and Jack Zheng for coding data, and to Wynne Chin, Carolyn Furlow, and Satish Nargundkar for helpful advice regarding statistics.
• For helpful comments on my thesis: I thank participants in workshops at the U. Georgia, U. British Columbia, U. Delaware, U. Kansas, Washington State U., Bentley College, Hong Kong U. of Science and Technology, and the ICIS Doctoral Consortium. For especially helpful comments, I thank Dale Goodhue, Elena Karahanna, Deb Compeau, Lynne Markus, and Phil Yetton. For helpful advice on the group-level literature, my thanks to Astrid Lipp and Ilze Zigurs. Thanks also to the anonymous reviewers and editors of two chapters of this thesis now under review—I’ve learned a lot from you.
To those who’ve been with me all along:
• First, my family. I thank my father and mother for being phenomenal parents. I hope that I might one day be as good a parent. As I grow older, I am increasingly in awe of everything they have done for me. I love, respect, and admire them dearly. To my sister, Katherine, and Aunt, Dylys, I am very grateful for their love and encouragement throughout my life, and for their many emails of support during my Ph.D. They helped me realize that family is “only an email away.”
• A big thanks also to my friends in Australia and overseas, especially Simon Jillella, Nick Ireland, Martin Nosek, Megan Dean, Viisti Dickens, Olivia Kyi Phyu, Novita Pratignyo, Grant Castner, and Stuart Benjamin, who have remained great friends despite my being a poor correspondent at times.
• Finally, I thank my beautiful partner, Allison Bennett. Her unstinting love and support, her good looks and funky ways, her wild hair, quick wit, and passion for life, and her tenderness, patience, and kindness have given me all the wealth in the world. I love you Allison, with all my heart. I also owe a special debt of gratitude to Allison’s family. Gayle, Merri, Briony, James, and the whole Bennett clan have been incredibly welcoming. Thank you to you all.
- vi -
Table of Contents
Acknowledgments ........................................................................................................................ iv Table of Contents ......................................................................................................................... vi List of Tables ................................................................................................................................. x List of Figures.............................................................................................................................. xii Abstract.......................................................................................................................................... 1 Chapter 1: Introduction .............................................................................................................. 2
1.1 Overview............................................................................................................................ 2 1.2 Scope of the Inquiry........................................................................................................... 6
1.2.1 Meta-Theoretical Assumptions: Critical Realist....................................................... 8 1.2.2 Research Target: Explanation ................................................................................... 9 1.2.3 Form of Theory: Variance ...................................................................................... 12
1.3 Generating Perspectives of a Construct within Critical Realism..................................... 13 1.3.1 Epistemological Factors that Enable Diversity of Meaning .................................... 14
1.3.1.1 Construct Definitions ................................................................................ 14 1.3.1.2 Theories..................................................................................................... 15 1.3.1.3 Methods..................................................................................................... 15
1.3.2 Ontological Factors that Constrain Diversity of Meaning...................................... 15 1.3.2.1 Elements.................................................................................................... 16 1.3.2.2 Properties .................................................................................................. 16 1.3.2.3 Values ....................................................................................................... 17
1.4 Generating New Perspectives on the System Usage Construct ....................................... 17 1.5 Steps of the Proposed Approach ...................................................................................... 20 1.6 Research Design............................................................................................................... 27
1.6.1 Empirical Tests ....................................................................................................... 27 1.6.2 Data Analysis .......................................................................................................... 28
1.7 Conclusion ....................................................................................................................... 30 Chapter 2: Reconceptualizing System Usage .......................................................................... 32
2.1 Introduction...................................................................................................................... 33 2.2 Implicit Conceptualizations of System Usage in Past Research...................................... 34 2.3 The Need to Reconceptualize System Usage................................................................... 35 2.4 A Staged Approach for Reconceptualizing System Usage.............................................. 37
2.4.1 Defining System Usage........................................................................................... 38 2.4.2 Selecting Content Valid, Contextualized Measures: A Two-Step Approach ......... 39
2.5 Empirical Investigation of the Staged Approach for Reconceptualizing Usage.............. 41 2.5.1 Defining Individual Task Performance................................................................... 43 2.5.2 Mapping Individual Task Performance to Existing Usage Measures..................... 44 2.5.3 Types of System Usage that Relate to Individual Task Performance..................... 45
- vii -
2.5.4 A Model of System Usage and Individual Task Performance............................... 45 2.5.4.1 Measuring User Employment of an IS During Exploitive Use: Cognitive
Absorption......................................................................................................................... 46 2.5.4.2 Measuring Use of the System in the Task During Exploitive Use: Deep
Structure Usage................................................................................................................. 48 2.6 Empirical Test of the Staged Approach for Reconceptualizing System Usage............... 51
2.6.1 Task and Design...................................................................................................... 52 2.6.2 Subjects ................................................................................................................... 52 2.6.3 Instrumentation - IV................................................................................................ 53 2.6.4 Instrumentation - DV .............................................................................................. 54 2.6.5 Procedure, Pretest, and Pilot Test ........................................................................... 54
2.7 Results of the Empirical Investigation............................................................................. 55 2.7.1 Descriptive Statistics............................................................................................... 55 2.7.2 Measurement Model ............................................................................................... 55 2.7.3 Structural Model and Nomological Validity........................................................... 56
2.8 Discussion ........................................................................................................................ 58 2.9 Conclusion ....................................................................................................................... 63 Appendix 2A: Additional Empirical Results .......................................................................... 64
2A.1 Testing for the Robustness of our Results across Data Collection Method............ 64 2A.2 Testing for the Influence of other Predictors of Performance ................................ 65
Chapter 3: Toward a Deeper Understanding of System Usage in Organizations: A Multilevel Perspective................................................................................................................. 67
3.1 Introduction...................................................................................................................... 68 3.2 Overview of Multilevel Theory ....................................................................................... 71
3.2.1 Foundations of Multilevel Theory: General Systems Theory................................. 71 3.2.2 Building a Multilevel Theory: Structure and Function........................................... 73
3.2.2.1 Structure................................................................................................... 73 3.2.2.2 Function ................................................................................................... 74
3.3 A Multilevel Perspective on System Usage..................................................................... 76 3.3.1 Defining System Usage........................................................................................... 77 3.3.2 The Structure of System Usage............................................................................... 77
3.3.2.1 Identifying the Level at which System Usage Exists............................... 78 3.3.2.2 Identifying the Form in which Collective Usage Exists .......................... 83 3.3.2.3 Implications for Measuring Collective Usage ......................................... 86
3.3.3 The Function of System Usage ............................................................................... 89 3.3.3.1 A Representational Theory of System Usage and Task Performance ..... 89 3.3.3.2 Selection................................................................................................... 91 3.3.3.3 Specifying the Functional Form............................................................. 101 3.3.3.4 Specifying the Time Frame.................................................................... 103
- viii -
3.4 Implications.................................................................................................................... 106 3.5 Conclusion ..................................................................................................................... 112 Appendix 3A: Conceptualizations of Usage in Past Research ............................................. 113 Appendix 3B: Motivations for Adopting Multilevel Theory................................................ 116
Chapter 4: A Multilevel Investigation of the Relationship Between System Usage and Task Performance .............................................................................................................................. 118
4.1 Introduction.................................................................................................................... 119 4.2 Building a Multilevel Model of System Usage and Task Performance......................... 122
4.2.1 System Usage and Task Performance: A Baseline, Individual-Level Model...... 122 4.2.2 Studying the Baseline Model: The Importance of Context .................................. 124 4.2.3 Extending the Baseline Model: The Structure of Collective Usage and Performance
............................................................................................................................................. 127 4.2.4 Extending the Baseline Model: Cross Level Relationships.................................. 132 4.2.5 An Extended, Multilevel Model of Usage and Performance................................. 134
4.3 Research Design............................................................................................................. 137 4.3.1 Task and System ................................................................................................... 137 4.3.2 Sample................................................................................................................... 137 4.3.3 Instrumentation ..................................................................................................... 140
4.4 Data Analysis ................................................................................................................. 143 4.4.1 Data Screening...................................................................................................... 143 4.4.2 Hypothesis Tests ................................................................................................... 145
4.5 Discussion ...................................................................................................................... 151 4.6 Conclusion ..................................................................................................................... 156 Appendix 4A: Experimental Task ....................................................................................... 158 Appendix 4B: Instrumentation............................................................................................. 159
Chapter 5: A Comprehensive Approach for Dealing with Method Variance in IS Research ..................................................................................................................................................... 160
5.1 Introduction.................................................................................................................... 161 5.2 Context: The Current State of Research on Method Variance ...................................... 163
5.2.1 The Nature of Method Variance ........................................................................... 163 5.2.2 Methodological Approaches to Reduce Method Variance ................................... 165 5.2.3 Statistical Approaches to Estimate Method Variance........................................... 166 5.2.4 The Need for a Comprehensive Approach for Dealing with Method Variance ... 167
5.3 Clarifying the Meaning of Method Variance................................................................. 167 5.3.1 The Meta-Theoretical Assumptions Underlying Positivist Research................... 167 5.3.2 Decomposing “Methods” and “Method Variance”............................................... 171 5.3.3 The Meaning and Significance of Distance Bias and Representation Bias .......... 174 5.3.4 Rethinking the Logic of Triangulation ................................................................. 178
5.4 A Comprehensive Approach for Dealing with Method Variance ................................. 179
- ix -
5.4.1 Selecting a Strategy for Dealing with Method Variance ...................................... 180 5.4.1.1 Nature of Inquiry: Is the Inquiry Confirmatory? ................................... 180 5.4.1.2 Nature of Theory: Does the Theory Specify a Rater?............................ 182 5.4.1.3 Nature of Methods: Is the Desired Rater Available? ............................. 183
5.4.2 Executing a Strategy for Dealing with Method Variance..................................... 184 5.4.2.1 Executing a Strategy: Rater ................................................................... 184 5.4.2.2 Executing a Strategy: Instrument and Procedure................................... 184 5.4.2.3 Executing a Strategy: Data Analysis...................................................... 185
5.4.3 Using the Approach in Practice: The Importance of Judgment and Multiple Studies............................................................................................................................................. 185
5.5 Dealing with Method Variance: A Demonstration Exercise ......................................... 186 5.5.1 Context of the Demonstration............................................................................... 187
5.5.1.1 Theoretical Context................................................................................ 188 5.5.1.2 Empirical Context .................................................................................. 188
5.5.2 Demonstration of the Approach............................................................................ 189 5.5.2.1 Selecting a Strategy for Dealing with Method Variance ....................... 191 5.5.2.2 Executing a Strategy for Dealing with Method Variance...................... 191 5.5.2.3 Results of the Demonstration Exercise .................................................. 200
5.6 Discussion ...................................................................................................................... 203 5.7 Conclusion ..................................................................................................................... 207 Appendix 5A: Measures and Methods for Measuring System Usage in Past Research....... 209
Chapter 6: Conclusion............................................................................................................. 211 6.1 Reprise: Objective.......................................................................................................... 211 6.2 Contributions.................................................................................................................. 212
6.2.1 Contributions to Research..................................................................................... 212 6.2.2 Contributions to Practice....................................................................................... 215
6.3 Limitations and Future Research ................................................................................... 216 6.4 Conclusion ..................................................................................................................... 216
References.................................................................................................................................. 219 Curriculum Vitae ...................................................................................................................... 241
- x -
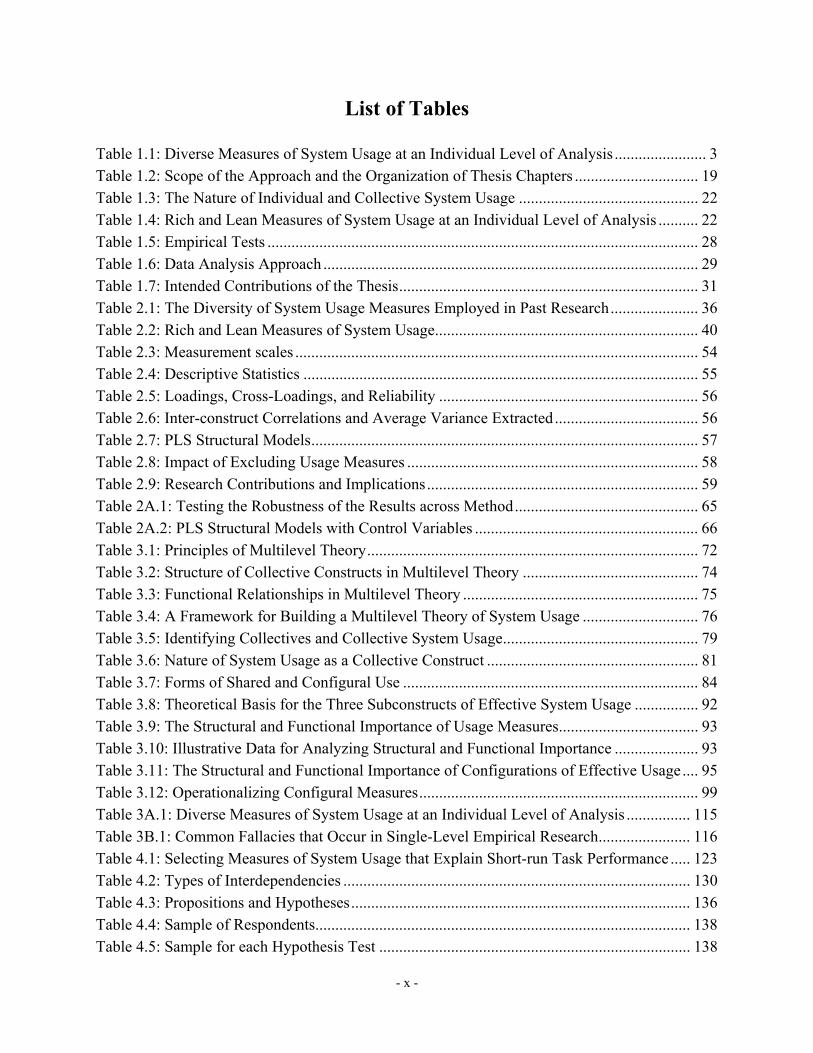
List of Tables
Table 1.1: Diverse Measures of System Usage at an Individual Level of Analysis ....................... 3 Table 1.2: Scope of the Approach and the Organization of Thesis Chapters ............................... 19 Table 1.3: The Nature of Individual and Collective System Usage ............................................. 22 Table 1.4: Rich and Lean Measures of System Usage at an Individual Level of Analysis .......... 22 Table 1.5: Empirical Tests ............................................................................................................ 28 Table 1.6: Data Analysis Approach .............................................................................................. 29 Table 1.7: Intended Contributions of the Thesis........................................................................... 31 Table 2.1: The Diversity of System Usage Measures Employed in Past Research...................... 36 Table 2.2: Rich and Lean Measures of System Usage.................................................................. 40 Table 2.3: Measurement scales ..................................................................................................... 54 Table 2.4: Descriptive Statistics ................................................................................................... 55 Table 2.5: Loadings, Cross-Loadings, and Reliability ................................................................. 56 Table 2.6: Inter-construct Correlations and Average Variance Extracted.................................... 56 Table 2.7: PLS Structural Models................................................................................................. 57 Table 2.8: Impact of Excluding Usage Measures ......................................................................... 58 Table 2.9: Research Contributions and Implications.................................................................... 59 Table 2A.1: Testing the Robustness of the Results across Method.............................................. 65 Table 2A.2: PLS Structural Models with Control Variables ........................................................ 66 Table 3.1: Principles of Multilevel Theory................................................................................... 72 Table 3.2: Structure of Collective Constructs in Multilevel Theory ............................................ 74 Table 3.3: Functional Relationships in Multilevel Theory ........................................................... 75 Table 3.4: A Framework for Building a Multilevel Theory of System Usage ............................. 76 Table 3.5: Identifying Collectives and Collective System Usage................................................. 79 Table 3.6: Nature of System Usage as a Collective Construct ..................................................... 81 Table 3.7: Forms of Shared and Configural Use .......................................................................... 84 Table 3.8: Theoretical Basis for the Three Subconstructs of Effective System Usage ................ 92 Table 3.9: The Structural and Functional Importance of Usage Measures................................... 93 Table 3.10: Illustrative Data for Analyzing Structural and Functional Importance ..................... 93 Table 3.11: The Structural and Functional Importance of Configurations of Effective Usage.... 95 Table 3.12: Operationalizing Configural Measures...................................................................... 99 Table 3A.1: Diverse Measures of System Usage at an Individual Level of Analysis ................ 115 Table 3B.1: Common Fallacies that Occur in Single-Level Empirical Research....................... 116 Table 4.1: Selecting Measures of System Usage that Explain Short-run Task Performance ..... 123 Table 4.2: Types of Interdependencies ....................................................................................... 130 Table 4.3: Propositions and Hypotheses..................................................................................... 136 Table 4.4: Sample of Respondents.............................................................................................. 138 Table 4.5: Sample for each Hypothesis Test .............................................................................. 138
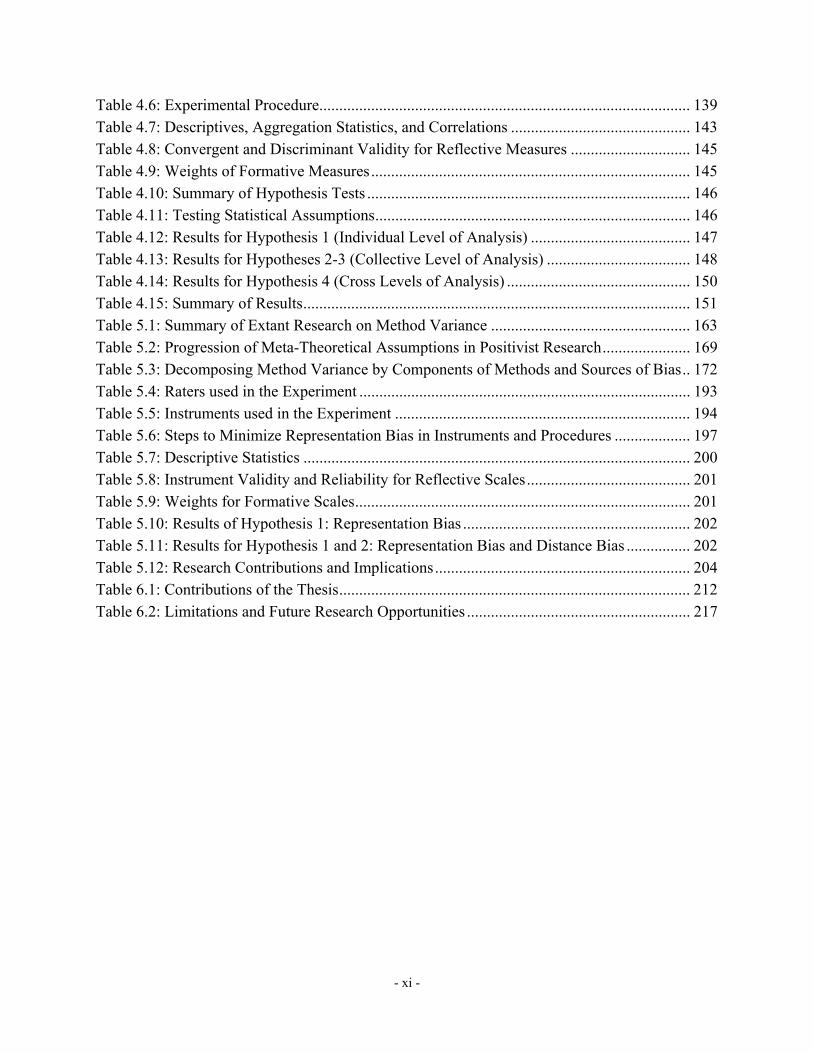
- xi -
Table 4.6: Experimental Procedure............................................................................................. 139 Table 4.7: Descriptives, Aggregation Statistics, and Correlations ............................................. 143 Table 4.8: Convergent and Discriminant Validity for Reflective Measures .............................. 145 Table 4.9: Weights of Formative Measures................................................................................ 145 Table 4.10: Summary of Hypothesis Tests ................................................................................. 146 Table 4.11: Testing Statistical Assumptions............................................................................... 146 Table 4.12: Results for Hypothesis 1 (Individual Level of Analysis) ........................................ 147 Table 4.13: Results for Hypotheses 2-3 (Collective Level of Analysis) .................................... 148 Table 4.14: Results for Hypothesis 4 (Cross Levels of Analysis) .............................................. 150 Table 4.15: Summary of Results................................................................................................. 151 Table 5.1: Summary of Extant Research on Method Variance .................................................. 163 Table 5.2: Progression of Meta-Theoretical Assumptions in Positivist Research...................... 169 Table 5.3: Decomposing Method Variance by Components of Methods and Sources of Bias.. 172 Table 5.4: Raters used in the Experiment ................................................................................... 193 Table 5.5: Instruments used in the Experiment .......................................................................... 194 Table 5.6: Steps to Minimize Representation Bias in Instruments and Procedures ................... 197 Table 5.7: Descriptive Statistics ................................................................................................. 200 Table 5.8: Instrument Validity and Reliability for Reflective Scales......................................... 201 Table 5.9: Weights for Formative Scales.................................................................................... 201 Table 5.10: Results of Hypothesis 1: Representation Bias ......................................................... 202 Table 5.11: Results for Hypothesis 1 and 2: Representation Bias and Distance Bias ................ 202 Table 5.12: Research Contributions and Implications................................................................ 204 Table 6.1: Contributions of the Thesis........................................................................................ 212 Table 6.2: Limitations and Future Research Opportunities ........................................................ 217
- xii -
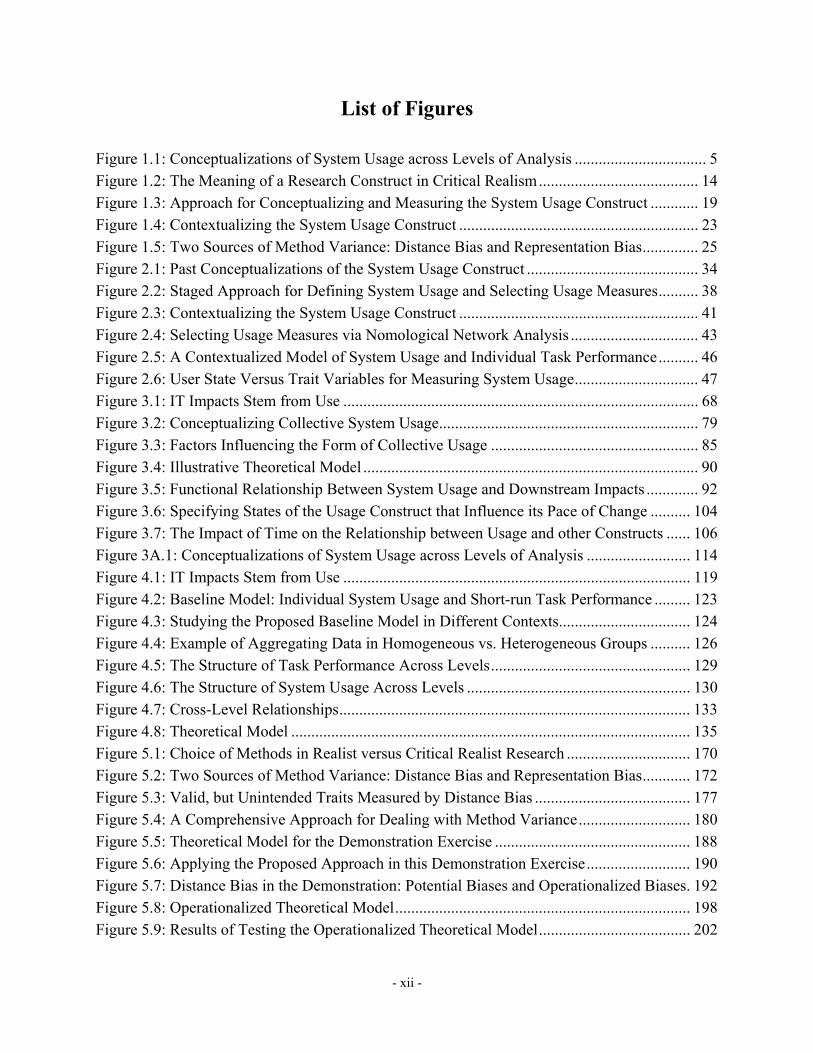
List of Figures
Figure 1.1: Conceptualizations of System Usage across Levels of Analysis ................................. 5 Figure 1.2: The Meaning of a Research Construct in Critical Realism........................................ 14 Figure 1.3: Approach for Conceptualizing and Measuring the System Usage Construct ............ 19 Figure 1.4: Contextualizing the System Usage Construct ............................................................ 23 Figure 1.5: Two Sources of Method Variance: Distance Bias and Representation Bias.............. 25 Figure 2.1: Past Conceptualizations of the System Usage Construct ........................................... 34 Figure 2.2: Staged Approach for Defining System Usage and Selecting Usage Measures.......... 38 Figure 2.3: Contextualizing the System Usage Construct ............................................................ 41 Figure 2.4: Selecting Usage Measures via Nomological Network Analysis ................................ 43 Figure 2.5: A Contextualized Model of System Usage and Individual Task Performance.......... 46 Figure 2.6: User State Versus Trait Variables for Measuring System Usage............................... 47 Figure 3.1: IT Impacts Stem from Use ......................................................................................... 68 Figure 3.2: Conceptualizing Collective System Usage................................................................. 79 Figure 3.3: Factors Influencing the Form of Collective Usage .................................................... 85 Figure 3.4: Illustrative Theoretical Model .................................................................................... 90 Figure 3.5: Functional Relationship Between System Usage and Downstream Impacts ............. 92 Figure 3.6: Specifying States of the Usage Construct that Influence its Pace of Change .......... 104 Figure 3.7: The Impact of Time on the Relationship between Usage and other Constructs ...... 106 Figure 3A.1: Conceptualizations of System Usage across Levels of Analysis .......................... 114 Figure 4.1: IT Impacts Stem from Use ....................................................................................... 119 Figure 4.2: Baseline Model: Individual System Usage and Short-run Task Performance ......... 123 Figure 4.3: Studying the Proposed Baseline Model in Different Contexts................................. 124 Figure 4.4: Example of Aggregating Data in Homogeneous vs. Heterogeneous Groups .......... 126 Figure 4.5: The Structure of Task Performance Across Levels.................................................. 129 Figure 4.6: The Structure of System Usage Across Levels ........................................................ 130 Figure 4.7: Cross-Level Relationships........................................................................................ 133 Figure 4.8: Theoretical Model .................................................................................................... 135 Figure 5.1: Choice of Methods in Realist versus Critical Realist Research ............................... 170 Figure 5.2: Two Sources of Method Variance: Distance Bias and Representation Bias............ 172 Figure 5.3: Valid, but Unintended Traits Measured by Distance Bias ....................................... 177 Figure 5.4: A Comprehensive Approach for Dealing with Method Variance............................ 180 Figure 5.5: Theoretical Model for the Demonstration Exercise ................................................. 188 Figure 5.6: Applying the Proposed Approach in this Demonstration Exercise.......................... 190 Figure 5.7: Distance Bias in the Demonstration: Potential Biases and Operationalized Biases. 192 Figure 5.8: Operationalized Theoretical Model.......................................................................... 198 Figure 5.9: Results of Testing the Operationalized Theoretical Model...................................... 202
1
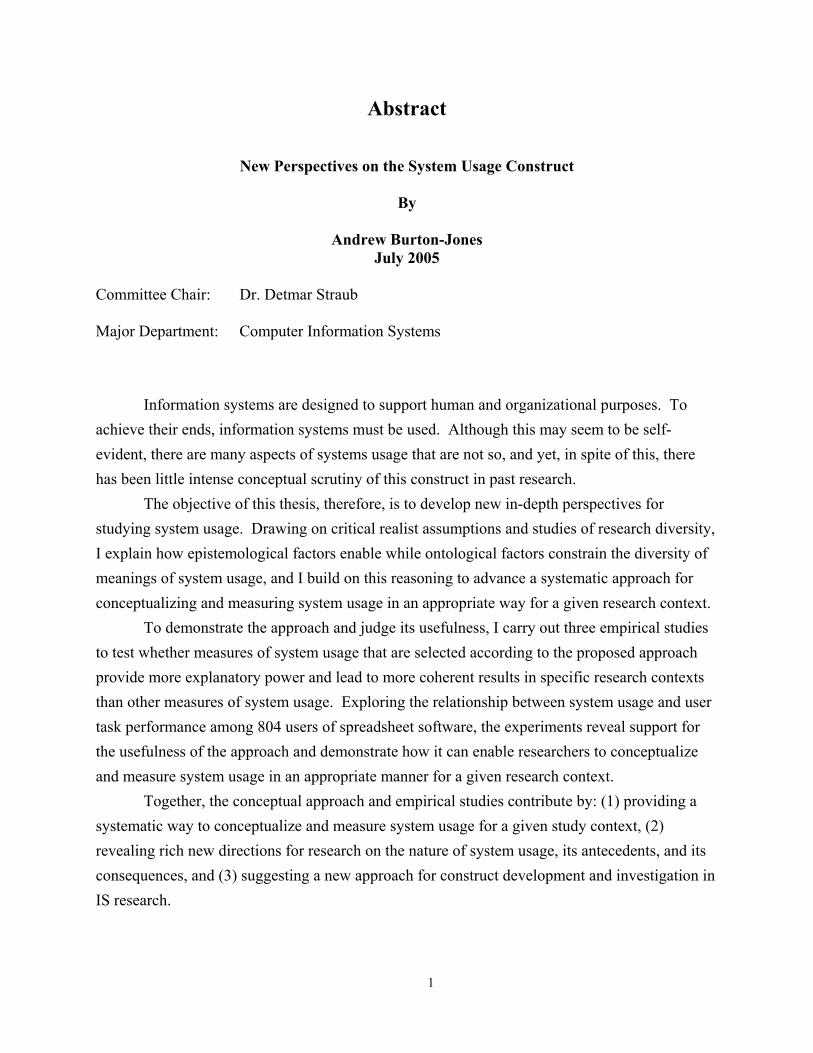
Abstract
New Perspectives on the System Usage Construct
By
Andrew Burton-Jones
July 2005
Committee Chair: Dr. Detmar Straub Major Department: Computer Information Systems
Information systems are designed to support human and organizational purposes. To achieve their ends, information systems must be used. Although this may seem to be self-evident, there are many aspects of systems usage that are not so, and yet, in spite of this, there has been little intense conceptual scrutiny of this construct in past research.
The objective of this thesis, therefore, is to develop new in-depth perspectives for studying system usage. Drawing on critical realist assumptions and studies of research diversity, I explain how epistemological factors enable while ontological factors constrain the diversity of meanings of system usage, and I build on this reasoning to advance a systematic approach for conceptualizing and measuring system usage in an appropriate way for a given research context.
To demonstrate the approach and judge its usefulness, I carry out three empirical studies to test whether measures of system usage that are selected according to the proposed approach provide more explanatory power and lead to more coherent results in specific research contexts than other measures of system usage. Exploring the relationship between system usage and user task performance among 804 users of spreadsheet software, the experiments reveal support for the usefulness of the approach and demonstrate how it can enable researchers to conceptualize and measure system usage in an appropriate manner for a given research context.
Together, the conceptual approach and empirical studies contribute by: (1) providing a systematic way to conceptualize and measure system usage for a given study context, (2) revealing rich new directions for research on the nature of system usage, its antecedents, and its consequences, and (3) suggesting a new approach for construct development and investigation in IS research.

2
Chapter 1
Introduction1
1.1 Overview
The June 2003 issue of the Harvard Business Review included 14 letters to the editor
debating the merits of Carr’s article entitled “IT Doesn’t Matter” (2003). A key theme of the
letters was whether impacts from information technology (IT) stem from IT itself, or from how it
is used. For many years, information systems researchers have debated the same question.
Some emphasize the deterministic effects of IT, while others stress that its impacts stem from use
in specific contexts (Markus 1994; Markus 2004; Robey and Sahay 1996).
Although it may be self-evident that IT impacts stem from use, there has been little in the
way of exacting studies of the nature of system usage as a theoretical construct. At a nomothetic
level, many have studied its antecedents (Compeau et al. 1999; Venkatesh et al. 2003). Others
have studied its consequences (Gelderman 1998; Lucas and Spitler 1999). However, there has
been scant attention as to the nature of usage itself (DeLone and McLean 2003). Studies of the
antecedents to use have converged on highly predictive theories (Venkatesh et al. 2003), but the
nature of usage typically escapes theoretical scrutiny in such studies. Studies of the
consequences of use report weak results and have recently called for more research to understand
how to conceptualize and measure the usage construct (Chin and Marcolin 2001).
Perhaps the most detailed understanding of system usage comes from idiographic
researchers. They show how similar users can use IT in different ways (Barley 1986; Robey and
Sahay 1996) and how users employ IT unconventionally (DeSanctis and Poole 1994; Orlikowski
1 Burton-Jones, A. "New Perspectives on the System Usage Construct," Working paper, Department of Computer Information Systems, Georgia State University, 2005.

3
1996). However, because of their meta-theoretical assumptions, they have rarely studied system
usage as a research construct. Nor, until recently, have they studied its consequences, e.g., on
performance (Orlikowski 2000).
Overall, past research on system usage is marked by two distinguishing characteristics:
• diverse conceptualizations of system usage • disconnected conceptualizations of system usage
To illustrate the diversity of conceptualizations of system usage that exist in the literature,
Table 1.1 summarizes 14 different measures of system usage and many minor variants that have
been used at the individual level analysis.
Table 1.1: Diverse Measures of System Usage at an Individual Level of Analysis†
Broad Measure Individual Measures Used as Independent Variable
Used as Dependent Variable
System usage measured as the use of information from an IS Extent of use Number of reports or searches requested Nature of use Types of reports requested, general vs. specific use Frequency of use Frequency of requests for reports, number of times
discuss or make decision using information
System usage measured as the use of an IS Method of use Direct versus indirect Extent of use Number of systems, sessions, searches, displays,
reports, functions, or messages; user’s report of whether they are a light/medium/heavy user.
Proportion of use Percentage of times use the IS to perform a task Duration of use Connect time, hours per week Frequency of use Number of times use system, daily/weekly Decision to use Binary variable (use or not use) Voluntariness of use Binary variable (voluntary or mandatory) Variety of use Number of business tasks supported by the IS Specificity of use Specific versus general use Appropriateness of use Appropriate versus inappropriate use Dependence on use Degree of dependence on use
†This list was induced from a sample of 48 IS articles in major journals from 1977-2005 (see Appendix 5A).
Diverse conceptions of system usage should not be surprising, given that the system
usage construct is:
• one of the longest standing constructs in IS research (DeLone and McLean 2003; Ginzberg 1978; Lucas 1978b)
4
• studied in many different subfields of IS research, including IS success (DeLone and McLean 1992), IS for decision making (Barkin and Dickson 1977), IS acceptance (Davis 1989) , IS implementation (Hartwick and Barki 1994), group support systems (Zigurs 1993), and practice perspectives on IT impacts (Orlikowski 2000)
• studied at many levels of analysis, such as the individual (Straub et al. 1995), group (DeSanctis and Poole 1994), and organizational levels (Devaraj and Kohli 2003).
Debates on the merits of research diversity generally conclude that disciplined diversity is
desirable (Benbasat and Weber 1996; Landry and Banville 1992; Robey 1996; Weber 2003a). Is
diversity within the system usage literature disciplined? The weight of evidence suggests that it
is not. For example, at the individual-level of analysis, there are no accepted definitions of
system usage (DeLone and McLean 2003; Trice and Treacy 1986), researchers rarely choose
measures of usage based on theory (Chin 1996; Chin and Marcolin 2001), researchers rarely
validate the system usage construct empirically (Igbaria et al. 1997), and researchers rarely
justify their methods for measuring system usage (Collopy 1996; Straub et al. 1995). The
situation is similar at other levels of analysis. As Zigurs (1993, p. 117) demurred after reviewing
the group-level literature, “system usage is an example of a deceptively simple construct that
needs to be looked at more carefully.”
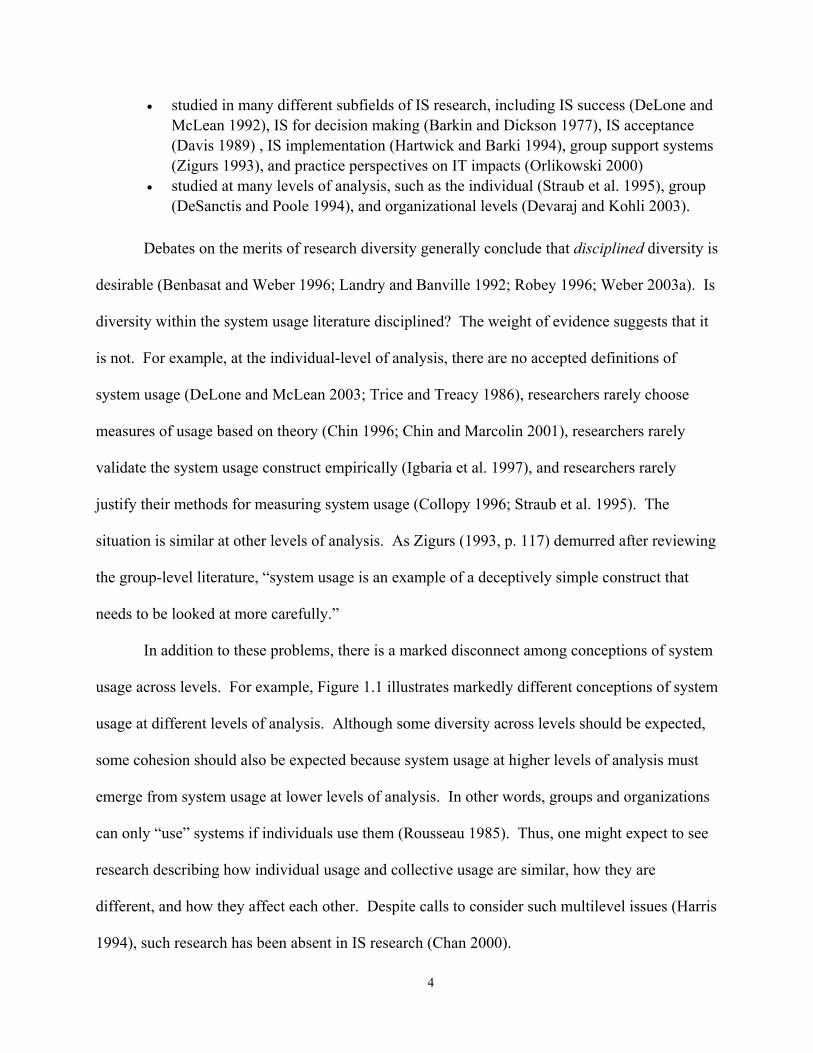
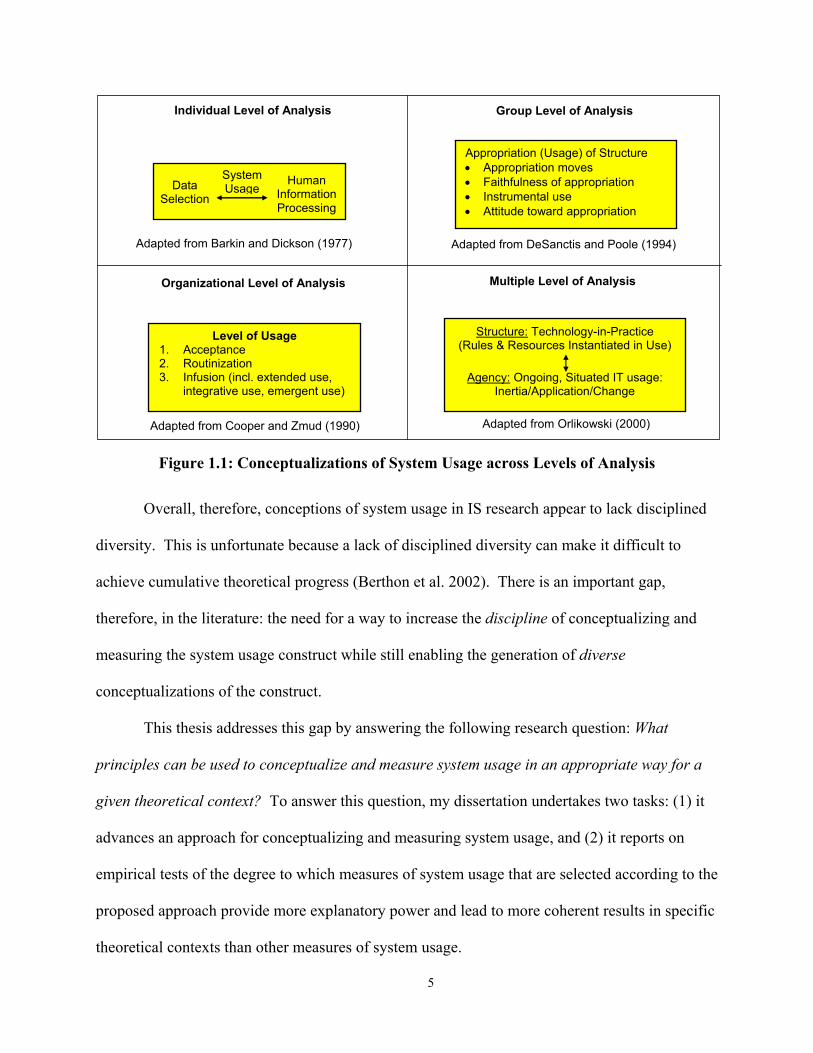
In addition to these problems, there is a marked disconnect among conceptions of system
usage across levels. For example, Figure 1.1 illustrates markedly different conceptions of system
usage at different levels of analysis. Although some diversity across levels should be expected,
some cohesion should also be expected because system usage at higher levels of analysis must
emerge from system usage at lower levels of analysis. In other words, groups and organizations
can only “use” systems if individuals use them (Rousseau 1985). Thus, one might expect to see
research describing how individual usage and collective usage are similar, how they are
different, and how they affect each other. Despite calls to consider such multilevel issues (Harris
1994), such research has been absent in IS research (Chan 2000).
5
Figure 1.1: Conceptualizations of System Usage across Levels of Analysis
Overall, therefore, conceptions of system usage in IS research appear to lack disciplined
diversity. This is unfortunate because a lack of disciplined diversity can make it difficult to
achieve cumulative theoretical progress (Berthon et al. 2002). There is an important gap,
therefore, in the literature: the need for a way to increase the discipline of conceptualizing and
measuring the system usage construct while still enabling the generation of diverse
conceptualizations of the construct.
This thesis addresses this gap by answering the following research question: What
principles can be used to conceptualize and measure system usage in an appropriate way for a
given theoretical context? To answer this question, my dissertation undertakes two tasks: (1) it
advances an approach for conceptualizing and measuring system usage, and (2) it reports on
empirical tests of the degree to which measures of system usage that are selected according to the
proposed approach provide more explanatory power and lead to more coherent results in specific
theoretical contexts than other measures of system usage.
Structure: Technology-in-Practice (Rules & Resources Instantiated in Use)
Agency: Ongoing, Situated IT usage:
Inertia/Application/Change
Adapted from Orlikowski (2000)
Individual Level of Analysis Group Level of Analysis
Organizational Level of Analysis Multiple Level of Analysis
Adapted from Barkin and Dickson (1977)
Human Information Processing
System Usage Data
Selection
Adapted from DeSanctis and Poole (1994)
Appropriation (Usage) of Structure • Appropriation moves • Faithfulness of appropriation • Instrumental use • Attitude toward appropriation
Adapted from Cooper and Zmud (1990)
Level of Usage 1. Acceptance 2. Routinization 3. Infusion (incl. extended use,
integrative use, emergent use)
6
The thesis contributes by: (1) clarifying the nature of system usage, (2) providing an
explicit set of steps and principles that researchers can use to select or evaluate measures of
system usage for a given theoretical context, (3) providing validated measures of system usage
for specific theoretical contexts, and, more generally, (4) demonstrating how constructs in IS
research can be conceptualized and measured in a diverse yet disciplined way. In terms of
practical contributions, the approach advanced in this thesis can be tailored by organizations to
help them select metrics of system usage that can predict and explain important downstream
outcomes such as individual, workgroup, and organizational performance.
This chapter summarizes the dissertation. The chapter is structured as follows. Section
1.2 presents the scope of the investigation. Section 1.3 forwards a high-level framework for
understanding how new perspectives of constructs can be generated. Sections 1.4 and 1.5 build
upon this framework to advance the proposed approach for conceptualizing and measuring
system usage. Section 1.6 describes three empirical studies that were carried out to test the
usefulness of the proposed approach. Section 1.7 summarizes the chapter.
1.2 Scope of the Inquiry
Developing new perspectives on the system usage construct requires answering two
questions:
• what is system usage and what can it be? • what is the “system usage construct” and what can it be?
Both questions are essentially philosophical. The first is an ontological question, as it
relates to the nature of a phenomenon in the world. The second is an epistemological question,
as it relates to the nature of knowledge about a phenomenon in the world. Consequently, I
propose that researchers could follow two general approaches to structure an inquiry into new
perspectives on the system usage construct. First, researchers could examine system usage

7
within one ontological and epistemological position. The aim would be to examine the
possibility of different perspectives within one such meta-theoretical position. There have been
very few examples of such research in IS. One example is Sabherwal and Robey’s (1995) study
in which they investigated the nature of IS developments projects from one set of ontological and
epistemological assumptions but two forms of theory, “variance” theory and “process” theory.
The second approach would be to examine system usage from multiple ontological and
epistemological assumptions. This would involve a multi- or meta-paradigmatic inquiry (Lewis
and Grimes 1999). Such inquiries seek to cultivate diverse views of constructs by illuminating
their various meanings across different ontological and/or epistemological positions (Lewis and
Kelemen 2002). Only a few such studies have been undertaken in IS (Hirschheim et al. 1995;
Jasperson et al. 2002; Mingers 2001; Trauth and Jessup 2000). For example, Jasperson et al.
(2002, p. 427) describe how: “Power is…a complex phenomenon …[and] a metaparadigmatic
approach can help authors understand, delimit, and carefully describe the conceptualization of
power that they are adopting when studying IT…. [and] help surface anomalies and paradoxes.”
I adopt the first of these approaches in this thesis. I do so because multi- or meta-
paradigmatic inquiries are so expansive that they are arguably more suited to being carried out by
a research team over a long-term research program (Jones 2004; Petter and Gallivan 2004).
Arguably, a multi- or meta-paradigmatic approach will also be more effective if one has carefully
investigated a phenomenon within each ontological and epistemological perspective first.
Adopting one set of ontological and epistemological assumptions alone is not sufficient
to scope the thesis. Specifically, I restrict my investigation according to the following principles,
which I define and discuss in turn below:
• Meta-theoretical assumptions: Critical realist • Research target: Explanation • Form of theory: Variance theory

8
1.2.1 Meta-Theoretical Assumptions: Critical Realist
This thesis adopts critical realist assumptions.2 Critical realism is a meta-theoretical
position that holds realist ontological assumptions and relativist epistemological assumptions
(Archer et al. 1998; Bhaskar 1979). In other words, critical realists assume that all natural and
social phenomena are part of the one “real” world, but, following constructivists, assume that the
“true” nature of the world is unknowable and that all human knowledge of the world is
inherently partial, fallible, and socially constructed (Hanson 1958; Kaplan 1998; Kuhn 1996).3
Are the meta-theoretical assumptions of critical realism accepted in the philosophy of
science? This is hard to answer, because as McKelvey (2002) notes, “philosophers never seem
to agree exactly on anything”(p. 757). Nonetheless, some do accept its assumptions. For
example, Searle (1995) based his philosophy of social science on the same meta-theoretical
assumptions. Likewise, Schwandt (1997) suggests that critical realism is a type of post-
empiricism and he argues that the assumptions of post-empiricism are “roughly equivalent to the
contemporary understanding of the philosophy of science” (p. 119).
Are the meta-theoretical assumptions of critical realism accepted in research practice?
Although not all researchers agree on the merits of these assumptions (Klein 2004; Mingers
2004a; Monod 2004), some have explicitly acknowledged the importance of critical research
assumptions in IS (Weber 1997), organization science (Azevedo 2002; McKelvey 2002), and,
more broadly, in qualitative research in general (Miles and Huberman 1994). Moreover, there is
significant evidence to suggest that critical realism has long been used implicitly in IS and
organizational research. For example, it is the position that underpinned Cook and Campbell’s
2 Other labels for critical realism are transcendental realism, evolutionary critical realism, constructive realism, and hypothetical realism (Archer et al. 1998; Bhaskar 1979; Bhaskar 1989; Brewer and Collins 1981; Messick 1989). 3 Epistemic relativity does not imply judgmental relativity, the view that all judgments are equally valid (Mingers 2004b). Cook and Campbell (1979), for example, utilize evolutionary principles to explain why good research ideas are selected while others discarded over time.

9
(1979) classic work on research validity. Donald Campbell was a vigorous proponent of critical
realism, and his research with many co-authors (Campbell and Fiske 1959; Cook and Campbell
1979; Webb et al. 2000) had a strong influence on notions of methods, constructs, measurement,
and validity in both the quantitative and qualitative behavioral sciences (Azevedo 2002; Bickman
2000; Brewer and Collins 1981; Evans 1999; Messick 1989; Yin 1994). Consequently, there are
likely many instances in IS and organizational research in which a practicing researcher is using
principles derived from a critical realist perspective, such as Cook and Campbell’s (1979)
validity typology, without acknowledging that critical realist principles are being used
(Moldoveanu and Baum 2002).
In short, critical realist assumptions appear to be an accepted set of assumptions in the
philosophy and practice of social science. Certainly, critical realism is not the only meta-
theoretical position, nor do all social scientists agree with it. Other meta-theoretical positions
could be adopted, and a multi- or meta-paradigmatic inquiry would be a very useful way to
understand the benefits of each position (Lewis and Kelemen 2002). Nonetheless, I submit that
critical realism is sufficiently well accepted position for me to utilize it in this thesis.
1.2.2 Research Target: Explanation
Social science generally targets one or more of the following goals (Rosenberg 1995):
• to explain relationships among research constructs • to understand the meaning and significance of people’s actions and beliefs • to emancipate individuals from domination, deceit, or delusion
In IS, researchers often associate these goals with different “paradigms,” namely
positivist, interpretive, and critical theory paradigms respectively (Orlikowski and Baroudi 1991).
In this thesis, I adopt a target of “explanation.” I search for perspectives of system usage
that will improve explanations of relationships between system usage and other phenomena, such
as user performance. I do not imply that this goal is superior to the other two goals. In fact, there

10
has been a series of important interpretive and critical theory studies of system usage over the last
decade (Boudreau and Robey 2005; Ngwenyama and Lee 1997; Orlikowski 1996; Vaast and
Walsham 2005). I merely submit that a thorough investigation of system usage from the
perspective of achieving explanations is useful because it can directly assist researchers who share
this goal, and it can indirectly assist those who strive for other goals by laying the groundwork for
a later multi- or meta-paradigmatic inquiry (Lewis and Kelemen 2002).
Adopting a goal of explanation entails a particular view of constructs. If my goal was
understanding or emancipation, I would focus on system usage as a “first-level construct,” that is,
it would refer to the concept(s) that people employ to understand their own use of systems (Lee
1991; Schutz 1962). However, because my goal is explanation, I focus on system usage as a
“second-level” construct, that is, it refers to a concept that researchers “construct” to explain
phenomena associated with people employing systems in reality (Lee 1991; Schutz 1962).
Philosophers of science disagree on what it means to “explain” (Kitcher 1998). Hovorka
et al. (2003) outline five different types of explanation possible in social science:
• Descriptive: empirical/atheoretical knowledge regarding a phenomenon, e.g.: o X tends to occur in context Y, but not in context Z
• Covering law: a logical deduction involving a set of initial conditions and a law, e.g.: o X occurred, therefore Y occurred, according to law Z
• Statistical relevance: statistically significant relationships between facts, e.g.: o X and Y explain a significant amount of the variation in Z
• Pragmatic: an informative, context-specific answer to a why-question, e.g.: o X is a good explanation for Y because it explains why Y has a value of Z, not Z*
• Functional: Explanations that are defined in terms of desired end states. For example: o People do X to achieve Y
Of these types of explanation, the descriptive and covering law types appear unacceptable
for this thesis because descriptive explanations do not offer the prospect of a very thorough
explanation, while the covering law model is generally considered flawed (Hovorka et al. 2003).
Of the remaining types of explanation, I use a combination of two (statistical relevance and

11
pragmatic) that complement each other.
As outlined earlier, my thesis develops an approach for selecting measures of system
usage that are appropriate for a given research context and I propose that when measures of
system usage are selected according to this approach, “explanations” of the relationship between
system usage and a downstream outcome will improve. I judge the merit of this proposition via
both types of explanation:
• Statistical relevance explanations: I judge whether measures of system usage selected according to the proposed approach explain a significantly higher proportion of the variation in a downstream outcome than other measures of system usage
• Pragmatic explanations: I judge whether relationships estimated between system usage and downstream outcomes are more coherent (or theoretically interpretable) when usage measures are selected according to the proposed approach than when they are not.
In addition to these two types of explanation, another possible type is functionalist
explanation. Markus (2004) recently pioneered such an explanation of system usage in the case
of email use. For reasons of scope, I do not employ functionalist explanations in this thesis.
However, future studies could extend the research in this thesis from such a perspective.
Given that I adopt a research target of explanation, some researchers might classify this
research as “positivist.” This would be misleading. Whether a critical realist study is
“positivist” depends on how one defines “positivism.” If positivism refers to pure “logical”
positivism, then critical realist research does not support it because critical realism was created in
direct opposition to logical positivism (Bhaskar 1979; Cook and Campbell 1979). Moreover,
logical positivism has also long been rejected. As Suppe (1977) explained, since the late 1970’s,
all remaining philosophies of science have, literally, been post-positivist.
If pure positivism has long been rejected, why do so many researchers describe their work
and the work of others as “positivist” (Dube and Pare 2003; Lee 1999; Myers et al. 2004; Straub
et al. 2004b)? A simple answer is that working positivists are not pure positivists (Moldoveanu

12
and Baum 2002). Weber (2003b) gives a good example of such a case:
“My most vivid memory…was my surprise at the way positivism was being characterized…. I was a positivist, but I subscribed to none of the assumptions that my colleagues…alleged that I made…. [the] assumptions that are supposedly made by…adherents [of positivism] are outdated and misplaced ideas. Indeed, I believe positivists would dismiss some as ludicrous” (pp. iii, x).
Weber’s case is useful to cite because he previously acknowledged that much of his research is
based on critical realism (Weber 1997). Likewise, Moldoveanu and Baum (2002) suggest that
most so-called positivists are likely critical realists or scientific realists.
In summary, it appears that many researchers who strive for a goal of explanation are
labeled “positivists,” yet they are not positivists, nor are they interpretivists or critical theorists.
Arguably, many of these researchers are, in fact, critical realists.
Given this unfortunately ambiguous state of affairs, I stress that the research in this thesis
is not pure positivist research. As Schwandt (1997) and Orlikowski and Baroudi (1991) note,
critical realist research is more accurately labeled “post-positivist, post-empiricist” research.
Even so, because many researchers who are incorrectly labeled by others as “positivists” are,
arguably, critical realists, it might be reasonable to informally describe the work in this thesis as
roughly conforming to the assumptions of “working positivists” in IS.
1.2.3 Form of Theory: Variance
Past research suggests that there are at least two well-accepted forms of theory: process
and variance (Markus and Robey 1988; Mohr 1982; Poole et al. 2000). The constructs in such
theories refer to different aspects of the world. In variance theory, research constructs refer to
properties of phenomena, whereas in process theory, research constructs refer to events,
sequences of events, or initial conditions (Poole et al. 2000). For example, in variance theory,
the system usage construct could be conceived as a property that comes into being when a user
employs a system in a task. A researcher could then measure values of this property over a

13
period of time. In contrast, in process theory, system usage could be conceived as a sequence of
events that occur when users employ a system in a task. A researcher could then measure system
usage by measuring the occurrence of various sequences of these events over time.
In this thesis, I conceive of system usage in variance theory terms. I do so to scope the
thesis and because it enables the thesis to directly contribute to a larger body of research (as most
IS research utilizes variance theory) (Shaw and Jarvenpaa 1997). Past research has offered
important process-oriented conceptions of usage (Hilbert and Redmiles 2000; Orlikowski 1996)
and I believe that the approach advanced in this thesis could be extended in the future to support
hybrid (i.e., process and variance) conceptions of system usage (Shaw and Jarvenpaa 1997).
1.3 Generating Perspectives of a Construct within Critical Realism
Although many so-called “positivist” researchers have arguably based their work on
critical realist principles (Moldoveanu and Baum 2002), I agree with Mingers (2004b) that the
full implications of a critical realist view have not been realized. I suggest that a critical realist
view has two important implications for conceiving and measuring constructs in IS research:
• Principle of diversity: All research constructs have multiple potential meanings. This principle stems from epistemological relativism. Because constructs are social constructions, there can be legitimately different meanings of a construct at any time.
• Principle of constraint: The number of potential meanings of a research construct is
constrained by the nature of the real world phenomena it represents. This principle stems from ontological realism. Because research constructs refer to real world phenomena, the number of potential meanings of a construct is necessarily limited because a construct must maintain a meaningful relation with its real world referent. These principles suggest that in critical realism, the generation and investigation of
constructs should embody a standard of disciplined diversity. Although other meta-theoretical
assumptions might imply different standards, a standard of disciplined diversity is very useful.
For example, in debating the merits of diversity in IS research, researchers have typically agreed

14
that a standard of disciplined diversity is perhaps the most appropriate research ideal (Benbasat
and Weber 1996; Landry and Banville 1992; Robey 1996; Weber 2003a).
Following past calls for principles to guide disciplined diversity (Robey 1996), this thesis
advances a framework to help researchers consider how to achieve disciplined diversity when
studying research constructs. Figure 1.2 illustrates the framework.4 After outlining the
framework, I use the principles in the framework to present an approach for conceptualizing and
measuring the system usage construct in a way that realizes disciplined diversity.
Figure 1.2: The Meaning of a Research Construct in Critical Realism
1.3.1 Epistemological Factors that Enable Diversity of Meaning
As Figure 1.2 shows, I build upon past research to suggest that three epistemological
factors drive the diversity of meaning of research constructs: construct definitions, theories, and
methods (Benbasat and Weber 1996; Robey 1996; Shadish et al. 2002).
The impact of each epistemological factor on the meaning of a construct is as follows:
1.3.1.1 Construct Definitions
Definitions establish the meaning of things (Antonelli 1998). Epistemological relativity
allows alternative definitions and thus alternative meanings to co-exist. Different definitions can
4 In this thesis, I only apply the principles of the framework to the system usage construct. Clearly, however, they could be applied to many other constructs in IS research, e.g., perceived usefulness (Davis 1989), task-technology fit (Goodhue 1995), effective IS security (Straub 1990), project escalation (Keil et al. 2000), and so on.
Epistemological Realm
Construct Definitions Theories Methods
Ontological Realm
Elements Properties
Values
Meaning(s) of Research Construct
Diversity of meaning enabled
by epistemological relativism
Diversity of meaning
constrained by ontological realism

15
co-exist, for example, because: (1) they may be useful in different contexts, e.g., in simple vs.
complex research contexts (an “instrumentalist” view), (2) they might occur within different
theories (a “coherence” view), or (3) different researchers might simply name instances of the
same phenomena differently (a “nominalist” view) (Monod 2004; Shadish et al. 2002).
1.3.1.2 Theories
Epistemological relativity assumes that the meaning of a construct depends on the theory
in which it is embedded. For example, as Kuhn (1996) notes, identical terms can have vastly
different meanings in different theoretical paradigms. Even within one paradigm, differences in
theory can affect the meaning of constructs. For example, Cronbach and Meehl (1955) suggest
that the meaning of a construct is determined partly by its internal structure (i.e., its make-up or
composition) and partly by its relationships with the other constructs in its theoretical model.
Likewise, Dubin (1978) argued that complex constructs should be decomposed into more
specific subconstructs that are relevant in different theoretical models.
1.3.1.3 Methods
Researchers often cite physicists such as Heisenberg to stress that research methods
influence construct measurements (Monod 2004; Weber 2003b). Campbell and Fiske (1959, p.
81) introduced this issue to the behavioral sciences, arguing that researchers cannot access true
aspects (or “traits”) of reality but can only measure “trait-method” units, i.e., “a union of a
particular trait content with measurement procedures not specific to that content.” Therefore,
even when a construct has one definition and is located in one theory, the use of different
methods for measuring the construct can vary the meaning of the construct measured.
1.3.2 Ontological Factors that Constrain Diversity of Meaning
As Figure 2 shows, I suggest that three ontological factors constrain the meaning of
constructs: elements, properties, and values. Elements are “things” (e.g., a person) or parts of
16
things (e.g., a person’s mind); properties are attributes of elements (e.g., a person’s intelligence);
values define states of a property (e.g., a person’s level of intelligence).5 These are typically
considered the three key constructs in variance-based ontology (Bunge 1977; Weber 2003c).6
The impact of these three ontological factors on the meaning of a construct is as follows:
1.3.2.1 Elements
A realist ontology implies that constructs have real world referents (Percival 2000).
Typically, constructs refer to properties (Rossiter 2002). That is, researchers do not measure
elements per se (e.g., a person), but rather properties of elements (e.g., intelligence) (Nunnally
and Bernstein 1994). Elements constrain the number of meanings of a construct by limiting the
types of properties a construct can refer to. For example, ontological theory suggests that
individual elements (e.g., people) have intrinsic properties (e.g., individual cognition) while
composite elements or “wholes” (e.g., collectives) also have emergent properties (e.g., collective
cognition) (Bunge 1977; Weber 1997). This has an important implication for research because,
as multilevel researchers have argued (Klein and Kozlowski 2000), if a researcher studies sets of
individuals, s/he is necessarily constrained to investigating intrinsic properties, but when s/he is
studying collectives, s/he can investigate intrinsic properties of individuals as well as emergent
properties of collectives (Hofmann and Jones 2004; Morgeson and Hofmann 1999).
1.3.2.2 Properties
Critical realists employ tests of construct validity to assess whether a measure represents,
fails to represent, or partially represents the intended property (Borsboom et al. 2004; Messick
1989). As no test can prove that a construct reflects a real world property, critical realists couple
this test with others that judge whether measures yield coherent results (Cronbach and Meehl
5 The term “value” is used here in its ontological sense (Bunge 1977), not in a moral or cultural sense. 6 Some ontological theories are consistent with a “variable-oriented” view of the world (Bunge 1977), while others are more consistent with a “process-oriented” view of the world (Whitehead 1979).
17
1955; Embretson 1983; Westen and Rosenthal 2003). As Cook and Campbell (1979) note, by
selecting constructs that pass such tests and discarding others, critical realists gradually build
confidence over time that their constructs may approximate intended properties. Thus, for
critical realists, the meaning of a construct is never fully relative, because to remain in use, its
meaning must be tied, at least in part, to the nature of property it is intended to reflect (Messick
1989).
1.3.2.3 Values
The meaning of a construct is constrained by values because to reflect a real world
property, measures of a construct must bear some similarity with the true value of the property.
This has long been the concern of psychometricians who study measurement “scales” (Schwager
1991). Although the true scale of a property is unknowable (Nunnally and Bernstein 1994), tests
have been developed to indicate when a construct scale might be misspecified (Viswanathan
2005). Multilevel researchers have also studied this issue to determine how to measure
“collective constructs” when individuals within a collective have different values on a property.
For example, researchers have developed ways to identify when a single value (e.g., an average)
is an accurate reflection of the different values in the collective or when a pattern of values (i.e.,
a “configuration”) would be a more accurate measure (Kozlowski and Klein 2000).
1.4 Generating New Perspectives on the System Usage Construct
A criticism of the preceding arguments might be that researchers have long known that
the meaning of a construct is enabled and constrained by ontological and epistemological factors.
Even if this criticism were correct, it does not follow that researchers have sufficiently accounted
for these issues when studying constructs. If past research had accounted for these factors, this
should be evident in extant conceptions of IS constructs. For example, we should be able to

18
identify how past research has created diverse conceptions of constructs by systematically
varying key epistemological factors while simultaneously ensuring that the constructs remain
tied to the aspects of reality that they are intended to reflect.
I submit that there is little to no evidence that such epistemological and ontological
factors have been accounted for in a systematic way in IS research. Certainly, in the case of
system usage, there is a great diversity in conceptualizations and yet little-to-no justification that
these conceptualizations actually reflect the intended aspects of system usage in reality.
Although I am not the first to highlight this problem (Collopy 1996; Straub et al. 1995; Trice and
Treacy 1986), extant research offers no systematic approach for accounting for these issues when
studying system usage, or any other construct, in IS research. In other words, although critical
realist assumptions have been used implicitly (often by so-called positivist researchers) for many
years, the full implications of a critical realist view have not been acknowledged or addressed.
This thesis attempts to fill this gap in the literature by proposing an approach for
conceptualizing and measuring the system usage construct. Figure 1.3 shows the approach. The
rationale for advancing the approach is that critical realist assumptions imply that it is not
possible to posit one “true” measure of system usage. However, I argue that it is beneficial to
have a rigorous approach for conceptualizing and measuring system usage. Such an approach
can offer a way to develop new perspectives of system usage that account for the epistemological
and ontological factors discussed above and can provide a way to help improve disciplined
diversity in the system usage literature (Benbasat and Weber, 1996, Robey 1996).
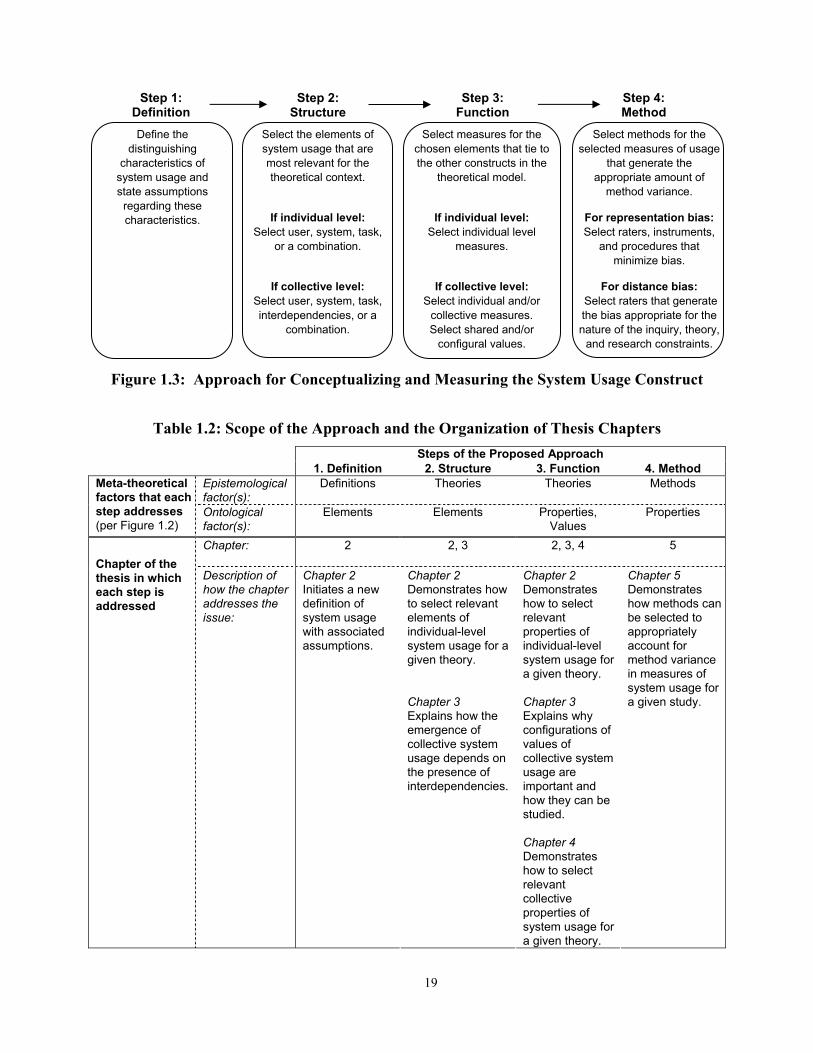
Table 1.2 explains which epistemological or ontological factors are addressed in each
step of the proposed approach. As Table 1.2 shows, Chapters 2-5 of this thesis consist of
individual papers that further explain each step of the approach, expand on the underlying
principles, and demonstrate how each step can be carried out in the context of a given study.
19
Figure 1.3: Approach for Conceptualizing and Measuring the System Usage Construct
Table 1.2: Scope of the Approach and the Organization of Thesis Chapters Steps of the Proposed Approach
1. Definition 2. Structure 3. Function 4. Method Epistemological factor(s):
Definitions Theories
Theories Methods Meta-theoretical factors that each step addresses (per Figure 1.2)
Ontological factor(s):
Elements Elements
Properties, Values
Properties
Chapter:
2 2, 3 2, 3, 4 5
Chapter of the thesis in which each step is addressed
Description of how the chapter addresses the issue:
Chapter 2 Initiates a new definition of system usage with associated assumptions.
Chapter 2 Demonstrates how to select relevant elements of individual-level system usage for a given theory. Chapter 3 Explains how the emergence of collective system usage depends on the presence of interdependencies.
Chapter 2 Demonstrates how to select relevant properties of individual-level system usage for a given theory. Chapter 3 Explains why configurations of values of collective system usage are important and how they can be studied. Chapter 4 Demonstrates how to select relevant collective properties of system usage for a given theory.
Chapter 5 Demonstrates how methods can be selected to appropriately account for method variance in measures of system usage for a given study.
Step 1: Definition
Step 2: Structure
Step 3: Function
Define the distinguishing
characteristics of system usage and state assumptions
regarding these characteristics.
Select the elements of system usage that are most relevant for the theoretical context.
If individual level: Select user, system, task,
or a combination.
If collective level: Select user, system, task, interdependencies, or a
combination.
Select measures for the chosen elements that tie to the other constructs in the
theoretical model.
If individual level: Select individual level
measures.
If collective level: Select individual and/or
collective measures. Select shared and/or
configural values.
Select methods for the selected measures of usage
that generate the appropriate amount of
method variance.
For representation bias: Select raters, instruments,
and procedures that minimize bias.
For distance bias:
Select raters that generate the bias appropriate for the nature of the inquiry, theory,
and research constraints.
Step 4: Method

20
1.5 Steps of the Proposed Approach
The following sections outline the steps of the proposed approach.
Step 1: Definition
The first step of the approach is to define the system usage construct and explicate its
assumptions. Although other definitions could be constructed, I propose that system usage is an
activity that involves three elements: (1) a user (i.e., the subject using the system), (2) a system
(i.e., the object being used), and (3) a task (i.e., the function being performed). Support for the
view that system usage involves these elements can be found widely in research on system usage
in IS (Szajna 1993, DeSanctis and Poole 1994, Massetti and Zmud 1996), human computer
interaction (John 2003), and computer supported cooperative work (Perry 2003). By drawing on
these elements and recognizing that any system comprises many features (Griffith 1999), I define
system usage as: a user’s employment of one or more features of a system to perform a task.7
This definition has two implications. First, it provides a scope for what system usage can
include. For example, it implies that system usage is related to, but is distinct from constructs
such as IT adoption, information usage, faithful appropriation, and habits. A researcher may use
system usage as a proxy for these constructs, but they are, nevertheless, different constructs.
Second, the definition refers to a broad “universe of content” (Cronbach 1971), only a
subset of which may be relevant in any study. Individual and multilevel researchers suggest that
constructs are defined partly by their internal structure and partly by their functional relationships
with other constructs in a theoretical model (Cronbach and Meehl 1955; Morgeson and Hofmann
7 My assumptions regarding each element of usage are as follows: • A user is a social actor. This implies that users are individuals or collectives who are using a system to
perform one or more aspects of their task(s) (Lamb and Kling 2003). • A system is an artifact that provides representations of one or more task domains. This implies that the system
offers features designed to support aspects of those task domains (DeSanctis and Poole 1994; Griffith 1999). • A task is a goal directed activity performed by an individual or collective. This implies that task outputs can
be assessed in terms of pre-defined task requirements (Zigurs and Buckland 1998).

21
1999). This implies a two-stage method for selecting system usage measures: (1) selecting
relevant elements of usage (i.e., its structure), and (2) selecting measures of these elements that
tie to the other constructs in a theoretical model (i.e., its function). These are the next two steps.
Step 2: Structure
This step involves selecting the relevant element(s) of system usage for a given study. It is
important to recognize that the elements of system usage vary depending on the level of analysis.
As noted above, I assume that “user” in the proposed definition could be an individual or a
collective (e.g., a group or firm). The difference, according to multilevel theorists, is that
collective phenomena emerge as a result of interdependencies among a collective’s members
(Morgeson and Hofmann 1999). This suggests that individual system usage comprises the
elements in the definition (user, system, and task), whereas collective system usage comprises not
only the sum of these elements for each individual in the collective, but also the interdependencies
among individual users during use. In other words, collective usage is “more than the sum of its
parts.” Table 1.3 illustrates this reasoning. Models 1-3 show conditions in which both collective
and individual usage exist, while Model 4 shows a condition in which only individual usage exists.
Once the possible elements of system usage are known, a researcher must select the
relevant elements for a given study. As Table 1.4 shows, one could use measures of varying
degrees of richness to capture this activity. Lean measures would attempt to capture the entire
spectrum of usage activity in an omnibus measure such as use/non-use, duration of use, or extent
of use. Although convenient, lean measures are not precise as they do not refer to the elements of
usage that may be most relevant in a specific study context (Collopy 1996). In contrast to lean
measures, rich measures step decisively into the nature of the usage activity. For example, as
Table 1.4 shows, some researchers may be more interested in the extent to which a system is used,
without capturing much of the user or task elements. Others may wish to add the user context by

22
Table 1.3: The Nature of Individual and Collective System Usage Model Nature of Systems Usage Among Individuals Type of
Interdependency Existence of Construct
1
User
SD
Profe ssio na l Workstation 600 0
PRO
System
SD
Profe ssio nal Workstation 600 0
PRO
System User
Interdependency between users via their IT
Both individual and collective system usage exist
2 SD
Profe ssio nal Workstation 600 0
PRO
System User
User
SD
Profe ssio nal Workstation 600 0
PRO
System
Interdependency between users who use IT
3
Meta-user
SD
Profe ssio na l Workstation 600 0
PRO
System User
User
SD
Profe ssio na l Workstation 600 0
PRO
System
Indirect interdependency between users who use IT (mediated by a “meta-user” e.g., a manager)
4 S D
Professi onal W orkstation 6000
PRO
System User
User
S D
Professi onal W orkstat ion 6000
PRO
System
No direct or indirect interdependency exists
Individual system usage exists (but collective system usage does not)
Table 1.4: Rich and Lean Measures of System Usage at an Individual Level of Analysis Richness of measures
1. Very Lean 2. Lean 3. Somewhat Rich (IS)
4. Rich (IS, User)
5. Rich
(IS, Task) 6. Very Rich
(IS, User, Task)Type Presence of
use Extent of use (omnibus)
Extent to which the system is used
Extent to which the user employs the system
Extent to which the system is used to carry out the task
Extent to which the user employs the system to carry out the task
Elements measured*
Example properties examined in past literature
Use/ Non-use
Duration Extent of use
Breadth of use (number of features)
Cognitive absorption
Variety of use (number of subtasks)
None to date (Difficult to capture via a reflective construct)
measuring the degree to which a user employs a system and/or add the task context by measuring
the degree to which an IS is employed in the task. At a collective level, researchers may wish to
include user interdependencies during use. None of these approaches is inherently better. Rather,
as Figure 1.3 states, researchers must identify the elements that best fit their theoretical context.
interdependency task task
independence task task
interdependency task task
interdependency task task
Usage
User
System
Task
Usage Usage Usage
User
System
Task
Usage
User
System
Task
Usage
User
System
Task

23
Step 3: Function
The Function step requires a researcher to examine his/her selected elements of system
usage and select one or more properties of these elements that tie to the other constructs in
his/her theory. As Table 1.4 shows, each element or combination of elements of usage can be
associated with one or more properties. For example, Model 4 in Table 1.4 shows a case in
which the researcher is interested in the user and system elements of usage and the table lists
“cognitive absorption” as a property associated with these elements. Of course, “cognitive
absorption” may or may not be relevant in a given study. The Function step simply requires a
researcher to determine the relevant properties for his/her study’s theoretical context.
Once a researcher has chosen the relevant properties, s/he must select measures to reflect
them. The aim is to obtain content-valid, contextualized measures of usage, that is, measures
that: (1) reflect the intended properties completely (i.e., no errors of omission) and (2) do not
also reflect other unintended properties (i.e., no errors of inclusion) (Messick 1989).
A potential criticism of this step is that it could lead to a proliferation of measures that all
refer to “system usage”, but refer to different content, thus hindering cumulative progress. This
criticism would be mistaken, because the different measures would still measure usage, just
different subsets of the usage activity. I show this in Figure 1.4 by using subscripts to denote
subtypes of usage relevant in different contexts. By encouraging researchers to justify the
properties and measures they select based on theory, the approach should support cumulative
progress.
Figure 1.4: Contextualizing the System Usage Construct
Key: X, Y = subtypes of system usage A, B = related constructs X-A, Y-B = usage measures that map to the related construct in the theoretical model
Construct A Usage X
MeasuresX-A
Construct B Usage Y
MeasuresY-B
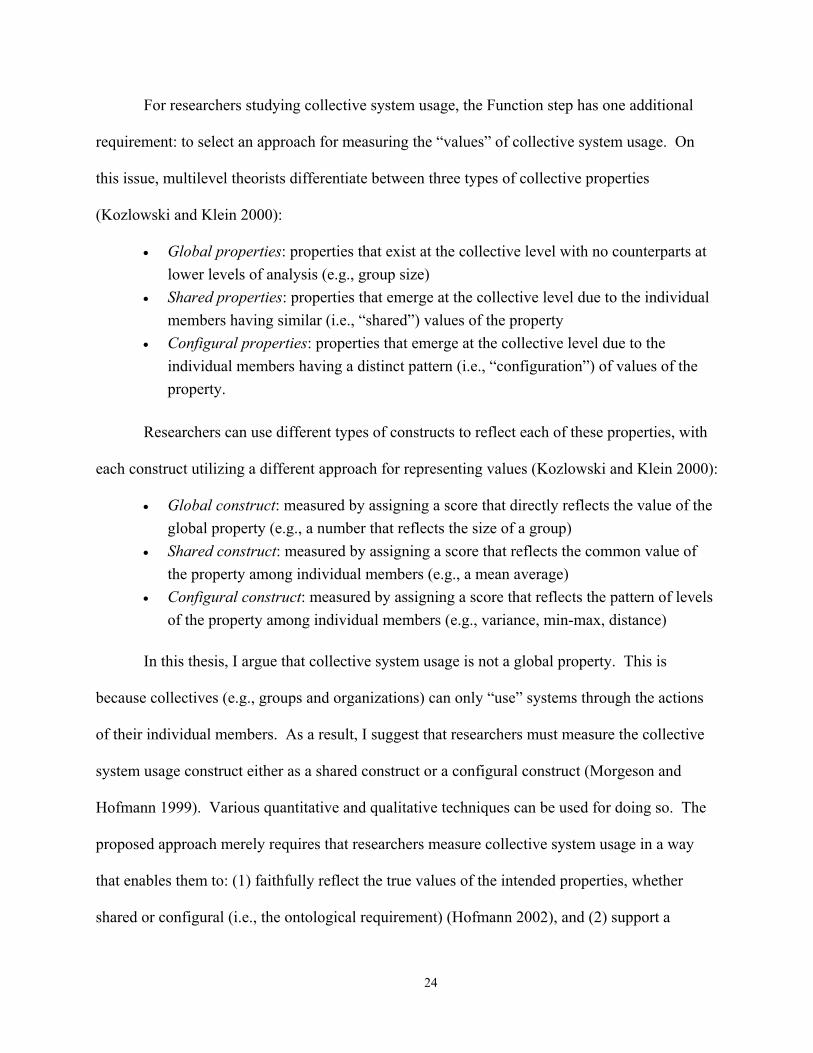
24
For researchers studying collective system usage, the Function step has one additional
requirement: to select an approach for measuring the “values” of collective system usage. On
this issue, multilevel theorists differentiate between three types of collective properties
(Kozlowski and Klein 2000):
• Global properties: properties that exist at the collective level with no counterparts at lower levels of analysis (e.g., group size)
• Shared properties: properties that emerge at the collective level due to the individual members having similar (i.e., “shared”) values of the property
• Configural properties: properties that emerge at the collective level due to the individual members having a distinct pattern (i.e., “configuration”) of values of the property.
Researchers can use different types of constructs to reflect each of these properties, with
each construct utilizing a different approach for representing values (Kozlowski and Klein 2000):
• Global construct: measured by assigning a score that directly reflects the value of the global property (e.g., a number that reflects the size of a group)
• Shared construct: measured by assigning a score that reflects the common value of the property among individual members (e.g., a mean average)
• Configural construct: measured by assigning a score that reflects the pattern of levels of the property among individual members (e.g., variance, min-max, distance)
In this thesis, I argue that collective system usage is not a global property. This is
because collectives (e.g., groups and organizations) can only “use” systems through the actions
of their individual members. As a result, I suggest that researchers must measure the collective
system usage construct either as a shared construct or a configural construct (Morgeson and
Hofmann 1999). Various quantitative and qualitative techniques can be used for doing so. The
proposed approach merely requires that researchers measure collective system usage in a way
that enables them to: (1) faithfully reflect the true values of the intended properties, whether
shared or configural (i.e., the ontological requirement) (Hofmann 2002), and (2) support a

25
coherent theoretical relationship with the other constructs in the theoretical model (i.e., the
epistemological requirement) (Doty et al. 1993).
Step 4: Method
The final step is to select one or more methods for obtaining the selected measures. To
extend past research (Collopy 1996; Straub et al. 1995), Figure 1.5 illustrates two sources of
method variance, distance bias and representation bias, that I propose researchers must consider
when selecting methods.
Distance bias refers to an inaccuracy in measurement that occurs due to a rater’s lack of
access (or “distance”) to the property. If a rater does not have access to the focal construct, their
measures may be restricted to a proxy (i.e., another construct). A common example of distance
bias occurs when a rater scores a property that belongs to a thing other than him/herself, e.g., an
IS or another person. In this case, the individual may lack knowledge of the property being
rated. Representation bias, in contrast, refers to an inaccuracy in measurement that is not due to
the rater’s lack of knowledge, but rather due to the rater not providing (i.e., “misrepresenting”)
his/her best estimate of the measure. Many reasons for representation bias are known, e.g.,
cognitive dissonance, social desirability, and yea/nay-saying (Podsakoff et al. 2003).
C
AB
Rater Domain of Interest
Figure 1.5: Two Sources of Method Variance: Distance Bias and Representation Bias8
8 The term “trait score” in measurement theory is equivalent to the term “property value” in ontology, i.e., it refers to the true score/value of the real world trait/property. In this chapter, I use the terms “property” and “value” because I align the arguments with ontological theory (Bunge 1977; Weber 2003c). In Chapter 5, I use the terms “trait” and “trait score” because the arguments in that chapter are aligned with measurement theory (Campbell and Fiske, 1959).
Key: A = Trait score (i.e., the property value) B = Rater’s best estimate of the trait score C = Rater’s recorded rating of the trait score Method variance: The distance C A Distance bias: The distance B A Representation bias: The distance B C

26
The proposed approach suggests that researchers account for these two sources of bias
differently. Specifically, the approach suggests that representation bias is unwanted and that
researchers should attempt to minimize it wherever possible. For example, researchers might use
multiple methods to triangulate on the scores from different raters (Campbell and Fiske 1959),
under an assumption that “true lies at the intersection of independent lies” (Levins 1966, p. 423).
Whether distance bias is unwanted depends on the aims of a study. This is because a
rating that reflects distance bias is not a true rating of the intended property, but it may be a valid
rating of a relevant, albeit unintended property. For example, assume that a researcher asks a
manager to complete a questionnaire regarding her subordinate’s performance. If the manager
has a mistaken perception of her subordinate’s performance, her rating would be a biased rating
of actual performance, but it would be a valid rating of her perception of the employee’s
performance, and this perception could have a real effect on how s/he interacts with the
employee at work, i.e., it is a relevant property in the domain. Of course, even though it is a
relevant trait in the domain, it may not be relevant for a particular researcher’s study. To provide
guidance, the proposed approach suggests that unintended properties measured by distance bias
are irrelevant (and, thus, distance bias should be minimized) only if all of the following hold:
• the inquiry is confirmatory (i.e., aiming to confirm or test one model) • the theory specifies a rater (e.g., perceived usefulness is “perceived” by the user) • the desired rater is available (i.e., the rater specified in the theory can be used)
Where any of these three conditions do not hold, the approach suggests that distance bias
is important, valuable, and should be investigated. Importantly, this could occur in many studies
of system usage because:
• researchers need not necessarily adopt a confirmatory stance (Platt 1964) • the system usage construct is rarely defined in terms of one particular rater • practical contingencies in research often preclude a researcher from using the desired
rater for every construct in a theoretical model

27
Overall, by highlighting the difference between distance bias and representation bias, and
providing guidance for dealing with them in an appropriate manner in a given study, the proposed
approach helps ensure that a researcher will obtain more accurate measures (i.e., the ontological
requirement) and more relevant measures (i.e., the epistemological requirement) in a given study.
1.6 Research Design
The proposed approach, like any approach, cannot be tested for its “truth,” only its
usefulness (Cook and Campbell 1979). I test its usefulness by empirically investigating whether
measures of system usage that are selected according to the approach yield better explanations
than other measures of usage in specific theoretical models. The theoretical context I use for this
empirical investigation is the relationship between system usage and user task performance,
which past researchers have suggested is a context in which better measures of system usage are
needed (Chin and Marcolin, 2001, DeLone and McLean, 2003).
1.6.1 Empirical Tests
Table 1.5 describes the empirical tests. As Table 1.5 shows, Chapters 2, 4, and 5 use data
from free simulation experiments. Each experiment examines one or more steps of the proposed
approach. Chapter 3 is a conceptual paper with no empirical test.
An experimental approach was appropriate because this is the first test of the proposed
approach and experiments generally provide strong empirical tests by providing greater control of
external influences and rival, confounding explanations (Calder et al. 1981; Greenberg 1987). A
limitation of experiments is their generalizability. To minimize this limitation, both experiments
examine a common task in practice: analysts’ use of spreadsheets for financial analysis (Springer
and Borthick 2004). This is a useful context for studying system usage because spreadsheets are
among the most common end-user applications in practice (Carlsson 1988; Panko 1998).

28
Table 1.5: Empirical Tests* Description of Empirical Test
Chapter Step examined
Design* Level of analysis
Methods Subjects Task/IT
Ch. 2 Structure, Function
Free simulation
Individual level Usage measured by self-report questionnaire, performance measured by an independent measure
Ch. 4 Structure, Function
Free simulation
Individual and collective level
Usage and performance measured by self-report questionnaire
Ch. 5 Method Free simulation
Individual level Usage and performance measured by self-report questionnaire and independent measures
Accounting students in a principles of accounting course in a southern US university
Use Excel to build a spreadsheet model to recommend a method of financing an asset purchase
* A free simulation is an experimental design in which the values of the independent variable (e.g., usage) are allowed to vary freely over their natural range (Fromkin and Streufert 1976). This gives an insight into the relationship between the independent and dependent variable and the range over which it occurs.
1.6.2 Data Analysis
Table 1.6 summarizes the data analysis approach. I briefly explain each test below.
In Chapter 2, I draw on theories of performance (Campbell 1990; March 1991) to
propose that in the context of studying the relationship between system usage and task
performance in cognitively engaging tasks, each element of usage (i.e., user, task, and system) is
relevant for explaining the relationship between system usage and task performance. Building
on past studies (Agarwal and Karahanna 2000; DeSanctis and Poole 1994; Wand and Weber
1995), I then propose two measures of these elements, cognitive absorption and deep structure
usage. I then empirically test whether these measures of system usage explain the relationship
between system usage and task performance more effectively than a measure of system usage
that would not be recommended by the proposed approach in this context (i.e., minutes of use).
Chapter 4 tests whether the results from Chapter 2 hold in a multilevel context. Drawing
on theories of groups (Lindenberg 1997), I propose that in this theoretical context, user
interdependencies-in-use are a relevant element of collective system usage in addition to the
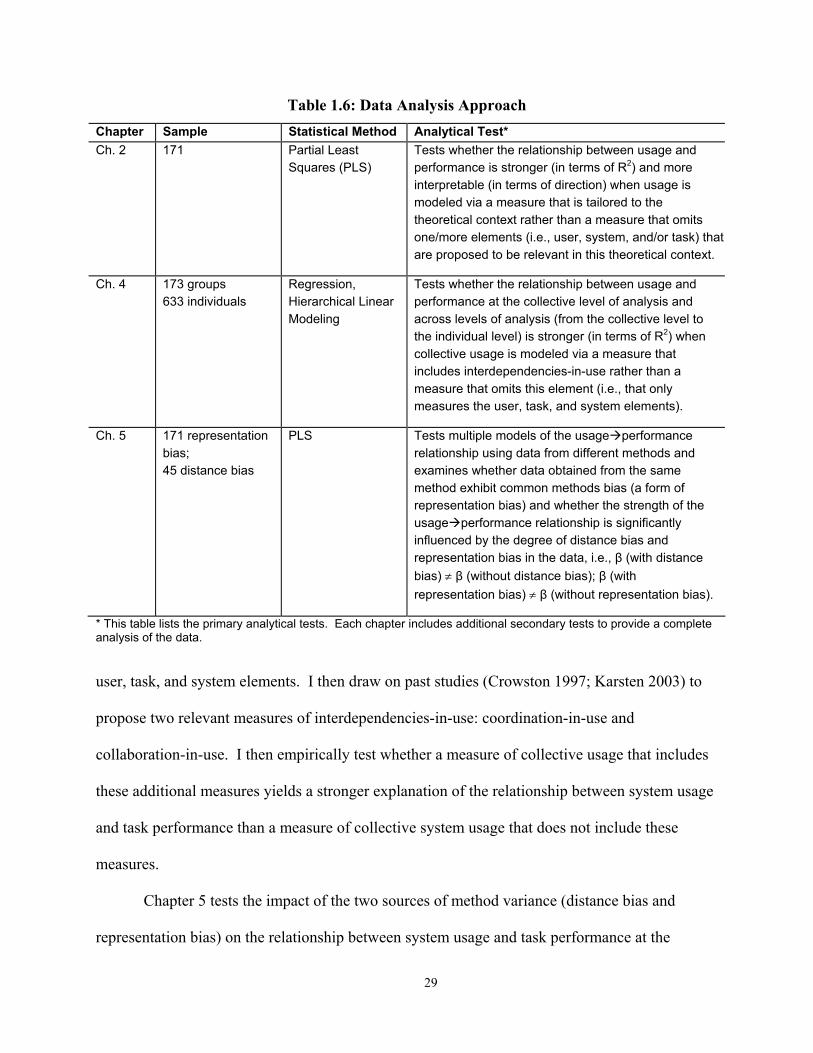
29
Table 1.6: Data Analysis Approach Chapter Sample Statistical Method Analytical Test* Ch. 2
171 Partial Least
Squares (PLS) Tests whether the relationship between usage and performance is stronger (in terms of R2) and more interpretable (in terms of direction) when usage is modeled via a measure that is tailored to the theoretical context rather than a measure that omits one/more elements (i.e., user, system, and/or task) that are proposed to be relevant in this theoretical context.
Ch. 4 173 groups 633 individuals
Regression, Hierarchical Linear Modeling
Tests whether the relationship between usage and performance at the collective level of analysis and across levels of analysis (from the collective level to the individual level) is stronger (in terms of R2) when collective usage is modeled via a measure that includes interdependencies-in-use rather than a measure that omits this element (i.e., that only measures the user, task, and system elements).
Ch. 5 171 representation bias; 45 distance bias
PLS Tests multiple models of the usage performance relationship using data from different methods and examines whether data obtained from the same method exhibit common methods bias (a form of representation bias) and whether the strength of the usage performance relationship is significantly influenced by the degree of distance bias and representation bias in the data, i.e., β (with distance bias) ≠ β (without distance bias); β (with representation bias) ≠ β (without representation bias).
* This table lists the primary analytical tests. Each chapter includes additional secondary tests to provide a complete analysis of the data. user, task, and system elements. I then draw on past studies (Crowston 1997; Karsten 2003) to
propose two relevant measures of interdependencies-in-use: coordination-in-use and
collaboration-in-use. I then empirically test whether a measure of collective usage that includes
these additional measures yields a stronger explanation of the relationship between system usage
and task performance than a measure of collective system usage that does not include these
measures.
Chapter 5 tests the impact of the two sources of method variance (distance bias and
representation bias) on the relationship between system usage and task performance at the
30
individual level of analysis. Utilizing the same measures of system usage and performance as in
Chapter 2, I use two methods to collect data on each measure: self-reports and independent
ratings. Self-reports are acquired via participants’ responses to validated instruments in a post-
test questionnaire. Independent ratings are obtained via independent ratings of participants’ use
of their spreadsheet program (MS Excel) and their final task performance. To enable an accurate
independent coding of system usage, Screen Cam software video records are examined for a
subsample of 46 user sessions. As Table 1.6 outlines, I test the impact of method variance by
running multiple models of the usage performance relationship that include different degrees of
distance bias and representation bias and I statistically identify the degree of methods bias and
distance bias within and across models.
1.7 Conclusion
Although system usage has been studied in IS research for many years, there have been
increasing calls to examine it more closely (Chin and Marcolin 2001; DeLone and McLean
2003). This thesis advances a new approach for conceptualizing and measuring system usage in
an appropriate manner for a given study and provides empirical tests to demonstrate that the
approach is both feasible and useful. Table 1.7 summarizes the intended contributions of the
thesis.
Construct development is a key activity in any field. By bringing new perspectives to the
system usage construct, my intention in this thesis is to create new opportunities for research on
the nature of system usage, its antecedents, and its consequences. Given the heated debates
surrounding this topic in journals such as the Harvard Business Review, a deeper understanding
of system usage should enlighten those who study information systems and those who invest in
and use systems in practice.

31
Table 1.7: Intended Contributions of the Thesis Component of Thesis Intended Contribution
Proposed approach Provide an explicit set of steps and principles that researchers can use to select or evaluate measures of system usage for a given theoretical context.
Provide an approach that practitioners can tailor to select metrics of system usage that enable them to explain how systems are used and explain how system usage is associated with downstream outcomes in practice.
Instantiate a new approach for conceptualizing and measuring constructs in IS research that is consistent with critical realist assumptions.
Empirical tests
Demonstrate the usefulness of the approach by empirically identifying the degree to which explanations of theoretical models can be improved by:
- Selecting elements, properties, and measures of system usage that are appropriate for a theoretical context
- Selecting methods for measuring system usage that are appropriate for the nature of a study’s inquiry, theory, and practical constraints
Provide validated measures of individual and collective usage for a specific theoretical context.
32
Chapter 2
Reconceptualizing System Usage9
Abstract
Although DeLone-McLean and others insist that system usage is a key variable in information systems research, the system usage construct has received little theoretical scrutiny, has no accepted definition, and is measured by a diverse set of measures. In this article, we present a systematic approach for reconceptualizing the system usage construct. Comprised of two stages, definition and selection, the approach enables researchers to develop clear and valid measures of system usage for a given theoretical and substantive context. The definition stage requires that researchers define system usage and explicate its underlying assumptions. In the selection stage, we suggest that system usage be conceptualized in terms of its structure and function. The structure of system usage is tripartite, comprising a user, system, and task, and researchers need to justify which elements of usage are most relevant for their study. In terms of function, researchers should choose measures for each element (i.e., user, system, and/or task) that tie closely to the other constructs in the researcher’s nomological network.
To provide evidence of the viability of the approach, we undertook an empirical investigation of the relationship between system usage and short-run task performance in cognitively engaging tasks. The results support the benefit of the proposed approach and suggest new directions for research into the nature of system usage, its antecedents, and its consequences.
Keywords: system usage, theoretical conceptualization, IS success
Acknowledgments: This paper has benefited from presentations at Georgia State University, the University of Georgia, and the University of Houston. We are particularly indebted to Dale Goodhue and Elena Karahanna for incisive comments.
9 Burton-Jones, A., and Straub, D. "Reconceptualizing System Usage," Working paper, Department of Computer Information Systems, Georgia State University, 2004.

33
2.1 Introduction
The system usage construct has played a central role in information systems (IS) research
since the 1970’s (Barkin and Dickson 1977). Many researchers have studied antecedents to
usage and, over time, the field has progressed towards a general model of these antecedents
(Venkatesh et al. 2003). Others have studied the impact of usage on individual performance.
They report the link to be strongly positive (Doll and Torkzadeh 1998), weakly positive
(Goodhue and Thompson 1995; Igbaria and Tan 1997), insignificant (Lucas and Spitler 1999), or
negative (Pentland 1989; Szajna 1993). The usage construct itself, however, typically escapes
scrutiny in such studies of antecedents and consequences. This has fuelled calls for closer
examination of the usage construct (Chin and Marcolin 2001; DeLone and McLean 2003).
Like Melone’s conceptual work on the user satisfaction construct in a (1990) issue of
Management Science, the current study undertakes a theoretical assessment of individual system
usage. Despite its centrality in IS research, the system usage construct has received scant
theoretical treatment to date. Apart from Trice and Treacy’s (1986) brief conceptualization and a
short discussion by Seddon (1997), we are unaware of any in-depth, theoretical assessment of the
construct. Without theoretical grounding, it is not surprising that past studies have arrived at
mixed conclusions about the link between system usage and individual performance.
We begin with a review of how system usage has been implicitly conceptualized in four
IS domains: IS acceptance, IS implementation, IS success, and IS-aided decision-making. Next,
we shift to the lack of theory and lack of validation in prior usage studies. To remedy these
problems, we advance a new, staged approach for reconceptualizing system usage, an approach
that enables researchers to construct measures that are more contextualized, complete, and valid.
We then empirically investigate the approach by conceptualizing system usage in terms of its
link with individual task performance. While other conceptualizations could be developed, a

34
mapping between system usage and performance is key, given mixed results in this area and
disagreements about its conceptualization (DeLone and McLean 2003). In addition, the present
work: (1) clarifies the richness of system usage, (2) demonstrates how different aspects of usage
can be integrated to derive a more complete, contextualized construct, and (3) reports on an
empirical test that validates the proposed approach for developing usage measures.
2.2 Implicit Conceptualizations of System Usage in Past Research
Few constructs in IS have had as long a history as system usage (DeLone and McLean,
1992, 2003). Figure 2.1 depicts the implicit conceptualizations of system usage in four research
domains: IS success, IS acceptance, IS implementation, and IS for decision-making.
IS Success
Adapted from DeLone and McLean (1992)
IS for Decision-Making
Adapted from Barkin and Dickson (1977)
Examples: Goodhue (1995); Lucas and Spitler (1999) Examples: Szajna (1993); Yuthas and Young (1998) IS Acceptance
Adapted from Davis (1989)
IS Implementation
Adapted from Lucas (1978a)
Examples: Straub et al. (1995); Venkatesh et al. 2003 Examples: Ginzberg (1981); Hartwick and Barki (1994)
Figure 2.1: Past Conceptualizations of the System Usage Construct
In the IS success domain, researchers have measured usage as an independent variable
(IV) or mediating variable leading to downstream impacts in order to determine how IT benefits
individuals or organizations (DeLone and McLean 1992). In the IS for decision making domain,
system usage is primarily a dependent variable (DV), as in Barkin and Dickson’s (1977) model
(see Figure 2.1). Researchers typically study IS characteristics that improve user decision-
Data from IS
Human Information Processing
Data Selection
Implementation Success
(System Usage)
Implementation Process
Usefulness and
Ease of Use
Intention to Use
System Usage
System & Information
Quality
System Usage
Individual & Organizat-
ional Impact
System Usage
35
making. In the IS acceptance domain, researchers study system usage as a behavior determined
by social and cognitive variables, with the goal of finding variables that explain most variance in
usage. Theories employed to specify the range of antecedents include the theory of reasoned
action, the theory of planned behavior, and social learning theory. Finally, system usage is a key
DV in IS implementation research, that is, determining characteristics of IT implementations that
lead to greater use of the final system. Although researchers sometimes choose measures specific
to their research domains (e.g., use of information from IS in the decision-making domain,
DeLone and McLean, 1992; or use of IS to support specific tasks in the IS success domain, Doll
and Torkzadeh, 1998), researchers across these communities generally deploy similar usage
measures. Long-standing measures include: features used, tasks supported, extent of use, use or
non-use, heavy/light use, frequency of use, and duration (see Table 2.1).
Despite this long-standing investigation of system usage, studies of its relationship with
other constructs often report weak effects. With system usage as a DV, researchers have carefully
examined a large number of antecedents (Adams et al. 1992), but explained variance is in a
middling range, averaging around 30% (Meister and Compeau 2002). With system usage as an
IV, studies of its downstream effects (e.g., on performance) report mixed results. Although
progress has been made at an organizational level (Devaraj and Kohli 2003), findings at an
individual level report that system usage can increase (Doll and Torkzadeh 1998), decrease
(Pentland 1989; Szajna 1993), or have no effect on performance (Lucas and Spitler 1999).
2.3 The Need to Reconceptualize System Usage
Why is there a need to reconceptualize system usage? A review of the literature prompts
two concerns: no theory and poor-to-no validation. Our evidence draws upon 48 empirical
studies of individual-level system usage (see Appendix 5A). The chief limitation in past

36
Table 2.1: The Diversity of System Usage Measures Employed in Past Research† Broad Dimension Individual Measures Used as IV Used as DV
System usage measured as the use of information from an IS Extent of use Number of reports or searches requested Nature of use Types of reports requested, general versus specific use Frequency of use Frequency of report requests, number of times discuss
information
System usage measured as the use of an IS Method of use Direct versus indirect Extent of use Number of systems, sessions, displays, functions, or messages;
user’s report of whether they are a light/medium/heavy user.
Proportion of use Percentage of times use the IS to perform a task Duration of use Connect time, hours per week Frequency of use Number of times use system (periods are: daily, weekly, etc.) Decision to use Binary variable (use or not use) Voluntariness of use Binary variable (voluntary or mandatory) Variety of use Number of business tasks supported by the IS Specificity of use Specific versus general use Appropriateness of use Appropriate versus inappropriate use Dependence on use Degree of dependence on use
† Developed from a sampling of 48 articles in major IS journals in the period 1977-2005 (see Appendix 5A). conceptualizations of system usage has been the atheoretical manner in which usage measures
have been chosen. While many researchers carefully use theory to choose antecedents to usage
(e.g., the theory of reasoned action; Venkatesh et al. 2003), few discuss how theory informs their
choice of usage measures. With the exception of early decision-making studies that drew on
information processing theory (Barkin and Dickson 1977), we found no studies that expressed a
strong theoretical basis for system usage, its appropriate empirical indicators, or its relationships
with other constructs. The consequences of this dearth of theory can be seen in Table 2.1, which
illustrates the diversity of usage measures in past research. In all, 14 broad measures are listed as
well as many minor variants. In the presence of strong theory, diversity of measures is desirable
(Campbell and Fiske 1959), but in its absence, an abundance of measures is problematical—it
lures researchers into believing that there is no problem with measuring usage (Srinivasan 1985).
We believe that the problems stemming from lack of theory are now coming to light, evident in
the persistence of mixed results and lack of consensus on how to conceptualize system usage in IS
success models (DeLone and McLean 2003).

37
In addition to this theoretical lacuna, our review found that there was almost no validation
of the usage construct. Surprisingly, while user satisfaction (the complement of system usage in
DeLone and McLean’s model), has had extensive instrument development (Doll and Torkzadeh
1988) and validation (Chin and Newsted 1995), work on system usage has not. Most studies
select one or two usage measures from the many available (see Appendix 5A). A minority of
studies use three or more measures and factor-analyze them to arrive at a composite measure of
usage (Igbaria et al. 1997). Even in these instances, however, measures of system usage are
chosen for their appearance in past empirical studies rather than for theoretical reasons.
2.4 A Staged Approach for Reconceptualizing System Usage
We suggest that the lack of theory underlying measures of usage in past research and the
lack of validation of such measures manifest deeper problems:
• There is no accepted definition of the system usage construct in the IS literature. • There is no accepted approach for selecting the relevant content of usage for any given study.
To overcome these problems, this paper presents, for the first time, a systematic approach
to enable researchers to reconceptualize system usage (Figure 2.2). By “reconceptualize,” we
mean that system usage is not a type of construct that can have a single conceptualization or
measure. Unlike constructs that are strictly unidimensional, or multidimensional with specific,
known dimensions, we believe that relevant measures and dimensions of system usage will vary
across contexts. In this light, having diverse conceptualizations of usage (as in past research, per
Figure 2.1) is desirable. What is needed is a way to make such conceptualizations explicit. Thus,
while we do not believe that there can be a single accepted conceptualization of system usage, we
believe that there is great value in having an accepted approach for systematically developing
conceptualizations of usage and selecting usage measures in a theoretically rigorous way. This
paper presents such an approach (per Figure 2.2). We outline the stages of the approach in turn.

38
Figure 2.2: Staged Approach for Defining System Usage and Selecting Usage Measures
2.4.1 Defining System Usage
To conceptualize system usage, one must define it. Surprisingly, the IS field has no
generally accepted definition of system usage. Granting that other definitions could be
constructed, we propose that system usage is an activity that involves three elements: (1) a user,
i.e., the subject using the IS, (2) a system, i.e., the object being used, and (3) a task, i.e., the
function being performed.10 Drawing on each element and recognizing that any IS comprises
many features (Griffith 1999), we define individual-level system usage as: an individual user’s
employment of one or more features of a system to perform a task. This definition has two
implications. First, it distinguishes system usage from related, but distinct constructs. For
example, it suggests that system usage is distinct from information usage. In contrast to DeLone
and McLean’s (1992) definition of system usage and others (Table 2.1), we suggest that
information usage is a useful construct, but it is not identical to system usage. System usage is
also distinct from a user’s decision to use or subsequent dependence on an IS and from user
adoption. Even though many IT acceptance researchers have utilized such constructs as proxies
for system usage (Table 2.1), one must not confuse a proxy for a construct. Finally, system usage
10 Any definition of usage must rely on assumptions. Our assumptions about the elements of usage are as follows: • A user is an individual person who employs an IS in a task. This implies that although users are social actors
(Lamb and Kling 2003), we assume that it is possible to study user behavior at a purely individual level. • An IS is an artifact that provides representations of one or more task domains. This implies that IS provide
features that are designed to support functions in those task domain(s) (Zigurs and Buckland 1998). • A task is a goal directed activity performed by a user. This implies that task outputs can be assessed in terms of
pre-defined task requirements (March 1991).
Definition Stage Define the distinguishing characteristics of system usage and state assumptions regarding these characteristics.
Selection Stage
Choose the best measures for the part of the usage activity that is of interest.
Step 1: Structure: Select the elements of usage that are most relevant for the research model and context.
Step 2: Function: Select measures for the chosen elements that tie to the other constructs in the nomological network.
39
is not an evaluation. Evaluations such as quality of use (Auer 1998) and appropriate use (Chin et
al. 1997) are useful constructs, but they do not measure system usage; instead, they measure the
degree to which one’s usage corresponds with another construct such as expected use or system
“spirit” (Chin et al. 1997). Our definition implies that if one is to measure system usage itself,
one must quantify it, not evaluate it.
The second implication of the definition is that it clarifies the content of system usage.
Because system usage is a complex activity involving a user, IS, and task over time, it has a
broad “universe of content” (Cronbach 1971). As Table 2.2 shows, one could use lean or rich
measures to measure this content. Lean measures would attempt to capture the entire content of
the activity in an omnibus measure such as use/non-use, duration of use, or “extent” of use.
Although such lean measures can be convenient, they are unfortunately inexact because they do
not refer to the aspect of usage that may be most relevant in a specific context and it may not be
clear to a respondent what part of the usage activity is actually being measured. Dubin (1978)
called omnibus measures of complex constructs “summative units” and warned against their
employ. In contrast to lean measures, rich measures incorporate the nature of the usage activity
(see Table 2.2). To employ rich measures, one must have a way to select relevant content; this
leads to the second stage: selection.
2.4.2 Selecting Content Valid, Contextualized Measures: A Two-Step Approach
As Table 2.2 shows, system usage always involves a system, but researchers can use rich
measures to capture more or less of its use in a particular context. Some researchers may only be
interested in the extent to which the system is used, without capturing much of the user or task
context (Table 2.2, model 3). Others may wish to include the user context by measuring the
degree to which a user employs a system (Table 2.2, model 4) or include the task context by
measuring the degree to which the system is employed in the task (Table 2.2, model 5). None of

40
Table 2.2: Rich and Lean Measures of System Usage Richness of measures
1. Very Lean 2. Lean 3. Somewhat Rich (IS)
4. Rich (IS, User)
5. Rich
(IS, Task) 6. Very Rich
(IS, User, Task) Type Presence of
use Extent of use (omnibus)
Extent to which the system is used
Extent to which the user employs the system
Extent to which the system is used to carry out the task
Extent to which the user employs the system to carry out the task
Domain of content measured*
Example Use/ Non-use
Duration Extent of use
Breadth of use (number of features)
Cognitive absorption
Variety of use (number of subtasks)
Reference Alavi and Henderson (1981)
Venkatesh and Davis (2000)
Saga and Zmud (1994)
Agarwal and Karahanna (2000)
Igbaria et al. (1997)
None to date (Difficult to capture via a reflective construct)
* Lean measures reflect usage alone; rich measures reflect its nature, involving the system, user, and/or task.
these approaches is inherently superior. Rather, researchers must choose appropriate measures for
their objective, theory, and methods. Methods can, at times, be very restrictive. For example, in
some instances, a researcher may be restricted to a very lean measure (per Table 2.2, model 1),
simply due to the practical realities of data collection. In other instances, a researcher may wish
to use a very rich measure to capture all three elements of usage (per Table 2.2, model 6).
Although it is feasible theoretically to construct a single measure that captures each element of
usage (i.e., system, user, and task), it is difficult methodologically to do so because the richness of
the activity being measured makes it difficult to construct and cognitively difficult to respond to
such a measure in practice. Here, a methodological compromise is to combine measures for the
system, user, and task aspects of usage and create an aggregate higher-order construct to capture
the entire activity (Law et al. 1998). We proffer an example of this strategy later in the paper.
As Figure 2.2 shows, this reasoning leads us to suggest a method for selecting measures
of usage in future research. In other words, system usage can be attributed with a precise
definition, but the definition refers to a broad range of content, only a subset of which will be
relevant in a specific study. As different subsets will be relevant in different studies, one cannot
Usage
User
System
Task
Usage Usage Usage
User
System
Task
Usage
User
System
Task
Usage
User
System
Task

41
create a single measure of usage, but one can define an approach for creating usage measures in
such a way that the measures capture the most relevant content for a specific context (i.e., are
content-valid, yet contextualized). To define such an approach, we draw on Cronbach and
Meehl’s (1955) classic description of construct validity. According to Cronbach and Meehl, a
construct’s meaning is defined partly by its internal structure or make-up and partly by the other
constructs in its nomological network. This implies a two-step method for selecting measures of
system usage (per Figure 2.2):
1. Structure: select the elements of usage (i.e., the user, system, and/or task) that are most relevant for the research model and context,
2. Function: for the selected elements of usage, select measures of these elements that tie closely to the other construct(s) in the proposed nomological network. A potential criticism of this two-step method is that it could lead to a proliferation of
measures that all refer to “system usage”, but refer to different content, thus hindering cumulative
progress. This criticism would be mistaken, because the different measures would still measure
usage, just different subsets of the usage activity. The distinction between the two-step method
and existing practice is that the method should enable researchers to select and validate their
usage measures from a theoretical basis. We show this in Figure 2.3 by using subscripts to
denote subtypes of usage appropriate for different contexts. By clarifying the subset of usage
being measured, and theoretically justifying one’s measures, cumulative progress will improve.
Figure 2.3: Contextualizing the System Usage Construct
2.5 Empirical Investigation of the Staged Approach for Reconceptualizing Usage
If the staged approach for reconceptualizing system usage is beneficial, a researcher
should obtain more persuasive and meaningful results in a study of system usage if s/he follows
Key: X, Y = subtypes of system usage A, B = related constructs X-A, Y-B = usage measures that map to the related construct in the theoretical model
Construct A Usage X
MeasuresX-A
Construct B Usage Y
MeasuresY-B

42
the approach than if s/he does not. We empirically investigate this proposition to provide
indicative (albeit, not definitive) support or refutation for the utility of the approach. To limit the
scope of the investigation, we adopt the definition of system usage that we proposed in the
Definition stage above and we focus on the benefit of following the steps in the Selection stage.
To conduct an empirical investigation of the approach, we must choose a theoretical and
substantive context. The theoretical context that we chose was the relationship between system
usage and short-run, individual task performance.11 This is an important context because
DeLone and McLean’s IS success model (1992) suggests a link between system usage and
individual task performance, but past studies of this link report mixed results (Pentland, 1989,
Lucas and Spitler, 1999) and several scholars have called for more research to determine which
usage measures are appropriate in this context (Chin and Marcolin 2001). The substantive
context that we chose for the empirical investigation was analysts’ use of spreadsheets for
financial analysis. This is a crucial practical context because spreadsheets are among the most
common end-user applications and decision-support tools in practice (Carlsson 1988; Panko
1998).
Following Figure 2.2, the first step when selecting usage measures is to define its
structure. Because usage involves an IS, user, and task, the relevance of each element should be
judged in light of the theoretical context. As financial analysis is a complex, cognitive activity,
not a simple, mechanical task (Goodhue 1995), we expect that each element is relevant and, thus,
a very rich usage measure is required (Table 2, model 6). The second step is to choose measures
for its elements that relate theoretically to the other constructs in its nomological network. There
are two constructs in our case: system usage and performance. Therefore, we select usage
11 Past research suggests a distinction between the causes of short-run and long-run performance (March 1991). Although both are clearly important, we limit our empirical investigation to short-run performance.

43
measures by chaining backwards from performance measures to usage measures (per Figure 2.4).
Figure 2.4: Selecting Usage Measures via Nomological Network Analysis
Following the logic in Figure 2.4, the sections below describe the nature of individual
task performance and propose measures of system usage that relate to it theoretically.
Specifically, we identify a type of system usage (exploitive system usage) that relates
theoretically to performance and we demonstrate how a very rich measure of this type of usage
can be formed by combining two rich measures of system usage: cognitive absorption (that
captures a user’s employment of an IS, per Table 2, model 4) and deep structure usage (that
captures the use of the system for the task, per Table 2, model 5). As proposed above, if the
staged approach for measuring usage is beneficial, measures selected according to the approach
should be superior to other measures. Thus, after defining performance and its related usage
measures below, we report on an experiment that we designed to test whether our ability to
explain the relationship between individual system usage and short-run task performance
improves when richer measures are used. In other words, we test whether explanations are
strongest (in terms of the amount of variance explained and the interpretability of relationships)
when a very rich measure is employed (i.e., exploitive system usage), less strong when a rich
measure is employed (i.e., cognitive absorption or deep structure usage alone), and even poorer
when a lean measure is employed (i.e., duration).
2.5.1 Defining Individual Task Performance
In the performance measurement literature, job performance comprises two dimensions:
System Usage
Individual Performance
Causal link
Mapping from performance measures to usage measures
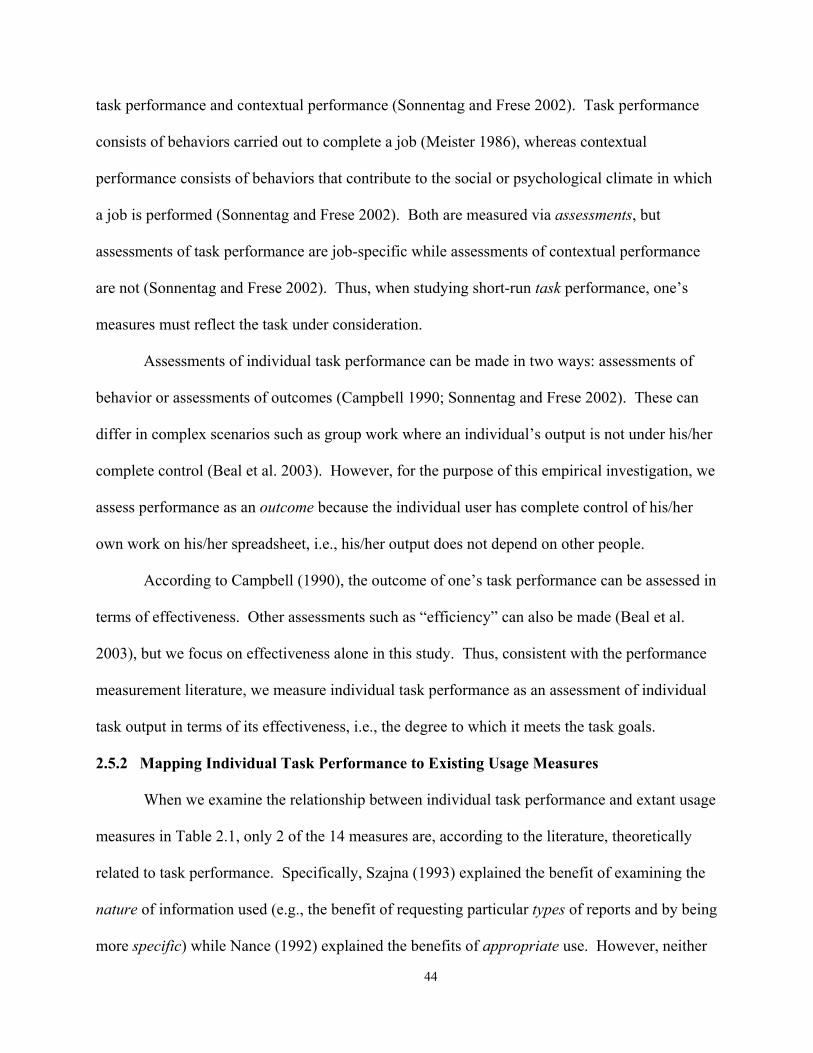
44
task performance and contextual performance (Sonnentag and Frese 2002). Task performance
consists of behaviors carried out to complete a job (Meister 1986), whereas contextual
performance consists of behaviors that contribute to the social or psychological climate in which
a job is performed (Sonnentag and Frese 2002). Both are measured via assessments, but
assessments of task performance are job-specific while assessments of contextual performance
are not (Sonnentag and Frese 2002). Thus, when studying short-run task performance, one’s
measures must reflect the task under consideration.
Assessments of individual task performance can be made in two ways: assessments of
behavior or assessments of outcomes (Campbell 1990; Sonnentag and Frese 2002). These can
differ in complex scenarios such as group work where an individual’s output is not under his/her
complete control (Beal et al. 2003). However, for the purpose of this empirical investigation, we
assess performance as an outcome because the individual user has complete control of his/her
own work on his/her spreadsheet, i.e., his/her output does not depend on other people.
According to Campbell (1990), the outcome of one’s task performance can be assessed in
terms of effectiveness. Other assessments such as “efficiency” can also be made (Beal et al.
2003), but we focus on effectiveness alone in this study. Thus, consistent with the performance
measurement literature, we measure individual task performance as an assessment of individual
task output in terms of its effectiveness, i.e., the degree to which it meets the task goals.
2.5.2 Mapping Individual Task Performance to Existing Usage Measures
When we examine the relationship between individual task performance and extant usage
measures in Table 2.1, only 2 of the 14 measures are, according to the literature, theoretically
related to task performance. Specifically, Szajna (1993) explained the benefit of examining the
nature of information used (e.g., the benefit of requesting particular types of reports and by being
more specific) while Nance (1992) explained the benefits of appropriate use. However, neither

45
of these measures complies well with the definition of system usage because Szajna’s (1993)
measures relate to information usage rather than system usage and Nance’s (1992) measure was
an evaluation of use rather than a measure of usage itself. Thus, new usage measures are needed.
Following the logic in Figure 2.4, we next outline the type of use⎯exploitive usage⎯that is
most conducive to a clear mapping to short run task performance.
2.5.3 Types of System Usage that Relate to Individual Task Performance
Two types of system usage can drive individual task performance: exploitation and
exploration (March 1991). Exploitation refers to routine execution of knowledge, whereas
exploration refers to the search for novel or innovative ways of doing things. A balance between
these is necessary for long run performance, but exploitation is preferred in the short run because
it has more predictable, immediate benefits (March 1991). In this illustrative case, the task is
short, so our measures of usage must refer to exploitive use. Exploitive usage refers to usage
that implements and executes one’s knowledge of one’s system and task. Subramani (2004)
recently examined the benefit of measures of exploitive use at an organizational level of analysis
but no such measures have ever been investigated at an individual level of analysis. Moreover,
Subramani’s (2004) measures of exploitive use referred only to the extent to which a system was
used in specific tasks (per Table 2.2, model 5). Because a very rich measure of usage is needed
in our theoretical context (per Table 2.2, model 6), the next sections demonstrate how such a
measure was constructed.
2.5.4 A Model of System Usage and Individual Task Performance
Figure 2.5 presents our proposed theoretical model for this empirical investigation.
Individual task performance is envisioned as a reflective construct measured in terms of
effectiveness. System usage is modeled as an aggregate higher-order construct with two
subconstructs that together capture user employment of the system (cognitive absorption) and the
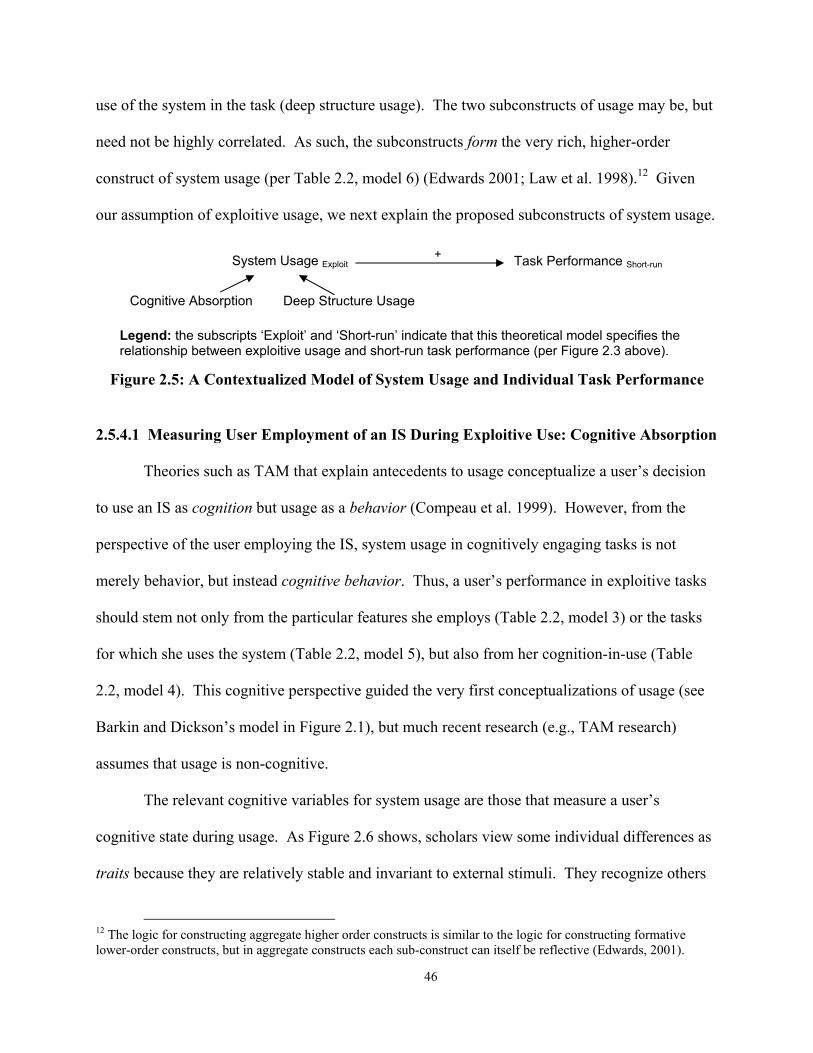
46
use of the system in the task (deep structure usage). The two subconstructs of usage may be, but
need not be highly correlated. As such, the subconstructs form the very rich, higher-order
construct of system usage (per Table 2.2, model 6) (Edwards 2001; Law et al. 1998).12 Given
our assumption of exploitive usage, we next explain the proposed subconstructs of system usage.
Legend: the subscripts ‘Exploit’ and ‘Short-run’ indicate that this theoretical model specifies the relationship between exploitive usage and short-run task performance (per Figure 2.3 above).
Figure 2.5: A Contextualized Model of System Usage and Individual Task Performance
2.5.4.1 Measuring User Employment of an IS During Exploitive Use: Cognitive Absorption
Theories such as TAM that explain antecedents to usage conceptualize a user’s decision
to use an IS as cognition but usage as a behavior (Compeau et al. 1999). However, from the
perspective of the user employing the IS, system usage in cognitively engaging tasks is not
merely behavior, but instead cognitive behavior. Thus, a user’s performance in exploitive tasks
should stem not only from the particular features she employs (Table 2.2, model 3) or the tasks
for which she uses the system (Table 2.2, model 5), but also from her cognition-in-use (Table
2.2, model 4). This cognitive perspective guided the very first conceptualizations of usage (see
Barkin and Dickson’s model in Figure 2.1), but much recent research (e.g., TAM research)
assumes that usage is non-cognitive.
The relevant cognitive variables for system usage are those that measure a user’s
cognitive state during usage. As Figure 2.6 shows, scholars view some individual differences as
traits because they are relatively stable and invariant to external stimuli. They recognize others
12 The logic for constructing aggregate higher order constructs is similar to the logic for constructing formative lower-order constructs, but in aggregate constructs each sub-construct can itself be reflective (Edwards, 2001).
System Usage Exploit Task Performance Short-run
Cognitive Absorption Deep Structure Usage
+
47
as states because they are variable and can be manipulated (Webster and Martocchio 1992). As
Figure 2.6 shows, the proposed model of usage includes measures of users’ cognitive state
during use; user traits are exogenous variables and are excluded from the usage construct. For
example, users’ knowledge of a system or a task, their ability or competence at performing
certain tasks, their self-efficacy, and their experience could all influence use and performance
(Marcolin et al. 2001), but they are not part of the system usage construct.
Figure 2.6: User State Versus Trait Variables for Measuring System Usage
Theories of cognition (Ashcraft 2002) delineate cognitive states associated with greater
task performance. Several cognitive theories could be used to explain the aspects of cognition
that are required for exploitive use of a system. For instance, Locke and Latham’s (1990) goal
setting theory suggests that users’ level of commitment to the task goals while using an IS would
be positively related to task performance. However, when choosing rich measures, one must
balance completeness with parsimony. To build a parsimonious model, we focus on just one part
of a user’s relationship with his/her IS: cognitive absorption (Agarwal and Karahanna 2000).
Cognitive absorption is the amount of cognitive resources applied when using a system in
a task. Two bodies of theory suggest that cognitive absorption will increase individual task
performance. First, cognitive psychology asserts that individuals must engage in conscious (not
automatic) processing to perform all but the simplest cognitive tasks (Ashcraft 2002). Cognitive
absorption refers to a state in which an individual is applying a significant proportion of his/her
conscious processing to the task. This improves cognition by controlling attention, speeding up
information processing, filtering out distractions, and reducing errors (Ashcraft 2002; Eysenck
User Trait: Exogenous Variable
User State:IS Usage Variable Dependent Variable
Performance Cognitive absorption
User Competency

48
1982). Thus, given a set of tasks requiring cognitive resources, an increase in cognitive
absorption, up to a reasonable level (Proctor and Dutta 1995), will increase the amount of
cognitive resources applied, and thereby increase the number of tasks completed.
Researchers have also studied performance benefits from absorption under the rubric of
flow. In a state of flow, individuals lose perception of their surroundings, reduce thinking about
extraneous matters, increase attention to the task-at-hand, and feel more control over their work
(Csikszentmihalyi 1990; Webster and Martocchio 1992). Flow theory also suggests that users in
flow produce better quality work by being more creative. Flow supports creativity because
individuals absorbed in their work have adaptable thought patterns because their attention is
focused in what is unfolding in the moment (Mainemelis 2001).
Drawing upon these two prior research streams, we therefore hypothesize that an increase
in cognitive absorption during system usage will lead to an increase in short-run task
performance.
As Table 2.2 outlines, a user’s cognitive state during exploitive use addresses an
important part of use (the user’s mental state), but it fails to capture the degree to which the IS is
being used in the task. Of course, two users in the same cognitive state could apply an IS
differently in their tasks. Thus, when testing the link between use and task performance, a richer
measure is needed to capture the way the IS is being used in the task, beyond mere cognition (per
Table 2.2, model 6).
2.5.4.2 Measuring Use of the System in the Task During Exploitive Use: Deep Structure Usage
To measure the degree to which a system is employed in a task, researchers often
measure breadth of use (e.g., Saga and Zmud, 1994, Igbaria et al., 1997). From the perspective
of a system, breadth refers to the number of features used (Table 2.2, model 3). From the
perspective of a system’s use in a task, breadth refers to the number of subtasks that an IS is used

49
to support (Table 2.2, model 5). Unfortunately, the theoretical link between breadth of use and
task performance is weak (Jasperson et al. 2005). Thus, following Figure 2.4, we searched for a
measure of exploitive use that would capture the degree to which a system is employed in a task
and that would theoretically relate to task performance.
Recently, Subramani (2004) developed a measure in this vein called “use for
exploitation.” In Subramani’s study, this was a task-centered measure, with items specifically
created to match the study task context. We adopt a similar approach. However, in our
theoretical context, exploitive use refers not just to the use of the IS in the task, but also to user’s
cognitions. Thus, to clearly distinguish these two aspects of exploitive use, we refer to usage of
the system to support the task as “deep structure usage” rather than Subramani’s “use for
exploitation.”
We adopt the term “deep structure usage” because it usefully describes one’s use of the
core features of an IS to complete a task. Originally coined in linguistics (Chomsky 1965), the
term “deep structure” has been used by many researchers to describe the underlying rules and
structure of tasks and compare it to “surface structure” that represents transient patterns of work
that are more adaptable and less significant (Gersick 1991; Heracleous and Barrett 2001; Lassila
and Brancheau 1999; Malone et al. 1999). Others employ deep structure to describe the IS itself.
Deep structure distinguishes functional rules and requirements embedded in an IS from its
surface structure (i.e., its interface or appearance) and its physical structure (i.e., the physical
machine) (DeSanctis and Poole 1994; Long and Denning 1995; Weber 1997).
In Adaptive Structuration Theory, DeSanctis and Poole (1994) integrated these views by
proposing that deep structures are designed into IS to support the deep structure of the tasks for
which they are used. DeSanctis and Poole characterize deep structures in IS in two ways: (1) as
structural features like the rules, resources, and capabilities in the IS, and (2) as the spirit or

50
values and goals underlying the set of structural features. Thus, two interpretations of deep
structure usage can be made: (1) using features in the IS that are designed to support the deep
structure of the task, and (2) using deep structure features in a way that is faithful with the
system spirit (i.e., the intent or vision of the system designers) (DeSanctis and Poole 1994). We
adopt the former interpretation. Chin et al. (1997) scaled “faithfulness of use” in the latter vein,
but faithfulness is an evaluation of usage, not a measure of system usage itself.
In sum, a significant body of theory has been developed regarding deep structure, both in
the analysis of users’ tasks, analysis of the IS, and DeSanctis and Poole’s integrated perspective.
In line with developing new constructs to support theory development and testing, we propose a
new measure of exploitive use based on this research stream, termed “deep structure usage.” It is
defined as the degree to which a user employs deep structure features of the system in the task.
Consistent with DeSanctis and Poole (1994), we propose that systems contain deep
structures consisting of rules, resources, and capabilities that were designed into the IS to support
a conception of user task requirements and that are made available for users to employ in the
form of features (Griffith 1999). For systems that support a single task, the IS deep structure will
map closely to the task deep structure. However, for systems that support many diverse tasks
(such as the system in our illustrative case, i.e., spreadsheets), only a subset of the IS deep
structure will support the deep structure of any specific task. Thus, following recent
recommendations (Jasperson et al. 2005), when studying the relationship between exploitive use
and performance, one must create a task-centered measure of deep structure use by examining
the subset of the IS deep structure that is relevant for the task and then measuring the degree to
which users employ those features. This task-centered approach is similar to the approach
Subramani (2004) used to create measures of “use for exploitation.” It also means that deep
structure usage is related to Goodhue’s (1995) task-technology-fit (TTF). TTF and deep

51
structure usage are distinct, however, because TTF is an evaluative construct that measures the
degree to which a system fits the task, whereas deep structure usage measures the degree to
which a user is using the set of features in the IS that were designed to support the task.13
Because deep structure features support the core aspects of a user’s task, we construct a
measure of the IS and task context during exploitive use (per Table 2.2, model 5) based on the
belief that deeper usage (defined as the extent to which deep structure features are used in the
task), will lead to greater short-run performance because using these features leverages user
cognition in the core executions of the task. By increasing the proportion of cognition applied to
the task, deep structure usage should increase task performance in two ways. First, following
TTF theory (Goodhue and Thompson 1995), focusing one’s use on the core of the task should
increase the proportion of required work completed by decreasing time spent on irrelevant tasks.
Second, by engaging users’ cognition in the task, deep structure features should increase work
quality by users gaining insight into the task and how the IS is supportive. Please note that this
insight need not only stem from correct use of the deep structure. If a user employs deep
structure inappropriately, s/he can observe the results of his/her action and learn, but users who
fail to use or choose not to use the deep structure, will not gain this understanding.
2.6 Empirical Test of the Staged Approach for Reconceptualizing System Usage
If the staged approach is beneficial, measures created according to the approach should
perform more effectively than measures not selected according to the approach. Thus, in the
present case, our ability to explain the relationship between system usage and short-run task
performance should be best if we employ a very rich measure of system usage (i.e., exploitive
system usage), less strong if we employ a rich measure of system usage alone (i.e., cognitive
13 Both TTF and deep structure usage also differ from “appropriate use,” which evaluates the degree to which users employ a system’s features in an optimal way in the task, or in a manner expected by its designers (Chin et al. 1997).
52
absorption or deep structure usage), and even poorer if we employ a lean measure of system
usage such as “duration of use.” We used an experiment to test this proposition. A field study
would have increased external validity, but lab experimentation provided a tighter test of the
proposed measures of usage (Calder et al. 1981).
2.6.1 Task and Design
The task required a user to build a spreadsheet model in MS Excel to determine the best
approach for financing an asset purchase. The task enabled a strong test of the theoretical model
as the analysis was cognitively engaging, which allows variation in cognitive absorption, and the
system (Excel) contains features that directly support the task, which allows variation in deep
structure usage. Because our interest is in the importance of rich measures, but not specific
values on these measures, we adopted a free simulation design rather than a factorial design
(Fromkin and Streufert 1976). Free simulations allow values of the IVs (e.g., cognitive
absorption and deep structure usage) to vary freely over their natural range. This gives an insight
into nature of the IV DV relationship as well as the range over which it occurs.
2.6.2 Subjects
Subjects were 229 students in an intermediate accounting course in a southern U.S.
university. The accounting course integrated a series of spreadsheet-based business analysis
assignments into the intermediate and prerequisite introductory accounting course. Students
were graded on four assignments in the introductory class and four in the intermediate class.
Data was collected during an end-of-semester case-exam worth 10% of the student’s grade. The
case used the same general format as previous assignments and involved accounting concepts
learned during the course (present value, asset financing, and risk versus return). To the greatest
extent possible, therefore, the system and task were believed to enable exploitive use by our
subjects. Completion of the post-test instrument was voluntary; 177 were returned (response rate
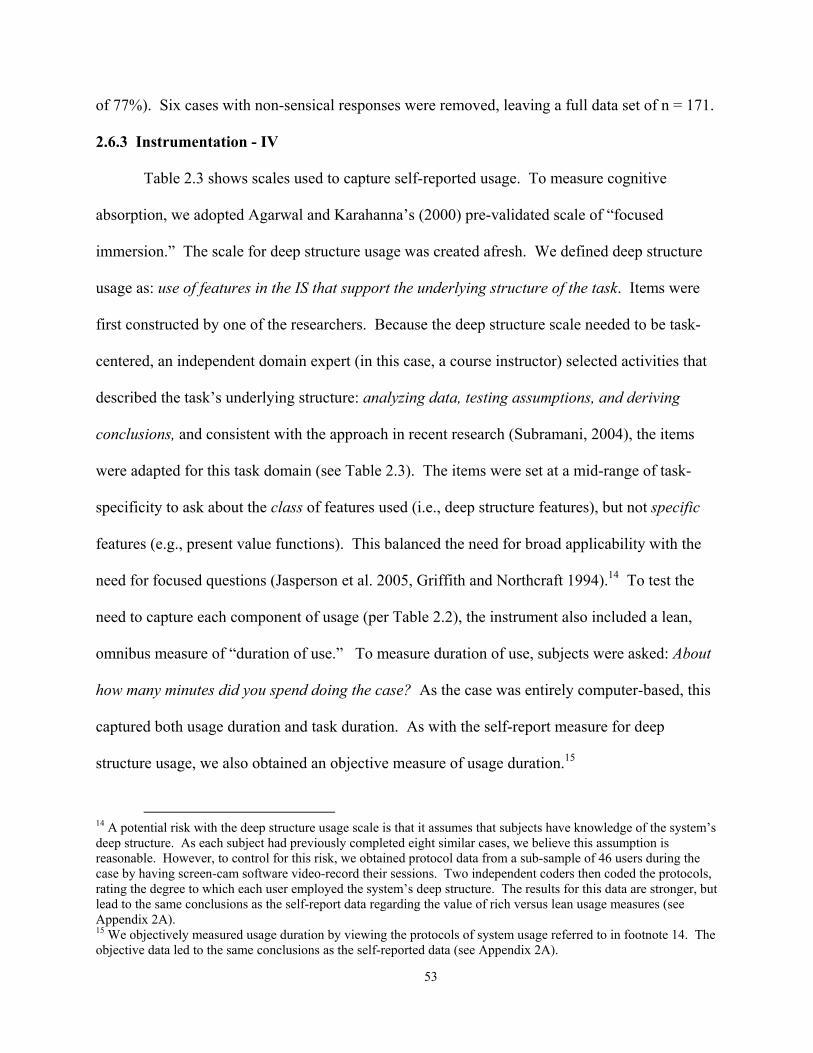
53
of 77%). Six cases with non-sensical responses were removed, leaving a full data set of n = 171.
2.6.3 Instrumentation - IV
Table 2.3 shows scales used to capture self-reported usage. To measure cognitive
absorption, we adopted Agarwal and Karahanna’s (2000) pre-validated scale of “focused
immersion.” The scale for deep structure usage was created afresh. We defined deep structure
usage as: use of features in the IS that support the underlying structure of the task. Items were
first constructed by one of the researchers. Because the deep structure scale needed to be task-
centered, an independent domain expert (in this case, a course instructor) selected activities that
described the task’s underlying structure: analyzing data, testing assumptions, and deriving
conclusions, and consistent with the approach in recent research (Subramani, 2004), the items
were adapted for this task domain (see Table 2.3). The items were set at a mid-range of task-
specificity to ask about the class of features used (i.e., deep structure features), but not specific
features (e.g., present value functions). This balanced the need for broad applicability with the
need for focused questions (Jasperson et al. 2005, Griffith and Northcraft 1994).14 To test the
need to capture each component of usage (per Table 2.2), the instrument also included a lean,
omnibus measure of “duration of use.” To measure duration of use, subjects were asked: About
how many minutes did you spend doing the case? As the case was entirely computer-based, this
captured both usage duration and task duration. As with the self-report measure for deep
structure usage, we also obtained an objective measure of usage duration.15
14 A potential risk with the deep structure usage scale is that it assumes that subjects have knowledge of the system’s deep structure. As each subject had previously completed eight similar cases, we believe this assumption is reasonable. However, to control for this risk, we obtained protocol data from a sub-sample of 46 users during the case by having screen-cam software video-record their sessions. Two independent coders then coded the protocols, rating the degree to which each user employed the system’s deep structure. The results for this data are stronger, but lead to the same conclusions as the self-report data regarding the value of rich versus lean usage measures (see Appendix 2A). 15 We objectively measured usage duration by viewing the protocols of system usage referred to in footnote 14. The objective data led to the same conclusions as the self-reported data (see Appendix 2A).
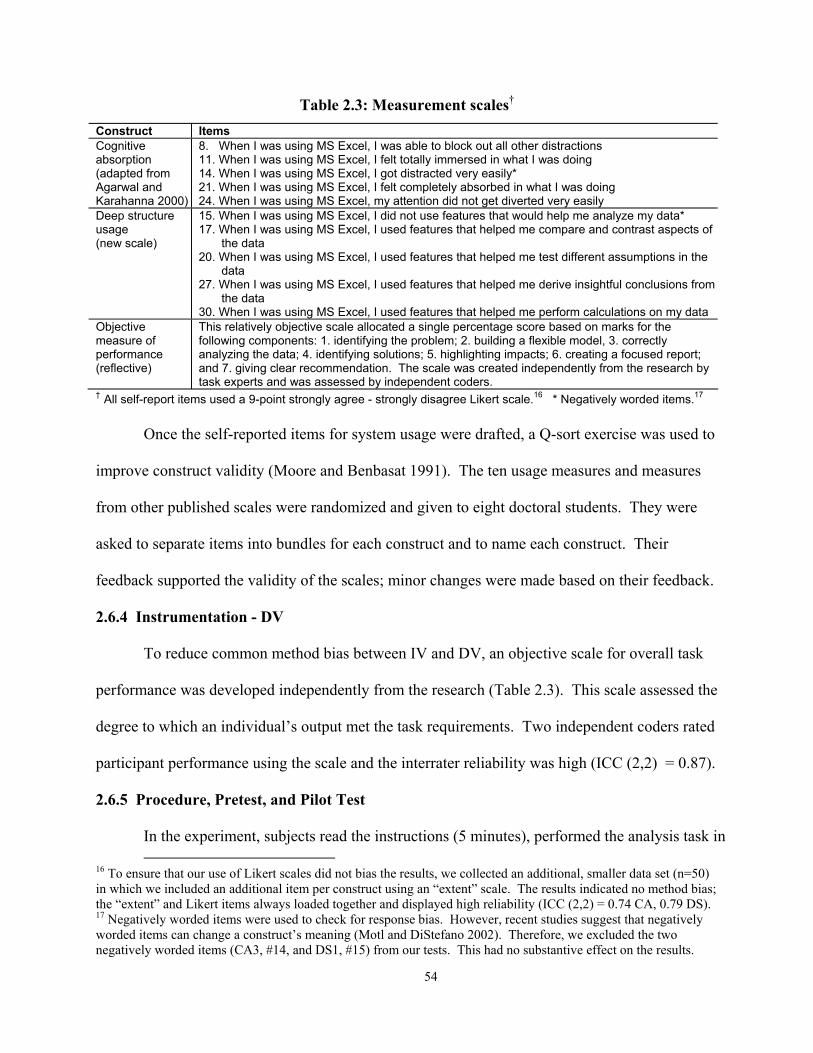
54
Table 2.3: Measurement scales† Construct Items Cognitive absorption (adapted from Agarwal and Karahanna 2000)
8. When I was using MS Excel, I was able to block out all other distractions 11. When I was using MS Excel, I felt totally immersed in what I was doing 14. When I was using MS Excel, I got distracted very easily* 21. When I was using MS Excel, I felt completely absorbed in what I was doing 24. When I was using MS Excel, my attention did not get diverted very easily
Deep structure usage (new scale)
15. When I was using MS Excel, I did not use features that would help me analyze my data* 17. When I was using MS Excel, I used features that helped me compare and contrast aspects of
the data 20. When I was using MS Excel, I used features that helped me test different assumptions in the
data 27. When I was using MS Excel, I used features that helped me derive insightful conclusions from
the data 30. When I was using MS Excel, I used features that helped me perform calculations on my data
Objective measure of performance (reflective)
This relatively objective scale allocated a single percentage score based on marks for the following components: 1. identifying the problem; 2. building a flexible model, 3. correctly analyzing the data; 4. identifying solutions; 5. highlighting impacts; 6. creating a focused report; and 7. giving clear recommendation. The scale was created independently from the research by task experts and was assessed by independent coders.
† All self-report items used a 9-point strongly agree - strongly disagree Likert scale.16 * Negatively worded items.17 Once the self-reported items for system usage were drafted, a Q-sort exercise was used to
improve construct validity (Moore and Benbasat 1991). The ten usage measures and measures
from other published scales were randomized and given to eight doctoral students. They were
asked to separate items into bundles for each construct and to name each construct. Their
feedback supported the validity of the scales; minor changes were made based on their feedback.
2.6.4 Instrumentation - DV
To reduce common method bias between IV and DV, an objective scale for overall task
performance was developed independently from the research (Table 2.3). This scale assessed the
degree to which an individual’s output met the task requirements. Two independent coders rated
participant performance using the scale and the interrater reliability was high (ICC (2,2) = 0.87).
2.6.5 Procedure, Pretest, and Pilot Test
In the experiment, subjects read the instructions (5 minutes), performed the analysis task in
16 To ensure that our use of Likert scales did not bias the results, we collected an additional, smaller data set (n=50) in which we included an additional item per construct using an “extent” scale. The results indicated no method bias; the “extent” and Likert items always loaded together and displayed high reliability (ICC (2,2) = 0.74 CA, 0.79 DS). 17 Negatively worded items were used to check for response bias. However, recent studies suggest that negatively worded items can change a construct’s meaning (Motl and DiStefano 2002). Therefore, we excluded the two negatively worded items (CA3, #14, and DS1, #15) from our tests. This had no substantive effect on the results.

55
MS Excel (90 minutes), and completed the questionnaire (15 minutes). To validate the procedure
and instruments, we conducted a pretest with four students and a pilot test with 38 students.
2.7 Results of the Empirical Investigation
Data analysis proceeded in two steps. We first examined the descriptive statistics and the
proposed measurement model, then the posited structural model. Both steps were performed
using partial least squares (PLS). PLS was used in preference to LISREL because LISREL is not
suited to testing higher-order molar constructs in the presence of only one DV (Edwards 2001).
2.7.1 Descriptive Statistics
Table 2.4 details study descriptive statistics. The data for minutes included some values
greater than the allowable time (90 minutes). As the results did not vary when these cases were
deleted, all were kept in the final analysis. The variance inflation factors from a regression of
minutes, cognitive absorption, and deep structure usage against performance ranged from 1.01-
1.27, indicating no significant multicollinearity (Mathieson et al. 2001). Skewness and kurtosis
and the normal probability plot from a regression of the three variables on performance
supported normality. We also checked for outliers, which were not an issue.
Table 2.4: Descriptive Statistics*
Construct/Item N Mean Std. Deviation Performance 166 81.01 15.87 Minutes 166 81.07 19.99 CA 1 171 5.96 1.89 CA 2 171 5.78 1.80 CA 4 171 5.94 1.65 CA 5 171 5.73 1.68 DS 2 171 6.11 1.73 DS 3 171 6.08 1.68 DS 4 171 6.09 1.59 DS 5 171 6.98 1.56 * Performance measured on a 0-100 scale. CA (cognitive absorption) and DS (deep structure) used a 1-9 scale.
2.7.2 Measurement Model
Tables 2.5-2.6 report tests of instrument validity and reliability. Table 2.5 supports scale
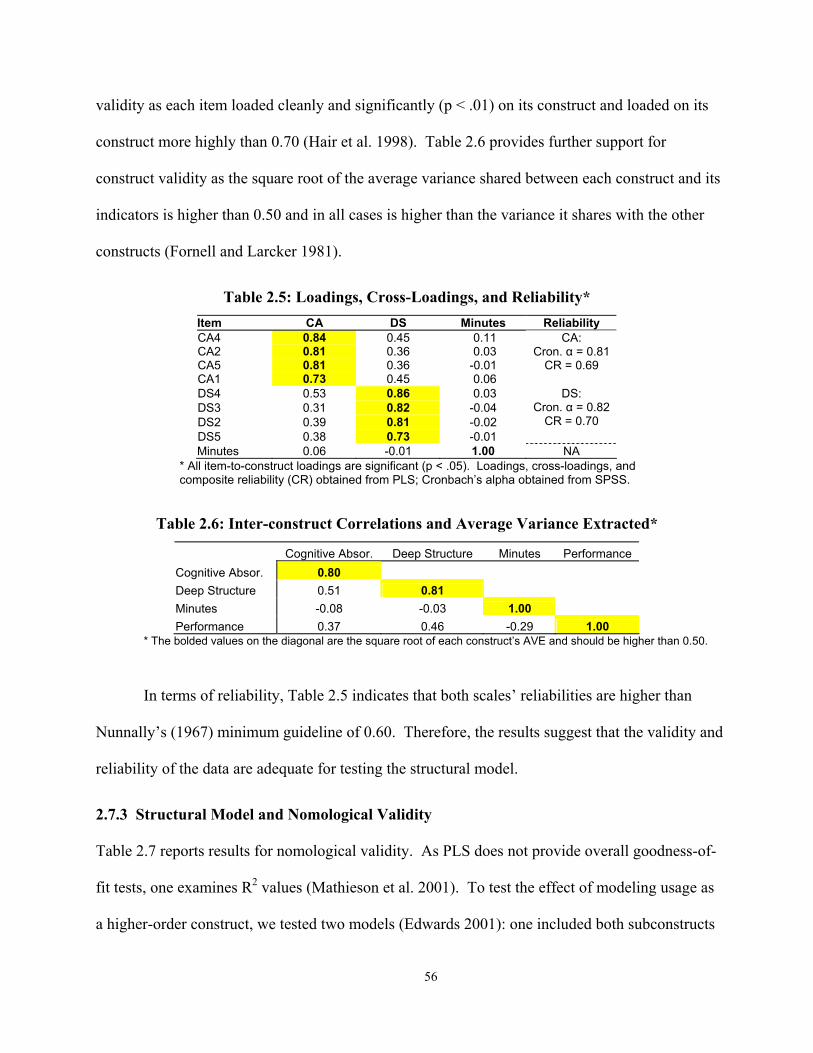
56
validity as each item loaded cleanly and significantly (p < .01) on its construct and loaded on its
construct more highly than 0.70 (Hair et al. 1998). Table 2.6 provides further support for
construct validity as the square root of the average variance shared between each construct and its
indicators is higher than 0.50 and in all cases is higher than the variance it shares with the other
constructs (Fornell and Larcker 1981).
Table 2.5: Loadings, Cross-Loadings, and Reliability*
Item CA DS Minutes Reliability CA4 0.84 0.45 0.11 CA2 0.81 0.36 0.03 CA5 0.81 0.36 -0.01 CA1 0.73 0.45 0.06
CA: Cron. α = 0.81
CR = 0.69
DS4 0.53 0.86 0.03 DS3 0.31 0.82 -0.04 DS2 0.39 0.81 -0.02 DS5 0.38 0.73 -0.01
DS: Cron. α = 0.82
CR = 0.70
Minutes 0.06 -0.01 1.00 NA * All item-to-construct loadings are significant (p < .05). Loadings, cross-loadings, and composite reliability (CR) obtained from PLS; Cronbach’s alpha obtained from SPSS.
Table 2.6: Inter-construct Correlations and Average Variance Extracted*
Cognitive Absor. Deep Structure Minutes Performance Cognitive Absor. 0.80 Deep Structure 0.51 0.81 Minutes -0.08 -0.03 1.00 Performance 0.37 0.46 -0.29 1.00
* The bolded values on the diagonal are the square root of each construct’s AVE and should be higher than 0.50. In terms of reliability, Table 2.5 indicates that both scales’ reliabilities are higher than
Nunnally’s (1967) minimum guideline of 0.60. Therefore, the results suggest that the validity and
reliability of the data are adequate for testing the structural model.
2.7.3 Structural Model and Nomological Validity
Table 2.7 reports results for nomological validity. As PLS does not provide overall goodness-of-
fit tests, one examines R2 values (Mathieson et al. 2001). To test the effect of modeling usage as
a higher-order construct, we tested two models (Edwards 2001): one included both subconstructs

57
as independent components, and a second formed a higher-order construct using the factor scores
of cognitive absorption and deep structure usage as formative indicators.
Table 2.7: PLS Structural Models† Measurement Approach Model Results
Extent of use (omnibus): Table 2.2, Model 2
BM = -.29, t = -4.00**, R2 = .087
Extent to which the user employs the system: Table 2.2, Model 4
BCA = .42, t = 7.11**, R2 = .178
Extent to which the system is used to carry out the task: Table 2.2, Model 5
BDS = .47, t = 8.97**, R2 = .218
Component Model
BCA = .25, t = 3.39** BDS = .34, t = 4.77**
R2 = .264 Higher-Order Model*
Extent to which the user employs the system to carry out the task: Table 2.2, Model 6
BU = .51, t = 9.57**
WeightCA = .83, WeightDS = .90 R2 = .262
† B: the coefficient between an antecedent and performance. Weight: the weight of the subconstruct on the higher-order usage construct in PLS.
* The higher-order model was constructed using factor scores for each sub-construct. We also ran this test using averages rather than factor scores; the results were not substantively different.
** All t-values significant at p < .01. In a separate analysis (not shown to conserve space), we tested another higher-order
model using the method of “repeated indicators” (Chin et al. 2003; Lohmoller 1989). The results
were consistent with those using the formative model. Finally, we ran each model in PLS and
stepwise regression controlling for important predictors of task performance and the results did
not change (see Appendix 2A). Overall, three findings in Table 2.7 are noteworthy:
1. The lean usage measure (duration) has a significant negative relationship with performance; 2. The rich usage measures (cognitive absorption and deep structure usage) both positively
impact performance and each explain more than twice the variance explained by duration;
3. A very rich measure of usage that captures the user, system, and task aspects of use explains almost three times the variance explained by the lean measure, and the results are similar whether usage is modeled as a higher-order construct or as a combination of components.
Minutes Performance
Cognitive Absorption Performance
Deep Structure Usage
Performance
Performance Cognitive Absorption
Deep Structure Usage
Cognitive Absorption
Deep Structure Usage
Usage Performance

58
As several models in Table 2.7 are nested, one can statistically compare the degree to
which each usage measure explains performance. Table 2.8 shows the results of this test.
Consistent with our predictions, the results suggest that excluding either the user or task aspects
of use leads to a significant (small-to-medium) reduction in R2. Excluding the rich usage
measures altogether and relying solely on a lean measure (duration) leads to a large reduction in
R2 and a change in the direction of the relationship between usage and performance. Although
speculations can be drawn post-hoc regarding possible reasons for a negative relationship
between duration and performance, we do not believe that this relationship is highly
interpretable, i.e., speculations could also have been made if we had found the relationship to be
positive.
Overall, the results strongly support the proposed two-step method for selecting usage
measures. The implications of these results are considered next.
Table 2.8: Impact of Excluding Usage Measures
Models compared Test Full Model Partial (Nested)
Model
Change in R2
Effect Size†
Perf = CA, DS, Mins (Table 2.2, Models 6 & 2)
Perf = Mins (Table 2.2, Model 2)
0.25** f2 = .37 Large
Impact of not measuring the IS, user, & task
(only measuring duration) Perf = Usage †, Mins
(Table 2.2, Models 6 & 2) Perf = Mins
(Table 2.2, Model 2) 0.24** f2 = .36
Large Impact of measuring the
user/IS but not the IS/task Perf = CA, DS
(Table 2.2, Model 6) Perf = CA
(Table 2.2, Model 4) 0.09** f2 = .12
Small-Medium Impact of measuring the
IS/task but not the user/IS Perf = CA, DS
(Table 2.2, Model 6) Perf = DS
(Table 2.2, Model 5) 0.05** f2 = .06
Small-Medium ** Sig. at p < .01, † Usage is formed with the factor scores of CA and DS as formative indicators, per Table 2.6. † Each construct’s effect size (f2) can be calculated by the formula )( 22
partialfull RR − / )1( 2fullR− (Mathieson, et
al., 2001; Chin et al., 2003). Multiplying f2 by (n-k-1), where n is the sample size (171) and k is the number of independent variables, provides a pseudo F test for the change in R2 with 1 and n-k degrees of freedom (Mathieson et al., 2001). An effect size of .02 is small, .15 is medium, and .35 is large (Cohen 1988). 2.8 Discussion
This paper presents a systematic attempt to define, conceptualize, and measure the system
usage construct. It contributes in four ways, summarized in Table 2.9, which we discuss in turn.
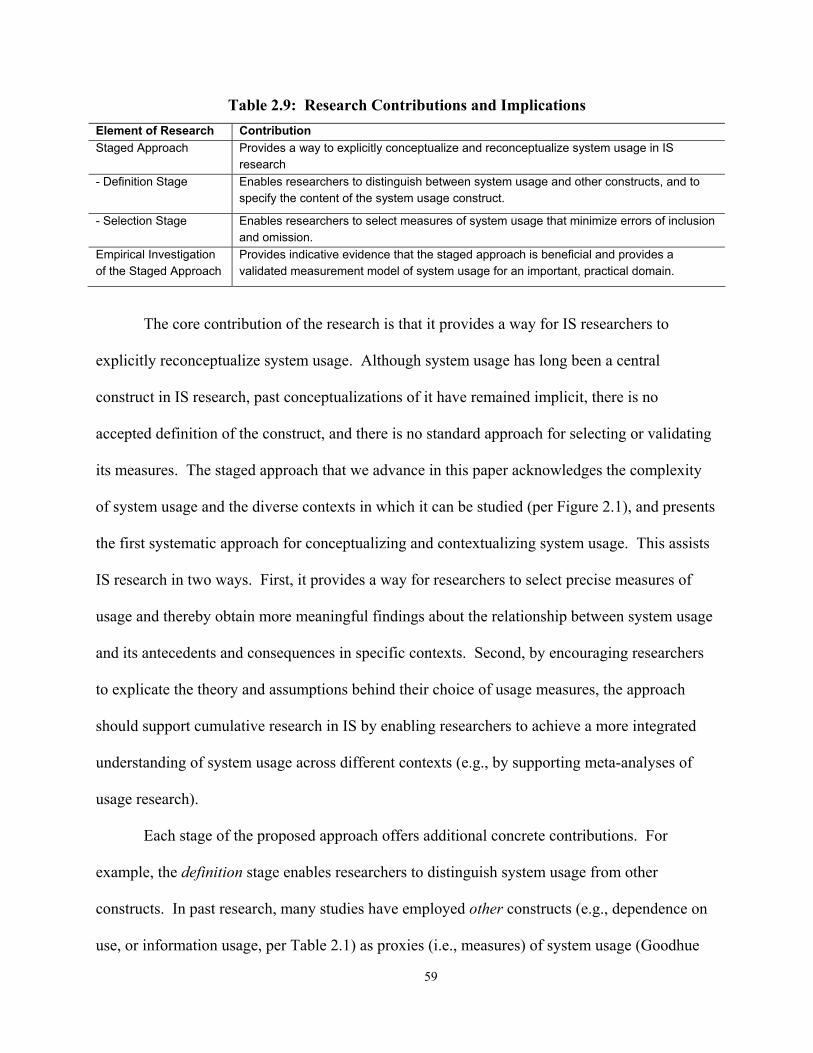
59
Table 2.9: Research Contributions and Implications
Element of Research Contribution Staged Approach Provides a way to explicitly conceptualize and reconceptualize system usage in IS
research - Definition Stage Enables researchers to distinguish between system usage and other constructs, and to
specify the content of the system usage construct.
- Selection Stage Enables researchers to select measures of system usage that minimize errors of inclusion and omission.
Empirical Investigation of the Staged Approach
Provides indicative evidence that the staged approach is beneficial and provides a validated measurement model of system usage for an important, practical domain.
The core contribution of the research is that it provides a way for IS researchers to
explicitly reconceptualize system usage. Although system usage has long been a central
construct in IS research, past conceptualizations of it have remained implicit, there is no
accepted definition of the construct, and there is no standard approach for selecting or validating
its measures. The staged approach that we advance in this paper acknowledges the complexity
of system usage and the diverse contexts in which it can be studied (per Figure 2.1), and presents
the first systematic approach for conceptualizing and contextualizing system usage. This assists
IS research in two ways. First, it provides a way for researchers to select precise measures of
usage and thereby obtain more meaningful findings about the relationship between system usage
and its antecedents and consequences in specific contexts. Second, by encouraging researchers
to explicate the theory and assumptions behind their choice of usage measures, the approach
should support cumulative research in IS by enabling researchers to achieve a more integrated
understanding of system usage across different contexts (e.g., by supporting meta-analyses of
usage research).
Each stage of the proposed approach offers additional concrete contributions. For
example, the definition stage enables researchers to distinguish system usage from other
constructs. In past research, many studies have employed other constructs (e.g., dependence on
use, or information usage, per Table 2.1) as proxies (i.e., measures) of system usage (Goodhue

60
and Thompson 1995, Szajna 1993), or conversely, have employed system usage as a proxy for
other constructs (e.g., IT acceptance) (Trice and Treacy 1986). There is nothing inherently wrong
with this practice except that in past research it has been implicit rather than explicit, and there
remains a lack of evidence for which proxies are accurate and which are not. Consider TAM.
TAM explains IT “acceptance,” but the DVs in TAM are usage intentions and usage behavior
(Davis, 1989). It is not clear that either of these constructs completely captures the notion of
“acceptance” (Trice and Treacy 1986). Our research highlights the need for researchers to
provide systematic evidence for which usage measures, if any, are valid proxies for related
constructs and to determine which other constructs, if any, are good proxies for system usage.
The selection stage contributes by providing a way to reduce errors of inclusion and
omission when measuring usage. Errors of inclusion occur when a researcher includes irrelevant
aspects of usage or another construct in his/her usage measures, while errors of omission occur
when a researcher omits key elements of usage from his/her usage measures (e.g., omitting
cognitive absorption from measures of exploitive use). The two-step selection method reduces
the possibility of both errors. First, it cautions against lean or omnibus usage measures. Lean
measures such as use/non-use, duration of use, and “extent” can increase errors of inclusion and
omission because they obscure (1) what constitutes usage, and (2) what part of usage the
researcher intends to measure. Thus, subjects who respond to a lean usage measure may have a
broader or narrower view of usage than intended by the researcher, leading to systematic errors
in their responses. Lean measures can also risk errors of inclusion by simply reflecting different
constructs. For example, “task duration” can often equate to “usage duration,” as it did in our
empirical test. The error of inclusion in our investigation was so strong that it changed the
direction of the estimated relationship between usage and performance. Because omnibus
measures have such significant limitations, we suggest that in future research they be used very

61
cautiously if at all.
The proposed two-step method provides a way to move beyond lean measures by
advancing a systematic way to create contextualized usage measures. For too long, we submit, IS
researchers have studied “system usage” without specifying and theoretically justifying the type
of usage being studied. Nevertheless, it is clear that different types of usage could be more
relevant in different contexts. The two-step method provides a way for researchers to develop
contextualized usage measures by specifying which elements (i.e., system, user, task) and which
measures of usage are most relevant for a theoretical context. For example, user cognitive
absorption may be a highly relevant metric for line managers who depend on performance
outcomes from employees’ usage, but it may be of little relevance to system administrators who
must make decisions based on how systems are actually being utilized (i.e., in terms of system
load) irrespective of employee cognitions. Moreover, even if the elements of usage are the same
in two contexts, different measures may be needed. For example, when studying long run rather
than short run performance, one would need additional measures to capture exploratory and
exploitive use (March 1991; Subramani 2004). Thus, much research is needed to systematically
identify managerial relevant subtypes of usage, define appropriate measurement models for these
contexts, and theorize the antecedents and consequences of these subtypes of use, rather than, or
at least in addition to, studying the antecedents and consequences of system usage in general.
A final contribution of our research is that the empirical investigation provides a
validated usage measure for an important, practical context: the relationship between system
usage and short-run performance in cognitively engaging tasks. Our test also suggests ways to
improve empirical studies of usage. For example, it suggests that the two-step approach could be
used to select methods for collecting usage data because objective measures may be more able to
measure the system and task aspects of usage (per Appendix 2A), but self-report questionnaires

62
may be more able to measure user states (e.g., cognitions/emotions) during usage (Hilbert and
Redmiles 2000). These issues are addressed further in Chapter 5. Our test also highlights the
need to determine when higher-order models or component models of usage are appropriate. A
higher-order model can never increase statistical explanations of a DV over an optimally
weighted combination of components (Edwards 2001). Therefore, as the higher-order model in
our tests explained performance to the same degree as the component model (per Table 2.7), the
parsimony of the higher-order model makes it more attractive (Segars and Grover 1998). But a
higher-order model may not always be best. If we examined long run rather than short run
performance, we would have needed to include subconstructs for both exploratory and exploitive
use and create a third-order model to capture both subconstructs. Whether such a third-order
model of usage could be developed is not clear. Thus, more research is needed to determine
when an overarching construct of “usage” can be constructed and when it is best modeled as a
combination of components (per Edwards, 2001).
When assessing the contributions of our empirical investigation, it is important to
recognize its limitations. In terms of construct validity, our work could be extended to see if
additional aspects of the user, IS, or task contexts could be modeled. For example, we measured
user cognitions, but some non-cognitive elements such as a user’s affective state may have been
relevant. In terms of internal validity, we did not consider antecedents to usage or potential
mediators between usage and performance such as learning. Such research would be valuable
because tying each usage measure to relevant causes and consequences could allow researchers
to develop more complete models of IS success (DeLone and McLean 2003). Finally, in terms
of external validity, one may argue that our deep-structure usage measure lacks external validity
because operationalizing it requires researchers to create items that reflect the deep structure of
the IS and task under investigation. This problem only occurs at the level of measures, however,

63
not constructs. For example, Goodhue (1995) measured task-technology-fit (TTF) in the context
of data management, and although his measures are not easily generalizable to other domains,
TTF is a generalizable construct (Lee and Baskerville 2003). Overall, the development of
feature-specific measures is in line with recent recommendations (Jasperson et al. 2005).
2.9 Conclusion
To overcome the lack of explicit conceptualizations of system usage in past research, the
present study advances a staged approach for reconceptualizing system usage. The first stage,
definition, recommends that researchers explicitly define system usage and its assumptions. The
second stage, selection, recommends that researchers select usage measures by a two-step
method that involves identifying the relevant elements of usage for a research context (i.e., IS,
user, and/or task) and identifying measures for these elements based on the other constructs in
the nomological network.
In the present study, we demonstrated how such an approach would work through an
empirical investigation in which we examined the degree to which lean usage measures and rich
usage measures would explain the relationship between system usage and task performance in
cognitively engaging tasks. The results strongly support the staged approach and indicate that
inappropriate choices of usage measures can significantly reduce explanations of performance,
even causing the estimated relationship between usage and performance to change direction.
Despite acknowledged limitations, we believe the staged approach advanced in this paper
helps to clarify the meaning of system usage and the range and dimensionality of past usage
measures. Given contradictory results in past studies of system usage and performance, and the
centrality of the usage construct in past research, our focused reconceptualization of the construct
should enable more informed research into the pathways by which IT impacts individuals at work.

64
Appendix 2A: Additional Empirical Results
This appendix details results from two additional tests of the data from the empirical
investigation.
2A.1 Testing for the Robustness of our Results across Data Collection Method
We collected additional, independent data to confirm the results from our self-reported
measures of deep structure usage and usage duration. As we indicated in footnote 14, a potential
risk with the self-reported measure of deep structure usage is that it may rely too strongly on
users’ knowledge of the system’s deep structure. To control for this, we obtained screen-cam
video records from a subsample of respondents’ usage (n=46) and independent raters coded the
video protocol data, rating the extent to which users employed each feature of MS Excel in their
tasks.18 The inter-rater reliability of their coding was acceptable (ICC (2,2) = .73).
To identify the subset of Excel features that related to the task’s deep structure, we gave
two independent domain experts (instructors of the course from which we obtained our sample) a
comprehensive list of features available via menus or shortcuts in Excel. Using a 7-point likert
scale, each rater then rated the degree to which each feature supported the task’s deep structure
(i.e., analyzing data, testing assumptions, and deriving conclusions). Their ratings indicated that
two features were the primary features of deep structure: functions (i.e., formulae) and filling
(i.e., completing rows or columns of data using absolute or relative cell references). Again,
inter-rater reliability was acceptable (ICC (2,2) = .76).
We tested the deep structure use performance relationship in PLS by creating a model
of deep structure usage reflected by indicators of subjects’ extent of use of the two deep structure
features. As Table 2A.1 shows, the independent measure of deep structure usage had a stronger
18 To ensure that the coders measured system usage rather than an evaluation of system usage, the coders rated the extent to which each subject used each feature, not how appropriately s/he used each feature (e.g., not whether a user chose an ideal formula or whether s/he entered correct values into a formula).

65
relationship with performance than the self-reported measures of deep structure usage, but the
overall pattern of results from Table 2.7 was confirmed, i.e., the rich measure of usage (deep
structure usage) had a stronger and more meaningful relationship with performance than the lean
measure (duration).
As Table 2A.1 shows, we used the same screen-cam video files to obtain an independent
measure of each participant’s duration of Excel usage and re-tested the relationship between
usage duration and task performance on this subsample (per footnote 15). As Table 2A.1 shows,
the independently coded data for usage duration showed a negative relationship with
performance that was slightly stronger, but similar to the self-reported measures in Table 2.7.
Overall, the results in Table 2A.1 confirm the pattern of results in Table 2.7 in that richer
measures are preferable to leaner measures.
Table 2A.1: Testing the Robustness of the Results across Method†
Measurement Approach Model Results
Extent of use (omnibus): Table 2.2, Model 2
BM = -.29, t = -4.00**, R2 = .087 BM = -.34, t = -3.18**, R2 = .117
Extent to which the system is used to carry out the task: Table 2.2, Model 5
BDS = .47, t = 8.97**, R2 = .218
BDS = .70, t = 8.94**, R2 = .485
† N = 46; B: the coefficient between an antecedent and performance. Self: self-reported measures; Ind: Independently recorded measure (by examining screen-cam video protocols of users’ sessions). * All t-values significant at p < .05.
2A.2 Testing for the Influence of other Predictors of Performance
Prior research on performance suggests that the primary predictors of individual task
performance are an individual’s declarative and procedural knowledge (Hesketh and Neal 1999;
Sonnentag and Frese 2002). Table 2A.2 replicates the results from Table 2.7, controlling for
these two factors. Declarative knowledge was measured via students’ score in their final
MinutesSelf Performance
MinutesInd Performance
Deep Structure UsageSelf
Performance
Deep Structure UsageInd
Performance
N = 171
N = 46
N = 171
N = 46
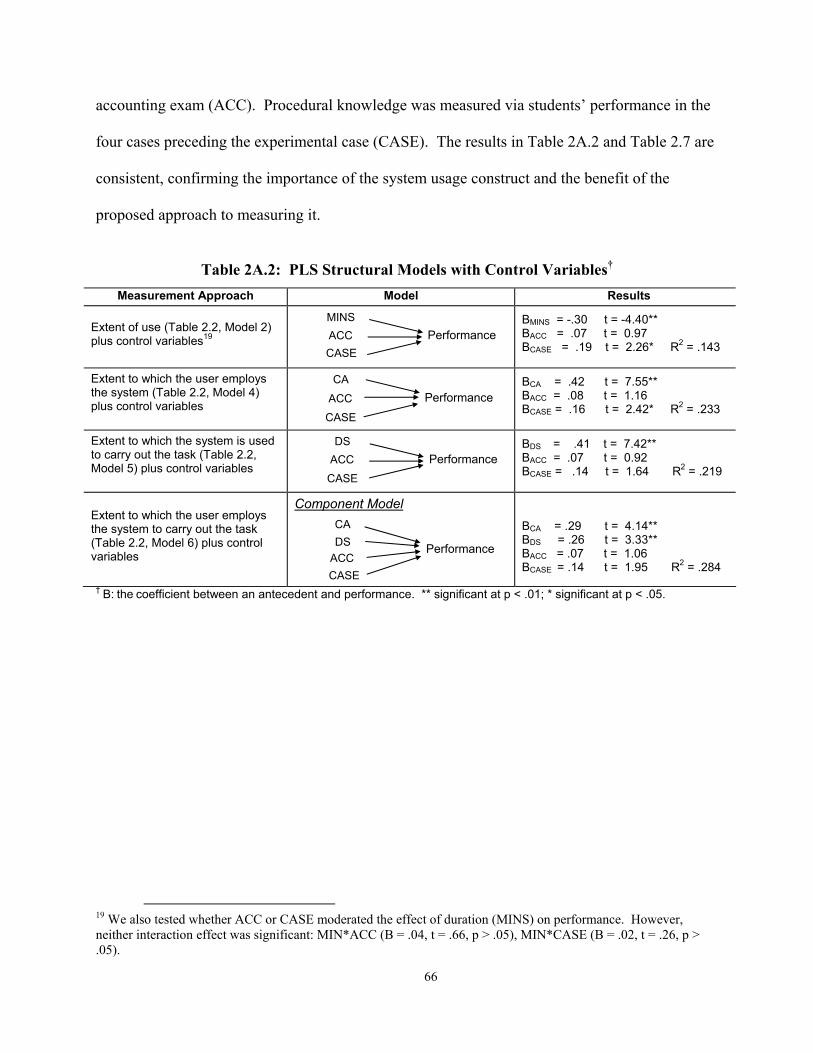
66
accounting exam (ACC). Procedural knowledge was measured via students’ performance in the
four cases preceding the experimental case (CASE). The results in Table 2A.2 and Table 2.7 are
consistent, confirming the importance of the system usage construct and the benefit of the
proposed approach to measuring it.
Table 2A.2: PLS Structural Models with Control Variables†
Measurement Approach Model Results Extent of use (Table 2.2, Model 2) plus control variables19
BMINS = -.30 t = -4.40** BACC = .07 t = 0.97 BCASE = .19 t = 2.26* R2 = .143
Extent to which the user employs the system (Table 2.2, Model 4) plus control variables
BCA = .42 t = 7.55** BACC = .08 t = 1.16 BCASE = .16 t = 2.42* R2 = .233
Extent to which the system is used to carry out the task (Table 2.2, Model 5) plus control variables
BDS = .41 t = 7.42** BACC = .07 t = 0.92 BCASE = .14 t = 1.64 R2 = .219
Extent to which the user employs the system to carry out the task (Table 2.2, Model 6) plus control variables
Component Model
BCA = .29 t = 4.14** BDS = .26 t = 3.33** BACC = .07 t = 1.06 BCASE = .14 t = 1.95 R2 = .284
† B: the coefficient between an antecedent and performance. ** significant at p < .01; * significant at p < .05.
19 We also tested whether ACC or CASE moderated the effect of duration (MINS) on performance. However, neither interaction effect was significant: MIN*ACC (B = .04, t = .66, p > .05), MIN*CASE (B = .02, t = .26, p > .05).
MINS Performance ACC
CASE
DS Performance ACC CASE
CA
CA Performance ACC
CASE
Performance ACC
CASE
DS

67
Chapter 3
Toward a Deeper Understanding of System Usage in Organizations:
A Multilevel Perspective20
Abstract
Economic studies show that information systems can positively impact organizations, but little is known of the process by which this occurs. Although the system usage construct is key to understanding this process, there has been little conceptual scrutiny of this construct in past research. The objective of this paper is to contribute towards a deeper understanding of system usage in organizations by examining its multilevel nature. To do so, we provide a framework for building multilevel theories of system usage, introduce principles to help researchers use the framework, and provide a concrete illustration of how a multilevel theory of system usage can be developed. The multilevel perspective advanced in this article offers rich opportunities for theoretical and empirical insights and suggests a new foundation for in-depth research on the nature of system usage, its emergence and change, and its antecedents and consequences.
Keywords: System usage, IT impact, level, multilevel, pattern, configuration, time, longitudinal.
20 Burton-Jones, A., and Gallivan, M.J. "Towards a Deeper Understanding of System Usage in Organizations: A Multilevel Perspective," Working paper, Department of Computer Information Systems, Georgia State University, 2004.

68
3.1 Introduction
Economic studies have shown that information systems can have positive organizational
impacts (Barua and Mukhopadhyay 2000; Dedrick et al. 2003), but we know little about how such
impacts occur (Heine et al. 2003; Soh and Markus 1995). Recent reviews have tried to identify a
core set of predictors of IT impacts, such as the quality of an organization’s IT and human
resources, its business processes, and competitive environment (Melville et al. 2004). Although
these factors are critical, most researchers agree that IT impacts can only occur if the systems are
used (Soh and Markus 1995, DeSanctis and Poole 1994, Orlikowski 2000) (Figure 3.1).
Extract from Benbasat and Zmud (2003) Figure 3.1: IT Impacts Stem from Use
Given that system usage is a necessary link between IT and its consequences, we might
expect that conceptualizations of the systems usage construct occupy a central role in the IS
literature. Some evidence supports this view. For example, differing conceptions of systems
usage have been offered at the individual (Barkin and Dickson 1977), group (DeSanctis and
Poole 1994), and organizational levels (Cooper and Zmud 1990). A substantial body of
empirical work has also examined system usage from nomothetic (Straub et al. 1995; Venkatesh
et al. 2003) and idiographic perspectives (Markus 1994; Orlikowski 1996; Orlikowski 2000).21
Recently, however, researchers have called for a renewed focus on the usage construct
(Chin and Marcolin 2001; DeLone and McLean 2003). This appears to be the case for four
reasons. First, while a substantial amount of research has studied antecedents to usage (i.e.,
antecedents usage) (Agarwal 2000), relatively few studies have investigated system usage in
21 A complete review of existing conceptualizations of the system usage construct is outside the scope of this paper. Appendix 3A provides a brief review of prior conceptualizations of system usage.
The IT Artifact
Usage Impact
69
its role as an independent variable leading to downstream consequences (i.e., usage
consequences). Many studies of IT impacts at the individual (Todd and Benbasat 1999), group
(Zigurs and Buckland 1998), and organizational levels (Santhanam and Hartono 2003) exclude
usage (i.e., they study antecedents consequences); implicitly assuming that system usage is
unproblematic (e.g., that users always use systems in an appropriate or predictable manner). As
a result, the consequences of system usage remain under-theorized. As Venkatesh et al. (2003)
write:
“little to no research has addressed the link between user acceptance and individual or organizational usage outcomes. Thus, while it is often assumed that usage will result in positive outcomes, this remains to be tested” (p. 470).
Second, when the consequences of system usage have been studied, results have often
been mixed. Although perhaps unsurprising in hindsight, many researchers at an individual,
group, and organizational level have hypothesized (or assumed) that system usage will increase
performance, but have found that usage can increase (Chidambaram and Jones 1993; Torkzadeh
and Doll 1999), decrease (Pentland 1989; Strauss and McGrath 1994; Szajna 1993), or have no
effect on performance (Gelderman 1998; Lucas and Spitler 1999; Trauth and Jessup 2000).
Third, there has been little concern in the IS literature regarding the appropriate way to
measure system usage. While many self-report and system-generated measures are easy to
capture, researchers have given surprisingly little thought to whether such measures are truly
meaningful (Straub et al. 1995). Due to the abundance of measures available, many researchers
believe that (p. 244) “there really has never been a problem with obtaining usage measures”
(Srinivasan 1985). In a field in which construct development is highly valued (Boudreau et al.
2001), it is surprising that system usage has received very limited construct or instrument
development (Chin and Marcolin 2001; Straub et al. 1995; Trice and Treacy 1986). Despite

70
occasional calls to more closely study system usage (e.g., Zigurs 1993), DeLone and McLean
(2003) demur, “the problem to date has been a too simplistic definition of this complex variable.”
Fourth, while systems usage has been a common focus among researchers at different
levels of analysis, there has been little integration of conceptions across levels. For example,
there is little evidence that conceptions of individual usage have influenced those of group or
organizational usage, or vice-versa (see Appendix 3A). While idiographic research has provided
rich multilevel descriptions of usage (Orlikowski 1996; 2000), this has had little impact on
nomothetic conceptions (Chan, 2000). Although IS researchers may have learned a great deal
from studying usage at a single level, we believe that studying organizations one level at a time
ultimately leads to an unnatural, incomplete, and very disjointed view of how organizations
really function in practice.
In summary, understanding systems usage is central to studies of IS impacts. However,
while construct conceptualization lies at the heart of theory building, few theoretical conceptions
of system usage have been offered and there has been little cumulative progress across levels of
analysis (Chan 2000). In recent years, scholars have worked to reconceptualize basic constructs
such as users (Lamb and Kling 2003) and the IT artifact (Orlikowski and Iacono 2001). There
have also been calls to reconceptualize system usage (Agarwal 2000; Chin and Marcolin 2001;
DeLone and McLean 2003). This is the charge that we undertake in this paper: to propose a new
multilevel conceptualization of system usage and advance a detailed framework for researching it.
It is important at the outset that we state the epistemological and ontological assumptions
underlying our analysis. In this paper, we adopt critical realist assumptions (Cook and Campbell
1979). In other words, we believe that it is meaningful to talk about and measure a latent construct
called “system usage” and to examine its existence, causes, and consequences. We do not deny the
value of other perspectives. In fact, we believe that non-positivist research is far ahead of

71
positivist research in understanding the nuances of system usage in practice (e.g., Orlikowski 1996,
2000) and we draw liberally upon findings from such research. However, as our focus is on usage
as a “construct,” we limit our theoretical perspective to a critical realist one in this paper.
The paper is structured as follows. We first briefly review the principles of multilevel
theory. We then draw on these principles to advance a new framework for building multilevel
theories of system usage. The framework defines three stages (definition, structure, and function)
and nine steps that we propose are necessary for building a multilevel theory of usage. Using the
framework as a structure for the remainder or the paper, we then offer principles for carrying out
each step in studies of system usage and provide concrete illustrations to demonstrate that the
framework is actionable and operationalizable. We conclude with a discussion of the value of a
deeper understanding of system usage and the rich, unexplored areas for research that it suggests.
3.2 Overview of Multilevel Theory
Because there are only a few explicitly multilevel studies in IS research (Ang et al. 2002;
Angst and Agarwal 2004; Gallivan et al. 2005), it is necessary to provide a brief overview of
multilevel theory before applying it to system usage.
3.2.1 Foundations of Multilevel Theory: General Systems Theory
Multilevel theory is a “meta-theory,” or set of theoretical principles, for theorizing about
organizations. As with any theory, multilevel theory is built upon certain assumptions about the
phenomena it investigates. The core assumption in multilevel theory is that “organizations are
multilevel systems” (Kozlowski and Klein 2000, p. 3). In contrast to single-level research, in
which the “system [to be studied] is sliced into organization, group, and individual levels”
(Kozlowski and Klein 2000, p. 3), multilevel theories attempt to account for phenomena that
span organizational levels. To study organizations as multilevel systems, multilevel theorists

72
have adopted principles from general systems theory (von Bertalanffy 1968) to serve as
assumptions about the nature of organizations (see Table 3.1) (Kozlowski and Klein 2000).
Table 3.1: Principles of Multilevel Theory* Principle Example Example References Composition: Parts interact with different strengths or coupling, creating wholes (collectives) that have different forms.
Firms have tighter internal coupling than external coupling, but the level of internal and external coupling can vary between firms and within firms.
(Simon 1996; Weick 1976)
Top-down influence: Properties of parts are constrained and enabled by properties of the whole.
Employees’ performance is constrained and enabled by their workgroup’s norms.
(Churchman 1968; Giddens 1984)
Bottom-up emergence: Properties of the whole emerge from interactions among the parts.
A team’s performance emerges not merely from individual performance but from interactions among the team’s members.
(Churchman 1968; Giddens 1984)
Equilibrium and change: The existence, strength, and nature of part-whole interactions are stable in equilibrium but can change over time.
In equilibrium, group routines tend to drive members’ behavior, but in flux, a single member’s behavior can change group routines.
(Ancona et al. 2001; Gersick 1991)
Pace: Properties of parts change more rapidly than emergent properties of wholes.
Team members can improve their own performance more quickly than they can collectively improve team performance.
(Gersick 1991; Simon 1996)
* The principles apply across all levels; the examples focus on just one or two levels for simplicity.
By influencing the way that multilevel researchers view organizations, the principles in
Table 3.1 influence the way that multilevel researchers conceive of constructs and relationships to
account for organizational phenomena. In particular, because multilevel researchers assume that
different collectives can have different structures and that these structures can change over time,
they assume that (a) constructs observed in one collective may or may not exist in a different
collective or in the same collective at a different time, and (b) the relationships between constructs
can differ across collectives and over time. In other words, multilevel researchers acknowledge
the context-dependency of theories. Although this assumption of context-dependency is common
in interpretive research (Robey and Sahay 1996), it is rare in positivist research.22 To allow for
this context-dependency, and yet still enable broad generalizations, multilevel researchers use
22 For a critique of theories that exclude context, we refer to Arrow et al. (2000, p. 28), who argued that: “attempts to strip context from groups are…limiting and doomed to fail… We need to study groups in context. This may be inconvenient…but pretending that groups can exist without a context, is, we believe, counterproductive.”

73
principles that enable them to incorporate context in their theories by (a) accounting for how
constructs emerge at the level at which they are being examined, and (b) accounting for
relationships between constructs at multiple levels. These principles are described next.
3.2.2 Building a Multilevel Theory: Structure and Function
To build a multilevel theory, researchers must define the constructs of their theory and
explain their structure and function (Morgeson and Hofmann 1999). Structure refers to the nature
of the constructs in the theory whereas function refers to relationships between the constructs.
3.2.2.1 Structure
In terms of structure, multilevel theories start by specifying the origin and level of each
construct (Kozlowski and Klein 2000). A construct’s origin is the level at which a construct
originates. For example, “behaviors” originate at the individual level, while “interdependencies”
originate at the dyadic level (as interdependencies require at least two people). A construct’s level
is the level at which a researcher chooses to study a construct. For example, a researcher may
choose to study a construct at the level of its origin (e.g., an individual’s memory), or s/he may
choose to study a construct at a higher level (e.g., an organization’s memory). From a multilevel
perspective, the distinction between origin and level is critical because if one wishes to study a
construct at a level higher than its origin, one must justify how the construct emerges at this higher
level. For example, “organizational memory” does not just “exist,” but emerges from processes
and practices that occur at lower levels of an organization (Morgeson and Hofmann 1999).
The distinction between a construct’s origin and level allows multilevel theorists to
distinguish: (a) between individual and collective constructs, and (b) among different types of
collective constructs (Klein et al. 1994). According to this perspective, an individual level
construct exists when the construct’s origin and level are both at the individual level. In contrast,

74
a “collective construct” refers to any construct that has a level higher than the individual level but
whose origin could lie at the level being studied or at a lower level (e.g., an individual level).
As Table 3.2 shows, there are three types of collective constructs: global, shared, and
configural (Chan 1998; Klein et al. 1994; Kozlowski and Klein 2000; Rousseau 1985). Global
constructs originate at the collective level and have no meaning at the individual level. For
example, in group-level research, group size is a global construct because it has no meaning at an
individual level. Shared constructs originate in the attributes of individuals and emerge at the
collective level in the form of homogeneity among members. For example, a group’s behavior
could be considered shared if each individual behaved similarly. Finally, configural constructs
originate in the attributes of individual members but emerge at the collective level in the form of a
distinct pattern among members of the collective. For example, a group’s behavior is considered
configural if each individual demonstrates different, yet fairly consistent behavior, leading to a
distinct pattern across the members of the group and/or across time (Kozlowski and Klein 2000).
Table 3.2: Structure of Collective Constructs in Multilevel Theory Description Explanation Measurement
Global constructs: properties that exist only at the whole (e.g., a collective’s official usage policy).
Direct measure, e.g., by asking a key informant.
Shared constructs: properties ascribed to the whole due to parts having similar values (e.g., the extent to which members have a common understanding of the official usage policy).
Aggregate measure that captures the homogeneity of a collective, e.g., mean average (if low variance).
Constructs at the collective level can be:
• Global (origin = level),
• Shared (level > origin),
• Configural (level > origin).
Configural constructs: properties ascribed to the whole due to parts having a pattern of values (e.g., a collective’s particular pattern of compliance with the official usage policy).
Aggregate measure that captures the heterogeneity of a collective, e.g., min/max, dispersion, profile deviation.
3.2.2.2 Function
The second limb of a multilevel theory is its function. Table 3.3 describes the different
functional forms that multilevel theories can employ (Klein et al. 1994; Kozlowski and Klein
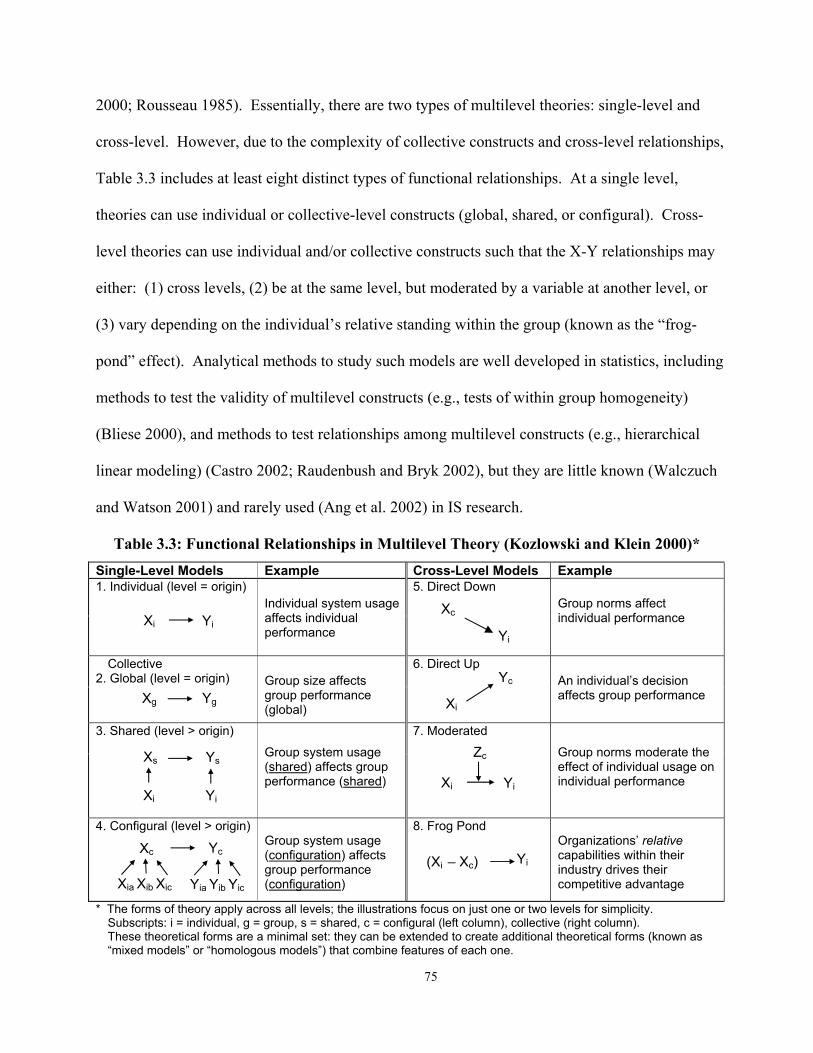
75
2000; Rousseau 1985). Essentially, there are two types of multilevel theories: single-level and
cross-level. However, due to the complexity of collective constructs and cross-level relationships,
Table 3.3 includes at least eight distinct types of functional relationships. At a single level,
theories can use individual or collective-level constructs (global, shared, or configural). Cross-
level theories can use individual and/or collective constructs such that the X-Y relationships may
either: (1) cross levels, (2) be at the same level, but moderated by a variable at another level, or
(3) vary depending on the individual’s relative standing within the group (known as the “frog-
pond” effect). Analytical methods to study such models are well developed in statistics, including
methods to test the validity of multilevel constructs (e.g., tests of within group homogeneity)
(Bliese 2000), and methods to test relationships among multilevel constructs (e.g., hierarchical
linear modeling) (Castro 2002; Raudenbush and Bryk 2002), but they are little known (Walczuch
and Watson 2001) and rarely used (Ang et al. 2002) in IS research.
Table 3.3: Functional Relationships in Multilevel Theory (Kozlowski and Klein 2000)* Single-Level Models Example Cross-Level Models Example 1. Individual (level = origin)
Individual system usage affects individual performance
5. Direct Down
Group norms affect individual performance
Collective 2. Global (level = origin)
Group size affects group performance (global)
6. Direct Up
An individual’s decision affects group performance
3. Shared (level > origin)
Group system usage (shared) affects group performance (shared)
7. Moderated
Group norms moderate the effect of individual usage on individual performance
4. Configural (level > origin)
Group system usage (configuration) affects group performance (configuration)
8. Frog Pond
Organizations’ relative capabilities within their industry drives their competitive advantage
* The forms of theory apply across all levels; the illustrations focus on just one or two levels for simplicity. Subscripts: i = individual, g = group, s = shared, c = configural (left column), collective (right column). These theoretical forms are a minimal set: they can be extended to create additional theoretical forms (known as “mixed models” or “homologous models”) that combine features of each one.
Xi Yi Xc
Yi
Xi
Yc
Xc Yc
Xia Xib Xic Yia Yib Yic
Xs Ys
Xi Yi Xi Yi
Zc
Xg Yg
(Xi – Xc)
Yi

76
As Klein et al. (1994) emphasize, it is important to note that the functional forms of
multilevel theory in Table 3.3 encompass single-level relationships. In other words, researchers
cannot “escape” multilevel principles by just studying a single-level. On the contrary, even
researchers who study phenomena at a single level of analysis must understand whether the
constructs that they seek to model are purely individual, or whether they are global, shared, or
configural in nature. Multilevel researchers assume that organizations are social systems and, as
a result, assume that multilevel principles apply irrespective of whether one examines just one or
multiple levels of the social system (Kozlowski and Klein 2000). Appendix 3B provides a more
detailed account of the empirical and theoretical motivations for adopting multilevel research.
3.3 A Multilevel Perspective on System Usage
In this section, we apply multilevel principles to specify, for the first time, how one could
build a multilevel theory of usage. Our aim is not to propose “the” multilevel theory of usage,
but to propose a general yet actionable framework for theory building. Table 3.4 details the steps
that we state are necessary to build a multilevel theory of system usage. We describe each one in
turn.
Table 3.4: A Framework for Building a Multilevel Theory of System Usage
Step Explanation Definition Define system usage. Structure
- Existence Identify whether system usage exists at the individual level, collective level, or both. - Structural form Identify the form in which collective system usage emerges (i.e., shared or configural).
Function - Selection Select the relevant elements and measures of usage for one’s theory.
Determine whether the function of each measure is tied to a particular structural form. - Functional form Specify the relationships between individual and collective usage.
Specify the relationships between system usage and the other constructs in the theory.- Time frame Specify the time over which individual and collective usage influence each other.
Specify the time over which usage and its related constructs influence each other.

77
3.3.1 Defining System Usage
To build a multilevel theory of system usage, one must first define the construct. Despite
many conceptions of systems usage in the literature, there is no generally accepted definition of the
construct, whether at the individual, group, or organizational level. Perhaps the best known
definition is one from DeLone and McLean (1992): “recipient’s consumption of the output of an
information system.” We submit, however, that this captures use of information from an IS, but
not system usage itself. Therefore, to support a multilevel perspective of usage, we propose a new
definition. We propose that system usage is an activity that involves three elements: (1) a user
(i.e., the subject using the system), (2) a system (i.e., the object being used), and (3) a task (i.e., the
function being performed). By drawing on these elements and recognizing that systems comprise
many features (Griffith 1999), we define system usage as: a user’s employment of one or more
features of a system to perform a task. This definition is useful for two reasons. First, it provides a
scope for what elements can be included in the usage construct. This is needed to provide a basis
for determining its structure (e.g., why usage emerges in certain forms) and its function (e.g., how
to select properties of usage that are relevant for specific theories). Second, it gives researchers
flexibility, because each element of usage (i.e., the user, system, and task) can be viewed in
multiple ways (Lamb and Kling 2003; Orlikowski and Iacono 2001; Zigurs and Buckland 1998).
With this definition as a starting point, we next outline its structure and function.23
3.3.2 The Structure of System Usage
Once a researcher has defined system usage, the next stage is to define its structure. This
involves determining: (a) whether it exists at an individual level, collective level, or both, and (b)
the form in which it emerges at the collective level (per Table 3.4).
23 We recognize that other definitions (with broader or narrower meanings) could be constructed. The principles in Table 3.4 are generic enough to apply to all definitions of system usage.
78
3.3.2.1 Identifying the Level at which System Usage Exists
To identify the level(s) at which system usage exists, researchers must perform two steps.
The first is to identify the level at which system usage originates (Kozlowski and Klein 2000).
Our definition of usage refers to a user, task, and system. We agree with Lamb and Kling (2003)
that “users” can be conceptualized at all levels of analysis (e.g., individual, group, organization).
However, as collectives can only “use” systems through actions of their individual members, the
origin of the usage construct lies at the individual level.24 The second step is to determine whether
usage exists at the collective level. Because usage originates at the individual level, it cannot be
global at the collective level (Kozlowski and Klein 2000). Thus, if a researcher wishes to create a
measure of collective (e.g., group) usage when observing a set of individuals using a system, s/he
has three options: 1. to define collective usage as shared, 2. to define collective usage as
configural, or 3. to acknowledge that collective usage does not exist (Kozlowski and Klein 2000).
Because collectives and collective constructs are social constructions, their existence will
always remain somewhat fuzzy (Arrow et al. 2000). Nevertheless, four principles can be used to
identify the existence of a collective and collective system usage (Table 3.5). Two implications
stem from these principles. First, for collective usage to exist, a “collective” and “usage” must
both exist. Thus, collective usage excludes collectives that do not have an IS, as access precedes
use (Huber 1990), and it excludes collectives or members of a collective that have access to a
system but do not use it. Figure 3.2 depicts this principle by showing three overlapping groups,
two of which use systems. If every employee in each group with an IS is a “user,” then collective
24 There are two exceptions to this rule. First, one might argue that collective usage does not always originate with the individual. For example, some systems are triggered by inputs from other systems and are only indirectly invoked by people, e.g., intelligent agents and automatic fulfillment systems. Second, one might argue that collective usage does not only originate with the individual. Thus, one may consider interdependencies that occur between people using an system (e.g., coordination) to be part of collective usage. In this latter case, collective usage would originate partly at the individual level and partly at the dyadic level (i.e., the lowest level at which coordination occurs). We believe the principles in this paper can be applied to both exceptions, but we do not comment on them to simplify the analysis.
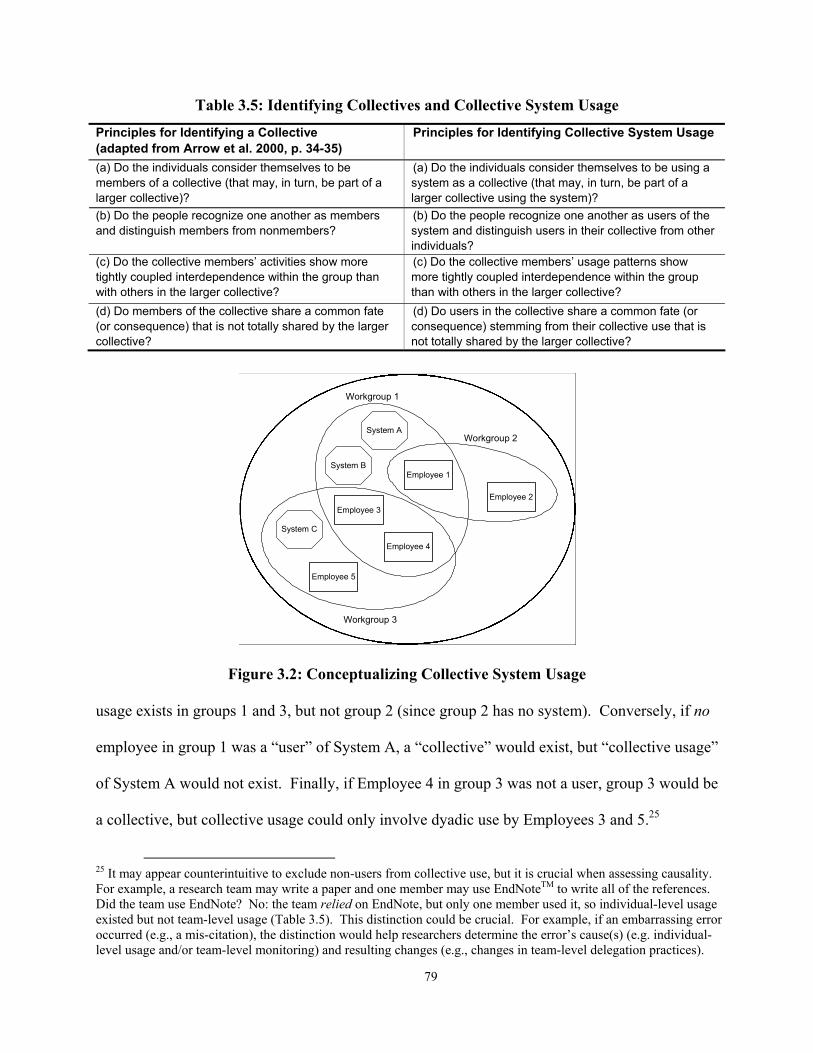
79
Table 3.5: Identifying Collectives and Collective System Usage
Principles for Identifying a Collective (adapted from Arrow et al. 2000, p. 34-35)
Principles for Identifying Collective System Usage
(a) Do the individuals consider themselves to be members of a collective (that may, in turn, be part of a larger collective)?
(a) Do the individuals consider themselves to be using a system as a collective (that may, in turn, be part of a larger collective using the system)?
(b) Do the people recognize one another as members and distinguish members from nonmembers?
(b) Do the people recognize one another as users of the system and distinguish users in their collective from other individuals?
(c) Do the collective members’ activities show more tightly coupled interdependence within the group than with others in the larger collective?
(c) Do the collective members’ usage patterns show more tightly coupled interdependence within the group than with others in the larger collective?
(d) Do members of the collective share a common fate (or consequence) that is not totally shared by the larger collective?
(d) Do users in the collective share a common fate (or consequence) stemming from their collective use that is not totally shared by the larger collective?
Employee 1
Employee 3
Employee 4
Employee 5
Employee 2
System B
System C
Workgroup 1
Workgroup 2
Workgroup 3
System A
Figure 3.2: Conceptualizing Collective System Usage
usage exists in groups 1 and 3, but not group 2 (since group 2 has no system). Conversely, if no
employee in group 1 was a “user” of System A, a “collective” would exist, but “collective usage”
of System A would not exist. Finally, if Employee 4 in group 3 was not a user, group 3 would be
a collective, but collective usage could only involve dyadic use by Employees 3 and 5.25
25 It may appear counterintuitive to exclude non-users from collective use, but it is crucial when assessing causality. For example, a research team may write a paper and one member may use EndNoteTM to write all of the references. Did the team use EndNote? No: the team relied on EndNote, but only one member used it, so individual-level usage existed but not team-level usage (Table 3.5). This distinction could be crucial. For example, if an embarrassing error occurred (e.g., a mis-citation), the distinction would help researchers determine the error’s cause(s) (e.g. individual-level usage and/or team-level monitoring) and resulting changes (e.g., changes in team-level delegation practices).

80
A second implication is that although collective usage is defined by interdependencies, the
principles in Table 3.5 do not limit the medium through which interdependencies are enacted. To
illustrate this implication, Table 3.6 depicts four archetypes of collective usage. Following the
principles in Table 3.5, users in Table 3.6 can engage in “collective usage” if they share
interdependencies during use. Thus, a strict definition of collective usage might limit it to Model 1
in Table 3.6, in which users interact and coordinate their work solely via their IT to produce joint
output (e.g., as in virtual teams using group support systems, Dennis et al. 2001). Although this
definition can be defended logically, we argue that it is too restrictive because it limits collective
usage to interdependencies that occur explicitly through the system according to the physical
structure of the IS (i.e., by the ISs being physically connected) rather than its deep structure (i.e.,
the underlying business process supported by the ISs). We propose that collective usage can exist
in Models 1-3, since these represent scenarios in which interdependencies during system usage
exist, but not in Model 4 where there are no interdependencies, and thus no “collective.”
In Model 2, individuals in a workgroup use systems in their work to produce a joint
output, but they manage their interdependencies via face-to-face rather than IT-mediated
interaction. An example of collective usage in Model 2 could be members of a consulting team
who interact face-to-face or by telephone to collaborate on a project, yet they use common
systems to support their joint work (e.g., Microsoft Office applications or Lotus Notes).
In Model 3, collective usage also exists, but another individual, here called a meta-user
(Orlikowski et al. 1995), is assigned the role of coordinating the members’ work rather than the
members interacting directly. Each member produces part of the group output, but the meta-user
(e.g., a supervisor) coordinates the workflow. An example of this model would be the use of a
customer support system by call center operators. Even if each operator handles calls
individually, with no direct interaction among operators, the calls they receive, the procedures
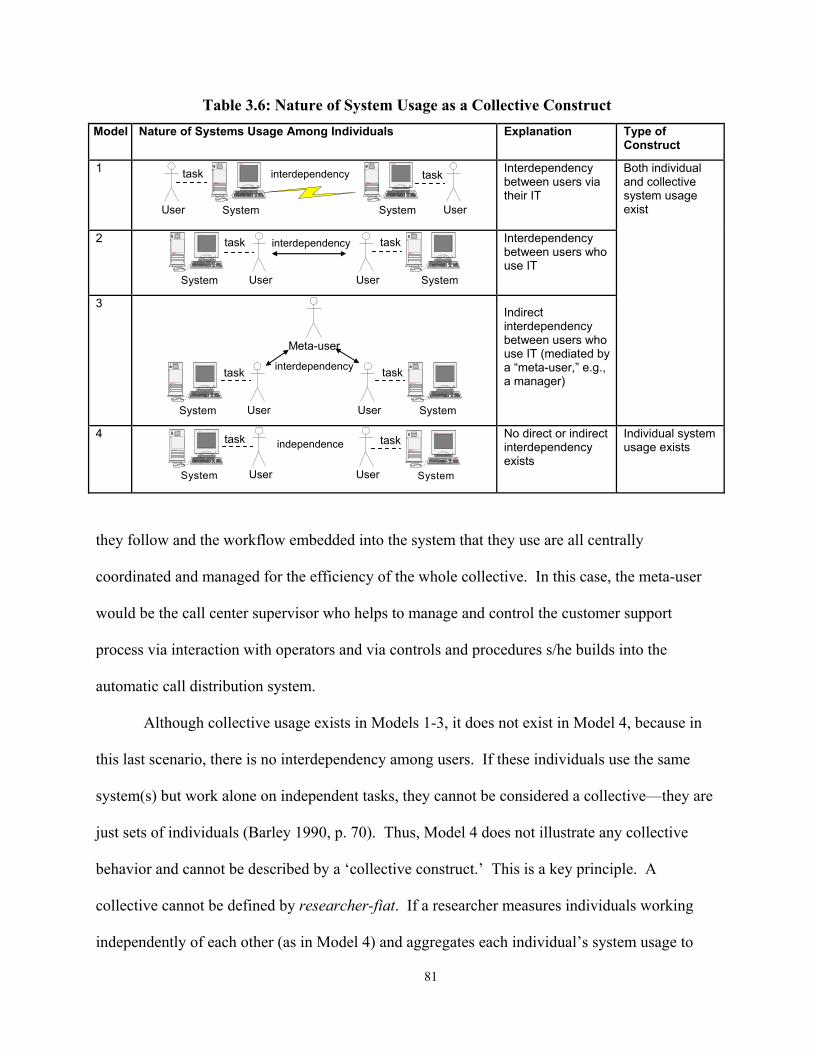
81
Table 3.6: Nature of System Usage as a Collective Construct Model Nature of Systems Usage Among Individuals Explanation Type of
Construct
1
User
SD
Profe ssio na l W orkstat ion 600 0
PRO
System
SD
Profe ssio nal Workstation 600 0
PRO
System User
Interdependency between users via their IT
Both individual and collective system usage exist
2 SD
Profe ssio nal Workstation 600 0
PRO
System User
User
SD
Profe ssio nal Workstation 600 0
PRO
System
Interdependency between users who use IT
3
Meta-user
SD
Profe ssio na l W orkstat ion 600 0
PRO
System User
User
SD
Profe ssio na l W orkstat ion 600 0
PRO
System
Indirect interdependency between users who use IT (mediated by a “meta-user,” e.g., a manager)
4 S D
Professi onal W orkstat ion 6000
PRO
System User
User
S D
Professi onal W orkstat ion 6000
PRO
System
No direct or indirect interdependency exists
Individual system usage exists
they follow and the workflow embedded into the system that they use are all centrally
coordinated and managed for the efficiency of the whole collective. In this case, the meta-user
would be the call center supervisor who helps to manage and control the customer support
process via interaction with operators and via controls and procedures s/he builds into the
automatic call distribution system.
Although collective usage exists in Models 1-3, it does not exist in Model 4, because in
this last scenario, there is no interdependency among users. If these individuals use the same
system(s) but work alone on independent tasks, they cannot be considered a collective—they are
just sets of individuals (Barley 1990, p. 70). Thus, Model 4 does not illustrate any collective
behavior and cannot be described by a ‘collective construct.’ This is a key principle. A
collective cannot be defined by researcher-fiat. If a researcher measures individuals working
independently of each other (as in Model 4) and aggregates each individual’s system usage to
task task
task task
task task
task task
interdependency
independence
interdependency
interdependency
82
create a summed or averaged measure—labeling it “collective usage,”—this would constitute a
cross-level fallacy (Rousseau 1985) (see Appendix 3B). A collective is also not defined by
institutional-fiat. If an informant claimed that their organization or group “used” IS, but it was
found that individuals (or groups) merely operated independently of each other in using these
systems, then the informant would also be committing a cross-level fallacy. Unfortunately, these
fallacies are all too common in the IS literature, whereby researchers assume that a global
measure of system usage exists at the organization or group level, simply because they can
aggregate individual data to form group-level or organizational-level scores. As system usage is
not a global construct, researchers cannot simply assume that collective usage exists. Rather,
they must be able to establish that collective usage is either shared or configural (for which other
prerequisites must be demonstrated); otherwise the notion of collective usage is a fallacy
(Rousseau 1985, Kozlowski and Klein 2000).
Two responses could be made to our arguments to date. On the one hand, one might
suggest that our principles for defining the existence of collective usage are too weak because
most members of an organization could be considered somewhat interdependent. On the other
hand, some might argue that the principles are too strict because they place a high burden on
researchers to determine whether collective “usage” really exists. We recognize both concerns
but believe that our principles strike a balance between either extreme. Although employees of
most organizations are somewhat interdependent, it would be rare to find a CEO or CIO who
could say that their firm used all their IT systems in a truly interdependent and integrated
fashion. Using systems as a collective is difficult, and CEOs and CIOs could certainly benefit
from research that helps them to understand what it takes for an organization to use a system, and
to use it effectively, in practice.

83
3.3.2.2 Identifying the Form in which Collective Usage Exists
Once a researcher has justified that collective use exists, the next step is to justify
whether the construct is shared or configural. Shared use emerges at the collective level in the
form of homogeneous levels of use among members. For example, a collective (e.g., a virtual
team) may develop routines such that each member uses a collaboration system at a similar
degree of intensity and frequency. This homogenous use of the system across group members
would be considered the group’s (shared) level of use.26 Typical quantitative measures of shared
use would be a mean of the levels of the collective’s members (assuming that the variance
among members is low).
Configural use emerges at the collective level in the form of a distinct pattern of use
among members. The levels may vary among members, but the differences are stable or
patterned over time, not random. For example, members of a virtual team may use a system in
different ways and amounts, and these differences may follow a heterogeneous but stable pattern,
e.g., relating to individual differences or job roles. For example, one individual may send email
messages asking questions to the other team members, who respond to these questions, but who
do not initiate new email messages. This is a simple example of a particular pattern (or
configuration), but obviously there are other, more complex configurations, whereby users have
distinct patterns of use that fit their workgroup's or organization's task needs. Typical
quantitative measures of configural usage would be a measure of dispersion, accompanied by
some justification that the variation represents a stable pattern, and not just random “noise.”
Typical qualitative measures of configural usage would be a categorization of the pattern, e.g., an
26 Homogeneity is not an all-or-nothing entity. In quantitative research, there are well-defined statistical tests such as intra-class correlation, eta squared, and others to identify whether an attribute is sufficiently similar within members of a group (versus sufficiently diverse for members across groups) to establish homogeneity (Castro 2002; James 1982).

84
expert-novice division of labor. As Table 3.7 shows, configurations in collective usage can
occur across members at a point in time (Model I), across time within members (Model IV), or
across members and time (Model III). In contrast, shared usage occurs when system usage is
similar both across members and over time (Model II).
Table 3.7: Forms of Shared and Configural Use* Across Time
Same Pattern
Pattern
Configural
Configural
Across Members
Same
Shared
Configural
* As the illustrations rely only on quantitative data and just two periods, they can only imply configurations. Accurately identifying and validating the level and form in which a collective construct emerges may ultimately require researchers to collect data over more than two periods and use quantitative and qualitative methods in combination (Berson et al. 2003).
What generates shared usage or configural usage? As Figure 3.3 illustrates, the existence
of shared or configural usage depends on three criteria: presence of equilibrium, level of
complexity, and length of time. First, multilevel theory assumes that systems tend towards
stability or equilibrium over time (per Table 3.1). It may be obvious that shared constructs
require stability, but so too do configural constructs because distinct patterns can only emerge if
there are periods of equilibrium (Meyer et al. 1993). Past research suggests that an assumption
of stability is untenable in two situations. First, disequilibria occur in the transitions that occur
between different equilibria (e.g., as in the transition from Time 1 Time 2 in Table 3.7, Model
IV) (Gersick 1991). Such a situation can occur, for example, during the “window of
opportunity” (Tyre and Orlikowski 1994) following a new IT implementation, before new
Level of Usage
Members
Time 1
Members
Time 2Level of Usage
Members
Time 1
Members
Time 2
Level of Usage
Members
Time 1
Members
Time 2 Level of Usage
Members
Time 1
Members
Time 2

85
Figure 3.3: Factors Influencing the Form of Collective Usage
routines stabilize. Second, disequilibria can persist if external forces prevent the formation of
equilibrium, e.g., in turbulent, “high-velocity” work environments (Brown and Eisenhardt 1997).
In either scenario, if equilibrium is not achieved, collective usage can neither be shared or
configural; instead it will remain essentially random (per Figure 3.3).
If periods of equilibrium can be identified, Figure 3.3 suggests that the second factor
determining whether usage is shared or configural is complexity (Arrow et al. 2000). Our
definition of usage suggests that collective usage will be more complex if the collective, system,
or task, increases in size or complexity. An increase in the complexity of any of these elements
increases the opportunity and incentive for members to form configurations by increasing the
likelihood that inherent individual differences among members and the inherent modularity of
systems and tasks will enable different members to enact different types of usage and achieve
efficiencies through specialization of labor, fit, and synergy (Rousseau 2000).
Finally, in terms of time, Arrow et al. (2000, p. 39) suggest that the number and variety of
patterned regularities in a collective increase over time. This is because longer periods allow for
regular patterns to emerge in an individual’s behavior or work role due to common temporal
phenomena such as learning curves and entrainment (e.g., work cycles) (Ancona et al. 2001).
In summary, our analysis suggests that if periods of equilibrium can be assumed,
System Usage
Random Usage
Shared System Usage Configural System Usage
If no pressures towards equilibrium
If pressures towards equilibrium
If usage is complex or covers a long period
If usage is simple and covers a short period

86
configural use will be common. As Arrow et al. (2000, p. 38-40) explain, patterned regularities
are the norm in real world collectives (even if they are the exception in IS or organizational
research). Configurations are enacted by individual members (e.g., to self-regulate behavior),
enacted by collectives (e.g., to achieve coordination and synergy), assigned by authority figures
in collectives (e.g., to require members to follow assigned roles), and selected by evolutionary
forces (e.g., due to variation, selection, and retention of patterns over time; Lassila and
Brancheau 1999). For all these reasons, we expect configural usage to be more common in
practice than shared usage.27 3.3.2.3 Implications for Measuring Collective Usage
Our analysis of the structure of collective usage has important implications for measuring
system usage. Specifically, it reveals that past practices for measuring collective usage have
risked substantial errors of inclusion and exclusion of measurement. Errors of inclusion occur
when researchers include a measure of collective usage when it does not in fact exist. Errors of
exclusion occur when researchers exclude a more appropriate representation of collective usage
(e.g., representing collective usage as shared when it is more accurately considered configural).
Consider, first, the dominance of cross-sectional research in IS (Pinsonneault and
Kraemer 1993). As Table 3.7 showed, researchers cannot determine the form in which collective
usage has emerged without measuring usage over at least two time periods. Consequently, cross-
sectional research designs provide no way for researchers or reviewers to determine whether
errors of inclusion or exclusion have occurred. Unfortunately, even in longitudinal research,
27 Historically, multilevel researchers initially emphasized that collective constructs emerge from homogeneity. As a result, principles for identifying configural constructs are much less developed than those for shared constructs (Kozlowski and Klein 2000). In recent years, more emphasis has been accorded to configural constructs. As Rousseau (2000, p. 578) argues: “…[in] many situations… the mere study of individuals…would miss the point: variability among individuals may be the critical quality that creates the larger whole.” Likewise, Kozlowski and Klein (2000, p. 61) criticize past research which “has tended to limit consideration to shared models of emergence…Theory needs to be able to capture the rich complexity of [different forms of] emergence rather than limiting emergence to universal conceptualizations that often do not exist.”
87
common measurement practices pose risks. For example, one way to gauge an organization’s
use of IS is to ask key informants (Gelderman 1998). However, typical key informant studies do
not verify that lower level units are sufficiently homogenous or patterned to warrant aggregating
the data to a shared or configural construct (Rogers 1996). If a researcher captured a measure of
organizational-level system usage based on key informant input in such a manner, the meaning
of the measure would be unclear and the researcher could be committing an error of inclusion.
To overcome the problems with key informant studies, some have obtained actual usage
measures from individuals and aggregated them to the group or organizational level using sums
or means (Devaraj and Kohli 2003; Easley et al. 2003). Unfortunately, even these cases are
problematic. Sums and averages are not configural measures, and unless users have similar
levels of use, they cannot represent shared usage (Kozlowski and Klein 2000). Unless
researchers report tests for homogeneity or patterned use (James 1982; Klein et al. 1994), the
meaning of such aggregated measures is unclear (Bliese 2000) and the potential for errors of
inclusion is high.
Importantly, the need to defend collective constructs applies equally to positivist,
qualitative research. Qualitative methods are ideally suited to multilevel research.
Unfortunately, seminal qualitative methods texts give scant attention to multilevel issues (Miles
and Huberman 1994; Yin 1994). Consider an example. Assume that a qualitative researcher
studied an organization’s ‘use’ of an ERP system and identified ‘themes’ (i.e., constructs) in
their data by aggregating concepts that appeared in and across respondents’ statements by
(implicitly or explicitly) counting how often such themes appeared in interviews with members.
If the researcher generalized these themes to describe “organizational usage,” this could create an
error of inclusion if the organization was more a collection of independent units rather than an
interdependent collective (per Table 3.6, Model 4).

88
Although we believe that errors of inclusion when studying system usage are very
common in IS research, errors of exclusion appear to be particularly prevalent because in our
review of past usage studies, we found no study that represented collective usage as configural.
Instead, IS researchers have continued to use sums and means to paint collectives in flat, single
colors, that remove all variations and patterns. By employing this strategy, researchers lose
crucial information in their measures. This may be one reason why researchers have obtained
mixed results for the relationship between use and other downstream variables such as
performance. Acknowledging the need for configurations and patterns in formulating our
theories could improve the “precision and power” of empirical tests (Meyer et al. 1993, pp.
1192) and would allow a much more natural conception of organizational life, by recognizing the
complex patterns and regularities that occur in real organizations (Arrow et al 2000).
A response to our argument may be that interpretive researchers have long studied how
members of a collective enact distinct patterns of use. One can point to observations of patterns
among individuals in groups (Mackay 1990) and groups in organizations (Barley 1990;
Orlikowski 2000). However, although these studies show how usage patterns can occur, they
have been more concerned with the emergence of patterns, rather than the implications of such
patterns for individual and collective outcomes such as performance. For example, Barley
(1990) and Mackay (1990) study the emergence of different patterns of technology usage, but
not the performance implications arising from these different patterns. Although this is
consistent with their interpretive epistemological assumptions, it is incumbent on positivist
researchers to not only identify patterns, but to identify their causes and/or consequences (Meyer
et al. 1993). To perform this task, researchers need to specify the second leg of a multilevel
theory—its function.
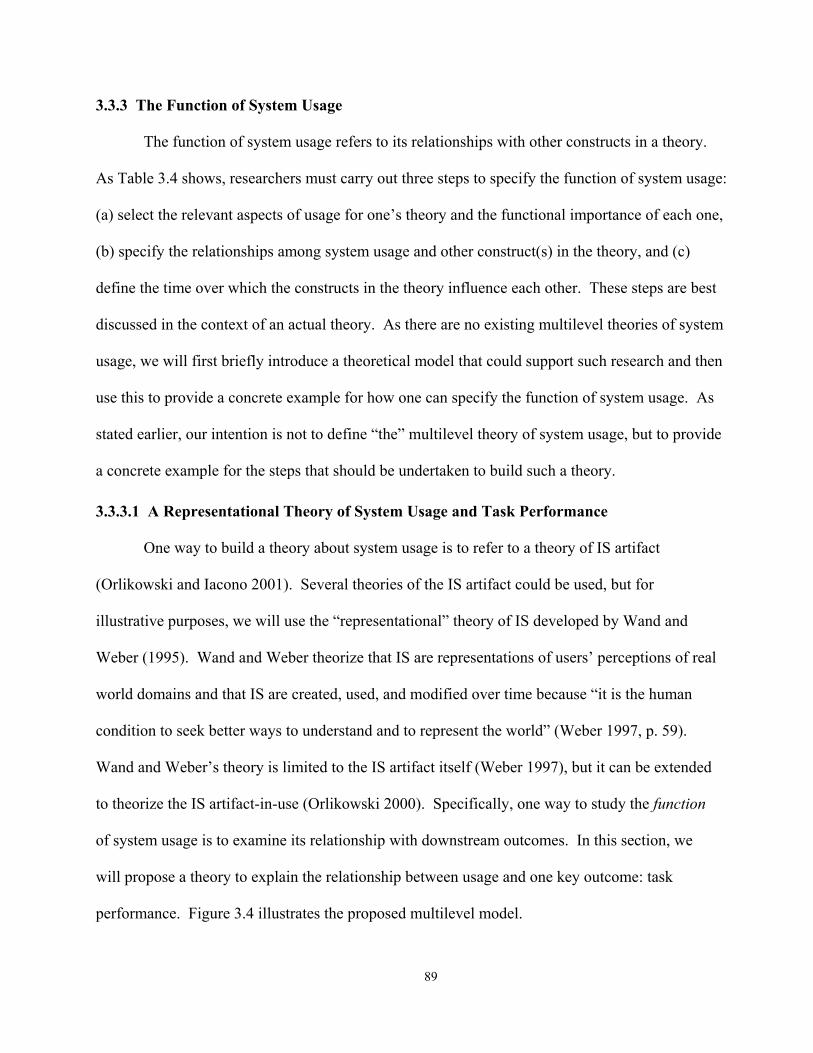
89
3.3.3 The Function of System Usage
The function of system usage refers to its relationships with other constructs in a theory.
As Table 3.4 shows, researchers must carry out three steps to specify the function of system usage:
(a) select the relevant aspects of usage for one’s theory and the functional importance of each one,
(b) specify the relationships among system usage and other construct(s) in the theory, and (c)
define the time over which the constructs in the theory influence each other. These steps are best
discussed in the context of an actual theory. As there are no existing multilevel theories of system
usage, we will first briefly introduce a theoretical model that could support such research and then
use this to provide a concrete example for how one can specify the function of system usage. As
stated earlier, our intention is not to define “the” multilevel theory of system usage, but to provide
a concrete example for the steps that should be undertaken to build such a theory.
3.3.3.1 A Representational Theory of System Usage and Task Performance
One way to build a theory about system usage is to refer to a theory of IS artifact
(Orlikowski and Iacono 2001). Several theories of the IS artifact could be used, but for
illustrative purposes, we will use the “representational” theory of IS developed by Wand and
Weber (1995). Wand and Weber theorize that IS are representations of users’ perceptions of real
world domains and that IS are created, used, and modified over time because “it is the human
condition to seek better ways to understand and to represent the world” (Weber 1997, p. 59).
Wand and Weber’s theory is limited to the IS artifact itself (Weber 1997), but it can be extended
to theorize the IS artifact-in-use (Orlikowski 2000). Specifically, one way to study the function
of system usage is to examine its relationship with downstream outcomes. In this section, we
will propose a theory to explain the relationship between usage and one key outcome: task
performance. Figure 3.4 illustrates the proposed multilevel model.
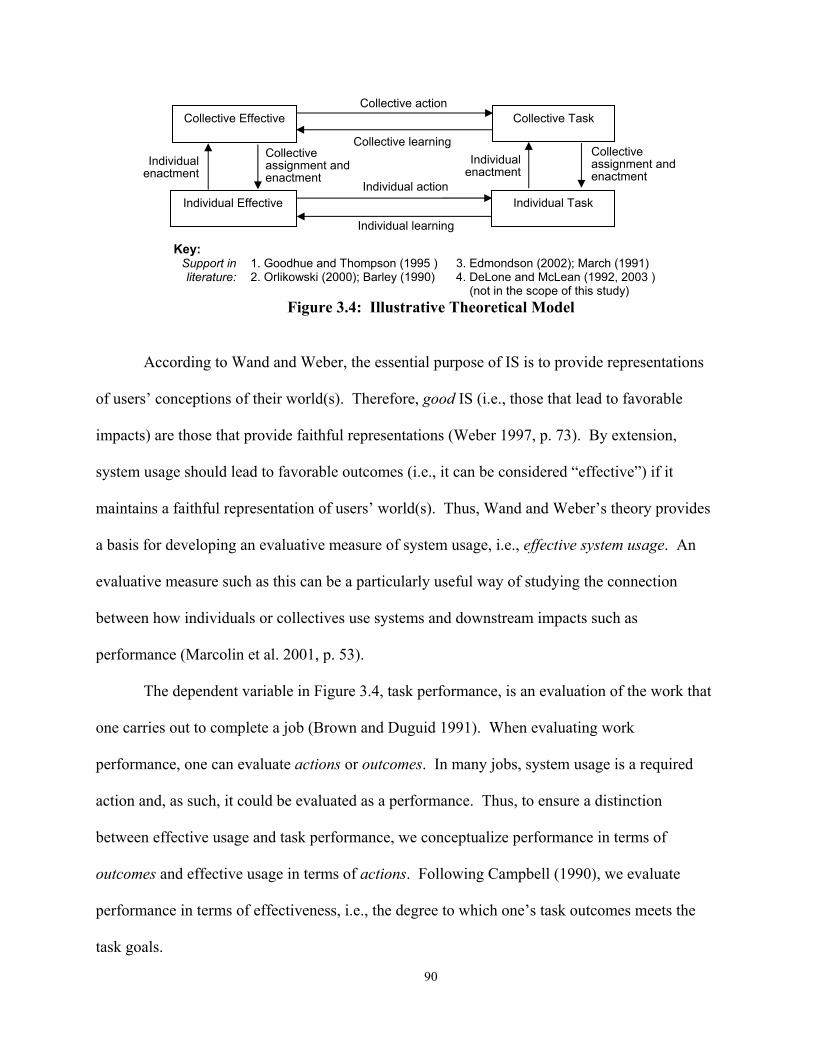
90
Key: Support in 1. Goodhue and Thompson (1995 ) 3. Edmondson (2002); March (1991) literature: 2. Orlikowski (2000); Barley (1990) 4. DeLone and McLean (1992, 2003 )
(not in the scope of this study) Figure 3.4: Illustrative Theoretical Model
According to Wand and Weber, the essential purpose of IS is to provide representations
of users’ conceptions of their world(s). Therefore, good IS (i.e., those that lead to favorable
impacts) are those that provide faithful representations (Weber 1997, p. 73). By extension,
system usage should lead to favorable outcomes (i.e., it can be considered “effective”) if it
maintains a faithful representation of users’ world(s). Thus, Wand and Weber’s theory provides
a basis for developing an evaluative measure of system usage, i.e., effective system usage. An
evaluative measure such as this can be a particularly useful way of studying the connection
between how individuals or collectives use systems and downstream impacts such as
performance (Marcolin et al. 2001, p. 53).
The dependent variable in Figure 3.4, task performance, is an evaluation of the work that
one carries out to complete a job (Brown and Duguid 1991). When evaluating work
performance, one can evaluate actions or outcomes. In many jobs, system usage is a required
action and, as such, it could be evaluated as a performance. Thus, to ensure a distinction
between effective usage and task performance, we conceptualize performance in terms of
outcomes and effective usage in terms of actions. Following Campbell (1990), we evaluate
performance in terms of effectiveness, i.e., the degree to which one’s task outcomes meets the
task goals.
Individual Effective
Collective Effective
Individual enactment
Collective assignment and enactment
Collective action
Collective learning
Individual action
Individual learning
Individual Task
Collective Task
Individual enactment
Collective assignment and enactment

91
3.3.3.2 Selection
In the prior section on the structure of usage, we defined usage as an activity and we
examined its existence and form based on the nature of this activity. When examining the
function of usage, a researcher may be interested in the entire usage activity or, instead, one or
more specific aspects of the activity relevant for theory being studied. In the selection stage, a
research must carry out two steps to select and specify the relevant elements and measures of
usage for his/her theory.
Step 1: Select Relevant Elements and Measures of System Usage.
Our definition of usage states that usage involves three elements (user, system, and task).
When selecting usage measures, a researcher should first select the elements of usage that are
most relevant for his/her theory, and then choose measures that are centered around the chosen
element(s) that relate theoretically to the other construct(s) in the proposed model (Burton-Jones
and Straub 2004, i.e., Chapter 2), e.g.:
1. Measures of a user’s state during usage (e.g., the user’s cognitive or emotive state);
2. Measures of the way that a system is used during usage (e.g., the features used);
3. Measures of the tasks performed during usage (e.g., the number of tasks performed);
4. A combination of system, user, and/or task-centered measures.
In some theoretical contexts, a researcher may need to measure just one precise aspect of usage
(e.g., features used), in which case a uni-dimensional construct could be used. However, in the
context of our theoretical model, we suggest that a combination approach is required to achieve a
content-valid measure of effective system usage. As Figure 3.5 shows, effective usage in our
theory is a multidimensional construct (Edwards 2001) formed by three measures (subconstructs):
transparent interaction, technology adaptation, and social awareness. We lack sufficient space to
completely explain the derivation of each subconstruct, but Table 3.8 briefly explains each one.

92
* We show this model at just one level for convenience, but it applies at multiple levels (per Figure 3.4).
Figure 3.5: Functional Relationship Between System Usage and Downstream Impacts*
Table 3.8: Theoretical Basis for the Three Subconstructs of Effective System Usage Subconstruct & Key Reference
Elements of Usage Measured
Theoretical Basis for the Importance of each Subconstruct
Transparent Interaction (Weber 1997)
System: The measure reflects the way that the system is used.
IS comprise three parts: surface structure (the facilities that allow users to interact with the IS), deep structure (the data and functions used to represent users’ world(s)), and physical structure (how surface and deep structures are mapped onto the underlying technology used to operate the IS). The benefit that users obtain from an IS stems from its deep structure. Thus, effective usage requires unimpeded access and interaction with this deep structure (i.e., “transparent interaction”).
Technology Adaptation (Majchrzak et al. 2000)
System and Task: The measure reflects the way that the system is used or adapted for a task.
IS deep structure represents users’ world(s) partially and problematically. Thus, users need to appropriate the deep structure, and employ it in new ways over time to maintain and create effective representations of their world(s). Such “technology adaptations” are an essential aspect of effective usage.
Social Awareness (Davern 1996)
User: The measure captures the user’s cognitive state during usage.
Users’ understanding of their world(s) and the IS deep structure(s) are imperfect. Users need to be aware of the ways that other members in their collective interact with and appropriate IS to learn the nature of effective usage in their collective. Such “social awareness” in use supports effective usage.
Step 2: Specify in what Form Each Measure is Functionally Important.
Once a researcher has selected the relevant measures of usage, s/he must determine
whether the functional importance of each measure is tied to a particular structural form. This is
due to equifinality—the notion that different patterns can have the same functional outcomes
Task Performance
Effective System Usage
Transparent Interaction:
- the extent to which users gain access to and interact with the deep structure of an IS unimpeded by its surface or physical structure.
Technology Adaptation:
- the extent to which users proactively change the way that they use their IS to maintain good representations of their world(s).
Social Awareness:
- the extent to which users are socially aware of other users’ technologies-in-practice when using their IS.
+
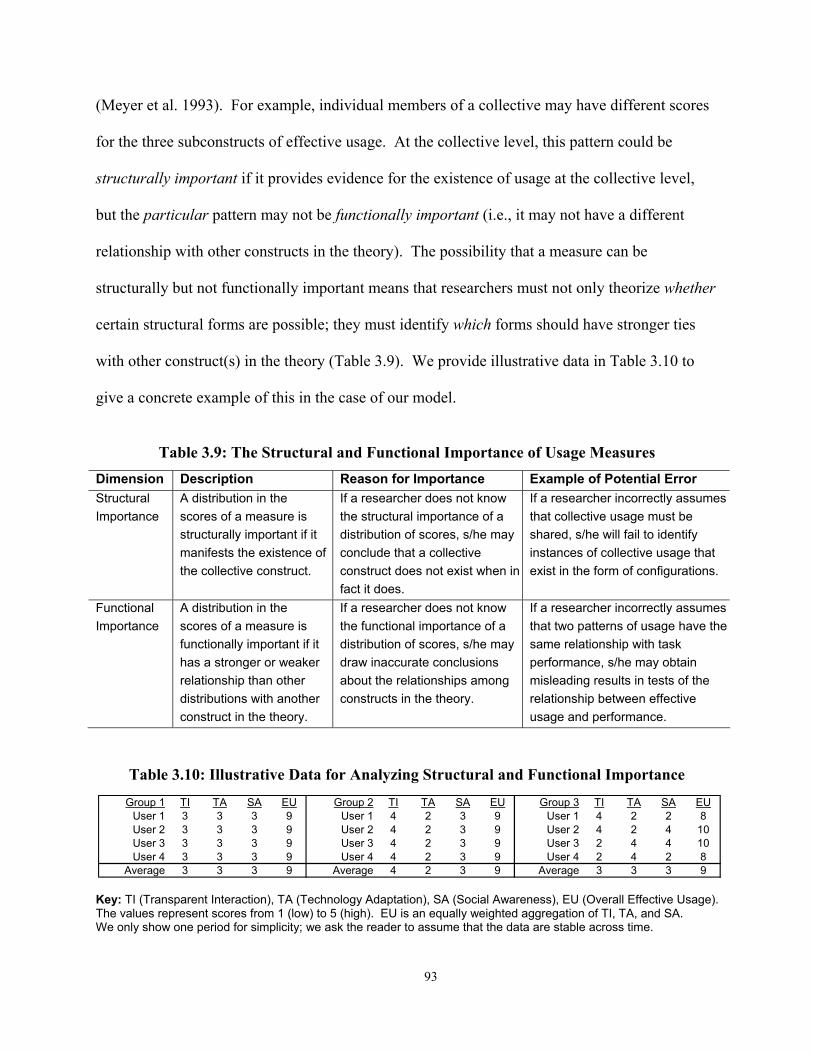
93
(Meyer et al. 1993). For example, individual members of a collective may have different scores
for the three subconstructs of effective usage. At the collective level, this pattern could be
structurally important if it provides evidence for the existence of usage at the collective level,
but the particular pattern may not be functionally important (i.e., it may not have a different
relationship with other constructs in the theory). The possibility that a measure can be
structurally but not functionally important means that researchers must not only theorize whether
certain structural forms are possible; they must identify which forms should have stronger ties
with other construct(s) in the theory (Table 3.9). We provide illustrative data in Table 3.10 to
give a concrete example of this in the case of our model.
Table 3.9: The Structural and Functional Importance of Usage Measures
Dimension Description Reason for Importance Example of Potential Error Structural Importance
A distribution in the scores of a measure is structurally important if it manifests the existence of the collective construct.
If a researcher does not know the structural importance of a distribution of scores, s/he may conclude that a collective construct does not exist when in fact it does.
If a researcher incorrectly assumes that collective usage must be shared, s/he will fail to identify instances of collective usage that exist in the form of configurations.
Functional Importance
A distribution in the scores of a measure is functionally important if it has a stronger or weaker relationship than other distributions with another construct in the theory.
If a researcher does not know the functional importance of a distribution of scores, s/he may draw inaccurate conclusions about the relationships among constructs in the theory.
If a researcher incorrectly assumes that two patterns of usage have the same relationship with task performance, s/he may obtain misleading results in tests of the relationship between effective usage and performance.
Table 3.10: Illustrative Data for Analyzing Structural and Functional Importance
Key: TI (Transparent Interaction), TA (Technology Adaptation), SA (Social Awareness), EU (Overall Effective Usage). The values represent scores from 1 (low) to 5 (high). EU is an equally weighted aggregation of TI, TA, and SA. We only show one period for simplicity; we ask the reader to assume that the data are stable across time.
Group 1 TI TA SA EU Group 2 TI TA SA EU Group 3 TI TA SA EUUser 1 3 3 3 9 User 1 4 2 3 9 User 1 4 2 2 8User 2 3 3 3 9 User 2 4 2 3 9 User 2 4 2 4 10User 3 3 3 3 9 User 3 4 2 3 9 User 3 2 4 4 10User 4 3 3 3 9 User 4 4 2 3 9 User 4 2 4 2 8
Average 3 3 3 9 Average 4 2 3 9 Average 3 3 3 9

94
Our example in Table 3.10 shows three groups with three different distributions of scores:
• Group 1 shows shared scores across users and across the three subconstructs; • Group 2 shows shared scores across users and a configuration across subconstructs; • Group 3 shows a configuration of scores across users and across the three subconstructs.
Consider, first, the distribution of scores in Group 1. In this case, collective usage is
shared as all members have the same scores for effective system usage (i.e., 9 out of a possible
score of 15), as well as identical scores for its subconstructs. Next, consider Group 2. This group
displays a configuration of scores across the three subconstructs but shared scores across users.
Because the pattern is identical across users, the individual members and the group all have the
same score for effective system usage, thus effective usage is again shared. Groups 1 and 2 give
a good example of equifinality. Because effective system usage in our model is a higher-order,
aggregate construct (Edwards 2001), the three subconstructs form (rather than reflect) effective
system usage. Thus, we assume that two different individuals or groups (such as Groups 1 and 2
in Table 3.10) can have the same effective usage overall (i.e., 9 out of a possible score of 15), yet
have different scores on each subconstruct, signifying different ways to achieve effective usage.28
Finally, consider Group 3, in which the scores are patterned across users and
subconstructs. If a researcher has a theoretical reason to believe that group-level usage should be
shared in her/his study, s/he must conclude that group-level usage does not exist in Group 3,
only individual-level usage exists.29 If there is a theoretical reason to support a configuration
view of usage, then the distribution of scores in Group 3 would be considered structurally
important (Table 3.9) and the data could be aggregated to the group level. The researcher must
28 We do not claim that all models of effective system usage should have this property of equifinality, but management scholars advise other researchers to be aware that such equifinality is possible (Meyer et al. 1993). 29 This is because if a researcher assumes in a particular context that group-level usage is shared, s/he must run tests of homogeneity within groups to identify those that are sufficiently homogenous to exhibit group-level usage (Castro 2002). As Group 3 has distinct patterns across users, it would fail tests of homogeneity and should not be aggregated.
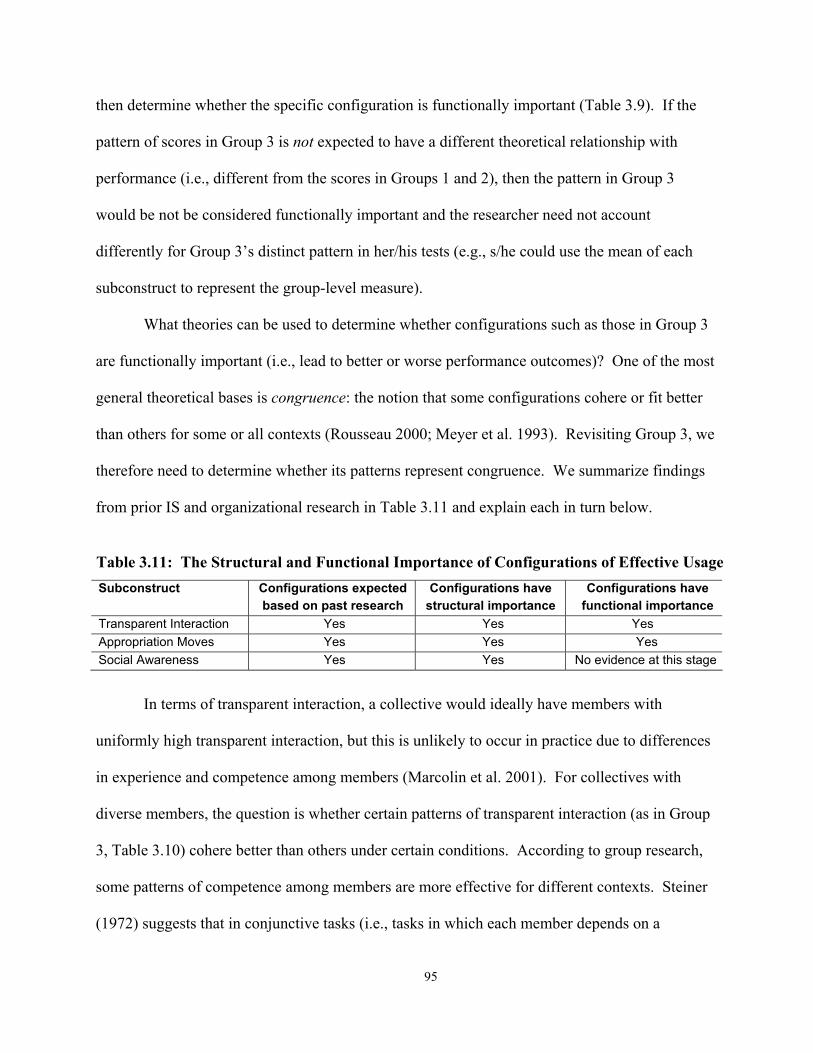
95
then determine whether the specific configuration is functionally important (Table 3.9). If the
pattern of scores in Group 3 is not expected to have a different theoretical relationship with
performance (i.e., different from the scores in Groups 1 and 2), then the pattern in Group 3
would be not be considered functionally important and the researcher need not account
differently for Group 3’s distinct pattern in her/his tests (e.g., s/he could use the mean of each
subconstruct to represent the group-level measure).
What theories can be used to determine whether configurations such as those in Group 3
are functionally important (i.e., lead to better or worse performance outcomes)? One of the most
general theoretical bases is congruence: the notion that some configurations cohere or fit better
than others for some or all contexts (Rousseau 2000; Meyer et al. 1993). Revisiting Group 3, we
therefore need to determine whether its patterns represent congruence. We summarize findings
from prior IS and organizational research in Table 3.11 and explain each in turn below.
Table 3.11: The Structural and Functional Importance of Configurations of Effective Usage Subconstruct Configurations expected
based on past research Configurations have
structural importance Configurations have
functional importance Transparent Interaction Yes Yes Yes Appropriation Moves Yes Yes Yes Social Awareness Yes Yes No evidence at this stage
In terms of transparent interaction, a collective would ideally have members with
uniformly high transparent interaction, but this is unlikely to occur in practice due to differences
in experience and competence among members (Marcolin et al. 2001). For collectives with
diverse members, the question is whether certain patterns of transparent interaction (as in Group
3, Table 3.10) cohere better than others under certain conditions. According to group research,
some patterns of competence among members are more effective for different contexts. Steiner
(1972) suggests that in conjunctive tasks (i.e., tasks in which each member depends on a

96
previous member), the least competent member’s behavior drives group performance.
Conversely, in disjunctive tasks (i.e., tasks in which group output is chosen from one member’s
contributions), the most competent member’s behavior drives group performance. Applying this
logic to the groups in Table 3.10 suggests that the specific pattern of transparent interaction in
Group 3 is functionally important (per Table 3.11) because depending on the task, a
heterogeneous pattern of transparent interaction at the group level could be better (for disjunctive
tasks) or worse (for conjunctive tasks) than a shared or homogeneous level of transparent
interaction such as in Group 1.
In terms of the second subconstruct, technology adaptation, research suggests that
patterns can be functionally important, depending on the type of adaptation that they reflect.
Studies of agency distinguish between two types of adaptive behavior: practical evaluative
behavior in which agents adapt to immediate, practical concerns, and projective behavior in
which agents explore possibilities for the future (Emirbayer and Mische 1998). In terms of
configurations of practical evaluative behavior, there is insufficient theory to conclude whether
patterns of such behavior lead to greater outcomes (i.e., they are not clearly functionally
important), but Majchrzak et al. (2000) showed that such patterns can occur in practice (i.e., they
are structurally important):
…adaptations may become discontinuous [i.e., configural] when the costs to change are very high, and when the technology is large or complex; but when the costs to not adapt are higher, and when the technology is more malleable, adaptations may become ongoing, if not continuous [i.e., shared] (p. 594). In terms of configurations of projective behavior, research suggests that patterns of such
behavior are both structurally and functionally important. Support for this stems from March’s
(1991) theory that individuals and collectives benefit from a mix of exploitation and exploration.
Exploitation refers to routinization and implementation of existing practices, whereas exploration
97
refers to the search or discovery of novel, innovative practices. Projective adaptations are
exploratory in nature. According to March (1991), there is a tension between exploitation and
exploration because exploitation tends to drive out exploration due to its higher certainty, speed,
and clarity of feedback. Short-term performance can benefit from exploitation alone, but long-
term performance will suffer from either (a) high exploitation alone (because it can trap one in
suboptimal routines) or (b) high exploration alone (because it yields high costs with few benefits)
(Argote and Ophir 2002). March’s theory supports a coherence perspective because it suggests
that effective system usage over the long run will not stem from uniform degrees of projective
adaptation (whether high or low) across members of a collective and/or over time, but rather will
stem from patterns of high and low adaptation. A collective could enact such patterns (a) across
members at a point in time (i.e., by some exploring and others exploiting), (b) within members
across time (i.e., by individuals exploring and exploiting at different times), or (c) across
members and time (per Table 3.7, Models I, III, and IV). Therefore, applying March’s (1991)
logic to the technology adaptation scores in Group 3 (Table 3.10) suggests that such a
heterogeneous pattern of scores would be more effective than one that displayed uniform levels
of adaptation across all members (e.g., as in Groups 1-2). Edmondson (2002) provides a good
example of this, finding that different groups in a firm engaged in different degrees of
exploration, apparently learning more effectively overall by overcoming each other’s
deficiencies. Likewise, Accenture has long had an “advanced technology practice” in its
Chicago headquarters, which experiments with and evaluates emerging technologies, before
deciding which ones should be adopting by other offices. This represents a distinct usage
configuration, since one unit (the “advanced technology practice”) uses new technologies in a
deliberately different manner than other units who are expected to use these technologies
98
according to prescribed methodologies. Thus, we suggest that the patterns of scores for
adaptation in Group 3 are both structurally and functionally important (per Table 3.11).30
Finally, in terms of the third subconstruct, social awareness, past research suggests that
different collectives (and different members within collectives) enact varying degrees of social
awareness. For example, Mackay (1990) observed a large group of email users and observed the
emergence of three informal subgroups: normal users who rarely modified the system (low
technology adaptation), gurus who modified the IS extensively (high technology adaptation), and
translators who publicized and disseminated the changes made by gurus to other users (high
social awareness). Despite this empirical evidence of the existence of varied social awareness
practices, we are aware of no general theory that suggests that patterns of social awareness
within or across collectives are inevitably more effective than homogeneous levels of social
awareness. Therefore, we conclude that such patterns are important from a structural, but not a
functional, perspective.
Implications for operationalizing measures of collective usage.
Just as the proposed principles for the structure of usage have implications for measuring
the construct, so too do the principles for its function. Specifically, if configural constructs are
functionally important, positivist researchers must identify ways to operationalize them.
Returning to our example, researchers must seek metrics to operationalize the configurations of
transparent interaction and technology adaptation in Table 3.10. Researchers generally capture
data on configurations using measures of heterogeneity (Table 3.2). Because of the link between
30 It is important to make explicit an issue that has remained implicit so far, namely that individual and collective benefits from system usage may not be perfectly aligned. This can have untoward effects for both individuals and collectives. For example, a collective may enact a pattern of use that is in the collective’s interest but not the interest of its individual members, and members may enact patterns of use that are in their own interest but not in the collective interest. A detailed examination of this is outside the scope of the paper but we return to it briefly in the Implications section.
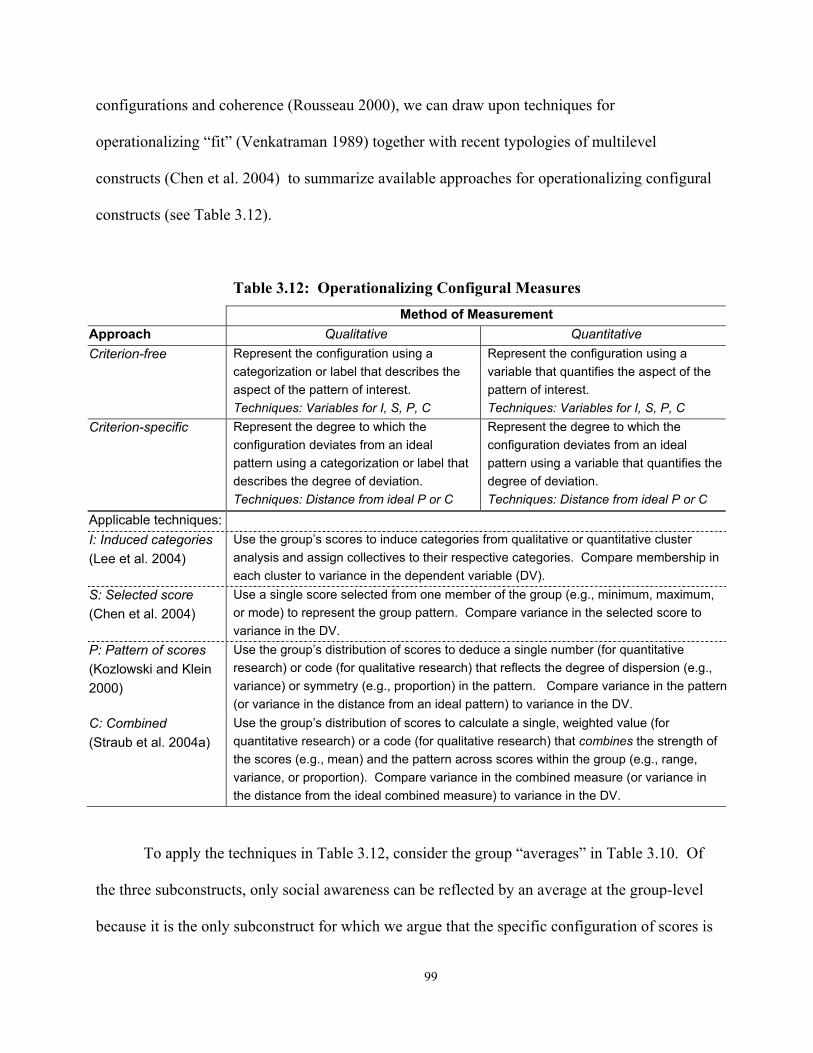
99
configurations and coherence (Rousseau 2000), we can draw upon techniques for
operationalizing “fit” (Venkatraman 1989) together with recent typologies of multilevel
constructs (Chen et al. 2004) to summarize available approaches for operationalizing configural
constructs (see Table 3.12).
Table 3.12: Operationalizing Configural Measures Method of Measurement Approach Qualitative Quantitative Criterion-free Represent the configuration using a
categorization or label that describes the aspect of the pattern of interest. Techniques: Variables for I, S, P, C
Represent the configuration using a variable that quantifies the aspect of the pattern of interest. Techniques: Variables for I, S, P, C
Criterion-specific Represent the degree to which the configuration deviates from an ideal pattern using a categorization or label that describes the degree of deviation. Techniques: Distance from ideal P or C
Represent the degree to which the configuration deviates from an ideal pattern using a variable that quantifies the degree of deviation. Techniques: Distance from ideal P or C
Applicable techniques: I: Induced categories (Lee et al. 2004)
Use the group’s scores to induce categories from qualitative or quantitative cluster analysis and assign collectives to their respective categories. Compare membership in each cluster to variance in the dependent variable (DV).
S: Selected score (Chen et al. 2004)
Use a single score selected from one member of the group (e.g., minimum, maximum, or mode) to represent the group pattern. Compare variance in the selected score to variance in the DV.
P: Pattern of scores (Kozlowski and Klein 2000)
Use the group’s distribution of scores to deduce a single number (for quantitative research) or code (for qualitative research) that reflects the degree of dispersion (e.g., variance) or symmetry (e.g., proportion) in the pattern. Compare variance in the pattern(or variance in the distance from an ideal pattern) to variance in the DV.
C: Combined (Straub et al. 2004a)
Use the group’s distribution of scores to calculate a single, weighted value (for quantitative research) or a code (for qualitative research) that combines the strength of the scores (e.g., mean) and the pattern across scores within the group (e.g., range, variance, or proportion). Compare variance in the combined measure (or variance in the distance from the ideal combined measure) to variance in the DV.
To apply the techniques in Table 3.12, consider the group “averages” in Table 3.10. Of
the three subconstructs, only social awareness can be reflected by an average at the group-level
because it is the only subconstruct for which we argue that the specific configuration of scores is

100
not functionally important (Table 3.11). For the other two subconstructs (transparent interaction
and technology adaptation) we must choose an approach from Table 3.12. The first step is to
choose a criterion-free or a criterion-specific approach. For most multilevel models of system
usage, a criterion-free approach will be appropriate, but in the case of our multilevel model, since
effective system usage is an evaluation, a criterion-specific measure is necessary (Venkatraman
1989). The second step is to choose a suitable technique for operationalizing the group’s scores
(per Table 3.12). For transparent interaction, we previously argued that the important aspects of
the patterns are the minimum/maximum, so the selected score technique is appropriate (Table
3.12). For technology adaptation, we argued that the important aspects of the pattern are the
dispersion (e.g., variance) and strength (e.g., mean) in the scores of each group. A combined
measure that weights the strength and dispersion of scores is appropriate (per Table 3.12)
because March’s theory does not privilege exploration over exploitation or vice versa, suggesting
that a moderate amount of exploratory behavior is ideal, with this moderate level being enacted
via a pattern of high and low levels across members, over time, or both (per Table 3.7). This
implies that in the context of Table 3.10, the ideal pattern of exploratory behavior has a mean
value reflecting a moderate level of technology adaptation (e.g., 3 on a 5-point scale) with a high
variance. Based on this insight, Group 3 would have the highest score for technology adaptation
(of the groups depicted in Table 3.10), followed by Group 1 (which has a lower variance, but
identical mean), and then Group 2 (which has both a lower mean and less variance).
Following Table 3.12, as effective system usage is a criterion-specific construct,
researchers would create the measure for overall effective system usage by using a distance
measure to capture the deviation of each member from the ideal level on each subconstruct, and
then aggregating these deviation scores to determine the overall level of effective usage.
Quantitative researchers could use techniques such as partial least squares to create the aggregate
101
(i.e., formative) construct, while qualitative researches would create a code or label to
characterize the overall effectiveness.31
3.3.3.3 Specifying the Functional Form
Once the relevant properties of usage have been specified, one must specify its functional
form in the theory (Table 3.4). In this section, we use our model in Figure 3.4 as an example of
how to carry out this step. Multilevel researchers can choose from over eight functional forms
(per Table 3.3), but past studies of the system usage performance link have examined only two
forms, testing single-level models at an individual level (Model 1, Table 3.3) (Goodhue and
Thompson 1995) and a collective level (Model 3, Table 3.3) (Dennis et al. 2001, Devaraj and
Kohli 2003). The proposed model in Figure 3.4 extends past studies by explaining the
usage performance link over both levels. Researchers must carry out two steps to specify the
function of usage in such a model (per Table 3.4):
Step 1: Define the functional relationship between individual usage and collective usage.
The proposed theory of effective system usage and task performance suggests that
effective usage comprises the same three subconstructs at an individual and collective level
(Figure 3.5) and that there is a reciprocal relationship between effective usage at the individual
and collective levels (per the vertical arrows in Figure 3.4). Following distinction between
canonical and non-canonical practice, we suggest that the reciprocal links between individual
and collective usage can be defined in terms of enactment and assignment. ‘Enactment’ refers to
what members of a collective actually do whereas ‘assignment’ refers to what an institution
31 Although qualitative and quantitative researchers can operationalize configural constructs in their own way, the literature provides more guidance for quantitative researchers, such as guidance for calculating combined measures (Straub et al. 2004), inducing configurations from cluster analysis (Lee et al. 2004), and calculating distance measures (Doty and Glick 1994; Doty et al. 1993). A detailed discussion of such work is outside the scope of this study (Chen et al. 2004; Hofmann and Jones 2004), but we return to the need for more research on operationalizing and validating multilevel and configural constructs in the Implications section.

102
assigns members to do (e.g., via mandatory rules and role assignments) (Gallivan 2001). We
propose that the influence of individual usage on collective usage—the upward arrow in Figure
3.4—is one of enactment, i.e., collective usage is formed bottom-up from the enactments of the
members in the collective. In contrast, we suggest that the influence of collective usage on
individual usage—the downward arrow in Figure 3.4—is one of both enactment and assignment.
This is because individual use of systems is influenced by the enactments of other individuals in
the collective as well as the formal rules and assignments made by the collective itself
(Orlikowski et al. 1995).
Step 2: Define the functional relationship between usage and its related constructs.
As Figure 3.4 shows, we theorize a reciprocal relationship between effective system
usage and task performance at each level. This assumes that users learn from their performance
outcomes and adjust their usage behaviors over time (Goodhue and Thompson 1995). As shown
in Figure 3.5, the functional relationship between effective usage and performance is expected to
be positive, i.e., effective usage will increase task performance at both individual and collective
levels. However, the feedback relationship between performance and effective usage is
unpredictable because learning is a discovery process and user responses to outcomes may not
always be advantageous.
When comparing the functional relationships that we specified in Figure 3.4 with the
eight possible functional relationships in Table 3.3, it is clear that more complex relationships
could, in principle, be theorized. For example, our model in Figure 3.4 specifies no direct
relationships across levels of analysis (e.g., diagonal lines from individual usage to collective
performance or from collective usage to individual performance). We omit such cross-level
relationships because we lack strong theoretical grounds to support them at this stage.
Specifically, we believe that changes in effective system usage will lead to (a) changes in task
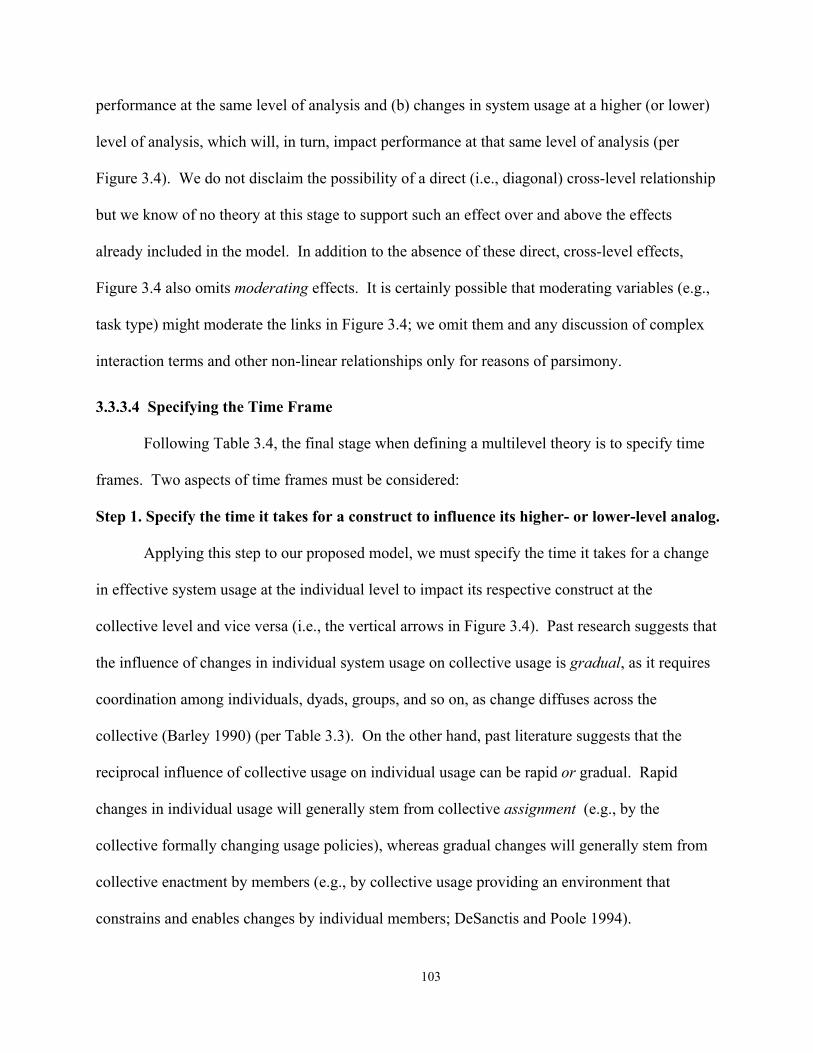
103
performance at the same level of analysis and (b) changes in system usage at a higher (or lower)
level of analysis, which will, in turn, impact performance at that same level of analysis (per
Figure 3.4). We do not disclaim the possibility of a direct (i.e., diagonal) cross-level relationship
but we know of no theory at this stage to support such an effect over and above the effects
already included in the model. In addition to the absence of these direct, cross-level effects,
Figure 3.4 also omits moderating effects. It is certainly possible that moderating variables (e.g.,
task type) might moderate the links in Figure 3.4; we omit them and any discussion of complex
interaction terms and other non-linear relationships only for reasons of parsimony.
3.3.3.4 Specifying the Time Frame
Following Table 3.4, the final stage when defining a multilevel theory is to specify time
frames. Two aspects of time frames must be considered:
Step 1. Specify the time it takes for a construct to influence its higher- or lower-level analog.
Applying this step to our proposed model, we must specify the time it takes for a change
in effective system usage at the individual level to impact its respective construct at the
collective level and vice versa (i.e., the vertical arrows in Figure 3.4). Past research suggests that
the influence of changes in individual system usage on collective usage is gradual, as it requires
coordination among individuals, dyads, groups, and so on, as change diffuses across the
collective (Barley 1990) (per Table 3.3). On the other hand, past literature suggests that the
reciprocal influence of collective usage on individual usage can be rapid or gradual. Rapid
changes in individual usage will generally stem from collective assignment (e.g., by the
collective formally changing usage policies), whereas gradual changes will generally stem from
collective enactment by members (e.g., by collective usage providing an environment that
constrains and enables changes by individual members; DeSanctis and Poole 1994).
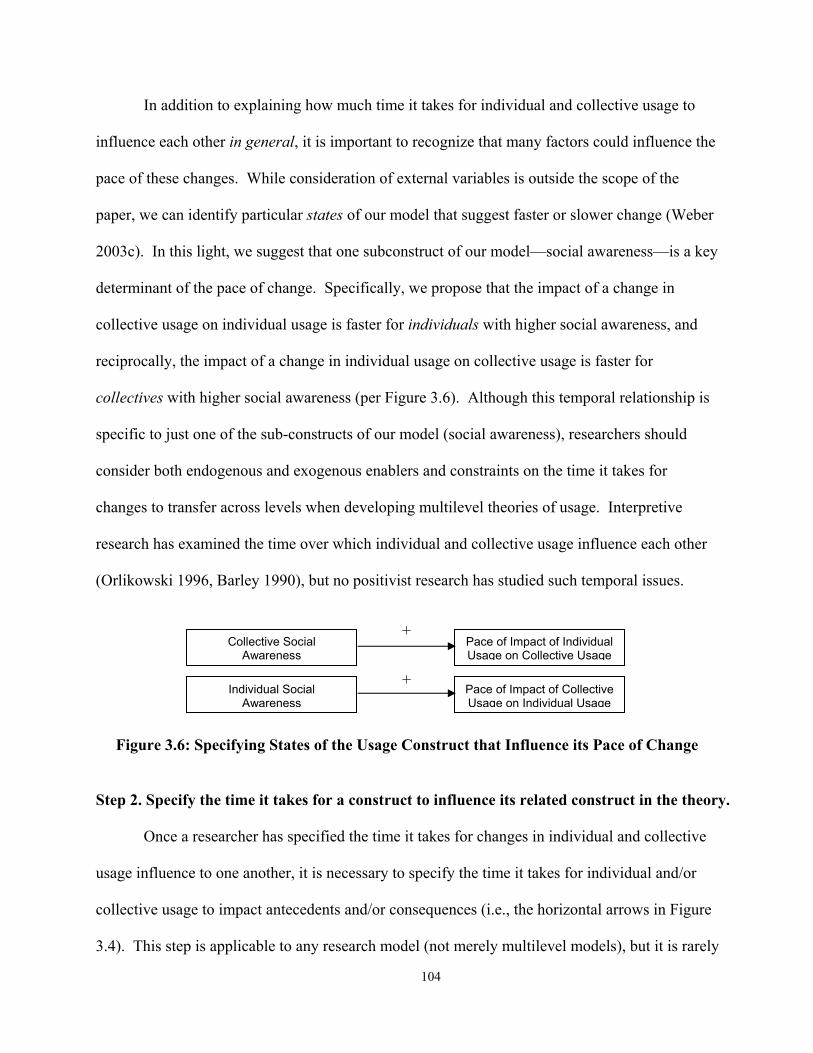
104
In addition to explaining how much time it takes for individual and collective usage to
influence each other in general, it is important to recognize that many factors could influence the
pace of these changes. While consideration of external variables is outside the scope of the
paper, we can identify particular states of our model that suggest faster or slower change (Weber
2003c). In this light, we suggest that one subconstruct of our model—social awareness—is a key
determinant of the pace of change. Specifically, we propose that the impact of a change in
collective usage on individual usage is faster for individuals with higher social awareness, and
reciprocally, the impact of a change in individual usage on collective usage is faster for
collectives with higher social awareness (per Figure 3.6). Although this temporal relationship is
specific to just one of the sub-constructs of our model (social awareness), researchers should
consider both endogenous and exogenous enablers and constraints on the time it takes for
changes to transfer across levels when developing multilevel theories of usage. Interpretive
research has examined the time over which individual and collective usage influence each other
(Orlikowski 1996, Barley 1990), but no positivist research has studied such temporal issues.
Figure 3.6: Specifying States of the Usage Construct that Influence its Pace of Change
Step 2. Specify the time it takes for a construct to influence its related construct in the theory.
Once a researcher has specified the time it takes for changes in individual and collective
usage influence to one another, it is necessary to specify the time it takes for individual and/or
collective usage to impact antecedents and/or consequences (i.e., the horizontal arrows in Figure
3.4). This step is applicable to any research model (not merely multilevel models), but it is rarely
Collective Social Awareness
Pace of Impact of Individual Usage on Collective Usage
Individual Social Awareness
Pace of Impact of Collective Usage on Individual Usage
+
+
105
undertaken (Mitchell and James 2001). Just as in Step 1, various external factors could affect the
time it takes for usage to influence performance, but we limit our attention to factors already in
the model. Specifically, of the three subconstructs used to measure effective usage in Figure 3.5,
we expect that a longer period will be needed to observe the impact of technology adaptation on
task performance than to observe the benefits of increased transparent interaction and social
awareness. As a result, as researchers increase the period over which they observes the
relationship between effective usage and task performance, we expect that the benefit of
technology adaptation on performance will become more salient (Figure 3.7). This follows
March’s (1991) theory that exploitation alone can improve performance in the short run, but that
exploration is needed over the long run. Following Mitchell and James (2001), we suggest that
the effect of time on the strength of the relationship between technology adaptation and task
performance is best viewed in relation to the time over which the change in the independent
variable (i.e., the “adaptation”) is said to occur. In other words, we suggest that it may often be
reasonable for a user (or researcher) to consider small adaptations to be part of a larger
“adaptation” that the user undertakes over time. Small technology adaptations may have small
impacts, but by helping a user to learn over time, a sequence of small adaptations may allow the
individual user or collective to realize broader, more general adaptations that engender more
certain benefits (Gallivan et al. 1994). Of course, this has a crucial implication: because the
benefits of adaptations are noticeable over longer periods, cross-sectional research and brief
longitudinal research will systematically understate the benefit of technology adaptations on
performance.32
32 This constitutes the basis for Karsten’s (1999) critique of the groupware implementation literature. She argues that the period studied in most research was too short for any changes in behavioral routines or performance to be observed.
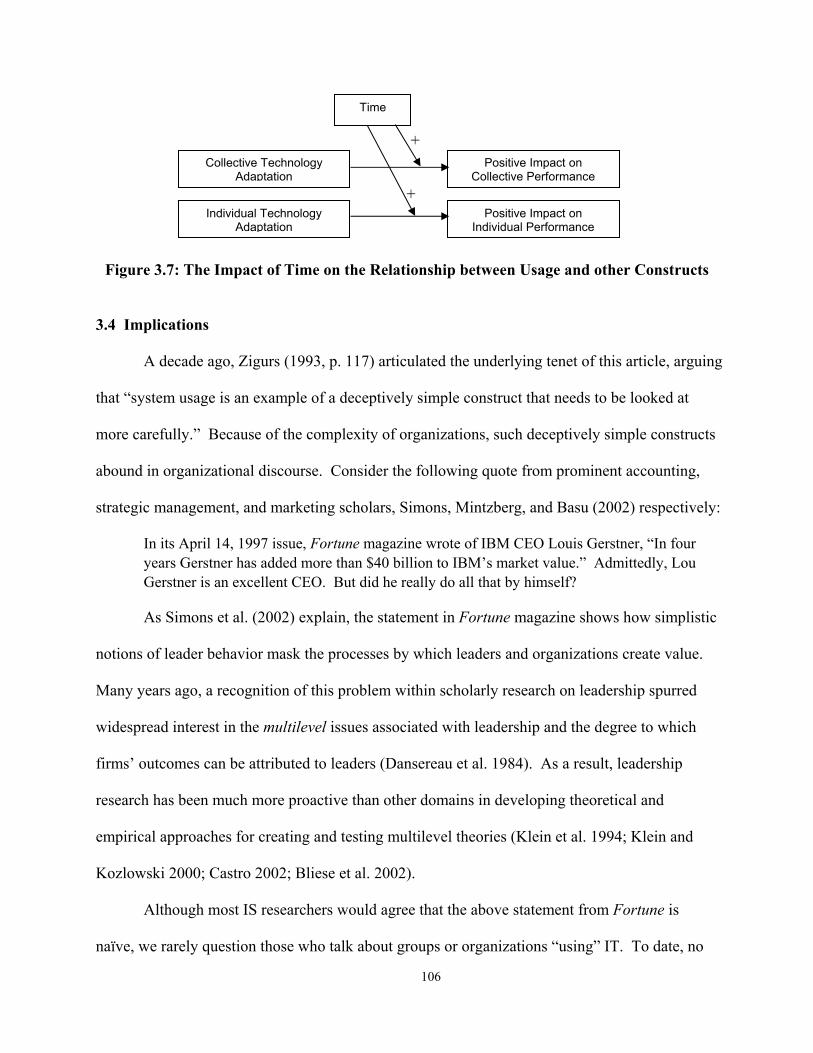
106
Figure 3.7: The Impact of Time on the Relationship between Usage and other Constructs
3.4 Implications
A decade ago, Zigurs (1993, p. 117) articulated the underlying tenet of this article, arguing
that “system usage is an example of a deceptively simple construct that needs to be looked at
more carefully.” Because of the complexity of organizations, such deceptively simple constructs
abound in organizational discourse. Consider the following quote from prominent accounting,
strategic management, and marketing scholars, Simons, Mintzberg, and Basu (2002) respectively:
In its April 14, 1997 issue, Fortune magazine wrote of IBM CEO Louis Gerstner, “In four years Gerstner has added more than $40 billion to IBM’s market value.” Admittedly, Lou Gerstner is an excellent CEO. But did he really do all that by himself?
As Simons et al. (2002) explain, the statement in Fortune magazine shows how simplistic
notions of leader behavior mask the processes by which leaders and organizations create value.
Many years ago, a recognition of this problem within scholarly research on leadership spurred
widespread interest in the multilevel issues associated with leadership and the degree to which
firms’ outcomes can be attributed to leaders (Dansereau et al. 1984). As a result, leadership
research has been much more proactive than other domains in developing theoretical and
empirical approaches for creating and testing multilevel theories (Klein et al. 1994; Klein and
Kozlowski 2000; Castro 2002; Bliese et al. 2002).
Although most IS researchers would agree that the above statement from Fortune is
naïve, we rarely question those who talk about groups or organizations “using” IT. To date, no
Collective Technology Adaptation
Positive Impact on Collective Performance
Individual Technology Adaptation
Positive Impact on Individual Performance
Time
+
+

107
positivist studies and only a few interpretive studies have examined system usage from a
multilevel perspective. However, if Deveraj and Kohli (2003) are correct in stating that system
usage is the missing link between IT investments and organizational outcomes, then it is
incumbent on researchers to begin identifying what collective system usage means and how
collectives such as organizations and groups really “use” systems. We can observe a significant
amount of single-level research on system usage (at an individual, group, and organizational
level; see Appendix 3A), but the linkages between these levels remains totally unexplored. The
steps, principles, and illustrations in this paper offer a first step towards investigating these
linkages and developing a deeper, more integrated understanding of what system usage in groups
and organizations means and how system usage impacts downstream consequences across levels
and over time.
We are not the first IS researchers to recognize the need for multilevel research. Chan
(2000) called for researchers to undertake multilevel research on IT impacts, Walczuch and
Watson (2001) called for more precise analysis of multilevel data in GSS research, and Robey
and Boudreau (2000) encouraged researchers to conduct multilevel studies to resolve conflicting
empirical results. A decade ago, Harris (1994) even suggested that multilevel research was the
key to understanding the organizational impacts from IT. Despite such calls, Chan (2000) found
that IS researchers have been unwilling to move beyond single-level models (see Ang et al. 2002
for one exception). As Rousseau (1985) observed, it was understandable to conduct single-level
research in the past because multilevel principles were immature. However, there is now a
significant and mature body of multilevel research with accepted practices for theory building,
research design, and data analysis, that is now well accepted in organizational research (Klein et
al. 2000; Klein et al. 1999; Klein et al. 1994).
We see four key implications for future research on system usage that stem from adopting

108
a multilevel perspective: 1) improving conceptions of the structure of usage by avoiding errors of
inclusion and exclusion, 2) improving studies of the function of usage by examining cross-level
paradoxes, 3) deepening insights into the IT artifact by conceptualizing “systems” in new ways,
and 4) improving methodological techniques for undertaking and evaluating multilevel research.
First, in relation to the structure of usage, a strong benefit of a multilevel perspective is
that it highlights key errors of inclusion and exclusion in past research. Errors of inclusion occur
when researchers create a measure of collective usage (e.g., by aggregating individual use, or by
asking a key informant about others’ use in their group or organization) but do not verify that
collective usage actually exists. Our research points to the need for both qualitative and
quantitative researchers to present evidence that they are not committing errors of inclusion by
inappropriately employing measures of collective usage in their studies. Despite the importance
of errors of inclusion, errors of exclusion appear even more prevalent because no prior positivist
studies have used measures of configural usage. We believe that configural usage should be the
most dominant form of describing and measuring collective use, certainly from a structural
perspective and often from a functional perspective. The reason for this is that, as we have
argued, system usage cannot be global. Moreover, in order for system usage in a collective to be
shared, it must meet two separate prerequisites, which we claim are rarely met: there must be
homogeneity both across group members at a given point in time and consistency within group
members over time. It is difficult for us to identify any system usage behavior that would be
sufficiently regular to meet these two prerequisites and thus, constitute shared usage. In the
absence of being global or shared, collective system usage must either be configural or a fallacy.
If configural system usage is the most common form of collective usage, as we propose, it is
clearly of great structural importance (per Table 3.11), as interpretive research has shown
(Mackay 1990, Orlikowski 2000). However, we also believe that it has great functional

109
importance because it will often have a stronger relationship with other constructs than shared
usage, which we demonstrated with our proposed model of effective usage and task performance.
Studying the emergence of usage configurations and their influence on other constructs offers rich
opportunities for studying the nature and meaning of system usage in organizations.
In terms of studying the function of usage, a multilevel perspective provides a way to
identify new research streams. For example, many interesting issues in organizations occur
when effects at one level lead to no effect or an opposite effect at another level (Goodman 2000).
We touched on such cross-level paradoxes in our model of effective system usage. Specifically,
because patterns of effective usage can be enacted across members, changes in individual usage
practices can improve individual performance (e.g., by increasing individual technology
adaptation) but they may reduce or have no effect on collective performance if the individual’s
enactments move the collective further away from an ideal pattern of collective technology
adaptation. As we indicated in footnote 30, the fact that benefits that occur at the individual or
collective level may have no effect or a reverse effect at other levels is a general issue that arises
because individual and organizational interests and practices are not always aligned (Goodman
2000). Further development of our proposed model and other multilevel models of usage offers
fruitful avenues for understanding such cross-level paradoxes as well as other unintended
outcomes of using IT in organizations (Markus and Robey 2004; Robey and Boudreau 2000).
A third implication of the multilevel perspective is that it reveals new ways to think about
IS artifacts. As Orlikowski and Iacono (2001) protested, too many studies in IS insufficiently
theorize the IS artifact. Researchers at all levels of analysis could study the IS artifact in more
depth, but multilevel research offers a unique way to reach insights about one important aspect of
systems: the degree to which systems can be considered in aggregate terms as one considers the
usage construct at a higher level of analysis. To elucidate this point, we have advanced
110
principles for aggregating system usage; other recent research has advanced principles for
aggregating innovations or systems (Fichman 2000). We believe that these two sets of principles
are highly complementary and that IS research would profit from extending these so that they do
not merely support studies of collective and configural usage of single systems, but collections
and configurations of systems. Such research would not only provide a deeper understanding of
system usage, it would also enable researchers to obtain deeper understanding of IS artifacts by
identifying how organizations achieve the necessary integration and coordination of IS artifacts
and usage practices to be able to use their “portfolios” of systems effectively (Zmud 2001).
A final implication is that there are great opportunities for IS researchers to identify new
empirical techniques for undertaking and evaluating multilevel research. For example, because
organizations contain many embedded levels of analysis and may themselves be contained
within higher levels, such as networks and industries (Rousseau 1985), researchers must
carefully judge the relevant span of levels over which a theory and data set apply. For example,
a researcher who studies GSS usage in virtual teams may be unable to (i) obtain accurate
measures of system usage at each level (dyad, group, local team, global team) if there are too
many levels, or (ii) obtain accurate measures at any one level if the size of the team is too large.
Thus, researchers should avoid two common errors. First, they should avoid studying levels too
far apart (e.g., the organization and individual level within a large organization). In such studies,
too many unobserved levels (e.g., workgroup or department levels) may dissipate and distort the
links between individual and collective constructs and render it difficult to determine if and how
collective constructs emerge. Second, researchers should avoid studying a phenomenon at too
broad a level (i.e., at a level with too many members). In such studies, relevant subgroups may
be overlooked and the validity of collective constructs may be compromised (Chan 1998).
Like Arrow et al. (2000), we are aware that it is onerous to avoid these types of

111
conceptual errors and conduct precise multilevel research, but we consider these difficulties to be
opportunities for research and practice, rather than problems to be avoided. Interpretive studies
have shown that multilevel theories can offer deep insights into how organizations work (Barley
1990). A multilevel perspective opens up exciting new directions for research on the antecedents
and consequences of system usage and it invites researchers and practitioners to begin new
discourses about the meaning of system usage, how organizational-level usage can be achieved,
and how organizations can improve their use of systems in practice.
Certainly, many multilevel principles need to be refined, such as principles for defining
construct validity for collective constructs (Chen et al. 2004; Hofmann and Jones 2004).
However, researchers must be aware that this does not mean that multilevel research is any less
rigorous than single-level research. In fact, the principles in this paper apply equally to single-
level studies, because researchers who study phenomena at a single level (whether at the
individual or collective level) must ensure that they control for the common fallacies found in
single-level research (per Appendix 3B). Furthermore, no matter how rigorous one’s research
design and data analysis, single-level studies cannot make reliable generalizations beyond that
level. Thus, the results of single-level studies are often of little value to practitioners who need to
make interventions at multiple levels. For example, a firm may wish to determine employees’
perceptions of and usage of a new discussion database. Single-level studies may find that
employees use the system frequently and, thus, claim the system a success. Group- or
community-level studies may find that few discussions occur, no ongoing communities emerge,
and thus judge the system a failure. Only explicitly multilevel studies can resolve such
apparently conflicting results (Goodman 2000). Multilevel approaches increase rigor by
requiring researchers to specify how constructs emerge at the level at which they are being
studied, and they enhance relevance by enabling broader, more integrated generalizations.

112
3.5 Conclusion
This paper advocates a multilevel perspective on system usage that integrates conceptions
of system usage at an individual and collective level and highlights the need for research on the
linkages between levels of analysis and the processes by which system usage leads to
downstream consequences. In doing so, we provided detailed steps for building multilevel
theories of system usage, devised principles for supporting each step, and provided a concrete
example of how such research could be undertaken within the context of a specific, actionable
theory of effective system usage. Although systems usage has been a key variable in IS research
since the 1970’s (DeLone and McLean 1992), it has received surprisingly few theoretical
assessments. Furthermore, the theoretical conceptualizations of usage that have been offered at
different levels of analysis show little to no integration. The principles that we advance in this
paper for studying system usage are designed as an initial platform to support research that can
explicitly bridge the gaps across levels of analysis that have been noted in past research (Chan
2000). Many prior studies have found inconsistent results for the organizational impact of IT
(Heine et al. 2003; Markus and Robey 1988). Most studies, however, have been constrained to a
single level of analysis. We contend that such single-level studies are destined to miss the
important effects of usage and impacts that emerge across levels of analysis and over time. By
providing a set of multilevel principles and a concrete, theoretically-grounded specification for
the way in which system usage emerges, stabilizes, and changes over time, empirical researchers
should be able to study the relationship between system usage and downstream outcomes from
IT more effectively. A multilevel approach appears to be a promising way to resolve conflicting
results from past studies, obtain rich insights into the nature and use of IT in organizations, and
increase the rigor and relevance of IS research.
113
Appendix 3A: Conceptualizations of Usage in Past Research
In our review of the system usage literature, we found that most researchers choose
measures based on their availability in past studies rather than a theoretical basis. Theoretical
descriptions of the system usage construct are extremely rare. Figure 3A.1 illustrates four
conceptualizations that have been offered: an individual-level information-processing model
(Barkin and Dickson, 1977), a group-level appropriation model (DeSanctis and Poole 1994), an
organizational-level diffusion model (Cooper and Zmud 1990), and a multi-level enactment
model (Orlikowski 2000).
At an individual level, some have used Barkin and Dickson’s (1977) information
processing model of usage. However, as Trice and Treacy (1986) noted, most researchers just
select from among the many available measures of usage. Table 3A.1 illustrates the diversity of
individual usage measures that have been employed, including 14 primary usage measures and
many minor variants.
At a group level, Dennis et al. (2001)explain that researchers have used two approaches
to conceptualizing usage: an instrumental approach in which usage is assumed to be
unproblematic, and an appropriation approach in which the features chosen by users depend
heavily on contextual factors and the process is assumed to be more complex (Griffith 1999).
The primary theoretical conceptualization of appropriation is DeSanctis and Poole’s (1994)
adaptive structuration theory.
At an organizational level, Zmud et al. (Cooper and Zmud 1990; Jasperson et al. 2005;
Kwon and Zmud 1987; Massetti and Zmud 1996; Saga and Zmud 1994) emphasize “depth” of
usage. Depth of usage is normally treated as a dependent variable. Various facets of depth
include acceptance (staff begin using the IS), routinization (staff use the IS as a normal work
activity), and infusion (staff use the IS extensively to integrate or redefine tasks) (Saga and Zmud

114
1994). The level of analysis in all of these cases is the organization or work-group, but measures
of infusion at an individual level of analysis have recently been developed (Meister and
Compeau 2002).
Finally, theorists of practice have conceptualized usage in a richly multilevel fashion
(Lassila and Brancheau 1999; Webster 1998). (e.g., Orlikowski 2000). Orlikowski’s (2000)
model provides the exemplar, which characterizes different forms of usage as inertia,
application, or change.
Researchers at each level have called for better conceptualizations of usage, e.g., DeLone
and McLean (2003) at an individual level, Gopal and Prasad (2000) and Dennis et al. (2001) at a
group level, Lucas (1993) and McKeen and Smith (1993) at an organizational level, and Lassila
and Brancheau (1999) and Orlikowski (2000) in theories of practice.
Figure 3A.1: Conceptualizations of System Usage across Levels of Analysis
Adapted from Barkin and Dickson (1977) Adapted from DeSanctis and Poole (1994)
Adapted from Cooper and Zmud (1990)
Individual Level of Analysis Group Level of Analysis
Organizational Level of Analysis Multiple Level of Analysis
Human Information Processing
System Usage Data
Selection
Appropriation (Usage) of Structure • Appropriation moves • Faithfulness of appropriation • Instrumental use • Attitude toward appropriation
Level of Usage 1. Acceptance 2. Routinization 3. Infusion (incl. extended use,
integrative use, emergent use)
Structure: Technology-in-Practice (Rules & Resources Instantiated in Use)
Agency: Ongoing, Situated IT usage:
Inertia/Application/Change
Adapted from Orlikowski (2000)
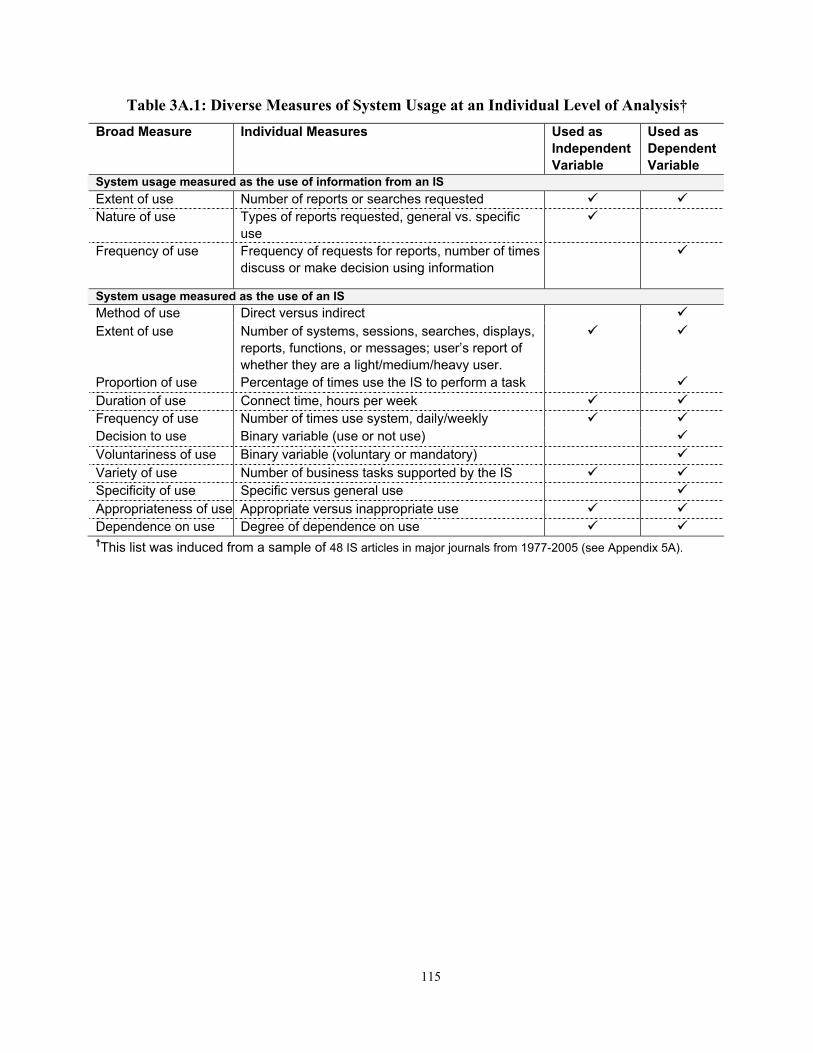
115
Table 3A.1: Diverse Measures of System Usage at an Individual Level of Analysis† Broad Measure Individual Measures Used as
Independent Variable
Used as Dependent Variable
System usage measured as the use of information from an IS Extent of use Number of reports or searches requested Nature of use Types of reports requested, general vs. specific
use
Frequency of use Frequency of requests for reports, number of times discuss or make decision using information
System usage measured as the use of an IS Method of use Direct versus indirect Extent of use Number of systems, sessions, searches, displays,
reports, functions, or messages; user’s report of whether they are a light/medium/heavy user.
Proportion of use Percentage of times use the IS to perform a task Duration of use Connect time, hours per week Frequency of use Number of times use system, daily/weekly Decision to use Binary variable (use or not use) Voluntariness of use Binary variable (voluntary or mandatory) Variety of use Number of business tasks supported by the IS Specificity of use Specific versus general use Appropriateness of use Appropriate versus inappropriate use Dependence on use Degree of dependence on use
†This list was induced from a sample of 48 IS articles in major journals from 1977-2005 (see Appendix 5A).
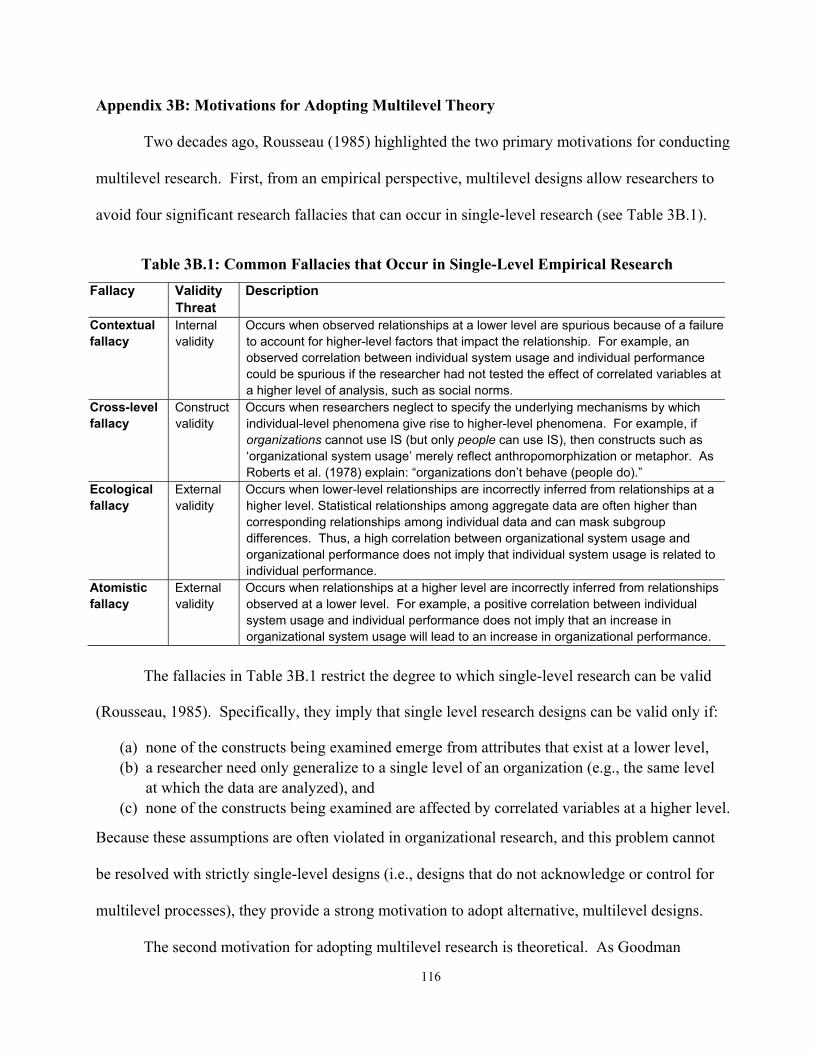
116
Appendix 3B: Motivations for Adopting Multilevel Theory
Two decades ago, Rousseau (1985) highlighted the two primary motivations for conducting
multilevel research. First, from an empirical perspective, multilevel designs allow researchers to
avoid four significant research fallacies that can occur in single-level research (see Table 3B.1).
Table 3B.1: Common Fallacies that Occur in Single-Level Empirical Research
Fallacy Validity Threat
Description
Contextual fallacy
Internal validity
Occurs when observed relationships at a lower level are spurious because of a failure to account for higher-level factors that impact the relationship. For example, an observed correlation between individual system usage and individual performance could be spurious if the researcher had not tested the effect of correlated variables at a higher level of analysis, such as social norms.
Cross-level fallacy
Construct validity
Occurs when researchers neglect to specify the underlying mechanisms by which individual-level phenomena give rise to higher-level phenomena. For example, if organizations cannot use IS (but only people can use IS), then constructs such as ‘organizational system usage’ merely reflect anthropomorphization or metaphor. As Roberts et al. (1978) explain: “organizations don’t behave (people do).”
Ecological fallacy
External validity
Occurs when lower-level relationships are incorrectly inferred from relationships at a higher level. Statistical relationships among aggregate data are often higher than corresponding relationships among individual data and can mask subgroup differences. Thus, a high correlation between organizational system usage and organizational performance does not imply that individual system usage is related to individual performance.
Atomistic fallacy
External validity
Occurs when relationships at a higher level are incorrectly inferred from relationships observed at a lower level. For example, a positive correlation between individual system usage and individual performance does not imply that an increase in organizational system usage will lead to an increase in organizational performance.
The fallacies in Table 3B.1 restrict the degree to which single-level research can be valid
(Rousseau, 1985). Specifically, they imply that single level research designs can be valid only if:
(a) none of the constructs being examined emerge from attributes that exist at a lower level, (b) a researcher need only generalize to a single level of an organization (e.g., the same level
at which the data are analyzed), and (c) none of the constructs being examined are affected by correlated variables at a higher level.
Because these assumptions are often violated in organizational research, and this problem cannot
be resolved with strictly single-level designs (i.e., designs that do not acknowledge or control for
multilevel processes), they provide a strong motivation to adopt alternative, multilevel designs.
The second motivation for adopting multilevel research is theoretical. As Goodman
117
(2000, p. 6-7) observes: “Our research, how we train each new generation of researchers, and our
professional associations display a clear level bias, that is, we tend to focus on one level of
analysis and implicitly make assumptions about the relations between the focal unit and other
units of analysis.” Recognition of this bias suggests two benefits of multilevel theory. First,
multilevel theory opens up new research directions. Specifically, it suggests that research is
needed to understand the linkages between levels of analysis. For example, Kozlowski and
Klein (2000, p. 76) observe: “How individual cognition, affect, behavior, and other
characteristics emerge to make contributions to group and organizational outcomes is largely an
unchartered frontier.” Second, multilevel theory can contribute towards organization-specific
theories. As Rousseau (1985) suggests, the reason why most researchers adopt single-level
theories is because they were trained in a reference discipline that traditionally operates at a
single level of analysis (e.g., psychology, sociology, or economics). Consequently, multilevel
theorizing offers an opportunity to create theories that contribute to a deeper understanding of
organizations, rather than merely a deeper understanding of phenomena studied by reference
disciplines that happen to exist in organizations, as House et al. (1995) explain:
... organizational researchers will never be better than psychologists at understanding individuals in general, better than economists at studying large-scale market forces, nor better than sociologists at studying social forces. Only an organizational science can address effectively the complexities of the relationships between the units at different levels of analysis that comprise organizations (p. 74-75) (emphasis in original). As Rousseau (1985) noted, the limitations of single-level research have been known for
many years, but alternative multilevel designs were not initially feasible, in part, due to a lack of
accepted statistical and methodological procedures. These two motivations for adopting
multilevel theories—empirical and theoretical—spurred a considerable amount of research on
multilevel techniques (Raudenbush and Bryk 2002, Klein et al. 1994, 1999), to the point that
now multilevel theories are not only desirable, but also feasible (Klein and Kozlowski 2000).

118
Chapter 4
A Multilevel Investigation of the Relationship Between System
Usage and Task Performance33
Abstract
System usage is one of the most widely implemented constructs in information systems research. Yet, to date, the difference between individual and collective system usage, and the links between system usage and its downstream consequences across levels of analysis have not been studied. The present study addresses these gaps by investigating the multilevel character of the relationship between system usage and task performance. The study focuses on three aspects of this multilevel relationship: context, structure, and cross-level relationships.
In relation to context, we propose that collectives are inherently different from mere collections of individuals and, as a result, when the usage-performance relationship is aggregated from the individual level to the collective level, the strength of the relationship differs when the individuals studied are in real collectives versus “nominal” collectives (i.e., mere collections of independent individuals). In relation to structure, we submit that collective usage is more than the sum of individual usage because it comprises interdependencies that occur among members’ usage, and propose that these interdependencies influence collective performance. Finally, in relation to cross-level relationships, we propose that aspects of collective usage influence individual usage and individual performance.
We test these propositions through an experiment in which 34 nominal groups (comprising 116 individuals) and 139 groups (comprising 517 individuals) used spreadsheet software to perform financial analysis tasks. The results confirm the importance of context, structure, and cross-level relationships, and reveal important new directions for research on what it means to use systems and how systems lead to consequences across levels of analysis.
Keywords: information system usage, multilevel theory, cross-level relationship, IT impacts, IS success, performance, measures, validation.
33 Burton-Jones, A., and Straub, D. "A Multilevel Investigation of the Relationship Between System Usage and Task Performance," Working paper, Department of Computer Information Systems, Georgia State University, 2005.
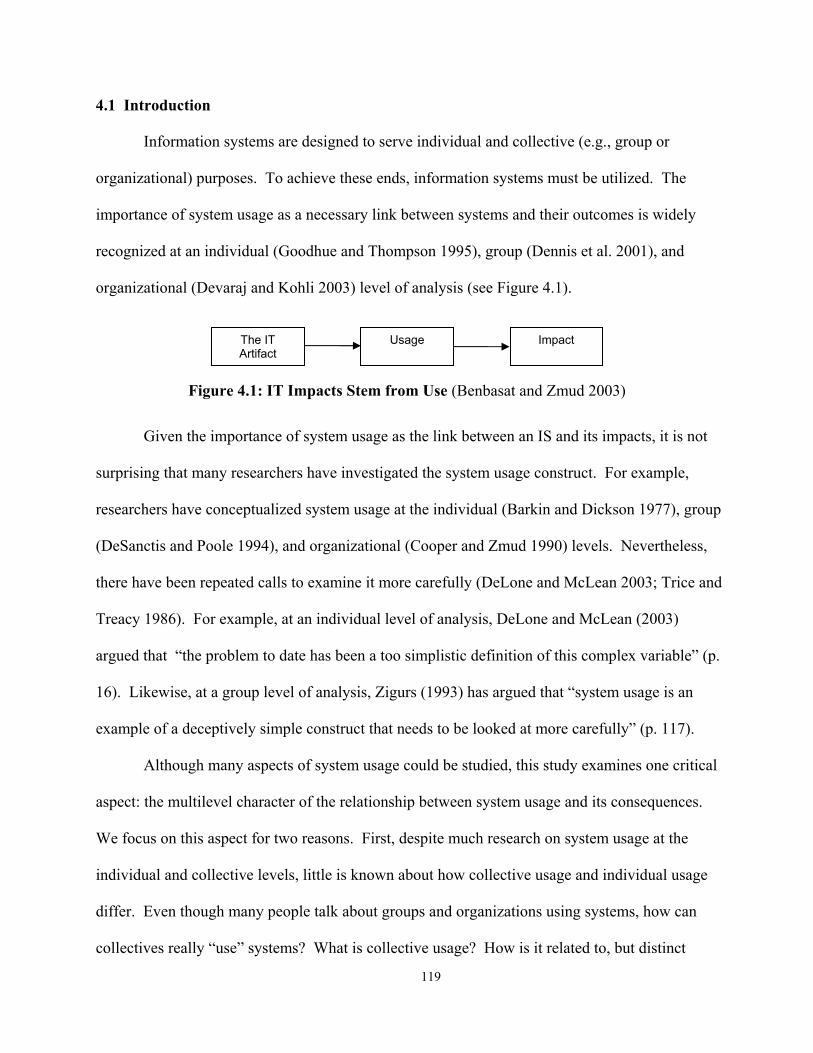
119
4.1 Introduction
Information systems are designed to serve individual and collective (e.g., group or
organizational) purposes. To achieve these ends, information systems must be utilized. The
importance of system usage as a necessary link between systems and their outcomes is widely
recognized at an individual (Goodhue and Thompson 1995), group (Dennis et al. 2001), and
organizational (Devaraj and Kohli 2003) level of analysis (see Figure 4.1).
Figure 4.1: IT Impacts Stem from Use (Benbasat and Zmud 2003)
Given the importance of system usage as the link between an IS and its impacts, it is not
surprising that many researchers have investigated the system usage construct. For example,
researchers have conceptualized system usage at the individual (Barkin and Dickson 1977), group
(DeSanctis and Poole 1994), and organizational (Cooper and Zmud 1990) levels. Nevertheless,
there have been repeated calls to examine it more carefully (DeLone and McLean 2003; Trice and
Treacy 1986). For example, at an individual level of analysis, DeLone and McLean (2003)
argued that “the problem to date has been a too simplistic definition of this complex variable” (p.
16). Likewise, at a group level of analysis, Zigurs (1993) has argued that “system usage is an
example of a deceptively simple construct that needs to be looked at more carefully” (p. 117).
Although many aspects of system usage could be studied, this study examines one critical
aspect: the multilevel character of the relationship between system usage and its consequences.
We focus on this aspect for two reasons. First, despite much research on system usage at the
individual and collective levels, little is known about how collective usage and individual usage
differ. Even though many people talk about groups and organizations using systems, how can
collectives really “use” systems? What is collective usage? How is it related to, but distinct
The IT Artifact
Usage Impact

120
from, individual usage? With the exception of one recent conceptual study (Burton-Jones and
Gallivan 2004) (i.e., Chapter 3), these questions remain unanswered. To date, most researchers at
the group and organizational levels have created measures of collective usage that are separate
from and not explicitly connected to measures of usage at lower levels of analysis (Cooper and
Zmud 1990; DeSanctis and Poole 1994; Zhu and Kraemer 2005). Others have measured
collective usage by aggregating measures of individual usage to the collective level (e.g., via
sums or means) (Devaraj and Kohli 2003; Easley et al. 2003). There has been no discussion to
date of which of these schemes, if either, is appropriate.
In addition to there being no research on the difference between the usage construct at
different levels of analysis, there has been no empirical research on the multilevel relationships
between usage and its consequences such as performance. Several researchers have called for
research to understand how IT use leads to performance outcomes both up and down levels of
analysis (Chan 2000; Devaraj and Kohli 2000; Harris 1994). Nevertheless, researchers have
been unwilling to move from their preferred level of analysis (Chan, 2000). This problem is also
evident in the broader organizational literature. For instance, Kozlowski and Klein (2000) (p.
76) observe: “How individual cognition, affect, behavior, and other characteristics emerge to
make contributions to group and organizational outcomes is largely an unchartered frontier.”
The existence of these gaps in the literature is understandable given that multilevel
theory, methods, and data analysis techniques are so new (Rousseau 1985). Nevertheless, the
past decade has witnessed great progress in multilevel research and data analysis (Klein et al.
1999; Klein et al. 1994; Raudenbush and Bryk 2002), to the point that rigorous multilevel studies
are now feasible (Goodman 2000; Klein and Kozlowski 2000).
We are certainly not the first to investigate multilevel aspects of system usage.
Interpretive researchers have long studied how properties of collectives influence individual and
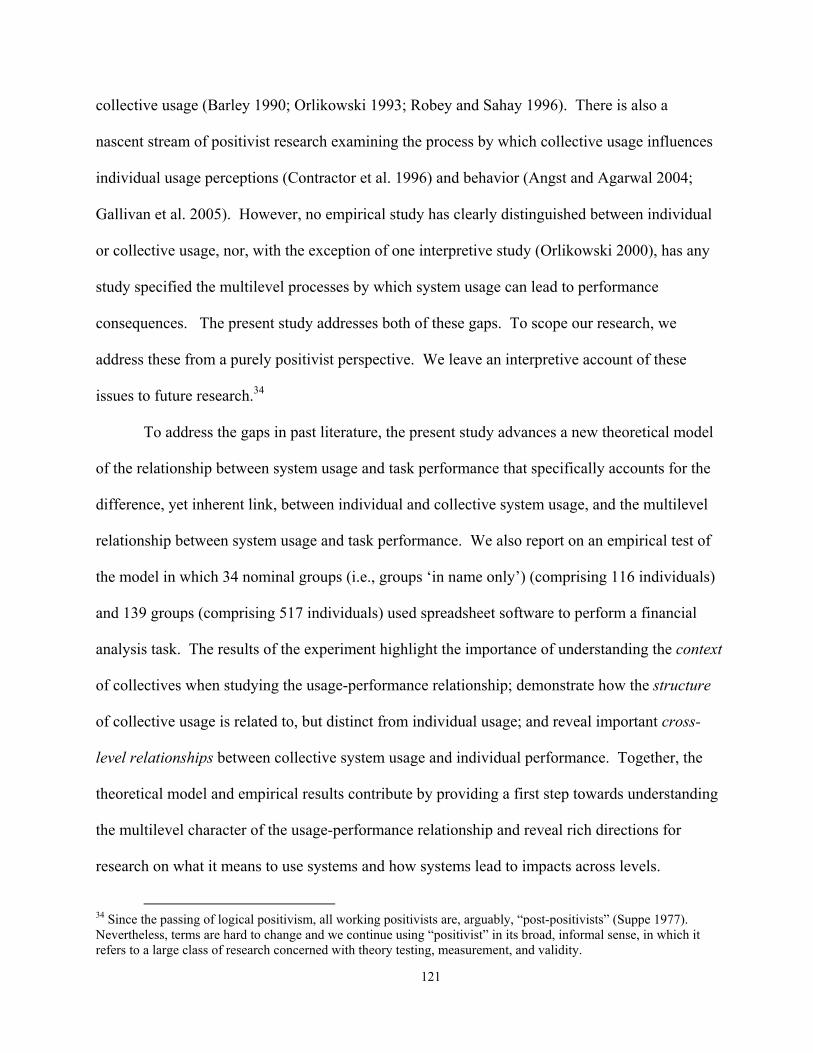
121
collective usage (Barley 1990; Orlikowski 1993; Robey and Sahay 1996). There is also a
nascent stream of positivist research examining the process by which collective usage influences
individual usage perceptions (Contractor et al. 1996) and behavior (Angst and Agarwal 2004;
Gallivan et al. 2005). However, no empirical study has clearly distinguished between individual
or collective usage, nor, with the exception of one interpretive study (Orlikowski 2000), has any
study specified the multilevel processes by which system usage can lead to performance
consequences. The present study addresses both of these gaps. To scope our research, we
address these from a purely positivist perspective. We leave an interpretive account of these
issues to future research.34
To address the gaps in past literature, the present study advances a new theoretical model
of the relationship between system usage and task performance that specifically accounts for the
difference, yet inherent link, between individual and collective system usage, and the multilevel
relationship between system usage and task performance. We also report on an empirical test of
the model in which 34 nominal groups (i.e., groups ‘in name only’) (comprising 116 individuals)
and 139 groups (comprising 517 individuals) used spreadsheet software to perform a financial
analysis task. The results of the experiment highlight the importance of understanding the context
of collectives when studying the usage-performance relationship; demonstrate how the structure
of collective usage is related to, but distinct from individual usage; and reveal important cross-
level relationships between collective system usage and individual performance. Together, the
theoretical model and empirical results contribute by providing a first step towards understanding
the multilevel character of the usage-performance relationship and reveal rich directions for
research on what it means to use systems and how systems lead to impacts across levels.
34 Since the passing of logical positivism, all working positivists are, arguably, “post-positivists” (Suppe 1977). Nevertheless, terms are hard to change and we continue using “positivist” in its broad, informal sense, in which it refers to a large class of research concerned with theory testing, measurement, and validity.

122
4.2 Building a Multilevel Model of System Usage and Task Performance
We build a multilevel model of system usage and task performance in four steps. First,
we build a baseline model, theorizing the relationship between individual system usage and
individual task performance. Second, we investigate the effect of studying this relationship in
different contexts, i.e., among independent individuals, collections of individuals, or collectives.
Third, we extend this baseline model by examining how the structure of collective usage differs
from that of individual usage. Finally, we extend the model by positing cross-level relationships
between collective usage, individual usage, and individual task performance.
4.2.1 System Usage and Task Performance: A Baseline, Individual-Level Model
We adopt our baseline model from an existing study (Burton-Jones and Straub 2004) (i.e.,
Chapter 2). System usage is conceived as an activity that involves three elements: (1) a user, i.e.,
the subject using the system, (2) a system, i.e., the object being used, and (3) a task, i.e., the
function being performed. Drawing on assumptions regarding each of these elements, we define
system usage as: a user’s employment of one or more features of a system to perform a task.35
This definition enables us to distinguish between individual and collective usage, i.e., individual
usage is where the user is an individual person; collective usage is where the user is a collective.
Burton-Jones and Straub (2004) suggest that researchers explain the link between system
usage and other constructs by selecting elements of usage that are relevant in the theoretical
context (i.e., system, user, and/or task) and by selecting measures of these elements that tie to the
other constructs in the model. Using this procedure requires that we first define the other
35 Our assumptions regarding each element of usage are as follows (per Burton-Jones and Straub 2004): • A user is a social actor. This implies that users are individuals or collectives who are using a system to
perform one or more aspects of their task(s) (Lamb and Kling 2003). • A system is an artifact that provides representations of one or more task domains. This implies that the system
offers features designed to support aspects of those task domains (DeSanctis and Poole 1994; Griffith 1999). • A task is a goal directed activity performed by an individual or collective. This implies that task outputs can
be assessed in terms of pre-defined task requirements (Zigurs and Buckland 1998).
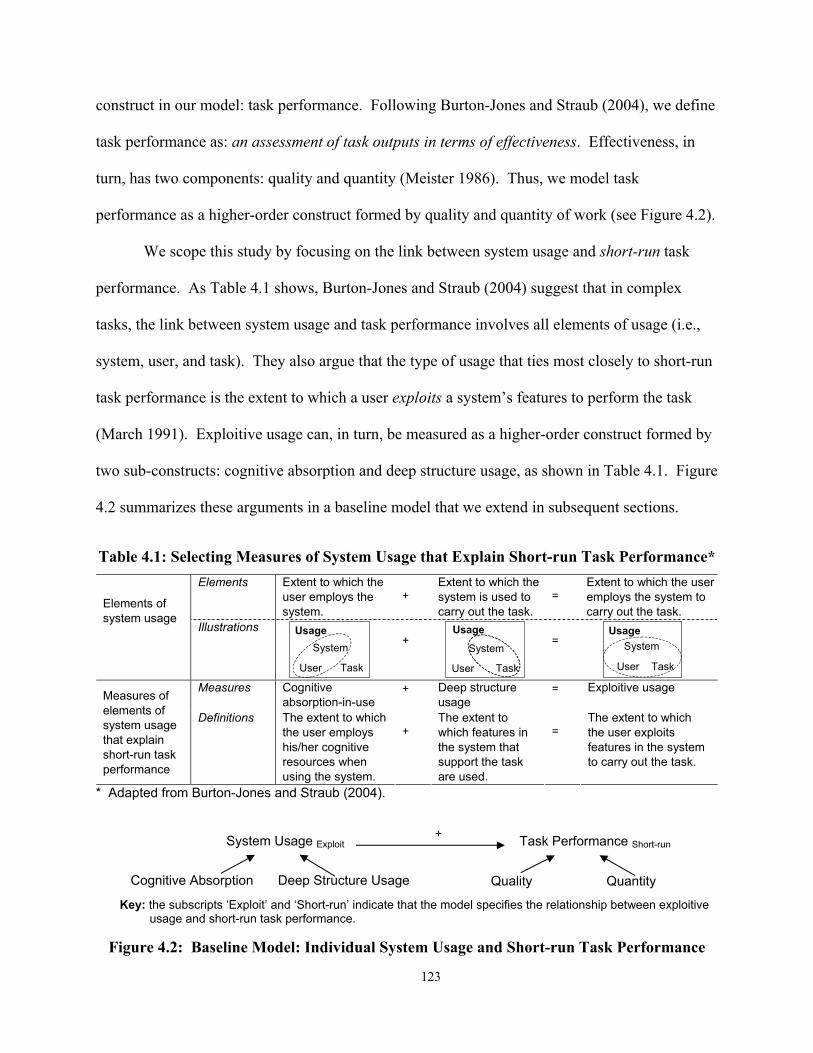
123
construct in our model: task performance. Following Burton-Jones and Straub (2004), we define
task performance as: an assessment of task outputs in terms of effectiveness. Effectiveness, in
turn, has two components: quality and quantity (Meister 1986). Thus, we model task
performance as a higher-order construct formed by quality and quantity of work (see Figure 4.2).
We scope this study by focusing on the link between system usage and short-run task
performance. As Table 4.1 shows, Burton-Jones and Straub (2004) suggest that in complex
tasks, the link between system usage and task performance involves all elements of usage (i.e.,
system, user, and task). They also argue that the type of usage that ties most closely to short-run
task performance is the extent to which a user exploits a system’s features to perform the task
(March 1991). Exploitive usage can, in turn, be measured as a higher-order construct formed by
two sub-constructs: cognitive absorption and deep structure usage, as shown in Table 4.1. Figure
4.2 summarizes these arguments in a baseline model that we extend in subsequent sections.
Table 4.1: Selecting Measures of System Usage that Explain Short-run Task Performance*
Elements Extent to which the user employs the system.
+
Extent to which the system is used to carry out the task.
=
Extent to which the user employs the system to carry out the task.
Elements of system usage
Illustrations
+
=
Measures Cognitive absorption-in-use
+ Deep structure usage
= Exploitive usage
Measures of elements of system usage that explain short-run task performance
Definitions The extent to which the user employs his/her cognitive resources when using the system.
+
The extent to which features in the system that support the task are used.
=
The extent to which the user exploits features in the system to carry out the task.
* Adapted from Burton-Jones and Straub (2004).
Key: the subscripts ‘Exploit’ and ‘Short-run’ indicate that the model specifies the relationship between exploitive
usage and short-run task performance.
Figure 4.2: Baseline Model: Individual System Usage and Short-run Task Performance
Usage
User
System
Task
Usage
User
System
Task
Usage
User
System
Task
System Usage Exploit Task Performance Short-run
Cognitive Absorption Deep Structure Usage
+
Quality Quantity

124
4.2.2 Studying the Baseline Model: The Importance of Context
The proposed baseline model is restricted to the individual level. Thus, it is only a valid
model for contexts in which individuals use systems independently of each other (Rousseau
1985). Nonetheless, it can be extended to support studies in other contexts. Figure 4.3 provides
a summary of what contexts can be studied, how the model would need to be extended in these
contexts, and the degree to which inferences could be made from results in these contexts.
Context of Population
Independent Individuals
Collectives of Individuals
Individual level
Analysis is appropriate.
Inferences are valid at the individual level, but not the collective level.
Need to extend the baseline model to account for cross-level effects.
Inferences are valid at the individual
level, but not the collective level.
Level of Analysis
Collective level
Analysis is inappropriate.
Inferences are invalid at the collective and individual levels.
Need to extend the baseline model to account for the structure of collective
constructs.
Inferences are valid at the collective level, but not the individual level.
Figure 4.3: Studying the Proposed Baseline Model in Different Contexts
Quadrant 1 (Figure 4.3) illustrates the default case for studying the baseline model. In
this context, inferences can be drawn from the model to the individual level of analysis only.
Quadrant 2 (Figure 4.3) reflects a context in which individuals use a system as part of a
collective. Here, the baseline model would need to be extended to account for contextual effects,
else an observed relationship between usage and performance at the individual level may be
spuriously caused by a correlated omitted variable at a higher level (Rousseau, 1985).36 In this
context, researchers must also limit their inferences to the individual level. This is because results
at the individual level will not necessarily reflect those at the collective level (Klein et al. 1994).
36 Another reason to control for contextual effects is due to statistics. Ordinary least-squares estimation assumes that residuals among errors are independent. This assumption is typically violated when individuals are subject to group influences, leading to biased parameter estimates, and increased type-1 error (Raudenbush and Bryk 2002).
1.
3.
2.
4.

125
Quadrant 3 (Figure 4.3) reflects a context in which the population comprises independent
individuals, but the researcher aggregates measures to the collective level. This may seem
illogical, but it could easily occur. For example, a researcher studying a consulting firm may be
told that consulting teams employ software to collectively track the performance of engagements.
However, in practice, consultants may not use the IS in the intended way, e.g., consultants may use
the system independently (e.g., tracking individual tasks), not as a team (e.g., not pooling each
member’s work outputs to track the team’s overall performance). If the researcher failed to verify
the way teams actually used the IS, s/he may incorrectly aggregate the individual level measures to
the team level. By so doing, the researcher would obtain measures of “nominal” teams (i.e., teams
in name only). As Figure 4.3 shows, it would be illogical here to make inferences to the collective
level. Nor could a researcher infer any findings back to the individual level, because collective-
level relationships will not necessarily reflect those at an individual level (Klein et al. 1994).
Finally, quadrant 4 (Figure 4.3) reflects a context in which individuals use systems within
collectives and the researcher analyzes data at the collective level. In this context, the model
would need to be extended to ensure that it reflects the structure of the collective constructs. If
this was done, the researcher could make inferences at the collective level, but again, s/he could
not make inferences from the collective-level data to the individual level (Klein et al. 1994).
In summary, the baseline model needs to be extended in two main ways: (1) by specifying
the structure of collective constructs, and (2) by accounting for cross-level effects. We discuss
these below. Before doing so, it is necessary to highlight the importance of context when
aggregating data. One way to measure collective usage in past research has been to aggregate
measures of individual usage to the collective level (e.g., via sums or means) (Devaraj and Kohli
2003; Easley et al. 2003). As noted above, individual usage should only be aggregated to the
collective level if collective usage actually exists. A failure to verify whether collective usage

126
exists can have an empirical as well as a theoretical implication. This is because the strength of an
individual-level X-Y relationship can change when aggregated to the collective level, with the
direction of change depending on the nature of the true X-Y relationship and the degree of within-
group homogeneity in the population (Robinson 1950; Rousseau 1985). To illustrate, Figure 4.4
shows a hypothetical, positive, X-Y relationship at an individual-level. As Figure 4.4 shows, if
groups are relatively homogenous in terms of the measures variables, aggregating the individual-
level measures to the group-level results in a stronger relationship than found at the individual
level (i.e., same slope with lower variance), but if groups are heterogeneous in terms of the
measured variables, aggregating the measures results in no relationship between the constructs.
Type of Group Individual-level Data Aggregated Data Estimated Relationship
Aggregated individual data (homogeneous
groups):
Individual-level Data
Aggregated individual data
(heterogeneous groups):
Figure 4.4: Example of Aggregating Data in Homogeneous vs. Heterogeneous Groups
Clearly, the example in Figure 4.4 could be simulated with different groupings and data;
the point is that relationships can change when aggregating data from the individual to collective
level, with the direction of the change being influenced by the nature of the collectives. This is
important in practice because collectives often have higher degrees of homogeneity among
members than found among random individuals in a population, resulting in relationships among
aggregated data often being higher than corresponding relationships at an individual level
(Robinson 1950; Rousseau 1985). Within-group homogeneity tends to occur in collectives for
IV
DV
X
X
X
X
X
X
X
X
X
X
X
X X
X
X
X
X
X
X
X
X
X
X
X
X X X X
X
X
X
X
X
X
X
X
X
X
X
Group 1 Group 2 Group 3
127
two reasons. First, similarity among individuals is a strong predictor of group formation because
individuals tend to be located in space/time near similar individuals and tend to be attracted to
such individuals (Bowers et al. 2000; Thompson and Fine 1999). Second, even if collectives are
designed to be diverse (Bowers et al. 2000; Rodan and Galunic 2004), once formed, interactions
within collectives often reduce individual differences. For example, members learn from each
other (leading to similar knowledge) (Lave and Wenger 1991) and influence each other (leading
to similar behaviors and beliefs) (Cialdini and Goldstein 2004), as studies in the usage literature
show (Angst and Agarwal 2004; Gallivan et al. 2005). Of course, members of real collectives
will not always be more homogeneous than random individuals, e.g., within-group conflict may
decrease within-group homogeneity. Rather, our argument is simply that real collectives will
have systematically different levels of homogeneity among members than found among random
individuals. As a result, we expect that X-Y relationships aggregated to the collective level will
differ when data come from real collectives (e.g., quadrant 4, Figure 4.3) than from nominal
collectives (e.g., quadrant 3, Figure 4.3). We empirically test this prediction later in the paper.
4.2.3 Extending the Baseline Model: The Structure of Collective Usage and Performance
To study the usage-performance link at the collective level, researchers must not only
verify the context of the users, but must account for the structure of the collective constructs. Past
researchers have measured collective system usage by aggregating individual-level usage (e.g., via
sums or means) (Devaraj and Kohli 2003; Easley et al. 2003), or setting individual usage aside and
creating distinct group- or organizational-level measures (Cooper and Zmud 1990; DeSanctis and
Poole 1994). From the perspective of collective constructs, both approaches are problematic.
Measures of collective system usage that merely aggregate individual use implicitly assume that a
collective is the sum of its parts. Measures of collective system usage that do not draw upon
individual usage implicitly assume that usage can occur without individual users.

128
How can system usage and task performance differ in structure across levels of analysis?
Morgeson and Hofmann (1999) suggest that the difference between individual and collective
constructs can be understood in terms of their function and structure. The function of a construct
is what it explains. This is often the same at each level of analysis. For example, in our
theoretical model, usage at each level of analysis is expected to have a functional relationship
with task performance. The structure of a construct is its composition. This generally differs
across levels. For example, in our theoretical model, the structure of usage and performance
differ across levels. Morgeson and Hofmann (1999) suggest that the difference in structure
stems from the collective construct comprising the interactions among individuals. In other
words, the “whole is more than the sum of its parts.” Hofmann (2002) provides an example:
“Individual ability allows individuals to receive, process, and respond to information in the external environment. It is perhaps self-evident that teams and organizations are also able to receive, interpret, and process information…. The functional outcomes of individual, team, and organizational ability are the same…. Clearly, however, the structure of this ability changes when moving from individuals to some larger collective. The structure of individual ability refers to scripts, schema, and other cognitive and biological factors, whereas the structure of ability for higher-level aggregates not only includes these cognitive and biological factors (since collectives are composed of individuals), but they also involve something more. This something more is the interaction between these individuals” (p. 250). Our basic assumption, therefore, is that the two constructs in the proposed theoretical
model (system usage and task performance) have the same functional relationship at each level
(i.e., a positive relationship of system usage on task performance at the individual and collective
levels), but the structure of the two constructs changes across levels. To determine the structure
of the two constructs at each level, we refer to the original definitions:
• System usage: a user’s employment of one or more features of a system to perform a task. • Task performance: an assessment of task outputs in terms of effectiveness.
We first deal with task performance (see Figure 4.5). Because task performance is an assessment
of outputs, we can assess this output via the same criteria (i.e., quantity and quality) at both the
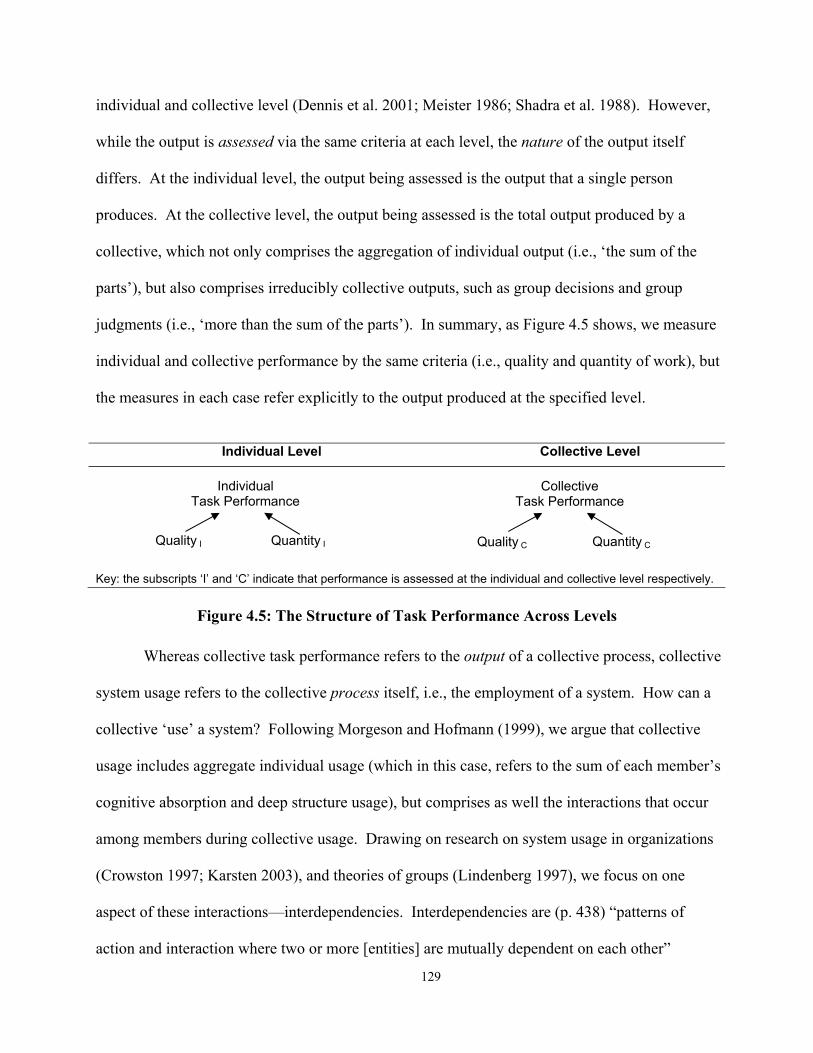
129
individual and collective level (Dennis et al. 2001; Meister 1986; Shadra et al. 1988). However,
while the output is assessed via the same criteria at each level, the nature of the output itself
differs. At the individual level, the output being assessed is the output that a single person
produces. At the collective level, the output being assessed is the total output produced by a
collective, which not only comprises the aggregation of individual output (i.e., ‘the sum of the
parts’), but also comprises irreducibly collective outputs, such as group decisions and group
judgments (i.e., ‘more than the sum of the parts’). In summary, as Figure 4.5 shows, we measure
individual and collective performance by the same criteria (i.e., quality and quantity of work), but
the measures in each case refer explicitly to the output produced at the specified level.
Individual Level Collective Level
Key: the subscripts ‘I’ and ‘C’ indicate that performance is assessed at the individual and collective level respectively.
Figure 4.5: The Structure of Task Performance Across Levels
Whereas collective task performance refers to the output of a collective process, collective
system usage refers to the collective process itself, i.e., the employment of a system. How can a
collective ‘use’ a system? Following Morgeson and Hofmann (1999), we argue that collective
usage includes aggregate individual usage (which in this case, refers to the sum of each member’s
cognitive absorption and deep structure usage), but comprises as well the interactions that occur
among members during collective usage. Drawing on research on system usage in organizations
(Crowston 1997; Karsten 2003), and theories of groups (Lindenberg 1997), we focus on one
aspect of these interactions—interdependencies. Interdependencies are (p. 438) “patterns of
action and interaction where two or more [entities] are mutually dependent on each other”
Individual Task Performance
Quality I Quantity I
Collective Task Performance
Quality C Quantity C
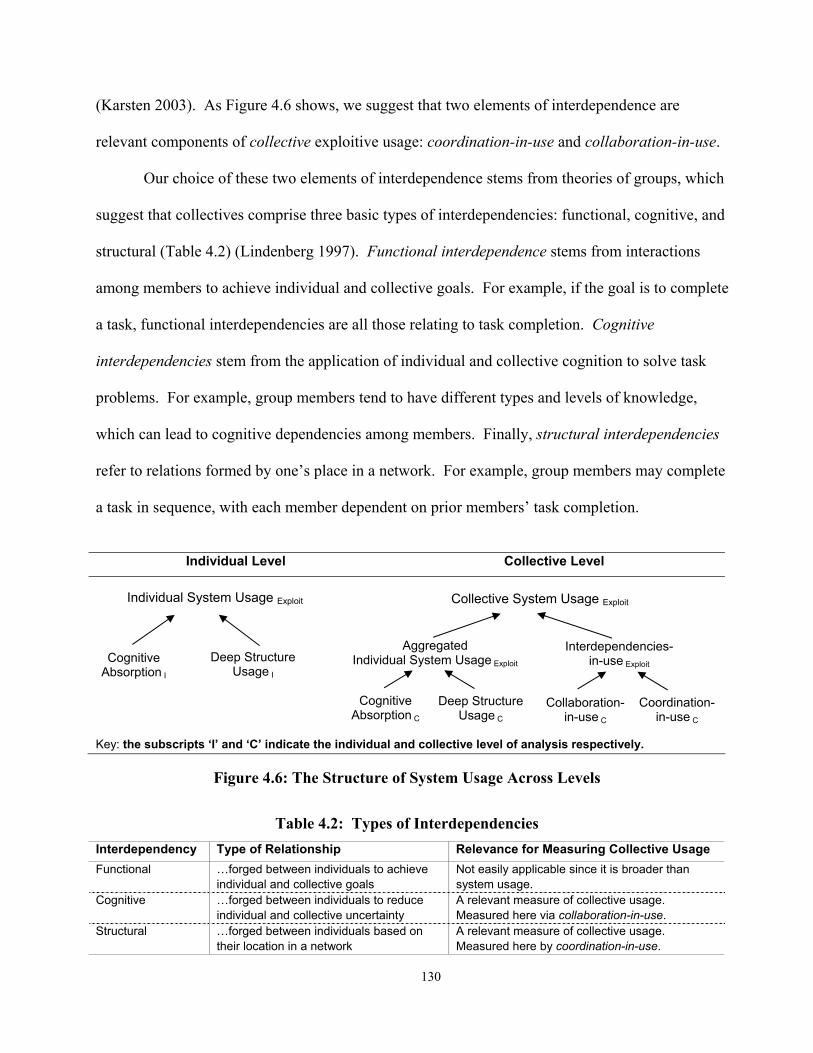
130
(Karsten 2003). As Figure 4.6 shows, we suggest that two elements of interdependence are
relevant components of collective exploitive usage: coordination-in-use and collaboration-in-use.
Our choice of these two elements of interdependence stems from theories of groups, which
suggest that collectives comprise three basic types of interdependencies: functional, cognitive, and
structural (Table 4.2) (Lindenberg 1997). Functional interdependence stems from interactions
among members to achieve individual and collective goals. For example, if the goal is to complete
a task, functional interdependencies are all those relating to task completion. Cognitive
interdependencies stem from the application of individual and collective cognition to solve task
problems. For example, group members tend to have different types and levels of knowledge,
which can lead to cognitive dependencies among members. Finally, structural interdependencies
refer to relations formed by one’s place in a network. For example, group members may complete
a task in sequence, with each member dependent on prior members’ task completion.
Individual Level Collective Level
Key: the subscripts ‘I’ and ‘C’ indicate the individual and collective level of analysis respectively.
Figure 4.6: The Structure of System Usage Across Levels
Table 4.2: Types of Interdependencies
Interdependency Type of Relationship Relevance for Measuring Collective Usage Functional …forged between individuals to achieve
individual and collective goals Not easily applicable since it is broader than system usage.
Cognitive …forged between individuals to reduce individual and collective uncertainty
A relevant measure of collective usage. Measured here via collaboration-in-use.
Structural …forged between individuals based on their location in a network
A relevant measure of collective usage. Measured here by coordination-in-use.
Individual System Usage Exploit
Cognitive Absorption I
Deep Structure Usage I
Collective System Usage Exploit
Aggregated Individual System Usage Exploit
Cognitive Absorption C
Deep Structure Usage C
Collaboration-in-use C
Coordination-in-use C
Interdependencies-in-use Exploit
131
As Table 4.2 indicates, it is important when measuring system usage that researchers
focus only on those interdependencies that occur in-use. As a result, we suggest that functional
interdependencies are too broad a concept for measuring interdependencies-in-use. Although
they are good measures of task interdependence in general, we agree with Lamb and Kling
(2003) that system usage is just one of many activities associated with completing a task. Thus,
we have not conceptualized a measure of functional interdependencies for collective usage.
However, because cognitive and structural interdependencies refer to more specific aspects of
collective interdependence, we can use these to measure interdependence-in-use.
We measure cognitive interdependence via collaboration-in-use (Figure 4.6). Collaboration
refers to cooperation on an intellectual endeavor (Merriam-Webster 2004). Collaboration
emphasizes that collective cognition is social and distributed, not individual and isolated (Borthick
et al. 2003; Halverson 2002; Lamb and Kling 2003; Thompson and Fine 1999). We adapt the
general definition of collaboration to define collaboration-in-use as the extent to which members
share knowledge with fellow members about how to use a system to perform a task. Thus, if one
member does not know how to use a specific feature of an IS, s/he can access knowledge from
another member (Gallivan et al. 2005; Olivera and Straus 2004; Perry 2003). It is desirable, in the
case of our proposed model, to tie collaboration-in-use to “exploitive usage” (Burton-Jones and
Straub 2004). Exploitive usage refers to the application of existing knowledge when using a system
to perform a task. At an individual level, this knowledge resides in one person’s mind, but at the
collective level, it is distributed among the members’ minds. Thus, in collectives, each member is
not limited to applying his/her own knowledge; rather s/he can also apply other members’
knowledge. Collaboration-in-use is the means by which members transfer such knowledge. As a
result, collaboration-in-use increases knowledge available for exploitation. Thus, we suggest that
collaboration-in-use is a necessary element of exploitive usage at the collective level.

132
We measure structural interdependence via coordination-in-use (Figure 4.6). Coordination
refers to the management of dependencies among activities (Crowston 1997; Malone and
Crowston 1994), such as the initial distribution and subsequent transfer of work among members
and the assembly of final outputs. Coordination-in-use refers more specifically to aspects of
coordination that involve system usage, e.g., the transfer of files among members at a time and in a
format required by other members. Again, it is desirable, in the case of our proposed model, to tie
coordination-in-use to exploitive usage. Whereas collaboration refers to one leg of the definition
of exploitive usage (i.e., the “application of knowledge”), coordination refers to the other (i.e.,
“performing the task”). At an individual level, each person performs tasks singly, but in
collectives, the “task” is distributed across members. Although distributing the task in this way
can increases the collective’s productivity (e.g., by reducing the amount of work required of each
member), members must coordinate to produce this collective output (Kraut 2003). Thus, we
suggest that coordination-in-use is a necessary element of exploitive usage at the collective level.
To summarize, the scope of exploitive system usage is limited to the application of a user’s
knowledge when using a system to perform a task (Burton-Jones and Straub 2004). We argue that
when the user is an individual, this scope is bounded by his/her individual cognition and behavior,
but when the user is a collective, this scope is bounded by collective cognition and behavior. Thus,
collaboration-in-use and coordination-in-use are outside the scope (i.e., invalid measures) of
individual usage, but clearly within the scope (i.e., valid measures) of collective usage.
4.2.4 Extending the Baseline Model: Cross Level Relationships
As noted earlier, a second reason that the proposed baseline theoretical model may be
invalid in some contexts is that it does not account for contextual effects, i.e., cross-level
relationships between the collective level and the individual level. Recent studies have examined
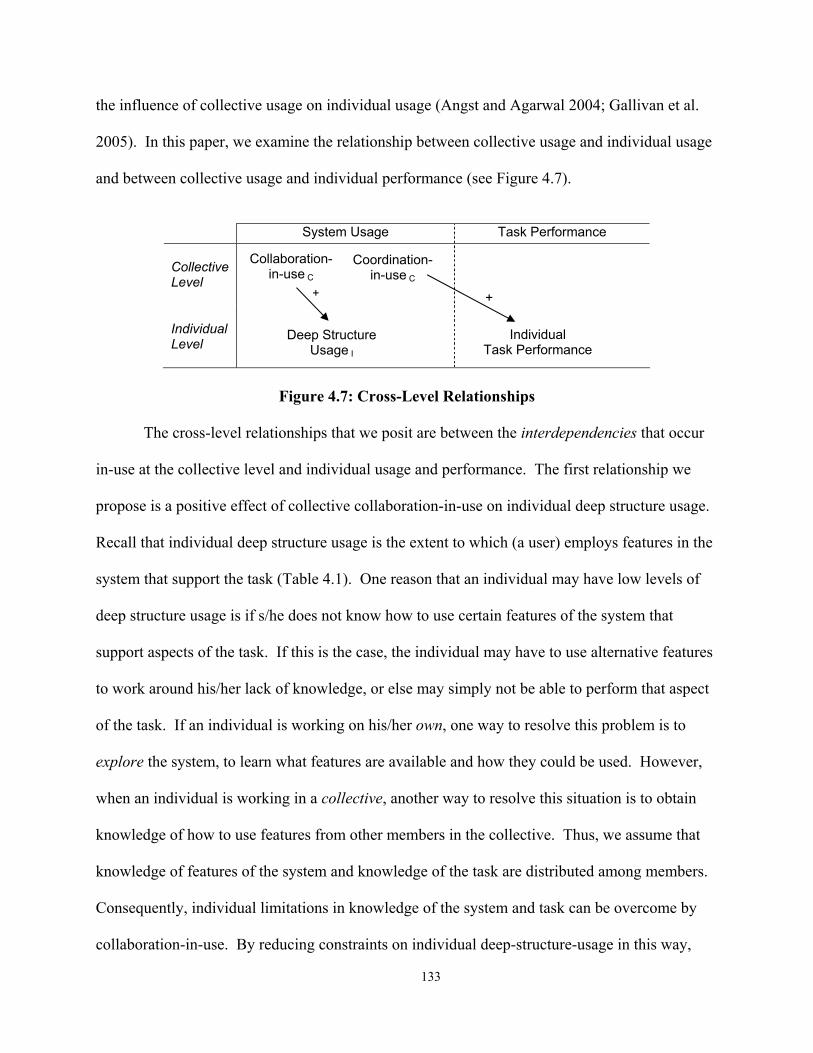
133
the influence of collective usage on individual usage (Angst and Agarwal 2004; Gallivan et al.
2005). In this paper, we examine the relationship between collective usage and individual usage
and between collective usage and individual performance (see Figure 4.7).
System Usage Task Performance
Collective Level
Individual Level
Figure 4.7: Cross-Level Relationships
The cross-level relationships that we posit are between the interdependencies that occur
in-use at the collective level and individual usage and performance. The first relationship we
propose is a positive effect of collective collaboration-in-use on individual deep structure usage.
Recall that individual deep structure usage is the extent to which (a user) employs features in the
system that support the task (Table 4.1). One reason that an individual may have low levels of
deep structure usage is if s/he does not know how to use certain features of the system that
support aspects of the task. If this is the case, the individual may have to use alternative features
to work around his/her lack of knowledge, or else may simply not be able to perform that aspect
of the task. If an individual is working on his/her own, one way to resolve this problem is to
explore the system, to learn what features are available and how they could be used. However,
when an individual is working in a collective, another way to resolve this situation is to obtain
knowledge of how to use features from other members in the collective. Thus, we assume that
knowledge of features of the system and knowledge of the task are distributed among members.
Consequently, individual limitations in knowledge of the system and task can be overcome by
collaboration-in-use. By reducing constraints on individual deep-structure-usage in this way,
Collaboration-in-use C
Coordination- in-use C
Deep Structure Usage I
Individual Task Performance
+ +

134
increased collaboration-in-use should be associated with increases in individual deep structure usage.
As Figure 4.7 shows, the second cross-level relationship proposed is between collective
coordination-in-use and individual task performance. The positive link between coordination and
collective performance is recognized in studies of group system usage. Kraut (2003) explains:
“When coordination is high, a unit of individual work will translate into more team output. Conversely, when coordination is low, the same quality and quantity of individual work will result in less group output” (p. 339).
In addition to coordination-in-use improving collective performance, we propose that it can also
have a direct positive effect on individual performance. This is for two reasons. First,
coordination is necessary for the alignment of goals (Kraut, 2002). That is, coordination helps
each individual understand what s/he needs to achieve to complete his/her portion of a collective
task. This should have a positive effect on individual performance because it increases individual
goal clarity. Goal clarity is a strong predictor of individual task performance (Locke and Latham
1990). Second, coordination is necessary for the alignments of behaviors (Kraut, 2002). In other
words, coordination helps individuals synchronize their behaviors, ensuring that they prepare
work in the time and format required the other members of their collective (Crowston 1997;
Malone and Crowston 1994). When a member obtains his/her task inputs from other members,
the inputs received from these other members serve as an anchor to his/her individual
performance. Coordination-in-use serves to improve this anchor, thereby enabling each
individual to have higher task performance.
4.2.5 An Extended, Multilevel Model of Usage and Performance
Drawing upon the baseline model, and the extensions outlined above, we propose a
multilevel model of the relationship between system usage and task performance (see Figure 4.8).
The model proposes single-level relationships between individual usage and individual
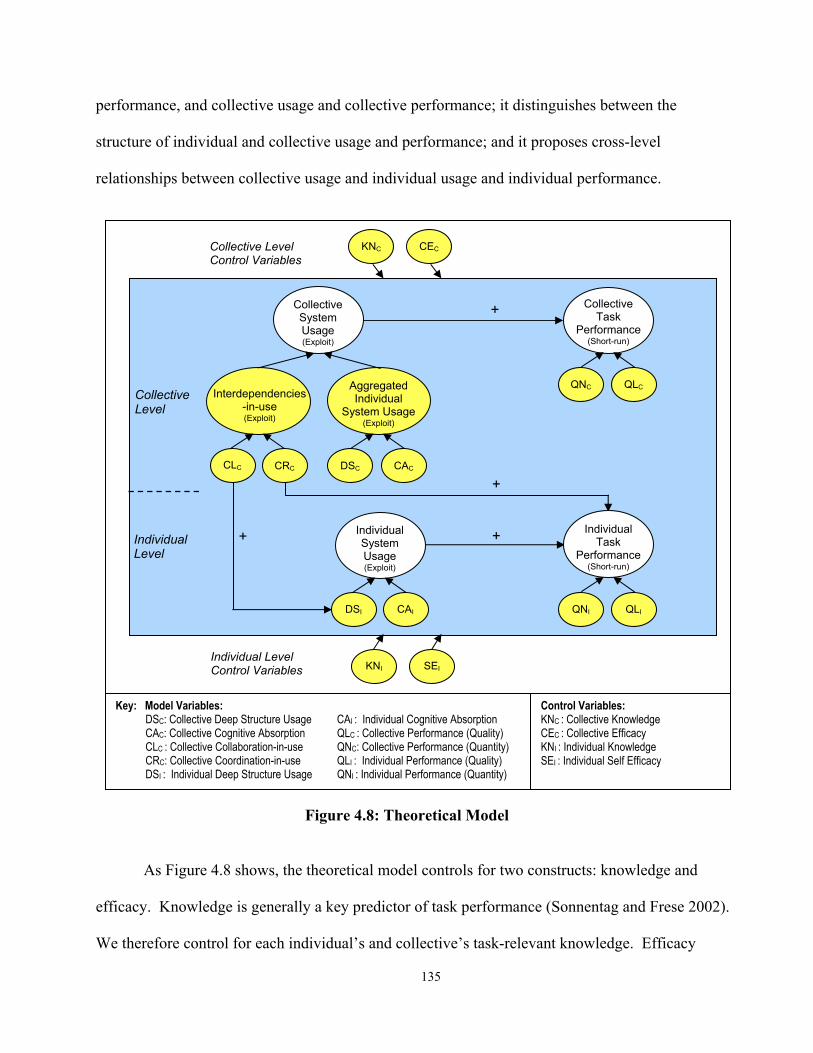
135
performance, and collective usage and collective performance; it distinguishes between the
structure of individual and collective usage and performance; and it proposes cross-level
relationships between collective usage and individual usage and individual performance.
Figure 4.8: Theoretical Model
As Figure 4.8 shows, the theoretical model controls for two constructs: knowledge and
efficacy. Knowledge is generally a key predictor of task performance (Sonnentag and Frese 2002).
We therefore control for each individual’s and collective’s task-relevant knowledge. Efficacy
KNI SEI Individual Level Control Variables
Collective Level Control Variables
KNC CEC
Key: Model Variables: DSC: Collective Deep Structure Usage CAI : Individual Cognitive Absorption CAC: Collective Cognitive Absorption QLC : Collective Performance (Quality) CLC : Collective Collaboration-in-use QNC: Collective Performance (Quantity) CRC: Collective Coordination-in-use QLI : Individual Performance (Quality) DSI : Individual Deep Structure Usage QNI : Individual Performance (Quantity)
Control Variables: KNC : Collective Knowledge CEC : Collective Efficacy KNI : Individual Knowledge SEI : Individual Self Efficacy
+
+
+
+
Individual System Usage (Exploit)
CAI DSI
Collective System Usage (Exploit)
Aggregated Individual
System Usage (Exploit)
CAC DSC CRC CLC
Interdependencies-in-use (Exploit)
Collective Task
Performance (Short-run)
Individual Task
Performance (Short-run)
QLC QNC
QLI QNI
Collective Level
Individual Level

136
refers to beliefs in one’s ability to perform a task (Bandura 1997). It can positively affect
performance at an individual and collective level (Chen et al. 2002). We control for these two
constructs because like Marcolin et al. (2001), we believe that system usage will have a significant
direct effect on task performance over-and-above the effects of knowledge and efficacy-beliefs.
Table 4.3 details our propositions and hypotheses that we use to test this multilevel model.
The propositions map the issues described above, i.e., the baseline model (P1), the important of
context when aggregating (P2), the structure of collective constructs (P3), and cross-level
relationships (P4).
Table 4.3: Propositions and Hypotheses
Issue Proposition Hypothesis Contribution Baseline Model
Individual exploitive system usage has a positive relationship with short run individual task performance.
1. Individual exploitive system usage (formed by cognitive absorption and deep structure usage) has a positive relationship with short-run individual task performance (formed by quantity and quality of work).
Provides a replication of Burton-Jones and Straub (2004)
Context The relationship between aggregated individual exploitive usage and short run task performance depends on the context in which the individuals exist.
2. When data are aggregated to the collective level, the relationship between exploitive system usage (formed by cognitive absorption and deep structure usage) and short-run task performance (formed by quantity and quality of work) differs when the individuals aggregated work independently (e.g., in “nominal” collectives) than in real collectives.
Provides evidence for whether context “matters” when aggregating data from the individual to the collective level.
Structure Collective system usage comprises interdependencies-in-use in addition to the aggregation of members’ individual system usage.
3. Interdependencies-in-use (formed by coordination-in-use and collaboration-in-use) has a positive significant effect on collective short run task performance (formed by collective quantity and quality of work) over and above the positive significant effect of aggregated individual usage (formed by aggregated cognitive absorption and deep structure usage).
Provides evidence for whether collective system usage is more than the sum of its parts.
Cross-level Effects
Elements of collective system usage influence individual short-run task performance and individual system usage.
4a. Collective coordination-in-use has a significant positive effect on short-run individual task performance (formed by quantity and quality of work).
4b. Collective collaboration-in-use has a significant positive effect on individual deep structure usage.
Provides evidence for whether the usage-performance relationship is multilevel in nature.

137
4.3 Research Design
We designed an experiment to test the theoretical model. The ability of experiments to
rule out confounding explanations was critical to this choice, given that this is the first multilevel
investigation of the relationship between usage and task performance (Calder et al. 1981). The
task and technology, sample, procedure, and instrumentation are detailed below.
4.3.1 Task and System
The hypotheses are tested in the context of a spreadsheet-based business analysis case in a
second-level accounting course in a large southern US university. The case required subjects to
determine the lowest cost mortgage to fund an asset purchase (see Appendix 4A). We chose this
task and IS for several reasons. First, it is the same context as studied in Burton-Jones and Straub
(2004), allowing us to replicate their baseline model and reuse their instruments (e.g., by allowing
us to use their scale for deep structure usage, which they tailored for this context). Second,
spreadsheet-based business analysis is an important use of IS in practice (Panko 1998). Third,
most studies on collective use have examined systems designed specifically for collaboration, e.g.,
GSS (DeSanctis and Poole 1994; Karsten 2003). However, in practice, individual productivity
systems such as word processors and spreadsheets are often used individually and collectively
(e.g., when a team of analysts produces a financial report), yet such instances of collective usage
have received far less focus in IS research than studies of “pure” collaboration systems.
4.3.2 Sample
The total sample consisted of 873 individuals in 218 groups of 2 to 5 subjects. Of this
sample, 633 individuals in 173 groups responded to the questionnaire, for a response rate of 72.5%
(see Table 4.4). The average group size was 3.7. The sample comprised students from two
consecutive semesters of the same course offered in 2003 and 2004. Due to practical constraints,
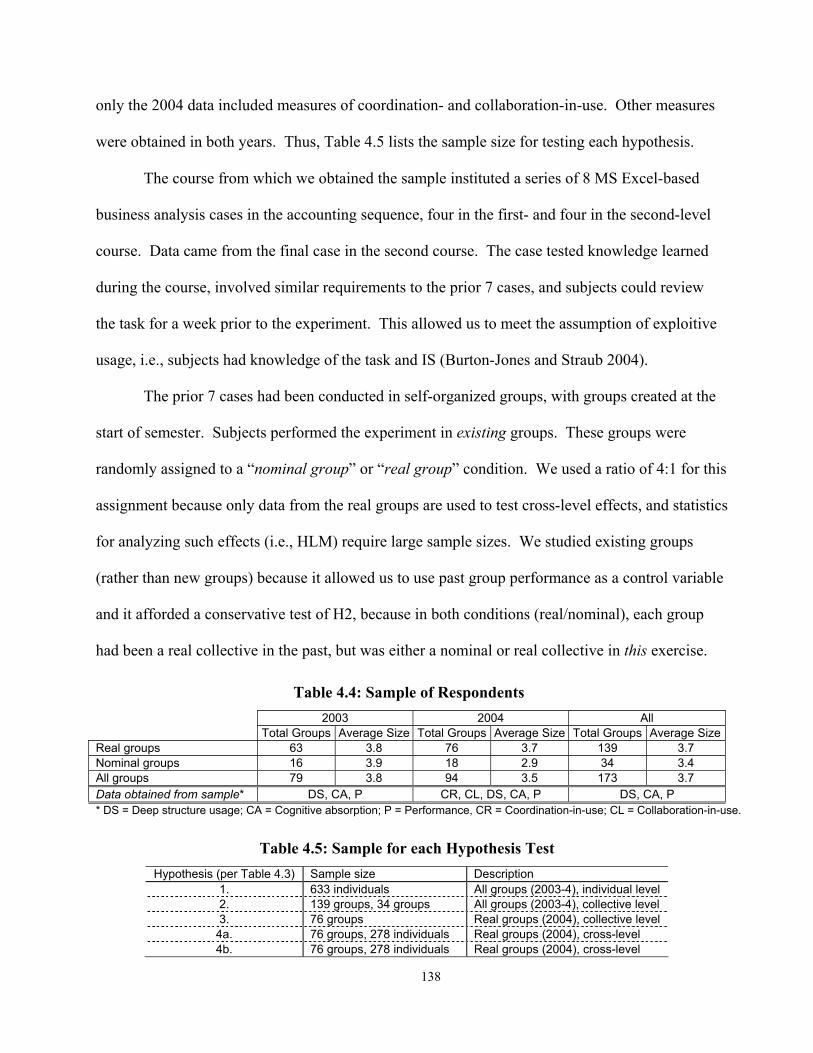
138
only the 2004 data included measures of coordination- and collaboration-in-use. Other measures
were obtained in both years. Thus, Table 4.5 lists the sample size for testing each hypothesis.
The course from which we obtained the sample instituted a series of 8 MS Excel-based
business analysis cases in the accounting sequence, four in the first- and four in the second-level
course. Data came from the final case in the second course. The case tested knowledge learned
during the course, involved similar requirements to the prior 7 cases, and subjects could review
the task for a week prior to the experiment. This allowed us to meet the assumption of exploitive
usage, i.e., subjects had knowledge of the task and IS (Burton-Jones and Straub 2004).
The prior 7 cases had been conducted in self-organized groups, with groups created at the
start of semester. Subjects performed the experiment in existing groups. These groups were
randomly assigned to a “nominal group” or “real group” condition. We used a ratio of 4:1 for this
assignment because only data from the real groups are used to test cross-level effects, and statistics
for analyzing such effects (i.e., HLM) require large sample sizes. We studied existing groups
(rather than new groups) because it allowed us to use past group performance as a control variable
and it afforded a conservative test of H2, because in both conditions (real/nominal), each group
had been a real collective in the past, but was either a nominal or real collective in this exercise.
Table 4.4: Sample of Respondents 2003 2004 All Total Groups Average Size Total Groups Average Size Total Groups Average SizeReal groups 63 3.8 76 3.7 139 3.7 Nominal groups 16 3.9 18 2.9 34 3.4 All groups 79 3.8 94 3.5 173 3.7 Data obtained from sample* DS, CA, P CR, CL, DS, CA, P DS, CA, P * DS = Deep structure usage; CA = Cognitive absorption; P = Performance, CR = Coordination-in-use; CL = Collaboration-in-use.
Table 4.5: Sample for each Hypothesis Test
Hypothesis (per Table 4.3) Sample size Description 1. 633 individuals All groups (2003-4), individual level 2. 139 groups, 34 groups All groups (2003-4), collective level 3. 76 groups Real groups (2004), collective level
4a. 76 groups, 278 individuals Real groups (2004), cross-level 4b. 76 groups, 278 individuals Real groups (2004), cross-level

139
4.3.3 Experimental Procedure and Treatments
Table 4.6 describes the experimental procedure for each treatment. The task required each
group to prepare a spreadsheet comprising 7 worksheets. The experiment was conducted in PC
laboratories supervised by independent proctors. Each group sat together, separated from other
groups, with every student in each group having his/her own PC running MS Excel. Nominal
groups and real groups performed the exercise in different labs. The experiment took 135
minutes, comprising 20 minutes for administration and 115 minutes for the experimental task.
Table 4.6: Experimental Procedure
Instructions Experimental Task (spreadsheet) Questionnaire Sheet 1 Sheet 2 Sheet 3 Sheet 4 Sheet 5 Sheet 6 Sheet 7
Prepare input data
Calculate bonds
15-year schedule
30-year schedule
Findings & sensitivity
Summary report
Group Memo
Nominal Groups
10 mins 115 minutes Work individually
10 mins Work in groups
10mins
Real Groups
10 mins 115 minutes Work in groups with sequential coordination.
Allocation of sheets to members depended on group size (per below)*
10 mins Work in groups
10mins
2: M1 M1 M2 M2 M1 M2 3: M1 M1 M2 M2 M3 M3 4: M1 M2 M3 M3 M1 M4
Group size:
5: M1 M2 M3 M4 M1 M5 * M = member of group; 1..5 = position in group; Arrow = transfer of work.
As Table 4.6 shows, the allocation of tasks depended on the condition (nominal vs. real
group) and group size. In nominal groups, each member performed the first six sheets alone and
members could not help each other. In real groups, each member was randomly allocated 1 or 2
sheets, passed on his/her work to the next member, and members could help each other. In both
conditions, groups worked together to perform the final (7th) sheet. We worked with an
independent course instructor to distribute tasks in real groups in such a way that (a) work was
approximately evenly split among members, and (b) each member’s task had an approximately
equivalent deep structure, allowing us to use the same deep-structure-usage scale for each member.
We ran a small pre-test with four groups of three students to verify that the procedure worked.

140
To distinguish individual and group contributions, each group was given a set of floppy
disks, one for each student, one for the group. Each student was required to save his/her own
work on his/her individual disk, and the group was required to save the final group spreadsheet
(with all 7 sheets) on the group disk. In the real group condition, members transferred their
assigned sheets to each other, in sequence, via the group disk. This allowed each member’s
original work to remain intact on his/her individual disk, while enabling later members to modify
prior members’ work if necessary. This ensured that when asked about individual performance an
individual could still refer to his/her own work, which remained intact on his/her individual disk.
In each condition (nominal and real groups), the manipulation was “do your best.” Thus,
it was up to each individual to determine his/her level of cognitive absorption and deep structure
usage, and in the real group condition, it was up to each group to decide how much to coordinate
and/or collaborate while using the system. Subjects were awarded a small number of bonus
points based on their performance in the exercise. Real groups were told that their grade would
comprise two parts: 50% based on individual performance and 50% based on group performance.
Nominal groups were told that their individual performance determined their grade with a
separate grade for the group’s performance on the final sheet.
4.3.3 Instrumentation
Appendix 4B details instrumentation for each construct. Five constructs were measured at
the individual level: two IVs (cognitive absorption, deep structure usage), the DV (performance),
and two control variables (knowledge and efficacy). We adopted the scales for cognitive
absorption (Agarwal and Karahanna 2000) and deep structure usage from those in Burton-Jones
and Straub (2004). The scale for performance was created afresh. To reduce the size of the
questionnaire, we used a three-item, formative measure, with one item for each dimension
(quality and quantity) and one item for overall performance. Knowledge was measured via a

141
single-item archival measure (performance in the final exam of the course). We used this as a
proxy for individual declarative knowledge, i.e., knowledge of the material covered in the course.
Finally, efficacy was measured with Compeau and Higgins’ (1995) self-efficacy scale, which was
adapted to refer to the nature of the task being performed (Johnson and Marakas 2000).
At the collective level, the theoretical model contains five constructs: four IVs (cognitive
absorption, deep structure usage, coordination-in-use, and collaboration-in-use), the DV
(performance), and two controls (knowledge and efficacy). Three ways to measure such
constructs are: (1) a single, global measure for the entire group (e.g., an independent assessment
of a group’s performance), (2) obtaining responses from each respondent on items defined at the
individual level (e.g., what was your performance?) and aggregating scores to the group level, and
(3) obtaining responses from each respondent on items defined at the group level (e.g., what was
your group’s performance?) and aggregating scores to the group level (Chan 1998; Hofmann
2002). There is no firm rule regarding which approach to use (Kozlowski and Klein 2000).
We adopted the first two approaches to measure collective knowledge: using a single,
global measure to serve as a proxy for each group’s procedural knowledge (an archival measure
of the group’s performance in the previous Excel-based group exercise), and using an aggregation
of each member’s final exam score to serve as a proxy for the group’s declarative knowledge.
We adopted the second approach to measure system usage because the four dimensions of
collective usage originate ‘below’ the group level (in each member’s cognitions and behavior and in
the interactions among members) and we considered that each member would be best qualified to
assess his/her own cognitions and behaviors and the interactions s/he was involved in. Moreover,
defining items at their lowest level allows us to test whether responses are sufficiently homogenous
to aggregate to the collective level (Bliese 2000). Thus, collective deep structure usage and
cognitive absorption were measured via the same scales as at the individual level, and in fact, are
142
just an aggregation of these values. New scales were created for coordination- and collaboration-in-
use, however. These drew upon Hoegl and Gemuenden’s (2001) scale for teamwork quality, which
includes a sub-scale for coordination that we adapted to measure coordination-in-use, and sub-
scales for communication and mutual support that we adapted to measure collaboration-in-use. The
wording was modified in four ways: (1) to be non-evaluative, i.e., to focus on extent, not quality, of
interaction (Burton-Jones and Straub, 2004), (2) to focus on interactions-in-use rather than in-
general (3) to account for the type of collaboration and coordination (i.e., sharing knowledge of
Excel, transferring files), and (4) to allow for the possibility that groups enact configurations of
interaction (Hofmann 2002). In relation to this last point, any interaction involves production and
receipt (giving and receiving). Thus, for coordination- and collaboration-in-use, we use two pairs
of measures to capture each ‘end’ of the interaction, and in the data analysis, test whether there is
sufficient homogeneity in responses to aggregate to the group level.
Finally, we used the third approach to measure collective efficacy and performance. For
collective efficacy, we used the same scale as for the individual level, but specified the collective
level in the item wording (Bandura 2000; Johnson and Marakas 2000). Likewise, we measured
collective performance via the same scale as used for individual performance, but explicitly
denoted the collective level in the items. A potential weakness of self-report performance
measures is that individuals may not have the ability to accurately assess their performance. This
risk was low in this case because participants had received assessment on seven prior cases.
To improve the reliability and validity and of the measures, we used a Q-sort exercise
(Moore and Benbasat 1991). The items were randomized and given to 26 senior students who
were asked to separate the items into bundles for each construct and name each one. Their
feedback supported the validity of the scales (with items placed in the correct bundle, on
average, 77% of the time); minor changes were made to the scales based on their feedback.
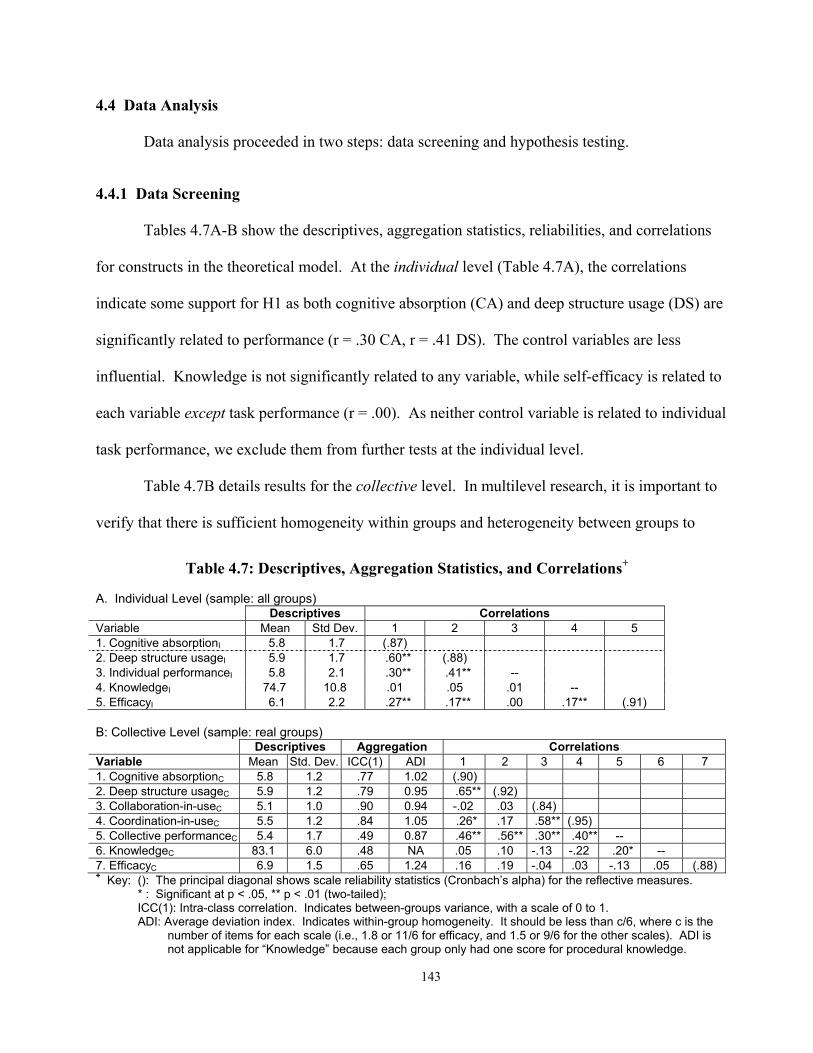
143
4.4 Data Analysis
Data analysis proceeded in two steps: data screening and hypothesis testing.
4.4.1 Data Screening
Tables 4.7A-B show the descriptives, aggregation statistics, reliabilities, and correlations
for constructs in the theoretical model. At the individual level (Table 4.7A), the correlations
indicate some support for H1 as both cognitive absorption (CA) and deep structure usage (DS) are
significantly related to performance (r = .30 CA, r = .41 DS). The control variables are less
influential. Knowledge is not significantly related to any variable, while self-efficacy is related to
each variable except task performance (r = .00). As neither control variable is related to individual
task performance, we exclude them from further tests at the individual level.
Table 4.7B details results for the collective level. In multilevel research, it is important to
verify that there is sufficient homogeneity within groups and heterogeneity between groups to
Table 4.7: Descriptives, Aggregation Statistics, and Correlations+
A. Individual Level (sample: all groups) Descriptives Correlations Variable Mean Std Dev. 1 2 3 4 5 1. Cognitive absorptionI 5.8 1.7 (.87) 2. Deep structure usageI 5.9 1.7 .60** (.88) 3. Individual performanceI 5.8 2.1 .30** .41** -- 4. KnowledgeI 74.7 10.8 .01 .05 .01 -- 5. EfficacyI 6.1 2.2 .27** .17** .00 .17** (.91)
B: Collective Level (sample: real groups) Descriptives Aggregation Correlations Variable Mean Std. Dev. ICC(1) ADI 1 2 3 4 5 6 7 1. Cognitive absorptionC 5.8 1.2 .77 1.02 (.90) 2. Deep structure usageC 5.9 1.2 .79 0.95 .65** (.92) 3. Collaboration-in-useC 5.1 1.0 .90 0.94 -.02 .03 (.84) 4. Coordination-in-useC 5.5 1.2 .84 1.05 .26* .17 .58** (.95) 5. Collective performanceC 5.4 1.7 .49 0.87 .46** .56** .30** .40** -- 6. KnowledgeC 83.1 6.0 .48 NA .05 .10 -.13 -.22 .20* -- 7. EfficacyC 6.9 1.5 .65 1.24 .16 .19 -.04 .03 -.13 .05 (.88) + Key: (): The principal diagonal shows scale reliability statistics (Cronbach’s alpha) for the reflective measures.
* : Significant at p < .05, ** p < .01 (two-tailed); ICC(1): Intra-class correlation. Indicates between-groups variance, with a scale of 0 to 1. ADI: Average deviation index. Indicates within-group homogeneity. It should be less than c/6, where c is the
number of items for each scale (i.e., 1.8 or 11/6 for efficacy, and 1.5 or 9/6 for the other scales). ADI is not applicable for “Knowledge” because each group only had one score for procedural knowledge.
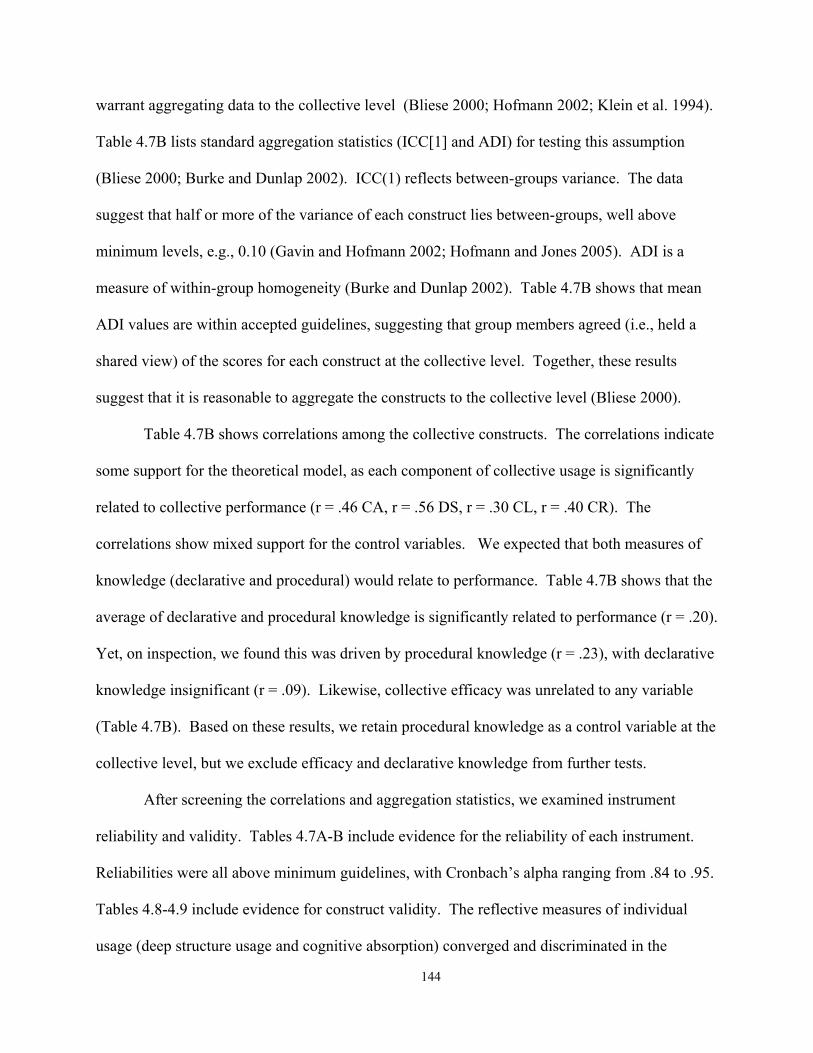
144
warrant aggregating data to the collective level (Bliese 2000; Hofmann 2002; Klein et al. 1994).
Table 4.7B lists standard aggregation statistics (ICC[1] and ADI) for testing this assumption
(Bliese 2000; Burke and Dunlap 2002). ICC(1) reflects between-groups variance. The data
suggest that half or more of the variance of each construct lies between-groups, well above
minimum levels, e.g., 0.10 (Gavin and Hofmann 2002; Hofmann and Jones 2005). ADI is a
measure of within-group homogeneity (Burke and Dunlap 2002). Table 4.7B shows that mean
ADI values are within accepted guidelines, suggesting that group members agreed (i.e., held a
shared view) of the scores for each construct at the collective level. Together, these results
suggest that it is reasonable to aggregate the constructs to the collective level (Bliese 2000).
Table 4.7B shows correlations among the collective constructs. The correlations indicate
some support for the theoretical model, as each component of collective usage is significantly
related to collective performance (r = .46 CA, r = .56 DS, r = .30 CL, r = .40 CR). The
correlations show mixed support for the control variables. We expected that both measures of
knowledge (declarative and procedural) would relate to performance. Table 4.7B shows that the
average of declarative and procedural knowledge is significantly related to performance (r = .20).
Yet, on inspection, we found this was driven by procedural knowledge (r = .23), with declarative
knowledge insignificant (r = .09). Likewise, collective efficacy was unrelated to any variable
(Table 4.7B). Based on these results, we retain procedural knowledge as a control variable at the
collective level, but we exclude efficacy and declarative knowledge from further tests.
After screening the correlations and aggregation statistics, we examined instrument
reliability and validity. Tables 4.7A-B include evidence for the reliability of each instrument.
Reliabilities were all above minimum guidelines, with Cronbach’s alpha ranging from .84 to .95.
Tables 4.8-4.9 include evidence for construct validity. The reflective measures of individual
usage (deep structure usage and cognitive absorption) converged and discriminated in the

145
expected ways (Table 4.8A). So too did the additional usage measures obtained at the collective
level (collaboration-in-use and coordination-in-use) (Table 4.8B).37 Table 4.9 shows evidence for
the validity of the formative measures of individual and collective performance. There is no firm
rule to determine the validity of formative measures (Chin 1998). To verify the validity of these
items, we used PLS-Graph to test the two single-level models that comprised the theoretical
model (i.e., one at the individual level and one at the collective level), and examined the weight of
each formative indicator of performance on the latent construct. As Table 4.9 shows, each
indicator was strongly related to the latent construct, suggesting that each is an important measure
of performance (Chin 1998). Overall, the results for the reflective and formative measures
suggest that the data have adequate reliability and validity to test the hypotheses.
Table 4.8: Convergent and Discriminant Validity for Reflective Measures*
A. Individual level usage measures B. Collective level usage measures CA DS CL CR CA13 .85 .22 CL24 .87 .31 CA16 .80 .28 CL20 .86 -.01 CA19 .79 .29 CL25 .70 .51 CA12 .76 .28 CL21 .60 .42 DS15 .24 .87 CR27 .17 .93 DS14 .25 .85 CR26 .24 .89 DS18 .30 .83 CR22 .22 .89 DS17 .30 .71 CR23 .30 .88 Principal components analysis, Varimax with Kaiser normalization, Converged in 3 iterations.
Principal components analysis, Varimax with Kaiser normalization, Converged in 3 iterations.
* CA: Cognitive absorption; DS: Deep structure usage; CL: Collaboration-in-use, CR: Coordination-in-use; Item numbers reflect the order of the item in the questionnaire (see Appendix 4B).
Table 4.9: Weights of Formative Measures Weight Weight IP7 .80 CP2 .92 IP8 .96 CP3 .97 IP9 .87 CP4 .84
4.4.2 Hypothesis Tests
Table 4.10 summarizes our hypothesis tests. We use two statistical techniques:
37 As an additional test, we used PLS-Graph to examine composite reliabilities, item loadings and cross-loadings, and correlations and the average variance extracted (AVE) for each construct. These results (not shown to conserve space) supported those shown above, providing further assurance that the instrumentation was reliable and valid.
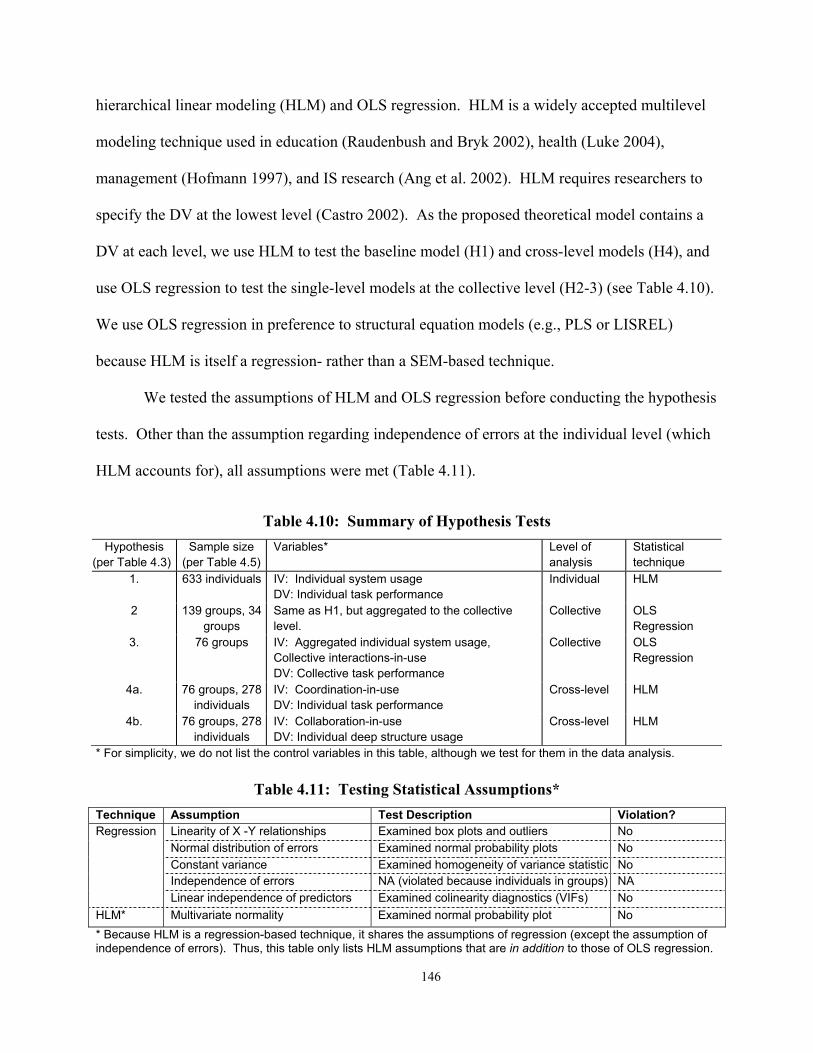
146
hierarchical linear modeling (HLM) and OLS regression. HLM is a widely accepted multilevel
modeling technique used in education (Raudenbush and Bryk 2002), health (Luke 2004),
management (Hofmann 1997), and IS research (Ang et al. 2002). HLM requires researchers to
specify the DV at the lowest level (Castro 2002). As the proposed theoretical model contains a
DV at each level, we use HLM to test the baseline model (H1) and cross-level models (H4), and
use OLS regression to test the single-level models at the collective level (H2-3) (see Table 4.10).
We use OLS regression in preference to structural equation models (e.g., PLS or LISREL)
because HLM is itself a regression- rather than a SEM-based technique.
We tested the assumptions of HLM and OLS regression before conducting the hypothesis
tests. Other than the assumption regarding independence of errors at the individual level (which
HLM accounts for), all assumptions were met (Table 4.11).
Table 4.10: Summary of Hypothesis Tests
Hypothesis (per Table 4.3)
Sample size (per Table 4.5)
Variables* Level of analysis
Statistical technique
1. 633 individuals IV: Individual system usage DV: Individual task performance
Individual HLM
2 139 groups, 34 groups
Same as H1, but aggregated to the collective level.
Collective OLS Regression
3. 76 groups IV: Aggregated individual system usage, Collective interactions-in-use DV: Collective task performance
Collective OLS Regression
4a. 76 groups, 278 individuals
IV: Coordination-in-use DV: Individual task performance
Cross-level HLM
4b. 76 groups, 278 individuals
IV: Collaboration-in-use DV: Individual deep structure usage
Cross-level HLM
* For simplicity, we do not list the control variables in this table, although we test for them in the data analysis.
Table 4.11: Testing Statistical Assumptions* Technique Assumption Test Description Violation?
Linearity of X -Y relationships Examined box plots and outliers No Normal distribution of errors Examined normal probability plots No Constant variance Examined homogeneity of variance statistic No Independence of errors NA (violated because individuals in groups) NA
Regression
Linear independence of predictors Examined colinearity diagnostics (VIFs) No HLM* Multivariate normality Examined normal probability plot No * Because HLM is a regression-based technique, it shares the assumptions of regression (except the assumption of independence of errors). Thus, this table only lists HLM assumptions that are in addition to those of OLS regression.

147
Table 4.12 details results for H1. After accounting for the positive effects of working in a
group ( 02γ ), and being in a group with high procedural knowledge ( 01γ ), individual system usage
(formed by deep structure usage and cognitive absorption) explains a large amount of variance in
individual performance (R2 = .31). While variance remains in the intercept (i.e., 00τ is significant),
indicating that the DV could be further explained, no variance remains in the slope (i.e., 11τ is
insignificant), indicating that the effect of individual usage on performance is not moderated by
other collective level constructs. Overall, the results support H1 and the baseline model.38
Table 4.12: Results for Hypothesis 1 (Individual Level of Analysis)
Parameter Estimates R2 Hypothesis and Model
00γ 01γ 02γ 10γ 2σ 00τ 11τ
IU
ModelH1:
ijijjjij rIUIPL ++= )(:1 10 ββ
jjjj UTrKnL 00201000 )()(:2 +++= γγγβ
jj UL 1101:2 += γβ
5.78*
0.04*
1.19*
0.46*
2.36
0.86*
0.06
0.31
0.43
Key: Model
L1 = Level 1; L2 = Level 2; IP = Individual performance.; IU = Individual usage; Kn = Collective procedural knowledge; Tr = Treatment (working in nominal group = 1, working in real group = 2)
Parameters
00γ = Intercept of Level 2 regression predicting j0β
01γ - 02γ = Slopes of Level 2 regression predicting j0β
10γ = Intercept of Level 2 regression predictingj1β (pooled Level 1 slopes)
2σ = Variance in Level 1 residual (i.e., variance in rij)
00τ = Variance in Level 2 residual for models predicting j0β (i.e., variance in U0)
11τ = Variance in Level 2 residual for models predicting j1β (i.e., variance in U1)
R2
IU = Incremental R2 due to Usage, i.e., ]2[00][00]2[00 )( levellconditionalconditionafullylevellconditiona −−− − τττ
Model = R2 of model, i.e., ][00][00][00 )( nalunconditiolconditionafullynalunconditio τττ −−
Note: Each predictor is entered as grand-mean centered (per Luke, 2004). * p < .05
Table 4.13 details results for H2-3. H2 predicted that the usage-performance relationship
would differ when aggregated from real collectives than from nominal collectives. As Table 4.13
38 We also tested whether two aspects of our research design (group size and year) affected these results. The results were robust; these variables had no significant direct (p = .93, p = .64) or moderating (p. = .23, p = .93) effects.
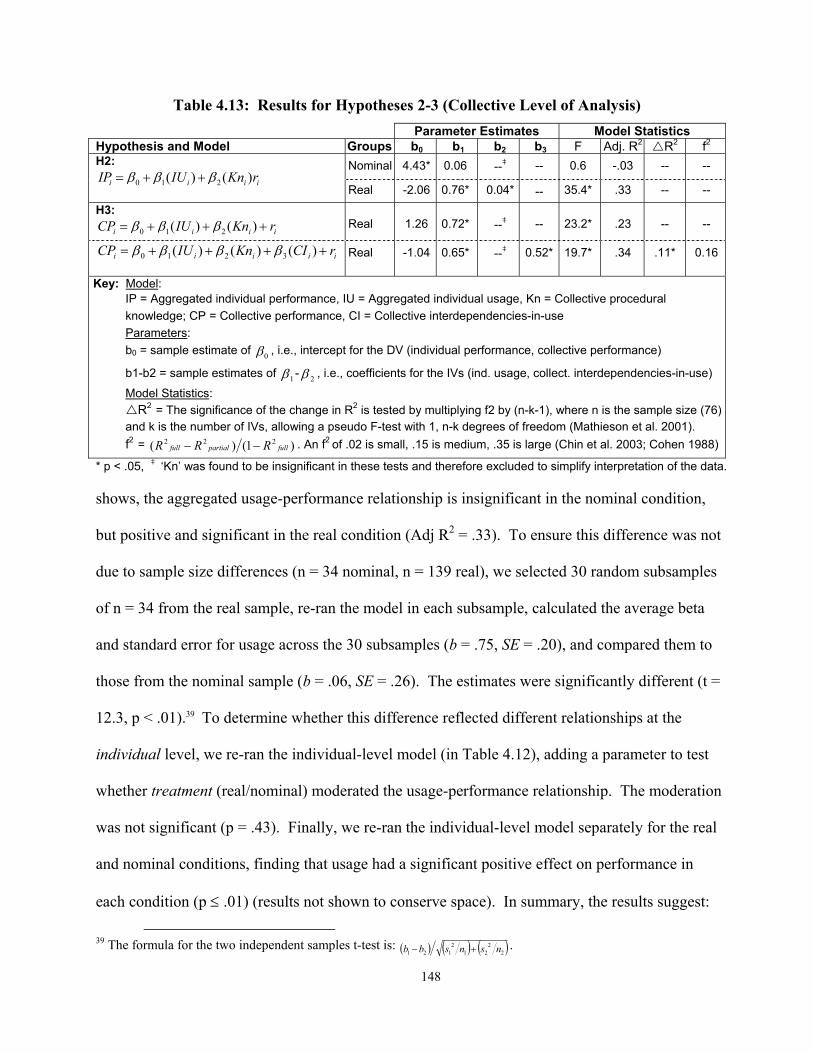
148
Table 4.13: Results for Hypotheses 2-3 (Collective Level of Analysis) Parameter Estimates Model Statistics Hypothesis and Model Groups b0 b1 b2 b3 F Adj. R2 R2 f2
Nominal
4.43*
0.06
--‡
--
0.6
-.03
--
-- H2: iiii rKnIUIP )()( 210 βββ ++=
Real
-2.06
0.76*
0.04*
--
35.4*
.33
--
--
H3: iiii rKnIUCP +++= )()( 210 βββ
Real
1.26
0.72*
--‡
--
23.2*
.23
--
--
iiiii rCIKnIUCP ++++= )()()( 3210 ββββ
Real
-1.04
0.65*
--‡
0.52*
19.7*
.34
.11*
0.16
Key: Model: IP = Aggregated individual performance, IU = Aggregated individual usage, Kn = Collective procedural knowledge; CP = Collective performance, CI = Collective interdependencies-in-use Parameters: b0 = sample estimate of 0β , i.e., intercept for the DV (individual performance, collective performance)
b1-b2 = sample estimates of 1β - 2β , i.e., coefficients for the IVs (ind. usage, collect. interdependencies-in-use)
Model Statistics: R2 = The significance of the change in R2 is tested by multiplying f2 by (n-k-1), where n is the sample size (76)
and k is the number of IVs, allowing a pseudo F-test with 1, n-k degrees of freedom (Mathieson et al. 2001). f2 = )1()( 222
fullpartialfull RRR −− . An f2 of .02 is small, .15 is medium, .35 is large (Chin et al. 2003; Cohen 1988)
* p < .05, ‡ ‘Kn’ was found to be insignificant in these tests and therefore excluded to simplify interpretation of the data.
shows, the aggregated usage-performance relationship is insignificant in the nominal condition,
but positive and significant in the real condition (Adj R2 = .33). To ensure this difference was not
due to sample size differences (n = 34 nominal, n = 139 real), we selected 30 random subsamples
of n = 34 from the real sample, re-ran the model in each subsample, calculated the average beta
and standard error for usage across the 30 subsamples (b = .75, SE = .20), and compared them to
those from the nominal sample (b = .06, SE = .26). The estimates were significantly different (t =
12.3, p < .01).39 To determine whether this difference reflected different relationships at the
individual level, we re-ran the individual-level model (in Table 4.12), adding a parameter to test
whether treatment (real/nominal) moderated the usage-performance relationship. The moderation
was not significant (p = .43). Finally, we re-ran the individual-level model separately for the real
and nominal conditions, finding that usage had a significant positive effect on performance in
each condition (p ≤ .01) (results not shown to conserve space). In summary, the results suggest:
39 The formula for the two independent samples t-test is: ( ) ( ) ( )2
221
2121 nsnsbb +− .

149
• at the individual level, the usage-performance relationship is positive and significant • the individual-level relationship is not significantly affected by group type (real/nominal) • when aggregated to the collective level, the usage-performance relationship is positive and
significant when data are from real groups, but not when data are from nominal groups. These results strongly support H2, demonstrating that context matters when aggregating
data. For example, if a researcher aggregated the data for all the groups in our sample, without
verifying the nature of the collectives, the explained variance for the usage-performance
relationship would be Adj. R2 = .23, which differs significantly from the true results in both
types of groups (Adj. R2 = -.03, Nominal, Adj. R2 = .33, Real, per Table 4.13).
H3 predicted that the effect of collective usage on collective performance would be greater
when accounting for interdependencies-in-use. As Table 4.13 shows, including
interdependencies-in-use significantly increases the explained variance ( R2 = .11), having a
“medium” effect on the DV (i.e., f2 = 0.16) (Cohen 1988). Thus, H3 is supported.
Table 4.14 details results for H4. H4a predicted that collective coordination-in-use would
have a significant positive effect on individual performance. As Table 4.14 shows, after
controlling for individual usage and collective knowledge, coordination-in-use had a significant
positive effect on individual performance (i.e., 01γ is significant), increasing R2 by 0.15. In HLM,
the significance of this increase can be tested by comparing each model’s deviance statistic
(produced using full maximum likelihood estimation), with the difference distributed as a chi-
square statistic with degrees of freedom equal to the difference in the number of parameters (Luke
2004). Following this procedure, the difference in deviance between the models was 4.64
(1035.21 – 1030.57), which, with one additional parameter (i.e., 01γ ), was significant at p < .05.
As in H1, we tested whether these results were influenced by the size of the groups, but group
size had no direct (p = .92) or moderating effect (p = .55). Thus, H4a is supported.
H4b predicted a significant positive effect of collective collaboration-in-use on individual

150
Table 4.14: Results for Hypothesis 4 (Cross Levels of Analysis) Parameter Estimates R2 Hypothesis and Model
00γ 01γ 02γ 10γ 2σ 00τ 11τ
CI
ModelH4a:
ijijjjij rIUIPL ++= )(:1 10 ββ
jjjj UKnCRL 00201000 )()(:2 +++= γγγβ
jj UL 1101:2 += γβ
6.24*
0.10*
.02
.07*
2.06
0.31*
0.04
0.15
0.42
H4b:
ijjij rDSL += 0:1 β
jjj UCLL 001000 )(:2 ++= γγβ
jj UL 1101:2 += γβ
6.13*
0.13
--
--
1.91
0.56*
--
0.00
0.00
Key:
Model
L1 = Level 1; L2 = Level 2; CP = Collective performance; IU = Aggregated individual usage; CI = Collective interdependencies-in-use (CR in H4a, CL in H4b); Kn = Collective procedural knowledge.
Parameters
00γ = Intercept of Level 2 regression predicting j0β
01γ - 02γ = Slopes of Level 2 regression predicting j0β
10γ = Intercept of Level 2 regression predictingj1β (pooled Level 1 slopes)
2σ = Variance in Level 1 residual (i.e., variance in rij)
00τ = Variance in Level 2 residual for models predicting j0β (i.e., variance in U0)
11τ = Variance in Level 2 residual for models predicting j1β (i.e., variance in U1)
R2
CI = Incremental R2 for CI, i.e., ][00][00][00 )( CIwithoutlconditionafullyCIwithlconditionafullyCIwithoutlconditionafully −−−−−−−−− − τττ
Model = R2 of model, i.e., ][00][00][00 )( nalunconditiolconditionafullynalunconditio τττ −−
* p < .05
deep structure usage. Table 4.14 shows that even though there is a significant variation in deep
structure usage among groups (i.e., 00τ is significant), collective collaboration-in-use accounts for
none of this variance (R2 CI = 0.00). Again, we investigated whether the effect of collaboration-
in-use on individual deep structure usage might depend on group size, but group size had no
significant effect (p = .47). Thus, there is no support for H4b.
Table 4.15 summarizes the results of the hypothesis tests. H1-H4a were supported, while
H4b was not supported. The implications of these results are considered next.
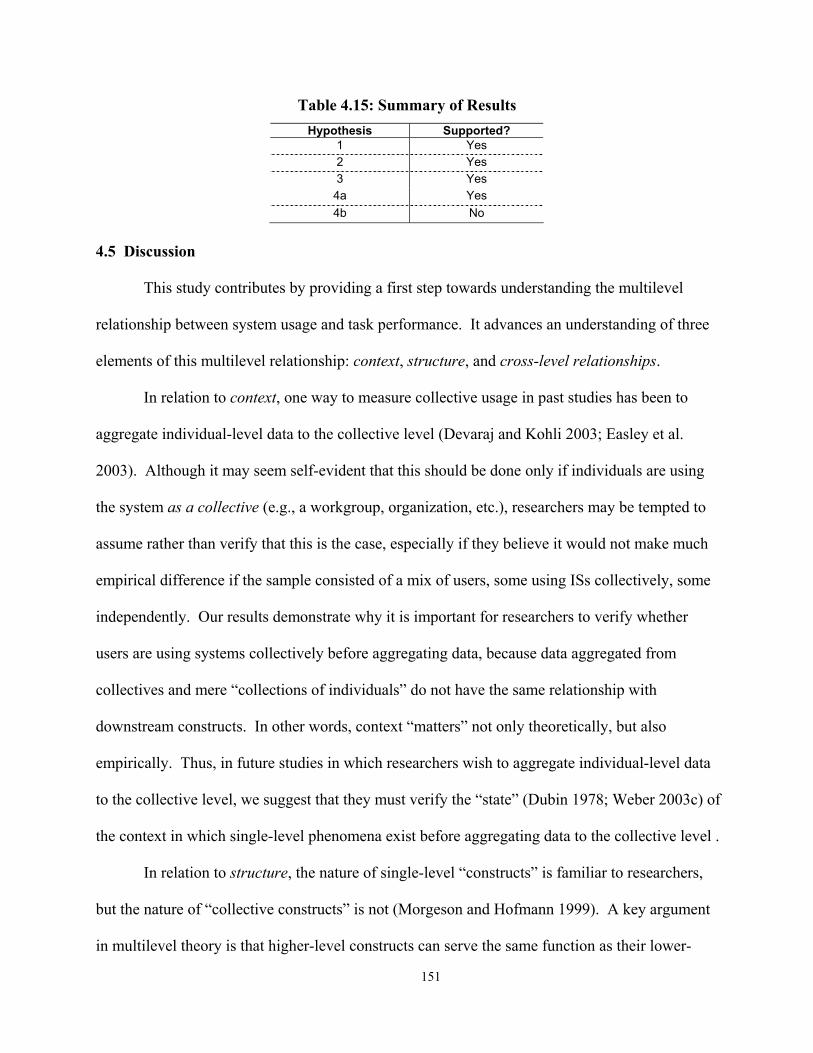
151
Table 4.15: Summary of Results Hypothesis Supported?
1 Yes 2 Yes 3 Yes 4a Yes 4b No
4.5 Discussion
This study contributes by providing a first step towards understanding the multilevel
relationship between system usage and task performance. It advances an understanding of three
elements of this multilevel relationship: context, structure, and cross-level relationships.
In relation to context, one way to measure collective usage in past studies has been to
aggregate individual-level data to the collective level (Devaraj and Kohli 2003; Easley et al.
2003). Although it may seem self-evident that this should be done only if individuals are using
the system as a collective (e.g., a workgroup, organization, etc.), researchers may be tempted to
assume rather than verify that this is the case, especially if they believe it would not make much
empirical difference if the sample consisted of a mix of users, some using ISs collectively, some
independently. Our results demonstrate why it is important for researchers to verify whether
users are using systems collectively before aggregating data, because data aggregated from
collectives and mere “collections of individuals” do not have the same relationship with
downstream constructs. In other words, context “matters” not only theoretically, but also
empirically. Thus, in future studies in which researchers wish to aggregate individual-level data
to the collective level, we suggest that they must verify the “state” (Dubin 1978; Weber 2003c) of
the context in which single-level phenomena exist before aggregating data to the collective level .
In relation to structure, the nature of single-level “constructs” is familiar to researchers,
but the nature of “collective constructs” is not (Morgeson and Hofmann 1999). A key argument
in multilevel theory is that higher-level constructs can serve the same function as their lower-

152
level counterparts, but with different structures (Morgeson and Hofmann 1999). To our
knowledge, the present study is the first in IS to explicitly model this difference in structure in a
construct across levels of analysis. Although some recent studies have examined how collective
usage relates to individual usage (Angst and Agarwal 2004; Gallivan et al. 2005), these studies
have conceived of collective usage as a simple aggregation of individual usage.
Collective usage certainly includes the sum of the parts, and the results of our empirical
study demonstrate that this alone has a substantial impact on collective performance (R2 = .23,
Table 4.13). Nevertheless, collective usage is more than the sum of individual usage, because it
also comprises interdependencies that occur during collective usage, and these have a significant
incremental effect on collective performance (f2 = .16, Table 4.13). The challenge lies in
identifying what comprises the additional structure in any collective construct, i.e., the whole
minus its parts. Morgeson and Hofmann (1999) provide initial guidance, suggesting that the
difference lies in the “interactions” among parts. Following Burton-Jones and Straub (2004), we
suggest that researchers choose elements of these interactions that are appropriate for the theory
and research question. For example, in the present study, we took a different approach for
measuring a group output (e.g., performance) than a group process (e.g., system usage). Likewise,
to measure collective exploitive usage, we drew on theories of groups (Lindenberg 1997) to submit
that two types of interdependencies were relevant: collaboration-in-use and coordination-in-use.
Although we believe that our measures were appropriate for our theory and research question,
other measures may have been more appropriate if we were studying a different question (e.g., the
relationship between system usage and long-run, rather than short-run, task performance).
In relation to cross-level relationships, the present study is the first (to our knowledge) to
examine cross-level relationships between collective usage and individual performance. As
Goodman (2000) demurs, little is known of the links between levels of analysis in organizational

153
research. Our results show that aspects of collective usage can significantly affect individual
performance. Thus, studies of individual usage that ignore potential cross-level effects from the
collective level could obtain spurious results simply due to an unmeasured effect from the
collective level. In this way, the internal validity of many IS studies could be threatened.
In addition to these three contributions, the empirical study contributes by replicating
recent work on individual usage (Burton-Jones and Straub 2004), providing additional evidence
for the validity of the measurement model and structural model developed in that earlier study,
and extending that study by validating a measurement model of collective usage. Thus, the study
contributes towards a cumulative tradition in investigating the usage-performance relationship.
Despite this empirical study’s contributions, it is not without limitation. From the
perspective of internal validity, the theoretical model is very limited in scope, only comprising a
small set of constructs. We controlled for efficacy and knowledge, but additional variables (e.g.,
motivation) may have been important to control. Furthermore, there may be relevant mediating
variables (e.g., individual or collective learning) that are not accounted for in the theoretical
model. Finally, our conception of cross-level relationships was only partial. We theorized
“downward” cross level effects, for which data analysis techniques are reasonably mature. We
did not theorize “upward” cross-level effects, as data analysis techniques for these are still in their
infancy (Griffin 1997; Kozlowski and Klein 2000). These limitations are all worthy of research.
The lack of support for H4b was notable. We had expected that collaboration-in-use
would be positively associated with individual deep structure usage, but our results showed no
evidence of any effect. We speculate on two possible reasons. First, it might be a measurement
issue. The scale for collaboration-in-use referred to advice given and received regarding “how to
use Excel”, whereas the scale for deep structure usage referred to the use of Excel features to
perform specific tasks, such as “features that helped me perform calculations on my data.” The

154
difference in specificity of these two scales may be the cause of the problem. Future research
could investigate this issue by: (a) creating more specific measures of collaboration-in-use, which
would accord with recent calls for more feature-specific measures (Jasperson et al. 2005), or (b)
creating more generalized measures of deep structure usage, which would accord with past calls
to test different levels of specificity when measuring feature use (Griffith and Northcraft 1994).
A competing reason for the lack of a result for H4b is that the construct is misspecified.
For example, it may be that non-evaluative measures of collaboration-in-use do not have a clear
relationship with individual usage. In this light, Burton-Jones and Straub (2004) suggested that
system usage is a non-evaluative construct (i.e., it differs from an evaluation of usage such as
“effective” usage). Although our results suggest that a non-evaluative measure of collaboration-
in-use is associated with higher collective performance (see Table 4.7b), it may be that an
evaluative measure (e.g., collaboration ‘quality’) is needed to find an effect on individual usage,
e.g., good collaboration may improve but poor collaboration may hinder individual deep structure
usage. Future research is needed to investigate these issues.
With respect to measurement, research is needed to examine whether results would differ
if we used measures of collective usage that explicitly referred to the collective level (e.g., how
did your group collaborate-in-use?). There is no firm rule at present regarding which approach is
optimal (Kozlowski and Klein 2000); more research is needed to address this issue.
In terms of statistical conclusion validity, our sample size was relatively small for HLM
(Hofmann et al. 2000), so a larger sample may have offered more powerful tests. Nevertheless,
recent studies have used HLM with much smaller samples (e.g., 25 teams of 4 people) (Hofmann
et al. 2003), and our study did find significant results despite the small sample size.
Finally, in terms of external validity, our results stem from just one experiment. Although
the experiment used a widely used computer application, and a realistic business case, it is still
155
limited by the standard limitations of laboratory experiments with student samples (Greenberg
1987); replications using other samples would be valuable. Furthermore, the study was limited to
the individual and small-group levels. Although we believe that our measures of
interdependencies-in-use (collaboration-in-use and coordination-in-use) are sufficiently general to
be applicable to any two levels (e.g., individual-group, group-organization, organization-
network), this remains an open theoretical and empirical issue.
This research could be extended in several ways. Perhaps the most obvious way would be
to extend our study by examining different contexts, structures, or cross-level relationships, or to
improve our study by directly addressing the limitations noted above. In addition to these, we
see four additional important areas.
First, researchers could extend our work by accounting for antecedents of individual and
collective usage. Researchers have begun to investigate common antecedents to usage across
levels (Dennis et al. 2004). Nevertheless, there are likely to be critical differences in antecedents
across levels because collective usage is more than the sum of its parts. Investigating these
antecedents would be very valuable because DeLone and McLean’s (1992) IS success model
specified consequences at the individual and collective levels, but only specified system usage
and its antecedents at the individual level. Thus, by identifying the antecedents to individual and
collective usage, researchers could begin to construct a full, multilevel IS success model.
Second, our theoretical model did not consider the possibility that collective level
constructs could reflect distinct configurations in values across members of a collective. We
allowed for this possibility in our measures, but the data was still restricted in that it met the
necessary assumptions of a shared view (as opposed to a configurational view) of the constructs
(Hofmann 2002). Recent research has suggested that many collectives enact distinct
configurations when performing tasks (e.g., for specialization of labor and loose coupling)
156
(Hofmann 2002; Kozlowski and Klein 2000; Rousseau 2000). To our knowledge, no empirical
studies in IS have examined this issue. Doing so could be a particularly valuable way to improve
understanding of the relationship between usage and performance.
Third, the present study largely ignored the temporal dimension. The issue of time in
multilevel research is clearly critical (Rousseau 2000). Future research could study whether
certain effects from collectives on individuals occur more quickly than others, or whether certain
individual level effects emerge at the collective level at different rates. The same data analysis
procedures (e.g., HLM) that are used for multilevel data analysis are also able to analyze temporal
effects (e.g., through studies of “growth curves” with HLM) (Raudenbush and Bryk 2002).
Consequently, such research on temporal issues is much more feasible now than it was in the past.
A final important avenue of research would be to examine the degree to which multilevel
studies of usage and performance (or other relationships in IS research) can contribute vis-à-vis
social network analyses. These two approaches (multilevel research, social network research)
conceptualize the collection of lower-level units differently, as an entity (i.e., a “collective”) or
as a set of nodes and links (i.e., a “network”). It is likely that these are complementary. For
example, multilevel research (but not network research) can isolate the effect of the “collective”
on its members, but social network research (but not multilevel research) can isolate the relative
importance of specific nodes and links within the collective that lead to effects (Borgatti and
Cross 2003; Sparrowe et al. 2001). Investigating the complementarity between multilevel and
social network analyses of the usage-performance relationships promises very rich insights into
the pathways by which system usage leads to performance for individuals and collectives.
4.6 Conclusion
System usage is a key construct in IS research, a necessary link between IS investments

157
and individual and organizational outcomes from IS (Heine et al. 2003; Soh and Markus 1995).
Although some studies have investigated the link between system usage and its consequences at
a single level (whether at an individual, group, and organization level), none to our knowledge
have explicitly examined it from a multilevel perspective. This study provides a first step
towards understanding the multilevel nature of the usage-performance relationship. We
examined three elements of this multilevel relationship: the importance of verifying the context
in which users exist (i.e., collectives of individuals or collections of independent individuals), the
structure of collective- vis-à-vis individual-level usage and performance, and the presence of
cross-level relationships from collective usage to individual usage and performance.
To examine the importance of these elements, we adopted a baseline model of the
usage-performance relationship developed in recent research (Burton-Jones and Straub 2004),
extended this model to account for its multilevel nature, and then tested the extended model in an
experiment involving 34 nominal groups (comprising 116 individuals) and 139 groups
(comprising 517 individuals) performing a spreadsheet-based financial analysis task.
The results of the experiment support the importance of context, structure, and cross-level
relationships when studying the usage-performance relationship. The study is not without
weaknesses, but despite its limitations, this first multilevel investigation of the usage-
performance relationship revealed important new finding, suggests profitable directions for
future research, and demonstrates the feasibility of conducting multilevel studies of the usage-
performance relationship (and, by extension, other such relationships in the field). Researchers
have long called for a multilevel approach for studying the consequences of system usage in
organizations (Harris 1994). We hope that our theoretical model and results offer a potential, if
partial, baseline to support such research.
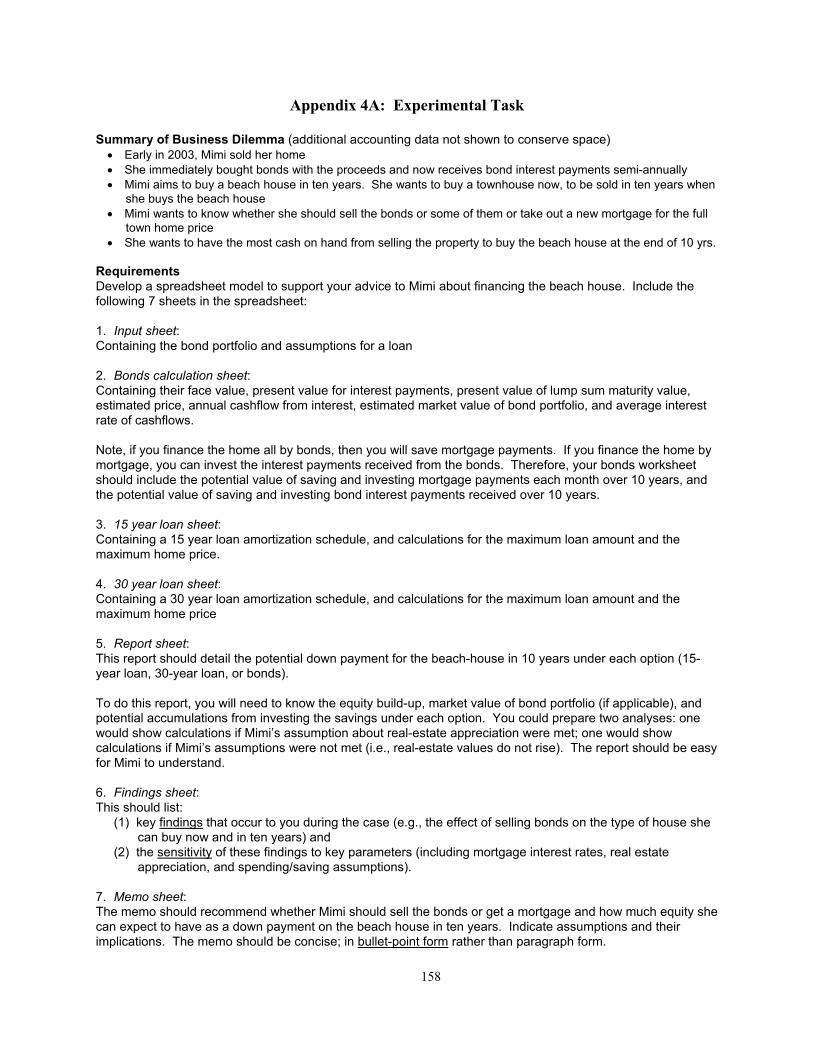
158
Appendix 4A: Experimental Task
Summary of Business Dilemma (additional accounting data not shown to conserve space) • Early in 2003, Mimi sold her home • She immediately bought bonds with the proceeds and now receives bond interest payments semi-annually • Mimi aims to buy a beach house in ten years. She wants to buy a townhouse now, to be sold in ten years when
she buys the beach house • Mimi wants to know whether she should sell the bonds or some of them or take out a new mortgage for the full
town home price • She wants to have the most cash on hand from selling the property to buy the beach house at the end of 10 yrs.
Requirements Develop a spreadsheet model to support your advice to Mimi about financing the beach house. Include the following 7 sheets in the spreadsheet:
1. Input sheet: Containing the bond portfolio and assumptions for a loan
2. Bonds calculation sheet: Containing their face value, present value for interest payments, present value of lump sum maturity value, estimated price, annual cashflow from interest, estimated market value of bond portfolio, and average interest rate of cashflows.
Note, if you finance the home all by bonds, then you will save mortgage payments. If you finance the home by mortgage, you can invest the interest payments received from the bonds. Therefore, your bonds worksheet should include the potential value of saving and investing mortgage payments each month over 10 years, and the potential value of saving and investing bond interest payments received over 10 years.
3. 15 year loan sheet: Containing a 15 year loan amortization schedule, and calculations for the maximum loan amount and the maximum home price.
4. 30 year loan sheet: Containing a 30 year loan amortization schedule, and calculations for the maximum loan amount and the maximum home price
5. Report sheet: This report should detail the potential down payment for the beach-house in 10 years under each option (15-year loan, 30-year loan, or bonds).
To do this report, you will need to know the equity build-up, market value of bond portfolio (if applicable), and potential accumulations from investing the savings under each option. You could prepare two analyses: one would show calculations if Mimi’s assumption about real-estate appreciation were met; one would show calculations if Mimi’s assumptions were not met (i.e., real-estate values do not rise). The report should be easy for Mimi to understand.
6. Findings sheet: This should list:
(1) key findings that occur to you during the case (e.g., the effect of selling bonds on the type of house she can buy now and in ten years) and
(2) the sensitivity of these findings to key parameters (including mortgage interest rates, real estate appreciation, and spending/saving assumptions).
7. Memo sheet: The memo should recommend whether Mimi should sell the bonds or get a mortgage and how much equity she can expect to have as a down payment on the beach house in ten years. Indicate assumptions and their implications. The memo should be concise; in bullet-point form rather than paragraph form.

159
Appendix 4B: Instrumentation*
Deep Structure Usage (Burton-Jones and Straub 2004) 14. When I was using MS Excel, I used features that helped me test different assumptions in the data 15. When I was using MS Excel, I used features that helped me compare and contrast aspects of the data 17. When I was using MS Excel, I used features that helped me perform calculations on my data 18. When I was using MS Excel, I used features that helped me derive insightful conclusions from the data
Cognitive Absorption (Agarwal and Karahanna 2000) 12. When I was using MS Excel, I felt completely absorbed in what I was doing 13. When I was using MS Excel, I was able to block out all other distractions 16. When I was using MS Excel, my attention did not get diverted very easily 19. When I was using MS Excel, I felt totally immersed in what I was doing
Collaboration-in-use (new scale) 20. To what extent did you give advice about how to use Excel to your group members during the simulation? 24. To what extent did you share your knowledge of how to use Excel with your group members during the simulation?21. To what extent did you receive advice about how to use Excel from your group members during the simulation? 25. To what extent did your group members share their knowledge of how to use Excel with you during the simulation?
Coordination-in-use (new scale) 22. To what extent did you discuss with your group members about when to transfer work during the simulation? 26. To what extent did you coordinate with your group members about when to transfer work during the simulation? 23. To what extent did your group members discuss with you about when to transfer work during the simulation? 27. To what extent did your group members coordinate with you about when to transfer work during the simulation?
Collective Performance (new scale) 2. I think the instructor would probably give our group the following percentage score on the case we just completed:**3. The instructor will probably consider our solution to be of very high quality: 4. I believe that our group completed all required parts of the case:
Individual Performance (new scale) 7. I think the instructor would probably give me the following percentage score on my section of the case:** 8. The instructor will probably consider my individual work to be of very high quality: 9. I believe that I completed all required parts of my tasks:
Knowledge (Burton-Jones and Straub 2004) Declarative knowledge: Final exam score (individual-level measure) Procedural knowledge: The group’s score on the previous Excel exercise (collective-level measure)
Collective Efficacy*** (adapted from (Compeau and Higgins 1995) Our group could complete [name of exercise] using MS Excel … .…if there was no one around to tell us what to do as we [I] did it. .…if we had only the solution to the previous case for reference .…if we had seen someone else doing it before trying it ourselves .…if we could call someone for help if we got stuck .…if someone else had helped us get started .…if we had a lot of time to complete the case .…if we had just the built-in Excel help facilities for assistance .…if someone showed us how to do it first.
Self Efficacy*** (adapted from (Compeau and Higgins 1995) I could complete [name of exercise] using MS Excel… .…if there was no one around to tell me what to do as I did it. .…if I had only the solution to the previous case for reference .…if I had seen someone else doing it before trying it myself .…if I could call someone for help if we got stuck .…if someone else had helped me get started .…if I had a lot of time to complete the case .…if I had just the built-in Excel help facilities for assistance .…if someone showed me how to do it first. * 9-point likert scale; ** percentage scale; *** 11 point likert scale; Item numbers reflect the order in the questionnaire.

160
Chapter 5
A Comprehensive Approach for Dealing with Method Variance in
IS Research40
Abstract
Researchers have long known that choice of research method influences the viability of construct measurements. Campbell and Fiske (1959) proposed that researchers should account for such method variance by measuring each construct in a model via multiple methods and using a special correlation matrix (a multi-trait, multi-method matrix), together with the logic of triangulation, to estimate the true relationships among the constructs. Many statistical tests have evolved to implement Campbell and Fiske’s approach in ever more advanced ways, yet the underlying logic stands to this day.
This paper responds to Fiske and Campbell’s (1992) own call to improve their approach. Specifically, their approach provides no guidance for selecting methods, and overemphasizes the importance of convergence in triangulation. To address these limitations, we propose the first comprehensive approach for dealing with method variance. This approach consists of two strategies for dealing with method variance, criteria for selecting an appropriate strategy for a given study, and guidance for executing a selected strategy.
We conduct a demonstration exercise to show how the approach would work in an empirical study of the relationship between individual-level system usage and task performance. The results support the approach, demonstrate its feasibility, and illustrate how it can help researchers test theories and identify new research opportunities.
Keywords: research methods, method variance, bias, construct development, theoretical conceptualization, measurement, validation, system usage.
Acknowledgment: An earlier version of this paper was presented at the 2004 Annual Conference of the Southern Association for Information Systems (SAIS).
40 Burton-Jones, A., and Straub, D. "Toward a Comprehensive Approach for Dealing with Method Variance in IS Research," Working paper, Department of Computer Information Systems, Georgia State University, 2005.

161
5.1 Introduction
To bridge the intellectual and empirical realms of research (e.g., to test a theory),
researchers use “research methods.” Because science relies so heavily on its methods, an
enduring quest is to improve the way researchers use methods in practice. This paper aims to
contribute to this goal by providing researchers with a deeper understanding of one key problem
related to “positivist” research methods—method variance—and providing a comprehensive
approach that positivist researchers can use to deal with method variance in practice.41
Campbell and Fiske (1959) introduced method variance to the behavioral sciences in the
following way:
Each test or task employed for measurement purposes is a trait-method unit, a union of a particular trait content with measurement procedures not specific to that content. The systematic variance among test scores can be due to responses to the measurement features [method variance] as well as responses to the trait content [trait variance] (p. 81).
Campbell and Fiske (1959) argued that method variance was a serious concern and that
researchers need a way to unpack the relative effects of trait (i.e., “true”) variance and method
variance. They suggested that researchers pursue the following strategy: (1) use multiple methods
to measure each construct in their model, (2) enter the correlations among all of the measures in a
special correlation matrix (the multi-trait, multi-method [MTMM] matrix), and (3) use
triangulation to converge on the true (i.e., unbiased) relationships among the constructs.
Although Campbell and Fiske’s (1959) paper is one of the most cited in social science, the
adoption of their recommendations has been notoriously low. Fiske and Campbell (1992)
explained that this was due to two problems. First, the MTMM matrix requires researchers to use
judgment when interpreting data, that is, it does not offer elegant statistics to quantify trait and
41 Since the demise of logical positivism, all working positivists are, arguably, “post-positivists” (Suppe 1977). Nevertheless, terms are hard to change and we continue using “positivist” in its broad, informal sense, in which it refers to a large class of research concerned with theory testing, measurement, and validity. We leave an analysis of the potential for method variance in non-positivist research (e.g., interpretive research) to future studies.

162
method variance. Second, at the conceptual level, method variance turned out to be more
complex than originally envisioned. Although many methodologists have attempted to resolve
the first problem, by creating advanced statistical techniques for analyzing MTMM data, the
second problem remains. Fiske and Campbell (1992) demurred that methods and traits might be
so conceptually intertwined that separating them might be impossible, a problem they found
disturbing yet seemingly intractable. Despite calls for research on these conceptual difficulties,
the issues remain little understood and unresolved (Cronbach 1995; Fiske 1995; Fiske and
Campbell 1992). The unfortunate result is that there is no accepted approach for dealing with
method variance in behavioral research (Sechrest et al. 2000). Although recent studies offer
strategies for dealing with parts of method variance, such as common method bias (Podsakoff et
al. 2003), what is missing is a strategy for dealing with method variance as a whole. This
problem, and the lack of awareness of it in IS research (Woszczynski and Whitman 2004), has led
to a state in which:
• Most IS researchers do not account for method variance in their studies • The minority of IS researchers who account for method variance do so only partially • Consumers of IS research are not aware of the impact of method variance on results. To redress this situation, the present study clarifies the meaning of method variance and
advances, for the first time, a comprehensive approach for dealing with it. The approach makes
an important contribution by enabling researchers to deal with method variance in a way that (1)
is complete, (2) fits a study’s aims, theoretical context, and practical constraints, and (3) supports
cumulative theoretical progress. The present study also contributes by showing how the approach
would work in an important research context, namely, the relationship between individual-level
system usage and task performance. The results demonstrate that the approach is feasible,
illustrate its benefits for testing theories, and reveal how it can help generate important insights
for future research.

163
5.2 Context: The Current State of Research on Method Variance
Table 5.1 summarizes extant research on method variance. Three categories can be identified:
research on the nature of method variance; research on methodological approaches to reduce
method variance; and research on statistical approaches to estimate method variance.
Table 5.1: Summary of Extant Research on Method Variance
Research Focus Question Representative Articles Conclusions/Findings to Date (1) What is method variance?
(Campbell and Fiske 1959; Crano 1981; Cronbach 1995; Fiske 1982; Golding 1977; Sechrest et al. 2000)
Method variance is not well defined. Doubts have surfaced about whether method variance and trait variance can be distinguished.
(2) Is method variance substantial?
(Cote and Buckley 1987; Crampton and Wagner 1994; Glick et al. 1986; Meyer et al. 2001; Podsakoff et al. 2003; Sharma and Yetton 2004; Wilson and Lipsey 2001)
In a given study, method variance can range from high to low. On average across studies, method variance appears to be as large as, or larger than, trait variance.
Nature of method variance
(3) How have past studies accounted for method variance?
(Fiske and Campbell 1992; Podsakoff et al. 2003; Woszczynski and Whitman 2004)
Many empirical studies do not account for method variance. Very few studies in IS discuss method variance.
(4) What research methods tend to increase method variance?
(Glick et al. 1986; Harrison et al. 1996; Hoyt 2000; Hufnagel and Conca 1994; Podsakoff and Organ 1986; Tepper and Tepper 1993).
Method variance is often found to affect data obtained by self-report methods and common methods. The extent of bias caused by a method depends on the context in which the method is used.
Methodological approaches to reduce method variance
(5) What alternative methods can be used to minimize method variance?
(Donaldson et al. 2000; Fazio and Olson 2003; Hilbert and Redmiles 2000; Payne et al. 2003; van Bruggen et al. 2002; Webb et al. 2000)
Many alternatives methods to self-report have been developed, e.g., archival measures, primary or secondary observation, behavioral traces, and implicit measures.
Statistical approaches to identify or reduce method variance
(6) What statistical approaches can be used to estimate method variance?
(Bagozzi et al. 1991; Campbell and O'Connell 1982; Corten et al. 2002; Eid et al. 2003; Kenny 1995; Lindell and Whitney 2001; Millsap 1995; Reichardt and Coleman 1995; Saris and Aalberts 2003; Westen and Rosenthal 2003).
Many technique have been created to estimate method variance, e.g.: MTMM matrices; ANOVA; correlations; and structural equation models (including single factor models; correlated uniqueness models; direct product models).
5.2.1 The Nature of Method Variance
A surprising feature of research on method variance is that few-to-no studies have
examined underlying conceptual issues such as defining method variance, describing its nature,
and distinguishing it from trait variance (Fiske, 1995, Fiske and Campbell 1992). According to

164
Cronbach (1995, p.145), “nearly everyone’s attention went to [statistical] techniques for
analysis.” As Sechrest et al. (2000, p. 84) state: “Method effects are omnipresent, but we do not
as yet know very well how to define them, let alone detect them and estimate their magnitude.”
If method variance were not a problem, there would be no need to resolve these
conceptual issues. Unfortunately, method variance causes two critical problems. First, method
variance can artificially increase reliability, leading researchers to (unknowingly) place faith in
biased measures. Specifically, many researchers justify the reliability of measures using tests
such as Cronbach’s alpha (Boudreau et al. 2001). Reliability theory assumes that test scores are
a function of true score and random error (Cote and Buckley 1987). As method variance is not
random, reliability theory includes method variance in true variance. As a result, method
variance tends to artificially inflate reliability scores such as Cronbach’s alpha (Tepper and
Tepper 1993). A common example of this occurs when researchers list questionnaire items in
groups for each construct rather than randomize the items. As Goodhue and Loiacono (2002)
note, respondents often give similar scores to grouped questions (e.g., to avoid cognitive
dissonance), thus leading to high Cronbach’s alpha (high reliability) but biased scores (low
validity). Thus, researchers who use this practice could, unknowingly, be relying on biased data
(Straub et al. 2004b).
A second problem is that method variance biases the estimates of relationships among
constructs. An early meta-analysis of MTMM studies found that on average across studies,
measures contain 42% true variance, 26% method variance, and 32% random error variance
(Cote and Buckley 1987). Using these percentages, Podsakoff et al. (2003) showed that where
two constructs have a true correlation of 1.00, method variance can lead researchers to conclude
that the correlation is 0.52, and where two constructs have a true correlation of 0.00, method
variance can lead researchers to conclude that the correlation is 0.23. In a recent synthesis of

165
meta-analyses (reflecting 16,525 individual studies), Wilson and Lipsey (2001) found that
method variance was an even stronger influence than in Cote and Buckley (1987). They found
that method variance accounted for nearly as much variability as true variance. Thus, method
variance can be a substantial cause of both type 1 and type 2 errors.
In short, method variance may not be well understood, but it can cause considerable
problems and raise serious questions about the validity of research findings. Unfortunately, few
researchers attempt to address it (Fiske and Campbell, 1992). In IS, Woszczynski and Whitman
(2004) analyzed 116 recent studies in MIS Quarterly, ISR, and JMIS, and found that only 12
studies even mentioned method variance, while 58% of studies used only one method.
Dishearteningly, Scandura and Williams (2000) found that management researchers had reduced
their emphasis on using multiple methods over the course of the last two decades.
5.2.2 Methodological Approaches to Reduce Method Variance
Despite the lack of research on the nature of method variance, it is true that researchers
have attempted to identify what methods tend to produce method variance (per Table 5.1). Many
studies have shown that the variance caused by a method depends on the context of the
measurement, e.g., the instrument used, the construct being measured, and the data source
(Crampton and Wagner 1994; Glick et al. 1986; Harrison et al. 1996; Kline et al. 2000; Williams
and Brown 1994). Nevertheless, some methods are considered to be especially problematic. For
example, many highlight the problems of self-report measures. According to Spector (1992;
1994), self-reported measures often reflect only 10-20% of the true variance of a construct. To
overcome known flaws of self-report measures, researchers have proposed: (a) improved
methods for constructing self-report measures (Hufnagel and Conca 1994; Schaeffer and Presser
2003; Tourangeau et al. 2000); (b) alternatives to self-report measures such as “implicit”

166
measures and behavioral traces (Fazio and Olson 2003; Hilbert and Redmiles 2000; Webb et al.
2000). Another typical cause of method variance is the use of common methods. The use of
common methods often leads to common method bias, i.e., covariance between items that stems
from the items being measured by the same method. Recent studies have highlighted the
problems of common method bias and have summarized strategies that can be used for
preventing, detecting, or correcting it (Podsakoff et al. 2003; Woszczynski and Whitman 2004).
5.2.3 Statistical Approaches to Estimate Method Variance
The largest body of literature on method variance addresses statistical issues (Cronbach,
1995). Many statistical techniques have been tested (per Table 5.1). These fall into two
categories: (1) techniques that estimate common method variance; (2) techniques that estimate
method variance in general. The vast majority estimate common method variance (e.g., MTMM
matrices, ANOVA, and structural equation models). Although these differ in particulars (e.g., the
degree to which the tests require researchers to name the aspect of the method that is common
across items or constructs), they all estimate common method bias rather than other aspects of
method variance (Saris and Aalberts 2003, Podsakoff et al. 2003). Recently, more general
techniques have emerged. For example, Westen and Rosenthal (2003) propose a technique for
quantifying the construct validity of a set of scores by testing the degree to which the actual
correlations match the theoretically expected correlations. This test assumes, however, that
researchers know the method variance in their data prior to data analysis. Without this
knowledge, the results of the test are inconclusive because method variance can increase or
decrease correlations leading to a positive or negative result. While this is not a criticism of the
test per se, it highlights the point that statistics alone cannot solve method variance (Cronbach,
1995).

167
5.2.4 The Need for a Comprehensive Approach for Dealing with Method Variance
Overall, our analysis of past research on method variance highlights three critical,
unresolved problems:
• The nature of method variance is not well understood • Most empirical researchers do not account for method variance • The minority of researchers who do attempt to account for method variance (whether
statistically or methodologically) generally only deal with part of the problem (e.g., common method bias or self-report bias).
To overcome these problems, this paper aims to clarify the meaning of method variance
and then to present a comprehensive approach for dealing with it in IS research.
5.3 Clarifying the Meaning of Method Variance
Method variance is complex for at least two reasons. First, its meaning depends on the
meta-theoretical assumptions underlying positivist research, which are complex and often poorly
understood (Messick 1989). Second, it can manifest itself in many ways, so it can be a difficult
concept to pin down (Fiske and Campbell, 1992). To address these issues, we first briefly clarify
the meta-theoretical assumptions of positivist research. We focus, especially, on critical realism,
the view arguably held (at least implicitly) by most positivist researchers (Cook and Campbell
1979; Messick 1989; Moldoveanu and Baum 2002; Weber 2003b).42 Second, we decompose
method variance into its sources. We then examine the meaning and significance of each source.
5.3.1 The Meta-Theoretical Assumptions Underlying Positivist Research
Table 5.2 illustrates the evolution of meta-theoretical assumptions in positivist research.
The initial meta-theoretical position was operationalism. Operationalists (e.g., logical
42 Like all ontological viewpoints, critical realism continues to evolve (Archer et al. 1998; Mingers 2004b; Mir and Watson 2001). Our focus is on the core assumptions of critical realism that concern issues of measurement. These have remained largely invariant since their classic treatment in Cook and Campbell (1979) [see Messick 1989].

168
positivists) rejected unobservable intellectual notions such as research constructs. To operate
without constructs, operationalists simply assumed that operations defined real world traits and
measures defined trait scores (e.g., your IQ is your intelligence) (Trout 1999). Although initially
influential, operationalism, along with logical positivism, has long been rejected by most
scientists (Grace 2001).
Realism was an early alternative to operationalism. Realists embraced unobservable
notions (e.g., constructs) and assumed that the empirical realm (e.g., traits and trait scores) could
be mirrored in the intellectual realm. Thus, realists assumed that real world phenomena (e.g.,
humans) have inherent traits (e.g., anxiety) with an inherent scale (e.g., nominal, ordinal, interval,
etc.) and that members of a population vary in their “true” trait scores on this scale (Essex and
Smythe 1999). The aim of research, according to the realist, was to build constructs that
correspond to real world traits (hence the arrow leading from traits to constructs in Table 5.2) and
to use methods to obtain the true scores of these traits (Borsboom et al. 2004; Trout 1999).
The constructivists rejected the realists’ assumption that the “true” nature of the world
could be observed (Kuhn 1996). To operate without this assumption, constructivists assumed
that: (a) constructs do not correspond to reality; they are merely useful fictions that researchers
attribute to phenomena; (b) scales do not reflect the true nature of a trait; they merely enable
researchers to obtain interesting/useful insights about phenomena; and (c) scores are not “true,”
but simply fictions that allow researchers to discuss the relative standing of phenomena on a
socially constructed construct and scale (Messick, 1989). Unfortunately, while constructivism
overcame some limitations of realism, it left the position of measurement and progress rather
vacuous in that nothing really exists to measure or to progress towards (Borsboom et al. 2004).
Critical realism melded constructivism and realism in an attempt to overcome each one’s
limitations (Cook and Campbell, 1979). Critical realists assume that real world phenomena have

169
Table 5.2: Progression of Meta-Theoretical Assumptions in Positivist Research* Meta-Theoretical Assumptions In Past Positivist Research
Operationalism Realism Constructivism Worldview:
Goal: Reductionism (i.e., explanation without metaphysical notions)
Truth (i.e., explaining/predicting reality)
Theoretical progress (i.e., useful, accepted theories)
Trait score: …is the observed score. … exists, but is unknown. …does not exist. Methods: …are part of constructs. …can be used to obtain the trait
score. …are socially accepted ways of
collecting data. Valid
measures: …are reliable and useful. …reflect the trait score. …fit a pattern expected by the
theory.
Meta-Theoretical Assumptions in Extant Positivist Research Critical Realism (Constructive-Realism)
Legend (Illustrative Example)
Worldview:
Goal: Theoretical progress, attempting to attain, yet never attaining, truth. Trait score: …exists, but is unknowable. Methods: …are socially accepted ways of approximating the trait score.
Valid measures:
…approximate the trait score and fit a pattern expected by the theory.
Trait**: the nature of human intelligence in reality. Trait score***: a person’s true level of intelligence in reality. Indicator: an operation designed to measure intelligence (e.g., IQ). Construct: researchers’ notion of human intelligence. Construct score: a person’s level of what researchers consider to be human intelligence. Method: approach for collecting data about human intelligence. Measure: an observed score of intelligence on an indicator.
* Adapted from (Borsboom et al. 2004; Messick 1989; Trout 1999). ** For simplicity, we use “trait” to refer to both traits and states (per Messick, 1989). *** The trait score is a “true” score, but it differs from the statistical notion of “true score.” The latter refers to tests and
samples rather than a phenomenon’s true score on a particular property (Borsboom et al. 2004). traits with scores, but they assume that these are unknowable; they can only be approximated by
constructs and measures (Loevinger 1957; Messick 1989). This influences the way critical
realists view data analysis. Specifically, critical realists assume that a measure is valid if it
Theory
Construct
Method
Indicator
Trait
Trait Score
Measure (Observed
Score)
Phenomenon
DataInstrumentation
Intellectual Realm Empirical Realm
Theory
Construct
Method
Indicator
Construct
Construct Score
Measure (Observed
Score)
Phenomenon
DataInstrumentation
Intellectual Realm Empirical Realm
Trait
Operational Theory
Indicator
Measure (Observed
Score)
Phenomenon
Data
Intellectual Realm Empirical Realm
Theory
Construct
Method
Indicator
Construct
Construct Score
Measure (Observed
Score)
Phenomenon
DataInstrumentation
Intellectual Realm Empirical Realm
Trait
Trait Score

170
measures the trait score (Borsboom et al. 2004), but because the trait score is unknowable, they
assume that data analysis cannot prove the validity of a measure. Rather, data analysis can only
show whether the data fit an expected theoretical pattern (Westen and Rosenthall, 2003). Thus,
critical realists emphasize obtaining precise measures prior to data analysis (Tourangeau et al.
2000, Schaeffer and Presser, 2003).
Even so, critical realists do not place as much faith in methods as realists did. Because
realists had assumed that trait scores could be obtained, they tended to believe that there was a
single “best” method for measuring any trait (Webb et al. 2000, p. xvi). In contrast, critical
realists assume that the trait score is unknowable and that multiple methods may be needed in an
attempt to approximate it (Webb et al. 2000). This led to the importance of “triangulation” in
critical realist research (Campbell and Fiske 1959; Crano 1981; Crano 2000) (see Figure 5.1).
Researchers triangulate by using multiple independent methods to converge on the true trait
score (Sechrest et al. 2000, p. 65). In the best case, all methods selected for studying a trait
should have merit, yet have different (and ideally, independent) strengths and limitations (Webb
et al. 2000). The underlying assumption is that “truth lies at the intersection of independent lies”
(Levins 1966, p. 423).
Figure 5.1: Choice of Methods in Realist versus Critical Realist Research
Realist View (Use the most precise method)
Critical Realist View (Use multiple methods and triangulate)
Region of Trait ScoreT T = trait score
Method 1 Method 2
Method 3
Method 4
Decision: Choose Method 2 Method C
Method A Method B
Method D
Decision: Choose Methods A, B, D
x
x
x

171
Campbell and Fiske (1959) proposed that triangulation was the best way for critical
realists to deal with the problem of method variance. They suggested that researchers could have
some faith that their measures approximate true trait scores if (a) they measured each construct in
a study using multiple “appropriate” methods and (b) if their measures of each construct
converged and their measures of different constructs discriminated. Campbell and Fiske (1959)
acknowledged that this approach was fallible, e.g., it contains little guidance for determining
“appropriate” methods. Nevertheless, while many statistical techniques have evolved to
implement the approach in ever more sophisticated ways, its underlying conceptual logic
remains dominant to this day (Crano, 2000).
Following Campbell and Fiske (1959), this paper examines method variance on the basis
of critical realist assumptions. However, like Fiske (1995), we suggest that Campbell and Fiske’s
logic of triangulation is useful but insufficient for dealing with method variance. The following
sections set out to define the necessary principles to enable us to overcome its limitations.
5.3.2 Decomposing “Methods” and “Method Variance”
Method and method variance are not well defined in the literature. In its broadest sense,
method refers to “everything that is done to collect the data” (Viswanathan 2005, p. 148). Three
elements are generally agreed to exist (Cronbach 1995, Sechrest et al. 2000, Viswnathan 2005):
• Rater: the provider of the score (e.g., subject, researcher, independent rater, computer log). • Instrument: the device used for scoring (e.g., questions and response options in a
questionnaire or interview, coding scripts for recording observations, recording programs for collecting electronic/computer records).
• Procedure: the process by which the rater’s score is obtained, whether for a single item of one construct (e.g., instructions for raters), or for multiple items (e.g., the sequence and timing of scoring multiple items of one construct or multiple items of different constructs). The “score” referred to above is an observed score obtained via a method in an attempt to
approximate the trait score. Thus, we draw on these elements to define method variance as:
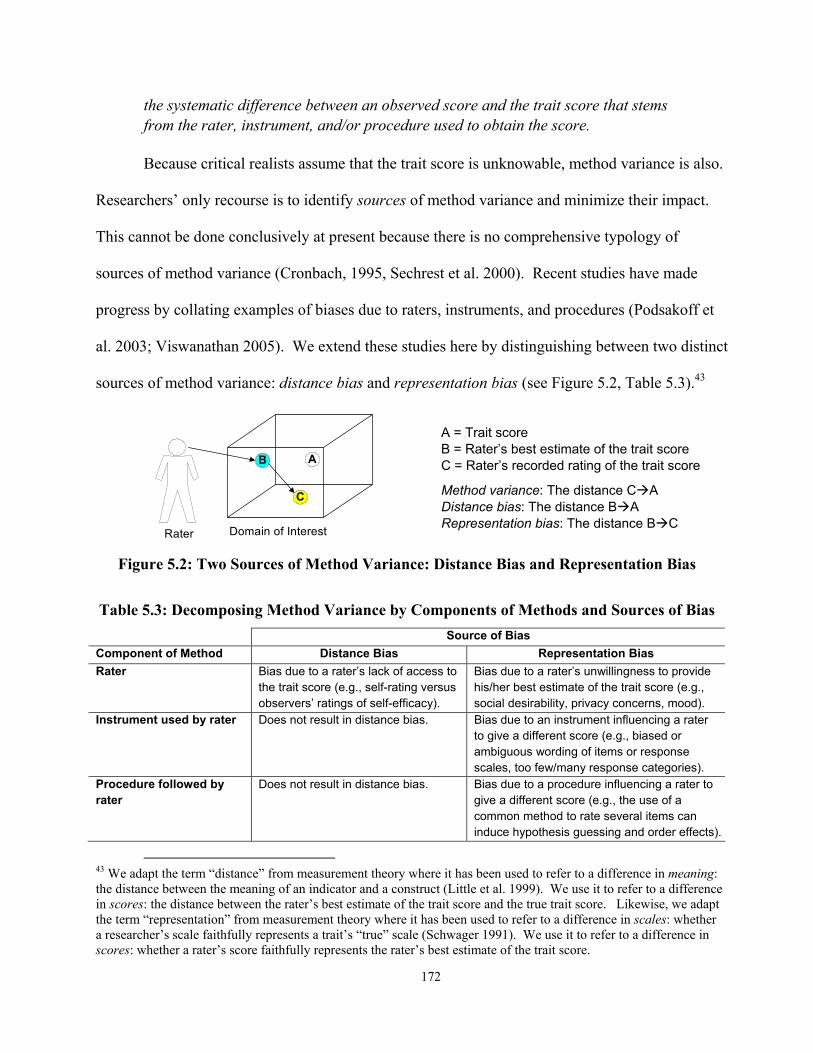
172
the systematic difference between an observed score and the trait score that stems from the rater, instrument, and/or procedure used to obtain the score. Because critical realists assume that the trait score is unknowable, method variance is also.
Researchers’ only recourse is to identify sources of method variance and minimize their impact.
This cannot be done conclusively at present because there is no comprehensive typology of
sources of method variance (Cronbach, 1995, Sechrest et al. 2000). Recent studies have made
progress by collating examples of biases due to raters, instruments, and procedures (Podsakoff et
al. 2003; Viswanathan 2005). We extend these studies here by distinguishing between two distinct
sources of method variance: distance bias and representation bias (see Figure 5.2, Table 5.3).43
C
AB
Rater Domain of Interest
Figure 5.2: Two Sources of Method Variance: Distance Bias and Representation Bias
Table 5.3: Decomposing Method Variance by Components of Methods and Sources of Bias Source of Bias
Component of Method Distance Bias Representation Bias Rater
Bias due to a rater’s lack of access to the trait score (e.g., self-rating versus observers’ ratings of self-efficacy).
Bias due to a rater’s unwillingness to provide his/her best estimate of the trait score (e.g., social desirability, privacy concerns, mood).
Instrument used by rater
Does not result in distance bias. Bias due to an instrument influencing a rater to give a different score (e.g., biased or ambiguous wording of items or response scales, too few/many response categories).
Procedure followed by rater
Does not result in distance bias. Bias due to a procedure influencing a rater to give a different score (e.g., the use of a common method to rate several items can induce hypothesis guessing and order effects).
43 We adapt the term “distance” from measurement theory where it has been used to refer to a difference in meaning: the distance between the meaning of an indicator and a construct (Little et al. 1999). We use it to refer to a difference in scores: the distance between the rater’s best estimate of the trait score and the true trait score. Likewise, we adapt the term “representation” from measurement theory where it has been used to refer to a difference in scales: whether a researcher’s scale faithfully represents a trait’s “true” scale (Schwager 1991). We use it to refer to a difference in scores: whether a rater’s score faithfully represents the rater’s best estimate of the trait score.
A = Trait score B = Rater’s best estimate of the trait score C = Rater’s recorded rating of the trait score
Method variance: The distance C A Distance bias: The distance B A Representation bias: The distance B C
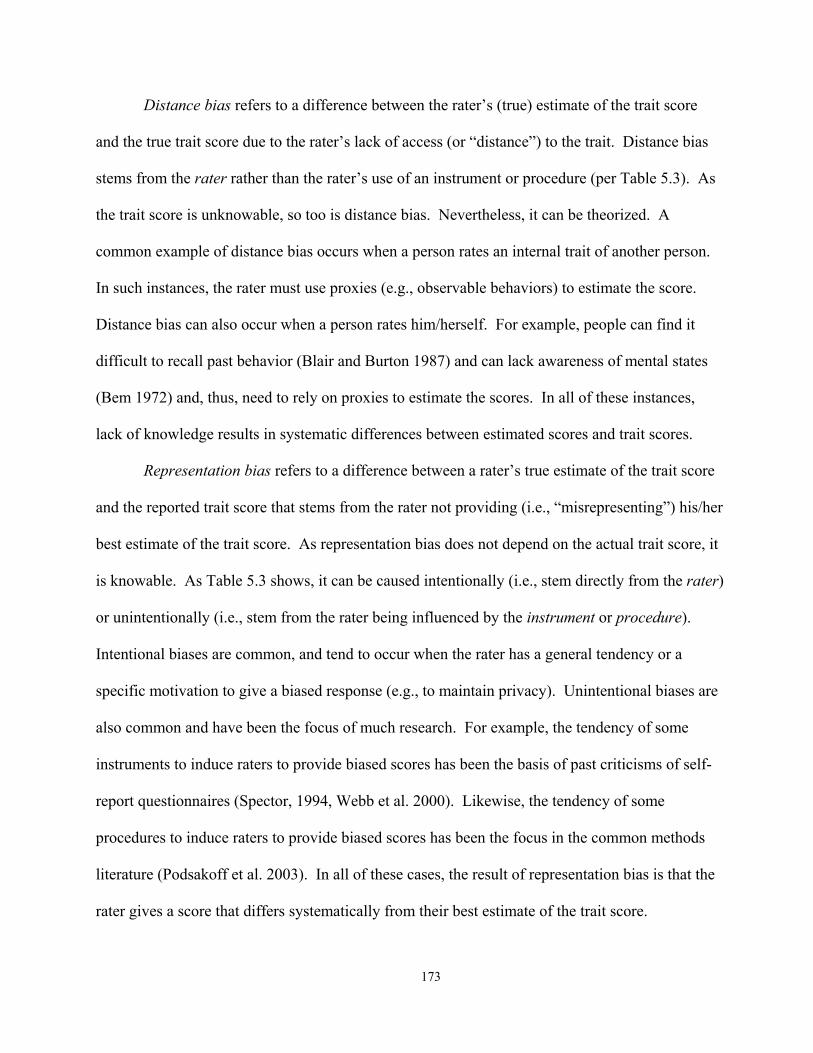
173
Distance bias refers to a difference between the rater’s (true) estimate of the trait score
and the true trait score due to the rater’s lack of access (or “distance”) to the trait. Distance bias
stems from the rater rather than the rater’s use of an instrument or procedure (per Table 5.3). As
the trait score is unknowable, so too is distance bias. Nevertheless, it can be theorized. A
common example of distance bias occurs when a person rates an internal trait of another person.
In such instances, the rater must use proxies (e.g., observable behaviors) to estimate the score.
Distance bias can also occur when a person rates him/herself. For example, people can find it
difficult to recall past behavior (Blair and Burton 1987) and can lack awareness of mental states
(Bem 1972) and, thus, need to rely on proxies to estimate the scores. In all of these instances,
lack of knowledge results in systematic differences between estimated scores and trait scores.
Representation bias refers to a difference between a rater’s true estimate of the trait score
and the reported trait score that stems from the rater not providing (i.e., “misrepresenting”) his/her
best estimate of the trait score. As representation bias does not depend on the actual trait score, it
is knowable. As Table 5.3 shows, it can be caused intentionally (i.e., stem directly from the rater)
or unintentionally (i.e., stem from the rater being influenced by the instrument or procedure).
Intentional biases are common, and tend to occur when the rater has a general tendency or a
specific motivation to give a biased response (e.g., to maintain privacy). Unintentional biases are
also common and have been the focus of much research. For example, the tendency of some
instruments to induce raters to provide biased scores has been the basis of past criticisms of self-
report questionnaires (Spector, 1994, Webb et al. 2000). Likewise, the tendency of some
procedures to induce raters to provide biased scores has been the focus in the common methods
literature (Podsakoff et al. 2003). In all of these cases, the result of representation bias is that the
rater gives a score that differs systematically from their best estimate of the trait score.
174
Our distinction between distance and representation bias helps to overcome a limitation
of Campbell and Fiske’s (1959) approach by providing researchers with a basis for choosing sets
of methods. Past studies tend to associate bias with methods. For example, an oft-cited view is
that “no research method is without bias” (Webb et al. 2000, p. 2). However, methods alone
have no inherent biases, they are merely associated with different sources of bias. To address
method variance, therefore, we argue that researchers need to focus on these sources, rather than
methods per se, and they need to do this systematically, ruling out both distance bias and
representation bias.
For example, in studies of systems usage, Straub et al. (1995) found that usage had
different relationships with antecedent constructs depending on the method used to measure it.
Since then, several studies have used different methods to measure antecedents to use
(questionnaires) and use (computer logs) (Venkatesh et al. 2003). While the intent here is
laudable, it only tackles one aspect of representation bias (common methods bias). If not used
carefully, it could exacerbate distance bias (e.g., if computer logs are less able than self-reported
measures to rate certain aspects of individual’s use of systems). Logically, it is clear that a
systematic approach is needed to address both sources of bias.
5.3.3 The Meaning and Significance of Distance Bias and Representation Bias
Another reason for distinguishing between distance bias and representation bias is that
they have different relationships with the reality of the domain under investigation. Specifically,
a rating that reflects distance bias is not a true rating of the intended trait, but it is, nevertheless, a
true rating. Moreover, this rating may be a valid rating of a relevant, albeit unintended trait, in the
domain. For example, assume that a researcher asks a manager to complete a questionnaire
regarding her subordinate’s performance. If the manager has a mistaken perception of her
subordinate’s performance, her rating would be a biased rating of actual performance, but it
175
would be a valid rating of her perception of the employee’s performance, and this perception
could have a real effect on how s/he interacts with the employee at work, i.e., it is a relevant trait
in the domain, but just a different trait to the employee’s true performance.
In contrast, a rating that reflects representation bias is not a true rating of any trait in the
domain; it is a transitory bias that exists only due to the act of measurement. For example, a
manager who responds to a questionnaire regarding employee performance may give a biased
score because she attempts to provide a socially desirable answer. Unlike distance bias, the biased
score resulting from such a misrepresentation is not a valid rating of any trait in the domain.44
The distinction between distance bias and representation bias enables us to clarify the
meaning of a “trait-method unit” (Fiske and Campbell, 1992; Cronbach, 1995). Campbell and
Fiske (1959) coined this phrase to suggest that any observed score partly reflects the trait score
and partly the method used to obtain it. While the intuition behind the phrase is useful, the
phrase itself is unclear because a score cannot reflect a method (as methods have no scores). We
argue that scores are not “trait-method units.” Scores are simply scores. Whether a score
reflects the trait score depends on its level of bias. A score that contains significant distance bias
will not measure the intended trait, but it could be a valid measure of a different trait. A score
that contains significant representation bias will not reflect the true score of any trait.45
If distance bias can result in valid measures of different traits, what can such traits be?
Like Chin (1996), we turn to ontology to answer this, specifically Searle’s (1995) ontological
44 Note that the human tendencies that cause representation bias (e.g., acquiescence) do exist in the domain and can be measured to control for representation bias, but they too would have to be measured without representation bias. 45 There is one exception to this argument. In the case of secondary data, the act of measurement occurs in the domain, so representation bias could exist naturally in such data. The majority of misrepresentations in secondary data will not result in valid measures of traits, but in rare instances they could do so. For example, performance appraisals may sometimes be biased ratings of actual performance but valid ratings of what managers wish others to think are their ratings, e.g., for impression management (Arvey and Murphy 1998). Although we admit that such meaningful instances of representation bias are sometimes possible, we believe that they would be nearly impossible to identify in practice, because researchers typically have no knowledge of how secondary data is produced.

176
analysis. Searle’s (1995) analysis is useful because it is consistent with critical realist
assumptions and it provides a way to classify the types of traits that method variance can
influence. Searle (1995) submits that all real world traits are either ontologically objective (that
is, traits that exist outside the human mind, such as height) or ontologically subjective (that is,
traits that exist in the human mind, such as joy). Furthermore, Searle (1995) argues that there are
two types of ontologically objective traits: observer-independent traits that exist irrespective of
human thought (e.g., height), and observer-dependent traits that have been ‘objectified’ because
a class of observers sees them (subjectively) in a similar way (e.g., IT spending is objective as it
occurs outside the mind, but it is observer-dependent as different people may define “IT”
differently, per (Orlikowski and Iacono 2001). Of these types of traits, Searle (1995) suggests
that social science is generally concerned with ontologically subjective traits (e.g., psychological
traits), and ontologically objective, observer dependent traits (e.g., sociological traits).46
Searle’s (1995) analysis reveals several ways that distance bias can lead to a valid rating
of an unintended trait (see Figure 5.3). In the case of ontologically objective traits, a rater may
lack access to the intended frame of reference for rating the trait. For example, a rater may rate
IT spending differently because s/he views IT differently (see Figure 5.3, path D1). In this case,
the rating is true, but it reflects a different trait. Another reason why ratings of objective traits
may have distance bias is that a rater may lack access to the true score of the intended trait (e.g.,
past observable behavior) and instead rate their perception of it (a subjective trait). As
perceptions are fallible, this perception may be ‘true,’ but it differs from the objective trait
(Figure 5.3, path D2).
46 Both ontologically objective traits (e.g., IT spending) and ontologically subjective traits (e.g., joy) can be studied from an epistemologically objective perspective (e.g., whether IT spending occurs or whether a person is joyful) and an epistemologically subjective perspective (e.g., whether IT spending or joy are good) (Searle 1995). Our analysis applies equally to both epistemological dimensions, but we omit a discussion of this issue due to space constraints.

177
Illustration of Distance Bias Theorized Trait Measured Trait
Examples of Types of Distance Bias
Objective (exists outside the mind)
Ontological nature of trait
Subjective (exists in the mind)
D1: Wish to measure IT spending from an accounting perspective, but measure it from an economic perspective.
D2: Wish to measure actual IT spending but measure a rater’s perception of IT spending.
D3: Wish to measure actual IT anxiety and instead measure a user’s behavior (e.g., resistance).
D4: Wish to measure actual IT anxiety and instead measure perceived IT anxiety.
Figure 5.3: Valid, but Unintended Traits Measured by Distance Bias
In the case of ontologically subjective traits, the rater may lack access to the subjective
trait (e.g., a person’s intelligence), and instead may rate an objective trait in the hope that it is a
good surrogate (e.g., a person’s work performance) (per Figure 5.3, path D3). Psychological
research suggests another reason why ratings of subjective traits suffer from distance bias: many
mental states are unconscious and inaccessible to conscious scrutiny (Wilson and Dunn 2004).
Thus, people literally do not have access to their own mental traits, e.g., those involved in
“perception, attention, learning, evaluation, emotion, and motivation” (Wilson and Dunn, 2004,
p. 499). Thus, perceived subjective traits can be true perceptions of the trait of interest, but they
can differ from the actual subjective traits of interest (see Figure 5.3, path D4).
It is important to note that the “distance” of the paths in Figure 5.3 is not necessarily
fixed. For example, it is possible to use instruments or procedures to reduce many of these
biases (i.e., shorten the paths), e.g., by training raters so that their perceptions more accurately
match reality. Although some approaches for dealing with method variance recommend such
techniques (Hoyt and Kerns 1999; Martell and Leavitt 2002), such approaches must be used with
caution. The ultimate arbiter of validity is whether a measure captures the trait score. Thus, if
Perception of A
A
D1
D2
A observed by different class
of observer
Observable surrogate of B
Perception of B
B D3
D4
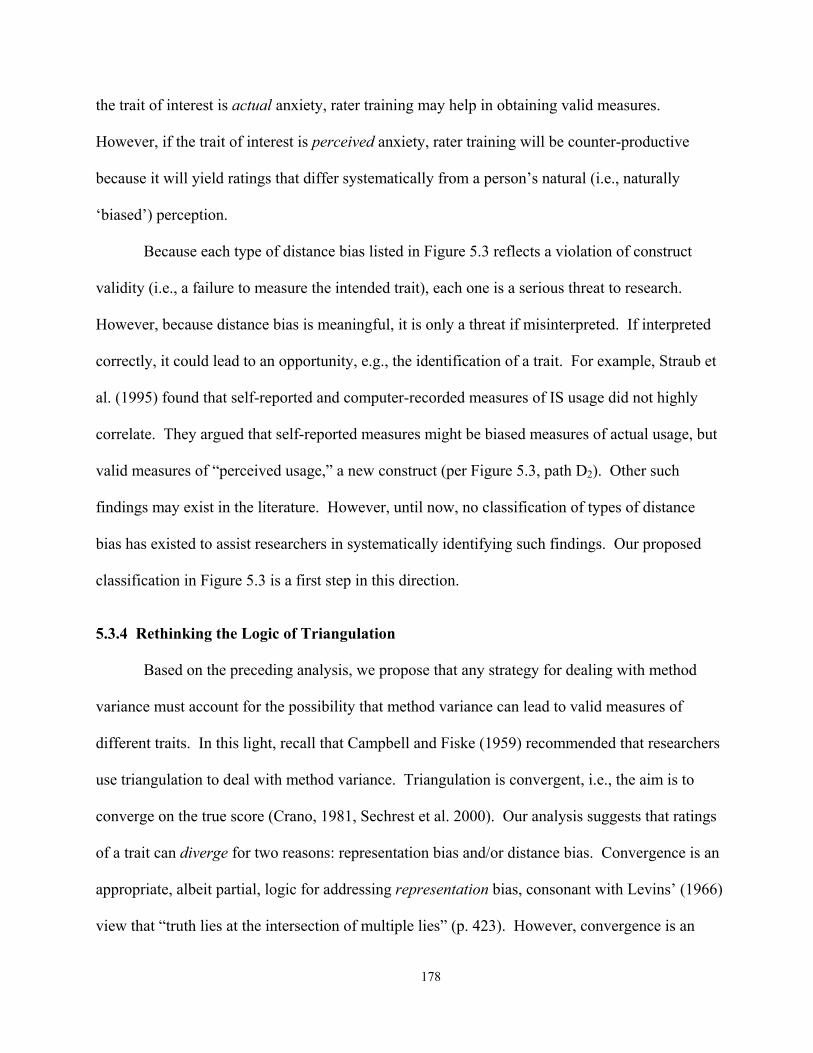
178
the trait of interest is actual anxiety, rater training may help in obtaining valid measures.
However, if the trait of interest is perceived anxiety, rater training will be counter-productive
because it will yield ratings that differ systematically from a person’s natural (i.e., naturally
‘biased’) perception.
Because each type of distance bias listed in Figure 5.3 reflects a violation of construct
validity (i.e., a failure to measure the intended trait), each one is a serious threat to research.
However, because distance bias is meaningful, it is only a threat if misinterpreted. If interpreted
correctly, it could lead to an opportunity, e.g., the identification of a trait. For example, Straub et
al. (1995) found that self-reported and computer-recorded measures of IS usage did not highly
correlate. They argued that self-reported measures might be biased measures of actual usage, but
valid measures of “perceived usage,” a new construct (per Figure 5.3, path D2). Other such
findings may exist in the literature. However, until now, no classification of types of distance
bias has existed to assist researchers in systematically identifying such findings. Our proposed
classification in Figure 5.3 is a first step in this direction.
5.3.4 Rethinking the Logic of Triangulation
Based on the preceding analysis, we propose that any strategy for dealing with method
variance must account for the possibility that method variance can lead to valid measures of
different traits. In this light, recall that Campbell and Fiske (1959) recommended that researchers
use triangulation to deal with method variance. Triangulation is convergent, i.e., the aim is to
converge on the true score (Crano, 1981, Sechrest et al. 2000). Our analysis suggests that ratings
of a trait can diverge for two reasons: representation bias and/or distance bias. Convergence is an
appropriate, albeit partial, logic for addressing representation bias, consonant with Levins’ (1966)
view that “truth lies at the intersection of multiple lies” (p. 423). However, convergence is an

179
inappropriate logic for dealing with distance bias because distance bias can create multiple truths
and a converged score will not reflect any of them. Thus, we suggest that if representation bias
can be ruled out, a divergence among scores does not indicate complete invalidity. Rather, it
signals the valid measurement of one or more unexpected traits, and the need to explore the
significance of each one for the research. In short, triangulation is insufficient for dealing with
method variance because it overemphasizes the importance of convergence. A more holistic
approach is needed that acknowledges the importance of both convergence and divergence.
Our preceding arguments are based on ontology (Searle, 1995) and psychology (Wilson
and Dunn, 2004). However, our arguments also have a basis in epistemology. For example,
Churchman (1971) defined five different systems of inquiry (i.e., epistemological strategies):
Leibnizian, Lockean, Kantian, Hegelian, and Singerian. Although each one is different, two of
these (Leibnizian and Lockean) are generally considered to follow a logic of convergence; they
both strive for one “true” model of reality (Messick, 1989). Two other strategies (Kantian and
Hegelian) are generally considered to follow a logic of divergence (Messick, 1989). The Kantian
view is pluralistic, allowing multiple truths, whereas the Hegelian view is dialectic, encouraging
rivalry among alternative truths. The fifth strategy (Singerian) subsumes the preceding strategies
and, thus, utilizes both convergence and divergence (Messick, 1989). In summary, convergence
is just one of several epistemological strategies and a researcher should use it only to the degree to
which it is consistent with the objectives and assumptions underlying his/her study.
5.4 A Comprehensive Approach for Dealing with Method Variance
To overcome the limits of past approaches, we propose a comprehensive approach for
dealing with method variance (see Figure 5.4). The approach consists of two phases: selecting a
strategy, and executing a strategy. We discuss each phase below.
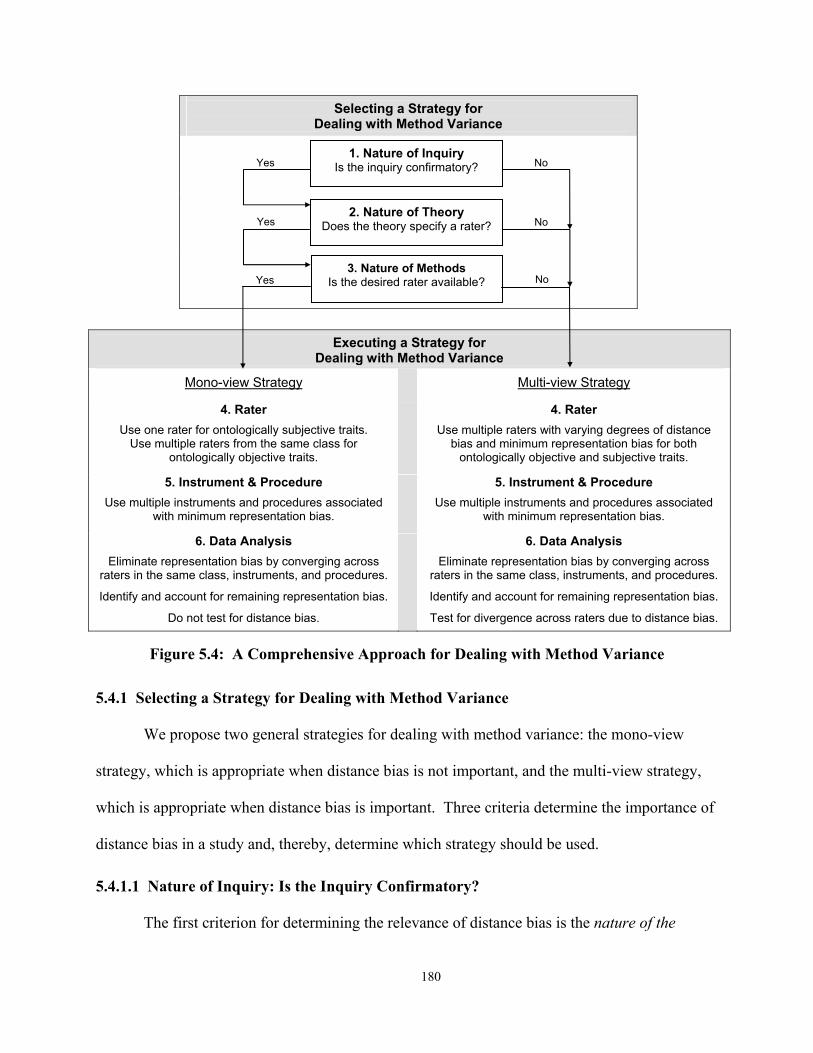
180
Selecting a Strategy for Dealing with Method Variance
Executing a Strategy for Dealing with Method Variance
Mono-view Strategy
Multi-view Strategy
4. Rater
Use one rater for ontologically subjective traits. Use multiple raters from the same class for
ontologically objective traits.
4. Rater
Use multiple raters with varying degrees of distance bias and minimum representation bias for both
ontologically objective and subjective traits.
5. Instrument & Procedure
Use multiple instruments and procedures associated with minimum representation bias.
5. Instrument & Procedure
Use multiple instruments and procedures associated with minimum representation bias.
6. Data Analysis
Eliminate representation bias by converging across raters in the same class, instruments, and procedures.
Identify and account for remaining representation bias.
Do not test for distance bias.
6. Data Analysis
Eliminate representation bias by converging across raters in the same class, instruments, and procedures.
Identify and account for remaining representation bias.
Test for divergence across raters due to distance bias.
Figure 5.4: A Comprehensive Approach for Dealing with Method Variance
5.4.1 Selecting a Strategy for Dealing with Method Variance
We propose two general strategies for dealing with method variance: the mono-view
strategy, which is appropriate when distance bias is not important, and the multi-view strategy,
which is appropriate when distance bias is important. Three criteria determine the importance of
distance bias in a study and, thereby, determine which strategy should be used. 5.4.1.1 Nature of Inquiry: Is the Inquiry Confirmatory?
The first criterion for determining the relevance of distance bias is the nature of the
1. Nature of Inquiry Is the inquiry confirmatory?
2. Nature of Theory Does the theory specify a rater?
3. Nature of MethodsIs the desired rater available?
Yes
Yes
Yes
No
No
No

181
inquiry. Churchman’s (1971) typology allows us to distinguish three types of inquiries:
• Confirmatory inquiry: aims to test a single truth (i.e., Lockean/Liebnizian inquiry) • Pluralistic inquiry: aims to reveal multiple truths (i.e., Kantian inquiry) • Dialectic inquiry: aims to weigh competing truths (i.e., Hegelian inquiry)
Clearly, all of these inquiries are useful. Confirmatory inquiry is useful because it
provides direct evidence for whether a theory is supported empirically. An example would be
Gefen’s et al. (2003) investigation of whether theories of IT acceptance and trust predict users’
online shopping behavior. Pluralistic inquiry is useful for extending theories by revealing the
observer-dependent nature of a theory’s constructs. An example would be to empirically test
DeLone and McLean’s (1992) argument that different observers conceive IS success differently.
This argument underpins DeLone and McLean’s (1992) IS success model, but to our knowledge,
this issue has never been formally investigated. The usefulness of dialectical inquiry has long
been noted (Platt 1964). An example would be to identify situations in which different
observers’ views of IS success are ‘better’ than other observers’ views, in the sense that they are
more predictive of certain outcomes.
As Figure 5.4 shows, if a researcher is following a confirmatory inquiry, they must look
to the next two criteria (nature of theory and nature of methods) to select an appropriate strategy.
However, if the inquiry is pluralistic or dialectical researchers should use the multi-view strategy.
This is because these inquiries do not aim to confirm the role of a construct in a given theory.
Rather, they aim to extend theory, for example, by investigating whether different classes of
observers have legitimately different perspectives of the construct, or whether the construct is
defined in terms of the class of observer with the ‘best’ perspective. Distance bias is important
in all of these cases and, thus, a multi-view strategy is appropriate.
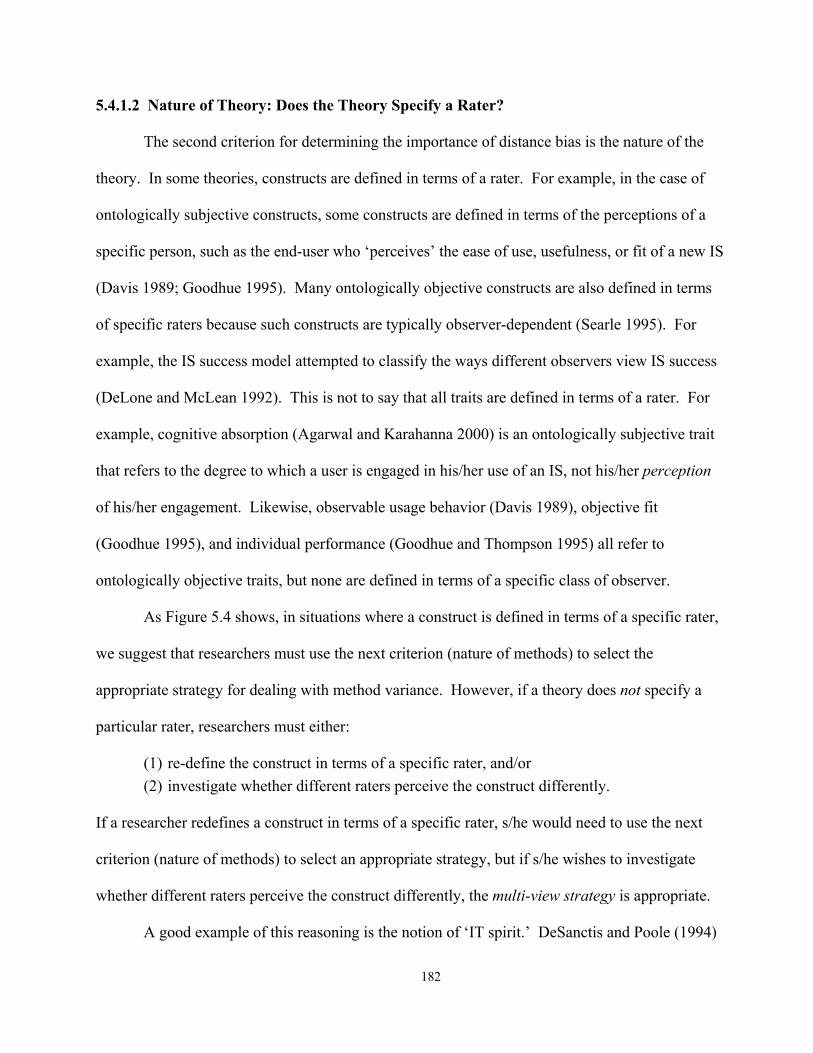
182
5.4.1.2 Nature of Theory: Does the Theory Specify a Rater?
The second criterion for determining the importance of distance bias is the nature of the
theory. In some theories, constructs are defined in terms of a rater. For example, in the case of
ontologically subjective constructs, some constructs are defined in terms of the perceptions of a
specific person, such as the end-user who ‘perceives’ the ease of use, usefulness, or fit of a new IS
(Davis 1989; Goodhue 1995). Many ontologically objective constructs are also defined in terms
of specific raters because such constructs are typically observer-dependent (Searle 1995). For
example, the IS success model attempted to classify the ways different observers view IS success
(DeLone and McLean 1992). This is not to say that all traits are defined in terms of a rater. For
example, cognitive absorption (Agarwal and Karahanna 2000) is an ontologically subjective trait
that refers to the degree to which a user is engaged in his/her use of an IS, not his/her perception
of his/her engagement. Likewise, observable usage behavior (Davis 1989), objective fit
(Goodhue 1995), and individual performance (Goodhue and Thompson 1995) all refer to
ontologically objective traits, but none are defined in terms of a specific class of observer.
As Figure 5.4 shows, in situations where a construct is defined in terms of a specific rater,
we suggest that researchers must use the next criterion (nature of methods) to select the
appropriate strategy for dealing with method variance. However, if a theory does not specify a
particular rater, researchers must either:
(1) re-define the construct in terms of a specific rater, and/or (2) investigate whether different raters perceive the construct differently.
If a researcher redefines a construct in terms of a specific rater, s/he would need to use the next
criterion (nature of methods) to select an appropriate strategy, but if s/he wishes to investigate
whether different raters perceive the construct differently, the multi-view strategy is appropriate.
A good example of this reasoning is the notion of ‘IT spirit.’ DeSanctis and Poole (1994)

183
argued that different observers might conceive of an IT’s spirit differently. In a later empirical
study of spirit, Chin et al. (1997) redefined spirit in terms of end users’ perception of spirit and
obtained ratings from end users based on this redefinition. To our knowledge, no study has
examined the implications that could stem from different raters (e.g., end users and managers)
having different views of an IT’s spirit or different views of each other’s view of an IT’s spirit.
5.4.1.3 Nature of Methods: Is the Desired Rater Available?
The final criterion for determining the importance of distance bias is the nature of
methods. Even if an inquiry is confirmatory and a construct is defined in terms of a rater, a
researcher may be unable to obtain data from the specified rater simply due to research realities
of. In such cases, it may sometimes be better to obtain an approximation of the rater’s
perspective than no perspective. For example, assume that a researchers wishes to measure an
employee’s perception of his/her supervisor’s abilities. A researcher may have difficulty
obtaining this employee’s perception because the employee may be unwilling to disclose his/her
true perception to the researcher. In such instances, an alternative would be to obtain other
raters’ perceptions of the employee’s perception, e.g., by asking his/her subordinates or peers.
The limitation is that these ratings could suffer from distance bias. For example, these raters
could be rating a different trait (e.g., his/her observable behavior, per Figure 5.3, path D3), and
they may even have different perceptions of this different trait (e.g., peers and subordinates may
perceive the employee’s behavior differently, per Figure 5.3, path D1). As a result, it is
important in such instances to test for distance bias rather than simply assume that the different
views converge on the intended trait. Thus, as Figure 5.4 shows, a mono-view strategy is
appropriate only if the desired rater is available; the multi-view strategy is appropriate if the
desired rater is not available.

184
5.4.2 Executing a Strategy for Dealing with Method Variance
To address method variance, researchers must use methods (i.e., raters, instruments, and
procedures) in such a way that unwanted biases are prevented from influencing the data and must
analyze data in such a way that remaining biases are identified and accounted for (per Figure 5.4).
5.4.2.1 Executing a Strategy: Rater
As Figure 5.4 shows, the two strategies have differing requirements regarding raters. The
multi-view strategy requires that researchers select multiple raters with varying distance bias and
minimum representation bias. In contrast, the mono-view strategy requires that researchers use
one rater for ontologically subjective traits and multiple raters from the same class of raters for
ontologically objective traits. In the mono-view strategy, this rater, or class of raters, should be
the one specified in the theory (e.g., the user perceiving an IT’s ease-of-use with the concomitant
construct called “perceived ease-of-use”). By definition, this rater will have minimum distance
bias. Nevertheless, s/he may still provide ratings with representation bias. The following steps
of the approach (instruments, procedures, and data analysis) offer ways to eliminate, identify,
and account for such representation bias. However, if the level of representation bias is expected
to be very substantial, this would signal a limitation of methods and the researcher would need to
revert to the multi-view strategy, as described above.
5.4.2.2 Executing a Strategy: Instrument and Procedure
Because distance bias only relates to raters (per Table 5.3), the two strategies adopt the
same approach regarding instruments and procedures: to use instruments and procedures that are
associated with minimum representation bias. Because representation bias is unlikely to be zero
with any instrument or procedure, using multiple instruments and procedures enables researchers
to attempt to triangulate (i.e., converge) on the trait scores (Sechrest et al. 2000, Levins 1966).

185
5.4.2.3 Executing a Strategy: Data Analysis
As Figure 5.4 shows, the two strategies deal with representation bias in the same manner.
First, they attempt to eliminate representation bias by converging across scores obtained from
different raters (within the same class), different instruments, or different procedures. Second,
they attempt to identify and account for any remaining representation bias in the data. Statistical
techniques for doing so are reasonably mature, such as the use of structural equation modeling
techniques to identify and account for common method bias (Podsakoff et al. 2003).
In addition to testing for representation bias, the multi-view strategy requires testing of
distance bias. Techniques for doing so include tests for differences in scores of a trait by
different raters (e.g., via comparison of means) and tests for differences in relationships
depending on the rater(s) used for measuring each trait (e.g., via comparisons of path
coefficients). New techniques for testing distance bias are emerging, though not yet mature
(Austin et al. 2002). Such emerging techniques include tests for measurement invariance, which
examine whether different raters interpret items in a survey in the same way (Vandenberg 2002),
and cognitive modeling techniques, which scrutinize the act of rating to determine whether a
rater is indeed scoring the intended trait (Borsboom et al. 2004).
Overall, reasonable data analysis techniques for addressing representation bias and
distance bias exist. What has been missing is an approach for choosing an appropriate set of
such techniques for a given study. The proposed approach provides a first step in this direction.
5.4.3 Using the Approach in Practice: The Importance of Judgment and Multiple Studies
The proposed approach is the first comprehensive guide for dealing with method
variance. However, it has two important limitations. First, its requirements are onerous. For
example, the multi-view strategy suggests that researchers consider rating each construct in a
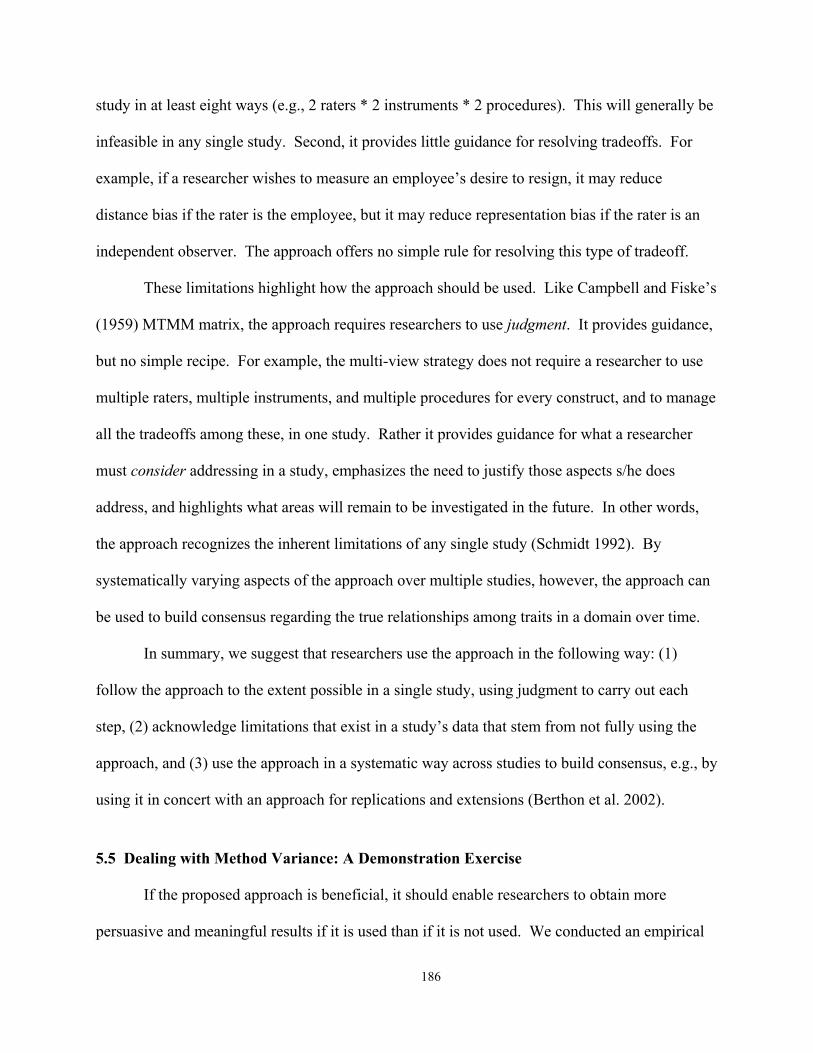
186
study in at least eight ways (e.g., 2 raters * 2 instruments * 2 procedures). This will generally be
infeasible in any single study. Second, it provides little guidance for resolving tradeoffs. For
example, if a researcher wishes to measure an employee’s desire to resign, it may reduce
distance bias if the rater is the employee, but it may reduce representation bias if the rater is an
independent observer. The approach offers no simple rule for resolving this type of tradeoff.
These limitations highlight how the approach should be used. Like Campbell and Fiske’s
(1959) MTMM matrix, the approach requires researchers to use judgment. It provides guidance,
but no simple recipe. For example, the multi-view strategy does not require a researcher to use
multiple raters, multiple instruments, and multiple procedures for every construct, and to manage
all the tradeoffs among these, in one study. Rather it provides guidance for what a researcher
must consider addressing in a study, emphasizes the need to justify those aspects s/he does
address, and highlights what areas will remain to be investigated in the future. In other words,
the approach recognizes the inherent limitations of any single study (Schmidt 1992). By
systematically varying aspects of the approach over multiple studies, however, the approach can
be used to build consensus regarding the true relationships among traits in a domain over time.
In summary, we suggest that researchers use the approach in the following way: (1)
follow the approach to the extent possible in a single study, using judgment to carry out each
step, (2) acknowledge limitations that exist in a study’s data that stem from not fully using the
approach, and (3) use the approach in a systematic way across studies to build consensus, e.g., by
using it in concert with an approach for replications and extensions (Berthon et al. 2002).
5.5 Dealing with Method Variance: A Demonstration Exercise
If the proposed approach is beneficial, it should enable researchers to obtain more
persuasive and meaningful results if it is used than if it is not used. We conducted an empirical
187
study to test this proposition and demonstrate the feasibility of the approach. The sections below
describe the study context, detail how the proposed approach was used, and present the results.
5.5.1 Context of the Demonstration
As the proposed approach focuses solely on the selection of methods and data analysis
techniques, it assumes that a researcher has already selected a theoretical and empirical context.
To focus this demonstration as much as possible on the applying the proposed approach, we
adopted the theoretical and empirical context of an existing study: Burton-Jones and Straub
(2004) (i.e., Chapter 2). We chose this study for two reasons. First, it studies an important
context: the relationship between system usage and task performance. System usage is a central
construct in IS research, yet there have been repeated calls to examine it more closely (DeLone
and McLean 2003; Ginzberg 1978; Trice and Treacy 1986), especially in relation to its link with
performance (Chin and Marcolin 2001).
Second, Burton-Jones and Straub (2004) present a detailed account of usage measures,
but are silent on what methods to use to obtain these measures. Moreover, there is little
consensus in IS literature regarding the best methods for measuring system usage. Most studies
use self-report questionnaires and focus on ontologically objective aspects of usage (see
Appendix 5A). However, several studies have shown that results can vary depending on the
aspect of use measured and the method used to measure it (Collopy 1996; Straub et al. 1995;
Szajna 1996). Thus, this context serves as a good test case for examining the usefulness of the
approach.
We therefore designed this study as a methodological extension of the Burton-Jones and
Straub study (per Berthon et al. 2002). We describe the theoretical and empirical context of the
study below.

188
5.5.1.1 Theoretical Context
Figure 5.5 presents the theoretical model proposed by Burton-Jones and Straub (2004).
They defined system usage and task performance as follows:
• System usage: a user’s employment of one or more features of a system to perform a task. • Task performance: an assessment of task outputs in terms of effectiveness.
Burton-Jones and Straub (2004) limited their account of the relationship between system usage
and task performance to short-run, cognitive engaging tasks. They theorized that in this context,
the type of usage that most closely relates to performance is a user’s exploitation of his/her
knowledge of the IS to perform the task (March 1991). They proposed that such “exploitive”
usage could be modeled via two dimensions:
• Cognitive absorption: The extent to which the user is cognitively engaged in his/her use of the system to perform the task.
• Deep structure usage: The extent to which the user is using the features of the system that support the structure of the task.
Cognitive absorption reflects an ontologically subjective trait because it exists in the user’s mind.
Deep structure usage and performance are ontologically objective, observer-dependent traits as
they are observable, but different observers may view them differently (see Figure 5.5).
Legend: the subscripts ‘Exploit’ and ‘Short-run’ indicate that this theoretical model specifies the
relationship between exploitive system usage and short-run task performance. Figure 5.5: Theoretical Model for the Demonstration Exercise
5.5.1.2 Empirical Context
To test the theoretical model in Figure 5.5, Burton-Jones and Straub (2004) conducted an
Cognitive Absorption
Deep Structure Usage
System Usage Exploit Task Performance Short-run
Ontologically subjective
Ontologically objective
Ontologically objective
Effectiveness +
+
189
experiment in which they examined accountants’ use of Microsoft Excel for financial analysis
and they tailored their measures for each construct to this specific domain. We adopt the same
empirical context in this investigation. This allows us to use some of the measures in the Burton-
Jones and Straub (2004) study and concentrate on applying the proposed approach for selecting
methods and data analysis techniques. We briefly summarize the experiment below.
Task and Design. The task required a user to build a spreadsheet model in MS Excel to
determine the best approach for financing an asset purchase. The task enabled a strong test of the
theoretical model as it was cognitively engaging, which allows variation in cognitive absorption,
the system contains features that support the task, which allows variation in deep structure usage,
and it required the student to complete the task within 1.5 hours, which enabled a test of short-run
task performance. The experiment used a free simulation design (Fromkin and Streufert 1976),
which allows values of the IVs (i.e., cognitive absorption and deep structure usage) to vary freely
over their natural range. This design was chosen rather than a factorial design because it gives an
insight into nature of the IV DV relationship without restricting the range over which it occurs.
Subjects. Subjects were 229 students in an intermediate accounting course in a southern
U.S. university. Data were collected during an end-of-semester case-exam worth 10% of
students’ grades. The case used the same general format as in eight previous assignments that
the students had completed and it involved accounting concepts learned during the course
(present value, asset financing, and risk/return). Therefore, to the greatest extent possible, the
system and task were believed to enable exploitive use by the subjects.
5.5.2 Demonstration of the Approach
Given the theoretical and empirical context outlined above, Figure 5.6 summarizes how
we applied the proposed approach. The following sections detail our application of each step.

190
Selecting a Strategy for Dealing with Method Variance
Selected Strategy: Multi-view Strategy
Executing the Multi-view Strategy for Dealing with Method Variance
Guidance for Executing the Multi-View Strategy Application of the Multi-View Strategy
4. Rater
Use multiple raters with varying degrees of distance bias and minimum representation bias for both
ontologically objective and subjective traits.
4. Rater
To vary distance bias, we obtained ratings of each construct from end-users and multiple observers.
To minimize representation bias, we ensured that both sets of raters were independent from the research and that observers were independent from the end-users.
5. Instrument & Procedure
Use multiple instruments and procedures associated with minimum representation bias.
5. Instrument & Procedure
We used two instruments: self-report questionnaires for end-users and coding schemes for observer ratings. To reduce representation bias, we validated and pre-tested the instruments and procedures and ensured
raters that their responses would remain anonymous.
6. Data Analysis
Eliminate representation bias by converging across raters in the same class, instruments, and procedures.
Identify and account for remaining representation bias.
Test for divergence across raters due to distance bias.
6. Data Analysis
We eliminate representation bias by converging across the ratings of two independent observers.
We identify and account for remaining representation bias by testing whether items measured by the same rater load
on a common methods factor and whether common methods bias increases path estimates.
We test for distance bias by testing whether path estimates differ depending on the raters used.
Figure 5.6: Applying the Proposed Approach in this Demonstration Exercise
1. Nature of Inquiry Is the inquiry confirmatory?
2. Nature of Theory Does the theory specify a rater?
3. Nature of Methods Is the desired rater available?
Yes
No

191
5.5.2.1 Selecting a Strategy for Dealing with Method Variance
The first criterion for selecting a strategy for dealing with method variance is to consider
the nature of the inquiry. Burton-Jones and Straub (2004) conducted a confirmatory inquiry, i.e.,
they set out to examine whether an empirical test would confirm the theoretical model in Figure
5.5. Because the aim of this demonstration is to show how the proposed approach would apply
in the context of the proposed theoretical model, it adopts the same confirmatory approach as in
Burton-Jones and Straub (2004). The next step is to examine whether the theory specifies a rater.
This is the deciding step here because Burton-Jones and Straub (2004) did not define their
theoretical constructs in terms of specific raters. Thus, as Figure 5.6 shows, the multi-view
strategy is appropriate in this case, irrespective of the nature of methods.
5.5.2.2 Executing a Strategy for Dealing with Method Variance
Raters. The multi-view strategy requires researchers to use multiple raters with varying
distance bias and minimum representation bias.
To achieve varying distance bias, we selected two classes of raters: end-users and
observers. We chose these two classes because differences between their views could be
relevant in practice, e.g., in the context of judging user performance at work. As Figure 5.7
shows, the use of these raters creates the possibility for many types of distance bias. For the
ontologically objective traits (deep structure usage and performance), end-users and observers
could differ in their scores for two reasons: (1) end users and observers may view the task
differently, due to differing knowledge of the task or system (Figure 5.7, path D1), and (2) end-
users and observers may provide incorrect, but nevertheless true, perceptions of deep structure
usage and performance because of memory limitations (Blair and Burton, 1987) (Figure 5.7, path
D2). Likewise, for the ontologically subjective trait (cognitive absorption), end-users and
observers could provide different scores for these traits because: (1) observers (and to some
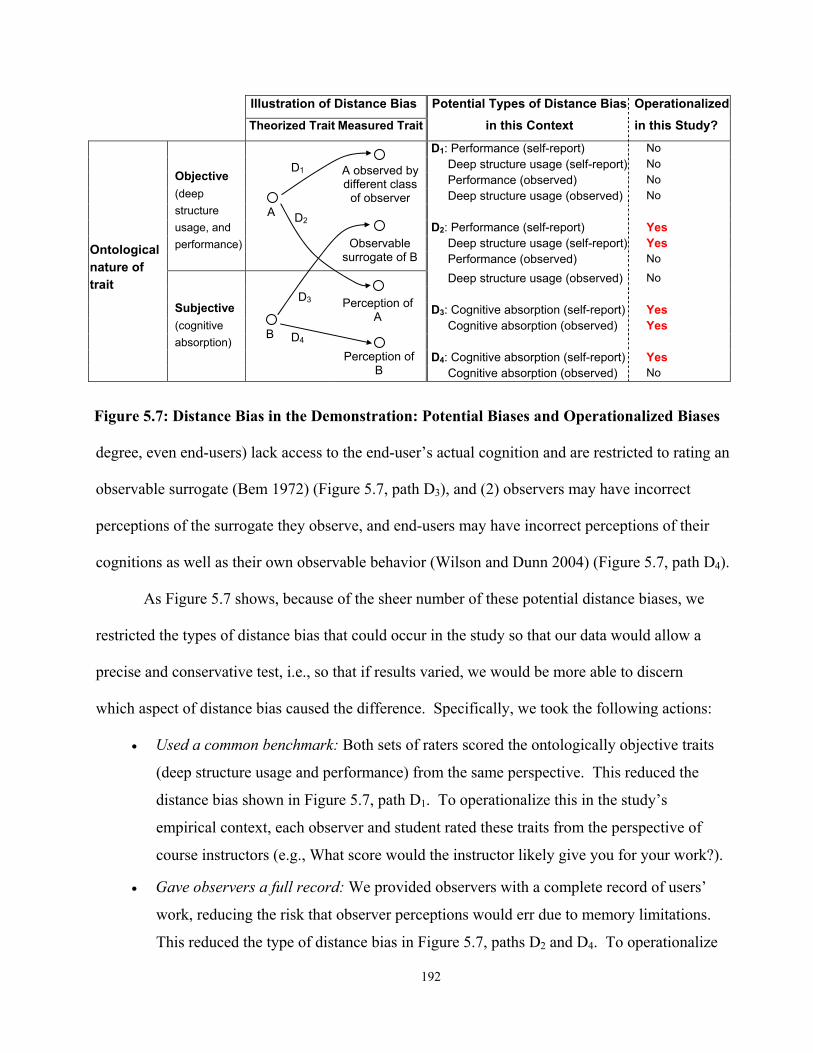
192
Illustration of Distance Bias
Theorized Trait Measured Trait
Potential Types of Distance Bias in this Context
Operationalized in this Study?
D1: Performance (self-report) No Deep structure usage (self-report) No Performance (observed) No Deep structure usage (observed) No
D2: Performance (self-report) Yes Deep structure usage (self-report) Yes
Objective (deep structure usage, and performance)
Performance (observed) No
Deep structure usage (observed) No D3: Cognitive absorption (self-report) Yes Cognitive absorption (observed) Yes D4: Cognitive absorption (self-report) Yes
Ontological nature of trait
Subjective (cognitive absorption)
Cognitive absorption (observed) No
Figure 5.7: Distance Bias in the Demonstration: Potential Biases and Operationalized Biases
degree, even end-users) lack access to the end-user’s actual cognition and are restricted to rating an
observable surrogate (Bem 1972) (Figure 5.7, path D3), and (2) observers may have incorrect
perceptions of the surrogate they observe, and end-users may have incorrect perceptions of their
cognitions as well as their own observable behavior (Wilson and Dunn 2004) (Figure 5.7, path D4).
As Figure 5.7 shows, because of the sheer number of these potential distance biases, we
restricted the types of distance bias that could occur in the study so that our data would allow a
precise and conservative test, i.e., so that if results varied, we would be more able to discern
which aspect of distance bias caused the difference. Specifically, we took the following actions:
• Used a common benchmark: Both sets of raters scored the ontologically objective traits
(deep structure usage and performance) from the same perspective. This reduced the
distance bias shown in Figure 5.7, path D1. To operationalize this in the study’s
empirical context, each observer and student rated these traits from the perspective of
course instructors (e.g., What score would the instructor likely give you for your work?).
• Gave observers a full record: We provided observers with a complete record of users’
work, reducing the risk that observer perceptions would err due to memory limitations.
This reduced the type of distance bias in Figure 5.7, paths D2 and D4. To operationalize
A observed by different class
of observer A
D1
Observable surrogate of B
Perception of B
Perception of A
B
D3
D4
D2

193
this, we provided coders with each user’s task output and a video record of his/her Excel
use. The video data was subject to protocol analysis and for practical reasons, it was
limited to the work of 46 users. This sample is significantly larger than samples used in
prior protocol analyses in IS research (e.g., n=18 (Mackay and Elam 1992), n=6 (Vessey
and Conger 1994) and n= 7 (Kim et al. 2000)).47
To achieve minimum representation bias, we followed Campbell and Fiske’s (1959)
principle to ensure that raters were independent. This meant ensuring that end-users and
observers were independent from the research (so they had no incentive to provide confirming
results) and that end users and observers were independent from each other (so that observers
have no incentive to misrepresent users’ work). To further reduce representation bias in observer
ratings, we used two raters from the same observer class to provide us with the data necessary to
later eliminate idiosyncratic representation bias by converging across rater scores.
In summary, we achieved the objective of this step (i.e., having multiple raters with
varying distance bias and minimum representation bias) by obtaining ratings for each construct
from end-users and multiple expert observers. These classes of raters were independent from the
study and from each other. Table 5.4 summarizes our operationalization of this step in the study.
Table 5.4: Raters used in the Experiment
Type of Construct Type of Rater Explanation of Rating End-users Each student performing the exercise rated deep structure usage and
performance from the perspective of the course instructors (e.g., What percent do you think the course instructor would give you for your work?).
Ontologically objective traits (Deep structure usage and performance) Observers Two independent coders rated deep structure usage (by reviewing video
records of end-users’ use of Excel) and task performance (by reviewing end-users’ task outputs). These two constructs were rated according to coding schemes that matched the perspective of the course instructors.
End-users Each student performing the exercise rated his/her cognitive absorption. Ontologically subjective trait (Cognitive absorption)
Observers Independent coders used video records of end-users’ Excel use to rate cognitive absorption. Coders rated cognitive absorption according to a coding schemed that matched observable correlates of this trait.
47 The sub-sample for protocol analysis did not differ significantly from the full sample (e.g., knowledge of Excel [r = .11, p = .17], final exam performance [r = .08, p = .23], and average performance in past exercises [r = .11, p = .12]).

194
Instruments and Procedures. The multi-view strategy requires researchers to use
multiple instruments and procedures associated with minimum representation bias.
We selected two instruments: questionnaires for end-users and structured coding schemes
for observer ratings. Table 5.5 lists the instruments, which we discuss in turn below.
Table 5.5: Instruments used in the Experiment
Construct Instrument Items Self-Report Questionnaire (reflective scale)
CS1: When I was using MS Excel, I was able to block out all other distractions CS2: When I was using MS Excel, I felt totally immersed in what I was doing CS3: When I was using MS Excel, I felt completely absorbed in what I was doing CS4: When I was using MS Excel, my attention did not get diverted very easily
Cognitive absorption
Independent Observation (formative scale)
CI1: Clear strategy: Independent rater’s perception of whether a user was following a clear strategy in his/her work.
CI2: Activity: Percentage of a user’s work time that s/he appeared to be working. (Instances of non-work were those in which no activity occurred for > 4 secs)
Self-Report Questionnaire (reflective scale)
DS1: When I was using MS Excel, I used features that helped me compare and contrast aspects of the data
DS2: When I was using MS Excel, I used features that helped me test different assumptions in the data
DS3: When I was using MS Excel, I used features that helped me derive insightful conclusions from the data
DS4: When I was using MS Excel, I used features that helped me perform calculations on my data
Deep structure usage
Independent Observation (formative scale)
DI1: The extent to which students used “function” features (e.g., to write formulae)DI2: The extent to which students used “fill” features (e.g., to copy or fill data
and/or formulae across a spreadsheet) Self-Report Questionnaire (formative scale)
PS1: Overall: My instructor would probably give me the following score in percentage terms on the case I just completed. [Open ended scale].
PS2: Quantity: I believe that I completed all required parts of the case PS3: Quality: The instructor would probably consider my work to be of very high
quality
Performance
Independent Observation (single item, reflective)
PI1: This single percentage score allocated marks for the following elements (identifying the problem, building a flexible model, correctly analyzing the data, identifying solutions, highlighting impacts, focusing the report, and giving clear recommendations).
†Unless indicated, all self-report questionnaire items used a 9-point strongly agree-strongly disagree Likert scale. For cognitive absorption, the questionnaire used Agarwal and Karahanna’s (2000) pre-
validated, reflective scale, which was also the same scale employed in Burton-Jones and Straub
(2004). The coding scheme for observer ratings of cognitive absorption was created afresh.
Because the experimental case was a problem-solving task, we first looked to theories of
cognition, which suggest that human problem-solving is carried out via a goal-directed sequence

195
of cognitive operations (Ashcraft 2002). On this basis, we constructed one surrogate of cognitive
absorption, ‘clear strategy,’ which was defined as the degree to which a user appeared to be
undertaking a sequence of goal-directed (rather than haphazard) operations in his/her use of
Excel. We then turned to research on flow (Csikszentmihalyi 1990). Flow theory suggests that
the behavior of cognitively absorbed individuals should, as the term suggests, ‘flow.’ Such
behavior occurs because the individual feels in control of his/her behavior and his/her attention is
focused in the task (Agarwal and Karahanna 2000). This suggests that cognitively absorbed
users should show evidence of continued, ‘flowing,’ rather than interrupted work. We therefore
chose a second surrogate of cognitive absorption: ‘activity,’ defined as the proportion of a user’s
work time that s/he appeared to be working. Research suggests that conscious cognitive
processes take “more than a second or two for completion” (Ashcraft 2002, p. 145). Thus, short
pauses cannot necessarily be considered non-work. To be conservative, we coded breaks in
activity of more than 4 seconds to be instances of idle time (i.e., breaks in flow). Although
theory suggests that these two surrogates (clear strategy and activity) both stem from cognitive
absorption, they need not correlate highly. For example, someone could be following a clear
strategy and yet break for 5 seconds, or could be working actively but haphazardly. Thus, we
model these two items as formative rather than reflective items (Chin 1998) (see Table 5.5).
For deep structure usage, we used the reflective questionnaire scale from Burton-Jones
and Straub (2004). They defined deep structure usage as use of features in the IS that support the
structure of the task. To ensure that the scale that matched the perspective of course instructors,
a course instructor supplied statements to characterize the structure of the task — which they
defined as analyzing data, testing assumptions, and deriving conclusions — and following the
approach in recent research (Subramani 2004), the items were adapted for this task domain (see
Table 5.5). To construct a coding scheme for observer ratings of deep structure usage, we first
196
constructed a comprehensive listing of Excel features. We then asked two instructors to indicate
the degree to which each feature supported the task’s deep structure (i.e., analyzing data, testing
assumptions, and deriving conclusions). Their ratings converged and indicated that two features
were the primary deep structure features: (1) functions (used for writing formulae) and (2) filling
(used for completing rows or columns of data using absolute or relative cell references) [ICC
(2,2) = .76] (Shrout and Fleiss 1979). We consider these two items to be formative because a
user may trade off use of one for another (e.g., by using a ‘fill’ feature to copy formulae across
cells rather than writing the formulae directly) (Diamantopoulos and Winklhofer 2001).
The scale for performance was created afresh. In the performance measurement
literature, work effectiveness has two components: quality and quantity (Meister 1986). We
therefore constructed a three-item self-report scale containing questions regarding overall
performance, quality of work, and quantity of work, all adapted to ask about effectiveness from
the perspective of the instructor or the course requirements. The items are considered formative
because students can trade-off quantity for quality, or vice versa (Bollen and Lennox 1991).
Independent from the research, the course instructors developed the coding scheme for observer
ratings of performance. This scheme awarded students a single percentage score based on
performance in seven aspects of the case.
Following recommended procedures (Goodhue and Loiacono 2002; Orne 1962;
Podsakoff et al. 2003; Webb et al. 2000), we took steps to reduce the risk that these instruments
and procedures would induce representation bias (see Table 5.6).
By following these steps, representation bias was reduced to a minimum. As noted
earlier, tradeoffs have to be made among biases. One such tradeoff had to be made in this study.
To vary distance bias, we determined (above) that each class of rater should rate each construct.
This means that each end-user in our study rated each construct in the model. As a result, this

197
Table 5.6: Steps to Minimize Representation Bias in Instruments and Procedures Instrument/Procedure Steps to Minimize Representation Bias
Questionnaire
Ran a Q-sorting exercise, pre-test, and pilot test to eliminate ambiguous items. Randomized items in the questionnaire to reduce hypothesis guessing. Assured respondents that questionnaire responses would remain anonymous.
Procedure for responding to the questionnaire
Pre-tested and pilot-tested the questionnaire to ensure that respondents had sufficient time to complete the questionnaire and that the instructions were clear.
Coding scheme Pre-tested the coding schemes to ensure that they enabled clear and accurate responses. Procedure for using coding scheme
Conducted practice coding to identify and eliminate idiosyncratic coding biases and to ensure that coders had sufficient time to code the video protocols. Separated the observers from the users to eliminate demand characteristics. Used difference coders for the usage data (IVs) than the performance data (DV).
self-report data may be influenced by common methods bias, e.g., end-users may attempt to align
their responses for the different traits to reduce cognitive dissonance. The ratings by observers
are not subject to this risk because unlike the end-users, we could use different observers from
the same observer class to rate the different traits.
To summarize, we followed the multi-view strategy to select raters, instruments, and
procedures expected to result in data that contain varying degrees of distance bias and, with the
exception of common method bias in the self-report data, minimum representation bias.
Data Analysis. The final step in the multiview strategy is to eliminate representation bias
via converging across raters, instruments, or procedures; identify and account for any remaining
representation bias in the data; and test for divergence due to distance bias (per Figure 5.6).
To eliminate idiosyncratic representation bias, we tested for the comparability of coder
ratings (finding that they were comparable; ICC [2, 2] = .73, system usage, .87, performance),
and converged (averaged) across the two coders’ ratings of each construct. As noted above, the
main source of representation bias that we expected to remain in the data following this step was
common methods bias. To identify and account for it, we ran a model that included a “common
method” factor and tested whether the items from each trait load on this factor (per Podsakoff et
al. 2003). Finally, to test for distance bias, we examined whether the use of raters with different
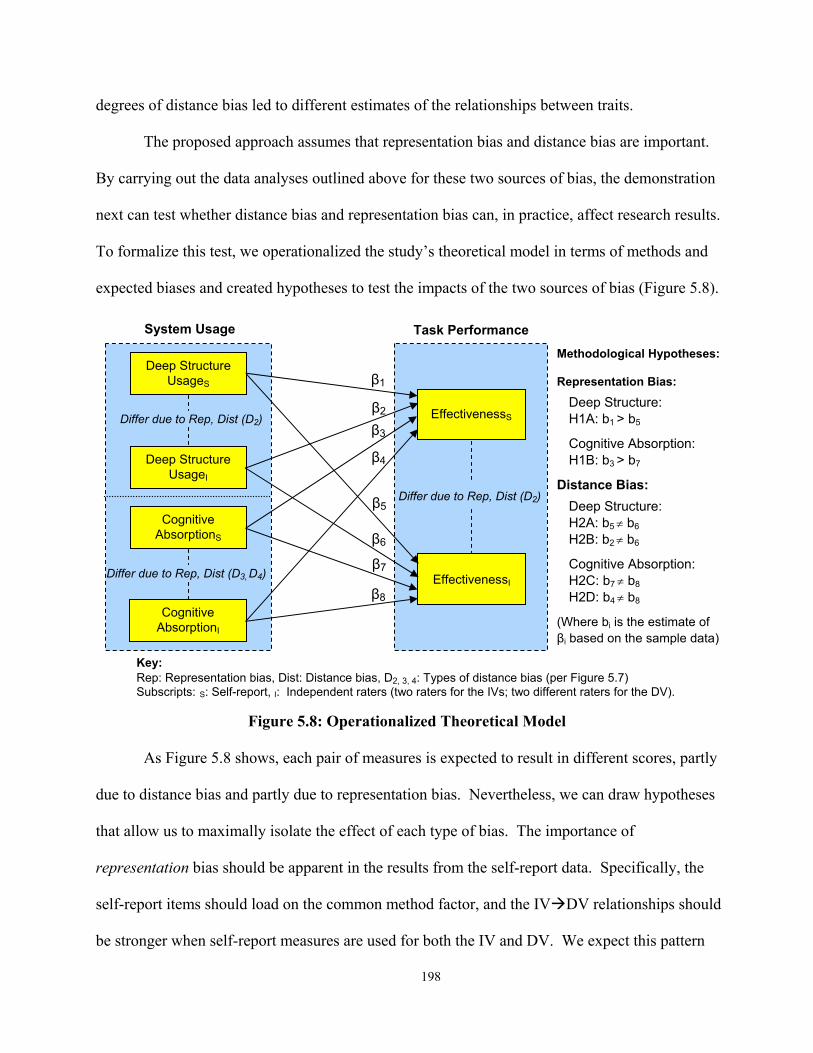
198
degrees of distance bias led to different estimates of the relationships between traits.
The proposed approach assumes that representation bias and distance bias are important.
By carrying out the data analyses outlined above for these two sources of bias, the demonstration
next can test whether distance bias and representation bias can, in practice, affect research results.
To formalize this test, we operationalized the study’s theoretical model in terms of methods and
expected biases and created hypotheses to test the impacts of the two sources of bias (Figure 5.8).
Figure 5.8: Operationalized Theoretical Model As Figure 5.8 shows, each pair of measures is expected to result in different scores, partly
due to distance bias and partly due to representation bias. Nevertheless, we can draw hypotheses
that allow us to maximally isolate the effect of each type of bias. The importance of
representation bias should be apparent in the results from the self-report data. Specifically, the
self-report items should load on the common method factor, and the IV DV relationships should
be stronger when self-report measures are used for both the IV and DV. We expect this pattern
Key: Rep: Representation bias, Dist: Distance bias, D2, 3, 4: Types of distance bias (per Figure 5.7) Subscripts: S: Self-report, I: Independent raters (two raters for the IVs; two different raters for the DV).
Cognitive AbsorptionI
Deep Structure UsageS
EffectivenessS
EffectivenessI
System Usage Task Performance
Differ due to Rep, Dist (D2)
Deep Structure UsageI
Cognitive AbsorptionS
β5
β6
β7
β8
β4
β1
β2 β3
Differ due to Rep, Dist (D3, D4)
Differ due to Rep, Dist (D2)
Methodological Hypotheses: Representation Bias:
Deep Structure: H1A: b1 > b5
Cognitive Absorption: H1B: b3 > b7
Distance Bias:
Deep Structure: H2A: b5 ≠ b6
H2B: b2 ≠ b6
Cognitive Absorption: H2C: b7 ≠ b8
H2D: b4 ≠ b8
(Where bi is the estimate of βi based on the sample data)

199
because the use of one questionnaire to obtain the IVs and the DV is expected to induce subjects
to align responses (e.g., to avoid cognitive dissonance) (Podsakoff et al. 2003). Thus, using the
notation in Figure 5.8, we pose the following methodological hypothesis: H1: Common methods bias has a significant effect on the relationships in the theoretical model.
H1A: The items for Deep Structure UsageS and PerformanceS load on a common factor.
Secondary test if H1A is supported: b1 > b5. H1B: The items for Cognitive AbsorptionS and PerformanceS load on a common factor.
Secondary test if H1B is supported: b3 > b7.
If distance bias is important in this study, the estimated relationships between constructs
should be influenced by the distance bias in the model. To ensure that this difference stems from
distance bias rather than representation bias, we test this hypothesis by comparing sets of paths
where the IV and DV in each case are measured by different raters (i.e., the IV and DV are rated
by different observers [IV observer/DV observer] or by different classes of raters [self/observer]).
It is difficult to specify the direction of the expected difference a priori because distance bias
results in measures of unintended traits and these traits (e.g., perceived absorption and perceived
performance) may have stronger or weaker relationships than those between the intended traits.
Thus, using the notation in Figure 5.8 we specify the following non-directional hypotheses: H2: Distance bias has a significant effect on the relationships in the theoretical model.
H2A: Deep Structure UsageI will have a different relationship with PerformanceI than will
Deep Structure UsageS. In other words, b5 ≠ b6. H2B: Deep Structure UsageI will have a different relationship with PerformanceI than with
PerformanceS. In other words, b2 ≠ b6. H2C: Cognitive AbsorptionI will have a different relationship with PerformanceI than will
Cognitive AbsorptionS. In other words, b7 ≠ b8. H2D: Cognitive AbsorptionI will have a different relationship with PerformanceI than with
PerformanceS. In other words, b4 ≠ b8.
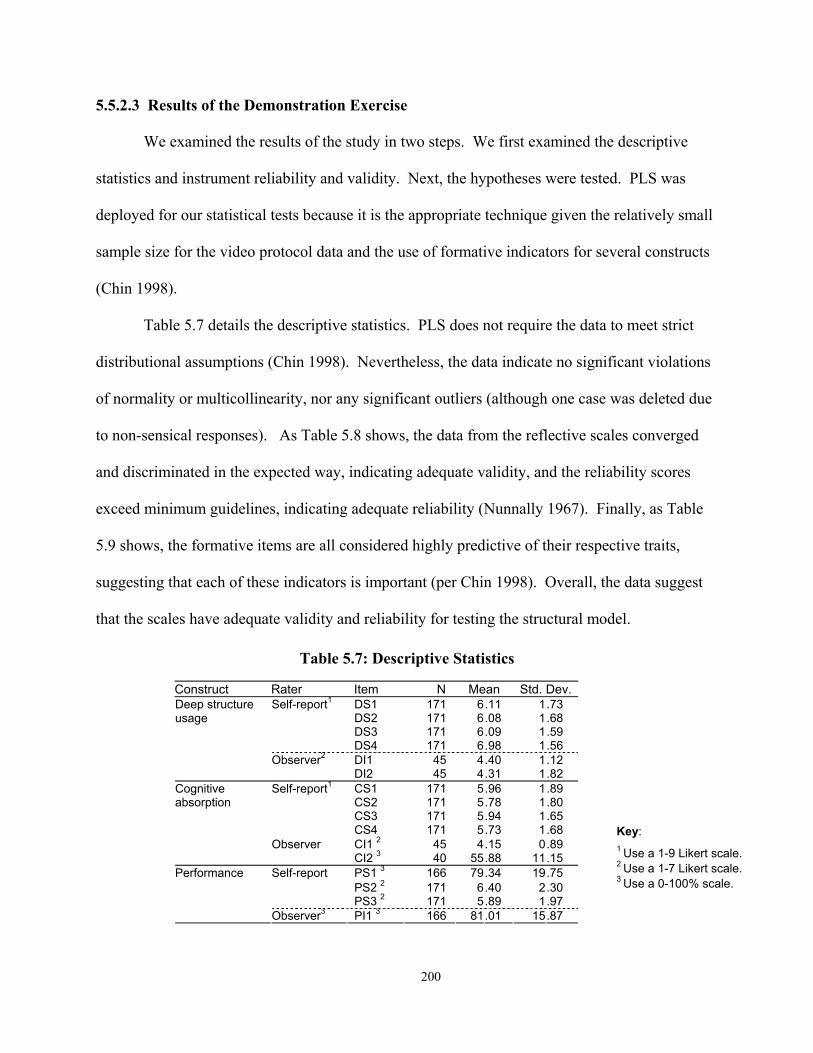
200
5.5.2.3 Results of the Demonstration Exercise
We examined the results of the study in two steps. We first examined the descriptive
statistics and instrument reliability and validity. Next, the hypotheses were tested. PLS was
deployed for our statistical tests because it is the appropriate technique given the relatively small
sample size for the video protocol data and the use of formative indicators for several constructs
(Chin 1998).
Table 5.7 details the descriptive statistics. PLS does not require the data to meet strict
distributional assumptions (Chin 1998). Nevertheless, the data indicate no significant violations
of normality or multicollinearity, nor any significant outliers (although one case was deleted due
to non-sensical responses). As Table 5.8 shows, the data from the reflective scales converged
and discriminated in the expected way, indicating adequate validity, and the reliability scores
exceed minimum guidelines, indicating adequate reliability (Nunnally 1967). Finally, as Table
5.9 shows, the formative items are all considered highly predictive of their respective traits,
suggesting that each of these indicators is important (per Chin 1998). Overall, the data suggest
that the scales have adequate validity and reliability for testing the structural model.
Table 5.7: Descriptive Statistics
Construct Rater Item N Mean Std. Dev. DS1 171 6.11 1.73 DS2 171 6.08 1.68 DS3 171 6.09 1.59
Self-report1
DS4 171 6.98 1.56 DI1 45 4.40 1.12
Deep structure usage
Observer2 DI2 45 4.31 1.82 CS1 171 5.96 1.89 CS2 171 5.78 1.80 CS3 171 5.94 1.65
Self-report1
CS4 171 5.73 1.68 CI1 2 45 4.15 0.89
Cognitive absorption
Observer CI2 3 40 55.88 11.15 PS1 3 166 79.34 19.75 PS2 2 171 6.40 2.30
Self-report
PS3 2 171 5.89 1.97
Performance
Observer3 PI1 3 166 81.01 15.87
Key:
1 Use a 1-9 Likert scale. 2 Use a 1-7 Likert scale. 3 Use a 0-100% scale.

201
Table 5.8: Instrument Validity and Reliability for Reflective Scales Item DS CS Reliability2
DS4 0.86 0.53 DS3 0.82 0.31 DS2 0.81 0.39 DS5 0.73 0.38
DS: Cron. α = 0.82
CR = 0.70
CS4 0.45 0.84 CS2 0.36 0.81 CS5 0.36 0.81
Loadings and Cross-loadings1
CS1 0.45 0.73
CS: Cron. α = 0.81
CR = 0.69
DS 0.80 - Correlations and AVE3 CS 0.51 0.81
Table 5.9: Weights for Formative Scales Construct Rater Item Weight
DI1 .995 Deep structure usage
Observer DI2 .841 CI1 .995 Cognitive
absorption Observer
CI2 .715 PS .940 PS2 .954
Performance Self-report
PS3 .811
The results for the hypotheses are shown in Figure 5.9 and Tables 5.10-11. The
theoretical model appears to have a high level of explanatory power, given the high R2s and small
sample size (n = 45). Table 5.10 provides support for H1, as all the items that shared a common
method load significantly on the common method factor. Table 5.11 provides further support for
H1, as the estimated relationships between constructs increased when methods were shared
(supporting H1A-B). Table 5.11 suggests that the impact of distance bias depends on the
construct being considered. Specifically, distance bias appears to significantly affect the
relationship between deep structure usage and performance (supporting H2A-B), but not the
relationship between cognitive absorption and performance (not supporting H2C-D).
Summary of Results. The results demonstrate that representation bias and distance bias
can significantly influence estimated relationships among constructs and can strongly influence a
study’s conclusions, e.g., determining whether or not an IV is considered to be a significant
predictor of a DV (as Figure 5. 9 shows) and creating changes of up to 20% in explanations of a
Key:
1 Obtained from PLS. All loadings are significant (p<.05).
2 Cronbach’s alpha obtained from SPSS, CR obtained from PLS.
3 The values on the diagonal are the square root of each construct’s AVE (Average Variance Extracted) and should be higher than .50.

202
Figure 5.9: Results of Testing the Operationalized Theoretical Model
Table 5.10: Results of Hypothesis 1: Representation Bias Items
DS1 DS2 DS3 DS4 CS1 CS2 CS3 CS4 PS1 PS2 PS3 Hypothesis Supported?
Loadings** .70* .69* .73* .53* .76* .60* .55* .51* .81* .82* .75* Yes ** Loadings on the common method factor; * Significant at p < .05 one tailed.
Table 5.11: Results for Hypothesis 1 and 2: Representation Bias and Distance Bias Hypothesis Results bX1 bX2 bX1 (SEX1) bX2 (SEX2) t R2 diff2
Hypothesis Supported?
H1A: 1 b1 > b5 .30 (.16) > 0.14 (.14) 4.92* .13 Yes H1B: 1 b3 > b7 .32 (.15) > 0.23 (.13) 3.03* .07 Yes H2A: b5 ≠ b6 .14 (.14) ≠ 0.38 (.11) -9.06* .20 Yes H2B: b2 ≠ b6 .17 (.16) ≠ 0.38 (.11) -7.21* .18 Yes H2C: b7 ≠ b8 .23 (.13) ≠ 0.27 (.11) -1.43 .093 No H2D: b4 ≠ b8 .26 (.15) ≠ 0.27 (.11) -0.21 .04 No
1 The pattern of results for H1A and H1B are the same in the n= 45 and n = 171 samples. The results for the smaller sample are shown here to be consistent with the other tests in this table.
2 R2 diff.: the difference between the R2 of each path when each path is run on its own. 3 These paths have significantly different betas when run singly, but not when run in a full model. * Significant at p < .05. The t-test is a two independent samples t-test; the formula is ( ) ( ) ( )2
221
2121 nsnsbb +− .
DV (as Table 5.11 shows). Overall, the results strongly support the proposed approach because:
• The approach suggested that the theoretical model should be tested with the multi-view strategy because none of the constructs were defined in terms of specific raters, and
• By following the multi-view strategy, we found that the choice of raters can have a substantial effect on the results of testing the theoretical model.
Subscripts:S: Self-report I: Independent
rater
* Significant at p < .05 (one-tailed)
System Usage Task Performance
Cognitive AbsorptionI
Deep Structure UsageS
EffectivenessS
R2 = .60
EffectivenessI
R2 = .59
Deep Structure UsageI
Cognitive AbsorptionS
b5
b6* b7* b8*
b4*
b1* b2 b3*

203
It is important to note that although the multi-view strategy tests for differences in results
due to distance bias, it does not place a value judgment on any specific difference. For example,
we found that the distance biases in measures of deep structure usage and performance led to
differences in the estimated relationships between these two constructs (H2A-B). However, we
do not conclude that the methods that led to stronger relationships are necessarily ‘better.’
Rather, we conclude that the different methods may be measuring different traits, and that this
difference is an important finding that requires further theoretical and empirical investigation.
Similarly, we found that differences in distance bias between different measures of
cognitive absorption and performance did not appear to lead to differences in the estimated
relationships between these constructs (H2C-D). Again, this apparent lack of difference is an
important result. It may indicate that observers are able to accurately infer user cognitions
despite their obvious lack of access to the cognitions. Alternatively, it may indicate that
individuals’ knowledge of their own cognitions is so limited that their reports of cognitive
absorption are no better than observer estimates (per Wilson and Dunn 2004). Further
theoretical and empirical investigation is needed to test whether either of these is the case.
Nevertheless, the identification of these research opportunities is a direct and useful result of
following the multiview strategy.
5.6 Discussion
This study presents a comprehensive approach for dealing with method variance in IS
research. It contributes in four ways, summarized in Table 5.12, which we discuss in turn below.
The core contribution of the study is that it provides the first comprehensive approach for
dealing with method variance in IS research. Despite the long-standing significance of method
variance, there remains no accepted approach for dealing with it (Sechrest et al. 2000). In past

204
Table 5.12: Research Contributions and Implications
Element of Research Contribution Staged Approach Provides the first comprehensive approach for dealing with method variance in IS research
- Selection Stage Enables researchers to choose a strategy that is consistent with the research question, theory, and methodological constraints in a given study.
- Execution Stage Enables researchers to deal with method variance in a manner that is consistent with their study and supports the development of cumulative progress over multiple studies.
Demonstration Exercise of the Staged Approach
Provides indicative evidence that the staged approach is feasible, demonstrates the magnitude of method effects when measuring system usage, and reveals new opportunities for future research in an important, practical domain.
research, a major impediment to developing such an approach was the conceptual complexity of
method variance (Fiske and Campbell 1992; Sechrest et al. 2000). By decomposing “method”
into its components and “method variance” into its sources, we were able to overcome this
problem and build a comprehensive, yet parsimonious approach, consisting of two strategies,
three criteria for selecting a strategy, and three areas of guidance for executing each strategy.
Because no comprehensive approach for dealing with method variance has appeared in the
methodological literature, it is not surprising that IS researchers rarely deal with it, and when they
do, do so only partially (Woszczynski and Whitman 2004). Nevertheless, the situation is
alarming because method variance can undermine theoretical progress (by leading researchers to
accept poor theories and reject good theories due to biased data), can lead researchers to make
inappropriate recommendations for practice (by basing recommendations on biased data), and
because partial approaches for dealing with method variance can exacerbate its problems while
creating a false sense of security in the validity of results. The proposed approach offers a way to
overcome these problems.
Each stage of the proposed approach offers additional contributions. For example, the
selection stage contributes by providing researchers with a parsimonious set of principles for
selecting a strategy for dealing with method variance that is consistent with the aim and context
of a given study. The criteria we propose for selecting a strategy (i.e., nature of inquiry, nature

205
of theory, and nature of methods) are broad enough to support any type of positivist IS research.
However, in past research, these criteria have very rarely been used explicitly to justify the
selection of methods in positivist IS research. For example, as the Appendix shows, most studies
of system usage have focused on its objective aspects and have obtained measures via self-report
questionnaires. In many of these studies, we believe that the most likely reason researchers
chose to use the self-report method is because of its use in past research (and perhaps its
convenience) rather than because of its appropriateness for the study’s theoretical context. By
encouraging researchers to justify their selection of methods in terms of study research question
and theoretical context, the proposed approach should help improve theoretical tests and improve
theoretical progress, e.g., by providing a basis for designing research programs and conducting
meta-analyses.
The execution stage contributes by providing detailed guidance for carrying out each
strategy. Of the two strategies, the mono-view strategy is perhaps the more traditional. This
strategy considers method variance to be an unwanted source of error that should be eliminated.
Even though this view is common (Webb et al. 2000), there has never been any comprehensive
approach for addressing method variance in this context, except for Campbell and Fiske’s (1959)
suggestion to use multiple independent methods. The lack of detailed guidance in past research
has led to the use of partial approaches for dealing with method variance, e.g., the belief that it
can be addressed by using a different method for the IV and DV, or by using ‘objective’ rather
than self-reported methods. None of these techniques fully addresses method variance. The
guidance offered in our mono-view strategy should assist researchers deal with method variance
more completely.
The multi-view strategy is novel. However, because it is the less restrictive of the two
strategies, it is likely to be the appropriate strategy in more cases than the mono-view strategy.

206
The multiview strategy enables researchers to extend theory by examining the potential
importance of distance bias in a study. Many constructs in IS (e.g., IS spirit, IS security
effectiveness, IS success, IS use) are not explicitly defined in terms of one class of observers and
yet could potentially be perceived differently by different classes of observers. Despite this,
there has been little systematic research in IS to test the existence or effects of these differences.
For example, in studies of system usage, theories of technology acceptance (e.g., TAM, Davis
1989) have propelled a great deal of research predicting when and how much people will use a
new IS. Even though these theories (e.g., TAM) did not define usage in terms of specific raters,
most researchers have measured system usage from the perspective of end-users (i.e., via self-
reports, per the Appendix). This led to rapid progress in the development of technology
acceptance theories, but at the cost of a narrow view of the dependent variable. Despite some
researchers’ efforts to test whether these theories are robust to representation bias (e.g., common
method bias, Venkatesh et al. 2003), there has been no systematic attempt to examine the
implications of distance bias on system usage, e.g., by developing theories to explain differences
in views of usage held by different classes of raters. The proposed approach provides a way to
systematically investigate these issues and, by so doing, enrich theories of technology
acceptance. To be sure, uncovering the local meanings of constructs in this way has long been a
key focus of interpretive research (Lee 1991), but we believe that positivist research can also
contribute by systematically identifying relevant classes of observers and empirically testing
whether their different viewpoints are significant in practice.
A final contribution of our research is that the demonstration exercise provides evidence
that the approach is feasible and beneficial in an important domain: studies of system usage and
task performance. The demonstration also reveals new research opportunities. For example, it
appears that ratings of ontologically objective aspects of usage may be very sensitive to the
207
choice of rater but that observations of ontologically subjective aspects of usage may not suffer
as great a distance bias as initially expected. While the results require further investigation, they
underscore that we are still at an early stage of understanding how best to measure system usage.
When assessing the contributions of the demonstration exercise, it is important to
recognize its limitations. In terms of construct validity, future researchers could examine
whether our results hold if different elements of the multi-view strategy had been implemented
(e.g., if different choices of raters, instruments, or procedures had been made). In terms of
internal validity, future tests of the approach could develop ways to more precisely separate the
effects of representation bias and distance bias and to investigate their individual and joint
impacts. The explained variance of our tests indicated adequate statistical conclusion validity,
but we acknowledge that the same size was small and that a larger sample would allow a more
powerful test. Finally, in terms of external validity, the empirical study comprised just one
experiment; further replications and extensions in the field would, of course, be valuable.
5.7 Conclusion
To overcome the lack of an explicit approach for selecting methods in IS research, the
present study has clarified the meaning of method variance and advanced the first comprehensive
approach for dealing with it in IS research. The approach consists of two stages. The first stage,
selection, recommends that researchers consider the nature of inquiry, nature of theory, and
nature of methods in a given study to select an appropriate strategy for a study’s context. The
second stage, execution, provides guidance for addressing method variance in a study by
choosing appropriate raters, instruments, procedures, and data analysis techniques.
In the present study, we demonstrated how the proposed approach would work through
an empirical investigation in which we examined the degree to which method effects influence

208
estimates of the relationship between individual system usage and task performance. The results
strongly support the proposed approach and indicate that simplistic choices of methods can lead
to significantly biased explanations of performance and mask important research opportunities.
Despite acknowledged limitations, we believe the staged approach advanced in this paper
helps to clarify the meaning of method variance and the range of techniques that can be used to
address it. Given the importance of research methods in positivist IS research, our focused
examination of the problem should enable researchers to obtain more meaningful findings,
improve cumulative progress, and lead to more informed use of IS research results in practice.

209
Appendix 5A: Measures and Methods for Measuring System Usage in Past Research
Study Measure of System Usage
(Number of measures, description) Ontological Nature of Trait
Rater Instrument
(Benbasat and Schroeder 1977)
1, Reports requested Objective Computer Computer logs
(Lucas 1978b) 3, Use or non-use, direct or indirect access, and extent of use (number of searches, displays, printed reports)
Mainly objective (some omnibus)
Self-report, Computer
Questionnaire, Computer logs
(Ginzberg 1981) 3, Avg. connect time, avg. number of sessions, avg. number of functions executed per month.
Objective Computer Computer logs
(Alavi and Henderson 1981)
1, Use or non-use Omnibus Self-report, Computer
Questionnaire, Computer logs
(Benbasat et al. 1981)
3, Frequency of use, use of system defaults, use of particular commands
Objective Computer Computer logs
(Culnan 1983) 2, Avg. number of searches, frequency of use Objective Self-report Questionnaire (Barki and Huff 1985)
1, % time used for decision making Objective Self-report Questionnaire
(Mahmood and Medewitz 1985)
1, Extent of use Omnibus Self-report Questionnaire
(Srinivasan 1985) 4, Frequency of use, duration of use, extent (light/heavy), number of reports
Mainly objective (some omnibus)
Self-report Questionnaire
(Snitkin and King 1986)
1, Hours used per week Objective Self-report Questionnaire
(Green and Hughes 1986)
1, Number of features used Objective Self-report Questionnaire
(Kim and Lee 1986) 2, Frequency of use, voluntariness Objective, subjective
Self-report Questionnaire
(Bergeron 1986) 1, Extent of use of information from system Objective Self-report Questionnaire (Nelson and Cheney 1987)
1, Extent of use for decision making Objective and subjective
Self-report Questionnaire
(Hogue 1987) 1, Frequency of use of information from IS Objective Self-report Questionnaire (Swanson 1987) 1, Frequency of use of information from IS Objective Self-report Questionnaire (Davis 1989) 1, Frequency of use, prediction of future use Objective Self-report Questionnaire (Davis et al. 1989) 1, Frequency of use Objective Self-report Questionnaire (Thompson et al. 1991)
3, Duration of use, Frequency, Number of packages used
Objective Self-report Questionnaire
(Moore and Benbasat 1991)
1, Use or non-use Omnibus Self-report Questionnaire
(Nance 1992) 2, General versus specific use, Appropriateness of use
Objective Self-report Questionnaire
(Adams et al. 1992) 2, Study 1: number of messages sent/ received; Study 2: frequency, duration used)
Objective Self-report Questionnaire
(Szajna 1993) 2, Use of specific or general reports, duration Objective Self-report Questionnaire (Hartwick and Barki 1994)
2, Frequency, extent (light, med., heavy) Objective, omnibus
Self-report Questionnaire
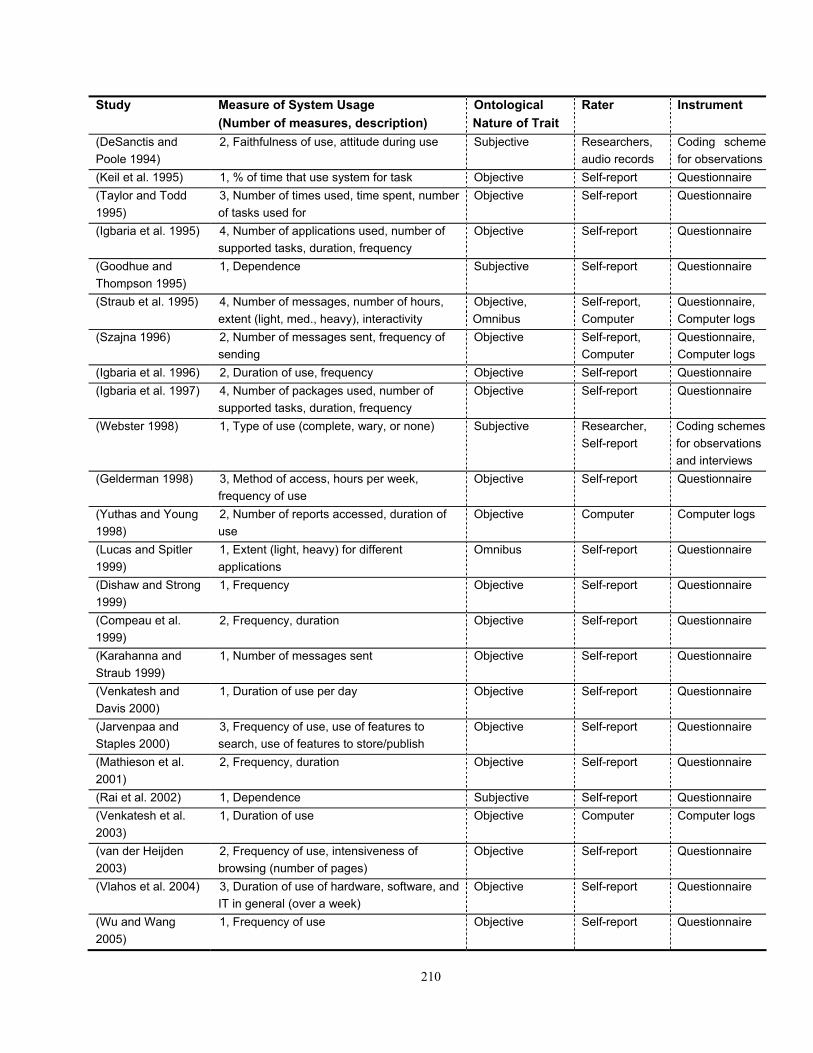
210
Study Measure of System Usage (Number of measures, description)
Ontological Nature of Trait
Rater Instrument
(DeSanctis and Poole 1994)
2, Faithfulness of use, attitude during use Subjective Researchers, audio records
Coding scheme for observations
(Keil et al. 1995) 1, % of time that use system for task Objective Self-report Questionnaire (Taylor and Todd 1995)
3, Number of times used, time spent, number of tasks used for
Objective Self-report Questionnaire
(Igbaria et al. 1995) 4, Number of applications used, number of supported tasks, duration, frequency
Objective Self-report Questionnaire
(Goodhue and Thompson 1995)
1, Dependence Subjective Self-report Questionnaire
(Straub et al. 1995) 4, Number of messages, number of hours, extent (light, med., heavy), interactivity
Objective, Omnibus
Self-report, Computer
Questionnaire, Computer logs
(Szajna 1996) 2, Number of messages sent, frequency of sending
Objective Self-report, Computer
Questionnaire, Computer logs
(Igbaria et al. 1996) 2, Duration of use, frequency Objective Self-report Questionnaire (Igbaria et al. 1997) 4, Number of packages used, number of
supported tasks, duration, frequency Objective Self-report Questionnaire
(Webster 1998) 1, Type of use (complete, wary, or none) Subjective Researcher, Self-report
Coding schemes for observations and interviews
(Gelderman 1998) 3, Method of access, hours per week, frequency of use
Objective Self-report Questionnaire
(Yuthas and Young 1998)
2, Number of reports accessed, duration of use
Objective Computer Computer logs
(Lucas and Spitler 1999)
1, Extent (light, heavy) for different applications
Omnibus Self-report Questionnaire
(Dishaw and Strong 1999)
1, Frequency Objective Self-report Questionnaire
(Compeau et al. 1999)
2, Frequency, duration Objective Self-report Questionnaire
(Karahanna and Straub 1999)
1, Number of messages sent Objective Self-report Questionnaire
(Venkatesh and Davis 2000)
1, Duration of use per day Objective Self-report Questionnaire
(Jarvenpaa and Staples 2000)
3, Frequency of use, use of features to search, use of features to store/publish
Objective Self-report Questionnaire
(Mathieson et al. 2001)
2, Frequency, duration Objective Self-report Questionnaire
(Rai et al. 2002) 1, Dependence Subjective Self-report Questionnaire (Venkatesh et al. 2003)
1, Duration of use Objective Computer Computer logs
(van der Heijden 2003)
2, Frequency of use, intensiveness of browsing (number of pages)
Objective Self-report Questionnaire
(Vlahos et al. 2004) 3, Duration of use of hardware, software, and IT in general (over a week)
Objective Self-report Questionnaire
(Wu and Wang 2005)
1, Frequency of use Objective Self-report Questionnaire

211
Chapter 6
Conclusion
6.1 Reprise: Objective
Motivated by the importance of system usage in practice and the need for a deeper
understanding of the system usage construct in IS research, this thesis set out to address the
following research question:
What principles can be used to conceptualize and measure system usage in an
appropriate way for a given theoretical context?
To answer this question, I drew upon critical realist assumptions and studies of research
diversity to develop a framework to clarify key epistemological factors that enable the system
usage construct to have diverse meanings (i.e., definitions, theories, and methods) and
ontological factors that constrain the potential meanings of the system usage construct (i.e.,
elements, properties, and values). I then proposed an approach for conceptualizing and
measuring the system usage construct that accounted for these epistemological and ontological
factors. The approach consists of four steps—definition, structure, function, and method—with
each step comprising principles and guidance to enable researchers to conceptualize and measure
system usage in an appropriate way for a given theoretical context.
To determine whether the approach and its underlying principles were useful, I carried
out three empirical tests to examine the feasibility of the approach and to judge whether
measures of system usage that were selected according to the approach enabled better
explanations of the relationship between system usage and downstream outcomes than other
measures of system usage. The results for these tests are detailed in Chapters 2, 4, and 5.

212
6.2 Contributions
The dissertation makes several contributions to research and practice. These
contributions were highlighted in each chapter of the thesis. Table 6.1 presents a summary of
these contributions and I discuss them briefly in turn.
Table 6.1: Contributions of the Thesis
Target of Contribution
Contribution
Contributions to research
Provides an explicit set of steps and principles that researchers can use to select or evaluate measures of system usage for a given theoretical context.
Instantiates a new approach for conceptualizing and measuring constructs in IS research that is consistent with critical realist assumptions.
Demonstrates the usefulness of the proposed approach by empirically identifying the degree to which explanations of theoretical models can be improved by:
- Selecting elements, properties, and measures of system usage that are appropriate for a theoretical context
- Selecting methods for measuring system usage that are appropriate for the nature of a study’s inquiry, theory, and practical constraints
Provides validated measures of individual and collective usage for a specific theoretical context.
Contributions to practice
Provides an approach that practitioners can tailor to select metrics of system usage that enable them to explain how systems are used and explain how system usage is associated with downstream outcomes in practice.
6.2.1 Contributions to Research
The central contribution of the thesis is that it offers a comprehensive approach that
researchers can use to select measures of system usage that are appropriate for a given theoretical
context. This has two benefits. First, at the level of a single study, the approach can help a
researcher select measures of system usage that will enable him/her to improve explanations of
the relationship between system usage and other constructs in his/her theoretical model. Second,
at the level of the entire community of researchers who study system usage, the approach
213
provides a way to improve the discipline of creating system usage measures while facilitating the
generation of diverse measures appropriate for different research contexts. In other words, the
approach provides a way to improve the disciplined diversity of system usage measures in IS
research. Disciplined diversity has been argued to be an important goal in IS research (Benbasat
and Weber 1996; Landry and Banville 1992; Robey 1996; Weber 2003a), but there are no
systematic approaches for conceptualizing or measuring constructs in IS research that enable
researchers to achieve it. The proposed approach provides one way to do so.
Each step of the approach offers additional contributions. These contributions are outlined
in depth in each chapter, but briefly summarized here. The definition step enables researchers to
clarify what system usage is and how it differs from conceptually related constructs (e.g.,
information usage, adoption, acceptance, and so on). By encouraging researchers to clarify their
definitions and to explicate the assumptions underlying their definitions, this step should help
researchers ensure that they are studying the phenomena they intended to study.
The structure step illuminates the elements of system usage and helps researchers select
relevant elements for a given context. One simple benefit of this step is that it highlights elements
of usage that have received insufficient research attention. For example, many researchers have
ignored the “user” element of system usage, such as user cognitions-in-use. Including such
elements in measures of system usage not only leads to a more natural conception of how people
use systems but can also improve the degree to which system usage measures can explain
downstream outcomes (see Chapter 2). Similarly, as Chapter 3 highlighted, past research has
ignored the differences between individual system usage and collective system usage. By
highlighting the importance of interdependencies-in-use, this step will help researchers determine
when collective system usage exists and how it differs from individual system usage.
The function step helps researchers select measures of system usage that are appropriate

214
for a given theoretical context, thereby avoiding errors of omission and inclusion in measurement.
The function step also highlights the importance of the distinction between shared and configural
conceptions of collective system usage. Configural measures of collective system usage have
never been used in IS research, but there are many reasons to suggest that collective system usage
will often be configural in practice.
The method step helps researchers account for method variance when obtaining measures
of system usage, thereby ensuring that their measures of system usage are both more accurate
and more appropriate for a study’s context. The method step especially highlights the relevance
of distance bias for many constructs in IS research and provides a framework to consider the
different types of properties that distance bias can reveal and the situations in which distance bias
is likely to be most relevant for a study (see Chapter 5).
A more general contribution of the approach is that it instantiates a new way to develop
and study constructs in IS research. As argued in Chapter 1, many “working positivists” in IS
implicitly use critical realist assumptions. Nevertheless, I agree with Mingers (2004b) that the
full implications of a critical realist position have not been widely acknowledged or discussed.
The proposed approach provides a systematic way to conceptualize and measure constructs from
a critical realist position.
In addition to the contributions that stem from the approach, the empirical tests offer
additional contributions. These tests contribute by: (1) demonstrating that the approach is
feasible in practice, (2) demonstrating that the principles underlying the approach are important
empirically (not just theoretically), (3) revealing new findings regarding the relationship between
system usage and performance at the individual level of analysis, collective level of analysis, and
across levels of analysis, and (4) by providing validated measures of system usage that future
researchers can employ.
215
6.2.2 Contributions to Practice
Even though the focus of this dissertation is a research “construct,” this does not limit the
contributions to research. Many practitioners also create constructs in the guise of “metrics” that
they use to make decisions, test lay theories, and monitor resources (Kaplan and Norton 1992).
In IS practice, there has long been a lack of good metrics (Strassman et al. 1988). According to
Chidambaram et al. (2005), one of the underlying problems “is the ad hoc manner in which IT
metrics are often selected, devised, and used” (p. 4).
Given the importance of system usage as a necessary link between IS investments and IS
outcomes, it might be expected that organizations might employ advanced techniques for
choosing and assessing metrics for system usage in practice. This is not the case. Surprisingly, in
their review of IT metrics in practice, Chidambaram et al. (2005) found 31 widely-used metrics,
of which only two related to system usage. These two metrics of system usage were measures of
duration: CPU hours utilized and hours logged per employee. The approach proposed in this
thesis (and the empirical results in Chapter 2) would suggest that such metrics will not provide
very meaningful insights into how usage of an organization’s information systems lead to
important outcomes such as employee, workgroup, or organizational performance.
I suggest, therefore, that the approach proposed in this thesis can contribute to practice by
helping organizations select metrics of system usage that can help explain relevant organizational
outcomes, such as individual or collective performance, staff satisfaction, quality of work life,
and so on. The approach would certainly need to be tailored to cater for the practical realities of
organizations. Nevertheless, I suggest that much of the approach and its principles would stay
the same. Organizations still need to define the metrics they wish to measure, still need to select
the elements and properties of system usage that are relevant for explaining the desired
outcomes, still need to ensure that their metrics accurately reflect the chosen properties, and still

216
need to determine what methods to use for obtaining the metrics. The goals of the approach
would also likely remain unchanged because practitioners, just like researchers, can benefit from
a better understanding of how systems are actually used in practice (i.e., the ontological
imperative) as well as how system usage leads to relevant outcomes (i.e., the epistemological
imperative).
6.3 Limitations and Future Research
Like all research, this thesis could be improved and extended. Table 6.2 summarizes its
limitations and describes avenues for future research that could address these limitations.
6.4 Conclusion
Motivated by the importance of understanding system usage in practice and the lack of
explicit conceptualizations of system usage in past research, this thesis advanced a
comprehensive approach for conceptualizing and measuring system usage in an appropriate
manner for a given theoretical context. Three empirical tests were carried out to test the
approach. The empirical tests demonstrated that the approach is feasible and can help
researchers reach better explanations of the relationship between system usage and downstream
outcomes. Overall, the thesis contributes by (1) providing an explicit and systematic way to
improve the discipline and diversity of measures of system usage in IS research, (2) instantiating
a new approach for construct development and investigation, (3) providing new empirical
findings and validated measures, (4) providing practitioners with a starting point for selecting
metrics of system usage in practice, and (5) by illuminating many new directions for research on
the nature of system usage, its antecedents, and its consequences.

217
Table 6.2: Limitations and Future Research Opportunities Component of Thesis
Limitations Future Research Opportunities
Constrained assumptions
Could conduct investigations of system usage from other meta-theoretical assumptions, research targets, or forms of theory. Could conduct a multi- or meta-paradigmatic inquiry on the nature of system usage. Could extend the conceptual basis of the work by deepening the use of critical realist assumptions.
Entire approach
Limited application (only applied to system usage)
Could tailor the approach to apply to other constructs in IS research, whether those with similar definitions to system usage (e.g., information usage) or distinctly different constructs (e.g., effective IS security, project escalation, and so on).
- Definition step Limited application (only one definition provided)
Could explicate other definitions of system usage with different assumptions and clarify situations in which one definition may be more acceptable than another (e.g., depending on the theoretical context).
Limited application (based on one definition)
Could examine whether different definitions of system usage imply different elements rather than, or in addition to, the user, system, and task.
Limited scope (limited to one system)
Could investigate the differences between individual or collective use of one system versus individual or collective use of a portfolio of systems.
- Structure step
Limited investigation (of collective system usage)
Could investigate how strong interdependencies have to be before collective usage can be said to exist. Could develop principles for determining to what extent every member of a collective must use a system for collective usage to exist. Could investigate the differences between multilevel and social network conceptions of structure.
Limited scope (only one theoretical context)
Could determine whether the approach assists researchers in other single-level or multilevel theoretical contexts.
- Function step
Limited scope (only dependent variable)
Could examine whether the approach enables researchers to choose more effective measures of system usage when it is an independent or mediating variable rather than a dependent variable

218
Component of Thesis
Limitations Future Research Opportunities
Limited investigation (did not examine conflicting outcomes)
Could examine models in which there are conflicting outcomes (e.g., organizational versus individual goals; performance goals versus quality of life goals).
Limited validation (little guidance for collective-level validation)
Could improve techniques for determining when measures of collective system usage can be deemed to have sufficient construct validity.
Limited scope (only examined distance and representation bias)
Could attempt to determine whether there are other general sources of method variance in addition to distance bias and representation bias.
- Method step
Limited investigation (of distance bias)
Could extend the framework of types of distance bias in Chapter 5 (Figure 5.3) to identify other general types. Could categorize different constructs in IS research according to the importance of distance bias when studying them.
Limited scope (demonstrations only)
Could use the steps and principles of the approach (e.g., the categorization of different elements of use) to provide a structure for a meta-analysis of the system usage literature.
Internal validity Could include other antecedents, moderating variables, or mediating variables in the theoretical models to determine if system usage still has the same effect on performance. Could use a factorial experimental design to improve the ability to rule out correlated omitted variables when testing models of system usage and when testing the relative effects of distance bias and representation bias.
Construct validity Could investigate whether the measurement models for system usage in the thesis exclude important properties of individual or collective system usage. Could investigate whether the unexpected lack of effect of collective collaboration-in-use on individual deep structure usage in Chapter 4 were due to measurement problems.
Statistical conclusion validity
Could increase the sample size used in each empirical test. Could replicate the hierarchical linear modeling results with multilevel structural equation modeling techniques that account for measurement error (e.g., MPLUS).
Empirical tests
External validity Could replicate the empirical tests in other theoretical contexts or methodological (e.g., field or survey) contexts.
219
References
Adams, D.A., Nelson, R.R., and Todd, P.A. "Perceived Usefulness, Ease of Use, and Usage of Information Technology: A Replication," MIS Quarterly (16:2) 1992, pp 227-247.
Agarwal, R. "Individual Acceptance of Information Technologies," in: Framing the Domains of IT Management: Projecting the Future through the Past, R.W. Zmud (ed.), Pinnaflex Educational Resources, Cincinnati, Ohio, 2000, pp. 85-104.
Agarwal, R., and Karahanna, E. "Time Flies When You’re Having Fun: Cognitive Absorption and Beliefs About Information Technology Usage," MIS Quarterly (24:4) 2000, pp 665-694.
Alavi, M., and Henderson, J.C. "An Evolutionary Strategy for Implementing a Decision Support System," Management Science (27:11), November 1981, pp 1309-1322.
Ancona, D.G., Okhuysen, G.A., and Perlow, L.A. "Taking Time to Integrate Temporal Research," Academy of Management Review (26:4), October 2001, pp 512-529.
Ang, S., Slaughter, S., and Ng, K.Y. "Human Capital and Institutional Determinants of Information Technology Compensation: Modeling Multilevel and Cross-level Interactions," Management Science (48:11), November 2002, pp 1427-1445.
Angst, C., and Agarwal, R. "Central and Peripheral Routes to Sustained Technology Usage," in Proceedings of the Workshop of the Special Interest Group on Diffusion, Transfer, and Implementation of IT (DIGIT), Washington DC, 2004.
Antonelli, A.G. "Definition," in: Routledge Encyclopedia of Philosophy, E. Craig (ed.), Routledge, (Available online, Retrieved May 2005, from http:www.rep.routledge.com/article/Y057), London, 1998.
Archer, M., Bhaskar, R., Collier, A., Lawson, T., and Norrie, A. (eds.) Critical Realism: Essential Readings. Routledge, London, 1998.
Argote, L., and Ophir, R. "Intraorganizational Learning," in: The Blackwell Companion to Organizations, J.A.C. Baum (ed.), Blackwell Publishers Ltd, Oxford, UK, 2002, pp. 181-207.
Arrow, H., McGrath, J.E., and Berdahl, J.L. Small Groups as Complex Systems: Formation, Coordination, Development, and Adaptation Sage Publications, Thousand Oaks, CA, 2000.
Arvey, R.D., and Murphy, K.R. "Performance Evaluation in Work Settings," Annual Review of Psychology (49) 1998, pp 141-168.
Ashcraft, M.H. Cognition, (3rd ed.) Prentice Hall, Upper Saddle River, New Jersey, 2002. Auer, T. "Quality of IS Use," European Journal of Information Systems (7:3) 1998, pp 192-201. Austin, J.T., Scherbaum, C.A., and Mahlman, R.A. "History of Research Methods in Industrial
and Organizational Psychology: Measurement, Design, Analysis," in: Handbook of Research Methods in Industrial and Organizational Psychology, S.G. Rogelberg (ed.), Blackwell, Oxford, 2002, pp. 3-33.
Azevedo, J. "Updating Organizational Epistemology," in: Blackwell Companion to Organizations, J.A.C. Baum (ed.), Blackwell, Oxford, UK, 2002, pp. 715-732.
Bagozzi, R.P., Yi, Y., and Phillips, L.W. "Assessing Construct Validity in Organizational Research," Administrative Science Quarterly (36) 1991, pp 421-458.
Bandura, A. Self-Efficacy: The Exercise of Control Freeman, New York, 1997. Bandura, A. "Exercise of Human Agency Through Collective Efficacy," Current Directions
Psychological Science (9) 2000, pp 75-78.

220
Barki, H., and Huff, S. "Change, Attitude to Change, and Decision Support System Success," Information & Management (9:5), December 1985, pp 261-268.
Barkin, S.R., and Dickson, G.W. "An Investigation of Information System Utilization," Information and Management (1:1) 1977, pp 35-45.
Barley, S.R. "Technology as an Occasion for Structuring: Evidence from Observations of CT Scanners and the Social Order of Radiology Departments," Administrative Science Quarterly (31), March 1986, pp 78-108.
Barley, S.R. "The Alignment of Technology and Structure through Roles and Networks," Administrative Science Quarterly (31) 1990, pp 61-103.
Barua, A., and Mukhopadhyay, T. "Information Technology and Business Performance: Past, Present, and Future," in: Framing the Domains of IT Management: Projecting the Future Through the Past, R.W. Zmud (ed.), Pinnaflex Educational Resources Inc, Cincinnati, Ohio, 2000, pp. 65-84.
Beal, D.J., Cohen, R.R., Burke, M.J., and McLendon, C.L. "Cohesion and Performance in Groups: A Meta-Analytic Clarification of Construct Relations," Journal of Applied Psychology (88:6) 2003, pp 989-1004.
Bem, D.J. "Self-Perception Theory," in: Advances in Experimental Social Psychology, L. Berkowitz (ed.), Academic Press, New York, 1972, pp. 1-62.
Benbasat, I., Dexter, A.S., and Marsulis, P.S. "An Experimental Study of the Human/Computer Interface," Communications of the ACM (24:11), November 1981, pp 752-762.
Benbasat, I., and Schroeder, R.G. "An Experimental Investigation of Some MIS Design Variables," MIS Quarterly (1:1), May 1977, pp 37-49.
Benbasat, I., and Weber, R. "Rethinking 'Diversity' in Information Systems Research," Information Systems Research (7) 1996, pp 389-399.
Benbasat, I., and Zmud, R.W. "The Identity Crisis Within the IS Discipline: Defining and Communicating the Discipline's Core Properties," MIS Quarterly (27:2) 2003, pp 183-194.
Bergeron, F. "Factors Influencing the Use of DP Chargeback Information," MIS Quarterly (10:3), September 1986, pp 225-237.
Berson, Y., Avolio, B., and Kahai, S. "Level Specification: Using Triangulation in a Grounded Theory Approach to Construct Validation," in: Research in Multi-Level Issues: Multi-Level Issues in Organizational Behavior and Strategy (Vol. 2), F.J. Yammarino and F. Dansereau (eds.), Elsevier Science, UK, 2003, pp. 85-112.
Berthon, P., Pitt, L., Ewing, M., and Carr, C.L. "Potential Research Space in MIS: A Framework for Envisioning and Evaluating Research Replication, Extension, and Generation," Information Systems Research (13:4) 2002, pp 416-427.
Bhaskar, R. The Possibility of Naturalism Harvester Press, Sussex, 1979. Bhaskar, R. Reclaiming Reality Verso, London, 1989. Bickman, L. (ed.) Research Design: Donald Campbell's Legacy. Sage Publications, Thousand
Oaks, California, 2000. Blair, E., and Burton, S. "Cognitive Processes Used by Survey Respondents to Answer
Behavioral Frequency Questions," Journal of Consumer Research (14), September 1987, pp 280-288.
Bliese, P.D. "Within-Group Agreement, Non-Independence, and Reliability: Implications for Data Aggregation and Analysis," in: Multilevel Theory, Research, and Methods in
221
Organizations, K.J. Klein and S.W.J. Kozlowski (eds.), Jossey-Bass, San Francisco, 2000, pp. 349-381.
Bollen, K.A., and Lennox, R. "Conventional Wisdom on Measurement: A Structural Equation Perspective," Psychological Bulletin (110:2) 1991, pp 305-314.
Borgatti, S.P., and Cross, R. "A Relational View of Information Seeking and Learning in Social Networks," Management Science (49:4), April 2003, pp 432-445.
Borsboom, D., Mellenberg, G.J., and van Heerdon, J. "The Concept of Validity," Psychological Review (111:4) 2004, pp 1061-1071.
Borthick, A.F., Jones, D.R., and Wakai, S. "Designing Learning Experiences within Learners' Zones of Proximal Development (ZPDs): Enabling Collaborative Learning On-site and On-line," Journal of Information Systems (17:1) 2003, pp 107-134.
Boudreau, M.-C., Gefen, D., and Straub, D.W. "Validation in Information Systems Research: A State-of-the-Art Assessment," MIS Quarterly (25:1), March 2001, pp 1-16.
Boudreau, M.-C., and Robey, D. "Enacting Integrated Information Technology: A Human Agency Perspective," Organization Science (16:1), Jan-Feb 2005, pp 3-18.
Bowers, C.A., Pharmer, J.A., and Salas, E. "When Member Homogeneity is Needed in Work Teams: A Meta-Analysis," Small Group Research (31:3), June 2000, pp 305-327.
Brewer, M.B., and Collins, B.E. (eds.) Scientific Inquiry and the Social Sciences: A Volume in Honor of Donald T. Campbell. Jossey-Bass Inc., San Francisco, 1981.
Brown, J.S., and Duguid, P. "Organizational Learning and Communities-of-Practice: Toward a Unified View of Working, Learning, and Innovation," Organization Science (2:1), February 1991, pp 40-57.
Brown, S.L., and Eisenhardt, K.M. "The Art of Continuous Change: Linking Complexity Theory and Time-Paced Evolution in Relentlessly Shifting Organizations," Administrative Science Quarterly (42) 1997, pp 1-34.
Bunge, M. Treatise on Basic Philosophy: Volume 3: Ontology I: The Furniture of the World Reidel, Boston, 1977.
Burke, M.J., and Dunlap, W.P. "Estimating Interrater Agreement with the Average Deviation Index: A User's Guide," Organizational Research Methods (5:2), April 2002, pp 159-172.
Burton-Jones, A., and Gallivan, M.J. "Towards a Deeper Understanding of System Usage in Organizations: A Multilevel Perspective," Working paper (Department of Computer Information Systems, Georgia State University) 2004.
Burton-Jones, A., and Straub, D. "Reconceptualizing System Usage," Working paper (Department of Computer Information Systems, Georgia State University), April 2004.
Calder, B.J., Phillips, L.W., and Tybout, A.M. "Designing Research for Application," Journal of Consumer Research (8) 1981, pp 197-207.
Campbell, D.T., and Fiske, D.W. "Convergent and Discriminant Validity by the Multitrait-Multimethod Matrix," Psychological Bulletin (56) 1959, pp 81-105.
Campbell, D.T., and O'Connell, E.J. "Methods as Diluting Trait Relationships Rather than Adding Irrelevant Systematic Variance," in: Forms of Validity in Research, D. Brinberg and L.H. Kidder (eds.), Jossey-Bass, San Francisco, 1982, pp. 93-111.
Campbell, J.P. "Modeling the Performance Prediction Problem in Industrial and Organizational Psychology," in: Handbook of Industrial and Organizational Psychology (2nd Ed), M.D. Dunnette and L.M. Hough (eds.), Consulting Psychologists' Press, Palo Alto, CA, 1990, pp. 687-732.
222
Carlsson, S.A. "A Longitudinal Study of Spreadsheet Program Use," Journal of Management Information Systems (5:1) 1988, pp 82-100.
Carr, N.G. "IT Doesn't Matter," Harvard Business Review (81:5), May 2003, pp 41-50. Castro, S.L. "Data Analytic Methods for the Analysis of Multilevel Questions: A Comparison of
Intraclass Correlation Coefficients, rwg(j), Hierarchical Linear Modeling, Within- and Between-Analysis, and Random Group Resampling," The Leadership Quarterly (13) 2002, pp 69-93.
Chan, D. "Functional Relations Among Constructs in the Same Content Domain at Different Levels of Analysis: A Typology of Composition Models," Journal of Applied Psychology (83) 1998, pp 234-246.
Chan, Y.E. "IT Value: The Great Divide Between Qualitative and Quantitative and Individual and Organizational Measures," Journal of Management Information Systems (16:4) 2000, pp 225-261.
Chen, G., Mathieu, J.E., and Bliese, P.D. "A Framework for Conducting Multilevel Construct Validation," in: Research in Multi-level Issues: The Many Faces of Multi-Level Issues (Vol. 3), F. Dansereau and F.J. Yammarino (eds.), Elsevier Science, Oxford, U.K., 2004, pp. 273-303.
Chen, G., Webber, S.S., Bliese, P.D., Mathieu, J.E., Payne, S.C., Born, D.H., and Zaccaro, S.J. "Simultaneous Examination of the Antecedents and Consequences of Efficacy Beliefs at Multiple Levels of Analysis," Human Performance (15:4) 2002, pp 381-409.
Chidambaram, L., and Jones, B. "Impact of Communication Medium and Computer Support on Group Perceptions and Performance: A Comparison of Face-to-Face and Dispersed Meetings," MIS Quarterly (17:4) 1993, pp 465-491.
Chidambaram, L., Zmud, R.W., and Karahannas, M. "Measuring the Business Value of Information Technology (IT): A Review and Analysis of IT Metrics," in: Business Performance Measurement: Towards Organizational Excellence, S.S. Kambhammettu (ed.), Le Magnus University Press, 2005, pp. 1-16.
Chin, W.W. "The Measurement and Meaning of IT Usage: Reconciling Recent Discrepancies between Self Reported and Computer Recorded Usage,," in B.A. Aubert and W.W. Chin, Proceedings of the Administrative Sciences Association of Canada - 24th Conference, IS Division, Canada, 1996, pp. 65-74.
Chin, W.W. "Issues and Opinion on Structural Equation Modeling," MIS Quarterly (21:1), March 1998, pp vii-xvi.
Chin, W.W., Gopal, A., and Salisbury, W.D. "Advancing the Theory of Adaptive Structuration: The Development of a Scale to Measure Faithfulness of Appropriation," Information Systems Research (8:4), March 1997, pp 342-367.
Chin, W.W., and Marcolin, B.L. "The Future of Diffusion Research," The DATA BASE for Advances in Information Systems (32:3), Summer 2001, pp 8-12.
Chin, W.W., Marcolin, B.L., and Newsted, P.R. "A Partial Least Squares Latent Variable Modeling Approach for Measuring Interaction Effects: Results from a Monte Carlo Simulation Study and an Electronic Mail Emotion/Adoption Study," Information Systems Research (14:2) 2003, pp 189-217.
Chin, W.W., and Newsted, P.R. "The Importance of Specification in Causal Modeling: The Case of End-User Computing Satisfaction," Information Systems Research (6:1) 1995, pp 73-81.
Chomsky, N. Aspects of the Theory of Syntax MIT Press, Cambridge, MA, 1965.
223
Churchman, C.W. The Systems Approach Dell Publishing Co., New York, 1968. Churchman, C.W. The Design of Inquiring Systems: Basic Concepts of Systems and
Organizations Basic Books, New York, 1971. Cialdini, R.B., and Goldstein, N.J. "Social Influence: Compliance and Conformity," Annual
Review of Psychology (55) 2004, pp 591-621. Cohen, J. Statistical Power Analysis for The Behavioral Sciences, (2nd Edition), (2nd ed.)
Lawrence Erlbaum, Hillsdale, NJ, 1988. Collopy, F. "Biases in Retrospective Self-reports of Time Use: An Empirical Study of Computer
Users," Management Science (42:5) 1996, pp 758-767. Compeau, D., Higgins, C.A., and Huff, S. "Social Cognitive Theory and Individual Reactions to
Computing Technology: A Longitudinal Study," MIS Quarterly (23:2), June 1999, pp 145-158.
Compeau, D.R., and Higgins, C.A. "Computer Self-Efficacy: Development of a Measure and Initial Test," MIS Quarterly (19:2), June 1995, pp 189-211.
Contractor, N.S., Seibold, D.R., and Heller, M.A. "Interactional Influence in the Structuring of Media Use in Groups: Influence in Member's Perceptions of Group Decision Support System Use," Human Communication Research (22:4), June 1996, pp 451-481.
Cook, T.D., and Campbell, D.T. Quasi-Experimentation: Design & Analysis Issues for Field Settings Houghton Mifflin Company, USA, 1979.
Cooper, R.B., and Zmud, R.W. "Information Technology Implementation Research: A Technology Diffusion Approach," Management Science (36:2), February 1990, pp 123-139.
Corten, I.W., Saris, W.E., Coenders, G., van der Veld, W., Aalberts, C.E., and Kornelis, C. "Fit of Different Models for Multitrait-Multimethod Experiments," Structural Equation Modeling (9:2) 2002, pp 213-232.
Cote, J.A., and Buckley, R. "Estimating Trait, Method, and Error Variance: Generalizing across 70 Construct Validation Studies," Journal of Marketing Research (24) 1987, pp 315-318.
Crampton, S., and Wagner, J.A. "Percept-Percept Inflation in Microorganizational Research: An Investigation of Prevalence and Effect," Journal of Applied Psychology (79) 1994, pp 67-76.
Crano, W.D. "Triangulation and Cross-Cultural Research," in: Scientific Inquiry and the Social Sciences: A Volume in Honor of Donald T. Campbell, M.B. Brewer and B.E. Collins (eds.), Jossey-Bass, San Francisco, 1981, pp. 317-344.
Crano, W.D. "The Multitrait-Multimethod Matrix as Synopsis and Recapitulation of Campbell's Views on the Proper Conduct of Social Inquiry," in: Research Design: Donald Campbell's Legacy, L. Bickman (ed.), Sage Publications, Thousand Oaks, California, 2000, pp. 37-61.
Cronbach, L.J. "Test validation," in: Educational Measurement (2nd Ed.), R.L. Thorndike (ed.), American Council on Education, Washington, D.C., 1971, pp. 443-507.
Cronbach, L.J. "Giving Method Variance its Due," in: Personality Research, Methods, and Theory: A Festschrift Honoring Donald W. Fiske, P.E. Shrout and S.T. Fiske (eds.), Lawrence Erlbaum, Hillsdale, New Jersey, 1995, pp. 145-157.
Cronbach, L.J., and Meehl, P.E. "Construct Validation in Psychological Tests," Psychological Bulletin (52) 1955, pp 281-302.
Crowston, K. "A Coordination Theory Approach to Organizational Process Design," Organization Science (8:2), March-April 1997, pp 157-175.
224
Csikszentmihalyi, M. Flow: The Psychology of Optimal Experience Jossey-Bass, San Francisco, CA, 1990.
Culnan, M.J. "Chauffeured Versus End User Access to Commercial Databases: the Effects of Task and Individual Differences," MIS Quarterly (7:1), March 1983, pp 55-67.
Dansereau, F., Alutto, J., and Yammarino, F.J. Theory Testing in Organizational Behavior: The Varient Approach Prentice Hall, Englewood Cliffs, N.J., 1984.
Davern, M.J. "When Good Fit is Bad: The Dynamics of Perceived Fit," in Proceedings of the Seventeenth International Conference on Information Systems, Cleveland, Ohio, 1996, pp. 112-121.
Davis, F. "Perceived Usefulness, Perceived Ease of Use, and End User Acceptance of Information Technology," MIS Quarterly (13:3), September 1989, pp 318-339.
Davis, F.D., Bagozzi, R.P., and Warshaw, P.R. "User Acceptance of Computer Technology: A Comparison of Two Theoretical Models," Management Science (35) 1989, pp 982-1003.
Dedrick, J., Gurbaxani, V., and Kraemer, K.L. "Information Technology and Economic Performance: A Critical Review of the Empirical Evidence," ACM Computing Surveys (35:1), March 2003, pp 1-28.
DeLone, W.H., and McLean, E.R. "Information Systems Success: The Quest for the Dependent Variable," Information Systems Research (3:1), March 1992, pp 60-95.
DeLone, W.H., and McLean, E.R. "The DeLone and McLean Model of Information Systems Success: A Ten-Year Review," Journal of Management Information Systems (19:4), Spring 2003, pp 9-30.
Dennis, A., Venkatesh, V., and Venkatraman, R. "Adoption of Collaboration Technologies: Integrating Technology Acceptance and Collaboration Technology Research," Working paper, TR-142-1, Information Systems Department, Indiana University) 2004.
Dennis, A.R., Wixom, B.H., and Vandenberg, R.J. "Understanding Fit and Appropriation Effects in Group Support Systems via Meta-Analysis," MIS Quarterly (25:2), June 2001, pp 167-193.
DeSanctis, G., and Poole, M.S. "Capturing the Complexity in Advanced Technology Use: Adaptive Structuration Theory," Organization Science (5:2), May 1994, pp 121-147.
Devaraj, S., and Kohli, R. "Information Technology Payoff in the Health-Care Industry: A Longitudinal Study," Journal of Management Information Systems (16:4) 2000, pp 41-67.
Devaraj, S., and Kohli, R. "Performance Impacts of Information Technology: Is Actual Usage the Missing Link?," Management Science (49:3) 2003, pp 273-289.
Diamantopoulos, A., and Winklhofer, H.M. "Index Construction with Formative Indicators: An Alternative to Scale Development," Journal of Marketing Research (38), May 2001, pp 269-277.
Dishaw, M.T., and Strong, D.M. "Extending the Technology Acceptance Model with Task-Technology fit Constructs," Information & Management (36:1) 1999, pp 9-21.
Doll, W.J., and Torkzadeh, G. "The Measurement of End-User Computing Satisfaction," MIS Quarterly (12), June 1988, pp 259-274.
Doll, W.J., and Torkzadeh, G. "Developing a Multidimensional Measure of System-use in an Organizational Context," Information & Management (33) 1998, pp 171-185.
Donaldson, S.I., Thomas, C.W., Graham, J.W., Au, J.G., and Hansen, W.B. "Verifying Drug Abuse Prevention Program Effects Using Reciprocal Best Friend Reports," Journal of Behavioral Medicine (23:6) 2000, pp 585-601.

225
Doty, D.H., and Glick, W.H. "Typologies as a Unique Form of Theory Building," Academy of Management Review (19:2) 1994, pp 230-251.
Doty, D.H., Glick, W.H., and Huber, G.P. "Fit, Equifinality, and Organizational Effectiveness: A Test of Two Configurational Theories," Academy of Management Journal (36:6) 1993, pp 1196-1250.
Dube, L., and Pare, G. "Rigor in Information Systems Positivist Case Research: Current Practices, Trends, and Recommendations," MIS Quarterly (27:4), December 2003, pp 597-635.
Dubin, R. Theory Building (Revised Edition) The Free Press, New York, 1978. Easley, R.F., Devaraj, S., and Crant, J.M. "Relating Collaborative Technology Use to Teamwork
Quality and Performance: An Empirical Analysis," Journal of Management Information Systems (19:4), Spring 2003, pp 249-270.
Edmondson, A.C. "The Local and Variegated Nature of Learning in Organizations: A Group-Level Perspective," Organization Science (13:2) 2002, pp 128-146.
Edwards, J., R. "Multidimensional Constructs in Organizational Behavior Research: An Integrative Analytic Framework," Organizational Research Methods (4:2), April 2001, pp 144-192.
Eid, M., Lischetzke, T., Nussbeck, F.W., and Trierweiler, L.I. "Separating Trait Effects from Trait-Specific Method Effects in Multitrait-Multimethod Models: A Multiple-Indicator CT-C(M-1) Model," Psychological Methods (8:1) 2003, pp 38-60.
Embretson, S.E. "Construct Validity: Construct Representation Versus Nomothetic Span," Psychological Bulletin (93:1) 1983, pp 179-197.
Emirbayer, M., and Mische, A. "What is Agency?," American Journal of Sociology (103:4), January 1998, pp 962-1023.
Essex, C., and Smythe, W.E. "Between Numbers and Notions: A Critique of Psychological Measurement," Theory & Psychology (9:6) 1999, pp 739-767.
Evans, M.G. "Methodological Contributions of Donald Campbell to Organizational Science," in: Variations in Organizational Science: A Conference in Honor of Donald T. Campbell, J.A.C. Baum and W. McKelvey (eds.), Sage, Thousand Oaks, CA, 1999, pp. 311-338.
Eysenck, M.W. Attention and Arousal: Cognition and Performance Springer-Verlag, Heidelberg Berlin, 1982.
Fazio, R.H., and Olson, M.A. "Implicit Measures in Social Cognition Research: Their Meaning and Use," Annual Review of Psychology (54) 2003, pp 297-327.
Fichman, R.G. "The Diffusion and Assimilation of Information Technology Investments," in: Framing the Domains of IT Management: Projecting the Future through the Past, R.W. Zmud (ed.), Pinnaflex Educational Resources Inc, Cincinnati, Ohio, 2000, pp. 105-127.
Fiske, D.W. "Convergent -Discriminant Validation in Measurements and Research Strategies," in: Forms of Validity in Research, D. Brinbirg and L.H. Kidder (eds.), Jossey Bass, San Francisco, 1982, pp. 77-92.
Fiske, D.W. "Reprise, New Themes, and Steps Forward," in: Personality Research, Methods, and Theory: A Festschrift Honoring Donald W. Fiske, P.E. Shrout and S.T. Fiske (eds.), Lawrence Erlbaum, Hillsdale, New Jersey, 1995, pp. 351-361.
Fiske, D.W., and Campbell, D.T. "Citations Do Not Solve Problems," Psychological Bulletin (112:3) 1992, pp 393-395.
Fornell, C., and Larcker, D. "Evaluating Structural Equation Models with Unobservable Variables and Measurement Error," Journal of Marketing Research (18) 1981, pp 39-50.
226
Fromkin, H.L., and Streufert, S. "Laboratory Experimentation," in: Handbook of Industrial and Organizational Psychology, M.D. Dunnette (ed.), Rand McNally, Chicago, 1976, pp. 415-465.
Gallivan, M.J. "Organizational Adoption and Implementation of Complex Technological Innovations: Development and Application of a New Framework," The DATA BASE for Advances in Information Systems (32:3) 2001, pp 51-85.
Gallivan, M.J., Hofman, J.D., and Orlikowski, W.J. "Implementing Radical Change: Gradual vs. Rapid Pace," in J. DeGross, S. Huff and M.C. Munro, Proceedings of the International Conference on Information Systems, Vancouver, B.C., 1994.
Gallivan, M.J., Spitler, V.K., and Koufaris, M. "Does Information Technology Training Really matter? A Social Information Processing Analysis of Coworkers' Influence on IT Usage in the Workplace," Journal of Management Information Systems (22:1), Summer 2005, pp 153-192.
Gavin, M.B., and Hofmann, D.A. "Using Hierarchical Linear Modeling to Investigate the Moderating Influence of Leadership Climate," The Leadership Quarterly (13) 2002, pp 15-33.
Gefen, D., Karahanna, E., and Straub, D.W. "Trust and TAM in Online Shopping: An Integrated Model," MIS Quarterly (27:1), March 2003, pp 1-40.
Gelderman, M. "The Relation Between User Satisfaction, Usage of Information Systems, and Performance," Information & Management (34:1) 1998, pp 11-18.
Gersick, C.G. "Revolutionary Change Theories: A Multilevel Exploration of the Punctuated Equilibrium Paradigm," Academy of Management Review (16:1) 1991, pp 10-36.
Giddens, A. The Constitution of Society: Outline of the Theory of Structuration University of California Press, Berkeley, CA, 1984.
Ginzberg, M.J. "Finding an Adequate Measure of OR/MS Effectiveness," Interfaces (8:4), August 1978, pp 59-62.
Ginzberg, M.J. "Early Diagnosis of MIS Implementation Failure," Management Science (27:4), April 1981, pp 459-478.
Glick, W.H., Jenkins Jr, G.D., and Gupta, N. "Method versus Substance: How Strong are Underlying Relationships between Job Characteristics and Attitudinal Outcomes?," Academy of Management Journal (29:3) 1986, pp 441-464.
Golding, S.L. "Method Variance, Inadequate Constructs, or Things That Go Bump In the Night?," Multivariate Behavioral Research (12), January 1977, pp 89-98.
Goodhue, D., and Loiacono, E. "Randomizing Question Order Versus Grouping Questions by Construct in Survey Research: an Empirical Test of the Impact on Apparent Reliabilities and LISREL Determined Path Coefficients," in Proceedings of the Hawaii International Conference on Information Systems (HICSS), Big Island, Hawaii, January, 2002.
Goodhue, D.L. "Understanding User Evaluations of Information Systems," Management Science (41:12), December 1995, pp 1827-1844.
Goodhue, D.L., and Thompson, R.L. "Task-Technology Fit and Individual Performance," MIS Quarterly (19:2), June 1995, pp 213-236.
Goodman, P.S. Missing Organizational Linkages: Tools for Cross-Level Research Sage Publications, CA, 2000.
Gopal, A., and Prasad, P. "Understanding GDSS in Symbolic Context: Shifting the Focus from Technology to Interaction," MIS Quarterly (24) 2000, pp 509-546.
Grace, R.C. "On the Failure of Operationism," Theory & Psychology (11:1) 2001, pp 5-33.

227
Green, G.I., and Hughes, C.T. "Effects of Decision Support Training and Cognitive Style on Decision Process Attributes," Journal of Management Information Systems (3:2), Fall 1986, pp 81-93.
Greenberg, J. "The College Sophomore as Guinea Pig: Setting the Record Straight," Academy of Management Review (12:1) 1987, pp 157-159.
Griffin, M.A. "Interaction Between Individual and Situations: Using HLM Procedures to Estimate Reciprocal Relationships," Journal of Management (23) 1997, pp 759-773.
Griffith, T.L. "Technology Features as Triggers for Sensemaking," Academy of Management Review (24:3) 1999, pp 472-488.
Griffith, T.L., and Northcraft, G.B. "Distinguishing Between the Forest and the Trees: Media, Features, and Methodology in Electronic Communication Research," Organization Science (5:2), May 1994, pp 272-285.
Hair, J.F., Anderson, R.E., Tatham, R.L., and Black, W.C. Multivariate Data Analysis, (5th ed.) Prentice Hall, Upper Saddle River, New Jersey, 1998.
Halverson, C.A. "Activity Theory and Distributed Cognition: Or What CSCW Need to DO with Theories?," Computer Supported Cooperative Work (11) 2002, pp 243-267.
Hanson, N.R. Patterns of Discovery Cambridge University Press, Cambridge, 1958. Harris, D.H. (ed.) Organizational Linkages: Understanding the Productivity Paradox. National
Academy Press, Washington, D.C., 1994. Harrison, D.A., McLaughlin, M.E., and Coalter, T.M. "Context, Cognition, and Common
Method Variance: Psychometric and Verbal Protocol Evidence," Organizational Behavior and Human Decision Processes (68) 1996, pp 246-261.
Hartwick, J.H., and Barki, H. "Explaining the Role of User Participation in Information System Use," Management Science (40) 1994, pp 440-465.
Heine, M.L., Grover, V., and Malhortra, M.K. "The Relationship Between Technology and Performance: A Meta-Analysis of Technology Models," Omega, International Journal of Management Science (31:3) 2003, pp 189-204.
Heracleous, L., and Barrett, M. "Organizational Change as Discourse: Communicative Actions and Deep Structures in the Context of Information Technology Implementation," Academy of Management Journal (44:4) 2001, pp 755-776.
Hesketh, B., and Neal, A. "Technology and Performance," in: The Changing Nature of Performance: Implications for Staffing, Motivation, and Development, D.R. Ilgen and E.D. Pulakos (eds.), Jossey-Bass, San Francisco, CA, 1999, pp. 21-55.
Hilbert, D.M., and Redmiles, D.F. "Extracting Usability Information from User Interface Events," ACM Computing Surveys (32:4), December 2000, pp 384-421.
Hirschheim, R., Klein, H., and Lyytinen, K. Information Systems Development and Data Modeling: Conceptual and Philosophical Foundations Cambridge University Press, Cambridge, 1995.
Hoegl, M., and Gemuenden, H.G. "Teamwork Quality and the Success of Innovative Projects: A Theoretical Concept and Empirical Evidence," Organization Science (12:4), July-August 2001, pp 435-449.
Hofmann, D.A. "An Overview of the Logic and Rationale of Hierarchical Linear Models," Journal of Management (23) 1997, pp 723-744.
Hofmann, D.A. "Issues in Multilevel Research: Theory Development, Measurement, and Analysis," in: Handbook of Research Methods in Industrial and Organizational Psychology, S.G. Rogelberg (ed.), Blackwell, Malden, MA, 2002, pp. 247-274.

228
Hofmann, D.A., Griffin, M.A., and Gavin, M.B. "The Application of Hierarchical Linear Modeling to Organizational Research," in: Multilevel Theory, Research, and Methods in Organizations: Foundations, Extensions, and New Directions, K.J. Klein and S.W.J. Kozlowski (eds.), Jossey Bass Inc., San Francisco, 2000, pp. 467-511.
Hofmann, D.A., and Jones, L.M. "Some Foundational and Guiding Questions for Multilevel Construct Validation," in: Research in Multi-level Issues: The Many Faces of Multi-Level Issues (Vol. 3), F. Dansereau and F.J. Yammarino (eds.), Elsevier Science, Oxford, U.K., 2004.
Hofmann, D.A., and Jones, L.M. "Leadership, Collective Personality, and Performance," Journal of Applied Psychology (In press) 2005.
Hofmann, D.A., Morgeson, F.P., and Gerras, S.J. "Climate as a Moderator of the Relationship Between Leader-Member Exchange and Content Specific Citizenship: Safety Climate as an Exemplar," Journal of Applied Psychology (88:1) 2003, pp 170-178.
Hogue, J. "A Framework for the Examination of Management Involvement in Decision Support Systems," Journal of Management Information Systems (4:1), Fall 1987, pp 96-110.
House, R., Rousseau, D.M., and Thomas-Hunt, M. "The Meso Paradigm: A Framework for Integration of Micro and Macro Organizational Behavior," in: Research in Organizational Behavior, L.L. Cummings and B. Staw (eds.), JAI Press, Greenwich, CT, 1995, pp. 71-114.
Hovorka, D.S., Germonprez, M., and Larsen, K.R.T. "Explanation in Information Systems," Sprouts Working Paper Series in Information Environments, Systems, and Organizations (3:Summer) 2003, pp 1-19.
Hoyt, W.T. "Rater Bias in Psychological Research: When Is It A Problem and What Can We Do About It?," Psychological Methods (5:1) 2000, pp 64-86.
Hoyt, W.T., and Kerns, M.-D. "Magnitude and Moderators of Bias in Observer Ratings: A Meta-Analysis," Psychological Methods (4:4) 1999, pp 403-424.
Huber, G.P. "A Theory of the Effects of Advanced Information Technology on Organizational Design," Academy of Management Review (15:1) 1990, pp 47-71.
Hufnagel, E.M., and Conca, C. "User Response Data: The Potential for Errors and Biases," Information Systems Research (5:1) 1994, pp 48-73.
Igbaria, M., Guimaraes, T., and Davis, G.B. "Testing the Determinants of Microcomputer Usage via a Structural Equation Model," Journal of Management Information Systems (11:4), Spring 1995, pp 87-114.
Igbaria, M., Parsuraman, S., and Baroudi, J. "A Motivational Model of Microcomputer Usage," Journal of Management Information Systems (13:1) 1996, pp 127-143.
Igbaria, M., and Tan, M. "The Consequences of Information Technology Acceptance on Subsequent Individual Performance," Information & Management (32) 1997, pp 113-121.
Igbaria, M., Zinatelli, N., Cragg, P., and Cavaye, A.L.M. "Personal Computing Acceptance Factors in Small Firms: A Structural Equation Model," MIS Quarterly (21:3) 1997, pp 279-305.
James, L.R. "Aggregation Bias in Estimates of Perceptual Agreement," Journal of Applied Psychology (67) 1982, pp 219-229.
Jarvenpaa, S.L., and Staples, D.S. "The Use of Collaborative Electronic Media for Information Sharing: An Exploratory Study of Determinants," Journal of Strategic Information Systems (9) 2000, pp 129-154.
229
Jasperson, J., Carte, T.A., Saunders, C.S., Butler, B.S., Croes, H.J.P., and Zheng, W.J. "Review: Power and Information Technology Research: A Metatriangulation Review," MIS Quarterly (26:4), December 2002, pp 397-459.
Jasperson, J., Carter, P.E., and Zmud, R.W. "A Comprehensive Conceptualization of the Post-Adoptive Behaviors Associated with IT-Enabled Work Systems," MIS Quarterly (forthcoming) 2005.
John, B.K. "Information Processing and Skilled Behavior," in: HCI Models Theories and Frameworks: Towards a Multidisciplinary Science, J.M. Carroll (ed.), Morgan Kaufmann Publishers, San Francisco, 2003, pp. 55-101.
Johnson, R.D., and Marakas, G.M. "The Role of Behavioral Modeling in Computer Skills Acquisition--Toward Refinement," Information Systems Research (11:4) 2000, pp 402-417.
Jones, M.R. "Debatable Advice and Inconsistent Evidence: Methodology in Information Systems Research," in B. Kaplan, D.P. Truex III, D. Wastell and J.I. DeGross, Proceedings of the IFIP TC8 WG8.2, 20th Year Retrospective, Relevant Theory and Informed Practice: Looking Forward from a 20-year Perspective on IS Research, Dordrecht: Kluwer, Manchester, England, 2004, pp. 121-142.
Kaplan, A. The Conduct of Inquiry: Methodology for Behavioral Science Transaction edition (Originally published in 1964), Transaction Publishers, Piscataway, New Jersey, 1998.
Kaplan, R.S., and Norton, D.P. "The Balanced Scorecard: Measures that Drive Performance," Harvard Business Review (Jan/Feb) 1992, pp 71-79.
Karahanna, E., and Straub, D. "The Psychological Origins of Perceived Usefulness and Perceived Ease-of-Use," Information & Management (35) 1999, pp 237-250.
Karsten, H. "Collaboration and Collaborative Information Technologies: A Review of the Evidence," The DATA BASE for Advances in Information Systems (30:2) 1999, pp 44-65.
Karsten, H. "Constructing Interdependencies with Collaborative Information Technology," Computer Supported Cooperative Work (12) 2003, pp 437-464.
Keil, M., Beranek, P.M., and Konsynski, B.R. "Usefulness and Ease of Use: Field Study Evidence Regarding Task Consideration," Decision Support Systems (13:1), January 1995, pp 75-91.
Keil, M., Mann, J., and Rai, A. "Why Software Projects Escalate: An Empirical Analysis and Test of Four Theoretical Models," MIS Quarterly (24:4), December 2000, pp 631-664.
Kenny, D.A. "The Multitrait-Multimethod Matrix: Design, Analysis, and Conceptual Issues," in: Personality Research, Methods, and Theory: A Festschrift Honoring Donald W. Fiske, P.E. Shrout and S.T. Fiske (eds.), Lawrence Erlbaum, Hillsdale, NJ., 1995, pp. 111-124.
Kim, E., and Lee, J. "An Exploratory Contingency Model of User Participation and MIS Use," Information & Management (11:2), September 1986, pp 87-97.
Kim, J., Hahn, J., and Hahn, H. "How Do we Understand a System with (So) Many Diagrams? Cognitive Integration Processes in Diagrammatic Reasoning," Information Systems Research (11:3), September 2000, pp 284-303.
Kitcher, P. "Explanation," in: Routledge Encyclopedia of Philosophy, E. Craig (ed.), Routledge, London, 1998.
Klein, H.K. "Seeking the New and the Critical in Critical Realism: deja vu?," Information and Organization (14) 2004, pp 123-144.
Klein, K.J., Bliese, P.D., Kozlowski, S.W.J., Dansereau, F., Gavin, M.B., Griffin, M.A., Hofmann, D.A., James, L.R., Yammarino, F.J., and Bligh, M.C. "Multilevel Analytical

230
Techniques: Commonalities, Differences, and Continuing Questions," in: Multilevel Theory, Research, and Methods in Organizations: Foundations, Extensions, and New Directions, Jossey-Bass Inc., San Francisco, CA, 2000, pp. 512-553.
Klein, K.J., Cannella, A., and Tosi, H. "Multilevel Theory: Challenges and Contributions," Academy of Management Review (24) 1999, pp 243-248.
Klein, K.J., Dansereau, F., and Hall, R.J. "Levels Issues in Theory Development, Data Collection, and Analysis," Academy of Management Review (19) 1994, pp 195-229.
Klein, K.J., and Kozlowski, S.W.J. (eds.) Multilevel Theory, Research, and Methods in Organizations. Jossey-Bass, California, 2000.
Kline, T.J.B., Sulsky, L.M., and Rever-Moriyama, S.D. "Common Method Variance and Specification Errors: A Practical Approach to Detection," The Journal of Psychology (134) 2000, pp 401-421.
Kozlowski, S.W.J., and Klein, K.J. "A Multilevel Approach to Theory and Research in Organizations," in: Multilevel Theory, Research, and Methods in Organizations, K.J. Klein and S.W.J. Kozlowski (eds.), Jossey-Bass, California, 2000, pp. 3-90.
Kraut, R.E. "Applying Social Psychological Theory to the Problems of Group Work," in: HCI Models Theories and Frameworks: Towards a Multidisciplinary Science, J.M. Carroll (ed.), Morgan Kaufmann Publishers, San Francisco, 2003, pp. 325-356.
Kuhn, T.S. The Structure of Scientific Revolutions, (Third ed.) University of Chicago Press, Chicago, USA, 1996.
Kwon, T.H., and Zmud, R.W. "Unifying the Fragmented Models of Information Systems Implementation," in: Critical Issues in Information Systems Research, R. Boland and R. Hirschheim (eds.), Wiley, Chichester, 1987, pp. 88-97.
Lamb, R., and Kling, R. "Reconceptualizing Users as Social Actors in Information Systems Research," MIS Quarterly (27:2) 2003, pp 197-235.
Landry, M., and Banville, C. "A Disciplined Methodological Pluralism for MIS Research," Accounting, Management and Information Technologies (2:2), April-June 1992, pp 77-97.
Lassila, K.S., and Brancheau, J.C. "Adoption and Utilization of Commercial Software Packages: Exploring Utilization Equilibria, Transitions, Triggers, and Tracks," Journal of Management Information Systems (16:2), Fall 1999, pp 63-90.
Lave, J., and Wenger, E. Situated Learning: Legitimate Peripheral Participation Cambridge University Press, Cambridge, UK, 1991.
Law, K.S., Wong, C.-S., and Mobley, W.H. "Toward a Taxonomy of Multidimensional Constructs," Academy of Management Review (23:4), October 1998, pp 741-755.
Lee, A.S. "Integrating Positivist and Interpretive Approaches to Organizational Research," Organization Science (2) 1991, pp 342-365.
Lee, A.S. "Rigor and Relevance in MIS Research: Beyond the Approach of Positivism Alone," MIS Quarterly (23:1), March 1999, pp 29-33.
Lee, A.S., and Baskerville, R. "Generalizing Generalizability in Information Systems Research," Information Systems Research (14:3), September 2003, pp 221-243.
Lee, J.-N., Miranda, S.M., and Kim, Y.-M. "IT Outsourcing Strategies: Universalistic, Contingency, and Configurational Explanations of Success," Information Systems Research (15:2), June 2004, pp 110-131.
Levins, R. "The Strategy of Model Building in Population Biology," American Scientist (54) 1966, pp 421-431.

231
Lewis, M.W., and Grimes, A.J. "Metatriangulation: Building Theory from Multiple Paradigms," Academy of Management Review (24:4) 1999, pp 672-690.
Lewis, M.W., and Kelemen, M.L. "Multiparadigm Inquiry: Exploring Organizational Pluralism and Paradox," Human Relations (55:2) 2002, pp 251-275.
Lindell, M.K., and Whitney, D.J. "Accounting for Common Method Variance in Cross-Sectional Research Designs," Journal of Applied Psychology (86:1), Feb 2001, pp 114-121.
Lindenberg, S. "Grounding Groups in Theory: Functional, Cognitive, and Structural Interdependencies," in: Advances in Group Processes, JAI Press, Greenwich, CT, 1997, pp. 281-331.
Little, T.D., Lindenberger, U., and Nesselroade, J.R. "On Selecting Indicators for Multivariate Measurement and Modeling with Latent Variables: When "Good" Indicators are Bad and "Bad" Indicators are Good," Psychological Methods (4:2) 1999, pp 192-211.
Locke, E.A., and Latham, G.P. A Theory of Goal Setting and Task Performance Prentice Hall, Englewood Cliffs, NJ, 1990.
Loevinger, J. "Objective Tests as Instruments of Psychological Theory," Psychological Reports (3), Monograph Supp. 9 1957, pp 635-694.
Lohmoller, J.-B. Latent Variable Path Modeling with Partial Least Squares Physica-Verlag, Heidelberg, 1989.
Long, J.G., and Denning, D.E. "Ultra-Structure: A Design Theory for Complex Systems and Processes," Communications of the ACM (38:1), January 1995, pp 103-120.
Lucas, H.C. "Empirical Evidence for a Descriptive Model of Implementation," MIS Quarterly (2:2), June 1978a, pp 27-41.
Lucas, H.C. "The Use of an Interactive Information Storage and Retrieval System in Medical Research," Communications of the ACM (21:3), March 1978b, pp 197-205.
Lucas, H.C. "The Business Value of Information Technology: A Historical Perspective and Thoughts for Future Research," in: Strategic Information Technology Management: Perspectives on Organizational Growth and Competitive Advantage, R.D. Banker, R.J. Kauffman and M.A. Mahmood (eds.), Idea Group Publishing, Harrisburg, Pennsylvania, 1993, pp. 359-374.
Lucas, H.C., and Spitler, V.K. "Technology Use and Performance: A Field Study of Broker Workstations," Decision Sciences (30:2), Spring 1999, pp 1-21.
Luke, D.A. Multilevel Modeling Sage, Thousand Oaks, 2004. Mackay, J.M., and Elam, J.J. "A Comparative Study of how Experts and Novices use a Decision
Aid to Solve Problems in Complex Knowledge Domains," Information Systems Research (3:2) 1992, pp 150-172.
Mackay, W.E. "Patterns of Sharing Customizable Software," in Proceedings of the ACM CSCW 90: Conference on Computer-Supported Cooperative Work., ACM, Los Angeles, CA, 1990, pp. 209-221.
Mahmood, M.A., and Medewitz, J.N. "Impact of Design Methods on Decision Support System Success: An Empirical Assessment," Information & Management (9:3), October 1985, pp 137-151.
Mainemelis, C. "When the Muse Takes it All: A Model for the Experience of Timeliness in Organizations," Academy of Management Review (26:4), October 2001, pp 548-565.
Majchrzak, A., Rice, R.E., Malhorta, A., King, N., and Ba, S. "Technology Adaptation: The Case of a Computer-Supported Inter-Organizational Virtual Team," MIS Quarterly (24) 2000, pp 569-600.

232
Malone, T.W., and Crowston, K. "The Interdisciplinary Study of Coordination," ACM Computing Surveys (26:1) 1994, pp 87-119.
Malone, T.W., Crowston, K., Lee, J., Pentland, B., Dellarocas, C., Wyner, G., Quimby, J., Osborne, C., Bernstein, A., Herman, G., Klein, M., and O’Donnell, E. "Tools for Inventing Organizations: Toward a Handbook of Organizational Processes," Management Science (45:3) 1999, pp 425-443.
March, J.G. "Exploration and Exploitation in Organizational Learning," Organizational Science (2) 1991, pp 71-87.
Marcolin, B.L., Compeau, D., Munro, M.C., and Huff, S.L. "Assessing User Competence: Conceptualization and Measurement," Information Systems Research (11:1) 2001, pp 37-60.
Markus, M.L. "Electronic Mail as the Medium of Managerial Choice," Organizational Science (5) 1994, pp 502 - 525.
Markus, M.L. "Fit For Function: Functionalism, Neofunctionalism, and Information Systems," in: Social Theory and Philosophy for Information Systems, J. Mingers and L. Willcocks (eds.), John Wiley & Sons Ltd., London, 2004, pp. 27-55.
Markus, M.L., and Robey, D. "Information Technology and Organizational Change: Causal Structure in Theory and Research," Management Science (34:5), May 1988, pp 583-598.
Markus, M.L., and Robey, D. "Why Stuff Happens: Explaining the Unintended Consequences of Using Information Technology," in: The Past and Future of Information Systems, M.T. Vendelo and K.V. Andersen (eds.), Elsevier Butterworth-Heinemann, London, 2004, pp. 61-93.
Martell, R.F., and Leavitt, K.N. "Reducing the Performance-Cue Bias in Work Behavior Ratings: Can Groups Help?," Journal of Applied Psychology (82:6) 2002, pp 1032-1041.
Massetti, B., and Zmud, R.W. "Measuring the Extent of EDI Usage in Complex Organizations: Strategies and Illustrative Examples," MIS Quarterly (20:3), September 1996, pp 331-345.
Mathieson, K., Peacock, E., and Chin, W.W. "Extending the Technology Acceptance Model: The Influence of Perceived User Resources," The DATA BASE for Advances in Information Systems (32:3), Summer 2001, pp 86-112.
McKeen, J.D., and Smith, H.A. "The Relationship Between Information Technology Use and Organizational Performance," in: Strategic Information Technology Management: Perspectives on Organizational Growth and Competitive Advantage, R.D. Banker, R.J. Kauffman and M.A. Mahmood (eds.), Idea Group Publishing, Harrisburg, Pennsylvania, 1993, pp. 405-444.
McKelvey, B. "Model-Centered Organization Science Epistemology," in: The Blackwell Companion to Organizations, J.A.C. Baum (ed.), Blackwell, Oxford, UK, 2002, pp. 752-780.
Meister, D. (ed.) Human Factors Testing and Evaluation. Elsevier, West Lafayette IN, 1986. Meister, D.B., and Compeau, D.R. "Infusion Of Innovation Adoption: An Individual
Perspective," in Proceedings of the Annual Conference of the Administrative Sciences Association of Canada (ASAC), May 25-28, Winnipeg, 2002, pp. 23-33.
Melone, N. "A Theoretical Assessment of the User-Satisfaction Construct in Information Systems Research," Management Science (36:1), January 1990, pp 76-91.

233
Melville, N., Kraemer, K., and Gurbaxani, V. "Information Technology and Organizational Performance: An Integrative Model of IT Business Value," MIS Quarterly (28:2), June 2004, pp 283-322.
Merriam-Webster Unabridged Dictionary, accessed online (http://www.m-w.com/) 2004. Messick, S. "Validity," in: Educational measurement, R.L. Linn (ed.), Macmillan, New York,
1989, pp. 13-103. Meyer, A.D., Tsui, A.S., and Hinings, C.R. "Configurational Approaches to Organizational
Analysis," Academy of Management Journal (36:6) 1993, pp 1175-1195. Meyer, G.J., Finn, S.E., Eyde, L.D., Kay, G.G., Moreland, K.L., Dies, R.R., Eisman, E.J.,
Kubiszyn, T.W., and Reed, G.M. "Psychological Testing and Psychological Assessment: A Review of Evidence and Issues," American Psychologist (56:2), February 2001, pp 128-165.
Miles, M.B., and Huberman, M.A. Qualitative Data Analysis, (2nd Edition ed.) Sage, 1994. Millsap, R.E. "The Statistical Analysis of Method Variance in Multitrait-Multimethod Data: A
Review," in: Personality Research, Methods, and Theory: A Festschrift Honoring Donald W. Fiske, P.E. Shrout and S.T. Fiske (eds.), Lawrence Erlbaum, Hillsdale, New Jersey, 1995, pp. 93-109.
Mingers, J. "Combining IS Research Methods: Towards a Pluralistic Methodology," Information Systems Research (12:3), September 2001, pp 240-259.
Mingers, J. "Critical Realism and Information Systems: Brief Responses to Monod and Klein," Information and Organization (14) 2004a, pp 145-153.
Mingers, J. "Real-izing Information Systems: Critical Realism as an Underpinning Philosophy for Information Systems," Information and Organization (14:2) 2004b, pp 87-103.
Mir, R., and Watson, A. "Critical Realism and Constructivism in Strategy Research: Toward a Synthesis," Strategic Management Journal (22:12) 2001, p 1169–1173.
Mitchell, T.R., and James, L.R. "Building Better Theory: Time and the Specification of When Things Happen," Academy of Management Review (26:4) 2001, pp 530-547.
Mohr, L.B. Explaining Organizational Behavior Jossey-Bass, San Francisco, 1982. Moldoveanu, M.C., and Baum, J.A.C. "Epistemological Misattributions in Organization
Science," in: Companion to Organizations, J.A.C. Baum (ed.), Blackwell, Oxford UK, 2002, pp. 733-751.
Monod, E. "Einstein, Heisenberg, Kant: Methodological Distinction and Conditions of Possibilities," Information and Organization (14) 2004, pp 105-121.
Moore, G.C., and Benbasat, I. "Development of an Instrument to Measure the Perceptions of Adopting and Information Technology Innovation," Information Systems Research (2) 1991, pp 192-222.
Morgeson, F.P., and Hofmann, D.A. "The Structure and Function of Collective Constructs: Implications for Multilevel Research and Theory Development," Academy of Management Review (24:2), April 1999, pp 249-265.
Motl, R.W., and DiStefano, C. "Longitudinal Invariance of Self-Esteem and Method Effects Associated with Negatively Worded Items," Structural Equation Modeling (9:4) 2002, pp 562-578.
Myers, M.D., Straub, D.W., Mingers, J., and Walsham, G. "The Great Quantitative/Qualitative Debate: The Past, Present, and Future of Positivism and Post-Positivism in Information Systems," in B. Kaplan, D.P. Truex III, D. Wastell and J.I. DeGross, Proceedings of the IFIP TC8 WG8.2, 20th Year Retrospective, Relevant Theory and Informed Practice:
234
Looking Forward from a 20-year Perspective on IS Research, Dordrecht: Kluwer, Manchester, England, 2004, pp. 659-660.
Nance, W.D. "Task/Technology Fit and Knowledge Worker Use of Information Technology: A Study of Auditors," Doctoral dissertation, University of Minnesota, Minnesota, 1992.
Nelson, R.R., and Cheney, P.H. "Training End Users: An Exploratory Study," MIS Quarterly (11:4), December 1987, pp 547-559.
Ngwenyama, O.K., and Lee, A.S. "Communication Richness in Electronic Mail: Critical Social Theory and the Contextuality of Meaning," MIS Quarterly (21:2) 1997, pp 145-167.
Nunnally, J.C. Psychometric Theory McGraw-Hill, New York, 1967. Nunnally, J.C., and Bernstein, I.H. Psychometric Theory, (Third ed.) McGraw-Hill Inc., New
York, 1994. Olivera, F., and Straus, S.G. "Group-to-Individual Transfer of Learning: Cognitive and Social
Factors," Small Group Research (35:4), August 2004, pp 440-465. Orlikowski, W.J. "CASE Tools as Organizational Change: Investigating Incremental and Radical
Changes in Systems Development," MIS Quarterly (17) 1993, pp 309-340. Orlikowski, W.J. "Improvising Organizational Transformation Over Time: A Situated Change
Perspective," Information Systems Research (7) 1996, pp 63-92. Orlikowski, W.J. "Using Technology and Constituting Structures: A Practice Lens for Studying
Technology in Organizations," Organization Science (11:4), July-August 2000, pp 404-428.
Orlikowski, W.J., and Baroudi, J.J. "Studying Information Technology in Organizations: Research Approaches and Assumptions," Information Systems Research (2) 1991, pp 1-28.
Orlikowski, W.J., and Iacono, C.S. "Research Commentary: Desperately Seeking the "IT" in IT Research - A Call to Theorizing the IT Artifact," Information Systems Research (12:2), June 2001, pp 121-134.
Orlikowski, W.J., Yates, J., Okamura, K., and Fujimoto, M. "Shaping Electronic Communication: The Metastructuring of Technology in the Context of Use," Organization Science (6:4), July-August 1995, pp 423-444.
Orne, M.T. "On the Social Psychology of the Psychological Experiment: With Particular Reference to Demand Characteristics and their Implications," American Psychologist (17) 1962, p 776–783.
Panko, R.R. "What we Know About Spreadsheet Errors," Journal of End User Computing (10:2), Spring 1998, pp 15-21.
Payne, S., Finch, J.F., and Tremble Jr., T.R. "Validating Surrogate Measures of Psychological Constructs: The Application of Construct Equivalence to Archival Data," Organizational Research Methods (6:3), July 2003, pp 363-382.
Pentland, B.T. "Use and Productivity in Personal Computing: An Empirical Test," in J.I. DeGross, J.C. Henderson and B.R. Konsynski, Proceedings of the Tenth International Conference on Information Systems, December, Boston, MA, 1989, pp. 211-222.
Percival, P. "Theoretical Terms: Meaning and Reference," in: A Companion to the Philosophy of Science, W.H. Newton-Smith (ed.), Blackwell Publishers, Malden, Mass., 2000, pp. 495-514.
Perry, M. "Distributed Cognition," in: HCI Models, Theories, and Frameworks: Towards a Multidisciplinary Science, J.M. Carroll (ed.), Morgan Kaufmann Publishers, San Francisco, 2003, pp. 193-223.

235
Petter, S.C., and Gallivan, M.J. "Toward a Framework for Classifying and Guiding Mixed Method Research in Information Systems," in Proceedings of the 37th Hawaii International Conference on System Sciences, IEEE, Hawaii, 2004, pp. 1-10.
Pinsonneault, A., and Kraemer, K. "Survey Research Methodology in Management Information Systems," Journal of Management Information Systems (Fall) 1993, pp 75-105.
Platt, J.R. "Strong Inference," Science (146) 1964, pp 347-353. Podsakoff, P.M., MacKenzie, S.B., Lee, J.-Y., and Podsakoff, N.P. "Common Method Bias in
Behavioral Research: A Critical Review of the Literature and Recommended Remedies," Journal of Applied Psychology (88:5) 2003, pp 879-903.
Podsakoff, P.M., and Organ, D.W. "Self-Reports in Organizational Research: Problems and Prospects," Journal of Management (12) 1986, pp 69-82.
Poole, M.S., Van de Ven, A.H., Dooley, K., and Holmes, M.E. Organizational Change and Innovation Processes Oxford University Press, New York, 2000.
Proctor, R.W., and Dutta, A. Skill Acquisition and Human Performance Sage, CA, 1995. Rai, A., Lang, S.S., and Welker, R.B. "Assessing the Validity of IS Success Models: An
Empirical Test and Theoretical Analysis," Information Systems Research (13:1), September 2002, pp 50-69.
Raudenbush, S.W., and Bryk, A.S. Hierarchical Linear Models: Applications and Data Analysis Methods, (Second ed.) Sage Publications, Newbury Park, CA, 2002.
Reichardt, C.S., and Coleman, S.C. "The Criteria for Convergent and Discriminant Validity in a Multitrait-Multimethod Matrix," Multivariate Behavioral Research (30:4) 1995, pp 513-538.
Roberts, K.H., Hulin, C.L., and Rousseau, D.M. Developing an Interdisciplinary Science of Organizations Jossey Bass, San Francisco, 1978.
Robey, D. "Diversity in Information Systems Research: Threat, Promise, and Responsibility," Information Systems Research (7) 1996, pp 400-408.
Robey, D., and Boudreau, M.-C. "Organizational Consequences of Information Technology: Dealing with Diversity in Empirical Research," in: Framing the Domains of IT Management, R.W. Zmud (ed.), Pinnaflex Educational Resources, Cincinnati, Ohio, 2000, pp. 51-63.
Robey, D., and Sahay, S. "Transforming Work through Information Technology: A Comparative Case Study of Geographic Information Systems in County Government," Information Systems Research (7:1), March 1996, pp 93-110.
Robinson, W.S. "Ecological Correlations and the Behavior of Individuals," American Sociological Review (15) 1950, pp 351-357.
Rodan, S., and Galunic, C. "More than Network Structure: How Knowledge Heterogeneity Influences Managerial Performance and Innovativeness," Strategic Management Journal (25) 2004, pp 541-562.
Rogers, E.M. Diffusion of Innovations, (4th edition ed.) The Free Press, New York, 1996. Rosenberg, A. Philosophy of Social Science Westview Press, Boulder, CO, 1995. Rossiter, J.R. "The C-OAR-SE Procedure for Scale Development in Marketing," International
Journal of Research in Marketing (19) 2002, pp 305-335. Rousseau, D.M. "Issues of Level in Organizational Research: Multi Level and Cross Level
Perspectives," Research in Organizational Behaviour (7) 1985, pp 1-37.

236
Rousseau, D.M. "Multilevel Competencies and Missing Linkages," in: Multilevel Theory, Research, and Methods in Organizations, K.J. Klein and S.W.J. Kozlowski (eds.), Jossey-Bass, San Francisco, 2000, pp. 572-582.
Sabherwal, R., and Robey, D. "Reconciling Variance and Process Strategies for Studying Information Systems Development," Information Systems Research (6:4), December 1995, pp 303-327.
Saga, V.L., and Zmud, R.W. "The Nature & Determinants of Information Technology Infusion at an Organizational Level of Analysis," in Proceedings of the Academy of Management, Distinguished Poster Session, Technology & Innovation Management,, Dallas, TX, August, 1994.
Santhanam, R., and Hartono, E. "Issues in Linking Information Technology Capability to Firm Performance," MIS Quarterly (27:1) 2003, pp 125-153.
Saris, W.E., and Aalberts, C.E. "Different Explanations for Correlated Disturbance Terms in MTMM Studies," Structural Equation Modeling (10:2) 2003, pp 193-213.
Scandura, T.A., and Williams, E.A. "Research Methodology in Management: Current Practices, Trends, and Implications for Future Research," Academy of Management Journal (43:6) 2000, pp 1248-1264.
Schaeffer, N.C., and Presser, S. "The Science of Asking Questions," Annual Review of Sociology (29) 2003, pp 65-88.
Schmidt, F.L. "What Do Data Really Mean? Research Findings, Meta-Analysis, and Cumulative Knowledge in Psychology," American Psychologist (47:10), October 1992, pp 1173-1181.
Schutz, A. "Concept and Theory Formation in the Social Sciences," in: Collected Papers, M. Natanson (ed.), Martinus Nijhoff, The Hague, 1962, pp. 48-66.
Schwager, W.K. "The Representational Theory of Measurement: An Assessment," Psychological Bulletin (110:3) 1991, pp 618-626.
Schwandt, T.A. Qualitative Inquiry: A Dictionary of Terms Sage, 1997. Searle, J.R. The Construction of Social Reality The Free Press, New York, 1995. Sechrest, L., Davis, M.F., Stickle, T.R., and McKnight, P.E. "Understanding "Method"
Variance," in: Research Design: Donald Campbell's Legacy, L. Bickman (ed.), Sage Publications, Thousand Oaks, California, 2000, pp. 63-87.
Seddon, P.B. "A Respecification and Extension of the DeLone and McLean Model of IS Success," Information Systems Research (8:3), September 1997, pp 240-253.
Segars, A.H., and Grover, V. "Strategic Information Systems Planning Success: An Investigation of the Construct and its Measurement," MIS Quarterly (22:2), June 1998, pp 139-163.
Shadish, W.R., Cook, T.D., and Campbell, D.T. Experimental and Quasi-Experimental Designs for Generalized Causal Inference Houghton-Mifflin, Boston, 2002.
Shadra, R., Barr, S.H., and McDonnell, J.C. "Decision Support System Effectiveness: A Review and Empirical Test," Management Science (34:2), February 1988, pp 139-159.
Sharma, R., and Yetton, P. "The Relationship between Perceived Usefulness and Use: The Effect of Common Method Bias," in Proceedings of the Diffusion Interest Group in Information Technology (DIGIT) Conference, Washington DC., 2004, p. 34 pp.
Shaw, T., and Jarvenpaa, S.L. "Process Models in Information Systems," in: Information Systems and Qualitative Research, J.L. A.S. Lee, & J.L. DeGross, eds. Information Systems and Qualitative Research (ed.), Chapman and Hall, London, 1997, pp. 70-100.
237
Shrout, P.E., and Fleiss, J.L. "Intraclass Correlations: Uses in Assessing Rater Reliability," Psychological Bulletin (86:2) 1979, pp 420-428.
Simon, H.A. The Sciences of the Artificial, (Third Edition ed.) The MIT Press, Cambridge, 1996. Simons, R., Mintzberg, H., and Basu, K. "Memo to CEOs," FastCompany (59:June), available
online at: http://pf.fastcompany.com/magazine/59/ceo.html 2002, p 117. Snitkin, S.R., and King, W.R. "Determinants of the Effectiveness of Personal Decision Support
Systems," Information & Management (10:2), February 1986, pp 83-89. Soh, C., and Markus, M.L. "How IT Creates Business Value: A Process Theory Synthesis," in
J.I. DeGross, G. Ariav, C. Beath, R. Hoyer and K. Kemerer, Proceedings of the Sixteenth International Conference on Information Systems, Amsterdam, December, 1995, pp. 29-41.
Sonnentag, S., and Frese, M. "Performance Concepts and Performance Theory," in: Psychological Management of Individual Performance, S. Sonnentag (ed.), Wiley, Chichester, 2002, pp. 3-25.
Sparrowe, R.T., Liden, R.C., Wayne, S.J., and Kraimer, M.L. "Social Networks and the Performance of Individuals and Groups," Academy of Management Journal (44:2) 2001, pp 316-325.
Spector, P.E. "A Consideration of the Validity and Meaning of Self-report Measures of Job Conditions," in: International Review of Industrial and Organizational Psychology, C.L. Cooper and I.T. Robertson (eds.), Wiley, New York, 1992, pp. 123-151.
Spector, P.E. "Using Self-Report Questionnaires in OB Research: A Comment on the Use of a Controversial Method," Journal of Organizational Behavior (15) 1994, pp 385-392.
Springer, C.W., and Borthick, A.F. "Business Simulation to Stage Critical Thinking in Introductory Accounting: Rationale, Design and Implementation," Issues in Accounting Education (19:3) 2004, pp 277-303.
Srinivasan, A. "Alternative Measures of System Effectiveness: Associations and Implications," MIS Quarterly (9:3), September 1985, pp 243-253.
Steiner, I. Group Processes and Productivity Academic Press, New York, 1972. Strassman, P.A., Berger, P., Swanson, E.B., Kriebel, C.H., and Kauffman, R.J. Measuring
Business Value of Information Technologies ICIT Press, Washington, DC, 1988. Straub, D., Limayem, M., and Karahanna-Evaristo, E. "Measuring System Usage: Implications
for IS Theory Testing," Management Science (41), August 1995, pp 1328-1342. Straub, D., Rai, A., and Klein, R. "Measuring Firm Performance at the Network Level: A
Nomology of the Business Impact of Digital Supply Networks," Journal of Management Information Systems (21:1) 2004a, pp 83-114.
Straub, D.W. "Effective IS Security: An Empirical Study," Information Systems Research (1:3), Sep 1990, pp 255-276.
Straub, D.W., Boudreau, M.-C., and Gefen, D. "Validation Guidelines for IS Positivist Research," Communications of The AIS (13:24) 2004b, pp 380-427.
Strauss, S.G., and McGrath, J.E. "Does the Medium Matter? The Interaction of Task Type and Technology on Group Performance and Member Reactions," Journal of Applied Psychology (79:1) 1994, pp 87-97.
Subramani, M. "How do Suppliers Benefit from Information Technology Use in Supply Chain Relationships," MIS Quarterly (28:1), March 2004, pp 45-74.
Suppe, F. (ed.) The Structure of Scientific Theories. University of Illinois Press, Urbana, 1977.

238
Swanson, E.B. "Information Channel Disposition and Use," Decision Sciences (18:1), Winter 1987, pp 131-145.
Szajna, B. "Determining Information Systems Usage: Some Issues and Examples," Information & Management (25) 1993, pp 147-154.
Szajna, B. "Empirical Evaluation of the Revised Technology Acceptance Model," Management Science (42:1) 1996, pp 85-92.
Taylor, S., and Todd, P.A. "Understanding Information Technology Usage: A Test of Competing Models," Information Systems Research (6:2), June 1995, pp 144-176.
Tepper, B.J., and Tepper, K. "The Effects of Method Variance within Measures," The Journal of Psychology (127:3) 1993, pp 293-302.
Thompson, L., and Fine, G.A. "Socially Shared Cognition, Affect, and Behavior: A Review and Integration," Personality and Social Psychology Review (3:4) 1999, pp 278-302.
Thompson, R.L., Higgins, C.A., and Howell, J.M. "Towards a Conceptual Model of Utilization," MIS Quarterly (15:1), March 1991, pp 125-143.
Todd, P., and Benbasat, I. "Evaluating the Impact of DSS, Cognitive Effort, and Incentives on Strategy Selection," Information Systems Research (10:4), December 1999, pp 356-374.
Torkzadeh, G., and Doll, W.J. "The Development of a Tool for Measuring the Perceived Impact of Information Technology on Work," Omega, International Journal of Management Science (27) 1999, pp 327-339.
Tourangeau, R., Rips, L.J., and Rasinski, K. The Psychology of Survey Response Cambridge University Press, Cambridge, UK, 2000.
Trauth, E.M., and Jessup, L.M. "Understanding Computer-Mediated Discussions: Positivist and Interpretive Analyses of Group Support System Use," MIS Quarterly (24:1), March 2000, pp 43-79.
Trice, A.W., and Treacy, M.E. "Utilization as a Dependent Variable in MIS Research," in Proceedings of the Proceedings of the Seventh International Conference on Information Systems, San Diego, CA, 1986, pp. 227-239.
Trout, J.D. "Measurement," in: A Companion to the Philosophy of Science, W.H. Newton-Smith (ed.), Blackwell, Oxford, England, 1999, pp. 265-277.
Tyre, M.J., and Orlikowski, W.J. "Windows of Opportunity: Temporal Patterns of Technological Adaptation in Organizations," Organization Science (5:1), February 1994, pp 98-118.
Vaast, E., and Walsham, G. "Representations and Actions: the Transformation of Work Practices with IT Use," Information and Organization (15) 2005, pp 65-89.
van Bruggen, G.H., Lilien, G.L., and Kacker, M. "Informants in Organizational Marketing Research: Why Use Multiple Informants and How to Aggregate Responses," Journal of Marketing Research (34), November 2002, pp 469-478.
van der Heijden, H. "Factors Influencing the Usage of Websites: The Case of a Generic Portal in The Netherlands," Information & Management (40:6) 2003, pp 541-549.
Vandenberg, R.J. "Toward a Further Understanding of and Improvement in Measurement Invariance Methods and Procedures," Organizational Research Methods (5:2), April 2002, pp 139-158.
Venkatesh, V., and Davis, F.D. "A Theoretical Extension of the Technology Acceptance Model: Four Longitudinal Field Studies," Management Science (46:2) 2000, pp 186-204.
Venkatesh, V., Morris, M.G., Davis, G.B., and Davis, F.D. "User Acceptance of Information Technology: Toward a Unified View," MIS Quarterly (27:3), September 2003, pp 425-478.

239
Venkatraman, N. "The Concept of Fit in Strategy Research: Toward Verbal and Statistical Correspondence," Academy of Management Review (14:3) 1989, pp 423-444.
Vessey, I., and Conger, S.A. "Requirements Specification: Learning Object, Process, and Data Methodologies," Communications of the ACM (37:5), May 1994, pp 102-113.
Viswanathan, M. Measurement Error and Research Design Sage Publications, Thousand Oaks, CA, 2005.
Vlahos, G.E., Ferratt, T.W., and Knoepfle, G. "The Use of Computer-Based Information Systems by German Managers to Support Decision Making," Information & Management (41:6), July 2004, pp 763-779.
von Bertalanffy, L. General Systems Theory Braziller, New York, 1968. Walczuch, R.M., and Watson, R.T. "Analyzing Group Data in MIS Research: Including the
Effect of the Group," Group Decision and Negotiation (10:1), January 2001, pp 83-94. Wand, Y., and Weber, R. "On the Deep Structure of Information Systems," Information Systems
Journal (5) 1995, pp 203-223. Webb, E., Campbell, D.T., Schwartz, R.D., and Sechrest, L. Unobtrusive Measures: Non-
Reactive Research in the Social Sciences Sage Publications (Sage Classics Edition, Original Publication, 1966), Thousand Oaks, CA, 2000.
Weber, R. Ontological Foundations of Information Systems Coopers & Lybrand and Accounting Association of Australia and New Zealand, Melbourne, 1997.
Weber, R. "Editor's Comments: The Reflexive Researcher," MIS Quarterly (27:4), December 2003a, pp v-xiv.
Weber, R. "Editor's Comments: The Rhetoric of Positivism versus Interpretivism: A Personal View," MIS Quarterly (28:1), March 2003b, pp iii-xii.
Weber, R. "Editor's Comments: Theoretically Speaking," MIS Quarterly (27:3), September 2003c, pp iii-xii.
Webster, J. "Desktop Videoconferencing: Experience of Complete Users, Wary Users, and Non-Users," MIS Quarterly (22:3), September 1998, pp 257-286.
Webster, J., and Martocchio, J.J. "Microcomputer Playfulness: Development of a Measure with Workplace Implications," MIS Quarterly (16:2), June 1992, pp 201-226.
Weick, K. "Educational Organizations as Loosely Coupled Systems," Administrative Science Quarterly (21) 1976, pp 1-19.
Westen, D., and Rosenthal, R. "Quantifying Construct Validity: Two Simple Measures," Journal of Personality and Social Psychology (84:3) 2003, pp 608-618.
Whitehead, A.N. Process and Reality Free Press (first published 1929), 1979. Williams, L.J., and Brown, B.K. "Method Variance in Organizational Behavior and Human
Resources Research: Effects on Correlations, Path Coefficients, and Hypothesis Testing," Organizational Behavior and Human Decision Processes (57) 1994, pp 185-209.
Wilson, D.B., and Lipsey, M.W. "The Role of Method in Treatment Effectiveness Research: Evidence from Meta-Analysis," Psychological Methods (6:4) 2001, pp 413-429.
Wilson, T.D., and Dunn, E.W. "Self-Knowledge: Its Limits, Value, and Potential for Improvement," Annual Review of Psychology (55) 2004, pp 493-518.
Woszczynski, A.B., and Whitman, M.E. "The Problem of Common Method Variance in IS Research," in: The Handbook of Information Systems Research, A.B. Woszczynski and M.E. Whitman (eds.), Idea Group Inc., Hershey, PA, 2004, pp. 66-77.
240
Wu, J.-H., and Wang, S.-C. "What Drives Mobile Commerce? An Empirical Evaluation of the Revised Technology Acceptance Model," Information & Management (42:5), July 2005, pp 719-729.
Yin, R.K. Case Study Research: Design and Methods, (2nd ed.) Sage Publications, Thousand Oaks, CA, 1994.
Yuthas, K., and Young, S.T. "Material Matters: Assessing the Effectiveness of Materials Management IS," Information & Management (33) 1998, pp 115-124.
Zhu, K., and Kraemer, K.L. "Post-Adoption Variations in Usage and Value of E-Business by Organizations: Cross-Country Evidence from the Retail Industry," Information Systems Research (16:1), March 2005, pp 61-84.
Zigurs, I. "Methodological and Measurement Issues in Group Support System Research," in: Group Support Systems: New Perspectives, L.M. Jessup and J.S. Valacich (eds.), Macmillan Publishing Company, New York, 1993, pp. 112-122.
Zigurs, I., and Buckland, B.K. "A Theory of Task/Technology Fit and Group Support Systems Effectiveness," MIS Quarterly (22:3), September 1998, pp 313-334.
Zmud, R.W. "Senior Editor Comments" (p. v-vi), in A.S. Lee "Editor's Comments: Research in Information Systems: What we Haven't Learned," MIS Quarterly (25:4) 2001, pp v-xv.

241
Curriculum Vitae
Biographical Details:
Name: Andrew Burton-Jones Birthplace: London, England, May19, 1976 Address: Unit #308-6385 Hawthorne Lane, Vancouver, BC. V6T 124, Canada.
Education
2005 Doctor of Philosophy (Business Administration - MIS), Georgia State University 1998 Master of Information Systems, The University of Queensland, Australia 1998 Bachelor of Commerce (First Class Honors), The University of Queensland
Work Experience
1996 Summer Associate, Coopers and Lybrand, Brisbane, Australia 1997 – 1998 December, 1998, Tutorial Assistant, Department of Commerce, University of Queensland 1999 – 2001 Consultant and Senior Consultant, PriceWaterhouseCoopers, Brisbane, Australia 2001 – 2005 Graduate Research Assistant to Dr. Peter Meso, Dr. Jeff Hubona, and Dr. Detmar Straub,
Department of Computer Information Systems, Georgia State University
Journal Publications
1. Burton-Jones, A. and Hubona, G.S. "Individual Differences and Usage Behavior: Revisiting a Technology Acceptance Model Assumption," The DATABASE for Advances in Information Systems, (36:2), 2005, pp. 58-77.
2. Burton-Jones, A., Storey, V.C., and Sugumaran, V., and Ahluwalia, P. "A Semiotic Metrics Suite for Assessing the Quality of Ontologies," Data and Knowledge Engineering, (In press), 2005.
Conference Publications
1. Burton-Jones, A., and Weber, R. "Understanding Relationships with Attributes in Entity-Relationship Diagrams," in Proceedings of the Twentieth International Conference on Information Systems (ICIS), P. De and J. I. DeGross (eds.), Charlotte, NC, 1999, pp. 214-228.
2. Burton-Jones, A., and Meso, P. "How Good are these UML Diagrams? An Empirical Test of the Wand and Weber Good Decomposition Model," in Proceedings of the Twenty-third International Conference on Information Systems (ICIS), L. Applegate, R. Galliers and J. I. DeGross (eds.), Barcelona, Spain, 2002, pp. 101-114,
3. Burton-Jones, A., Purao, S., and Storey, V.C. "Context-Aware Query Processing on the Semantic Web," in Proceedings of the Twenty-third International Conference on Information Systems (ICIS), L. Applegate, R. Galliers and J. I. DeGross (eds.), Barcelona, Spain, Dec. 16-19, 2002, pp. 195-208.
4. Hubona, G.S., and Burton-Jones, A. "Modeling the User Acceptance of E-Mail," in Proceedings of the Thirty-sixth Annual Hawaii International Conference on System Sciences (HICSS), 2003.

242
5. Burton-Jones, A., Storey, V.C., Sugumaran, V., and Ahluwalia, P. "Assessing the Effectiveness of the DAML Ontologies for the Semantic Web," in Proceedings of the Eighth International Conference on Applications of Natural Language to Information Systems (NLDB), A. Düsterhöft and B. Thalheim (eds.), Burg (Spreewald), Germany, 2003, pp. 56-69.
6. Burton-Jones, A. and R. Weber, "Properties Do Not Have Properties: Investigating a Questionable Conceptual Modeling Practice," in Proceedings of the Second Annual Symposium on Research in Systems Analysis and Design, D. Batra, J. Parsons, and V. Ramesh (eds.), 2003, 14 pp.
7. Burton-Jones, A., Storey, V.C., Sugumaran, V., and Purao, S. "A Heuristic-based Methodology for Semantic Augmentation of User Queries on the Web," in Proceedings of the Twenty-second International Conference on Conceptual Modeling (ER), I.-Y Song, S.W. Liddle, T.W Ling, and P. Scheuermann (eds.), Chicago, Illinois, October 13-16, 2003, pp. 476-489.
8. Burton-Jones, A., Straub, D.W. "Minimizing Method Variance in Measures of System Usage," in Proceedings of the Southern Association for Information Systems (SAIS), R. Papp (ed.), Savannah, Georgia, 2004, pp. 336-342.
9. Storey, V.C., Sugumaran, V., and Burton-Jones, A., "The Role of User Profiles in Context-Aware Query Processing for the Semantic Web," in Proceedings of the Ninth International Conference on Applications of Natural Language to Information Systems (NLDB), F. Meziane and E. Métais (eds.), Salford, UK, June 23-25, 2004, pp. 51-63.
Awards
1. Accepted to the Doctoral Consortium of the International Conference on Information Systems, 2004 2. Best Research Paper Award, International Conference on Information Systems, Barcelona, 2002 3. Phi Beta Kappa, National Honor Society, Georgia State University, 2002-2003 4. Thomas Brown and Son's Memorial Thesis Prize for best Honors Thesis, Department of Commerce,
University of Queensland, 1998 5. Dean's List, Department of Commerce, University of Queensland, 1997-1998 6. Butterworths Book Prize, Department of Commerce, University of Queensland, 1997 7. Shell Prize in Accounting, Department of Commerce, University of Queensland, 1997
Service
Associate Editor: Research Methods and Philosophy Track, International Conference on Information Systems (ICIS), 2005. Reviewer: Journals: Management Science, MIS Quarterly, Information Systems Research, Information Systems Journal, Requirements Engineering Journal, Journal of Strategic Information Systems, Data & Knowledge Engineering, Information Technology and Management, Journal of Information Technology, International Journal of Accounting Information Systems, and Journal of Database Management. Conferences: International Conference on Information Systems (ICIS), Hawaii International Conference on Systems Sciences (HICSS), Americas Conference on Information Systems (AMCIS), European Conference on Information Systems (ECIS), and Diffusion Interest Group in Information Technology (DIGIT).