new parameterization of the t score values: a case study ... · science, english, kiswahili, social...
TRANSCRIPT

1
New Parameterization of the T Score Values: A Case Study of the
Standardization of the Kenya Certificate of Primary Education (KCPE)
Examination
Presented at
The 41st International Association for Education Assessment (IAEA)
11th – 15th October, 2015 Lawrence, Kansas, USA
By
Andrew F Otieno
Research & Quality Assurance Division
The Kenya National Examinations Council, Nairobi, Kenya
E-Mail: [email protected]

2

3
Abstract
Standardization of raw examination marks is a vital procedure in ensuring the validity of
examinations results that is undertaken by assessment bodies. In Kenya, the Kenya Certificate of
Primary Education examination (sat after the first eight (8) years of basic education) uses eight
tests/papers that are standardized before they are combined to get the overall results. The current
standardize score computed using fixed parameters of test mean of 50 and standard deviation of
15 and 12 for the objective/multiple choice papers and composition/essay papers respectively. The
mean and standard deviation of raw marks in humanities, mathematics and science subjects are
quite distinct and thus subjecting the marks to the same fixed parameters when standardizing raw
marks leads to biasness that disadvantages candidates in mathematics and sciences subjects.
The purpose of this study is to address the limitation of application of a fixed mean and standard
deviation on the standardization of tests that have different performance characteristics that leads
to disadvantaging examines in some subjects. Using data from the Kenya National Examinations
Council, new parameters have been generated and applied in the computation of the standardized
marks for different tests/papers in the years 2012 to 2014. The new standardized scores distribution
are compared to that of the current standard scores distribution and applied on standard normal
distribution curve.
The study establish that the distribution of marks produces a better and valid standardize scores
than the one that is currently used in Kenya with a fixed mean and standard deviation for all tests.
The method is transparent and ensures that the standardize scores of high and low abilities
candidates at both tails of the curve are not distorted to disadvantage/advantage one group of
examinees.
Key Words: Standardization, Standard Normal Distribution

4
Introduction
The Kenya Certificate of Primary Education (KCPE) examination is a Norm Referenced (N.R)
examination which aims at comparing a candidate’s performance to that of other candidates taking
the examination. The main purpose of KCPE examination is the selection and placement of
students to the secondary schools.
Secondary school admission in Kenya is competitive as the number of vacancies in ‘good’ schools
is limited. This means that students must be ranked in a way to ensure fairness. Therefore, all
subjects’ marks must be of the same weighing. Marks from subjects as varied as Mathematics,
Science, English, Kiswahili, Social Studies and Religious Education must be on the same scale of
measurement to produce a meaningful result. KNEC uses a series of processes to convert the raw
marks for different courses to the same measurement scale. The scaled scores for the subjects are
then be added together to get the overall score that is used for selection of students. This marks
adjustment process caters for differences in cognitive abilities and ensures that students are not
disadvantaged in ‘difficult’ subjects, nor advantaged in ‘easy’ one.
Before the awarding stage of examination, there are other standard setting initiatives adhered by
the KNEC in the conduct of the KCPE examination processes from the stage of development of
question papers, administration of examination and marking of answer scripts. However to
maintain the integrity, credibility and public confidence in the KCPE qualification, the statistical
standardization during awarding is necessary so as to take care of variation in the question papers,
which may occur despite careful development of the test items as well as marking that, may occur
from year to year.
KNEC adopted the T-score distribution with fixed parameters in its standardization process that
has resulted to severe scaling down of high ability candidates’ marks and up scaling of low ability
candidates’ marks in Mathematics and Science subjects. No candidate has been awarded a scaled
percentage mark of over ninety (90%) for several years even though the two subjects have been
registering the best mean performance of the raw marks from year to year. This has led to the two
myths that are frequently expounded about the KCPE examination standardization process by the

5
stakeholders. Firstly, the myth that private schools have their marks deducted because they have
better facilities. Secondly, there is the myth that private schools scores are standardized differently
to those of public schools.
Review of Literature on the Standardization of Examinations Results
Standardization is the moderation process used to mitigate the effect of the factors other than
learners’ knowledge and aptitude on their performance. Standardization removes variable elements
from test scores and allows candidates to be compared equally. It is fair to say that very few people
fully understand the process! There are too many factors that are unknown to the general public –
the relative difficulty of the paper, the ability of the cohort, and so on – to allow you to calculate a
standardized score directly from a raw score.
The standardization of results is an international practice undertaken by all assessment agencies in
the world to evaluate whether the examinations has produced scores that are valid and reliable.
The process of standardization has been dominated by statistics data and is based on the principle
of equivalence of standards from year to year. Standardization enhances the consistency and
fairness of the scoring. Establishing a criterion or norm referenced standard for passing and failing
candidates, standardizes the process of making pass and fail decisions.
There is a controversy on subjects difficulties over the years, Nuttall et al., (1974) reported that
science and languages subjects were found to be more difficult than other subjects. Kelly (1975,
1976a, 1976b) published her investigations into ‘soft’ and ‘tough’ options in Scottish Higher
examinations. She developed the subject pairs methodology from Nuttall et al. and obtained a
similar ordering of subjects for difficulty. Kelly also noted variation in the results between subjects
over the four years of her study, and particularly between boys and girls, noting that the actual use
of a correction factors was thus problematic. She found however that languages, chemistry and
physics were consistently more difficult, with biology and mathematics relatively less so. Then, in
1994, Fitz-Gibbon and Vincent’s ALIS-based investigation was published which specifically
addressed the question “are mathematics and science more difficult than other subjects at A-level?”

6
They carried out their analysis in four different ways, and consistently concluded that these
subjects were more difficult.
Many different statistical methods have been used to standardize examinations in different
subjects:
Percentile ranks
Percentile rank is a point in a distribution at or below which the scores of a given percentage of
students fall.
Stanines
Stanines are bands of standard scores that have a mean of 5 and a standard deviation of 2. Stanines
range from 1 to 9.
Deviation IQ Scores
Deviation IQ Scores are frequently used to report the performance of students on norm-referenced
standardized tests. The deviation scores of the Wechsler Intelligence Scale for Children–III and
the Wechsler Individual Achievement Test–II have a mean of 100 and a standard deviation of 15,
while the Stanford-Binet Intelligence Scale–IV has a mean of 100 and a standard deviation of 16.
Many test manuals provide tables that allow conversion of raw scores to deviation IQ scores.
Normal Curve Equivalents
Normal curve equivalents (NCEs) are type of standard scores with a mean of 50 and a standard
deviation of 21.06. When the baseline of the normal curve is divided into 99 equal units, the
percentile ranks of 1, 50, and 99 are the same as NCE units (Lyman, 1986)
Z-Scores
A Z-Score is a statistical measurement of a score's relationship to the mean in a group of scores.
It has a mean of 0 and a standard deviation of 1. A Z-score of 0 means the score is the same as the
mean. Z-score can be positive or negative, indicating whether it is above or below the mean and
by how many standard deviations

7
T-Scores
A T-score is a standard Z score shifted and scaled to have a mean of 50 and a standard deviation
of 10
Purpose of the Study
This study sought to achieve the following objectives:
Analyze the scaled scores for candidates in the Kenya Certificate of Primary Education
(KCPE) examinations more importantly on the effect of the extreme raw scores;
Compare the scaled scores in subject generated by the initial and the new T-score;
Established the effect on the scaled scores in fitting to the normal standard distribution
Method
This study compares the consistency of scaled marks distributions obtained from using the T-score
distributions, one based on a fixed parameters and the other on a variable parameters models. The
scaled scores for the year 2012, 2013 and 2014 were calculated and compared in reference to the
distribution on the percentile scale with respect to the mean and standard deviations of the raw
scores of all the candidates who sat the examination in the respective year.
Computation the T-Score in KCPE Examination
The KCPE examination syllabus is tested using a total of seven (07) subjects which are examined
in ten (10) papers. Candidates are expected to sit for eight (08) papers in one sitting.
The examination is standardized by use of T-scores distribution with a fixed mean (µ) of 50 mark
and a standard deviation (𝛿) of 15 and 12 for papers scored out of 50 and 40 respectively.
sX Z (1)
Where:
XS = Standard Scores
Z = Z-Score
𝛿 = Standard deviation
M = Mean

8
If Xs is less or equal to zero (0) the number is replaced by 1 and if it is greater than ninety nine (99)
the number is replaced by 99. For standardization of multiple choice tests that is scored out of 50
marks, a fixed mean of 50 and Standard Deviation of 15 the formula used is as follows:-
15 50sX Z (2)
Derivation of the New T Score Distribution
The test is derived from the following assumptions:
The expected mean of paper scored in percentage and is normally distributed is 50;
All the candidates’ scores will lie within three standard deviations of the mean since we
are dealing with a large population whose scores are mutually independent.
Therefore the T-score distribution standard deviation is computed as follows:
50
16.673
(3)
Mathematics and Science is tested using 50 items thus the T-score distribution mean that is used
to scale the subject marks is doubled be raised it to percentage.
2X (4)
Where:
𝜇 = T-score mean
X = Mean of raw mark
The new T-scores distribution is given by:
(5)
Where:
16.67sX Z

9
XS = Standard Scores
= T-score mean
If the computed T-Score is less than or equal to zero (0) the difference from the first positive
integer is uniformly distributed to the values below the integers and if the T-score is greater than
99 mark, the marks are replaced by 99.
Findings of Application of the T-scores in scaling of the Raw Marks
The mean and standard deviation of subjects in the KCPE examination between the years 2012
and 2014 is shown in table 1.
Table 1: Mean and Standard Deviation of KCPE Examination Subjects between the Years
2012 and 2014
Subject 2014 2013 2012
Mean Standard
Deviation
Mean Standard
Deviation
Mean Standard
Deviation
English Grammar 23.82 6.29 26.53 6.81 24.94 6.36
English Composition 16.59 7.03 16.76 7.22 16.97 7.23
Kiswahili Grammar 22.52 5.65 22.89 5.86 23.37 6.27
Kiswahili
Composition
23.20 7.14 20.98 6.98 21.99 7.34
Mathematics 26.02 10.12 26.43 9.47 28.15 10.51
Science 33.01 9.39 30.91 8.54 32.02 9.51
NOTE: English and Kiswahili Composition are scored out of 40 marks;
Mathematics and Science means are above average and has the best dispersion ( ) of
marks
The parameters for the new T-scores were calculated using formulae 3 and 4 and are shown in
table 2.
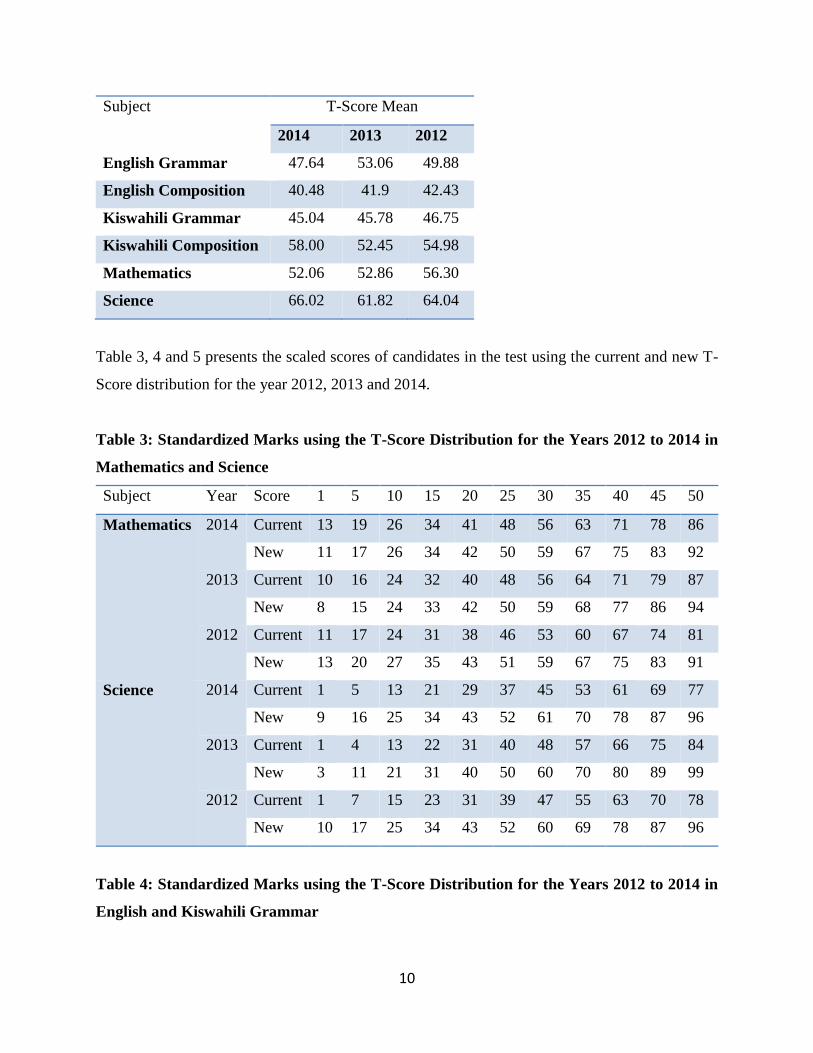
Table 2: Mean of New T-Scores for Subjects between the Years 2012 and 2014
10
Subject T-Score Mean
2014 2013 2012
English Grammar 47.64 53.06 49.88
English Composition 40.48 41.9 42.43
Kiswahili Grammar 45.04 45.78 46.75
Kiswahili Composition 58.00 52.45 54.98
Mathematics 52.06 52.86 56.30
Science 66.02 61.82 64.04
Table 3, 4 and 5 presents the scaled scores of candidates in the test using the current and new T-
Score distribution for the year 2012, 2013 and 2014.
Table 3: Standardized Marks using the T-Score Distribution for the Years 2012 to 2014 in
Mathematics and Science
Subject Year Score 1 5 10 15 20 25 30 35 40 45 50
Mathematics 2014 Current 13 19 26 34 41 48 56 63 71 78 86
New 11 17 26 34 42 50 59 67 75 83 92
2013 Current 10 16 24 32 40 48 56 64 71 79 87
New 8 15 24 33 42 50 59 68 77 86 94
2012 Current 11 17 24 31 38 46 53 60 67 74 81
New 13 20 27 35 43 51 59 67 75 83 91
Science 2014 Current 1 5 13 21 29 37 45 53 61 69 77
New 9 16 25 34 43 52 61 70 78 87 96
2013 Current 1 4 13 22 31 40 48 57 66 75 84
New 3 11 21 31 40 50 60 70 80 89 99
2012 Current 1 7 15 23 31 39 47 55 63 70 78
New 10 17 25 34 43 52 60 69 78 87 96
Table 4: Standardized Marks using the T-Score Distribution for the Years 2012 to 2014 in
English and Kiswahili Grammar

11
Subject Year Score 1 5 10 15 20 25 30 35 40 45 50
English
Grammar
2014 Current 1 5 17 29 41 51 65 77 89 99 99
New 1 2 11 24 37 53 64 77 91 99 99
2013 Current 1 3 14 25 36 47 58 69 80 91 99
New 1 2 13 25 37 49 62 74 86 98 99
2012 Current 1 3 15 27 38 50 62 74 86 97 99
New 1 2 11 24 37 50 63 76 89 99 99
Kiswahili
Grammar
2014 Current 1 3 17 30 43 57 70 83 96 99 99
New 1 1 8 23 38 52 67 82 97 99 99
2013 Current 1 4 17 30 43 55 68 81 94 99 99
New 1 2 9 23 38 52 66 80 95 99 99
2012 Current 1 6 18 30 42 54 64 78 90 99 99
New 1 2 11 24 38 51 66 78 91 99 99
Table 5: Standardized Marks using the T-Score Distribution for the Years 2012 to 2014 in
English and Kiswahili Composition
Observations from tables 3, 4 and 5
Subject Year Score 1 5 10 15 20 25 30 35 40
English
Composition
2014 Current 23 30 39 47 56 64 73 81 90
New 3 13 25 37 49 60 72 84 96
2013 Current 24 30 39 47 55 64 72 80 89
New 5 15 26 38 49 61 73 84 96
2012 Current 23 30 38 47 55 63 72 80 88
New 6 15 26 38 49 61 73 84 96
Kiswahili
Composition
2014 Current 13 19 28 36 45 53 61 70 78
New 6 15 27 39 51 62 74 86 97
2013 Current 16 23 31 40 48 57 66 74 83
New 5 14 26 38 50 62 74 86 98
2012 Current 16 22 30 39 47 55 63 71 79
New 7 16 28 39 50 62 73 85 96

12
The new T-Score distributions of scaled marks at the tails (1-10 and 40-50) are uniformly
distributed;
The median value of the new T-Score distribution has a value of 50±2;
The range of distribution of marks for the new T-Score distribution covers a good area of
the percentile range.
Discussion
The variable parameter T-Score distribution model is the best fitting model between the two
models distribution the maximum marks to over 90% compared to current fixed parameter T-Score
distribution model where maximum mark is scaled to as low as 78% mark. The model has
produced a normal curve equivalent model covering a wider range of percentage area addressing
the biasness of a fixed T-Score distribution.
The scaled marks clearly shows that there is fairness on scaling of high abilities candidates in
Mathematics and Science subjects with respect to low abilities candidates when variable
parameters are used to standardize the raw scores using T-Score distribution.
Conclusion
This study investigates the effect of scaling raw marks using a T– Score distribution with fixed
and varying parameters. It has found that a T-Score distribution of fixed parameter has biasness
depending in regard to the differences mean and standard deviation of the test. This is more
pronounce in Kenya where there are few private schools that performs exceptionally well but their
good results are severely affected by the bulk of the candidates who performs dismally in public
school thus pulling down their good marks. The use of varied parameters in the T-Score
distribution for different subjects addresses this biasness as students from the extreme abilities are
scaled fairly.
Acknowledgement

13
The author is grateful to the Kenya National Examinations Council for provision of data and peer
reviewers who offered valuable critique/comments that greatly improved the paper.
14
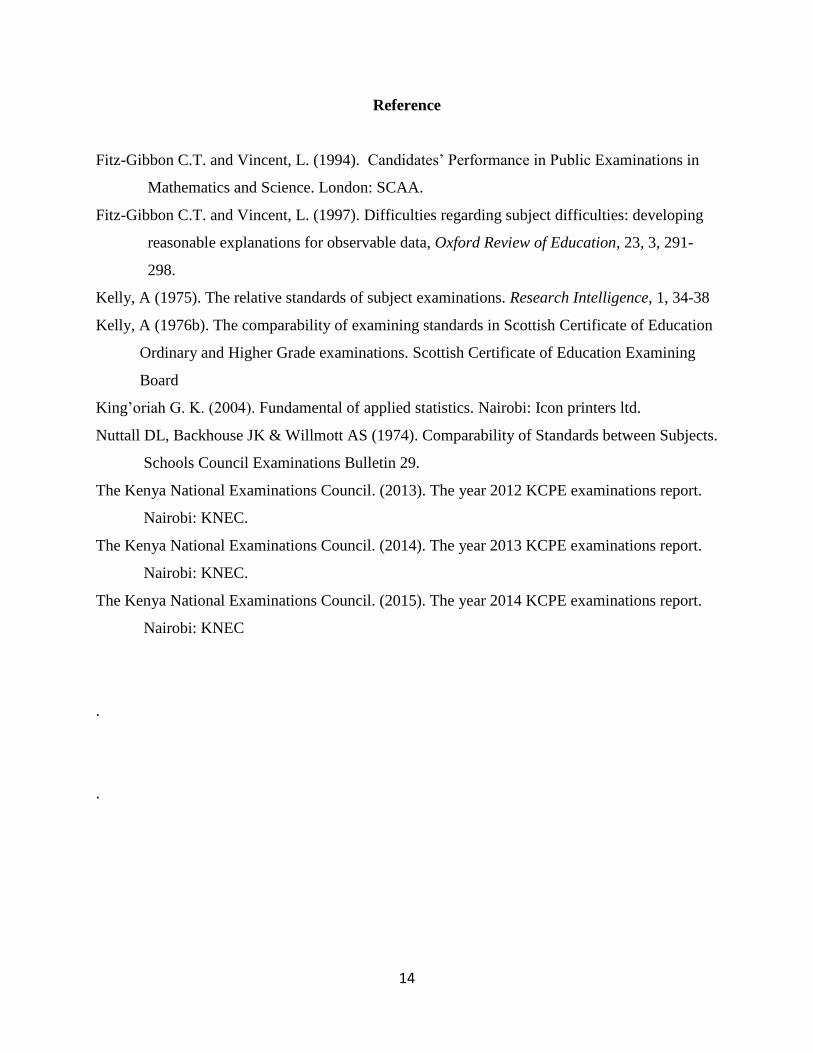
Reference
Fitz-Gibbon C.T. and Vincent, L. (1994). Candidates’ Performance in Public Examinations in
Mathematics and Science. London: SCAA.
Fitz-Gibbon C.T. and Vincent, L. (1997). Difficulties regarding subject difficulties: developing
reasonable explanations for observable data, Oxford Review of Education, 23, 3, 291-
298.
Kelly, A (1975). The relative standards of subject examinations. Research Intelligence, 1, 34-38
Kelly, A (1976b). The comparability of examining standards in Scottish Certificate of Education
Ordinary and Higher Grade examinations. Scottish Certificate of Education Examining
Board
King’oriah G. K. (2004). Fundamental of applied statistics. Nairobi: Icon printers ltd.
Nuttall DL, Backhouse JK & Willmott AS (1974). Comparability of Standards between Subjects.
Schools Council Examinations Bulletin 29.
The Kenya National Examinations Council. (2013). The year 2012 KCPE examinations report.
Nairobi: KNEC.
The Kenya National Examinations Council. (2014). The year 2013 KCPE examinations report.
Nairobi: KNEC.
The Kenya National Examinations Council. (2015). The year 2014 KCPE examinations report.
Nairobi: KNEC
.
.