new orleans east land bridge study 12... · ben c. gerwick has been tasked by the slfpa-e of new...
TRANSCRIPT

Southeast Louisiana Flood Protection Authority - East
New Orleans East Land Bridge Study LPV 111 to Chef Menteur, Chef Menteur to Rigolets
December 2012
Southeast Louisiana Flood Protection Authority - East
New Orleans East Land Bridge Study LPV 111 to Chef Menteur, Chef Menteur to Rigolets
December 2012
1300 Clay Street, 7th Floor Oakland, CA 94612 Tel. 510 839 8972 Fax. 510 839 9715 www.gerwick.com
SLFPAE contract 02-02
Task order no. 002
Document no. 2011-006-0001
Version B
Date of issue December 2012
Prepared JNOT, AAAU
Checked MPJ
Approved DEB
New Orleans East Land Bridge Study
Revised: 12/18/2012
1
.
Table of Contents
1 Executive Summary 4
1.1 Framework 4
1.2 Approach to Scope of Work 5
1.3 Data Collection and Review 5
1.4 Hazard Case Scenarios and Hydraulic Modeling 6
1.5 Feasibility Study & Recommended Actions 8
1.6 Key Contact Involvement 8
2 Existing Studies Affecting the ELB 10
2.1 UNO Report on Hydrodynamic Modeling of the Tidal Prism in the Pontchartrain Basin 11
2.2 USACE Louisiana Coastal Protection and Restoration (LACPR) Final Technical Report 12
2.3 Framework for Environmental Assessment of Alternative Flood Control Structures on Chef Menteur and Rigolets Passes 27
2.4 NRC Review of the LACPR Technical Report 34
2.5 Existing and Planned LACPR Projects and Studies Affecting the ELB 35
3 Background Project Data 41
3.1 Summary of Compiled Information 41
3.2 Time Line 41
3.3 Project Site 41
3.4 Meteorological and Oceanographic Conditions 44
3.5 Sea Level Rise 53
3.6 Impact of Static Relative Sea Level Rise on ELB 60
3.7 Historical and Projected Shoreline Change 63
3.8 Subsidence and Subsurface Conditions 71
3.9 Key Vulnerable Locations within the ELB Project Area 76
4 Plan Formulation 78
4.1 Planning Objectives 78
4.2 Planning Constraints 78
4.3 Planning Criteria 79
4.4 Framework 80
4.5 Structural Measures 80
4.6 Acceptability Review 84
4.7 Recommendations for Future Environmental Impact Study 86
New Orleans East Land Bridge Study
Revised: 12/18/2012
2
.
4.8 Measure Screening 87
4.9 Path Forward 92
5 Levee Design Parameters 94
5.1 Determination of Design Crest Elevation 94
5.2 General Project Alignment 95
5.3 Numerical Assessment 96
6 Hydrodynamic Modeling 97
6.1 Objectives 97
6.2 ADCIRC Deployment Strategy 97
6.3 Motivation 97
6.4 Definition of Case Studies 98
6.5 Modeling Guidelines 99
6.6 Test Cases and Comparisons 102
6.7 Summary of Results 109
7 Proposed Plan 112
7.1 Plan Outline 112
7.2 Step 1: High-crested Levee 112
7.3 Proposed Construction Sequence 114
7.4 End Caps 121
7.5 Cost Estimates 125
7.6 Step 2: FSSP Monitoring Program 128
7.7 Step 3: Supplemental FSSP 128
8 Conclusions and Final Recommendations 131
8.1 Data Collection and Review 131
8.2 Hazard Case Scenarios and Hydraulic Modeling 131
8.3 Recommended Actions 132
8.4 Recommendations for Future Study 133
9 Bibliography 135

New Orleans East Land Bridge Study
Revised: 12/18/2012
3
.
Table of Appendices
Appendix A Glossary of Acronyms
Appendix B Geotechnical Data
Appendix C Storm Surge Elevation Hindcast from the CERA
Appendix D Excerpts from IPET Volume 4 The Storm
Appendix E Hydraulic Assessment ADCIRC and SWAN Modeling by ARCADIS, US Inc.
New Orleans East Land Bridge Study
Revised: 12/18/2012
4
.
1 Executive Summary
1.1 Framework The primary objective of this feasibility study is to assess the long-term potential of the East Land Bridge (ELB) to be the receptacle of or act as a physical flood barrier against storm surge in the Lake Pontchartrain Basin (LPB). While not formally a part of the Hundred-Year Level of Assurance (HYLA) system, the results published in the USACE Louisiana Coastal Protection and Restoration (LACPR) Final Technical Report (USACE 2009) assert the value of the ELB as a potent flood control system (FCS) sub-component by showing a reduction in storm surge elevation in the LPB in combi-nation with various on-going restoration projects.
The existing ELB south of US-90 is a natural land feature that limits storm surge heights in Lake Pontchartrain. The LPB Unit (LPB) is closely related to the USACE-designated Planning Unit 1 (USACE 2009). The Pontchartrain Basin includes large portions of the New Orleans Hurricane Storm Damage Risk Reduction System (HSDRRS) that is currently being completed by the USACE to pro-vide the New Orleans metro area with protection against the 1% chance of exceedance storm event and associated storm surge damage, as required to maintain proper flood insurance requisites.
While the New Orleans ELB sits outside of the formal Hurricane and Storm Damage Risk Reduction System (HSDRRS), it has nonetheless proven capable of performing a critical function in limiting the 0.2% and 1% chance of exceedance storm surge elevations calculated by the USACE for the HSDRRS. As such, it ought to act as a cornerstone of the overall protection strategy described in the LACPR Technical Report (USACE 2009) and CPRA Master Plan (CPRA 2012; CPRA 2007a)1 and to achieve Congress's mandate to address a Category 5 hurricane event. The Master Plan is a large integrated plan, and the ELB is only a small portion of the planned system; nevertheless, it is a critical feature of the Pontchartrain Basin for which the Southeast Louisiana Flood Protection Authority-East (SLFPA-E) is a significant stakeholder2.
The on-going degradation of the coastal landscape in southeast Louisiana warrants special measures be taken to protect, strengthen and develop coastal features identified as critical, including the ELB. It is not straightforward to determine the specific contribution of a healthy ELB in reducing storm surge and to evaluate the direct influence of the ELB on hurricane storm surge (although results in this study provide evidence of a clear role in protecting some areas near New Orleans). That is because it is only part of a complex array of interspersed structures, topographic, hydrologic and bathymetric features that, together, all have an effect on the performance of the ELB against hurricane storm surge hazard. Nonetheless, based on published data, the loss or degradation of this natural feature would
1 The more recent 2012 Master Plan (CPRA 2012) was used after the initiation of this study. 2 Other stakeholders include: St. Bernard parish, St. Tammany parish, Louisiana State Department of Natural Re-sources (LA DNR), Louisiana State Department of Transportation and Development (LA DOTD), Louisiana De-partment of Wildlife & Fisheries (LDWF), CSX Corporation, the Mississippi Emergency Management Agency (MEMA), Orleans Levee District (OLD), Louisiana Coastal Protection and Restoration Authority (LACPRA), Lake Pontchartrain Basin Foundation (LPBF) and the US Army Corps of Engineers (USACE).
New Orleans East Land Bridge Study
Revised: 12/18/2012
5
.
likely result in increased surge heights in the lake, and would in turn eliminate an evacuation route out of the New Orleans metro area.
1.2 Approach to Scope of Work and Report Outline Ben C. Gerwick has been tasked by the SLFPA-E of New Orleans to conduct the present feasibility study which provides preliminary designs for a series of adaptation and mitigating measures. These structural measures, either in the form of shoreline protection or a high-crested levee, are strategically located in order to maximize their efficacy, and to complement existing or planned features. In ana-lyzing the value and expected performance of these measures, references are made to the CPRA Mas-ter Plan (CPRA 2012; CPRA 2007a) and LACPR Technical Report (USACE 2009) throughout.
The results provided herein support the role of the ELB as an essential component of the existing re-gional storm surge reduction system because its degradation or disappearance would necessarily re-duce the efficacy of that system and increase flooding hazard in the LPB. Therefore, a path forward that leverages and seeks to expand the ELB's existing storm surge reduction potential is devised.
The approach implemented in this study follows the milestones described in the original Scope of Work (SOW). For each of the tasks enunciated in the SOW, the outcome of their execution is summa-rized in the following sections.
In section 2 "Existing Studies Affecting the ELB" a review of key reports pertaining to the ELB is performed. Critical information is extracted that is then used in later sections of this report. In Section 3 "Background Project Data" the impact of eustatic sea-level rise is elaborated upon; wind, waves and tides are analyzed for extremes. Select locations, identified as particularly vulnerable to erosion and shoreline retreat, are summarized and tabulated. Section 4 "Plan Formulation" sets the rules for se-lecting the best foreshore/shoreline/flood risk reduction systems that match the study's objectives. Each tentative measure is carefully evaluated for its ability to perform in four distinct dimensions, defined in this report as completeness, efficiency, acceptability and efficiency. Special attention is given to the acceptability criterion, and possible avenues for a more detailed environmental assess-ment of a high-crested levee at the ELB are provided. By selecting a judicious path forward, it sets the stage for the hydrodynamic study of Section 5 "Levee Design Parameters" and Section 6 "Hydrodynamic Modeling". There, the results of an ADCIRC/SWAN numerical model provide re-vealing insights into the efficacy of a flood risk reduction system against several synthetic storms, each selected for their relevance to this study. Section 7 "Proposed Plan" leverages those results and conclusions and elaborates upon a tentative multi-step path forward which combines the ensemble of data collected throughout the report. Section 8 "Conclusions and Final Recommendations" summariz-es the advances made in the report. A list of references used to complete the report is listed in the fi-nal Section, "Bibliography". Definitions of various acronyms are provided in the Glossary, at the end of this document.
1.3 Data Collection and Review An extensive amount of data was collected to draw a more refined picture of the various stressors af-fecting the fate of the ELB. Of these, the threat of relative sea-level rise (RSLR) was identified as

New Orleans East Land Bridge Study
Revised: 12/18/2012
6
.
most critical: if conservative trajectories for RSLR projections were to be followed, most of the low-lying ELB could be permanently inundated by 2060, as shown in Section 3.6. By analyzing photo-graphic and survey-based evidence of marsh and shoreline degradation trends, key vulnerable loca-tions were identified. On the other hand, in doing so, several key assets were delineated that could be part of a long-term mitigation and adaptation plan to climate change and flood risk.
In addition to RSLR, an ensemble of data pertaining to wind, waves and tides was analyzed. General-ly speaking, the ELB is somewhat sheltered from day-to-day wave action however, with a fairly long fetch length extending to the East, is susceptible to large wave action during a storm event. This anal-ysis reveals that the shoreline of the ELB must be managed and that mitigating measures must con-tinue to be implemented to preserve the current shoreline if any successful storm surge and climate change mitigation plan is to be implemented. The topic of saltwater intrusion and waterborne stress-ors was not considered in this study, but an avenue for a more detailed environmental assessment is provided.
Finally, a series of key policy reports and technical documents were reviewed, with ad hoc input from various stakeholders. Among these, the UNO report (McCorquodale et al. 2007) focuses on the envi-ronmental impact of a navigational structure on the tidal prism. A key result of that study is the de-termination of an optimal width for the pass openings. The Framework for Environmental Assess-ment of Alternative Flood Control Structures by (Lopez and Davis 2011) brings awareness on the topic of environmental preservation of the ELB natural heritage and is key stepping stone in the screening of the measures contemplated in Section 4.
The Technical Report by USACE (USACE 2009) provides a wealth of information, in large part di-rectly relevant to the needs and objectives of this study. It includes but is not limited to: present and future storm surge hazard and storm surge distribution near the ELB; wave climate; subsidence; SLR; and a prioritized list of restoration and flood control projects. Most importantly, the results of Annex A of Volume 1 of the Hydraulics and Hydrology Appendix set the tone for the additional numerical modeling efforts engaged in this study where the efficacy of a 100-YRP levee barrier was evaluated. The same report, along with other references, also provides a solid basis for establishing the impact of sea-level rise on storm surge hazard.
1.4 Hazard Case Scenarios and Hydraulic Modeling To complement the large body of existing results related to flood control near the ELB, a series of hazard case scenarios was devised. These scenarios are tailored to quantify the effects of various stressors of the flood barrier concept proposed in this study. They are optimized to avoid redundancy with any existing modeling efforts and to maximize the value of the results generated throughout.
The goals of the hazard case studies were to evaluate the projected storm surge hazard in the presence of a degraded ELB; with a flood barrier; assuming open/close conditions for tentative gates at the Chef Menteur and Rigolets passes. The cases devised also focused on quantifying the spatial impact of such structure on storm surge distribution. They helped determine whether a net beneficial impact to the Lake Pontchartrain region would necessarily place additional hydraulic burden on adjacent structures, e.g. the GIWW/IHNC flood protection projects, Lake Borgne and Mississippi regions.

New Orleans East Land Bridge Study
Revised: 12/18/2012
7
.
These case scenarios form the basis of an ADCIRC/SWAN model that provides the foundation of the proposed recommended action plan.
The hydrodynamic modeling further supplements the results gathered in the early chapters of the study by elaborating on storm surge elevation with the presence of a flood barrier and by comparing the results to a "base case"; and by estimating wave climate along the levee. Three objectives are con-sidered in the hydrodynamic study.
Objective A consists in assessing the effect of subsidence and marshland within the project area and their impact on hurricane storm surge hazard. Results show that, regionally, in absence of a flood bar-rier, the influence of the ELB is small but measurable. At the 400-YRP level, a degraded ELB con-tributes to an increase in surge level at New Orleans East (NOE) polder of 2 to 3ft, and up to 1ft north of the ELB. With a flood barrier the influence of an intact ELB is more nuanced. The performance of the open-gate levee is similar for with and without the ELB; but the results of the hydrodynamic analysis show that the combination of the open-gate levee with an intact ELB does perform somewhat better than the open-gate levee with degraded ELB and incurs less additional burden on neighboring areas. An intact ELB also reduces current velocities if an open-pass solution is retained.
Objective B seeks to assess the effects of gates at the Chef Menteur and Rigolets passes. Results show that for the closed-gate case, a complete hydraulic closure of the Lake Pontchartrain through the use of gates at the Chef Menteur and Rigolets passes has pronounced effects on storm surge distribu-tion. It is able to provide a significant reduction in the storm surge elevation in Lake Pontchartrain, with some areas where flooding is prevented altogether. In return, the added hydraulic burden placed on adjacent levee systems is equally appreciable, with local increases of up to 3ft along the Missis-sippi coast, more than 1 ft throughout the northern portion of Caernarvon Marsh and Biloxi Marsh and 4ft in the Lake Borgne/GIWW area at the 100-YRP level.
On the other hand, the open-pass levee with an intact ELB reduces the 100-YRP surge in Lake Pont-chartrain by approximately 1ft. The hydraulic cost of this reduction is 1ft increase in the flood level in Lake Borgne and up to 3ft immediately in front of the ELB levee. At the 400-YRP level, an overall reduction in the surge level of 1ft is observed. The hydrodynamic study reveals that levee structure with the two major passes open, in conjunction with the intact ELB area is able to strike a balance by reducing surge level in Lake Pontchartrain and the inundation area on the North shore of the lake while limiting impacts on Mississippi State and adjacent flood control systems.
A final Objective C consists in assessing the impact of a new structure on the time and spatial redis-tribution of storm surge near the ELB and vicinity. In general, results illustrate the trade-off that ex-ists between adding an effective flood barrier and an increased hydraulic burden imparted on adjacent regions. A significant reduction in the region of influence, along with a good level of flood reduction at the 100-YRP and 400-YRP level, can be achieved with a minimal cost to neighboring areas if no gates are present. In that case, an intact ELB provides additional storm surge damping benefits with no detectable additional burden placed on existing lines of defense.
New Orleans East Land Bridge Study
Revised: 12/18/2012
8
.
1.5 Feasibility Study & Recommended Actions The feasibility leveraged the data collected in Task and results obtained from the hydrodynamic mod-eling. The objectives of the proposed mitigation and adaptation plan were (1) to reduce flood risk at the LPB by placing a physical flood barrier against storm surge and (2) to preserve the integrity and encourage efforts to expand and strengthen the shoreline at the ELB.
To that end, a screening procedure was deployed. It started out with the evaluation of a series of measures taken from the Multiple Lines of Defense Principle (MLDP). Each was evaluated and scored according to four criteria, namely completeness, effectiveness, efficiency and acceptability. By doing so, two measures were identified as key components of a tentative path forward. The rationale argued that while none of these could simultaneously achieve Objective 1 and 2, a synergistic combi-nation of these two measures would provide significant long-term flood risk reduction to the ELB.
Based on a survey of future and on-going foreshore and shoreline stabilization projects (FSSP); the review of past numerical simulations; and after reviewing several structural measures; it was deter-mined that a judiciously located earthen levee, with a tentative crest height of 22ft-NAVD88, with openings at the Chef Menteur and Rigolets passes and sufficient scour protection, would provide sig-nificant flood risk reduction for the Lake Pontchartrain region while minimizing the impact on adja-cent areas and the local ecosystem and other critical flood protection systems.
The proposed alignment leverages the existing CSX railway, identified as a key asset in this study, to position the high-crested levee. The design relies on an adaptive approach, where the system would be part of a multi-tiered system: as such, even if an open-pass design is unable to provide the level of protection than a closed-gate solution, the protection it offers will complement existing control struc-tures. In addition, because it is built with adaptive features from the ground up, the open-pass solution can be easily upgraded pending appropriate funding. A discussion on the long-term benefits to be ob-tained from the installation of navigational structures at the passes is conducted in the next section.
In addition, the proposed plan recommends the implementation of a FSSP monitoring program that seeks to quantify the efficacy of on-going restoration projects. The program would rely on a network of probes (sensors, photography, on-the-ground observations, etc.) to measure and document the evo-lution of the ELB shoreline over time. In doing so, the program would enable stakeholders to learn from any potential flaws and/or recognized high-value features in existing projects and to optimize the layout and placement of any future FSSP.
Finally, the plan calls for the installation of supplemental FSSP intended to complement existing pro-jects and assist the proposed flood barrier by mitigating the eroding action of the strong currents an-ticipated near the pass openings. A preliminary design emphasizes simple to build, robust and adap-tive features, such as a launch apron and rock berm, to keep upgrade, maintenance and construction costs low.
1.6 Future Efforts In addition to these recommendations, the study suggests that work be done by the SFLPA-E & part-ners together with the USACE to initiate a new feasibility study to examine a combination of flood-

New Orleans East Land Bridge Study
Revised: 12/18/2012
9
.
gate and flood-barrier. The flexible concept envisioned in this study would seek to reduce its hydro-logical footprint, with the inclusion of specific elements, including perforated caissons, sluice gates and buoyant bottom-hinged gate leaves.
Such features are anticipated to be cost efficient and flexible: the bottom-hinged gate leaves could be designed to be overtopped as a variable crest height gate in order to limit the effect of increasing storm surge t elevation in adjoining areas. On the other hand, gate leaves could be added in the future if it is determined that additional flood protection is required to protect the existing flood control sys-tems around Lake Pontchartrain.
Furthermore, it is expected that together with supplemental dredging, the combined openings through the perforated caissons and the navigable gate should be able to minimize disruption of the existing tidal prism passing through Rigolets. A similar concept may be considered at the Chef Menteur pass, if warranted by navigational and environmental needs, to be established in a future study. Finally, fu-ture efforts should seek to refine the design of the recommended earthen levee to interface with these possible new surge barriers. Other suggestions for exploration are suggested in Section in the final section of this report.
1.7 Key Contact Involvement This report was prepared by Ben C. Gerwick, Inc. and the members of the SLFPA-E. Members from the Orleans, St. Bernard and St. Tammany Parishes, Orleans Levee District, CPRA, LPB Foundation and USACE were contacted to provide input to the study. The following persons were involved to various degrees in this study and are acknowledged for their contributions: Rick Stierwald of St. Ber-nard Parish; Bao Vu of Orleans Parish; John E. Smith of St. Tammany Parish; Gerald Gillen of Orle-ans Levee District; John A. Lopez of the LPB Foundation; Chris Williams of CPRA; Timothy Harper of CPRA; John Jurgensen of NRCS; Troy Constance of USACE.
New Orleans East Land Bridge Study
Revised: 12/18/2012
10
.
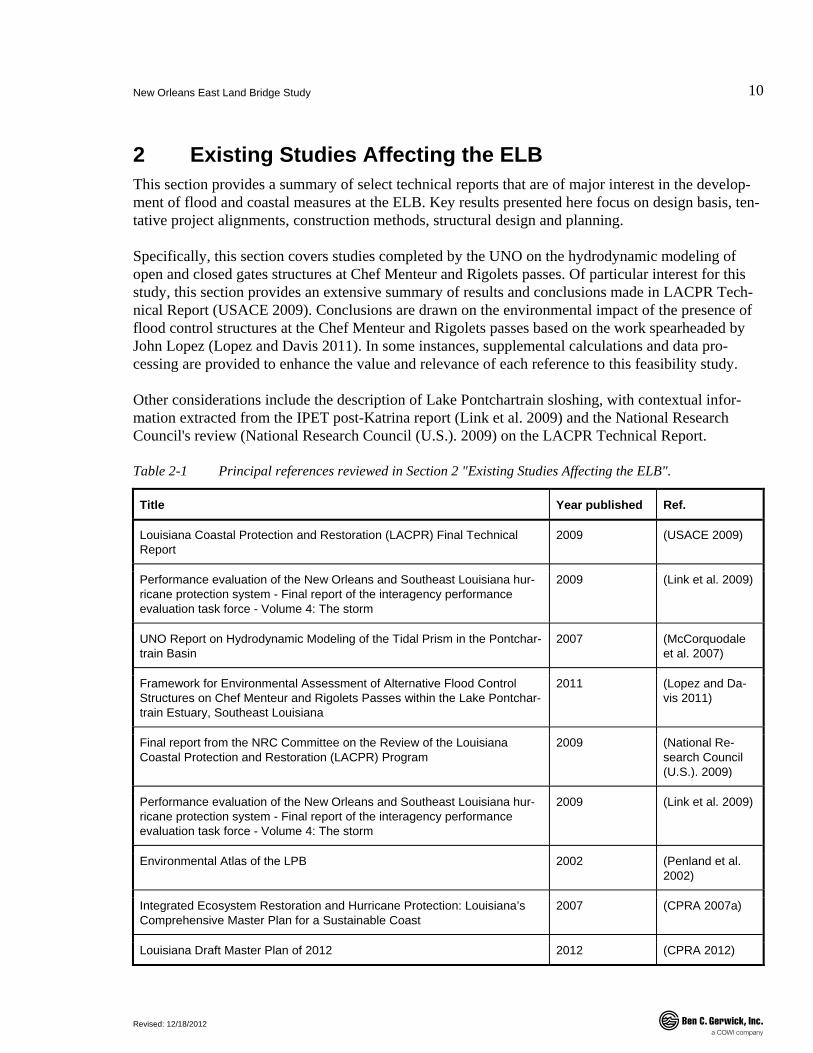
2 Existing Studies Affecting the ELB This section provides a summary of select technical reports that are of major interest in the develop-ment of flood and coastal measures at the ELB. Key results presented here focus on design basis, ten-tative project alignments, construction methods, structural design and planning.
Specifically, this section covers studies completed by the UNO on the hydrodynamic modeling of open and closed gates structures at Chef Menteur and Rigolets passes. Of particular interest for this study, this section provides an extensive summary of results and conclusions made in LACPR Tech-nical Report (USACE 2009). Conclusions are drawn on the environmental impact of the presence of flood control structures at the Chef Menteur and Rigolets passes based on the work spearheaded by John Lopez (Lopez and Davis 2011). In some instances, supplemental calculations and data pro-cessing are provided to enhance the value and relevance of each reference to this feasibility study.
Other considerations include the description of Lake Pontchartrain sloshing, with contextual infor-mation extracted from the IPET post-Katrina report (Link et al. 2009) and the National Research Council's review (National Research Council (U.S.). 2009) on the LACPR Technical Report.
Table 2-1 Principal references reviewed in Section 2 "Existing Studies Affecting the ELB".
Title Year published Ref.
Louisiana Coastal Protection and Restoration (LACPR) Final Technical Report
2009 (USACE 2009)
Performance evaluation of the New Orleans and Southeast Louisiana hur-ricane protection system - Final report of the interagency performance evaluation task force - Volume 4: The storm
2009 (Link et al. 2009)
UNO Report on Hydrodynamic Modeling of the Tidal Prism in the Pontchar-train Basin
2007 (McCorquodale et al. 2007)
Framework for Environmental Assessment of Alternative Flood Control Structures on Chef Menteur and Rigolets Passes within the Lake Pontchar-train Estuary, Southeast Louisiana
2011 (Lopez and Da-vis 2011)
Final report from the NRC Committee on the Review of the Louisiana Coastal Protection and Restoration (LACPR) Program
2009 (National Re-search Council (U.S.). 2009)
Performance evaluation of the New Orleans and Southeast Louisiana hur-ricane protection system - Final report of the interagency performance evaluation task force - Volume 4: The storm
2009 (Link et al. 2009)
Environmental Atlas of the LPB 2002 (Penland et al. 2002)
Integrated Ecosystem Restoration and Hurricane Protection: Louisiana’s Comprehensive Master Plan for a Sustainable Coast
2007 (CPRA 2007a)
Louisiana Draft Master Plan of 2012 2012 (CPRA 2012)

New Orleans East Land Bridge Study
Revised: 12/18/2012
11
.
2.1 UNO Report on Hydrodynamic Modeling of the Tidal Prism in the Pontchartrain Basin
This study by (McCorquodale et al. 2007) provides useful results regarding optimal flood control structure widths that could be installed at the Chef Menteur and Rigolets passes. It also sets the tone for the cursory environmental ranking procedure implemented in Section 4. Further results generated in the present study rely on those structural recommendations when performing hydrodynamic model-ing at the ELB.
2.1.1 Study Objective The report, authored by a panel from the University of New Orleans, seeks to determine the hydrody-namic impacts of proposed structural changes to the tidal passes and the navigational waterways by the use of the Finite Volume Coastal Ocean Model (FVCOM). In addition, in their report the team provides recommendations for optimal dimensioning of future flood control structures in the Rigolets and Chef Menteur Passes that would minimize the impact on the tidal prism of Lake Pontchartrain under normal conditions when the gates are open.
2.1.2 Model Description FVCOM is a prognostic, unstructured-grid, finite-volume, free-surface, 3-D primitive equation coastal ocean circulation model developed by the University of Massachusetts at Dartmouth and the Woods Hole Oceanographic Institute (UMASSD-WHOI) joint efforts.
The model consists of momentum, continuity, temperature, salinity and density equations. Boundary conditions are given as tidal forcing and salinity data. In addition to tidal variations, the case studies analyzed by UNO included a provision for an extra-tropical storm surge superimposed on the normal tides and with the 1997 Bonnet Carré hydrograph.
The horizontal grid relies on unstructured triangular cells and the irregular bottom is described using sigma coordinates. FVCOM is solved numerically by a second-order, discrete flux calculation in its integral form over an unstructured triangular grid.
2.1.3 Methodology Hydrodynamic modeling in the Pontchartrain estuary was performed using FVCOM to establish base-line (present) conditions. Once baseline conditions were established and the model calibrated, various structural options were simulated to assess their impact on the tidal prism in Lake Pontchartrain. Sim-ulations focused on water levels and velocity distributions resulting from tidal variations, both with and without structural changes to the passes and the navigational waterways. Study cases covered the hydrodynamic response of the system under normal tidal conditions and included special conditions such as the presence of an extra-tropical storm or the Bonnet Carré Spillway open. The resulting ele-vation and velocity changes were compared to estimate the effect on the system and to optimize flood control structures.
New Orleans East Land Bridge Study
Revised: 12/18/2012
12
.
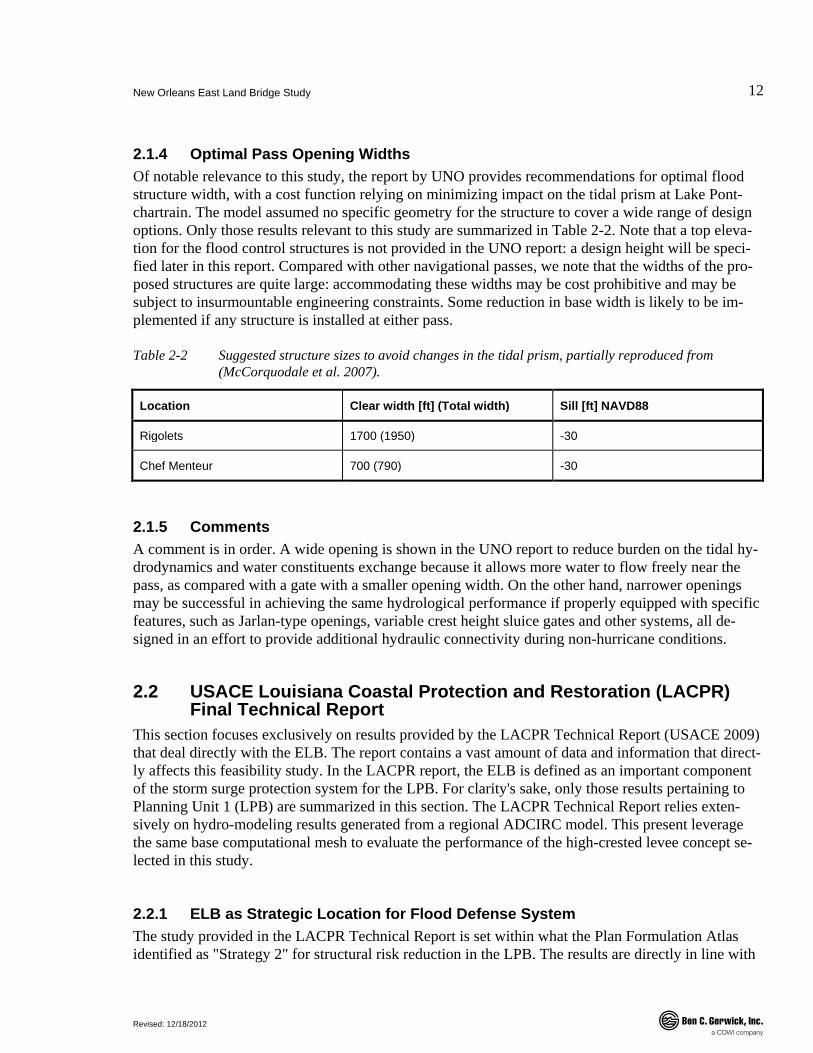
2.1.4 Optimal Pass Opening Widths Of notable relevance to this study, the report by UNO provides recommendations for optimal flood structure width, with a cost function relying on minimizing impact on the tidal prism at Lake Pont-chartrain. The model assumed no specific geometry for the structure to cover a wide range of design options. Only those results relevant to this study are summarized in Table 2-2. Note that a top eleva-tion for the flood control structures is not provided in the UNO report: a design height will be speci-fied later in this report. Compared with other navigational passes, we note that the widths of the pro-posed structures are quite large: accommodating these widths may be cost prohibitive and may be subject to insurmountable engineering constraints. Some reduction in base width is likely to be im-plemented if any structure is installed at either pass.
Table 2-2 Suggested structure sizes to avoid changes in the tidal prism, partially reproduced from (McCorquodale et al. 2007).
Location Clear width [ft] (Total width) Sill [ft] NAVD88
Rigolets 1700 (1950) -30
Chef Menteur 700 (790) -30
2.1.5 Comments A comment is in order. A wide opening is shown in the UNO report to reduce burden on the tidal hy-drodynamics and water constituents exchange because it allows more water to flow freely near the pass, as compared with a gate with a smaller opening width. On the other hand, narrower openings may be successful in achieving the same hydrological performance if properly equipped with specific features, such as Jarlan-type openings, variable crest height sluice gates and other systems, all de-signed in an effort to provide additional hydraulic connectivity during non-hurricane conditions.
2.2 USACE Louisiana Coastal Protection and Restoration (LACPR) Final Technical Report
This section focuses exclusively on results provided by the LACPR Technical Report (USACE 2009) that deal directly with the ELB. The report contains a vast amount of data and information that direct-ly affects this feasibility study. In the LACPR report, the ELB is defined as an important component of the storm surge protection system for the LPB. For clarity's sake, only those results pertaining to Planning Unit 1 (LPB) are summarized in this section. The LACPR Technical Report relies exten-sively on hydro-modeling results generated from a regional ADCIRC model. This present leverage the same base computational mesh to evaluate the performance of the high-crested levee concept se-lected in this study.
2.2.1 ELB as Strategic Location for Flood Defense System The study provided in the LACPR Technical Report is set within what the Plan Formulation Atlas identified as "Strategy 2" for structural risk reduction in the LPB. The results are directly in line with
New Orleans East Land Bridge Study
Revised: 12/18/2012
13
.
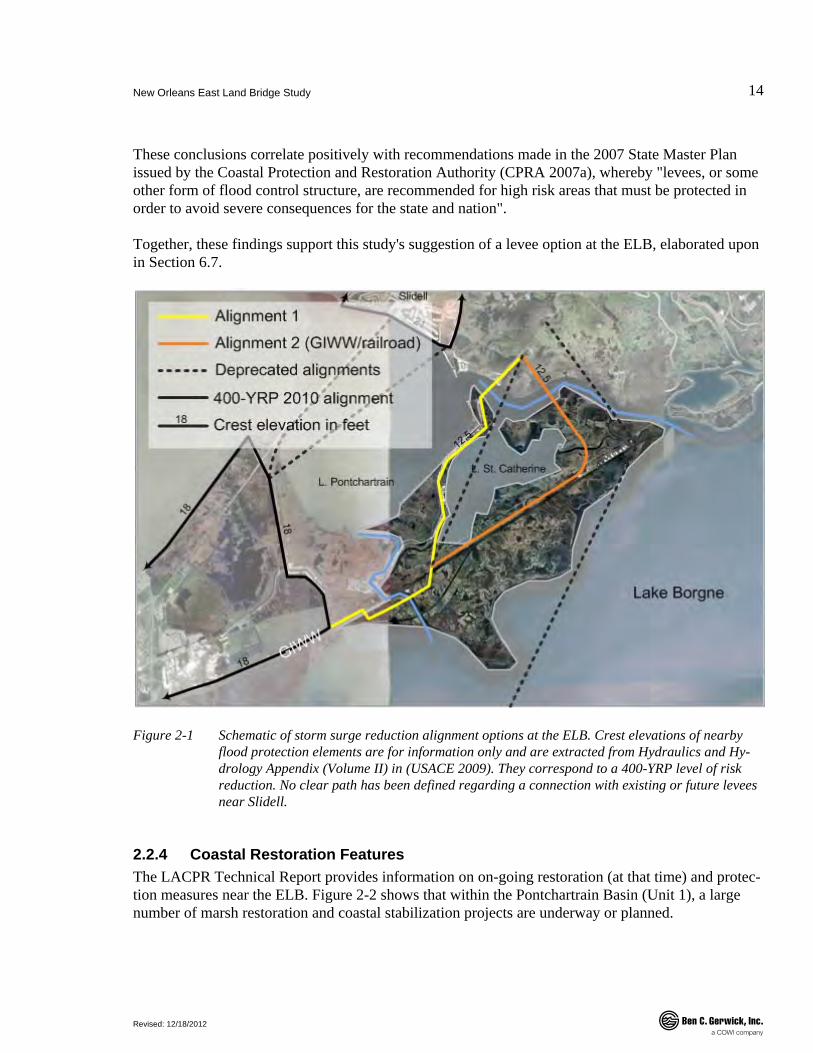
the scope of the present study. The common strategy consists of installing a surge reduction structure along the mouth of Lake Pontchartrain. Options exist regarding the specific details of this alignment, and the LACPR evaluated the performance of three alignments for the closure, namely:
• Alignment 1 follows US-90 along the land bridge. This solution was screened out by the State due to public opposition; however, the LACPR considered it due to good soil foundation present along the alignment.
• Alignment 2 follows the GIWW/railroad and is essentially the same as that presented in the State Master Plan (CPRA 2007a).
• Alignment 3 and "State": these alignments at the ELB were essentially rejected due to cost and construction constraints.
Alignment 1 is investigated in details in the Hydraulics and Hydrology Appendix (Volume II) in which several closure options of Lake Pontchartrain are considered. Alignment 2, on the other hand, has been retained in this study based on interactions with stakeholders. This alignment would also participate in preserving more valuable marshland than Alignment 1, which would leave out a majori-ty of what constitutes the ELB today. A map showing the alignments highlighted in this section is shown in Figure 2-1.
Additional information is provided in the Figure regarding levee heights of nearby flood protection alignments. Here, the crest heights of the 400-YRP protection given for the East B plan are used.
2.2.2 Relevance to the ELB The LACPR Technical Report has determined that critical features exist within the coastal landscape, such as wetlands, highways and most notably land bridges, that all have a measureable influence on hurricane surges. According to the Technical Report,
"These features are critical contributors to the long-term sustainability of a comprehensive risk re-duction system for coastal communities. The coastal landscape, and the restoration and maintenance of that landscape, are important considerations in a comprehensive system for risk reduction".
This supports the need to provide coastal measures to guarantee that the ELB will maintain or im-prove on its current configuration.
2.2.3 Importance of Structural Measures The Technical Report regards an earthen levee option as an efficient structural measure to the greatest level of risk reduction, with the caveat that it should be "removed from the immediate proximity of development. All structural measures are capable of providing significant risk reduction with increas-ing design levels. However, the technical evaluation has indicated that levee alignments that allow some distance between the levee and the development footprint produce greater, and often significant residual protection above the indicated design level".
New Orleans East Land Bridge Study
Revised: 12/18/2012
14
.
These conclusions correlate positively with recommendations made in the 2007 State Master Plan issued by the Coastal Protection and Restoration Authority (CPRA 2007a), whereby "levees, or some other form of flood control structure, are recommended for high risk areas that must be protected in order to avoid severe consequences for the state and nation".
Together, these findings support this study's suggestion of a levee option at the ELB, elaborated upon in Section 6.7.
Figure 2-1 Schematic of storm surge reduction alignment options at the ELB. Crest elevations of nearby flood protection elements are for information only and are extracted from Hydraulics and Hy-drology Appendix (Volume II) in (USACE 2009). They correspond to a 400-YRP level of risk reduction. No clear path has been defined regarding a connection with existing or future levees near Slidell.
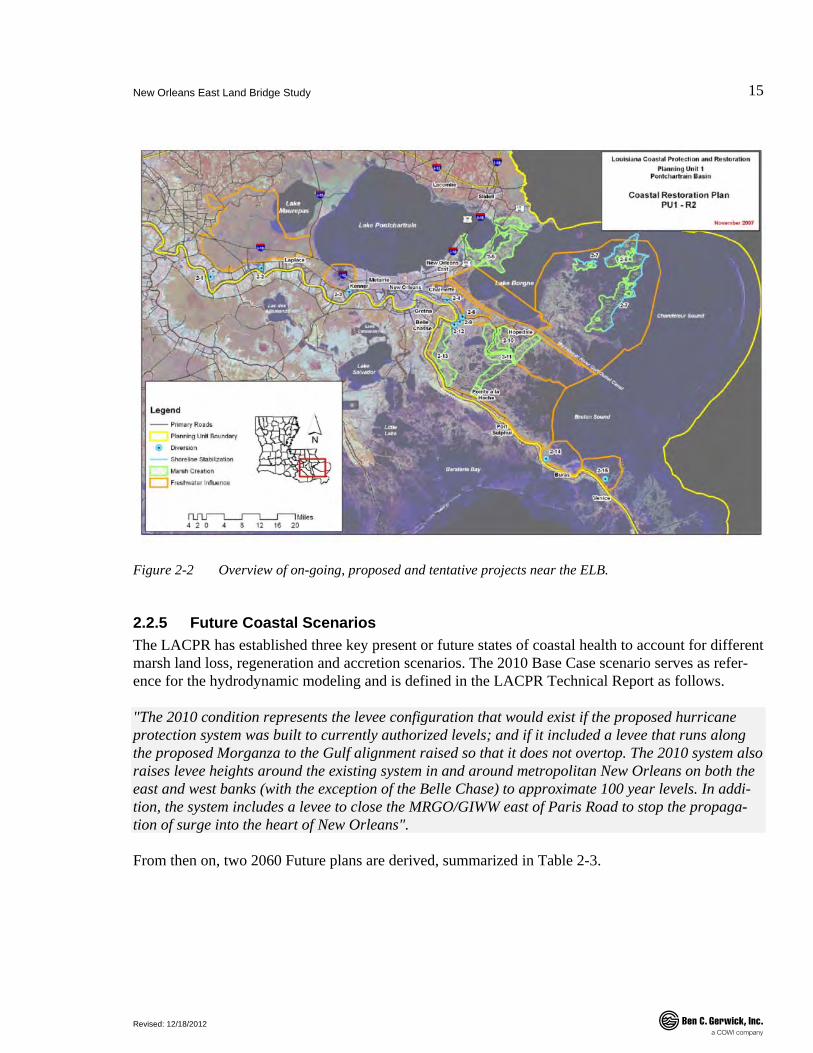
2.2.4 Coastal Restoration Features The LACPR Technical Report provides information on on-going restoration (at that time) and protec-tion measures near the ELB. Figure 2-2 shows that within the Pontchartrain Basin (Unit 1), a large number of marsh restoration and coastal stabilization projects are underway or planned.
New Orleans East Land Bridge Study
Revised: 12/18/2012
15
.
Figure 2-2 Overview of on-going, proposed and tentative projects near the ELB.
2.2.5 Future Coastal Scenarios The LACPR has established three key present or future states of coastal health to account for different marsh land loss, regeneration and accretion scenarios. The 2010 Base Case scenario serves as refer-ence for the hydrodynamic modeling and is defined in the LACPR Technical Report as follows.
"The 2010 condition represents the levee configuration that would exist if the proposed hurricane protection system was built to currently authorized levels; and if it included a levee that runs along the proposed Morganza to the Gulf alignment raised so that it does not overtop. The 2010 system also raises levee heights around the existing system in and around metropolitan New Orleans on both the east and west banks (with the exception of the Belle Chase) to approximate 100 year levels. In addi-tion, the system includes a levee to close the MRGO/GIWW east of Paris Road to stop the propaga-tion of surge into the heart of New Orleans".
From then on, two 2060 Future plans are derived, summarized in Table 2-3.

New Orleans East Land Bridge Study
Revised: 12/18/2012
16
.
Table 2-3 Present and future conditions re: RSLR and coastal configuration according to (USACE 2009).
Coastal conditions Measures RSLR
2010 Base Case No measures (current coast) 0ft (current conditions)
2060 No-action No measures 2.6ft (see "Future Conditions 2")
2060 Maintain Measures to preserve 2010 coast configuration
2.6ft
2.2.6 Levee Crest Height at ELB In the Engineering and Structural Measures Appendices of the same report (USACE 2009), investiga-tions are conducted to determine the most cost efficient and least disruptive methods to protect the LPB against storm surge. Two solutions were envisaged (adding up to 4 study cases) for the partial or complete hydraulic closure of Lake Pontchartrain.
The first solution relies on a non-overtopping levee (with or without flood gates at Chef Menteur and Rigolets passes) and the other involves a so-called barrier-weir (overtopping) with lower crest height. The ADCIRC modeling campaigns sought to determine the direct and indirect impacts of these struc-tural choices to neighboring areas. The conclusion was as follows.
"In summary, the non-overtopping barrier has been eliminated from further consideration because of cost constraints, engineering feasibility issues, and potential impacts to Mississippi".
The report only addresses "engineering feasibility issues" in a cursory fashion. This present study in-tends to elaborate further on this subject. Crest heights studied by the LACPR are summarized in Ta-ble 2-4.
Table 2-4 Levee crest heights retained in the Structural Plan Component Appendix of (USACE 2009).
Hurricane storm surge scenario Full barrier elevation [ft-NAVD88 2004.65]
Weir barrier [ft-NAVD88 2004.65]
100-YRP 25 12.5
400-YRP 32 12.5
1000-YRP 36 12.5
New Orleans East Land Bridge Study
Revised: 12/18/2012
17
.
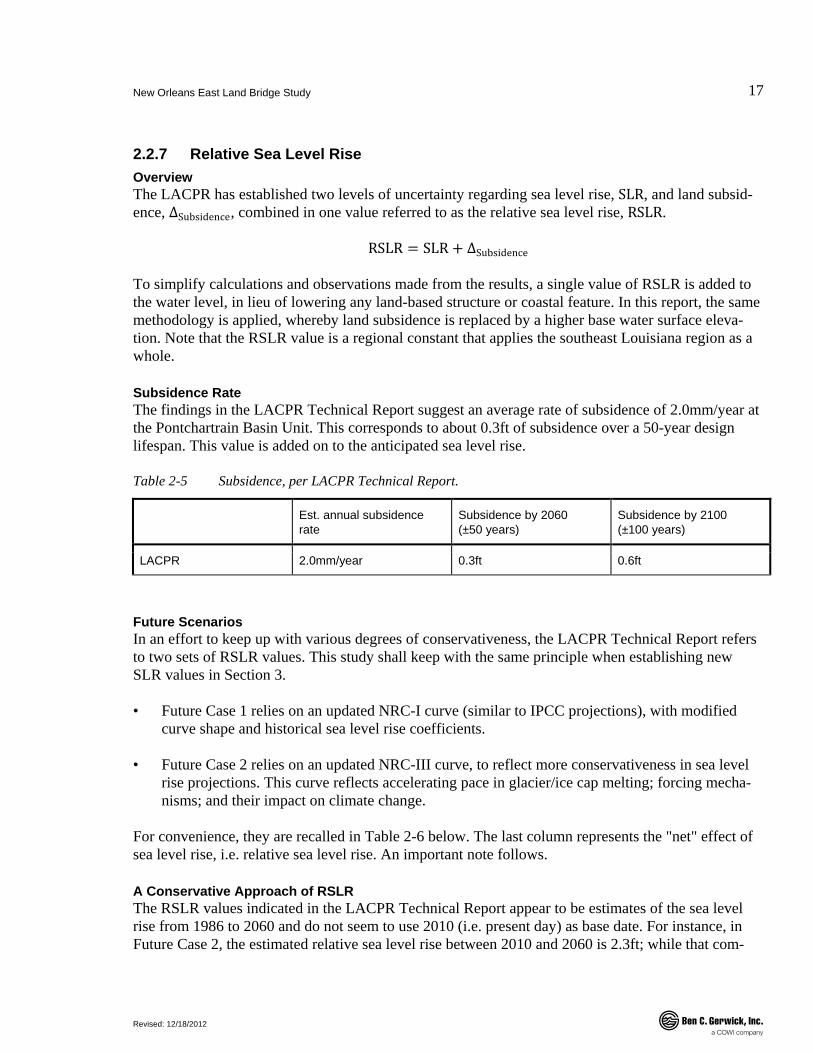
2.2.7 Relative Sea Level Rise Overview The LACPR has established two levels of uncertainty regarding sea level rise, SLR, and land subsid-ence, ΔSubsidence, combined in one value referred to as the relative sea level rise, RSLR.
RSLR = SLR + ΔSubsidence
To simplify calculations and observations made from the results, a single value of RSLR is added to the water level, in lieu of lowering any land-based structure or coastal feature. In this report, the same methodology is applied, whereby land subsidence is replaced by a higher base water surface eleva-tion. Note that the RSLR value is a regional constant that applies the southeast Louisiana region as a whole.
Subsidence Rate The findings in the LACPR Technical Report suggest an average rate of subsidence of 2.0mm/year at the Pontchartrain Basin Unit. This corresponds to about 0.3ft of subsidence over a 50-year design lifespan. This value is added on to the anticipated sea level rise.
Table 2-5 Subsidence, per LACPR Technical Report.
Est. annual subsidence rate
Subsidence by 2060 (±50 years)
Subsidence by 2100 (±100 years)
LACPR 2.0mm/year 0.3ft 0.6ft
Future Scenarios In an effort to keep up with various degrees of conservativeness, the LACPR Technical Report refers to two sets of RSLR values. This study shall keep with the same principle when establishing new SLR values in Section 3.
• Future Case 1 relies on an updated NRC-I curve (similar to IPCC projections), with modified curve shape and historical sea level rise coefficients.
• Future Case 2 relies on an updated NRC-III curve, to reflect more conservativeness in sea level rise projections. This curve reflects accelerating pace in glacier/ice cap melting; forcing mecha-nisms; and their impact on climate change.
For convenience, they are recalled in Table 2-6 below. The last column represents the "net" effect of sea level rise, i.e. relative sea level rise. An important note follows.
A Conservative Approach of RSLR The RSLR values indicated in the LACPR Technical Report appear to be estimates of the sea level rise from 1986 to 2060 and do not seem to use 2010 (i.e. present day) as base date. For instance, in Future Case 2, the estimated relative sea level rise between 2010 and 2060 is 2.3ft; while that com-
New Orleans East Land Bridge Study
Revised: 12/18/2012
18
.
puted with 1986 and 2060 is 2.7ft. Likewise, for Future Case 1, the RSLR between 2010 and 2060 is 1.0ft; between 1986 and 2060 it reads 1.3ft.
Table 2-6 Relative sea level rise for the Pontchartrain Basin (Unit 1), per (USACE 2009).
Scenario Sea Level Rise Subsidence (±50 years) Relative Sea Level Rise
Future Case 1 (2060) 0.31m (1 ft) 2.0 mm/yr (0.3 ft) 0.40m (1.3 ft)
Future Case 2 (2060) 0.70m (2.3 ft) 2.0 mm/yr (0.3 ft) 0.79m (2.6 ft)
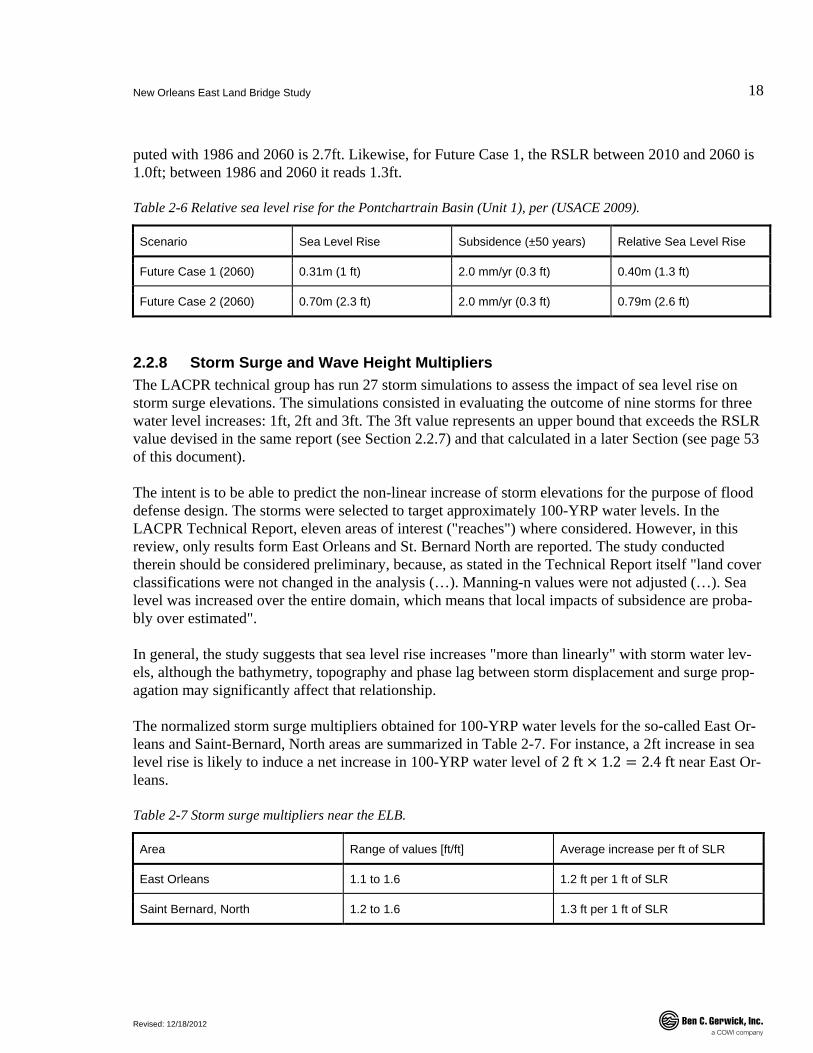
2.2.8 Storm Surge and Wave Height Multipliers The LACPR technical group has run 27 storm simulations to assess the impact of sea level rise on storm surge elevations. The simulations consisted in evaluating the outcome of nine storms for three water level increases: 1ft, 2ft and 3ft. The 3ft value represents an upper bound that exceeds the RSLR value devised in the same report (see Section 2.2.7) and that calculated in a later Section (see page 53 of this document).
The intent is to be able to predict the non-linear increase of storm elevations for the purpose of flood defense design. The storms were selected to target approximately 100-YRP water levels. In the LACPR Technical Report, eleven areas of interest ("reaches") where considered. However, in this review, only results form East Orleans and St. Bernard North are reported. The study conducted therein should be considered preliminary, because, as stated in the Technical Report itself "land cover classifications were not changed in the analysis (…). Manning-n values were not adjusted (…). Sea level was increased over the entire domain, which means that local impacts of subsidence are proba-bly over estimated".
In general, the study suggests that sea level rise increases "more than linearly" with storm water lev-els, although the bathymetry, topography and phase lag between storm displacement and surge prop-agation may significantly affect that relationship.
The normalized storm surge multipliers obtained for 100-YRP water levels for the so-called East Or-leans and Saint-Bernard, North areas are summarized in Table 2-7. For instance, a 2ft increase in sea level rise is likely to induce a net increase in 100-YRP water level of 2 ft × 1.2 = 2.4 ft near East Or-leans.
Table 2-7 Storm surge multipliers near the ELB.
Area Range of values [ft/ft] Average increase per ft of SLR
East Orleans 1.1 to 1.6 1.2 ft per 1 ft of SLR
Saint Bernard, North 1.2 to 1.6 1.3 ft per 1 ft of SLR
New Orleans East Land Bridge Study
Revised: 12/18/2012
19
.
The LACPR Technical Report also reports similar results on increase in wave height. Here, the in-crease is per increase in water level, not increase in sea level rise. For convenience, increases in wave heights per unit of increase in sea level rise are shown in Table 2-8.
Table 2-8 Wave height multipliers near the ELB.
Area Range of values Average increase per ft of SLR
East Orleans 0.06 to 0.31 0.16 per 1 ft of SLR
Saint Bernard, North 0.04 to 0.38 0.22 per 1 ft of SLR
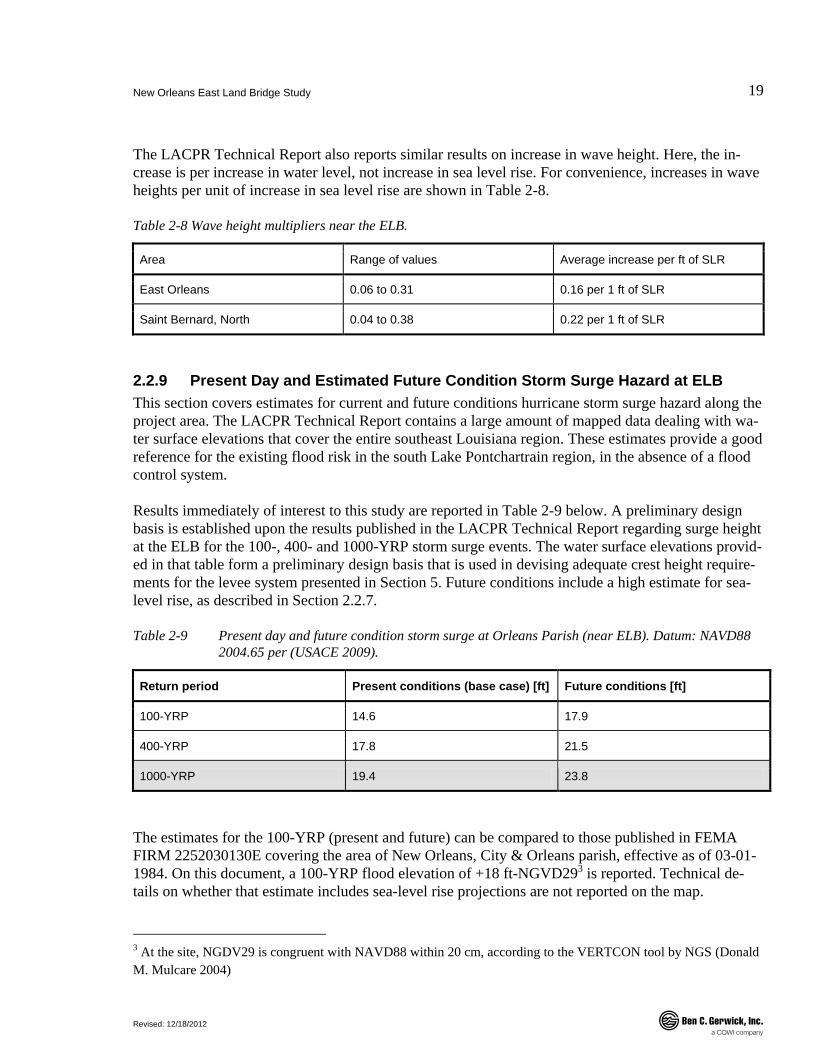
2.2.9 Present Day and Estimated Future Condition Storm Surge Hazard at ELB This section covers estimates for current and future conditions hurricane storm surge hazard along the project area. The LACPR Technical Report contains a large amount of mapped data dealing with wa-ter surface elevations that cover the entire southeast Louisiana region. These estimates provide a good reference for the existing flood risk in the south Lake Pontchartrain region, in the absence of a flood control system.
Results immediately of interest to this study are reported in Table 2-9 below. A preliminary design basis is established upon the results published in the LACPR Technical Report regarding surge height at the ELB for the 100-, 400- and 1000-YRP storm surge events. The water surface elevations provid-ed in that table form a preliminary design basis that is used in devising adequate crest height require-ments for the levee system presented in Section 5. Future conditions include a high estimate for sea-level rise, as described in Section 2.2.7.
Table 2-9 Present day and future condition storm surge at Orleans Parish (near ELB). Datum: NAVD88 2004.65 per (USACE 2009).
Return period Present conditions (base case) [ft] Future conditions [ft]
100-YRP 14.6 17.9
400-YRP 17.8 21.5
1000-YRP 19.4 23.8
The estimates for the 100-YRP (present and future) can be compared to those published in FEMA FIRM 2252030130E covering the area of New Orleans, City & Orleans parish, effective as of 03-01-1984. On this document, a 100-YRP flood elevation of +18 ft-NGVD293 is reported. Technical de-tails on whether that estimate includes sea-level rise projections are not reported on the map.
3 At the site, NGDV29 is congruent with NAVD88 within 20 cm, according to the VERTCON tool by NGS (Donald M. Mulcare 2004)
New Orleans East Land Bridge Study
Revised: 12/18/2012
20
.
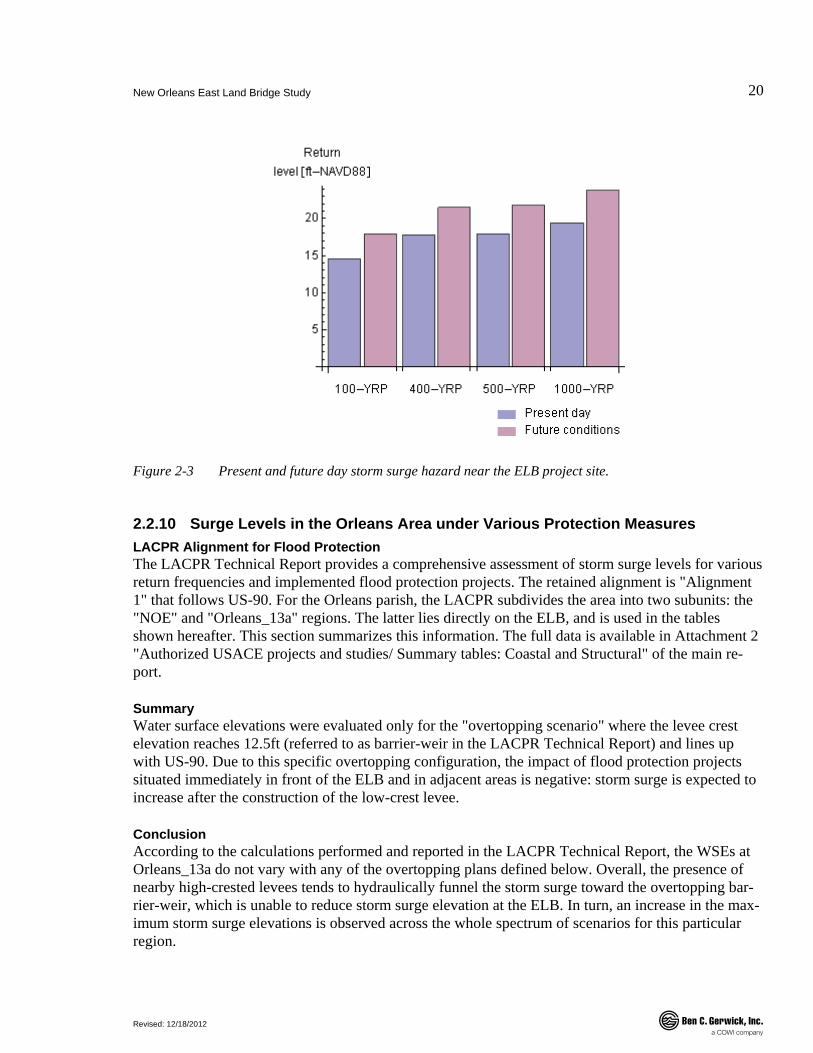
Figure 2-3 Present and future day storm surge hazard near the ELB project site.
2.2.10 Surge Levels in the Orleans Area under Various Protection Measures LACPR Alignment for Flood Protection The LACPR Technical Report provides a comprehensive assessment of storm surge levels for various return frequencies and implemented flood protection projects. The retained alignment is "Alignment 1" that follows US-90. For the Orleans parish, the LACPR subdivides the area into two subunits: the "NOE" and "Orleans_13a" regions. The latter lies directly on the ELB, and is used in the tables shown hereafter. This section summarizes this information. The full data is available in Attachment 2 "Authorized USACE projects and studies/ Summary tables: Coastal and Structural" of the main re-port.
Summary Water surface elevations were evaluated only for the "overtopping scenario" where the levee crest elevation reaches 12.5ft (referred to as barrier-weir in the LACPR Technical Report) and lines up with US-90. Due to this specific overtopping configuration, the impact of flood protection projects situated immediately in front of the ELB and in adjacent areas is negative: storm surge is expected to increase after the construction of the low-crest levee.
Conclusion According to the calculations performed and reported in the LACPR Technical Report, the WSEs at Orleans_13a do not vary with any of the overtopping plans defined below. Overall, the presence of nearby high-crested levees tends to hydraulically funnel the storm surge toward the overtopping bar-rier-weir, which is unable to reduce storm surge elevation at the ELB. In turn, an increase in the max-imum storm surge elevations is observed across the whole spectrum of scenarios for this particular region.

New Orleans East Land Bridge Study
Revised: 12/18/2012
21
.
Table 2-10 Max surge elevations at the ELB per (USACE 2009) for the overtopping levee Lake Pontchar-train closure scenario at area Orleans_13a.
Area: Orleans_13a
Scenario + event return
period
2010 Base Case Future Case 2, 2060
100-YRP 400-YRP 1000-YRP 100-YRP 400-YRP 1000-YRP
No project 14.6 17.8 19.4 17.9 21.5 23.8
All scenarios (see below) 16.4 21.8 26.5 19.0 24.4 29.1
100-Year Level of Risk Reduction Scenarios envisaged in the study include:
• -LP-a-100-1: Sustain coastal landscape through restoration and construct barrier-weir and levees to reduce risk to the Lake Pontchartrain area. Raise upper Plaquemines levees to 100-YRP level of risk reduction.
• -LP-a-100-2: Sustain coastal landscape through restoration and construct barrier-weir and levees to reduce risk to the Lake Pontchartrain area. Raise upper Plaquemines levees and construct new levees around Laplace and across the North shore to the 100-YRP level of risk reduction.
• -LP-a-100-3: Sustain coastal landscape through restoration and construct barrier-weir and levees to reduce risk to the Lake Pontchartrain area. Raise upper Plaquemines levees and construct new levees around Laplace and Slidell to the 100-YRP level of risk reduction.
400-Year Level of Risk Reduction Scenarios envisaged in the study include:
• -LP-b-400-1: Sustain coastal landscape through restoration and construct barrier-weir and levees to reduce risk to the Lake Pontchartrain area. Raise Lake Pontchartrain and Vicinity and upper Plaquemines levees to 400-YRP level of risk reduction.
• -LP-b-400-3: Sustain coastal landscape through restoration and construct barrier-weir and levees to reduce risk to the Lake Pontchartrain area. Raise Lake Pontchartrain and Vicinity and upper Plaquemines levees and construct new levees around Laplace and Slidell to the 400-YRP level risk of reduction.
1000-Year Level of Risk Reduction Scenarios envisaged in the study include:

New Orleans East Land Bridge Study
Revised: 12/18/2012
22
.
• -LP-b-1000-1: Sustain coastal landscape through restoration and construct barrier-weir and lev-ees to reduce risk to the Lake Pontchartrain area. Raise Lake Pontchartrain and Vicinity and up-per Plaquemines levees to 1000-YRP level of risk reduction.
• -LP-b-1000-3: Sustain coastal landscape through restoration and construct barrier-weir and lev-ees to reduce risk to the Lake Pontchartrain area. Raise Lake Pontchartrain and Vicinity and up-per Plaquemines levees and construct new levees around Laplace and across the North shore to the 1000-YRP level of risk reduction.
2.2.11 Impact of Hard Structure (non-Overtopping) on Storm Surge Distribution near the ELB
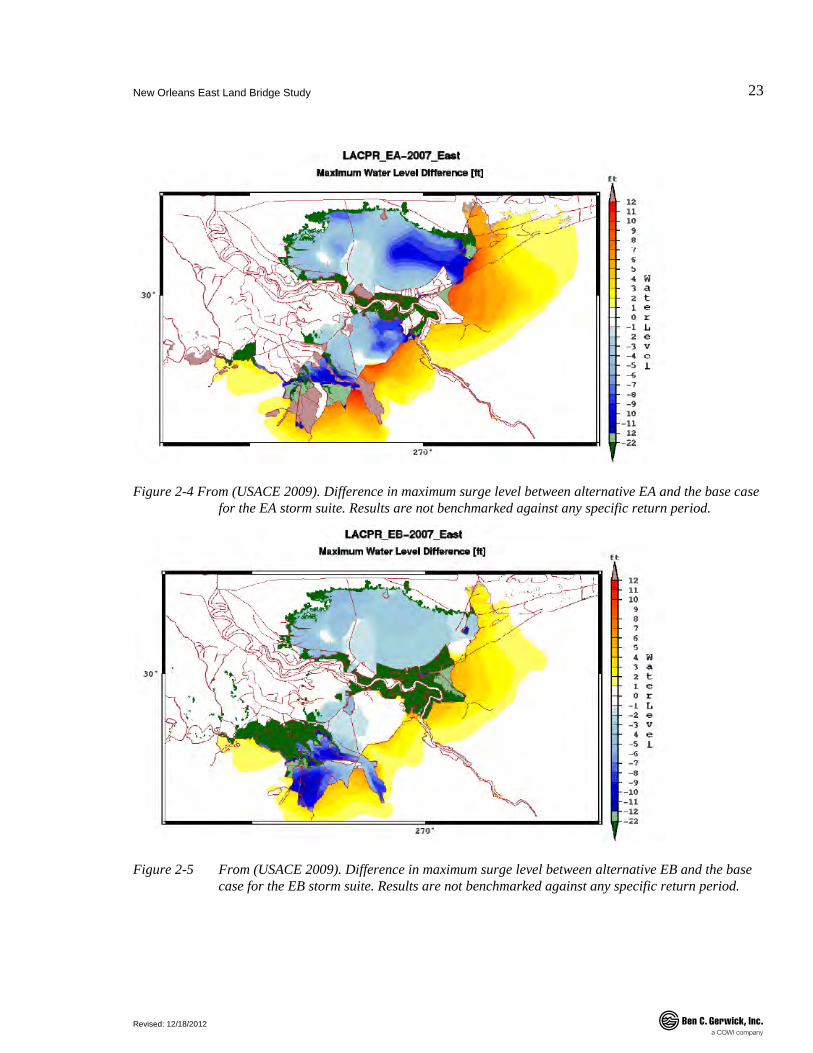
The LACPR Technical Report provides extensive results on the impact of an overtopping and non-overtopping levee placed along the US-90 alignment on the ELB. Essentially, the hydraulic study, performed using the ADCIRC+STWAVE models, shows that any hard structure would be successful in protecting the LPB against high storm surge, with the most appreciable reduction in storm surge observed for Alternative EA. However, it would negatively affect storm surge elevation near the St-Bernard parish and near the Mississippi state line.
Studied Alternatives In order to study the impact of these structures, the LACPR hydraulic team distinguished three alter-natives, described as follows:
• Alternative EA: full closure at US-90 with presence of closed flood control structures at the Chef Menteur and Rigolets passes. The levee is non-overtopping, with a design crest elevation of 27ft. This option is the most effective at reducing storm surge near Slidell.
• Alternative EB: same as EA but with an overtopping levee, with top crest elevation of 12.5ft. Again, the two passes at ELB Are in a closed position.
• Alternative EC: this alternative is identical to EB, however in this case the two passes are in an open position (i.e. no flood control structures).
New Orleans East Land Bridge Study
Revised: 12/18/2012
23
.
Figure 2-4 From (USACE 2009). Difference in maximum surge level between alternative EA and the base case for the EA storm suite. Results are not benchmarked against any specific return period.
Figure 2-5 From (USACE 2009). Difference in maximum surge level between alternative EB and the base case for the EB storm suite. Results are not benchmarked against any specific return period.
New Orleans East Land Bridge Study
Revised: 12/18/2012
24
.
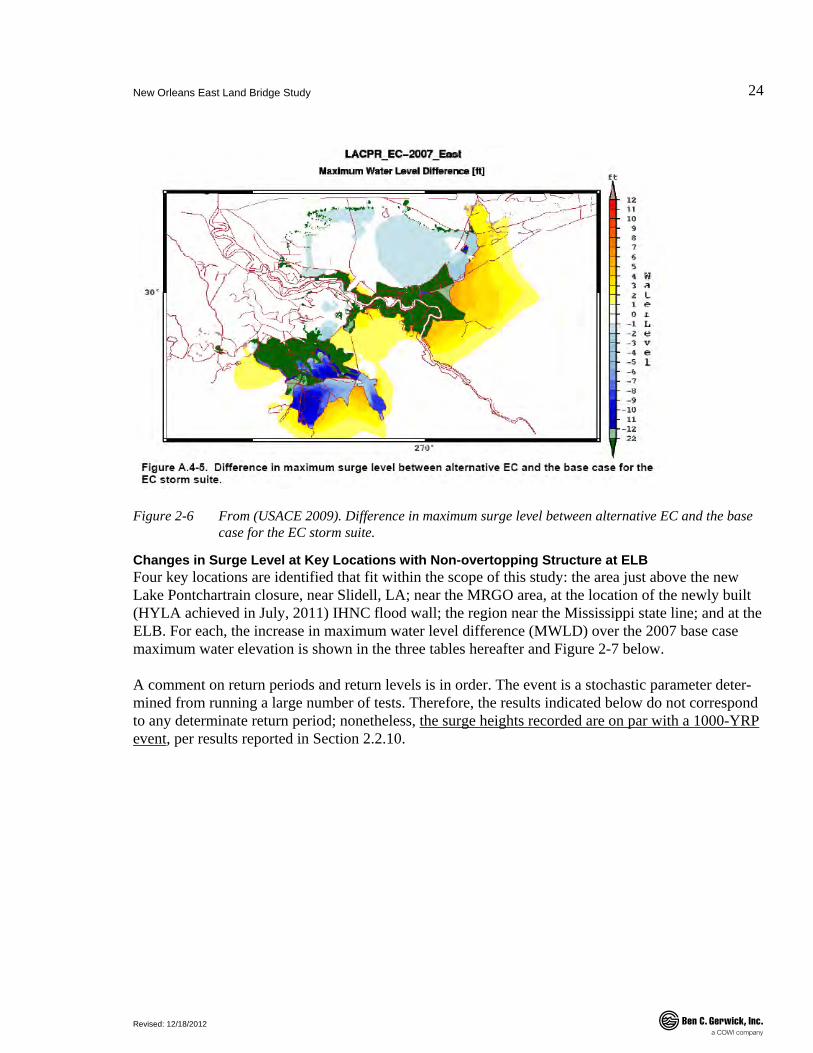
Figure 2-6 From (USACE 2009). Difference in maximum surge level between alternative EC and the base case for the EC storm suite.
Changes in Surge Level at Key Locations with Non-overtopping Structure at ELB Four key locations are identified that fit within the scope of this study: the area just above the new Lake Pontchartrain closure, near Slidell, LA; near the MRGO area, at the location of the newly built (HYLA achieved in July, 2011) IHNC flood wall; the region near the Mississippi state line; and at the ELB. For each, the increase in maximum water level difference (MWLD) over the 2007 base case maximum water elevation is shown in the three tables hereafter and Figure 2-7 below.
A comment on return periods and return levels is in order. The event is a stochastic parameter deter-mined from running a large number of tests. Therefore, the results indicated below do not correspond to any determinate return period; nonetheless, the surge heights recorded are on par with a 1000-YRP event, per results reported in Section 2.2.10.
New Orleans East Land Bridge Study
Revised: 12/18/2012
25
.
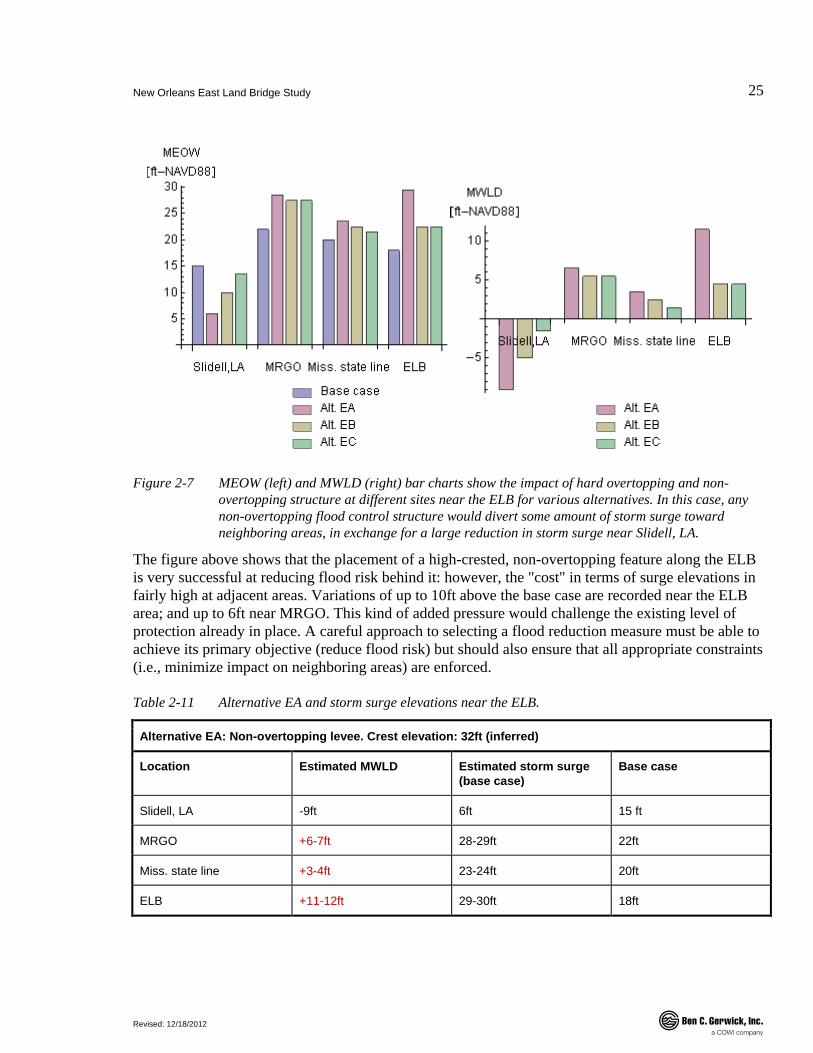
Figure 2-7 MEOW (left) and MWLD (right) bar charts show the impact of hard overtopping and non-overtopping structure at different sites near the ELB for various alternatives. In this case, any non-overtopping flood control structure would divert some amount of storm surge toward neighboring areas, in exchange for a large reduction in storm surge near Slidell, LA.
The figure above shows that the placement of a high-crested, non-overtopping feature along the ELB is very successful at reducing flood risk behind it: however, the "cost" in terms of surge elevations in fairly high at adjacent areas. Variations of up to 10ft above the base case are recorded near the ELB area; and up to 6ft near MRGO. This kind of added pressure would challenge the existing level of protection already in place. A careful approach to selecting a flood reduction measure must be able to achieve its primary objective (reduce flood risk) but should also ensure that all appropriate constraints (i.e., minimize impact on neighboring areas) are enforced.
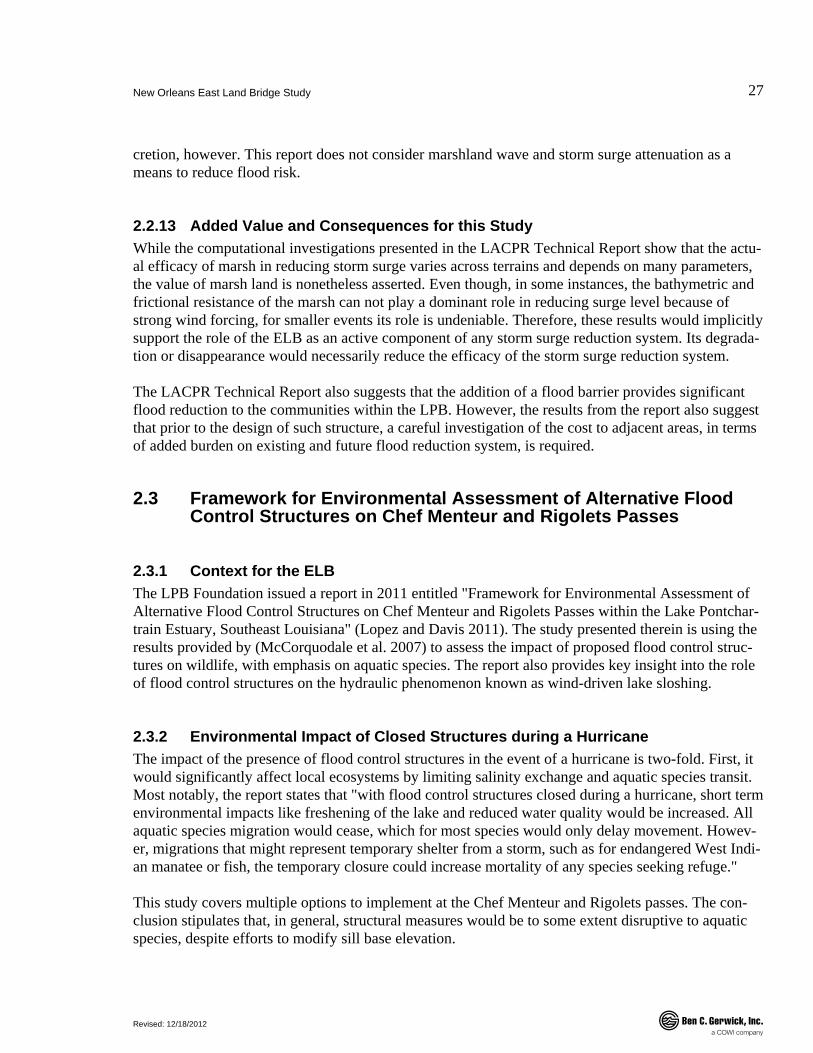
Table 2-11 Alternative EA and storm surge elevations near the ELB.
Alternative EA: Non-overtopping levee. Crest elevation: 32ft (inferred)
Location Estimated MWLD Estimated storm surge (base case)
Base case
Slidell, LA -9ft 6ft 15 ft
MRGO +6-7ft 28-29ft 22ft
Miss. state line +3-4ft 23-24ft 20ft
ELB +11-12ft 29-30ft 18ft
New Orleans East Land Bridge Study
Revised: 12/18/2012
26
.
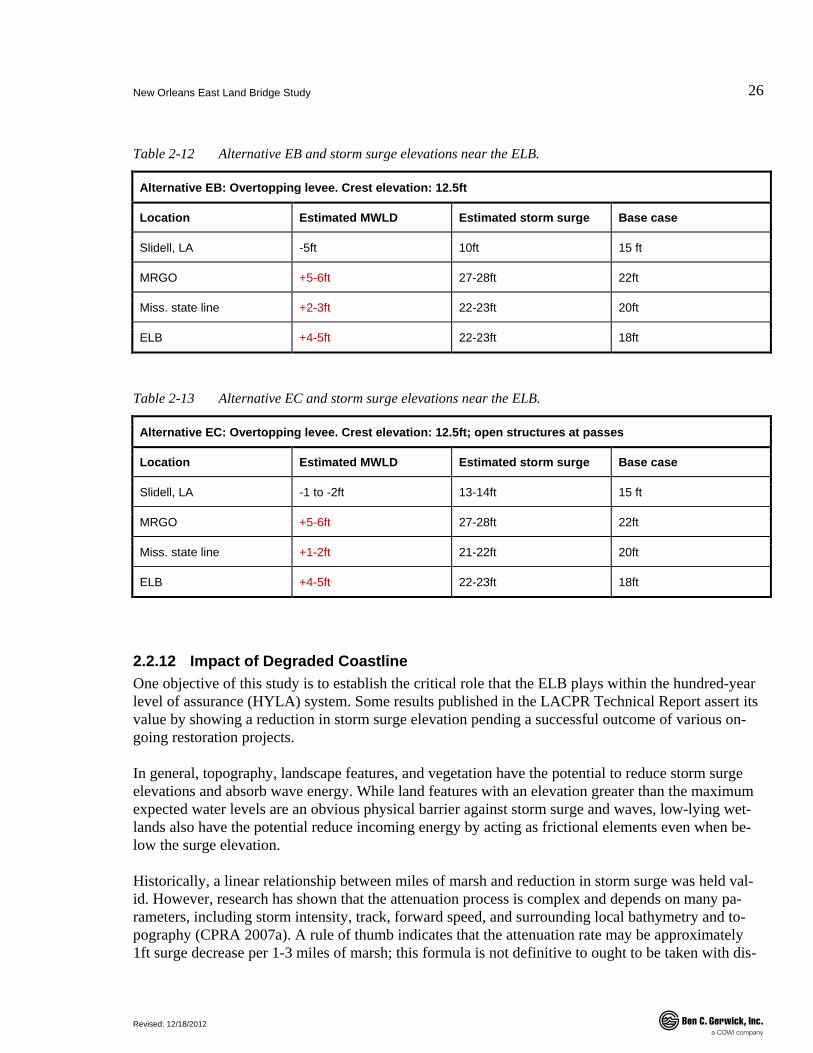
Table 2-12 Alternative EB and storm surge elevations near the ELB.
Alternative EB: Overtopping levee. Crest elevation: 12.5ft
Location Estimated MWLD Estimated storm surge Base case
Slidell, LA -5ft 10ft 15 ft
MRGO +5-6ft 27-28ft 22ft
Miss. state line +2-3ft 22-23ft 20ft
ELB +4-5ft 22-23ft 18ft
Table 2-13 Alternative EC and storm surge elevations near the ELB.
Alternative EC: Overtopping levee. Crest elevation: 12.5ft; open structures at passes
Location Estimated MWLD Estimated storm surge Base case
Slidell, LA -1 to -2ft 13-14ft 15 ft
MRGO +5-6ft 27-28ft 22ft
Miss. state line +1-2ft 21-22ft 20ft
ELB +4-5ft 22-23ft 18ft
2.2.12 Impact of Degraded Coastline One objective of this study is to establish the critical role that the ELB plays within the hundred-year level of assurance (HYLA) system. Some results published in the LACPR Technical Report assert its value by showing a reduction in storm surge elevation pending a successful outcome of various on-going restoration projects.
In general, topography, landscape features, and vegetation have the potential to reduce storm surge elevations and absorb wave energy. While land features with an elevation greater than the maximum expected water levels are an obvious physical barrier against storm surge and waves, low-lying wet-lands also have the potential reduce incoming energy by acting as frictional elements even when be-low the surge elevation.
Historically, a linear relationship between miles of marsh and reduction in storm surge was held val-id. However, research has shown that the attenuation process is complex and depends on many pa-rameters, including storm intensity, track, forward speed, and surrounding local bathymetry and to-pography (CPRA 2007a). A rule of thumb indicates that the attenuation rate may be approximately 1ft surge decrease per 1-3 miles of marsh; this formula is not definitive to ought to be taken with dis-
New Orleans East Land Bridge Study
Revised: 12/18/2012
27
.
cretion, however. This report does not consider marshland wave and storm surge attenuation as a means to reduce flood risk.
2.2.13 Added Value and Consequences for this Study While the computational investigations presented in the LACPR Technical Report show that the actu-al efficacy of marsh in reducing storm surge varies across terrains and depends on many parameters, the value of marsh land is nonetheless asserted. Even though, in some instances, the bathymetric and frictional resistance of the marsh can not play a dominant role in reducing surge level because of strong wind forcing, for smaller events its role is undeniable. Therefore, these results would implicitly support the role of the ELB as an active component of any storm surge reduction system. Its degrada-tion or disappearance would necessarily reduce the efficacy of the storm surge reduction system.
The LACPR Technical Report also suggests that the addition of a flood barrier provides significant flood reduction to the communities within the LPB. However, the results from the report also suggest that prior to the design of such structure, a careful investigation of the cost to adjacent areas, in terms of added burden on existing and future flood reduction system, is required.
2.3 Framework for Environmental Assessment of Alternative Flood Control Structures on Chef Menteur and Rigolets Passes
2.3.1 Context for the ELB The LPB Foundation issued a report in 2011 entitled "Framework for Environmental Assessment of Alternative Flood Control Structures on Chef Menteur and Rigolets Passes within the Lake Pontchar-train Estuary, Southeast Louisiana" (Lopez and Davis 2011). The study presented therein is using the results provided by (McCorquodale et al. 2007) to assess the impact of proposed flood control struc-tures on wildlife, with emphasis on aquatic species. The report also provides key insight into the role of flood control structures on the hydraulic phenomenon known as wind-driven lake sloshing.
2.3.2 Environmental Impact of Closed Structures during a Hurricane The impact of the presence of flood control structures in the event of a hurricane is two-fold. First, it would significantly affect local ecosystems by limiting salinity exchange and aquatic species transit. Most notably, the report states that "with flood control structures closed during a hurricane, short term environmental impacts like freshening of the lake and reduced water quality would be increased. All aquatic species migration would cease, which for most species would only delay movement. Howev-er, migrations that might represent temporary shelter from a storm, such as for endangered West Indi-an manatee or fish, the temporary closure could increase mortality of any species seeking refuge."
This study covers multiple options to implement at the Chef Menteur and Rigolets passes. The con-clusion stipulates that, in general, structural measures would be to some extent disruptive to aquatic species, despite efforts to modify sill base elevation.
New Orleans East Land Bridge Study
Revised: 12/18/2012
28
.
2.3.3 Lake Pontchartrain Sloshing This section makes extensive use of resources originally published by the IPET taskforce in (Link et al. 2009). The storm surge snapshots discussed in the following sections are reproduced in the Ap-pendix.
Observed Seiching from Seismic Activity (Lopez and Davis 2011) elaborate on the phenomenon of wind-driven sloshing of Lake Pontchartrain; this phenomenon is confirmed by a limited number of NOAA weather briefs on observed earthquake-induced seiching of the Lake. For instance, NWS weather advisory GMZ530-271045, published on February 27, 2010, reported that "vibrations [caused by the 8.8-magnitude earthquake near Concep-cion, Chile] through the ground have onset a slosh within the LPB. Tidal gauges are indicating rapid rise and falls around one half foot".
Wind-driven Sloshing Phenomenon In (Lopez and Davis 2011), the authors report that "During the passage of a hurricane, Lake Pontchar-train undergoes a sloshing effect such that storm surge piles-up first on the west side of the Lake, then the south side and then the east side". It is suggested that a non-overtopping structures may in fact exacerbate this sloshing effect. Two reasons are presented. First, it would amplify sloshing by limit-ing how much water can migrate through the passes: "with flood control structures in place and closed, the sloshing effect pushes water eastward toward the passes but water cannot escape as quick-ly, compounding the storm surge elevation". In addition, because the structures would hydraulically lock Lake Pontchartrain, the latter would become a "regional retention reservoir of finite capacity", subject to significant flooding from runoff and pump storm water. This increase in trapped water vol-ume, in turn, would also amplify sloshing.
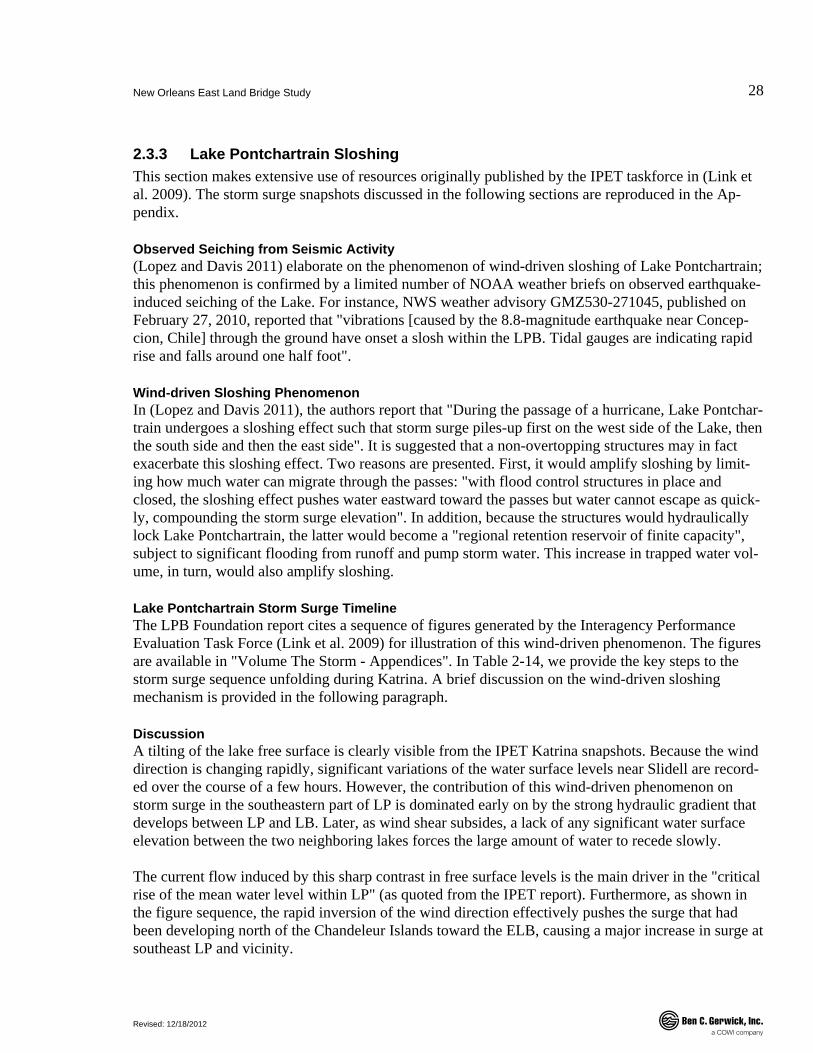
Lake Pontchartrain Storm Surge Timeline The LPB Foundation report cites a sequence of figures generated by the Interagency Performance Evaluation Task Force (Link et al. 2009) for illustration of this wind-driven phenomenon. The figures are available in "Volume The Storm - Appendices". In Table 2-14, we provide the key steps to the storm surge sequence unfolding during Katrina. A brief discussion on the wind-driven sloshing mechanism is provided in the following paragraph.
Discussion A tilting of the lake free surface is clearly visible from the IPET Katrina snapshots. Because the wind direction is changing rapidly, significant variations of the water surface levels near Slidell are record-ed over the course of a few hours. However, the contribution of this wind-driven phenomenon on storm surge in the southeastern part of LP is dominated early on by the strong hydraulic gradient that develops between LP and LB. Later, as wind shear subsides, a lack of any significant water surface elevation between the two neighboring lakes forces the large amount of water to recede slowly.
The current flow induced by this sharp contrast in free surface levels is the main driver in the "critical rise of the mean water level within LP" (as quoted from the IPET report). Furthermore, as shown in the figure sequence, the rapid inversion of the wind direction effectively pushes the surge that had been developing north of the Chandeleur Islands toward the ELB, causing a major increase in surge at southeast LP and vicinity.
New Orleans East Land Bridge Study
Revised: 12/18/2012
29
.
Table 2-14 Hurricane Katrina timeline. From (Link et al. 2009)
Time Key storm surge dynamics at Lake Pontchartrain Wind Direction WSL at Slidell (est.) w/r to NAVD88 [ft]
8/29/0700 UTC Water level (WL) is raised on the southwest end of LP; presence of the CSX railroad suppresses WL in Eastern LP.
Combined WL rise at Lake Borgne and drawdown in Eastern LP causes a strong surface water gradient at Chef Menteur and Rigolets passes: this process is re-sponsible for initiating the "critical rise of the mean WL" within LP.
Northeasterly 2.0
8/29/1200 UTC The northeasterly winds over LP are building up surge against the levees at Jefferson and Orleans parishes.
The continued strong surface water gradient aided by the winds between LB and LP continue to drive water from LB to LP
Northeasterly 1.0
8/29/1300 UTC Surge in LP strongly focused on the south side of the lake and a well defined drawdown exists along the North shore of LP
Northeasterly 1.0
8/29/1400 UC Katrina now located directly over LB
Water blown from the North of LP; buildup along the southern areas of LP
Water accumulates from the East and overtopping is observed at CSX railroad
Northerly, turning Northwesterly as storm moves rapidly across ELB
4.0
8/29/1600 UTC Water blown from west to east across LP
Overtopping of CSX and US-90
Northwesterly winds (reversal due to passage of eye)
12.0
8/29/1700 UTC Drawdown in west LP due to sustained westerly wind action; strong surge in East LP.
Water "forcefully penetrates from Lake Borgne"; ELB now fully inundated
Westerly 16.0
8/29/2000 to 2300 UTC
High water remains in LP and is only subsiding due to lack of strong water surface elevation gradient be-tween Lake Pontchartrain and Lake Borgne.
LB slowly initiates withdrawal.
Westerly, subsid-ing
11.0 later reced-ing to 7.0

New Orleans East Land Bridge Study
Revised: 12/18/2012
30
.
Several effects compound to increase water surface level at Lake Pontchartrain during a storm. Estab-lishing the true isolated significance of a wind-induced sloshing of the Lake is not straightforward given the high level of complexity of the hydraulic processes occurring during such an event. There-fore, the importance of further study of this phenomenon is warranted.
Hypothetical Scenario: Non-overtopping Levee The presence of a non-overtopping levee with flood control structures at the ELB would essentially prevent the storm surge from entering the LP by initially eliminating the action of the current flowing through the passes; later, it would prevent the wind-driven surge developing on the Mississippi side from reaching the southeastern part of LP.
Looking at the early stage of Hurricane Katrina, the drawdown born out of the strong Northeasterly winds causes a relatively small surge on the west side of LP of about 5.0-7.0ft (as measured from NAVD 88). Assuming the presence of a hard structure preventing any water from rushing through the Chef Menteur and Rigolets passes, by conservation of mass it is reasonable to assume that, as the wind direction changes, no more than a 5-7.0ft change in water surface elevation may accumulate on the East side of LP. This value is less than the maximum 16.0 WSL recorded in the later hours after the ELB has been completely flooded.
Preliminary Hydrodynamic Analysis In order to estimate an order of magnitude of the sloshing during a hurricane of similar intensity to that of Hurricane Katrina, a Mike 21 HD model of the Lake was developed. The forcing function is a wind velocity and direction profile extracted from the IPET report. The Lake is assumed to be hy-draulically locked, i.e., that a non-overtopping levee is present at the ELB and that all passes are closed adequately.
Hydraulically Locked Lake Pontchartrain The bathymetry of the Lake is extracted from the regional DEM. The result is shown in Figure 2-8. The two arrows in the lower right corner indicate that the Chef Menteur and Rigolets passes are as-sumed to be closed before landfall of the hurricane.

New Orleans East Land Bridge Study
Revised: 12/18/2012
31
.
Figure 2-8 Lake Pontchartrain bathymetry, assumed hydraulically locked; depth is in [ft-NAVD88]. Source: NOAA NGDC.
Setup To expedite calculations in what constitutes only a preliminary estimate of lake sloshing potential un-der hurricane conditions, a 500m-cell size grid is interpolated from the DEM. The main forcing to be evaluated is the wind field, assumed constant in space and varying in time, whose direction and speed are devised from the recordings and hindcast calculations published in the IPET. The model spans 08-27-2005 12a to 08-30-2005 1120a so as to encompass the slow rise and rapid decay of the hurricane, as shown in the wind speed history in Figure 2-9.
Wind Forcing The wind profile used in the simulation is shown in Figure 2-9. The values correspond to those rec-orded and later hindcasted at station MDLL1 on the Lake Pontchartrain Causeway. This station did not go out of service during the hurricane and the data provided therein is regarded as of high quality (see (Link et al. 2009)). Of utmost interest is the abrupt change in direction of the wind field on the evening of August 29, which is considered the main driver behind the Lake sloshing effect.

New Orleans East Land Bridge Study
Revised: 12/18/2012
32
.
Figure 2-9 Wind speed (left) and direction (right) recorded during hurricane Katrina at the MDLL1 station located on LP Causeway.
Observations The following snapshots show how the lake's free surface responds to wind forcing. Only those fig-ures immediately relevant to this discussion are shown. The initial drawdown recorded in the early hours of August 29th, 10:20a is well picked up by the model: some drying is observed on the south-east shore.
As the hurricane, rotating anticlockwise, moves toward ELB, a swift rotation in its wind field is ob-served. This rapid "catapulting" of a large body of water creates a peak surge near the hypothetical non-overtopping levee. However, because the Lake is hydraulically locked, there is no exchange or gradient developing near the passes. For this reason, the surge recorded in the southeast region of the Lake is moderate, and a maximum value is less than 2m or 6ft at peak time, shown on August 29th, 07:20p. After the hurricane has left the area, the Lake surface returns to its zero mean elevation with-in hours (not shown).
This preliminary numerical assessment of storm surge in a hydraulically locked LP gives an indica-tion of the effect of a non-overtopping levee near ELB. The storm surge recorded in the early phase of the hurricane is of the same order of magnitude as that shown in the IPET report. In addition, a wind driven set up of less than 6-7ft is likely to be observed near Slidell, followed by a quick decay in the lake's free surface oscillation.
Thus, on the one hand, a non-overtopping levee that closes off the LP would prevent excessive surge from entering the Lake, but would cause massive increase in storm surge near the Mississippi state line and near the critical MRGO area. On the other hand, opening the gates during the early hours of the hurricane would limit such surge redistribution: this solution is fragile, however, because of the difficulty in timing gate closure right.
New Orleans East Land Bridge Study
Revised: 12/18/2012
33
.
New Orleans East Land Bridge Study
Revised: 12/18/2012
34
.
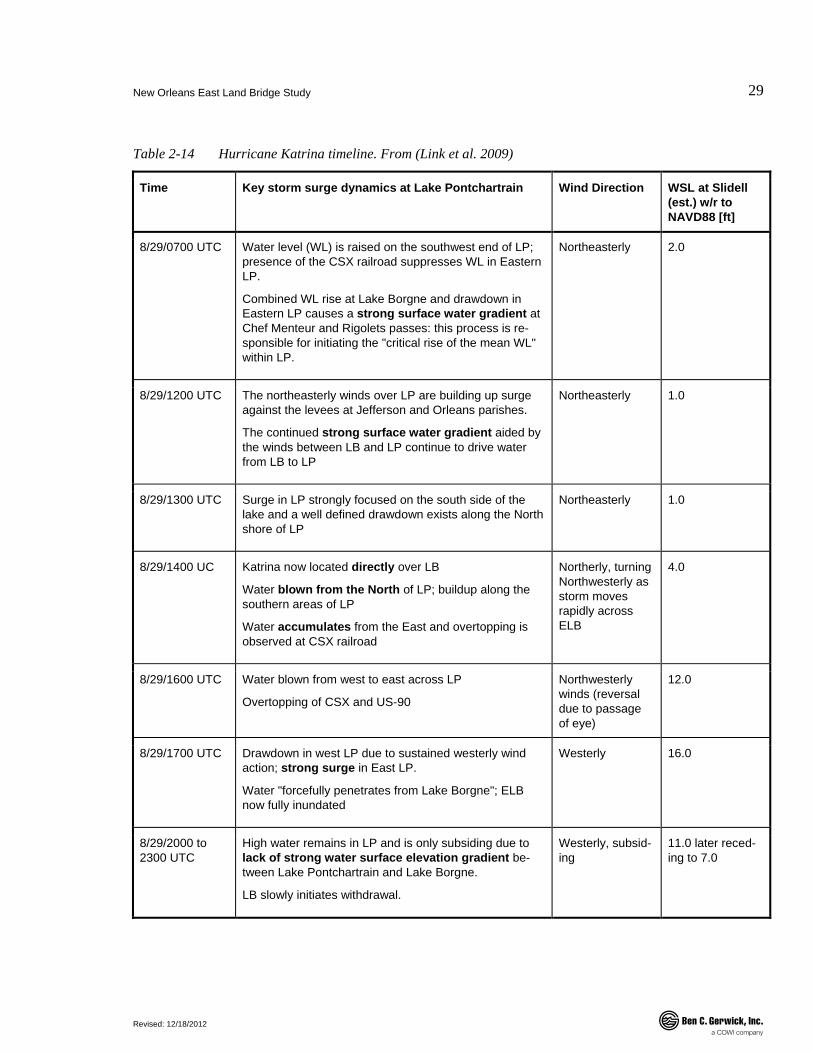
Figure 2-10 Snapshot of free surface elevations at Lake Pontchartrain; peak storm surge occurs in the southeast region of LP. Storm surge is limited to less than 6ft due to the presence of a non-overtopping levee at the ELB.
Hypothetical Scenario: Overtopping Levee The presence of an overtopping levee protection at the ELB would only delay storm surge from pene-trating inside LP and would later trap a significant amount of water: this reduces the value of such a flood barrier. Furthermore, because there is no significant water surface elevation gradient between LB and LP, opening the Chef and Rigolets passes would not have an immediate impact on reducing surge within LP.
2.4 NRC Review of the LACPR Technical Report The NRC reviewed the Master Plan and made numerous recommendations in their final 2009 report including the following selected findings and recommendations. Key points from the NRC review are summarized in this section.
2.4.1 Multi-Criteria Decision Analysis (MCDA) The NRC study recommends that "the LACPR team should perform a quantitative risk assessment of the structural protection systems that includes the probability of system failure of the various compo-nents including floodwalls, levees, ring levees, and floodgates."
In general, "The LACPR team (and the Corps) should take a more aggressive leadership role in pro-moting a variety of nonstructural measures that are important to reducing flood risks in coastal Loui-
New Orleans East Land Bridge Study
Revised: 12/18/2012
35
.
siana. Examples of these nonstructural measures include limiting development in flood-prone areas and stronger public education efforts regarding flooding risk in different sections of New Orleans."
The MCDA approach followed by the LACPR was criticized: "(…) Flaws in the application of these methods to the LACPR study have prevented any convincing results. As applied, the methods do not support the identification of a preferred alternative for any of the planning areas". In addition, the lack of "rankings of alternative plans as presented in the LACPR report" prevents the identification of high-priority projects.
This study seeks to build upon this feedback to increase the value of its recommendations for action.
2.4.2 Integrated Development Limiting Development The NRC review deems favorable a statement in the LACPR Technical Report describing the im-portance of limiting development in flood-prone areas. According to the NRC, such a development principle is at the core of flood risk management and reduction. However, it was concluded that the report comes short as it "(…) does not adequately demonstrate how these principles will be a promi-nent part of hurricane protection and coastal restoration actions". Recommendations were made to the LACPR to improve cooperation with state and local authorities so that the prevention of development plays a key role in future coastal risk reduction plans.
Multiple Authorization System vs. Comprehensive Plan The NRC report also bemoans the multiple authorizations system in place that is governing restora-tion and protection efforts in southern Louisiana. It warns that this "piecemeal approach [...] may hin-der integrated, adaptive restoration and protection improvements across the region".
Generally speaking, the NRC authors comment on the lack of a "comprehensive long-term hurricane protection and coastal restoration plan". Similarly to what was stated for the MCDA process, the au-thors deem it a major shortcoming of the LACPR Technical Report to lack any advice on "initial high priority steps and projects".
At the time, it was recommended that "before the end of 2009, the Corps of Engineers and the State of Louisiana should agree on the elements of a single comprehensive plan for long-term hurricane protection and coastal restoration". A key component of that plan should include agreed-upon high-priority projects ready for immediate implementation.
2.5 Existing and Planned LACPR Projects and Studies Affecting the ELB
In general, a review of on-going and existing restoration projects indicate a positive outlook for the ELB shoreline. Most critically, the Alligator Bend restoration project will provide direct protection against wave action and by doing so will help limit shoreline erosion. This dovetails with the 2007 results published in the Coastal Louisiana Environmental Assessment Report (CLEAR) - available as
New Orleans East Land Bridge Study
Revised: 12/18/2012
36
.
Appendix G of the 2007 CPRA Master Plan (CPRA 2007b). The report shows that, overall, the ELB is expected to gain from regrowth and regenerative efforts. More details are given in Section 3.7.
2.5.1 Planned Studies At time of writing, there are no anticipated planned studies that are similar in scope to this effort.
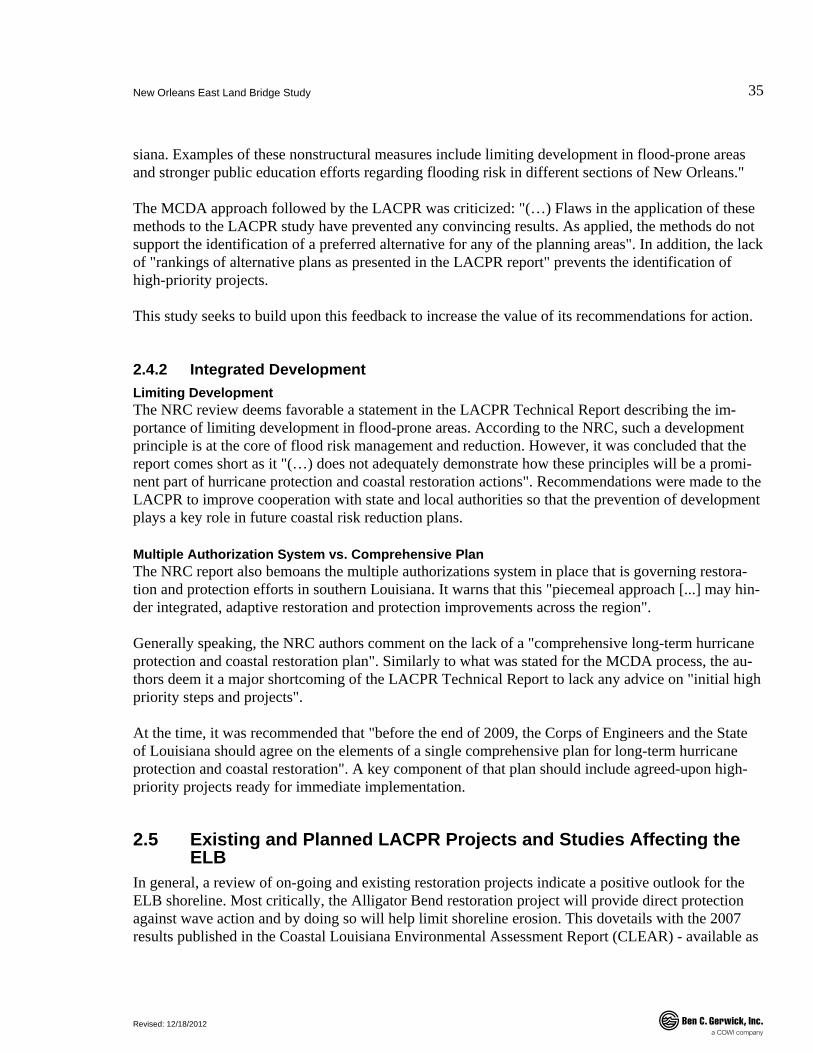
2.5.2 Planned Projects Nearby projects that directly affect the ELB restoration and protection efforts can be found from the Louisiana Coastal Wetlands Conservation and Restoration Task Force database. A 2008 map centered on the ELB, compiled by the Coastal Wetlands Planning, Protection and Restoration Act agency shown in Figure 2.11 locates each project.
Most notably, the Bayou Chevée Shoreline Protection (PO-22) and the Alligator Bend Marsh Resto-ration and Shoreline Protection (PO-34) projects are the immediate vicinity of the ELB. These and other projects are reviewed in a cursory fashion in the following section.
Figure 2-11 Timeline of projects near the ELB.
Table 2-15 Existing and planned LACPR projects of immediate relevance to the ELB.
Name Completion date Purpose Location Sponsors
PO-22 Dec. 2001 Shoreline protection against wave action on marsh
Bayou Chevée area NRCS (federal) and LACPR (state)
PO-34 Sep. 2012 (antici-pated)
Shoreline protection and marsh restora-tion
South-west bend of ELB
USACE (federal) and LACPR (state)
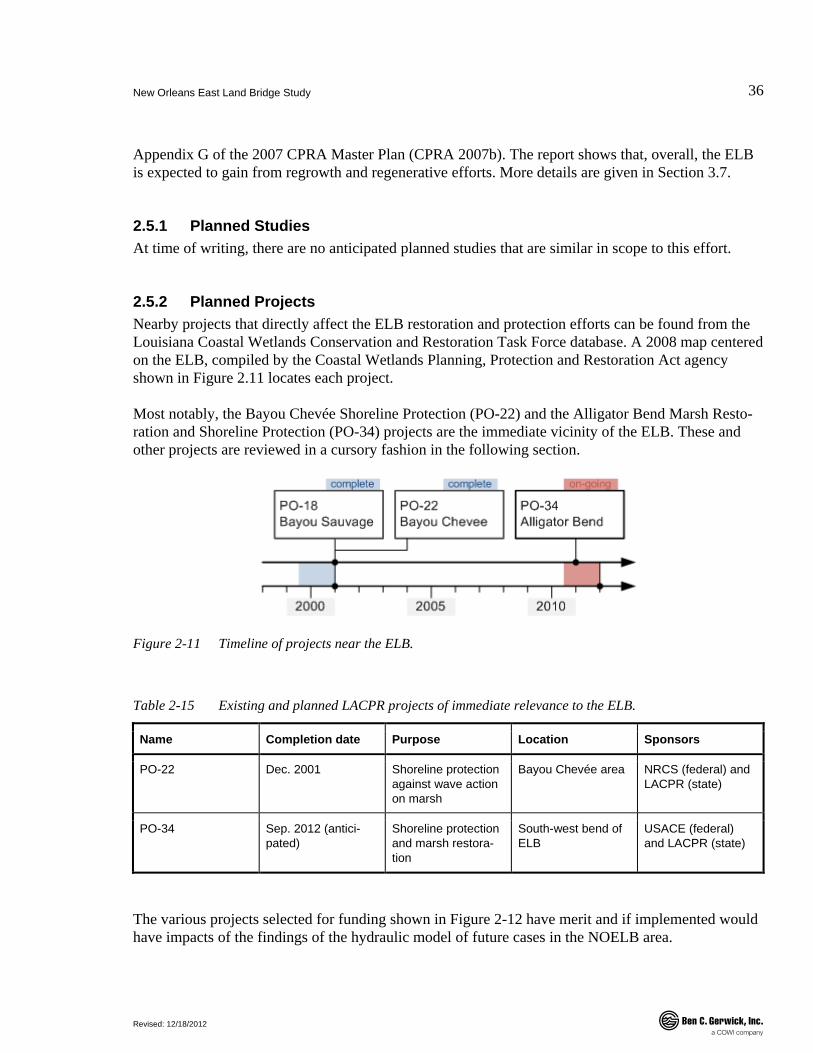
The various projects selected for funding shown in Figure 2-12 have merit and if implemented would have impacts of the findings of the hydraulic model of future cases in the NOELB area.
New Orleans East Land Bridge Study
Revised: 12/18/2012
37
.
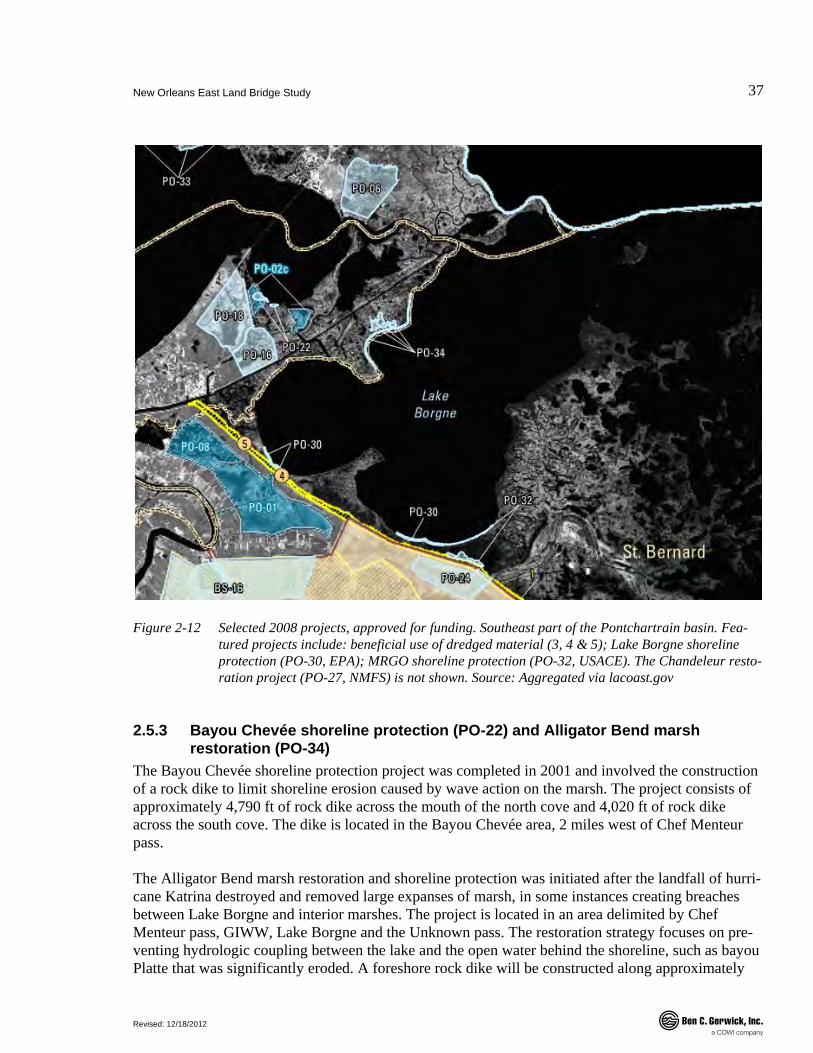
Figure 2-12 Selected 2008 projects, approved for funding. Southeast part of the Pontchartrain basin. Fea-tured projects include: beneficial use of dredged material (3, 4 & 5); Lake Borgne shoreline protection (PO-30, EPA); MRGO shoreline protection (PO-32, USACE). The Chandeleur resto-ration project (PO-27, NMFS) is not shown. Source: Aggregated via lacoast.gov
2.5.3 Bayou Chevée shoreline protection (PO-22) and Alligator Bend marsh restoration (PO-34)
The Bayou Chevée shoreline protection project was completed in 2001 and involved the construction of a rock dike to limit shoreline erosion caused by wave action on the marsh. The project consists of approximately 4,790 ft of rock dike across the mouth of the north cove and 4,020 ft of rock dike across the south cove. The dike is located in the Bayou Chevée area, 2 miles west of Chef Menteur pass.
The Alligator Bend marsh restoration and shoreline protection was initiated after the landfall of hurri-cane Katrina destroyed and removed large expanses of marsh, in some instances creating breaches between Lake Borgne and interior marshes. The project is located in an area delimited by Chef Menteur pass, GIWW, Lake Borgne and the Unknown pass. The restoration strategy focuses on pre-venting hydrologic coupling between the lake and the open water behind the shoreline, such as bayou Platte that was significantly eroded. A foreshore rock dike will be constructed along approximately
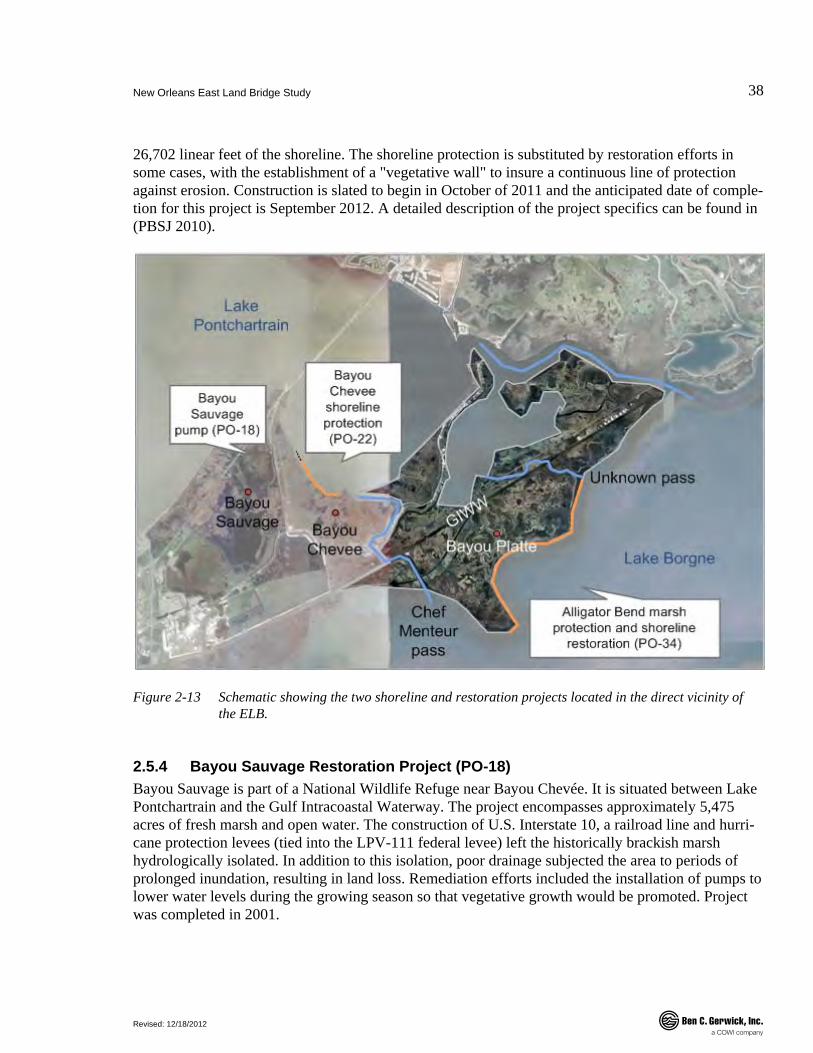
New Orleans East Land Bridge Study
Revised: 12/18/2012
38
.
26,702 linear feet of the shoreline. The shoreline protection is substituted by restoration efforts in some cases, with the establishment of a "vegetative wall" to insure a continuous line of protection against erosion. Construction is slated to begin in October of 2011 and the anticipated date of comple-tion for this project is September 2012. A detailed description of the project specifics can be found in (PBSJ 2010).
Figure 2-13 Schematic showing the two shoreline and restoration projects located in the direct vicinity of the ELB.
2.5.4 Bayou Sauvage Restoration Project (PO-18) Bayou Sauvage is part of a National Wildlife Refuge near Bayou Chevée. It is situated between Lake Pontchartrain and the Gulf Intracoastal Waterway. The project encompasses approximately 5,475 acres of fresh marsh and open water. The construction of U.S. Interstate 10, a railroad line and hurri-cane protection levees (tied into the LPV-111 federal levee) left the historically brackish marsh hydrologically isolated. In addition to this isolation, poor drainage subjected the area to periods of prolonged inundation, resulting in land loss. Remediation efforts included the installation of pumps to lower water levels during the growing season so that vegetative growth would be promoted. Project was completed in 2001.
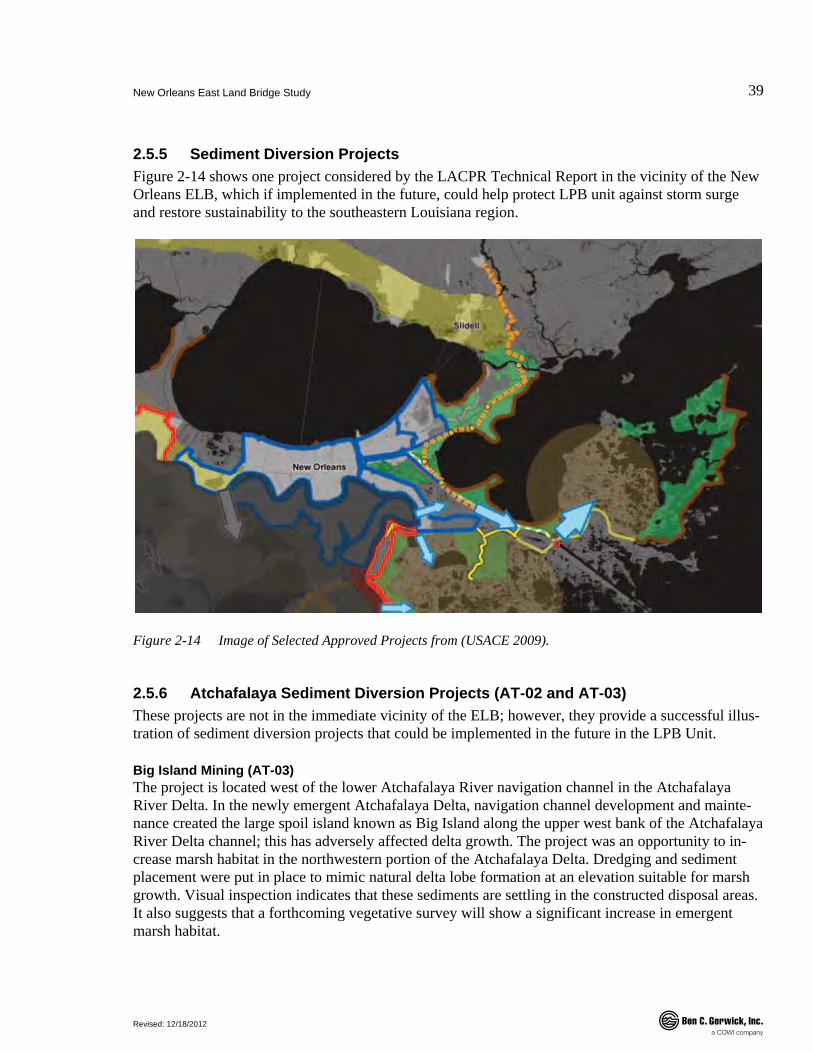
New Orleans East Land Bridge Study
Revised: 12/18/2012
39
.
2.5.5 Sediment Diversion Projects Figure 2-14 shows one project considered by the LACPR Technical Report in the vicinity of the New Orleans ELB, which if implemented in the future, could help protect LPB unit against storm surge and restore sustainability to the southeastern Louisiana region.
Figure 2-14 Image of Selected Approved Projects from (USACE 2009).
2.5.6 Atchafalaya Sediment Diversion Projects (AT-02 and AT-03) These projects are not in the immediate vicinity of the ELB; however, they provide a successful illus-tration of sediment diversion projects that could be implemented in the future in the LPB Unit.
Big Island Mining (AT-03) The project is located west of the lower Atchafalaya River navigation channel in the Atchafalaya River Delta. In the newly emergent Atchafalaya Delta, navigation channel development and mainte-nance created the large spoil island known as Big Island along the upper west bank of the Atchafalaya River Delta channel; this has adversely affected delta growth. The project was an opportunity to in-crease marsh habitat in the northwestern portion of the Atchafalaya Delta. Dredging and sediment placement were put in place to mimic natural delta lobe formation at an elevation suitable for marsh growth. Visual inspection indicates that these sediments are settling in the constructed disposal areas. It also suggests that a forthcoming vegetative survey will show a significant increase in emergent marsh habitat.

New Orleans East Land Bridge Study
Revised: 12/18/2012
40
.
Atchafalaya Sediment Delivery (AT-02) The project is located east of the lower Atchafalaya River navigation channel in the Atchafalaya Riv-er Delta, approximately 19 miles southwest of Morgan City, Louisiana, in St. Mary Parish. Growth of the lower Atchafalaya Delta has been reduced as a result of maintenance of the Atchafalaya River navigation channel. The purpose of this project is to promote natural delta development by reopening two silted-in channels and using those dredged sediments to create new wetlands. To date, satellite imagery indicates that there have been significant increases in emergent acreage from 1998.

New Orleans East Land Bridge Study
Revised: 12/18/2012
41
.
3 Background Project Data
3.1 Summary of Compiled Information Gerwick has obtained and assessed the following data relevant to the present study: Available infor-mation related to the current state of the ELB; bathymetric and topographic data; and wind, wave and tidal information. In addition, this section contains select geotechnical information, including: esti-mates of rates of subsidence within the project area for both 50 and 100-YRP periods; and analysis of soil samples at the project site. Specifically, the following items are addressed in this section:
• Available information related to the current state of the ELB;
• Bathymetric and topographic data;
• Preliminary met-ocean information, including local wind, wave climate and water levels;
• Geotechnical information;
• Estimates of rates of subsidence within the project area for both 50- and 100-year periods;
• Identification of vulnerable locations.
3.2 Time Line The timeline envisioned by this study corresponds to 50 years from 2011, 2061. Nonetheless, to facil-itate comparison with results from the LACPR Technical Report, the time horizon is set to 2060.
3.3 Project Site
3.3.1 Units Whenever convenient, units for quantities are provided in both the US customary and Système Inter-national (SI) systems. In general, all numerical codes work in a grid system (UTM) and require metric units. A notable exception is the hydrodynamic modeling software ADCIRC, which requires geo-graphic coordinates and metric units.
3.3.2 Local Subdivision The East Land Bridge lies in the Orleans parish, and is located at the interface between Lake Borgne and Lake Ponchartrain. In its immediate vicinity lies St. Bernard parish. A locator map is shown be-low.

New Orleans East Land Bridge Study
Revised: 12/18/2012
42
.
Figure 3-1 Locator map showing the East Land Bridge as delineated in this report (red, thick black out-line); Orleans parish (light red) and adjacent parishes.
3.3.3 Project Bathymetry Datum and Coordinate System Bathymetry Digital elevation models (DEM) are provided by NOAA's National Geophysical Data Center (NGDC). These integrated bathymetric-topographic DEMs were developed for the NOAA Coastal Survey Development Laboratory (CSDL). Bathymetric, topographic, and shoreline data used in DEM compilation are obtained from various sources, including NGDC, the U.S. Coastal Services Center (CSC), the U.S. Office of Coast Survey (OCS), the U.S. Army Corps of Engineers (USACE), and other federal, state, and local government agencies, academic institutions, and private companies.
In this particular case, two DEMs are combined to form the basis of a digital elevation model: the New Orleans and Northern Gulf of Mexico are merged in order to achieve a compromise between expansive coverage and good resolution of the ELB area (Taylor et al. 2007). As shown in Figure 2.1, the merged DEM dimensions are approximately 216km × 170km. Details are given below.
Planar Coordinate System and Vertical Datum The ELB is within Zone 15 of the UTM system. The specifics of each grid are tabulated below. A rendering is shown in Figure 3-2.
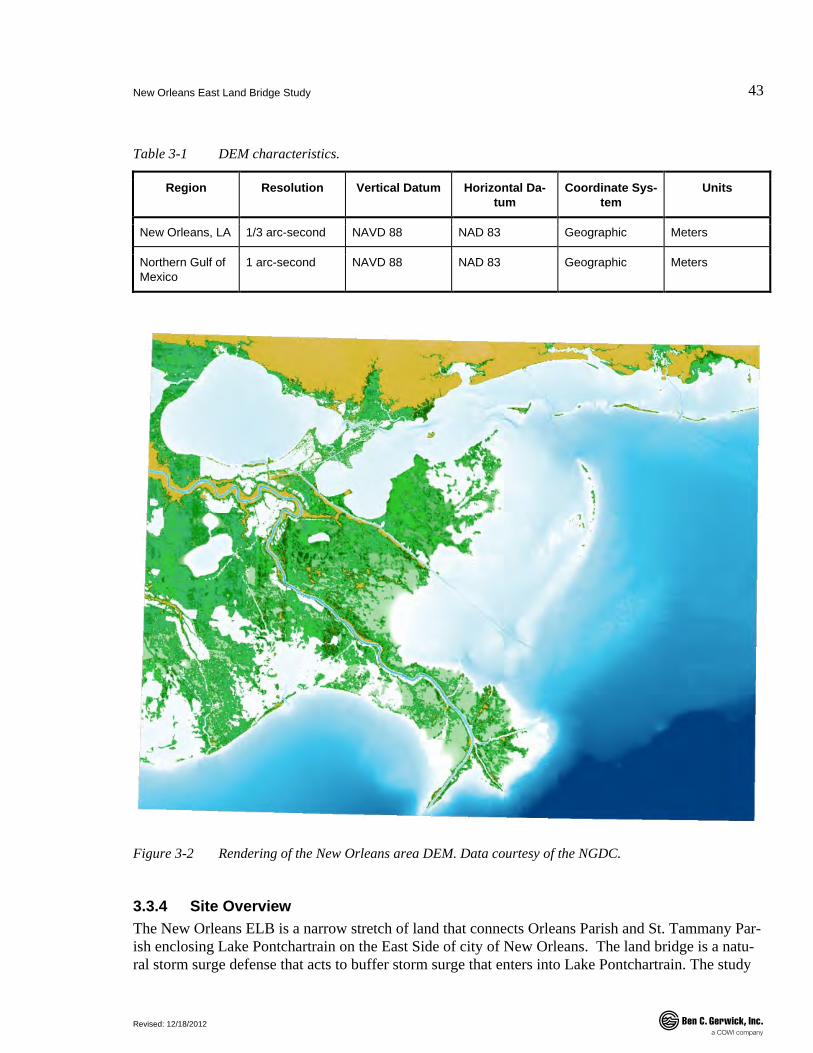
New Orleans East Land Bridge Study
Revised: 12/18/2012
43
.
Table 3-1 DEM characteristics.
Region Resolution Vertical Datum Horizontal Da-tum
Coordinate Sys-tem
Units
New Orleans, LA 1/3 arc-second NAVD 88 NAD 83 Geographic Meters
Northern Gulf of Mexico
1 arc-second NAVD 88 NAD 83 Geographic Meters
Figure 3-2 Rendering of the New Orleans area DEM. Data courtesy of the NGDC.
3.3.4 Site Overview The New Orleans ELB is a narrow stretch of land that connects Orleans Parish and St. Tammany Par-ish enclosing Lake Pontchartrain on the East Side of city of New Orleans. The land bridge is a natu-ral storm surge defense that acts to buffer storm surge that enters into Lake Pontchartrain. The study
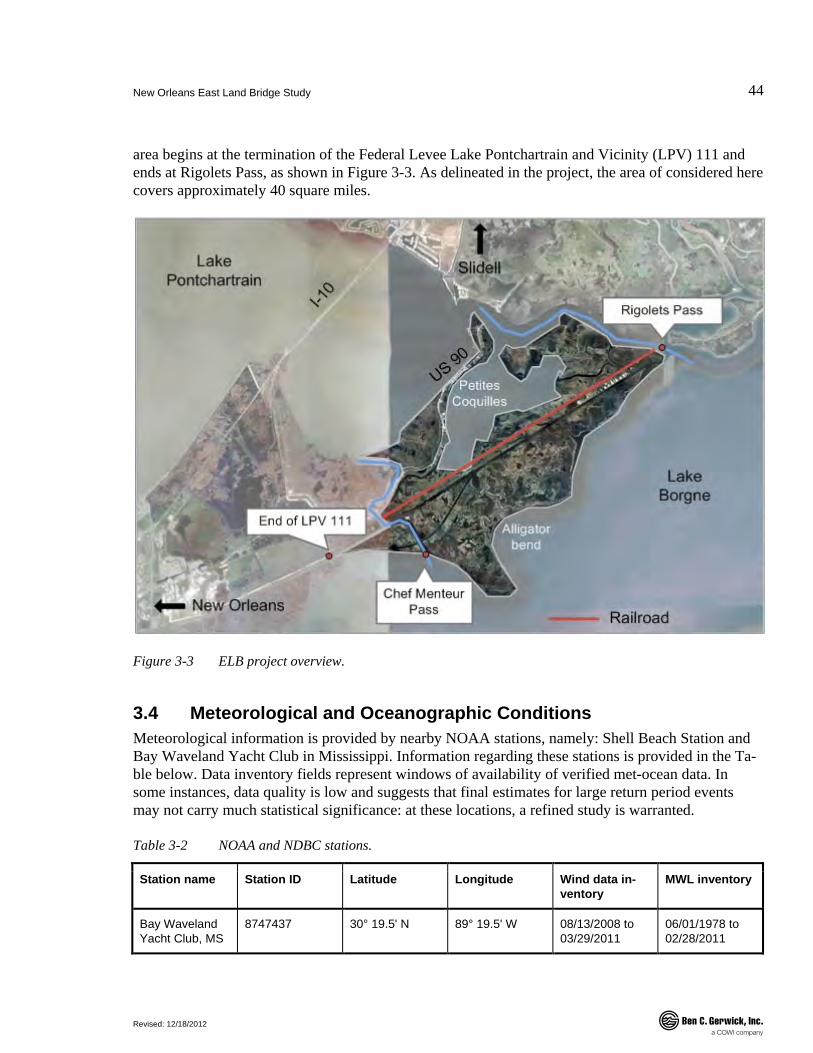
New Orleans East Land Bridge Study
Revised: 12/18/2012
44
.
area begins at the termination of the Federal Levee Lake Pontchartrain and Vicinity (LPV) 111 and ends at Rigolets Pass, as shown in Figure 3-3. As delineated in the project, the area of considered here covers approximately 40 square miles.
Figure 3-3 ELB project overview.
3.4 Meteorological and Oceanographic Conditions Meteorological information is provided by nearby NOAA stations, namely: Shell Beach Station and Bay Waveland Yacht Club in Mississippi. Information regarding these stations is provided in the Ta-ble below. Data inventory fields represent windows of availability of verified met-ocean data. In some instances, data quality is low and suggests that final estimates for large return period events may not carry much statistical significance: at these locations, a refined study is warranted.
Table 3-2 NOAA and NDBC stations.
Station name Station ID Latitude Longitude Wind data in-ventory
MWL inventory
Bay Waveland Yacht Club, MS
8747437 30° 19.5' N 89° 19.5' W 08/13/2008 to 03/29/2011
06/01/1978 to 02/28/2011
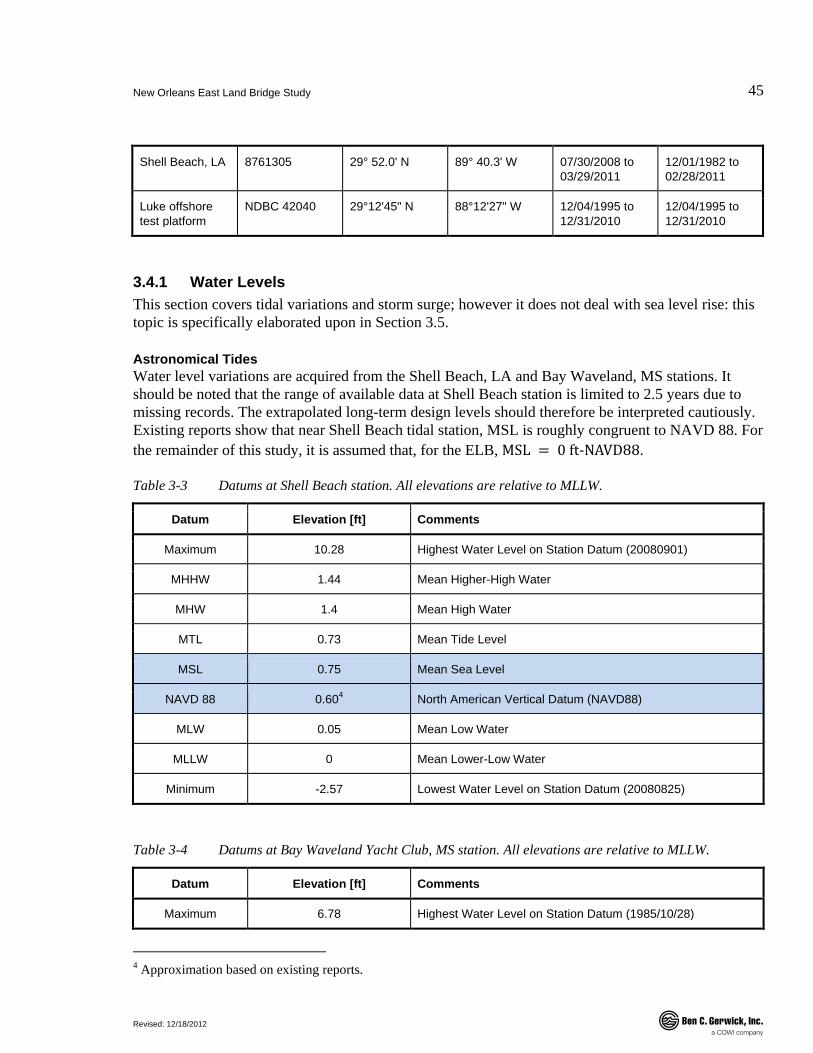
New Orleans East Land Bridge Study
Revised: 12/18/2012
45
.
Shell Beach, LA 8761305 29° 52.0' N 89° 40.3' W 07/30/2008 to 03/29/2011
12/01/1982 to 02/28/2011
Luke offshore test platform
NDBC 42040 29°12'45" N 88°12'27" W 12/04/1995 to 12/31/2010
12/04/1995 to 12/31/2010
3.4.1 Water Levels This section covers tidal variations and storm surge; however it does not deal with sea level rise: this topic is specifically elaborated upon in Section 3.5.
Astronomical Tides Water level variations are acquired from the Shell Beach, LA and Bay Waveland, MS stations. It should be noted that the range of available data at Shell Beach station is limited to 2.5 years due to missing records. The extrapolated long-term design levels should therefore be interpreted cautiously. Existing reports show that near Shell Beach tidal station, MSL is roughly congruent to NAVD 88. For the remainder of this study, it is assumed that, for the ELB, MSL = 0 ft-NAVD88.
Table 3-3 Datums at Shell Beach station. All elevations are relative to MLLW.
Datum Elevation [ft] Comments
Maximum 10.28 Highest Water Level on Station Datum (20080901)
MHHW 1.44 Mean Higher-High Water
MHW 1.4 Mean High Water
MTL 0.73 Mean Tide Level
MSL 0.75 Mean Sea Level
NAVD 88 0.604 North American Vertical Datum (NAVD88)
MLW 0.05 Mean Low Water
MLLW 0 Mean Lower-Low Water
Minimum -2.57 Lowest Water Level on Station Datum (20080825)
Table 3-4 Datums at Bay Waveland Yacht Club, MS station. All elevations are relative to MLLW.
Datum Elevation [ft] Comments
Maximum 6.78 Highest Water Level on Station Datum (1985/10/28)
4 Approximation based on existing reports.
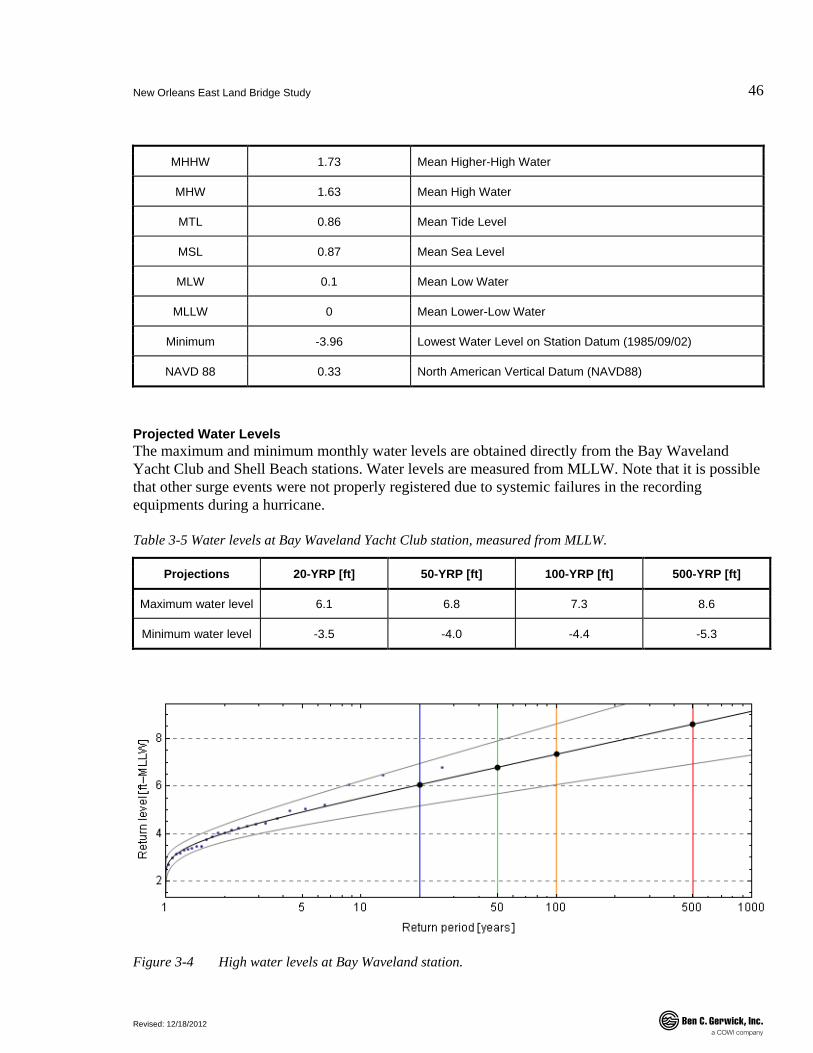
New Orleans East Land Bridge Study
Revised: 12/18/2012
46
.
MHHW 1.73 Mean Higher-High Water
MHW 1.63 Mean High Water
MTL 0.86 Mean Tide Level
MSL 0.87 Mean Sea Level
MLW 0.1 Mean Low Water
MLLW 0 Mean Lower-Low Water
Minimum -3.96 Lowest Water Level on Station Datum (1985/09/02)
NAVD 88 0.33 North American Vertical Datum (NAVD88)
Projected Water Levels The maximum and minimum monthly water levels are obtained directly from the Bay Waveland Yacht Club and Shell Beach stations. Water levels are measured from MLLW. Note that it is possible that other surge events were not properly registered due to systemic failures in the recording equipments during a hurricane.
Table 3-5 Water levels at Bay Waveland Yacht Club station, measured from MLLW.
Projections 20-YRP [ft] 50-YRP [ft] 100-YRP [ft] 500-YRP [ft]
Maximum water level 6.1 6.8 7.3 8.6
Minimum water level -3.5 -4.0 -4.4 -5.3
Figure 3-4 High water levels at Bay Waveland station.
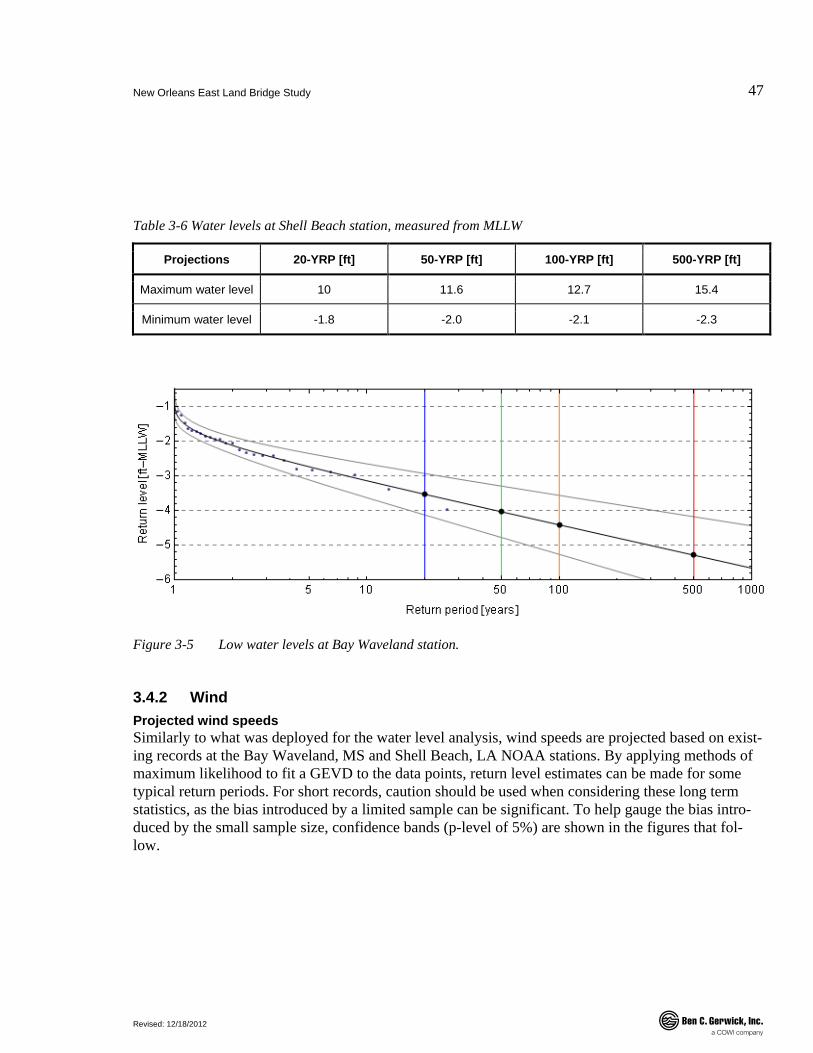
New Orleans East Land Bridge Study
Revised: 12/18/2012
47
.
Table 3-6 Water levels at Shell Beach station, measured from MLLW
Projections 20-YRP [ft] 50-YRP [ft] 100-YRP [ft] 500-YRP [ft]
Maximum water level 10 11.6 12.7 15.4
Minimum water level -1.8 -2.0 -2.1 -2.3
Figure 3-5 Low water levels at Bay Waveland station.
3.4.2 Wind Projected wind speeds Similarly to what was deployed for the water level analysis, wind speeds are projected based on exist-ing records at the Bay Waveland, MS and Shell Beach, LA NOAA stations. By applying methods of maximum likelihood to fit a GEVD to the data points, return level estimates can be made for some typical return periods. For short records, caution should be used when considering these long term statistics, as the bias introduced by a limited sample can be significant. To help gauge the bias intro-duced by the small sample size, confidence bands (p-level of 5%) are shown in the figures that fol-low.
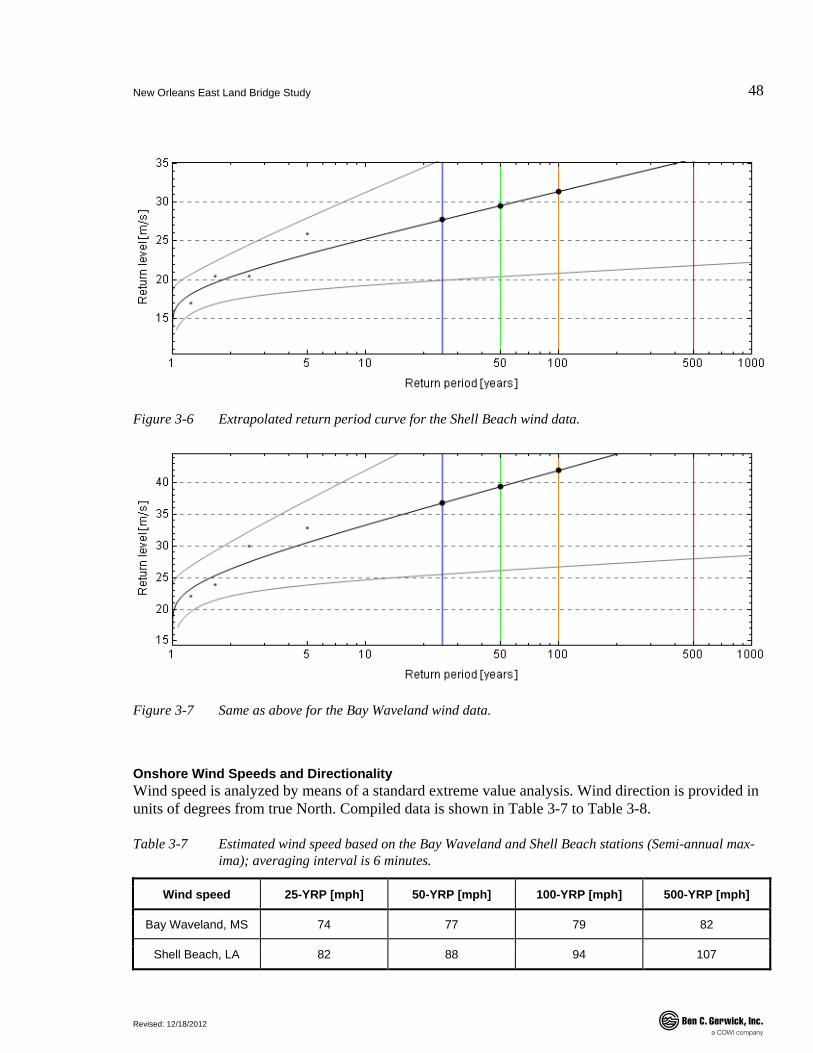
New Orleans East Land Bridge Study
Revised: 12/18/2012
48
.
Figure 3-6 Extrapolated return period curve for the Shell Beach wind data.
Figure 3-7 Same as above for the Bay Waveland wind data.
Onshore Wind Speeds and Directionality Wind speed is analyzed by means of a standard extreme value analysis. Wind direction is provided in units of degrees from true North. Compiled data is shown in Table 3-7 to Table 3-8.
Table 3-7 Estimated wind speed based on the Bay Waveland and Shell Beach stations (Semi-annual max-ima); averaging interval is 6 minutes.
Wind speed 25-YRP [mph] 50-YRP [mph] 100-YRP [mph] 500-YRP [mph]
Bay Waveland, MS 74 77 79 82
Shell Beach, LA 82 88 94 107
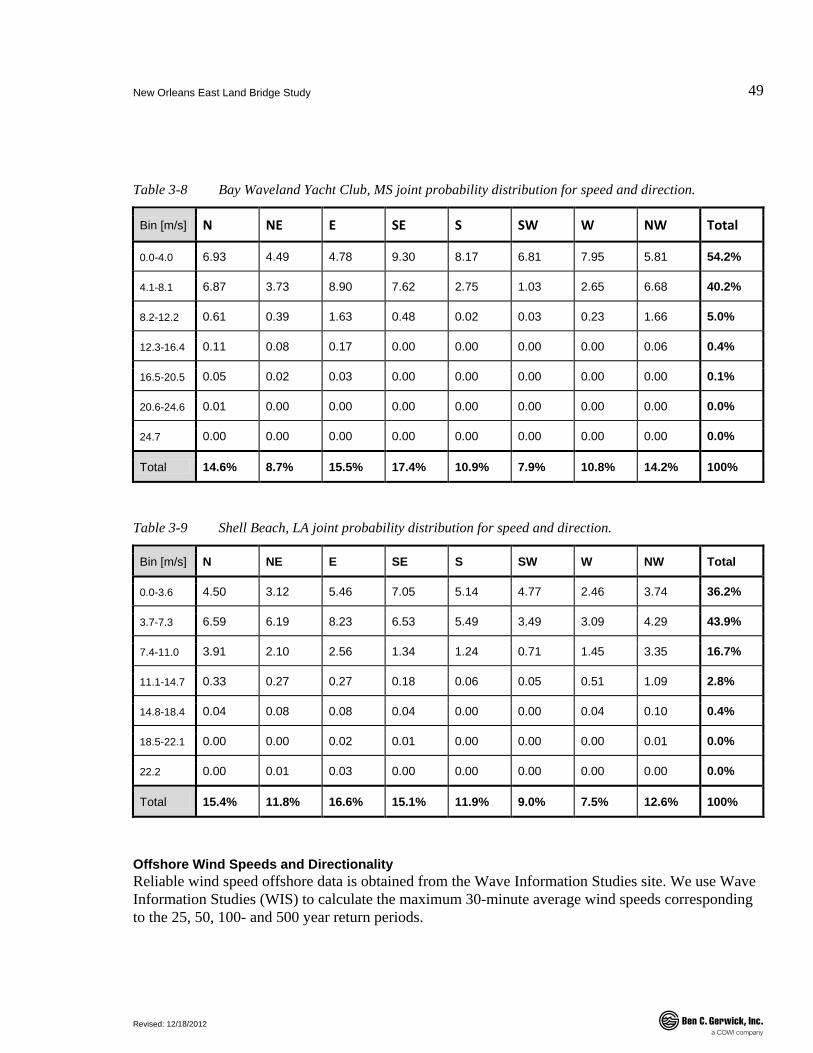
New Orleans East Land Bridge Study
Revised: 12/18/2012
49
.
Table 3-8 Bay Waveland Yacht Club, MS joint probability distribution for speed and direction.
Bin [m/s] N NE E SE S SW W NW Total
0.0-4.0 6.93 4.49 4.78 9.30 8.17 6.81 7.95 5.81 54.2%
4.1-8.1 6.87 3.73 8.90 7.62 2.75 1.03 2.65 6.68 40.2%
8.2-12.2 0.61 0.39 1.63 0.48 0.02 0.03 0.23 1.66 5.0%
12.3-16.4 0.11 0.08 0.17 0.00 0.00 0.00 0.00 0.06 0.4%
16.5-20.5 0.05 0.02 0.03 0.00 0.00 0.00 0.00 0.00 0.1%
20.6-24.6 0.01 0.00 0.00 0.00 0.00 0.00 0.00 0.00 0.0%
24.7 0.00 0.00 0.00 0.00 0.00 0.00 0.00 0.00 0.0%
Total 14.6% 8.7% 15.5% 17.4% 10.9% 7.9% 10.8% 14.2% 100%
Table 3-9 Shell Beach, LA joint probability distribution for speed and direction.
Bin [m/s] N NE E SE S SW W NW Total
0.0-3.6 4.50 3.12 5.46 7.05 5.14 4.77 2.46 3.74 36.2%
3.7-7.3 6.59 6.19 8.23 6.53 5.49 3.49 3.09 4.29 43.9%
7.4-11.0 3.91 2.10 2.56 1.34 1.24 0.71 1.45 3.35 16.7%
11.1-14.7 0.33 0.27 0.27 0.18 0.06 0.05 0.51 1.09 2.8%
14.8-18.4 0.04 0.08 0.08 0.04 0.00 0.00 0.04 0.10 0.4%
18.5-22.1 0.00 0.00 0.02 0.01 0.00 0.00 0.00 0.01 0.0%
22.2 0.00 0.01 0.03 0.00 0.00 0.00 0.00 0.00 0.0%
Total 15.4% 11.8% 16.6% 15.1% 11.9% 9.0% 7.5% 12.6% 100%
Offshore Wind Speeds and Directionality Reliable wind speed offshore data is obtained from the Wave Information Studies site. We use Wave Information Studies (WIS) to calculate the maximum 30-minute average wind speeds corresponding to the 25, 50, 100- and 500 year return periods.
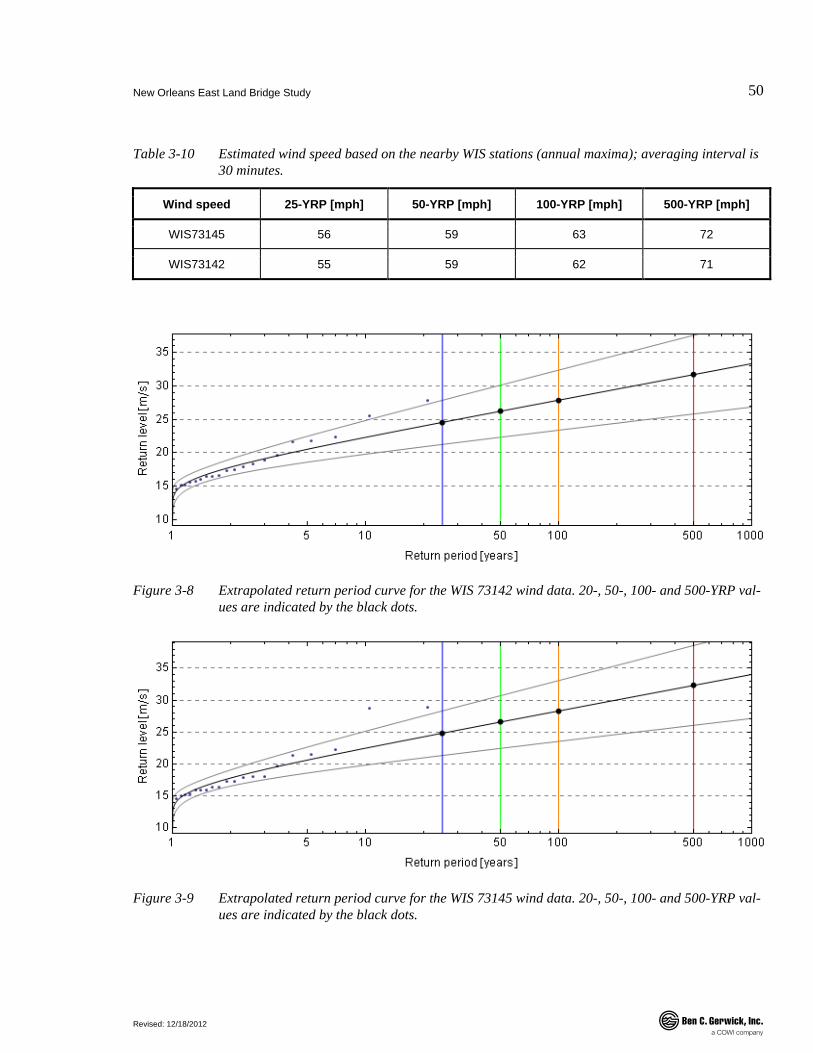
New Orleans East Land Bridge Study
Revised: 12/18/2012
50
.
Table 3-10 Estimated wind speed based on the nearby WIS stations (annual maxima); averaging interval is 30 minutes.
Wind speed 25-YRP [mph] 50-YRP [mph] 100-YRP [mph] 500-YRP [mph]
WIS73145 56 59 63 72
WIS73142 55 59 62 71
Figure 3-8 Extrapolated return period curve for the WIS 73142 wind data. 20-, 50-, 100- and 500-YRP val-ues are indicated by the black dots.
Figure 3-9 Extrapolated return period curve for the WIS 73145 wind data. 20-, 50-, 100- and 500-YRP val-ues are indicated by the black dots.
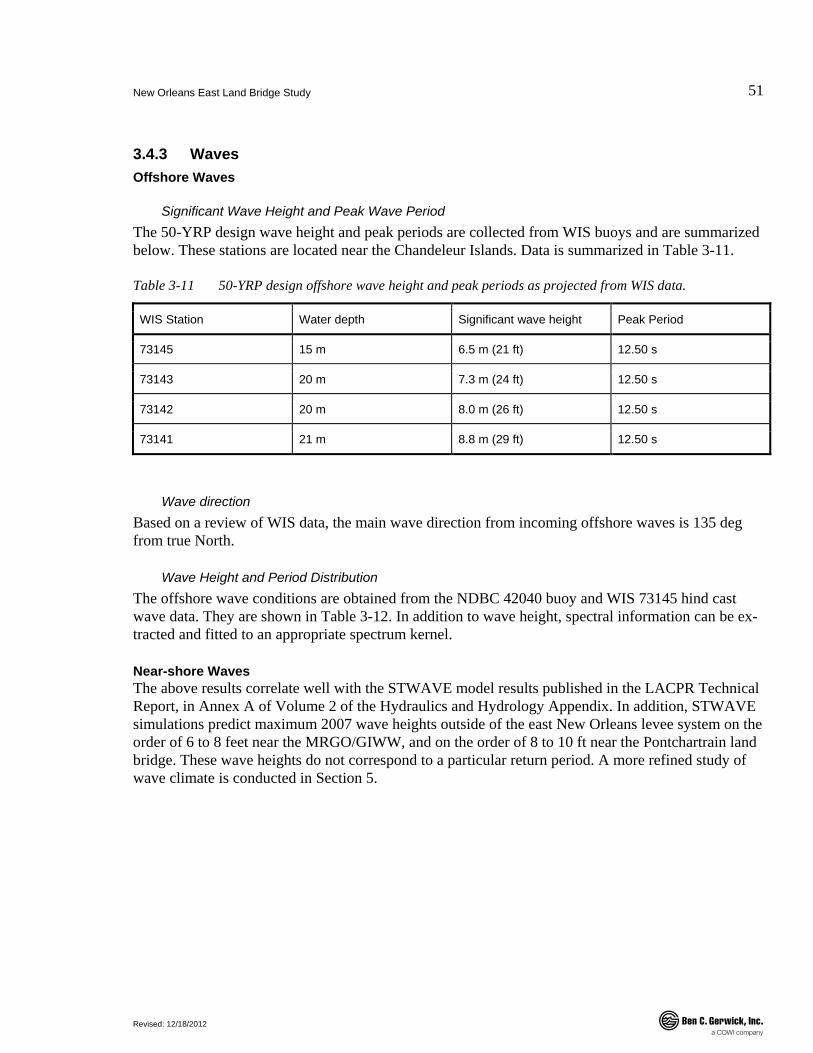
New Orleans East Land Bridge Study
Revised: 12/18/2012
51
.
3.4.3 Waves Offshore Waves
Significant Wave Height and Peak Wave Period The 50-YRP design wave height and peak periods are collected from WIS buoys and are summarized below. These stations are located near the Chandeleur Islands. Data is summarized in Table 3-11.
Table 3-11 50-YRP design offshore wave height and peak periods as projected from WIS data.
WIS Station Water depth Significant wave height Peak Period
73145 15 m 6.5 m (21 ft) 12.50 s
73143 20 m 7.3 m (24 ft) 12.50 s
73142 20 m 8.0 m (26 ft) 12.50 s
73141 21 m 8.8 m (29 ft) 12.50 s
Wave direction Based on a review of WIS data, the main wave direction from incoming offshore waves is 135 deg from true North.
Wave Height and Period Distribution The offshore wave conditions are obtained from the NDBC 42040 buoy and WIS 73145 hind cast wave data. They are shown in Table 3-12. In addition to wave height, spectral information can be ex-tracted and fitted to an appropriate spectrum kernel.
Near-shore Waves The above results correlate well with the STWAVE model results published in the LACPR Technical Report, in Annex A of Volume 2 of the Hydraulics and Hydrology Appendix. In addition, STWAVE simulations predict maximum 2007 wave heights outside of the east New Orleans levee system on the order of 6 to 8 feet near the MRGO/GIWW, and on the order of 8 to 10 ft near the Pontchartrain land bridge. These wave heights do not correspond to a particular return period. A more refined study of wave climate is conducted in Section 5.
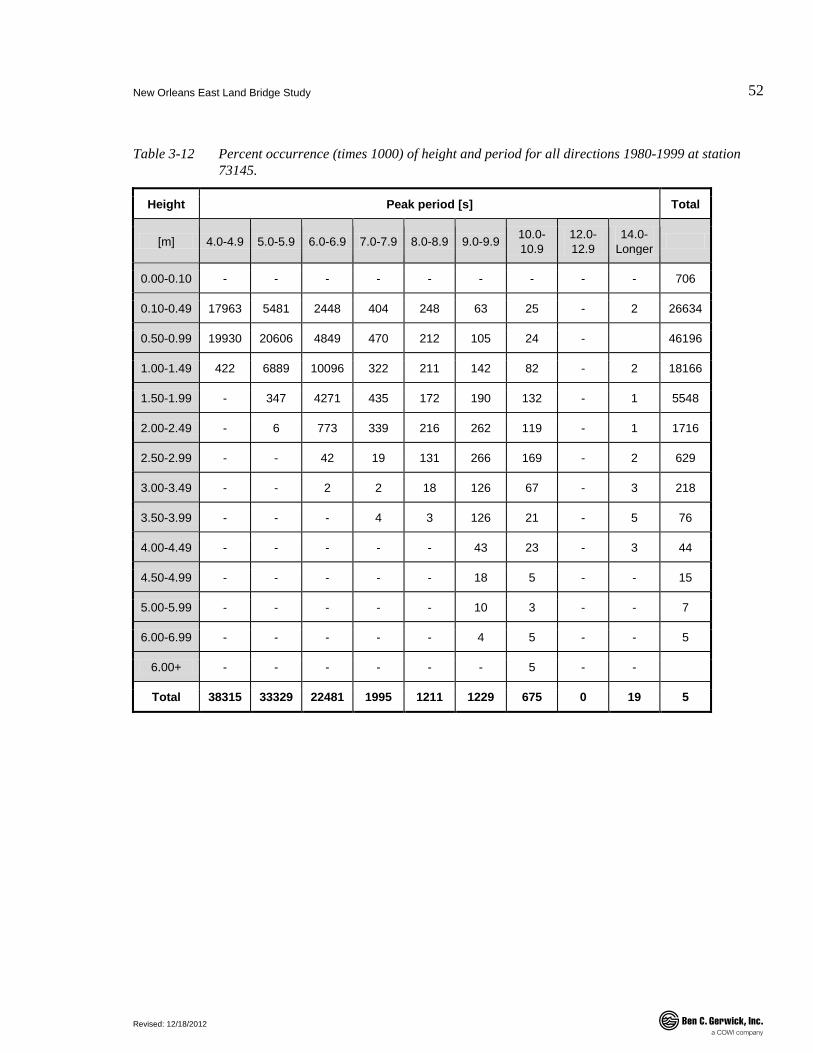
New Orleans East Land Bridge Study
Revised: 12/18/2012
52
.
Table 3-12 Percent occurrence (times 1000) of height and period for all directions 1980-1999 at station 73145.
Height Peak period [s] Total
[m] 4.0-4.9 5.0-5.9 6.0-6.9 7.0-7.9 8.0-8.9 9.0-9.9 10.0-10.9
12.0-12.9
14.0-Longer
0.00-0.10 - - - - - - - - - 706
0.10-0.49 17963 5481 2448 404 248 63 25 - 2 26634
0.50-0.99 19930 20606 4849 470 212 105 24 - 46196
1.00-1.49 422 6889 10096 322 211 142 82 - 2 18166
1.50-1.99 - 347 4271 435 172 190 132 - 1 5548
2.00-2.49 - 6 773 339 216 262 119 - 1 1716
2.50-2.99 - - 42 19 131 266 169 - 2 629
3.00-3.49 - - 2 2 18 126 67 - 3 218
3.50-3.99 - - - 4 3 126 21 - 5 76
4.00-4.49 - - - - - 43 23 - 3 44
4.50-4.99 - - - - - 18 5 - - 15
5.00-5.99 - - - - - 10 3 - - 7
6.00-6.99 - - - - - 4 5 - - 5
6.00+ - - - - - - 5 - -
Total 38315 33329 22481 1995 1211 1229 675 0 19 5
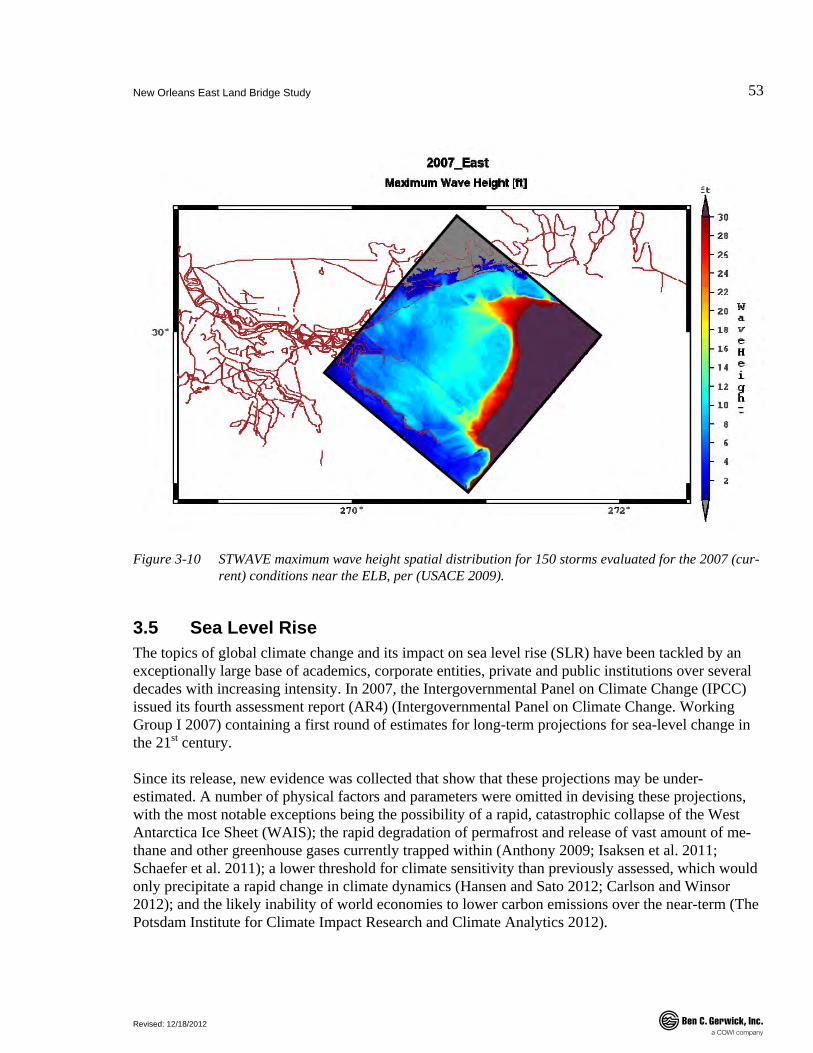
New Orleans East Land Bridge Study
Revised: 12/18/2012
53
.
Figure 3-10 STWAVE maximum wave height spatial distribution for 150 storms evaluated for the 2007 (cur-rent) conditions near the ELB, per (USACE 2009).
3.5 Sea Level Rise The topics of global climate change and its impact on sea level rise (SLR) have been tackled by an exceptionally large base of academics, corporate entities, private and public institutions over several decades with increasing intensity. In 2007, the Intergovernmental Panel on Climate Change (IPCC) issued its fourth assessment report (AR4) (Intergovernmental Panel on Climate Change. Working Group I 2007) containing a first round of estimates for long-term projections for sea-level change in the 21st century.
Since its release, new evidence was collected that show that these projections may be under-estimated. A number of physical factors and parameters were omitted in devising these projections, with the most notable exceptions being the possibility of a rapid, catastrophic collapse of the West Antarctica Ice Sheet (WAIS); the rapid degradation of permafrost and release of vast amount of me-thane and other greenhouse gases currently trapped within (Anthony 2009; Isaksen et al. 2011; Schaefer et al. 2011); a lower threshold for climate sensitivity than previously assessed, which would only precipitate a rapid change in climate dynamics (Hansen and Sato 2012; Carlson and Winsor 2012); and the likely inability of world economies to lower carbon emissions over the near-term (The Potsdam Institute for Climate Impact Research and Climate Analytics 2012).

New Orleans East Land Bridge Study
Revised: 12/18/2012
54
.
Publicly, recently updated estimates for sea-level change projections can be found in, e.g., the USACE Engineering Circular 1165-2-212 (USACE 2011); the 2012 National Research Council re-port (National Research Council (U.S.). 2009); the California Coastal and Ocean Climate Action Team (CO-CAT) report (Cayan et al. 2010) and others (FEMA, PIANC, etc.). For this assessment, the base for future SL projections is obtained from the EC 1165-2-212 document, the CO-CAT report and elements from the original Vermeer and Rahmstorf paper (Vermeer and Rahmstorf 2009).
The impact of sea-level rise on the fate of coastal southeast Louisiana has been extensively docu-mented and studied. Therefore, to maximize efficiency and minimize any redundancy, the purpose of this section is to offer a summarized list of long-term trends that capture the fundamental design con-straints posed by sea-level rise onto future shoreline infrastructure improvement measures, in the southeastern region of Louisiana. A more detailed description of potential disruptive mechanisms that may accelerate SLR trends is given in a separate document (Berner 2011).
3.5.1 Sea Level Rise and Coastal Louisiana Although the threat to the Pontchartrain Basin indicated by Figure 3-11 is serious, the 2009 assump-tion of a 3 ft (0.9m) RSLR by 2100 made by (Blum and Roberts 2009) is non-conservative with re-gard to the storm surge threat to the Pontchartrain Basin, based on information available until June 2011.
Figure 3-11 indicates how much of the Louisiana coastal areas are at risk of flooding from sea level rise. Several sections of this report make use of the updated values provided in this section.

New Orleans East Land Bridge Study
Revised: 12/18/2012
55
.
Figure 3-11 Sea level risk on the southeast Louisiana coast. Dark red areas indicate zones highly susceptible of flooding under a sea level rise scenario.
3.5.2 Historical Trend The monthly mean MSL values from the Bay Waveland can be used to determine an approximate historical rate of sea level rise. The data quality is less than that at nearby Grande Isle, LA, where it was established by NOAA that the apparent rate of sea level rise is 9.24 ± 0.59 mm/year – a rate that is well above the current global mean, as measured from satellite observations, which reads 2.5 mm/year.
The rate observed at the nearby NOAA Bay Waveland tidal gauge reads 3.28 ± 1.28 mm/year, as shown in Figure 3-12. This highlights the concept of relative sea-level rise (RSLR), which must in-corporate land subsidence and in some instances land up-thrust in addition to a change in the eustatic sea-level.
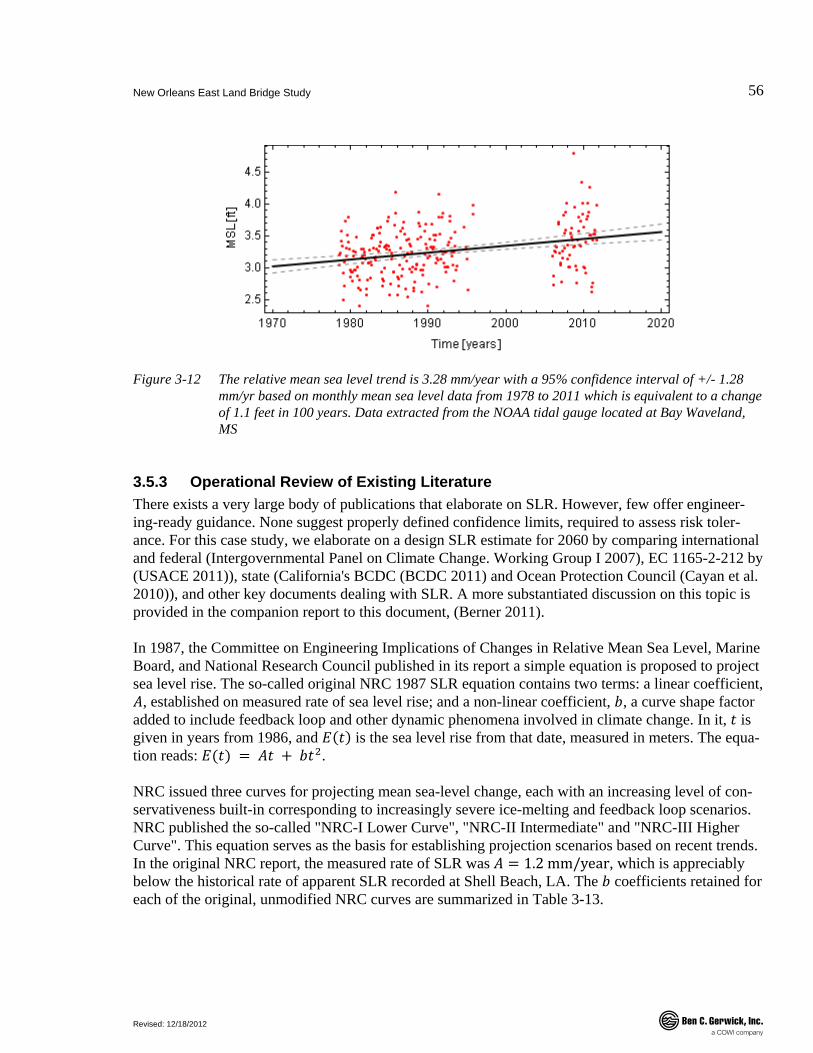
New Orleans East Land Bridge Study
Revised: 12/18/2012
56
.
Figure 3-12 The relative mean sea level trend is 3.28 mm/year with a 95% confidence interval of +/- 1.28 mm/yr based on monthly mean sea level data from 1978 to 2011 which is equivalent to a change of 1.1 feet in 100 years. Data extracted from the NOAA tidal gauge located at Bay Waveland, MS
3.5.3 Operational Review of Existing Literature There exists a very large body of publications that elaborate on SLR. However, few offer engineer-ing-ready guidance. None suggest properly defined confidence limits, required to assess risk toler-ance. For this case study, we elaborate on a design SLR estimate for 2060 by comparing international and federal (Intergovernmental Panel on Climate Change. Working Group I 2007), EC 1165-2-212 by (USACE 2011)), state (California's BCDC (BCDC 2011) and Ocean Protection Council (Cayan et al. 2010)), and other key documents dealing with SLR. A more substantiated discussion on this topic is provided in the companion report to this document, (Berner 2011).
In 1987, the Committee on Engineering Implications of Changes in Relative Mean Sea Level, Marine Board, and National Research Council published in its report a simple equation is proposed to project sea level rise. The so-called original NRC 1987 SLR equation contains two terms: a linear coefficient, 𝐴, established on measured rate of sea level rise; and a non-linear coefficient, 𝑏, a curve shape factor added to include feedback loop and other dynamic phenomena involved in climate change. In it, 𝑡 is given in years from 1986, and 𝐸(𝑡) is the sea level rise from that date, measured in meters. The equa-tion reads: 𝐸(𝑡) = 𝐴𝑡 + 𝑏𝑡�.
NRC issued three curves for projecting mean sea-level change, each with an increasing level of con-servativeness built-in corresponding to increasingly severe ice-melting and feedback loop scenarios. NRC published the so-called "NRC-I Lower Curve", "NRC-II Intermediate" and "NRC-III Higher Curve". This equation serves as the basis for establishing projection scenarios based on recent trends. In the original NRC report, the measured rate of SLR was 𝐴 = 1.2 mm/year, which is appreciably below the historical rate of apparent SLR recorded at Shell Beach, LA. The 𝑏 coefficients retained for each of the original, unmodified NRC curves are summarized in Table 3-13.

New Orleans East Land Bridge Study
Revised: 12/18/2012
57
.
Table 3-13 Original curve shape coefficients, NRC (1987).
Curve shape coefficient NRC-I NRC-II NRC-III
b 2.80E-05 6.60E-05 1.05E-4
EC Curves In the latest engineering circular (USACE 2011) - see before that (Dornstauder 2009; Knuuti 2002; USACE 2009) - the USACE proposes to update SLR projections based on a revised version for the linear sea level rise, however the long term trends were not appreciably different than those set by NRC: essentially, the measured rate of SLR was adjusted to reflect more recent findings, so that 𝐴 = 1.7 mm/year. Table 3-14 lists the new, 2011 curve shape coefficients, indicating an appreciable reduction in the shape factors for the EC projection model. Regardless, the long-term projections are generally in good agreement with those of NRC. The 2009 values are indicated for comparison only.
Table 3-14 Curve shape coefficients for long-term sea-level trend projections, per (USACE 2011).
Year of issue Curve shape coef-ficient
NRC-I (modified) NRC-II (modified) NRC-III (modified)
2009 b 2.36 E-05 6.20 E-05 10.1 E-05
2011 b 2.71 E-05 7.00 E-05 11.3 E-05
3.5.4 SLR Projections The next step consists in devising a judicious value for future SLR projections. A large number of models have been proposed to estimate future projections. However, the now well-accepted Vermeer and Rahmstorf paper (Vermeer and Rahmstorf 2009; Rahmstorf, Perrette, and Vermeer 2011) offers a rather elegant method to project future SLR by postulating that the change in mean sea level varies with the global mean temperature. The model proposes that the rate of sea-level varies as follows:
𝑑𝐻/𝑑𝑡~𝐹(𝑇) + 𝐺(𝑑𝑇 𝑑𝑡⁄ )
Here, 𝑇 is the global mean temperature. The basis of such a model is that while 𝑇 is captured well by global climate models, while 𝐻 is generally not. A major (and recognized) caveat to the VR's method is that it is inherently unable to capture catastrophic (rapid and/or non-linear) changes in sea level change mechanisms — for instance, ice sheet collapse (Schodlok et al. 2012), rapid ice melting (Hu et al. 2009), methane hydrates release (Anthony 2009), and others. Provisions for contingency can be implemented through the use of confidence limits, as explained below.
The clear advantage of their results over those suggested by the USACE is the addition of confidence bands, which is absent from most technical reports, in an explicit form. While the State of California has recommended the consideration of so-called Lower, Medium and Higher projections, as seen in

New Orleans East Land Bridge Study
Revised: 12/18/2012
58
.
Figure 3-13, no confidence bands are explicitly indicated; nor is a probability of occurrence of each SLR outcome.
The mid-range Vermeer and Rahmstorf (VR) curve may be approximated in a manner consistent with that used by the original NRC publication (Committee on Engineering Implications of Changes in Relative Mean Sea Level 1987), whereby for the solid blue line of Figure 3-13, lower graph, a fit reads, in SI units [meter]: 𝐻(𝑡) = 1.9 × 10�� ⋅ 𝑡 + 0.78 × 10�� ⋅ 𝑡�. According to calculations, 𝑡 is the difference between a given date and 1992. The curves lies above both the modified NRC-I and -II proposed in the most recent EC guidance (USACE 2011).
Figure 3-13 (upper) From State of California SLR Task Force (Cayan et al. 2010). SLR projections are de-rived from the work by Vermeer and Rahmstorf publication (Vermeer and Rahmstorf 2009); modified here to reflect 1990 as baseline (adjusted by -3.4cm, see original report); (lower) Original Vermeer and Rahmstorf curve with 1990 as baseline with EC curves and historic SLR trends recorded from the Bay Waveland, MS gauge.
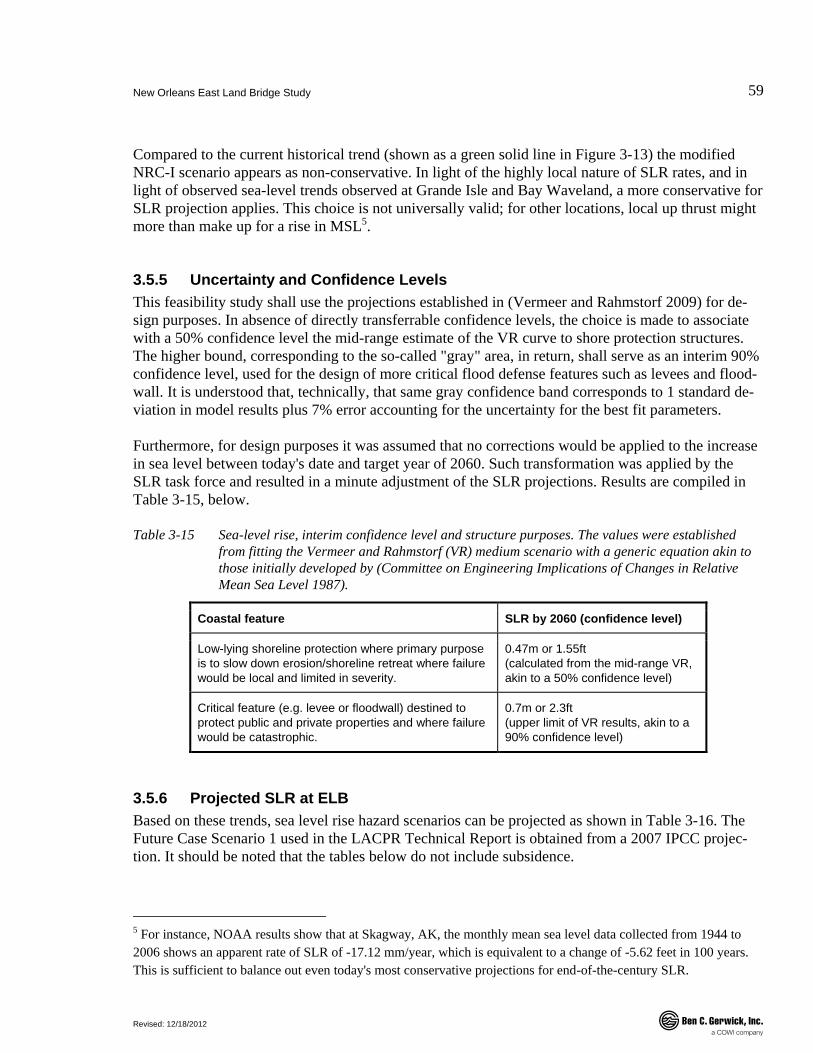
New Orleans East Land Bridge Study
Revised: 12/18/2012
59
.
Compared to the current historical trend (shown as a green solid line in Figure 3-13) the modified NRC-I scenario appears as non-conservative. In light of the highly local nature of SLR rates, and in light of observed sea-level trends observed at Grande Isle and Bay Waveland, a more conservative for SLR projection applies. This choice is not universally valid; for other locations, local up thrust might more than make up for a rise in MSL5.
3.5.5 Uncertainty and Confidence Levels This feasibility study shall use the projections established in (Vermeer and Rahmstorf 2009) for de-sign purposes. In absence of directly transferrable confidence levels, the choice is made to associate with a 50% confidence level the mid-range estimate of the VR curve to shore protection structures. The higher bound, corresponding to the so-called "gray" area, in return, shall serve as an interim 90% confidence level, used for the design of more critical flood defense features such as levees and flood-wall. It is understood that, technically, that same gray confidence band corresponds to 1 standard de-viation in model results plus 7% error accounting for the uncertainty for the best fit parameters.
Furthermore, for design purposes it was assumed that no corrections would be applied to the increase in sea level between today's date and target year of 2060. Such transformation was applied by the SLR task force and resulted in a minute adjustment of the SLR projections. Results are compiled in Table 3-15, below.
Table 3-15 Sea-level rise, interim confidence level and structure purposes. The values were established from fitting the Vermeer and Rahmstorf (VR) medium scenario with a generic equation akin to those initially developed by (Committee on Engineering Implications of Changes in Relative Mean Sea Level 1987).
Coastal feature SLR by 2060 (confidence level)
Low-lying shoreline protection where primary purpose is to slow down erosion/shoreline retreat where failure would be local and limited in severity.
0.47m or 1.55ft (calculated from the mid-range VR, akin to a 50% confidence level)
Critical feature (e.g. levee or floodwall) destined to protect public and private properties and where failure would be catastrophic.
0.7m or 2.3ft (upper limit of VR results, akin to a 90% confidence level)
3.5.6 Projected SLR at ELB Based on these trends, sea level rise hazard scenarios can be projected as shown in Table 3-16. The Future Case Scenario 1 used in the LACPR Technical Report is obtained from a 2007 IPCC projec-tion. It should be noted that the tables below do not include subsidence.
5 For instance, NOAA results show that at Skagway, AK, the monthly mean sea level data collected from 1944 to 2006 shows an apparent rate of SLR of -17.12 mm/year, which is equivalent to a change of -5.62 feet in 100 years. This is sufficient to balance out even today's most conservative projections for end-of-the-century SLR.
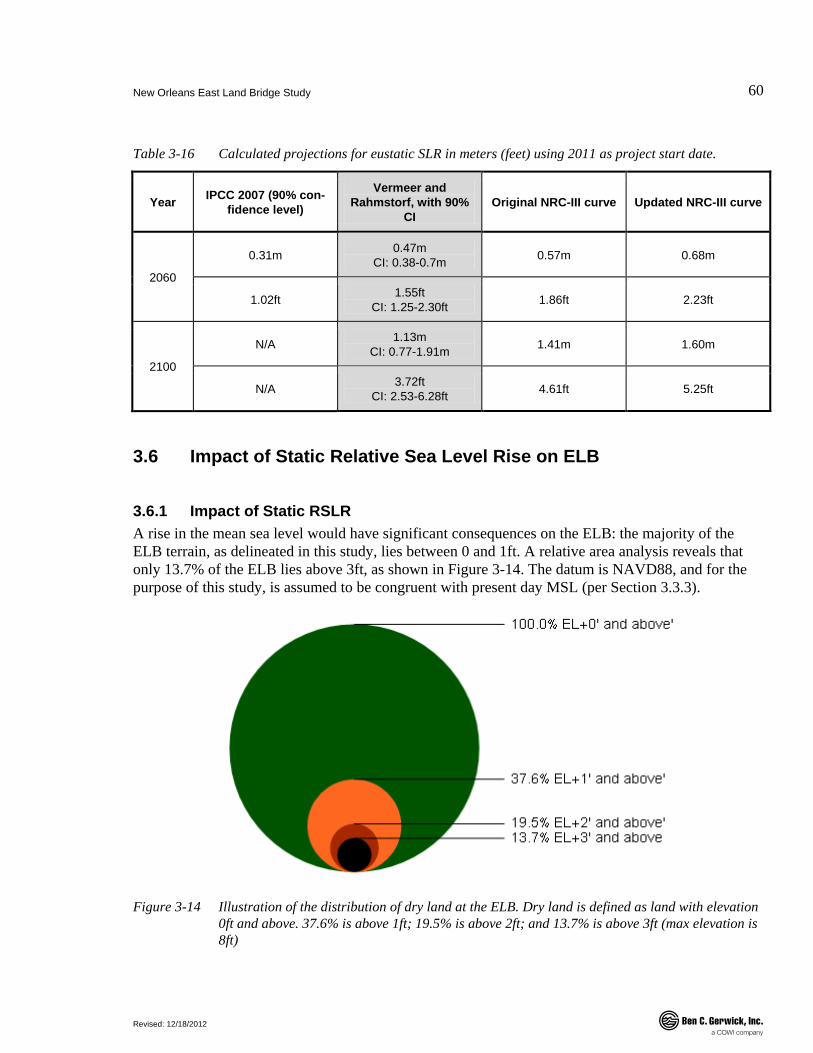
New Orleans East Land Bridge Study
Revised: 12/18/2012
60
.
Table 3-16 Calculated projections for eustatic SLR in meters (feet) using 2011 as project start date.
Year IPCC 2007 (90% con-fidence level)
Vermeer and Rahmstorf, with 90%
CI Original NRC-III curve Updated NRC-III curve
2060
0.31m 0.47m CI: 0.38-0.7m 0.57m 0.68m
1.02ft 1.55ft CI: 1.25-2.30ft 1.86ft 2.23ft
2100
N/A 1.13m CI: 0.77-1.91m 1.41m 1.60m
N/A 3.72ft CI: 2.53-6.28ft 4.61ft 5.25ft
3.6 Impact of Static Relative Sea Level Rise on ELB
3.6.1 Impact of Static RSLR A rise in the mean sea level would have significant consequences on the ELB: the majority of the ELB terrain, as delineated in this study, lies between 0 and 1ft. A relative area analysis reveals that only 13.7% of the ELB lies above 3ft, as shown in Figure 3-14. The datum is NAVD88, and for the purpose of this study, is assumed to be congruent with present day MSL (per Section 3.3.3).
Figure 3-14 Illustration of the distribution of dry land at the ELB. Dry land is defined as land with elevation 0ft and above. 37.6% is above 1ft; 19.5% is above 2ft; and 13.7% is above 3ft (max elevation is 8ft)
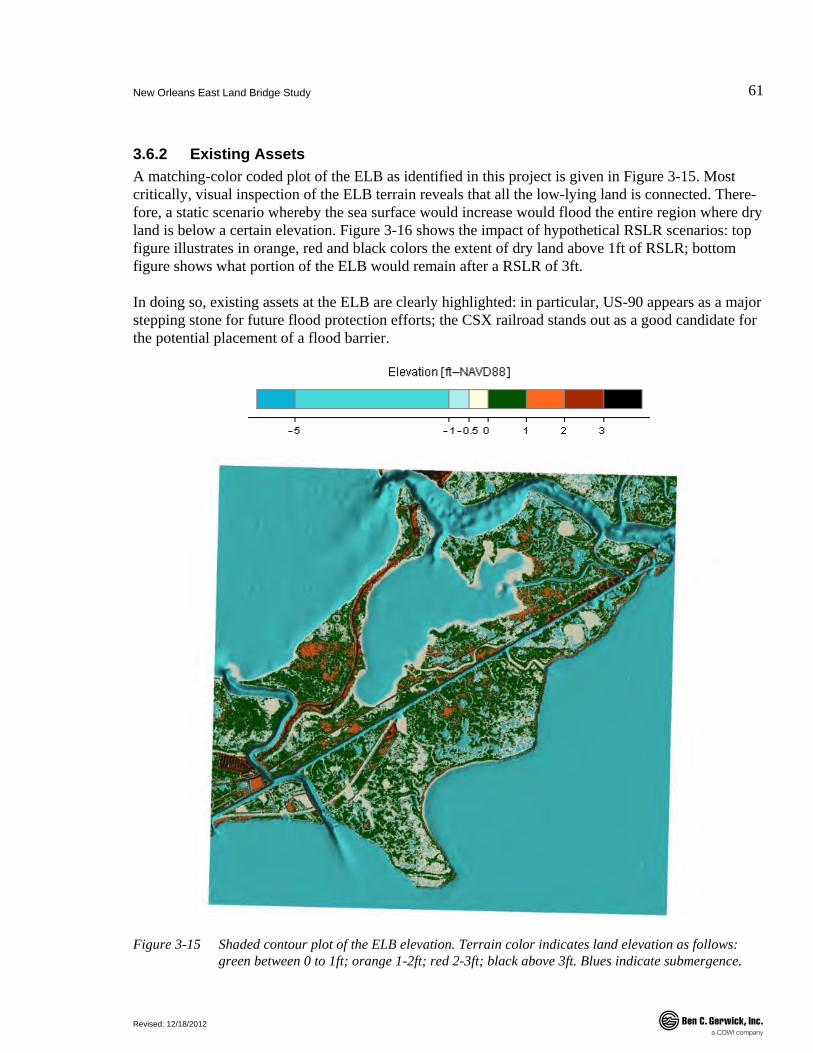
New Orleans East Land Bridge Study
Revised: 12/18/2012
61
.
3.6.2 Existing Assets A matching-color coded plot of the ELB as identified in this project is given in Figure 3-15. Most critically, visual inspection of the ELB terrain reveals that all the low-lying land is connected. There-fore, a static scenario whereby the sea surface would increase would flood the entire region where dry land is below a certain elevation. Figure 3-16 shows the impact of hypothetical RSLR scenarios: top figure illustrates in orange, red and black colors the extent of dry land above 1ft of RSLR; bottom figure shows what portion of the ELB would remain after a RSLR of 3ft.
In doing so, existing assets at the ELB are clearly highlighted: in particular, US-90 appears as a major stepping stone for future flood protection efforts; the CSX railroad stands out as a good candidate for the potential placement of a flood barrier.
Figure 3-15 Shaded contour plot of the ELB elevation. Terrain color indicates land elevation as follows: green between 0 to 1ft; orange 1-2ft; red 2-3ft; black above 3ft. Blues indicate submergence.

New Orleans East Land Bridge Study
Revised: 12/18/2012
62
.
Figure 3-16 (upper) Residual dry land at ELB assuming a +1ft RSLR; (lower) same as top figure, assuming a RSLR of +3ft. For the latter the remaining above-water surface area does not exceed 14% of the original dry surface area. Blue-colored patches indicate submerged areas.
New Orleans East Land Bridge Study
Revised: 12/18/2012
63
.
3.6.3 Summary and Consequences for this Study The plots above reveal that the whole region delineated in this project is highly vulnerable to even relatively small permanent variations in the relative MSL. In fact, the combined action of waves in conjunction with an appreciable rise in sea level would likely accelerate marshland loss and coastline recess. Part of this vulnerability assessment is needed to establish relevant objectives in terms of pro-tecting against shoreline retreat and protecting heavily populated areas against storm surge. If the global accelerating trend in sea level rise continues unabated, the possibility of a complete disappear-ance of large patches of wetlands and marshland around the ELB becomes a plausible scenario.
In light of this, a mitigation and resiliency plan should emphasize an approach where the main objec-tives are prioritized in an effort to strike a balance between shoreline preservation (using low-lying armored berms and other rock-based structures) and flood risk reduction, through the use of high-crested flood control structures. The plan should also seek to leverage any pre-existing assets: here, it is the railroad that traces across the ELB and along GIWW, standing at over 6ft (1.83m) on average and clearly visible in Figure 3-16 (upper).
3.7 Historical and Projected Shoreline Change
3.7.1 Shoreline Change Regional Change In their report, (Blum and Roberts 2009) predicted the potential for the loss of an additional 5,200 square miles (13,468 square kilometers) of Louisiana coastal area by 2100 assuming a 3-ft (0.9-m) RSLR over that period. If these trends are pursued, Figure 3-17 clearly indicates that using conserva-tive 2009 estimates of sea level rise and erosion that the Eastern Land Bridge will be largely sub-merged and that the integrity of the Pontchartrain Basin will be threatened.
The historical loss of approximately 2,400 square miles (6216 square kilometers) of Louisiana coastal lands since that time (due to both erosion and somewhat over 8-inches (20-cm) of RSLR), has signifi-cantly increased the exposure of the greater New Orleans area to hurricane storm surge. (Blum and Roberts 2009).

New Orleans East Land Bridge Study
Revised: 12/18/2012
64
.
Figure 3-17 Potential Loss of Louisiana Coast Area from Present to 2100 (Blum and Roberts 2009).
3.7.2 Marshland Loss Erosion Rate and Marshland Loss The ELB spans 45,638 acres of almost entirely brackish marsh within Orleans Parish. The primary causes of land loss are shoreline erosion and direct removal. In addition, the hydrology of the ELB was altered by the construction of the GIWW and the Lake Pontchartrain Hurricane Protection Levee, which forms the eastern border of the area. According to a report from the USGS (Penland et al. 2002), the most current marsh loss rate is approximately 350 acres per year. The same reference states that by 2050, a further 3,550 acres or 14 % of the 1990 is expected to be lost.
Table 3-17 Marsh loss rate, measured and projected. From (Penland et al. 2002).
Area Marsh Acres 1932
Marsh Acres 1990
Projected Marsh Acres 2050
% Marsh Lost 1932 - 1990
% Marsh Lost 1990 - 2050
ELB 30,930 25,460 21,910 17.6 14.0

New Orleans East Land Bridge Study
Revised: 12/18/2012
65
.
Visual Observations of Shoreline Erosion USGS/NOAA aerial photos from 1980 and 2008 were used to visually identify critical areas at the ELB. Figure 3-18 reveals three critical locations suffering from significant erosion and/or marsh loss. The most significant areas of degradation occur west of the Alligator Bend, where larger water bod-ies can be seen where vegetation used to stand; at Petites Coquilles, coastal erosion is observed on both sides of the island; and somewhat larger interior marsh features are now visible near GIWW on the East end of the ELB. These locations are indicated by the red arrows shown on the same Figure.
Table 3-18 Summary of observed shoreline/marshland changes at ELB, 1980-present day.
Location Observed changes
Petites Coquilles Visible signs of shoreline erosion on the south side of US-90
East of Unknown Pass New interior water bodies have replaced elevated vege-tative cover.
Alligator Bend, interior area Larger water bodies in lieu of vegetative cover.
Figure 3-18 Comparison of ELB aerial photographs, spanning approximately 30 years (1980-2011). Note that useful comparative visual data covering the west end of the ELB is not available. Source: Google Earth compiled from USGS and NOAA data.
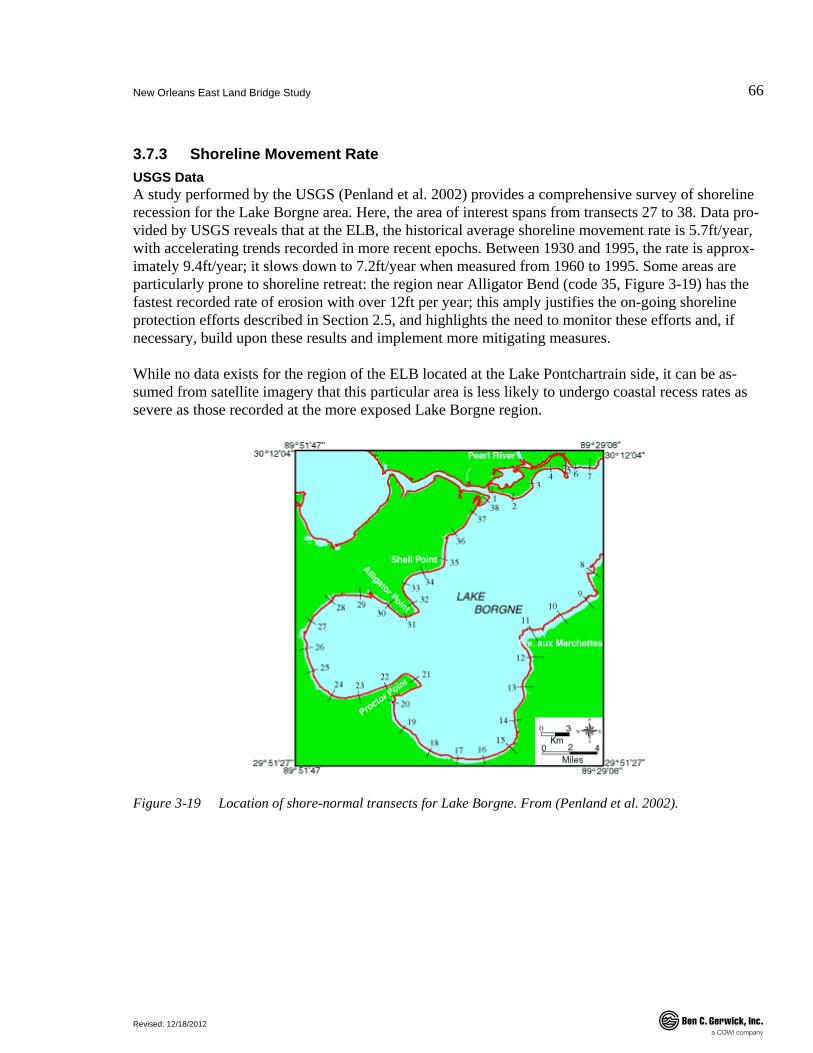
New Orleans East Land Bridge Study
Revised: 12/18/2012
66
.
3.7.3 Shoreline Movement Rate USGS Data A study performed by the USGS (Penland et al. 2002) provides a comprehensive survey of shoreline recession for the Lake Borgne area. Here, the area of interest spans from transects 27 to 38. Data pro-vided by USGS reveals that at the ELB, the historical average shoreline movement rate is 5.7ft/year, with accelerating trends recorded in more recent epochs. Between 1930 and 1995, the rate is approx-imately 9.4ft/year; it slows down to 7.2ft/year when measured from 1960 to 1995. Some areas are particularly prone to shoreline retreat: the region near Alligator Bend (code 35, Figure 3-19) has the fastest recorded rate of erosion with over 12ft per year; this amply justifies the on-going shoreline protection efforts described in Section 2.5, and highlights the need to monitor these efforts and, if necessary, build upon these results and implement more mitigating measures.
While no data exists for the region of the ELB located at the Lake Pontchartrain side, it can be as-sumed from satellite imagery that this particular area is less likely to undergo coastal recess rates as severe as those recorded at the more exposed Lake Borgne region.
Figure 3-19 Location of shore-normal transects for Lake Borgne. From (Penland et al. 2002).
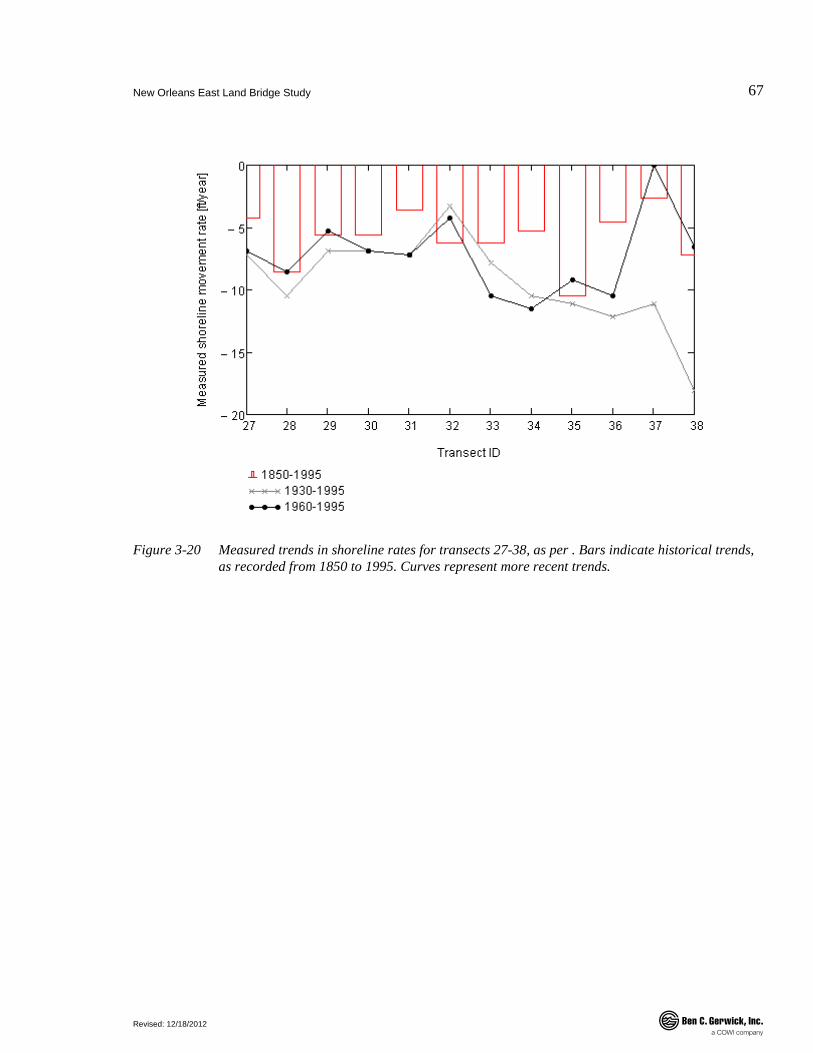
New Orleans East Land Bridge Study
Revised: 12/18/2012
67
.
Figure 3-20 Measured trends in shoreline rates for transects 27-38, as per . Bars indicate historical trends, as recorded from 1850 to 1995. Curves represent more recent trends.

New Orleans East Land Bridge Study
Revised: 12/18/2012
68
.
Table 3-19 Measured change of shoreline position (m) along Lake Borgne for three time intervals and4 the corresponding shoreline movement rate (m/yr) for each transect.
Transect 1850-1995 Rate (m/yr) 1930-1995 Rate
(m/yr) 1960-1995 Rate (m/yr)
27 -185 -1.3 -146 -2.2 -73 -2.1
28 -379 -2.6 -209 -3.2 -92 -2.6
29 -250 -1.7 -138 -2.1 -55 -1.6
30 -244 -1.7 -139 -2.1 -74 -2.1
31 -158 -1.1 -142 -2.2 -78 -2.2
32 -274 -1.9 -68 -1.0 -47 -1.3
33 -277 -1.9 -158 -2.4 -111 -3.2
34 -238 -1.6 -206 -3.2 -122 -3.5
35 -461 -3.2 -223 -3.4 -97 -2.8
36 -203 -1.4 -239 -3.7 -112 -3.2
37 -120 -0.8 -223 -3.4 0 0.0
38 -318 -2.2 -357 -5.5 -69 -2.0
Estimated Retreat by 2060 Assuming an average rate of shoreline retreat of 10ft/year, over 50 years the coast will have receded by 500ft (1000ft within 100 years). This estimate is valid for the shoreline located at the Lake Borgne region.
3.7.4 Projected Trends Slope Profile In an effort to provide adequate design for any tentative foreshore protection and revetment, perpen-dicular sections to the foreshore profile are extracted, as shown in Figure 3-21. The extraction process begins at LPV-111 and ends at Rigolets passes.
The cross sections are stacked against each other linearly. Each captures the cross-section of a seg-ment of the ELB foreshore. A cross section is approximately centered on the shore and extends ap-proximately 800ft. In total, about 100 cross sections are extracted. In Figure 3-22, each profile is plot-ted linearly.
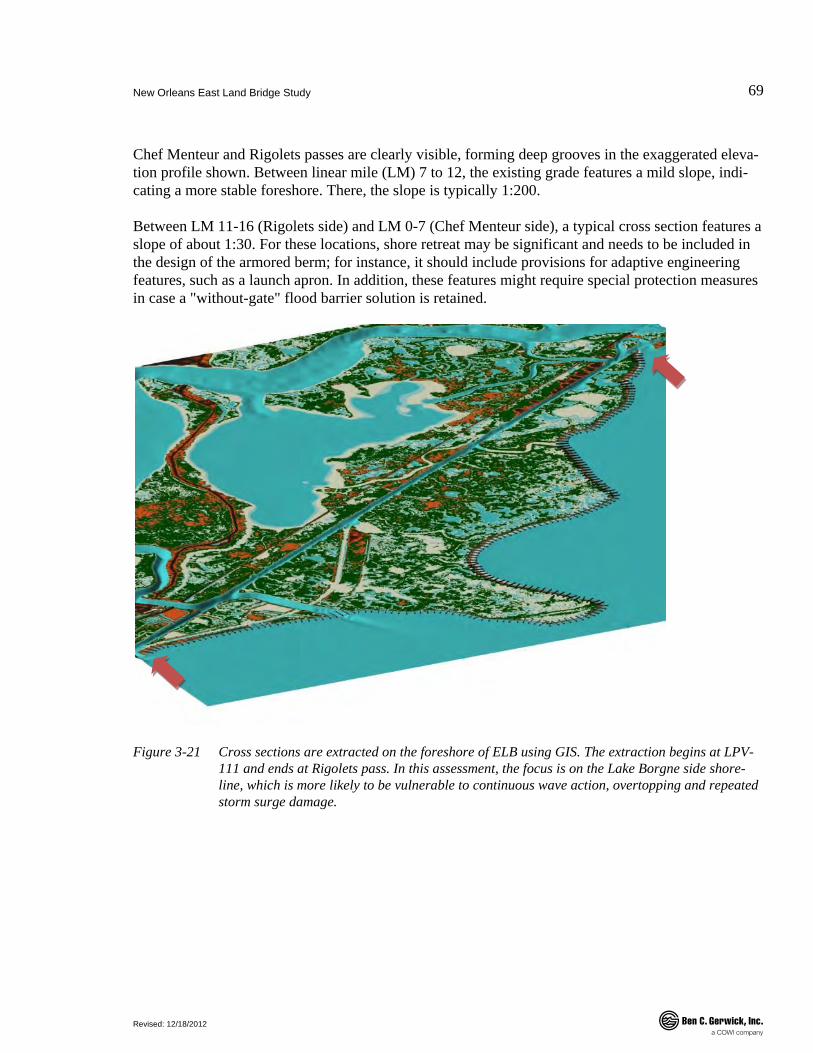
New Orleans East Land Bridge Study
Revised: 12/18/2012
69
.
Chef Menteur and Rigolets passes are clearly visible, forming deep grooves in the exaggerated eleva-tion profile shown. Between linear mile (LM) 7 to 12, the existing grade features a mild slope, indi-cating a more stable foreshore. There, the slope is typically 1:200.
Between LM 11-16 (Rigolets side) and LM 0-7 (Chef Menteur side), a typical cross section features a slope of about 1:30. For these locations, shore retreat may be significant and needs to be included in the design of the armored berm; for instance, it should include provisions for adaptive engineering features, such as a launch apron. In addition, these features might require special protection measures in case a "without-gate" flood barrier solution is retained.
Figure 3-21 Cross sections are extracted on the foreshore of ELB using GIS. The extraction begins at LPV-111 and ends at Rigolets pass. In this assessment, the focus is on the Lake Borgne side shore-line, which is more likely to be vulnerable to continuous wave action, overtopping and repeated storm surge damage.
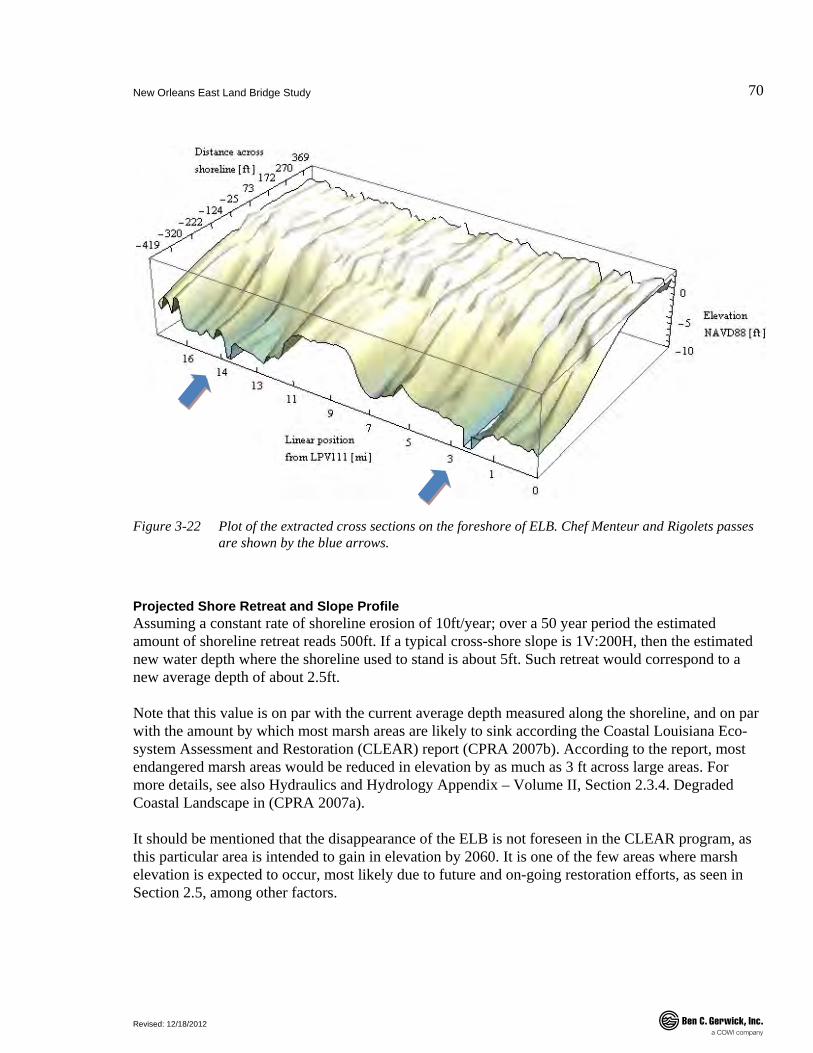
New Orleans East Land Bridge Study
Revised: 12/18/2012
70
.
Figure 3-22 Plot of the extracted cross sections on the foreshore of ELB. Chef Menteur and Rigolets passes are shown by the blue arrows.
Projected Shore Retreat and Slope Profile Assuming a constant rate of shoreline erosion of 10ft/year; over a 50 year period the estimated amount of shoreline retreat reads 500ft. If a typical cross-shore slope is 1V:200H, then the estimated new water depth where the shoreline used to stand is about 5ft. Such retreat would correspond to a new average depth of about 2.5ft.
Note that this value is on par with the current average depth measured along the shoreline, and on par with the amount by which most marsh areas are likely to sink according the Coastal Louisiana Eco-system Assessment and Restoration (CLEAR) report (CPRA 2007b). According to the report, most endangered marsh areas would be reduced in elevation by as much as 3 ft across large areas. For more details, see also Hydraulics and Hydrology Appendix – Volume II, Section 2.3.4. Degraded Coastal Landscape in (CPRA 2007a).
It should be mentioned that the disappearance of the ELB is not foreseen in the CLEAR program, as this particular area is intended to gain in elevation by 2060. It is one of the few areas where marsh elevation is expected to occur, most likely due to future and on-going restoration efforts, as seen in Section 2.5, among other factors.
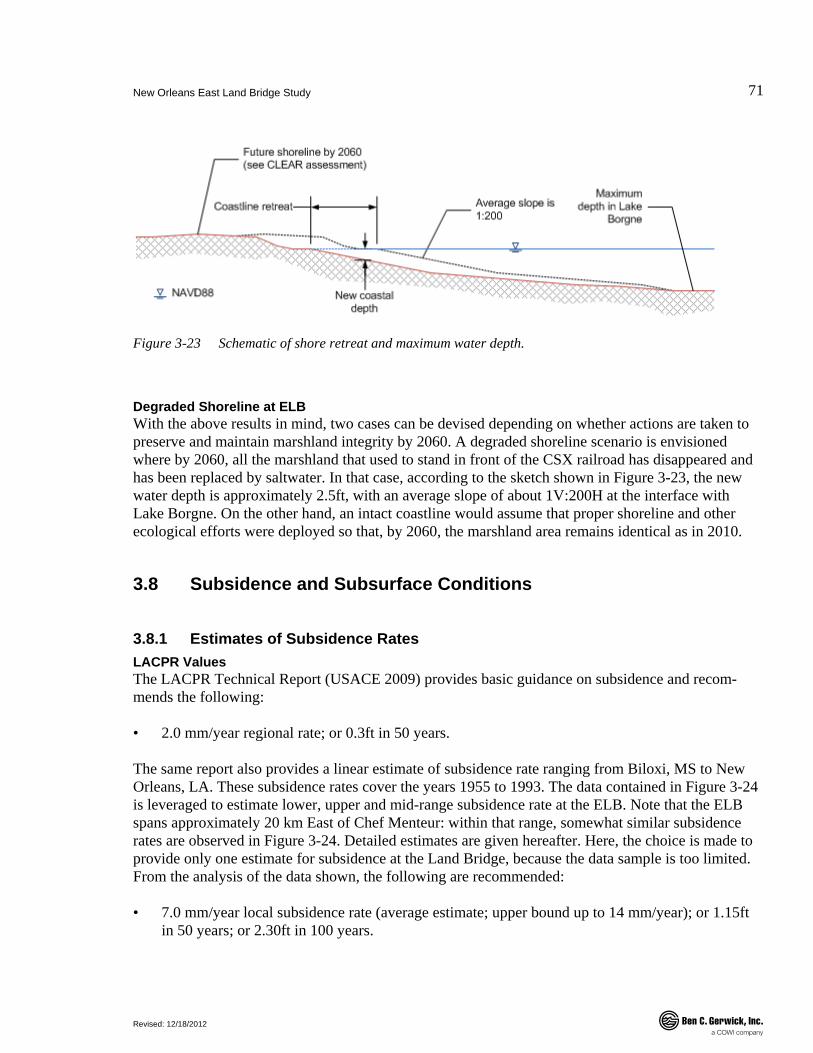
New Orleans East Land Bridge Study
Revised: 12/18/2012
71
.
Figure 3-23 Schematic of shore retreat and maximum water depth.
Degraded Shoreline at ELB With the above results in mind, two cases can be devised depending on whether actions are taken to preserve and maintain marshland integrity by 2060. A degraded shoreline scenario is envisioned where by 2060, all the marshland that used to stand in front of the CSX railroad has disappeared and has been replaced by saltwater. In that case, according to the sketch shown in Figure 3-23, the new water depth is approximately 2.5ft, with an average slope of about 1V:200H at the interface with Lake Borgne. On the other hand, an intact coastline would assume that proper shoreline and other ecological efforts were deployed so that, by 2060, the marshland area remains identical as in 2010.
3.8 Subsidence and Subsurface Conditions
3.8.1 Estimates of Subsidence Rates LACPR Values The LACPR Technical Report (USACE 2009) provides basic guidance on subsidence and recom-mends the following:
• 2.0 mm/year regional rate; or 0.3ft in 50 years.
The same report also provides a linear estimate of subsidence rate ranging from Biloxi, MS to New Orleans, LA. These subsidence rates cover the years 1955 to 1993. The data contained in Figure 3-24 is leveraged to estimate lower, upper and mid-range subsidence rate at the ELB. Note that the ELB spans approximately 20 km East of Chef Menteur: within that range, somewhat similar subsidence rates are observed in Figure 3-24. Detailed estimates are given hereafter. Here, the choice is made to provide only one estimate for subsidence at the Land Bridge, because the data sample is too limited. From the analysis of the data shown, the following are recommended:
• 7.0 mm/year local subsidence rate (average estimate; upper bound up to 14 mm/year); or 1.15ft in 50 years; or 2.30ft in 100 years.
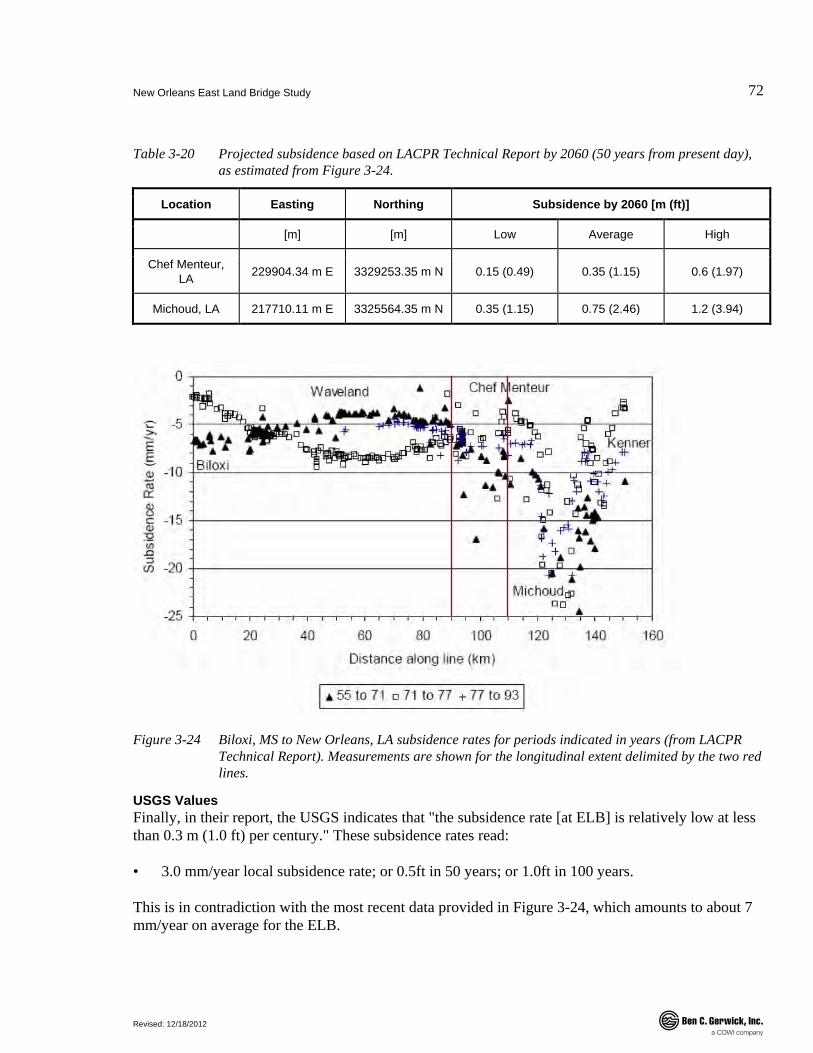
New Orleans East Land Bridge Study
Revised: 12/18/2012
72
.
Table 3-20 Projected subsidence based on LACPR Technical Report by 2060 (50 years from present day), as estimated from Figure 3-24.
Location Easting Northing Subsidence by 2060 [m (ft)]
[m] [m] Low Average High
Chef Menteur, LA 229904.34 m E 3329253.35 m N 0.15 (0.49) 0.35 (1.15) 0.6 (1.97)
Michoud, LA 217710.11 m E 3325564.35 m N 0.35 (1.15) 0.75 (2.46) 1.2 (3.94)
Figure 3-24 Biloxi, MS to New Orleans, LA subsidence rates for periods indicated in years (from LACPR Technical Report). Measurements are shown for the longitudinal extent delimited by the two red lines.
USGS Values Finally, in their report, the USGS indicates that "the subsidence rate [at ELB] is relatively low at less than 0.3 m (1.0 ft) per century." These subsidence rates read:
• 3.0 mm/year local subsidence rate; or 0.5ft in 50 years; or 1.0ft in 100 years.
This is in contradiction with the most recent data provided in Figure 3-24, which amounts to about 7 mm/year on average for the ELB.

New Orleans East Land Bridge Study
Revised: 12/18/2012
73
.
3.8.2 Design Subsidence Rate According to the various studies published to this day, the recommended subsidence rate retained in this study is taken as that projected by the USGS. It amounts to about 0.5ft of subsidence in 50 years (1.0ft in 100 years). This value is slightly more conservative than that retained for design in the LACPR Technical Report. The value reported in the CPRA 2012 Draft Louisiana Master Plan (CPRA 2012) indicates a range of 2-10 mm/year for subsidence rates near the ELB.
Table 3-21 Design subsidence rate at ELB.
Location Subsidence rate [mm/year]
Subsidence over 50 years [m (ft)]
Subsidence over 100 years [m (ft)]
ELB 3.0 0.15 (0.50) 0.30 (1.0)
3.8.3 Subsurface Conditions and Construction Requirements LPV-111 to Alligator Point Generally, soils at the ELB are extremely soft. The following soil information represents 33,981-ft of shoreline in the project area ranging from LPV-111 to Alligator point.
Based on the subsurface conditions as described in (England and Eustis 2008), the soils are very compressible generally consisting of slightly organic clays and peat extending approximately 15-ft to 30-ft below the mud line. These materials are typically underlain by very soft to soft clay, silty clay, and slightly organic clay to the boring termination depth of 40-ft to 60-ft. The soils towards Alligator Point have some layers of firm sand, silty sand and clayey sand, increasing in thickness east of Chef Menteur Pass.
The undrained shear strength and design density profiles for the cohesive deposits, derived from the aforementioned data report and exploration program, are summarized in the Appendix. The recom-mendations for su versus depth are typical of the soft marshy soils in this area.
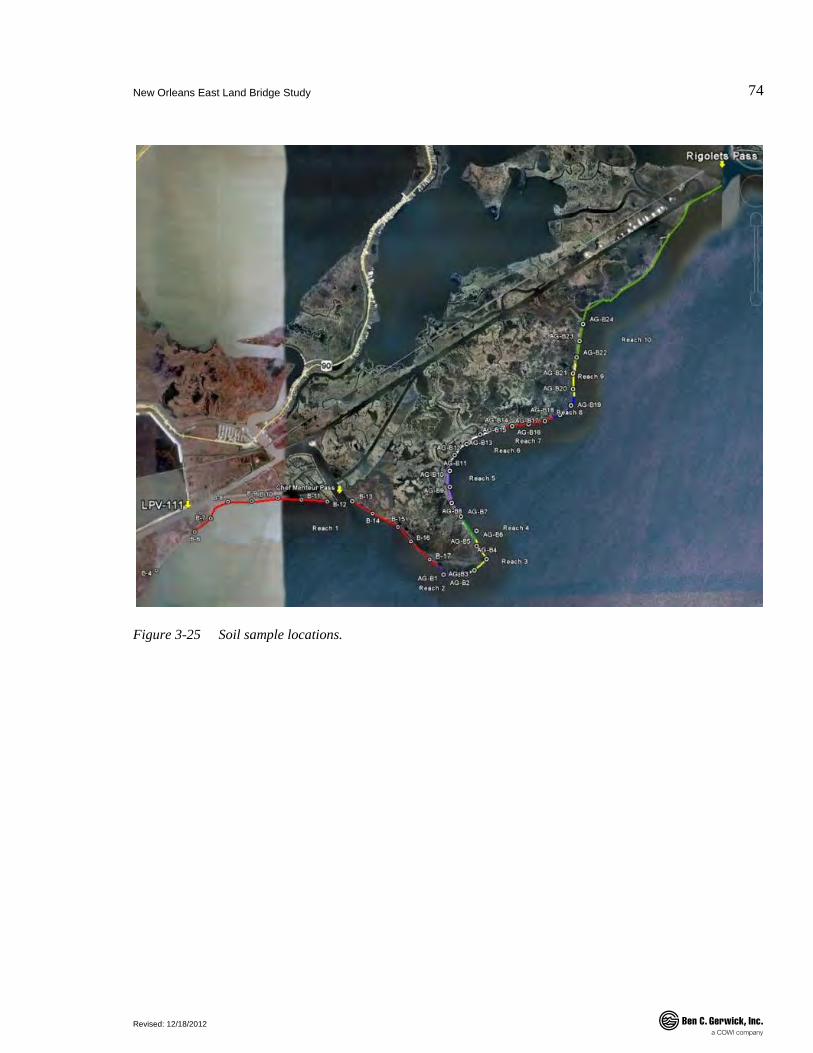
New Orleans East Land Bridge Study
Revised: 12/18/2012
74
.
Figure 3-25 Soil sample locations.
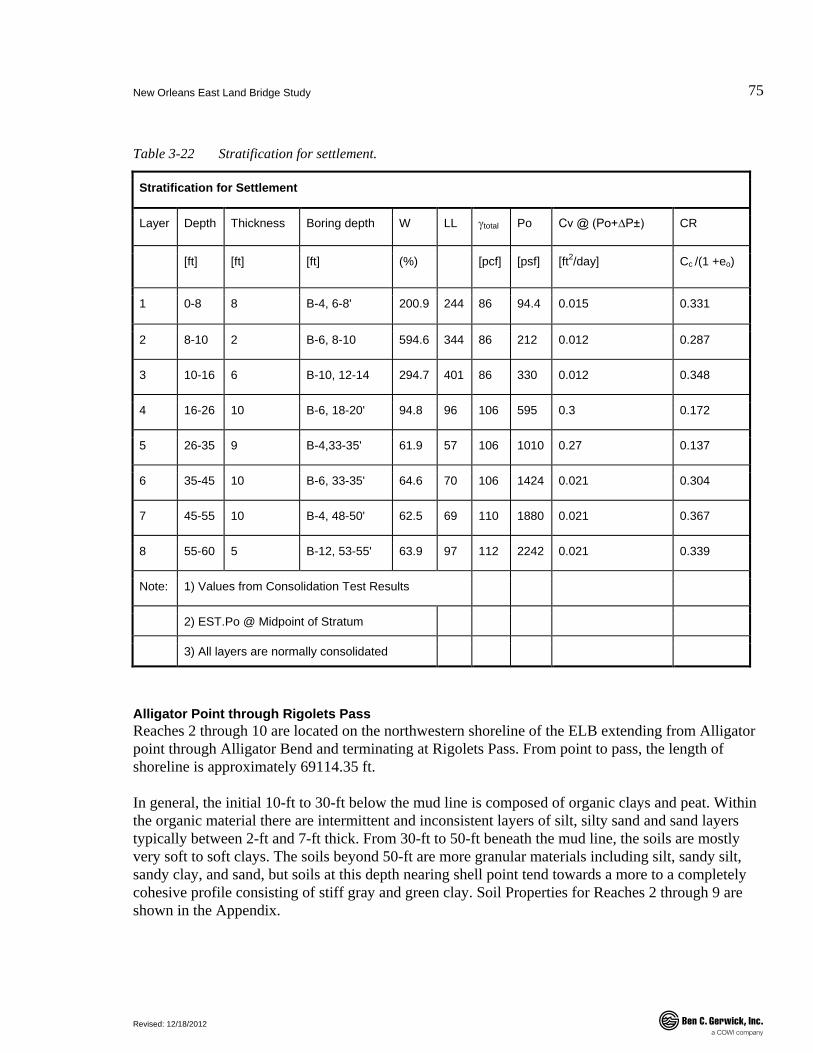
New Orleans East Land Bridge Study
Revised: 12/18/2012
75
.
Table 3-22 Stratification for settlement.
Stratification for Settlement
Layer Depth Thickness Boring depth W LL γtotal Po Cv @ (Po+∆P±) CR
[ft] [ft] [ft] (%) [pcf] [psf] [ft2/day] Cc /(1 +eo)
1 0-8 8 B-4, 6-8' 200.9 244 86 94.4 0.015 0.331
2 8-10 2 B-6, 8-10 594.6 344 86 212 0.012 0.287
3 10-16 6 B-10, 12-14 294.7 401 86 330 0.012 0.348
4 16-26 10 B-6, 18-20' 94.8 96 106 595 0.3 0.172
5 26-35 9 B-4,33-35' 61.9 57 106 1010 0.27 0.137
6 35-45 10 B-6, 33-35' 64.6 70 106 1424 0.021 0.304
7 45-55 10 B-4, 48-50' 62.5 69 110 1880 0.021 0.367
8 55-60 5 B-12, 53-55' 63.9 97 112 2242 0.021 0.339
Note: 1) Values from Consolidation Test Results
2) EST.Po @ Midpoint of Stratum
3) All layers are normally consolidated
Alligator Point through Rigolets Pass Reaches 2 through 10 are located on the northwestern shoreline of the ELB extending from Alligator point through Alligator Bend and terminating at Rigolets Pass. From point to pass, the length of shoreline is approximately 69114.35 ft.
In general, the initial 10-ft to 30-ft below the mud line is composed of organic clays and peat. Within the organic material there are intermittent and inconsistent layers of silt, silty sand and sand layers typically between 2-ft and 7-ft thick. From 30-ft to 50-ft beneath the mud line, the soils are mostly very soft to soft clays. The soils beyond 50-ft are more granular materials including silt, sandy silt, sandy clay, and sand, but soils at this depth nearing shell point tend towards a more to a completely cohesive profile consisting of stiff gray and green clay. Soil Properties for Reaches 2 through 9 are shown in the Appendix.
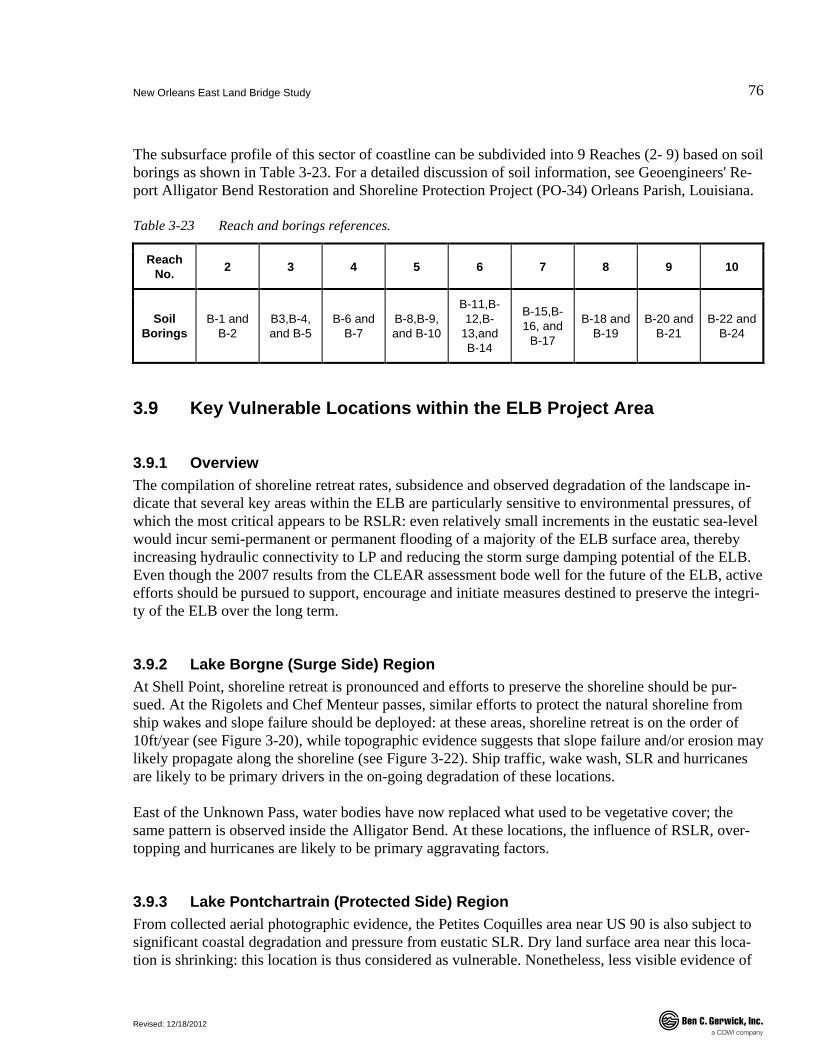
New Orleans East Land Bridge Study
Revised: 12/18/2012
76
.
The subsurface profile of this sector of coastline can be subdivided into 9 Reaches (2- 9) based on soil borings as shown in Table 3-23. For a detailed discussion of soil information, see Geoengineers' Re-port Alligator Bend Restoration and Shoreline Protection Project (PO-34) Orleans Parish, Louisiana.
Table 3-23 Reach and borings references.
Reach No. 2 3 4 5 6 7 8 9 10
Soil Borings
B-1 and B-2
B3,B-4, and B-5
B-6 and B-7
B-8,B-9, and B-10
B-11,B-12,B-
13,and B-14
B-15,B-16, and
B-17
B-18 and B-19
B-20 and B-21
B-22 and B-24
3.9 Key Vulnerable Locations within the ELB Project Area
3.9.1 Overview The compilation of shoreline retreat rates, subsidence and observed degradation of the landscape in-dicate that several key areas within the ELB are particularly sensitive to environmental pressures, of which the most critical appears to be RSLR: even relatively small increments in the eustatic sea-level would incur semi-permanent or permanent flooding of a majority of the ELB surface area, thereby increasing hydraulic connectivity to LP and reducing the storm surge damping potential of the ELB. Even though the 2007 results from the CLEAR assessment bode well for the future of the ELB, active efforts should be pursued to support, encourage and initiate measures destined to preserve the integri-ty of the ELB over the long term.
3.9.2 Lake Borgne (Surge Side) Region At Shell Point, shoreline retreat is pronounced and efforts to preserve the shoreline should be pur-sued. At the Rigolets and Chef Menteur passes, similar efforts to protect the natural shoreline from ship wakes and slope failure should be deployed: at these areas, shoreline retreat is on the order of 10ft/year (see Figure 3-20), while topographic evidence suggests that slope failure and/or erosion may likely propagate along the shoreline (see Figure 3-22). Ship traffic, wake wash, SLR and hurricanes are likely to be primary drivers in the on-going degradation of these locations.
East of the Unknown Pass, water bodies have now replaced what used to be vegetative cover; the same pattern is observed inside the Alligator Bend. At these locations, the influence of RSLR, over-topping and hurricanes are likely to be primary aggravating factors.
3.9.3 Lake Pontchartrain (Protected Side) Region From collected aerial photographic evidence, the Petites Coquilles area near US 90 is also subject to significant coastal degradation and pressure from eustatic SLR. Dry land surface area near this loca-tion is shrinking: this location is thus considered as vulnerable. Nonetheless, less visible evidence of

New Orleans East Land Bridge Study
Revised: 12/18/2012
77
.
degradation is observed because of the relatively sheltered status of this region, as opposed to the Lake Borgne region, which is more vulnerable to the direct impact and erosion due to wave action, overtopping and storm surge damage.
Figure 3-26 Key vulnerable locations within the ELB area, color-coded as follows: orange for marsh degra-dation and pronounced ecological changes; red for observed shoreline retreat. In general, the ELB exhibits more vulnerable spots on the Lake Borgne (surge side) region than on the Lake Pontchartrain (protected side) region, with coastal erosion visible from satellite data near the Petites Coquilles area.
New Orleans East Land Bridge Study
Revised: 12/18/2012
78
.
4 Plan Formulation This section sets the rationale, objectives and constraints needed to establish the basis of a mitigation plan. In formulating the framework and establishing boundary conditions required for the completion of this task, references are made to the USACE ER 1105-2-100 (USACE 2000), which serves as a main guideline for this section.
4.1 Planning Objectives The specific objectives for this feasibility study are directly derived from the Scope of Work. The planning objectives are statements of the study purpose. These objectives are the projections of posi-tive changes to be observed in a without-project future. Here, these objectives would be reached with-in the time horizon defined earlier, i.e., a 50-year time frame beginning in 2012. A majority of the measures described in this section fall within the ELB.
The measures presented in this section seek to attain two primary objectives, and enforce a set of con-straints. The two key objectives for each measure are:
• Objective 1: To reduce flood risk at the LPB by placing a physical flood barrier against storm surge.
• Objective 2: To preserve the integrity and encourage efforts to expand and strengthen the shore-line at the ELB.
4.2 Planning Constraints A constraint is a restriction that limits the extent of the measure planning process. It is a statement of the negative effects the plan should seek to avoid. In general, constraints are designed to avoid unde-sirable changes between future without and future with-project conditions.
Measure planning constraints are conditions, which, if violated by a given measure, will eliminate it or reduce its rating during the evaluation and comparison phase. For this ELB feasibility study, a con-straint designated as "absolute" will result in the elimination of any measure that violates it. A viola-tion of one or more "non-absolute" constraints will reduce the rating of a measure during the screen-ing process.
4.2.1 Absolute Constraints This project comprises the following absolute constraints:
• Do not contradict or otherwise negatively interfere with Master Plan requirements and guide-lines.
• Do not jeopardize existing or future flood reduction system near study area.
New Orleans East Land Bridge Study
Revised: 12/18/2012
79
.
4.2.2 Non-absolute Constraints During the evaluation process, measures that do not avoid or otherwise minimize the following unde-sirable conditions will be penalized. In evaluating each measure, different weighing factors may be assigned to emphasize the need to "avoid" rather than "mitigate" or "minimize" an undesirable condi-tion. In this case, non-absolute constraints are predominantly identified as environmental concerns. In fact, these constraints are addressed in more detail in Section 4.6. Constraints to avoid, minimize or mitigate are as follows:
• Further loss of existing marshes, tidal flats in the study area and reduction in the quality of exist-ing marshes.
• Negative impact on salinity, tidal fluxes and sediment quality within the study area.
• Negative impacts to native species; reduction of total habitat value.
• Negative impacts to existing infrastructure function within the study area.
• Features that reduce or limit future ability to adapt to increased flood risk doe to changing climat-ic conditions in excess of those considered during the evaluation period.
4.3 Planning Criteria The criteria for success defined in this study are formulated as follows and are adapted from (USACE 2000) to the needs of the present feasibility study:
• Completeness: Completeness is a determination whether or not the measure includes all ele-ments necessary to achieve the objectives of the plan. It indicates the inter-dependence of the outputs of the plan upon those of other plans. For instance, measures that would rely on other measures are generally not retained past the initial screening step. However, recommendations can be made for a particular partially incomplete measure to be implemented if it is known or an-ticipated with sufficient confidence that other plans by other entities will be implemented, and will enhance the completeness of the original measure.
• Effectiveness: effectiveness weighs the ability of a given measure to achieve the planning objec-tives. Those that do not contribute, in an unambiguous manner, to achieving these objectives, will be dropped altogether.
• Efficiency: Efficiency measures cost effectiveness and is expressed in estimating the net impact to be obtained from the measure. Benefits can be both monetary and non-monetary. Measure with a very high cost and little or no foreseeable benefits will not be retained; measures that pro-vide moderate benefits but outstanding value per dollar spent will be considered.
• Acceptability: Acceptability is all-encompassing metric that seeks to define whether the measure or plan is sound technically, environmentally, economically and socially. For instance, some
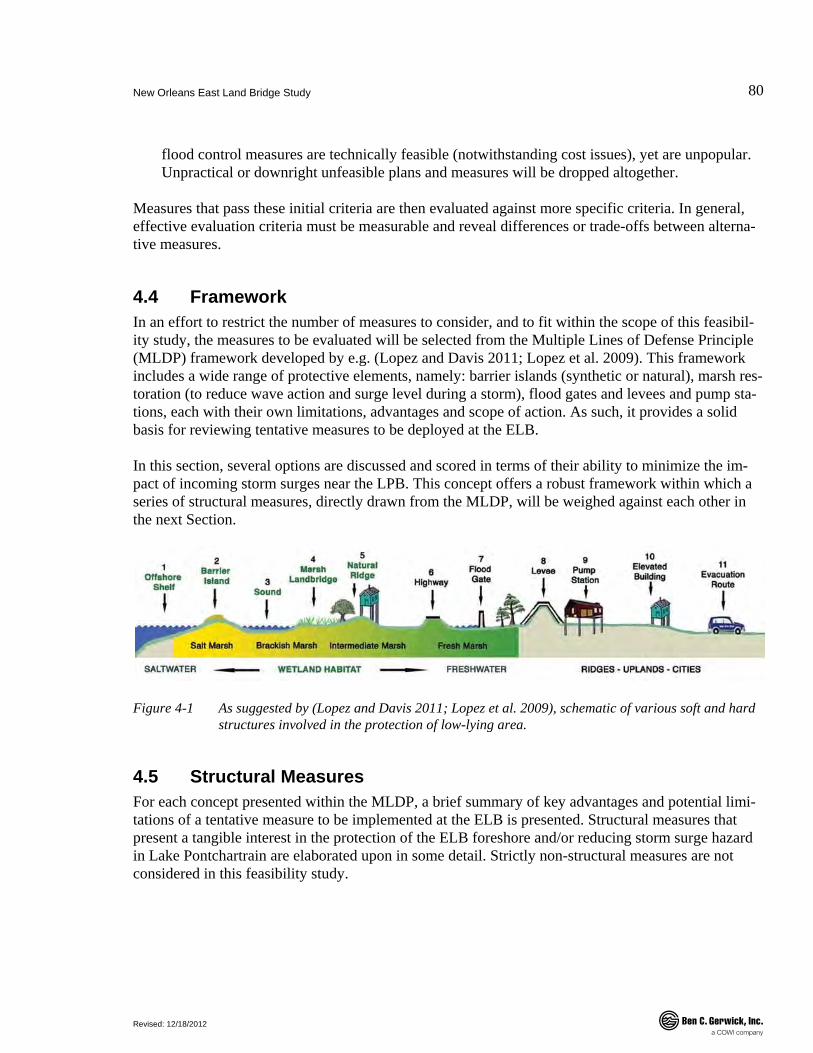
New Orleans East Land Bridge Study
Revised: 12/18/2012
80
.
flood control measures are technically feasible (notwithstanding cost issues), yet are unpopular. Unpractical or downright unfeasible plans and measures will be dropped altogether.
Measures that pass these initial criteria are then evaluated against more specific criteria. In general, effective evaluation criteria must be measurable and reveal differences or trade-offs between alterna-tive measures.
4.4 Framework In an effort to restrict the number of measures to consider, and to fit within the scope of this feasibil-ity study, the measures to be evaluated will be selected from the Multiple Lines of Defense Principle (MLDP) framework developed by e.g. (Lopez and Davis 2011; Lopez et al. 2009). This framework includes a wide range of protective elements, namely: barrier islands (synthetic or natural), marsh res-toration (to reduce wave action and surge level during a storm), flood gates and levees and pump sta-tions, each with their own limitations, advantages and scope of action. As such, it provides a solid basis for reviewing tentative measures to be deployed at the ELB.
In this section, several options are discussed and scored in terms of their ability to minimize the im-pact of incoming storm surges near the LPB. This concept offers a robust framework within which a series of structural measures, directly drawn from the MLDP, will be weighed against each other in the next Section.
Figure 4-1 As suggested by (Lopez and Davis 2011; Lopez et al. 2009), schematic of various soft and hard structures involved in the protection of low-lying area.
4.5 Structural Measures For each concept presented within the MLDP, a brief summary of key advantages and potential limi-tations of a tentative measure to be implemented at the ELB is presented. Structural measures that present a tangible interest in the protection of the ELB foreshore and/or reducing storm surge hazard in Lake Pontchartrain are elaborated upon in some detail. Strictly non-structural measures are not considered in this feasibility study.
New Orleans East Land Bridge Study
Revised: 12/18/2012
81
.
4.5.1 Barrier Island Concept and Benefits A barrier island provides a regional form of protection against hurricane storm surge. It is first in line in the multiple line of defense strategy. In their paper (Stone and McBride 1998), the authors have shown that barrier islands play a significant role in mitigating ocean swells and other storm events for the water systems behind on the mainland side of the barrier island. Essentially, these barriers nurture a low energy environment, where multiple wetland systems such as lagoons, estuaries and marshes can result, which all participate in reducing incoming wave energy. These results are also in line with past studies (Cooper 2005; Dixon, Leggett, and Weight 1998) establishing a significant connection between brackish vegetation cover and wave energy attenuation. For instance, a conceptual NSSB may propose to relocate the Mississippi river entrance (Main Pass, South Pass, etc.), by up to 45-miles (72 km) upstream. By doing so, the proposed approach would facilitate diversion of the limited sediment load carried by Mississippi river away from the deep waters of the Gulf of Mexico. The silt deposits may be strategically diverted to form a protective storm surge barrier and to nourish wet-lands, in a manner similar to that implemented by the successful AT-02 and -03 projects in the Atchafalaya Basin, albeit at a much larger scale.
Limitations Here, the limitations of a newly stabilized sediment barrier (NSSB) are obvious: high cost, time and environmental constraints. While it can be shown that this solution does provide benefit at the region-al level against storm surge hazard, the size, scope and timeframe associated with a project of this magnitude limit its potential for deployment within the context of the present feasibility study. This translates into a lower acceptability score.
4.5.2 Marsh Restoration Concept and Benefits Marsh restoration can be achieved through multiple pathways, including: beneficial reuse of dredged material; replanting efforts; removal of invasive species, among others. The benefits extend beyond environmental ones (e.g. restored/expanded wildlife habitat). A restored marshland, featuring a higher base elevation and taller vegetation may help absorb incoming wave and storm surge energy (see Sec-tion 2).
Limitations The concept of marsh restoration is not explicitly warranted at the ELB in the CPRA Master Plan (CPRA 2007a; CPRA 2012). While storm surge reduction potential exists, it is limited and cannot be considered a substitute for physical flood barriers. For the specific case of beneficial dredged material reuse, pollutant remixing may occur, with an impact on local ecosystem. In general, the scale of these projects is limited to small areas, which further reduces their effectiveness.
4.5.3 Rock Dike Concept and Benefits A low-crested armored berm, or rock dike, specifically addresses Objective 2 through foreshore stabi-lization efforts. Arguably, smaller coastal measures do not provide the same regional level of protec-
New Orleans East Land Bridge Study
Revised: 12/18/2012
82
.
tion as a levee of flood wall does against storm surge hazard. However, a well constructed armored berm, with sufficient crest elevation to accommodate future sea level rise, does provide benefit to the ELB by limiting erosion and improve shoreline stability, as shown by the PO-34 project. Because there is a recognized value in preserving marshland to reduce storm surge intensity (see for instance the results shown in Section 2.2.8), such measure would prove effective in addressing Objective 1 to some extent.
In order to provide a significant amount of protection against erosion and slowly deteriorating effect of sea level rise, a low-crested armored berm can be devised. A low-crested rock dike with a launch apron would prevent erosion and further slope failure by adapting to changing conditions over time. The protected side of the berm features reinforced turf and would include a new fill and planting area. The project alignment follows the foreshore of the ELB and draws upon existing projects whenever necessary.
Limitations The LACPR Technical Report does not present or suggest any additional shoreline protections schemes near the ELB per Annex 1 of the Engineering Appendix of (USACE 2009). Projects are al-ready in place in the vicinity of ELB: most importantly the Alligator Bend marsh restoration project is reviewed in Section 2.5. On the other hand, significant slope failure may occur if the foreshore pro-tection does not extend below the water surface. Therefore, while the completeness and effectiveness at achieving Objective 2 are high, their efficiency and acceptability may be hindered by cost, lack of sufficient support, material sourcing restrictions and landscape impact issues.
4.5.4 Augmented Armored Berm Concept and Benefits As an alternative to the low-lying option presented above, this conceptual augmented armored berm relies on a higher crest elevation. This concept makes use of larger armor stones and provides an augmented user experience. Larger (60ft at the base, 15ft tall) and wider (20ft on top) than its low-lying counterpart, the augmented version allows for a mixed use pathway at the crest.
The augmented armored berm features heavy armored stone on both faces, with a core made of quar-ry run rock (or equivalent). This structure is able to shield the land immediately behind it from re-peated high-energy wave action, and also adds stability to coastline extension projects. A key ad-vantage of this solution is its ability to provide significant stability to the coastline by providing a center point for marshland restoration on both sides of the structure. In that respect, this concept is able to address Objective 1 and 2.
Limitations They are similar to those developed for the rock dike above; in addition, constraints stemming from expansive pre-construction requirements and material sourcing further lower the acceptability index for this concept. The added weight required for the construction of this armored berm will affect con-struction costs due to soil preparation (or may render it cost prohibitive), construction methods and placement tolerances.
New Orleans East Land Bridge Study
Revised: 12/18/2012
83
.
4.5.5 Elevated and Augmented Highway Concept and Benefits Strengthening the existing US-90 through flood-proofing and upgrading has merit: the existing road-way has a clear advantage in elevation over the rest of the ELB as shown in Section 3.6, and as such is a good platform for flood risk reduction efforts. The addition of flood protection element along the roadway or leveraging this asset to act as platform for a flood barrier would be a valuable asset in a regional plan to limit flood risk in the LPB.
On a side note, it should be noted that, Alignment 2 (as described in 2.2) highlights the CSX railroad as a viable alternative to an elevated highway measure. Because it follows the GIWW on the North-ern part of the ELB, this asset would preserve a larger part of the current study area.
Limitations Given the objectives set forth in this study, namely flood risk reduction and shoreline/foreshore preservation, the current location of US-90 would leave out a large part of ELB open to environmen-tal stressors such as wave action and storm surge. As noted above, the CSX railroad alignment is in direct competition to US-90 because it could form the basis for the potential alignment a future high-crested structure. In addition, the highway is located in areas that are densely populated (Petites Co-quilles region), and the implementation of flood risk reduction at that location might be hindered by the lack of real estate, landscape disruption and low acceptability (public nuisance).
4.5.6 Earthen Levee, Floodwalls and Flood Gates Concept and Benefits The ELB is a low-lying area that would benefit from the presence of a levee extending from the end of the LPV-111 federal levee and up to the Rigolets pass. The LACPR Technical Report estimates that during any significant storm (with a return period exceeding 100 years), the ELB is completely submerged. This immediate threat may hinder the efficacy of lower-crested coastal protection measures, such as riprap placement or marsh regeneration, to prevent the surge from penetrating in-side Lake Pontchartrain.
With a properly defined crest height, and a project alignment that is judiciously positioned to com-plement existing flood control features, the levee would provide a direct barrier to a storm surge, thereby significantly reducing the risk of flooding and prevent land loss in the Northern part of the ELB. An earthen levee, erected along the GIWW waterway, provides direct action against storm surge hazard for the LPB and is likely to be cost-effective.
This type of flood protection system, with or without control structure can be seen as an adaptive and supplementary component of an existing network of multiple lines of defense that will assist other systems already in place, such as the PCCP in New Orleans, to cope with changing SLR conditions.
The potential construction of flood gate structures at the Chef Menteur and Rigolets passes is briefly investigated in this report. It is known that the environmental impact would be fairly high: a detailed analysis has already been done to determine the optimal size for such flood gates; in addition, (Lopez and Davis 2011) have already established a solid foundation for their environmental impact. Regard-
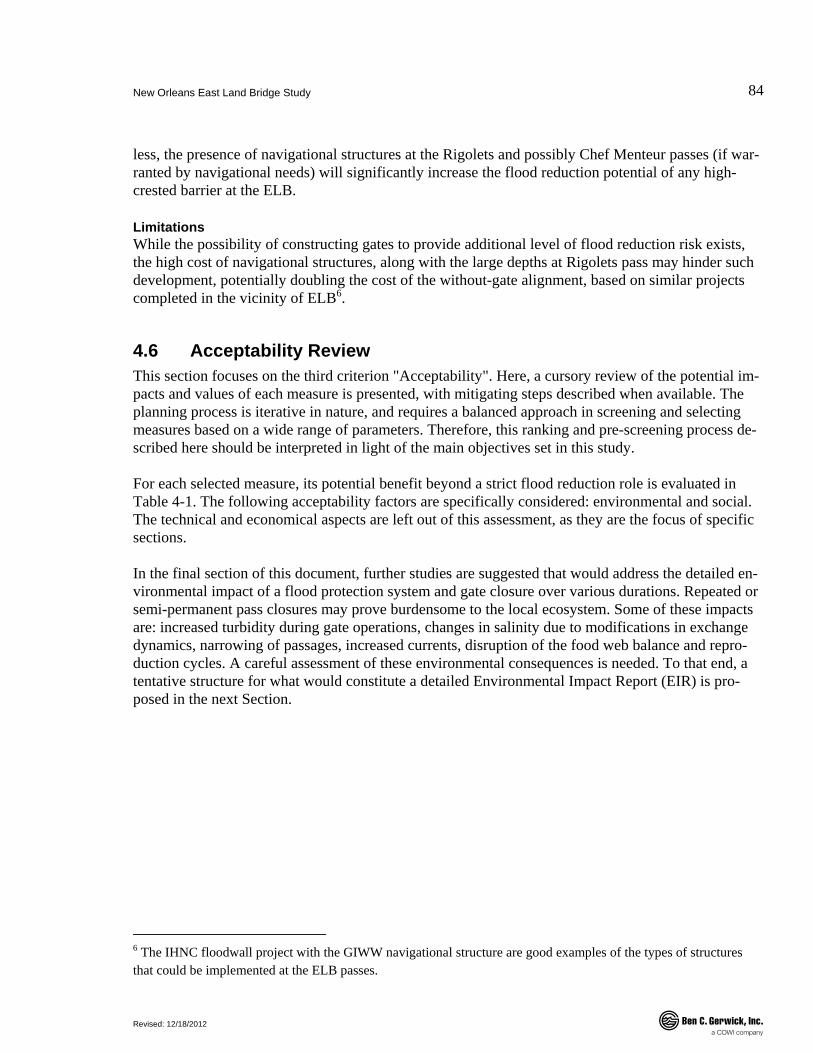
New Orleans East Land Bridge Study
Revised: 12/18/2012
84
.
less, the presence of navigational structures at the Rigolets and possibly Chef Menteur passes (if war-ranted by navigational needs) will significantly increase the flood reduction potential of any high-crested barrier at the ELB.
Limitations While the possibility of constructing gates to provide additional level of flood reduction risk exists, the high cost of navigational structures, along with the large depths at Rigolets pass may hinder such development, potentially doubling the cost of the without-gate alignment, based on similar projects completed in the vicinity of ELB6.
4.6 Acceptability Review This section focuses on the third criterion "Acceptability". Here, a cursory review of the potential im-pacts and values of each measure is presented, with mitigating steps described when available. The planning process is iterative in nature, and requires a balanced approach in screening and selecting measures based on a wide range of parameters. Therefore, this ranking and pre-screening process de-scribed here should be interpreted in light of the main objectives set in this study.
For each selected measure, its potential benefit beyond a strict flood reduction role is evaluated in Table 4-1. The following acceptability factors are specifically considered: environmental and social. The technical and economical aspects are left out of this assessment, as they are the focus of specific sections.
In the final section of this document, further studies are suggested that would address the detailed en-vironmental impact of a flood protection system and gate closure over various durations. Repeated or semi-permanent pass closures may prove burdensome to the local ecosystem. Some of these impacts are: increased turbidity during gate operations, changes in salinity due to modifications in exchange dynamics, narrowing of passages, increased currents, disruption of the food web balance and repro-duction cycles. A careful assessment of these environmental consequences is needed. To that end, a tentative structure for what would constitute a detailed Environmental Impact Report (EIR) is pro-posed in the next Section.
6 The IHNC floodwall project with the GIWW navigational structure are good examples of the types of structures that could be implemented at the ELB passes.
New Orleans East Land Bridge Study
Revised: 12/18/2012
85
.
Table 4-1 Factors affecting acceptability of selected measures.
Barrier Island Marsh restoration Shoreline protection Elevated highway Levee alignment Full closure
Summarized net benefit for flood reduction
Potential for regional-scale surge reduction.
Promotion of low-energy climate.
Increases natural wild-life habitat.
May reduce incoming wave energy during storm surge
Limit coastline recess and provides benefits for marsh restoration projects.
Strengthens ELB's role as flood defense line by maintaining current marsh area.
Leverages US90 alignment and provides direct protection against moderate storm surge with lim-ited impact on local system
Physical, high-crested line of defense against moderate to severe storm surge
Enhanced potency of flood risk reduction system with ability to hydraulically lock LP
Positive acceptability factors
● Planning opportunity to define new protection status to large areas; enlargement of natural habitats and wildlife refuge.
● Remote location and low so-cial impact.
● Provides long-term benefits with low dis-ruption to existing landscape.
● Expands natural hab-itat and promotes fa-vorable environmental conditions.
● Opportunity to use as building block for re-planting and restoration efforts.
● Inert building materi-al.
● Reduced footprint
●● Opportunities for including small-scale restoration projects along US 90 alignment.
● Located in mostly uninhabited areas
● Ample opportunities for mitigating ecological impact during/after construction.
● Earthen levees may be used as support blocks for replanting/marsh revitalization efforts.
● Recreational value: structures may be integrat-ed into state park or recreation areas with bike/walk paths, beaches, etc.
●● Project brings focus to restoration and revalu-ation of nearby natural landscape
Negative acceptability factors
● Large-scale disruption of exist-ing landscape.
● Limited ability to provide direct, measurable reduction in storm surge in densely populated are-as.
● May be overwhelmed by change in sea-level.
●Short-term environ-mental disruption dur-ing marsh nourishment phase.
● Sediment for restora-tion subject to limited quantity and availabil-ity.
● Non-native building material and potential disruption to natural habitat.
● Construction may be conducted in sensitive areas.
● Elevated structure would require upgrades to existing infra-structures that would affect local ecosystem.
● Right-of-way issues; inhabited areas may be left unprotected
● Large-scale project significantly alters land-scape and local ecosystem.
● Heavy pre-construction soil preparation; con-struction may incur environmental impact; mitigat-ing measures should be enforced.
● Hydrodynamic consequences of repeated and/or prolonged pass closures
Factors considered: environmental ● and social ●
New Orleans East Land Bridge Study
Revised: 12/18/2012
86
.
4.7 Recommendations for Future Environmental Impact Study
4.7.1 Objectives Lake Pontchartrain is the centerpiece of the Pontchartrain drainage basin, which is the habitat for a large number of species. This ecosystem in natural state is in a finely-tuned and delicate balance, which can be easily breached by the addition of man-made structures, such as those considered in this study. For instance, to protect the lake area under hazardous situations, such as hurricanes or oil spills, a full-closure levee structure may be proposed that is intended to be closed. It is anticipated that the duration of the closure may be extended for a certain time period, extending over the course of several days or weeks. Such closure would cause an interruption in water exchange between the lake and the coastal water. In this situation, water pollutant concentration, nutrients supply level and other water quality parameters may change consequently. Tentative objectives of a detailed environ-mental impact study (EIR) would be as follows:
• Determine the fate of water quality during closures spanning from one week to a month
• Estimate the time needed for the local ecosystem to recover from the closure and restore itself to pre-closure conditions after the lake is re-connected to Lake Borgne
4.7.2 Proposed Methodology In order to examine these potential impacts on the ecosystem and water quality of Lake Pontchartrain, a water-quality model may be employed to evaluate the effects of an extended closure of the struc-tures. Water-quality parameters will be predicted on the basis of modeled hydrodynamics under nor-mal and extreme conditions. Spatial distribution and temporal variation of major water quality param-eters will be predicted before, during and after the closure. The candidate models are Delft3D and Environmental Fluid Dynamics Code (EFDC). Both are technically defensible, state-of–art models that are widely used to simulate hydrodynamics and water qualities in either two- or three-dimensional domain.
Extensive data and previous studies will be collected and reviewed to characterize the baseline condi-tions of natural ecological state of Lake Pontchartrain, which directs the model calibration and the impact study. The model calibration will be conducted for the baseline condition and based on the data availability. A long-term prediction, such as a 1 year closure, is computationally expensive using a water-quality model. An ecosystem box model or a water quality factor (i.e. approximate long term impacts based on shorter term trends) are recommended for a long-term impact study rather than a long term single simulation.
4.7.3 Cost Breakdown The cost of this study depends on the model availability, data availability and complexity of the study. The cost is estimated in the Table 4-2. Items 1 to 7 are considered essential for the proposed

New Orleans East Land Bridge Study
Revised: 12/18/2012
87
.
EIR; items 8 and 9 would enhance the value of the study, but were considered optional. The estimated time required to complete Items 1 to 7 is approximately 4 to 6 months from notice to proceed.
Table 4-2 Cost table: supplemental environmental study.
Item Objectives Task description Costa
1 Background study Literature/Data collection $10,000
2 Hydrodynamics Grid generation, model setup, model calibration, simulations $40,000
3 Salinity Model setup, calibration and simulations $10,000
4 Flushing time Calculation of Lagrangian currents $5,000
5 Temperature Model setup, simulations $10,000
6 Dissolved oxygen Determination of dominant bio-chemical processes and cor-responding parameters, model setup and simulations $10,000
7 Nutrient supply Determination of dominant bio-chemical processes and cor-responding parameters, model setup and simulations $10,000
SUBTOTAL (estimated) $95,000
8 Geomorphology Determination of bottom sediment properties and sediment intake, model setup and simulations $10,000
9 Other water quality pa-rameters
Additional modeling efforts for specific parameters $5k to 10k
TOTAL (estimated) $115,000
a: cost for estimating purposes only; may be subject to revision; cost estimates valid as of July, 2012.
Shaded items are optional
4.8 Measure Screening
4.8.1 Criteria for Success The measures identified in the previous section are ranked according to their relative strength at achieving the objectives and constraints defined earlier.
• Completeness: Completeness is a determination whether or not the measure includes all ele-ments necessary to achieve the objectives of the plan.
In general, most of the (structural) measures presented herein are complete, with the notable ex-ception of sediment barrier, which falls outside the scope of this study and whose design, financ-

New Orleans East Land Bridge Study
Revised: 12/18/2012
88
.
ing and implementation would necessarily depend on other authorities outside of the Orleans par-ish. The regular and armored berms, high-crested levees with or without gates are all self-standing measures capable of performing without significantly relying on other components.
• Efficiency: Efficiency measures cost effectiveness and is expressed in estimating the net impact to be obtained from the measure.
A barrier island has the highest cost, while an earthen levee was ranked higher than the armored berm measure: this is because of the high volume and local scarcity of the rock material needed for the construction of the latter.
• Effectiveness: Effectiveness measures the ability of a given measure to achieve the planning ob-jectives
- Flood protection. A high score (4+) indicates that the item delivers on providing significant reduction in flood risk at in the immediate vicinity of LPB. For instance, the barrier island provides large-scale reduction in storm surge hazard. However, because it provides region-level flood reduction, it is unable to reduce flood risk directly near the LPB. Thus, it is not ranked as high as a levee or an elevated highway, which are more direct lines of defense against flood risk.
- Shoreline/foreshore preservation. A high score indicates ability to actively protect existing shoreline assets and promote regrowth over the long term within the ELB sector. For in-stance, the armored berm is a key component of preserving the shoreline and limiting ero-sion due to wave action, current, tides, saltwater intrusion, etc.; on the other hand, the ele-vated armored berm would be a more disruptive element and would require significant prep-aration prior to construction.
• Acceptability: Acceptability is all-encompassing metric that seeks to define whether the measure or plan is sound technically, environmentally, economically and socially.
The construction of an armored berm is relatively straightforward: it requires no significant soil preparation (settlement must be accounted for, however) and can be completed in a timely man-ner. On the other hand, larger projects such as a levee or augmented berm would require signifi-cant financial and construction planning. The barrier island project scores low in this category because of its very large footprint, prohibitive cost and overall scale, thereby reducing its overall feasibility index.
A high acceptability score also indicates that the item is able to be constructed with relatively no or low impact to the immediate environment. For this, results summarized in Table 4-1 are inte-grated. For instance, the armored berm ends up as best solution here because of a relatively low footprint and absence of soil preparation. The elevated highway fares well because this solution leverages existing assets. On the other hand, the augmented berm did not score high because the volume of rock material to displace and the requirements for soil preparation prior to construc-tion. A barrier island would impose the least pressure at the ELB because of its remote location, but the impact at the project site is likely to be significant.

New Orleans East Land Bridge Study
Revised: 12/18/2012
89
.
In general, the measures retained thus far to reduce flood risk and/or shoreline erosion should meet minimum social acceptance requirements, given that the measures do not interfere with any absolute constraints, such as placing additional burden on adjacent flood protection system (IHNC, Mississippi).
A summary table assigns to each feature's performance a rank according the metrics defined above. Figure 4-2 illustrates this screening phase through the use of a radar plot. Here, the levee and armored berm measures appear as higher-priority measures: both feature perform strongly in their respective field (flood protection and shoreline preservation) while achieving a well-balanced profile overall.
4.8.2 Results by Measure Table 4-3 Structural measure: levee.
Levee Comments Score [1-5]
Completeness Self-standing project; ties in with existing facilities but does not require output from other plans 5
Efficiency Benefits to be collected from construction are significant; adaptive design help overcome cost constraints. 4
Effectiveness Able to achieve objective 1 "flood reduction..." fully while partially succeeding in promoting land preservation (objective 2) 5
Acceptability Proper design will reduce negative consequences on adjacent infrastructure and populated areas; cost mitigation measures available; limited environmen-tal damage possible. No major hurdles anticipated for construction: local sources (e.g. concrete units instead of armor stones). Recognized efficacy of levees in flood control. Negative considerations include: large environmental footprint during construction, right-of-way and real estate requirements.
4
Table 4-4 Structural measure: low-crested armored berm (rock dike).
Rock dike Comments Score [1-5]
Completeness Self-standing project: able to achieve objective on its own 5
Efficiency Benefits are significant but may exhibit redundancy with existing projects, e.g. Alligator Bend restoration: locations for installation should be optimized. Cost/benefit ratio is low.
3
Effectiveness Able to achieve objective 2 ("Shoreline protection...") fully while unable to ad-dress flood risk reduction (objective 1) by promoting marshland regrowth (proven to beneficially affect surge distribution and dampen waves during storm event).
2
Acceptability Low overall environmental impact makes this project both feasible and likely to gain support from stakeholders. Previously implemented projects indicate a high acceptability index for this measure.
5
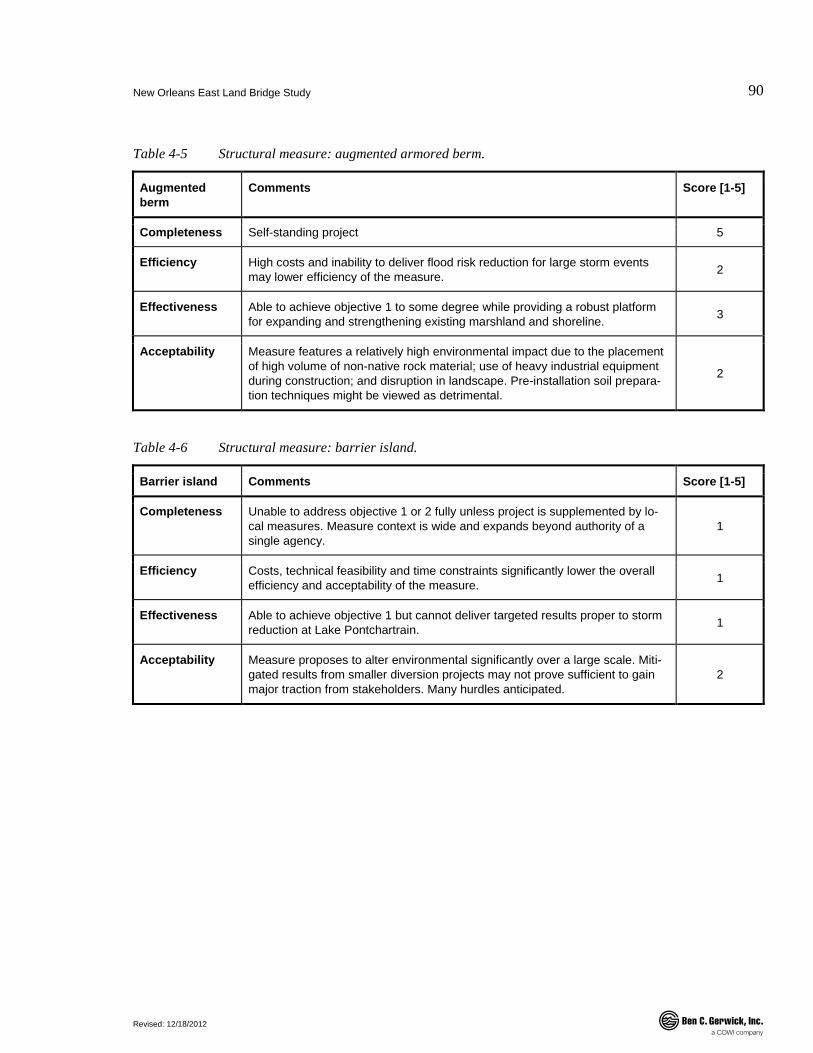
New Orleans East Land Bridge Study
Revised: 12/18/2012
90
.
Table 4-5 Structural measure: augmented armored berm.
Augmented berm
Comments Score [1-5]
Completeness Self-standing project 5
Efficiency High costs and inability to deliver flood risk reduction for large storm events may lower efficiency of the measure. 2
Effectiveness Able to achieve objective 1 to some degree while providing a robust platform for expanding and strengthening existing marshland and shoreline. 3
Acceptability Measure features a relatively high environmental impact due to the placement of high volume of non-native rock material; use of heavy industrial equipment during construction; and disruption in landscape. Pre-installation soil prepara-tion techniques might be viewed as detrimental.
2
Table 4-6 Structural measure: barrier island.
Barrier island Comments Score [1-5]
Completeness Unable to address objective 1 or 2 fully unless project is supplemented by lo-cal measures. Measure context is wide and expands beyond authority of a single agency.
1
Efficiency Costs, technical feasibility and time constraints significantly lower the overall efficiency and acceptability of the measure. 1
Effectiveness Able to achieve objective 1 but cannot deliver targeted results proper to storm reduction at Lake Pontchartrain. 1
Acceptability Measure proposes to alter environmental significantly over a large scale. Miti-gated results from smaller diversion projects may not prove sufficient to gain major traction from stakeholders. Many hurdles anticipated.
2

New Orleans East Land Bridge Study
Revised: 12/18/2012
91
.
Table 4-7 Structural measure: elevated highway.
Elevated high-way (US-90)
Comments Score [1-5]
Completeness Only partially capable of serving the needs defined in this study. Requires ad-ditional components to form a regional flood barrier. 2
Efficiency Soil conditions identified as good in previous LACPR Technical Report and other references; alignment retained in preliminary hydrodynamic studies. 3
Effectiveness Able to achieve objective 1 to some extent but does not address shoreline protection as defined by Objective 2. 2
Acceptability Alignment not favored by local stakeholders (USACE 2009); densely populat-ed areas; environmentally less relevant than other measures due to its inability to actively protect the shoreline.
2
Table 4-8 Measure screening results.
Measure Planning objective ad-dressed
Retained? Screening rationale
1 2
Levee ● ● Yes Selected for next screening round
Armored berm ● Yes Selected for next screening round
Augmented berm ● ● No This measure was eliminated from further con-sideration because of potential cost and accept-ability issues. The measure would necessarily interfere on existing infrastructure (Alligator Bend)
Barrier Island ● No This measure does not properly address storm surge reduction and is incomplete: the concept spans outside the realm of authority of the SLFPA-E.
Elevated highway ● No This measure leaves out a large area of ELB vulnerable to shoreline erosion and marshland loss. Alignment does not line up with interests of stakeholders.
Objective 1 To reduce flood risk at the LPB by placing a physical flood barrier against storm surge.
Objective 2 To preserve the integrity and encourage efforts to expand and strengthen the shoreline at the ELB.
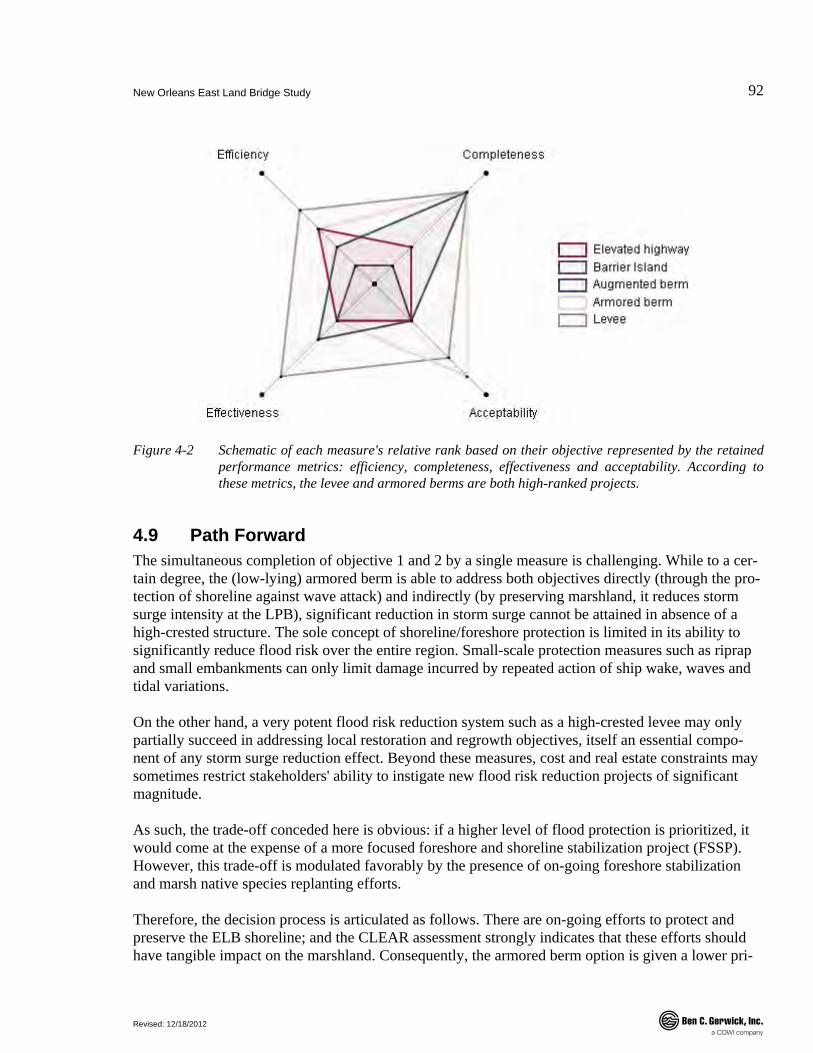
New Orleans East Land Bridge Study
Revised: 12/18/2012
92
.
Figure 4-2 Schematic of each measure's relative rank based on their objective represented by the retained performance metrics: efficiency, completeness, effectiveness and acceptability. According to these metrics, the levee and armored berms are both high-ranked projects.
4.9 Path Forward The simultaneous completion of objective 1 and 2 by a single measure is challenging. While to a cer-tain degree, the (low-lying) armored berm is able to address both objectives directly (through the pro-tection of shoreline against wave attack) and indirectly (by preserving marshland, it reduces storm surge intensity at the LPB), significant reduction in storm surge cannot be attained in absence of a high-crested structure. The sole concept of shoreline/foreshore protection is limited in its ability to significantly reduce flood risk over the entire region. Small-scale protection measures such as riprap and small embankments can only limit damage incurred by repeated action of ship wake, waves and tidal variations.
On the other hand, a very potent flood risk reduction system such as a high-crested levee may only partially succeed in addressing local restoration and regrowth objectives, itself an essential compo-nent of any storm surge reduction effect. Beyond these measures, cost and real estate constraints may sometimes restrict stakeholders' ability to instigate new flood risk reduction projects of significant magnitude.
As such, the trade-off conceded here is obvious: if a higher level of flood protection is prioritized, it would come at the expense of a more focused foreshore and shoreline stabilization project (FSSP). However, this trade-off is modulated favorably by the presence of on-going foreshore stabilization and marsh native species replanting efforts.
Therefore, the decision process is articulated as follows. There are on-going efforts to protect and preserve the ELB shoreline; and the CLEAR assessment strongly indicates that these efforts should have tangible impact on the marshland. Consequently, the armored berm option is given a lower pri-

New Orleans East Land Bridge Study
Revised: 12/18/2012
93
.
ority. Within the context of this feasibility study, the net benefits to be achieved through the deploy-ment of a high-crested levee appear appreciably higher. The initiation of a conceptual design for a high-crested levee is thus given the highest priority in the context of this feasibility study.
While the armored berm concept would provide shoreline stabilization, the presence of on-going shoreline/marsh restoration project warrants some delay before additional measures are implemented. That being said, in the meantime, monitoring and performance evaluation of all on-going FSSP is recommended, with emphasis on the results of the Alligator Bend Marsh Restoration and Shoreline Protection (PO-34), due to its direct relevance to the objectives defined in this study.
Finally, after confirming the value of an intact ELB for limiting storm surge in the LPB, additional FSSP should be engaged wherever current or future projects fail to address specific erosion control needs: for instance, for a without-gate solution, proper scour control components should be installed where the levee intersects with either pass. Specific locations can be determined from the results of the visual inspection of Section 3.9, and from the needs of the high-crested levee system evaluated in the next Section. Recommendations on these are provided in Figure 7-11.
Table 4-9 High-priority projects recommended at the ELB.
Priority-level Name Description
1 High-crested levee Feasibility study and conceptual design of high-crested lev-ee protection at ELB.
2 FSSP evaluation and monitoring program
Track success through quantifiable metrics such as a re-growth index, organic top-layer measurements; aerial photo and on-site collection campaign.
3 Complement/augment existing FSSP with ad-hoc measures wherever required.
Conditioned to efficacy of high-crested levee in limiting storm surge, augment and/or complement existing FSSP at critical areas where shoreline stabilization is critical and participates in improving the efficacy of the flood control system.
New Orleans East Land Bridge Study
Revised: 12/18/2012
94
.
5 Levee Design Parameters This section articulates the preliminary design steps taken to shape the high-crested levee concept to be tested for efficacy in the next Section.
5.1 Determination of Design Crest Elevation Need The purpose of this feasibility study is to supplement the work already performed and published in the LACPR Technical Report. To do so, a mid-range levee crest height is devised that sits between the elevations considered for evaluation in the aforementioned report.
Rationale for Crest Elevation The LACPR Technical Master Plan (USACE 2009) considered overtopping barrier weir with a crest height of 12.5 ft (see Section 2.2.6 for more details). At that level, the barrier was reported to have merit in protecting against more frequent and smaller storm events, but was shown to not be able to provide an appreciable reduction in Lake Ponchartrain storm surge for major flooding events.
On the other hand, a so-called "non-overtopping" levee, with a top elevation of 25 to 32 ft would of-fer significant protection against storm surge level in Lake Pontchartrain. However, this level of suc-cess comes at the expense of nearby areas which would bear additional hydraulic burden due to the storm surge redistribution: according to calculations, the non-overtopping solution would incur exces-sive hydraulic stress to the IHNC floodwall region and Mississippi.
Mid-range Elevation In order to provide with an intermediate elevation that sits between an overtopping and non-overtopping levee, and to evaluate the benefits of an intermediate solution to the Lake Pontchartrain basin, an estimate is calculated based on the HSDRRS design guidelines (USACE 2007), Appendix D, which suggests that the maximum water level, ELTop, during a storm surge with still water level, ELSWL and significant wave height, 𝐻�, is as follows:
ELTop = ELSWL + 0.7 ⋅ 𝐻�
Estimates for wave parameters and storm surge elevations are described in Sections 3.4.3 and 2.2.9, respectively. According to the HSDRRS guideline, taking a design significant wave height of approx-imately 6ft for the 100-year case and 8 ft for the 400-year case; a future condition (2060, Future Case 2) storm surge elevation of 18ft (100-YRP) and 21.5ft (400-YRP), the crest elevations for the 100-YRP and 400-YRP design case becomes 22 and 26 ft, respectively; this is less than the non-overtopping barrier elevations cited in the LACPR Technical Report, namely 25 and 32 ft.
It should be noted that in the above estimate, the impact of RSLR on storm surge elevation was taken into account. While the values retained in the original reference (LACPR Technical Report) differ from those selected for this study (2.6 against 2.8 ft, respectively), that difference is minor, and no correction is applied to this preliminary storm surge elevation assessment. Results are summarized in Table 5-1.

New Orleans East Land Bridge Study
Revised: 12/18/2012
95
.
Table 5-1 Establishment of crest elevation for levees based on storm surge elevation assessment from LACPR Technical Report. Future conditions for surge elevations are those reported for the Or-leans area, and correspond to Future Case 2, featuring a more conservative SLR projection.
Configuration Surge elevation [ft-NAVD88] (future conditions)
RSLR [ft] (already included in estimates)
Wave height (sig-nificant) [ft]
Approximate levee crest height [ft-NAVD88]
Overtopping barrier-weir considered for testing in the LACPR (shown for reference; see Sec-tion 2.2.6)
12.5
Below: proposed barrier elevations in this study at the 100- and 400-YRP levels.
100-YRP level 18 2.67 6 22
400-YRP level 21.5 2.68 8 26
Below: non-overtopping barrier considered for testing in the LACPR (shown for reference; see Section 2.2.6)
100-YRP level 25
400-YRP level 32
5.2 General Project Alignment The general alignment follows the layout proposed in (USACE 2009), recalled here for convenience with point coordinates in UTM (Zone 16) system. As shown, the length of the project is approximate-ly 17 miles. Originally, the LACPR Technical Report suggested that the alignment feature a notch near the Chef Menteur pass. For this feasibility study, a simpler alignment is considered that follows the CSX rail track. It connects with the end of LPV-111 on the west; lines up with the rail track and turns northward before Rabbit Island on the East.
As was mentioned in Section 2.2.1, nearby levee systems, part of the 400-YRP 2010 alignment, are indicated in the figure. The coordinates of Alignment 2 as shown in Figure 5-1 are shown in Table 5-2 below. These coordinates are used to trace the alignment in the ADCIRC model of Section 5.
7 Relative sea level rise is already included in the storm surge elevation. 8 Ibid.
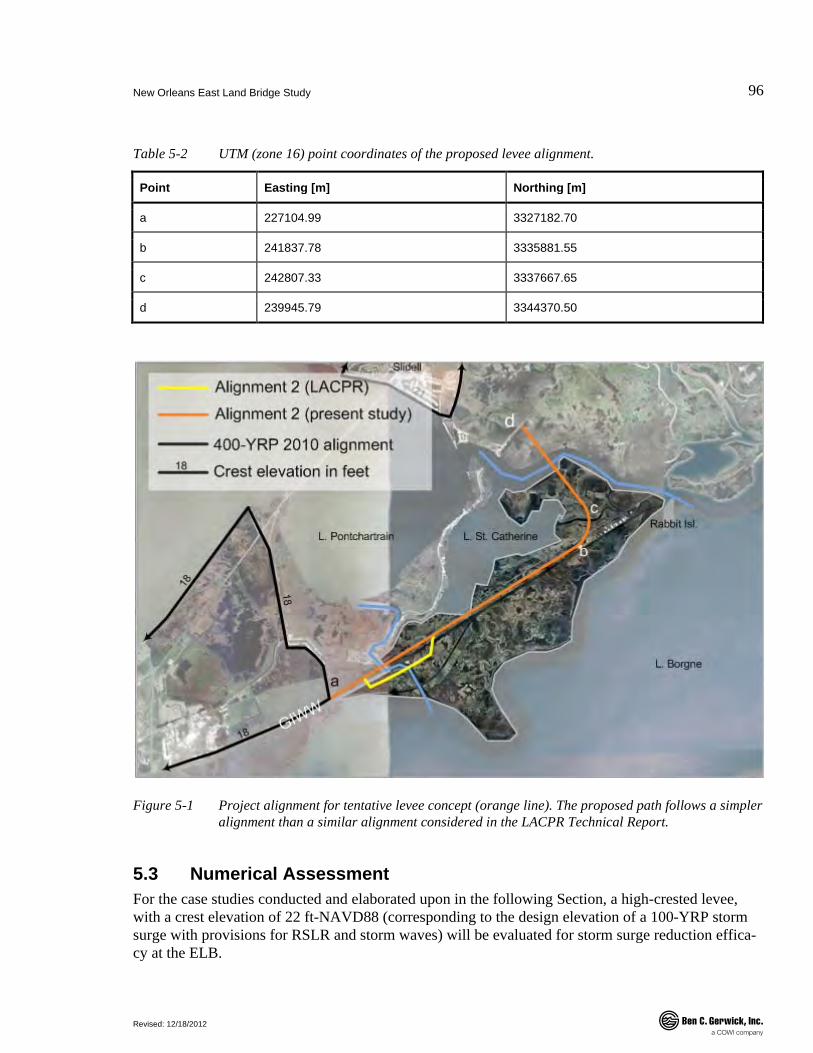
New Orleans East Land Bridge Study
Revised: 12/18/2012
96
.
Table 5-2 UTM (zone 16) point coordinates of the proposed levee alignment.
Point Easting [m] Northing [m]
a 227104.99 3327182.70
b 241837.78 3335881.55
c 242807.33 3337667.65
d 239945.79 3344370.50
Figure 5-1 Project alignment for tentative levee concept (orange line). The proposed path follows a simpler alignment than a similar alignment considered in the LACPR Technical Report.
5.3 Numerical Assessment For the case studies conducted and elaborated upon in the following Section, a high-crested levee, with a crest elevation of 22 ft-NAVD88 (corresponding to the design elevation of a 100-YRP storm surge with provisions for RSLR and storm waves) will be evaluated for storm surge reduction effica-cy at the ELB.

New Orleans East Land Bridge Study
Revised: 12/18/2012
97
.
6 Hydrodynamic Modeling
6.1 Objectives The results of the hydrodynamic modeling follow up on the screening process articulated in the pre-vious section. Here, specific goals form the basis of the investigation and are as follows:
• Objective A: To assess the effect of subsidence and marshland within the project area and their impact on hurricane storm surge hazard;
• Objective B: To assess the effects of gates at Chef Menteur and Rigolets passes;
• Objective C: To assess the impact of a new structure on the time and spatial redistribution of storm surge near the ELB.
To reach these objectives, an ADCIRC numerical model is deployed to model a series of judiciously defined hazard cases. Generally speaking, each round of test cases is designed so as to complement the results already provided in the LACPR Technical Report. To that end, the numerical experiments will not evaluate the performance of a barrier-weir (overtopping levee, 12.5 ft-NAVD88) or non-overtopping levee (+32 ft-NAVD88). Instead, this feasibility study will focus on an intermediate so-lution which emphasizes on minimizing funding constraints and maximizing net benefits, hereby ex-pressed in the form of surge reduction in the Lake Pontchartrain area. Here, the elevation of the con-cept barrier is 22ft NAVD88. It is elaborated upon in greater details in the next Section, where a con-ceptual cross-section is shown.
6.2 ADCIRC Deployment Strategy The hydrodynamic modeling is performed using the ADCIRC model; waves are modeled using a coupled SWAN model. ADCIRC is a two-dimensional, depth-integrated, barotropic time-dependent long wave, hydrodynamic circulation model. ADCIRC models can be applied to computational do-mains encompassing the deep ocean, continental shelves, coastal seas, and small-scale estuarine sys-tems. Typical ADCIRC applications include modeling tides and wind driven circulation, analysis of hurricane storm surge and flooding, dredging feasibility and material disposal studies, larval transport studies, near shore marine operations. An influence diagram illustrating the input/output relationships between various parameters is shown in Figure 6-1.
6.3 Motivation Throughput this report, ample evidence was gathered that shows that a judiciously located high-crested structure is more likely to significantly reduce storm surge in the LPB, compared to a shore-line stabilization structure alone. While a low-crested armored berm may be successful in limiting or delaying coastline retreat, it is unable to provide significant storm surge reduction. On the other hand, further evidence should be gathered that shows that a healthy ELB with a preserved marshland serves a critical role in improving the efficacy of any future storm surge reduction system: the rationale be-hind the definition of each design case reflects these objectives.

New Orleans East Land Bridge Study
Revised: 12/18/2012
98
.
Figure 6-1 ADCIRC influence diagram and input/output parameters explored in this study.
6.4 Definition of Case Studies The numerical case scenarios are intended to determine whether the ELB would benefit from struc-tural upgrades to reduce storm surge in the LPB. One of the goals is to evaluate the consequences of that upgrade upon storm surge distribution, specifically near the IHNC/MRGO site, Seabrook and Mississippi state-line. To answer the three objectives defined earlier, the cases studies to be evaluated can be divided in the following classes.
6.4.1 Classes "No gates" (a.k.a. "open passes") seeks to measures the efficacy against storm surge of an intermedi-ate high-crested levee system, positioned along the CSX railroad. Two sub-cases are envisioned: one assumes that the ELB is preserved by 2060; the other assumes that the coastline has receded so as to be adjacent to the flood control structure. This latter sub-case is intended to highlight ELB marsh-land's role as an active line of coastal defense.
"Gates" is a similar to the "No gates" ("open passes") case except for the assumed presence of flood control structures at the Chef Menteur and Rigolets passes. For this case, all structures are assumed to have a top elevation that matches the crest elevation of the concept levee. For this case an intact ELB will be considered: the goal here is to establish the potential of the flood barrier to divert storm surge to critical locations, such as MRGO/IHNC area, Mississippi state line, etc.
"No ELB" is intended to establish the fate of the current storm surge reduction system in the event that the ELB would disappear under the combined stress of erosion and sea level rise. By doing so,

New Orleans East Land Bridge Study
Revised: 12/18/2012
99
.
we would seek to validate the ELB's critical role in protecting against storm surge. For this particular case, an educated guess will be made for the tentative water depth where the ELB used to stand. This scenario will not include a new levee structure.
6.4.2 Scenario Definitions Five specific scenarios are considered for evaluation in this study.
• FWOA-ELB-intact is a Future without Action (FWOA) scenario representing a future situation where SLR and subsidence have occurred throughout the Louisiana coastal region, but the ELB remains intact and vegetated. This scenario is referred as the base case and all future scenarios are compared to it.
• FWOA-ELB-degraded (Scenario 1) is a FWOA scenario similar to the base except that the ELB has been allowed to erode and disappear. Simulations with this scenario are intended to es-timate the role of the ELB topography and vegetation in suppressing storm surge in Lake Pont-chartrain.
• Levee-Gate-Closed-ELB-intact (Scenario 2) is a scenario that includes a proposed levee across the ELB with no openings at the Chef Menteur and Rigolets passes. This configuration will hy-draulically isolate Lake Pontchartrain from Lake Borne and the Gulf of Mexico. This scenario assumes the ELB elevations and vegetation are maintained. This scenario is intended to estimate the efficacy of a closed levee to prevent surge from entering Lake Pontchartrain. The simulations will also be used to approximate the redistribution of storm surge at nearby locations, including the GIWW navigational structure, Seabrook, and along the Mississippi coast.
• Levee-Gate-Open-ELB-intact scenario (Scenario 3) is similar to the Levee-Closed_ELB-intact scenario but with free flowing openings at the Chef Menteur and Rigolets passes. This scenario assumes the ELB elevations and vegetation are maintained. Simulations with this scenario are in-tended to estimate the change in surge response within Pontchartrain and at nearby locations in-cluding the Mississippi coast. In the text, this case is also referred to as the "open gates" case.
• Levee-Gate-Open-ELB-degraded (Scenario 4) features open gates and anticipates a degraded ELB, in a manner similar as was employed in the FWOA-ELB-degraded scenario. The goal of this case study is to measure the impact of coastline degradation on the storm surge time/space distribution in Lake Pontchartrain and vicinity. Of particular interest are estimates of the change in surge response within Lake Pontchartrain and at critical nearby locations including the Missis-sippi coast.
6.5 Modeling Guidelines The following is a condensed version of the general guidelines followed during the execution of the ADCIRC/SWAN modeling campaign. A more detailed version is given in the Appendix. The most recent validated version of ADCIRC and/or SWAN was selected. For this effort, the ADCIRC mesh that was used was that built for the storm surge simulation needs of the CPRA Master Plan. Because
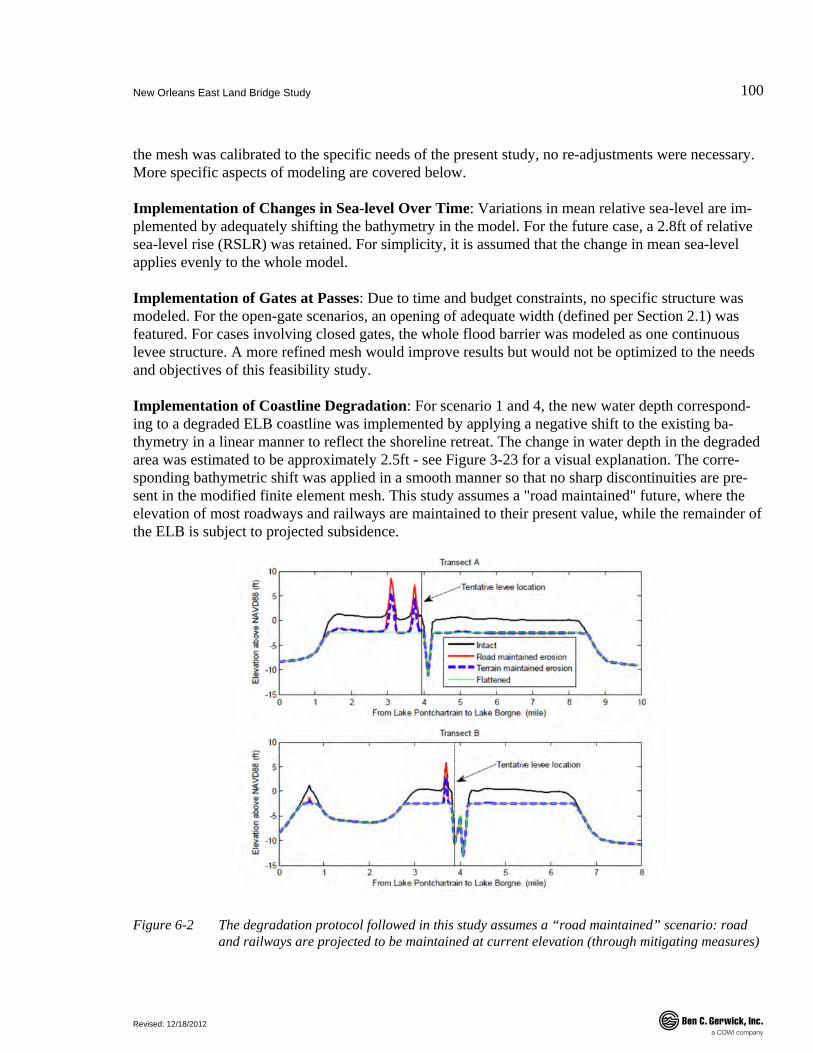
New Orleans East Land Bridge Study
Revised: 12/18/2012
100
.
the mesh was calibrated to the specific needs of the present study, no re-adjustments were necessary. More specific aspects of modeling are covered below.
Implementation of Changes in Sea-level Over Time: Variations in mean relative sea-level are im-plemented by adequately shifting the bathymetry in the model. For the future case, a 2.8ft of relative sea-level rise (RSLR) was retained. For simplicity, it is assumed that the change in mean sea-level applies evenly to the whole model.
Implementation of Gates at Passes: Due to time and budget constraints, no specific structure was modeled. For the open-gate scenarios, an opening of adequate width (defined per Section 2.1) was featured. For cases involving closed gates, the whole flood barrier was modeled as one continuous levee structure. A more refined mesh would improve results but would not be optimized to the needs and objectives of this feasibility study.
Implementation of Coastline Degradation: For scenario 1 and 4, the new water depth correspond-ing to a degraded ELB coastline was implemented by applying a negative shift to the existing ba-thymetry in a linear manner to reflect the shoreline retreat. The change in water depth in the degraded area was estimated to be approximately 2.5ft - see Figure 3-23 for a visual explanation. The corre-sponding bathymetric shift was applied in a smooth manner so that no sharp discontinuities are pre-sent in the modified finite element mesh. This study assumes a "road maintained" future, where the elevation of most roadways and railways are maintained to their present value, while the remainder of the ELB is subject to projected subsidence.
Figure 6-2 The degradation protocol followed in this study assumes a “road maintained” scenario: road and railways are projected to be maintained at current elevation (through mitigating measures)
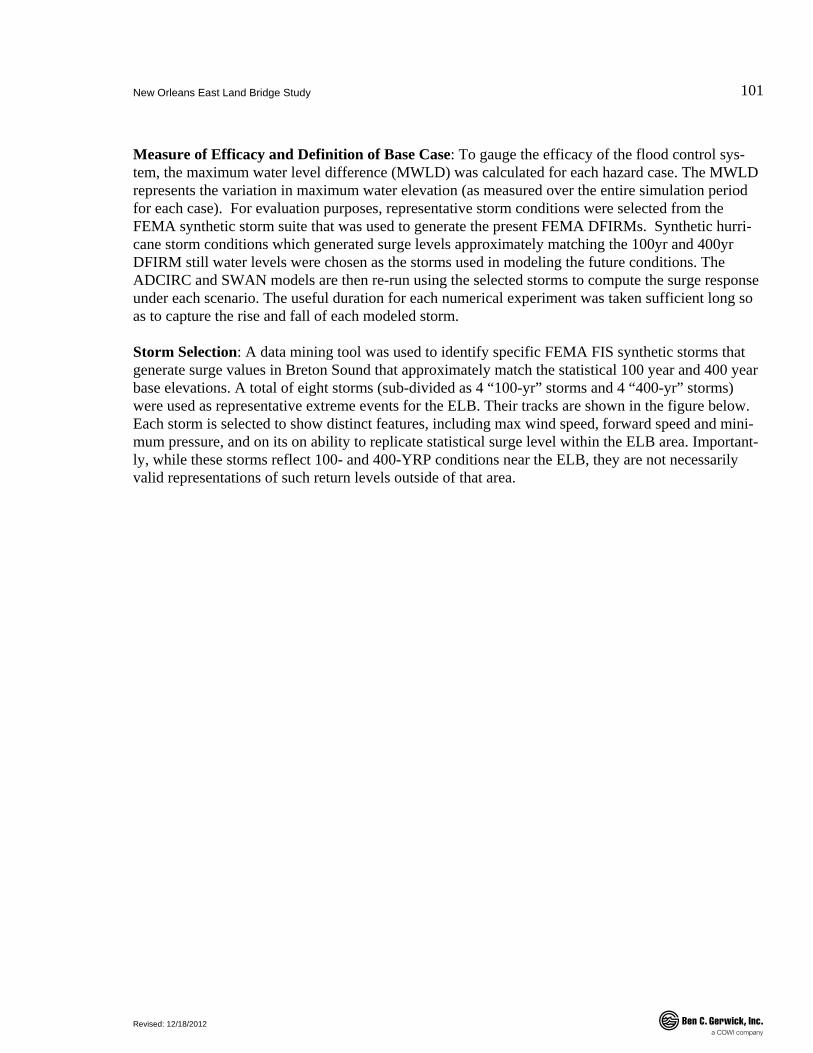
New Orleans East Land Bridge Study
Revised: 12/18/2012
101
.
Measure of Efficacy and Definition of Base Case: To gauge the efficacy of the flood control sys-tem, the maximum water level difference (MWLD) was calculated for each hazard case. The MWLD represents the variation in maximum water elevation (as measured over the entire simulation period for each case). For evaluation purposes, representative storm conditions were selected from the FEMA synthetic storm suite that was used to generate the present FEMA DFIRMs. Synthetic hurri-cane storm conditions which generated surge levels approximately matching the 100yr and 400yr DFIRM still water levels were chosen as the storms used in modeling the future conditions. The ADCIRC and SWAN models are then re-run using the selected storms to compute the surge response under each scenario. The useful duration for each numerical experiment was taken sufficient long so as to capture the rise and fall of each modeled storm.
Storm Selection: A data mining tool was used to identify specific FEMA FIS synthetic storms that generate surge values in Breton Sound that approximately match the statistical 100 year and 400 year base elevations. A total of eight storms (sub-divided as 4 “100-yr” storms and 4 “400-yr” storms) were used as representative extreme events for the ELB. Their tracks are shown in the figure below. Each storm is selected to show distinct features, including max wind speed, forward speed and mini-mum pressure, and on its on ability to replicate statistical surge level within the ELB area. Important-ly, while these storms reflect 100- and 400-YRP conditions near the ELB, they are not necessarily valid representations of such return levels outside of that area.
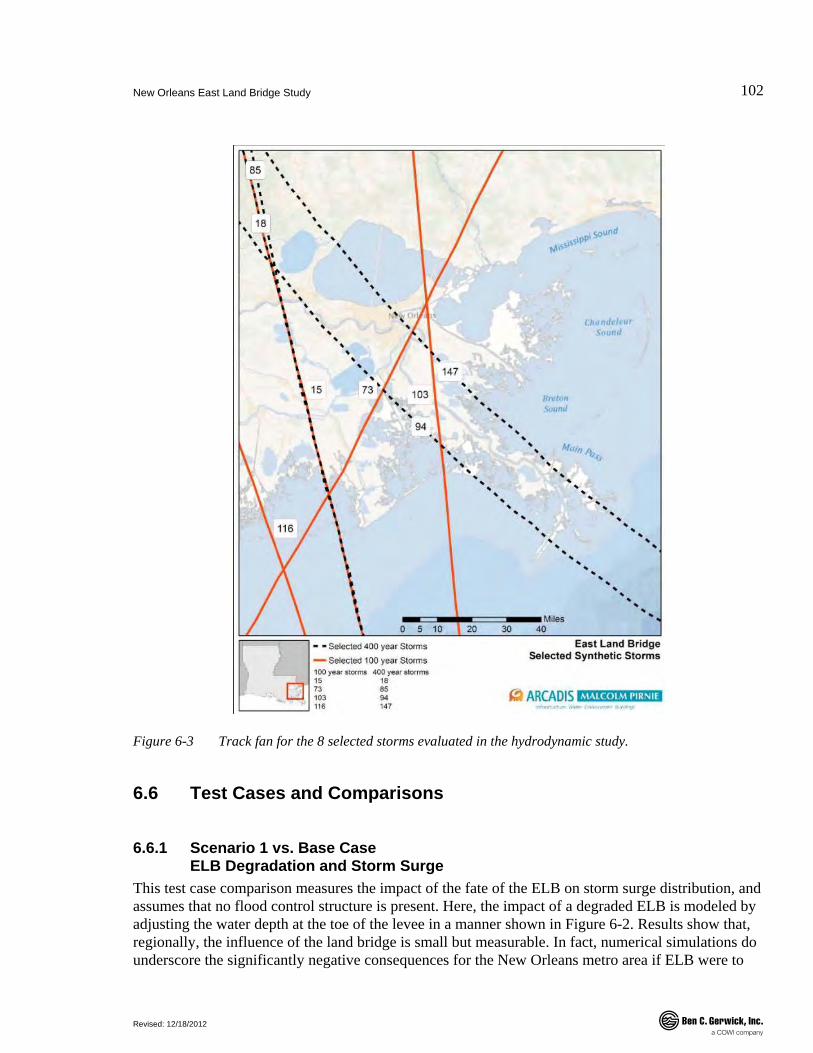
New Orleans East Land Bridge Study
Revised: 12/18/2012
102
.
Figure 6-3 Track fan for the 8 selected storms evaluated in the hydrodynamic study.
6.6 Test Cases and Comparisons
6.6.1 Scenario 1 vs. Base Case ELB Degradation and Storm Surge
This test case comparison measures the impact of the fate of the ELB on storm surge distribution, and assumes that no flood control structure is present. Here, the impact of a degraded ELB is modeled by adjusting the water depth at the toe of the levee in a manner shown in Figure 6-2. Results show that, regionally, the influence of the land bridge is small but measurable. In fact, numerical simulations do underscore the significantly negative consequences for the New Orleans metro area if ELB were to
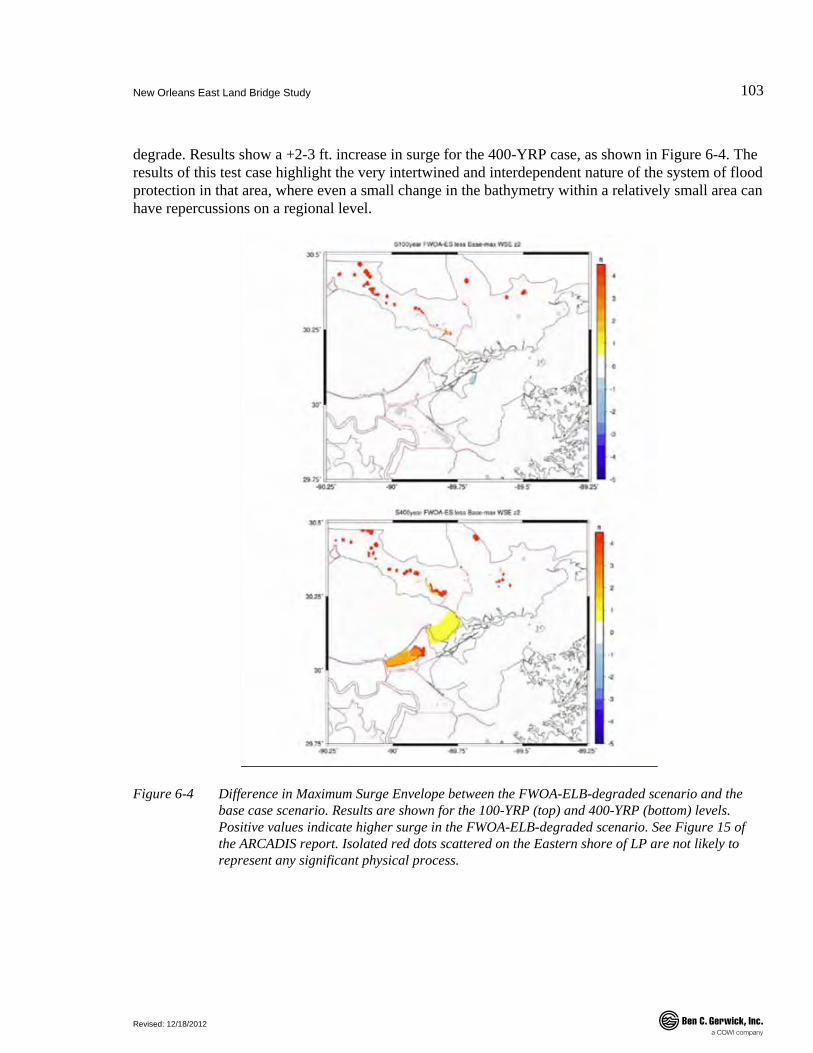
New Orleans East Land Bridge Study
Revised: 12/18/2012
103
.
degrade. Results show a +2-3 ft. increase in surge for the 400-YRP case, as shown in Figure 6-4. The results of this test case highlight the very intertwined and interdependent nature of the system of flood protection in that area, where even a small change in the bathymetry within a relatively small area can have repercussions on a regional level.
Figure 6-4 Difference in Maximum Surge Envelope between the FWOA-ELB-degraded scenario and the base case scenario. Results are shown for the 100-YRP (top) and 400-YRP (bottom) levels. Positive values indicate higher surge in the FWOA-ELB-degraded scenario. See Figure 15 of the ARCADIS report. Isolated red dots scattered on the Eastern shore of LP are not likely to represent any significant physical process.
New Orleans East Land Bridge Study
Revised: 12/18/2012
104
.
6.6.2 Scenario 2 vs. Base Case Efficacy of Gates at Passes
The presence of gates at the Rigolets and Chef Menteur passes offers a significant reduction in surge levels at Lake Pontchartrain, with a reduction of up to 3-5ft for the 100 and 400-YRP level. However, the figure below show that this benefit comes at a high hydraulic cost for neighboring areas, with in-creases in surge of 3-4 ft. at IHNC, and 1-2 ft. over large expanses extending well over MS and Caer-narvon. It should be further noted that for reasons mentioned above in Section 6.5 for the areas away from ELB, the responses tend to be storm dependent and do not represent 100- and 400-YRP surge elevations well. These results are evidence of the trade off to be achieved between a large reduction in flood risk in the LPB and increased hydraulic burden for LB areas and beyond.
Figure 6-5 Difference in maximum surge envelope between the gate-closed scenario and the base scenario. Positive values indicate higher surge in the gate-closed scenario. Shown for the 100- (top) and 400-YRP (bottom) cases. See Figure 17 of the ARCADIS report.
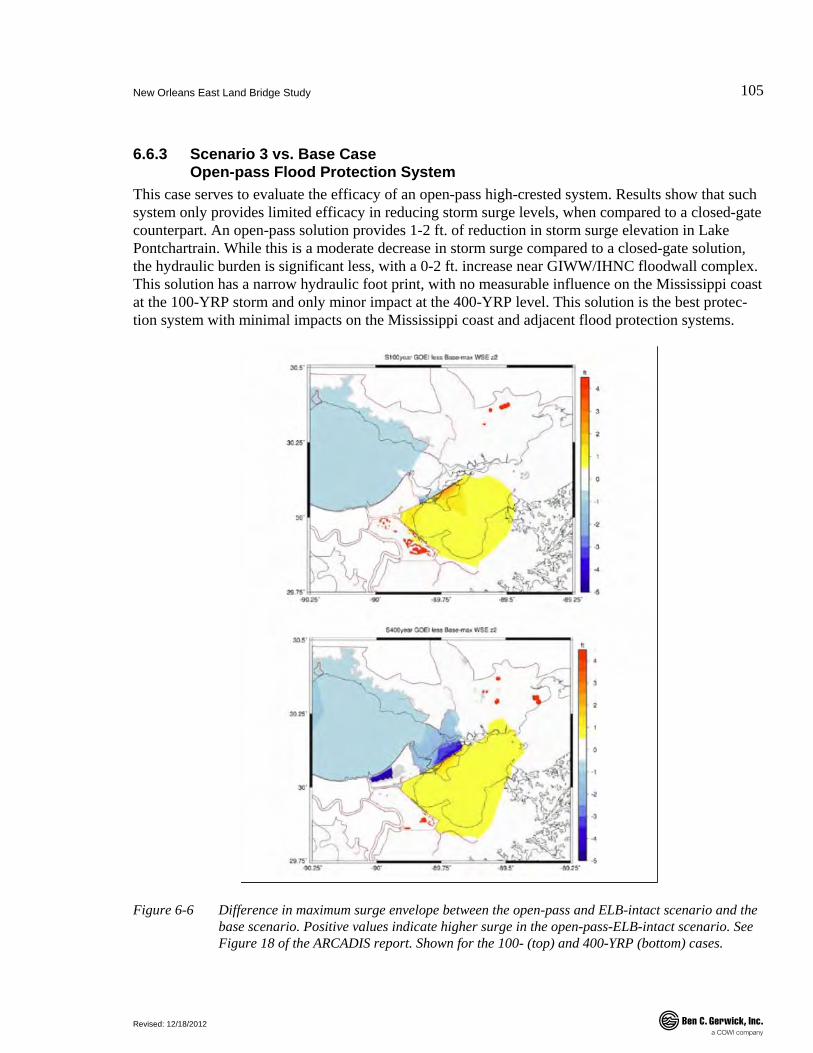
New Orleans East Land Bridge Study
Revised: 12/18/2012
105
.
6.6.3 Scenario 3 vs. Base Case Open-pass Flood Protection System
This case serves to evaluate the efficacy of an open-pass high-crested system. Results show that such system only provides limited efficacy in reducing storm surge levels, when compared to a closed-gate counterpart. An open-pass solution provides 1-2 ft. of reduction in storm surge elevation in Lake Pontchartrain. While this is a moderate decrease in storm surge compared to a closed-gate solution, the hydraulic burden is significant less, with a 0-2 ft. increase near GIWW/IHNC floodwall complex. This solution has a narrow hydraulic foot print, with no measurable influence on the Mississippi coast at the 100-YRP storm and only minor impact at the 400-YRP level. This solution is the best protec-tion system with minimal impacts on the Mississippi coast and adjacent flood protection systems.
Figure 6-6 Difference in maximum surge envelope between the open-pass and ELB-intact scenario and the base scenario. Positive values indicate higher surge in the open-pass-ELB-intact scenario. See Figure 18 of the ARCADIS report. Shown for the 100- (top) and 400-YRP (bottom) cases.
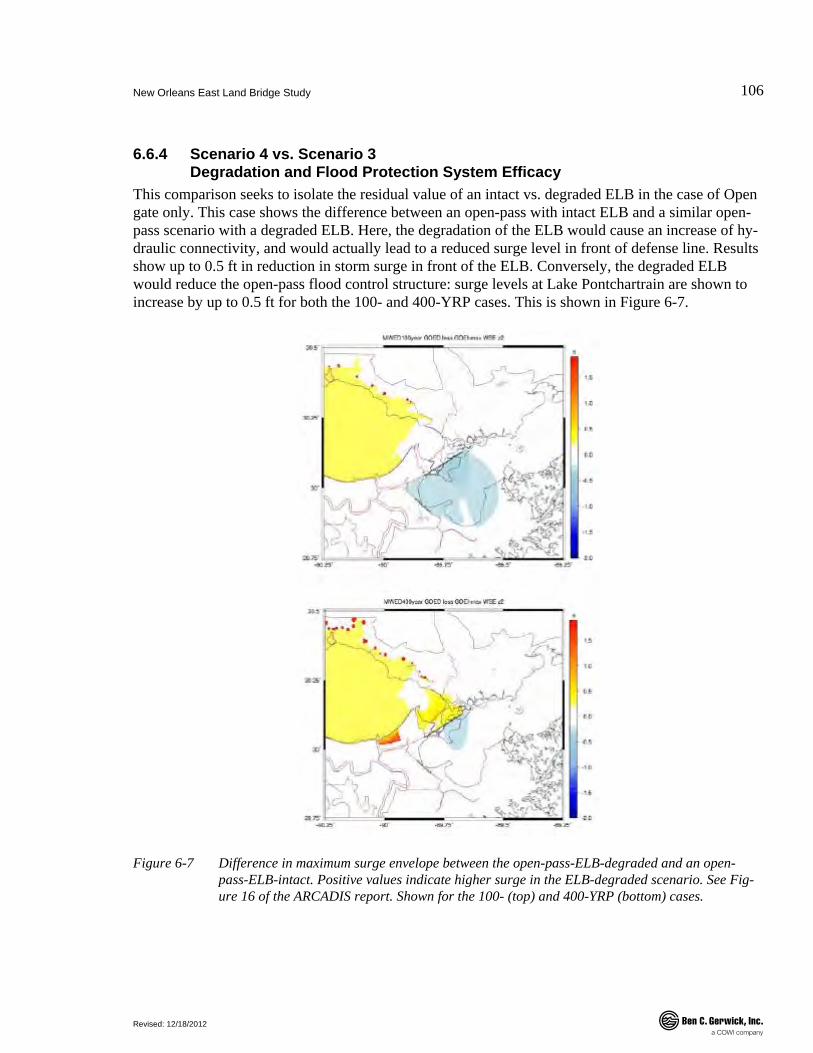
New Orleans East Land Bridge Study
Revised: 12/18/2012
106
.
6.6.4 Scenario 4 vs. Scenario 3 Degradation and Flood Protection System Efficacy
This comparison seeks to isolate the residual value of an intact vs. degraded ELB in the case of Open gate only. This case shows the difference between an open-pass with intact ELB and a similar open-pass scenario with a degraded ELB. Here, the degradation of the ELB would cause an increase of hy-draulic connectivity, and would actually lead to a reduced surge level in front of defense line. Results show up to 0.5 ft in reduction in storm surge in front of the ELB. Conversely, the degraded ELB would reduce the open-pass flood control structure: surge levels at Lake Pontchartrain are shown to increase by up to 0.5 ft for both the 100- and 400-YRP cases. This is shown in Figure 6-7.
Figure 6-7 Difference in maximum surge envelope between the open-pass-ELB-degraded and an open-pass-ELB-intact. Positive values indicate higher surge in the ELB-degraded scenario. See Fig-ure 16 of the ARCADIS report. Shown for the 100- (top) and 400-YRP (bottom) cases.
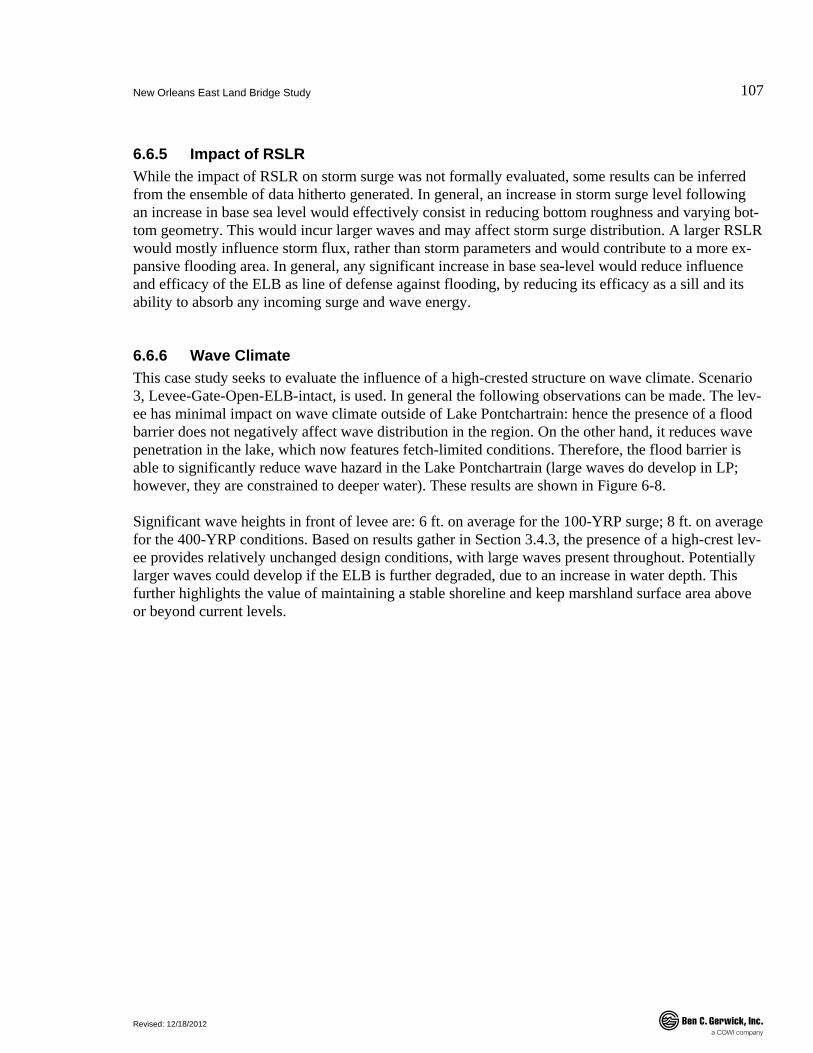
New Orleans East Land Bridge Study
Revised: 12/18/2012
107
.
6.6.5 Impact of RSLR While the impact of RSLR on storm surge was not formally evaluated, some results can be inferred from the ensemble of data hitherto generated. In general, an increase in storm surge level following an increase in base sea level would effectively consist in reducing bottom roughness and varying bot-tom geometry. This would incur larger waves and may affect storm surge distribution. A larger RSLR would mostly influence storm flux, rather than storm parameters and would contribute to a more ex-pansive flooding area. In general, any significant increase in base sea-level would reduce influence and efficacy of the ELB as line of defense against flooding, by reducing its efficacy as a sill and its ability to absorb any incoming surge and wave energy.
6.6.6 Wave Climate This case study seeks to evaluate the influence of a high-crested structure on wave climate. Scenario 3, Levee-Gate-Open-ELB-intact, is used. In general the following observations can be made. The lev-ee has minimal impact on wave climate outside of Lake Pontchartrain: hence the presence of a flood barrier does not negatively affect wave distribution in the region. On the other hand, it reduces wave penetration in the lake, which now features fetch-limited conditions. Therefore, the flood barrier is able to significantly reduce wave hazard in the Lake Pontchartrain (large waves do develop in LP; however, they are constrained to deeper water). These results are shown in Figure 6-8.
Significant wave heights in front of levee are: 6 ft. on average for the 100-YRP surge; 8 ft. on average for the 400-YRP conditions. Based on results gather in Section 3.4.3, the presence of a high-crest lev-ee provides relatively unchanged design conditions, with large waves present throughout. Potentially larger waves could develop if the ELB is further degraded, due to an increase in water depth. This further highlights the value of maintaining a stable shoreline and keep marshland surface area above or beyond current levels.
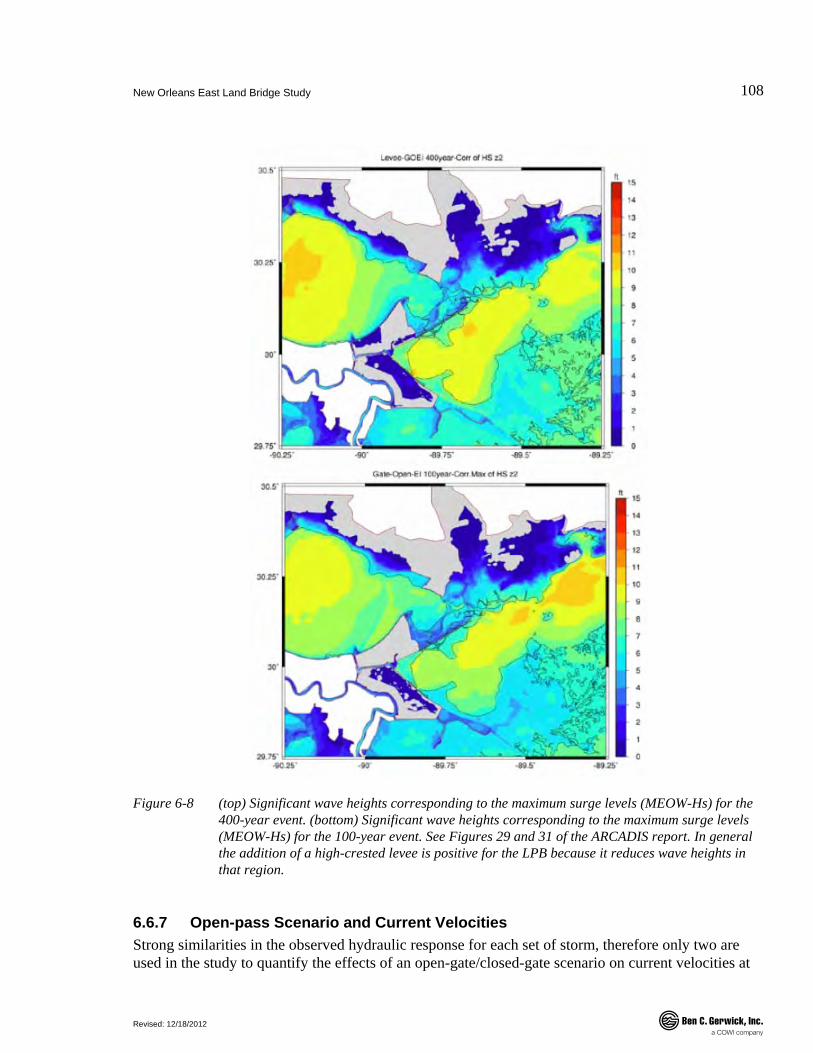
New Orleans East Land Bridge Study
Revised: 12/18/2012
108
.
Figure 6-8 (top) Significant wave heights corresponding to the maximum surge levels (MEOW-Hs) for the 400-year event. (bottom) Significant wave heights corresponding to the maximum surge levels (MEOW-Hs) for the 100-year event. See Figures 29 and 31 of the ARCADIS report. In general the addition of a high-crested levee is positive for the LPB because it reduces wave heights in that region.
6.6.7 Open-pass Scenario and Current Velocities Strong similarities in the observed hydraulic response for each set of storm, therefore only two are used in the study to quantify the effects of an open-gate/closed-gate scenario on current velocities at

New Orleans East Land Bridge Study
Revised: 12/18/2012
109
.
the passes. In this context, storm 073 is selected to illustrate the 100-YRP event and storm 147 is se-lected for the 400-YRP event. As expected, the results of the ADCIRC modeling confirm that the presence of closed gates (Scenario 2) essentially eliminates any current from developing at the passes; the base case, similarly, does not induce locally high current velocities because the flow is not con-strained to any particular path in the absence of a flood protection system.
For the open-gate solution (Scenario 3) a strong hydraulic gradient between the Lake Borgne (Gulf side) and Pontchartrain (protected side) develops, with the flow now constrained into the passes. This results in somewhat elevated current velocities to occur during a storm event at the Chef Menteur pass near the intersection with the levee alignment; and current velocities on the order of 30-40 ft/s at Rigolets (deeper channel) for the 100-YRP storm (storm 073) most likely in the deepest part of the channel. At the 400-YRP level, these results remain somewhat similar. These depth-averaged veloci-ties should be interpreted cautiously as the model deployed to generate these results did not fully in-clude 3-dimensional effects. These should be considered and evaluated in final design simulations. Results show that the flow velocities are much larger during the flood phase than during ebb condi-tions. The flow rates recorded during the latter are approximately 50% smaller than those during ebb conditions.
The results also show that the configuration of an open-pass levee with degraded ELB renders a slightly larger Froude number in comparison with that of open-pass levee with an intact ELB scenar-io. Excessive scour and structural instabilities are likely to occur without proper armoring of the levee transitions. In that sense, the preservation of a healthy ELB shoreline and marshland near the poten-tial openings would in turn limit potential damage and further erosion at these locations.
In addition to armoring of the slopes, mitigating measures to reduce flow velocity appear limited: the width of the openings is directly tied to the performance of the flood control system: wider opening would reduce flow velocity, but would negatively impact the flood reduction potential of the system. In addition, a narrowing of these openings would contradict the tradeoff conceded earlier, that seeks to reconcile environmental concerns by minimizing their effect on local ecosystem and tidal prism (see Section 2.1).
The results illustrate the relative difficulty in achieving a balance between a higher level of protection against flood risk with a high hydraulic footprint and a somewhat transparent solution that includes open passes and high current velocities.
6.7 Summary of Results This section seeks to extract the essence of the data gathered from these results in a manner consistent with the specific objectives set for this study.
6.7.1 Objective A To assess the effect of subsidence and marshland within the project area and their impact on hurri-cane storm surge hazard.

New Orleans East Land Bridge Study
Revised: 12/18/2012
110
.
► Results show that, regionally, in absence of a flood barrier, the influence of the ELB is small but measurable. At the 400-YRP level, a degraded ELB contributes to an increase in surge level at New Orleans East (NOE) polder of 2 to 3ft, and up to 1ft north of the ELB.
► With a flood barrier the influence of an intact ELB is more nuanced. The performance of the open-gate levee is similar for with and without the ELB; but the results of the hydrodynamic analysis show that the combination of the open-gate levee with an intact ELB does perform somewhat better than the open-gate levee with degraded ELB and incurs less additional burden on neighboring areas.
► An intact ELB also reduces current velocities if an open-pass solution is retained.
6.7.2 Objective B To assess the effects of the presence of gates at Chef Menteur and Rigolets passes.
Closed Gates
► A complete hydraulic closure of the Lake Pontchartrain through the use of gates at the Chef Menteur and Rigolets passes has pronounced effects on storm surge distribution. It is able to pro-vide a significant reduction in the storm surge elevation in Lake Pontchartrain, with some areas for which flooding is prevented altogether.
► The added hydraulic burden placed on adjacent levee systems is equally appreciable, with local increases of up to 3ft along the Mississippi coast, more than 1 ft throughout the northern portion of Caernarvon Marsh and Biloxi Marsh and 4ft in the Lake Borgne/GIWW area at the 100-YRP level.
Open-pass
► The open-pass levee with an intact ELB reduces the 100-YRP surge in Lake Pontchartrain by ap-proximately 1ft. The "cost" of this reduction is 1ft increase in the flood level in Lake Borgne and up to 3ft immediately in front of the ELB levee. At the 400-YRP level, an overall reduction in the surge level of 1ft is observed, with larger decreases immediately behind the ELB defense line.
► A levee structure with the two major passes open, in conjunction with the intact ELB area, reduc-es the surge level in Lake Pontchartrain and the inundation area on the North shore of the lake while the impacts on Mississippi State are minimized.
6.7.3 Objective C To assess the impact of a new structure on the time and spatial redistribution of storm surge near the ELB and vicinity
► In general, results illustrate the trade-off that exists between adding an effective flood control sys-tem and an increased hydraulic burden inflicted on adjacent regions.
► A significant reduction in the region of influence, along with a good level of flood reduction at the 100-YRP and 400-YRP level, can be achieved with a minimal cost to neighboring areas if no

New Orleans East Land Bridge Study
Revised: 12/18/2012
111
.
gates are present. In that case, an intact ELB provides additional storm surge damping benefits with no detectable additional burden placed on existing lines of defense.

New Orleans East Land Bridge Study
Revised: 12/18/2012
112
.
7 Proposed Plan The results of the hydrodynamic assessment confirm the value and tangible benefits to be obtained from the installation of a high-crested levee at the ELB. Technical details pertaining to the structure of the levee and its connections to exiting or future levee systems will be refined in a detailed study. This section is dedicated to establishing the foundations of a proof of concept flood protection design, and to expanding on Step 2 and 3 described earlier.
Here, in light of the constraints defined in Section 4; the results obtained from the numerical analysis reported in the Appendix and summarized in Section 5; and the data collected in Sections 2 and 3, the choice is made to plan for a levee system that would be of the "without-gate" type.
7.1 Plan Outline The current plan, as delineated from the data and information compiled in this report consists of the three main steps:
• Step 1: High-crested levee. Perform a feasibility study and complete a conceptual design for a high-crested levee at the ELB. Establishing a path forward to achieve overall acceptability for this feature is the primary goal of this step.
• Step 2: FSSP monitoring program. Track success through quantifiable metrics such as a re-growth index, organic top-layer measurements; aerial photo and on-site collection campaign. Fo-cus on the on-going Alligator Bend restoration project.
• Step 3: Complement/augment existing FSSP with ad-hoc measures wherever required. Condi-tioned to efficacy of high-crested levee in limiting storm surge, augment and/or complement ex-isting FSSP at critical areas where shoreline stabilization is critical and participates in improving the efficacy of the flood control system.
Each step is elaborated upon in the following section.
7.2 Step 1: High-crested Levee
7.2.1 Structure High-crested earthen levees are designed to provide direct protection against flooding during a surge event. The proposed levee is designed to limit and accommodate seepage through its core by featur-ing a clay cover on the flood side. Alternatives include slurry walls and clay cores, with a filter mate-rial to be placed on either side. This study recommends the latter.

New Orleans East Land Bridge Study
Revised: 12/18/2012
113
.
7.2.2 Soil Preparation The organic nature of the top soil present at the ELB will require significant excavation and soil prep-aration to be performed prior to the installation of earthen levees or flood walls in order to avoid ex-cessive settlement (expected to be on the order of 5 to 10ft based on anticipated size of the project and initial geotechnical assessment9). In addition, the placement of riprap or other granular-based shore protection would require the use of geo-fabric to limit settlement and native soil migration through the rock layer. These extra costs for soil preparation are included in the preliminary cost es-timates presented Section 7.5.
7.2.3 Turf reinforcement Turf reinforcement may be judiciously employed to limit erosion during overtopping events. Based on (USACE 2007), turf reinforcement has four distinct advantages over any other system of levee armoring. Foremost, the turf reinforcement does not contribute any significant weight that will induce settlement or stability issues. The cost of a synthetic turf reinforcement solution is anticipated to be much less than rock or any other heavy material because of sourcing locations and weight. In addi-tion, turf reinforcement can be more quickly installed than any other system. Pending proper design, maintenance is anticipated to be less burdensome as that required for traditional armoring solution (which may require re-grading after a storm event). This is clear advantage over riprap or lesser-used gabion mattresses that may become overwhelmed with trees and shrubs. Their removal drives maintenance costs higher.
7.2.4 Provision for Overtopping and Run-up Overtopping protection is required for the crest and the protected side of the levee. The periodic na-ture of wave overtopping makes a difference between wave overtopping and steady flow overtopping. As each wave overtops, it has a forward velocity across the levee crest that likely exceeds the crest velocity of surge overtopping. Thus, unprotected soil on the levee crest that is stable for surge over-topping may erode if waves overtop. However, this flow condition is unsteady and peak velocities are sustained for only a brief time. In addition, the unsteady discharge over the crest results in a limited overtopping volume. Consequently, any erosion on the leeside slope due to wave overtopping is in-termittent, and probably does not progress at rates as high as what can occur for steady surge over-topping. Ample studies have been performed that show that simple steps can be taken during design to limit overtopping: the slope angle, berm width, toe, freeboard height and concrete elements can all be fine-tuned to reduce mean overtopping volume and its consequences on erosion. See for instance the EurOtop manual (Pullen et al. 2007) and the CEM (Morang and Szuwalski 2003) for detailed formulations and methods to reduce overtopped volumes.
7.2.5 Wave Action and Scour Protection Riprap is positioned on the flood side of the levee to protect against repeated wave action. Turf rein-forcement, specialty vegetation covers such as vetiver grass or other strong natural revetment would be beneficial to mitigate destabilizing forces acting on the stones during heavy overtopping action (up
9 The estimates for short- and long-term settlements should be refined in a detailed geotechnical assessment.
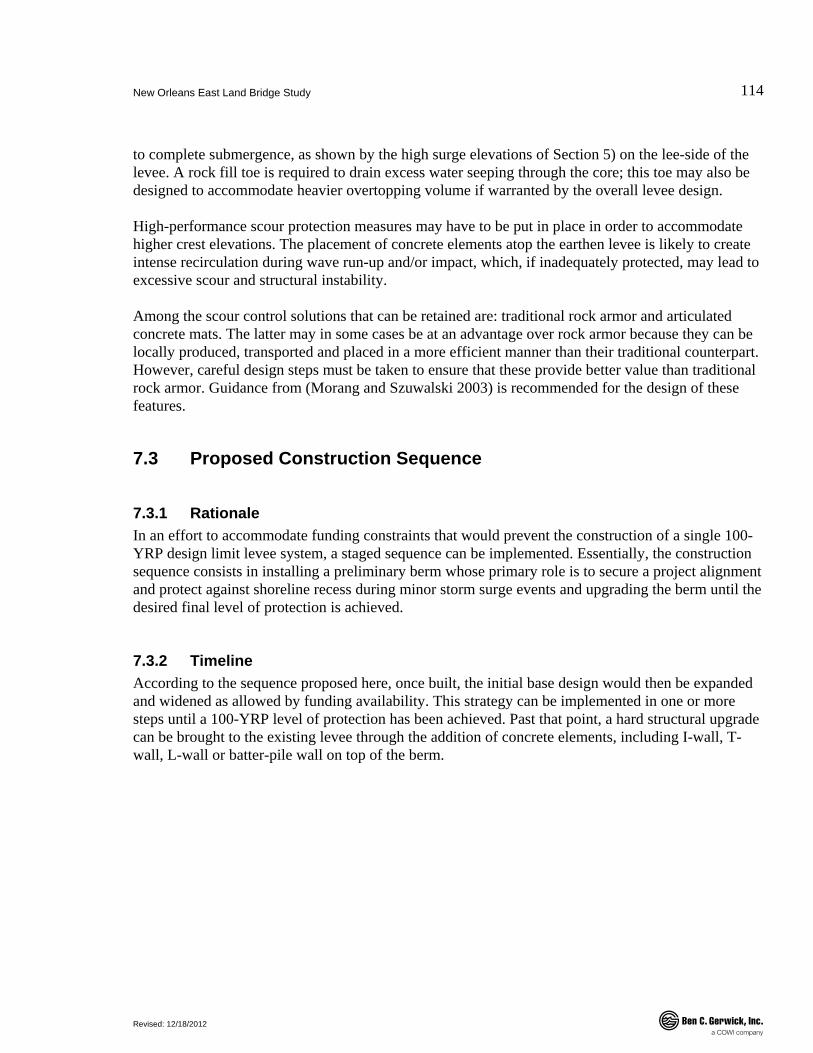
New Orleans East Land Bridge Study
Revised: 12/18/2012
114
.
to complete submergence, as shown by the high surge elevations of Section 5) on the lee-side of the levee. A rock fill toe is required to drain excess water seeping through the core; this toe may also be designed to accommodate heavier overtopping volume if warranted by the overall levee design.
High-performance scour protection measures may have to be put in place in order to accommodate higher crest elevations. The placement of concrete elements atop the earthen levee is likely to create intense recirculation during wave run-up and/or impact, which, if inadequately protected, may lead to excessive scour and structural instability.
Among the scour control solutions that can be retained are: traditional rock armor and articulated concrete mats. The latter may in some cases be at an advantage over rock armor because they can be locally produced, transported and placed in a more efficient manner than their traditional counterpart. However, careful design steps must be taken to ensure that these provide better value than traditional rock armor. Guidance from (Morang and Szuwalski 2003) is recommended for the design of these features.
7.3 Proposed Construction Sequence
7.3.1 Rationale In an effort to accommodate funding constraints that would prevent the construction of a single 100-YRP design limit levee system, a staged sequence can be implemented. Essentially, the construction sequence consists in installing a preliminary berm whose primary role is to secure a project alignment and protect against shoreline recess during minor storm surge events and upgrading the berm until the desired final level of protection is achieved.
7.3.2 Timeline According to the sequence proposed here, once built, the initial base design would then be expanded and widened as allowed by funding availability. This strategy can be implemented in one or more steps until a 100-YRP level of protection has been achieved. Past that point, a hard structural upgrade can be brought to the existing levee through the addition of concrete elements, including I-wall, T-wall, L-wall or batter-pile wall on top of the berm.
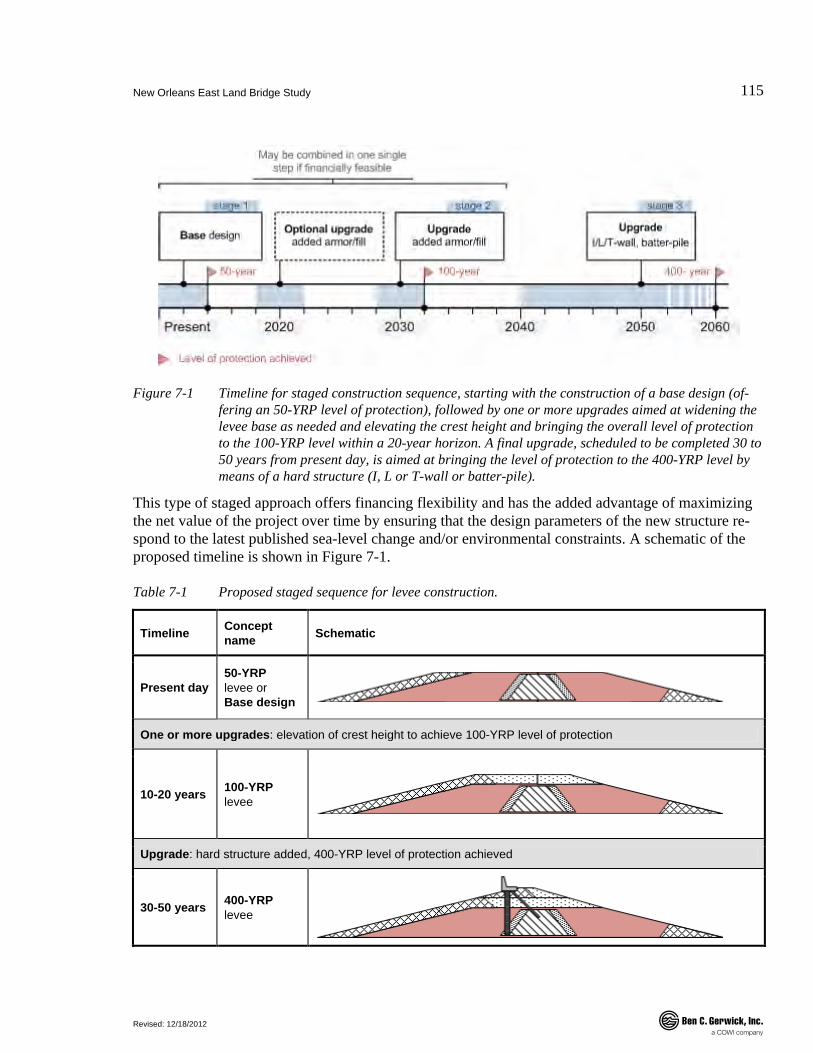
New Orleans East Land Bridge Study
Revised: 12/18/2012
115
.
Figure 7-1 Timeline for staged construction sequence, starting with the construction of a base design (of-fering an 50-YRP level of protection), followed by one or more upgrades aimed at widening the levee base as needed and elevating the crest height and bringing the overall level of protection to the 100-YRP level within a 20-year horizon. A final upgrade, scheduled to be completed 30 to 50 years from present day, is aimed at bringing the level of protection to the 400-YRP level by means of a hard structure (I, L or T-wall or batter-pile).
This type of staged approach offers financing flexibility and has the added advantage of maximizing the net value of the project over time by ensuring that the design parameters of the new structure re-spond to the latest published sea-level change and/or environmental constraints. A schematic of the proposed timeline is shown in Figure 7-1.
Table 7-1 Proposed staged sequence for levee construction.
Timeline Concept name Schematic
Present day 50-YRP levee or Base design
One or more upgrades: elevation of crest height to achieve 100-YRP level of protection
10-20 years 100-YRP levee
Upgrade: hard structure added, 400-YRP level of protection achieved
30-50 years 400-YRP levee
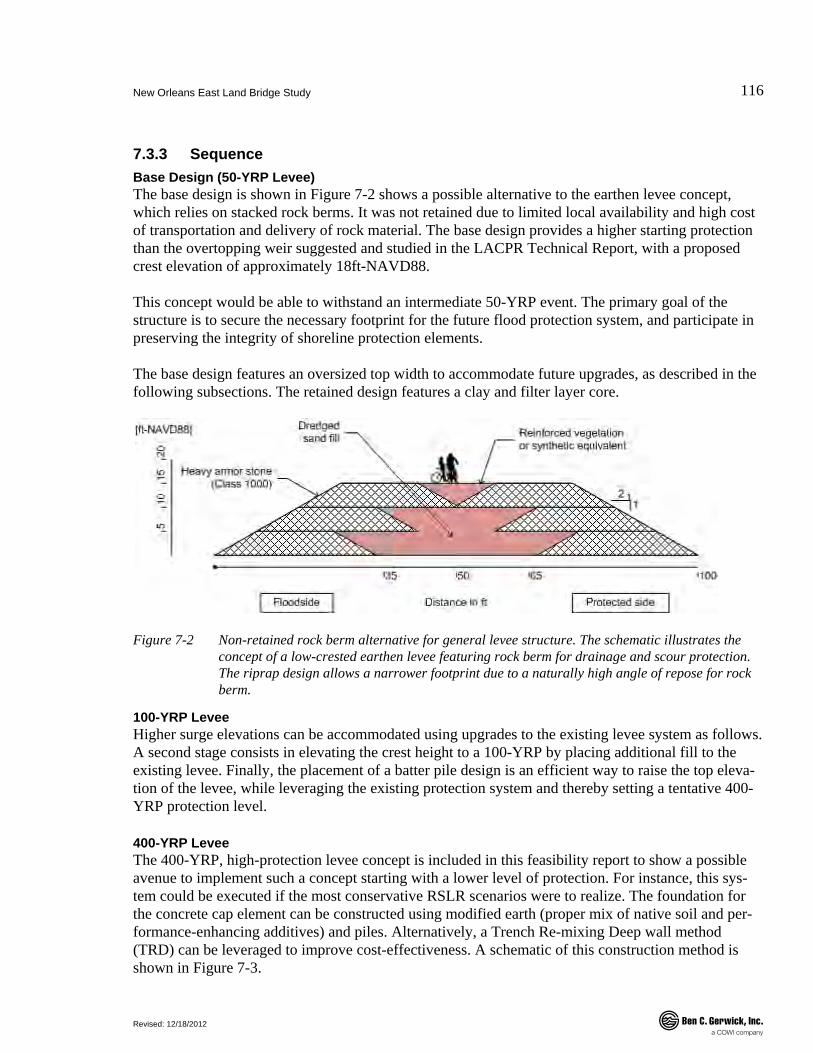
New Orleans East Land Bridge Study
Revised: 12/18/2012
116
.
7.3.3 Sequence Base Design (50-YRP Levee) The base design is shown in Figure 7-2 shows a possible alternative to the earthen levee concept, which relies on stacked rock berms. It was not retained due to limited local availability and high cost of transportation and delivery of rock material. The base design provides a higher starting protection than the overtopping weir suggested and studied in the LACPR Technical Report, with a proposed crest elevation of approximately 18ft-NAVD88.
This concept would be able to withstand an intermediate 50-YRP event. The primary goal of the structure is to secure the necessary footprint for the future flood protection system, and participate in preserving the integrity of shoreline protection elements.
The base design features an oversized top width to accommodate future upgrades, as described in the following subsections. The retained design features a clay and filter layer core.
Figure 7-2 Non-retained rock berm alternative for general levee structure. The schematic illustrates the concept of a low-crested earthen levee featuring rock berm for drainage and scour protection. The riprap design allows a narrower footprint due to a naturally high angle of repose for rock berm.
100-YRP Levee Higher surge elevations can be accommodated using upgrades to the existing levee system as follows. A second stage consists in elevating the crest height to a 100-YRP by placing additional fill to the existing levee. Finally, the placement of a batter pile design is an efficient way to raise the top eleva-tion of the levee, while leveraging the existing protection system and thereby setting a tentative 400-YRP protection level.
400-YRP Levee The 400-YRP, high-protection levee concept is included in this feasibility report to show a possible avenue to implement such a concept starting with a lower level of protection. For instance, this sys-tem could be executed if the most conservative RSLR scenarios were to realize. The foundation for the concrete cap element can be constructed using modified earth (proper mix of native soil and per-formance-enhancing additives) and piles. Alternatively, a Trench Re-mixing Deep wall method (TRD) can be leveraged to improve cost-effectiveness. A schematic of this construction method is shown in Figure 7-3.
New Orleans East Land Bridge Study
Revised: 12/18/2012
117
.
7.3.4 General Considerations Availability of Burrow Assumptions are based on local contractors' input during the cost estimating phase regarding local availability of burrow for levee construction. However, this issue remains of critical importance and should warrant detailed analysis in the final design phase. A preliminary quantity take-off indicates that the quantity of material required to build the 17-mile alignment is significant, with approx. 200,000 cubic yards of fill/clay, which may bear serious environmental consequences if directly sourced from southern Louisiana.
Soil Improvement As mentioned earlier, soils along the proposed alignment are extremely soft. The soils are very com-pressible generally consisting of slightly organic clays and peat extending approximately 15-ft to 30-ft below the mud line. These materials are typically underlain by very soft to soft clay, silty clay, and slightly organic clay to the boring termination depth of 40-ft to 60-ft. Proper soil improvement tech-niques (short piles; remixing) will be required before erecting the levees. Additional calculations will also be needed to assess long-term settlement.
Option for Upgrading: Trench Cutting Communications with local contractors and design firms indicate that trench cutting techniques cur-rently allow for excavating up to 150 ft deep. In addition, they also confirm that the simultaneous driving of steel pipes or pre-stressed concrete piles is possible: this allows for the placement of ten-sion-capable elements at the top of the levee. One limitation to the trench-cutting system is that it is only effective on a straight line. Circular trajectories, while limited in the proposed alignment may be managed using alternative techniques.
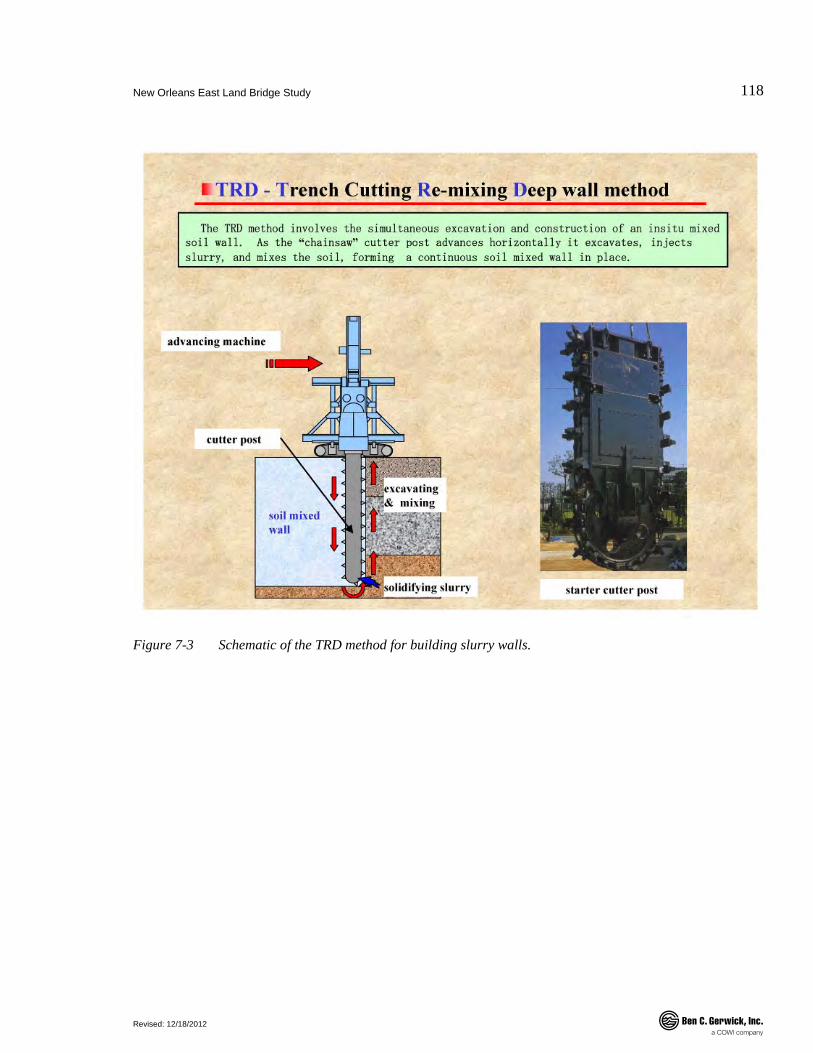
New Orleans East Land Bridge Study
Revised: 12/18/2012
118
.
Figure 7-3 Schematic of the TRD method for building slurry walls.

New Orleans East Land Bridge Study
Revised: 12/18/2012
119
.
Figure 7-4 Base design or 50-YRP levee: this is the first step in the staged construction sequence. This low-crested earthen levee features impervious clay cores, riprap as scour protection on the flood side and toe rock fill for proper drainage. The approximate return period which this structure can withstand is 50 years. Water levels are as follows: (F) indicate future conditions and (P) refers to present conditions.
Figure 7-5 100-YRP levee design. This concept is an upgraded version of the basic low-crested levee as shown in Figure 7-4, after addition of armor rock and fill on top of the existing structure. In this implementation, the 100-YRP levee design may also be obtained by widening the base design cross-sectional width.
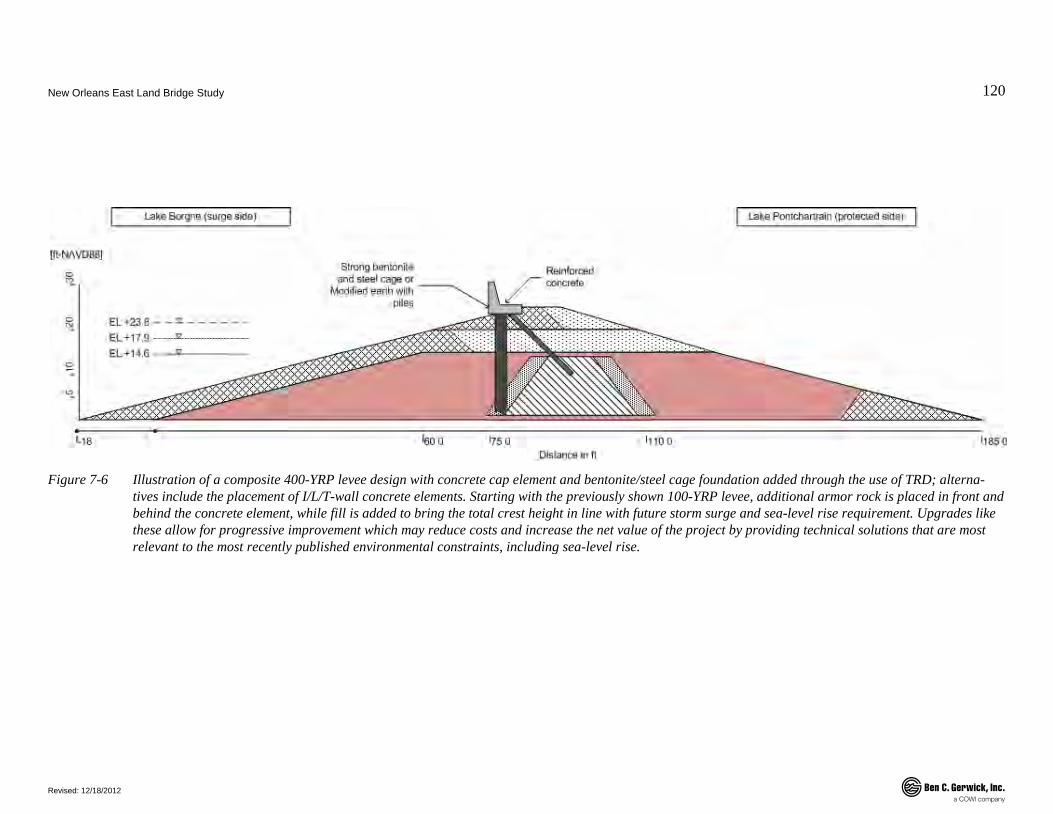
New Orleans East Land Bridge Study
Revised: 12/18/2012
120
.
Figure 7-6 Illustration of a composite 400-YRP levee design with concrete cap element and bentonite/steel cage foundation added through the use of TRD; alterna-
tives include the placement of I/L/T-wall concrete elements. Starting with the previously shown 100-YRP levee, additional armor rock is placed in front and behind the concrete element, while fill is added to bring the total crest height in line with future storm surge and sea-level rise requirement. Upgrades like these allow for progressive improvement which may reduce costs and increase the net value of the project by providing technical solutions that are most relevant to the most recently published environmental constraints, including sea-level rise.

New Orleans East Land Bridge Study
Revised: 12/18/2012
121
.
7.4 End Caps
7.4.1 Purpose If no gates are installed at the Rigolets and (possibly) Chef Menteur passes, during a storm event, it was shown that large current velocities are anticipated to develop in the pass channels. This bears consequences on erosion and structural stability of the levees at these locations. Therefore, adequate protection should be provided near the levee ends where they meet with the Chef Menteur and Rigolets passes. Essentially, scour protection elements are required to prevent any catastrophic failure of these connections and ensure proper function of the remaining part of the levee system. Here, a concept armored cap is proposed. It features a width of 150ft with a length of approximately 250ft. The structure is designed to withstand very high velocities and heavy overtopping and/or complete submergence, all to be expected during a severe storm event.
In absence of a navigational structure, the main forcing during a storm event is the potentially signifi-cant scouring effect of the flow developing at the pass. From calculations and circulation models al-ready implemented in the LACPR Technical Report and IPET reports (Link et al. 2009; USACE 2009), it is known that velocities of up to 𝑉Max = 10-15ft/s are likely to be observed in narrow natural pathways, such as the Chef Menteur and Rigolets passes. In that sense, the construction of a high-crested levee system, such as that proposed in this feasibility study, would in turn accentuate the con-striction and would induce higher velocities. Note that erosive forces are not the only ones to be con-sidered: impact, floating debris and damming loads are very likely to occur during a major storm event. These would be part of a final design effort, which is outside the scope of the present study.
7.4.2 Preliminary Design Features The hydrodynamic study reveals that current velocities of on the order of 25-30 ft/s may develop at Chef Menteur. While the validity of this result is not questioned, it should be taken cautiously: this value was derived from a large scale, two-dimensional grid, which is inherently unable to render in sufficient details the actual flow field in the immediate vicinity of the armored cap. For instance, it is well known that the flow distribution in an open channel follows a quadratic profile, with the largest velocities developing at its centerline: therefore, it is unreasonable to design riprap protection for the maximum velocities.
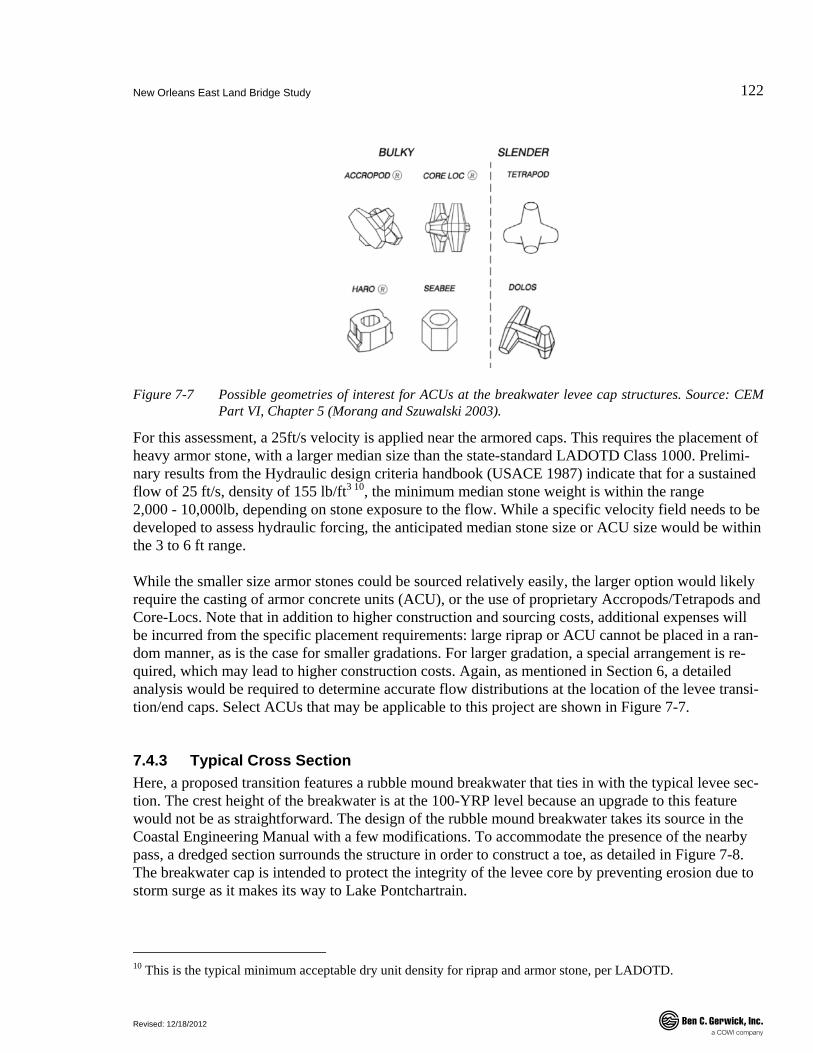
New Orleans East Land Bridge Study
Revised: 12/18/2012
122
.
Figure 7-7 Possible geometries of interest for ACUs at the breakwater levee cap structures. Source: CEM Part VI, Chapter 5 (Morang and Szuwalski 2003).
For this assessment, a 25ft/s velocity is applied near the armored caps. This requires the placement of heavy armor stone, with a larger median size than the state-standard LADOTD Class 1000. Prelimi-nary results from the Hydraulic design criteria handbook (USACE 1987) indicate that for a sustained flow of 25 ft/s, density of 155 lb/ft3 10, the minimum median stone weight is within the range 2,000 - 10,000lb, depending on stone exposure to the flow. While a specific velocity field needs to be developed to assess hydraulic forcing, the anticipated median stone size or ACU size would be within the 3 to 6 ft range.
While the smaller size armor stones could be sourced relatively easily, the larger option would likely require the casting of armor concrete units (ACU), or the use of proprietary Accropods/Tetrapods and Core-Locs. Note that in addition to higher construction and sourcing costs, additional expenses will be incurred from the specific placement requirements: large riprap or ACU cannot be placed in a ran-dom manner, as is the case for smaller gradations. For larger gradation, a special arrangement is re-quired, which may lead to higher construction costs. Again, as mentioned in Section 6, a detailed analysis would be required to determine accurate flow distributions at the location of the levee transi-tion/end caps. Select ACUs that may be applicable to this project are shown in Figure 7-7.
7.4.3 Typical Cross Section Here, a proposed transition features a rubble mound breakwater that ties in with the typical levee sec-tion. The crest height of the breakwater is at the 100-YRP level because an upgrade to this feature would not be as straightforward. The design of the rubble mound breakwater takes its source in the Coastal Engineering Manual with a few modifications. To accommodate the presence of the nearby pass, a dredged section surrounds the structure in order to construct a toe, as detailed in Figure 7-8. The breakwater cap is intended to protect the integrity of the levee core by preventing erosion due to storm surge as it makes its way to Lake Pontchartrain.
10 This is the typical minimum acceptable dry unit density for riprap and armor stone, per LADOTD.
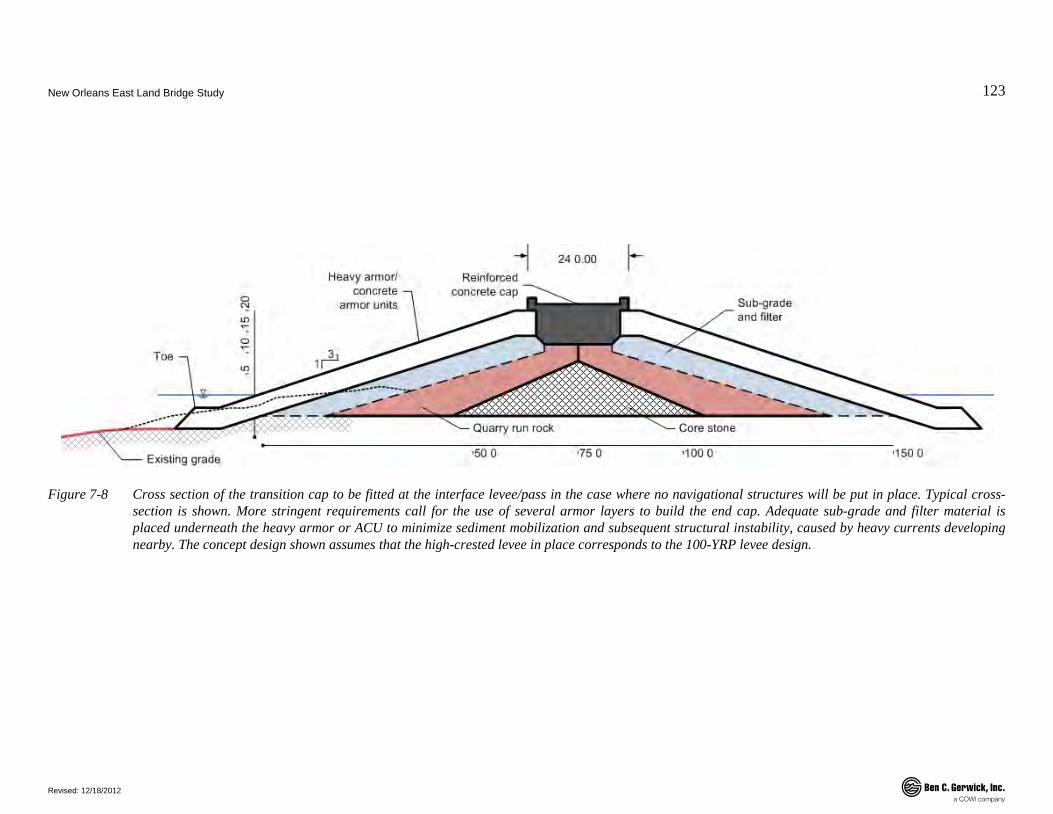
New Orleans East Land Bridge Study
Revised: 12/18/2012
123
.
Figure 7-8 Cross section of the transition cap to be fitted at the interface levee/pass in the case where no navigational structures will be put in place. Typical cross-section is shown. More stringent requirements call for the use of several armor layers to build the end cap. Adequate sub-grade and filter material is placed underneath the heavy armor or ACU to minimize sediment mobilization and subsequent structural instability, caused by heavy currents developing nearby. The concept design shown assumes that the high-crested levee in place corresponds to the 100-YRP levee design.
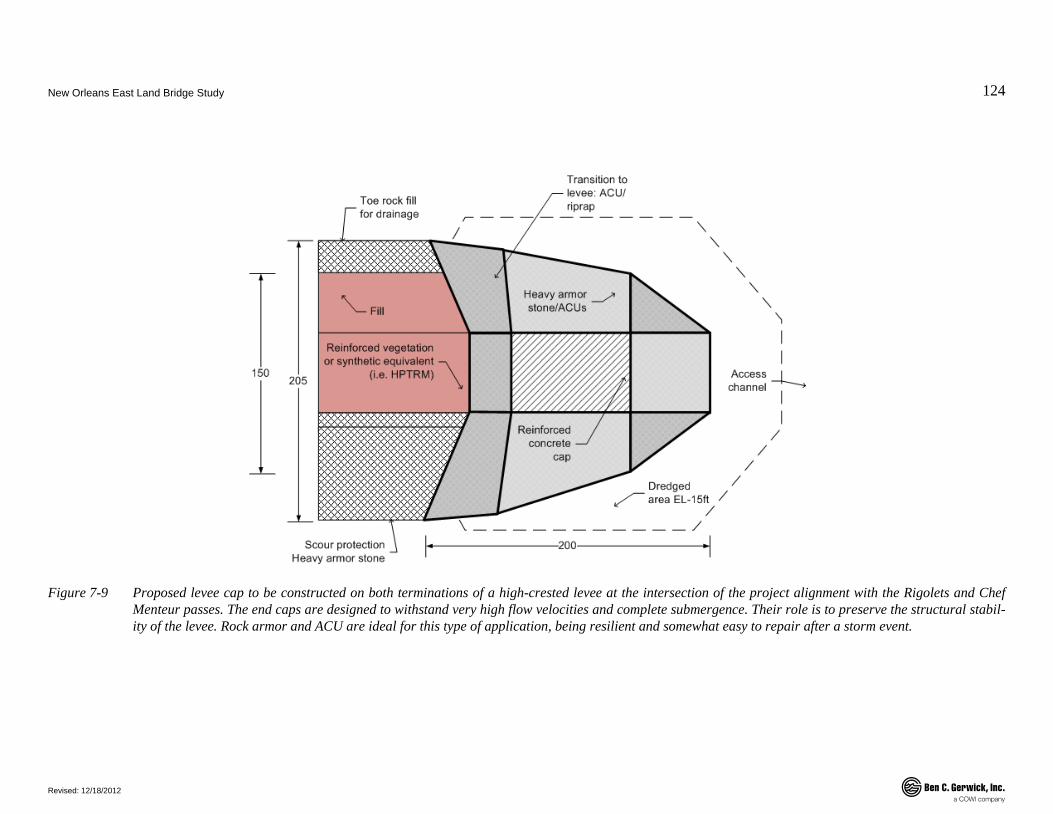
New Orleans East Land Bridge Study
Revised: 12/18/2012
124
.
Figure 7-9 Proposed levee cap to be constructed on both terminations of a high-crested levee at the intersection of the project alignment with the Rigolets and Chef Menteur passes. The end caps are designed to withstand very high flow velocities and complete submergence. Their role is to preserve the structural stabil-ity of the levee. Rock armor and ACU are ideal for this type of application, being resilient and somewhat easy to repair after a storm event.
New Orleans East Land Bridge Study
Revised: 12/18/2012
125
.
7.5 Cost Estimates
7.5.1 Overview A rough order of magnitude for the cost of the Base design (50-YRP levee) and 100-YRP levee con-cepts was developed. Costs indicated below reflect local material availability. In addition, the cost of upgrading the levee from a 15ft to 22ft crest elevation is presented. The difference in cost estimate for the 15ft and 22ft concepts is small and supports that the high-crested levee be installed in one step. The construction cost estimate assumes the installation of a temporary platform near the Michoud ar-ea to unload barges. All material would be trucked in place. Additional soil preparation in critical area would increase costs.
7.5.2 Limitations Final cost estimates for a navigational gate were not part of this plan as they were screened out given their impact on nearby flood protection systems. Nevertheless, similar projects in the Lake Borgne/GIWW region show that typical navigational structures in shallow water are within the $300 - 700M range. Deeper water regions, such as the Rigolets pass, may incur additional costs. Fur-thermore, it is assumed that any cap feature or riprap protection is included in the levee cost outline.
7.5.3 Working Assumptions To estimate the cost of the retained scenarios, each design was broken down in basic components. All estimates are given in 2012 USD. Maintenance costs are expressed in net present value. Because of the early nature of this feasibility study, the level of confidence of these estimates is approximately 10%. The following rates were used to estimate construction costs:
• Escalation of 2.73% is included for a construction sequence to last approximately 18 months.
• 6% Owner's Cost included for SIOH (Site Inspection and Overhead)
• 30% Contingency included.
• 8% Profit included.
• 4% sales tax included.
• USACE standard rates were used for Job Office Overhead (JOOH) and Home Office Overhead (HOOH).
• Engineering design fee is included as 10% of the budget

New Orleans East Land Bridge Study
Revised: 12/18/2012
126
.
• Maintenance costs are evaluated as a lump sum over the entire design life (100 years) of the structure and are set to 5% of total cost for the base design (50-YRP levee); and to 10% of the to-tal cost for the 100-YRP levee.
For better readability and in light of the early nature of this cost estimate, dollar amounts are rounded up to the nearest million USD.
7.5.4 Base Design (50-YRP Levee) The total estimated cost per linear mile of the levee concept illustrated in Section 7.3 comes out to approximately $60m based on a 17-mile alignment. The total project cost is approximately $750m. Additional cost may be incurred from unforeseen soil preparation and conditioning prior to the instal-lation of the flood protection system, in addition to those already included in the project (base layer of 10ft). This cost does not include any gate structure at Rigolets and Chef Menteur passes.
Table 7-2 Cost estimate for construction of the base design (50-YRP levee) in present day USD.
Construction Task Estimated Cost
Mobilization $2m
Construction of levee base $478m
Geotextile base $9m
Clay core $76m
Dirt fill $262m
Toe rock $49m
Armor rock $114m
Armormax mat / geosynthetic equivalent $11m
Total cost including maintenance $999m
Cost per unit mile (17-mile alignment) $60m
7.5.5 Upgrade from Base Design to 100-YRP Design To upgrade from an existing base design (50-YRP levee) to a 100-YRP levee, extensive mobilization and placement of additional material are required. The value indicated below is Net Present Value (NPV); a future value is included, assuming a 4% interest rate. The very low cost of the upgrade is explained by the fact that dirt fill makes up a majority of the cost of the base levee. A reduced price tag may be obtained by selecting a narrower cross-sectional width. This would then drive the cost of an upgrade to the wider 100-YRP levee.
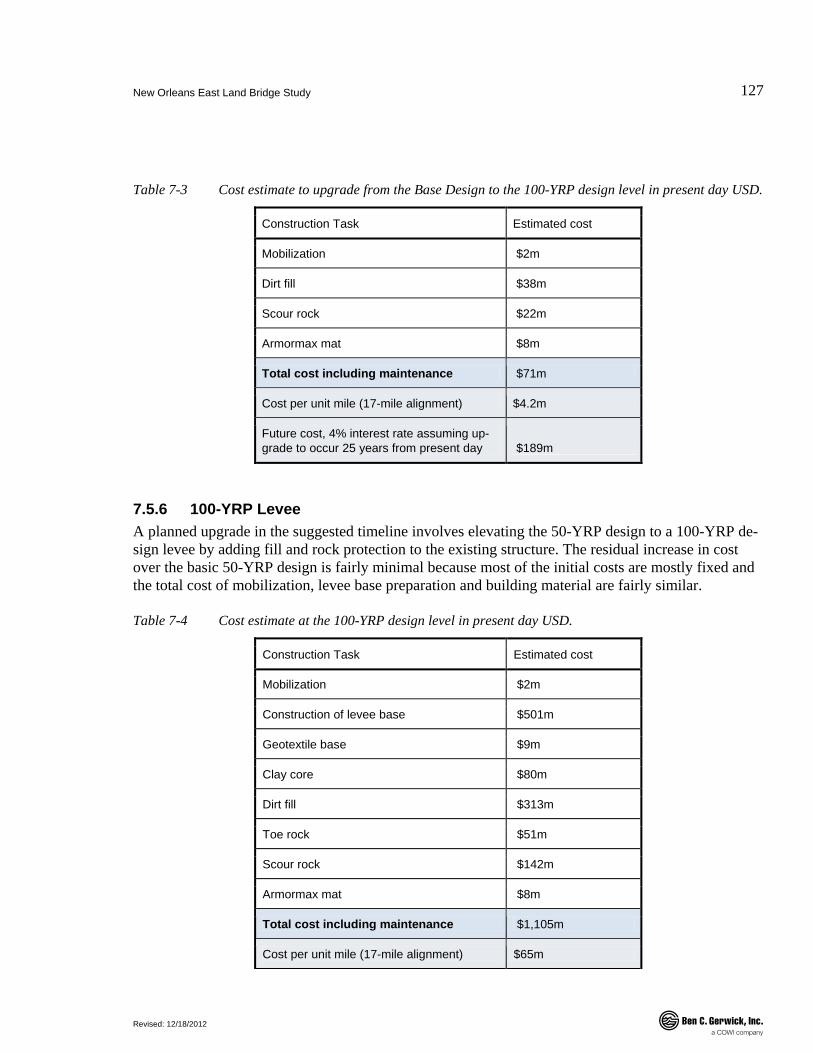
New Orleans East Land Bridge Study
Revised: 12/18/2012
127
.
Table 7-3 Cost estimate to upgrade from the Base Design to the 100-YRP design level in present day USD.
Construction Task Estimated cost
Mobilization $2m
Dirt fill $38m
Scour rock $22m
Armormax mat $8m
Total cost including maintenance $71m
Cost per unit mile (17-mile alignment) $4.2m
Future cost, 4% interest rate assuming up-grade to occur 25 years from present day $189m
7.5.6 100-YRP Levee A planned upgrade in the suggested timeline involves elevating the 50-YRP design to a 100-YRP de-sign levee by adding fill and rock protection to the existing structure. The residual increase in cost over the basic 50-YRP design is fairly minimal because most of the initial costs are mostly fixed and the total cost of mobilization, levee base preparation and building material are fairly similar.
Table 7-4 Cost estimate at the 100-YRP design level in present day USD.
Construction Task Estimated cost
Mobilization $2m
Construction of levee base $501m
Geotextile base $9m
Clay core $80m
Dirt fill $313m
Toe rock $51m
Scour rock $142m
Armormax mat $8m
Total cost including maintenance $1,105m
Cost per unit mile (17-mile alignment) $65m
New Orleans East Land Bridge Study
Revised: 12/18/2012
128
.
7.6 Step 2: FSSP Monitoring Program According to the results gathered in this study, a FSSP monitoring program should be implemented. Its objectives are as follows. First, it is to track the efficacy of all on-going FSSPs near the ELB through quantifiable metrics such as a regrowth index (year over year marshland growth); organic top-layer thickness measurements; reduction or reversal of shoreline recess, as measured from aerial photo and on-site collection campaigns. Special attention should be given to Alligator Bend restora-tion project, which covers a large expanse of the ELB shoreline and may serve as a bellwether for future FSSP implementations near the ELB. Second, it is to learn from these FSSP implementations and potentially revise their design to improve and optimize the efficacy of tentative future projects. The components of the monitoring program can be achieved independently by obtaining aerial pho-tography on demand; by acquiring photographic data on the ground; or by partnering with other agencies and institutions to collect, organize and analyze data.
7.7 Step 3: Supplemental FSSP
7.7.1 Proposed Locations As suggested in the hydrodynamic study, strong current will develop in the vicinity of the passes for a without-gate flood barrier project. By extension, anywhere near the openings in the new flood control system will be subject to more intense scouring, due for instance to wake wash (small, high frequency waves that significantly contribute to shoreline erosion), propeller wash, among other stressors. The role of supplemental FSSP is two-fold: first, it is to support foreshore stability against the current (in addition to wave/storm surge action); second, it is to maintain sufficient marsh land to actively reduce flow velocity and limit the eroding power of the flow. This was shown in the ADCIRC model where a lower Froude number was observed in the intact-ELB scenarios.
Here, two locations are proposed to install new rock dikes, similar to those built for the Alligator Bend project, and whose concept cross-sections are shown in Figure 7-10. In this case, a first segment is suggested to protect the west side of the ELB near the intersection of the proposed levee and Rigolets pass; the second segment is suggested near the mouth of Chef Menteur pass. Note that, as currently planned, strong armored caps will be installed at every endpoint of the flood barrier. These supplemental FSSP seek to achieve Objective 2, and therefore, should be placed strategically ahead of the flood barrier.
A comment is in order. It was determined that, in general, on the Pontchartrain side of the ELB, no supplemental or new foreshore stabilization structures appeared critical. Based on the map of critical areas devised in Section 3.9, "Key Vulnerable Locations within the ELB Project Area", none of the spots located within the Lake St. Catherine area warrant additional measures, based on the objectives set for this study. Additional efforts, beyond the scope of this work, may be performed to determine the value of such FSSB on factors that extend past the strict realm of flood protection.
New Orleans East Land Bridge Study
Revised: 12/18/2012
129
.
7.7.2 Conceptual Low-crested Armored Berm Pursuant to the concept described in Section 4.5.3, the low-crested armored berm, or rock dike, seeks to achieve Objective 2: "To preserve the integrity and encourage efforts to expand and strengthen the shoreline at the ELB". The alignment would follow the shoreline of ELB and would span approxi-mately 19mi (30km), which is appreciably longer than the length of the levee alignment.
Purpose Here, the purpose of this concept is to locally mitigate shoreline retreat due to environmental pressure from storm surge and waves action. Modified versions of this concept may also be deployed at judi-cious locations to mitigate the action of strong current velocities that may develop near the open pass-es during a storm event. To that end, in addition to the construction of this armored berm, the concept envisioned here would also include additional efforts to provide vegetative coverage on both sides of the structure, which will benefit from the maintained shoreline stability.
Requirements During a hurricane, the armored berm should be capable of withstanding complete submergence, without incurring significant damage (beyond the point of irreparability). To do so, large armor stones (tentative Class 1000 from a standard LADOTD gradation) will be used for its construction. A sche-matic of the tentative design features of the berm is shown hereafter. Given its small footprint, the rock dike should not require any significant soil preparation; at least not to a degree required for the placement of a levee.
Design The armored berm schematic also includes two new planting areas: on the flood side to provide an additional layer of protection and to stabilize the shoreline; on the protected side to ease the transition with the existing vegetation. Large scour stones, with median weight of 1000 lb absorb breaking wave impact during the early phase of a storm event. Two rock toes (leeside and flood side) are placed adjacent to the main armor layer. The flood side toe is designed with a "launch apron" located on the flood side to accommodate the dynamically evolving landscape. The riprap gradations indicat-ed in the figure are approximate but are anticipated to suit the needs of the project. Detailed armor stone size and riprap gradations can be devised from the Coastal Engineering Manual (Morang and Szuwalski 2003).

New Orleans East Land Bridge Study
Revised: 12/18/2012
130
.
Figure 7-10 Schematic of armored berm concept featuring a quarry run rock core, toe on both sides and a launch apron, intended to provide adaptability in the face of an evolving flood side shoreline. A 2.05 ft RSLR estimate was calculated from the "mid-range" scenario, as explained in Section 3.5.6, to which the design subsidence value of 0.5 ft, was added (see Section 3.8.2).
Figure 7-11 Proposed locations for supplemental FSSP in light of the results from the hydrodynamic study and objectives to be achieved for this study.

New Orleans East Land Bridge Study
Revised: 12/18/2012
131
.
8 Conclusions and Final Recommendations
8.1 Data Collection and Review An extensive amount of data was collected to draw a more refined picture of the various stressors af-fecting the ELB. Of these, the threat of relative sea-level rise (RSLR) was identified as most critical: if conservative trajectories for RSLR projections were to be followed, most of the ELB could be fully submerged by 2060. By analyzing photographic and survey-based evidence of marsh and shoreline degradation trends, key vulnerable locations were identified. On the other hand, in doing so, several key assets were identified that could be part of a long-term mitigation and adaptation plan.
In addition to RSLR, an ensemble of data pertaining to wind, waves and tides was devised. Generally speaking, the ELB is somewhat sheltered from day-to-day wave action however, with a fairly long fetch length extending to the East, is susceptible to large wave action during a storm event. This anal-ysis reveals that the shoreline of the ELB must be managed and that mitigating measures must be im-plemented to preserve the current shoreline if any successful storm surge and climate change mitiga-tion plan is to be implemented. The topic of saltwater intrusion and waterborne stressors was not con-sidered in this study.
Finally, a series of key policy reports and technical documents were reviewed, with ad hoc input from various stakeholders. The UNO report (McCorquodale et al. 2007) focuses on the environmental im-pact of a navigational structure on the tidal prism. A key result of that study is the determination of an optimal width for the pass openings, which serves as basis for the flood barrier concept studied in Section 5. The Framework for Environmental Assessment of Alternative Flood Control Structures by (Lopez and Davis 2011) brings awareness on the topic of environmental preservation of the ELB nat-ural heritage and is key stepping stone in the screening of the measures contemplated in Section 4.
The Technical Report by USACE (USACE 2009) provides a wealth of information, in large part di-rectly relevant to the needs and objectives of this study. It includes but is not limited to: present and future storm surge hazard and storm surge distribution near the ELB; wave climate; subsidence; SLR; and a prioritized list of restoration and flood control projects. Most importantly, the results of Annex A of Volume 1 of the Hydraulics and Hydrology Appendix set the tone for the additional numerical modeling efforts engaged in this study where the efficacy of a 100-YRP levee barrier was evaluated. The same report, along with other references, also provides a solid basis for establishing the impact of sea-level rise on storm surge hazard.
8.2 Hazard Case Scenarios and Hydraulic Modeling To complement the large body of existing results related to flood control near the ELB, a series of hazard case scenarios was devised. These scenarios are tailored to quantify the effect of various ele-ments of the proposed flood reduction system. They are optimized to avoid redundancy with any ex-isting modeling efforts and to maximize the value of the results generated throughout.
Specifically, the goals of the hazard case studies are to evaluate the projected storm surge hazard in the presence of a degraded ELB; with a flood control system; assuming open/close conditions for ten-

New Orleans East Land Bridge Study
Revised: 12/18/2012
132
.
tative gates at the Chef Menteur and Rigolets passes. The cases devised also focus on quantifying the spatial impact of such a structure on the storm surge distribution. As such, they help determine whether a net beneficial impact to the Lake Pontchartrain region would necessarily place additional hydraulic burden on adjacent structures, e.g. the GIWW/IHNC flood protection projects, Lake Borgne and Mississippi regions. These case scenarios form the basis of an ADCIRC/SWAN model that pro-vides the foundation of the proposed recommended action plan.
The hydrodynamic modeling further supplements the results gathered in the study by elaborating on storm surge elevation with the presence of a flood barrier and by comparing the results to a "base case"; and by estimating wave climate along the levee.
8.3 Recommended Actions The feasibility leverages the data collected in Task and results obtained from the hydrodynamic mod-eling. The objectives of the proposed mitigation and adaptation plan are (1) to reduce flood risk at the LPB by placing a physical flood barrier against storm surge and (2) to preserve the integrity and en-courage efforts to expand and strengthen the shoreline at the ELB.
To that end, a screening procedure was deployed. It started out with the evaluation of a series of measures taken from the Multiple Lines of Defense Principle (MLDP). Each was evaluated and scored according to four criteria, namely completeness, effectiveness, efficiency and acceptability. By doing so, two measures were identified as key components of a tentative path forward. The rationale argued that while none of these could simultaneously achieve Objective 1 and 2, a synergistic combi-nation of these two measures would provide significant long-term flood risk reduction to the ELB.
Based on a survey of future and on-going foreshore and shoreline stabilization projects (FSSP); the review of past numerical simulations; and after reviewing several structural measures; it was deter-mined that a judiciously located earthen levee, with a crest height of 22ft-NAVD88, with openings at the Chef Menteur and Rigolets passes, would provide significant flood risk reduction for the Lake Pontchartrain region while minimizing the impact on adjacent areas and the local ecosystem and other critical flood protection systems. The proposed alignment leverages the existing railway, identified as a key asset for the ELB, to position the high-crested levee. The design relies on an adaptive approach, where the system would be part of a multi-tiered system: as such, even if an open-pass design is una-ble to provide the level of protection than a closed-gate solution, the protection it offers will comple-ment existing control structures. In addition, because it is built with adaptive features from the ground up, the open-pass solution can be easily upgraded pending appropriate funding. A discussion on the long-term benefits to be obtained from the installation of navigational structures at the passes is con-ducted in the next section.
In addition, the proposed plan recommends the implementation of FSSP monitoring program that seeks to quantify the efficacy of on-going restoration projects. The program would rely on a network of probes (sensors, photography, on-the-ground observations, etc.) that aim to measure the evolution of the ELB shoreline over time. In doing so, the program would enable stakeholders to learn from any potential flaws and/or recognized high-value features in existing projects and to optimize the layout and placement of any future FSSP.
New Orleans East Land Bridge Study
Revised: 12/18/2012
133
.
Finally, the plan calls for the construction of supplemental FSSP that aim to complement existing pro-jects (PO-34, most importantly) and assist the proposed flood barrier by mitigating the eroding action of the strong currents anticipated near the pass openings, as explained in Task 3. Preliminary cross sections emphasize adaptive features, such as a launch apron, while keeping construction costs low.
8.4 Recommendations for Future Study Unless proper stabilization and preservation measures such as those cited in Section 8.3 are not taken, the ELB may continue to degrade at critical areas. Over time, this may lead to an increased storm surge in Lake Pontchartrain beyond the currently assumed design conditions for the existing flood control systems around the shore of Lake Pontchartrain. In addition, as the UN has acknowledged that the IPCC 2007 AR4 SLR projections are lower than what has been measured to current since the projections where made. This suggests that, without the addition of the gateless earthen levee with a 22ft-NAVD 88 crest as part of a MLDP system then existing flood control systems around the shores of Lake Pontchartrain may not provide the required level of flood defense before the ends of their de-sign service lives.
Furthermore, as indicated in Figure 9-1 and Figure 9-2 in the Appendix, the storm surge in Lake Pontchartrain from the nominal Category 1 (Cat 1) hurricane Isaac was essentially on par with that from the nominal Cat 3 Hurricane Katrina. This indicates that it may be prudent to begin a new feasi-bility study to assess the viability of retro-fitting environmentally sound floodgates (and associated flood barriers) at the Rigolets and Chef Menteur openings and into the recommended gateless earthen levee, should the return period for a given storm level be reduced in the future. This type of down-grading of the return period is anticipated to emanate from the USACE.
Therefore, it is further recommended that the SLFPA-E work together with the USACE to initiate a new feasibility study to:
► Examine a combination of floodgate/flood-barrier such that shown in Figure 8-1 and Figure 8-2 for the Rigolets pass. This would allow for the regulation of tidal exchange and storm surge by the use of either perforated caissons with sluice gates and /or a 600-ft, to 700-ft, wide naviga-ble gate with both pneumatically controlled buoyant bottom-hinged gate leave and a double con-crete barge gate barrier.
Not only is such a navigable gate believed to be cost efficient, but the bottom-hinged gate leaves could be designed to be overtopped as a variable crest height gate in order to limit the effect of increasing storm surge t elevation in adjoining areas; while the double barge gate leaves could be added in the future if it is determined in the future that addition flood protection is required to protect the existing flood control systems around Lake Pontchartrain.
Furthermore, it is expected that together with supplemental dredging the combined openings through the perforated caissons and the navigable gate should be able to minimize disruption of the existing tidal prism passing through the Rigolets.
► Examine a variation of the floodgate/flood-barrier concept established for the Rigolets pass to match the requirements for Chef Menteur, if warranted by navigational and environmental needs.
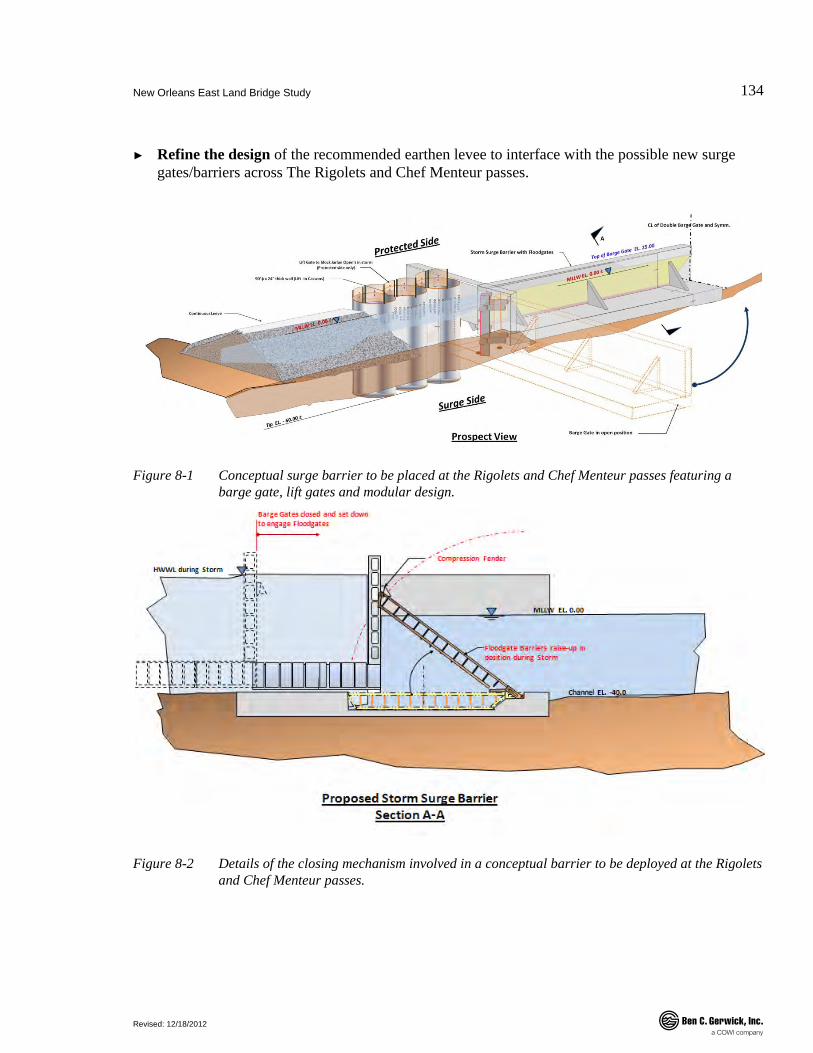
New Orleans East Land Bridge Study
Revised: 12/18/2012
134
.
► Refine the design of the recommended earthen levee to interface with the possible new surge gates/barriers across The Rigolets and Chef Menteur passes.
Figure 8-1 Conceptual surge barrier to be placed at the Rigolets and Chef Menteur passes featuring a barge gate, lift gates and modular design.
Figure 8-2 Details of the closing mechanism involved in a conceptual barrier to be deployed at the Rigolets and Chef Menteur passes.
New Orleans East Land Bridge Study
Revised: 12/18/2012
135
.
9 Bibliography Anthony, K.W. 2009. “Methane: A Menace Surfaces.” Scientific American 301 (6) (December): 68–
75. doi:10.1038/scientificamerican1209-68.
BCDC. 2011. Draft Staff Report. Living with a Rising Bay: Vulnerability and Adaptation in San Francisco Bay and on Its Shoreline. San Francisco, CA: San Francisco Bay Conservation and Development Commission.
Berner, D.E. 2011. Draft Review and Recommendation on Eustatic Sea Level Rise at the Pontchar-train Basin - Supplement to the New Orleans East Land Bridge Study. Technical report. New Orleans, LA: Ben C. Gerwick, Inc.
Blum, Michael D., and Harry H. Roberts. 2009. “Drowning of the Mississippi Delta Due to Insuffi-cient Sediment Supply and Global Sea-level Rise.” Nature Geoscience 2 (7) (June): 488–491. doi:10.1038/ngeo553.
Carlson, Anders E., and Kelsey Winsor. 2012. “Northern Hemisphere Ice-sheet Responses to Past Climate Warming.” Nature Geoscience 5 (9) (August 26): 607–613. doi:10.1038/ngeo1528.
Cayan, Dan, G. Griggs, S. Johnson, and T. Haymet. 2010. STATE OF CALIFORNIA SEA‐LEVEL RISE INTERIM GUIDANCE DOCUMENT. Sea‐Level Rise Task Force of the Coastal and Ocean Working Group of the California Climate Action Team (CO‐CAT).
Committee on Engineering Implications of Changes in Relative Mean Sea Level. 1987. Responding to Changes in Sea Level: Engineering Implications. National Academies Press.
Cooper, N.J. 2005. “Wave Dissipation Across Intertidal Surfaces in the Wash Tidal Inlet, Eastern England.” Journal of Coastal Research 21 (1) (January): 28–40.
CPRA. 2007a. Integrated Ecosystem Restoration and Hurricane Protection: Louisiana’s Comprehen-sive Master Plan for a Sustainable Coast. Baton Rouge, LA: Louisiana Coastal Protection and Restoration Authority.
———. 2007b. Integrated Ecosystem Restoration and Hurricane Protection: Louisiana’s Compre-hensive Master Plan for a Sustainable Coast - Appendix G Coastal La Ecosystem Assessment & Restoration (CLEAR). Baton Rouge, LA: Louisiana Coastal Protection and Restoration Au-thority.
———. 2012. Coastal Protection and Restoration Authority of Louisiana. Louisiana’s Comprehen-sive Master Plan for a Sustainable Coast. Baton Rouge, LA: Coastal Protection and Restora-tion Authority of Louisiana.
Dixon, A. M., D. J. Leggett, and R. C. Weight. 1998. “Habitat Creation Opportunities for Landward Coastal Re-alignment: Essex Case Studies.” Water and Environment Journal 12 (2) (April): 107–112. doi:10.1111/j.1747-6593.1998.tb00158.x.
Donald M. Mulcare. 2004. “NGS Toolkit, Part 9: The National Geodetic Survey VERTCON Tool.” Professional Surveyor Magazine, March. http://www.profsurv.com/magazine/article.aspx?i=1214.
Dornstauder, A.C. 2009. EC 1165-2-211 Water Resource Policies and Authorities Incorporating Sea-Level Change Considerations in Civil Works Programs. Circular. Washington, DC 20314-1000: U.S. Army Corps of Engineers.
New Orleans East Land Bridge Study
Revised: 12/18/2012
136
.
England, L., and C. L. Eustis. 2008. Geotechnical Data Report. Orleans Landbridge Shoreline Pro-tection. Orleans Parish, Louisiana. Technical report. Baton Rouge, LA: Louis J. Capozzoli and Associates | a subsidiary of Geoengineers.
Hansen, James E., and Makiko Sato. 2012. “Paleoclimate Implications for Human-Made Climate Change.” In Climate Change, ed. André Berger, Fedor Mesinger, and Djordje Sijacki, 21–47. Vienna: Springer Vienna. http://www.springerlink.com/index/10.1007/978-3-7091-0973-1_2.
Hu, Aixue, Gerald A. Meehl, Weiqing Han, and Jianjun Yin. 2009. “Transient Response of the MOC and Climate to Potential Melting of the Greenland Ice Sheet in the 21st Century.” Geophysi-cal Research Letters 36 (10) (May). doi:10.1029/2009GL037998.
Intergovernmental Panel on Climate Change. Working Group I. 2007. Climate Change 2007‐: the physical science basis‐: working group I contribution to the Fourth Assessment Report of the IPCC. Cambridge: Cambridge University Press.
Isaksen, Ivar S. A., Michael Gauss, Gunnar Myhre, Katey M. Walter Anthony, and Carolyn Ruppel. 2011. “Strong Atmospheric Chemistry Feedback to Climate Warming from Arctic Methane Emissions.” Global Biogeochemical Cycles 25 (2) (April 20). doi:10.1029/2010GB003845. http://www.agu.org/pubs/crossref/2011/2010GB003845.shtml.
Knuuti, Kevin. 2002. “Planning for Sea Level Rise: U.S. Army Corps of Engineers Policy.” In Solu-tions to Coastal Disasters ’02, 48–48. San Diego, California, USA. doi:10.1061/40605(258)48. http://link.aip.org/link/ASCECP/v258/i40605/p48/s1&Agg=doi.
Link, L.E., J.J. Jaeger, J. Stevenson, W. Stroupe, R.L. Mosher, D. Martin, J.K. Garster, et al. 2009. Performance Evaluation of the New Orleans and Southeast Louisiana Hurricane Protection System - Final Report of the Interagency Performance Evaluation Task Force - Volume 4: The Storm. Interagency Performance Evaluation Task force (IPET).
Lopez, J., and M. Davis. 2011. Framework for Environmental Assessment of Alternative Flood Con-trol Structures on Chef Menteur and Rigolets Passes Within the Lake Pontchartrain Estuary, Southeast Louisiana. New Orleans, LA: Lake Pontchartrain Basin Foundation.
Lopez, J., N. Snider, C. Dufrechou, M. Hester, and P. Keddy. 2009. Comprehensive Recommenda-tions Supporting the Use of the Multiple Lines of Defense Strategy to Sustain Coastal Louisi-ana 2008 Report (Version I). New Orleans, LA: Lake Pontchartrain Basin Foundation.
McCorquodale, J.Al., I. Georgiou, A.G. Retana, D. Barbe, and M.J. Guillot. 2007. Uno Report on Hydrodynamic Modeling of the Tidal Prism in the Pontchartrain Basin. New Orleans, LA: University of New Orleans.
Morang, A., and A. Szuwalski. 2003. Coastal Engineering Manual. Vicksburg, MS: Coastal and Hy-draulics Laboratory, US Army Engineer Research and Development Center.
National Research Council (U.S.). 2009. Final Report from the NRC Committee on the Review of the Louisiana Coastal Protection and Restoration (LACPR) Program. Washington D.C.: Nation-al Academies Press.
PBSJ. 2010. PO-34 Alligator Bend Shoreline Protection Project. 30% Design Report. Metairie, La.: PBS&J.

New Orleans East Land Bridge Study
Revised: 12/18/2012
137
.
Penland, S., A. Beall, D. Britsch, and S.J. Williams. 2002. Environmental Atlas of the Lake Pontchar-train Basin. New Orleans, LA: U.S. Geological Survey. http://coastal.er.usgs.gov/pontchartrain/.
Pullen, T., A. Kortenhaus, N.W.H. Allsop, T. Bruce, and H. Schuttrumpf. 2007. EurOtop - Wave Overtopping of Sea Defences and Related Structures: Assessment Manual. EA Environment Agency, UK. ENW Expertise Netwerk Waterkeren, NL. KFKI Kuratorium für Forschung im Küsteningenieurwesen, DE.
Rahmstorf, Stefan, Mahé Perrette, and Martin Vermeer. 2011. “Testing the Robustness of Semi-empirical Sea Level Projections.” Climate Dynamics (November 10). doi:10.1007/s00382-011-1226-7. http://www.springerlink.com/index/10.1007/s00382-011-1226-7.
Schaefer, Kevin, Tingjun Zhang, Lori Bruhwiler, and Andrew P. Barrett. 2011. “Amount and Timing of Permafrost Carbon Release in Response to Climate Warming.” Tellus B 63 (2) (April): 165–180. doi:10.1111/j.1600-0889.2011.00527.x.
Schodlok, Michael P., Dimitris Menemenlis, Eric Rignot, and Michael Studinger. 2012. “Sensitivity of the Ice-shelf/ocean System to the Sub-ice-shelf Cavity Shape Measured by NASA IceBridge in Pine Island Glacier, West Antarctica.” Annals of Glaciology 53 (60): 156–162. doi:10.3189/2012AoG60A073.
Stone, G.W., and R.A. McBride. 1998. “Louisiana Barrier Islands and Their Importance in Wetland Protection: Forecasting Shoreline Change and Subsequent Response of Wave Climate.” Jour-nal of Coastal Research 14 (3) (March): 900–916.
Taylor, L.A., B.W. Eakins, K.S. Carignan, R.R. Warnken, T. Sazonova, and D.C. Schoolcraft. 2007. Digital Elevation Model for Biloxi, Mississippi: Procedures, Data Sources and Analysis. Boulder, Colorado: NOAA National Geophysical Data Center (NGDC).
The Potsdam Institute for Climate Impact Research and Climate Analytics. 2012. Turn down the Heat - Why a 4C Warmer World Must Be Avoided. Washington, DC 20433: International Bank for Reconstruction and Development / The World Bank. www.worldbank.org.
USACE. 1987. Hydraulic Design Criteria. US Army Corps of Engineers.
———. 2000. Planning Guidance Notebook. ER 1105-2-100. Circular. Washington, DC 20314-1000: U.S. Army Corps of Engineers.
———. 2007. Hurricane and Storm Damage Reduction System Design (HSDRS) Guidelines. New Orleans, LA: US Army Corps of Engineers. New Orleans District Engineering Division.
———. 2009. Louisiana Coastal Protection and Restoration (LACPR) Final Technical Report. New Orleans, LA: US Army Corps of Engineers. New Orleans District Mississippi Valley Divi-sion.
———. 2011. EC 1165-2-212 Water Resource Policies and Authorities Incorporating Sea-Level Change Considerations in Civil Works Programs. Circular. Washington, DC 20314-1000: U.S. Army Corps of Engineers.
Vermeer, M., and S. Rahmstorf. 2009. “From the Cover: Global Sea Level Linked to Global Temper-ature.” Proceedings of the National Academy of Sciences 106 (51) (December): 21527–21532. doi:10.1073/pnas.0907765106.
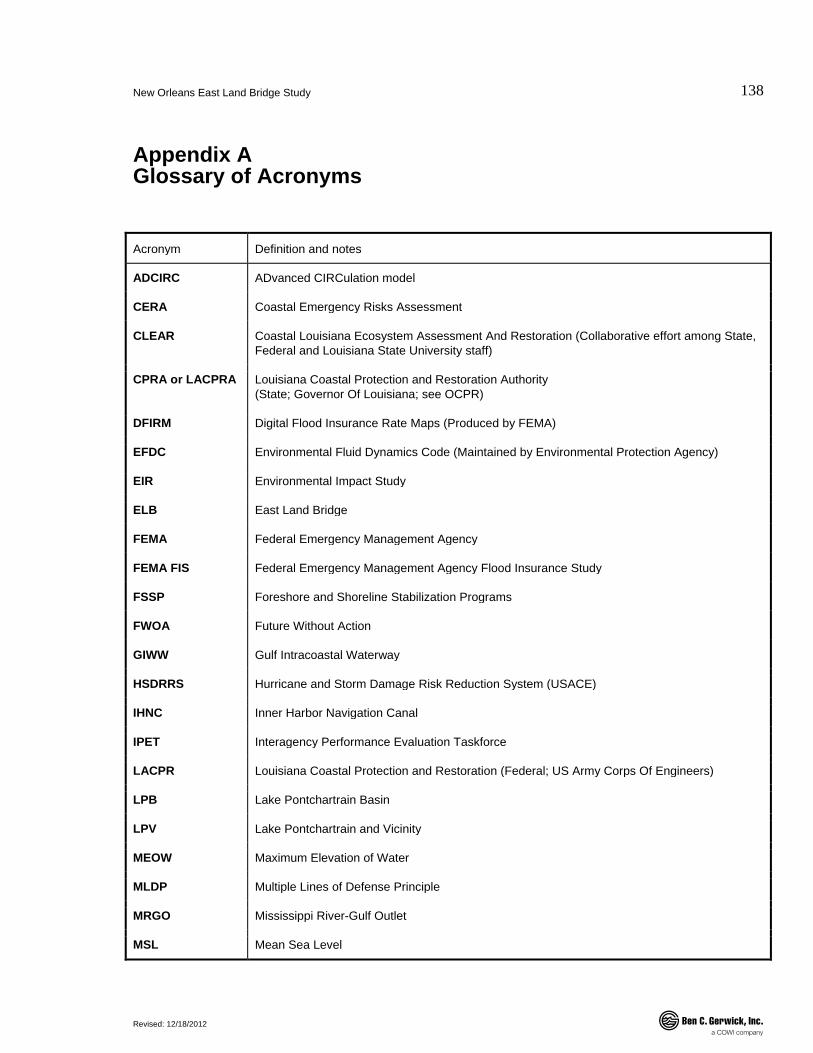
New Orleans East Land Bridge Study
Revised: 12/18/2012
138
.
Appendix A Glossary of Acronyms
Acronym Definition and notes
ADCIRC ADvanced CIRCulation model
CERA Coastal Emergency Risks Assessment
CLEAR Coastal Louisiana Ecosystem Assessment And Restoration (Collaborative effort among State, Federal and Louisiana State University staff)
CPRA or LACPRA Louisiana Coastal Protection and Restoration Authority (State; Governor Of Louisiana; see OCPR)
DFIRM Digital Flood Insurance Rate Maps (Produced by FEMA)
EFDC Environmental Fluid Dynamics Code (Maintained by Environmental Protection Agency)
EIR Environmental Impact Study
ELB East Land Bridge
FEMA Federal Emergency Management Agency
FEMA FIS Federal Emergency Management Agency Flood Insurance Study
FSSP Foreshore and Shoreline Stabilization Programs
FWOA Future Without Action
GIWW Gulf Intracoastal Waterway
HSDRRS Hurricane and Storm Damage Risk Reduction System (USACE)
IHNC Inner Harbor Navigation Canal
IPET Interagency Performance Evaluation Taskforce
LACPR Louisiana Coastal Protection and Restoration (Federal; US Army Corps Of Engineers)
LPB Lake Pontchartrain Basin
LPV Lake Pontchartrain and Vicinity
MEOW Maximum Elevation of Water
MLDP Multiple Lines of Defense Principle
MRGO Mississippi River-Gulf Outlet
MSL Mean Sea Level
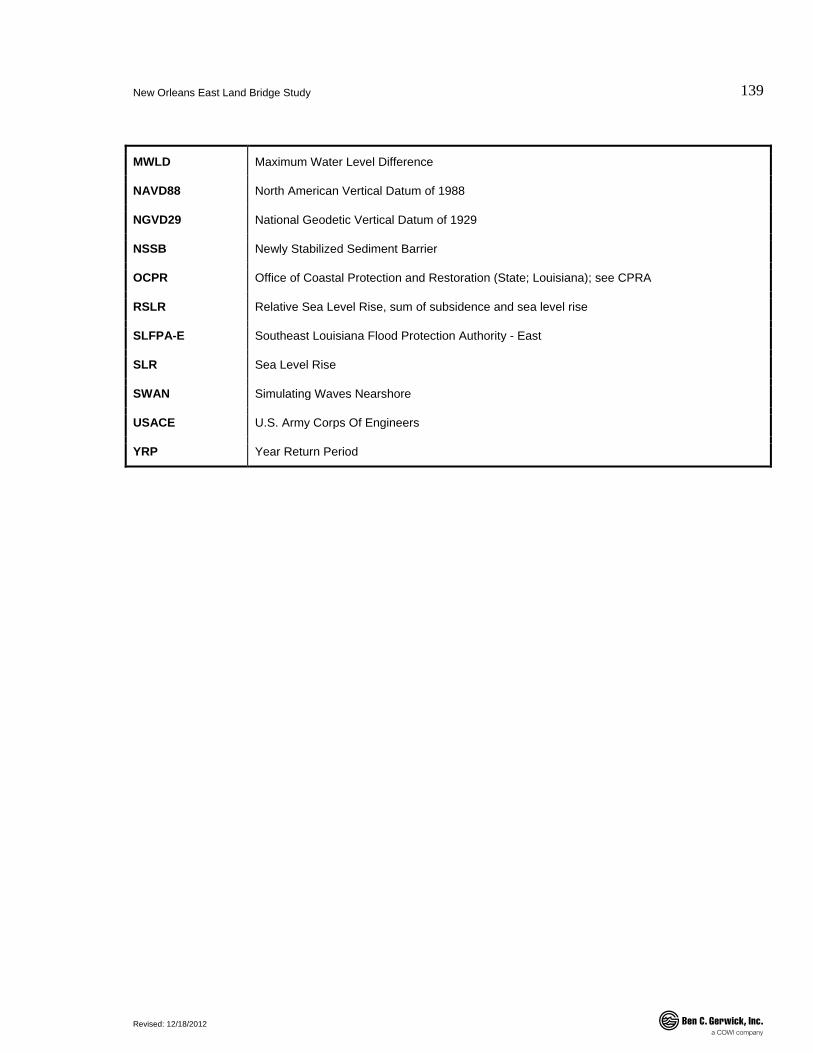
New Orleans East Land Bridge Study
Revised: 12/18/2012
139
.
MWLD Maximum Water Level Difference
NAVD88 North American Vertical Datum of 1988
NGVD29 National Geodetic Vertical Datum of 1929
NSSB Newly Stabilized Sediment Barrier
OCPR Office of Coastal Protection and Restoration (State; Louisiana); see CPRA
RSLR Relative Sea Level Rise, sum of subsidence and sea level rise
SLFPA-E Southeast Louisiana Flood Protection Authority - East
SLR Sea Level Rise
SWAN Simulating Waves Nearshore
USACE U.S. Army Corps Of Engineers
YRP Year Return Period

New Orleans East Land Bridge Study
Revised: 12/18/2012
140
.
Appendix B Geotechnical Data The following tables summarize findings provided from soil borings realized at the ELB project area.
Soil Properties Reach 2 Layer Depth W γtotal Su Pc Po Cv Ch Cc Cr (ft) (%) (pcf) (psf) (psf) (psf) ft2/day x 10-5 in2/sec
1 0-9 150 71 150 680 94.4 0.02(3) 6.67 1.725 0.192
2 9-18 150 98 150 680 212 0.06(1) 20 1.725 0.192 3 18-22 40 115 150 680 330 0.2(3) 66.67 0.450 0.071
4 22-32 40 102 150 680 595 0.2(3) 66.67 0.450 0.071
5 32-50 55 102 200 680 1010 0.025(2) 8.33 1.052 0.071
6 50-60 30 102 1000 900 1424 1(3) 333.33 0.305 0.057
7 60-80 102 SP 4540 1880 1(3) 333.33
Notes: 1) Based on consol. test of sample depth 8'-10' boring B-22 (moisture = 143.74%) 2) Based on consol. Test of sample depth 20'-22' boring B-23 (moisture = 213.1%) 3) Based on consol. test of sample depth 55' boring B-24 (moisture = 60.3%) 4) From Geoengineers correlation between MC and Cv for Alligator Bend, Lake Lery
Soil Properties Reach 3 Layer Depth W γtotal Su Pc Po Cv Ch Cc Cr (ft) (%) (pcf) (psf) (psf) (psf) ft2/day x 10-5 in2/sec
1 0-4 85 82 200 900 40 0.021(4) 7.00 0.978 0.121
2 4-17 85 100 200 900 320 0.021(4) 7.00 0.978 0.121 3 17-22 50 105 120 1220 680 0.013(1) 4.26 0.691 0.109
4 22-40 50 105 200 2100 1160 0.49(2) 163.34 0.817 0.081
5 40-50 50 105 260 1700 1760 0.08(4) 26.67 0.595 0.085
6 50-80 50 105 105 1(4) 333.33 Notes: 1) Based on consol. test of sample depth 8'-10' boring B-22 (moisture = 143.74%) 2) Based on consol. test of sample depth 20'-22' boring B-23 (moisture = 213.1%) 3) Based on consol. test of sample depth 55' boring B-24 (moisture = 60.3%) 4) From Geoengineers correlation between MC and Cv for Alligator Bend, Lake Lery

New Orleans East Land Bridge Study
Revised: 12/18/2012
141
.
Soil Properties Reach 4 Layer Depth W γtotal Su Pc Po Cv Ch Cc Cr (ft) (%) (pcf) (psf) (psf) (psf) ft2/day x 10-5 in2/sec
1 0-4 150 98 150 680 80 0.02(2) 6.66 1.725 0.192
2 4-10 150 80 150 680 200 0.02(2) 6.66 1.725 0.192 3 10-14 100 80 200 900 280 0.02(2) 6.66 1.150 0.138 4 14-20 100 100 200 900 440 0.02(2) 6.66 1.150 0.138 5 20-32 60 100 230 1040 760 0.04(2) 13.33 0.740 0.099 6 32-50 60 100 230 1360 1340 0.04(2) 13.33 0.740 0.099 7 50-80 30 100 370 2200 2240 1(2) 333.33 0.305 0.057 Note: 1) Based on consol. test of sample depth 8'-10' boring B-22 (moisture = 143.74%) 2) Based on consol. test of sample depth 20'-22' boring B-23 (moisture = 213.1%) 3) Based on consol. test of sample depth 55' boring B-24 (moisture = 60.3%) 4) From Geoengineers correlation between MC and Cv for Alligator Bend, Lake Lery
Soil Properties Reach 5 Layer Depth W γtotal Su Pc Po Cv Ch Cc Cr (ft) (%) (pcf) (psf) (psf) (psf) ft2/day x 10-5 in2/sec
1 0-12 150 98 110-120 640 220 0.02(4) 6.66 1.725 0.192 2 12-25 80 98 120-140 560 660 0.022(4) 7.34 1.03 0.126
3 25-38 80 98 140-220 820 1120 0.025(4) 8.34 1.03 0.126 4 38-50 50 108 220-290 1160 1620 0.08(4) 26.67 0.595 0.085 5 50-60 50 108 290-440 1660 2120 0.08(4) 26.67 0.595 0.085 6 60-80 30 108 440-720 2640 2820 1(4) 333.33 0.305 0.057 Note: 1) Based on consol. test of sample depth 8'-10' boring B-22 (moisture = 143.74%) 2) Based on consol. test of sample depth 20'-22' boring B-23 (moisture = 213.1%) 3) Based on consol. test of sample depth 55' boring B-24 (moisture = 60.3%) 4) From Geoengineers correlation between MC and Cv for Alligator Bend, Lake Lery
Soil Properties Reach 6 Layer Depth W γtotal Su Pc Po Cv Ch Cc Cr (ft) (%) (pcf) (psf) (psf) (psf) ft2/day x 10-5 in2/sec
1 0-10 180 90 150 640 138 0.02(5) 6.66 2.070 0.225 2 10-20 120 90 150 680 414 0.02(5) 6.66 1.380 0.159 3 20-50. 60 100 150-370 1200 1116 0.04(3) 13.34 0.840 0.108 4 50-80 45 110 370-600 2200 2394 0.014(4) 4.66 0.659 0.07 Note: 1) Based on consol. test of sample depth 8'-10' boring B-22 (moisture = 143.74%) 2) Based on consol. test of sample depth 20'-22' boring B-23 (moisture = 213.1%) 3) Based on consol. test of sample depth 55' boring B-24 (moisture = 60.3%) 4) From Geoengineers correlation between MC and Cv for Alligator Bend, Lake Lery
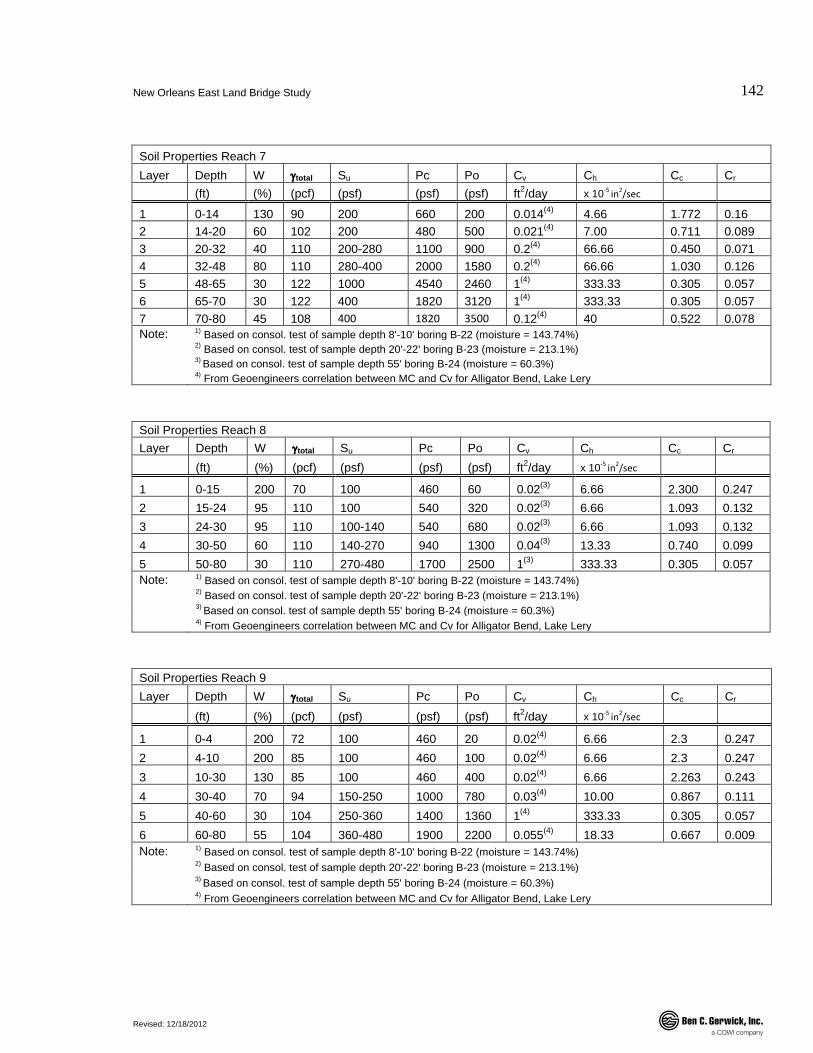
New Orleans East Land Bridge Study
Revised: 12/18/2012
142
.
Soil Properties Reach 7 Layer Depth W γtotal Su Pc Po Cv Ch Cc Cr (ft) (%) (pcf) (psf) (psf) (psf) ft2/day x 10-5 in2/sec
1 0-14 130 90 200 660 200 0.014(4) 4.66 1.772 0.16 2 14-20 60 102 200 480 500 0.021(4) 7.00 0.711 0.089 3 20-32 40 110 200-280 1100 900 0.2(4) 66.66 0.450 0.071 4 32-48 80 110 280-400 2000 1580 0.2(4) 66.66 1.030 0.126 5 48-65 30 122 1000 4540 2460 1(4) 333.33 0.305 0.057 6 65-70 30 122 400 1820 3120 1(4) 333.33 0.305 0.057 7 70-80 45 108 400 1820 3500 0.12(4) 40 0.522 0.078 Note: 1) Based on consol. test of sample depth 8'-10' boring B-22 (moisture = 143.74%) 2) Based on consol. test of sample depth 20'-22' boring B-23 (moisture = 213.1%) 3) Based on consol. test of sample depth 55' boring B-24 (moisture = 60.3%) 4) From Geoengineers correlation between MC and Cv for Alligator Bend, Lake Lery
Soil Properties Reach 8 Layer Depth W γtotal Su Pc Po Cv Ch Cc Cr (ft) (%) (pcf) (psf) (psf) (psf) ft2/day x 10-5 in2/sec
1 0-15 200 70 100 460 60 0.02(3) 6.66 2.300 0.247 2 15-24 95 110 100 540 320 0.02(3) 6.66 1.093 0.132 3 24-30 95 110 100-140 540 680 0.02(3) 6.66 1.093 0.132 4 30-50 60 110 140-270 940 1300 0.04(3) 13.33 0.740 0.099 5 50-80 30 110 270-480 1700 2500 1(3) 333.33 0.305 0.057 Note: 1) Based on consol. test of sample depth 8'-10' boring B-22 (moisture = 143.74%) 2) Based on consol. test of sample depth 20'-22' boring B-23 (moisture = 213.1%) 3) Based on consol. test of sample depth 55' boring B-24 (moisture = 60.3%) 4) From Geoengineers correlation between MC and Cv for Alligator Bend, Lake Lery
Soil Properties Reach 9 Layer Depth W γtotal Su Pc Po Cv Ch Cc Cr
(ft) (%) (pcf) (psf) (psf) (psf) ft2/day x 10-5 in2/sec
1 0-4 200 72 100 460 20 0.02(4) 6.66 2.3 0.247 2 4-10 200 85 100 460 100 0.02(4) 6.66 2.3 0.247 3 10-30 130 85 100 460 400 0.02(4) 6.66 2.263 0.243 4 30-40 70 94 150-250 1000 780 0.03(4) 10.00 0.867 0.111 5 40-60 30 104 250-360 1400 1360 1(4) 333.33 0.305 0.057 6 60-80 55 104 360-480 1900 2200 0.055(4) 18.33 0.667 0.009 Note: 1) Based on consol. test of sample depth 8'-10' boring B-22 (moisture = 143.74%) 2) Based on consol. test of sample depth 20'-22' boring B-23 (moisture = 213.1%) 3) Based on consol. test of sample depth 55' boring B-24 (moisture = 60.3%) 4) From Geoengineers correlation between MC and Cv for Alligator Bend, Lake Lery
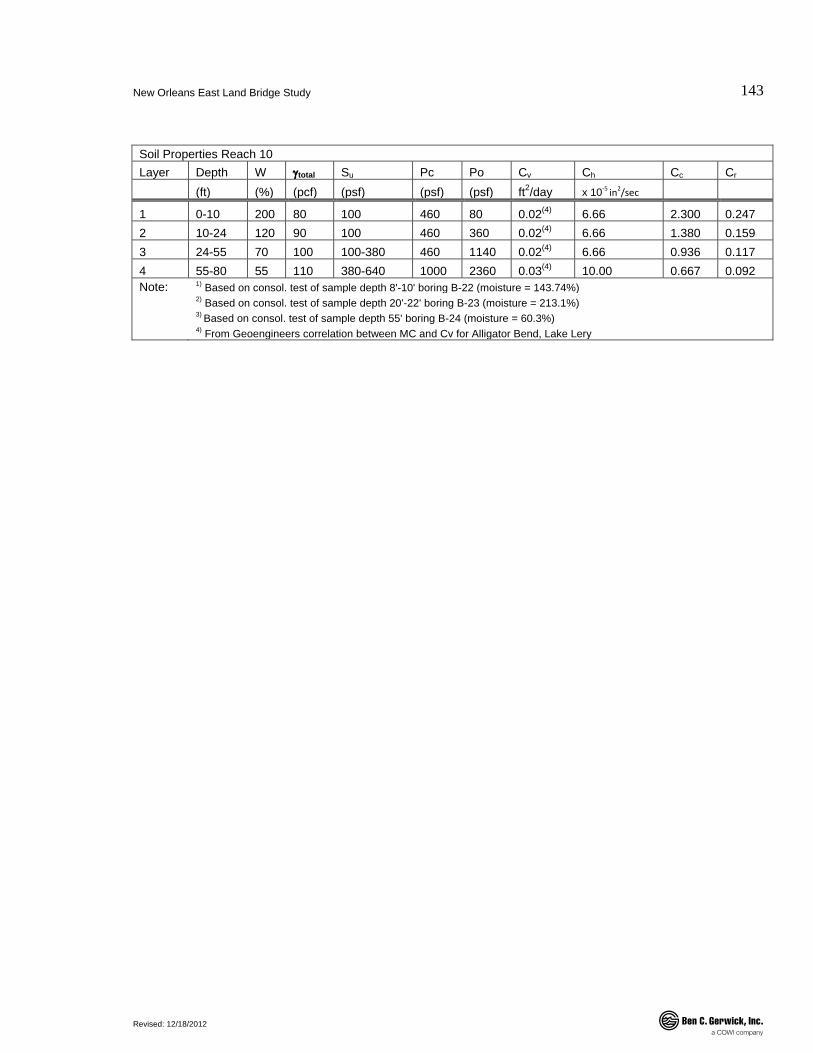
New Orleans East Land Bridge Study
Revised: 12/18/2012
143
.
Soil Properties Reach 10 Layer Depth W γtotal Su Pc Po Cv Ch Cc Cr (ft) (%) (pcf) (psf) (psf) (psf) ft2/day x 10-5 in2/sec
1 0-10 200 80 100 460 80 0.02(4) 6.66 2.300 0.247 2 10-24 120 90 100 460 360 0.02(4) 6.66 1.380 0.159 3 24-55 70 100 100-380 460 1140 0.02(4) 6.66 0.936 0.117 4 55-80 55 110 380-640 1000 2360 0.03(4) 10.00 0.667 0.092 Note: 1) Based on consol. test of sample depth 8'-10' boring B-22 (moisture = 143.74%) 2) Based on consol. test of sample depth 20'-22' boring B-23 (moisture = 213.1%) 3) Based on consol. test of sample depth 55' boring B-24 (moisture = 60.3%) 4) From Geoengineers correlation between MC and Cv for Alligator Bend, Lake Lery

New Orleans East Land Bridge Study
Revised: 12/18/2012
144
.
Appendix C Storm Surge Elevation Hindcast from the CERA
Figure 9-1 Maximum water height history hindcast during hurricane Isaac. Graphics obtained from the Coastal Emergency Risks Assessment (CERA) showing water levels in the Lake Pontchartrain and Vicinity area in ft-NAVD88. Model boundaries, including levees, roads, etc. are shown in brown. The results shown here were generated using the ADCIRC and SWAN models.
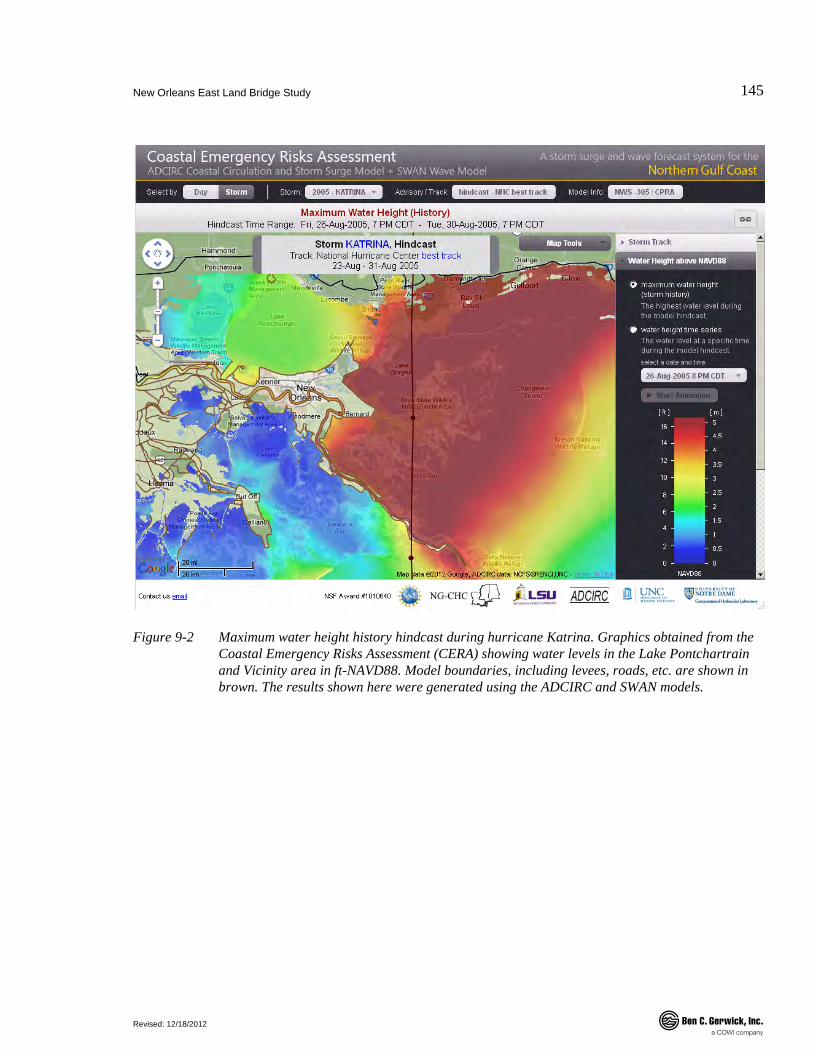
New Orleans East Land Bridge Study
Revised: 12/18/2012
145
.
Figure 9-2 Maximum water height history hindcast during hurricane Katrina. Graphics obtained from the Coastal Emergency Risks Assessment (CERA) showing water levels in the Lake Pontchartrain and Vicinity area in ft-NAVD88. Model boundaries, including levees, roads, etc. are shown in brown. The results shown here were generated using the ADCIRC and SWAN models.
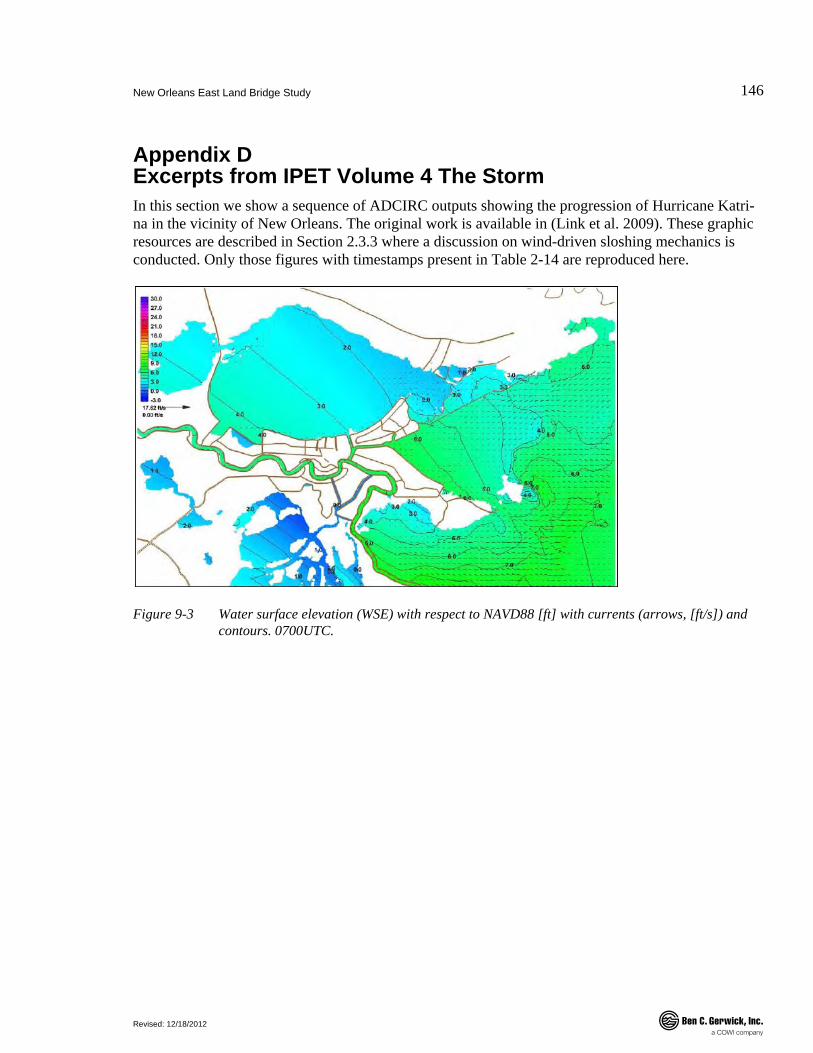
New Orleans East Land Bridge Study
Revised: 12/18/2012
146
.
Appendix D Excerpts from IPET Volume 4 The Storm In this section we show a sequence of ADCIRC outputs showing the progression of Hurricane Katri-na in the vicinity of New Orleans. The original work is available in (Link et al. 2009). These graphic resources are described in Section 2.3.3 where a discussion on wind-driven sloshing mechanics is conducted. Only those figures with timestamps present in Table 2-14 are reproduced here.
Figure 9-3 Water surface elevation (WSE) with respect to NAVD88 [ft] with currents (arrows, [ft/s]) and contours. 0700UTC.
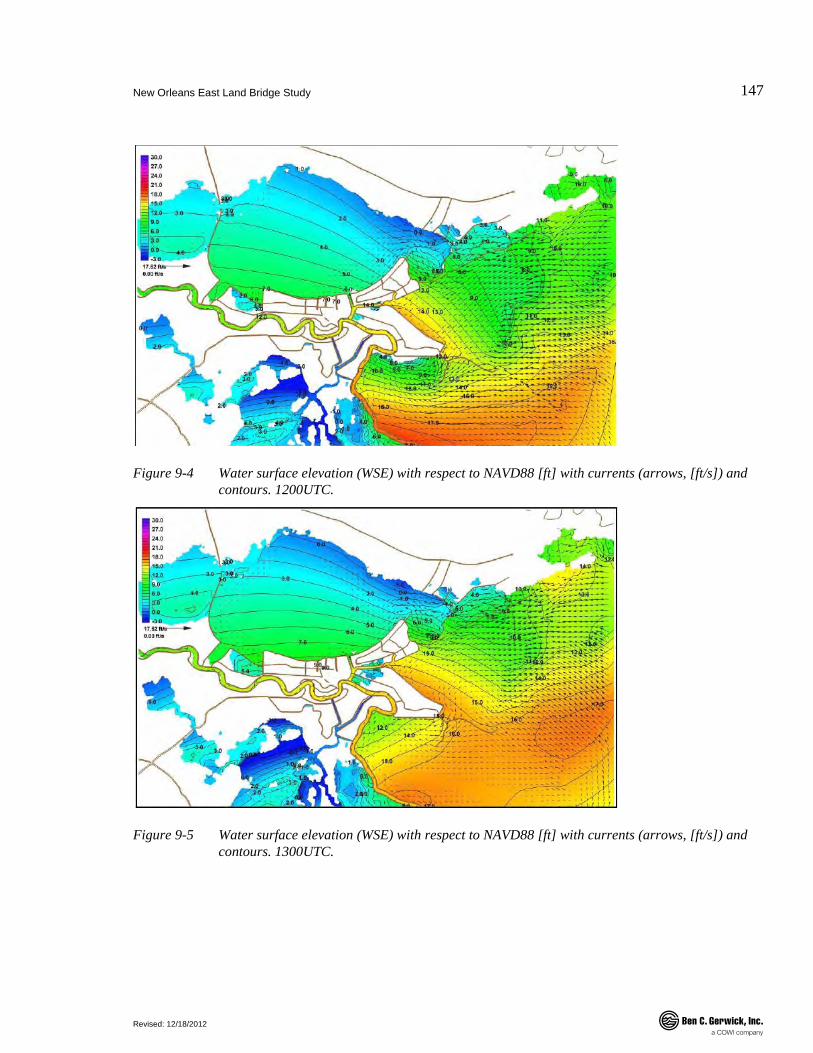
New Orleans East Land Bridge Study
Revised: 12/18/2012
147
.
Figure 9-4 Water surface elevation (WSE) with respect to NAVD88 [ft] with currents (arrows, [ft/s]) and contours. 1200UTC.
Figure 9-5 Water surface elevation (WSE) with respect to NAVD88 [ft] with currents (arrows, [ft/s]) and contours. 1300UTC.
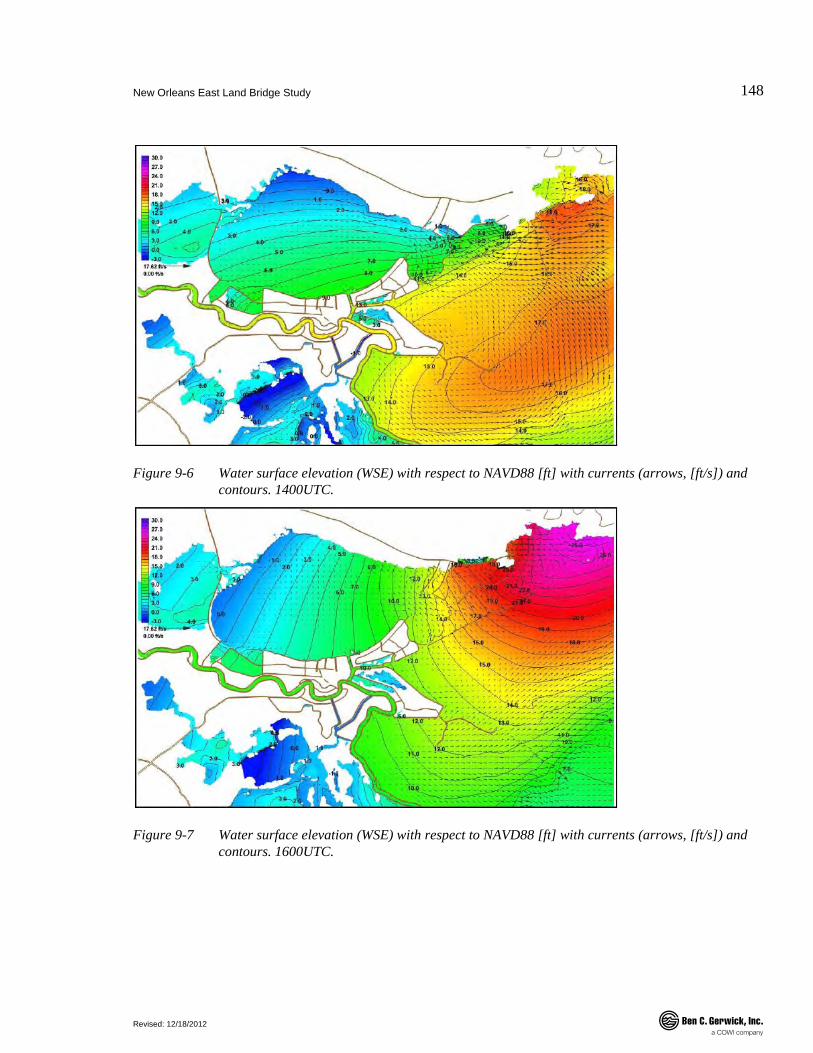
New Orleans East Land Bridge Study
Revised: 12/18/2012
148
.
Figure 9-6 Water surface elevation (WSE) with respect to NAVD88 [ft] with currents (arrows, [ft/s]) and contours. 1400UTC.
Figure 9-7 Water surface elevation (WSE) with respect to NAVD88 [ft] with currents (arrows, [ft/s]) and contours. 1600UTC.
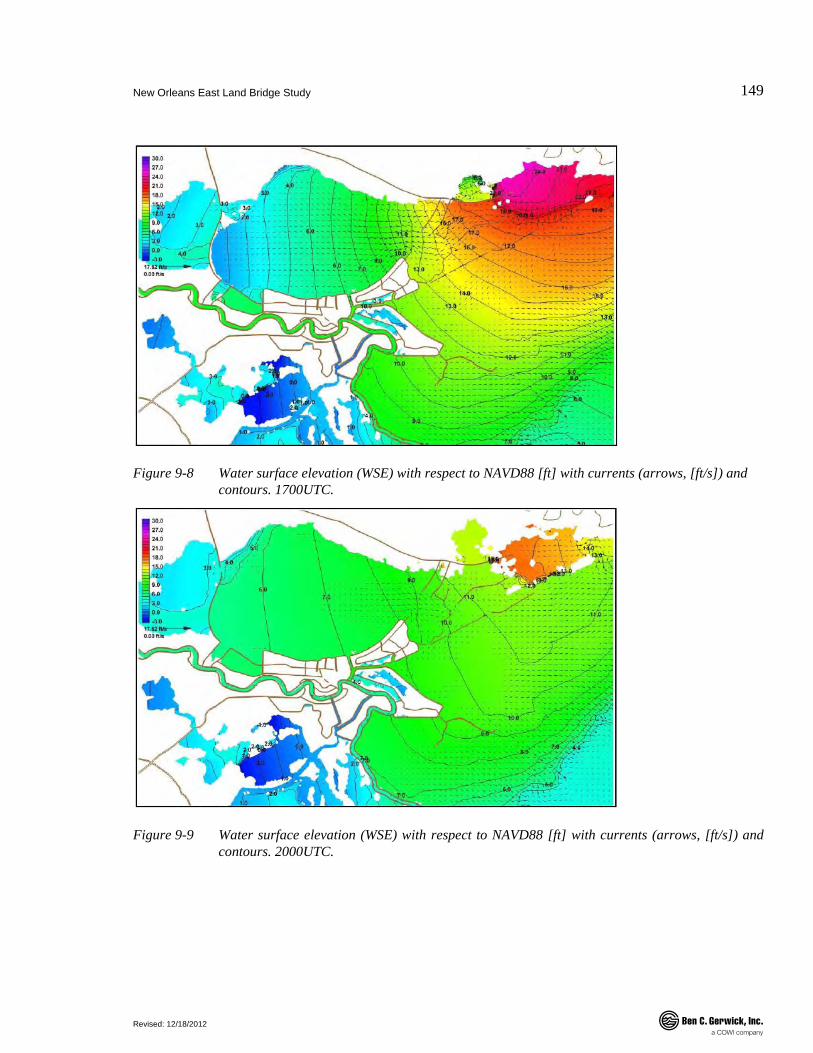
New Orleans East Land Bridge Study
Revised: 12/18/2012
149
.
Figure 9-8 Water surface elevation (WSE) with respect to NAVD88 [ft] with currents (arrows, [ft/s]) and contours. 1700UTC.
Figure 9-9 Water surface elevation (WSE) with respect to NAVD88 [ft] with currents (arrows, [ft/s]) and contours. 2000UTC.

New Orleans East Land Bridge Study
Revised: 12/18/2012
150
.
Appendix E Hydraulic Assessment ADCIRC and SWAN Modeling by ARCADIS, US Inc.
Imagine the result
Effectiveness of a Proposed Levee Structure to Suppress Storm Surge and Waves in the Lake Pontchartrain Basin
Numerical Simulations and Scenario Analysis
11 July 2012

Effectiveness of a Proposed Levee Structure to Suppress Storm Surge and Waves in the Lake Pontchartrain Basin Numerical Simulations and Scenario Analysis
Haihong Zhao, Ph.D. Civil Specialist John H. Atkinson, Ph.D. Senior Engineer Hugh J. Roberts, P.E. Project Manager
Prepared for:
Ben C. Gerwick, Inc.
Prepared by:
ARCADIS U.S., Inc. 10352 Plaza Americana Drive Baton Rouge Louisiana 70816 Tel 225 292 1004 Fax 225 218 9677
Our Ref.:
LA003080.0001.REPRT
Date:
11 July 2012 This document is intended only for the use of the individual or entity for which it was prepared and may contain information that is privileged, confidential and exempt from disclosure under applicable law. Any dissemination, distribution or copying of this document is strictly prohibited.

Ben C Gerwick/3080.1/R/1/jha i
Table of Contents
1. Introduction 1
2. Identification of Representative Storm Scenarios 1
2.1 Procedure 1
2.2 Final Selection 4
2.3 Storm Characteristics 8
3. Hydraulic Cases Meshing 10
3.1 Scenarios 10
3.2 Meshing 11
4. Results and Analysis 16
4.1 Simulation Results 16
4.2 Scenario Analysis 18
4.2.1 Effects of Sea Level Rise 18
4.2.2 Maximum Water Elevation Differences 19
4.2.2.1 Effect of the ELB 20
4.2.2.2 Effects of the Proposed Levee 24
4.2.3 Inter-Scenario Comparison 28
4.2.4 Current Velocity 36
4.2.5 Wave Parameters 42
5. Summary and Conclusions 48
6. References 51
Tables
Table 1. Average and variation of FEMA surge values along the ELB 4
Table 2. Peak surge levels from the individual FEMA synthetic storms 7
Table 3. Synthetic storm characteristics 9
Table 4. Abbreviations of images’ titles and description 16
Table 5 Surge levels at LF stations 32
Ben C Gerwick/3080.1/R/1/jha ii
Table of Contents
Table 6 Wave heights and corresponding peak periods at LF stations for the Open-Gate-ELB-intact scenario 47
Figures
Figure 1. Schematic of the proposed ELB levee alignment and FEMA flood level evaluation points. 2
Figure 2. Trend of FEMA surge values along proposed levee alignment. 3
Figure 3. Surge values of the candidate storms for the three sub-regions. 5
Figure 4. Variation along the ELB levee alignment of the FEMA return, the surge from the four individual storms, the mean of the four storms, and the MEOW of the four storms. 6
Figure 5. Comparison between target surge levels and selected storm surge levels. 8
Figure 6. Tracks of selected FEMA synthetic storms. 9
Figure 7. Grid size in the study area. 12
Figure 8. Map of bathymetry in ELB area and vicinity with the tentative levee structure. 12
Figure 9. Map of the bathymetry in ELB area with the open levee structure and degraded ELB. 13
Figure 10. Land elevation profile along transects with and without ELB degraded. 14
Figure 11. Map of the Manning’s coefficient in degraded ELB area (red dotted line). 15
Figure 12. Map of the horizontal eddy viscosity in degraded ELB area (red dotted line). 15
Figure 13. Project area overview and simulation comparison locations (Levee-Front [LF], Chef Menteur pass [CM], Rigolets pass [RP], and Lake Pontchartrain [LK]). 17
Figure 14. Variation of maximum and mean of four storms for the Current Condition (CC) and for the base scenario (FWOA). The solid black line is the CC statistical values from the FEMA FIS. 19
Figure 15. Difference in Maximum Surge Envelope between the FWOA-ELB-degraded scenario and the base scenario. Positive values indicate higher surge in the FWOA-ELB-degraded scenario. 21
Figure 16. Difference in Maximum Surge Envelope between the Levee-Gate-Open-ELB-degraded scenario and Levee-Gate-Open-ELB-intact scenario. Positive values indicate higher surge in the ELB-degraded scenario. 22
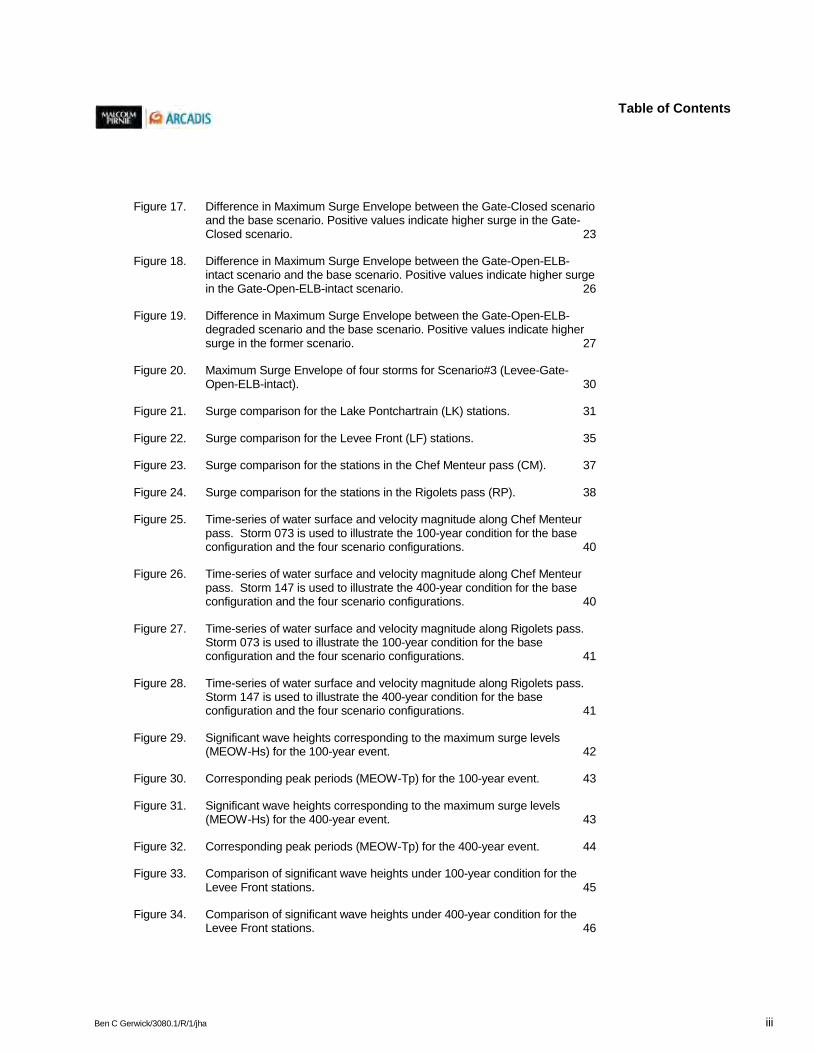
Ben C Gerwick/3080.1/R/1/jha iii
Table of Contents
Figure 17. Difference in Maximum Surge Envelope between the Gate-Closed scenario and the base scenario. Positive values indicate higher surge in the Gate-Closed scenario. 23
Figure 18. Difference in Maximum Surge Envelope between the Gate-Open-ELB-intact scenario and the base scenario. Positive values indicate higher surge in the Gate-Open-ELB-intact scenario. 26
Figure 19. Difference in Maximum Surge Envelope between the Gate-Open-ELB-degraded scenario and the base scenario. Positive values indicate higher surge in the former scenario. 27
Figure 20. Maximum Surge Envelope of four storms for Scenario#3 (Levee-Gate-Open-ELB-intact). 30
Figure 21. Surge comparison for the Lake Pontchartrain (LK) stations. 31
Figure 22. Surge comparison for the Levee Front (LF) stations. 35
Figure 23. Surge comparison for the stations in the Chef Menteur pass (CM). 37
Figure 24. Surge comparison for the stations in the Rigolets pass (RP). 38
Figure 25. Time-series of water surface and velocity magnitude along Chef Menteur pass. Storm 073 is used to illustrate the 100-year condition for the base configuration and the four scenario configurations. 40
Figure 26. Time-series of water surface and velocity magnitude along Chef Menteur pass. Storm 147 is used to illustrate the 400-year condition for the base configuration and the four scenario configurations. 40
Figure 27. Time-series of water surface and velocity magnitude along Rigolets pass. Storm 073 is used to illustrate the 100-year condition for the base configuration and the four scenario configurations. 41
Figure 28. Time-series of water surface and velocity magnitude along Rigolets pass. Storm 147 is used to illustrate the 400-year condition for the base configuration and the four scenario configurations. 41
Figure 29. Significant wave heights corresponding to the maximum surge levels (MEOW-Hs) for the 100-year event. 42
Figure 30. Corresponding peak periods (MEOW-Tp) for the 100-year event. 43
Figure 31. Significant wave heights corresponding to the maximum surge levels (MEOW-Hs) for the 400-year event. 43
Figure 32. Corresponding peak periods (MEOW-Tp) for the 400-year event. 44
Figure 33. Comparison of significant wave heights under 100-year condition for the Levee Front stations. 45
Figure 34. Comparison of significant wave heights under 400-year condition for the Levee Front stations. 46
Ben C Gerwick/3080.1/R/1/jha iv
Table of Contents
Appendices
Appendix A CD
Appendix B Tracks of Selected FEMA Synthetic Storms
Appendix C Variation of Surge Levels for the Future Scenarios
Appendix D Wider Extent View of MWED
Appendix E Surge Elevations at Stations in Lake Pontchartrain (LK), Chef Menteur Pass (CM), and Rigolets Pass (RP)
Ben C Gerwick/3080.1/R/1/jha 1
Effectiveness of a proposed levee structure in suppressing storm surge and waves in the Lake Pontchartain Basin
D
R
A
F
T
Numerical Simulations and Scenario Analysis
1. Introduction
ARCADIS U.S., Inc. (ARCADIS) was subcontracted to provide the Southeast Louisiana Flood Protection Authority-East with a modeling study using the Advanced Circulation model (ADCIRC) and the Simulation Wave Nearshore model (SWAN) to explore the feasibility of constructing a new flood protection levee to suppress storm surge and waves from entering Lake Pontchartrain. Three proposed levee configurations are evaluated in this report. The configurations are based upon structures included in the previous Louisiana Coastal Protection and Restoration (LACPR; USACE 2009) study with levee alignment specifics and crest elevations supplied by Ben C. Gerwick, Inc. A set of storm conditions were chosen from the suite of synthetic storms used during the recent Federal Emergency Management Agency (FEMA) Flood Insurance Study (FIS) (Westerink et al. 2007) and LACPR studies to approximately match the 100- and 400-year statistical surge levels. The efficacy of the levee configurations is evaluated in this report by comparing the simulation results for the proposed levees to the results of a future-without-action scenario. All of the simulations performed for this study include estimated future sea level rise and subsidence impacts. The following report documents how the representative storms were chosen, how the numerical models were constructed, and an analysis of the results of the simulations.
2. Identification of Representative Storm Scenarios
In preparation for performing storm surge simulations of the proposed East Land Bridge (ELB) protection barrier, a small set of storm events was identified to indicate how the proposed levee would affect the target surge levels: 100- and 400-year statistical flood elevations. The target surge levels to be used as criteria in selecting the storm scenarios were extracted from the existing FEMA flood data for the region. For this feasibility-level study, ARCADIS was required to identify only four storms to represent each of the two return periods of interest. These storm scenarios were chosen from the existing suite of synthetic hurricanes as developed and used by FEMA for generating the local storm surge statistics.
2.1 Procedure
The procedure for identifying the target flood level and for selecting the representative storm scenarios is described here.
First, along the alignment of the proposed ELB levee alignment (the black dashed line in Figure 1), a series of locations were selected (red dots in Figure 1) to inventory the
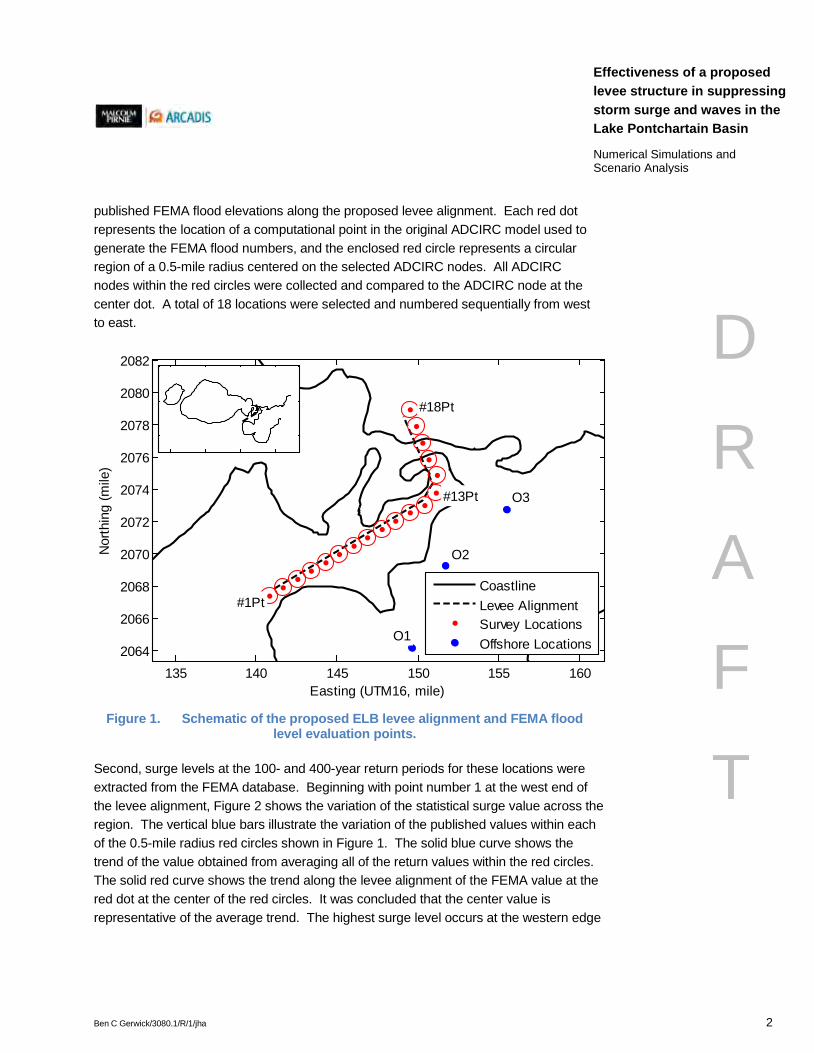
Ben C Gerwick/3080.1/R/1/jha 2
Effectiveness of a proposed levee structure in suppressing storm surge and waves in the Lake Pontchartain Basin
D
R
A
F
T
Numerical Simulations and Scenario Analysis
published FEMA flood elevations along the proposed levee alignment. Each red dot represents the location of a computational point in the original ADCIRC model used to generate the FEMA flood numbers, and the enclosed red circle represents a circular region of a 0.5-mile radius centered on the selected ADCIRC nodes. All ADCIRC nodes within the red circles were collected and compared to the ADCIRC node at the center dot. A total of 18 locations were selected and numbered sequentially from west to east.
Figure 1. Schematic of the proposed ELB levee alignment and FEMA flood level evaluation points.
Second, surge levels at the 100- and 400-year return periods for these locations were extracted from the FEMA database. Beginning with point number 1 at the west end of the levee alignment, Figure 2 shows the variation of the statistical surge value across the region. The vertical blue bars illustrate the variation of the published values within each of the 0.5-mile radius red circles shown in Figure 1. The solid blue curve shows the trend of the value obtained from averaging all of the return values within the red circles. The solid red curve shows the trend along the levee alignment of the FEMA value at the red dot at the center of the red circles. It was concluded that the center value is representative of the average trend. The highest surge level occurs at the western edge
135 140 145 150 155 1602064
2066
2068
2070
2072
2074
2076
2078
2080
2082
#1Pt
#13Pt
#18Pt
O1
O2
O3
Easting (UTM16, mile)
Nor
thin
g (m
ile)
CoastlineLevee AlignmentSurvey LocationsOffshore Locations

Ben C Gerwick/3080.1/R/1/jha 3
Effectiveness of a proposed levee structure in suppressing storm surge and waves in the Lake Pontchartain Basin
D
R
A
F
T
Numerical Simulations and Scenario Analysis
of the alignment and decreases to a local minima between points 6 and 8, then begins to rise again toward a local maxima between points 12 and 13. The proposed levee alignment makes a 90-degree turn to the north at point 13. As can be seen in Figure 2, the FEMA surge values decrease along the short northwest segment. The trend is similar for both the 100- and 400-year values.
Figure 2. Trend of FEMA surge values along proposed levee alignment.
Third, using the FEMA surge levels at the selected ADCIRC nodes (red dots in Figure 1), Table 1 lists the mean and the variation (standard deviation/mean) of the 100- and 400-year flood elevation for the entire ELB region. The variation of surge levels along the ELB is small (approximately 5 percent). Thus, three locations from the original set of 18 survey locations were selected to represent the regional values along the proposed levee alignment: the 5th, 12th, and 17th survey locations; correspondingly, the center ADCIRC nodes are 111689, 113202 and 26454. These three locations were used to query the ADCIRC FEMA storm database to find individual storm simulations, which generate surge values similar to the 100- and 400-year storm surge levels. Three offshore locations were also evaluated in order to gain an understanding of how the FEMA surge values vary regionally.
-2 0 2 4 6 8 10 12 14 16 1812
14
16
18
Distance from #1Pt (mile)
Storm Surge Level Tr=100year
Sur
ge L
evel
(NA
VD
88, f
t)
-2 0 2 4 6 8 10 12 14 16 1814
16
18
20
Distance from #1Pt (mile)
Storm Surge Level Tr=400year
Sur
ge L
evel
(NA
VD
88, f
t)
Center nodeMean
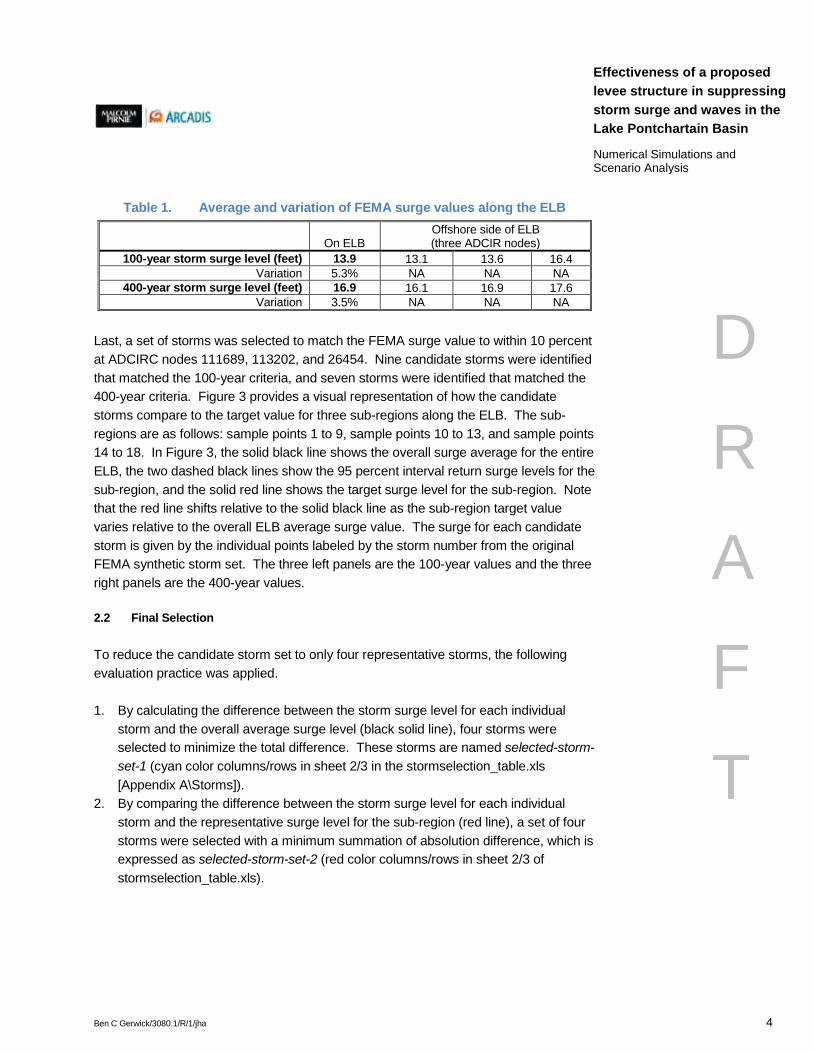
Ben C Gerwick/3080.1/R/1/jha 4
Effectiveness of a proposed levee structure in suppressing storm surge and waves in the Lake Pontchartain Basin
D
R
A
F
T
Numerical Simulations and Scenario Analysis
Table 1. Average and variation of FEMA surge values along the ELB
On ELB Offshore side of ELB (three ADCIR nodes)
100-year storm surge level (feet) 13.9 13.1 13.6 16.4 Variation 5.3% NA NA NA
400-year storm surge level (feet) 16.9 16.1 16.9 17.6 Variation 3.5% NA NA NA
Last, a set of storms was selected to match the FEMA surge value to within 10 percent at ADCIRC nodes 111689, 113202, and 26454. Nine candidate storms were identified that matched the 100-year criteria, and seven storms were identified that matched the 400-year criteria. Figure 3 provides a visual representation of how the candidate storms compare to the target value for three sub-regions along the ELB. The sub-regions are as follows: sample points 1 to 9, sample points 10 to 13, and sample points 14 to 18. In Figure 3, the solid black line shows the overall surge average for the entire ELB, the two dashed black lines show the 95 percent interval return surge levels for the sub-region, and the solid red line shows the target surge level for the sub-region. Note that the red line shifts relative to the solid black line as the sub-region target value varies relative to the overall ELB average surge value. The surge for each candidate storm is given by the individual points labeled by the storm number from the original FEMA synthetic storm set. The three left panels are the 100-year values and the three right panels are the 400-year values.
2.2 Final Selection
To reduce the candidate storm set to only four representative storms, the following evaluation practice was applied.
1. By calculating the difference between the storm surge level for each individual storm and the overall average surge level (black solid line), four storms were selected to minimize the total difference. These storms are named selected-storm-set-1 (cyan color columns/rows in sheet 2/3 in the stormselection_table.xls [Appendix A\Storms]).
2. By comparing the difference between the storm surge level for each individual storm and the representative surge level for the sub-region (red line), a set of four storms were selected with a minimum summation of absolution difference, which is expressed as selected-storm-set-2 (red color columns/rows in sheet 2/3 of stormselection_table.xls).

Ben C Gerwick/3080.1/R/1/jha 5
Effectiveness of a proposed levee structure in suppressing storm surge and waves in the Lake Pontchartain Basin
D
R
A
F
T
Numerical Simulations and Scenario Analysis
Figure 3. Surge values of the candidate storms for the three sub-regions.
0 2 4 6 8 1012
13
14
15
16
9 15 17
73103116
126
138
158
Sub-region1
Stormj
Tr=100 years
0 2 4 6 814
16
18
20
18
24
57
85 94
127147
Sub-region1
Stormj
Tr=400 years
0 2 4 6 8 1012
13
14
15
16
9
15 17 73
103
116 126
138
158
Sub-region2
Stormj
Sur
ge L
evel
(ft)
0 2 4 6 814
16
18
20
18 24
57
85 94
127
147
Sub-region2
Stormj
0 2 4 6 8 1012
13
14
15
16
9
15 17 73103
116126
138
158
Sub-region3
Stormj
0 2 4 6 814
16
18
20
18 24
57
85 94 127
147
Sub-region3
Stormj

Ben C Gerwick/3080.1/R/1/jha 6
Effectiveness of a proposed levee structure in suppressing storm surge and waves in the Lake Pontchartain Basin
D
R
A
F
T
Numerical Simulations and Scenario Analysis
3. By comparing the difference between the storm surge level for each individual storm and the representative surge level for the sub-region (red line), a set of four storms were selected with a minimum summation of absolution difference, which is expressed as selected-storm-set-2 (red color columns/rows in sheet 2/3 of stormselection_table.xls).
4. Storm-set-2 on sheet 2 is used for the 100-year storms and storm-set-1 on sheet 3 is used for 400-year storms. These storm sets were chosen to best match the target values in both the sub-regions and across the entire ELB region.
Figure 4 plots the variation of 100- and 400-year return surge levels along the proposed ELB levee alignment. The black solid line is the published statistical FEMA surge value and the four colored lines represent the individual storm surge levels for the selected storms. The maximum envelope of the four individual storms is represented by the dashed black line and the mean value of the four storms is represented by the line with circles. Table 2 lists the surge levels from the selected FEMA synthetic storms at three representative locations (#5, #12, and #17) and three offshore locations (O1, O2, and O3) for reference.
Figure 4. Variation along the ELB levee alignment of the FEMA return, the surge from the four individual storms, the mean of the four storms, and the
MEOW of the four storms.
0 5 10 15 20 2512
13
14
15
16
17
Distance from #1Pt (mile)
Sur
ge L
evel
(NA
VD
88, f
t)
Storm Surge Level Tr=100year
100yearStorm#15Storm#73Storm#103Storm#116MEOWMEAN
0 5 10 15 20 2515
16
17
18
19
20
Distance from #1Pt (mile)
Sur
ge L
evel
(NA
VD
88, f
t)
Storm Surge Level Tr=400year
400yearStorm#18Storm#85Storm#94Storm#147MEOWMEAN
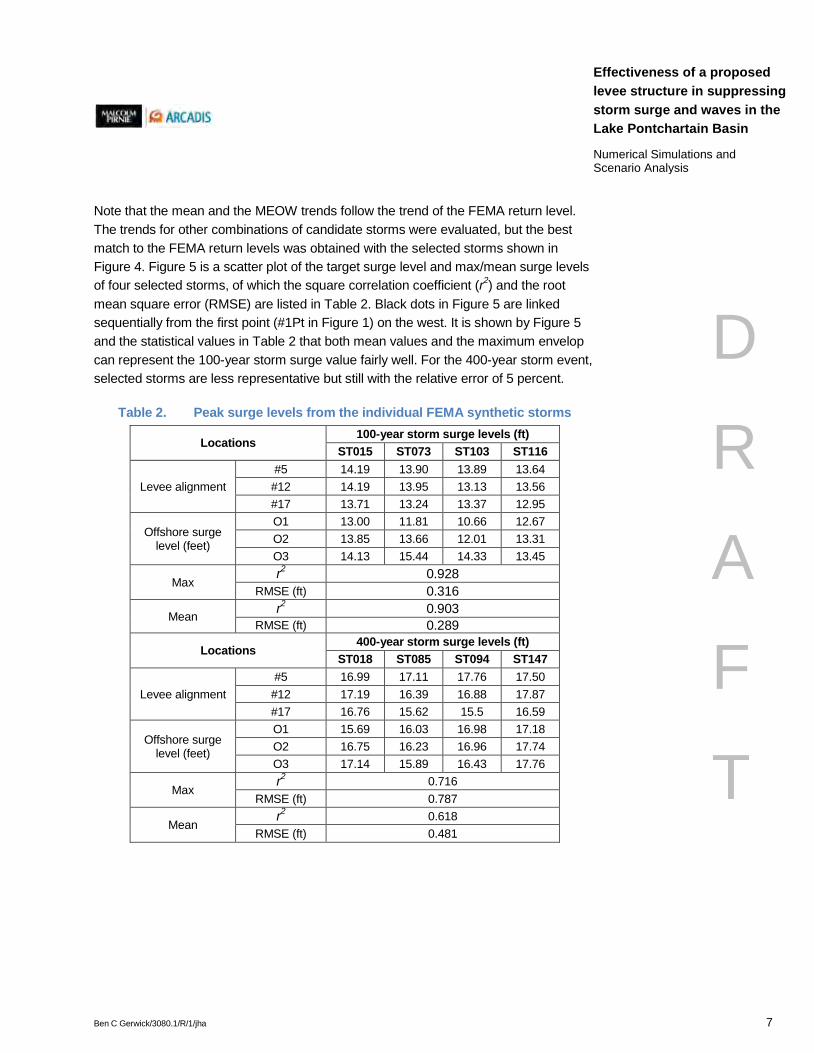
Ben C Gerwick/3080.1/R/1/jha 7
Effectiveness of a proposed levee structure in suppressing storm surge and waves in the Lake Pontchartain Basin
D
R
A
F
T
Numerical Simulations and Scenario Analysis
Note that the mean and the MEOW trends follow the trend of the FEMA return level. The trends for other combinations of candidate storms were evaluated, but the best match to the FEMA return levels was obtained with the selected storms shown in Figure 4. Figure 5 is a scatter plot of the target surge level and max/mean surge levels of four selected storms, of which the square correlation coefficient (r2) and the root mean square error (RMSE) are listed in Table 2. Black dots in Figure 5 are linked sequentially from the first point (#1Pt in Figure 1) on the west. It is shown by Figure 5 and the statistical values in Table 2 that both mean values and the maximum envelop can represent the 100-year storm surge value fairly well. For the 400-year storm event, selected storms are less representative but still with the relative error of 5 percent.
Table 2. Peak surge levels from the individual FEMA synthetic storms
Locations 100-year storm surge levels (ft)
ST015 ST073 ST103 ST116
Levee alignment #5 14.19 13.90 13.89 13.64
#12 14.19 13.95 13.13 13.56 #17 13.71 13.24 13.37 12.95
Offshore surge level (feet)
O1 13.00 11.81 10.66 12.67 O2 13.85 13.66 12.01 13.31 O3 14.13 15.44 14.33 13.45
Max r2 0.928
RMSE (ft) 0.316
Mean r2 0.903 RMSE (ft) 0.289
Locations 400-year storm surge levels (ft)
ST018 ST085 ST094 ST147
Levee alignment #5 16.99 17.11 17.76 17.50
#12 17.19 16.39 16.88 17.87 #17 16.76 15.62 15.5 16.59
Offshore surge level (feet)
O1 15.69 16.03 16.98 17.18 O2 16.75 16.23 16.96 17.74 O3 17.14 15.89 16.43 17.76
Max r2 0.716
RMSE (ft) 0.787
Mean r2 0.618
RMSE (ft) 0.481
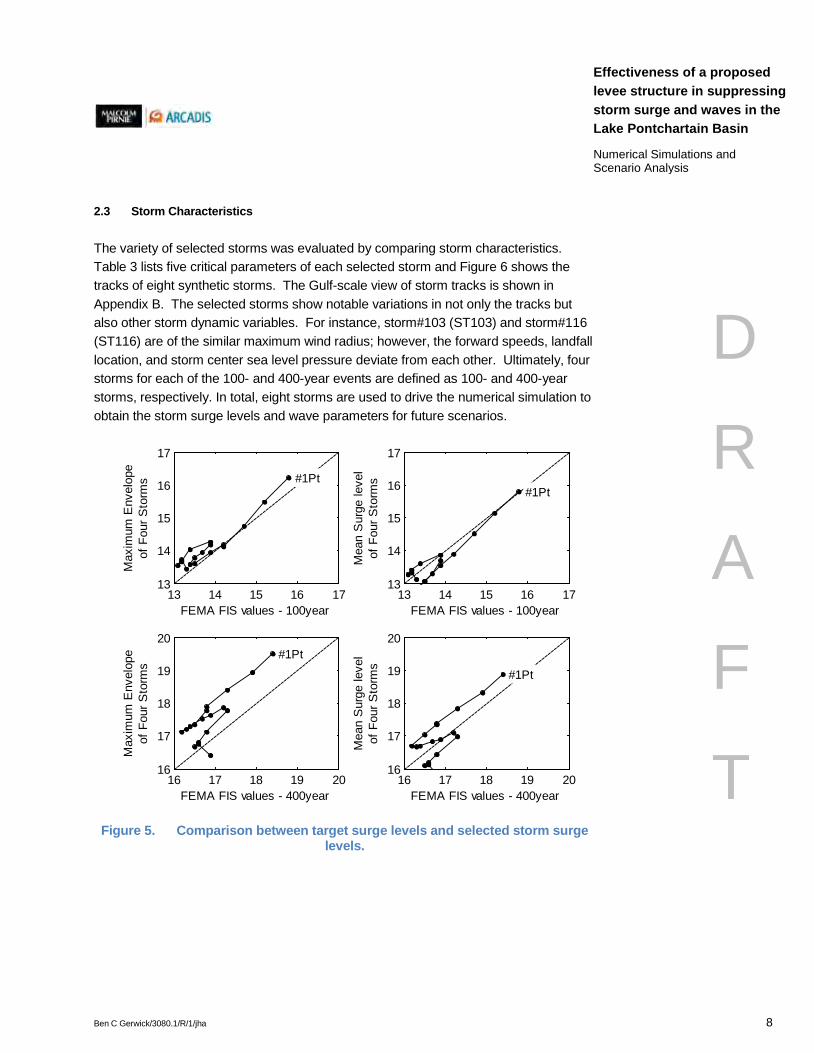
Ben C Gerwick/3080.1/R/1/jha 8
Effectiveness of a proposed levee structure in suppressing storm surge and waves in the Lake Pontchartain Basin
D
R
A
F
T
Numerical Simulations and Scenario Analysis
2.3 Storm Characteristics
The variety of selected storms was evaluated by comparing storm characteristics. Table 3 lists five critical parameters of each selected storm and Figure 6 shows the tracks of eight synthetic storms. The Gulf-scale view of storm tracks is shown in Appendix B. The selected storms show notable variations in not only the tracks but also other storm dynamic variables. For instance, storm#103 (ST103) and storm#116 (ST116) are of the similar maximum wind radius; however, the forward speeds, landfall location, and storm center sea level pressure deviate from each other. Ultimately, four storms for each of the 100- and 400-year events are defined as 100- and 400-year storms, respectively. In total, eight storms are used to drive the numerical simulation to obtain the storm surge levels and wave parameters for future scenarios.
Figure 5. Comparison between target surge levels and selected storm surge
levels.
13 14 15 16 1713
14
15
16
17
#1Pt
FEMA FIS values - 100year
Max
imum
Env
elop
eof
Fou
r Sto
rms
13 14 15 16 1713
14
15
16
17
#1Pt
FEMA FIS values - 100year
Mea
n S
urge
leve
lof
Fou
r Sto
rms
16 17 18 19 2016
17
18
19
20#1Pt
FEMA FIS values - 400year
Max
imum
Env
elop
eof
Fou
r Sto
rms
16 17 18 19 2016
17
18
19
20
#1Pt
FEMA FIS values - 400year
Mea
n S
urge
leve
lof
Fou
r Sto
rms
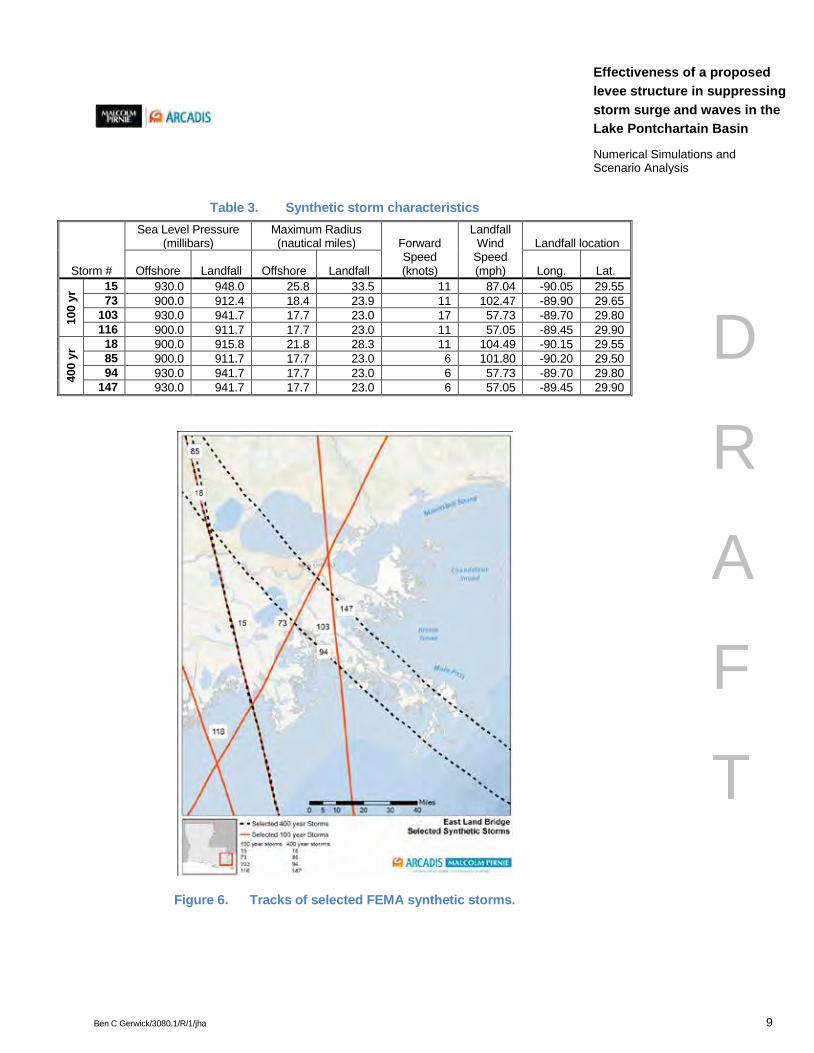
Ben C Gerwick/3080.1/R/1/jha 9
Effectiveness of a proposed levee structure in suppressing storm surge and waves in the Lake Pontchartain Basin
D
R
A
F
T
Numerical Simulations and Scenario Analysis
Table 3. Synthetic storm characteristics
Storm #
Sea Level Pressure (millibars)
Maximum Radius (nautical miles) Forward
Speed (knots)
Landfall Wind
Speed (mph)
Landfall location
Offshore Landfall Offshore Landfall Long. Lat.
100
yr 15 930.0 948.0 25.8 33.5 11 87.04 -90.05 29.55
73 900.0 912.4 18.4 23.9 11 102.47 -89.90 29.65 103 930.0 941.7 17.7 23.0 17 57.73 -89.70 29.80 116 900.0 911.7 17.7 23.0 11 57.05 -89.45 29.90
400
yr 18 900.0 915.8 21.8 28.3 11 104.49 -90.15 29.55
85 900.0 911.7 17.7 23.0 6 101.80 -90.20 29.50 94 930.0 941.7 17.7 23.0 6 57.73 -89.70 29.80
147 930.0 941.7 17.7 23.0 6 57.05 -89.45 29.90
Figure 6. Tracks of selected FEMA synthetic storms.
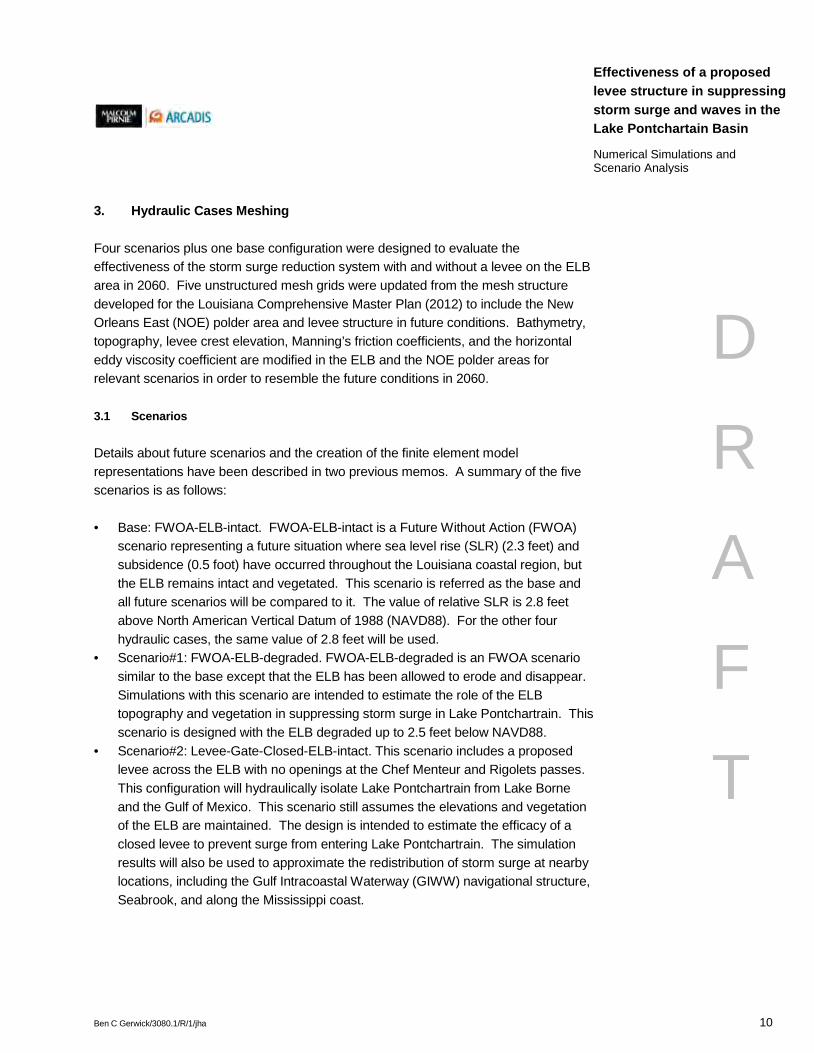
Ben C Gerwick/3080.1/R/1/jha 10
Effectiveness of a proposed levee structure in suppressing storm surge and waves in the Lake Pontchartain Basin
D
R
A
F
T
Numerical Simulations and Scenario Analysis
3. Hydraulic Cases Meshing
Four scenarios plus one base configuration were designed to evaluate the effectiveness of the storm surge reduction system with and without a levee on the ELB area in 2060. Five unstructured mesh grids were updated from the mesh structure developed for the Louisiana Comprehensive Master Plan (2012) to include the New Orleans East (NOE) polder area and levee structure in future conditions. Bathymetry, topography, levee crest elevation, Manning’s friction coefficients, and the horizontal eddy viscosity coefficient are modified in the ELB and the NOE polder areas for relevant scenarios in order to resemble the future conditions in 2060.
3.1 Scenarios
Details about future scenarios and the creation of the finite element model representations have been described in two previous memos. A summary of the five scenarios is as follows:
· Base: FWOA-ELB-intact. FWOA-ELB-intact is a Future Without Action (FWOA) scenario representing a future situation where sea level rise (SLR) (2.3 feet) and subsidence (0.5 foot) have occurred throughout the Louisiana coastal region, but the ELB remains intact and vegetated. This scenario is referred as the base and all future scenarios will be compared to it. The value of relative SLR is 2.8 feet above North American Vertical Datum of 1988 (NAVD88). For the other four hydraulic cases, the same value of 2.8 feet will be used.
· Scenario#1: FWOA-ELB-degraded. FWOA-ELB-degraded is an FWOA scenario similar to the base except that the ELB has been allowed to erode and disappear. Simulations with this scenario are intended to estimate the role of the ELB topography and vegetation in suppressing storm surge in Lake Pontchartrain. This scenario is designed with the ELB degraded up to 2.5 feet below NAVD88.
· Scenario#2: Levee-Gate-Closed-ELB-intact. This scenario includes a proposed levee across the ELB with no openings at the Chef Menteur and Rigolets passes. This configuration will hydraulically isolate Lake Pontchartrain from Lake Borne and the Gulf of Mexico. This scenario still assumes the elevations and vegetation of the ELB are maintained. The design is intended to estimate the efficacy of a closed levee to prevent surge from entering Lake Pontchartrain. The simulation results will also be used to approximate the redistribution of storm surge at nearby locations, including the Gulf Intracoastal Waterway (GIWW) navigational structure, Seabrook, and along the Mississippi coast.
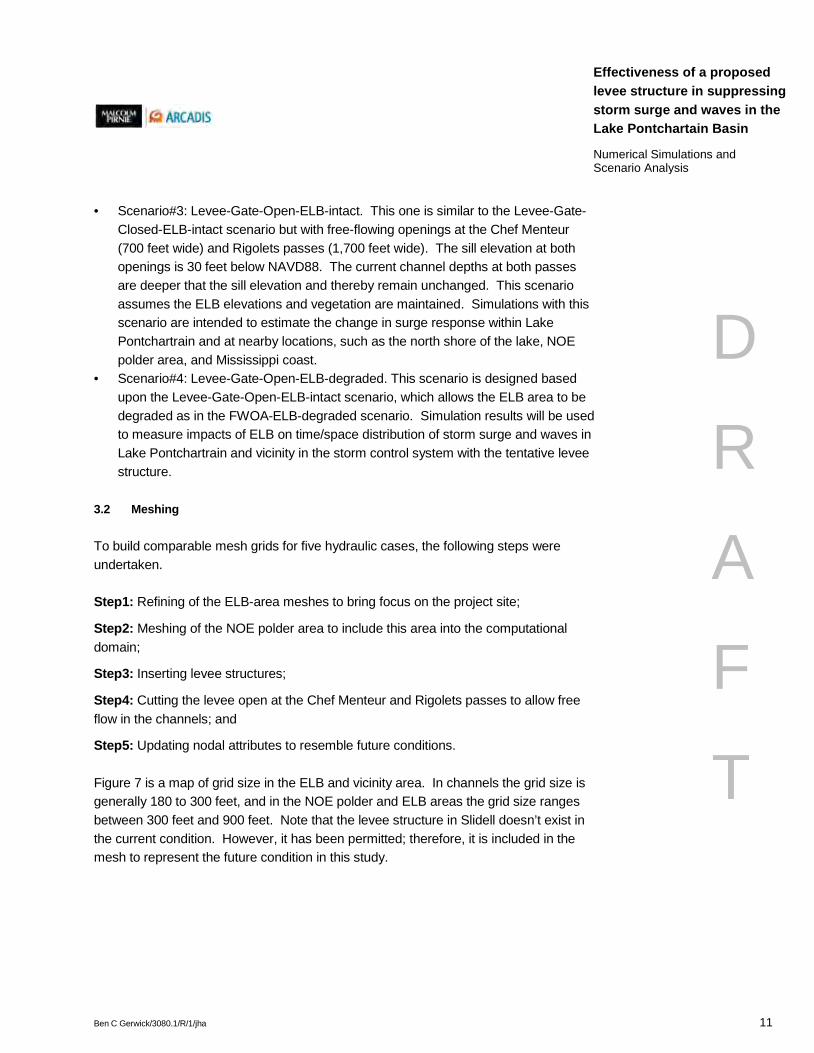
Ben C Gerwick/3080.1/R/1/jha 11
Effectiveness of a proposed levee structure in suppressing storm surge and waves in the Lake Pontchartain Basin
D
R
A
F
T
Numerical Simulations and Scenario Analysis
· Scenario#3: Levee-Gate-Open-ELB-intact. This one is similar to the Levee-Gate-Closed-ELB-intact scenario but with free-flowing openings at the Chef Menteur (700 feet wide) and Rigolets passes (1,700 feet wide). The sill elevation at both openings is 30 feet below NAVD88. The current channel depths at both passes are deeper that the sill elevation and thereby remain unchanged. This scenario assumes the ELB elevations and vegetation are maintained. Simulations with this scenario are intended to estimate the change in surge response within Lake Pontchartrain and at nearby locations, such as the north shore of the lake, NOE polder area, and Mississippi coast.
· Scenario#4: Levee-Gate-Open-ELB-degraded. This scenario is designed based upon the Levee-Gate-Open-ELB-intact scenario, which allows the ELB area to be degraded as in the FWOA-ELB-degraded scenario. Simulation results will be used to measure impacts of ELB on time/space distribution of storm surge and waves in Lake Pontchartrain and vicinity in the storm control system with the tentative levee structure.
3.2 Meshing
To build comparable mesh grids for five hydraulic cases, the following steps were undertaken.
Step1: Refining of the ELB-area meshes to bring focus on the project site;
Step2: Meshing of the NOE polder area to include this area into the computational domain;
Step3: Inserting levee structures;
Step4: Cutting the levee open at the Chef Menteur and Rigolets passes to allow free flow in the channels; and
Step5: Updating nodal attributes to resemble future conditions.
Figure 7 is a map of grid size in the ELB and vicinity area. In channels the grid size is generally 180 to 300 feet, and in the NOE polder and ELB areas the grid size ranges between 300 feet and 900 feet. Note that the levee structure in Slidell doesn’t exist in the current condition. However, it has been permitted; therefore, it is included in the mesh to represent the future condition in this study.
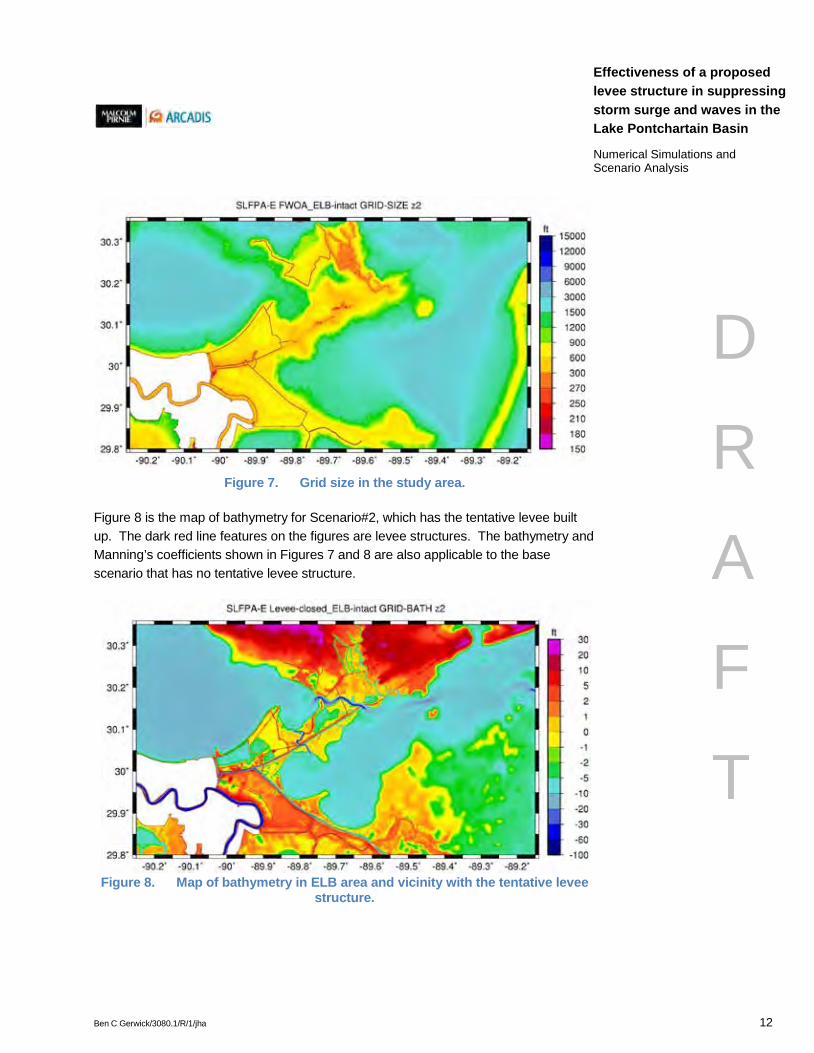
Ben C Gerwick/3080.1/R/1/jha 12
Effectiveness of a proposed levee structure in suppressing storm surge and waves in the Lake Pontchartain Basin
D
R
A
F
T
Numerical Simulations and Scenario Analysis
Figure 7. Grid size in the study area.
Figure 8 is the map of bathymetry for Scenario#2, which has the tentative levee built up. The dark red line features on the figures are levee structures. The bathymetry and Manning’s coefficients shown in Figures 7 and 8 are also applicable to the base scenario that has no tentative levee structure.
Figure 8. Map of bathymetry in ELB area and vicinity with the tentative levee structure.
Ben C Gerwick/3080.1/R/1/jha 13
Effectiveness of a proposed levee structure in suppressing storm surge and waves in the Lake Pontchartain Basin
D
R
A
F
T
Numerical Simulations and Scenario Analysis
Figure 9 is a zoomed-in ELB view of the bathymetry with the levee open at the Chef Menteur and Rigolets passes and with the ELB area degraded. The land degradation rule is only applied to the ELB area where the land elevation is above -2.5 feet NAVD88 and there is no man-made structure. Transects A and B indicated in Figure 9 slice through the ELB. Figure 10 shows the side view of bathymetry and topography (NAVD88) along the two transects and demonstrates three different ways used to adjust the land elevation in the degraded ELB area. The roads-remained strategy is adopted to obtain the degraded ELB elevation for Scenario#1 and Scenario#4. The bathymetry in the degraded ELB is also applicable to Scenario#1 (FWOA-ELB-degraded) where the ELB disappears.
Figure 9. Map of the bathymetry in ELB area with the open levee structure and degraded ELB.
B2
B1
A2
A1
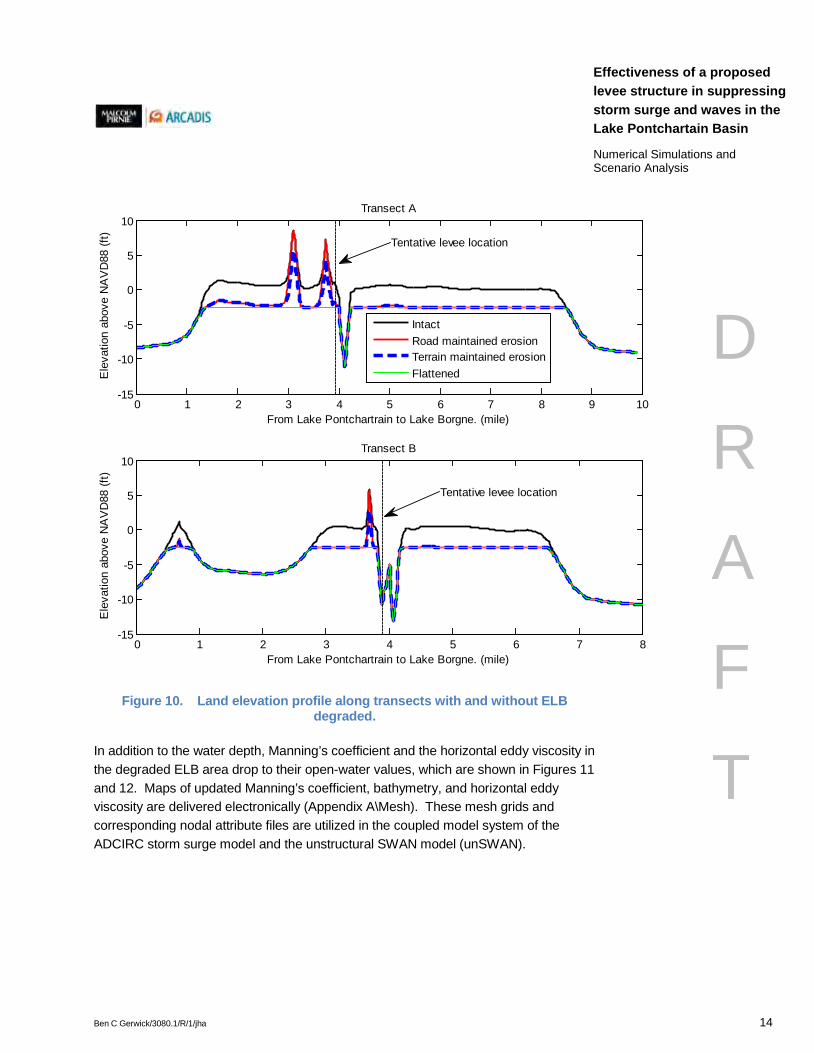
Ben C Gerwick/3080.1/R/1/jha 14
Effectiveness of a proposed levee structure in suppressing storm surge and waves in the Lake Pontchartain Basin
D
R
A
F
T
Numerical Simulations and Scenario Analysis
Figure 10. Land elevation profile along transects with and without ELB degraded.
In addition to the water depth, Manning’s coefficient and the horizontal eddy viscosity in the degraded ELB area drop to their open-water values, which are shown in Figures 11 and 12. Maps of updated Manning’s coefficient, bathymetry, and horizontal eddy viscosity are delivered electronically (Appendix A\Mesh). These mesh grids and corresponding nodal attribute files are utilized in the coupled model system of the ADCIRC storm surge model and the unstructural SWAN model (unSWAN).
0 1 2 3 4 5 6 7 8 9 10-15
-10
-5
0
5
10
Ele
vatio
n ab
ove
NA
VD
88 (f
t)
Transect A
From Lake Pontchartrain to Lake Borgne. (mile)
IntactRoad maintained erosionTerrain maintained erosionFlattened
0 1 2 3 4 5 6 7 8-15
-10
-5
0
5
10
From Lake Pontchartrain to Lake Borgne. (mile)
Ele
vatio
n ab
ove
NA
VD
88 (f
t)
Transect B
Tentative levee location
Tentative levee location
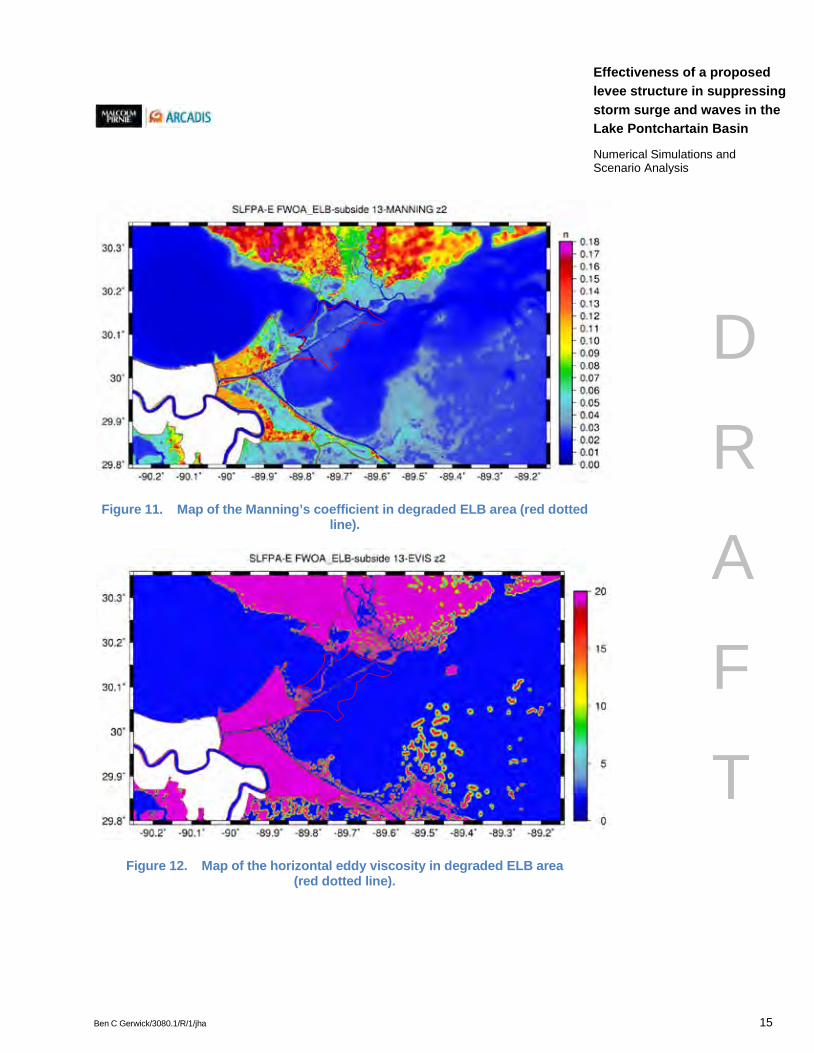
Ben C Gerwick/3080.1/R/1/jha 15
Effectiveness of a proposed levee structure in suppressing storm surge and waves in the Lake Pontchartain Basin
D
R
A
F
T
Numerical Simulations and Scenario Analysis
Figure 11. Map of the Manning’s coefficient in degraded ELB area (red dotted line).
Figure 12. Map of the horizontal eddy viscosity in degraded ELB area (red dotted line).

Ben C Gerwick/3080.1/R/1/jha 16
Effectiveness of a proposed levee structure in suppressing storm surge and waves in the Lake Pontchartain Basin
D
R
A
F
T
Numerical Simulations and Scenario Analysis
4. Results and Analysis
4.1 Simulation Results
For each scenario, eight simulations were performed by applying the storm forcing identified in Section 2. A total number of 40 runs were carried out to simulate the storm surge and wind waves using the latest ADCIRC + SWAN codes (Dietrich et al. 2011). The simulation time of each run depends on the storm duration and ranges from 3 to 7 days in addition to the 5-day spin-up period. The time step of the ADCIRC model is set to be 1 second and 20 minutes for the SWAN model. ADCIRC and SWAN are fully coupled with the interchanging time interval of 20 minutes.
Sequences of images are used to present the simulation results and quantify the regional effect of the proposed levee configurations and the impact of the ELB topography. Table 4 lists the title and the brief description of created images. Storms#1 through #4 represent selected 100- or 400-year storms. The base scenario and one of Scenarios#1 through #4 are listed for illustration to minimize duplicate information.
Table 4. Abbreviations of images’ titles and description
Base
Scenario Scenario
#x Description Storm#1 PWSE(s)
PWH(s) TP-PWH(s)
PWSE(s) PWH(s)
TP-PWH(s)
Peak water surface elevation of an individual storm. Peak significant wave height of an individual storm. Peak period corresponding to each PWH.
Storm#2 Storm#3 Storm#4
Summary MEOW
MEOW-Hs MEOW-Tp
MEOW MEOW-Hs MEOW-Tp
Maximum envelope of water surface elevations of four storms. Significant wave height corresponding to MEOW. Peak period corresponding to MEOW.
Difference MWED MHsD
Maximum water surface elevation difference. Maximum significant wave height difference.
The PWSE, PWH, TP-PWH are the individual storm maximum water surface elevation, the individual storm maximum significant wave height, and the peak period corresponding to each maximum significant wave heights, of which images are presented in Appendix A\Atlas. For each scenario, the maximum envelope of PWSEs out of four selected 100- or 400-year storms is denoted as MEOW. Significant wave heights were retrieved from individual PWHs corresponding to the MEOW and denoted as MEOW-Hs. Similarly, the corresponding peak periods out of four storms were obtained and referred to

Ben C Gerwick/3080.1/R/1/jha 17
Effectiveness of a proposed levee structure in suppressing storm surge and waves in the Lake Pontchartain Basin
D
R
A
F
T
Numerical Simulations and Scenario Analysis
as MEOW-Tp. MEOW, MEOW-Hs, and MEOW-Tp for all five scenarios are plotted and presented in Appendix A\Atlas.
In order to evaluate the regional and local effects of the ELB and the proposed levee configurations, the following were carried out: 1) creating difference plots between Scenarios#1 through #4 and the base scenario; 2) extracting water surface elevations, depth-averaged current velocities, wave heights, and peak periods at a series of survey locations; and 3) displaying and tabulating extracted values for comparisons.
Figure 13 shows all selected survey stations. Seven stations selected from the north side of the ELB to inside the Lake Pontchartrain are shown as cyan balloons (LK1-LK6). At the Chef Menteur and Rigolets passes, several stations are used to reveal the variation of storm surge levels (CM1-CM10 and RP1-RP9). Along the levee alignment, the same locations that were used to evaluate and select the representative storms are also marked in Figure 13 (LF1-LF18) and will be used to reveal the variation of surge levels, wave heights, and wave periods. These stations are located at the adjacent front of the tentative levee. The time series of current velocities inside the channels at CM4 and CM5 as well as RP5 and RP6 were drawn to depict the flow conditions during 100- and 400-year storms.
Figure 13. Project area overview and simulation comparison locations (Levee-Front [LF], Chef Menteur pass [CM], Rigolets pass [RP], and Lake
Pontchartrain [LK]).
Ben C Gerwick/3080.1/R/1/jha 18
Effectiveness of a proposed levee structure in suppressing storm surge and waves in the Lake Pontchartain Basin
D
R
A
F
T
Numerical Simulations and Scenario Analysis
4.2 Scenario Analysis
4.2.1 Effects of Sea Level Rise
As described previously, the storm selection was intended to approximate the 100- and 400-year FEMA surge levels along the proposed levee alignment. Selected storms were then used for all five future scenarios including an approximate Relative Sea Level Rise (RSLR) of 2.8 feet which includes eustatic and subsidence contributions to future sea levels. The FWOA-ELB-intact scenario, i.e., base scenario, is the one much closer to the current condition (CC). Figure 14 shows the variation of surge levels at the levee front stations (LF1 to ~LF18) for the base scenario. The computed surge levels are compared with the target surge level indicated by the solid black lines in Figure 14.
Due to RSLR, the future mean sea level is raised and the simulated surge maxima are overall above the CC FEMA FIS values. In order to review the dynamic effect of relative SLR, the CC surge elevations are shifted up by 2.8 feet and represented by a black dashed line and a black marked line for the maximum and mean of four storm surge levels, respectively. These shift-ups are comparable with simulated surge levels for the 100-year event whereas they are above those simulated for the 400-year event. It is implied that the impacts of RSLR on the peak value of storm surges are less severe for the 400-year event than for the 100-year event. Additionally, for the 100-year event, impacts of RSLR along the levee alignment render higher risk on the eastern portion than on the western portion. Note that the eastern portion of the levee is curved northward and extended farther inland.
Impacts of RSLR on storm surge peak are embodied by increasing the still water depth, reducing the bottom roughness, and varying the geometry of the inundation region. If a more severe RSLR is imposed, the water depth on ELB would be increased, which results in a higher volume of surge flux between Lake Borgne and Lake Pontchartrain and, thus, smaller peak surge. A reduced bottom roughness may have a minor to negligible effect because of the increased water depth. While severe RSLR has minor impacts of storm surge parameters on the ELB area, it gives rise to a more extensive inland inundation and high peak surge at the shoreline.
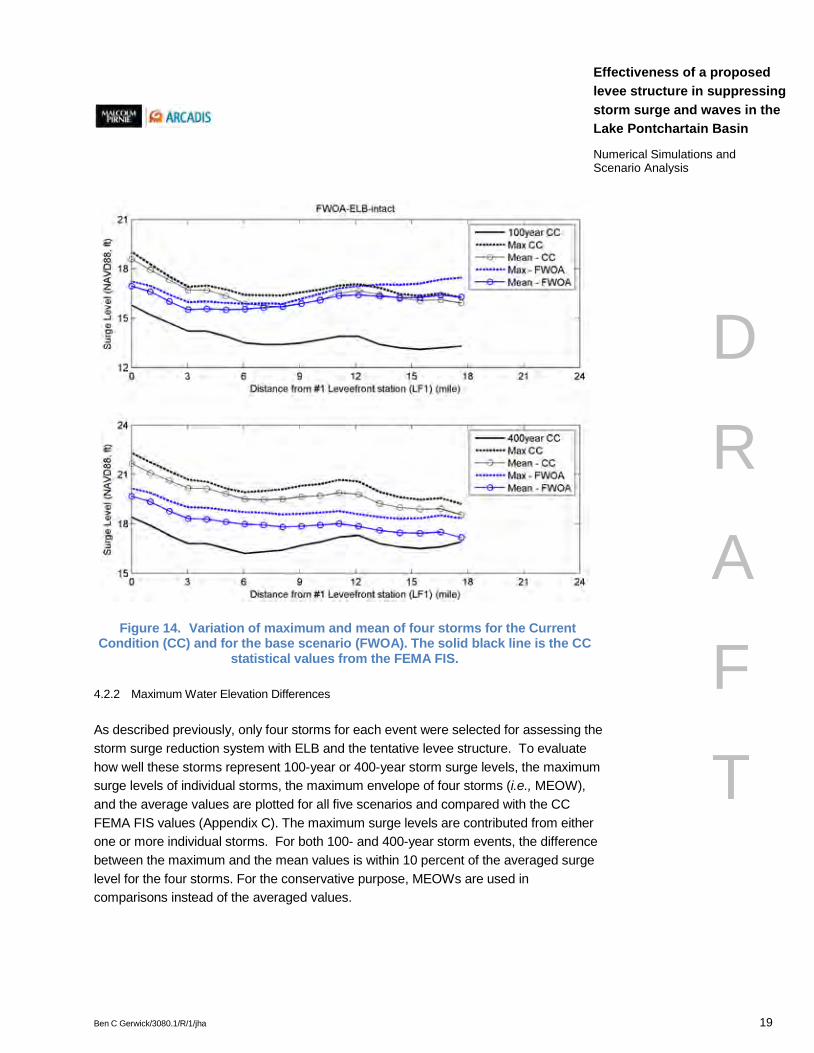
Ben C Gerwick/3080.1/R/1/jha 19
Effectiveness of a proposed levee structure in suppressing storm surge and waves in the Lake Pontchartain Basin
D
R
A
F
T
Numerical Simulations and Scenario Analysis
Figure 14. Variation of maximum and mean of four storms for the Current Condition (CC) and for the base scenario (FWOA). The solid black line is the CC
statistical values from the FEMA FIS.
4.2.2 Maximum Water Elevation Differences
As described previously, only four storms for each event were selected for assessing the storm surge reduction system with ELB and the tentative levee structure. To evaluate how well these storms represent 100-year or 400-year storm surge levels, the maximum surge levels of individual storms, the maximum envelope of four storms (i.e., MEOW), and the average values are plotted for all five scenarios and compared with the CC FEMA FIS values (Appendix C). The maximum surge levels are contributed from either one or more individual storms. For both 100- and 400-year storm events, the difference between the maximum and the mean values is within 10 percent of the averaged surge level for the four storms. For the conservative purpose, MEOWs are used in comparisons instead of the averaged values.
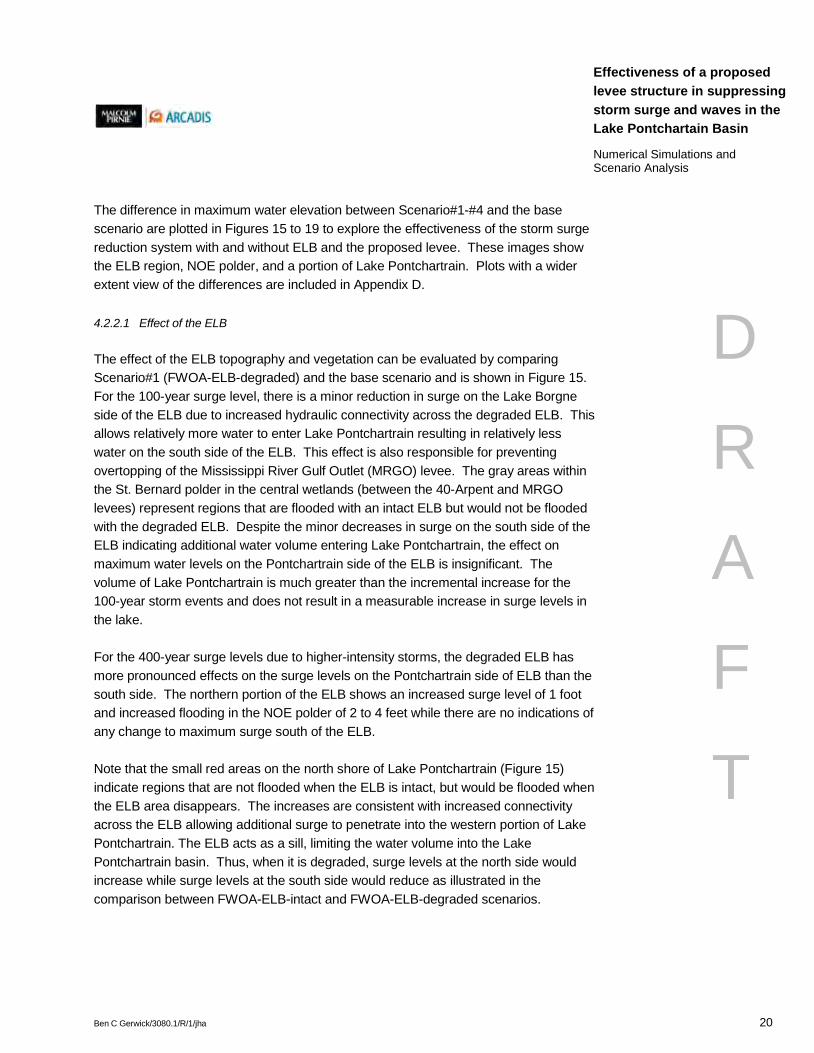
Ben C Gerwick/3080.1/R/1/jha 20
Effectiveness of a proposed levee structure in suppressing storm surge and waves in the Lake Pontchartain Basin
D
R
A
F
T
Numerical Simulations and Scenario Analysis
The difference in maximum water elevation between Scenario#1-#4 and the base scenario are plotted in Figures 15 to 19 to explore the effectiveness of the storm surge reduction system with and without ELB and the proposed levee. These images show the ELB region, NOE polder, and a portion of Lake Pontchartrain. Plots with a wider extent view of the differences are included in Appendix D.
4.2.2.1 Effect of the ELB
The effect of the ELB topography and vegetation can be evaluated by comparing Scenario#1 (FWOA-ELB-degraded) and the base scenario and is shown in Figure 15. For the 100-year surge level, there is a minor reduction in surge on the Lake Borgne side of the ELB due to increased hydraulic connectivity across the degraded ELB. This allows relatively more water to enter Lake Pontchartrain resulting in relatively less water on the south side of the ELB. This effect is also responsible for preventing overtopping of the Mississippi River Gulf Outlet (MRGO) levee. The gray areas within the St. Bernard polder in the central wetlands (between the 40-Arpent and MRGO levees) represent regions that are flooded with an intact ELB but would not be flooded with the degraded ELB. Despite the minor decreases in surge on the south side of the ELB indicating additional water volume entering Lake Pontchartrain, the effect on maximum water levels on the Pontchartrain side of the ELB is insignificant. The volume of Lake Pontchartrain is much greater than the incremental increase for the 100-year storm events and does not result in a measurable increase in surge levels in the lake.
For the 400-year surge levels due to higher-intensity storms, the degraded ELB has more pronounced effects on the surge levels on the Pontchartrain side of ELB than the south side. The northern portion of the ELB shows an increased surge level of 1 foot and increased flooding in the NOE polder of 2 to 4 feet while there are no indications of any change to maximum surge south of the ELB.
Note that the small red areas on the north shore of Lake Pontchartrain (Figure 15) indicate regions that are not flooded when the ELB is intact, but would be flooded when the ELB area disappears. The increases are consistent with increased connectivity across the ELB allowing additional surge to penetrate into the western portion of Lake Pontchartrain. The ELB acts as a sill, limiting the water volume into the Lake Pontchartrain basin. Thus, when it is degraded, surge levels at the north side would increase while surge levels at the south side would reduce as illustrated in the comparison between FWOA-ELB-intact and FWOA-ELB-degraded scenarios.
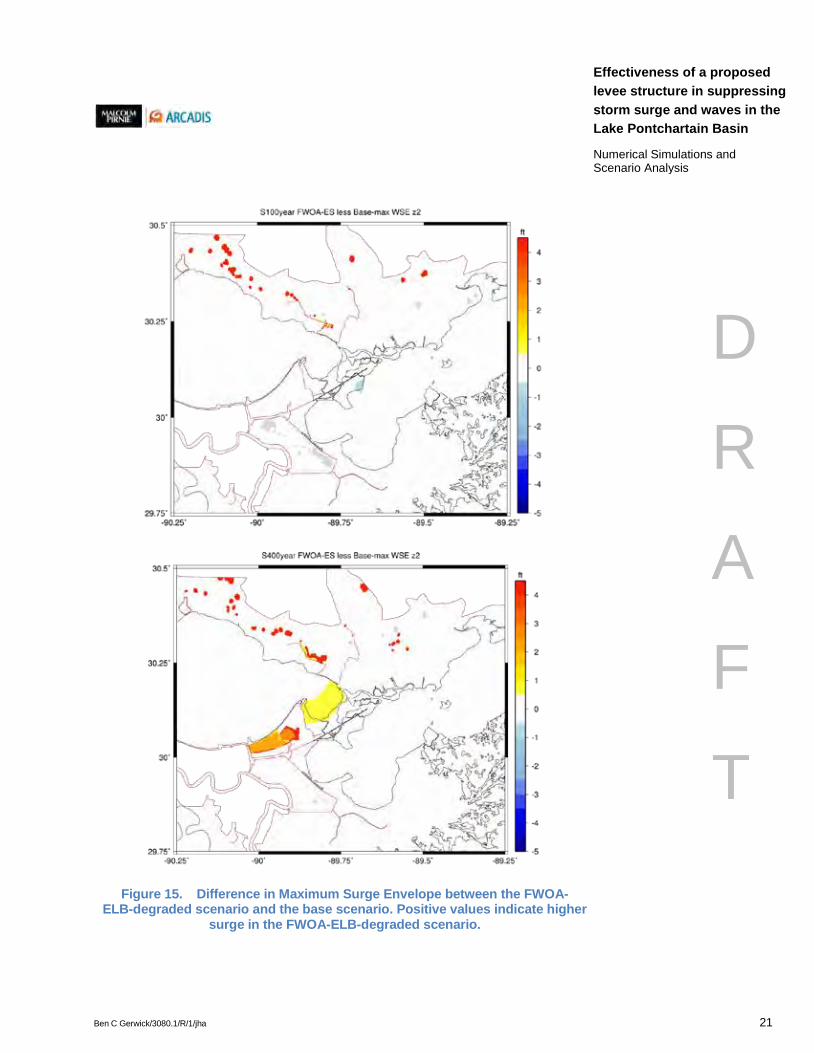
Ben C Gerwick/3080.1/R/1/jha 21
Effectiveness of a proposed levee structure in suppressing storm surge and waves in the Lake Pontchartain Basin
D
R
A
F
T
Numerical Simulations and Scenario Analysis
Figure 15. Difference in Maximum Surge Envelope between the FWOA-ELB-degraded scenario and the base scenario. Positive values indicate higher
surge in the FWOA-ELB-degraded scenario.
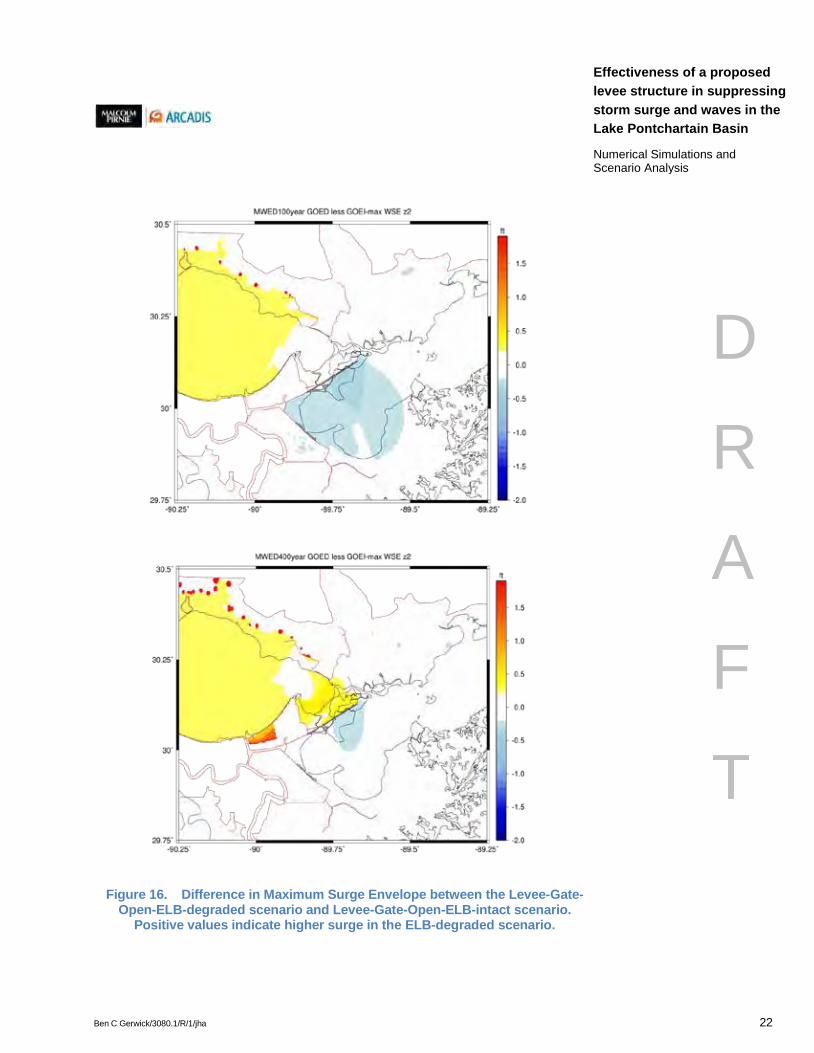
Ben C Gerwick/3080.1/R/1/jha 22
Effectiveness of a proposed levee structure in suppressing storm surge and waves in the Lake Pontchartain Basin
D
R
A
F
T
Numerical Simulations and Scenario Analysis
Figure 16. Difference in Maximum Surge Envelope between the Levee-Gate-Open-ELB-degraded scenario and Levee-Gate-Open-ELB-intact scenario.
Positive values indicate higher surge in the ELB-degraded scenario.
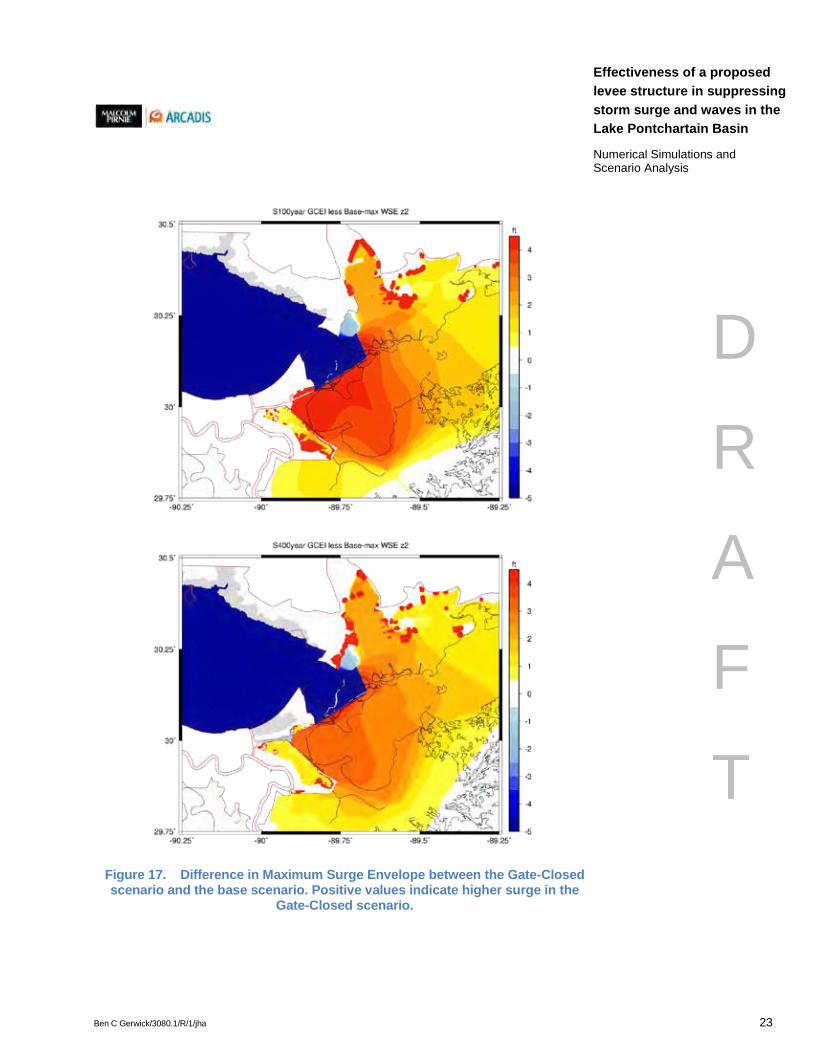
Ben C Gerwick/3080.1/R/1/jha 23
Effectiveness of a proposed levee structure in suppressing storm surge and waves in the Lake Pontchartain Basin
D
R
A
F
T
Numerical Simulations and Scenario Analysis
Figure 17. Difference in Maximum Surge Envelope between the Gate-Closed scenario and the base scenario. Positive values indicate higher surge in the
Gate-Closed scenario.
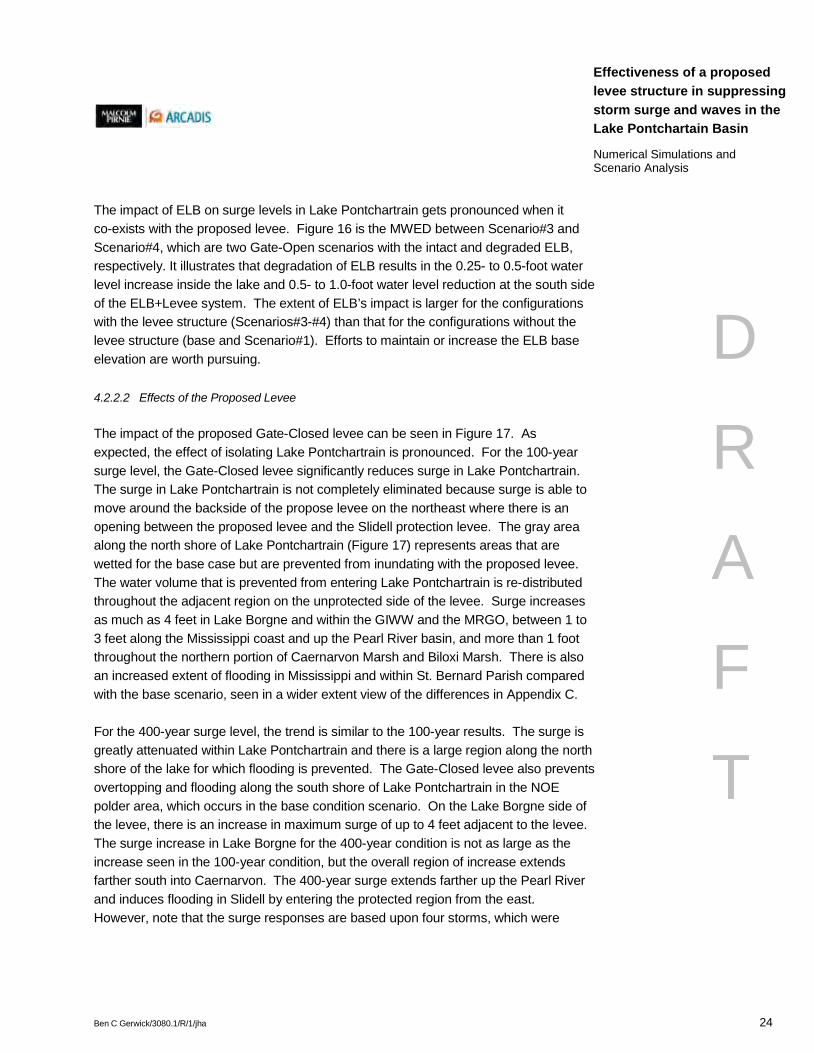
Ben C Gerwick/3080.1/R/1/jha 24
Effectiveness of a proposed levee structure in suppressing storm surge and waves in the Lake Pontchartain Basin
D
R
A
F
T
Numerical Simulations and Scenario Analysis
The impact of ELB on surge levels in Lake Pontchartrain gets pronounced when it co-exists with the proposed levee. Figure 16 is the MWED between Scenario#3 and Scenario#4, which are two Gate-Open scenarios with the intact and degraded ELB, respectively. It illustrates that degradation of ELB results in the 0.25- to 0.5-foot water level increase inside the lake and 0.5- to 1.0-foot water level reduction at the south side of the ELB+Levee system. The extent of ELB’s impact is larger for the configurations with the levee structure (Scenarios#3-#4) than that for the configurations without the levee structure (base and Scenario#1). Efforts to maintain or increase the ELB base elevation are worth pursuing.
4.2.2.2 Effects of the Proposed Levee
The impact of the proposed Gate-Closed levee can be seen in Figure 17. As expected, the effect of isolating Lake Pontchartrain is pronounced. For the 100-year surge level, the Gate-Closed levee significantly reduces surge in Lake Pontchartrain. The surge in Lake Pontchartrain is not completely eliminated because surge is able to move around the backside of the propose levee on the northeast where there is an opening between the proposed levee and the Slidell protection levee. The gray area along the north shore of Lake Pontchartrain (Figure 17) represents areas that are wetted for the base case but are prevented from inundating with the proposed levee. The water volume that is prevented from entering Lake Pontchartrain is re-distributed throughout the adjacent region on the unprotected side of the levee. Surge increases as much as 4 feet in Lake Borgne and within the GIWW and the MRGO, between 1 to 3 feet along the Mississippi coast and up the Pearl River basin, and more than 1 foot throughout the northern portion of Caernarvon Marsh and Biloxi Marsh. There is also an increased extent of flooding in Mississippi and within St. Bernard Parish compared with the base scenario, seen in a wider extent view of the differences in Appendix C.
For the 400-year surge level, the trend is similar to the 100-year results. The surge is greatly attenuated within Lake Pontchartrain and there is a large region along the north shore of the lake for which flooding is prevented. The Gate-Closed levee also prevents overtopping and flooding along the south shore of Lake Pontchartrain in the NOE polder area, which occurs in the base condition scenario. On the Lake Borgne side of the levee, there is an increase in maximum surge of up to 4 feet adjacent to the levee. The surge increase in Lake Borgne for the 400-year condition is not as large as the increase seen in the 100-year condition, but the overall region of increase extends farther south into Caernarvon. The 400-year surge extends farther up the Pearl River and induces flooding in Slidell by entering the protected region from the east. However, note that the surge responses are based upon four storms, which were

Ben C Gerwick/3080.1/R/1/jha 25
Effectiveness of a proposed levee structure in suppressing storm surge and waves in the Lake Pontchartain Basin
D
R
A
F
T
Numerical Simulations and Scenario Analysis
selected with the focus on the ELB area. For the areas farther away from the ELB, the responses tend to be storm-dependent and do not represent the 100- and 400-year surge elevations well.
The effect of the proposed Gate-Open levee is shown in Figure 18 for the intact ELB and in Figure 19 for the degraded ELB. The performances of the Gate-Open levee are similar with and without the ELB. The combination of the Gate-Open levee with intact ELB does perform somewhat better than the Gate-Open levee with degraded ELB.
In Figure 18, the Gate-Open levee on the intact ELB reduces the 100-year surge in Lake Pontchartrain by approximately 1 foot with a corresponding increase outside the levee of approximately 1 foot in Lake Borgne and as much as 3 feet immediately in front of the levee. There are minor reduction in overtopping of the St Bernard levee and inundation along the north shore of Lake Pontchartrain. The 400-year surge is reduced by approximately 1 foot throughout most of the lake, but with a much higher reduction immediately behind the levee. At the 400-year surge level, the effect of the levee at restricting the flow is greater as indicated by the surge shadow on the protected ELB and to the east near Slidell (Figure 18). Overtopping volume is also reduced for the NOE polder along the south shore of Lake Pontchartrain and less overtopping of the Seabrook barrier; thus, less water is entering the Inner Harbor Navigation Canal corridor. For both the 100-year and 400-year events, approximately 1 foot of water surface elevation is increased in Lake Borgne. However the region of increase is larger for the 400-year events than that of the 100-year events.
In Figure 19, the MWED is presented for the Gate-Open with degraded ELB, which resembles the trends of MWED for the Gate-Open with intact ELB, shown in Figure 18. However because of the removal of ELB “blockage”, magnitudes of both the surge level increase in front of the ELB+Levee system and the surge level decrease behind the system are reduced; the extent of the levee’s impact is smaller for both 100- and 400-year events by comparing Figure 18 and Figure 19.

Ben C Gerwick/3080.1/R/1/jha 26
Effectiveness of a proposed levee structure in suppressing storm surge and waves in the Lake Pontchartain Basin
D
R
A
F
T
Numerical Simulations and Scenario Analysis
Figure 18. Difference in Maximum Surge Envelope between the Gate-Open-ELB-intact scenario and the base scenario. Positive values indicate higher surge
in the Gate-Open-ELB-intact scenario.

Ben C Gerwick/3080.1/R/1/jha 27
Effectiveness of a proposed levee structure in suppressing storm surge and waves in the Lake Pontchartain Basin
D
R
A
F
T
Numerical Simulations and Scenario Analysis
Figure 19. Difference in Maximum Surge Envelope between the Gate-Open-ELB-degraded scenario and the base scenario. Positive values indicate higher
surge in the former scenario.
Ben C Gerwick/3080.1/R/1/jha 28
Effectiveness of a proposed levee structure in suppressing storm surge and waves in the Lake Pontchartain Basin
D
R
A
F
T
Numerical Simulations and Scenario Analysis
For both Gate-Open scenarios, the region of influence significantly shrinks in comparison to the influencing extent of the Gate-Closed scenario. Importantly, the extent of significant increased flooding on the outside of the levee does not extend beyond Lake Borgne for the Gate-Open scenarios. For the Gate-Open scenarios, populated regions along the Mississippi coast potentially experience minimal impact for the 100- and 400-year surge levels. A levee structure with the two major passes open, in conjunction with the intact ELB area, reduces the surge level in Lake Pontchartrain and the inundation area on the north shore of the lake while the impacts on Mississippi are minimized.
Figure 20 shows the maximum of the peak surge levels for Scenario#3 under 100- and 400-year storm conditions. The 100-year surge level behind the levee along the ELB is around 15 feet and varies between 12 and 15 feet inside Lake Pontchartrain. The 400-year surge level is approximately 1 to 3 feet higher than the 100-year surge level along the ELB and in the adjacent lakes.
4.2.3 Inter-Scenario Comparison
To compare the maximum surge response between the scenarios, a series of survey locations were selected along the levee, inside the Lake Pontchartrain, and at Chef Menteur and Rigolets Passes. Histograms were produced which indicate the surge height by the height of a colored bar graph, corresponding values are tabulated (Appendix E). The comparison bar graph was created for multiple locations so that how each scenario performs at the location of interest can be readily observed. On the figures that follow, the following color scheme is adopted:
· FWOA-ELB-intact (base) = Dark Blue · FWOA-ELB-degraded (Scenario#1) = Blue · Levee-Gate-Closed-ELB-intact (Scenario#2) = Green · Levee-Gate-Open-ELB-intact (Scenario#3) = Orange · Levee-Gate-Open-ELB-degraded (Scenario#4) = Red
The specific locations for the bar graph comparisons are shown in Figure 13. For each event (100- and 400-year), the comparisons are provided both for each individual storm simulations and for the average of the set of four storm maximums. On the charts showing the maximum value, the small “error bars” indicate the range of the maximums used to compute the average value.
Ben C Gerwick/3080.1/R/1/jha 29
Effectiveness of a proposed levee structure in suppressing storm surge and waves in the Lake Pontchartain Basin
D
R
A
F
T
Numerical Simulations and Scenario Analysis
One important measure of the efficacy of the proposed levee alignment is the degree to which surge is suppressed in Lake Pontchartrain. The maximum surge for each of the scenarios is presented in Figure 21 for the “LK” stations shown in Figure 13. Plotted values are included in Table E1 in Appendix E. Note that for both the 100- and the 400-year conditions, the Levee-Gate-Closed-ELB-intact scenario provides significantly more surge reduction in the lake than other scenarios.
In comparing the two scenarios with open gates, note that the Levee-Gate-Open-ELB-intact damps surge marginally better than the Levee-Gate-Open-ELB-degraded scenario for individual storms. However, comparison of the 100-year average surge value reveals that the two Gate-Open scenarios are approximately equivalent and comparison of the 400-year average value reveals that the Levee-Gate-Open-ELB-intact scenario does reduce surge slightly more than the Levee-Gate-Open-ELB-degraded scenario. The reduction of the average surge is most significant in the region adjacent to the proposed levee and the reduction diminishes for stations increasingly distant from the levee. Finally, note that surge reduction due to the Gate-Open scenarios in comparison to the base case is approximately 1 to 2 feet for the 100-year condition and 2 to 4 feet for the 400-year condition, but the reduction varies by location and storm conditions.
The surge increase on the front side of the proposed levee is presented in Figure 22 and tabulated in Table 5. The station numbering in Figure 22 refers to the “LF” stations shown in Figure 13. The Levee-Gate-Closed-ELB-intact scenario produces maximum surge levels several feet higher than the other scenarios along the entire length of the levee. The Levee-Gate-Open-ELB-intact and Levee-Gate-Open-ELB-degraded scenarios also produce higher surge levels in front of the levee compared to the base case, but not as high as the Gate-Closed scenario. Due to the hydraulic connectivity of the open passes, the two Gate-Open scenarios have lower surge at the stations located near the passes. This is caused because the open gates convey some of the surge water through the openings. At the opening, the surge levels are lower than other stations away from the openings, with the highest values to the west of Chef Menteur and between Chef Menteur and the Rigolets.
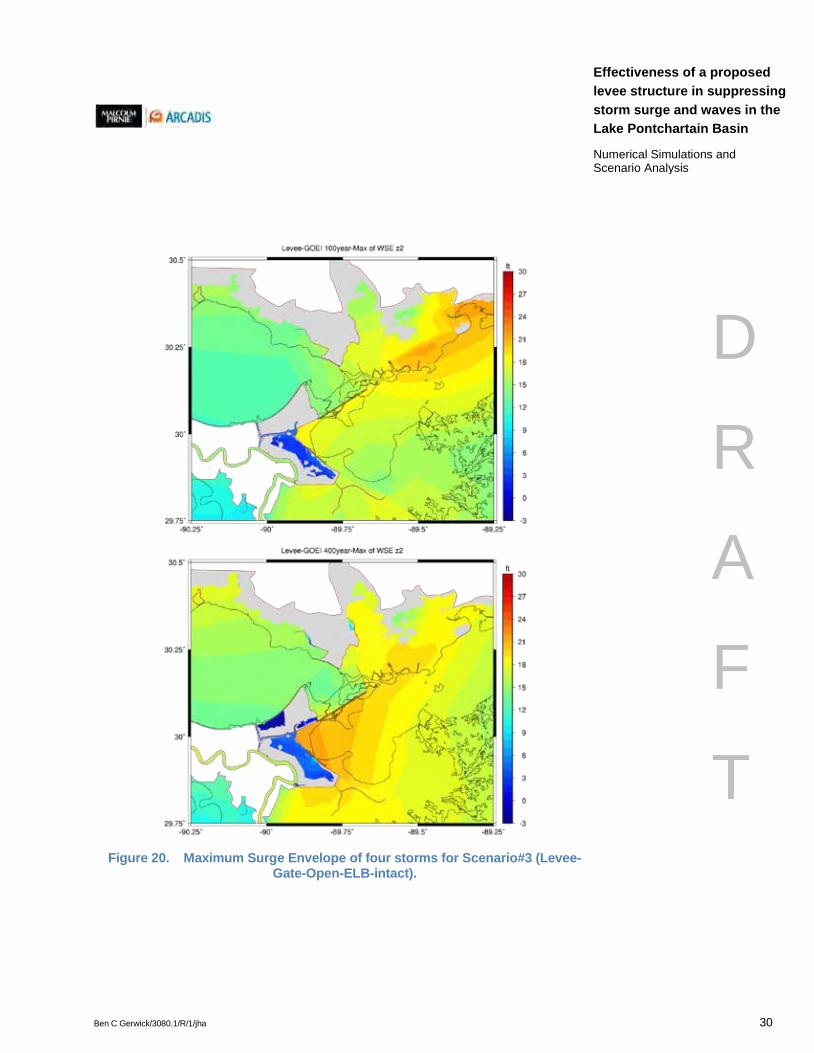
Ben C Gerwick/3080.1/R/1/jha 30
Effectiveness of a proposed levee structure in suppressing storm surge and waves in the Lake Pontchartain Basin
D
R
A
F
T
Numerical Simulations and Scenario Analysis
Figure 20. Maximum Surge Envelope of four storms for Scenario#3 (Levee-
Gate-Open-ELB-intact).

Ben C Gerwick/3080.1/R/1/jha 31
Effectiveness of a proposed levee structure in suppressing storm surge and waves in the Lake Pontchartain Basin
D
R
A
F
T
Numerical Simulations and Scenario Analysis
Figure 21. Surge comparison for the Lake Pontchartrain (LK) stations.

Ben C Gerwick/3080.1/R/1/jha 32
Effectiveness of a proposed levee structure in suppressing storm surge and waves in the Lake Pontchartain Basin
D
R
A
F
T
Numerical Simulations and Scenario Analysis
Table 5 Surge levels (feet, NAVD88) at LF stations
LF #
Ss (Scenarios, B: Base; S1, Scenario#1; S2, Scenario#2; S3, Scenario#3; S4, Scenario#4)
Ss 100-year 400-year
15 73 103 116 MEOW Mean 18 85 94 147 MEOW Mean
1
B 17.2 17.1 16.5 16.8 17.2 16.9 19.9 18.6 20.0 20.2 20.2 19.7 S1 16.9 16.7 16.3 16.5 16.9 16.6 19.5 18.4 19.8 20.0 20.0 19.4 S2 20.5 21.6 20.0 20.1 21.6 20.5 23.8 21.3 23.1 23.6 23.8 22.9 S3 18.2 18.3 17.4 17.8 18.3 17.9 21.1 19.4 20.9 21.1 21.1 20.6 S4 18.0 18.0 17.2 17.5 18.0 17.7 20.8 19.2 20.7 21.0 21.0 20.4
2
B 17.0 16.8 16.2 16.5 17.0 16.6 19.5 18.3 19.7 19.9 19.9 19.3 S1 16.7 16.4 16.0 16.3 16.7 16.3 19.2 18.1 19.4 19.7 19.7 19.1 S2 20.4 21.5 19.9 20.0 21.5 20.4 23.6 21.2 22.9 23.5 23.6 22.8 S3 18.0 18.0 17.1 17.5 18.0 17.7 20.9 19.1 20.6 20.9 20.9 20.4 S4 17.8 17.8 17.0 17.3 17.8 17.5 20.6 19.0 20.4 20.8 20.8 20.2
3
B 16.4 16.1 15.5 16.0 16.4 16.0 18.9 17.7 19.1 19.4 19.4 18.8 S1 16.4 16.0 15.6 15.9 16.4 16.0 18.8 17.7 19.1 19.4 19.4 18.8 S2 20.3 21.4 19.9 19.9 21.4 20.4 23.5 21.0 22.7 23.3 23.5 22.6 S3 17.4 17.4 16.5 17.0 17.4 17.1 20.2 18.6 20.0 20.3 20.3 19.8 S4 17.4 17.4 16.6 17.0 17.4 17.1 20.2 18.6 20.0 20.4 20.4 19.8
4
B 16.0 15.6 14.9 15.6 16.0 15.5 18.4 17.3 18.6 19.0 19.0 18.3 S1 16.0 15.6 15.1 15.6 16.0 15.6 18.4 17.4 18.7 19.1 19.1 18.4 S2 20.2 21.4 19.9 19.8 21.4 20.3 23.4 20.8 22.5 23.2 23.4 22.5 S3 16.7 16.6 15.8 16.2 16.7 16.3 19.3 17.8 19.2 19.7 19.7 19.0 S4 16.8 16.8 16.0 16.4 16.8 16.5 19.5 18.0 19.4 19.9 19.9 19.2
5
B 16.0 15.7 15.0 15.6 16.0 15.6 18.4 17.2 18.5 19.0 19.0 18.3 S1 16.1 15.6 15.1 15.6 16.1 15.6 18.5 17.3 18.6 19.1 19.1 18.4 S2 20.2 21.4 19.9 19.8 21.4 20.3 23.3 20.7 22.3 23.1 23.3 22.4 S3 17.3 17.5 16.6 16.9 17.5 17.1 20.1 18.3 19.7 20.2 20.2 19.6 S4 17.4 17.5 16.7 16.9 17.5 17.1 20.2 18.4 19.8 20.3 20.3 19.7
6
B 15.9 15.6 15.0 15.5 15.9 15.5 18.3 17.0 18.3 18.8 18.8 18.1 S1 16.1 15.7 15.0 15.6 16.1 15.6 18.4 17.2 18.4 19.0 19.0 18.3 S2 20.1 21.5 20.0 19.7 21.5 20.3 23.2 20.6 22.1 23.1 23.2 22.3 S3 17.8 18.1 17.2 17.3 18.1 17.6 20.6 18.6 19.9 20.6 20.6 19.9

Ben C Gerwick/3080.1/R/1/jha 33
Effectiveness of a proposed levee structure in suppressing storm surge and waves in the Lake Pontchartain Basin
D
R
A
F
T
Numerical Simulations and Scenario Analysis
LF #
Ss (Scenarios, B: Base; S1, Scenario#1; S2, Scenario#2; S3, Scenario#3; S4, Scenario#4)
Ss 100-year 400-year
15 73 103 116 MEOW Mean 18 85 94 147 MEOW Mean
S4 17.6 17.8 17.0 17.1 17.8 17.4 20.4 18.5 19.8 20.5 20.5 19.8
7
B 15.9 15.6 15.3 15.5 15.9 15.5 18.2 16.9 18.1 18.7 18.7 18.0 S1 16.0 15.7 15.2 15.6 16.0 15.6 18.4 17.1 18.2 18.9 18.9 18.1 S2 20.0 21.5 20.0 19.6 21.5 20.3 23.1 20.4 21.9 23.0 23.1 22.1 S3 17.9 18.4 17.4 17.4 18.4 17.8 20.7 18.6 19.9 20.7 20.7 20.0 S4 17.7 18.0 17.1 17.2 18.0 17.5 20.4 18.5 19.7 20.5 20.5 19.8
8
B 15.9 15.7 15.5 15.5 15.9 15.6 18.3 16.8 17.9 18.7 18.7 17.9 S1 16.0 15.7 15.4 15.5 16.0 15.7 18.4 17.0 18.1 18.8 18.8 18.0 S2 19.9 21.5 19.9 19.5 21.5 20.2 23.0 20.2 21.7 22.9 23.0 21.9 S3 17.9 18.5 17.5 17.4 18.5 17.8 20.7 18.5 19.8 20.7 20.7 19.9 S4 17.6 18.1 17.2 17.1 18.1 17.5 20.4 18.3 19.6 20.5 20.5 19.7
9
B 15.9 15.9 15.7 15.4 15.9 15.7 18.2 16.7 17.8 18.6 18.6 17.8 S1 15.9 15.8 15.7 15.5 15.9 15.7 18.3 16.8 17.9 18.7 18.7 17.9 S2 19.7 21.4 20.0 19.3 21.4 20.1 22.8 20.0 21.5 22.7 22.8 21.8 S3 17.8 18.5 17.5 17.3 18.5 17.8 20.6 18.4 19.6 20.6 20.6 19.8 S4 17.5 18.1 17.1 17.0 18.1 17.4 20.3 18.2 19.4 20.3 20.3 19.5
10
B 16.0 16.2 16.0 15.5 16.2 15.9 18.4 16.7 17.8 18.6 18.6 17.9 S1 16.0 16.0 15.9 15.5 16.0 15.9 18.4 16.8 17.8 18.6 18.6 17.9 S2 19.6 21.4 20.2 19.2 21.4 20.1 22.7 19.8 21.3 22.6 22.7 21.6 S3 17.7 18.5 17.7 17.2 18.5 17.8 20.5 18.2 19.4 20.4 20.5 19.6 S4 17.4 18.1 17.4 16.9 18.1 17.4 20.2 18.0 19.2 20.2 20.2 19.4
11
B 16.1 16.5 16.2 15.6 16.5 16.1 18.5 16.7 17.8 18.7 18.7 17.9 S1 16.0 16.3 16.1 15.6 16.3 16.0 18.4 16.7 17.8 18.6 18.6 17.9 S2 19.5 21.4 20.4 19.0 21.4 20.1 22.5 19.6 21.1 22.4 22.5 21.4 S3 17.6 18.4 17.9 17.1 18.4 17.7 20.3 18.0 19.2 20.2 20.3 19.4 S4 17.3 18.0 17.6 16.8 18.0 17.4 20.1 17.8 19.0 20.0 20.1 19.2
12
B 16.2 16.8 16.7 15.7 16.8 16.4 18.7 16.8 17.8 18.8 18.8 18.0 S1 16.1 16.5 16.5 15.6 16.5 16.2 18.5 16.7 17.7 18.6 18.6 17.9 S2 19.3 21.3 20.6 18.9 21.3 20.0 22.4 19.4 20.8 22.2 22.4 21.2 S3 17.4 18.3 18.0 16.9 18.3 17.7 20.1 17.8 18.9 20.0 20.1 19.2 S4 17.2 18.0 17.7 16.7 18.0 17.4 19.9 17.6 18.7 19.8 19.9 19.0
13 B 16.1 16.9 16.9 15.6 16.9 16.4 18.6 16.6 17.6 18.6 18.6 17.8

Ben C Gerwick/3080.1/R/1/jha 34
Effectiveness of a proposed levee structure in suppressing storm surge and waves in the Lake Pontchartain Basin
D
R
A
F
T
Numerical Simulations and Scenario Analysis
LF #
Ss (Scenarios, B: Base; S1, Scenario#1; S2, Scenario#2; S3, Scenario#3; S4, Scenario#4)
Ss 100-year 400-year
15 73 103 116 MEOW Mean 18 85 94 147 MEOW Mean
S1 16.1 16.7 16.9 15.6 16.9 16.3 18.5 16.6 17.6 18.5 18.5 17.8 S2 19.2 21.4 20.8 18.7 21.4 20.0 22.2 19.2 20.6 22.0 22.2 21.0 S3 17.0 18.0 17.8 16.4 18.0 17.3 19.6 17.3 18.4 19.5 19.6 18.7 S4 16.8 17.7 17.7 16.3 17.7 17.1 19.5 17.2 18.3 19.3 19.5 18.6
14
B 15.9 16.9 17.0 15.4 17.0 16.3 18.4 16.4 17.3 18.3 18.4 17.6 S1 16.0 16.7 17.0 15.4 17.0 16.3 18.4 16.4 17.3 18.3 18.4 17.6 S2 19.1 21.5 21.0 18.6 21.5 20.0 22.1 19.1 20.4 21.9 22.1 20.9 S3 16.1 17.3 17.2 15.6 17.3 16.5 18.7 16.5 17.5 18.6 18.7 17.8 S4 16.0 17.1 17.1 15.5 17.1 16.4 18.6 16.5 17.4 18.5 18.6 17.7
15
B 15.9 16.8 17.0 15.3 17.0 16.2 18.3 16.3 17.1 18.1 18.3 17.5 S1 16.0 16.7 17.1 15.4 17.1 16.3 18.4 16.4 17.3 18.2 18.4 17.6 S2 19.1 21.6 21.2 18.7 21.6 20.1 22.2 19.1 20.4 21.9 22.2 20.9 S3 15.4 16.6 16.8 14.9 16.8 15.9 17.9 15.8 16.6 17.7 17.9 17.0 S4 15.5 16.6 16.9 15.0 16.9 16.0 18.0 15.9 16.7 17.8 18.0 17.1
16
B 15.9 16.7 17.1 15.3 17.1 16.3 18.3 16.3 17.1 18.0 18.3 17.4 S1 16.1 16.6 17.2 15.5 17.2 16.4 18.5 16.5 17.3 18.2 18.5 17.6 S2 19.2 21.7 21.4 18.8 21.7 20.3 22.3 19.1 20.4 21.9 22.3 20.9 S3 15.1 16.3 17.0 14.6 17.0 15.7 17.4 15.4 16.1 17.1 17.4 16.5 S4 15.2 16.4 17.0 14.7 17.0 15.8 17.5 15.5 16.2 17.2 17.5 16.6
17
B 16.1 16.7 17.3 15.5 17.3 16.4 18.5 16.4 17.0 18.0 18.5 17.5 S1 16.3 16.6 17.4 15.7 17.4 16.5 18.7 16.6 17.3 18.2 18.7 17.7 S2 19.0 21.1 20.5 18.6 21.1 19.8 21.9 19.0 20.0 21.4 21.9 20.6 S3 15.6 16.5 17.2 15.2 17.2 16.1 18.0 16.1 16.6 17.6 18.0 17.1 S4 15.7 16.5 17.2 15.2 17.2 16.2 18.1 16.1 16.7 17.7 18.1 17.1
18
B 15.9 16.4 17.5 15.3 17.5 16.3 18.3 16.2 16.6 17.6 18.3 17.2 S1 16.2 16.4 17.5 15.5 17.5 16.4 18.6 16.4 16.9 17.8 18.6 17.4 S2 16.0 17.4 16.6 15.6 17.4 16.4 18.4 16.0 16.5 17.6 18.4 17.1 S3 15.0 16.3 17.2 14.5 17.2 15.8 17.3 15.2 15.6 16.5 17.3 16.1 S4 15.2 16.3 17.3 14.6 17.3 15.9 17.4 15.3 15.7 16.6 17.4 16.3
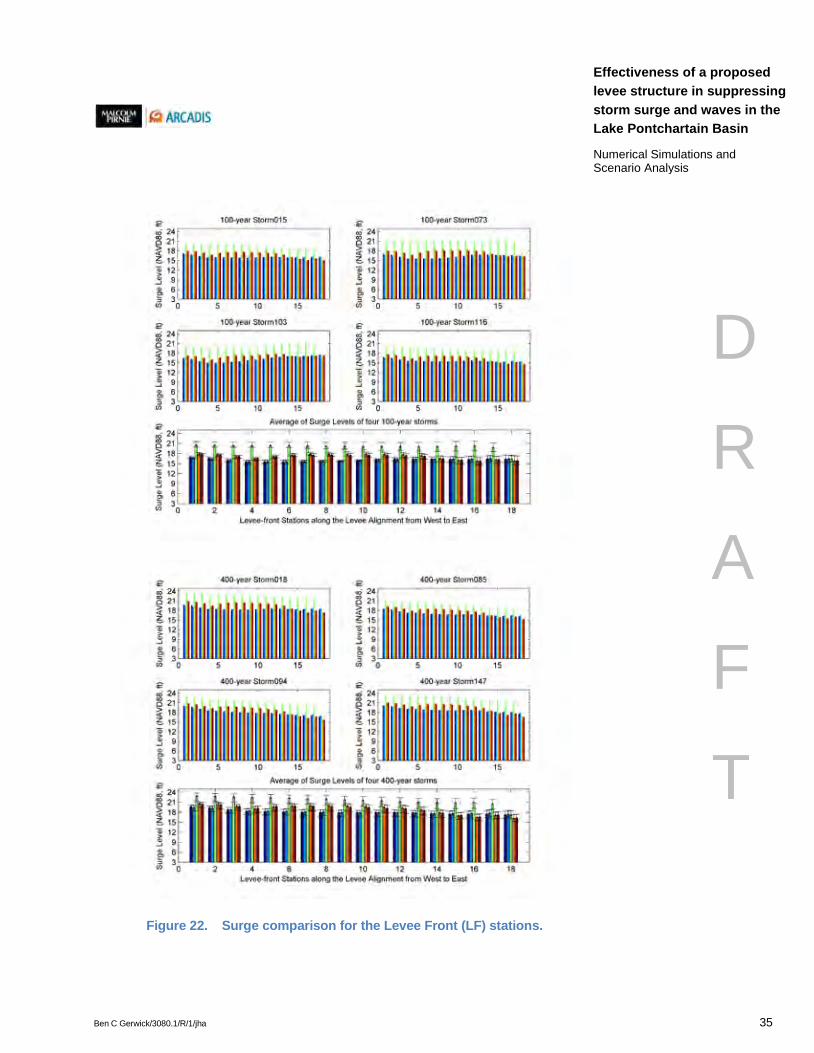
Ben C Gerwick/3080.1/R/1/jha 35
Effectiveness of a proposed levee structure in suppressing storm surge and waves in the Lake Pontchartain Basin
D
R
A
F
T
Numerical Simulations and Scenario Analysis
Figure 22. Surge comparison for the Levee Front (LF) stations.

Ben C Gerwick/3080.1/R/1/jha 36
Effectiveness of a proposed levee structure in suppressing storm surge and waves in the Lake Pontchartain Basin
D
R
A
F
T
Numerical Simulations and Scenario Analysis
The impact of the proposed levee in the Chef Menteur and Rigolets passes is presented in Figure 23 and Figure 24. The values of storm surge elevations are listed in Tables E2 and E3 in Appendix E. On these two figures, the station numbering begins on the unprotected side of the levee and moves through the levee openings as the numbering increases. It can be seen for both passes that the Levee-Gate-Closed-ELB-intact scenario has the highest surge on the unprotected side, but then drops significantly for the stations on the protected side. The same behavior exists for the Levee-Gate-Open-ELB-intact and Levee-Gate-Open-ELB-degraded scenarios, but the magnitude of the decrease is remarkably less than for the Levee-Gate-Closed-ELB-intact scenario. Because of the relative increase in water level outside and the relative decrease on the inside, the two Gate-Open scenarios are characteristic of the significantly increasing hydraulic gradient through the passes. This has implications on the flow velocities within the channel as will be discussed in the next section.
4.2.4 Current Velocity
The presence of a levee structure modifies the timing and magnitude of the surge water levels and also changes the velocities of the flow. The effect is most pronounced within the channels of the Chef Menteur and Rigolets passes where the constriction of the Gate-Open levees increases the hydraulic gradient and accelerates the flow due to two-dimensional convergence. Both of these effects result in higher velocities through the channel.
To visualize the degree of increased flow velocity, time-series plots were created for both surge elevation and current speeds at three locations: the adjacent outside, mid-way, and just inside the opening in the channel. In terms of the impact of the levee on flow velocities in the channel, there is similarity in response between the four 100-year storms and between the four 400-year storms. Thus, to present the implications, a single 100-year and a single 400-year storm were selected as an example to demonstrate the effect. Storm 073 was selected to illustrate the 100-year event and storm 147 was selected for the 400-year event.

Ben C Gerwick/3080.1/R/1/jha 37
Effectiveness of a proposed levee structure in suppressing storm surge and waves in the Lake Pontchartain Basin
D
R
A
F
T
Numerical Simulations and Scenario Analysis
Figure 23. Surge comparison for the stations in the Chef Menteur pass (CM).

Ben C Gerwick/3080.1/R/1/jha 38
Effectiveness of a proposed levee structure in suppressing storm surge and waves in the Lake Pontchartain Basin
D
R
A
F
T
Numerical Simulations and Scenario Analysis
Figure 24. Surge comparison for the stations in the Rigolets pass (RP).
Ben C Gerwick/3080.1/R/1/jha 39
Effectiveness of a proposed levee structure in suppressing storm surge and waves in the Lake Pontchartain Basin
D
R
A
F
T
Numerical Simulations and Scenario Analysis
In Figures 25 and 26, the surge and velocity time series within Chef Menteur pass are presented for the 100- and 400-year conditions, respectively. In Figures 27 and 28, the surge and velocity time-series within Rigolets pass are presented for the 100- and 400-year conditions, respectively. For all of the time-series plots, the time-series data are presented at three stations along the channel, outside the levee, in the gate opening, and behind the levee. The left panels are water surface elevation and the right panels are velocity magnitude (positive velocity points toward Lake Pontchartrain).
The Gate-Closed scenario shows a sharp decrease in velocity because the conveyance is completely closed. The two Gate-Open scenarios show a significant increase in current velocity due to an increased hydraulic gradient between the Gulf side and protected side of the levee and the flow convergence resulting from the flow being confined to only the channels rather than across the entire ELB, as occurs when there would not be a levee obstruction. Similar features were observed for both channels.
For the individual storms used in the above discussion, the Froude number approaches 1.0 in the Chef Menteur pass (0.9-0.96) and is smaller in the Rigolets pass (0.6-0.7). The configuration of a Gate-Open levee with degraded ELB renders a slightly larger Froude number in comparison with that of a Gate-Open levee with an intact ELB scenario. This is critical to the analysis of scour protection and structural stability, which should be considered carefully. Unfortunately, if the gate locations were widened to reduce flow velocity and scour potential, the efficacy of the proposed levee to suppress surge in Lake Pontchartrain would diminish. It should also be noted that the velocities produced in this study are output from a two-dimensional model designed to compute large-scale storm surge effects and should not be used to design scour protection and structural stability. A more highly resolved model, both in the horizontal and vertical dimensions, should be used to further analyze velocities for design purposes.
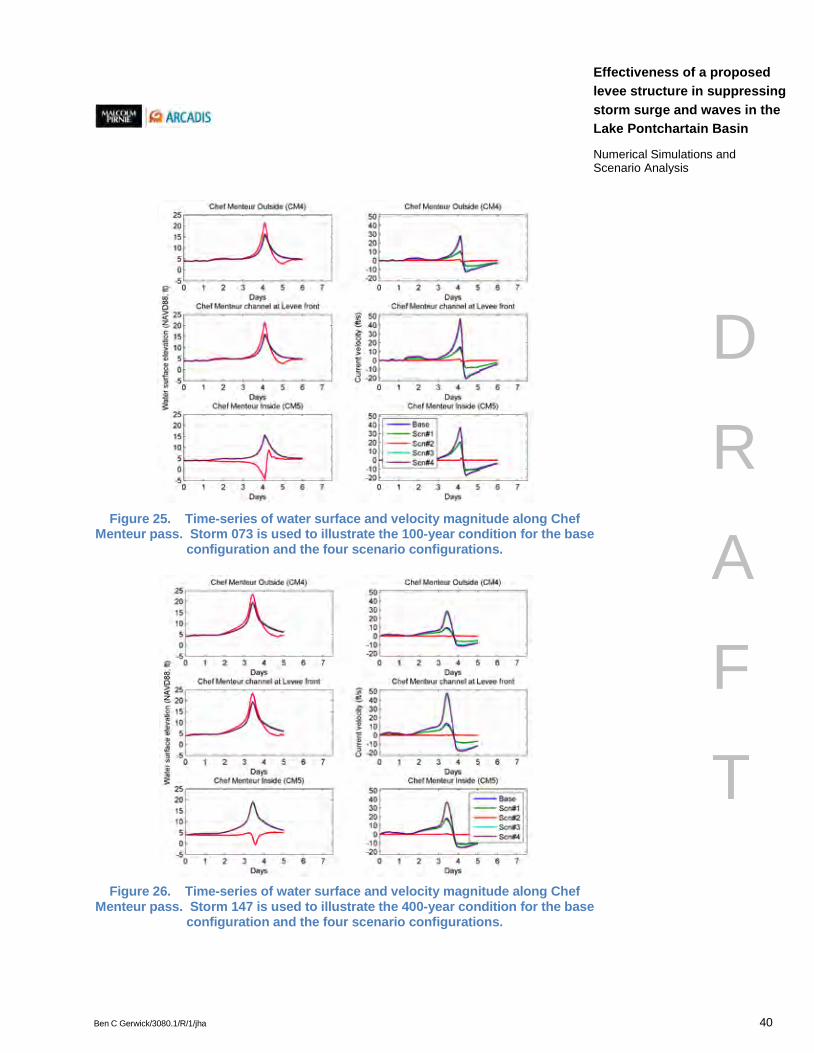
Ben C Gerwick/3080.1/R/1/jha 40
Effectiveness of a proposed levee structure in suppressing storm surge and waves in the Lake Pontchartain Basin
D
R
A
F
T
Numerical Simulations and Scenario Analysis
Figure 25. Time-series of water surface and velocity magnitude along Chef
Menteur pass. Storm 073 is used to illustrate the 100-year condition for the base configuration and the four scenario configurations.
Figure 26. Time-series of water surface and velocity magnitude along Chef
Menteur pass. Storm 147 is used to illustrate the 400-year condition for the base configuration and the four scenario configurations.
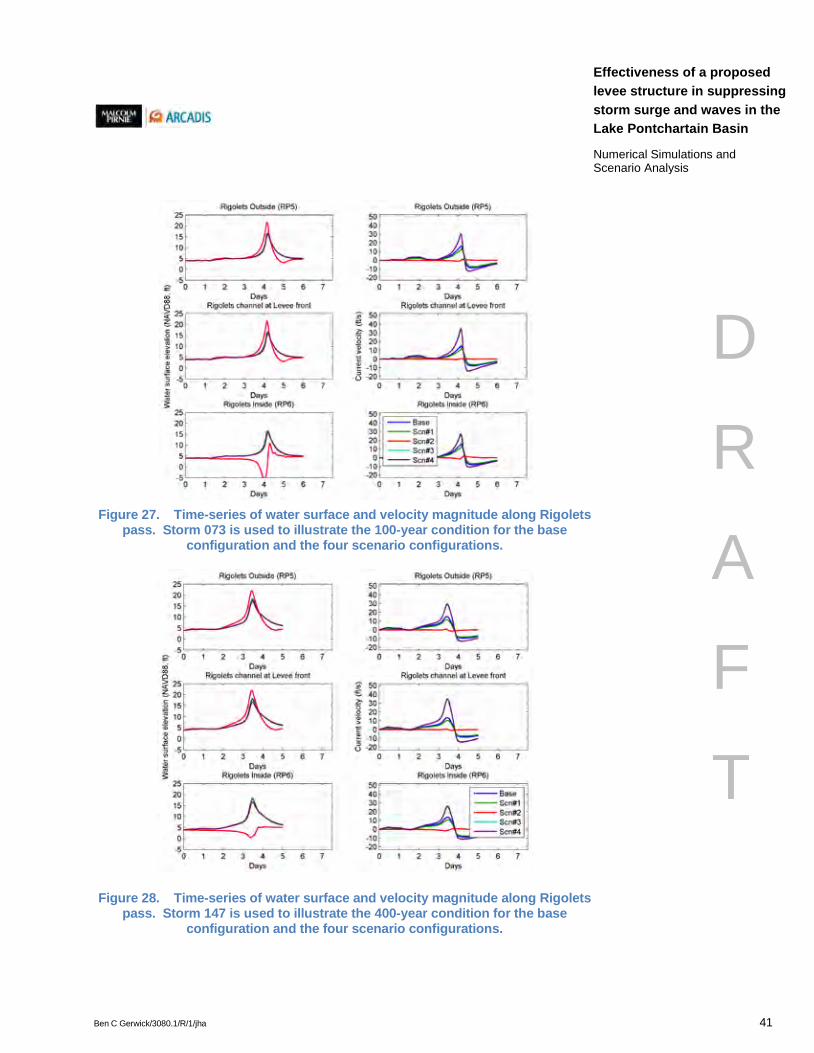
Ben C Gerwick/3080.1/R/1/jha 41
Effectiveness of a proposed levee structure in suppressing storm surge and waves in the Lake Pontchartain Basin
D
R
A
F
T
Numerical Simulations and Scenario Analysis
Figure 27. Time-series of water surface and velocity magnitude along Rigolets
pass. Storm 073 is used to illustrate the 100-year condition for the base configuration and the four scenario configurations.
Figure 28. Time-series of water surface and velocity magnitude along Rigolets pass. Storm 147 is used to illustrate the 400-year condition for the base
configuration and the four scenario configurations.
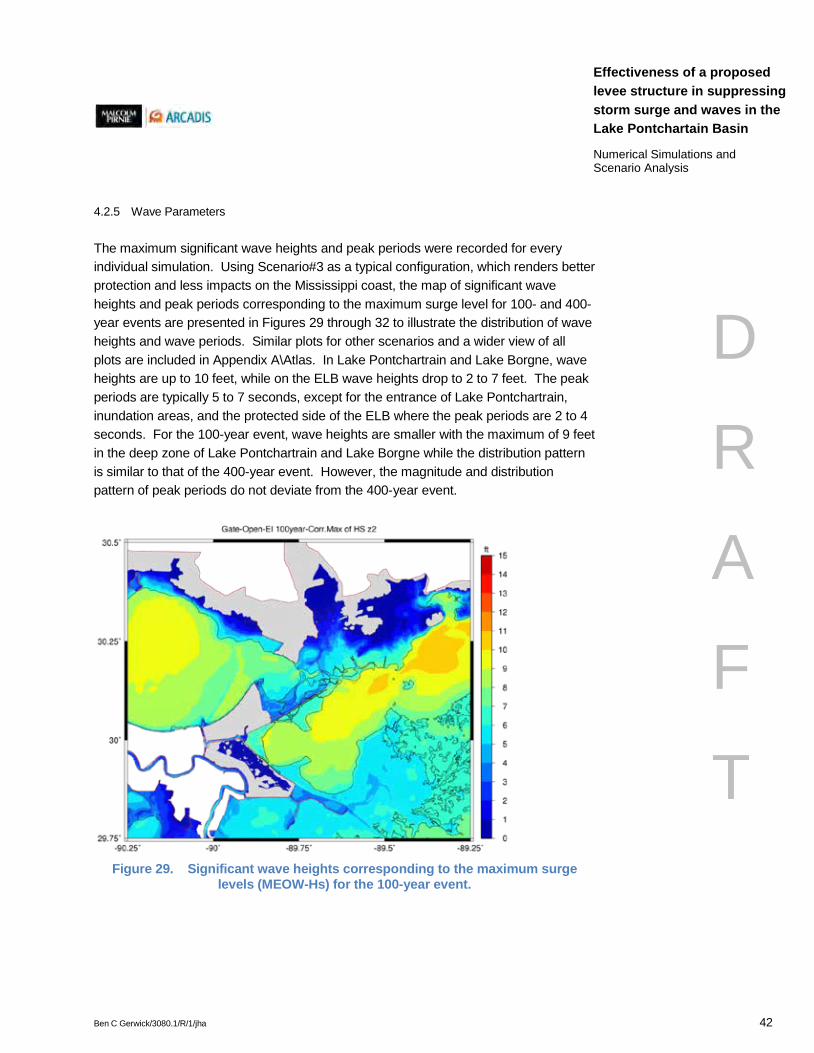
Ben C Gerwick/3080.1/R/1/jha 42
Effectiveness of a proposed levee structure in suppressing storm surge and waves in the Lake Pontchartain Basin
D
R
A
F
T
Numerical Simulations and Scenario Analysis
4.2.5 Wave Parameters
The maximum significant wave heights and peak periods were recorded for every individual simulation. Using Scenario#3 as a typical configuration, which renders better protection and less impacts on the Mississippi coast, the map of significant wave heights and peak periods corresponding to the maximum surge level for 100- and 400-year events are presented in Figures 29 through 32 to illustrate the distribution of wave heights and wave periods. Similar plots for other scenarios and a wider view of all plots are included in Appendix A\Atlas. In Lake Pontchartrain and Lake Borgne, wave heights are up to 10 feet, while on the ELB wave heights drop to 2 to 7 feet. The peak periods are typically 5 to 7 seconds, except for the entrance of Lake Pontchartrain, inundation areas, and the protected side of the ELB where the peak periods are 2 to 4 seconds. For the 100-year event, wave heights are smaller with the maximum of 9 feet in the deep zone of Lake Pontchartrain and Lake Borgne while the distribution pattern is similar to that of the 400-year event. However, the magnitude and distribution pattern of peak periods do not deviate from the 400-year event.
Figure 29. Significant wave heights corresponding to the maximum surge
levels (MEOW-Hs) for the 100-year event.
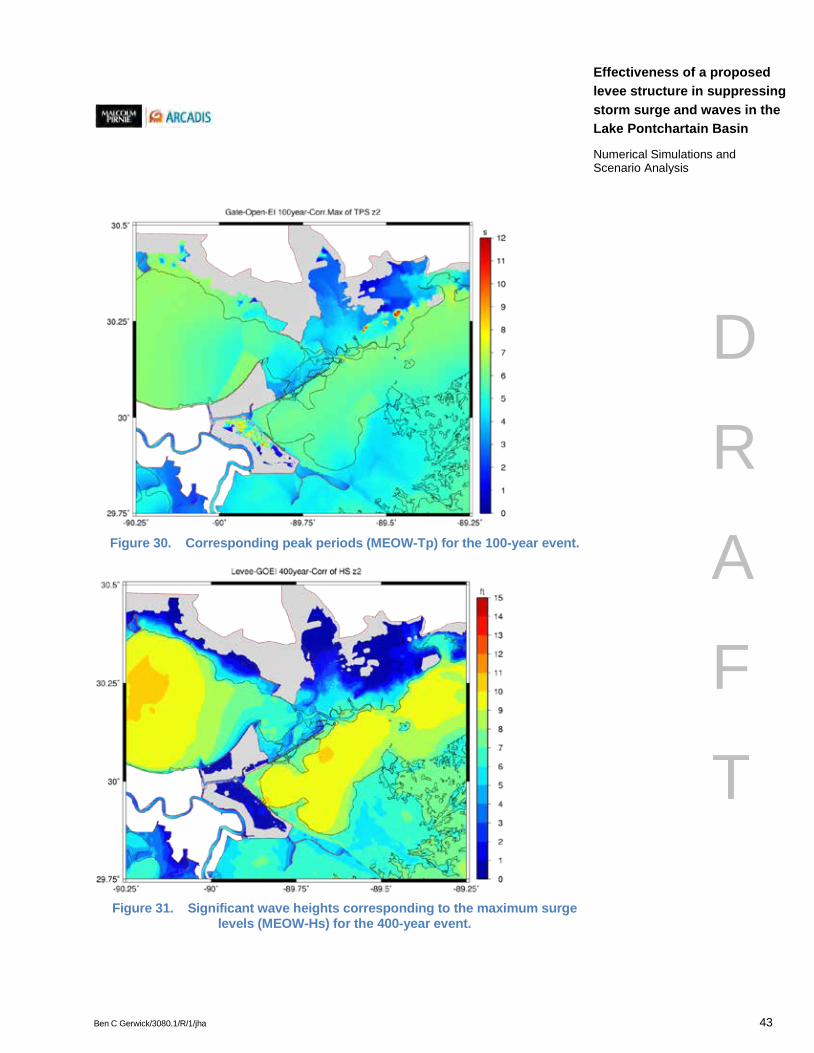
Ben C Gerwick/3080.1/R/1/jha 43
Effectiveness of a proposed levee structure in suppressing storm surge and waves in the Lake Pontchartain Basin
D
R
A
F
T
Numerical Simulations and Scenario Analysis
Figure 30. Corresponding peak periods (MEOW-Tp) for the 100-year event.
Figure 31. Significant wave heights corresponding to the maximum surge
levels (MEOW-Hs) for the 400-year event.
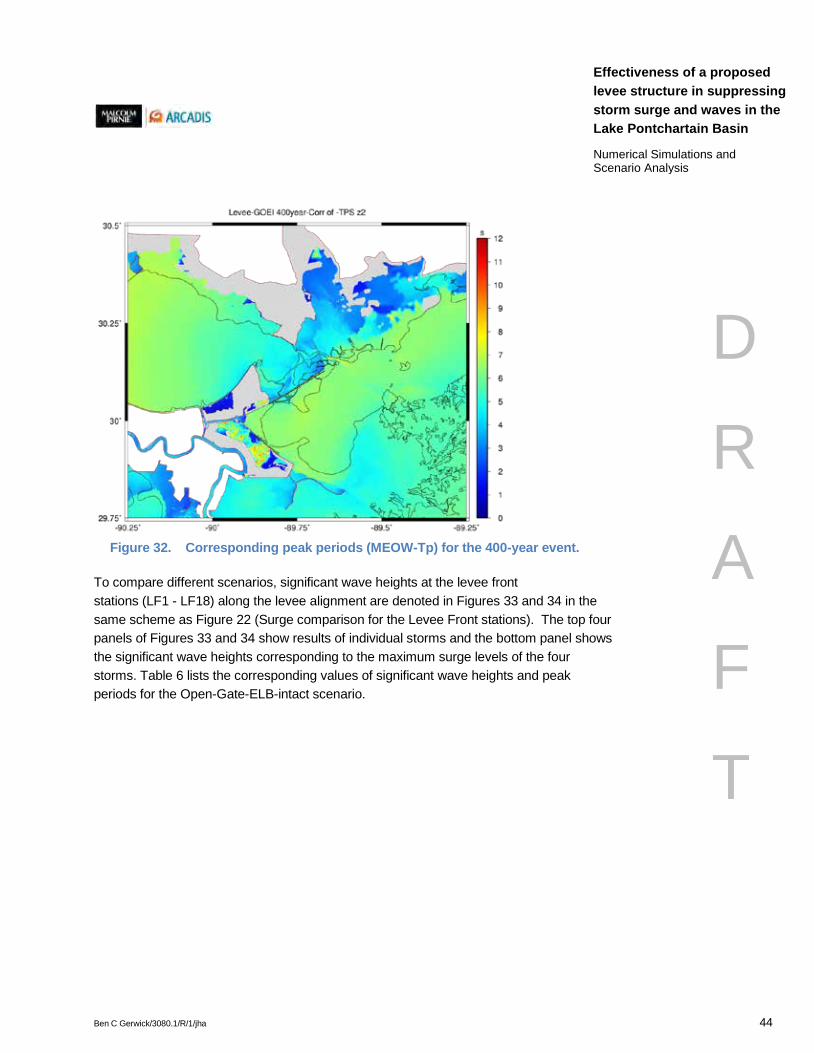
Ben C Gerwick/3080.1/R/1/jha 44
Effectiveness of a proposed levee structure in suppressing storm surge and waves in the Lake Pontchartain Basin
D
R
A
F
T
Numerical Simulations and Scenario Analysis
Figure 32. Corresponding peak periods (MEOW-Tp) for the 400-year event.
To compare different scenarios, significant wave heights at the levee front stations (LF1 - LF18) along the levee alignment are denoted in Figures 33 and 34 in the same scheme as Figure 22 (Surge comparison for the Levee Front stations). The top four panels of Figures 33 and 34 show results of individual storms and the bottom panel shows the significant wave heights corresponding to the maximum surge levels of the four storms. Table 6 lists the corresponding values of significant wave heights and peak periods for the Open-Gate-ELB-intact scenario.

Ben C Gerwick/3080.1/R/1/jha 45
Effectiveness of a proposed levee structure in suppressing storm surge and waves in the Lake Pontchartain Basin
D
R
A
F
T
Numerical Simulations and Scenario Analysis
Figure 33. Comparison of significant wave heights under 100-year condition
for the Levee Front stations.
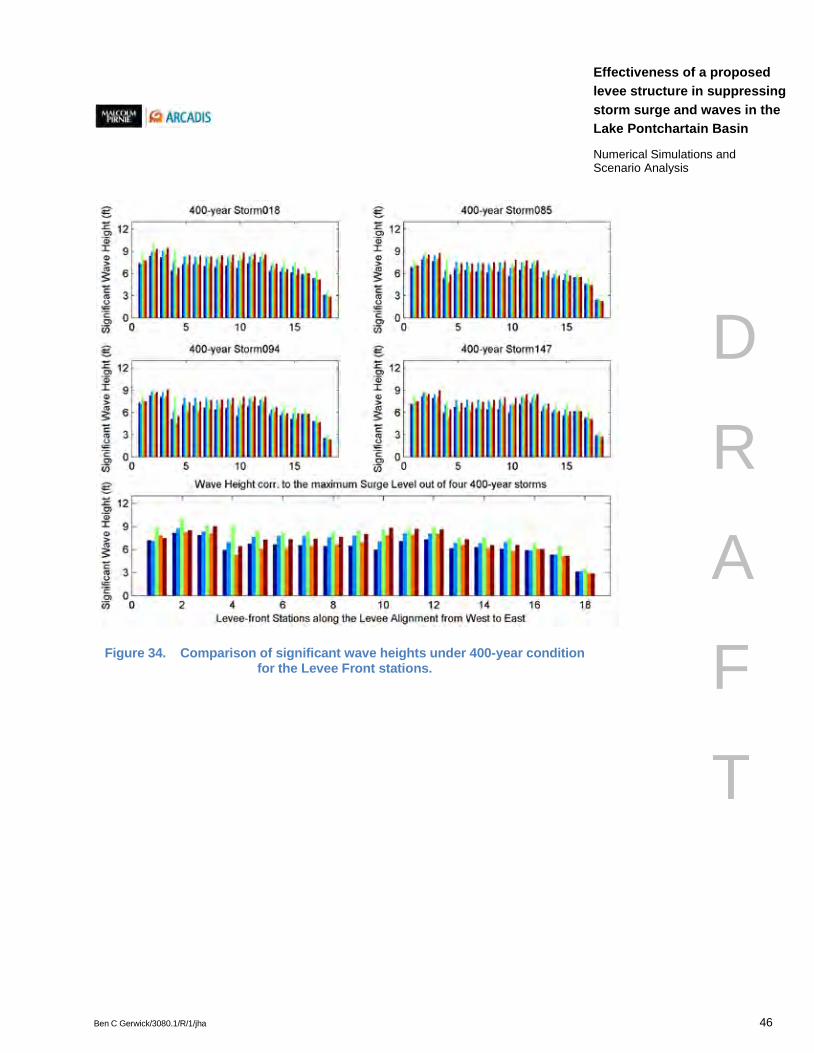
Ben C Gerwick/3080.1/R/1/jha 46
Effectiveness of a proposed levee structure in suppressing storm surge and waves in the Lake Pontchartain Basin
D
R
A
F
T
Numerical Simulations and Scenario Analysis
Figure 34. Comparison of significant wave heights under 400-year condition for the Levee Front stations.

Ben C Gerwick/3080.1/R/1/jha 47
Effectiveness of a proposed levee structure in suppressing storm surge and waves in the Lake Pontchartain Basin
D
R
A
F
T
Numerical Simulations and Scenario Analysis
Table 6 Wave heights (ft) and corresponding peak periods (seconds) at LF stations for the Open-Gate-ELB-intact scenario
LF# 100-year 400-year
015 073 103 116 MEOW-Hs (Tp) 018 085 094 147 MEOW
-Hs (Tp)
1 Hs 6.7 6.7 6.1 6.5 6.7 7.8 7.1 7.5 7.5 7.8 Tp 5.9 5.7 5.6 5.9 5.7 6.2 6.2 6.3 6.2 6.2
2 Hs 7.7 8.1 7.3 7.5 8.1 8.9 8.1 8.4 8.2 8.2 Tp 5.8 5.6 5.0 5.8 5.6 6.2 5.9 5.9 5.6 5.6
3 Hs 7.5 7.8 7.0 7.4 7.8 8.6 8.0 8.3 8.1 8.1 Tp 5.0 4.9 4.4 4.9 4.9 5.2 5.0 5.1 5.1 5.1
4 Hs 5.1 4.5 6.3 4.7 5.1 5.7 4.9 4.6 5.3 5.3 Tp 5.5 5.2 4.8 5.4 5.5 6.0 5.9 6.9 6.5 6.5
5 Hs 6.1 6.3 5.6 5.8 6.3 7.2 6.1 6.1 6.1 6.1 Tp 4.7 4.7 4.4 4.7 4.7 5.5 5.0 6.0 6.2 6.2
6 Hs 6.1 6.3 5.8 5.9 6.3 7.2 6.1 6.2 6.2 6.2 Tp 5.7 4.8 4.5 5.7 4.8 6.2 6.1 6.2 6.3 6.3
7 Hs 6.2 6.5 6.0 6.0 6.5 7.3 6.3 6.6 6.4 6.4 Tp 5.8 5.1 4.6 5.8 5.1 6.2 6.1 6.2 6.3 6.3
8 Hs 6.4 6.7 6.1 6.2 6.7 7.5 6.5 6.7 6.7 6.7 Tp 5.7 5.0 4.6 5.7 5.0 6.1 5.8 6.0 6.2 6.2
9 Hs 6.5 6.9 6.3 6.3 6.9 7.6 6.7 7.0 7.0 7.0 Tp 5.7 5.1 4.5 5.7 5.1 6.0 5.8 6.0 6.2 6.2
10 Hs 6.7 7.1 6.6 6.5 7.1 7.9 6.9 7.1 7.0 7.9 Tp 5.6 5.1 4.9 5.5 5.1 5.8 5.6 5.6 6.0 5.8
11 Hs 6.8 7.3 6.9 6.6 7.3 8.0 7.1 7.5 7.8 8.0 Tp 5.7 5.5 5.6 5.6 5.5 6.0 5.8 6.0 6.1 6.0
12 Hs 6.9 7.3 7.0 6.7 7.3 8.0 7.1 7.5 7.9 8.0 Tp 5.6 5.5 5.6 5.6 5.5 5.9 5.7 5.9 5.9 5.9
13 Hs 5.6 6.0 5.9 5.4 6.0 6.7 5.7 6.1 6.5 6.7 Tp 5.8 5.7 5.9 5.8 5.7 6.1 5.8 5.7 5.7 6.1
14 Hs 5.2 5.6 5.5 5.1 5.6 6.2 5.4 5.6 6.0 6.2 Tp 4.6 4.9 4.5 4.4 4.9 5.1 4.4 4.5 4.7 5.1
15 Hs 5.0 5.3 5.2 4.8 5.2 5.8 5.0 5.1 5.5 5.8 Tp 3.8 4.0 3.9 3.6 3.9 4.1 3.6 3.8 4.0 4.1
16 Hs 5.2 5.4 4.7 5.0 4.7 6.1 5.5 5.8 6.2 6.1 Tp 3.9 4.0 3.6 3.9 3.6 4.3 4.2 4.4 4.6 4.3
17 Hs 4.2 4.7 4.3 4.1 4.3 5.2 4.4 4.7 5.1 5.2 Tp 3.9 3.9 3.7 3.8 3.7 4.3 4.1 4.2 4.3 4.3
18 Hs 2.2 2.7 2.9 2.0 2.9 2.9 2.3 2.3 2.7 2.9 Tp 4.1 4.1 3.9 4.0 3.9 4.6 4.3 4.3 4.5 4.6

Ben C Gerwick/3080.1/R/1/jha 48
Effectiveness of a proposed levee structure in suppressing storm surge and waves in the Lake Pontchartain Basin
D
R
A
F
T
Numerical Simulations and Scenario Analysis
Significant wave heights are determined by wind strength, wind fetch and duration, and the water depth. When there is no levee constructed, waves at these ELB survey locations are mainly limited by the water depth. For the FWOA scenarios (Base and Scenario #1), the wave heights are large where the total depths are large. For example, LF18 is located at the highest ground (on US Highway 90) among the LF stations and the significant wave heights there are the smallest due to the relatively shallow water depth. The impacts of the ELB topography are indicated by increased wave heights at stations LF4 - LF15 along the ELB when they are compared with the results of scenarios with the same configuration but intact ELB. such as FWOA-ELB-degraded versus FWOA-ELB-intact and Gate-Open-ELB-degraded versus Gate-Open-ELB-intact. The wave heights between Chef Menteur pass and the Rigolets pass (approximately stations LF4 - LF15) increase by up to 1 foot for both the 100-year and 400-year events.
For the levee configurations evaluated in this project, Lake Pontchartrain becomes either completely or partially hydraulically disconnected from Lake Borgne and the Gulf of Mexico. For these situations, the waves inside the basin are not only limited by the total water depth but also the wind fetch, especially for the area adjacent to the north side of the levee. At the levee front, because of the raised water level due to the levee obstruction, wave heights are the highest for the Gate-Closed scenario with the exception of stations LF10 – LF12, which are located near the midpoint of the levee and are least affected by the opening of the two passes. If two major passes remain open, increased wave heights are only observed at the middle stations LF9 – LF13, while wave heights at other stations show little increment or decrease. For instance, wave heights at LF4 and LF15 for two Gate-Open scenarios (orange and red bars) are slightly smaller than both FWOA scenarios (dark blue and blue bars). These two stations are close to the opening where the peak current velocities are around or above 30 feet per second. Overall, the levee construction influences the wave environment near the mid-way location of the levee but has minimal impact near both ends of the levee, especially when the Chef Menteur and Rigolets passes remain open.
5. Summary and Conclusions
A total number of 40 simulations have been conducted to evaluate the response of storm surge levels and wind waves of selected 100- and 400-year storms under five different future scenarios using the coupled ADCIRC and unSWAN modeling systems. Sequences of images, hydrographs, and inter-scenario comparison of surge levels and wave heights were created to reveal the dynamics of the future-without action system and the future system with proposed levee structure constructed. All future scenarios include the effects of 2.8 feet relative SLR.

Ben C Gerwick/3080.1/R/1/jha 49
Effectiveness of a proposed levee structure in suppressing storm surge and waves in the Lake Pontchartain Basin
D
R
A
F
T
Numerical Simulations and Scenario Analysis
Four storms were selected from the suite of synthetic storms previously developed during the recent FEMA FIS and LACPR studies. The selected storms show notable variations in the storm tracks and in other dynamic variables such as maximum wind speed, forward speed, and minimum pressure. Note that these storms were selected based only upon how well the simulated surge generated in the original FEMA runs matched the 100-year and 400-year statistical surge level within the ELB area. For areas farther away from the ELB, the simulated responses tend to be storm-dependent and thus do not represent the100- and 400-year surge elevation outside of the project area.
Five sets of mesh structures and corresponding nodal attributes were developed based upon the scenario design configurations. The mesh size within the ELB area is approximately 300 to 600 feet and the mesh size within the channels is less than 300 feet. The future Slidell levee was also implemented in all meshes for an accurate representation of the future condition. All simulations were performed on a parallel super-computer platform and completed without instabilities. The existing model setup remains available and ready for simulating additional levee configurations that may need to be explored.
Simulation results were analyzed graphically and numerically. Two sets of chosen storms for the 100-year and 400-year events generate storm surge that generally matches the linear summation of RSLR (2.8 feet) and the FEMA statistical surge levels on the ELB area. The maximum water surface elevation (PWSE), the maximum significant wave heights (PWH), and the corresponding peak periods (TP-PWH) of individual storms were output and plotted. The maximum of PWSEs and the corresponding wave heights were extracted from four storms for 100- and 400-year events, respectively.
With a 2.8-foot RSLR, it is expected that the simulated surge levels for future scenarios are elevated about 2.8 feet above the FEMA statistical levels based upon the CC in reference to the datum of NAVD88. In addition, impacts of RSLR on peak storm surge are also embodied via increasing the still water depth, reducing the bottom roughness, and varying the geometry of the inundation region. A more severe RSLR would have influence on the surge flux between Lake Borgne and Lake Pontchartrain rather than on the storm parameters. However, it would introduce a more extensive inland inundation and high peak surge at the shoreline.
By comparing a series of regional maps of maximum surface elevations and wave heights, as well as point measures at individual stations, the different storm risk
Ben C Gerwick/3080.1/R/1/jha 50
Effectiveness of a proposed levee structure in suppressing storm surge and waves in the Lake Pontchartain Basin
D
R
A
F
T
Numerical Simulations and Scenario Analysis
response of five scenarios was illustrated quantitatively. The protective values of the ELB were investigated through the comparison between scenarios with the intact and degraded ELB. It is shown that the ELB acts as a sill and can reduce surge level behind it. Additionally, the presence of the ELB provides a topographic and vegetative barrier in front of the proposed levee. The presence of the ELB land will help to attenuate waves which will in turn protect the levee from wave energy thus contributing to resilience of the proposed protection structure, Therefore, preserving the ELB intact is a worthwhile effort.
To supplement the protective value of ELB, a levee structure is proposed to provide more protection to the Lake Pontchartrain basin. Previously, a numerical study by Chen et al. (2008) has shown that a surge barrier or a flood gate at the entrance of Lake Pontchartrain during Hurricane Katrina would have reduced the maximum surge levels in Lake Pontchartrain by up to 3.0m. In this project, three model configurations were designated to explore the efficacy and potential impacts on adjacent areas of the proposed levee structure. The Gate-Closed design provides the most effective protection for Lake Pontchartrain and its north shore area because it hydraulically closes the lake completely. However, the surge level and wave heights increase significantly in front of the levee and the surge is re-distributed to the west and east of the ELB. Therefore, the Gate-Closed design increases the surge risk on the Mississippi coast and the impact of the proposed construction extends farthest of all three configurations.
With the Chef Menteur and the Rigolets passes fully open, the effectiveness of the levee for reducing storm surge in Lake Pontchartrain is reduced and the impacts on the Mississippi coast are reduced as well. The Gate-Open with the intact ELB scenario reduces the surge level in Lake Pontchartrain 1 to 2 feet and shrinks the inundation area slightly. For the 100-year surge level, the construction of the levee has no influence on the Mississippi coast. For the 400-year surge level, it has a negligible to minor effect on the Mississippi coast. If the ELB disappears, the ability of the levee to suppress storm surge diminishes to some extent. Thus, the Gate-Open-ELB-intact system provides the best protection with minimal impacts on the Mississippi coast.
However, if gates were present, the maximum water velocity within two major passes is greatly increased due to the flow convergence and the increased head differential between the protected and unprotected sides of the levee. The resulting velocities are 20 to 40 feet per second in the channel, which is approaching critical flow velocity. Additional modeling using a high-resolution three-dimensional model is required to compute accurate flow velocities in the channel for designing scour countermeasures.
Ben C Gerwick/3080.1/R/1/jha 51
Effectiveness of a proposed levee structure in suppressing storm surge and waves in the Lake Pontchartain Basin
D
R
A
F
T
Numerical Simulations and Scenario Analysis
During a hurricane event, gates would be closed for a certain time period in order to provide protection to Lake Pontchartrain. The potential ecological effects on Lake Pontchartrain due to the extended closure can be evaluated by additional computer simulation. The two-dimensional model developed here can be used to evaluate how the proposed levee configuration can be expected to modify the existing tidal prism volume and the existing hydro-period. Additionally, a three-dimensional water quality model can be developed for exploring potential modifications to the salinity and turbidity within Lake Borgne and Lake Pontchartrain.
6. References
Chen, Q., L. Wang, and H. Zhao. 2008. An integrated surge and wave modeling system for northern Gulf of Mexico: Simulations of Hurricanes Katrina and Ivan. ASCE, Proceeding of 31st International Conference on Coastal Engineering 2008, Hamburg, Germany. pp. 1072-1084.
Dietrich, J.C., J.J. Westerink, A.B. Kennedy, J.M. Smith, R.E. Jensen, M. Zijlema, L.H. Holthuijsen, C. Dawson, R.A. Luettich, M.D. Powell, V.J. Cardone, A.T. Cox, G.W. Stone, H. Pourtaheri, M.E. Hope, S. Tanaka, L.G. Westerink, H.J. Westerink, and Z. Cobell. 2011. Hurricane Gustav (2008) waves and storm surge: Hindcast, synoptic analysis, and validation in southern Louisiana. Monthly Weather Review 139(8): pp. 2488-2522.
USACE. 2009. Louisiana Coastal Protection and Restoration Final Technical Report and Comment Addendum. New Orleans District. August.
Westerink, J.W., D. Resio, F.R. Clark, H. Roberts, J. Atkinson, J. Smith, C. Bender, J. Ratcliff, B. Blanton, and R. Jensen. 2007. Flood Insurance Study: Southeastern Parishes, Louisiana - Intermediate Submission 2, Offshore Water Levels and Waves. Federal Emergency Management Agency and U.S. Army Corps of Engineers.

Appendix A
CD
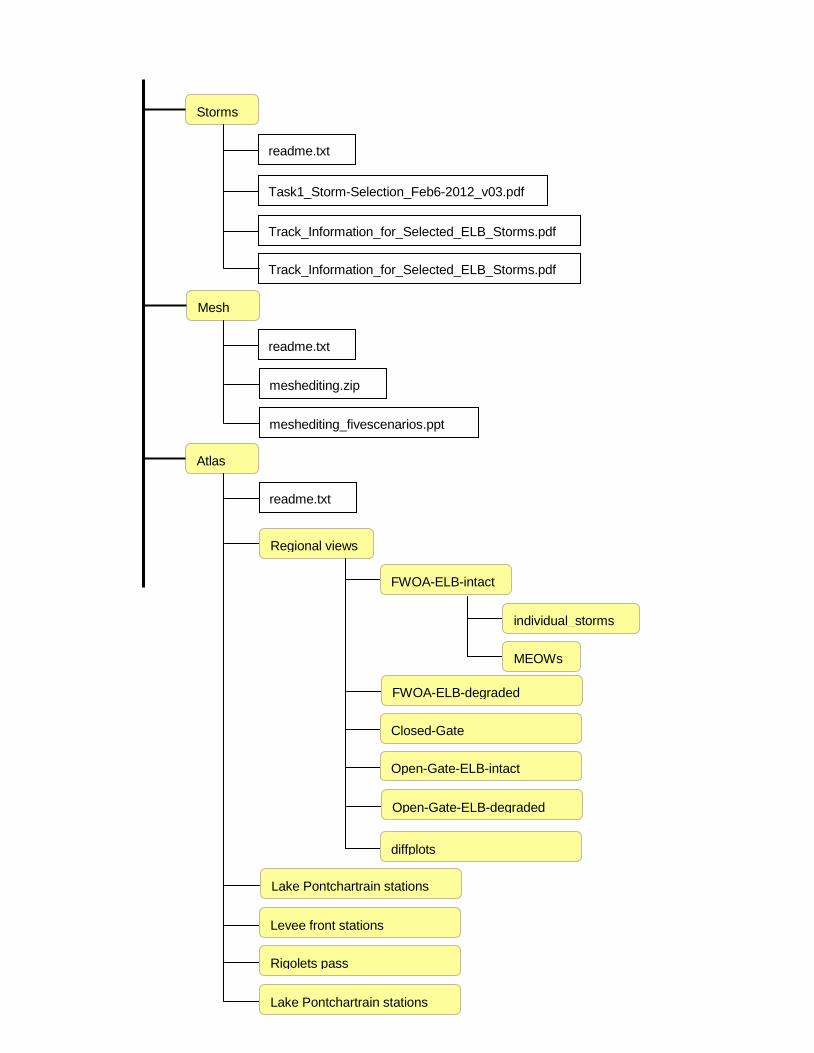
FWOA-ELB-intact
MEOWs
individual_storms
Storms
readme.txt
Task1_Storm-Selection_Feb6-2012_v03.pdf
Track_Information_for_Selected_ELB_Storms.pdf
Track_Information_for_Selected_ELB_Storms.pdf
Mesh
readme.txt
meshediting.zip
meshediting_fivescenarios.ppt
Atlas
readme.txt
Regional views
Levee front stations
Rigolets pass
Lake Pontchartrain stations
Lake Pontchartrain stations
Closed-Gate
Open-Gate-ELB-intact
Open-Gate-ELB-degraded
FWOA-ELB-degraded
diffplots

Appendix B
Tracks of Selected FEMA Synthetic Storms

Ben C Gerwick/3080.1/R/1/jha B-1

Appendix C
Variation of Surge Levels for the Future Scenarios

Ben C Gerwick/3080.1/R/1/jha C-1
Figure C-1. Variation of surge levels for Base Scenario: FWOA-ELB-intact. The solid black line is the
Current Condition (CC) value from the FEMA FIS.
Figure C-2. Variation of surge levels for Scenario#1: FWOA-ELB-subside. The solid black line is the
Current Condition (CC) value from the FEMA FIS.

Ben C Gerwick/3080.1/R/1/jha C-2
Figure C-3. Variation of surge levels for Scenario#2: Levee-Gate-Closed-ELB-subside. The solid
black line is the Current Condition (CC) value from the FEMA FIS.
Figure C-4. Variation of surge levels for Scenario#3: Levee-Gate-Open-ELB-intact. The solid black
line is the Current Condition (CC) value from the FEMA FIS
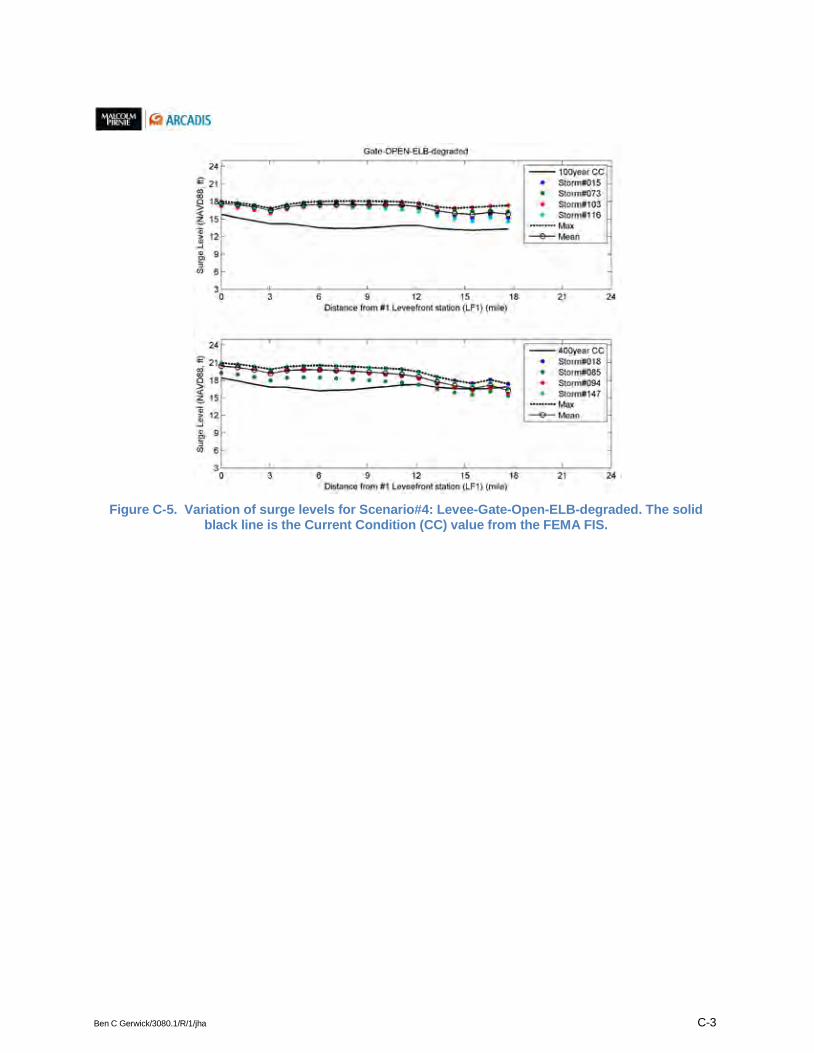
Ben C Gerwick/3080.1/R/1/jha C-3
Figure C-5. Variation of surge levels for Scenario#4: Levee-Gate-Open-ELB-degraded. The solid
black line is the Current Condition (CC) value from the FEMA FIS.

Appendix D
Wider Extent View of MWED

Ben C Gerwick/3080.1/R/1/jha D-1
Figure D-1. Difference in Maximum Surge Envelope between the FWOA-ELB-degraded scenario and the base scenario. Positive values indicate higher surge in the FWOA-ELB-degraded scenario.
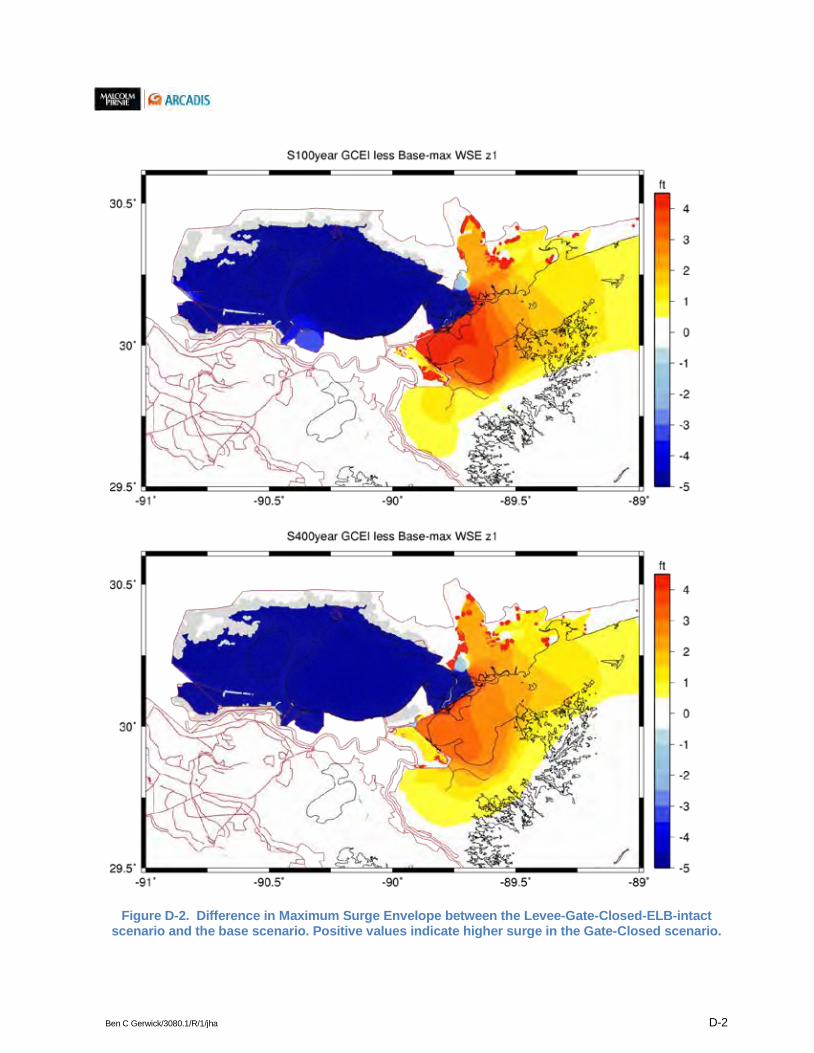
Ben C Gerwick/3080.1/R/1/jha D-2
Figure D-2. Difference in Maximum Surge Envelope between the Levee-Gate-Closed-ELB-intact scenario and the base scenario. Positive values indicate higher surge in the Gate-Closed scenario.
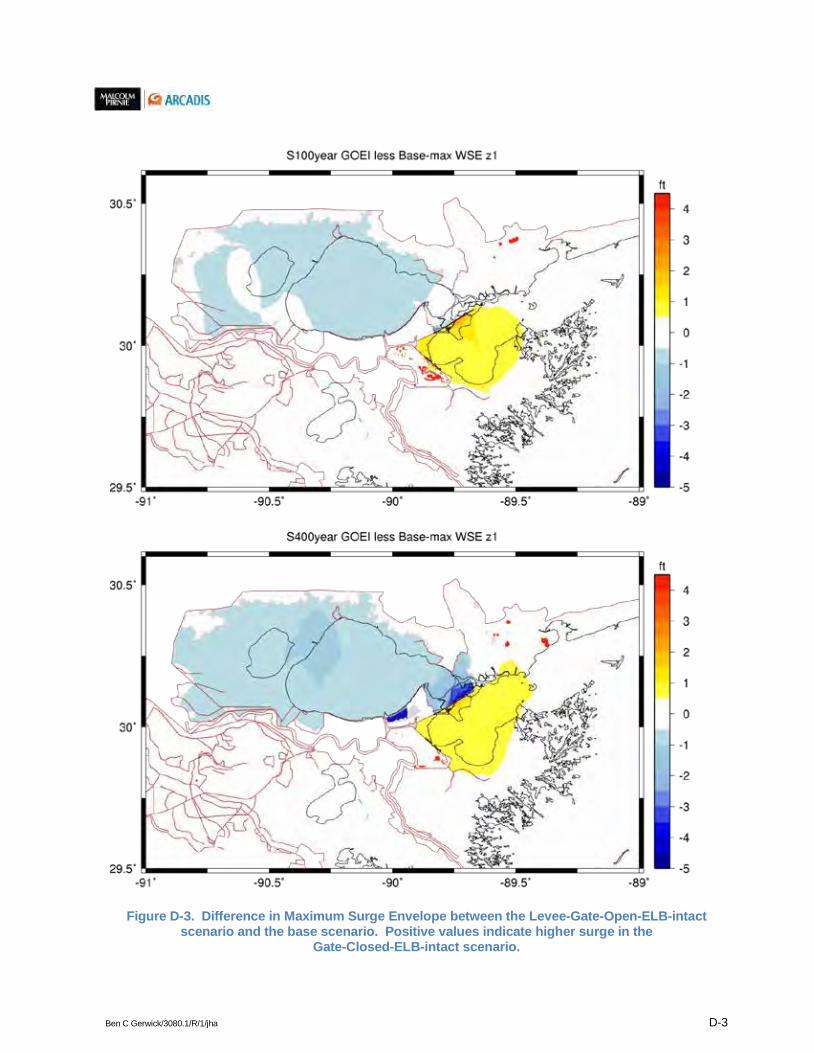
Ben C Gerwick/3080.1/R/1/jha D-3
Figure D-3. Difference in Maximum Surge Envelope between the Levee-Gate-Open-ELB-intact scenario and the base scenario. Positive values indicate higher surge in the
Gate-Closed-ELB-intact scenario.
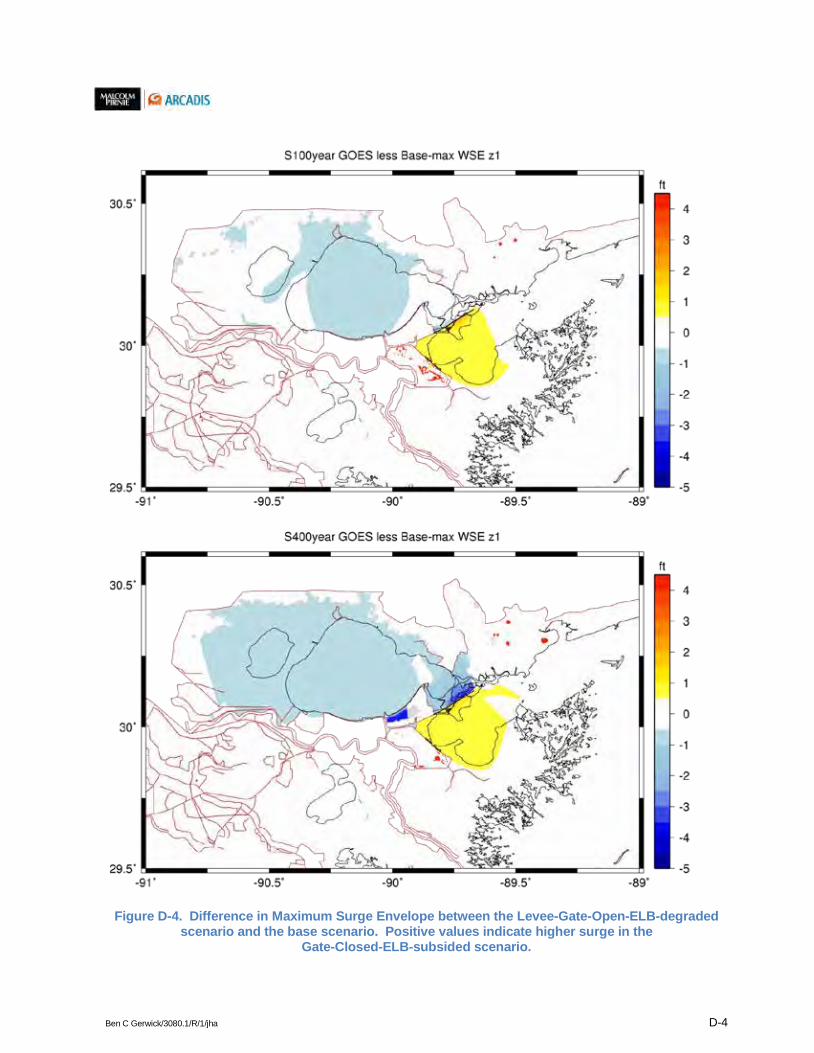
Ben C Gerwick/3080.1/R/1/jha D-4
Figure D-4. Difference in Maximum Surge Envelope between the Levee-Gate-Open-ELB-degraded scenario and the base scenario. Positive values indicate higher surge in the
Gate-Closed-ELB-subsided scenario.

Appendix E
Surge Elevations at Stations in Lake Pontchartrain (LK), Chef Menteur Pass (CM), and Rigolets Pass (RP)

Ben C Gerwick/3080.1/R/1/jha E-1-1
Table E-1 Surge levels at LK stations
LK #
Ss (Scenarios, B: Base; S1, Scenario#1; S2, Scenario#2; S3, Scenario#3; S4, Scenario#4)
Ss 100-year 400-year
15 73 103 116 MEOW Mean 18 85 94 147 MEOW Mean
1
B 15.6 15.3 15.3 15.2 15.6 15.4 17.9 16.6 17.7 18.4 18.4 17.7 S1 15.8 15.4 15.3 15.4 15.8 15.5 18.2 16.9 18.0 18.7 18.7 17.9 S2 5.0 9.9 8.6 4.6 9.9 7.0 5.3 5.7 5.3 5.3 5.7 5.4 S3 12.6 14.7 15.1 12.2 15.1 13.6 14.2 13.5 14.4 15.0 15.0 14.3 S4 12.9 14.8 15.1 12.5 15.1 13.8 14.6 13.9 14.7 15.3 15.3 14.6
2
B 13.6 14.5 15.3 13.0 15.3 14.1 15.5 14.4 15.1 15.7 15.7 15.2 S1 14.1 14.6 15.3 13.5 15.3 14.4 16.1 15.0 15.7 16.4 16.4 15.8 S2 4.9 9.0 8.2 4.6 9.0 6.7 5.3 5.5 5.2 5.2 5.5 5.3 S3 12.4 14.4 15.0 11.5 15.0 13.3 13.8 13.4 13.1 13.7 13.8 13.5 S4 12.7 14.5 15.2 11.9 15.2 13.6 14.2 13.5 13.6 14.2 14.2 13.9
3
B 13.2 14.0 14.9 12.5 14.9 13.6 14.6 14.5 12.9 13.7 14.6 13.9 S1 13.5 14.1 15.0 12.7 15.0 13.8 15.0 14.7 13.5 14.1 15.0 14.3 S2 4.9 8.0 7.9 4.6 8.0 6.4 5.3 5.4 5.2 5.2 5.4 5.3 S3 12.6 13.8 14.4 11.8 14.4 13.2 13.8 14.0 12.0 13.0 14.0 13.2 S4 12.8 13.9 14.6 12.0 14.6 13.3 14.0 14.1 12.2 13.2 14.1 13.4
4
B 13.5 13.5 14.2 12.8 14.2 13.5 14.9 15.0 13.2 14.1 15.0 14.3 S1 13.8 13.7 14.5 13.1 14.5 13.8 15.2 15.3 13.5 14.3 15.3 14.6 S2 4.9 6.9 7.4 4.6 7.4 6.0 5.3 5.4 5.2 5.4 5.4 5.3 S3 12.8 13.1 13.6 12.1 13.6 12.9 14.0 14.4 12.4 13.3 14.4 13.5 S4 13.0 13.3 13.8 12.3 13.8 13.1 14.2 14.6 12.7 13.5 14.6 13.7
5
B 13.7 12.8 13.3 13.1 13.7 13.2 15.1 15.4 13.6 14.3 15.4 14.6 S1 14.0 13.1 13.6 13.4 14.0 13.5 15.5 15.6 13.9 14.6 15.6 14.9 S2 4.9 5.9 6.6 4.6 6.6 5.5 5.3 5.4 5.2 5.5 5.5 5.4 S3 13.0 12.4 12.7 12.3 13.0 12.6 14.1 14.6 12.7 13.4 14.6 13.7 S4 13.2 12.6 12.9 12.6 13.2 12.8 14.4 14.9 13.0 13.7 14.9 14.0
6
B 13.8 12.2 12.3 13.3 13.8 12.9 15.3 15.7 13.8 14.3 15.7 14.8 S1 14.2 12.5 12.6 13.6 14.2 13.2 15.7 16.0 14.2 14.6 16.0 15.1 S2 4.9 4.9 5.6 4.7 5.6 5.0 5.3 5.4 5.2 5.5 5.5 5.4 S3 13.0 11.7 11.6 12.5 13.0 12.2 14.2 14.9 13.0 13.4 14.9 13.9 S4 13.3 11.9 11.8 12.7 13.3 12.4 14.5 15.1 13.2 13.7 15.1 14.1
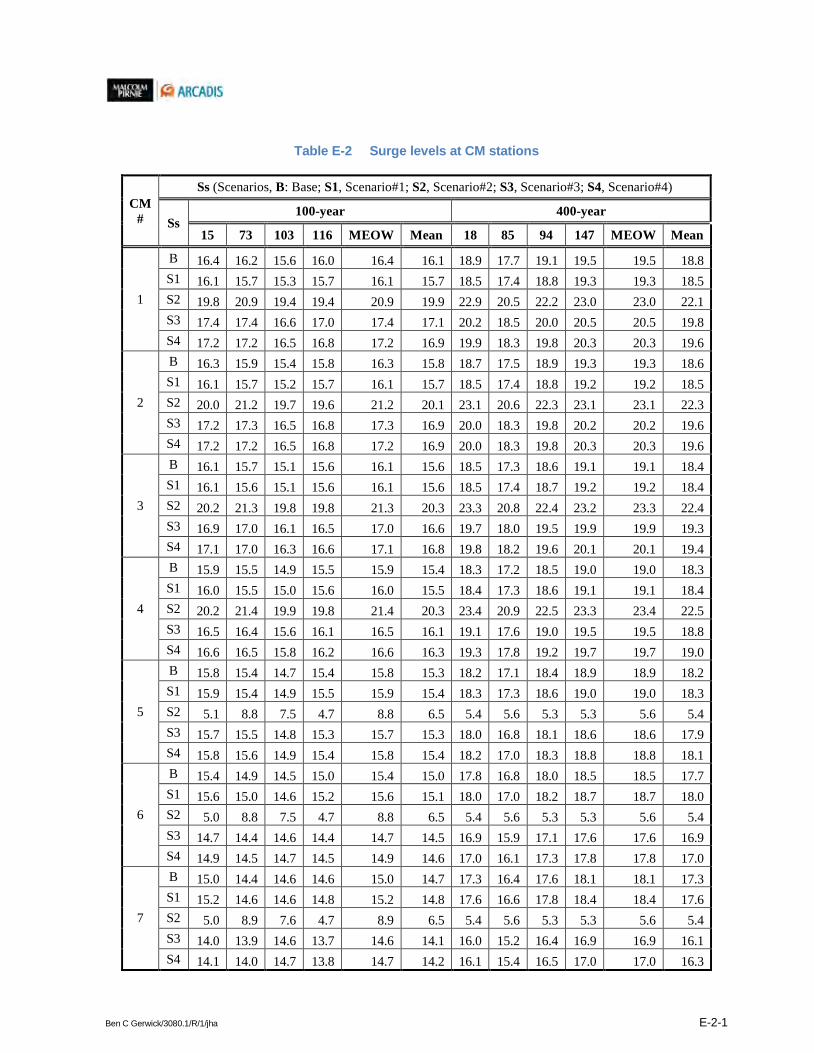
Ben C Gerwick/3080.1/R/1/jha E-2-1
Table E-2 Surge levels at CM stations
CM #
Ss (Scenarios, B: Base; S1, Scenario#1; S2, Scenario#2; S3, Scenario#3; S4, Scenario#4)
Ss 100-year 400-year
15 73 103 116 MEOW Mean 18 85 94 147 MEOW Mean
1
B 16.4 16.2 15.6 16.0 16.4 16.1 18.9 17.7 19.1 19.5 19.5 18.8 S1 16.1 15.7 15.3 15.7 16.1 15.7 18.5 17.4 18.8 19.3 19.3 18.5 S2 19.8 20.9 19.4 19.4 20.9 19.9 22.9 20.5 22.2 23.0 23.0 22.1 S3 17.4 17.4 16.6 17.0 17.4 17.1 20.2 18.5 20.0 20.5 20.5 19.8 S4 17.2 17.2 16.5 16.8 17.2 16.9 19.9 18.3 19.8 20.3 20.3 19.6
2
B 16.3 15.9 15.4 15.8 16.3 15.8 18.7 17.5 18.9 19.3 19.3 18.6 S1 16.1 15.7 15.2 15.7 16.1 15.7 18.5 17.4 18.8 19.2 19.2 18.5 S2 20.0 21.2 19.7 19.6 21.2 20.1 23.1 20.6 22.3 23.1 23.1 22.3 S3 17.2 17.3 16.5 16.8 17.3 16.9 20.0 18.3 19.8 20.2 20.2 19.6 S4 17.2 17.2 16.5 16.8 17.2 16.9 20.0 18.3 19.8 20.3 20.3 19.6
3
B 16.1 15.7 15.1 15.6 16.1 15.6 18.5 17.3 18.6 19.1 19.1 18.4 S1 16.1 15.6 15.1 15.6 16.1 15.6 18.5 17.4 18.7 19.2 19.2 18.4 S2 20.2 21.3 19.8 19.8 21.3 20.3 23.3 20.8 22.4 23.2 23.3 22.4 S3 16.9 17.0 16.1 16.5 17.0 16.6 19.7 18.0 19.5 19.9 19.9 19.3 S4 17.1 17.0 16.3 16.6 17.1 16.8 19.8 18.2 19.6 20.1 20.1 19.4
4
B 15.9 15.5 14.9 15.5 15.9 15.4 18.3 17.2 18.5 19.0 19.0 18.3 S1 16.0 15.5 15.0 15.6 16.0 15.5 18.4 17.3 18.6 19.1 19.1 18.4 S2 20.2 21.4 19.9 19.8 21.4 20.3 23.4 20.9 22.5 23.3 23.4 22.5 S3 16.5 16.4 15.6 16.1 16.5 16.1 19.1 17.6 19.0 19.5 19.5 18.8 S4 16.6 16.5 15.8 16.2 16.6 16.3 19.3 17.8 19.2 19.7 19.7 19.0
5
B 15.8 15.4 14.7 15.4 15.8 15.3 18.2 17.1 18.4 18.9 18.9 18.2 S1 15.9 15.4 14.9 15.5 15.9 15.4 18.3 17.3 18.6 19.0 19.0 18.3 S2 5.1 8.8 7.5 4.7 8.8 6.5 5.4 5.6 5.3 5.3 5.6 5.4 S3 15.7 15.5 14.8 15.3 15.7 15.3 18.0 16.8 18.1 18.6 18.6 17.9 S4 15.8 15.6 14.9 15.4 15.8 15.4 18.2 17.0 18.3 18.8 18.8 18.1
6
B 15.4 14.9 14.5 15.0 15.4 15.0 17.8 16.8 18.0 18.5 18.5 17.7 S1 15.6 15.0 14.6 15.2 15.6 15.1 18.0 17.0 18.2 18.7 18.7 18.0 S2 5.0 8.8 7.5 4.7 8.8 6.5 5.4 5.6 5.3 5.3 5.6 5.4 S3 14.7 14.4 14.6 14.4 14.7 14.5 16.9 15.9 17.1 17.6 17.6 16.9 S4 14.9 14.5 14.7 14.5 14.9 14.6 17.0 16.1 17.3 17.8 17.8 17.0
7
B 15.0 14.4 14.6 14.6 15.0 14.7 17.3 16.4 17.6 18.1 18.1 17.3 S1 15.2 14.6 14.6 14.8 15.2 14.8 17.6 16.6 17.8 18.4 18.4 17.6 S2 5.0 8.9 7.6 4.7 8.9 6.5 5.4 5.6 5.3 5.3 5.6 5.4 S3 14.0 13.9 14.6 13.7 14.6 14.1 16.0 15.2 16.4 16.9 16.9 16.1 S4 14.1 14.0 14.7 13.8 14.7 14.2 16.1 15.4 16.5 17.0 17.0 16.3
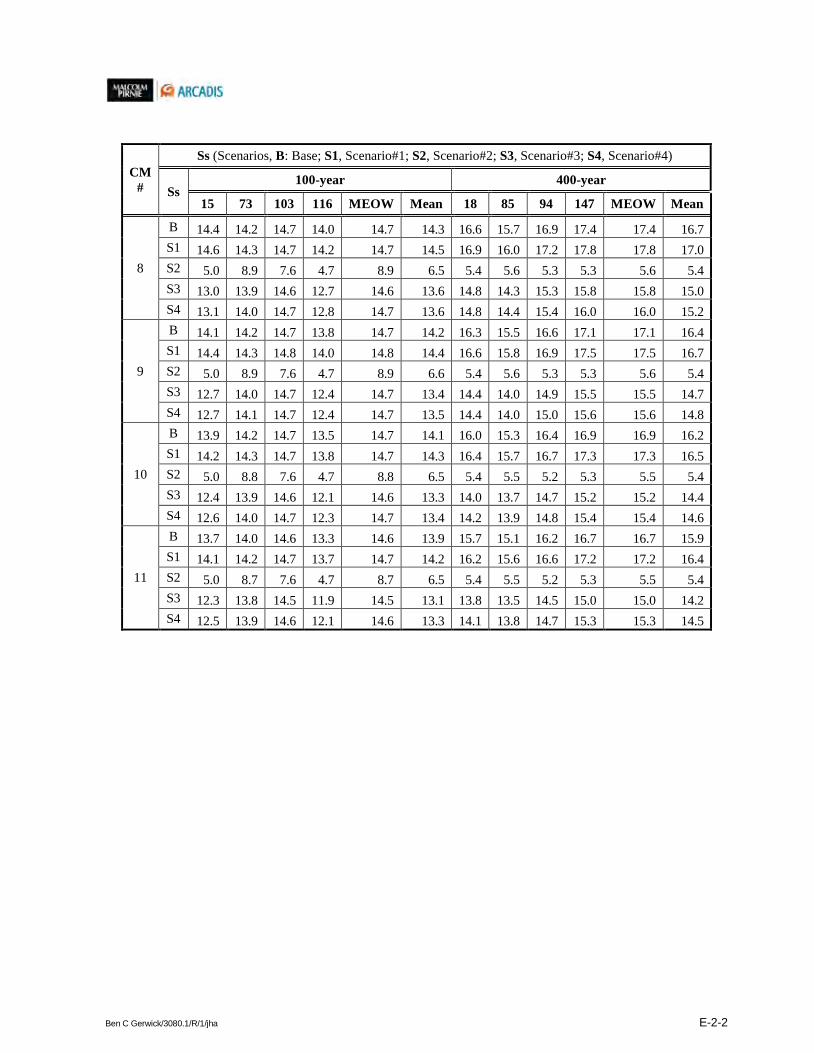
Ben C Gerwick/3080.1/R/1/jha E-2-2
CM #
Ss (Scenarios, B: Base; S1, Scenario#1; S2, Scenario#2; S3, Scenario#3; S4, Scenario#4)
Ss 100-year 400-year
15 73 103 116 MEOW Mean 18 85 94 147 MEOW Mean
8
B 14.4 14.2 14.7 14.0 14.7 14.3 16.6 15.7 16.9 17.4 17.4 16.7 S1 14.6 14.3 14.7 14.2 14.7 14.5 16.9 16.0 17.2 17.8 17.8 17.0 S2 5.0 8.9 7.6 4.7 8.9 6.5 5.4 5.6 5.3 5.3 5.6 5.4 S3 13.0 13.9 14.6 12.7 14.6 13.6 14.8 14.3 15.3 15.8 15.8 15.0 S4 13.1 14.0 14.7 12.8 14.7 13.6 14.8 14.4 15.4 16.0 16.0 15.2
9
B 14.1 14.2 14.7 13.8 14.7 14.2 16.3 15.5 16.6 17.1 17.1 16.4 S1 14.4 14.3 14.8 14.0 14.8 14.4 16.6 15.8 16.9 17.5 17.5 16.7 S2 5.0 8.9 7.6 4.7 8.9 6.6 5.4 5.6 5.3 5.3 5.6 5.4 S3 12.7 14.0 14.7 12.4 14.7 13.4 14.4 14.0 14.9 15.5 15.5 14.7 S4 12.7 14.1 14.7 12.4 14.7 13.5 14.4 14.0 15.0 15.6 15.6 14.8
10
B 13.9 14.2 14.7 13.5 14.7 14.1 16.0 15.3 16.4 16.9 16.9 16.2 S1 14.2 14.3 14.7 13.8 14.7 14.3 16.4 15.7 16.7 17.3 17.3 16.5 S2 5.0 8.8 7.6 4.7 8.8 6.5 5.4 5.5 5.2 5.3 5.5 5.4 S3 12.4 13.9 14.6 12.1 14.6 13.3 14.0 13.7 14.7 15.2 15.2 14.4 S4 12.6 14.0 14.7 12.3 14.7 13.4 14.2 13.9 14.8 15.4 15.4 14.6
11
B 13.7 14.0 14.6 13.3 14.6 13.9 15.7 15.1 16.2 16.7 16.7 15.9 S1 14.1 14.2 14.7 13.7 14.7 14.2 16.2 15.6 16.6 17.2 17.2 16.4 S2 5.0 8.7 7.6 4.7 8.7 6.5 5.4 5.5 5.2 5.3 5.5 5.4 S3 12.3 13.8 14.5 11.9 14.5 13.1 13.8 13.5 14.5 15.0 15.0 14.2 S4 12.5 13.9 14.6 12.1 14.6 13.3 14.1 13.8 14.7 15.3 15.3 14.5

Ben C Gerwick/3080.1/R/1/jha E-3-1
Table E-3 Surge levels at RP stations
RP #
Ss (Scenarios, B: Base; S1, Scenario#1; S2, Scenario#2; S3, Scenario#3; S4, Scenario#4)
Ss 100-year 400-year
15 73 103 116 MEOW Mean 18 85 94 147 MEOW Mean
1
B 16.2 17.6 17.8 15.7 17.8 16.8 18.7 16.5 17.4 18.5 18.7 17.8 S1 16.1 17.3 17.7 15.5 17.7 16.7 18.5 16.4 17.3 18.4 18.5 17.7 S2 18.7 21.3 21.1 18.3 21.3 19.9 21.7 18.7 20.0 21.5 21.7 20.5 S3 16.5 18.0 18.2 16.0 18.2 17.2 19.2 16.8 17.7 18.9 19.2 18.1 S4 16.4 17.9 18.1 15.9 18.1 17.1 19.1 16.7 17.7 18.8 19.1 18.1
2
B 16.1 17.3 17.6 15.6 17.6 16.7 18.6 16.5 17.3 18.4 18.6 17.7 S1 16.1 17.1 17.6 15.5 17.6 16.6 18.5 16.5 17.3 18.4 18.5 17.7 S2 18.9 21.4 21.2 18.5 21.4 20.0 21.9 18.8 20.2 21.6 21.9 20.6 S3 16.2 17.6 17.7 15.7 17.7 16.8 18.8 16.5 17.4 18.6 18.8 17.8 S4 16.2 17.5 17.7 15.7 17.7 16.8 18.8 16.5 17.4 18.5 18.8 17.8
3
B 16.0 17.1 17.3 15.5 17.3 16.5 18.5 16.4 17.3 18.3 18.5 17.6 S1 16.1 16.9 17.3 15.5 17.3 16.5 18.5 16.5 17.3 18.3 18.5 17.7 S2 19.0 21.5 21.2 18.6 21.5 20.1 22.1 19.0 20.3 21.8 22.1 20.8 S3 15.8 17.1 17.1 15.3 17.1 16.3 18.4 16.2 17.1 18.2 18.4 17.5 S4 15.9 17.1 17.2 15.4 17.2 16.4 18.4 16.3 17.1 18.2 18.4 17.5
4
B 15.9 16.8 17.2 15.4 17.2 16.3 18.4 16.3 17.1 18.1 18.4 17.5 S1 16.1 16.8 17.3 15.5 17.3 16.4 18.5 16.5 17.3 18.3 18.5 17.6 S2 19.1 21.6 21.3 18.7 21.6 20.2 22.2 19.1 20.4 21.9 22.2 20.9 S3 15.4 16.6 17.0 14.9 17.0 16.0 17.8 15.8 16.6 17.6 17.8 17.0 S4 15.5 16.6 17.0 15.0 17.0 16.0 18.0 15.9 16.7 17.7 18.0 17.1
5
B 15.9 16.7 17.1 15.3 17.1 16.2 18.3 16.3 17.1 18.0 18.3 17.4 S1 16.0 16.6 17.2 15.5 17.2 16.3 18.5 16.5 17.3 18.2 18.5 17.6 S2 19.2 21.7 21.3 18.8 21.7 20.3 22.3 19.1 20.5 22.0 22.3 21.0 S3 15.0 16.3 16.9 14.5 16.9 15.7 17.3 15.4 16.1 17.1 17.3 16.5 S4 15.1 16.3 16.9 14.6 16.9 15.8 17.5 15.5 16.2 17.2 17.5 16.6
6
B 15.7 16.5 16.9 15.2 16.9 16.1 18.2 16.2 17.0 17.9 18.2 17.3 S1 16.0 16.5 17.0 15.4 17.0 16.2 18.4 16.5 17.3 18.2 18.4 17.6 S2 5.0 10.9 9.9 4.6 10.9 7.6 5.3 5.6 5.2 5.3 5.6 5.4 S3 14.5 16.2 16.8 14.0 16.8 15.4 16.6 14.9 15.5 16.4 16.6 15.9 S4 14.6 16.2 16.8 14.1 16.8 15.4 16.7 15.0 15.6 16.5 16.7 16.0
7
B 15.6 16.3 16.8 15.1 16.8 15.9 18.0 16.1 16.9 17.8 18.0 17.2 S1 15.9 16.3 16.8 15.3 16.8 16.1 18.3 16.4 17.2 18.1 18.3 17.5 S2 5.0 10.8 9.8 4.6 10.8 7.5 5.3 5.6 5.2 5.3 5.6 5.4 S3 14.1 16.0 16.6 13.6 16.6 15.1 16.1 14.4 15.0 15.9 16.1 15.4 S4 14.2 16.1 16.6 13.7 16.6 15.2 16.2 14.6 15.2 16.0 16.2 15.5
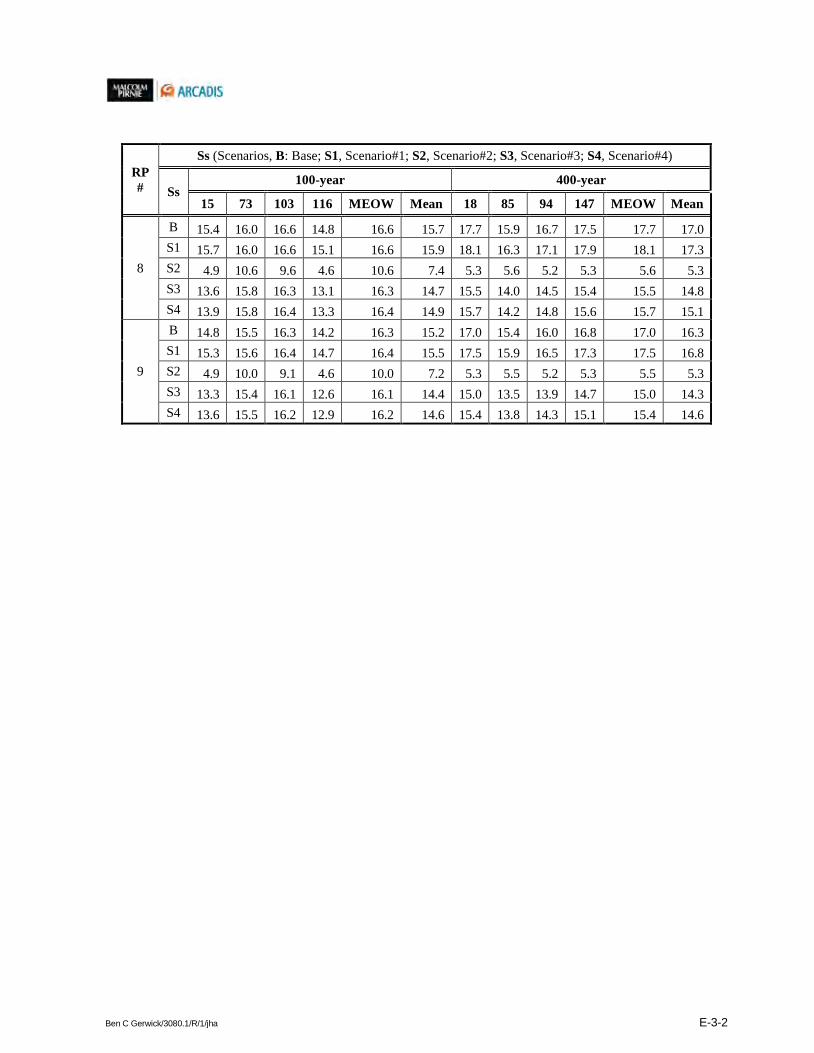
Ben C Gerwick/3080.1/R/1/jha E-3-2
RP #
Ss (Scenarios, B: Base; S1, Scenario#1; S2, Scenario#2; S3, Scenario#3; S4, Scenario#4)
Ss 100-year 400-year
15 73 103 116 MEOW Mean 18 85 94 147 MEOW Mean
8
B 15.4 16.0 16.6 14.8 16.6 15.7 17.7 15.9 16.7 17.5 17.7 17.0 S1 15.7 16.0 16.6 15.1 16.6 15.9 18.1 16.3 17.1 17.9 18.1 17.3 S2 4.9 10.6 9.6 4.6 10.6 7.4 5.3 5.6 5.2 5.3 5.6 5.3 S3 13.6 15.8 16.3 13.1 16.3 14.7 15.5 14.0 14.5 15.4 15.5 14.8 S4 13.9 15.8 16.4 13.3 16.4 14.9 15.7 14.2 14.8 15.6 15.7 15.1
9
B 14.8 15.5 16.3 14.2 16.3 15.2 17.0 15.4 16.0 16.8 17.0 16.3 S1 15.3 15.6 16.4 14.7 16.4 15.5 17.5 15.9 16.5 17.3 17.5 16.8 S2 4.9 10.0 9.1 4.6 10.0 7.2 5.3 5.5 5.2 5.3 5.5 5.3 S3 13.3 15.4 16.1 12.6 16.1 14.4 15.0 13.5 13.9 14.7 15.0 14.3 S4 13.6 15.5 16.2 12.9 16.2 14.6 15.4 13.8 14.3 15.1 15.4 14.6