new mexico annual social & economic … · new mexico annual social & economic indicators...
TRANSCRIPT

NEW MEXICO ANNUALSOCIAL & ECONOMIC INDICATORS
2012

STATE OF NEW MEXICOSUSANA MARTINEZ, GOVERNOR
NEW MEXICOANNUAL SOCIAL AND ECONOMIC INDICATORS
NEW MEXICO DEPARTMENT OF WORKFORCE SOLUTIONSCelina Bussey, Secretary
BUREAU OF ECONOMIC RESEARCH AND ANALYSISMark Boyd, Bureau Chief
Report prepared by Katie Bass, Economist Stefany Pickin, Economist
2012
FOR FURTHER INFORMATION CONTACT:
New Mexico Department of Workforce SolutionsBureau of Economic Research and Analysis
Post Office Box 1928Albuquerque, NM 87103
TELEPHONE: (505) 383-2729
www.dws.state.nm.us
Data and Program Reporting Areas 1
Population 2New Mexico Population by County Showing Components of Change 3New Mexico Population by County 4New Mexico Population Estimates for Incorporated Places 5-7New Mexico Population by Age and Sex 8New Mexico Population Comparisons by Hispanic Origin and Race, 2000 and 2010 9New Mexico Population Comparisons by Hispanic Origin and Race, 1990 and 2000 10New Mexico Population by Counties by Race and Hispanic Origin 11-12New Mexico Population Projections by County and Balance of the State 13New Mexico Population Growth Rates by County 14
Labor Market 15Labor Force Data for the United States, New Mexico, and Substate Areas 15Civilian Labor Force Estimates in New Mexico and Albuquerque MSA 16Civilian Labor Force Estimates by County and MSA 17Unemployment Rate Ranking by State, Over-the-Year Change 18Nonagricultural Growth Rate Rankings by Sector 19-24New Mexico Population and Average Unemployment Rates by County 25Nonagricultural Employment in the United States, New Mexico, and the Albuquerque MSA 26Farm Employment in New Mexico, Year to Year Comparison 27Agricultural Employment in New Mexico, 2001 to 2009 28Employment Status of the Civilian Noninstitutional Population in New Mexico 29Labor Force Participation Rates by State 30Employment to Population Ratios by State 31
Occupational Outlook 32New Mexico Occupations in Demand 32New Mexico Fastest Growing Jobs - Wages and Growth 33New Mexico Occupations with the Most Openings - Wages and Growth 34New Mexico Estimated and Projected Nonagricultural Wage and Salary Employment 35
Labor Surplus Areas 36New Mexico Eligible Labor Surplus Areas 36
Income 37Per Capita Personal Income in New Mexico by County and MSA 38Per Capita Personal Income by State 39Per Capita Personal Income by BEA Region 40Estimated Median Family Income in New Mexico by County and MSA 41New Mexico Mean and Median Annual Wages for Selected Occupations 42Consumer Price Index 43
Poverty 44New Mexico Poverty Threshold 45Percent Below Poverty Level by State 46New Mexico Poverty Rates by County 47New Mexico Poverty Rate by School District 48-49United States Poverty Statistics 50New Mexico Poverty Statistics 51Federal and State Poverty Guidelines 52SNAP Recipiency Rate in New Mexico by County 53
Education 54New Mexico Educational Attainment 54Educational Attainment by State 55New Mexico Student Dropout Rates by Grade, Sex, and Ethnicity 56New Mexico Dropout Rates by School District 57New Mexico School District Graduation Rates 58Average ACT Scores by State 59Average SAT Scores by State 60
Table of Contents
Quality of Life 61Mean Travel Time to Work by State 62Public Transportation Usage by State 63New Mexico Annual Building Permits by County 64Median Home Values by State 65Homeownership Rates by State 66State and Local Property Taxes by State 67Median Age of the Population by State 68Voter Participation Rates, 2008 69Percentage of People Uninsured by State 70Crime Rates by State 71
AppendixNew Mexico Department of Workforce Solutions, Bureau of Economic Research and Analysis - Operational Programs A-1New Mexico Department of Workforce Solutions, Bureau of Economic Research and Analysis - Resources A-2Additional Sources of Socioeconomic Information A-4Glossary A-5

Preface New Mexico Annual Social and Economic Indicators is published by the New Mexico Department of Workforce Solutions (NMDWS) Bureau of Economic Research and Analysis prior to the beginning of each program year (July 1) and revised as needed. This report is intended to provide planners and other data users with a broad range of information on current and expected labor market conditions in New Mexico. Much of the information contained in this report is available in greater detail from the NMDWS Bureau of Economic Research and Analysis. Bureau operational programs are listed on page A-1; New Mexico labor market publications on pages A-2 and A-3; additional sources of information for demographic, social, and economic conditions in the state of New Mexico on page A-4; and a glossary of terms and acronyms on pages A-5 and A-6. The Governor of New Mexico is required by federal regulation to designate “an organizational unit to be responsible for oversight and management of a statewide comprehensive labor market and occupational supply and demand information system.” The NMDWS was assigned this role through executive order. New Mexico Annual Social and Economic Indicators is one of several publications produced by the NMDWS to meet the information system designation.
1
Data and Program Reporting Areas
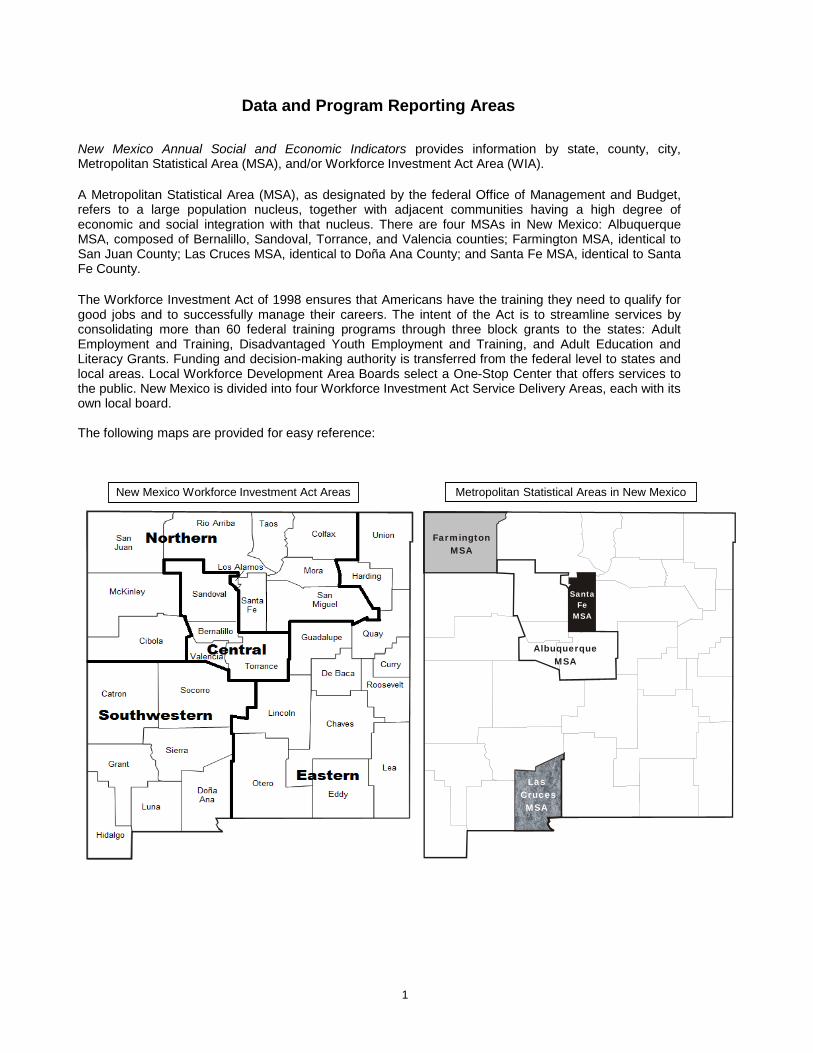
New Mexico Annual Social and Economic Indicators provides information by state, county, city, Metropolitan Statistical Area (MSA), and/or Workforce Investment Act Area (WIA). A Metropolitan Statistical Area (MSA), as designated by the federal Office of Management and Budget, refers to a large population nucleus, together with adjacent communities having a high degree of economic and social integration with that nucleus. There are four MSAs in New Mexico: Albuquerque MSA, composed of Bernalillo, Sandoval, Torrance, and Valencia counties; Farmington MSA, identical to San Juan County; Las Cruces MSA, identical to Doña Ana County; and Santa Fe MSA, identical to Santa Fe County. The Workforce Investment Act of 1998 ensures that Americans have the training they need to qualify for good jobs and to successfully manage their careers. The intent of the Act is to streamline services by consolidating more than 60 federal training programs through three block grants to the states: Adult Employment and Training, Disadvantaged Youth Employment and Training, and Adult Education and Literacy Grants. Funding and decision-making authority is transferred from the federal level to states and local areas. Local Workforce Development Area Boards select a One-Stop Center that offers services to the public. New Mexico is divided into four Workforce Investment Act Service Delivery Areas, each with its own local board. The following maps are provided for easy reference:
New Mexico Workforce Investment Act Areas Metropolitan Statistical Areas in New Mexico
AlbuquerqueMSA
Las Cruces
MSA
SantaFe
MSA
FarmingtonMSA
2
http://www.census.gov/popest/estimates.phpSource: U.S. Census Bureau, Population Division. Population Estimates.
University of New Mexico - BBER, Populations & Projections.Revised: March 2012.
Population
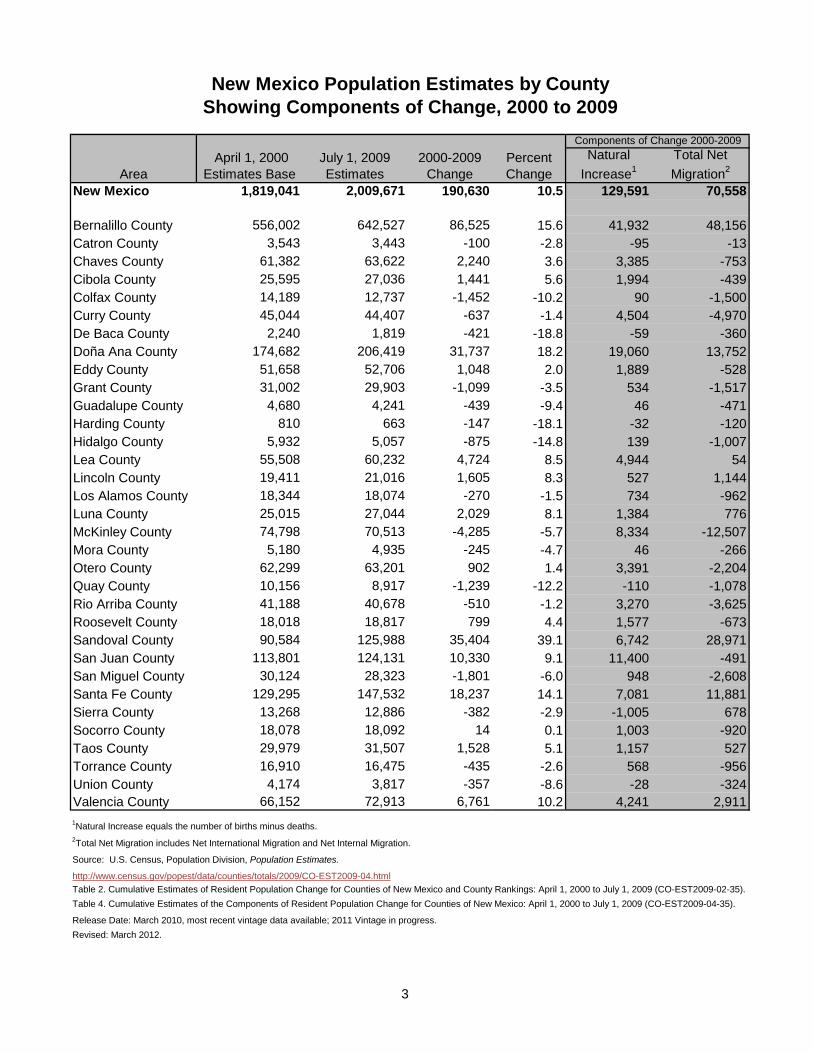
According to the 2010 Census, New Mexico’s population was 2,059,179. This was an increase of 240,133 (13.2 percent) since the 2000 Census, making New Mexico the 15th fastest growing state in the nation. The population of the entire United States grew by 9.7 percent since July 1, 2000, for a total count of 308.7 million people. Census 2010 results confirmed the continuation of historic trends in the state’s population distribution. The most noticeable of these trends is the concentration of the state’s population in metropolitan counties along the central Rio Grande corridor. Over 65 percent of the state’s population lived in one of the seven counties designated as metropolitan by the Census Bureau—Bernalillo, Doña Ana, San Juan, Sandoval, Santa Fe, Torrance, and Valencia. The Albuquerque metropolitan region, the largest in the state, has had over 21 percent growth since 2000, making it the 53rd fastest growing MSA in the country. Albuquerque’s core incorporated area in Bernalillo County had growth of 19.0 percent from 2000 to 2010, which is higher than the overall statewide growth rate. Bernalillo County’s dominance in the Albuquerque area is lessening as the population grows more rapidly in surrounding communities. The population of Sandoval County increased by 46.3 percent, making it the fastest growing county in the state. The growth was concentrated along Sandoval County’s borders with Bernalillo and Santa Fe counties. During the period 2000–2010, some non-metro counties grew rapidly while other counties lost population. Lea County grew by 16.6 percent, followed by Roosevelt which grew by 10.1 percent, Taos by 9.9 percent, and Union by 9 percent. Quay County lost 11 percent, Harding lost over 14 percent, and Hildago lost over 17 percent. According to the 2009 Census estimates, nearly 70 percent of the state’s population growth resulted from natural increase. Natural increase is when there are more births than deaths. The remaining increase was due to net migration, which happens when more people move to the state than leave the state. The 2000 Census added a new dimension to the race question by allowing responses that include multiple races. A total of 63 racial combinations are possible, doubling to 126 combinations if Hispanic origin is also considered. This change makes race comparisons with previous census counts problematic. The Census Bureau suggests the consideration of a range of numbers for each racial group. The minimum number for an individual racial group is the number of people that gave a certain response as their only race. The maximum number for the same racial group is the sum of the single-race respondents plus the number of people who identified themselves in combination with other racial categories. For all races, the maximum value is a count of responses rather than people, with it being possible for individuals to select from one to six responses to the race question. The tables on pages 9-12 present two compatible approaches to the race identification question. The table on page 9 dicusses the minimum-maximum method recommended by the Census Bureau for comparing 1990 to 2000. But because the maximum value counts responses rather than people, the totals add to more than the population of the state. The table on page 10 shows the most recent 10-year Census comparisons of race categories, now directly comparable for those identifying themselves as two or more races. The table on pages 11-12 shows the population range in New Mexico for each racial group. There is no one best approach to accurately classify the population of New Mexico, short of looking at the rather cumbersome 126 possible classifications. For this reason, we follow the guidance from the Census Bureau and present the range of values. The best and most appropriate number to use depends upon the question that is being answered with the data.
3
Area April 1, 2000
Estimates BaseJuly 1, 2009 Estimates
2000-2009 Change
Percent Change
Natural Increase1
Total Net Migration2
New Mexico 1,819,041 2,009,671 190,630 10.5 129,591 70,558
Bernalillo County 556,002 642,527 86,525 15.6 41,932 48,156Catron County 3,543 3,443 -100 -2.8 -95 -13Chaves County 61,382 63,622 2,240 3.6 3,385 -753Cibola County 25,595 27,036 1,441 5.6 1,994 -439Colfax County 14,189 12,737 -1,452 -10.2 90 -1,500Curry County 45,044 44,407 -637 -1.4 4,504 -4,970De Baca County 2,240 1,819 -421 -18.8 -59 -360Doña Ana County 174,682 206,419 31,737 18.2 19,060 13,752Eddy County 51,658 52,706 1,048 2.0 1,889 -528Grant County 31,002 29,903 -1,099 -3.5 534 -1,517Guadalupe County 4,680 4,241 -439 -9.4 46 -471Harding County 810 663 -147 -18.1 -32 -120Hidalgo County 5,932 5,057 -875 -14.8 139 -1,007Lea County 55,508 60,232 4,724 8.5 4,944 54Lincoln County 19,411 21,016 1,605 8.3 527 1,144Los Alamos County 18,344 18,074 -270 -1.5 734 -962Luna County 25,015 27,044 2,029 8.1 1,384 776McKinley County 74,798 70,513 -4,285 -5.7 8,334 -12,507Mora County 5,180 4,935 -245 -4.7 46 -266Otero County 62,299 63,201 902 1.4 3,391 -2,204Quay County 10,156 8,917 -1,239 -12.2 -110 -1,078Rio Arriba County 41,188 40,678 -510 -1.2 3,270 -3,625Roosevelt County 18,018 18,817 799 4.4 1,577 -673Sandoval County 90,584 125,988 35,404 39.1 6,742 28,971San Juan County 113,801 124,131 10,330 9.1 11,400 -491San Miguel County 30,124 28,323 -1,801 -6.0 948 -2,608Santa Fe County 129,295 147,532 18,237 14.1 7,081 11,881Sierra County 13,268 12,886 -382 -2.9 -1,005 678Socorro County 18,078 18,092 14 0.1 1,003 -920Taos County 29,979 31,507 1,528 5.1 1,157 527Torrance County 16,910 16,475 -435 -2.6 568 -956Union County 4,174 3,817 -357 -8.6 -28 -324Valencia County 66,152 72,913 6,761 10.2 4,241 2,911
Revised: March 2012.Release Date: March 2010, most recent vintage data available; 2011 Vintage in progress.
Components of Change 2000-2009
New Mexico Population Estimates by CountyShowing Components of Change, 2000 to 2009
Table 2. Cumulative Estimates of Resident Population Change for Counties of New Mexico and County Rankings: April 1, 2000 to July 1, 2009 (CO-EST2009-02-35).Table 4. Cumulative Estimates of the Components of Resident Population Change for Counties of New Mexico: April 1, 2000 to July 1, 2009 (CO-EST2009-04-35).
1Natural Increase equals the number of births minus deaths.2Total Net Migration includes Net International Migration and Net Internal Migration.
Source: U.S. Census, Population Division, Population Estimates.
http://www.census.gov/popest/data/counties/totals/2009/CO-EST2009-04.html

4
April 1, July 1, April 1, April 1, 2000-2010Area 1990 1995 2000 2010 % Change
New Mexico 1,515,069 1,720,394 1,819,046 2,059,179 13.2%
Sandoval County 63,319 78,818 89,908 131,561 46.3%Dona Ana County 135,510 161,014 174,682 209,233 19.8%Bernalillo County 480,577 538,615 556,678 662,564 19.0%Lea County 55,765 56,613 55,511 64,727 16.6%Valencia County 45,235 57,112 66,152 76,569 15.7%San Juan County 91,605 101,390 113,801 130,044 14.3%Santa Fe County 98,928 118,462 129,292 144,170 11.5%Roosevelt County 16,702 18,895 18,018 19,846 10.1%Taos County 23,118 26,656 29,979 32,937 9.9%Union County 4,124 4,315 4,174 4,549 9.0%Curry County 42,207 48,459 45,044 48,376 7.4%Chaves County 57,849 61,365 61,382 65,645 6.9%Cibola County 23,794 24,507 25,595 27,213 6.3%Lincoln County 12,219 15,869 19,411 20,497 5.6%Catron County 2,563 2,897 3,543 3,725 5.1%Eddy County 48,605 52,308 51,658 53,829 4.2%Otero County 51,928 59,516 62,298 63,797 2.4%Luna County 18,110 22,740 25,016 25,095 0.3%Guadalupe County 4,156 4,178 4,680 4,687 0.1%Socorro County 14,764 16,664 18,078 17,866 -1.2%Los Alamos County 18,115 18,750 18,343 17,950 -2.1%Rio Arriba County 34,365 38,211 41,190 40,246 -2.3%San Miguel County 25,743 29,213 30,126 29,393 -2.4%Colfax County 12,925 14,075 14,189 13,750 -3.1%Torrance County 10,285 13,356 16,911 16,383 -3.1%McKinley County 60,686 70,197 74,798 71,492 -4.4%Grant County 27,676 29,792 31,002 29,514 -4.8%Mora County 4,264 4,652 5,180 4,881 -5.8%Sierra County 9,912 11,764 13,270 11,988 -9.7%De Baca County 2,252 2,308 2,240 2,022 -9.7%Quay County 10,823 10,604 10,155 9,041 -11.0%Harding County 987 903 810 695 -14.2%Hidalgo County 5,958 6,176 5,932 4,894 -17.5%
http://bber.unm.edu/census/NMCos00_10Red.htm
http://www.census.gov/popest/data/intercensal/county/CO-EST00INT-01.html
Revised: March 2012.
Source: Bureau of Business and Economic Research, University of New Mexico, New Mexico Revised County
New Mexico Population by CountyHistorical Data, 1990 to 2010, with Percent Change
Population Estimates from the U.S. Census Bureau and U.S Census Bureau, Population Division, Population Estimates .
Release Date: March 2011, most recent historical data available; 2011 Vintage in progess.
5
July 1, July 1, Census 2000 Population PercentPlace 2000 2009 Population Change Change
Albuquerque 529,219 450,557 448,607 78,662 17.5%Las Cruces 93,452 73,605 74,267 19,847 27.0%Rio Rancho 82,574 52,706 51,765 29,868 56.7%Santa Fe * 74,190 63,286 62,203 10,904 17.2%Roswell 46,453 45,193 45,293 1,260 2.8%Farmington 43,412 38,445 37,844 4,967 12.9%Alamogordo 35,966 35,166 35,582 800 2.3%Clovis 32,863 32,566 32,667 297 0.9%Hobbs * 31,843 28,612 28,657 3,231 11.3%Carlsbad 26,352 25,605 25,625 747 2.9%Gallup * 19,660 20,805 20,209 -1,145 -5.5%Deming * 15,331 14,305 14,116 1,026 7.2%Sunland Park 14,857 13,385 13,309 1,472 11.0%Los Lunas 14,328 10,115 10,034 4,213 41.7%Las Vegas 13,689 14,565 14,565 -876 -6.0%Portales 12,184 11,132 11,131 1,052 9.5%Artesia 11,208 10,753 10,692 455 4.2%Silver City 10,330 10,497 10,545 -167 -1.6%Lovington 10,206 9,522 9,471 684 7.2%Espanola 9,708 9,700 9,688 8 0.1%Bernalillo 9,386 6,582 6,611 2,804 42.6%Ruidoso 9,236 7,985 7,698 1,251 15.7%Socorro 8,924 8,862 8,877 62 0.7%Grants 8,731 8,818 8,806 -87 -1.0%Corrales 7,924 7,267 7,334 657 9.0%Belen 7,396 7,180 6,901 216 3.0%Bloomfield 7,299 6,734 6,417 565 8.4%Truth or Consequences 7,111 7,290 7,289 -179 -2.5%Aztec 6,985 6,495 6,378 490 7.5%Raton 6,329 7,270 7,282 -941 -12.9%Los Ranchos de Albuq. 5,588 5,436 5,092 152 2.8%Taos 5,525 4,750 4,700 775 16.3%Tucumcari 5,247 5,941 5,989 -694 -11.7%Edgewood * 4,363 1,985 1,893 2,378 119.8%Bosque Farms 4,082 3,942 3,931 140 3.6%Peralta 3,780 3,535 (X) 245 6.9%Tularosa 3,031 2,989 2,864 42 1.4%Lordsburg 2,882 3,277 3,379 -395 -12.1%Eunice 2,837 2,576 2,562 261 10.1%Ruidoso Downs 2,697 2,650 1,824 47 1.8%Santa Rosa 2,574 2,755 2,744 -181 -6.6%Mesilla 2,510 2,492 2,180 18 0.7%Milan 2,451 1,899 1,891 552 29.1%Bayard 2,401 2,525 2,534 -124 -4.9%Clayton 2,309 2,517 2,524 -208 -8.3%
(continued)
New Mexico Population Estimates for Incorporated Places2000 to 2009, Revised

6
July 1, July 1, Census 2000 Population PercentPlace 2000 2009 Population Change Change
Jal 2,094 2,005 1,996 89 4.4%Moriarty 1,975 1,866 1,765 109 5.8%Questa 1,900 1,868 1,864 32 1.7%Santa Clara 1,857 1,938 1,944 -81 -4.2%Columbus 1,813 1,755 1,765 58 3.3%Hatch 1,667 1,636 1,673 31 1.9%Estancia 1,584 1,585 1,584 -1 -0.1%Capitan 1,523 1,456 1,443 67 4.6%Pecos 1,473 1,441 1,441 32 2.2%Hurley 1,411 1,458 1,464 -47 -3.2%Cuba 1,396 593 590 803 135.4%Elephant Butte 1,396 1,402 1,390 -6 -0.4%Loving 1,369 1,339 1,326 30 2.2%Chama 1,345 1,204 1,199 141 11.7%Dexter 1,240 1,244 1,235 -4 -0.3%Hagerman 1,175 1,167 1,168 8 0.7%Mountainair 1,126 1,119 1,116 7 0.6%Springer 1,122 1,285 1,285 -163 -12.7%Carrizozo 1,049 1,035 1,036 14 1.4%Logan 997 1,097 1,094 -100 -9.1%Texico 990 1,062 1,065 -72 -6.8%Angel Fire 970 1,058 1,048 -88 -8.3%Magdalena 964 910 913 54 5.9%Fort Sumner 920 1,231 1,249 -311 -25.3%Cloudcroft 914 763 749 151 19.8%Cimarron 799 918 917 -119 -13.0%Tatum 775 706 683 69 9.8%Melrose 679 734 736 -55 -7.5%Tijeras 515 497 474 18 3.6%Red River 513 485 484 28 5.8%Williamsburg 505 526 527 -21 -4.0%Vaughn 467 539 539 -72 -13.4%Jemez Springs 445 372 375 73 19.6%Lake Arthur 438 431 432 7 1.6%Reserve 388 389 387 -1 -0.3%Wagon Mound 350 371 369 -21 -5.7%Eagle Nest 292 305 306 -13 -4.3%Willard 249 261 240 -12 -4.6%San Jon 248 278 306 -30 -10.8%Maxwell 244 274 274 -30 -10.9%San Ysidro 233 236 238 -3 -1.3%
(continued)
New Mexico Population Estimates for Incorporated Places2000 to 2009, Revised
7
July 1, July 1, Census 2000 Population PercentPlace 2000 2009 Population Change Change
Roy 194 299 304 -105 -35.1%Corona 186 165 165 21 12.7%Elida 180 182 183 -2 -1.1%Des Moines 163 176 177 -13 -7.4%Dora 124 130 130 -6 -4.6%Virden 123 139 143 -16 -11.5%Hope 111 107 107 4 3.7%Grady 91 98 98 -7 -7.1%Encino 90 94 94 -4 -4.3%Mosquero 78 119 120 -41 -34.5%Floyd 74 78 78 -4 -5.1%Folsom 67 75 75 -8 -10.7%House 63 71 72 -8 -11.3%Causey 58 61 52 -3 -4.9%Taos Ski Valley 58 56 56 2 3.6%Grenville 23 25 25 -2 -8.0%
* The preliminary estimates for 2009 were revised for several places. This was to account for revisions associated with boundary changes
and other geographic updates that were not fully incorporated into the original estimates in the 2009 round.
r Revised. After the June 2010 release of the Vintage 2009 housing unit estimates series, it was discovered that some housing unit updates
provided to the Census Bureau by the states had not been incorporated for years prior to 2009. The Vintage 2009 housing unit estimates
were recalculated and re-released in September 2010. This updated series supersedes the June 2010 release.
(X) Not defined.
Source: U.S. Census Bureau, Population Division. Revised Sept., 2010 as part of the 2009 round of estimates.
http://www.census.gov/popest/data/counties/totals/2009/index.htmlTable prepared by: Bureau of Business and Economic Research, University of New Mexico.
http://bber.unm.edu/demo/citypopest1.htm
Most recent data available. Revised: March 2012.
2000 to 2009, RevisedNew Mexico Population Estimates for Incorporated Places
8
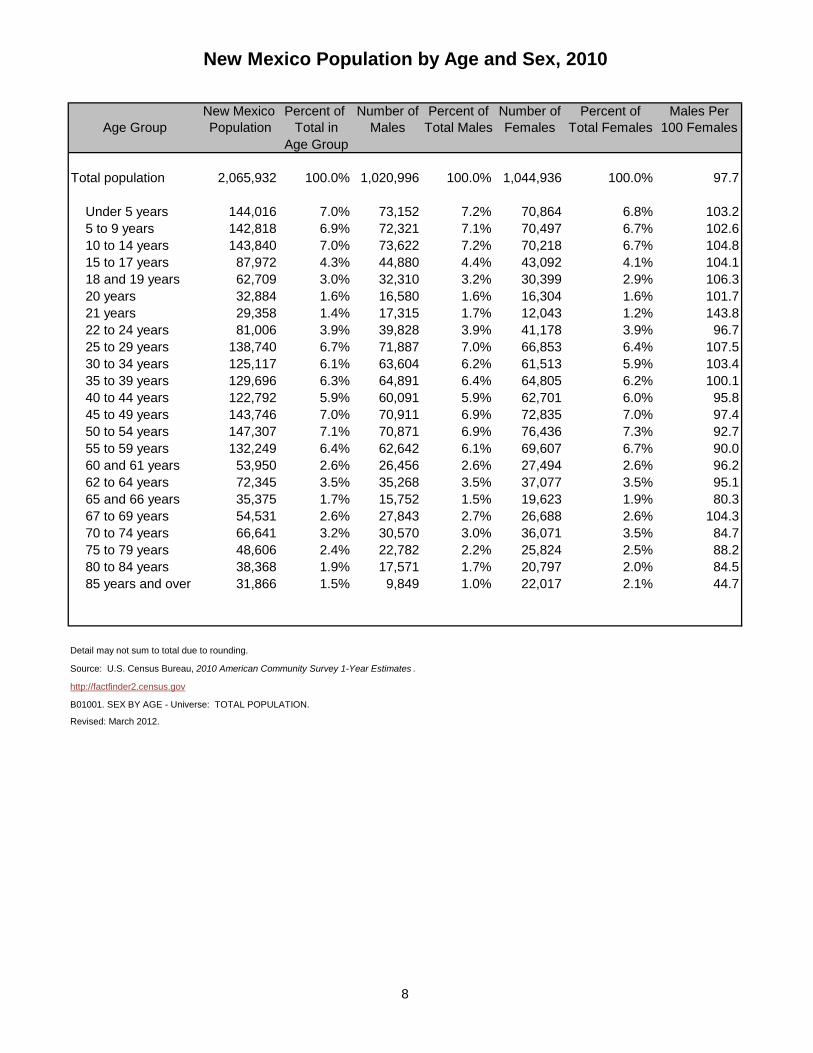
New Mexico Percent of Number of Percent of Number of Percent of Males PerAge Group Population Total in Males Total Males Females Total Females 100 Females
Age Group
Total population 2,065,932 100.0% 1,020,996 100.0% 1,044,936 100.0% 97.7
Under 5 years 144,016 7.0% 73,152 7.2% 70,864 6.8% 103.2 5 to 9 years 142,818 6.9% 72,321 7.1% 70,497 6.7% 102.6 10 to 14 years 143,840 7.0% 73,622 7.2% 70,218 6.7% 104.8 15 to 17 years 87,972 4.3% 44,880 4.4% 43,092 4.1% 104.1 18 and 19 years 62,709 3.0% 32,310 3.2% 30,399 2.9% 106.3 20 years 32,884 1.6% 16,580 1.6% 16,304 1.6% 101.7 21 years 29,358 1.4% 17,315 1.7% 12,043 1.2% 143.8 22 to 24 years 81,006 3.9% 39,828 3.9% 41,178 3.9% 96.7 25 to 29 years 138,740 6.7% 71,887 7.0% 66,853 6.4% 107.5 30 to 34 years 125,117 6.1% 63,604 6.2% 61,513 5.9% 103.4 35 to 39 years 129,696 6.3% 64,891 6.4% 64,805 6.2% 100.1 40 to 44 years 122,792 5.9% 60,091 5.9% 62,701 6.0% 95.8 45 to 49 years 143,746 7.0% 70,911 6.9% 72,835 7.0% 97.4 50 to 54 years 147,307 7.1% 70,871 6.9% 76,436 7.3% 92.7 55 to 59 years 132,249 6.4% 62,642 6.1% 69,607 6.7% 90.0 60 and 61 years 53,950 2.6% 26,456 2.6% 27,494 2.6% 96.2 62 to 64 years 72,345 3.5% 35,268 3.5% 37,077 3.5% 95.1 65 and 66 years 35,375 1.7% 15,752 1.5% 19,623 1.9% 80.3 67 to 69 years 54,531 2.6% 27,843 2.7% 26,688 2.6% 104.3 70 to 74 years 66,641 3.2% 30,570 3.0% 36,071 3.5% 84.7 75 to 79 years 48,606 2.4% 22,782 2.2% 25,824 2.5% 88.2 80 to 84 years 38,368 1.9% 17,571 1.7% 20,797 2.0% 84.5 85 years and over 31,866 1.5% 9,849 1.0% 22,017 2.1% 44.7
Source: U.S. Census Bureau, 2010 American Community Survey 1-Year Estimates .
http://factfinder2.census.gov
Revised: March 2012.
New Mexico Population by Age and Sex, 2010
B01001. SEX BY AGE - Universe: TOTAL POPULATION.
Detail may not sum to total due to rounding.

Usi
ng R
ace
Alon
eU
sing
Rac
e Al
one
or in
1990
2000
2000
for C
ensu
s 20
00C
ombi
natio
n fo
r Cen
sus
2000
Rac
e Al
one
Rac
e Al
one
orD
iffer
ence
(199
0 to
200
0)D
iffer
ence
(199
0 to
200
0) in
Com
bina
tion1
Num
eric
alPe
rcen
tN
umer
ical
Perc
ent
HIS
PAN
IC O
RIG
IN (o
f any
race
)57
9,22
476
5,38
676
5,38
618
6,16
232
.118
6,16
232
.1
NO
T O
F H
ISPA
NIC
OR
IGIN
:
Whi
te76
4,16
481
3,49
583
5,84
249
,331
6.5
71,6
789.
4
Blac
k27
,642
30,6
5435
,899
3,01
210
.98,
257
29.9
Nat
ive
Amer
ican
128,
068
161,
460
173,
041
33,3
9226
.144
,973
35.1
Asia
n12
,587
19,2
4925
,663
6,66
252
.913
,076
103.
9
Haw
aiia
n &
Paci
fic Is
land
er3,
384
3,00
910
,819
-375
-11.
17,
435
219.
7
P010
. HIS
PAN
IC O
RIG
IN B
Y R
ACE
- Uni
vers
e: P
erso
ns (D
ata
Set:
1990
Sum
mar
y Ta
pe F
ile 1
(STF
1) -
100
-Per
cent
dat
a).
P4. H
ISPA
NIC
OR
LAT
INO
, AN
D N
OT
HIS
PAN
IC O
R L
ATIN
O B
Y R
ACE
[73]
- U
nive
rse:
Tot
al p
opul
atio
n (D
ata
Set:
Cen
sus
2000
Sum
mar
y Fi
le 1
(SF
1) 1
00-P
erce
nt D
ata)
.R
evis
ed: M
arch
201
2. N
o up
date
s.
http
://fa
ctfin
der2
.cen
sus.
gov
9
1 In c
ombi
natio
n w
ith o
ne o
r mor
e ot
her r
aces
list
ed.
The
sum
may
be
grea
ter t
han
the
tota
l pop
ulat
ion
and
perc
enta
ge m
ay a
dd to
to m
ore
than
100
% b
ecau
se in
divi
dual
s m
ay re
port
mor
e th
an o
ne ra
ce.
New
Mex
ico
Popu
latio
n C
ompa
rison
sby
His
pani
c O
rigin
and
Rac
e, 1
990
and
2000
Sour
ce: U
.S. C
ensu
s Bu
reau
, 199
0 C
ensu
s a
nd C
ensu
s 20
00.
This
tabl
e sh
ows
the
diffe
renc
e be
twee
n th
e po
pula
tion
by ra
ce in
199
0 an
d th
e po
pula
tion
by ra
ce in
200
0. B
ecau
se in
divi
dual
s co
uld
repo
rt on
ly
one
race
in 1
990
and
coul
d re
port
mor
e th
an o
ne r
ace
in 2
000,
the
rac
e da
ta f
or 1
990
and
2000
are
not
dire
ctly
com
para
ble.
U
.S.
Cen
sus
Bure
au g
uide
lines
sug
gest
a "
min
imum
-max
imum
" ra
nge
appr
oach
for
ana
lyzi
ng c
hang
e in
pop
ulat
ion
for
indi
vidu
al r
aces
. T
he m
inim
um
incr
ease
for a
race
cat
egor
y is
the
com
paris
on o
f a 1
990
cate
gory
with
the
2000
sin
gle
race
resp
onse
s, o
r "R
ace
Alo
ne."
The
max
imum
incr
ease
fo
r a ra
ce c
ateg
ory
is th
e co
mpa
rison
of a
199
0 ca
tego
ry th
e w
ith 2
000
sing
le a
nd m
ultip
le ra
ce re
spon
ses
to th
e sa
me
cate
gory
, or "
Rac
e A
lone
or
in C
ombi
natio
n." F
or e
xam
ple,
the
non-
His
pani
c N
ativ
e Am
eric
an p
opul
atio
n gr
ew b
y a
min
imum
of 2
6.1%
and
a m
axim
um o
f 35.
1% b
etw
een
1990
and
200
0.
2000
2009
TOTA
L1,
819,
017
1,82
1,20
42,
036,
802
2,05
9,17
92,
065,
932
.One
Rac
e1,
793,
606
1,79
4,55
81,
992,
889
2,01
3,27
32,
019,
716
..Whi
te1,
553,
005
1,55
4,65
61,
705,
476
1,72
0,99
21,
726,
766
..Bla
ck38
,433
39,2
5348
,866
49,0
0649
,140
..AIA
N17
8,87
017
6,87
920
5,05
920
8,89
020
9,28
7..A
sian
21,1
8621
,462
30,2
3831
,253
31,3
84..N
HP
I2,
112
2,30
83,
250
3,13
23,
139
.Tw
o or
Mor
e R
aces
25,4
1126
,646
43,9
1345
,906
46,2
16.N
OT
HIS
PAN
IC1,
053,
611
1,05
4,71
11,
103,
400
1,10
5,77
61,
106,
518
..One
Rac
e1,
034,
926
1,03
3,92
01,
074,
758
1,07
8,04
31,
078,
488
...W
hite
821,
372
820,
143
836,
116
838,
173
838,
154
...B
lack
31,2
3131
,808
36,4
8935
,906
35,9
66...
AIA
N16
2,45
816
1,35
617
4,23
617
6,02
117
6,29
4...
Asi
an18
,825
19,2
1326
,278
26,6
7626
,801
...N
HP
I1,
040
1,40
01,
639
1,26
71,
273
..Tw
o or
Mor
e R
aces
18,6
8520
,791
28,6
4227
,733
28,0
30.H
ISPA
NIC
765,
406
766,
493
933,
402
953,
403
959,
414
..One
Rac
e75
8,68
076
0,63
891
8,13
193
5,23
094
1,22
8...
Whi
te73
1,63
373
4,51
386
9,36
088
2,81
988
8,61
2...
Bla
ck7,
202
7,44
512
,377
13,1
0013
,174
...A
IAN
16,4
1215
,523
30,8
2332
,869
32,9
93...
Asi
an2,
361
2,24
93,
960
4,57
74,
583
...N
HP
I1,
072
908
1,61
11,
865
1,86
6..T
wo
or M
ore
Rac
es6,
726
5,85
515
,271
18,1
7318
,186
Rev
ised
: Mar
ch 2
012.
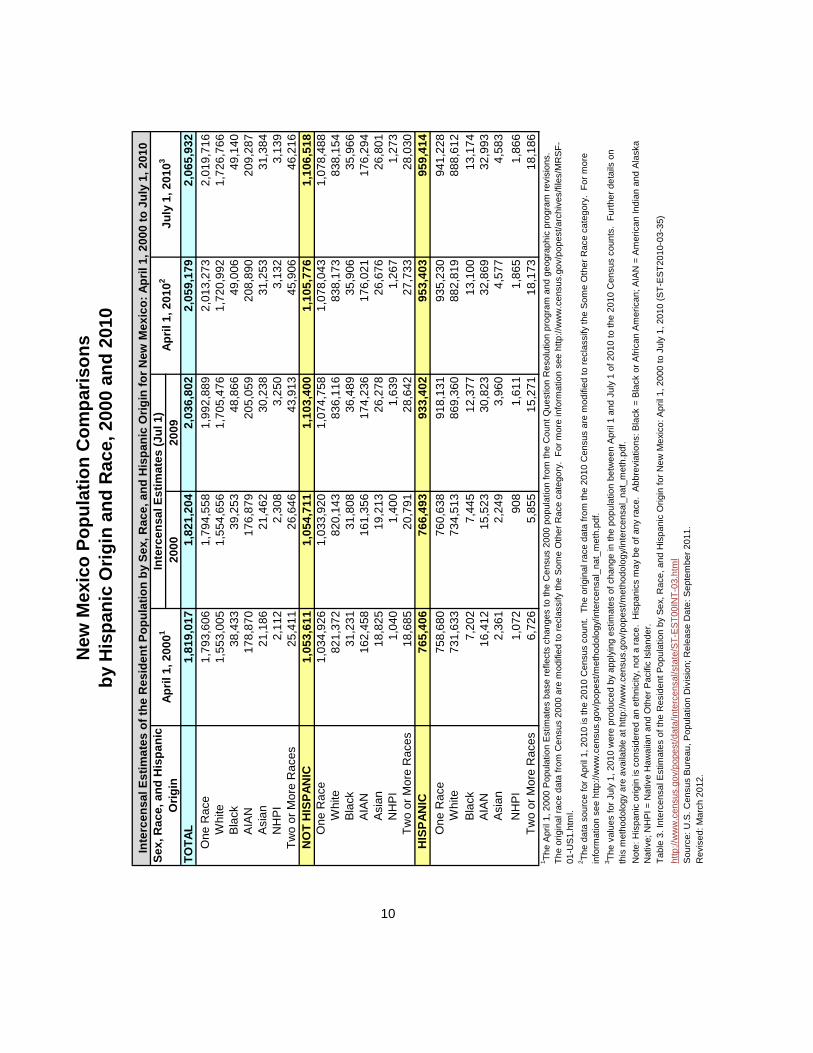
New
Mex
ico
Popu
latio
n C
ompa
rison
sby
His
pani
c O
rigin
and
Rac
e, 2
000
and
2010
Inte
rcen
sal E
stim
ates
of t
he R
esid
ent P
opul
atio
n by
Sex
, Rac
e, a
nd H
ispa
nic
Orig
in fo
r New
Mex
ico:
Apr
il 1,
200
0 to
Jul
y 1,
201
0
Sou
rce:
U.S
. Cen
sus
Bur
eau,
Pop
ulat
ion
Div
isio
n; R
elea
se D
ate:
Sep
tem
ber 2
011.
10
1 The
Apr
il 1,
200
0 P
opul
atio
n E
stim
ates
bas
e re
flect
s ch
ange
s to
the
Cen
sus
2000
pop
ulat
ion
from
the
Cou
nt Q
uest
ion
Res
olut
ion
prog
ram
and
geo
grap
hic
prog
ram
revi
sion
s.
The
orig
inal
race
dat
a fro
m C
ensu
s 20
00 a
re m
odifi
ed to
recl
assi
fy th
e S
ome
Oth
er R
ace
cate
gory
. Fo
r mor
e in
form
atio
n se
e ht
tp://
ww
w.c
ensu
s.go
v/po
pest
/arc
hive
s/fil
es/M
RS
F-01
-US
1.ht
ml.
2 The
data
sou
rce
for A
pril
1, 2
010
is th
e 20
10 C
ensu
s co
unt.
The
orig
inal
race
dat
a fro
m th
e 20
10 C
ensu
s ar
e m
odifi
ed to
recl
assi
fy th
e S
ome
Oth
er R
ace
cate
gory
. Fo
r mor
e in
form
atio
n se
e ht
tp://
ww
w.c
ensu
s.go
v/po
pest
/met
hodo
logy
/inte
rcen
sal_
nat_
met
h.pd
f.3 Th
e va
lues
for J
uly
1, 2
010
wer
e pr
oduc
ed b
y ap
plyi
ng e
stim
ates
of c
hang
e in
the
popu
latio
n be
twee
n A
pril
1 an
d Ju
ly 1
of 2
010
to th
e 20
10 C
ensu
s co
unts
. Fu
rther
det
ails
on
this
met
hodo
logy
are
ava
ilabl
e at
http
://w
ww
.cen
sus.
gov/
pope
st/m
etho
dolo
gy/in
terc
ensa
l_na
t_m
eth.
pdf.
Not
e: H
ispa
nic
orig
in is
con
side
red
an e
thni
city
, not
a ra
ce.
His
pani
cs m
ay b
e of
any
race
. A
bbre
viat
ions
: Bla
ck =
Bla
ck o
r Afri
can
Am
eric
an; A
IAN
= A
mer
ican
Indi
an a
nd A
lask
a N
ativ
e; N
HP
I = N
ativ
e H
awai
ian
and
Oth
er P
acifi
c Is
land
er.
Tabl
e 3.
Inte
rcen
sal E
stim
ates
of t
he R
esid
ent P
opul
atio
n by
Sex
, Rac
e, a
nd H
ispa
nic
Orig
in fo
r New
Mex
ico:
Apr
il 1,
200
0 to
Jul
y 1,
201
0 (S
T-E
ST2
010-
03-3
5)ht
tp://
ww
w.c
ensu
s.go
v/po
pest
/dat
a/in
terc
ensa
l/sta
te/S
T-E
ST0
0IN
T-03
.htm
l
Sex,
Rac
e, a
nd H
ispa
nic
Orig
inAp
ril 1
, 200
01Ap
ril 1
, 201
02Ju
ly 1
, 201
03In
terc
ensa
l Est
imat
es (J
ul 1
)
Tota
lW
hite
Pe
rcen
tBl
ack
orPe
rcen
tAm
eric
anPe
rcen
tAs
ian
Perc
ent
Nat
ive
Perc
ent
Mor
e Th
anPe
rcen
tH
ispa
nic
Perc
ent
Popu
latio
nO
nly
of
Afric
anof
In
dian
/of
O
nly
of
Haw
aiia
nof
O
ne R
ace
of
or L
atin
oof
To
tal
Amer
ican
Tota
lAK
Nat
ive
Tota
lTo
tal
Onl
yTo
tal
Tota
lAl
lTo
tal
Onl
yO
nly
Rac
es
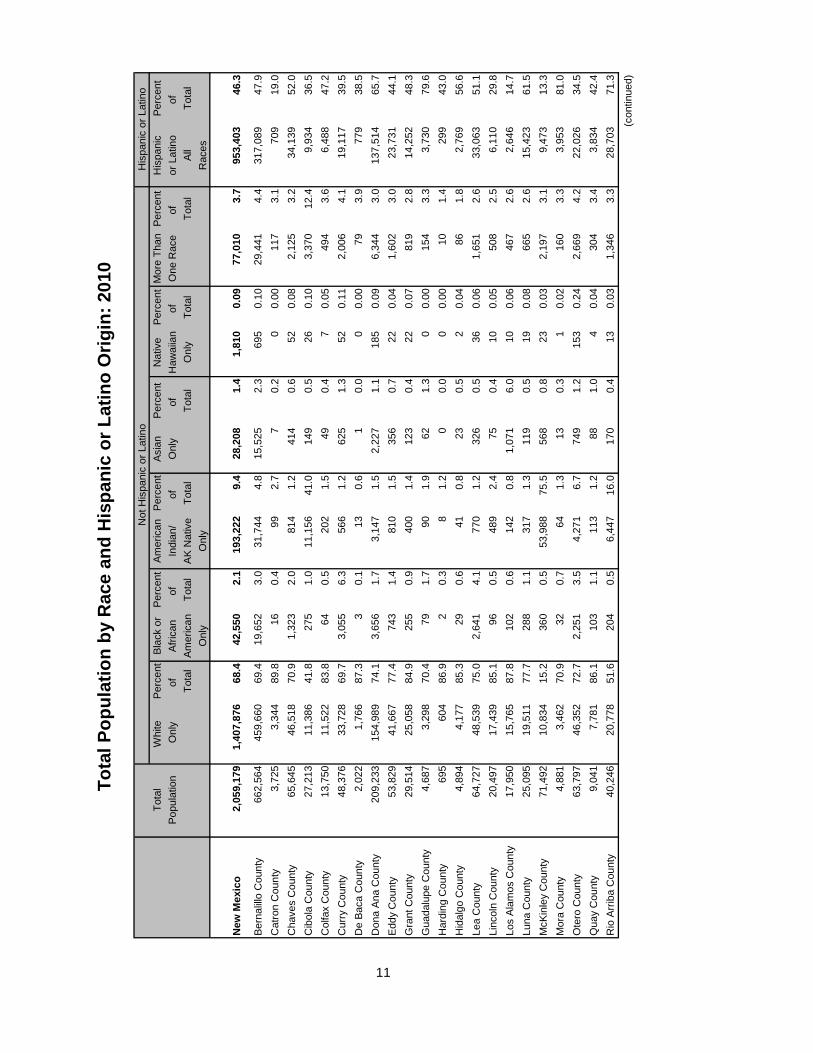
New
Mex
ico
2,05
9,17
91,
407,
876
68.4
42,5
502.
119
3,22
29.
428
,208
1.4
1,81
00.
0977
,010
3.7
953,
403
46.3
Bern
alillo
Cou
nty
662,
564
459,
660
69.4
19,6
523.
031
,744
4.8
15,5
252.
369
50.
1029
,441
4.4
317,
089
47.9
Cat
ron
Cou
nty
3,72
53,
344
89.8
160.
499
2.7
70.
20
0.00
117
3.1
709
19.0
Cha
ves
Cou
nty
65,6
4546
,518
70.9
1,32
32.
081
41.
241
40.
652
0.08
2,12
53.
234
,139
52.0
Cib
ola
Cou
nty
27,2
1311
,386
41.8
275
1.0
11,1
5641
.014
90.
526
0.10
3,37
012
.49,
934
36.5
Col
fax
Cou
nty
13,7
5011
,522
83.8
640.
520
21.
549
0.4
70.
0549
43.
66,
488
47.2
Cur
ry C
ount
y48
,376
33,7
2869
.73,
055
6.3
566
1.2
625
1.3
520.
112,
006
4.1
19,1
1739
.5D
e Ba
ca C
ount
y2,
022
1,76
687
.33
0.1
130.
61
0.0
00.
0079
3.9
779
38.5
Don
a An
a C
ount
y20
9,23
315
4,98
974
.13,
656
1.7
3,14
71.
52,
227
1.1
185
0.09
6,34
43.
013
7,51
465
.7Ed
dy C
ount
y53
,829
41,6
6777
.474
31.
481
01.
535
60.
722
0.04
1,60
23.
023
,731
44.1
Gra
nt C
ount
y29
,514
25,0
5884
.925
50.
940
01.
412
30.
422
0.07
819
2.8
14,2
5248
.3G
uada
lupe
Cou
nty
4,68
73,
298
70.4
791.
790
1.9
621.
30
0.00
154
3.3
3,73
079
.6H
ardi
ng C
ount
y69
560
486
.92
0.3
81.
20
0.0
00.
0010
1.4
299
43.0
Hid
algo
Cou
nty
4,89
44,
177
85.3
290.
641
0.8
230.
52
0.04
861.
82,
769
56.6
Lea
Cou
nty
64,7
2748
,539
75.0
2,64
14.
177
01.
232
60.
536
0.06
1,65
12.
633
,063
51.1
Linc
oln
Cou
nty
20,4
9717
,439
85.1
960.
548
92.
475
0.4
100.
0550
82.
56,
110
29.8
Los
Alam
os C
ount
y17
,950
15,7
6587
.810
20.
614
20.
81,
071
6.0
100.
0646
72.
62,
646
14.7
Luna
Cou
nty
25,0
9519
,511
77.7
288
1.1
317
1.3
119
0.5
190.
0866
52.
615
,423
61.5
McK
inle
y C
ount
y71
,492
10,8
3415
.236
00.
553
,988
75.5
568
0.8
230.
032,
197
3.1
9,47
313
.3M
ora
Cou
nty
4,88
13,
462
70.9
320.
764
1.3
130.
31
0.02
160
3.3
3,95
381
.0O
tero
Cou
nty
63,7
9746
,352
72.7
2,25
13.
54,
271
6.7
749
1.2
153
0.24
2,66
94.
222
,026
34.5
Qua
y C
ount
y9,
041
7,78
186
.110
31.
111
31.
288
1.0
40.
0430
43.
43,
834
42.4
Rio
Arr
iba
Cou
nty
40,2
4620
,778
51.6
204
0.5
6,44
716
.017
00.
413
0.03
1,34
63.
328
,703
71.3
Not
His
pani
c or
Lat
ino
His
pani
c or
Lat
ino
Tota
l Pop
ulat
ion
by R
ace
and
His
pani
c or
Lat
ino
Orig
in: 2
010
11
(con
tinue
d)
Tota
lW
hite
Pe
rcen
tBl
ack
orPe
rcen
tAm
eric
anPe
rcen
tAs
ian
Perc
ent
Nat
ive
Perc
ent
Mor
e Th
anPe
rcen
tH
ispa
nic
Perc
ent
Popu
latio
nO
nly
of
Afric
anof
In
dian
/of
O
nly
of
Haw
aiia
nof
O
ne R
ace
of
or L
atin
oof
To
tal
Amer
ican
Tota
lAK
Nat
ive
Tota
lTo
tal
Onl
yTo
tal
Tota
lAl
lTo
tal
Onl
yO
nly
Rac
es
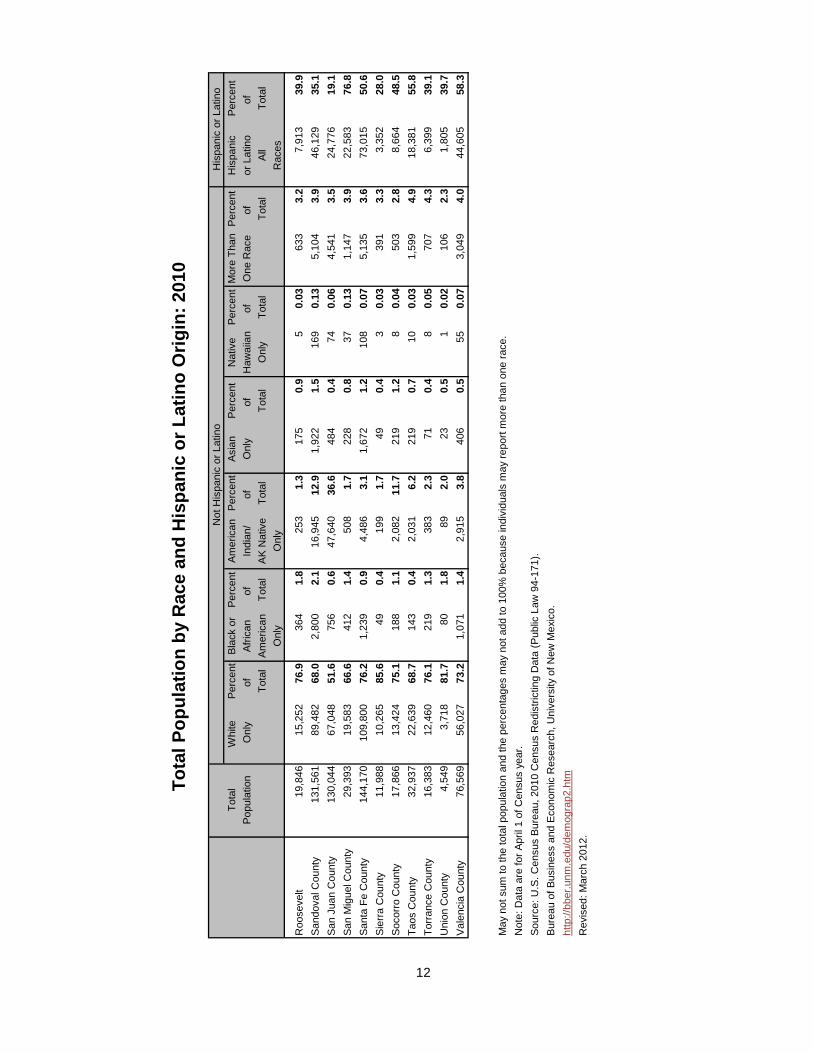
Roo
seve
lt19
,846
15,2
5276
.936
41.
825
31.
317
50.
95
0.03
633
3.2
7,91
339
.9Sa
ndov
al C
ount
y13
1,56
189
,482
68.0
2,80
02.
116
,945
12.9
1,92
21.
516
90.
135,
104
3.9
46,1
2935
.1Sa
n Ju
an C
ount
y13
0,04
467
,048
51.6
756
0.6
47,6
4036
.648
40.
474
0.06
4,54
13.
524
,776
19.1
San
Mig
uel C
ount
y29
,393
19,5
8366
.641
21.
450
81.
722
80.
837
0.13
1,14
73.
922
,583
76.8
Sant
a Fe
Cou
nty
144,
170
109,
800
76.2
1,23
90.
94,
486
3.1
1,67
21.
210
80.
075,
135
3.6
73,0
1550
.6Si
erra
Cou
nty
11,9
8810
,265
85.6
490.
419
91.
749
0.4
30.
0339
13.
33,
352
28.0
Soco
rro
Cou
nty
17,8
6613
,424
75.1
188
1.1
2,08
211
.721
91.
28
0.04
503
2.8
8,66
448
.5Ta
os C
ount
y32
,937
22,6
3968
.714
30.
42,
031
6.2
219
0.7
100.
031,
599
4.9
18,3
8155
.8To
rran
ce C
ount
y16
,383
12,4
6076
.121
91.
338
32.
371
0.4
80.
0570
74.
36,
399
39.1
Uni
on C
ount
y4,
549
3,71
881
.780
1.8
892.
023
0.5
10.
0210
62.
31,
805
39.7
Vale
ncia
Cou
nty
76,5
6956
,027
73.2
1,07
11.
42,
915
3.8
406
0.5
550.
073,
049
4.0
44,6
0558
.3
May
not
sum
to th
e to
tal p
opul
atio
n an
d th
e pe
rcen
tage
s m
ay n
ot a
dd to
100
% b
ecau
se in
divi
dual
s m
ay re
port
mor
e th
an o
ne ra
ce.
Not
e: D
ata
are
for A
pril
1 of
Cen
sus
year
.
http
://bb
er.u
nm.e
du/d
emog
rap2
.htm
Rev
ised
: Mar
ch 2
012.
Tota
l Pop
ulat
ion
by R
ace
and
His
pani
c or
Lat
ino
Orig
in: 2
010
Not
His
pani
c or
Lat
ino
His
pani
c or
Lat
ino
12
Bure
au o
f Bus
ines
s an
d Ec
onom
ic R
esea
rch,
Uni
vers
ity o
f New
Mex
ico.
Sour
ce: U
.S. C
ensu
s Bu
reau
, 201
0 C
ensu
s R
edis
trict
ing
Dat
a (P
ublic
Law
94-
171)
.
13
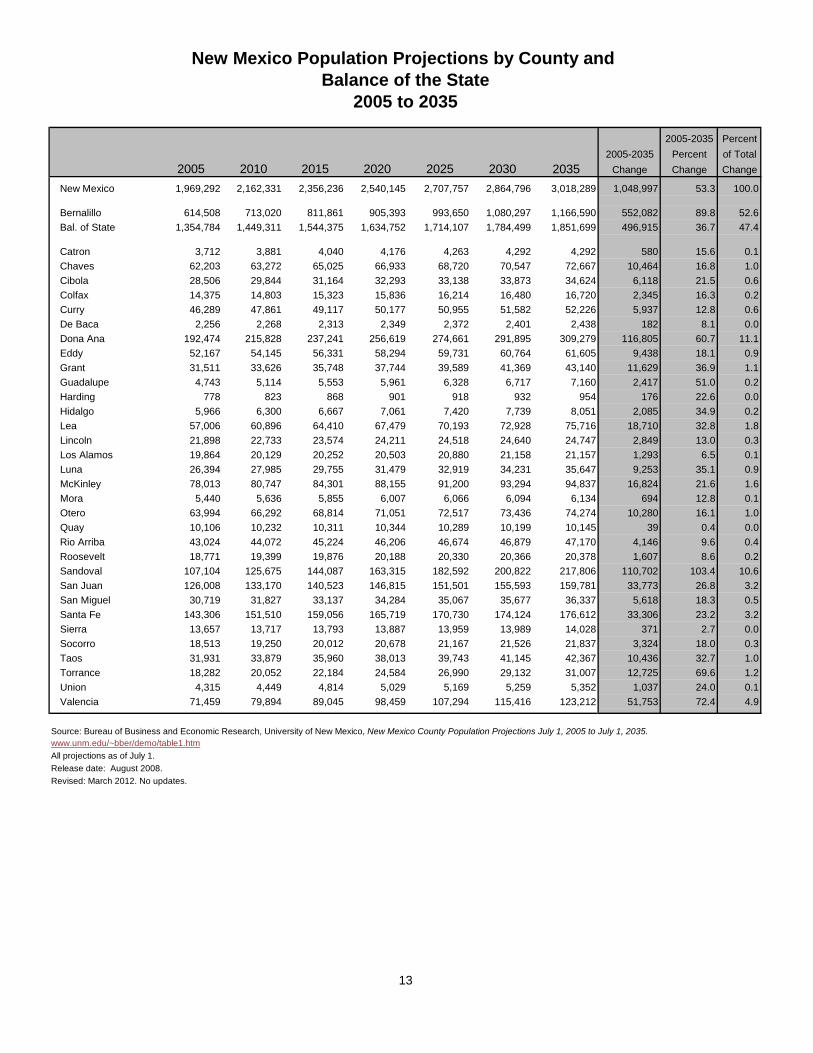
2005-2035 Percent2005-2035 Percent of Total
2005 2010 2015 2020 2025 2030 2035 Change Change Change
New Mexico 1,969,292 2,162,331 2,356,236 2,540,145 2,707,757 2,864,796 3,018,289 1,048,997 53.3 100.0
Bernalillo 614,508 713,020 811,861 905,393 993,650 1,080,297 1,166,590 552,082 89.8 52.6Bal. of State 1,354,784 1,449,311 1,544,375 1,634,752 1,714,107 1,784,499 1,851,699 496,915 36.7 47.4
Catron 3,712 3,881 4,040 4,176 4,263 4,292 4,292 580 15.6 0.1Chaves 62,203 63,272 65,025 66,933 68,720 70,547 72,667 10,464 16.8 1.0Cibola 28,506 29,844 31,164 32,293 33,138 33,873 34,624 6,118 21.5 0.6Colfax 14,375 14,803 15,323 15,836 16,214 16,480 16,720 2,345 16.3 0.2Curry 46,289 47,861 49,117 50,177 50,955 51,582 52,226 5,937 12.8 0.6De Baca 2,256 2,268 2,313 2,349 2,372 2,401 2,438 182 8.1 0.0Dona Ana 192,474 215,828 237,241 256,619 274,661 291,895 309,279 116,805 60.7 11.1Eddy 52,167 54,145 56,331 58,294 59,731 60,764 61,605 9,438 18.1 0.9Grant 31,511 33,626 35,748 37,744 39,589 41,369 43,140 11,629 36.9 1.1Guadalupe 4,743 5,114 5,553 5,961 6,328 6,717 7,160 2,417 51.0 0.2Harding 778 823 868 901 918 932 954 176 22.6 0.0Hidalgo 5,966 6,300 6,667 7,061 7,420 7,739 8,051 2,085 34.9 0.2Lea 57,006 60,896 64,410 67,479 70,193 72,928 75,716 18,710 32.8 1.8Lincoln 21,898 22,733 23,574 24,211 24,518 24,640 24,747 2,849 13.0 0.3Los Alamos 19,864 20,129 20,252 20,503 20,880 21,158 21,157 1,293 6.5 0.1Luna 26,394 27,985 29,755 31,479 32,919 34,231 35,647 9,253 35.1 0.9McKinley 78,013 80,747 84,301 88,155 91,200 93,294 94,837 16,824 21.6 1.6Mora 5,440 5,636 5,855 6,007 6,066 6,094 6,134 694 12.8 0.1Otero 63,994 66,292 68,814 71,051 72,517 73,436 74,274 10,280 16.1 1.0Quay 10,106 10,232 10,311 10,344 10,289 10,199 10,145 39 0.4 0.0Rio Arriba 43,024 44,072 45,224 46,206 46,674 46,879 47,170 4,146 9.6 0.4Roosevelt 18,771 19,399 19,876 20,188 20,330 20,366 20,378 1,607 8.6 0.2Sandoval 107,104 125,675 144,087 163,315 182,592 200,822 217,806 110,702 103.4 10.6San Juan 126,008 133,170 140,523 146,815 151,501 155,593 159,781 33,773 26.8 3.2San Miguel 30,719 31,827 33,137 34,284 35,067 35,677 36,337 5,618 18.3 0.5Santa Fe 143,306 151,510 159,056 165,719 170,730 174,124 176,612 33,306 23.2 3.2Sierra 13,657 13,717 13,793 13,887 13,959 13,989 14,028 371 2.7 0.0Socorro 18,513 19,250 20,012 20,678 21,167 21,526 21,837 3,324 18.0 0.3Taos 31,931 33,879 35,960 38,013 39,743 41,145 42,367 10,436 32.7 1.0Torrance 18,282 20,052 22,184 24,584 26,990 29,132 31,007 12,725 69.6 1.2Union 4,315 4,449 4,814 5,029 5,169 5,259 5,352 1,037 24.0 0.1Valencia 71,459 79,894 89,045 98,459 107,294 115,416 123,212 51,753 72.4 4.9
www.unm.edu/~bber/demo/table1.htmAll projections as of July 1.Release date: August 2008.Revised: March 2012. No updates.
New Mexico Population Projections by County and
2005 to 2035Balance of the State
Source: Bureau of Business and Economic Research, University of New Mexico, New Mexico County Population Projections July 1, 2005 to July 1, 2035.
14
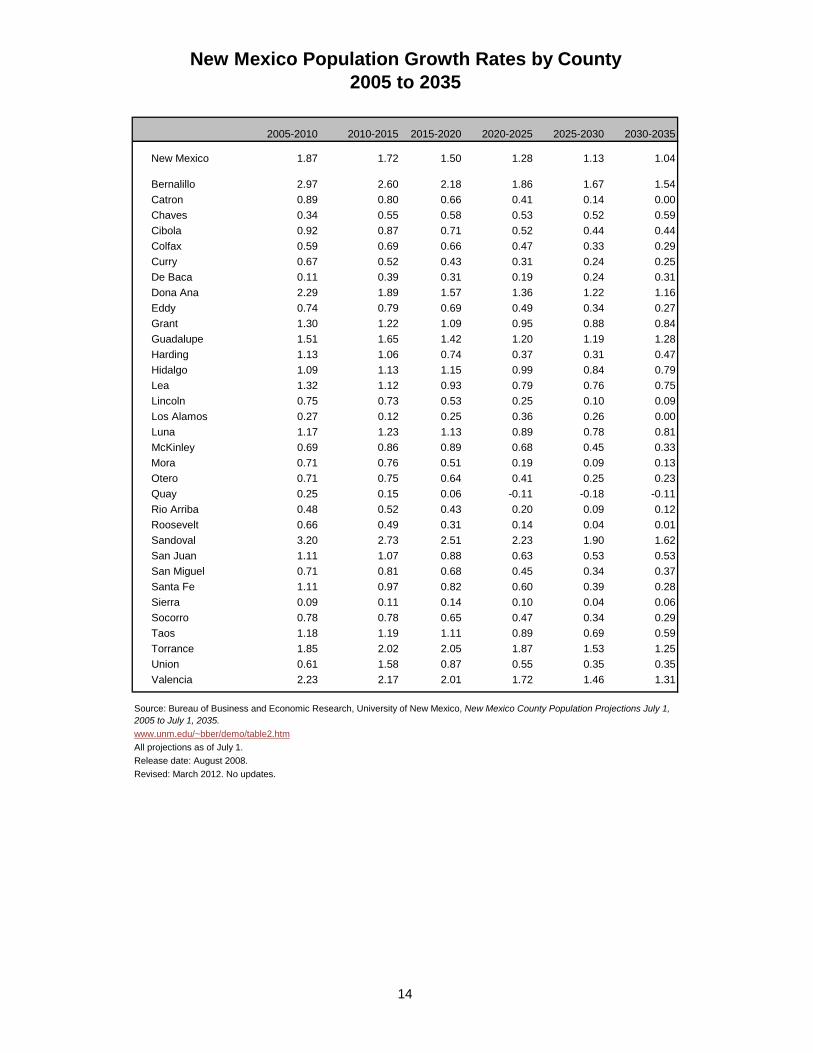
2005-2010 2010-2015 2015-2020 2020-2025 2025-2030 2030-2035
New Mexico 1.87 1.72 1.50 1.28 1.13 1.04
Bernalillo 2.97 2.60 2.18 1.86 1.67 1.54Catron 0.89 0.80 0.66 0.41 0.14 0.00Chaves 0.34 0.55 0.58 0.53 0.52 0.59Cibola 0.92 0.87 0.71 0.52 0.44 0.44Colfax 0.59 0.69 0.66 0.47 0.33 0.29Curry 0.67 0.52 0.43 0.31 0.24 0.25De Baca 0.11 0.39 0.31 0.19 0.24 0.31Dona Ana 2.29 1.89 1.57 1.36 1.22 1.16Eddy 0.74 0.79 0.69 0.49 0.34 0.27Grant 1.30 1.22 1.09 0.95 0.88 0.84Guadalupe 1.51 1.65 1.42 1.20 1.19 1.28Harding 1.13 1.06 0.74 0.37 0.31 0.47Hidalgo 1.09 1.13 1.15 0.99 0.84 0.79Lea 1.32 1.12 0.93 0.79 0.76 0.75Lincoln 0.75 0.73 0.53 0.25 0.10 0.09Los Alamos 0.27 0.12 0.25 0.36 0.26 0.00Luna 1.17 1.23 1.13 0.89 0.78 0.81McKinley 0.69 0.86 0.89 0.68 0.45 0.33Mora 0.71 0.76 0.51 0.19 0.09 0.13Otero 0.71 0.75 0.64 0.41 0.25 0.23Quay 0.25 0.15 0.06 -0.11 -0.18 -0.11Rio Arriba 0.48 0.52 0.43 0.20 0.09 0.12Roosevelt 0.66 0.49 0.31 0.14 0.04 0.01Sandoval 3.20 2.73 2.51 2.23 1.90 1.62San Juan 1.11 1.07 0.88 0.63 0.53 0.53San Miguel 0.71 0.81 0.68 0.45 0.34 0.37Santa Fe 1.11 0.97 0.82 0.60 0.39 0.28Sierra 0.09 0.11 0.14 0.10 0.04 0.06Socorro 0.78 0.78 0.65 0.47 0.34 0.29Taos 1.18 1.19 1.11 0.89 0.69 0.59Torrance 1.85 2.02 2.05 1.87 1.53 1.25Union 0.61 1.58 0.87 0.55 0.35 0.35Valencia 2.23 2.17 2.01 1.72 1.46 1.31
www.unm.edu/~bber/demo/table2.htmAll projections as of July 1.Release date: August 2008.Revised: March 2012. No updates.
New Mexico Population Growth Rates by County2005 to 2035
Source: Bureau of Business and Economic Research, University of New Mexico, New Mexico County Population Projections July 1, 2005 to July 1, 2035.
15
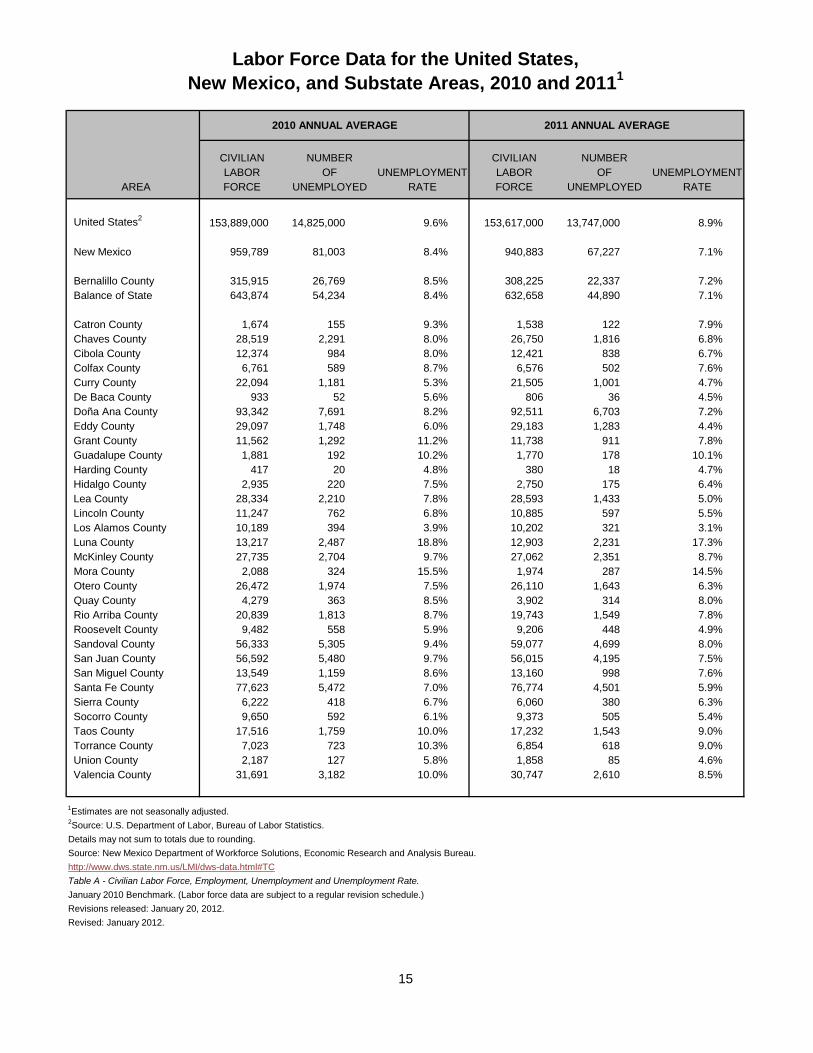
2010 ANNUAL AVERAGE 2011 ANNUAL AVERAGE
CIVILIAN NUMBER CIVILIAN NUMBERLABOR OF UNEMPLOYMENT LABOR OF UNEMPLOYMENT
AREA FORCE UNEMPLOYED RATE FORCE UNEMPLOYED RATE
United States2 153,889,000 14,825,000 9.6% 153,617,000 13,747,000 8.9%
New Mexico 959,789 81,003 8.4% 940,883 67,227 7.1%
Bernalillo County 315,915 26,769 8.5% 308,225 22,337 7.2%Balance of State 643,874 54,234 8.4% 632,658 44,890 7.1%
Catron County 1,674 155 9.3% 1,538 122 7.9%Chaves County 28,519 2,291 8.0% 26,750 1,816 6.8%Cibola County 12,374 984 8.0% 12,421 838 6.7%Colfax County 6,761 589 8.7% 6,576 502 7.6%Curry County 22,094 1,181 5.3% 21,505 1,001 4.7%De Baca County 933 52 5.6% 806 36 4.5%Doña Ana County 93,342 7,691 8.2% 92,511 6,703 7.2%Eddy County 29,097 1,748 6.0% 29,183 1,283 4.4%Grant County 11,562 1,292 11.2% 11,738 911 7.8%Guadalupe County 1,881 192 10.2% 1,770 178 10.1%Harding County 417 20 4.8% 380 18 4.7%Hidalgo County 2,935 220 7.5% 2,750 175 6.4%Lea County 28,334 2,210 7.8% 28,593 1,433 5.0%Lincoln County 11,247 762 6.8% 10,885 597 5.5%Los Alamos County 10,189 394 3.9% 10,202 321 3.1%Luna County 13,217 2,487 18.8% 12,903 2,231 17.3%McKinley County 27,735 2,704 9.7% 27,062 2,351 8.7%Mora County 2,088 324 15.5% 1,974 287 14.5%Otero County 26,472 1,974 7.5% 26,110 1,643 6.3%Quay County 4,279 363 8.5% 3,902 314 8.0%Rio Arriba County 20,839 1,813 8.7% 19,743 1,549 7.8%Roosevelt County 9,482 558 5.9% 9,206 448 4.9%Sandoval County 56,333 5,305 9.4% 59,077 4,699 8.0%San Juan County 56,592 5,480 9.7% 56,015 4,195 7.5%San Miguel County 13,549 1,159 8.6% 13,160 998 7.6%Santa Fe County 77,623 5,472 7.0% 76,774 4,501 5.9%Sierra County 6,222 418 6.7% 6,060 380 6.3%Socorro County 9,650 592 6.1% 9,373 505 5.4%Taos County 17,516 1,759 10.0% 17,232 1,543 9.0%Torrance County 7,023 723 10.3% 6,854 618 9.0%Union County 2,187 127 5.8% 1,858 85 4.6%Valencia County 31,691 3,182 10.0% 30,747 2,610 8.5%
1Estimates are not seasonally adjusted.2Source: U.S. Department of Labor, Bureau of Labor Statistics.Details may not sum to totals due to rounding.Source: New Mexico Department of Workforce Solutions, Economic Research and Analysis Bureau. http://www.dws.state.nm.us/LMI/dws-data.html#TCTable A - Civilian Labor Force, Employment, Unemployment and Unemployment Rate.January 2010 Benchmark. (Labor force data are subject to a regular revision schedule.) Revisions released: January 20, 2012.Revised: January 2012.
Labor Force Data for the United States,New Mexico, and Substate Areas, 2010 and 20111

16
NEW MEXICO
Month Civilian Labor Force Employment Unemployment Unemployment
Rate
2010 January 954,978 870,332 84,646 8.9% February 960,250 874,917 85,333 8.9% March 961,524 874,857 86,670 9.0% April 960,802 882,767 78,035 8.1% May 955,681 879,423 76,258 8.0% June 962,423 880,668 81,755 8.5% July 966,658 880,592 86,066 8.9% August 959,133 878,282 80,851 8.4% September 957,345 881,164 76,181 8.0% October 961,556 881,487 80,069 8.3% November 959,531 881,095 78,436 8.2% December 957,591 879,845 77,746 8.1%2010 Annual Average 959,789 878,785 81,003 8.4%2011 January 944,297 861,105 83,192 8.8% February 951,461 867,264 84,197 8.8% March 939,036 869,497 69,539 7.4% April 941,689 876,668 65,021 6.9% May 935,936 875,301 60,635 6.5% June 942,386 868,801 73,585 7.8% July 941,181 873,109 68,072 7.2% August 934,378 872,274 62,104 6.6% September 933,793 874,107 59,686 6.4% October 938,727 878,227 60,500 6.4% November 943,155 883,859 59,296 6.3% December 944,552 883,655 60,897 6.4%2011 Annual Average 940,883 873,656 67,227 7.1%
ALBUQUERQUE MSA1
Month Civilian Labor Force Employment Unemployment Unemployment Rate
2010 January 409,260 372,745 36,515 8.9% February 410,919 373,980 36,939 9.0% March 412,164 374,466 37,698 9.1% April 412,992 378,768 34,224 8.3% May 410,431 376,539 33,892 8.3% June 411,874 375,319 36,555 8.9% July 413,483 375,114 38,369 9.3% August 408,755 372,199 36,556 8.9% September 408,988 374,101 34,887 8.5% October 411,088 374,576 36,512 8.9% November 411,492 376,226 35,266 8.6% December 410,134 375,781 34,353 8.4%2010 Annual Average 410,965 374,984 35,980 8.8%
2011 January 404,805 368,268 36,537 9.0% February 406,754 369,616 37,138 9.1% March 400,841 369,983 30,858 7.7% April 402,798 373,899 28,899 7.2% May 399,899 372,631 27,268 6.8% June 402,461 369,431 33,030 8.2% July 402,169 371,207 30,962 7.7% August 397,411 368,942 28,469 7.2% September 398,026 370,472 27,554 6.9% October 400,098 372,220 27,878 7.0% November 403,811 376,668 27,143 6.7% December 403,769 376,326 27,443 6.8%2011 Annual Average 401,904 371,639 30,265 7.5%
1Metropolitan Statistical Area - Bernalillo, Sandoval,Torrance, and Valencia counties. Rates not seasonally adjusted.Source: New Mexico Department of Workforce Solutions, Economic Research and Analysis Bureau.www.dws.state.nm.us/LMI/dws-data.html#TATable A - Civilian Labor Force, Employment, Unemployment and Unemployment Rate.January 2010 Benchmark. (Labor force data are subject to a regular revision schedule.) Revisions released: January 20, 2012.
New Mexico and Albuquerque MSACivilian Labor Force Estimates for 2010 and 2011
17
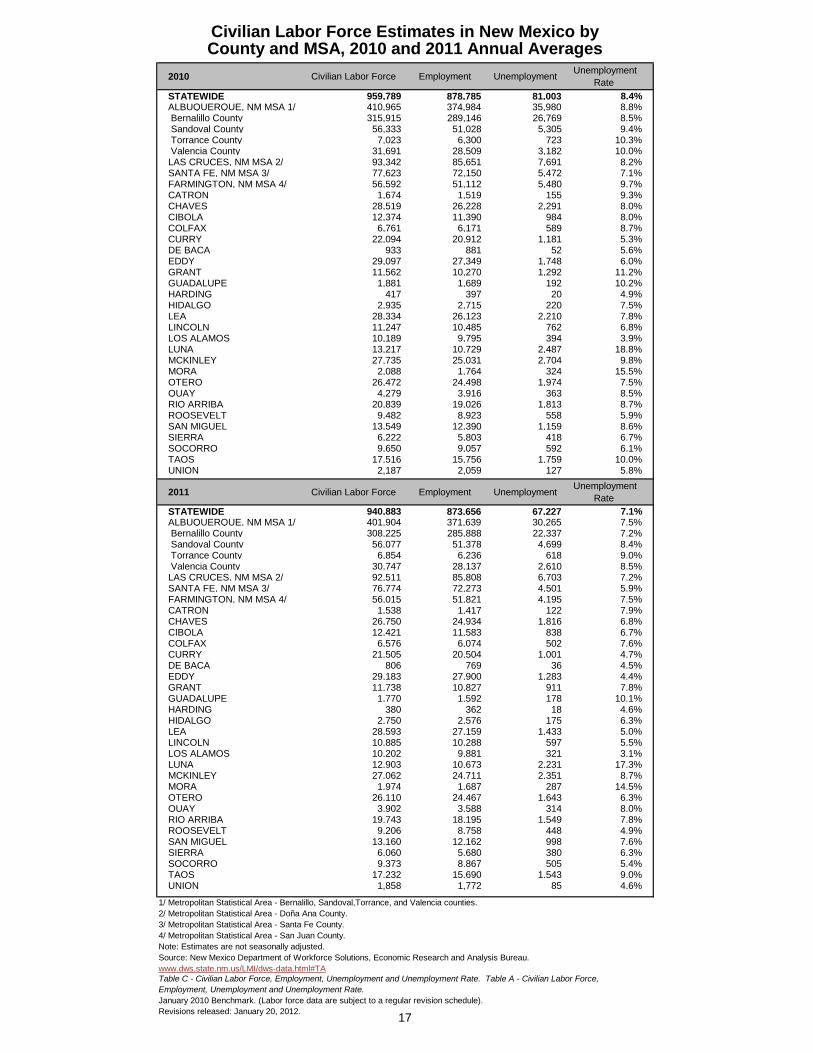
2010 Civilian Labor Force Employment Unemployment Unemployment Rate
STATEWIDE 959,789 878,785 81,003 8.4%ALBUQUERQUE, NM MSA 1/ 410,965 374,984 35,980 8.8% Bernalillo County 315,915 289,146 26,769 8.5% Sandoval County 56,333 51,028 5,305 9.4% Torrance County 7,023 6,300 723 10.3% Valencia County 31,691 28,509 3,182 10.0%LAS CRUCES, NM MSA 2/ 93,342 85,651 7,691 8.2%SANTA FE, NM MSA 3/ 77,623 72,150 5,472 7.1%FARMINGTON, NM MSA 4/ 56,592 51,112 5,480 9.7%CATRON 1,674 1,519 155 9.3%CHAVES 28,519 26,228 2,291 8.0%CIBOLA 12,374 11,390 984 8.0%COLFAX 6,761 6,171 589 8.7%CURRY 22,094 20,912 1,181 5.3%DE BACA 933 881 52 5.6%EDDY 29,097 27,349 1,748 6.0%GRANT 11,562 10,270 1,292 11.2%GUADALUPE 1,881 1,689 192 10.2%HARDING 417 397 20 4.9%HIDALGO 2,935 2,715 220 7.5%LEA 28,334 26,123 2,210 7.8%LINCOLN 11,247 10,485 762 6.8%LOS ALAMOS 10,189 9,795 394 3.9%LUNA 13,217 10,729 2,487 18.8%MCKINLEY 27,735 25,031 2,704 9.8%MORA 2,088 1,764 324 15.5%OTERO 26,472 24,498 1,974 7.5%QUAY 4,279 3,916 363 8.5%RIO ARRIBA 20,839 19,026 1,813 8.7%ROOSEVELT 9,482 8,923 558 5.9%SAN MIGUEL 13,549 12,390 1,159 8.6%SIERRA 6,222 5,803 418 6.7%SOCORRO 9,650 9,057 592 6.1%TAOS 17,516 15,756 1,759 10.0%UNION 2,187 2,059 127 5.8%
2011 Civilian Labor Force Employment Unemployment Unemployment Rate
STATEWIDE 940,883 873,656 67,227 7.1%ALBUQUERQUE, NM MSA 1/ 401,904 371,639 30,265 7.5% Bernalillo County 308,225 285,888 22,337 7.2% Sandoval County 56,077 51,378 4,699 8.4% Torrance County 6,854 6,236 618 9.0% Valencia County 30,747 28,137 2,610 8.5%LAS CRUCES, NM MSA 2/ 92,511 85,808 6,703 7.2%SANTA FE, NM MSA 3/ 76,774 72,273 4,501 5.9%FARMINGTON, NM MSA 4/ 56,015 51,821 4,195 7.5%CATRON 1,538 1,417 122 7.9%CHAVES 26,750 24,934 1,816 6.8%CIBOLA 12,421 11,583 838 6.7%COLFAX 6,576 6,074 502 7.6%CURRY 21,505 20,504 1,001 4.7%DE BACA 806 769 36 4.5%EDDY 29,183 27,900 1,283 4.4%GRANT 11,738 10,827 911 7.8%GUADALUPE 1,770 1,592 178 10.1%HARDING 380 362 18 4.6%HIDALGO 2,750 2,576 175 6.3%LEA 28,593 27,159 1,433 5.0%LINCOLN 10,885 10,288 597 5.5%LOS ALAMOS 10,202 9,881 321 3.1%LUNA 12,903 10,673 2,231 17.3%MCKINLEY 27,062 24,711 2,351 8.7%MORA 1,974 1,687 287 14.5%OTERO 26,110 24,467 1,643 6.3%QUAY 3,902 3,588 314 8.0%RIO ARRIBA 19,743 18,195 1,549 7.8%ROOSEVELT 9,206 8,758 448 4.9%SAN MIGUEL 13,160 12,162 998 7.6%SIERRA 6,060 5,680 380 6.3%SOCORRO 9,373 8,867 505 5.4%TAOS 17,232 15,690 1,543 9.0%UNION 1,858 1,772 85 4.6%
1/ Metropolitan Statistical Area - Bernalillo, Sandoval,Torrance, and Valencia counties. 2/ Metropolitan Statistical Area - Doña Ana County. 3/ Metropolitan Statistical Area - Santa Fe County. 4/ Metropolitan Statistical Area - San Juan County. Note: Estimates are not seasonally adjusted.Source: New Mexico Department of Workforce Solutions, Economic Research and Analysis Bureau. www.dws.state.nm.us/LMI/dws-data.html#TA
January 2010 Benchmark. (Labor force data are subject to a regular revision schedule). Revisions released: January 20, 2012.
Table C - Civilian Labor Force, Employment, Unemployment and Unemployment Rate. Table A - Civilian Labor Force, Employment, Unemployment and Unemployment Rate.
Civilian Labor Force Estimates in New Mexico byCounty and MSA, 2010 and 2011 Annual Averages

18
December 2010 December 2011P
Rank State Rate Rate Change1 NEVADA 14.9 12.6 -2.32 FLORIDA 12.0 9.9 -2.13 NEW MEXICO 8.6 6.6 -2.04 MICHIGAN 11.1 9.3 -1.84 WEST VIRGINIA 9.7 7.9 -1.86 OREGON 10.6 8.9 -1.77 MISSOURI 9.6 8.0 -1.68 MASSACHUSETTS 8.3 6.8 -1.58 UTAH 7.5 6.0 -1.5
10 CALIFORNIA 12.5 11.1 -1.410 OHIO 9.5 8.1 -1.410 SOUTH CAROLINA 10.9 9.5 -1.413 IDAHO 9.7 8.4 -1.314 KENTUCKY 10.3 9.1 -1.214 MINNESOTA 6.9 5.7 -1.216 DELAWARE 8.5 7.4 -1.117 ALABAMA 9.1 8.1 -1.017 COLORADO 8.9 7.9 -1.019 ARIZONA 9.6 8.7 -0.919 LOUISIANA 7.7 6.8 -0.919 PENNSYLVANIA 8.5 7.6 -0.922 CONNECTICUT 9.0 8.2 -0.822 WASHINGTON 9.3 8.5 -0.824 GEORGIA 10.4 9.7 -0.724 TENNESSEE 9.4 8.7 -0.724 MARYLAND 7.4 6.7 -0.724 OKLAHOMA 6.8 6.1 -0.724 VERMONT 5.8 5.1 -0.724 RHODE ISLAND 11.5 10.8 -0.730 ALASKA 7.9 7.3 -0.630 MONTANA 7.4 6.8 -0.630 WYOMING 6.4 5.8 -0.633 TEXAS 8.3 7.8 -0.533 INDIANA 9.5 9.0 -0.533 IOWA 6.1 5.6 -0.533 KANSAS 6.8 6.3 -0.533 MAINE 7.5 7.0 -0.533 NEW HAMPSHIRE 5.6 5.1 -0.533 NORTH DAKOTA 3.8 3.3 -0.533 SOUTH DAKOTA 4.7 4.2 -0.541 WISCONSIN 7.5 7.1 -0.441 VIRGINIA 6.6 6.2 -0.443 ARKANSAS 7.9 7.7 -0.243 NEBRASKA 4.3 4.1 -0.243 NEW YORK 8.2 8.0 -0.246 NEW JERSEY 9.1 9.0 -0.147 NORTH CAROLINA 9.8 9.9 0.148 MISSISSIPPI 10.2 10.4 0.249 HAWAII 6.3 6.6 0.350 ILLINOIS 9.2 9.8 0.651 DISTRICT OF COLUMBIA 9.6 10.4 0.8
Rates shown are a percentage of the labor force.Data refer to place of residence.
Source: U.S. Department of Labor, Bureau of Labor Statistics, Over the Year Change in Unemployment Rates for States.www.bls.gov/web/laumstch.htmRelease date: January 24, 2012.Revised: January 2012.
Over-the-Year Change in Unemployment Rates for StatesSeasonally Adjusted
Estimates for the latest month are subject to revision the following month.
PPreliminary.
19
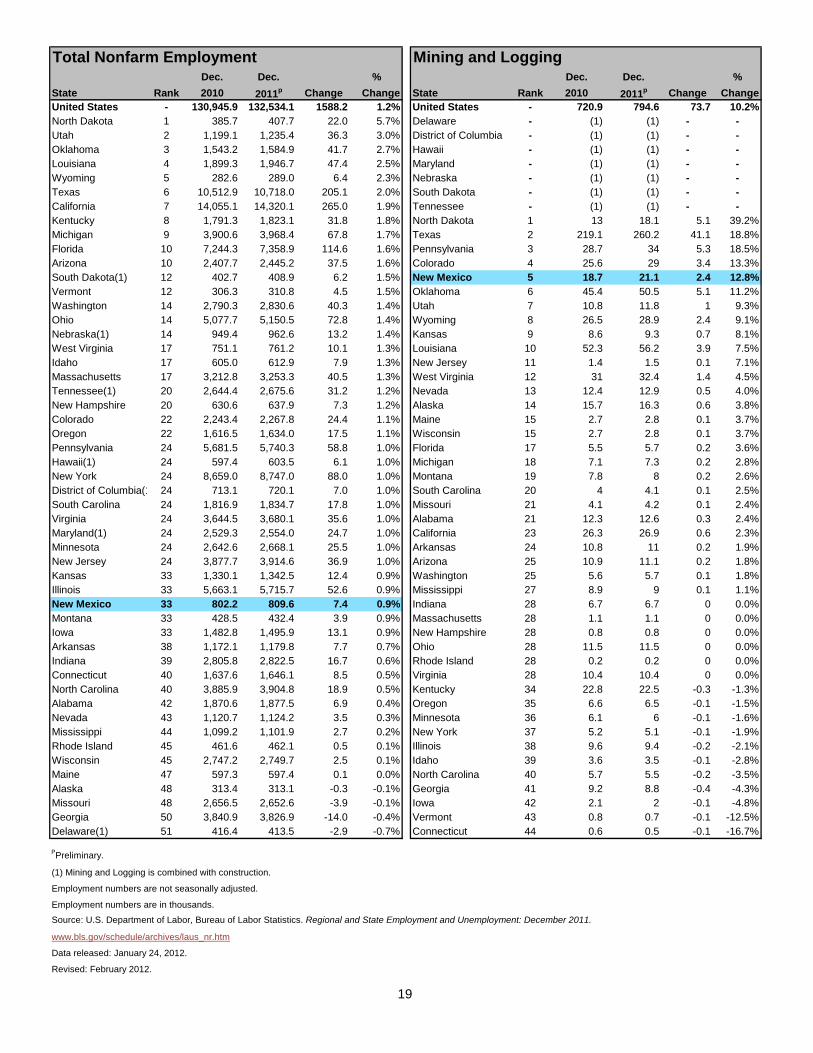
Dec. Dec. % Dec. Dec. %State Rank 2010 2011p Change Change State Rank 2010 2011p Change ChangeUnited States - 130,945.9 132,534.1 1588.2 1.2% United States - 720.9 794.6 73.7 10.2%North Dakota 1 385.7 407.7 22.0 5.7% Delaware - (1) (1) - -Utah 2 1,199.1 1,235.4 36.3 3.0% District of Columbia - (1) (1) - -Oklahoma 3 1,543.2 1,584.9 41.7 2.7% Hawaii - (1) (1) - -Louisiana 4 1,899.3 1,946.7 47.4 2.5% Maryland - (1) (1) - -Wyoming 5 282.6 289.0 6.4 2.3% Nebraska - (1) (1) - -Texas 6 10,512.9 10,718.0 205.1 2.0% South Dakota - (1) (1) - -California 7 14,055.1 14,320.1 265.0 1.9% Tennessee - (1) (1) - -Kentucky 8 1,791.3 1,823.1 31.8 1.8% North Dakota 1 13 18.1 5.1 39.2%Michigan 9 3,900.6 3,968.4 67.8 1.7% Texas 2 219.1 260.2 41.1 18.8%Florida 10 7,244.3 7,358.9 114.6 1.6% Pennsylvania 3 28.7 34 5.3 18.5%Arizona 10 2,407.7 2,445.2 37.5 1.6% Colorado 4 25.6 29 3.4 13.3%South Dakota(1) 12 402.7 408.9 6.2 1.5% New Mexico 5 18.7 21.1 2.4 12.8%Vermont 12 306.3 310.8 4.5 1.5% Oklahoma 6 45.4 50.5 5.1 11.2%Washington 14 2,790.3 2,830.6 40.3 1.4% Utah 7 10.8 11.8 1 9.3%Ohio 14 5,077.7 5,150.5 72.8 1.4% Wyoming 8 26.5 28.9 2.4 9.1%Nebraska(1) 14 949.4 962.6 13.2 1.4% Kansas 9 8.6 9.3 0.7 8.1%West Virginia 17 751.1 761.2 10.1 1.3% Louisiana 10 52.3 56.2 3.9 7.5%Idaho 17 605.0 612.9 7.9 1.3% New Jersey 11 1.4 1.5 0.1 7.1%Massachusetts 17 3,212.8 3,253.3 40.5 1.3% West Virginia 12 31 32.4 1.4 4.5%Tennessee(1) 20 2,644.4 2,675.6 31.2 1.2% Nevada 13 12.4 12.9 0.5 4.0%New Hampshire 20 630.6 637.9 7.3 1.2% Alaska 14 15.7 16.3 0.6 3.8%Colorado 22 2,243.4 2,267.8 24.4 1.1% Maine 15 2.7 2.8 0.1 3.7%Oregon 22 1,616.5 1,634.0 17.5 1.1% Wisconsin 15 2.7 2.8 0.1 3.7%Pennsylvania 24 5,681.5 5,740.3 58.8 1.0% Florida 17 5.5 5.7 0.2 3.6%Hawaii(1) 24 597.4 603.5 6.1 1.0% Michigan 18 7.1 7.3 0.2 2.8%New York 24 8,659.0 8,747.0 88.0 1.0% Montana 19 7.8 8 0.2 2.6%District of Columbia(1 24 713.1 720.1 7.0 1.0% South Carolina 20 4 4.1 0.1 2.5%South Carolina 24 1,816.9 1,834.7 17.8 1.0% Missouri 21 4.1 4.2 0.1 2.4%Virginia 24 3,644.5 3,680.1 35.6 1.0% Alabama 21 12.3 12.6 0.3 2.4%Maryland(1) 24 2,529.3 2,554.0 24.7 1.0% California 23 26.3 26.9 0.6 2.3%Minnesota 24 2,642.6 2,668.1 25.5 1.0% Arkansas 24 10.8 11 0.2 1.9%New Jersey 24 3,877.7 3,914.6 36.9 1.0% Arizona 25 10.9 11.1 0.2 1.8%Kansas 33 1,330.1 1,342.5 12.4 0.9% Washington 25 5.6 5.7 0.1 1.8%Illinois 33 5,663.1 5,715.7 52.6 0.9% Mississippi 27 8.9 9 0.1 1.1%New Mexico 33 802.2 809.6 7.4 0.9% Indiana 28 6.7 6.7 0 0.0%Montana 33 428.5 432.4 3.9 0.9% Massachusetts 28 1.1 1.1 0 0.0%Iowa 33 1,482.8 1,495.9 13.1 0.9% New Hampshire 28 0.8 0.8 0 0.0%Arkansas 38 1,172.1 1,179.8 7.7 0.7% Ohio 28 11.5 11.5 0 0.0%Indiana 39 2,805.8 2,822.5 16.7 0.6% Rhode Island 28 0.2 0.2 0 0.0%Connecticut 40 1,637.6 1,646.1 8.5 0.5% Virginia 28 10.4 10.4 0 0.0%North Carolina 40 3,885.9 3,904.8 18.9 0.5% Kentucky 34 22.8 22.5 -0.3 -1.3%Alabama 42 1,870.6 1,877.5 6.9 0.4% Oregon 35 6.6 6.5 -0.1 -1.5%Nevada 43 1,120.7 1,124.2 3.5 0.3% Minnesota 36 6.1 6 -0.1 -1.6%Mississippi 44 1,099.2 1,101.9 2.7 0.2% New York 37 5.2 5.1 -0.1 -1.9%Rhode Island 45 461.6 462.1 0.5 0.1% Illinois 38 9.6 9.4 -0.2 -2.1%Wisconsin 45 2,747.2 2,749.7 2.5 0.1% Idaho 39 3.6 3.5 -0.1 -2.8%Maine 47 597.3 597.4 0.1 0.0% North Carolina 40 5.7 5.5 -0.2 -3.5%Alaska 48 313.4 313.1 -0.3 -0.1% Georgia 41 9.2 8.8 -0.4 -4.3%Missouri 48 2,656.5 2,652.6 -3.9 -0.1% Iowa 42 2.1 2 -0.1 -4.8%Georgia 50 3,840.9 3,826.9 -14.0 -0.4% Vermont 43 0.8 0.7 -0.1 -12.5%Delaware(1) 51 416.4 413.5 -2.9 -0.7% Connecticut 44 0.6 0.5 -0.1 -16.7%
PPreliminary.
(1) Mining and Logging is combined with construction.
Employment numbers are not seasonally adjusted.
Employment numbers are in thousands.
Source: U.S. Department of Labor, Bureau of Labor Statistics. Regional and State Employment and Unemployment: December 2011.
www.bls.gov/schedule/archives/laus_nr.htm
Data released: January 24, 2012.
Revised: February 2012.
Total Nonfarm Employment Mining and Logging

20
Dec. Dec. % Dec. Dec. %State Rank 2010 2011p Change Change State Rank 2010 2011p Change ChangeUnited States - 5,381.7 5,423.1 41.4 0.8% United States - 11,543.3 11,734.8 191.5 1.7%North Dakota 1 19.1 24.2 5.1 26.7% Oklahoma 1 126.9 137.6 10.7 8.4%Indiana 2 109.7 123.1 13.4 12.2% Michigan 2 482.9 510.6 27.7 5.7%West Virginia 3 29.3 32.4 3.1 10.6% Washington 2 257.3 271.9 14.6 5.7%Tennessee 4 106.4 113.5 7.1 6.7% South Carolina 4 209.6 221.2 11.6 5.5%Rhode Island 5 15.2 16.1 0.9 5.9% Louisiana 5 138.2 145.2 7.0 5.1%District of Columbia 5 10.2 10.8 0.6 5.9% Utah 6 113.3 118.8 5.5 4.9%Iowa 7 58.1 61.1 3.0 5.2% Iowa 7 200.8 209.4 8.6 4.3%Kansas 8 51.2 53.8 2.6 5.1% Kansas 8 159.1 165.1 6.0 3.8%Oregon 9 66.6 69.7 3.1 4.7% Idaho 9 53.3 55.2 1.9 3.6%Oklahoma 10 68.0 71.0 3.0 4.4% Missouri 10 245.6 253.3 7.7 3.1%Vermont 11 12.6 13.1 0.5 4.0% Texas 10 814.1 839.1 25.0 3.1%California 12 549.8 571.1 21.3 3.9% Ohio 12 623.3 641.5 18.2 2.9%New Hampshire 13 20.5 21.2 0.7 3.4% Nebraska 13 92.9 95.5 2.6 2.8%Ohio 14 159.8 165.0 5.2 3.3% Kentucky 14 212.5 218.1 5.6 2.6%Arizona 15 108.0 111.0 3.0 2.8% South Dakota 15 37.3 38.2 0.9 2.4%Pennsylvania 16 213.6 219.1 5.5 2.6% Tennessee 16 295.2 302.1 6.9 2.3%Utah 17 64.4 66.0 1.6 2.5% Wisconsin 17 433.7 443.2 9.5 2.2%Massachusetts 18 103.6 106.0 2.4 2.3% Illinois 17 563.6 575.8 12.2 2.2%New York 19 292.3 298.2 5.9 2.0% Pennsylvania 19 563.5 575.6 12.1 2.1%Illinois 20 191.0 194.2 3.2 1.7% Arizona 19 148.9 152.0 3.1 2.1%South Dakota 21 19.2 19.4 0.2 1.0% Florida 21 304.4 310.0 5.6 1.8%Connecticut 21 49.3 49.8 0.5 1.0% Massachusetts 21 256.1 260.8 4.7 1.8%Montana 21 20.7 20.9 0.2 1.0% Indiana 21 447.8 456.0 8.2 1.8%Michigan 24 121.6 122.6 1.0 0.8% Alabama 24 235.0 238.6 3.6 1.5%Washington 24 133.2 134.2 1.0 0.8% North Dakota 25 23.6 23.9 0.3 1.3%Arkansas 26 46.5 46.8 0.3 0.6% Minnesota 26 293.0 296.6 3.6 1.2%New Jersey 27 129.4 130.1 0.7 0.5% Hawaii 27 12.9 13.0 0.1 0.8%Idaho 28 30.1 30.2 0.1 0.3% Colorado 28 125.1 126.0 0.9 0.7%Minnesota 28 78.5 78.7 0.2 0.3% West Virginia 29 48.9 49.1 0.2 0.4%North Carolina 30 170.2 170.2 0.0 0.0% New Mexico 30 29.0 29.1 0.1 0.3%Florida 31 332.8 331.3 -1.5 -0.5% Vermont 30 31.9 32.0 0.1 0.3%Maine 32 24.5 24.3 -0.2 -0.8% Georgia 30 345.5 346.5 1.0 0.3%Kentucky 33 64.3 63.7 -0.6 -0.9% North Carolina 33 433.5 433.6 0.1 0.0%Louisiana 34 121.8 120.6 -1.2 -1.0% Delaware 33 26.1 26.1 0.0 0.0%Hawaii 34 28.9 28.6 -0.3 -1.0% Wyoming 33 8.9 8.9 0.0 0.0%Texas 36 591.0 584.5 -6.5 -1.1% California 36 1,245.7 1,241.2 -4.5 -0.4%Virginia 37 182.8 180.3 -2.5 -1.4% Virginia 37 230.3 229.1 -1.2 -0.5%Wyoming 37 21.9 21.6 -0.3 -1.4% Maine 38 51.9 51.6 -0.3 -0.6%Nebraska 39 40.5 39.8 -0.7 -1.7% Oregon 39 164.2 163.0 -1.2 -0.7%Alaska 40 13.4 13.1 -0.3 -2.2% Rhode Island 39 40.9 40.6 -0.3 -0.7%Nevada 41 55.9 54.6 -1.3 -2.3% New York 41 455.0 450.3 -4.7 -1.0%Maryland 42 143.3 139.5 -3.8 -2.7% New Hampshire 42 66.2 65.5 -0.7 -1.1%South Carolina 43 78.9 76.1 -2.8 -3.5% Mississippi 43 135.1 133.5 -1.6 -1.2%Colorado 44 111.4 107.0 -4.4 -3.9% Connecticut 44 168.6 166.3 -2.3 -1.4%Mississippi 45 48.7 46.7 -2.0 -4.1% Maryland 45 113.3 111.5 -1.8 -1.6%Missouri 46 102.1 97.7 -4.4 -4.3% Nevada 46 36.4 35.6 -0.8 -2.2%Alabama 47 83.8 80.1 -3.7 -4.4% Montana 47 16.7 16.3 -0.4 -2.4%Georgia 48 140.0 133.7 -6.3 -4.5% Arkansas 48 159.1 155.0 -4.1 -2.6%Wisconsin 49 83.7 79.6 -4.1 -4.9% New Jersey 49 258.3 249.4 -8.9 -3.4%Delaware 50 19.8 18.7 -1.1 -5.6% District of Columbia 50 1.2 1.1 -0.1 -8.3%New Mexico 51 44.1 38.1 -6.0 -13.6% Alaska 51 6.7 5.2 -1.5 -22.4%
PPreliminary.
Employment numbers are not seasonally adjusted.
Employment numbers are in thousands.Source: U.S. Department of Labor, Bureau of Labor Statistics. Regional and State Employment and Unemployment: December 2011.
www.bls.gov/schedule/archives/laus_nr.htm
Data released: January 24, 2012.
Revised: February 2012.
Construction Manufacturing
21
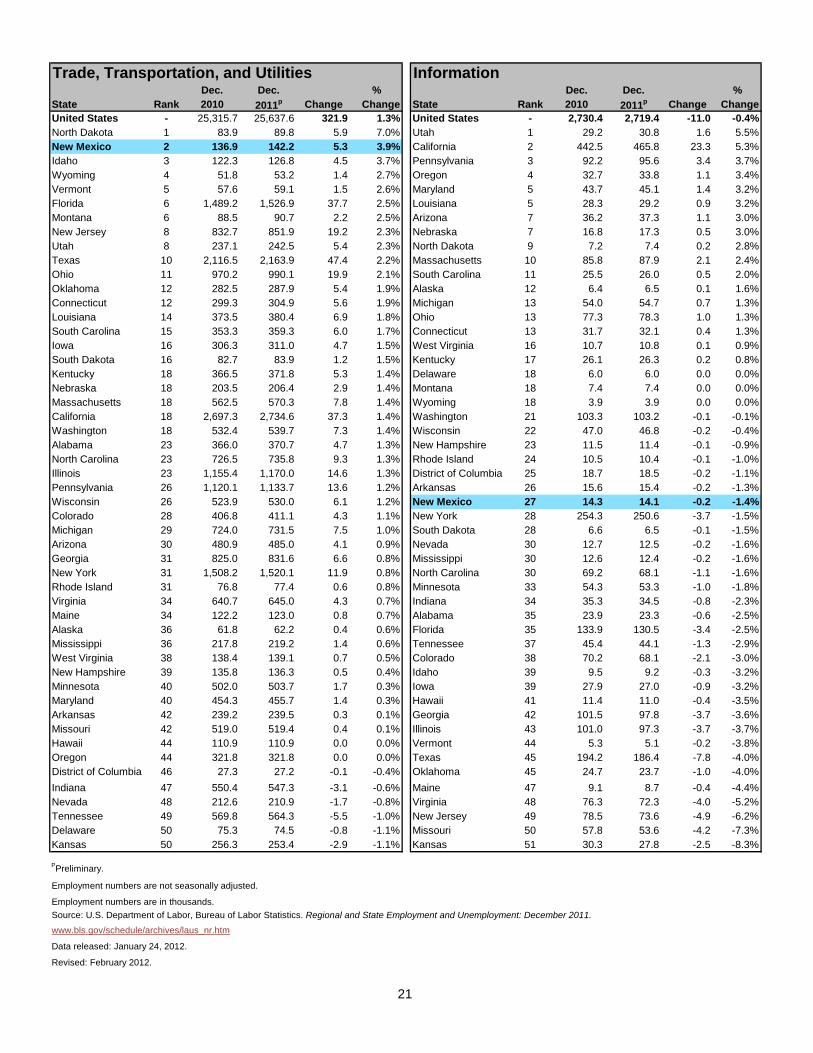
Dec. Dec. % Dec. Dec. %State Rank 2010 2011p Change Change State Rank 2010 2011p Change ChangeUnited States - 25,315.7 25,637.6 321.9 1.3% United States - 2,730.4 2,719.4 -11.0 -0.4%North Dakota 1 83.9 89.8 5.9 7.0% Utah 1 29.2 30.8 1.6 5.5%New Mexico 2 136.9 142.2 5.3 3.9% California 2 442.5 465.8 23.3 5.3%Idaho 3 122.3 126.8 4.5 3.7% Pennsylvania 3 92.2 95.6 3.4 3.7%Wyoming 4 51.8 53.2 1.4 2.7% Oregon 4 32.7 33.8 1.1 3.4%Vermont 5 57.6 59.1 1.5 2.6% Maryland 5 43.7 45.1 1.4 3.2%Florida 6 1,489.2 1,526.9 37.7 2.5% Louisiana 5 28.3 29.2 0.9 3.2%Montana 6 88.5 90.7 2.2 2.5% Arizona 7 36.2 37.3 1.1 3.0%New Jersey 8 832.7 851.9 19.2 2.3% Nebraska 7 16.8 17.3 0.5 3.0%Utah 8 237.1 242.5 5.4 2.3% North Dakota 9 7.2 7.4 0.2 2.8%Texas 10 2,116.5 2,163.9 47.4 2.2% Massachusetts 10 85.8 87.9 2.1 2.4%Ohio 11 970.2 990.1 19.9 2.1% South Carolina 11 25.5 26.0 0.5 2.0%Oklahoma 12 282.5 287.9 5.4 1.9% Alaska 12 6.4 6.5 0.1 1.6%Connecticut 12 299.3 304.9 5.6 1.9% Michigan 13 54.0 54.7 0.7 1.3%Louisiana 14 373.5 380.4 6.9 1.8% Ohio 13 77.3 78.3 1.0 1.3%South Carolina 15 353.3 359.3 6.0 1.7% Connecticut 13 31.7 32.1 0.4 1.3%Iowa 16 306.3 311.0 4.7 1.5% West Virginia 16 10.7 10.8 0.1 0.9%South Dakota 16 82.7 83.9 1.2 1.5% Kentucky 17 26.1 26.3 0.2 0.8%Kentucky 18 366.5 371.8 5.3 1.4% Delaware 18 6.0 6.0 0.0 0.0%Nebraska 18 203.5 206.4 2.9 1.4% Montana 18 7.4 7.4 0.0 0.0%Massachusetts 18 562.5 570.3 7.8 1.4% Wyoming 18 3.9 3.9 0.0 0.0%California 18 2,697.3 2,734.6 37.3 1.4% Washington 21 103.3 103.2 -0.1 -0.1%Washington 18 532.4 539.7 7.3 1.4% Wisconsin 22 47.0 46.8 -0.2 -0.4%Alabama 23 366.0 370.7 4.7 1.3% New Hampshire 23 11.5 11.4 -0.1 -0.9%North Carolina 23 726.5 735.8 9.3 1.3% Rhode Island 24 10.5 10.4 -0.1 -1.0%Illinois 23 1,155.4 1,170.0 14.6 1.3% District of Columbia 25 18.7 18.5 -0.2 -1.1%Pennsylvania 26 1,120.1 1,133.7 13.6 1.2% Arkansas 26 15.6 15.4 -0.2 -1.3%Wisconsin 26 523.9 530.0 6.1 1.2% New Mexico 27 14.3 14.1 -0.2 -1.4%Colorado 28 406.8 411.1 4.3 1.1% New York 28 254.3 250.6 -3.7 -1.5%Michigan 29 724.0 731.5 7.5 1.0% South Dakota 28 6.6 6.5 -0.1 -1.5%Arizona 30 480.9 485.0 4.1 0.9% Nevada 30 12.7 12.5 -0.2 -1.6%Georgia 31 825.0 831.6 6.6 0.8% Mississippi 30 12.6 12.4 -0.2 -1.6%New York 31 1,508.2 1,520.1 11.9 0.8% North Carolina 30 69.2 68.1 -1.1 -1.6%Rhode Island 31 76.8 77.4 0.6 0.8% Minnesota 33 54.3 53.3 -1.0 -1.8%Virginia 34 640.7 645.0 4.3 0.7% Indiana 34 35.3 34.5 -0.8 -2.3%Maine 34 122.2 123.0 0.8 0.7% Alabama 35 23.9 23.3 -0.6 -2.5%Alaska 36 61.8 62.2 0.4 0.6% Florida 35 133.9 130.5 -3.4 -2.5%Mississippi 36 217.8 219.2 1.4 0.6% Tennessee 37 45.4 44.1 -1.3 -2.9%West Virginia 38 138.4 139.1 0.7 0.5% Colorado 38 70.2 68.1 -2.1 -3.0%New Hampshire 39 135.8 136.3 0.5 0.4% Idaho 39 9.5 9.2 -0.3 -3.2%Minnesota 40 502.0 503.7 1.7 0.3% Iowa 39 27.9 27.0 -0.9 -3.2%Maryland 40 454.3 455.7 1.4 0.3% Hawaii 41 11.4 11.0 -0.4 -3.5%Arkansas 42 239.2 239.5 0.3 0.1% Georgia 42 101.5 97.8 -3.7 -3.6%Missouri 42 519.0 519.4 0.4 0.1% Illinois 43 101.0 97.3 -3.7 -3.7%Hawaii 44 110.9 110.9 0.0 0.0% Vermont 44 5.3 5.1 -0.2 -3.8%Oregon 44 321.8 321.8 0.0 0.0% Texas 45 194.2 186.4 -7.8 -4.0%District of Columbia 46 27.3 27.2 -0.1 -0.4% Oklahoma 45 24.7 23.7 -1.0 -4.0%Indiana 47 550.4 547.3 -3.1 -0.6% Maine 47 9.1 8.7 -0.4 -4.4%Nevada 48 212.6 210.9 -1.7 -0.8% Virginia 48 76.3 72.3 -4.0 -5.2%Tennessee 49 569.8 564.3 -5.5 -1.0% New Jersey 49 78.5 73.6 -4.9 -6.2%Delaware 50 75.3 74.5 -0.8 -1.1% Missouri 50 57.8 53.6 -4.2 -7.3%Kansas 50 256.3 253.4 -2.9 -1.1% Kansas 51 30.3 27.8 -2.5 -8.3%
PPreliminary.
Employment numbers are not seasonally adjusted.
Employment numbers are in thousands.Source: U.S. Department of Labor, Bureau of Labor Statistics. Regional and State Employment and Unemployment: December 2011.
www.bls.gov/schedule/archives/laus_nr.htm
Data released: January 24, 2012.
Revised: February 2012.
Trade, Transportation, and Utilities Information
22
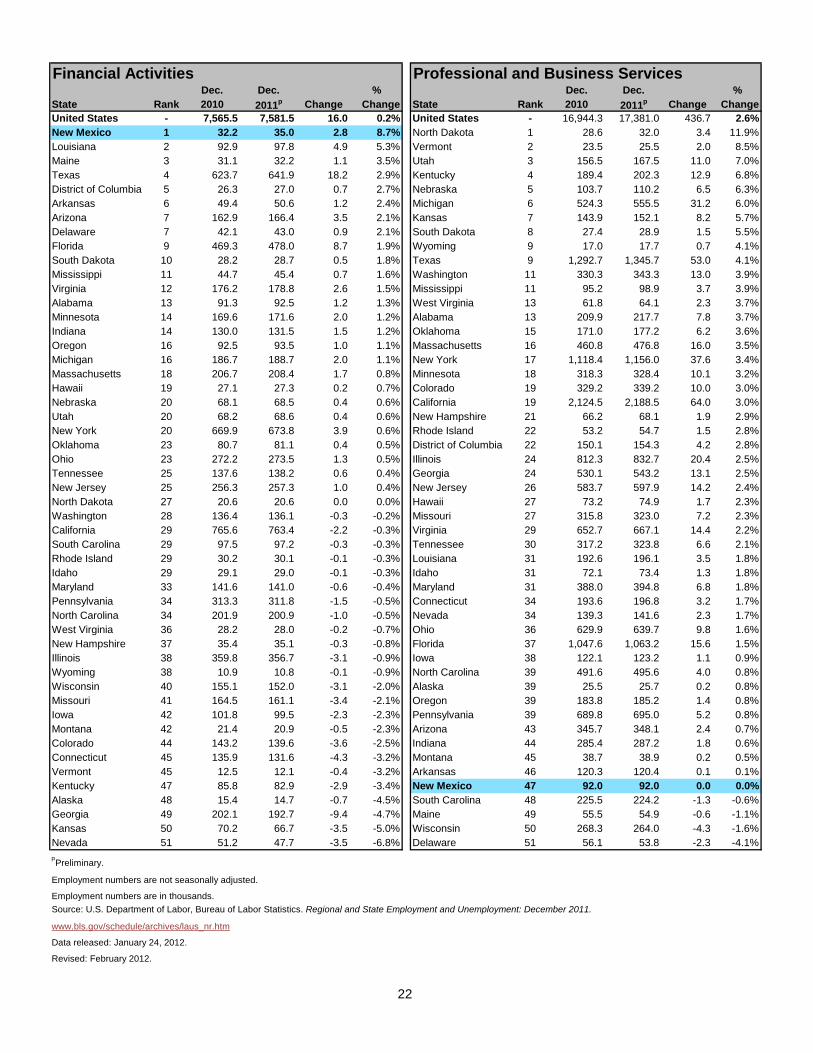
Financial Activities Professional and Business ServicesDec. Dec. % Dec. Dec. %
State Rank 2010 2011p Change Change State Rank 2010 2011p Change ChangeUnited States - 7,565.5 7,581.5 16.0 0.2% United States - 16,944.3 17,381.0 436.7 2.6%New Mexico 1 32.2 35.0 2.8 8.7% North Dakota 1 28.6 32.0 3.4 11.9%Louisiana 2 92.9 97.8 4.9 5.3% Vermont 2 23.5 25.5 2.0 8.5%Maine 3 31.1 32.2 1.1 3.5% Utah 3 156.5 167.5 11.0 7.0%Texas 4 623.7 641.9 18.2 2.9% Kentucky 4 189.4 202.3 12.9 6.8%District of Columbia 5 26.3 27.0 0.7 2.7% Nebraska 5 103.7 110.2 6.5 6.3%Arkansas 6 49.4 50.6 1.2 2.4% Michigan 6 524.3 555.5 31.2 6.0%Arizona 7 162.9 166.4 3.5 2.1% Kansas 7 143.9 152.1 8.2 5.7%Delaware 7 42.1 43.0 0.9 2.1% South Dakota 8 27.4 28.9 1.5 5.5%Florida 9 469.3 478.0 8.7 1.9% Wyoming 9 17.0 17.7 0.7 4.1%South Dakota 10 28.2 28.7 0.5 1.8% Texas 9 1,292.7 1,345.7 53.0 4.1%Mississippi 11 44.7 45.4 0.7 1.6% Washington 11 330.3 343.3 13.0 3.9%Virginia 12 176.2 178.8 2.6 1.5% Mississippi 11 95.2 98.9 3.7 3.9%Alabama 13 91.3 92.5 1.2 1.3% West Virginia 13 61.8 64.1 2.3 3.7%Minnesota 14 169.6 171.6 2.0 1.2% Alabama 13 209.9 217.7 7.8 3.7%Indiana 14 130.0 131.5 1.5 1.2% Oklahoma 15 171.0 177.2 6.2 3.6%Oregon 16 92.5 93.5 1.0 1.1% Massachusetts 16 460.8 476.8 16.0 3.5%Michigan 16 186.7 188.7 2.0 1.1% New York 17 1,118.4 1,156.0 37.6 3.4%Massachusetts 18 206.7 208.4 1.7 0.8% Minnesota 18 318.3 328.4 10.1 3.2%Hawaii 19 27.1 27.3 0.2 0.7% Colorado 19 329.2 339.2 10.0 3.0%Nebraska 20 68.1 68.5 0.4 0.6% California 19 2,124.5 2,188.5 64.0 3.0%Utah 20 68.2 68.6 0.4 0.6% New Hampshire 21 66.2 68.1 1.9 2.9%New York 20 669.9 673.8 3.9 0.6% Rhode Island 22 53.2 54.7 1.5 2.8%Oklahoma 23 80.7 81.1 0.4 0.5% District of Columbia 22 150.1 154.3 4.2 2.8%Ohio 23 272.2 273.5 1.3 0.5% Illinois 24 812.3 832.7 20.4 2.5%Tennessee 25 137.6 138.2 0.6 0.4% Georgia 24 530.1 543.2 13.1 2.5%New Jersey 25 256.3 257.3 1.0 0.4% New Jersey 26 583.7 597.9 14.2 2.4%North Dakota 27 20.6 20.6 0.0 0.0% Hawaii 27 73.2 74.9 1.7 2.3%Washington 28 136.4 136.1 -0.3 -0.2% Missouri 27 315.8 323.0 7.2 2.3%California 29 765.6 763.4 -2.2 -0.3% Virginia 29 652.7 667.1 14.4 2.2%South Carolina 29 97.5 97.2 -0.3 -0.3% Tennessee 30 317.2 323.8 6.6 2.1%Rhode Island 29 30.2 30.1 -0.1 -0.3% Louisiana 31 192.6 196.1 3.5 1.8%Idaho 29 29.1 29.0 -0.1 -0.3% Idaho 31 72.1 73.4 1.3 1.8%Maryland 33 141.6 141.0 -0.6 -0.4% Maryland 31 388.0 394.8 6.8 1.8%Pennsylvania 34 313.3 311.8 -1.5 -0.5% Connecticut 34 193.6 196.8 3.2 1.7%North Carolina 34 201.9 200.9 -1.0 -0.5% Nevada 34 139.3 141.6 2.3 1.7%West Virginia 36 28.2 28.0 -0.2 -0.7% Ohio 36 629.9 639.7 9.8 1.6%New Hampshire 37 35.4 35.1 -0.3 -0.8% Florida 37 1,047.6 1,063.2 15.6 1.5%Illinois 38 359.8 356.7 -3.1 -0.9% Iowa 38 122.1 123.2 1.1 0.9%Wyoming 38 10.9 10.8 -0.1 -0.9% North Carolina 39 491.6 495.6 4.0 0.8%Wisconsin 40 155.1 152.0 -3.1 -2.0% Alaska 39 25.5 25.7 0.2 0.8%Missouri 41 164.5 161.1 -3.4 -2.1% Oregon 39 183.8 185.2 1.4 0.8%Iowa 42 101.8 99.5 -2.3 -2.3% Pennsylvania 39 689.8 695.0 5.2 0.8%Montana 42 21.4 20.9 -0.5 -2.3% Arizona 43 345.7 348.1 2.4 0.7%Colorado 44 143.2 139.6 -3.6 -2.5% Indiana 44 285.4 287.2 1.8 0.6%Connecticut 45 135.9 131.6 -4.3 -3.2% Montana 45 38.7 38.9 0.2 0.5%Vermont 45 12.5 12.1 -0.4 -3.2% Arkansas 46 120.3 120.4 0.1 0.1%Kentucky 47 85.8 82.9 -2.9 -3.4% New Mexico 47 92.0 92.0 0.0 0.0%Alaska 48 15.4 14.7 -0.7 -4.5% South Carolina 48 225.5 224.2 -1.3 -0.6%Georgia 49 202.1 192.7 -9.4 -4.7% Maine 49 55.5 54.9 -0.6 -1.1%Kansas 50 70.2 66.7 -3.5 -5.0% Wisconsin 50 268.3 264.0 -4.3 -1.6%Nevada 51 51.2 47.7 -3.5 -6.8% Delaware 51 56.1 53.8 -2.3 -4.1%PPreliminary.
Employment numbers are not seasonally adjusted.
Employment numbers are in thousands.Source: U.S. Department of Labor, Bureau of Labor Statistics. Regional and State Employment and Unemployment: December 2011.
www.bls.gov/schedule/archives/laus_nr.htm
Data released: January 24, 2012.
Revised: February 2012.

23
Education and Health Services Leisure and HospitalityDec. Dec. % Dec. Dec. %
State Rank 2010 2011p Change Change State Rank 2010 2011p Change ChangeUnited States - 19,954.5 20,359.6 405.1 2.0% United States - 12,830.3 13,072.1 241.8 1.9%Louisiana 1 274.2 292.6 18.4 6.7% New Hampshire 1 62.4 66.2 3.8 6.1%Oregon 2 233.0 242.1 9.1 3.9% Kentucky 1 166.3 176.4 10.1 6.1%Arizona 3 353.0 365.8 12.8 3.6% Oregon 3 157.9 166.4 8.5 5.4%New Mexico 4 123.6 127.9 4.3 3.5% Utah 4 109.4 114.8 5.4 4.9%Mississippi 5 135.3 139.8 4.5 3.3% Texas 5 1,003.5 1,044.4 40.9 4.1%Alaska 5 42.4 43.8 1.4 3.3% Colorado 6 270.9 281.6 10.7 3.9%West Virginia 7 121.7 125.7 4.0 3.3% North Dakota 7 34.6 35.9 1.3 3.8%Nevada 8 101.7 104.7 3.0 2.9% South Carolina 8 197.8 204.5 6.7 3.4%Ohio 8 859.5 884.3 24.8 2.9% Florida 9 930.6 961.1 30.5 3.3%Maine 10 120.8 124.2 3.4 2.8% Nevada 10 309.5 319.3 9.8 3.2%Washington 10 381.3 392.0 10.7 2.8% Louisiana 11 194.5 200.5 6.0 3.1%Utah 12 158.7 163.0 4.3 2.7% North Carolina 12 380.9 392.3 11.4 3.0%Texas 13 1,411.5 1,448.4 36.9 2.6% Washington 13 260.3 267.5 7.2 2.8%District of Columbia 13 111.0 113.9 2.9 2.6% Montana 14 55.5 57.0 1.5 2.7%Kansas 13 182.3 187.0 4.7 2.6% Oklahoma 14 137.4 141.1 3.7 2.7%Florida 16 1,098.5 1,126.4 27.9 2.5% Arizona 16 255.0 261.4 6.4 2.5%Maryland 16 404.6 414.6 10.0 2.5% Delaware 16 40.1 41.1 1.0 2.5%Hawaii 16 77.5 79.4 1.9 2.5% Indiana 16 261.7 268.2 6.5 2.5%Iowa 19 218.4 223.6 5.2 2.4% Hawaii 19 101.7 104.0 2.3 2.3%Minnesota 19 462.9 473.9 11.0 2.4% Pennsylvania 20 484.3 494.6 10.3 2.1%California 19 1,828.8 1,872.2 43.4 2.4% Virginia 21 318.3 324.8 6.5 2.0%Colorado 22 270.7 276.9 6.2 2.3% District of Columbia 21 59.0 60.2 1.2 2.0%Kentucky 22 252.4 258.1 5.7 2.3% California 23 1,503.7 1,530.6 26.9 1.8%New Jersey 22 615.4 628.7 13.3 2.2% Idaho 24 57.4 58.4 1.0 1.7%Oklahoma 25 206.2 210.5 4.3 2.1% New Mexico 24 82.5 83.9 1.4 1.7%Arkansas 25 168.2 171.7 3.5 2.1% Minnesota 24 222.3 226.0 3.7 1.7%South Dakota 27 65.5 66.8 1.3 2.0% Massachusetts 27 293.9 298.6 4.7 1.6%Illinois 27 847.6 864.3 16.7 2.0% New York 27 726.3 737.8 11.5 1.6%Wisconsin 29 422.5 430.7 8.2 1.9% Tennessee 29 257.2 261.0 3.8 1.5%Michigan 29 630.7 642.6 11.9 1.9% Vermont 30 35.6 36.1 0.5 1.4%Pennsylvania 31 1,159.5 1,179.9 20.4 1.8% Arkansas 30 99.9 101.3 1.4 1.4%New York 32 1,754.5 1,784.5 30.0 1.7% Maryland 32 218.9 221.5 2.6 1.2%North Dakota 33 55.4 56.3 0.9 1.6% Connecticut 33 133.0 134.4 1.4 1.1%Connecticut 33 315.0 320.0 5.0 1.6% South Dakota 34 41.0 41.3 0.3 0.7%Delaware 35 65.7 66.7 1.0 1.5% Alaska 34 29.0 29.2 0.2 0.7%Virginia 36 464.0 470.4 6.4 1.4% Illinois 34 508.8 512.2 3.4 0.7%Vermont 37 60.1 60.9 0.8 1.3% New Jersey 37 323.5 325.2 1.7 0.5%Georgia 37 493.9 500.4 6.5 1.3% West Virginia 38 72.2 72.4 0.2 0.3%North Carolina 37 539.6 546.7 7.1 1.3% Alabama 39 165.9 166.1 0.2 0.1%Nebraska 37 137.1 138.9 1.8 1.3% Georgia 40 369.1 368.3 -0.8 -0.2%Tennessee 37 378.8 383.6 4.8 1.3% Iowa 40 128.5 128.2 -0.3 -0.2%South Carolina 42 216.3 218.8 2.5 1.2% Wisconsin 40 242.0 241.4 -0.6 -0.2%New Hampshire 43 111.0 112.2 1.2 1.1% Wyoming 43 30.0 29.9 -0.1 -0.3%Idaho 44 86.6 87.5 0.9 1.0% Maine 44 53.8 53.6 -0.2 -0.4%Montana 45 64.9 65.2 0.3 0.5% Nebraska 44 79.2 78.9 -0.3 -0.4%Rhode Island 46 103.5 103.9 0.4 0.4% Rhode Island 44 47.0 46.8 -0.2 -0.4%Massachusetts 47 680.5 682.8 2.3 0.3% Ohio 47 465.8 463.7 -2.1 -0.5%Alabama 48 216.1 216.3 0.2 0.1% Kansas 48 111.4 110.7 -0.7 -0.6%Indiana 49 433.5 432.4 -1.1 -0.3% Missouri 49 262.2 259.8 -2.4 -0.9%Missouri 50 411.9 410.1 -1.8 -0.4% Michigan 50 360.4 355.8 -4.6 -1.3%Wyoming 51 26.7 26.5 -0.2 -0.7% Mississippi 51 118.2 115.7 -2.5 -2.1%
PPreliminary.
Employment numbers are not seasonally adjusted.
Employment numbers are in thousands.Source: U.S. Department of Labor, Bureau of Labor Statistics. Regional and State Employment and Unemployment: December 2011.
www.bls.gov/schedule/archives/laus_nr.htm
Data released: January 24, 2012.
Revised: February 2012.

24
Other Services GovernmentDec. Dec. % Dec. Dec. %
State Rank 2010 2011p Change Change State Rank 2010 2011p Change ChangeUnited States - 5,254.7 5,286.6 31.9 0.6% United States - 22,704.6 22,543.8 -160.8 -0.7%Maryland 1 114.4 120.0 5.6 4.9% Wyoming 1 73.6 75.9 2.3 3.1%North Dakota 2 16.6 17.4 0.8 4.8% California 2 2,389.8 2,446.0 56.2 2.4%Arkansas 3 42.8 44.6 1.8 4.2% Tennessee 3 437.2 444.2 7.0 1.6%Texas 4 363.0 376.0 13.0 3.6% Oklahoma 3 340.9 346.3 5.4 1.6%Massachusetts 5 116.2 119.8 3.6 3.1% Arkansas 5 220.3 223.5 3.2 1.5%Nevada 6 33.6 34.5 0.9 2.7% Virginia 6 709.9 717.2 7.3 1.0%Utah 6 33.8 34.7 0.9 2.7% Montana 7 90.0 90.6 0.6 0.7%Wyoming 8 11.4 11.7 0.3 2.6% Maryland 8 507.2 510.3 3.1 0.6%New Jersey 9 158.6 162.2 3.6 2.3% New Hampshire 9 100.6 101.0 0.4 0.4%Michigan 10 166.4 170.0 3.6 2.2% South Dakota 9 79.2 79.5 0.3 0.4%Pennsylvania 11 250.3 255.0 4.7 1.9% Arizona 11 420.5 421.9 1.4 0.3%Alabama 12 79.4 80.8 1.4 1.8% Hawaii 12 127.3 127.6 0.3 0.2%South Carolina 13 68.0 69.0 1.0 1.5% Kansas 12 264.9 265.3 0.4 0.2%Nebraska 14 36.9 37.4 0.5 1.4% Colorado 14 397.2 397.1 -0.1 0.0%Tennessee 15 99.6 100.8 1.2 1.2% New York 15 1,507.9 1,505.8 -2.1 -0.1%Hawaii 16 26.5 26.8 0.3 1.1% Connecticut 16 249.5 249.1 -0.4 -0.2%District of Columbia 16 63.2 63.9 0.7 1.1% Vermont 16 56.4 56.3 -0.1 -0.2%Wisconsin 16 140.0 141.5 1.5 1.1% Louisiana 16 364.6 363.8 -0.8 -0.2%Virginia 19 182.9 184.7 1.8 1.0% Mississippi 19 247.9 247.0 -0.9 -0.4%Ohio 20 214.4 216.0 1.6 0.7% Utah 19 217.7 216.9 -0.8 -0.4%West Virginia 20 55.1 55.5 0.4 0.7% Missouri 19 456.3 454.5 -1.8 -0.4%South Dakota 22 15.6 15.7 0.1 0.6% New Jersey 22 639.9 636.8 -3.1 -0.5%Delaware 23 19.9 20.0 0.1 0.5% Nebraska 23 170.7 169.7 -1.0 -0.6%Washington 23 102.0 102.5 0.5 0.5% New Mexico 23 200.1 198.8 -1.3 -0.6%Florida 23 310.6 312.1 1.5 0.5% Florida 25 1,121.9 1,113.7 -8.2 -0.7%Idaho 23 21.1 21.2 0.1 0.5% Alaska 26 85.9 85.2 -0.7 -0.8%Oregon 27 56.7 56.9 0.2 0.4% Ohio 27 793.8 786.9 -6.9 -0.9%Minnesota 28 114.6 115.0 0.4 0.3% Illinois 28 861.1 852.1 -9.0 -1.0%Alaska 29 11.2 11.2 0.0 0.0% Massachusetts 29 445.6 440.8 -4.8 -1.1%California 30 481.1 479.8 -1.3 -0.3% Idaho 30 119.9 118.5 -1.4 -1.2%Kentucky 31 71.2 71.0 -0.2 -0.3% District of Columbia 30 246.1 243.2 -2.9 -1.2%Indiana 32 105.6 105.2 -0.4 -0.4% Kentucky 30 334.0 330.0 -4.0 -1.2%North Carolina 32 155.2 154.6 -0.6 -0.4% North Dakota 30 83.1 82.1 -1.0 -1.2%New Hampshire 34 20.2 20.1 -0.1 -0.5% West Virginia 34 153.8 151.7 -2.1 -1.4%Arizona 35 85.7 85.2 -0.5 -0.6% North Carolina 34 711.6 701.5 -10.1 -1.4%New York 35 367.0 364.8 -2.2 -0.6% Minnesota 34 421.0 414.9 -6.1 -1.4%Georgia 37 152.5 151.5 -1.0 -0.7% Iowa 37 260.0 255.6 -4.4 -1.7%Illinois 38 252.9 251.0 -1.9 -0.8% South Carolina 38 340.5 334.3 -6.2 -1.8%Connecticut 38 61.1 60.6 -0.5 -0.8% Oregon 39 300.7 295.1 -5.6 -1.9%Colorado 40 93.1 92.2 -0.9 -1.0% Michigan 40 642.5 629.1 -13.4 -2.1%Vermont 40 10.0 9.9 -0.1 -1.0% Indiana 40 439.7 430.4 -9.3 -2.1%Missouri 42 117.2 115.9 -1.3 -1.1% Alabama 40 387.0 378.8 -8.2 -2.1%Kansas 43 51.9 51.3 -0.6 -1.2% Rhode Island 43 62.0 60.6 -1.4 -2.3%Mississippi 44 34.8 34.3 -0.5 -1.4% Wisconsin 44 428.3 417.7 -10.6 -2.5%Maine 45 19.9 19.5 -0.4 -2.0% Washington 44 548.2 534.5 -13.7 -2.5%Montana 46 16.9 16.5 -0.4 -2.4% Delaware 46 65.3 63.6 -1.7 -2.6%Oklahoma 47 59.5 58.0 -1.5 -2.5% Pennsylvania 46 766.2 746.0 -20.2 -2.6%Iowa 48 56.8 55.3 -1.5 -2.6% Georgia 48 672.0 652.4 -19.6 -2.9%Louisiana 49 66.4 64.3 -2.1 -3.2% Texas 49 1,883.6 1,827.5 -56.1 -3.0%Rhode Island 50 22.1 21.3 -0.8 -3.6% Maine 49 105.8 102.6 -3.2 -3.0%New Mexico 51 28.8 27.4 -1.4 -4.9% Nevada 51 155.4 149.9 -5.5 -3.5%PPreliminary.
Employment numbers are not seasonally adjusted.
Employment numbers are in thousands.
Source: U.S. Department of Labor, Bureau of Labor Statistics. Regional and State Employment and Unemployment: December 2011.
www.bls.gov/schedule/archives/laus_nr.htm
Data released: January 24, 2012.
Revised: February 2012.
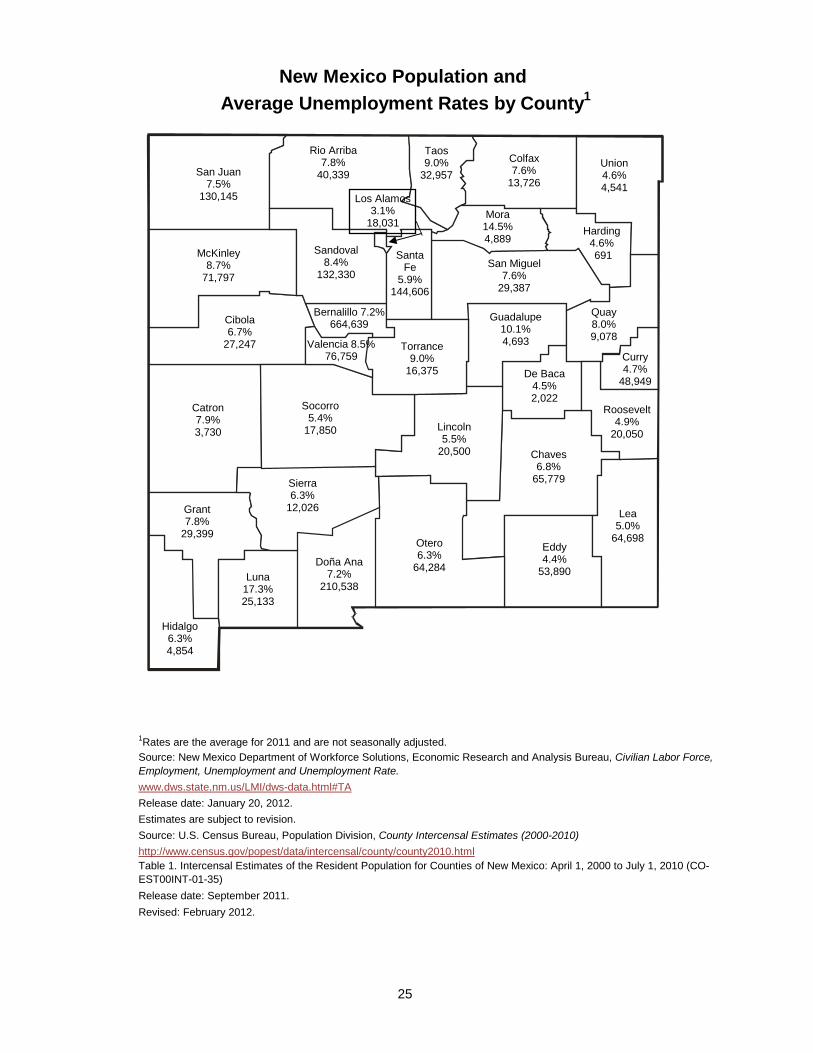
25
1Rates are the average for 2011 and are not seasonally adjusted.
Release date: January 20, 2012.Estimates are subject to revision.
Release date: September 2011.Revised: February 2012.
Table 1. Intercensal Estimates of the Resident Population for Counties of New Mexico: April 1, 2000 to July 1, 2010 (CO-EST00INT-01-35)
New Mexico Population and Average Unemployment Rates by County1
Source: U.S. Census Bureau, Population Division, County Intercensal Estimates (2000-2010)
Source: New Mexico Department of Workforce Solutions, Economic Research and Analysis Bureau, Civilian Labor Force, Employment, Unemployment and Unemployment Rate.www.dws.state.nm.us/LMI/dws-data.html#TA
http://www.census.gov/popest/data/intercensal/county/county2010.html
San Juan 7.5%
130,145
Rio Arriba 7.8%
40,339
Taos 9.0%
32,957
McKinley 8.7%
71,797
Colfax 7.6%
13,726
Union 4.6% 4,541
San Miguel 7.6%
29,387
Santa Fe
5.9% 144,606
Harding 4.6% 691
Guadalupe 10.1% 4,693 Torrance
9.0% 16,375
Catron 7.9% 3,730
Cibola 6.7%
27,247
Lincoln 5.5%
20,500
Doña Ana 7.2%
210,538
Mora 14.5% 4,889
Quay 8.0% 9,078
Socorro 5.4%
17,850
De Baca 4.5% 2,022
Curry 4.7%
48,949
Roosevelt 4.9%
20,050
Chaves 6.8%
65,779
Eddy 4.4%
53,890
Otero 6.3%
64,284
Lea 5.0%
64,698
Sierra 6.3%
12,026 Grant 7.8%
29,399
Hidalgo 6.3% 4,854
Luna 17.3% 25,133
Sandoval 8.4%
132,330
Bernalillo 7.2% 664,639
Valencia 8.5% 76,759
Los Alamos 3.1%
18,031
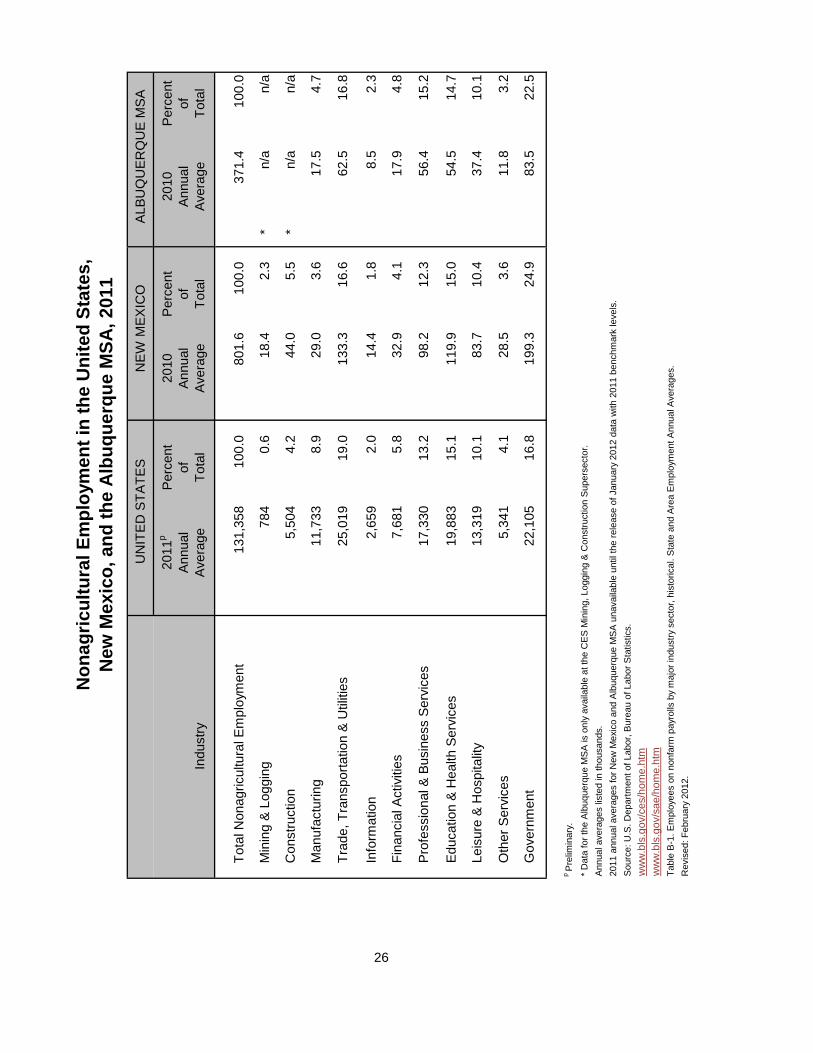
U
NIT
ED S
TATE
S
NEW
MEX
ICO
ALBU
QU
ERQ
UE
MSA
2011
pPe
rcen
t20
10Pe
rcen
t20
10Pe
rcen
tAn
nual
ofAn
nual
ofAn
nual
ofIn
dust
ryAv
erag
eTo
tal
Aver
age
Tota
lAv
erag
eTo
tal
Tota
l Non
agric
ultu
ral E
mpl
oym
ent
131,
358
100.
080
1.6
100.
037
1.4
100.
0
Min
ing
& Lo
ggin
g78
40.
618
.42.
3*
n/a
n/a
Con
stru
ctio
n5,
504
4.2
44.0
5.5
*n/
an/
a
Man
ufac
turin
g11
,733
8.9
29.0
3.6
17.5
4.7
Trad
e, T
rans
porta
tion
& U
tiliti
es25
,019
19.0
133.
316
.662
.516
.8
Info
rmat
ion
2,65
92.
014
.41.
88.
52.
3
Fina
ncia
l Act
iviti
es7,
681
5.8
32.9
4.1
17.9
4.8
Prof
essi
onal
& B
usin
ess
Serv
ices
17,3
3013
.298
.212
.356
.415
.2
Educ
atio
n &
Hea
lth S
ervi
ces
19,8
8315
.111
9.9
15.0
54.5
14.7
Leis
ure
& H
ospi
talit
y13
,319
10.1
83.7
10.4
37.4
10.1
Oth
er S
ervi
ces
5,34
14.
128
.53.
611
.83.
2
Gov
ernm
ent
22,1
0516
.819
9.3
24.9
83.5
22.5
p P
relim
inar
y.
* D
ata
for t
he A
lbuq
uerq
ue M
SA
is o
nly
avai
labl
e at
the
CE
S M
inin
g, L
oggi
ng &
Con
stru
ctio
n S
uper
sect
or.
Ann
ual a
vera
ges
liste
d in
thou
sand
s.20
11 a
nnua
l ave
rage
s fo
r New
Mex
ico
and
Alb
uque
rque
MS
A u
nava
ilabl
e un
til th
e re
leas
e of
Jan
uary
201
2 da
ta w
ith 2
011
benc
hmar
k le
vels
.S
ourc
e: U
.S. D
epar
tmen
t of L
abor
, Bur
eau
of L
abor
Sta
tistic
s.
ww
w.b
ls.g
ov/c
es/h
ome.
htm
ww
w.b
ls.g
ov/s
ae/h
ome.
htm
Tabl
e B
-1. E
mpl
oyee
s on
non
farm
pay
rolls
by
maj
or in
dust
ry s
ecto
r, hi
stor
ical
. Sta
te a
nd A
rea
Em
ploy
men
t Ann
ual A
vera
ges.
Rev
ised
: Feb
ruar
y 20
12.
Non
agric
ultu
ral E
mpl
oym
ent i
n th
e U
nite
d St
ates
,N
ew M
exic
o, a
nd th
e A
lbuq
uerq
ue M
SA, 2
011
26
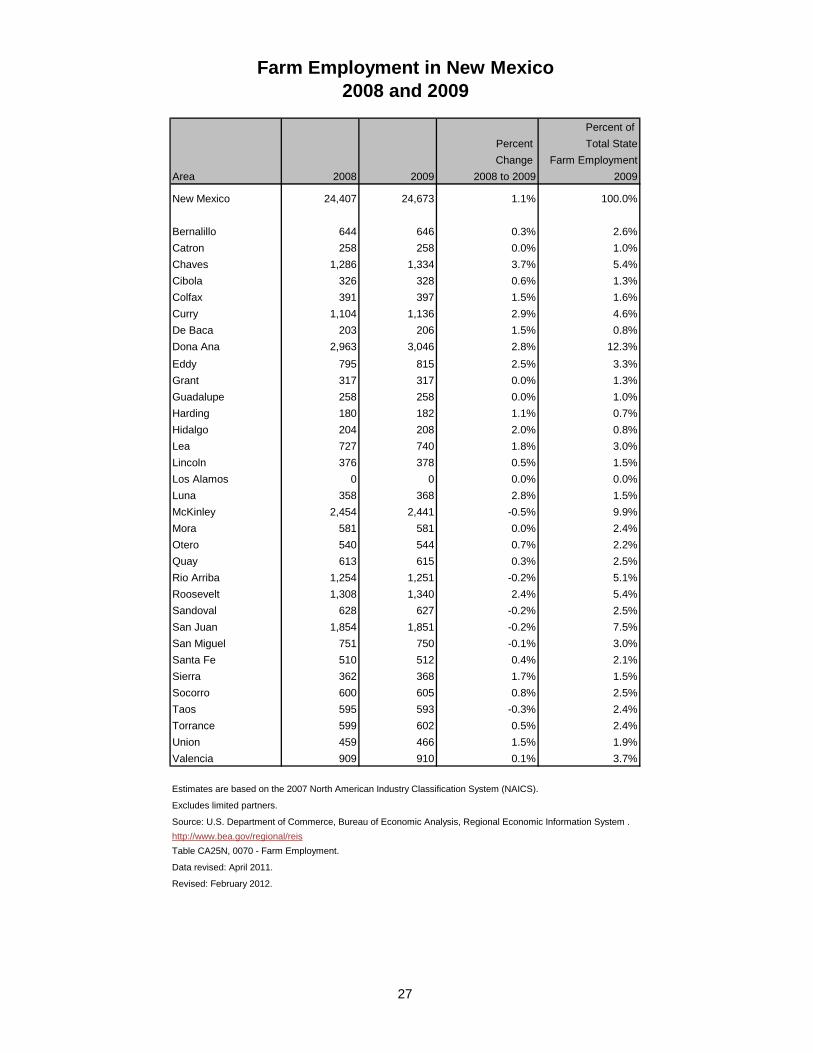
27
Percent of Percent Total StateChange Farm Employment
Area 2008 2009 2008 to 2009 2009
New Mexico 24,407 24,673 1.1% 100.0%
Bernalillo 644 646 0.3% 2.6%Catron 258 258 0.0% 1.0%Chaves 1,286 1,334 3.7% 5.4%Cibola 326 328 0.6% 1.3%Colfax 391 397 1.5% 1.6%Curry 1,104 1,136 2.9% 4.6%De Baca 203 206 1.5% 0.8%Dona Ana 2,963 3,046 2.8% 12.3%Eddy 795 815 2.5% 3.3%Grant 317 317 0.0% 1.3%Guadalupe 258 258 0.0% 1.0%Harding 180 182 1.1% 0.7%Hidalgo 204 208 2.0% 0.8%Lea 727 740 1.8% 3.0%Lincoln 376 378 0.5% 1.5%Los Alamos 0 0 0.0% 0.0%Luna 358 368 2.8% 1.5%McKinley 2,454 2,441 -0.5% 9.9%Mora 581 581 0.0% 2.4%Otero 540 544 0.7% 2.2%Quay 613 615 0.3% 2.5%Rio Arriba 1,254 1,251 -0.2% 5.1%Roosevelt 1,308 1,340 2.4% 5.4%Sandoval 628 627 -0.2% 2.5%San Juan 1,854 1,851 -0.2% 7.5%San Miguel 751 750 -0.1% 3.0%Santa Fe 510 512 0.4% 2.1%Sierra 362 368 1.7% 1.5%Socorro 600 605 0.8% 2.5%Taos 595 593 -0.3% 2.4%Torrance 599 602 0.5% 2.4%Union 459 466 1.5% 1.9%Valencia 909 910 0.1% 3.7%
Estimates are based on the 2007 North American Industry Classification System (NAICS).
Excludes limited partners.
Source: U.S. Department of Commerce, Bureau of Economic Analysis, Regional Economic Information System .http://www.bea.gov/regional/reisTable CA25N, 0070 - Farm Employment.
Data revised: April 2011.
Revised: February 2012.
Farm Employment in New Mexico2008 and 2009
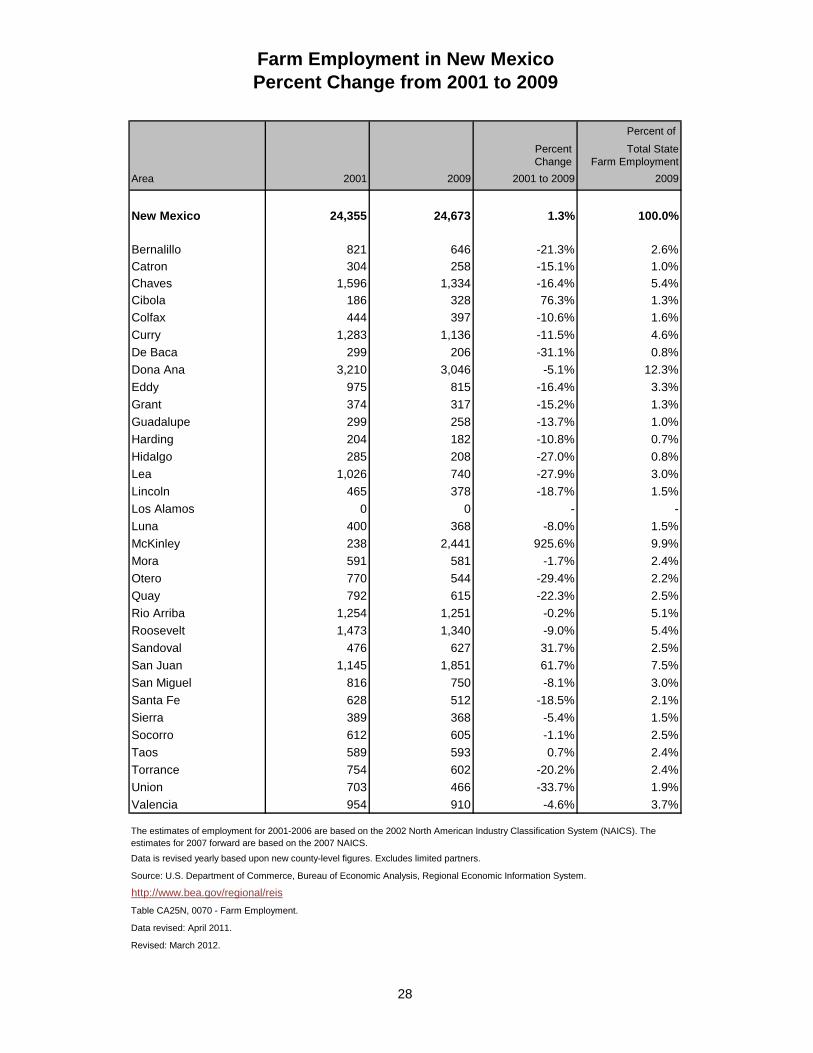
28
Percent of
Percent Total StateChange Farm Employment
Area 2001 2009 2001 to 2009 2009
New Mexico 24,355 24,673 1.3% 100.0%
Bernalillo 821 646 -21.3% 2.6%Catron 304 258 -15.1% 1.0%Chaves 1,596 1,334 -16.4% 5.4%Cibola 186 328 76.3% 1.3%Colfax 444 397 -10.6% 1.6%Curry 1,283 1,136 -11.5% 4.6%De Baca 299 206 -31.1% 0.8%Dona Ana 3,210 3,046 -5.1% 12.3%Eddy 975 815 -16.4% 3.3%Grant 374 317 -15.2% 1.3%Guadalupe 299 258 -13.7% 1.0%Harding 204 182 -10.8% 0.7%Hidalgo 285 208 -27.0% 0.8%Lea 1,026 740 -27.9% 3.0%Lincoln 465 378 -18.7% 1.5%Los Alamos 0 0 - -Luna 400 368 -8.0% 1.5%McKinley 238 2,441 925.6% 9.9%Mora 591 581 -1.7% 2.4%Otero 770 544 -29.4% 2.2%Quay 792 615 -22.3% 2.5%Rio Arriba 1,254 1,251 -0.2% 5.1%Roosevelt 1,473 1,340 -9.0% 5.4%Sandoval 476 627 31.7% 2.5%San Juan 1,145 1,851 61.7% 7.5%San Miguel 816 750 -8.1% 3.0%Santa Fe 628 512 -18.5% 2.1%Sierra 389 368 -5.4% 1.5%Socorro 612 605 -1.1% 2.5%Taos 589 593 0.7% 2.4%Torrance 754 602 -20.2% 2.4%Union 703 466 -33.7% 1.9%Valencia 954 910 -4.6% 3.7%
Data is revised yearly based upon new county-level figures. Excludes limited partners.
Source: U.S. Department of Commerce, Bureau of Economic Analysis, Regional Economic Information System.
http://www.bea.gov/regional/reisTable CA25N, 0070 - Farm Employment.
Data revised: April 2011.
Revised: March 2012.
The estimates of employment for 2001-2006 are based on the 2002 North American Industry Classification System (NAICS). The estimates for 2007 forward are based on the 2007 NAICS.
Farm Employment in New MexicoPercent Change from 2001 to 2009
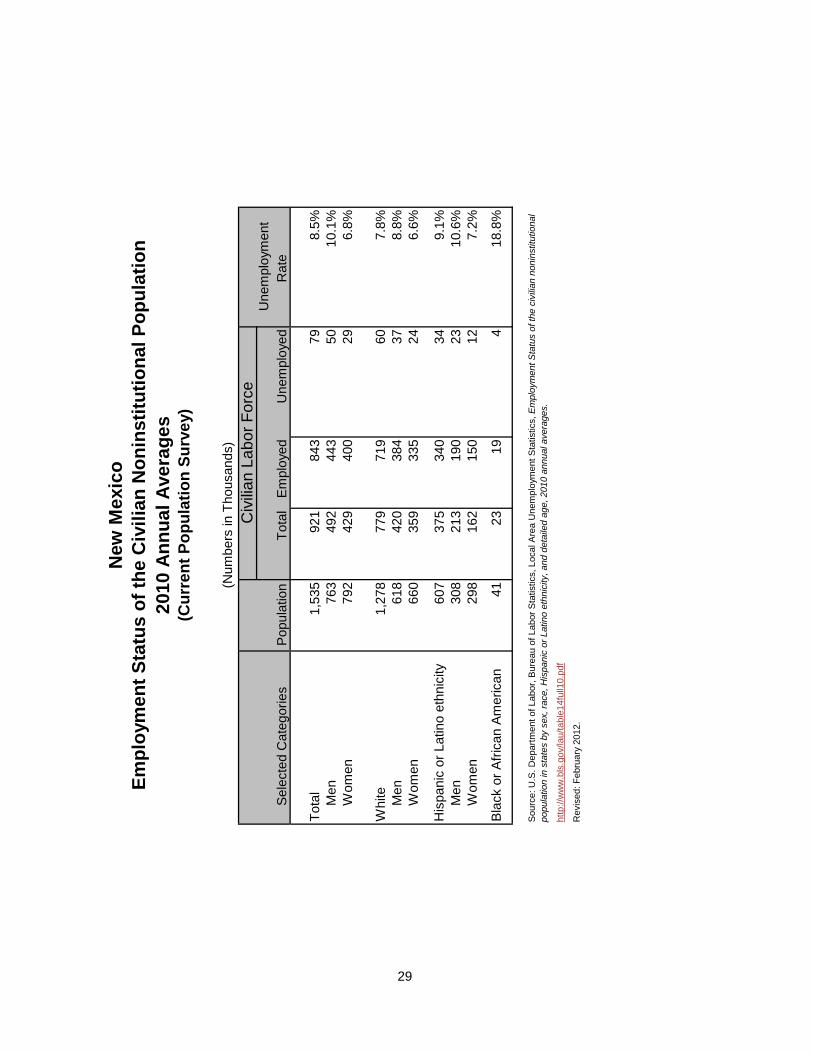
Une
mpl
oym
ent
Sele
cted
Cat
egor
ies
Popu
latio
nTo
tal
Empl
oyed
Une
mpl
oyed
Rat
e
Tota
l1,
535
921
843
798.
5%M
en76
349
244
350
10.1
%W
omen
792
429
400
296.
8%
Whi
te1,
278
779
719
607.
8%M
en61
842
038
437
8.8%
Wom
en66
035
933
524
6.6%
His
pani
c or
Lat
ino
ethn
icity
60
737
534
034
9.1%
Men
308
213
190
2310
.6%
Wom
en29
816
215
012
7.2%
Blac
k or
Afri
can
Amer
ican
4123
194
18.8
%
http
://w
ww
.bls
.gov
/lau/
tabl
e14f
ull1
0.pd
f
Rev
ised
: Feb
ruar
y 20
12.
Sou
rce:
U.S
. Dep
artm
ent o
f Lab
or, B
urea
u of
Lab
or S
tatis
tics,
Loc
al A
rea
Une
mpl
oym
ent S
tatis
tics,
Em
ploy
men
t Sta
tus
of th
e ci
vilia
n no
nins
titut
iona
l po
pula
tion
in s
tate
s by
sex
, rac
e, H
ispa
nic
or L
atin
o et
hnic
ity, a
nd d
etai
led
age,
201
0 an
nual
ave
rage
s.
(Num
bers
in T
hous
ands
)
29
Civ
ilian
Labo
r For
ce
New
Mex
ico
Empl
oym
ent S
tatu
s of
the
Civ
ilian
Non
inst
itutio
nal P
opul
atio
n20
10 A
nnua
l Ave
rage
s(C
urre
nt P
opul
atio
n Su
rvey
)
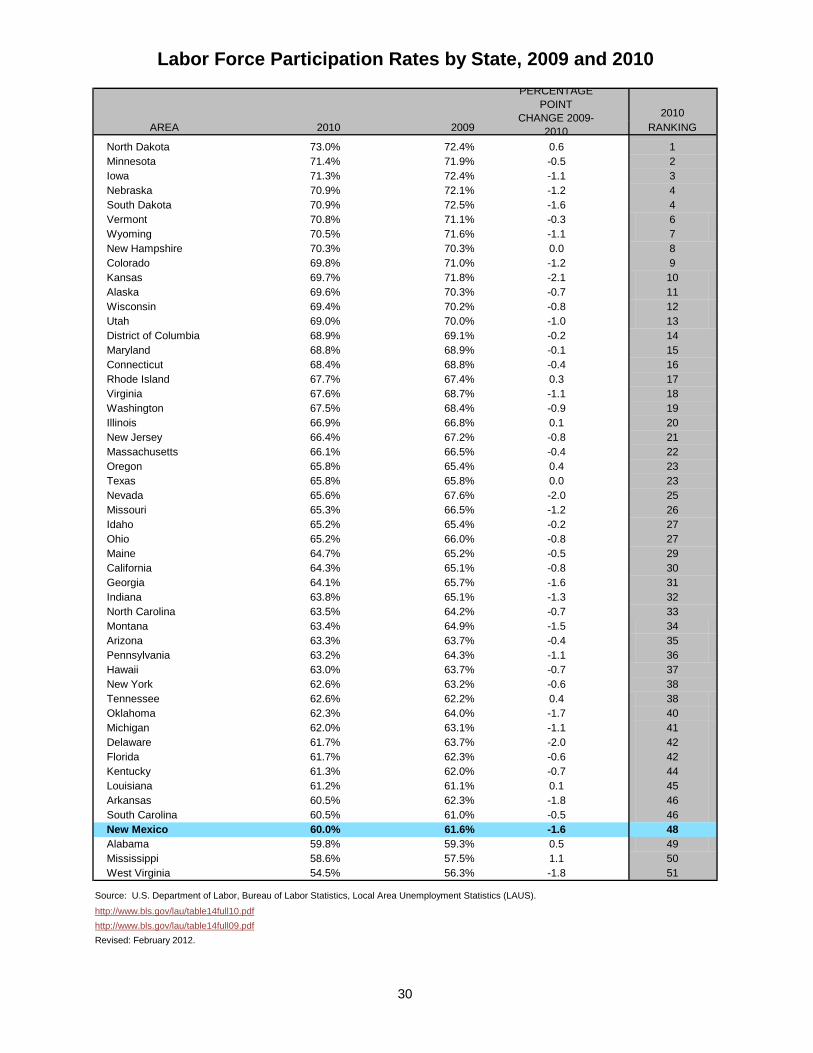
30
2010AREA 2010 2009 RANKING
North Dakota 73.0% 72.4% 0.6 1Minnesota 71.4% 71.9% -0.5 2Iowa 71.3% 72.4% -1.1 3Nebraska 70.9% 72.1% -1.2 4South Dakota 70.9% 72.5% -1.6 4Vermont 70.8% 71.1% -0.3 6Wyoming 70.5% 71.6% -1.1 7New Hampshire 70.3% 70.3% 0.0 8Colorado 69.8% 71.0% -1.2 9Kansas 69.7% 71.8% -2.1 10Alaska 69.6% 70.3% -0.7 11Wisconsin 69.4% 70.2% -0.8 12Utah 69.0% 70.0% -1.0 13District of Columbia 68.9% 69.1% -0.2 14Maryland 68.8% 68.9% -0.1 15Connecticut 68.4% 68.8% -0.4 16Rhode Island 67.7% 67.4% 0.3 17Virginia 67.6% 68.7% -1.1 18Washington 67.5% 68.4% -0.9 19Illinois 66.9% 66.8% 0.1 20New Jersey 66.4% 67.2% -0.8 21Massachusetts 66.1% 66.5% -0.4 22Oregon 65.8% 65.4% 0.4 23Texas 65.8% 65.8% 0.0 23Nevada 65.6% 67.6% -2.0 25Missouri 65.3% 66.5% -1.2 26Idaho 65.2% 65.4% -0.2 27Ohio 65.2% 66.0% -0.8 27Maine 64.7% 65.2% -0.5 29California 64.3% 65.1% -0.8 30Georgia 64.1% 65.7% -1.6 31Indiana 63.8% 65.1% -1.3 32North Carolina 63.5% 64.2% -0.7 33Montana 63.4% 64.9% -1.5 34Arizona 63.3% 63.7% -0.4 35Pennsylvania 63.2% 64.3% -1.1 36Hawaii 63.0% 63.7% -0.7 37New York 62.6% 63.2% -0.6 38Tennessee 62.6% 62.2% 0.4 38Oklahoma 62.3% 64.0% -1.7 40Michigan 62.0% 63.1% -1.1 41Delaware 61.7% 63.7% -2.0 42Florida 61.7% 62.3% -0.6 42Kentucky 61.3% 62.0% -0.7 44Louisiana 61.2% 61.1% 0.1 45Arkansas 60.5% 62.3% -1.8 46South Carolina 60.5% 61.0% -0.5 46New Mexico 60.0% 61.6% -1.6 48Alabama 59.8% 59.3% 0.5 49Mississippi 58.6% 57.5% 1.1 50West Virginia 54.5% 56.3% -1.8 51
Source: U.S. Department of Labor, Bureau of Labor Statistics, Local Area Unemployment Statistics (LAUS).
http://www.bls.gov/lau/table14full10.pdfhttp://www.bls.gov/lau/table14full09.pdfRevised: February 2012.
Labor Force Participation Rates by State, 2009 and 2010PERCENTAGE
POINT CHANGE 2009-
2010
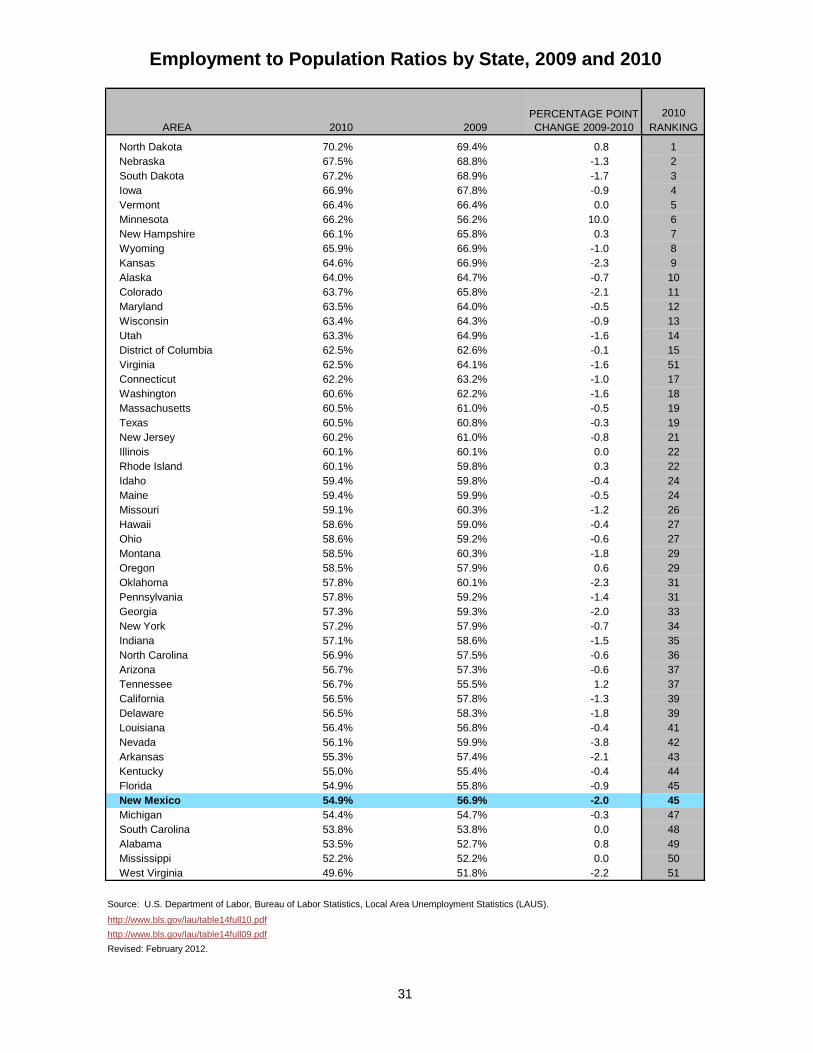
31
2010AREA 2010 2009 RANKING
North Dakota 70.2% 69.4% 0.8 1Nebraska 67.5% 68.8% -1.3 2South Dakota 67.2% 68.9% -1.7 3Iowa 66.9% 67.8% -0.9 4Vermont 66.4% 66.4% 0.0 5Minnesota 66.2% 56.2% 10.0 6New Hampshire 66.1% 65.8% 0.3 7Wyoming 65.9% 66.9% -1.0 8Kansas 64.6% 66.9% -2.3 9Alaska 64.0% 64.7% -0.7 10Colorado 63.7% 65.8% -2.1 11Maryland 63.5% 64.0% -0.5 12Wisconsin 63.4% 64.3% -0.9 13Utah 63.3% 64.9% -1.6 14District of Columbia 62.5% 62.6% -0.1 15Virginia 62.5% 64.1% -1.6 51Connecticut 62.2% 63.2% -1.0 17Washington 60.6% 62.2% -1.6 18Massachusetts 60.5% 61.0% -0.5 19Texas 60.5% 60.8% -0.3 19New Jersey 60.2% 61.0% -0.8 21Illinois 60.1% 60.1% 0.0 22Rhode Island 60.1% 59.8% 0.3 22Idaho 59.4% 59.8% -0.4 24Maine 59.4% 59.9% -0.5 24Missouri 59.1% 60.3% -1.2 26Hawaii 58.6% 59.0% -0.4 27Ohio 58.6% 59.2% -0.6 27Montana 58.5% 60.3% -1.8 29Oregon 58.5% 57.9% 0.6 29Oklahoma 57.8% 60.1% -2.3 31Pennsylvania 57.8% 59.2% -1.4 31Georgia 57.3% 59.3% -2.0 33New York 57.2% 57.9% -0.7 34Indiana 57.1% 58.6% -1.5 35North Carolina 56.9% 57.5% -0.6 36Arizona 56.7% 57.3% -0.6 37Tennessee 56.7% 55.5% 1.2 37California 56.5% 57.8% -1.3 39Delaware 56.5% 58.3% -1.8 39Louisiana 56.4% 56.8% -0.4 41Nevada 56.1% 59.9% -3.8 42Arkansas 55.3% 57.4% -2.1 43Kentucky 55.0% 55.4% -0.4 44Florida 54.9% 55.8% -0.9 45New Mexico 54.9% 56.9% -2.0 45Michigan 54.4% 54.7% -0.3 47South Carolina 53.8% 53.8% 0.0 48Alabama 53.5% 52.7% 0.8 49Mississippi 52.2% 52.2% 0.0 50West Virginia 49.6% 51.8% -2.2 51
Source: U.S. Department of Labor, Bureau of Labor Statistics, Local Area Unemployment Statistics (LAUS).
http://www.bls.gov/lau/table14full10.pdfhttp://www.bls.gov/lau/table14full09.pdfRevised: February 2012.
Employment to Population Ratios by State, 2009 and 2010
PERCENTAGE POINT CHANGE 2009-2010
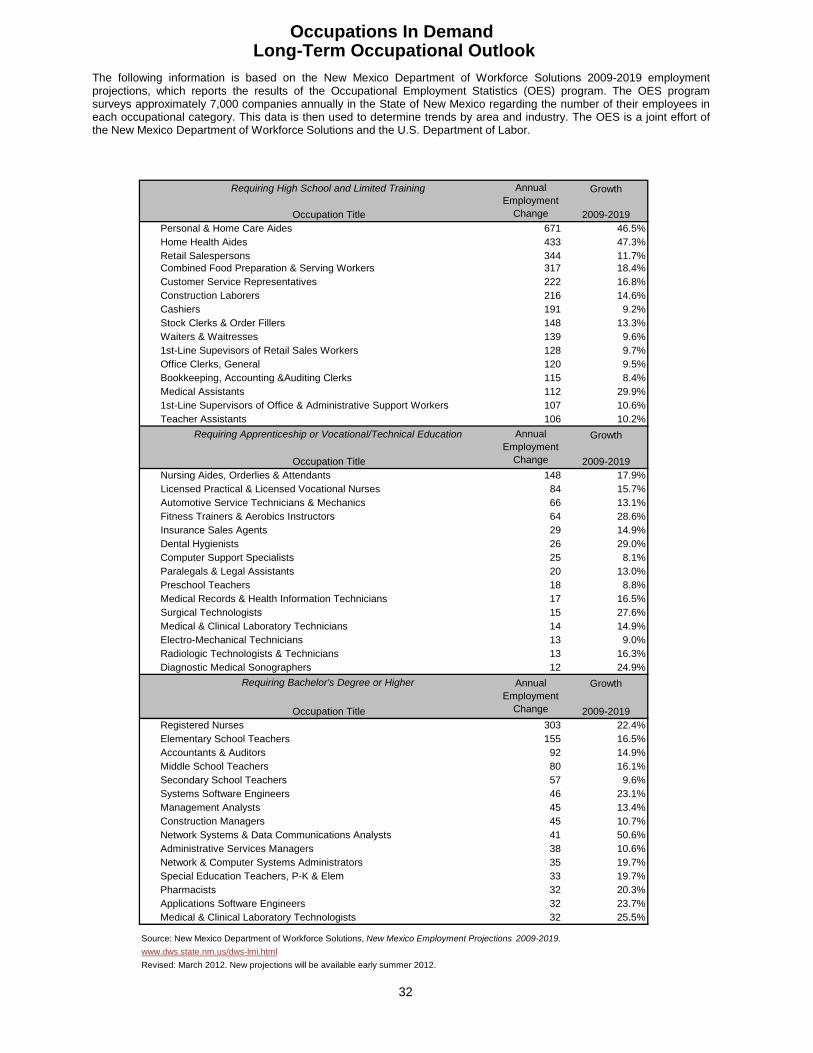
Requiring High School and Limited Training Growth
Occupation Title 2009-2019Personal & Home Care Aides 671 46.5%Home Health Aides 433 47.3%Retail Salespersons 344 11.7%Combined Food Preparation & Serving Workers 317 18.4%Customer Service Representatives 222 16.8%Construction Laborers 216 14.6%Cashiers 191 9.2%Stock Clerks & Order Fillers 148 13.3%Waiters & Waitresses 139 9.6%1st-Line Supevisors of Retail Sales Workers 128 9.7%Office Clerks, General 120 9.5%Bookkeeping, Accounting &Auditing Clerks 115 8.4%Medical Assistants 112 29.9%1st-Line Supervisors of Office & Administrative Support Workers 107 10.6%Teacher Assistants 106 10.2%
Requiring Apprenticeship or Vocational/Technical Education Growth
Occupation Title 2009-2019Nursing Aides, Orderlies & Attendants 148 17.9%Licensed Practical & Licensed Vocational Nurses 84 15.7%Automotive Service Technicians & Mechanics 66 13.1%Fitness Trainers & Aerobics Instructors 64 28.6%Insurance Sales Agents 29 14.9%Dental Hygienists 26 29.0%Computer Support Specialists 25 8.1%Paralegals & Legal Assistants 20 13.0%Preschool Teachers 18 8.8%Medical Records & Health Information Technicians 17 16.5%Surgical Technologists 15 27.6%Medical & Clinical Laboratory Technicians 14 14.9%Electro-Mechanical Technicians 13 9.0%Radiologic Technologists & Technicians 13 16.3%Diagnostic Medical Sonographers 12 24.9%
Requiring Bachelor's Degree or Higher Growth
Occupation Title 2009-2019Registered Nurses 303 22.4%Elementary School Teachers 155 16.5%Accountants & Auditors 92 14.9%Middle School Teachers 80 16.1%Secondary School Teachers 57 9.6%Systems Software Engineers 46 23.1%Management Analysts 45 13.4%Construction Managers 45 10.7%Network Systems & Data Communications Analysts 41 50.6%Administrative Services Managers 38 10.6%Network & Computer Systems Administrators 35 19.7%Special Education Teachers, P-K & Elem 33 19.7%Pharmacists 32 20.3%Applications Software Engineers 32 23.7%Medical & Clinical Laboratory Technologists 32 25.5%
Source: New Mexico Department of Workforce Solutions, New Mexico Employment Projections 2009-2019.www.dws.state.nm.us/dws-lmi.htmlRevised: March 2012. New projections will be available early summer 2012.
Annual Employment
Change
Occupations In Demand Long-Term Occupational Outlook
Annual Employment
Change
Annual Employment
Change
32
The following information is based on the New Mexico Department of Workforce Solutions 2009-2019 employment projections, which reports the results of the Occupational Employment Statistics (OES) program. The OES program surveys approximately 7,000 companies annually in the State of New Mexico regarding the number of their employees in each occupational category. This data is then used to determine trends by area and industry. The OES is a joint effort of the New Mexico Department of Workforce Solutions and the U.S. Department of Labor.

33
SOC Average Annual %Code Occupational Title Wages Openings Change
31-1011 Home Health Aides $19,870 524 47.3%39-9021 Personal & Home Care Aides $19,060 851 46.5%29-2052 Pharmacy Technicians $29,870 121 34.2%31-9092 Medical Assistants $27,100 154 29.9%39-9031 Fitness Trainers & Aerobics Instructors $32,660 104 28.6%29-1111 Registered Nurses $64,750 539 22.4%43-4081 Hotel, Motel & Resort Desk Clerks $19,890 195 21.8%35-3021 Combined Food Preparation & Serving Workers $17,420 682 18.4%31-1012 Nursing Aides, Orderlies & Attendants $23,410 230 17.9%43-4051 Customer Service Representatives $28,680 638 16.8%25-2021 Elementary School Teachers $51,890 369 16.5%25-2022 Middle School Teachers $52,640 193 16.1%29-2061 Licensed Practical Nurses $50,690 252 15.7%13-2011 Accountants & Auditors $61,750 197 14.9%47-2061 Construction Laborers $24,750 315 14.6%35-9021 Dishwashers $18,270 215 14.2%13-1111 Management Analysts $83,860 103 13.4%43-5081 Stock Clerks & Order Fillers $22,220 404 13.3%49-3023 Automotive Service Technicians $34,570 162 13.1%35-3022 Counter Attendants, Cafeteria & Coffee Shop $17,830 308 12.6%33-3012 Correctional Officers & Jailers $37,510 132 11.7%49-9042 Maintenance & Repair Workers, General $33,010 238 11.7%41-2031 Retail Salespersons $24,000 1,167 11.7%35-3011 Bartenders $18,170 137 11.4%19-3031 Clinical, Counseling & School Psychologists $63,040 105 11.3%35-2011 Cooks, Fast Food $18,440 190 11.3%37-3011 Landscaping & Groundskeeping Workers $22,950 161 11.2%53-3032 Truck Drivers, Heavy & Tractor-Trailer $38,470 254 11.0%35-2014 Cooks, Restaurant $21,250 249 11.0%43-1011 1st-Line Supervisors of Office & Administrative Support Workers $42,570 334 10.6%11-3011 Administrative Services Managers $73,360 112 10.6%33-9032 Security Guards $27,340 230 10.4%47-2073 Construction Equipment Operators $38,490 109 10.4%25-9041 Teacher Assistants $19,780 327 10.2%43-4171 Receptionists & Information Clerks $23,450 323 10.1%47-1011 1st-Line Supervisors of Construction & Extraction Workers $56,100 186 9.9%41-1011 1st-Line Supervisors of Retail Sales Workers $35,450 411 9.7%35-9031 Hosts & Hostesses, Restaurant & Lounge $18,370 170 9.7%43-6011 Executive Secretaries & Administrative Assistants $42,930 124 9.7%25-2031 Secondary School Teachers $55,500 229 9.6%35-3031 Waiters & Waitresses $18,140 939 9.6%43-3071 Tellers $22,700 196 9.5%43-9061 Office Clerks, General $24,360 292 9.5%41-2011 Cashiers $19,710 1,120 9.2%33-3051 Police & Sheriff's Patrol Officers $44,250 121 9.2%35-9011 Dining Room & Cafeteria Attendants $18,390 163 8.5%43-3031 Bookkeeping, Accounting & Auditing Clerks $31,060 280 8.4%15-1041 Computer Support Specialists $46,040 112 8.1%47-2152 Plumbers, Pipefitters & Steamfitters $43,190 119 7.8%
Source: New Mexico Department of Workforce Solutions, Economic Research & Analysis, New Mexico Employment Projections 2009-2019.Average wages obtained from 200902 EDS survey. www.dws.state.nm.us/eds/index.htmlRevised: March 2012. New projections will be available early summer 2012.
Fastest Growing Jobs in New MexicoAverage Wages and Annual Projected Openings

34
SOC Annual AverageCode Occupational Title Openings Wages
41-2031 Retail Salespersons 1,167 $24,00041-2011 Cashiers 1,120 $19,71035-3031 Waiters & Waitresses 939 $18,14039-9021 Personal & Home Care Aides 851 $19,06035-3021 Combined Food Preparation & Serving Workers 682 $17,42043-4051 Customer Service Representatives 638 $28,68029-1111 Registered Nurses 539 $64,75031-1011 Home Health Aides 524 $19,87041-1011 1st-Line Supervisors of Retail Sales Workers 411 $35,45011-1021 General & Operations Managers 407 $92,17043-5081 Stock Clerks & Order Fillers 404 $22,22025-2021 Elementary School Teachers 369 $51,89043-1011 1st-Line Supervisors of Office & Administrative Support Workers 334 $42,57025-9041 Teacher Assistants 327 $19,78053-7062 Laborers & Freight, Stock & Material Movers, Hand 326 $23,75043-4171 Receptionists & Information Clerks 323 $23,45047-2061 Construction Laborers 315 $24,75035-3022 Counter Attendants, Cafeteria & Coffee Shop 308 $17,83043-9061 Office Clerks, General 292 $24,36037-2011 Janitors & Cleaners 282 $21,59043-3031 Bookkeeping, Accounting & Auditing Clerks 280 $31,06043-6014 Secretaries 264 $29,12053-3032 Truck Drivers, Heavy & Tractor-Trailer 254 $38,47029-2061 Licensed Practical Nurses 252 $50,69035-2014 Cooks, Restaurant 249 $21,25037-2012 Maids & Housekeeping Cleaners 244 $19,04049-9042 Maintenance & Repair Workers, General 238 $33,01031-1012 Nursing Aides, Orderlies & Attendants 230 $23,41033-9032 Security Guards 230 $27,34025-2031 Secondary School Teachers 229 $55,50035-9021 Dishwashers 215 $18,27013-2011 Accountants & Auditors 197 $61,75043-3071 Tellers 196 $22,70043-4081 Hotel, Motel & Resort Desk Clerks 195 $19,89025-2022 Middle School Teachers 193 $52,64035-2011 Cooks, Fast Food 190 $18,44047-1011 1st-Line Supervisors of Construction & Extraction Workers 186 $56,10039-9011 Child Care Workers 185 $19,32035-2021 Food Preparation Workers 184 $20,35035-9031 Hosts & Hostesses, Restaurant & Lounge 170 $18,37035-9011 Dining Room & Cafeteria Attendants 163 $18,39049-3023 Automotive Service Technicians 162 $34,57037-3011 Landscaping & Groundskeeping Workers 161 $22,95031-9092 Medical Assistants 154 $27,10035-3011 Bartenders 137 $18,17047-2031 Carpenters 137 $36,33045-2092 Farmworkers & Laborers, Crop, Nursery & Greenhouse 137 $18,44053-3033 Truck Drivers, Light or Delivery Services 134 $29,35041-4012 Sales Representatives, Wholesale & Manufacturing, Except Technical & Scientific Products 133 $53,81033-3012 Correctional Officers & Jailers 132 $37,510
Source: New Mexico Department of Workforce Solutions, Bureau of Economic Research & Analysis, New Mexico Employment Projections 2009-2019.http://www.dws.state.nm.us/eds/index.htmlAverage Wages obtained from 200902 EDS survey panel estimates. Revised: March 2012. New projections will be available early summer 2012.
Occupations with the Most Job Openings in New Mexico

35
IndustryNumber % Change
Total Employment, All Jobs 869,800 958,140 88,340 10.2%
Health Care and Social Assistance 113,080 140,100 27,020 23.9%
Educational Services 81,100 91,240 10,130 12.5%
Accommodation and Food Services 81,640 91,670 10,030 12.3%
Retail Trade 92,470 102,090 9,620 10.4%
Government 93,680 100,720 7,040 7.5%
Professional, Scientific, and Technical Services 56,150 62,250 6,100 10.9%
Construction 51,700 57,450 5,760 11.1%
Administrative, Support, and Waste Management Services 45,810 50,690 4,870 10.6%
Other Services (Except Government) 21,410 24,240 2,830 13.2%
Finance and Insurance 22,140 23,890 1,750 7.9%
Mining 19,450 21,180 1,730 8.9%
Arts, Entertainment, and Recreation 13,970 15,400 1,430 10.2%
Real Estate and Rental and Leasing 9,950 11,180 1,230 12.4%
Management of Companies and Enterprises 5,080 5,500 420 8.2%
Wholesale Trade 22,480 22,670 200 0.9%
Utilities 4,610 4,770 160 3.4%
Information 14,720 13,960 -760 -5.2%
Agriculture, Forestry, Fishing and Hunting 10,700 9,790 -910 -8.5%
Manufacturing 30,880 27,320 -3,560 -11.5%
Source: New Mexico Department of Workforce Solutions, Bureau of Economic Research and Analysis, Industry Employment Projections 2009-2019.
http://laser.state.nm.us/Details may not sum to totals due to rounding.Revised: March 2012. New projections will be available early summer 2012.
Estimated & Projected Wage and Salary EmploymentNew Mexico
2009
Projected Employment
2019
Change in Employment
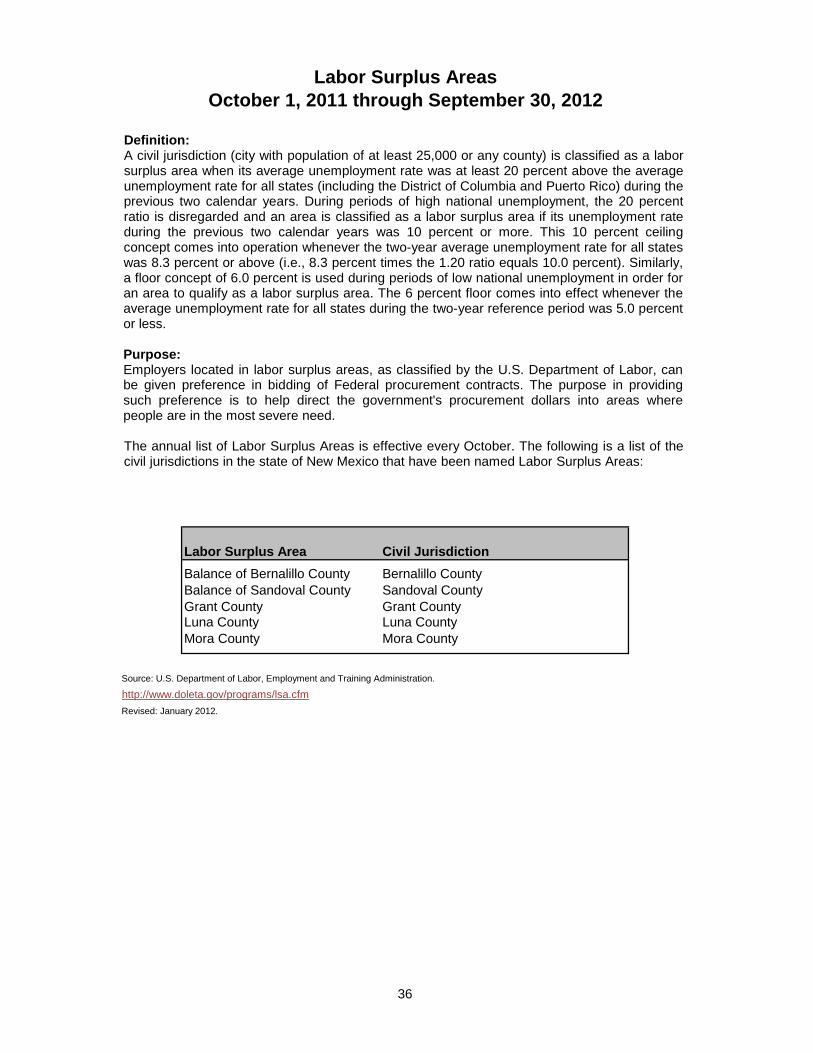
36
Labor Surplus Area Civil JurisdictionBalance of Bernalillo County Bernalillo CountyBalance of Sandoval County Sandoval CountyGrant County Grant CountyLuna County Luna CountyMora County Mora County
Source: U.S. Department of Labor, Employment and Training Administration.
http://www.doleta.gov/programs/lsa.cfmRevised: January 2012.
Labor Surplus AreasOctober 1, 2011 through September 30, 2012
Definition: A civil jurisdiction (city with population of at least 25,000 or any county) is classified as a labor surplus area when its average unemployment rate was at least 20 percent above the average unemployment rate for all states (including the District of Columbia and Puerto Rico) during the previous two calendar years. During periods of high national unemployment, the 20 percent ratio is disregarded and an area is classified as a labor surplus area if its unemployment rate during the previous two calendar years was 10 percent or more. This 10 percent ceiling concept comes into operation whenever the two-year average unemployment rate for all states was 8.3 percent or above (i.e., 8.3 percent times the 1.20 ratio equals 10.0 percent). Similarly, a floor concept of 6.0 percent is used during periods of low national unemployment in order for an area to qualify as a labor surplus area. The 6 percent floor comes into effect whenever the average unemployment rate for all states during the two-year reference period was 5.0 percent or less. Purpose: Employers located in labor surplus areas, as classified by the U.S. Department of Labor, can be given preference in bidding of Federal procurement contracts. The purpose in providing such preference is to help direct the government's procurement dollars into areas where people are in the most severe need. The annual list of Labor Surplus Areas is effective every October. The following is a list of the civil jurisdictions in the state of New Mexico that have been named Labor Surplus Areas:

37
Revised: March 2012.
Income Personal income, an indicator produced by the U.S. Department of Commerce, is a major index of economic well-being and is broadly defined as the current income received by residents of an area from all sources. The components of personal income are net earnings (adjusted for residence), transfer payments, dividends, interest and rent. Per capita income is average income per person and is calculated by dividing total personal income by the resident population. In comparison to other states, New Mexico continues to rank low in terms of per capita income, despite growth in this area. New Mexico's 2011 per capita income of $34,575 was approximately 83% of the national figure of $41,663 and ranked 43rd of the 50 states. The rapid growth of the New Mexico population makes progress in per capita income an uphill struggle, since such growth in population would require even faster personal income growth to improve the state's standing. Annual average pay is calculated by the U.S. Department of Labor's Bureau of Labor Statistics from reports filed by employers under the Unemployment Insurance program. Annual average pay is computed by dividing total annual payrolls of employees covered by the Unemployment Insurance program by average monthly employment for these employees. Hourly average (mean) is computed by taking the annual number and dividing it by 2,080 (standard working hours in a year). In 2011, the average wage of $40,799 was greater than the median, indicating that more individuals fell below the average. More than half of New Mexico's population earned an annual income of less than $31,040. Price inflation reduces the purchasing power of personal income. The Consumer Price Index (CPI) is a measure of inflation, and is produced monthly by the U.S. Department of Labor. The CPI is based on the cost of a market basket of goods and services purchased by a typical consumer. The cost of the market basket of goods in the current month is divided by the cost of the same market basket in the base year to yield an index figure. The CPI table lists the CPI for two population groups: All Urban Consumers (CPI-U) and Urban Wage and Clerical Workers (CPI-W).

38
% of State 2008-2009 %Area 2007 2008 2009 Average Change Change
New Mexico $32,018 $33,609 $33,267 100.0 -$342 -1.0
Albuquerque, NM $34,528 $35,608 $35,329 106.2 -$279 -0.8Farmington, NM $29,183 $31,893 $30,702 92.3 -$1,191 -3.7Las Cruces, NM $26,725 $27,848 $28,165 84.7 $317 1.1Santa Fe, NM $43,292 $44,423 $42,645 128.2 -$1,778 -4.0Bernalillo, NM $36,186 $37,235 $36,825 110.7 -$410 -1.1Catron, NM $22,491 $24,532 $25,872 77.8 $1,340 5.5Chaves, NM $29,128 $31,636 $29,891 89.9 -$1,745 -5.5Cibola, NM $22,580 $24,084 $24,795 74.5 $711 3.0Colfax, NM $30,200 $32,481 $33,528 100.8 $1,047 3.2Curry, NM $32,595 $35,095 $35,390 106.4 $295 0.8De Baca, NM $28,630 $33,020 $34,718 104.4 $1,698 5.1Dona Ana, NM $26,725 $27,848 $28,165 84.7 $317 1.1Eddy, NM $35,308 $39,600 $38,731 116.4 -$869 -2.2Grant, NM $27,846 $30,233 $29,713 89.3 -$520 -1.7Guadalupe, NM $20,710 $23,194 $24,981 75.1 $1,787 7.7Harding, NM $29,385 $35,355 $33,774 101.5 -$1,581 -4.5Hidalgo, NM $25,253 $28,394 $28,772 86.5 $378 1.3Lea, NM $34,033 $38,622 $34,971 105.1 -$3,651 -9.5Lincoln, NM $27,565 $29,023 $29,428 88.5 $405 1.4Los Alamos, NM $56,774 $60,335 $59,936 180.2 -$399 -0.7Luna, NM $22,342 $23,517 $24,275 73.0 $758 3.2McKinley, NM $21,667 $22,601 $23,622 71.0 $1,021 4.5Mora, NM $21,233 $23,187 $24,430 73.4 $1,243 5.4Otero, NM $24,382 $25,390 $26,653 80.1 $1,263 5.0Quay, NM $27,356 $28,732 $29,707 89.3 $975 3.4Rio Arriba, NM $25,571 $27,090 $27,619 83.0 $529 2.0Roosevelt, NM $28,237 $30,673 $28,309 85.1 -$2,364 -7.7Sandoval, NM $30,833 $31,907 $32,172 96.7 $265 0.8San Juan, NM $29,183 $31,893 $30,702 92.3 -$1,191 -3.7San Miguel, NM $27,515 $29,624 $30,731 92.4 $1,107 3.7Santa Fe, NM $43,292 $44,423 $42,645 128.2 -$1,778 -4.0Sierra, NM $25,277 $27,221 $27,457 82.5 $236 0.9Socorro, NM $25,521 $27,562 $27,739 83.4 $177 0.6Taos, NM $30,786 $31,778 $31,792 95.6 $14 0.0Torrance, NM $26,565 $28,679 $28,909 86.9 $230 0.8Union, NM $27,975 $31,293 $31,378 94.3 $85 0.3Valencia, NM $27,878 $29,149 $29,057 87.3 -$92 -0.3
Revised: February 2012.
Source: Bureau of Economic Analysis, Regional Economic Accounts .
Per Capita Personal Income by County and MSA
www.bea.gov/regional/reis/
Release date: April 2011.Table CA1-3—Personal income, population, per capita personal income.
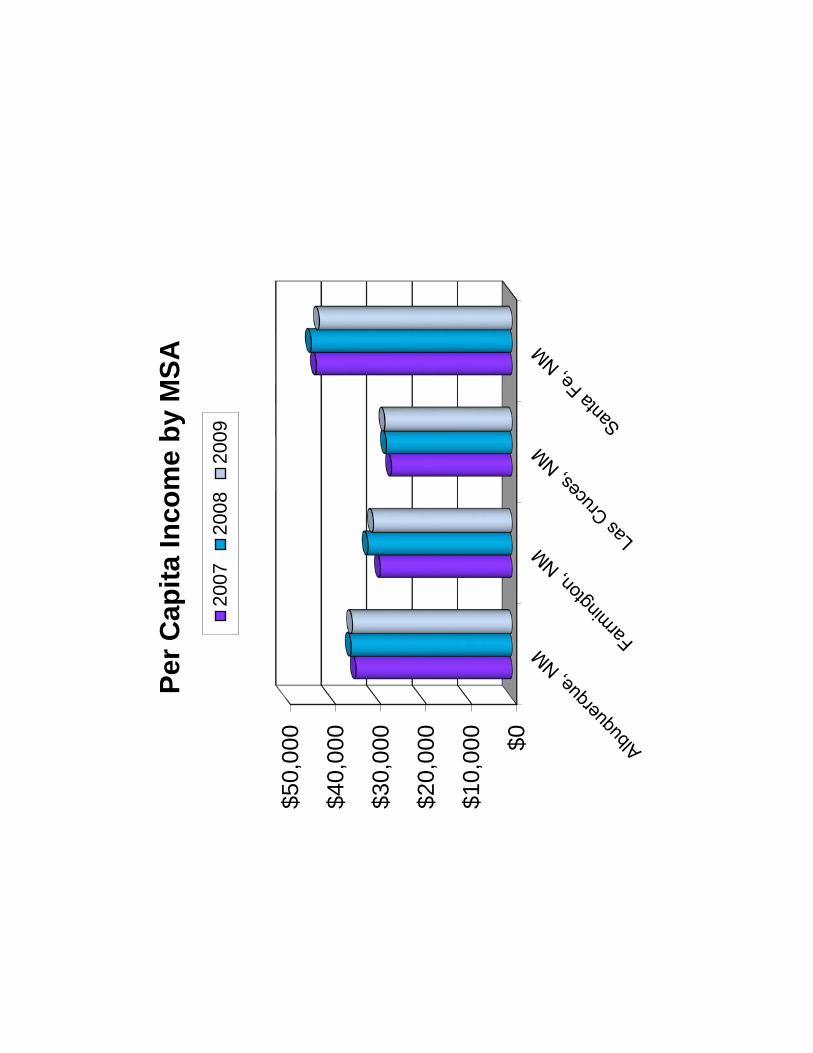
$0
$10,
000
$20,
000
$30,
000
$40,
000
$50,
000
Per C
apita
Inco
me
by M
SA
2007
2008
2009
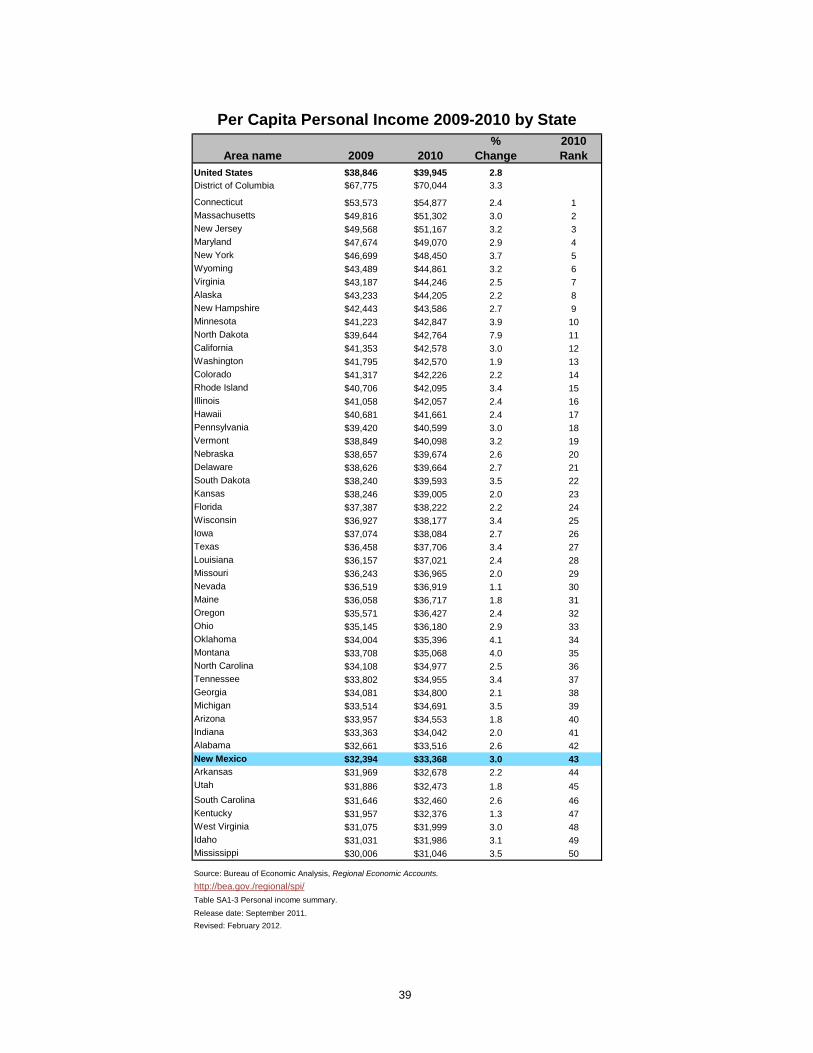
39
Area name 2009 2010%
Change2010 Rank
United States $38,846 $39,945 2.8District of Columbia $67,775 $70,044 3.3
Connecticut $53,573 $54,877 2.4 1Massachusetts $49,816 $51,302 3.0 2New Jersey $49,568 $51,167 3.2 3Maryland $47,674 $49,070 2.9 4New York $46,699 $48,450 3.7 5Wyoming $43,489 $44,861 3.2 6Virginia $43,187 $44,246 2.5 7Alaska $43,233 $44,205 2.2 8New Hampshire $42,443 $43,586 2.7 9Minnesota $41,223 $42,847 3.9 10North Dakota $39,644 $42,764 7.9 11California $41,353 $42,578 3.0 12Washington $41,795 $42,570 1.9 13Colorado $41,317 $42,226 2.2 14Rhode Island $40,706 $42,095 3.4 15Illinois $41,058 $42,057 2.4 16Hawaii $40,681 $41,661 2.4 17Pennsylvania $39,420 $40,599 3.0 18Vermont $38,849 $40,098 3.2 19Nebraska $38,657 $39,674 2.6 20Delaware $38,626 $39,664 2.7 21South Dakota $38,240 $39,593 3.5 22Kansas $38,246 $39,005 2.0 23Florida $37,387 $38,222 2.2 24Wisconsin $36,927 $38,177 3.4 25Iowa $37,074 $38,084 2.7 26Texas $36,458 $37,706 3.4 27Louisiana $36,157 $37,021 2.4 28Missouri $36,243 $36,965 2.0 29Nevada $36,519 $36,919 1.1 30Maine $36,058 $36,717 1.8 31Oregon $35,571 $36,427 2.4 32Ohio $35,145 $36,180 2.9 33Oklahoma $34,004 $35,396 4.1 34Montana $33,708 $35,068 4.0 35North Carolina $34,108 $34,977 2.5 36Tennessee $33,802 $34,955 3.4 37Georgia $34,081 $34,800 2.1 38Michigan $33,514 $34,691 3.5 39Arizona $33,957 $34,553 1.8 40Indiana $33,363 $34,042 2.0 41Alabama $32,661 $33,516 2.6 42New Mexico $32,394 $33,368 3.0 43Arkansas $31,969 $32,678 2.2 44Utah $31,886 $32,473 1.8 45South Carolina $31,646 $32,460 2.6 46Kentucky $31,957 $32,376 1.3 47West Virginia $31,075 $31,999 3.0 48Idaho $31,031 $31,986 3.1 49Mississippi $30,006 $31,046 3.5 50
Revised: February 2012.
Per Capita Personal Income 2009-2010 by State
Source: Bureau of Economic Analysis, Regional Economic Accounts.
http://bea.gov./regional/spi/Table SA1-3 Personal income summary.Release date: September 2011.

40
BEA Region 2009 2010 Numeric Change % ChangeSoutheast $35,248 $36,111 $863 2.4Mideast $45,527 $47,057 $1,530 3.4Great Lakes $36,399 $37,434 $1,035 2.8Plains $38,339 $39,473 $1,134 3.0New England $47,659 $48,989 $1,330 2.8Southwest $35,556 $36,696 $1,140 3.2Far West $40,746 $41,837 $1,091 2.7Rocky Mountain $36,875 $37,772 $897 2.4
http://bea.gov./regional/spi/
Table SA1-3 Personal income summary.
Release date: September 2011.
Revised: December 2011.
Per Capita Personal Income 2009 and 2010 by BEA Region
Source: Bureau of Economic Analysis, Regional Economic Accounts.
2.4
3.4
2.8 3.0 2.8 3.2
2.7 2.4
0.0
0.5
1.0
1.5
2.0
2.5
3.0
3.5
4.0
Per Capita Personal Income Growth 2009-2010 by BEA Region
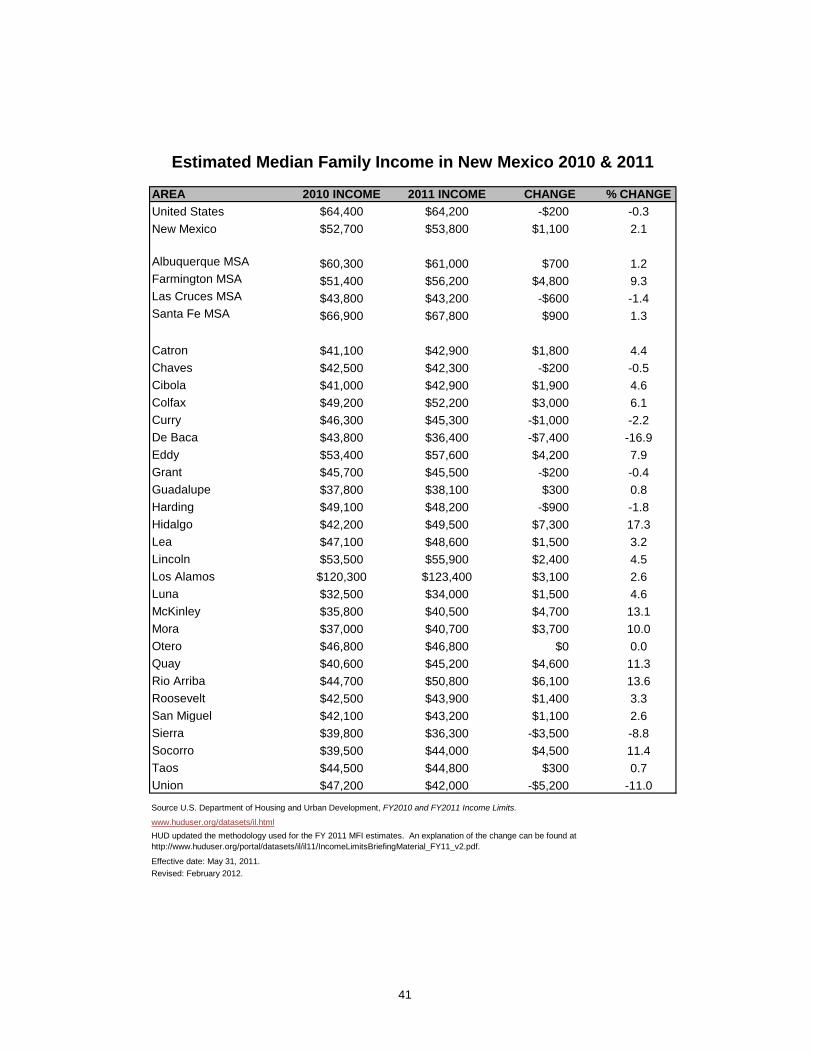
41
AREA 2010 INCOME 2011 INCOME CHANGE % CHANGEUnited States $64,400 $64,200 -$200 -0.3New Mexico $52,700 $53,800 $1,100 2.1
Albuquerque MSA $60,300 $61,000 $700 1.2Farmington MSA $51,400 $56,200 $4,800 9.3Las Cruces MSA $43,800 $43,200 -$600 -1.4Santa Fe MSA $66,900 $67,800 $900 1.3
Catron $41,100 $42,900 $1,800 4.4Chaves $42,500 $42,300 -$200 -0.5Cibola $41,000 $42,900 $1,900 4.6Colfax $49,200 $52,200 $3,000 6.1Curry $46,300 $45,300 -$1,000 -2.2De Baca $43,800 $36,400 -$7,400 -16.9Eddy $53,400 $57,600 $4,200 7.9Grant $45,700 $45,500 -$200 -0.4Guadalupe $37,800 $38,100 $300 0.8Harding $49,100 $48,200 -$900 -1.8Hidalgo $42,200 $49,500 $7,300 17.3Lea $47,100 $48,600 $1,500 3.2Lincoln $53,500 $55,900 $2,400 4.5Los Alamos $120,300 $123,400 $3,100 2.6Luna $32,500 $34,000 $1,500 4.6McKinley $35,800 $40,500 $4,700 13.1Mora $37,000 $40,700 $3,700 10.0Otero $46,800 $46,800 $0 0.0Quay $40,600 $45,200 $4,600 11.3Rio Arriba $44,700 $50,800 $6,100 13.6Roosevelt $42,500 $43,900 $1,400 3.3San Miguel $42,100 $43,200 $1,100 2.6Sierra $39,800 $36,300 -$3,500 -8.8Socorro $39,500 $44,000 $4,500 11.4Taos $44,500 $44,800 $300 0.7Union $47,200 $42,000 -$5,200 -11.0
Effective date: May 31, 2011. Revised: February 2012.
Estimated Median Family Income in New Mexico 2010 & 2011
Source U.S. Department of Housing and Urban Development, FY2010 and FY2011 Income Limits.
www.huduser.org/datasets/il.htmlHUD updated the methodology used for the FY 2011 MFI estimates. An explanation of the change can be found at http://www.huduser.org/portal/datasets/il/il11/IncomeLimitsBriefingMaterial_FY11_v2.pdf.

$0
$10,000
$20,000
$30,000
$40,000
$50,000
$60,000
$70,000
2010 INCOME 2011 INCOME
$64,400 $64,200
$52,700 $53,800
Estimated Median Family Income
United States New Mexico
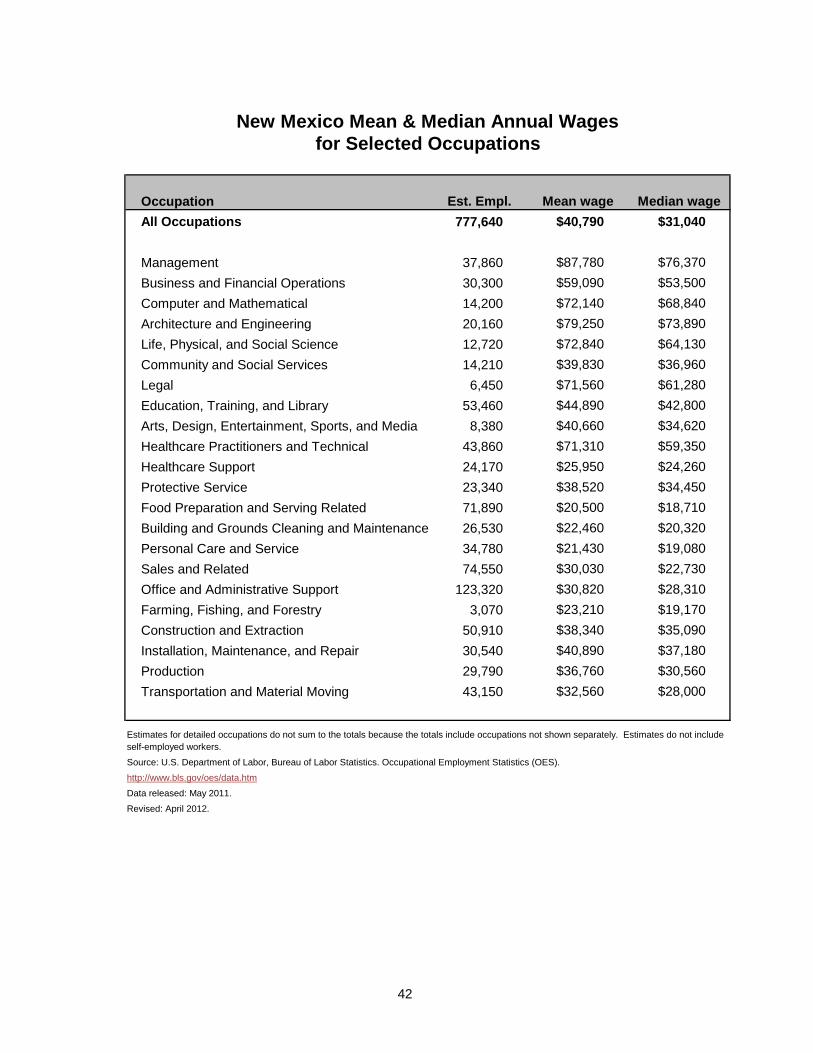
42
Occupation Est. Empl. Mean wage Median wageAll Occupations 777,640 $40,790 $31,040
Management 37,860 $87,780 $76,370 Business and Financial Operations 30,300 $59,090 $53,500 Computer and Mathematical 14,200 $72,140 $68,840 Architecture and Engineering 20,160 $79,250 $73,890 Life, Physical, and Social Science 12,720 $72,840 $64,130 Community and Social Services 14,210 $39,830 $36,960 Legal 6,450 $71,560 $61,280 Education, Training, and Library 53,460 $44,890 $42,800 Arts, Design, Entertainment, Sports, and Media 8,380 $40,660 $34,620 Healthcare Practitioners and Technical 43,860 $71,310 $59,350 Healthcare Support 24,170 $25,950 $24,260 Protective Service 23,340 $38,520 $34,450 Food Preparation and Serving Related 71,890 $20,500 $18,710 Building and Grounds Cleaning and Maintenance 26,530 $22,460 $20,320 Personal Care and Service 34,780 $21,430 $19,080 Sales and Related 74,550 $30,030 $22,730 Office and Administrative Support 123,320 $30,820 $28,310 Farming, Fishing, and Forestry 3,070 $23,210 $19,170 Construction and Extraction 50,910 $38,340 $35,090 Installation, Maintenance, and Repair 30,540 $40,890 $37,180 Production 29,790 $36,760 $30,560 Transportation and Material Moving 43,150 $32,560 $28,000
Revised: April 2012.
New Mexico Mean & Median Annual Wages for Selected Occupations
Data released: May 2011.
Source: U.S. Department of Labor, Bureau of Labor Statistics. Occupational Employment Statistics (OES).
http://www.bls.gov/oes/data.htm
Estimates for detailed occupations do not sum to the totals because the totals include occupations not shown separately. Estimates do not include self-employed workers.

43
YEA
R
JAN FEB MAR APR MAY JUN JUL AUG SEP OCT NOV DEC Ann
ual A
vera
ge
Dec
-Dec
Per
cent
C
hang
e
Ann
ual A
vera
ge
Perc
ent C
hang
e
1981 CPI-U 87.0 87.9 88.5 89.1 89.8 90.6 91.6 92.3 93.2 93.4 93.7 94.0 90.9 10.3 8.9CPI-W 87.5 88.5 89.0 89.6 90.3 91.1 92.2 92.8 93.7 93.9 94.1 94.4 91.4 10.3 8.6
1982 CPI-U 94.3 94.6 94.5 94.9 95.8 97.0 97.5 97.7 97.9 98.2 98.0 97.6 96.5 6.2 3.8CPI-W 94.7 95.0 94.8 95.2 96.2 97.4 98.0 98.2 98.3 98.6 98.4 98.0 96.9 6.0 3.8
1983 CPI-U 97.8 97.9 97.9 98.6 99.2 99.5 99.9 100.2 100.7 101.0 101.2 101.3 99.6 3.2 3.8CPI-W 98.1 98.1 98.4 99.0 99.5 99.8 100.1 100.5 101.0 101.2 101.2 101.2 99.8 3.0 3.3
1984 CPI-U 101.9 102.4 102.6 103.1 103.4 103.7 104.1 104.5 105.0 105.3 105.3 105.3 103.9 4.3 3.9CPI-W 101.6 101.8 101.8 102.1 102.5 102.8 103.2 104.2 104.8 104.8 104.7 104.8 103.3 3.5 3.6
1985 CPI-U 105.5 106.0 106.4 106.9 107.3 107.6 107.8 108.0 108.3 108.7 109.0 109.3 107.6 3.6 3.8CPI-W 104.9 105.4 105.9 106.3 106.7 107.0 107.1 107.3 107.6 107.9 108.3 108.6 106.9 3.5 3.6
1986 CPI-U 109.6 109.3 108.8 108.6 108.9 109.5 109.5 109.7 110.2 110.3 110.4 110.5 109.6 1.9 1.1CPI-W 108.9 108.5 107.9 107.6 107.9 108.4 108.4 108.6 109.1 109.1 109.2 109.3 108.6 1.6 0.6
1987 CPI-U 111.2 111.6 112.1 112.7 113.1 113.5 113.8 114.4 115.0 115.3 115.4 115.4 113.6 3.6 4.4CPI-W 110.0 110.5 111.0 111.6 111.9 112.4 112.7 113.3 113.8 114.1 114.3 114.2 112.5 3.6 4.5
1988 CPI-U 115.7 116.0 116.5 117.1 117.5 118.0 118.5 119.0 119.8 120.2 120.3 120.5 118.3 4.1 4.4CPI-W 114.5 114.7 115.1 115.7 116.2 116.7 117.2 117.7 118.5 118.9 119.0 119.2 117.0 4.0 4.4
1989 CPI-U 121.1 121.6 122.3 123.1 123.8 124.1 124.4 124.6 125.0 125.6 125.9 126.1 124.0 4.8 4.6CPI-W 119.7 120.2 120.8 121.8 122.5 122.8 123.2 123.2 123.6 124.2 124.4 124.6 122.6 4.8 4.5
1990 CPI-U 127.4 128.0 128.7 128.9 129.2 129.9 130.4 131.6 132.7 133.5 133.8 133.8 130.7 5.4 6.1CPI-W 125.9 126.4 127.1 127.3 127.5 128.3 128.7 129.9 131.1 131.9 132.2 132.2 129.0 5.2 6.1
1991 CPI-U 134.6 134.8 135.0 135.2 135.6 136.0 136.2 136.6 137.2 137.4 137.8 137.9 136.2 4.2 3.1CPI-W 132.8 132.8 133.0 133.3 133.8 134.1 134.3 134.6 135.2 135.4 135.8 135.9 134.3 4.1 2.8
1992 CPI-U 138.1 138.6 139.3 139.5 139.7 140.2 140.5 140.9 141.3 141.8 142.0 141.9 140.3 3.0 2.9CPI-W 136.0 136.4 137.0 137.3 137.6 138.1 138.4 138.8 139.1 139.6 139.8 139.8 138.2 2.9 2.9
1993 CPI-U 142.6 143.1 143.6 144.0 144.2 144.4 144.4 144.8 145.1 145.7 145.8 145.8 144.5 3.0 2.7CPI-W 140.3 140.7 141.1 141.6 141.9 142.0 142.1 142.4 142.6 143.3 143.4 143.3 142.1 2.8 2.5
1994 CPI-U 146.2 146.7 147.2 147.4 147.5 148.0 148.4 149.0 149.4 149.5 149.7 149.7 148.2 2.6 2.7CPI-W 143.6 144.0 144.4 144.7 144.9 145.4 145.8 146.5 146.9 147.0 147.3 147.2 145.6 2.5 2.7
1995 CPI-U 150.3 150.9 151.4 151.9 152.2 152.5 152.5 152.9 153.2 153.7 153.6 153.5 152.4 2.8 2.5CPI-W 147.8 148.3 148.7 149.3 149.6 149.9 149.9 150.2 150.6 151.0 150.9 150.9 149.8 2.9 2.5
1996 CPI-U 154.4 154.9 155.7 156.3 156.6 156.7 157.0 157.3 157.8 158.3 158.6 158.6 156.9 3.0 3.3CPI-W 151.7 152.2 152.9 153.6 154.0 154.1 154.3 154.5 155.1 155.5 155.9 155.9 154.1 2.9 3.3
1997 CPI-U 159.1 159.6 160.0 160.2 160.1 160.3 160.5 160.8 161.2 161.6 161.5 161.3 160.5 2.3 1.7CPI-W 156.3 156.8 157.0 157.2 157.2 157.4 157.5 157.8 158.3 158.5 158.5 158.2 157.6 2.3 1.5
1998 CPI-U 161.6 161.9 162.2 162.5 162.8 163.0 163.2 163.4 163.6 164.0 164.0 163.9 163.0 1.6 1.6CPI-W 158.4 158.5 158.7 159.1 159.5 159.7 159.8 160.0 160.2 160.6 160.7 160.7 159.7 1.3 1.6
1999 CPI-U 164.3 164.5 165.0 166.2 166.2 166.2 166.7 167.1 167.9 168.2 168.3 168.3 166.6 2.2 2.7CPI-W 161.0 161.1 161.4 162.7 162.8 162.8 163.3 163.8 164.7 165.0 165.1 165.1 163.2 2.2 2.7
2000 CPI-U 168.7 169.7 171.1 171.2 171.3 172.3 172.6 172.8 173.7 174.0 174.1 174.0 172.1 3.3 3.4CPI-W 165.5 166.4 167.8 167.9 168.1 169.1 169.3 169.3 170.4 170.6 170.9 170.7 168.8 3.4 3.4
2001 CPI-U 175.1 175.8 176.2 176.9 177.7 178.0 177.5 177.5 178.3 177.7 177.4 176.7 177.1 2.9 1.6CPI-W 171.7 172.4 172.6 173.5 174.4 174.6 173.8 173.8 174.8 174.0 173.7 172.9 173.5 2.8 1.3
2002 CPI-U 177.1 177.8 178.8 179.8 179.8 179.9 180.1 180.7 181.0 181.3 181.3 180.9 179.9 1.6 2.4CPI-W 173.2 173.7 174.7 175.8 175.8 175.9 176.1 176.6 177.0 177.3 177.4 177.0 175.9 1.4 2.4
2003 CPI-U 181.7 183.1 184.2 183.8 183.5 183.7 183.9 184.6 185.2 185.0 184.5 184.3 184.4 2.3 1.9CPI-W 177.7 179.2 180.3 179.8 179.4 179.6 179.6 180.3 181.0 180.7 180.2 179.9 179.8 2.2 1.6
2004 CPI-U 185.2 186.2 187.4 188.0 189.1 189.7 189.4 189.5 189.9 190.9 191.0 190.3 188.9 2.7 3.3CPI-W 180.9 181.9 182.9 183.5 184.7 185.3 184.9 185.0 185.4 186.5 186.8 186.0 184.5 2.6 3.4
2005 CPI-U 190.7 191.8 193.3 194.6 194.4 194.5 195.4 196.4 198.8 199.2 197.6 196.8 195.3 3.4 3.4CPI-W 186.3 187.3 188.6 190.2 190.0 190.1 191.0 192.1 195.0 195.2 193.4 192.5 195.3 3.5 3.5
2006 CPI-U 198.3 198.7 199.8 201.5 202.5 202.9 203.5 203.9 202.9 201.8 201.5 201.8 201.6 3.2 2.5CPI-W 194.0 194.2 195.3 197.2 198.2 198.6 199.2 199.6 198.4 197.0 196.8 197.2 197.1 3.2 2.4
2007 CPI-U 202.4 203.5 205.4 206.7 208.0 208.4 208.3 207.9 208.5 209.0 210.2 210.0 207.4 2.9 4.1CPI-W 197.6 198.5 200.6 202.1 203.7 203.9 203.7 203.2 203.9 204.3 205.9 205.8 202.8 2.9 4.4
2008 CPI-U 211.1 211.7 213.5 214.8 216.6 218.8 220.0 219.1 218.8 216.6 212.4 210.2 215.3 3.8 0.1CPI-W 206.7 207.3 209.1 210.7 212.8 215.2 216.3 215.2 214.9 212.2 207.3 204.8 211.1 4.1 -0.5
2009 CPI-U 211.1 212.2 212.7 213.2 213.9 215.7 215.4 215.8 216 216.2 216.3 215.9 214.5 -0.4 2.7
CPI-W 205.7 206.7 207.2 207.9 208.8 211 210.5 211.2 211.3 211.5 212 211.7 209.6 -0.7 3.4
2010 CPI-U 216.7 216.7 217.6 218 218.2 218 218 218.3 218.4 218.7 218.8 219.2 218.1 1.6 1.5
CPI-W 212.6 212.5 213.5 214 214.1 213.8 213.9 214.2 214.3 214.6 214.8 215.3 214.5 2.7 -0.4
2011 CPI-U 220.2 221.3 223.5 224.9 226 225.7 225.9 226.5 226.9 226.4 226.2 225.7 224.9 3.0 3.2
CPI-W 216.4 217.5 220 221.7 223 222.5 222.7 223.3 223.7 223 222.8 222.2 221.5 3.2 3.6
CPI-U 0.4% Dec CPI-U 3.0%
CPI-W 0.5% '10-'11 CPI-W 3.2%
CPI-U ALL URBAN CONSUMERSCPI-W URBAN WAGE EARNERS & CLERICAL WORKERS1982-84 = 100Source: NM Department of Workforce Solutions. www.dws.state.nm.us/LMI/dws-cpi.html
Consumer Price Index
Revised: April 2012.
Month to Month Change Year to Year Change
Dec '11-Jan '12
44
Poverty
Official Census Bureau poverty data is collected with the Current Population Survey (CPS) Annual Demographic Supplement. The Census Bureau uses a set of money income thresholds that vary by family size and composition to determine who is poor. The different family compositions consist of two parents, one parent, and other guardians. If a family's total income is less than that family's threshold, then that family and every individual in it is considered poor. The poverty thresholds do not vary geographically, but they are updated annually for inflation using the Consumer Price Index (CPI-U). The official poverty definition counts money income before taxes and does not include capital gains and noncash benefits (such as public housing, Medicaid, and SNAP payments). Poverty is not defined for people in military barracks, institutional group quarters (such as college dormitories), or for unrelated individuals under age 15 (such as foster children). They are excluded from the poverty universe and considered neither as "poor" nor as "nonpoor." The following page indicates the current (2010) Poverty Thresholds. While the thresholds in some sense represent families' needs, the official poverty measure should be interpreted as a statistical yardstick rather than as a complete description of what people and families need to live. Many of the government's aid programs use different income amounts as eligibility criteria in addition to programmatic time limitations. The official measure of poverty is based upon the Current Population Survey (CPS), which produces intercensal estimates. The CPS is model-based and the county estimates from it are subject to a relatively high degree of sampling error (which is considered in the data produced). The following tables and graphs show estimates based upon surveys associated with the 2010 Census. For a full discussion on the differences between the Small Area Income and Poverty Estimate (SAIPE), which is based on the CPS, and the Census Estimate, please see the frequently asked questions page at http://www.census.gov/did/www/saipe/about/faq.html. Estimates and even definitions of poverty are contentious subjects, and it is best to use a number of measures to determine needs of small areas. Also included in this section are tables showing the number of people receiving benefits from the Supplemental Nutrition Assistance Program (SNAP, formerly the Food Stamps Program) in New Mexico by county, poverty by educational district, and poverty characteristics. Revised: February 2012.
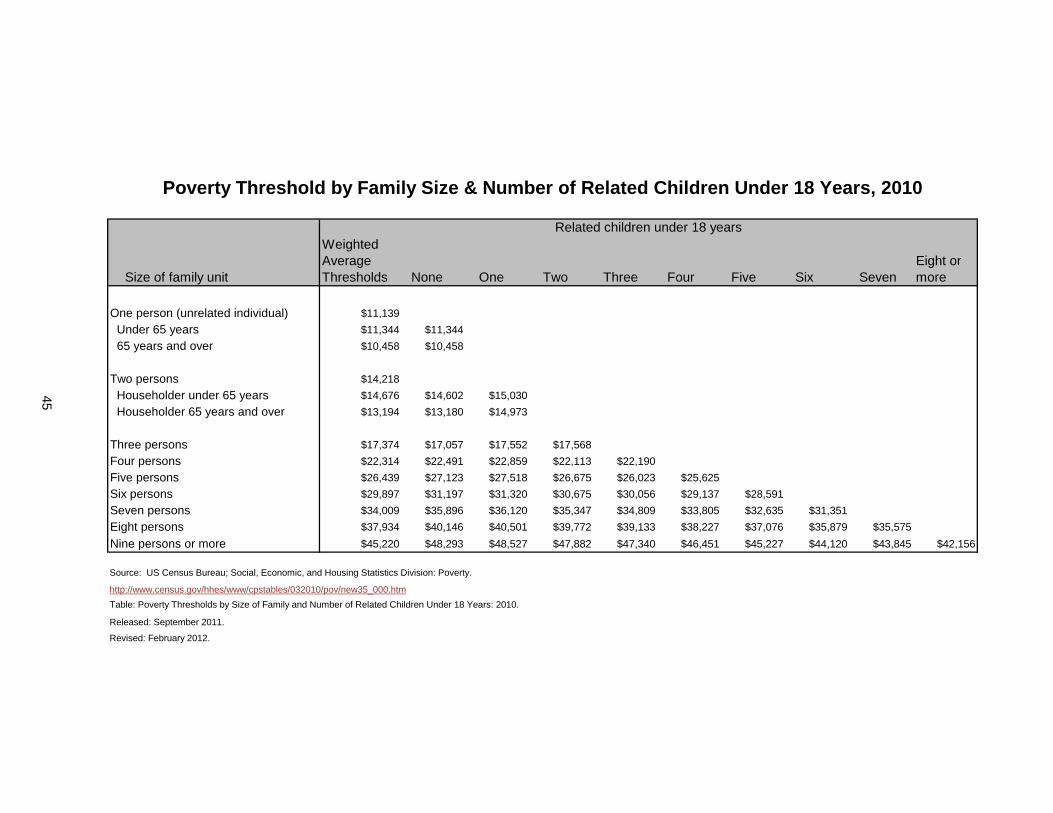
Size of family unit
Weighted Average Thresholds None One Two Three Four Five Six Seven
Eight or more
One person (unrelated individual) $11,139 Under 65 years $11,344 $11,344 65 years and over $10,458 $10,458
Two persons $14,218 Householder under 65 years $14,676 $14,602 $15,030 Householder 65 years and over $13,194 $13,180 $14,973
Three persons $17,374 $17,057 $17,552 $17,568Four persons $22,314 $22,491 $22,859 $22,113 $22,190Five persons $26,439 $27,123 $27,518 $26,675 $26,023 $25,625Six persons $29,897 $31,197 $31,320 $30,675 $30,056 $29,137 $28,591Seven persons $34,009 $35,896 $36,120 $35,347 $34,809 $33,805 $32,635 $31,351Eight persons $37,934 $40,146 $40,501 $39,772 $39,133 $38,227 $37,076 $35,879 $35,575Nine persons or more $45,220 $48,293 $48,527 $47,882 $47,340 $46,451 $45,227 $44,120 $43,845 $42,156
http://www.census.gov/hhes/www/cpstables/032010/pov/new35_000.htm
Released: September 2011.
45
Poverty Threshold by Family Size & Number of Related Children Under 18 Years, 2010
Related children under 18 years
Table: Poverty Thresholds by Size of Family and Number of Related Children Under 18 Years: 2010.
Revised: February 2012.
Source: US Census Bureau; Social, Economic, and Housing Statistics Division: Poverty.
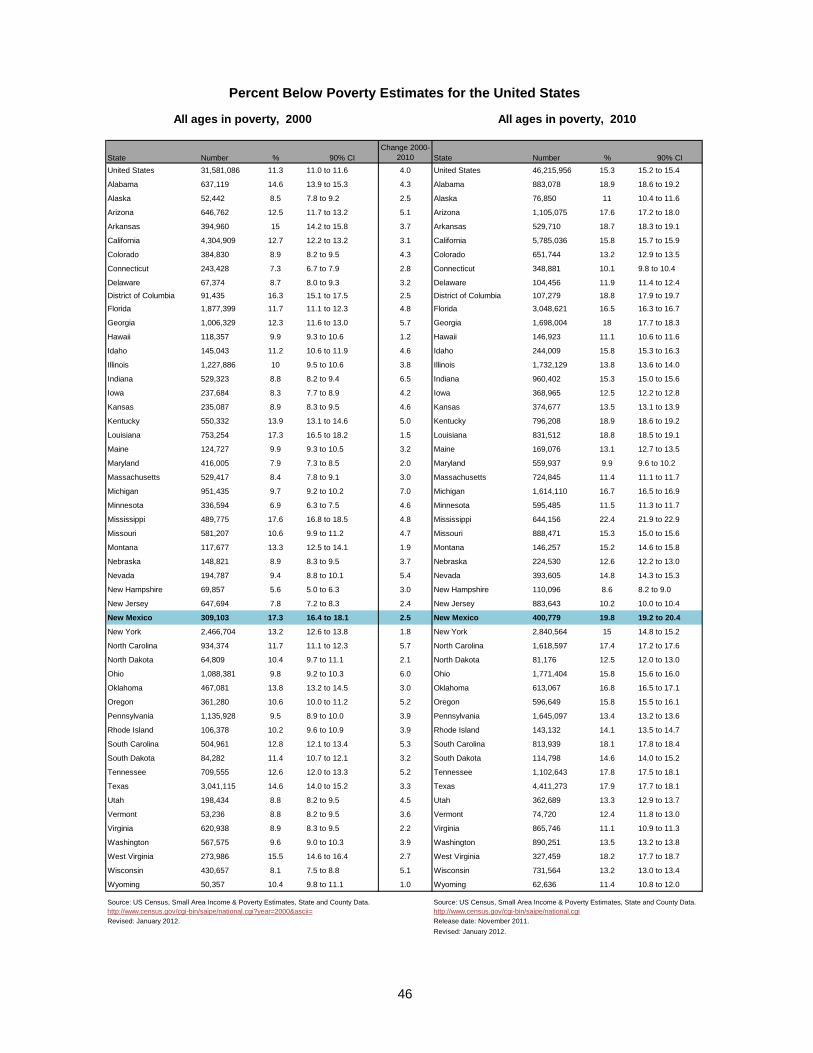
46
State Number % 90% CIChange 2000-
2010 State Number % 90% CIUnited States 31,581,086 11.3 11.0 to 11.6 4.0 United States 46,215,956 15.3 15.2 to 15.4
Alabama 637,119 14.6 13.9 to 15.3 4.3 Alabama 883,078 18.9 18.6 to 19.2
Alaska 52,442 8.5 7.8 to 9.2 2.5 Alaska 76,850 11 10.4 to 11.6
Arizona 646,762 12.5 11.7 to 13.2 5.1 Arizona 1,105,075 17.6 17.2 to 18.0
Arkansas 394,960 15 14.2 to 15.8 3.7 Arkansas 529,710 18.7 18.3 to 19.1
California 4,304,909 12.7 12.2 to 13.2 3.1 California 5,785,036 15.8 15.7 to 15.9
Colorado 384,830 8.9 8.2 to 9.5 4.3 Colorado 651,744 13.2 12.9 to 13.5
Connecticut 243,428 7.3 6.7 to 7.9 2.8 Connecticut 348,881 10.1 9.8 to 10.4
Delaware 67,374 8.7 8.0 to 9.3 3.2 Delaware 104,456 11.9 11.4 to 12.4District of Columbia 91,435 16.3 15.1 to 17.5 2.5 District of Columbia 107,279 18.8 17.9 to 19.7
Florida 1,877,399 11.7 11.1 to 12.3 4.8 Florida 3,048,621 16.5 16.3 to 16.7
Georgia 1,006,329 12.3 11.6 to 13.0 5.7 Georgia 1,698,004 18 17.7 to 18.3
Hawaii 118,357 9.9 9.3 to 10.6 1.2 Hawaii 146,923 11.1 10.6 to 11.6
Idaho 145,043 11.2 10.6 to 11.9 4.6 Idaho 244,009 15.8 15.3 to 16.3
Illinois 1,227,886 10 9.5 to 10.6 3.8 Illinois 1,732,129 13.8 13.6 to 14.0
Indiana 529,323 8.8 8.2 to 9.4 6.5 Indiana 960,402 15.3 15.0 to 15.6
Iowa 237,684 8.3 7.7 to 8.9 4.2 Iowa 368,965 12.5 12.2 to 12.8
Kansas 235,087 8.9 8.3 to 9.5 4.6 Kansas 374,677 13.5 13.1 to 13.9
Kentucky 550,332 13.9 13.1 to 14.6 5.0 Kentucky 796,208 18.9 18.6 to 19.2
Louisiana 753,254 17.3 16.5 to 18.2 1.5 Louisiana 831,512 18.8 18.5 to 19.1
Maine 124,727 9.9 9.3 to 10.5 3.2 Maine 169,076 13.1 12.7 to 13.5
Maryland 416,005 7.9 7.3 to 8.5 2.0 Maryland 559,937 9.9 9.6 to 10.2
Massachusetts 529,417 8.4 7.8 to 9.1 3.0 Massachusetts 724,845 11.4 11.1 to 11.7
Michigan 951,435 9.7 9.2 to 10.2 7.0 Michigan 1,614,110 16.7 16.5 to 16.9
Minnesota 336,594 6.9 6.3 to 7.5 4.6 Minnesota 595,485 11.5 11.3 to 11.7
Mississippi 489,775 17.6 16.8 to 18.5 4.8 Mississippi 644,156 22.4 21.9 to 22.9
Missouri 581,207 10.6 9.9 to 11.2 4.7 Missouri 888,471 15.3 15.0 to 15.6
Montana 117,677 13.3 12.5 to 14.1 1.9 Montana 146,257 15.2 14.6 to 15.8
Nebraska 148,821 8.9 8.3 to 9.5 3.7 Nebraska 224,530 12.6 12.2 to 13.0
Nevada 194,787 9.4 8.8 to 10.1 5.4 Nevada 393,605 14.8 14.3 to 15.3
New Hampshire 69,857 5.6 5.0 to 6.3 3.0 New Hampshire 110,096 8.6 8.2 to 9.0
New Jersey 647,694 7.8 7.2 to 8.3 2.4 New Jersey 883,643 10.2 10.0 to 10.4
New Mexico 309,103 17.3 16.4 to 18.1 2.5 New Mexico 400,779 19.8 19.2 to 20.4
New York 2,466,704 13.2 12.6 to 13.8 1.8 New York 2,840,564 15 14.8 to 15.2
North Carolina 934,374 11.7 11.1 to 12.3 5.7 North Carolina 1,618,597 17.4 17.2 to 17.6
North Dakota 64,809 10.4 9.7 to 11.1 2.1 North Dakota 81,176 12.5 12.0 to 13.0
Ohio 1,088,381 9.8 9.2 to 10.3 6.0 Ohio 1,771,404 15.8 15.6 to 16.0
Oklahoma 467,081 13.8 13.2 to 14.5 3.0 Oklahoma 613,067 16.8 16.5 to 17.1
Oregon 361,280 10.6 10.0 to 11.2 5.2 Oregon 596,649 15.8 15.5 to 16.1
Pennsylvania 1,135,928 9.5 8.9 to 10.0 3.9 Pennsylvania 1,645,097 13.4 13.2 to 13.6
Rhode Island 106,378 10.2 9.6 to 10.9 3.9 Rhode Island 143,132 14.1 13.5 to 14.7
South Carolina 504,961 12.8 12.1 to 13.4 5.3 South Carolina 813,939 18.1 17.8 to 18.4
South Dakota 84,282 11.4 10.7 to 12.1 3.2 South Dakota 114,798 14.6 14.0 to 15.2
Tennessee 709,555 12.6 12.0 to 13.3 5.2 Tennessee 1,102,643 17.8 17.5 to 18.1
Texas 3,041,115 14.6 14.0 to 15.2 3.3 Texas 4,411,273 17.9 17.7 to 18.1
Utah 198,434 8.8 8.2 to 9.5 4.5 Utah 362,689 13.3 12.9 to 13.7
Vermont 53,236 8.8 8.2 to 9.5 3.6 Vermont 74,720 12.4 11.8 to 13.0
Virginia 620,938 8.9 8.3 to 9.5 2.2 Virginia 865,746 11.1 10.9 to 11.3
Washington 567,575 9.6 9.0 to 10.3 3.9 Washington 890,251 13.5 13.2 to 13.8
West Virginia 273,986 15.5 14.6 to 16.4 2.7 West Virginia 327,459 18.2 17.7 to 18.7
Wisconsin 430,657 8.1 7.5 to 8.8 5.1 Wisconsin 731,564 13.2 13.0 to 13.4
Wyoming 50,357 10.4 9.8 to 11.1 1.0 Wyoming 62,636 11.4 10.8 to 12.0
http://www.census.gov/cgi-bin/saipe/national.cgi?year=2000&ascii= http://www.census.gov/cgi-bin/saipe/national.cgiRevised: January 2012. Release date: November 2011.
Revised: January 2012.
Percent Below Poverty Estimates for the United States
All ages in poverty, 2010
Source: US Census, Small Area Income & Poverty Estimates, State and County Data.
All ages in poverty, 2000
Source: US Census, Small Area Income & Poverty Estimates, State and County Data.

State Number % 90% CIChange
2000-2010 State Number % 90% CINew Mexico 309,103 17.3 16.4 to 18.1 2.5 New Mexico 400,779 19.8 19.2 to 20.4Bernalillo 71,582 13.0 10.4 to 15.5 3.4 Bernalillo 107,186 16.4 15.1 to 17.7Catron 769 22.3 17.4 to 27.3 0.8 Catron 854 23.1 17.9 to 28.3Chaves 12,565 21.3 16.8 to 25.7 1.5 Chaves 14,625 22.8 18.8 to 26.8Cibola 5,443 22.1 17.2 to 27.0 5.5 Cibola 6,843 27.6 22.4 to 32.8Colfax 2,158 15.8 12.4 to 19.1 2.1 Colfax 2,383 17.9 13.7 to 22.1Curry 8,254 19.0 15.0 to 23.0 0.8 Curry 9,491 19.8 16.6 to 23.0DeBaca 424 20.6 16.0 to 25.1 -2.0 DeBaca 373 18.6 14.0 to 23.2Dona Ana 40,315 23.6 18.8 to 28.3 1.8 Dona Ana 52,262 25.4 22.9 to 27.9Eddy 9,008 18.0 14.3 to 21.7 -1.4 Eddy 8,820 16.6 13.1 to 20.1Grant 5,495 18.3 14.5 to 22.1 0.6 Grant 5,428 18.9 14.6 to 23.2Guadalupe 891 21.8 17.0 to 26.6 1.9 Guadalupe 978 23.7 18.0 to 29.4Harding 115 14.7 11.2 to 18.1 -1.2 Harding 93 13.5 10.3 to 16.7Hidalgo 1,355 25.2 19.6 to 30.7 0.0 Hidalgo 1,204 25.2 19.4 to 31.0Lea 9,652 18.2 14.4 to 22.0 -0.2 Lea 11,263 18 14.2 to 21.8Lincoln 3,394 17.5 13.5 to 21.6 0.8 Lincoln 3,714 18.3 14.3 to 22.3Los Alamos 480 2.7 2.0 to 3.4 0.5 Los Alamos 575 3.2 2.4 to 4.0Luna 6,953 28.2 22.0 to 34.5 2.5 Luna 7,544 30.7 24.8 to 36.6McKinley 21,644 29.1 21.7 to 36.5 3.5 McKinley 23,168 32.6 28.0 to 37.2Mora 1,250 24.2 18.8 to 29.6 -2.4 Mora 1,063 21.8 16.3 to 27.3Otero 9,967 16.6 13.2 to 20.1 5.2 Otero 13,488 21.8 18.4 to 25.2Quay 2,160 22.4 17.6 to 27.2 2.2 Quay 2,219 24.6 19.4 to 29.8Rio Arriba 7,460 18.3 14.5 to 22.2 2.7 Rio Arriba 8,405 21 17.1 to 24.9Roosevelt 3,924 22.7 18.0 to 27.3 1.8 Roosevelt 4,627 24.5 20.2 to 28.8Sandoval 10,872 11.8 9.3 to 14.3 2.0 Sandoval 18,106 13.8 11.8 to 15.8San Juan 21,479 18.7 14.6 to 22.8 5.2 San Juan 30,727 23.9 21.3 to 26.5San Miguel 6,774 23.7 18.4 to 29.0 2.0 San Miguel 7,272 25.7 20.9 to 30.5Santa Fe 15,880 12.3 9.6 to 15.1 4.2 Santa Fe 23,421 16.5 14.4 to 18.6Sierra 2,852 22.2 16.9 to 27.5 -1.0 Sierra 2,491 21.2 15.8 to 26.6Socorro 4,845 27.9 21.8 to 34.0 -0.5 Socorro 4,723 27.4 21.2 to 33.6Taos 6,461 21.5 17.1 to 25.9 -2.9 Taos 6,078 18.6 14.3 to 22.9Torrance 3,639 22.5 17.0 to 28.1 1.3 Torrance 3,744 23.8 18.7 to 28.9Union 677 17.0 13.2 to 20.8 1.9 Union 732 18.9 14.3 to 23.5Valencia 10,364 15.9 12.6 to 19.2 6.6 Valencia 16,878 22.5 19.6 to 25.4
Revised: December 2010.Revised: January 2012.
47
Release date: November 2011.
Source: US Census, Small Area Income & Poverty Estimates, State and County Data.
Poverty Estimates for New Mexico Counties
All ages in poverty, 2010
Source: US Census, Small Area Income & Poverty Estimates, State and County Data.http://www.census.gov/did/www/saipe/county.html http://www.census.gov/did/www/saipe/county.html
All ages in poverty, 2000

48
District Name and School Type
Grade Range of Responsibility
Estimated Total
Population
Estimated 'Relevant' Population Age 5 to 17
Estimated 'Relevant' Age 5 to 17 of Families
in PovertyAlamogordo Public Schools PK-12 43,656 6,967 1,548 22.2%Albuquerque Public Schools PK-12 669,558 114,501 25,015 21.8%Animas Public Schools PK-12 1,155 213 91 42.7%Artesia Public Schools PK-12 18,240 3,590 860 24.0%Aztec Municipal Schools PK-12 16,768 3,185 549 17.2%Belen Consolidated Schools PK-12 30,921 5,744 1,748 30.4%Bernalillo Public Schools PK-12 24,484 4,364 1,179 27.0%Bloomfield Municipal Schools PK-12 17,942 3,731 1,226 32.9%Capitan Municipal Schools PK-12 4,231 574 100 17.4%Carlsbad Municipal Schools PK-12 33,874 6,227 1,292 20.7%Carrizozo Municipal Schools PK-12 1,534 181 78 43.1%Central Consolidated Schools PK-12 33,108 7,392 2,983 40.4%Chama Valley Independent PK-12 2,925 392 80 20.4%Cimarron Public Schools PK-12 3,525 468 62 13.2%Clayton Public Schools PK-12 3,969 594 122 20.5%Cloudcroft Municipal Schools PK-12 3,016 336 95 28.3%Clovis Municipal Schools PK-12 45,629 8,887 2,382 26.8%Cobre Consolidated Schools PK-12 8,105 1,302 447 34.3%Corona Municipal Schools PK-12 452 56 11 19.6%Cuba Independent Schools PK-12 4,611 999 333 33.3%Deming Public Schools PK-12 25,133 4,829 2,299 47.6%Des Moines Municipal Schools PK-12 552 88 49 55.7%Dexter Consolidated Schools PK-12 3,983 855 205 24.0%Dora Consolidated Schools PK-12 655 118 23 19.5%Dulce Independent Schools PK-12 3,468 812 182 22.4%Elida Municipal Schools PK-12 430 70 11 15.7%Española Municipal Schools PK-12 36,723 6,564 1,915 29.2%Estancia Municipal Schools PK-12 4,795 820 235 28.7%Eunice Municipal Schools PK-12 3,239 621 96 15.5%Farmington Municipal Schools PK-12 62,327 12,406 3,389 27.3%Floyd Municipal Schools PK-12 556 127 36 28.3%Fort Sumner Municipal Schools PK-12 2,022 343 101 29.4%Gadsden Independent Schools PK-12 63,078 15,084 6,308 41.8%Gallup-Mckinley County Schools PK-12 63,882 14,543 6,049 41.6%Grady Municipal Schools PK-12 344 48 13 27.1%Grants-Cibola County Schools PK-12 27,122 4,883 1,803 36.9%Hagerman Municipal Schools PK-12 2,228 535 170 31.8%Hatch Valley Municipal Schools PK-12 5,855 1,455 563 38.7%Hobbs Municipal Schools PK-12 43,000 8,608 2,116 24.6%Hondo Valley Public Schools PK-12 975 181 73 40.3%House Municipal Schools PK-12 259 36 8 22.2%Jal Public Schools PK-12 2,155 404 99 24.5%Jemez Mountain Public Schools PK-12 1,513 252 77 30.6%Jemez Valley Public Schools PK-12 5,304 826 147 17.8%Lake Arthur Municipal Schools PK-12 707 159 38 23.9%Las Cruces Public Schools PK-12 150,415 26,207 6,781 25.9%Las Vegas City Public Schools PK-12 13,345 2,186 742 33.9%
(continued)
Percent of 'Relevant'
Population of Families in Poverty
Poverty Estimates for New Mexico School Districts, 2010
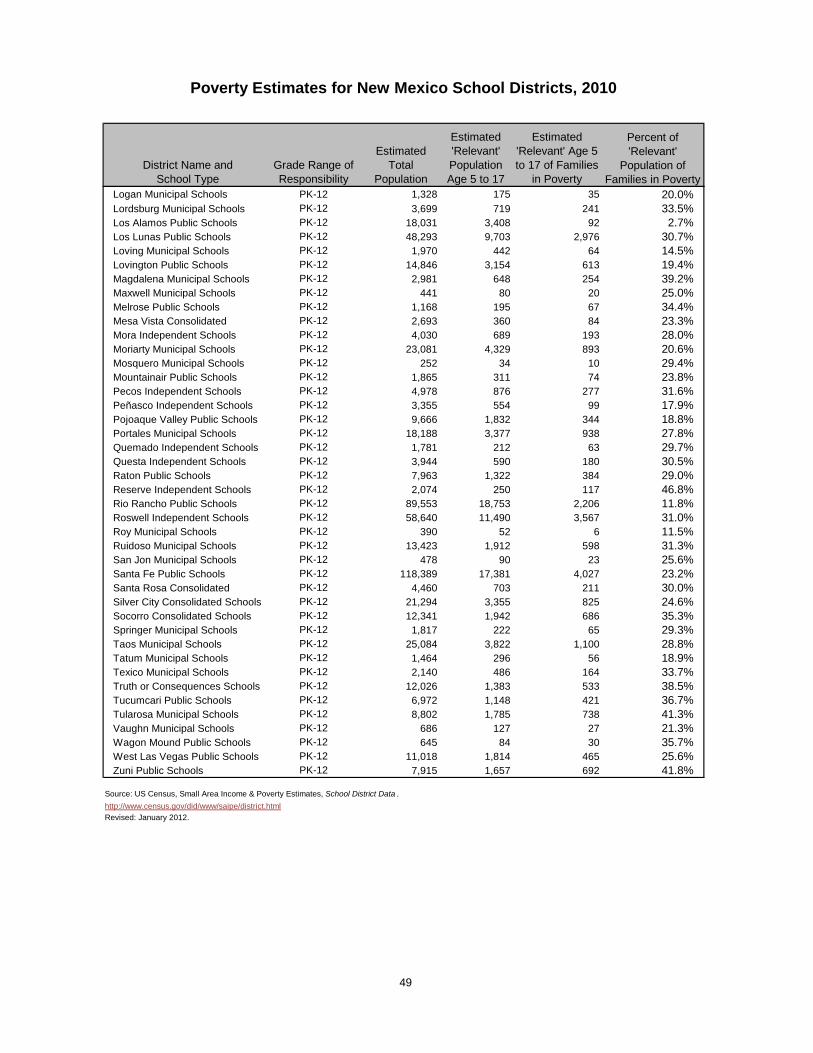
49
District Name and School Type
Grade Range of Responsibility
Estimated Total
Population
Estimated 'Relevant' Population Age 5 to 17
Estimated 'Relevant' Age 5 to 17 of Families
in Poverty
Percent of 'Relevant'
Population of Families in Poverty
Poverty Estimates for New Mexico School Districts, 2010
Logan Municipal Schools PK-12 1,328 175 35 20.0%Lordsburg Municipal Schools PK-12 3,699 719 241 33.5%Los Alamos Public Schools PK-12 18,031 3,408 92 2.7%Los Lunas Public Schools PK-12 48,293 9,703 2,976 30.7%Loving Municipal Schools PK-12 1,970 442 64 14.5%Lovington Public Schools PK-12 14,846 3,154 613 19.4%Magdalena Municipal Schools PK-12 2,981 648 254 39.2%Maxwell Municipal Schools PK-12 441 80 20 25.0%Melrose Public Schools PK-12 1,168 195 67 34.4%Mesa Vista Consolidated PK-12 2,693 360 84 23.3%Mora Independent Schools PK-12 4,030 689 193 28.0%Moriarty Municipal Schools PK-12 23,081 4,329 893 20.6%Mosquero Municipal Schools PK-12 252 34 10 29.4%Mountainair Public Schools PK-12 1,865 311 74 23.8%Pecos Independent Schools PK-12 4,978 876 277 31.6%Peñasco Independent Schools PK-12 3,355 554 99 17.9%Pojoaque Valley Public Schools PK-12 9,666 1,832 344 18.8%Portales Municipal Schools PK-12 18,188 3,377 938 27.8%Quemado Independent Schools PK-12 1,781 212 63 29.7%Questa Independent Schools PK-12 3,944 590 180 30.5%Raton Public Schools PK-12 7,963 1,322 384 29.0%Reserve Independent Schools PK-12 2,074 250 117 46.8%Rio Rancho Public Schools PK-12 89,553 18,753 2,206 11.8%Roswell Independent Schools PK-12 58,640 11,490 3,567 31.0%Roy Municipal Schools PK-12 390 52 6 11.5%Ruidoso Municipal Schools PK-12 13,423 1,912 598 31.3%San Jon Municipal Schools PK-12 478 90 23 25.6%Santa Fe Public Schools PK-12 118,389 17,381 4,027 23.2%Santa Rosa Consolidated PK-12 4,460 703 211 30.0%Silver City Consolidated Schools PK-12 21,294 3,355 825 24.6%Socorro Consolidated Schools PK-12 12,341 1,942 686 35.3%Springer Municipal Schools PK-12 1,817 222 65 29.3%Taos Municipal Schools PK-12 25,084 3,822 1,100 28.8%Tatum Municipal Schools PK-12 1,464 296 56 18.9%Texico Municipal Schools PK-12 2,140 486 164 33.7%Truth or Consequences Schools PK-12 12,026 1,383 533 38.5%Tucumcari Public Schools PK-12 6,972 1,148 421 36.7%Tularosa Municipal Schools PK-12 8,802 1,785 738 41.3%Vaughn Municipal Schools PK-12 686 127 27 21.3%Wagon Mound Public Schools PK-12 645 84 30 35.7%West Las Vegas Public Schools PK-12 11,018 1,814 465 25.6%Zuni Public Schools PK-12 7,915 1,657 692 41.8%
Source: US Census, Small Area Income & Poverty Estimates, School District Data .http://www.census.gov/did/www/saipe/district.htmlRevised: January 2012.
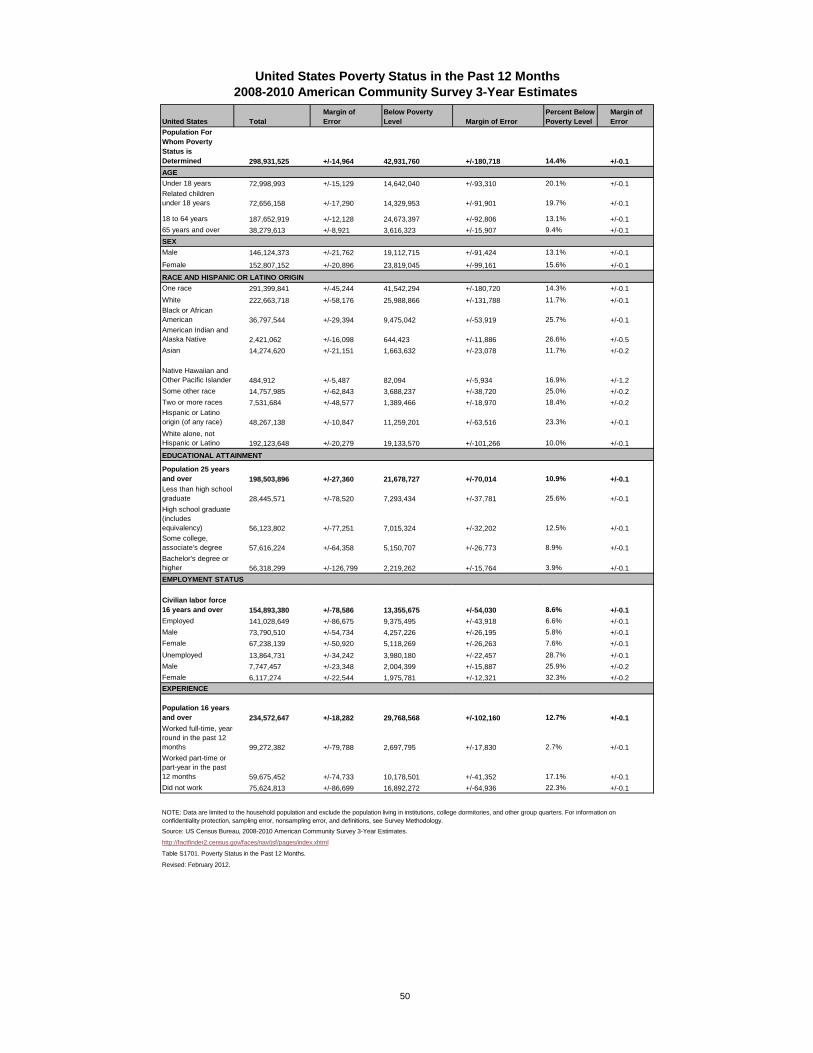
50
United States TotalMargin of Error
Below Poverty Level Margin of Error
Percent Below Poverty Level
Margin of Error
Population For Whom Poverty Status is Determined 298,931,525 +/-14,964 42,931,760 +/-180,718 14.4% +/-0.1
Under 18 years 72,998,993 +/-15,129 14,642,040 +/-93,310 20.1% +/-0.1Related children under 18 years 72,656,158 +/-17,290 14,329,953 +/-91,901 19.7% +/-0.1
18 to 64 years 187,652,919 +/-12,128 24,673,397 +/-92,806 13.1% +/-0.165 years and over 38,279,613 +/-8,921 3,616,323 +/-15,907 9.4% +/-0.1
Male 146,124,373 +/-21,762 19,112,715 +/-91,424 13.1% +/-0.1
Female 152,807,152 +/-20,896 23,819,045 +/-99,161 15.6% +/-0.1
One race 291,399,841 +/-45,244 41,542,294 +/-180,720 14.3% +/-0.1White 222,663,718 +/-58,176 25,988,866 +/-131,788 11.7% +/-0.1Black or African American 36,797,544 +/-29,394 9,475,042 +/-53,919 25.7% +/-0.1American Indian and Alaska Native 2,421,062 +/-16,098 644,423 +/-11,886 26.6% +/-0.5Asian 14,274,620 +/-21,151 1,663,632 +/-23,078 11.7% +/-0.2
Native Hawaiian and Other Pacific Islander 484,912 +/-5,487 82,094 +/-5,934 16.9% +/-1.2Some other race 14,757,985 +/-62,843 3,688,237 +/-38,720 25.0% +/-0.2Two or more races 7,531,684 +/-48,577 1,389,466 +/-18,970 18.4% +/-0.2Hispanic or Latino origin (of any race) 48,267,138 +/-10,847 11,259,201 +/-63,516 23.3% +/-0.1White alone, not Hispanic or Latino 192,123,648 +/-20,279 19,133,570 +/-101,266 10.0% +/-0.1
Population 25 years and over 198,503,896 +/-27,360 21,678,727 +/-70,014 10.9% +/-0.1Less than high school graduate 28,445,571 +/-78,520 7,293,434 +/-37,781 25.6% +/-0.1High school graduate (includes equivalency) 56,123,802 +/-77,251 7,015,324 +/-32,202 12.5% +/-0.1Some college, associate's degree 57,616,224 +/-64,358 5,150,707 +/-26,773 8.9% +/-0.1Bachelor's degree or higher 56,318,299 +/-126,799 2,219,262 +/-15,764 3.9% +/-0.1
Civilian labor force 16 years and over 154,893,380 +/-78,586 13,355,675 +/-54,030 8.6% +/-0.1Employed 141,028,649 +/-86,675 9,375,495 +/-43,918 6.6% +/-0.1Male 73,790,510 +/-54,734 4,257,226 +/-26,195 5.8% +/-0.1Female 67,238,139 +/-50,920 5,118,269 +/-26,263 7.6% +/-0.1Unemployed 13,864,731 +/-34,242 3,980,180 +/-22,457 28.7% +/-0.1Male 7,747,457 +/-23,348 2,004,399 +/-15,887 25.9% +/-0.2Female 6,117,274 +/-22,544 1,975,781 +/-12,321 32.3% +/-0.2 EXPERIENCE
Population 16 years and over 234,572,647 +/-18,282 29,768,568 +/-102,160 12.7% +/-0.1Worked full-time, year-round in the past 12 months 99,272,382 +/-79,788 2,697,795 +/-17,830 2.7% +/-0.1Worked part-time or part-year in the past 12 months 59,675,452 +/-74,733 10,178,501 +/-41,352 17.1% +/-0.1Did not work 75,624,813 +/-86,699 16,892,272 +/-64,936 22.3% +/-0.1
Revised: February 2012.
United States Poverty Status in the Past 12 Months2008-2010 American Community Survey 3-Year Estimates
Source: US Census Bureau, 2008-2010 American Community Survey 3-Year Estimates.
Table S1701. Poverty Status in the Past 12 Months.
http://factfinder2.census.gov/faces/nav/jsf/pages/index.xhtml
NOTE: Data are limited to the household population and exclude the population living in institutions, college dormitories, and other group quarters. For information on confidentiality protection, sampling error, nonsampling error, and definitions, see Survey Methodology.
AGE
SEX
RACE AND HISPANIC OR LATINO ORIGIN
EDUCATIONAL ATTAINMENT
EMPLOYMENT STATUS
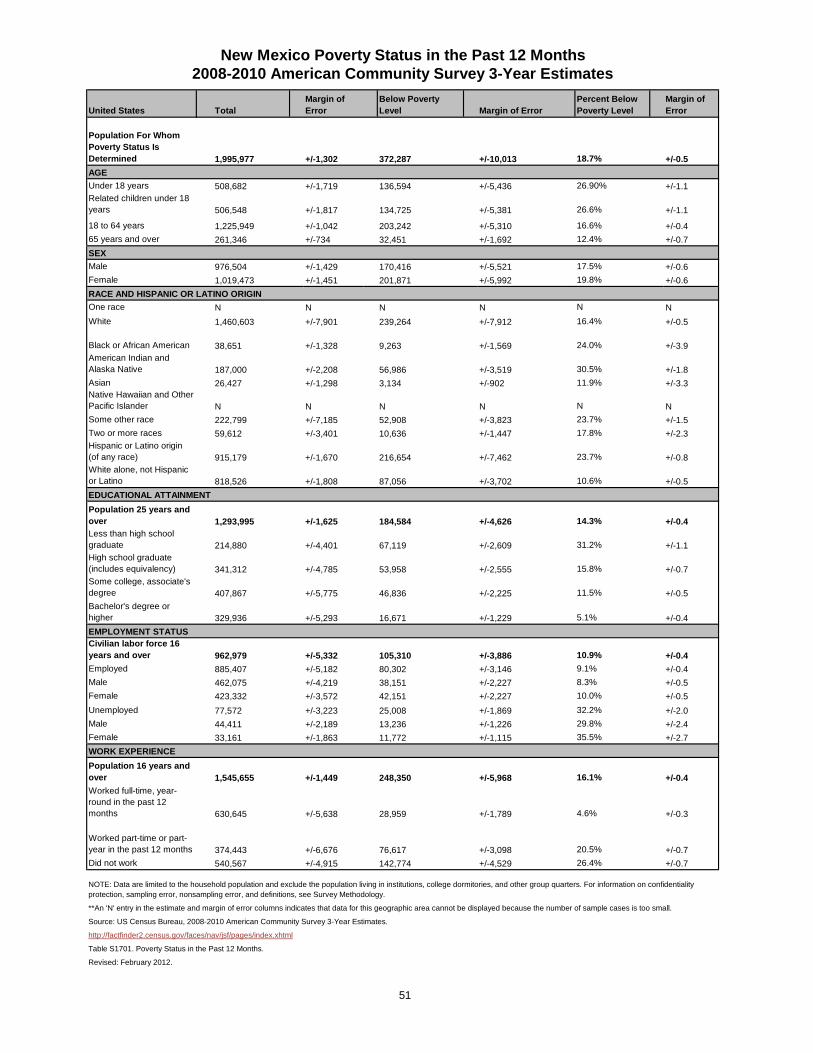
51
United States TotalMargin of Error
Below Poverty Level Margin of Error
Percent Below Poverty Level
Margin of Error
Population For Whom Poverty Status Is Determined 1,995,977 +/-1,302 372,287 +/-10,013 18.7% +/-0.5
Under 18 years 508,682 +/-1,719 136,594 +/-5,436 26.90% +/-1.1Related children under 18 years 506,548 +/-1,817 134,725 +/-5,381 26.6% +/-1.1
18 to 64 years 1,225,949 +/-1,042 203,242 +/-5,310 16.6% +/-0.465 years and over 261,346 +/-734 32,451 +/-1,692 12.4% +/-0.7
Male 976,504 +/-1,429 170,416 +/-5,521 17.5% +/-0.6Female 1,019,473 +/-1,451 201,871 +/-5,992 19.8% +/-0.6
One race N N N N N NWhite 1,460,603 +/-7,901 239,264 +/-7,912 16.4% +/-0.5
Black or African American 38,651 +/-1,328 9,263 +/-1,569 24.0% +/-3.9American Indian and Alaska Native 187,000 +/-2,208 56,986 +/-3,519 30.5% +/-1.8Asian 26,427 +/-1,298 3,134 +/-902 11.9% +/-3.3Native Hawaiian and Other Pacific Islander N N N N N NSome other race 222,799 +/-7,185 52,908 +/-3,823 23.7% +/-1.5Two or more races 59,612 +/-3,401 10,636 +/-1,447 17.8% +/-2.3Hispanic or Latino origin (of any race) 915,179 +/-1,670 216,654 +/-7,462 23.7% +/-0.8White alone, not Hispanic or Latino 818,526 +/-1,808 87,056 +/-3,702 10.6% +/-0.5
Population 25 years and over 1,293,995 +/-1,625 184,584 +/-4,626 14.3% +/-0.4Less than high school graduate 214,880 +/-4,401 67,119 +/-2,609 31.2% +/-1.1High school graduate (includes equivalency) 341,312 +/-4,785 53,958 +/-2,555 15.8% +/-0.7Some college, associate's degree 407,867 +/-5,775 46,836 +/-2,225 11.5% +/-0.5Bachelor's degree or higher 329,936 +/-5,293 16,671 +/-1,229 5.1% +/-0.4
Civilian labor force 16 years and over 962,979 +/-5,332 105,310 +/-3,886 10.9% +/-0.4Employed 885,407 +/-5,182 80,302 +/-3,146 9.1% +/-0.4Male 462,075 +/-4,219 38,151 +/-2,227 8.3% +/-0.5Female 423,332 +/-3,572 42,151 +/-2,227 10.0% +/-0.5Unemployed 77,572 +/-3,223 25,008 +/-1,869 32.2% +/-2.0Male 44,411 +/-2,189 13,236 +/-1,226 29.8% +/-2.4Female 33,161 +/-1,863 11,772 +/-1,115 35.5% +/-2.7
Population 16 years and over 1,545,655 +/-1,449 248,350 +/-5,968 16.1% +/-0.4Worked full-time, year-round in the past 12 months 630,645 +/-5,638 28,959 +/-1,789 4.6% +/-0.3
Worked part-time or part-year in the past 12 months 374,443 +/-6,676 76,617 +/-3,098 20.5% +/-0.7Did not work 540,567 +/-4,915 142,774 +/-4,529 26.4% +/-0.7
Revised: February 2012.
New Mexico Poverty Status in the Past 12 Months2008-2010 American Community Survey 3-Year Estimates
**An 'N' entry in the estimate and margin of error columns indicates that data for this geographic area cannot be displayed because the number of sample cases is too small.
NOTE: Data are limited to the household population and exclude the population living in institutions, college dormitories, and other group quarters. For information on confidentiality protection, sampling error, nonsampling error, and definitions, see Survey Methodology.
Source: US Census Bureau, 2008-2010 American Community Survey 3-Year Estimates.
http://factfinder2.census.gov/faces/nav/jsf/pages/index.xhtml
Table S1701. Poverty Status in the Past 12 Months.
WORK EXPERIENCE
AGE
SEX
RACE AND HISPANIC OR LATINO ORIGIN
EDUCATIONAL ATTAINMENT
EMPLOYMENT STATUS
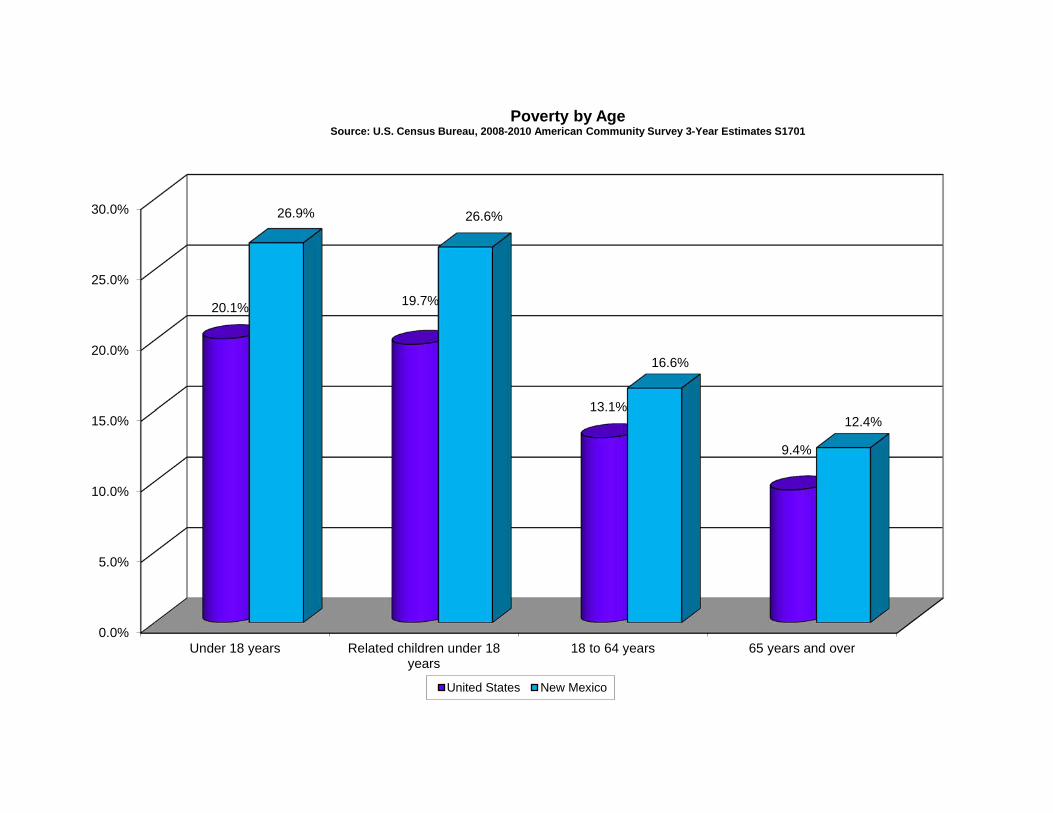
0.0%
5.0%
10.0%
15.0%
20.0%
25.0%
30.0%
Under 18 years Related children under 18years
18 to 64 years 65 years and over
20.1% 19.7%
13.1%
9.4%
26.9% 26.6%
16.6%
12.4%
Poverty by Age Source: U.S. Census Bureau, 2008-2010 American Community Survey 3-Year Estimates S1701
United States New Mexico
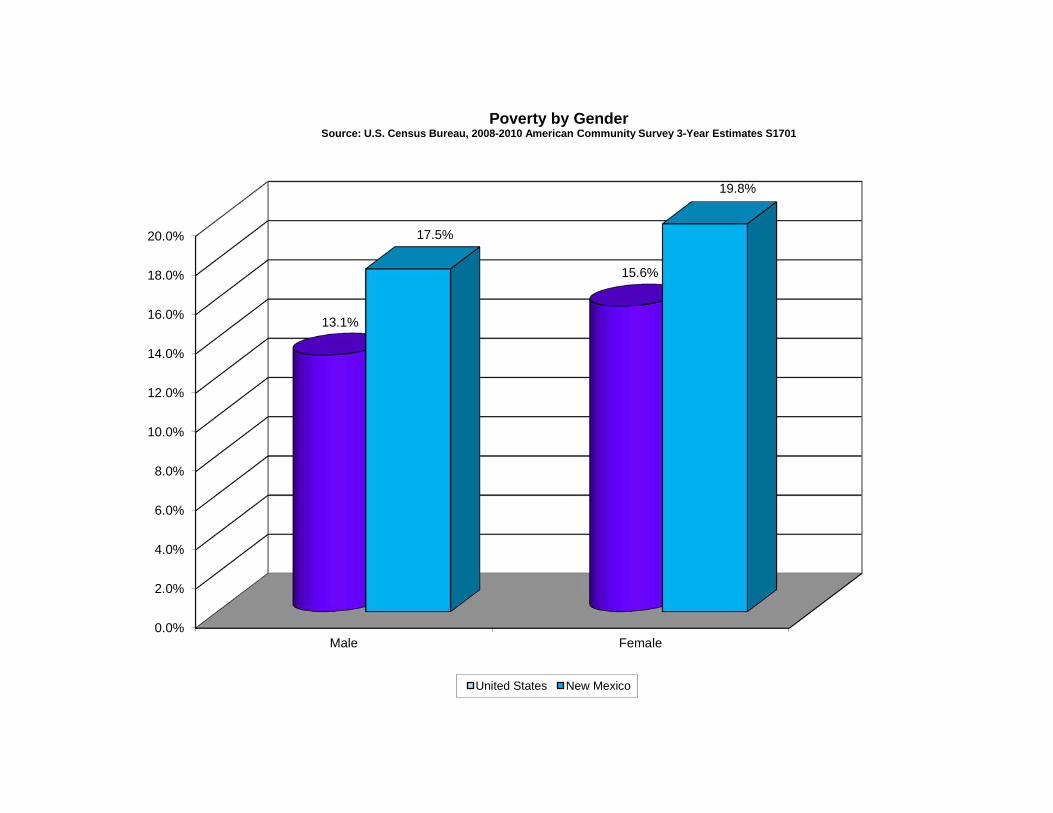
0.0%
2.0%
4.0%
6.0%
8.0%
10.0%
12.0%
14.0%
16.0%
18.0%
20.0%
Male Female
13.1%
15.6%
17.5%
19.8%
Poverty by Gender Source: U.S. Census Bureau, 2008-2010 American Community Survey 3-Year Estimates S1701
United States New Mexico

0.0%
5.0%
10.0%
15.0%
20.0%
25.0%
30.0%
35.0%
One race White Black orAfrican
American
AmericanIndianand
AlaskaNative
Asian NativeHawaiianand Other
PacificIslander
Someother race
Two ormoreraces
Hispanicor Latinoorigin (ofany race)
Whitealone, notHispanicor Latino
14.3%
11.7%
25.7% 26.6%
11.7%
16.9%
25.0%
18.4%
23.3%
10.0%
0.0%
16.4%
24.0%
30.5%
11.9%
0.0%
23.7%
17.8%
23.7%
10.6%
Poverty by Race Source: U.S. Census Bureau, 2008-2010 American Community Survey 3-Year Estimates S1701
United States New Mexico
**Data for "One race" and "Native Hawaiian and Other Pacific Islander" categories cannot be displayed because the number of sample cases is too small.
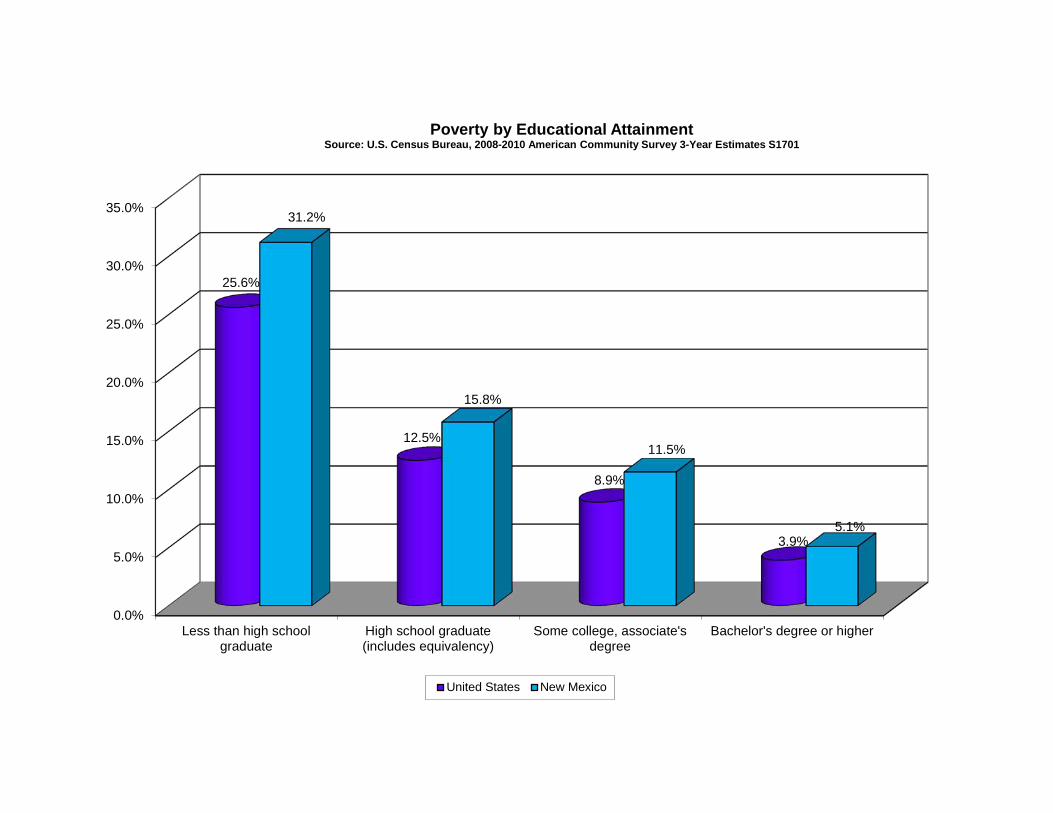
0.0%
5.0%
10.0%
15.0%
20.0%
25.0%
30.0%
35.0%
Less than high schoolgraduate
High school graduate(includes equivalency)
Some college, associate'sdegree
Bachelor's degree or higher
25.6%
12.5%
8.9%
3.9%
31.2%
15.8%
11.5%
5.1%
Poverty by Educational Attainment Source: U.S. Census Bureau, 2008-2010 American Community Survey 3-Year Estimates S1701
United States New Mexico
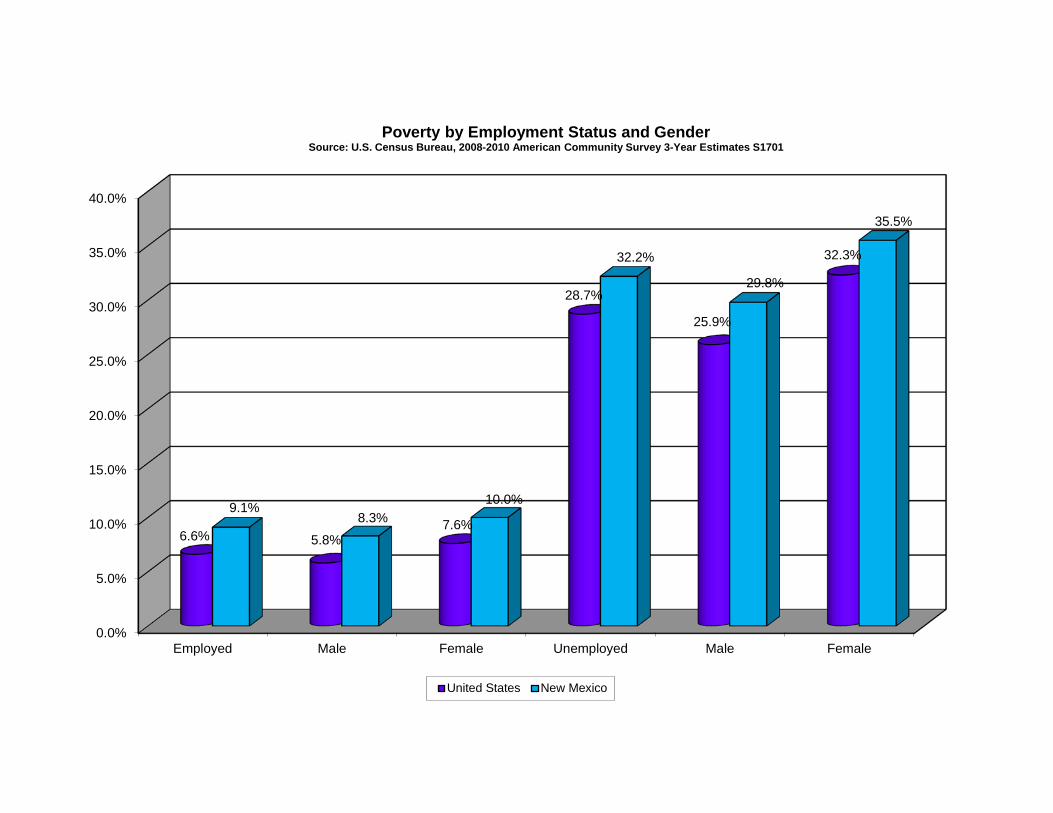
0.0%
5.0%
10.0%
15.0%
20.0%
25.0%
30.0%
35.0%
40.0%
Employed Male Female Unemployed Male Female
6.6% 5.8% 7.6%
28.7%
25.9%
32.3%
9.1% 8.3%
10.0%
32.2%
29.8%
35.5%
Poverty by Employment Status and Gender Source: U.S. Census Bureau, 2008-2010 American Community Survey 3-Year Estimates S1701
United States New Mexico
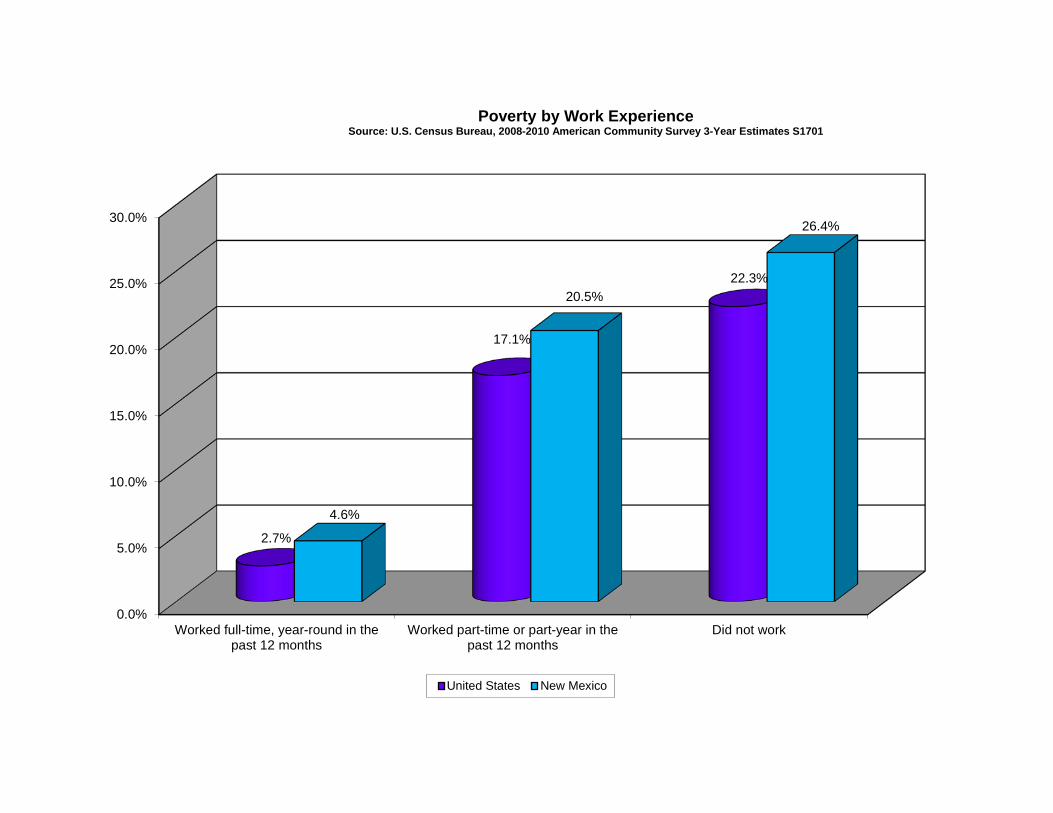
0.0%
5.0%
10.0%
15.0%
20.0%
25.0%
30.0%
Worked full-time, year-round in thepast 12 months
Worked part-time or part-year in thepast 12 months
Did not work
2.7%
17.1%
22.3%
4.6%
20.5%
26.4%
Poverty by Work Experience Source: U.S. Census Bureau, 2008-2010 American Community Survey 3-Year Estimates S1701
United States New Mexico

52
Family Size 100% 130% 185% 235%
TANF Gross Income Test
85%
TANF3
Payment Standard
SNAP4 Allotment for Maximum
TANF payments
1 $10,896 $14,160 $20,148 $25,608 $9,264 $2,724 $2,400
2 $14,712 $19,128 $27,216 $34,584 $12,504 $3,648 $4,404
3 $18,540 $24,096 $34,284 $43,572 $15,756 $4,560 $6,312
4 $22,356 $29,064 $41,352 $52,548 $19,008 $5,508 $8,016
5 $26,172 $34,032 $48,420 $61,512 $22,248 $6,432 $9,516
6 $30,000 $38,988 $55,488 $70,500 $25,500 $7,356 $11,424
7 $33,816 $43,956 $62,556 $79,476 $28,740 $7,428 $12,624
8 $37,632 $48,924 $69,624 $88,440 $31,992 $9,408 $14,424
9 $41,460 $53,928 $76,692 $97,404 $35,232 $10,332 $16,224
10 $45,288 $58,860 $83,760 $106,368 $38,472 $11,256 $18,024
11 $49,116 $63,828 $90,828 $115,332 $41,712 $12,180 $19,824
12 $52,944 $68,796 $97,656 $124,296 $44,952 $13,104 $21,624
Federal and State Program Guidelines
2011 Federal Poverty Guidelines1,2
(Annual Amounts) (Annual Amounts)
Revised: January 2012.http://www.hsd.state.nm.us/isd/reports.htmlSource: NM Human Services Department: Monthly Statistical Report, December 2011 Issue.
Federal Fiscal Year 2011
4Supplemental Nutrition Assistance Program (SNAP) is the former Food Stamp Program.
1The 2011 Federal Poverty Guidelines are used for the determination of LIHEAP, SNAP and TANF eligibility from October 1, 2011 through September 30, 2012.2The 2011 Federal Poverty Guidelines are used for the determination of Medicaid eligibility from April 1, 2011–March 31, 2012.3Known in New Mexico as the NM Works program, it reflects the 15% decrease due to the budgetary adjustment that was effective January 1, 2011.

53
Rank County Estimated Population SNAP Recipients Rate (Percent)1 McKinley 71,492 25,725 36.0%2 Luna 25095 8,680 34.6%3 Torrance 16,383 5,590 34.1%4 Cibola 27,213 8,191 30.1%5 Rio Arriba 40,246 11,911 29.6%6 Dona Ana 209,233 58,371 27.9%7 San Miguel 29,393 8,148 27.7%8 Socorro 17,866 4,880 27.3%9 Quay 9,041 2,386 26.4%10 Sierra 11,988 3,161 26.4%11 Colfax 13,750 3,415 24.8%12 Valencia 76,569 18,825 24.6%13 Guadalupe 4,687 1,133 24.2%14 Chaves 65,645 15,353 23.4%15 Hidaldo 4,894 1,089 22.3%16 Grant 29,514 6,498 22.0%17 Mora 4,881 1,061 21.7%18 Curry 48,376 10,071 20.8%19 San Juan 130,044 26,916 20.7%20 Taos 32,937 6,644 20.2%21 Bernalillo 662,564 128,619 19.4%22 De Baca 2,022 383 18.9%23 Union 4,549 860 18.9%24 Eddy 53,829 9,929 18.4%25 Roosevelt 19,846 3,467 17.5%26 Lincoln 20,497 3,510 17.1%27 Sandoval 131,561 21,760 16.5%28 Lea 64,727 9,967 15.4%29 Otero 63,797 9,671 15.2%30 Santa Fe 144,170 18,393 12.8%31 Carton 3,725 440 11.8%32 Harding 695 53 7.6%33 Los Alamos 17,950 382 2.1%
New Mexico 2,059,179 435,482 21.1%
SNAP Recipiency Rate By County November 2011
Note: Population data comes U.S. Census Bureau, 2010 Population.Recipiency rate is the percent of individuals living in the State or County who receive Supplemental Nutrition Assistance Program benefits. Source: NM Human Services Department: Monthly Statistical Report, November 2012 Issue.http://www.hsd.state.nm.us/isd/reports.htmlRevised: February 2012.
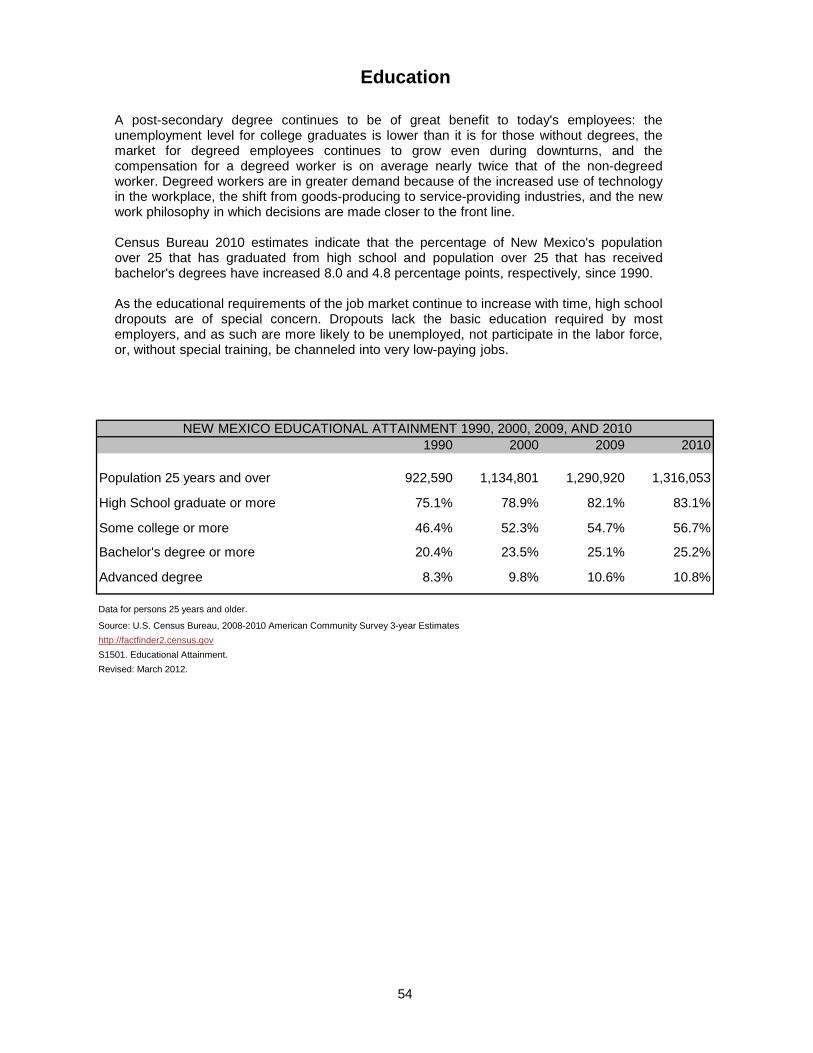
54
1990 2000 2009 2010
Population 25 years and over 922,590 1,134,801 1,290,920 1,316,053
High School graduate or more 75.1% 78.9% 82.1% 83.1%
Some college or more 46.4% 52.3% 54.7% 56.7%
Bachelor's degree or more 20.4% 23.5% 25.1% 25.2%
Advanced degree 8.3% 9.8% 10.6% 10.8%
http://factfinder2.census.gov
Revised: March 2012.
Source: U.S. Census Bureau, 2008-2010 American Community Survey 3-year Estimates
S1501. Educational Attainment.
Education
NEW MEXICO EDUCATIONAL ATTAINMENT 1990, 2000, 2009, AND 2010
Data for persons 25 years and older.
A post-secondary degree continues to be of great benefit to today's employees: the unemployment level for college graduates is lower than it is for those without degrees, the market for degreed employees continues to grow even during downturns, and the compensation for a degreed worker is on average nearly twice that of the non-degreed worker. Degreed workers are in greater demand because of the increased use of technology in the workplace, the shift from goods-producing to service-providing industries, and the new work philosophy in which decisions are made closer to the front line. Census Bureau 2010 estimates indicate that the percentage of New Mexico's population over 25 that has graduated from high school and population over 25 that has received bachelor's degrees have increased 8.0 and 4.8 percentage points, respectively, since 1990. As the educational requirements of the job market continue to increase with time, high school dropouts are of special concern. Dropouts lack the basic education required by most employers, and as such are more likely to be unemployed, not participate in the labor force, or, without special training, be channeled into very low-paying jobs.
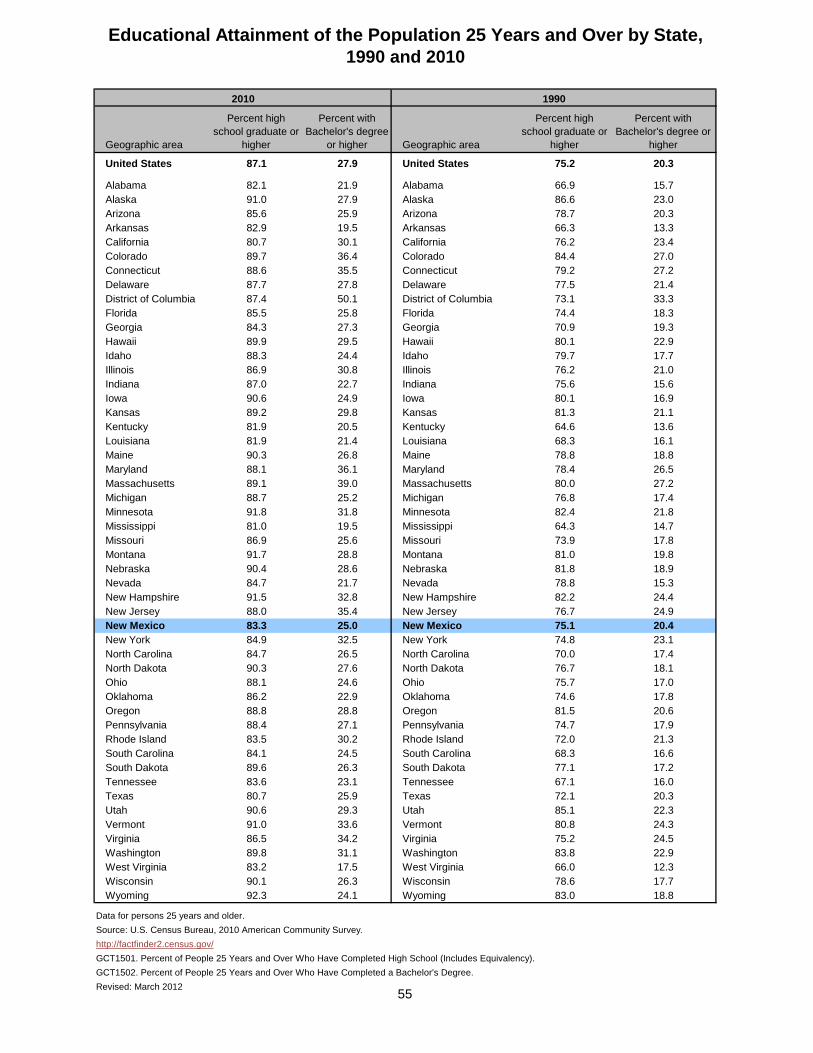
55
Geographic area
Percent high school graduate or
higher
Percent with Bachelor's degree
or higher Geographic area
Percent high school graduate or
higher
Percent with Bachelor's degree or
higher
United States 87.1 27.9 United States 75.2 20.3 Alabama 82.1 21.9 Alabama 66.9 15.7Alaska 91.0 27.9 Alaska 86.6 23.0Arizona 85.6 25.9 Arizona 78.7 20.3Arkansas 82.9 19.5 Arkansas 66.3 13.3California 80.7 30.1 California 76.2 23.4Colorado 89.7 36.4 Colorado 84.4 27.0Connecticut 88.6 35.5 Connecticut 79.2 27.2Delaware 87.7 27.8 Delaware 77.5 21.4District of Columbia 87.4 50.1 District of Columbia 73.1 33.3Florida 85.5 25.8 Florida 74.4 18.3Georgia 84.3 27.3 Georgia 70.9 19.3Hawaii 89.9 29.5 Hawaii 80.1 22.9Idaho 88.3 24.4 Idaho 79.7 17.7Illinois 86.9 30.8 Illinois 76.2 21.0Indiana 87.0 22.7 Indiana 75.6 15.6Iowa 90.6 24.9 Iowa 80.1 16.9Kansas 89.2 29.8 Kansas 81.3 21.1Kentucky 81.9 20.5 Kentucky 64.6 13.6Louisiana 81.9 21.4 Louisiana 68.3 16.1Maine 90.3 26.8 Maine 78.8 18.8Maryland 88.1 36.1 Maryland 78.4 26.5Massachusetts 89.1 39.0 Massachusetts 80.0 27.2Michigan 88.7 25.2 Michigan 76.8 17.4Minnesota 91.8 31.8 Minnesota 82.4 21.8Mississippi 81.0 19.5 Mississippi 64.3 14.7Missouri 86.9 25.6 Missouri 73.9 17.8Montana 91.7 28.8 Montana 81.0 19.8Nebraska 90.4 28.6 Nebraska 81.8 18.9Nevada 84.7 21.7 Nevada 78.8 15.3New Hampshire 91.5 32.8 New Hampshire 82.2 24.4New Jersey 88.0 35.4 New Jersey 76.7 24.9New Mexico 83.3 25.0 New Mexico 75.1 20.4New York 84.9 32.5 New York 74.8 23.1North Carolina 84.7 26.5 North Carolina 70.0 17.4North Dakota 90.3 27.6 North Dakota 76.7 18.1Ohio 88.1 24.6 Ohio 75.7 17.0Oklahoma 86.2 22.9 Oklahoma 74.6 17.8Oregon 88.8 28.8 Oregon 81.5 20.6Pennsylvania 88.4 27.1 Pennsylvania 74.7 17.9Rhode Island 83.5 30.2 Rhode Island 72.0 21.3South Carolina 84.1 24.5 South Carolina 68.3 16.6South Dakota 89.6 26.3 South Dakota 77.1 17.2Tennessee 83.6 23.1 Tennessee 67.1 16.0Texas 80.7 25.9 Texas 72.1 20.3Utah 90.6 29.3 Utah 85.1 22.3Vermont 91.0 33.6 Vermont 80.8 24.3Virginia 86.5 34.2 Virginia 75.2 24.5Washington 89.8 31.1 Washington 83.8 22.9West Virginia 83.2 17.5 West Virginia 66.0 12.3Wisconsin 90.1 26.3 Wisconsin 78.6 17.7Wyoming 92.3 24.1 Wyoming 83.0 18.8
http://factfinder2.census.gov/
Revised: March 2012
GCT1501. Percent of People 25 Years and Over Who Have Completed High School (Includes Equivalency).GCT1502. Percent of People 25 Years and Over Who Have Completed a Bachelor's Degree.
Educational Attainment of the Population 25 Years and Over by State,1990 and 2010
Source: U.S. Census Bureau, 2010 American Community Survey. Data for persons 25 years and older.
19902010
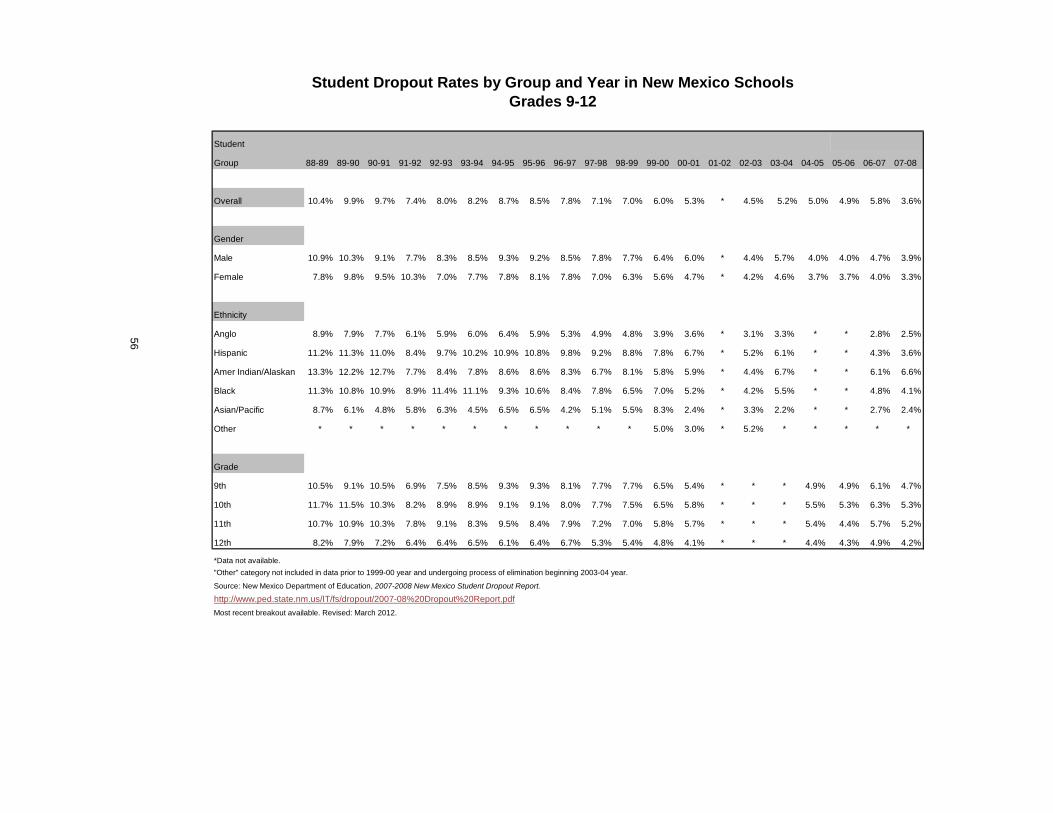
Student
Group 88-89 89-90 90-91 91-92 92-93 93-94 94-95 95-96 96-97 97-98 98-99 99-00 00-01 01-02 02-03 03-04 04-05 05-06 06-07 07-08
Overall 10.4% 9.9% 9.7% 7.4% 8.0% 8.2% 8.7% 8.5% 7.8% 7.1% 7.0% 6.0% 5.3% * 4.5% 5.2% 5.0% 4.9% 5.8% 3.6%
Gender
Male 10.9% 10.3% 9.1% 7.7% 8.3% 8.5% 9.3% 9.2% 8.5% 7.8% 7.7% 6.4% 6.0% * 4.4% 5.7% 4.0% 4.0% 4.7% 3.9%
Female 7.8% 9.8% 9.5% 10.3% 7.0% 7.7% 7.8% 8.1% 7.8% 7.0% 6.3% 5.6% 4.7% * 4.2% 4.6% 3.7% 3.7% 4.0% 3.3%
Ethnicity
Anglo 8.9% 7.9% 7.7% 6.1% 5.9% 6.0% 6.4% 5.9% 5.3% 4.9% 4.8% 3.9% 3.6% * 3.1% 3.3% * * 2.8% 2.5%
Hispanic 11.2% 11.3% 11.0% 8.4% 9.7% 10.2% 10.9% 10.8% 9.8% 9.2% 8.8% 7.8% 6.7% * 5.2% 6.1% * * 4.3% 3.6%
Amer Indian/Alaskan 13.3% 12.2% 12.7% 7.7% 8.4% 7.8% 8.6% 8.6% 8.3% 6.7% 8.1% 5.8% 5.9% * 4.4% 6.7% * * 6.1% 6.6%
Black 11.3% 10.8% 10.9% 8.9% 11.4% 11.1% 9.3% 10.6% 8.4% 7.8% 6.5% 7.0% 5.2% * 4.2% 5.5% * * 4.8% 4.1%
Asian/Pacific 8.7% 6.1% 4.8% 5.8% 6.3% 4.5% 6.5% 6.5% 4.2% 5.1% 5.5% 8.3% 2.4% * 3.3% 2.2% * * 2.7% 2.4%
Other * * * * * * * * * * * 5.0% 3.0% * 5.2% * * * * *
Grade
9th 10.5% 9.1% 10.5% 6.9% 7.5% 8.5% 9.3% 9.3% 8.1% 7.7% 7.7% 6.5% 5.4% * * * 4.9% 4.9% 6.1% 4.7%
10th 11.7% 11.5% 10.3% 8.2% 8.9% 8.9% 9.1% 9.1% 8.0% 7.7% 7.5% 6.5% 5.8% * * * 5.5% 5.3% 6.3% 5.3%
11th 10.7% 10.9% 10.3% 7.8% 9.1% 8.3% 9.5% 8.4% 7.9% 7.2% 7.0% 5.8% 5.7% * * * 5.4% 4.4% 5.7% 5.2%
12th 8.2% 7.9% 7.2% 6.4% 6.4% 6.5% 6.1% 6.4% 6.7% 5.3% 5.4% 4.8% 4.1% * * * 4.4% 4.3% 4.9% 4.2%
http://www.ped.state.nm.us/IT/fs/dropout/2007-08%20Dropout%20Report.pdf
56
"Other" category not included in data prior to 1999-00 year and undergoing process of elimination beginning 2003-04 year.
Most recent breakout available. Revised: March 2012.
Student Dropout Rates by Group and Year in New Mexico Schools
Source: New Mexico Department of Education, 2007-2008 New Mexico Student Dropout Report.
*Data not available.
Grades 9-12

57
District Membership Dropouts Dropout Rate District Membership Dropouts Dropout Rate ALAMOGORDO PUBLIC SCHOOLS 2899 145 5.00% LAS CRUCES PUBLIC SCHOOLS 11627 619 5.32% ALBUQUERQUE PUBLIC SCHOOLS 44154 2696 6.11% LAS VEGAS CITY PUBLIC SCHOOLS 836 42 5.02% ANIMAS PUBLIC SCHOOLS 133 - 0.00% LOGAN MUNICIPAL SCHOOLS 112 - 0.00% ARTESIA PUBLIC SCHOOLS 1589 69 4.34% LORDSBURG MUNICIPAL SCHOOLS 318 14 4.40% AZTEC MUNICIPAL SCHOOLS 1566 79 5.04% LOS ALAMOS PUBLIC SCHOOLS 1691 29 1.71% BELEN CONSOLIDATED SCHOOLS 2169 93 4.29% LOS LUNAS PUBLIC SCHOOLS 3872 158 4.08% BERNALILLO PUBLIC SCHOOLS 1434 75 5.23% LOVING MUNICIPAL SCHOOLS 278 - 0.72% BLOOMFIELD SCHOOLS 1408 86 6.11% LOVINGTON MUNICIPAL SCHOOLS 1391 62 4.46% CAPITAN MUNICIPAL SCHOOLS 244 - 1.64% MAGDALENA MUNICIPAL SCHOOLS 228 - 1.32% CARLSBAD MUNICIPAL SCHOOLS 2640 78 2.95% MAXWELL MUNICIPAL SCHOOLS 34 - 0.00% CARRIZOZO MUNICIPAL SCHOOLS 90 - 3.33% MELROSE PUBLIC SCHOOLS 102 - 1.96% CENTRAL CONSOLIDATED SCHOOLS 3149 201 6.38% MESA VISTA CONSOLIDATED SCHOOLS 223 11 4.93% CHAMA VALLEY INDEP. SCHOOLS 192 - 2.08% MORA INDEPENDENT SCHOOLS 233 12 5.15% CIMARRON MUNICIPAL SCHOOLS 262 16 6.11% MORIARTY MUNICIPAL SCHOOLS 1646 59 3.58% CLAYTON MUNICIPAL SCHOOLS 284 - 2.82% MOSQUERO MUNICIPAL SCHOOLS 24 - 4.17% CLOUDCROFT MUNICIPAL SCHOOLS 228 - 2.19% MOUNTAINAIR PUBLIC SCHOOLS 164 - 1.22% CLOVIS MUNICIPAL SCHOOLS 3616 133 3.68% PECOS INDEPENDENT SCHOOLS 316 14 4.43% COBRE CONSOLIDATED SCHOOLS 584 - 1.20% PENASCO INDEPENDENT SCHOOLS 257 - 3.11% CORONA MUNICIPAL SCHOOLS 34 - 2.94% POJOAQUE VALLEY PUBLIC SCHOOLS 1064 31 2.91% CUBA INDEPENDENT SCHOOLS 414 19 4.59% PORTALES MUNICIPAL SCHOOLS 1267 31 2.45% DEMING PUBLIC SCHOOLS 2611 188 7.20% QUEMADO INDEPENDENT SCHOOLS 91 - 2.20% DES MOINES MUNICIPAL SCHOOLS 52 - 0.00% QUESTA INDEPENDENT SCHOOLS 235 - 2.55% DEXTER CONSOLIDATED SCHOOLS 518 - 0.97% RATON PUBLIC SCHOOLS 610 20 3.28% DORA MUNICIPAL SCHOOLS 135 - 1.48% RESERVE PUBLIC SCHOOLS 80 - 1.25% DULCE INDEPENDENT SCHOOLS 319 27 8.46% RIO RANCHO PUBLIC SCHOOLS 7536 317 4.21% ELIDA MUNICIPAL SCHOOLS 61 - 0.00% ROSWELL INDEPENDENT SCHOOLS 4299 248 5.77% ESPANOLA PUBLIC SCHOOLS 1633 108 6.61% ROY MUNICIPAL SCHOOLS 37 - 10.81% ESTANCIA MUNICIPAL SCHOOLS 467 44 9.42% RUIDOSO MUNICIPAL SCHOOLS 1042 19 1.82% EUNICE MUNICIPAL SCHOOLS 282 12 4.26% SAN JON MUNICIPAL SCHOOLS 82 - 0.00% FARMINGTON MUNICIPAL SCHOOLS 4505 179 3.97% SANTA FE PUBLIC SCHOOLS 5616 360 6.41% FLOYD MUNICIPAL SCHOOLS 130 - 0.77% SANTA ROSA CONSOLIDATED SCHOOLS 268 - 2.24% FORT SUMNER MUNICIPAL SCHOOLS 140 - 2.14% SILVER CONSOLIDATED SCHOOLS 1501 27 1.80% GADSDEN INDEPENDENT SCHOOLS 6627 179 2.70% SOCORRO CONSOLIDATED SCHOOLS 867 36 4.15% GALLUP‐MCKINLEY CTY SCHOOLS 6244 366 5.86% SPRINGER MUNICIPAL SCHOOLS 102 - 0.00% GRADY MUNICIPAL SCHOOLS 56 - 1.79% T OR C MUNICIPAL SCHOOLS 672 66 9.82% GRANTS‐CIBOLA COUNTY SCHOOLS 1769 82 4.64% TAOS MUNICIPAL SCHOOLS 1347 84 6.24% HAGERMAN MUNICIPAL SCHOOLS 201 - 3.98% TATUM MUNICIPAL SCHOOLS 167 - 0.60% HATCH VALLEY PUBLIC SCHOOLS 602 20 3.32% TEXICO MUNICIPAL SCHOOLS 266 - 1.13% HOBBS MUNICIPAL SCHOOLS 3548 151 4.26% TUCUMCARI PUBLIC SCHOOLS 460 23 5.00% HONDO VALLEY PUBLIC SCHOOLS 75 - 1.33% TULAROSA MUNICIPAL SCHOOLS 450 - 2.00% HOUSE MUNICIPAL SCHOOLS 76 14 18.42% VAUGHN MUNICIPAL SCHOOLS 42 - 2.38% JAL PUBLIC SCHOOLS 187 - 0.53% WAGON MOUND PUBLIC SCHOOLS 52 - 3.85% JEMEZ MOUNTAIN PUBLIC SCHOOLS 143 - 4.90% WEST LAS VEGAS PUBLIC SCHOOLS 868 28 3.23% JEMEZ VALLEY PUBLIC SCHOOLS 300 - 1.33% ZUNI PUBLIC SCHOOLS 697 26 3.73% LAKE ARTHUR MUNICIPAL SCHOOLS 78 - 7.69% New Mexico 150,918 7,520 5.0%
Membership is determined based upon 40th day enrollment.
“Transition Year” dropouts are included in the totals.
http://www.ped.state.nm.us/IT/fs/dropout/2010%20Dropout%20Report.pdf?pagemode=bookmarksSource: New Mexico Department of Education, 2009-2010 New Mexico Student Dropout Report.
Revised: March 2012.
2009-2010 New Mexico School District Dropout RatesGrades 7-12
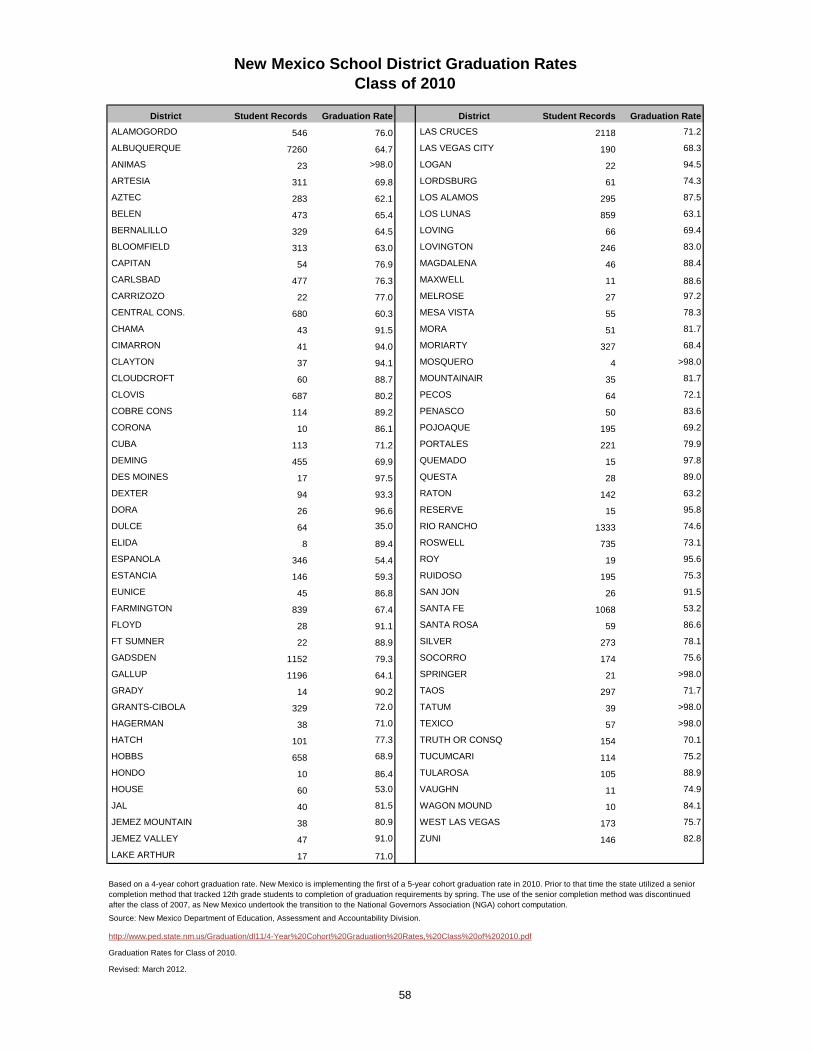
58
District Student Records Graduation Rate District Student Records Graduation Rate ALAMOGORDO 546 76.0 LAS CRUCES 2118 71.2
ALBUQUERQUE 7260 64.7 LAS VEGAS CITY 190 68.3
ANIMAS 23 >98.0 LOGAN 22 94.5
ARTESIA 311 69.8 LORDSBURG 61 74.3
AZTEC 283 62.1 LOS ALAMOS 295 87.5
BELEN 473 65.4 LOS LUNAS 859 63.1
BERNALILLO 329 64.5 LOVING 66 69.4
BLOOMFIELD 313 63.0 LOVINGTON 246 83.0
CAPITAN 54 76.9 MAGDALENA 46 88.4
CARLSBAD 477 76.3 MAXWELL 11 88.6 CARRIZOZO 22 77.0 MELROSE 27 97.2
CENTRAL CONS. 680 60.3 MESA VISTA 55 78.3
CHAMA 43 91.5 MORA 51 81.7
CIMARRON 41 94.0 MORIARTY 327 68.4
CLAYTON 37 94.1 MOSQUERO 4 >98.0
CLOUDCROFT 60 88.7 MOUNTAINAIR 35 81.7
CLOVIS 687 80.2 PECOS 64 72.1
COBRE CONS 114 89.2 PENASCO 50 83.6
CORONA 10 86.1 POJOAQUE 195 69.2
CUBA 113 71.2 PORTALES 221 79.9
DEMING 455 69.9 QUEMADO 15 97.8
DES MOINES 17 97.5 QUESTA 28 89.0
DEXTER 94 93.3 RATON 142 63.2
DORA 26 96.6 RESERVE 15 95.8
DULCE 64 35.0 RIO RANCHO 1333 74.6
ELIDA 8 89.4 ROSWELL 735 73.1
ESPANOLA 346 54.4 ROY 19 95.6
ESTANCIA 146 59.3 RUIDOSO 195 75.3
EUNICE 45 86.8 SAN JON 26 91.5
FARMINGTON 839 67.4 SANTA FE 1068 53.2
FLOYD 28 91.1 SANTA ROSA 59 86.6
FT SUMNER 22 88.9 SILVER 273 78.1
GADSDEN 1152 79.3 SOCORRO 174 75.6
GALLUP 1196 64.1 SPRINGER 21 >98.0
GRADY 14 90.2 TAOS 297 71.7
GRANTS‐CIBOLA 329 72.0 TATUM 39 >98.0
HAGERMAN 38 71.0 TEXICO 57 >98.0
HATCH 101 77.3 TRUTH OR CONSQ 154 70.1
HOBBS 658 68.9 TUCUMCARI 114 75.2
HONDO 10 86.4 TULAROSA 105 88.9
HOUSE 60 53.0 VAUGHN 11 74.9
JAL 40 81.5 WAGON MOUND 10 84.1
JEMEZ MOUNTAIN 38 80.9 WEST LAS VEGAS 173 75.7
JEMEZ VALLEY 47 91.0 ZUNI 146 82.8
LAKE ARTHUR 17 71.0
Source: New Mexico Department of Education, Assessment and Accountability Division.
http://www.ped.state.nm.us/Graduation/dl11/4-Year%20Cohort%20Graduation%20Rates,%20Class%20of%202010.pdf
Graduation Rates for Class of 2010.
Revised: March 2012.
New Mexico School District Graduation RatesClass of 2010
Based on a 4-year cohort graduation rate. New Mexico is implementing the first of a 5-year cohort graduation rate in 2010. Prior to that time the state utilized a senior completion method that tracked 12th grade students to completion of graduation requirements by spring. The use of the senior completion method was discontinued after the class of 2007, as New Mexico undertook the transition to the National Governors Association (NGA) cohort computation.
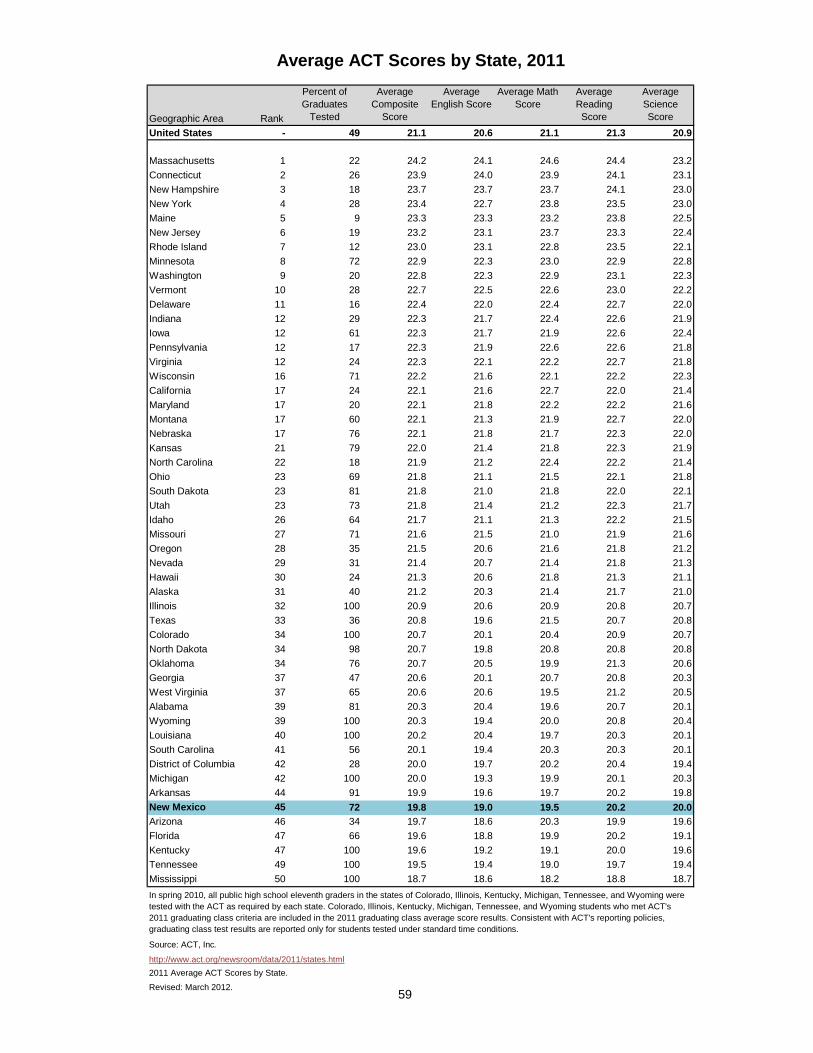
59
Geographic Area Rank
Percent of Graduates
Tested
Average Composite
Score
Average English Score
Average Math Score
Average Reading Score
Average Science Score
United States - 49 21.1 20.6 21.1 21.3 20.9
Massachusetts 1 22 24.2 24.1 24.6 24.4 23.2Connecticut 2 26 23.9 24.0 23.9 24.1 23.1New Hampshire 3 18 23.7 23.7 23.7 24.1 23.0New York 4 28 23.4 22.7 23.8 23.5 23.0Maine 5 9 23.3 23.3 23.2 23.8 22.5New Jersey 6 19 23.2 23.1 23.7 23.3 22.4Rhode Island 7 12 23.0 23.1 22.8 23.5 22.1Minnesota 8 72 22.9 22.3 23.0 22.9 22.8Washington 9 20 22.8 22.3 22.9 23.1 22.3Vermont 10 28 22.7 22.5 22.6 23.0 22.2Delaware 11 16 22.4 22.0 22.4 22.7 22.0Indiana 12 29 22.3 21.7 22.4 22.6 21.9Iowa 12 61 22.3 21.7 21.9 22.6 22.4Pennsylvania 12 17 22.3 21.9 22.6 22.6 21.8Virginia 12 24 22.3 22.1 22.2 22.7 21.8Wisconsin 16 71 22.2 21.6 22.1 22.2 22.3California 17 24 22.1 21.6 22.7 22.0 21.4Maryland 17 20 22.1 21.8 22.2 22.2 21.6Montana 17 60 22.1 21.3 21.9 22.7 22.0Nebraska 17 76 22.1 21.8 21.7 22.3 22.0Kansas 21 79 22.0 21.4 21.8 22.3 21.9North Carolina 22 18 21.9 21.2 22.4 22.2 21.4Ohio 23 69 21.8 21.1 21.5 22.1 21.8South Dakota 23 81 21.8 21.0 21.8 22.0 22.1Utah 23 73 21.8 21.4 21.2 22.3 21.7Idaho 26 64 21.7 21.1 21.3 22.2 21.5Missouri 27 71 21.6 21.5 21.0 21.9 21.6Oregon 28 35 21.5 20.6 21.6 21.8 21.2Nevada 29 31 21.4 20.7 21.4 21.8 21.3Hawaii 30 24 21.3 20.6 21.8 21.3 21.1Alaska 31 40 21.2 20.3 21.4 21.7 21.0Illinois 32 100 20.9 20.6 20.9 20.8 20.7Texas 33 36 20.8 19.6 21.5 20.7 20.8Colorado 34 100 20.7 20.1 20.4 20.9 20.7North Dakota 34 98 20.7 19.8 20.8 20.8 20.8Oklahoma 34 76 20.7 20.5 19.9 21.3 20.6Georgia 37 47 20.6 20.1 20.7 20.8 20.3West Virginia 37 65 20.6 20.6 19.5 21.2 20.5Alabama 39 81 20.3 20.4 19.6 20.7 20.1Wyoming 39 100 20.3 19.4 20.0 20.8 20.4Louisiana 40 100 20.2 20.4 19.7 20.3 20.1South Carolina 41 56 20.1 19.4 20.3 20.3 20.1District of Columbia 42 28 20.0 19.7 20.2 20.4 19.4Michigan 42 100 20.0 19.3 19.9 20.1 20.3Arkansas 44 91 19.9 19.6 19.7 20.2 19.8New Mexico 45 72 19.8 19.0 19.5 20.2 20.0Arizona 46 34 19.7 18.6 20.3 19.9 19.6Florida 47 66 19.6 18.8 19.9 20.2 19.1Kentucky 47 100 19.6 19.2 19.1 20.0 19.6Tennessee 49 100 19.5 19.4 19.0 19.7 19.4Mississippi 50 100 18.7 18.6 18.2 18.8 18.7
Source: ACT, Inc.
http://www.act.org/newsroom/data/2011/states.html2011 Average ACT Scores by State.
Revised: March 2012.
Average ACT Scores by State, 2011
In spring 2010, all public high school eleventh graders in the states of Colorado, Illinois, Kentucky, Michigan, Tennessee, and Wyoming were tested with the ACT as required by each state. Colorado, Illinois, Kentucky, Michigan, Tennessee, and Wyoming students who met ACT's 2011 graduating class criteria are included in the 2011 graduating class average score results. Consistent with ACT's reporting policies, graduating class test results are reported only for students tested under standard time conditions.
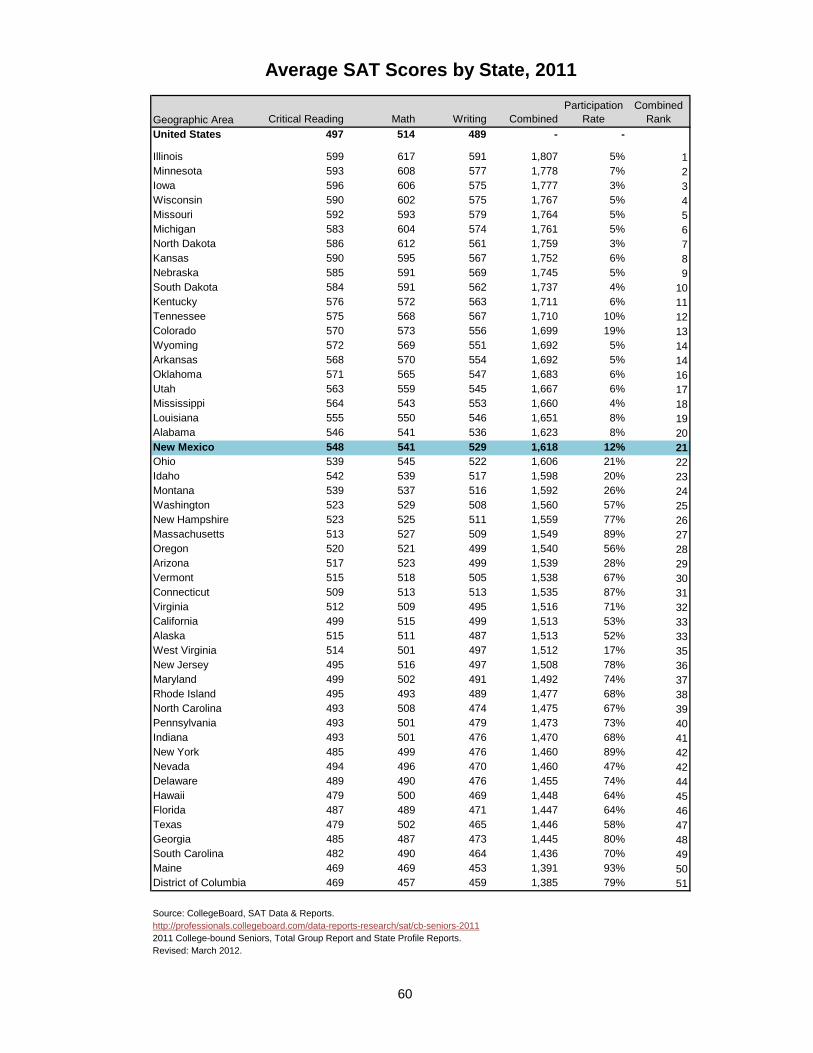
60
Geographic Area Critical Reading Math Writing CombinedParticipation
RateCombined
RankUnited States 497 514 489 - -
Illinois 599 617 591 1,807 5% 1Minnesota 593 608 577 1,778 7% 2Iowa 596 606 575 1,777 3% 3Wisconsin 590 602 575 1,767 5% 4Missouri 592 593 579 1,764 5% 5Michigan 583 604 574 1,761 5% 6North Dakota 586 612 561 1,759 3% 7Kansas 590 595 567 1,752 6% 8Nebraska 585 591 569 1,745 5% 9South Dakota 584 591 562 1,737 4% 10Kentucky 576 572 563 1,711 6% 11Tennessee 575 568 567 1,710 10% 12Colorado 570 573 556 1,699 19% 13Wyoming 572 569 551 1,692 5% 14Arkansas 568 570 554 1,692 5% 14Oklahoma 571 565 547 1,683 6% 16Utah 563 559 545 1,667 6% 17Mississippi 564 543 553 1,660 4% 18Louisiana 555 550 546 1,651 8% 19Alabama 546 541 536 1,623 8% 20New Mexico 548 541 529 1,618 12% 21Ohio 539 545 522 1,606 21% 22Idaho 542 539 517 1,598 20% 23Montana 539 537 516 1,592 26% 24Washington 523 529 508 1,560 57% 25New Hampshire 523 525 511 1,559 77% 26Massachusetts 513 527 509 1,549 89% 27Oregon 520 521 499 1,540 56% 28Arizona 517 523 499 1,539 28% 29Vermont 515 518 505 1,538 67% 30Connecticut 509 513 513 1,535 87% 31Virginia 512 509 495 1,516 71% 32California 499 515 499 1,513 53% 33Alaska 515 511 487 1,513 52% 33West Virginia 514 501 497 1,512 17% 35New Jersey 495 516 497 1,508 78% 36Maryland 499 502 491 1,492 74% 37Rhode Island 495 493 489 1,477 68% 38North Carolina 493 508 474 1,475 67% 39Pennsylvania 493 501 479 1,473 73% 40Indiana 493 501 476 1,470 68% 41New York 485 499 476 1,460 89% 42Nevada 494 496 470 1,460 47% 42Delaware 489 490 476 1,455 74% 44Hawaii 479 500 469 1,448 64% 45Florida 487 489 471 1,447 64% 46Texas 479 502 465 1,446 58% 47Georgia 485 487 473 1,445 80% 48South Carolina 482 490 464 1,436 70% 49Maine 469 469 453 1,391 93% 50District of Columbia 469 457 459 1,385 79% 51
Source: CollegeBoard, SAT Data & Reports.http://professionals.collegeboard.com/data-reports-research/sat/cb-seniors-20112011 College-bound Seniors, Total Group Report and State Profile Reports.Revised: March 2012.
Average SAT Scores by State, 2011
61
Quality of Life
Quality of life indicators are defined by community leaders, municipalities, government agencies, nonprofits, and other entities seeking to capture a broader sense of the community well-being outside the scope of conventional economic indicators such as employment statistics and per capita income. These indicators allow for the framing of issues and policy concerns surrounding communities, and the data provides for the measurement and estimation of degrees of health and well-being. Selected statistics can address a range of topics, including the environment, safety, health, and housing, and can be used to monitor general concern or a specific issue. Transport and mobility behavior data are useful indicators when evaluating the demands on local and urban areas. On average, New Mexicans spend less time commuting to work each day than do people in some of our neighboring states, and New Mexico is ranked 33rd among all states for public transportation usage. The state of current housing conditions, including affordability and availability, is a key dimension to evaluating quality of life in a specific area or community. While the median home value in New Mexico ranks in the lower half, the state's homeownership rate is higher than both the national average and that of surrounding states. New Mexico leads the region and ranks third in the nation for lowest per capita property tax collection. Also included in this section are tables summarizing median population age, voter participation, health care, and public safety data. The following tables are provided, in addition to the previous labor market, income, poverty, and education statistics sections, as some selected quality of life indicators. Other possible dimensions, such as energy, environmental, recreation, and human rights data, can also be used to determine what constitutes "quality of life" and well-being of a community. Revised: March 2012.
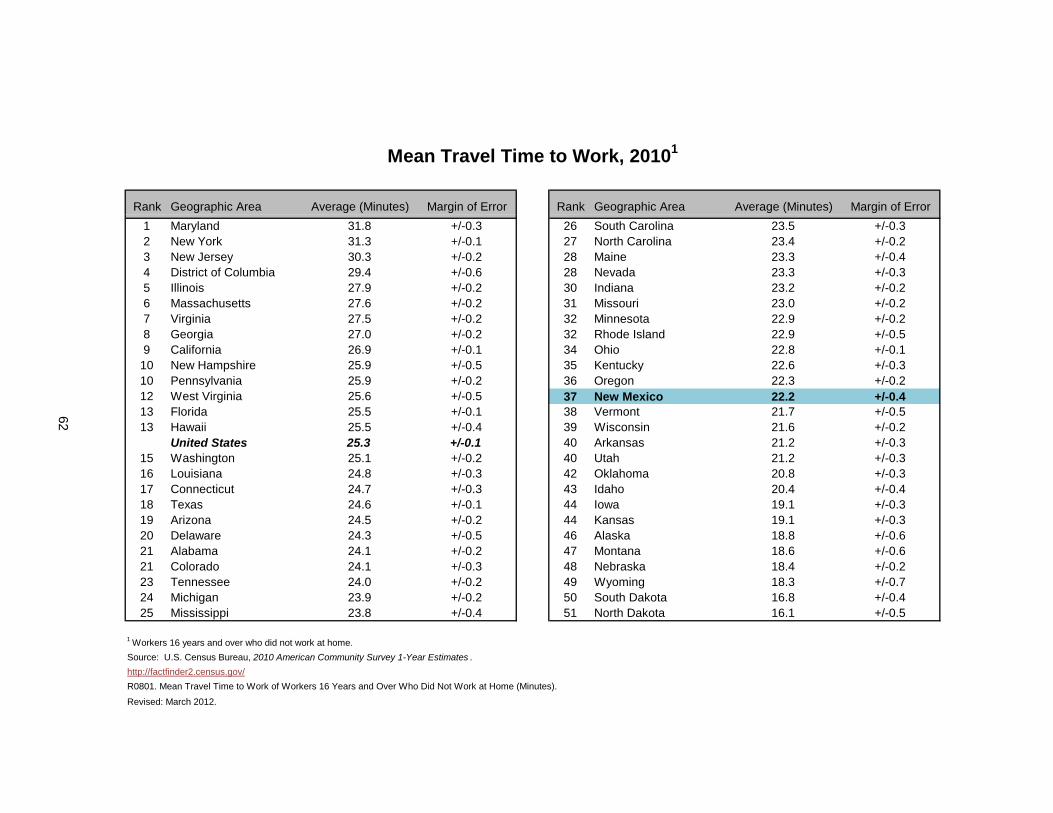
Rank Geographic Area Average (Minutes) Margin of Error Rank Geographic Area Average (Minutes) Margin of Error1 Maryland 31.8 +/-0.3 26 South Carolina 23.5 +/-0.32 New York 31.3 +/-0.1 27 North Carolina 23.4 +/-0.23 New Jersey 30.3 +/-0.2 28 Maine 23.3 +/-0.44 District of Columbia 29.4 +/-0.6 28 Nevada 23.3 +/-0.35 Illinois 27.9 +/-0.2 30 Indiana 23.2 +/-0.26 Massachusetts 27.6 +/-0.2 31 Missouri 23.0 +/-0.27 Virginia 27.5 +/-0.2 32 Minnesota 22.9 +/-0.28 Georgia 27.0 +/-0.2 32 Rhode Island 22.9 +/-0.59 California 26.9 +/-0.1 34 Ohio 22.8 +/-0.1
10 New Hampshire 25.9 +/-0.5 35 Kentucky 22.6 +/-0.310 Pennsylvania 25.9 +/-0.2 36 Oregon 22.3 +/-0.212 West Virginia 25.6 +/-0.5 37 New Mexico 22.2 +/-0.413 Florida 25.5 +/-0.1 38 Vermont 21.7 +/-0.513 Hawaii 25.5 +/-0.4 39 Wisconsin 21.6 +/-0.2
United States 25.3 +/-0.1 40 Arkansas 21.2 +/-0.315 Washington 25.1 +/-0.2 40 Utah 21.2 +/-0.316 Louisiana 24.8 +/-0.3 42 Oklahoma 20.8 +/-0.317 Connecticut 24.7 +/-0.3 43 Idaho 20.4 +/-0.418 Texas 24.6 +/-0.1 44 Iowa 19.1 +/-0.319 Arizona 24.5 +/-0.2 44 Kansas 19.1 +/-0.320 Delaware 24.3 +/-0.5 46 Alaska 18.8 +/-0.621 Alabama 24.1 +/-0.2 47 Montana 18.6 +/-0.621 Colorado 24.1 +/-0.3 48 Nebraska 18.4 +/-0.223 Tennessee 24.0 +/-0.2 49 Wyoming 18.3 +/-0.724 Michigan 23.9 +/-0.2 50 South Dakota 16.8 +/-0.425 Mississippi 23.8 +/-0.4 51 North Dakota 16.1 +/-0.5
1 Workers 16 years and over who did not work at home.Source: U.S. Census Bureau, 2010 American Community Survey 1-Year Estimates . http://factfinder2.census.gov/
Revised: March 2012.
Mean Travel Time to Work, 20101
62
R0801. Mean Travel Time to Work of Workers 16 Years and Over Who Did Not Work at Home (Minutes).

63
Rank Geographic AreaTotal workers 16 years and over
Public Transportation
Percent of Total
United States 136,941,010 6,768,661 4.9
1 District of Columbia 296,717 113,648 38.32 New York 8,723,526 2,328,724 26.73 New Jersey 4,054,388 439,572 10.84 Massachusetts 3,151,546 285,330 9.15 Maryland 2,847,946 245,628 8.66 Illinois 5,792,659 494,684 8.57 Hawaii 657,295 43,534 6.68 Washington 3,046,571 167,329 5.59 Pennsylvania 5,723,063 310,436 5.4
10 California 15,921,475 820,349 5.211 Connecticut 1,707,618 76,791 4.512 Virginia 3,845,626 168,554 4.413 Oregon 1,665,614 70,285 4.214 Minnesota 2,649,994 92,083 3.515 Nevada 1,184,067 38,895 3.316 Delaware 404,044 12,113 3.017 Colorado 2,428,102 71,917 3.018 Rhode Island 479,988 13,406 2.819 Georgia 4,118,024 93,624 2.320 Utah 1,210,020 25,757 2.121 Florida 7,865,975 161,012 2.022 Arizona 2,621,839 46,829 1.823 Wyoming 278,970 4,738 1.724 Ohio 5,070,590 84,738 1.725 Wisconsin 2,757,982 46,031 1.726 Missouri 2,706,413 42,305 1.627 Texas 11,145,480 168,791 1.528 Louisiana 1,932,178 27,806 1.429 Vermont 314,463 4,172 1.330 Michigan 4,044,769 51,549 1.331 Alaska 343,424 4,034 1.232 New Mexico 857,959 9,950 1.233 Iowa 1,513,705 16,649 1.134 Kentucky 1,803,377 19,654 1.135 North Carolina 4,119,560 43,004 1.036 Indiana 2,845,206 27,693 1.037 New Hampshire 667,506 6,098 0.938 Montana 459,904 3,856 0.839 Idaho 669,892 5,410 0.840 West Virginia 727,598 5,179 0.741 Tennessee 2,676,457 18,928 0.742 North Dakota 359,823 2,471 0.743 Nebraska 921,395 5,299 0.644 South Dakota 403,672 2,124 0.545 Oklahoma 1,653,574 8,687 0.546 Kansas 1,358,914 7,098 0.547 South Carolina 1,948,160 9,729 0.548 Arkansas 1,225,968 6,058 0.549 Maine 627,588 3,067 0.550 Mississippi 1,158,617 5,079 0.451 Alabama 1,951,769 7,964 0.4
Source: U.S. Census Bureau, 2010 American Community Survey 1-Year Estimates.
http://factfinder2.census.gov/
Revised: March 2012.
B08101. Means of Transportation to Work by Age.
Public Transportation Usage, 2010
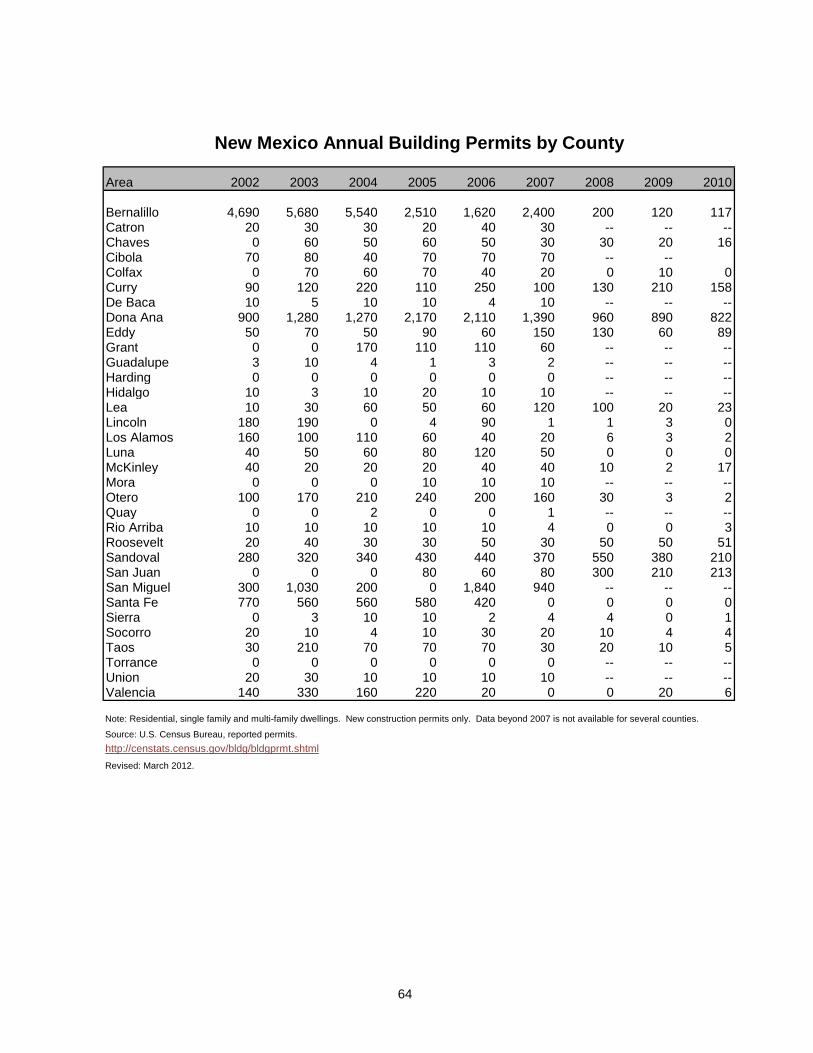
64
Area 2002 2003 2004 2005 2006 2007 2008 2009 2010
Bernalillo 4,690 5,680 5,540 2,510 1,620 2,400 200 120 117Catron 20 30 30 20 40 30 -- -- --Chaves 0 60 50 60 50 30 30 20 16Cibola 70 80 40 70 70 70 -- --Colfax 0 70 60 70 40 20 0 10 0Curry 90 120 220 110 250 100 130 210 158De Baca 10 5 10 10 4 10 -- -- --Dona Ana 900 1,280 1,270 2,170 2,110 1,390 960 890 822Eddy 50 70 50 90 60 150 130 60 89Grant 0 0 170 110 110 60 -- -- --Guadalupe 3 10 4 1 3 2 -- -- --Harding 0 0 0 0 0 0 -- -- --Hidalgo 10 3 10 20 10 10 -- -- --Lea 10 30 60 50 60 120 100 20 23Lincoln 180 190 0 4 90 1 1 3 0Los Alamos 160 100 110 60 40 20 6 3 2Luna 40 50 60 80 120 50 0 0 0McKinley 40 20 20 20 40 40 10 2 17Mora 0 0 0 10 10 10 -- -- --Otero 100 170 210 240 200 160 30 3 2Quay 0 0 2 0 0 1 -- -- --Rio Arriba 10 10 10 10 10 4 0 0 3Roosevelt 20 40 30 30 50 30 50 50 51Sandoval 280 320 340 430 440 370 550 380 210San Juan 0 0 0 80 60 80 300 210 213San Miguel 300 1,030 200 0 1,840 940 -- -- --Santa Fe 770 560 560 580 420 0 0 0 0Sierra 0 3 10 10 2 4 4 0 1Socorro 20 10 4 10 30 20 10 4 4Taos 30 210 70 70 70 30 20 10 5Torrance 0 0 0 0 0 0 -- -- --Union 20 30 10 10 10 10 -- -- --Valencia 140 330 160 220 20 0 0 20 6
Source: U.S. Census Bureau, reported permits.http://censtats.census.gov/bldg/bldgprmt.shtmlRevised: March 2012.
New Mexico Annual Building Permits by County
Note: Residential, single family and multi-family dwellings. New construction permits only. Data beyond 2007 is not available for several counties.
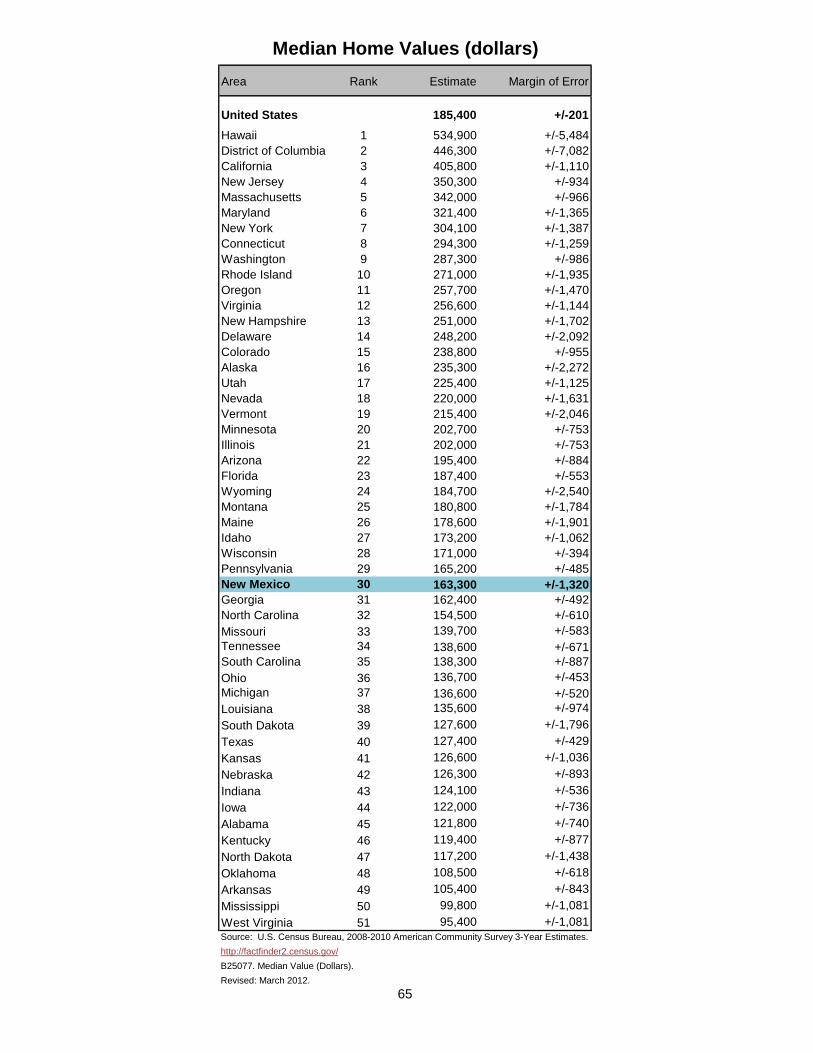
65
Area Rank Estimate Margin of Error
United States 185,400 +/-201Hawaii 1 534,900 +/-5,484District of Columbia 2 446,300 +/-7,082California 3 405,800 +/-1,110New Jersey 4 350,300 +/-934Massachusetts 5 342,000 +/-966Maryland 6 321,400 +/-1,365New York 7 304,100 +/-1,387Connecticut 8 294,300 +/-1,259Washington 9 287,300 +/-986Rhode Island 10 271,000 +/-1,935Oregon 11 257,700 +/-1,470Virginia 12 256,600 +/-1,144New Hampshire 13 251,000 +/-1,702Delaware 14 248,200 +/-2,092Colorado 15 238,800 +/-955Alaska 16 235,300 +/-2,272Utah 17 225,400 +/-1,125Nevada 18 220,000 +/-1,631Vermont 19 215,400 +/-2,046Minnesota 20 202,700 +/-753Illinois 21 202,000 +/-753Arizona 22 195,400 +/-884Florida 23 187,400 +/-553Wyoming 24 184,700 +/-2,540Montana 25 180,800 +/-1,784Maine 26 178,600 +/-1,901Idaho 27 173,200 +/-1,062Wisconsin 28 171,000 +/-394Pennsylvania 29 165,200 +/-485New Mexico 30 163,300 +/-1,320Georgia 31 162,400 +/-492North Carolina 32 154,500 +/-610Missouri 33 139,700 +/-583Tennessee 34 138,600 +/-671South Carolina 35 138,300 +/-887Ohio 36 136,700 +/-453Michigan 37 136,600 +/-520Louisiana 38 135,600 +/-974South Dakota 39 127,600 +/-1,796Texas 40 127,400 +/-429Kansas 41 126,600 +/-1,036Nebraska 42 126,300 +/-893Indiana 43 124,100 +/-536Iowa 44 122,000 +/-736Alabama 45 121,800 +/-740Kentucky 46 119,400 +/-877North Dakota 47 117,200 +/-1,438Oklahoma 48 108,500 +/-618Arkansas 49 105,400 +/-843Mississippi 50 99,800 +/-1,081West Virginia 51 95,400 +/-1,081
http://factfinder2.census.gov/B25077. Median Value (Dollars).Revised: March 2012.
Median Home Values (dollars)
Source: U.S. Census Bureau, 2008-2010 American Community Survey 3-Year Estimates.
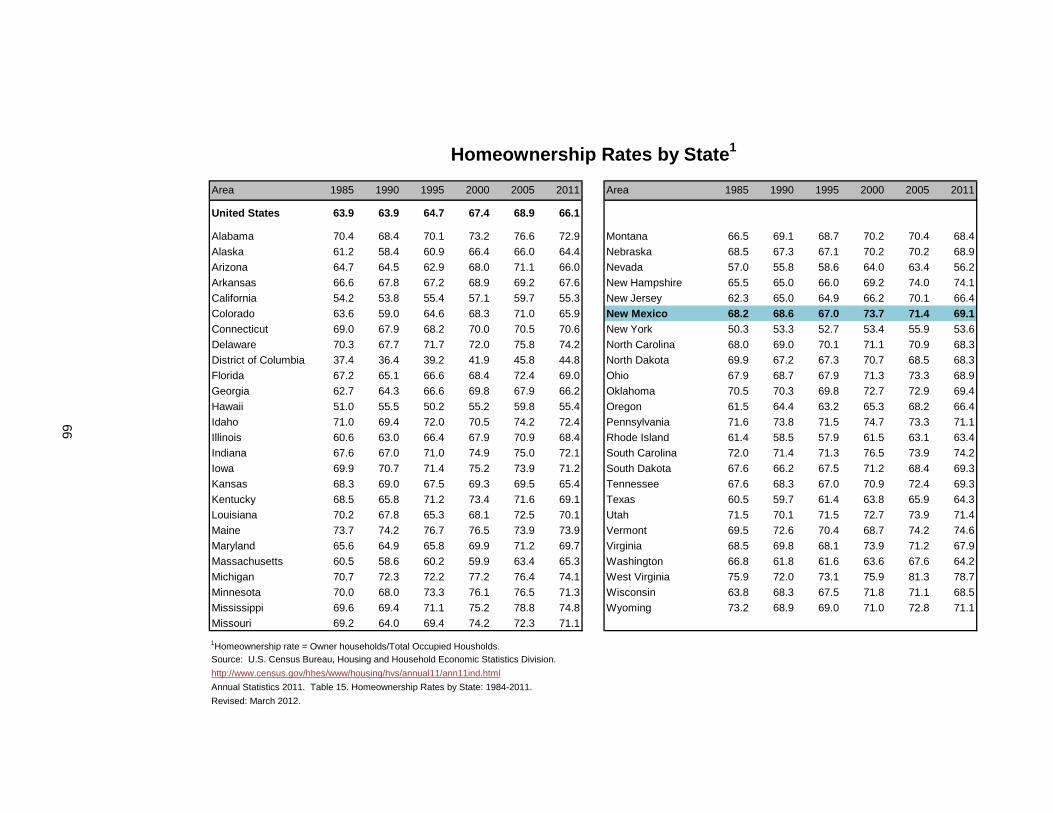
Area 1985 1990 1995 2000 2005 2011 Area 1985 1990 1995 2000 2005 2011
United States 63.9 63.9 64.7 67.4 68.9 66.1
Alabama 70.4 68.4 70.1 73.2 76.6 72.9 Montana 66.5 69.1 68.7 70.2 70.4 68.4Alaska 61.2 58.4 60.9 66.4 66.0 64.4 Nebraska 68.5 67.3 67.1 70.2 70.2 68.9Arizona 64.7 64.5 62.9 68.0 71.1 66.0 Nevada 57.0 55.8 58.6 64.0 63.4 56.2Arkansas 66.6 67.8 67.2 68.9 69.2 67.6 New Hampshire 65.5 65.0 66.0 69.2 74.0 74.1California 54.2 53.8 55.4 57.1 59.7 55.3 New Jersey 62.3 65.0 64.9 66.2 70.1 66.4Colorado 63.6 59.0 64.6 68.3 71.0 65.9 New Mexico 68.2 68.6 67.0 73.7 71.4 69.1Connecticut 69.0 67.9 68.2 70.0 70.5 70.6 New York 50.3 53.3 52.7 53.4 55.9 53.6Delaware 70.3 67.7 71.7 72.0 75.8 74.2 North Carolina 68.0 69.0 70.1 71.1 70.9 68.3District of Columbia 37.4 36.4 39.2 41.9 45.8 44.8 North Dakota 69.9 67.2 67.3 70.7 68.5 68.3Florida 67.2 65.1 66.6 68.4 72.4 69.0 Ohio 67.9 68.7 67.9 71.3 73.3 68.9Georgia 62.7 64.3 66.6 69.8 67.9 66.2 Oklahoma 70.5 70.3 69.8 72.7 72.9 69.4Hawaii 51.0 55.5 50.2 55.2 59.8 55.4 Oregon 61.5 64.4 63.2 65.3 68.2 66.4Idaho 71.0 69.4 72.0 70.5 74.2 72.4 Pennsylvania 71.6 73.8 71.5 74.7 73.3 71.1Illinois 60.6 63.0 66.4 67.9 70.9 68.4 Rhode Island 61.4 58.5 57.9 61.5 63.1 63.4Indiana 67.6 67.0 71.0 74.9 75.0 72.1 South Carolina 72.0 71.4 71.3 76.5 73.9 74.2Iowa 69.9 70.7 71.4 75.2 73.9 71.2 South Dakota 67.6 66.2 67.5 71.2 68.4 69.3Kansas 68.3 69.0 67.5 69.3 69.5 65.4 Tennessee 67.6 68.3 67.0 70.9 72.4 69.3Kentucky 68.5 65.8 71.2 73.4 71.6 69.1 Texas 60.5 59.7 61.4 63.8 65.9 64.3Louisiana 70.2 67.8 65.3 68.1 72.5 70.1 Utah 71.5 70.1 71.5 72.7 73.9 71.4Maine 73.7 74.2 76.7 76.5 73.9 73.9 Vermont 69.5 72.6 70.4 68.7 74.2 74.6Maryland 65.6 64.9 65.8 69.9 71.2 69.7 Virginia 68.5 69.8 68.1 73.9 71.2 67.9Massachusetts 60.5 58.6 60.2 59.9 63.4 65.3 Washington 66.8 61.8 61.6 63.6 67.6 64.2Michigan 70.7 72.3 72.2 77.2 76.4 74.1 West Virginia 75.9 72.0 73.1 75.9 81.3 78.7Minnesota 70.0 68.0 73.3 76.1 76.5 71.3 Wisconsin 63.8 68.3 67.5 71.8 71.1 68.5Mississippi 69.6 69.4 71.1 75.2 78.8 74.8 Wyoming 73.2 68.9 69.0 71.0 72.8 71.1Missouri 69.2 64.0 69.4 74.2 72.3 71.1
1Homeownership rate = Owner households/Total Occupied Housholds.Source: U.S. Census Bureau, Housing and Household Economic Statistics Division. http://www.census.gov/hhes/www/housing/hvs/annual11/ann11ind.htmlAnnual Statistics 2011. Table 15. Homeownership Rates by State: 1984-2011.Revised: March 2012.
Homeownership Rates by State1
66
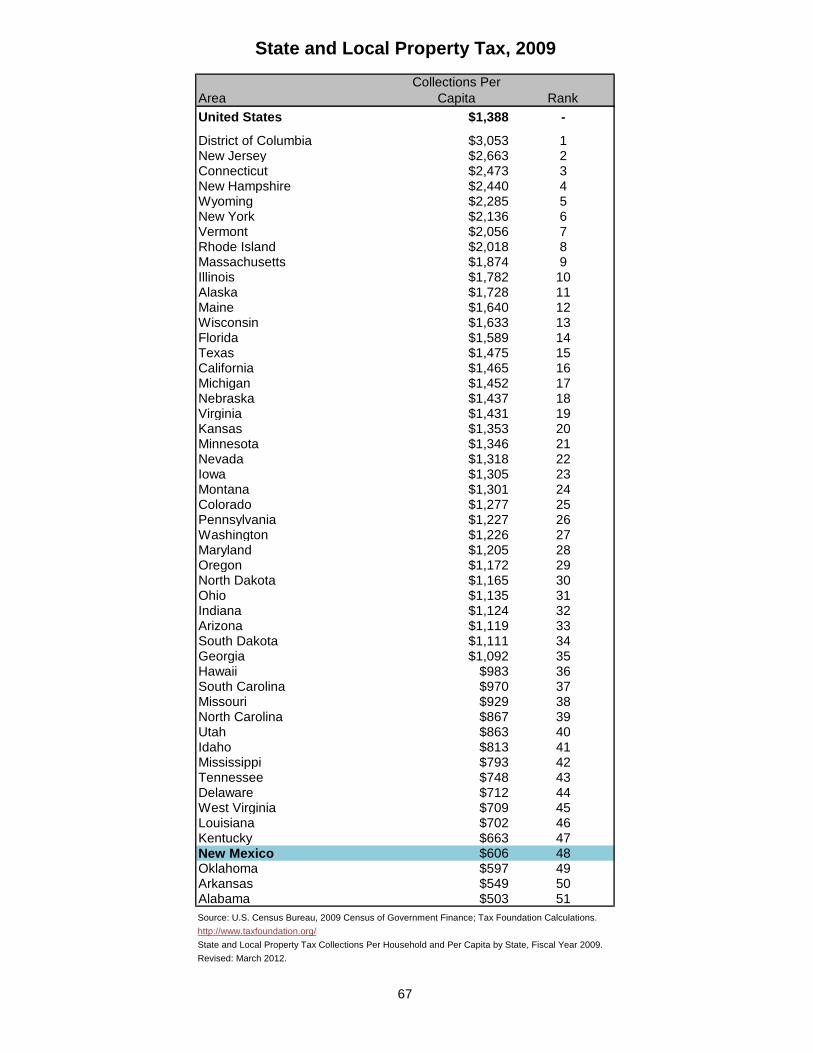
67
United States $1,388 -
District of Columbia $3,053 1New Jersey $2,663 2Connecticut $2,473 3New Hampshire $2,440 4Wyoming $2,285 5New York $2,136 6Vermont $2,056 7Rhode Island $2,018 8Massachusetts $1,874 9Illinois $1,782 10Alaska $1,728 11Maine $1,640 12Wisconsin $1,633 13Florida $1,589 14Texas $1,475 15California $1,465 16Michigan $1,452 17Nebraska $1,437 18Virginia $1,431 19Kansas $1,353 20Minnesota $1,346 21Nevada $1,318 22Iowa $1,305 23Montana $1,301 24Colorado $1,277 25Pennsylvania $1,227 26Washington $1,226 27Maryland $1,205 28Oregon $1,172 29North Dakota $1,165 30Ohio $1,135 31Indiana $1,124 32Arizona $1,119 33South Dakota $1,111 34Georgia $1,092 35Hawaii $983 36South Carolina $970 37Missouri $929 38North Carolina $867 39Utah $863 40Idaho $813 41Mississippi $793 42Tennessee $748 43Delaware $712 44West Virginia $709 45Louisiana $702 46Kentucky $663 47New Mexico $606 48Oklahoma $597 49Arkansas $549 50Alabama $503 51
http://www.taxfoundation.org/
Revised: March 2012.State and Local Property Tax Collections Per Household and Per Capita by State, Fiscal Year 2009.
Source: U.S. Census Bureau, 2009 Census of Government Finance; Tax Foundation Calculations.
State and Local Property Tax, 2009
AreaCollections Per
Capita Rank

68
Rank Geographic Area Median- United States 36.81 Maine 42.22 Vermont 41.23 West Virginia 40.54 New Hampshire 40.45 Florida 40.06 Pennsylvania 39.97 Connecticut 39.58 Rhode Island 39.29t Massachusetts 39.09t Montana 39.011 New Jersey 38.812 Michigan 38.512 Ohio 38.514 Delaware 38.415 Wisconsin 38.216 New York 38.116 Oregon 38.118 Iowa 38.019 Kentucky 37.719 Maryland 37.719 Tennessee 37.722 Missouri 37.622 South Carolina 37.624 Hawaii 37.525 Alabama 37.426 Minnesota 37.327 Arkansas 37.027 Washington 37.029 North Carolina 36.929 South Dakota 36.929 Virginia 36.932 Indiana 36.833 North Dakota 36.334 Illinois 36.235 Kansas 35.935 Wyoming 35.937 Nebraska 35.837 Oklahoma 35.839 Colorado 35.740 New Mexico 35.641 Nevada 35.542 Louisiana 35.443 District of Columbia 35.144 Arizona 35.044 Mississippi 35.046 California 34.847 Georgia 34.748 Idaho 34.149 Texas 33.050 Alaska 32.851 Utah 28.8
ranked by estimate).
Median Age of the Population, 2009
Most recent data available. Revised: March 2012.
Source: U.S. Census Bureau, 2009 Population Estimates . http://factfinder2.census.gov/GCT-T2-R. Median Age of the Total Population (geographies

Total populationTotal citizen population
Total registered (Citizen 18+)
Percent registered (Citizen 18+)
Total voted (Citizen 18+)
Percent voted (Citizen 18+)
UNITED STATESTotal 225,499 206,072 146,311 64.9 131,144 58.2Male 108,974 98,818 68,242 62.6 60,729 55.7Female 116,525 107,255 78,069 67.0 70,415 60.4White alone 183,169 169,438 122,020 66.6 109,100 59.6 White non-Hispanic alone 154,472 151,321 111,215 72.0 100,042 64.8Black alone 26,528 24,930 17,375 65.5 16,133 60.8Asian alone 10,455 7,059 3,901 37.3 3,357 32.1Hispanic (of any race) 30,852 19,537 11,608 37.6 9,745 31.6White alone or in combination 185,773 171,798 123,628 66.5 110,500 59.5Black alone or in combination 27,483 25,768 17,960 65.3 16,674 60.7Asian alone or in combination 11,009 7,562 4,225 38.4 3,627 32.9
NEW MEXICOTotal 1,473 1,352 937 63.6 846 57.4Male 720 653 445 61.8 395 54.8Female 753 699 491 65.3 451 59.9White alone 1,287 1,176 833 64.7 748 58.1 White non-Hispanic alone 666 654 496 74.5 468 70.3Black alone 32 31 22 (B) 20 (B)Asian alone 29 19 16 (B) 14 (B)Hispanic (of any race) 640 539 346 54.1 289 45.2White alone or in combination 1,293 1,181 838 64.9 753 58.3Black alone or in combination 33 32 23 (B) 22 (B)Asian alone or in combination 29 19 16 (B) 14 (B)
Numbers in thousands.NOTE: The symbol (B) means that the base is less than 75,000 and therefore too small to show the derived measure.Separate estimates for the race group “White Non-Hispanic Alone or in Combination,” which were included in 2004, have been removed from this table. Please contact the Education and Social Stratification Branch if you have any questions (301-763-2468).
Voter Participation Rates, 2008
Internet release date: February 2009.
69
Source: U.S. Census Bureau, Current Population Survey, 2008. http://www.census.gov/hhes/www/socdemo/voting/index.htmlTable 4b. Reported Voting and Registration of the Voting-Age Population, by Sex, Race and Hispanic Origin, for States: November 2008.
Most recent data available. Revised: March 2012.
Registered Voted

Rank Geographic Area Total Number Uninsured
90-percent confidence
interval2Percentage Rank Geographic Area Total Number
Uninsured
90-percent confidence
interval2Percentage
United States 303,957 47,890 499 15.81 Texas 24,669 6,130 243 24.8 27 Missouri 5,940 811 70 13.72 New Mexico 1,990 433 52 21.8 28 Utah 2,796 370 33 13.23 Florida 18,328 3,785 168 20.7 29 Ohio 11,403 1,471 105 12.94 Nevada 2,618 524 38 20.0 29 Virginia 7,766 998 64 12.95 Arizona 6,584 1,256 107 19.1 31 Indiana 6,339 813 74 12.86 Georgia 9,685 1,840 124 19.0 31 South Dakota 801 102 13 12.87 California 36,903 6,987 208 18.9 31 Washington 6,659 853 75 12.88 Mississippi 2,896 542 40 18.7 34 Maryland 5,644 710 62 12.69 Arkansas 2,853 526 35 18.5 35 Kansas 2,742 341 39 12.5
10 Alaska 685 125 10 18.3 35 Michigan 9,801 1,223 74 12.511 Louisiana 4,406 792 57 18.0 37 Nebraska 1,781 210 16 11.812 South Carolina 4,501 793 61 17.6 38 Delaware 876 102 9 11.713 North Carolina 9,283 1,547 103 16.7 38 North Dakota 631 74 9 11.714 Idaho 1,525 253 26 16.6 40 Rhode Island 1,041 120 10 11.515 Oregon 3,809 628 48 16.5 41 District of Columbia 599 68 7 11.416 Montana 973 159 14 16.3 42 Iowa 2,983 320 36 10.716 Oklahoma 3,622 589 71 16.3 43 Connecticut 3,471 364 30 10.518 Kentucky 4,277 663 61 15.5 43 Pennsylvania 12,354 1,299 82 10.519 Wyoming 536 82 6 15.3 45 New Hampshire 1,306 132 10 10.120 Tennessee 6,249 920 72 14.7 46 Maine 1,301 129 11 9.921 Alabama 4,687 677 64 14.4 47 Vermont 618 58 5 9.421 New Jersey 8,625 1,241 98 14.4 48 Wisconsin 5,577 511 54 9.223 Colorado 4,979 711 48 14.3 49 Minnesota 5,170 449 45 8.724 New York 19,270 2,728 134 14.2 50 Hawaii 1,255 94 9 7.525 West Virginia 1,804 251 27 13.9 51 Massachusetts 6,556 325 37 5.026 Illinois 12,790 1,759 115 13.8
70
Revised: March 2012.
http://www.census.gov/hhes/www/hlthins/data/incpovhlth/2010/tables.html
Percentage of People Uninsured by State1
Numbers in thousands. People as of March of the following year.13-Year Average (2008-2010).2For more information see "Standard errors and their use" at <www.census.gov/hhes/www/p60_238sa.pdf>.Source: U.S. Census Bureau, Current Population Survey, 2008 to 2011 Annual Social and Economic Supplements.
Table: Number and Percentage of People Without Health Insurance Coverage by State Using 2-and 3-Year Averages: 2007-2008 and 2009-2010.
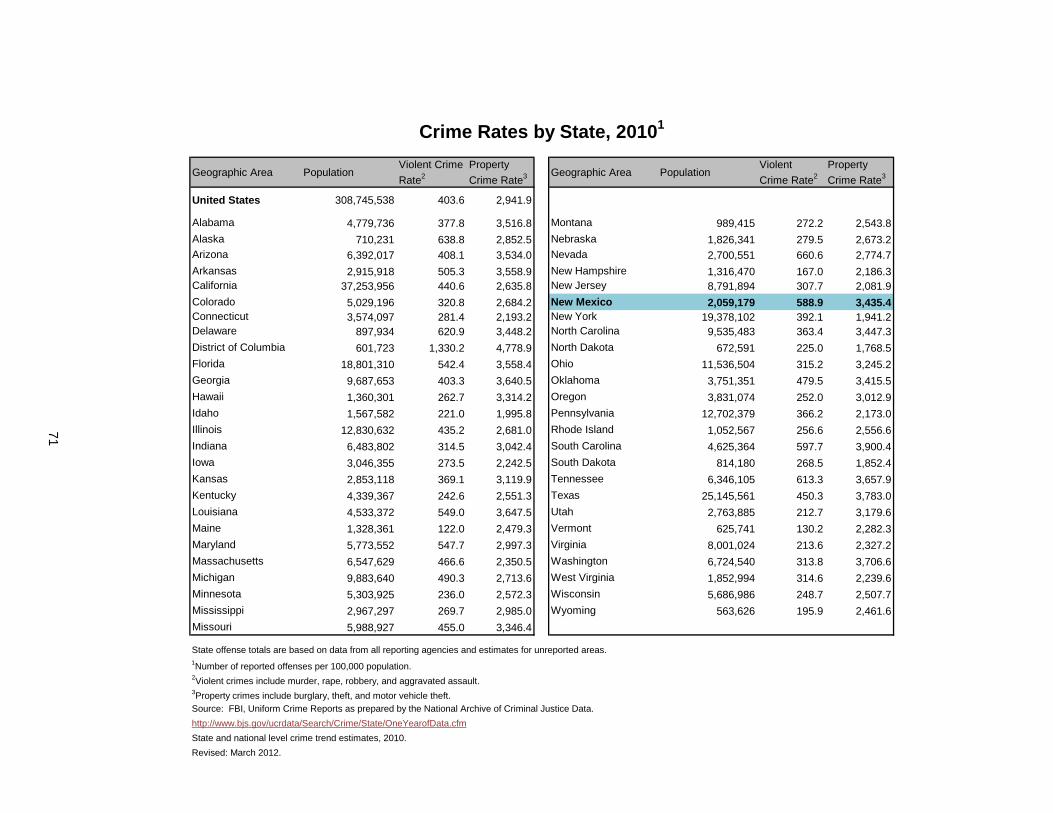
Geographic Area PopulationViolent Crime Rate2
Property Crime Rate3 Geographic Area Population
Violent Crime Rate2
Property Crime Rate3
United States 308,745,538 403.6 2,941.9
Alabama 4,779,736 377.8 3,516.8 Montana 989,415 272.2 2,543.8Alaska 710,231 638.8 2,852.5 Nebraska 1,826,341 279.5 2,673.2Arizona 6,392,017 408.1 3,534.0 Nevada 2,700,551 660.6 2,774.7Arkansas 2,915,918 505.3 3,558.9 New Hampshire 1,316,470 167.0 2,186.3California 37,253,956 440.6 2,635.8 New Jersey 8,791,894 307.7 2,081.9Colorado 5,029,196 320.8 2,684.2 New Mexico 2,059,179 588.9 3,435.4Connecticut 3,574,097 281.4 2,193.2 New York 19,378,102 392.1 1,941.2Delaware 897,934 620.9 3,448.2 North Carolina 9,535,483 363.4 3,447.3District of Columbia 601,723 1,330.2 4,778.9 North Dakota 672,591 225.0 1,768.5Florida 18,801,310 542.4 3,558.4 Ohio 11,536,504 315.2 3,245.2Georgia 9,687,653 403.3 3,640.5 Oklahoma 3,751,351 479.5 3,415.5Hawaii 1,360,301 262.7 3,314.2 Oregon 3,831,074 252.0 3,012.9Idaho 1,567,582 221.0 1,995.8 Pennsylvania 12,702,379 366.2 2,173.0Illinois 12,830,632 435.2 2,681.0 Rhode Island 1,052,567 256.6 2,556.6Indiana 6,483,802 314.5 3,042.4 South Carolina 4,625,364 597.7 3,900.4Iowa 3,046,355 273.5 2,242.5 South Dakota 814,180 268.5 1,852.4Kansas 2,853,118 369.1 3,119.9 Tennessee 6,346,105 613.3 3,657.9Kentucky 4,339,367 242.6 2,551.3 Texas 25,145,561 450.3 3,783.0Louisiana 4,533,372 549.0 3,647.5 Utah 2,763,885 212.7 3,179.6Maine 1,328,361 122.0 2,479.3 Vermont 625,741 130.2 2,282.3Maryland 5,773,552 547.7 2,997.3 Virginia 8,001,024 213.6 2,327.2Massachusetts 6,547,629 466.6 2,350.5 Washington 6,724,540 313.8 3,706.6Michigan 9,883,640 490.3 2,713.6 West Virginia 1,852,994 314.6 2,239.6Minnesota 5,303,925 236.0 2,572.3 Wisconsin 5,686,986 248.7 2,507.7Mississippi 2,967,297 269.7 2,985.0 Wyoming 563,626 195.9 2,461.6Missouri 5,988,927 455.0 3,346.4
State offense totals are based on data from all reporting agencies and estimates for unreported areas.
2Violent crimes include murder, rape, robbery, and aggravated assault.3Property crimes include burglary, theft, and motor vehicle theft.Source: FBI, Uniform Crime Reports as prepared by the National Archive of Criminal Justice Data. http://www.bjs.gov/ucrdata/Search/Crime/State/OneYearofData.cfm
Revised: March 2012.
Crime Rates by State, 20101
1Number of reported offenses per 100,000 population.
State and national level crime trend estimates, 2010.
71
A-1
Operational Programs
The Economic Research and Analysis Bureau (ER&A) is responsible for the collection, development, analysis, and publication of labor market information for New Mexico and its various substate areas. The Bureau operates five statistical programs under contract with the U.S. Department of Labor, Bureau of Labor Statistics. The Bureau is organized as follows: CURRENT EMPLOYMENT STATISTICS The Current Employment Statistics (CES) program is a federal/state cooperative statistical program. Using a monthly employer survey, estimates of nonagricultural payroll employment by industry are derived for Statewide New Mexico and the Albuquerque, Las Cruces, Santa Fe, and Farmington Metropolitan Statistical Areas (MSAs). Estimates of earnings and hours of work are also derived for some industries and areas. The Mass Layoffs Statistics program is also conducted by this unit. QUARTERLY CENSUS OF EMPLOYMENT AND WAGES The Quarterly Census of Employment and Wages (QCEW, formerly ES-202) is a federal/state cooperative statistical program. Using administrative data from state and federal unemployment insurance (UI) programs, the QCEW program produces employment, wage, and UI contribution totals by industry. Output from this program is used in producing economic measures such as Gross Domestic Product and personal income. LOCAL AREA UNEMPLOYMENT STATISTICS Local Area Unemployment Statistics (LAUS) is a federal/state cooperative statistical program. This program produces estimates of the monthly labor force, employment, unemployment, and unemployment rate for Statewide New Mexico and substate areas. It also tracks local unemployment trends within New Mexico for the U.S. Department of Labor’s Labor Surplus Program which gives priority to high unemployment area businesses when bidding for federal government procurement contracts. OCCUPATIONAL INFORMATION AND PLANNING This unit operates a federal/state statistical program called Occupational Employment Statistics (OES). The OES program produces occupational staffing pattern estimates by industry by means of a semi-annual survey with approximately 3,500 employers sampled in each panel. This unit develops long-range occupational employment forecasts through the use of staffing pattern data from the OES program. The unit is responsible for providing planning information for placement, counseling, education, and job training. Wage Information-Estimate Delivery System contains the confidential OES occupation and wage information collected from employers. Job seekers and employers can utilize this information to anticipate what an occupation pays in a given area based on experience. DATA ANALYSIS AND PUBLICATIONS This unit is responsible for producing the New Mexico Labor Market Review, a monthly labor market information newsletter, and the monthly Employment News Release. Additionally, the unit is responsible for coordinating the production and dissemination of economic data and career information through reports, exhibits, conferences, and workshops. The unit maintains the New Mexico Department of Workforce Solutions Labor Market Information website and LASER (Labor Analysis, Statistics, and Economic Research), and produces a broad range of publications for educational institutions, employers, job seekers, and the general public.

A-2
New Mexico Department of Workforce Solutions Resources
New Mexico Department of Workforce Solutions Bureau of Economic Research & Analysis P.O. Box 1928 Albuquerque, NM 87103 (505) 383-2729 Please visit us online at www.dws.state.nm.us for the most current information. Printed publications are of limited availability and may not include recent updates. JOB SEARCH AND WORKFORCE SERVICES Labor Analysis Statistics and Economic Research (LASER) A powerful online job seeker/workforce services system that provides access to a complete set of employment tools in one website. The site is designed to assist job seekers, students, case managers, employers, training providers, workforce professionals, and others seeking benefits and services. Career Solutions System The Career Solutions System is designed to help students, parents, educators, and job seekers make informed decisions regarding career planning and occupational exploration. The site includes an Occupation Interest Profiler, along with additional tools to help the user complete the Next Step Plan, explore post-secondary educational opportunities, and develop effective job-seeking skills. EMPLOYMENT/UNEMPLOYMENT STATISTICS Employment News Release Monthly press release providing a brief summary of current economic conditions in New Mexico, along with concise tables of LAUS and CES estimates.
New Mexico Labor Market Review Monthly publication with statewide and local area labor force employment and unemployment estimates, employment by industry, average weekly earnings, and significant labor market developments. Includes preliminary labor force estimates for substate areas, special articles, and much more. Table A Civilian Labor Force, Employment, Unemployment, and Unemployment Rate (Monthly) Data for the United States; New Mexico; the Albuquerque, Farmington, Las Cruces, and Santa Fe MSAs; and all 33 New Mexico counties. Table B Employment by Industry and County (Monthly) Data for all 33 New Mexico counties. Table C Civilian Labor Force, Employment, Unemployment, and Unemployment Rate (Annual Averages) Data for the United States; New Mexico; the Albuquerque, Farmington, Las Cruces, and Santa Fe MSAs; and all 33 New Mexico counties. Table D Employment by Industry and County (Annual Averages) Data for New Mexico and its 33 counties. Current Employment Statistics Nonagricultural Wage and Salary Employment by Industry (Monthly and Annual Averages) Data for New Mexico and the Albuquerque, Farmington, Las Cruces, and Santa Fe MSAs.
A-3
New Mexico Department of Workforce Solutions (cont.) EMPLOYMENT/UNEMPLOYMENT STATISTICS (cont.) Quarterly Census of Employment and Wages Covered Employment and Wages by Industry (Quarterly Employment by Month and Average Weekly Wages) Data for New Mexico and its 33 counties. Size Class Data Annual information on private-sector workers covered by New Mexico Unemployment Insurance laws. Data is reported by establishment size and number of workers. INDUSTRY/OCCUPATIONAL DATA Occupational Employment and Wage Estimates Employment and wage data for New Mexico; the Albuquerque, Farmington, Las Cruces, and Santa Fe MSAs; and New Mexico's four Workforce Investment Act areas using the Estimate Delivery System produced by the North Carolina Employment Security Commission. Quick Reference Sheets for Wages Separate pamphlets for New Mexico's four WIA areas and the Albuquerque, Las Cruces, and Santa Fe MSAs list typical starting wages and a broad range of average wages for almost 200 occupations. Industry and Occupation Employment Projections Short-term and long-term industry and occupation employment projections for New Mexico; the Albuquerque, Farmington, Las Cruces, and Santa Fe MSAs; and New Mexico's four Workforce Investment Act areas. ADDITIONAL SOURCES OF ECONOMIC DATA AND JOB HUNTER INFORMATION ARE AVAILABLE ON OUR WEBSITE AT WWW.DWS.STATE.NM.US
A-4
Publications Available From Other Sources
Many of these publications are available at low or no cost or in digital format from the website address provided.
City of Albuquerque Planning Department 600 2nd St. NW Albuquerque, NM 87103 (505) 924-3860 http://www.cabq.gov/planning/
Publications Urban Growth Trends 1980-1990 and Urban Growth Projections 1999-2010 - Provide historical and projected socioeconomic data for the Albuquerque area.
New Mexico Economic Development Department 1100 St. Francis Drive Santa Fe, NM 87503 (505) 827-0300 http://www.gonm.biz/
Publications Strategic Plan - An annual publication detailing the department's goals and past performance in furthering economic development in New Mexico.
Performance Measures - A quarterly report of accomplishments and goals achieved by the Economic Development Department. University of New Mexico Bureau of Business and Economic Research 303 Girard Blvd, NE Ste 116 Albuquerque, NM 87106 (505) 277-2216 or (505) 277-6626 for Data Bank www.unm.edu/~bber
Publications New Mexico Business, Current Economic Report - Reviews the current New Mexico economy and contains special economic research articles.
FOR-UNM Bulletin - A quarterly economic forecast of the New Mexico economy.
New Mexico County Population Projections July 1, 2005 to July 1, 2035 (CD product) - CD includes Microsoft Excel menus that allow the user to create data tables interactively for various geographic areas. Data tables and graphics show distributions of the projected population and percent distributions in various intervals by sex and age. U.S. Department of Labor Bureau of Labor Statistics - Southwest Information Office 525 Griffin St., Rm. 221 Dallas, TX 75202 (214) 767-6970 www.bls.gov
Publications Monthly Labor Review - The principal journal of fact, analysis, and research from the Bureau of Labor Statistics providing information in a wide variety of areas—the labor force, the economy, employment, inflation, productivity, occupational injuries and illnesses, wages, prices, and many more. Occupational Outlook Handbook, 2012-2013 Edition - Source of career information including job descriptions, working conditions, training and education requirements, earnings, and expected job prospects.
A-5
Glossary
ANNUAL AVERAGE PAY Annual average pay is computed by dividing total annual payrolls of employees covered by unemployment insurance programs by average monthly employment for these employees. CIVILIAN LABOR FORCE The “Civilian Labor Force” is the total labor force, excluding persons in the Armed Forces. Most published data, including national and state estimates, pertain to the Civilian Labor Force. EMPLOYED Employed persons are those individuals, 16 years of age and older, who did any work at all during the survey week as paid employees, or in their own business, profession or farm, or who worked 15 hours or more as unpaid workers in a family operated business. Also counted as employed are those persons who had jobs or businesses from which they were temporarily absent because of illness, bad weather, vacation, labor-management dispute, or personal reasons. Individuals are counted only once even though they may hold more than one job. Employment figures relate to place of residence, and not to place of work. ESTIMATE An estimate is an approximate figure arrived at by following specified procedures, thoughtful consideration of facts and/or approximate calculations. It does not imply an exact figure and may be subject to change or revision as additional facts or techniques become available. Estimates based on early sample returns or heavily upon the judgment of an analyst due to the fact that numerous facts are as yet unavailable are identified as Preliminary Estimates. SUPPLEMENTAL NUTRITION ASSISTANCE PROGRAM (SNAP) Provides low-income households with increased food purchasing power to enable them to obtain a more adequate nutritional diet through a federal program regulated by the U.S. Department of Agriculture. The electronic benefit card may be used in retail grocery outlets for food items. LABOR AREA A labor area is a geographical area consisting of a central city community or communities in which there is a concentration of economic activity and in which workers can generally change jobs without changing their residence. Basic emphasis is on the relationship between the worker’s place of residence and place of work. Each New Mexico county is considered as a separate labor area except Bernalillo, Sandoval, Torrance and Valencia counties, which make up the Albuquerque MSA. LABOR FORCE The term “labor force” usually refers to an estimate of the number of persons, 16 years of age and older, classified as “Employed” or “Unemployed.” LABOR FORCE PARTICIPATION RATE The number of persons in the labor force as a percent of the total population 16 years of age and older. LOWER LIVING STANDARD INCOME LEVEL (LLSIL) The lower living standard income level means that income level (adjusted for regional, metropolitan, urban and rural differences, and family size) determined annually by the Secretary of U.S. Department of Labor based on the most recent “lower living family budget” issued by the Secretary. The following levels are the same for the whole of the western region (Source: http://www.doleta.gov/llsil/2011/). 2011 - WEST REGION LLSIL BASED ON FAMILY OF FOUR METRO 70% NON-METRO METRO 100% NON-METRO $26,544 $25,481 $37,920 $36,402
A-6
Glossary (cont.)
METROPOLITAN AREA Urban places of 50,000 or more population are metropolitan areas as defined by the Census of Population. All jurisdictions within the MSA, regardless of size, are considered metropolitan areas. METROPOLITAN STATISTICAL AREA (MSA) The general concept of the metropolitan statistical area (MSA) is one of a large population nucleus together with adjacent communities which have a high degree of economic and social integration with that nucleus. Specifically, an area must either have a city with a population of at least 50,000 or it must have an urbanized area of at least 50,000 and a total county (or multi-county) population of at least 100,000. New Mexico has four MSAs; Albuquerque MSA, Farmington MSA, Las Cruces MSA, and Santa Fe MSA. NONAGRICULTURAL WAGE AND SALARY EMPLOYMENT (JOBS) Nonagricultural wage and salary jobs refers only to employees on establishment payrolls during the survey week in each month and excludes self-employed, unpaid family workers, domestic workers, agricultural workers, and workers involved in labor-management disputes. Nonagricultural wage and salary employment figures relate to place of work of the workers and not to their place of residence. The payroll records may count a person more than once to the extent that multiple job holding exists during the payroll period. In addition, the payroll data includes commuters who live outside the labor area, but not commuters who work outside the area. PER CAPITA INCOME Per capita personal income is the total personal income of residents divided by the resident population. PERSONAL INCOME Personal income is the current income received by residents of an area from all sources. It is measured after deduction of personal contributions for social security, government retirement, and other social insurance programs but before deductions of income and other personal taxes. It includes income received from foreign governments. It consists of wage and salary disbursements, various types of supplementary earnings termed “other labor income,” proprietors’ income, rental income, dividends, interest, and government and business transfers. TEMPORARY ASSISTANCE FOR NEEDY FAMILIES (TANF) Formerly called Aid to Families with Dependent Children (AFDC), TANF provides financial assistance and support services to families with children needing care or support due to death, absence, disability, unemployment, or under employment of one or both parents. POVERTY The poverty concept is a statistical yardstick based on the Department of Agriculture’s 1961 Economy Food Plan and reflects the different consumption requirements of families in relation to their size and composition, sex and age of the family head and number of children under 18 years of age. It was discovered from the U.S. Department of Agriculture’s 1955 Survey of Food Consumption that families of three or more persons spend approximately one-third of their income on food; the poverty level was therefore set at three times the cost of the Economy Food Plan. The level comes out once a year, late-February to early March. See http://aspe.hhs.gov/poverty/ to check for the most recent figures. The following represents 100% of poverty. POVERTY LEVEL GUIDELINES - 2011 FAMILY SIZE 1 2 3 4 5 6 7 8 INCOME LEVEL $10,890 14,710 18,530 22,350 26,170 29,990 33,810 37,630 UNEMPLOYED Persons 16 years and over who had no employment during the reference week, were available for work, except for temporary illness, and had made specific efforts to find employment sometime during the 4-week period ending with the reference week. Persons who were waiting to be recalled to a job from which they had been laid off need not have been looking for work to be classified as unemployed. WORKFORCE INVESTMENT ACT (WIA) WIA established programs to prepare youth and unskilled adults for entry into the labor force and to offer job training to those economically disadvantaged individuals and other individuals facing serious barriers to employment.