new method to compare indoor and outdoor temperature
TRANSCRIPT

Uludağ University Journal of The Faculty of Engineering, Vol. 23, No. 1, 2018 RESEARCH
DOI: 10.17482/uumfd.298338
127
NEW METHOD TO COMPARE INDOOR AND OUTDOOR
TEMPERATURE COEFFICIENTS OF PHOTOVOLTAIC
MODULES
Ali ŞENTÜRK
*
Rüştü EKE*
Received: 16.03.2017; revised: 06.10.2017; accepted: 15.11.2017
Abstract: In this study, a new method is presented to compare the indoor and outdoor temperature
coefficients of photovoltaic module. Precise input of temperature coefficients introduced in the simulation
is very essential to obtain accurate results about the actual performance of photovoltaic module/array.
Thus, it is important to specify which type (indoor or outdoor) of the temperature coefficient is more
accurate in simulating the actual performance. The short circuit current, the open circuit voltage, the
output peak power and produced energy are considered as actual performance indexes. New method
proposed in this study, simulates the actual performance for both indoor and outdoor temperature
coefficients and compares with actual performance measured at field to decide which type of temperature
coefficient is more accurate.
Keywords: Temperature Coefficient, Photovoltaic Module, Photovoltaic Array, Photovoltaic
Performance
Yeni Bir Yöntemle Fotovoltaik Modüllerin İç ve Dış Sıcaklık Katsayılarının Karşılıştırılması
Öz: Bu çalışmada, fotovoltaik modüllerin iç ve dış ortamda elde edilen sıcaklık katsayılarının
karşılaştırılması için yeni bir yöntem ortaya konmuştur. Fotovoltaik modüllerin/örgülerin gerçek
performanslarının doğru bir şekilde simüle edilebilmesi için doğru sıcaklık katsayılarının kullanılması
oldukça önemlidir. Bu yüzden, gerçek performansın simülasyonunda hangi tip sıcaklık katsayılarının (iç
veya dış) daha doğru sonuçlar vereceği belirlenmelidir. Kısa devre akımı, açık devre gerilimi, maksimum
çıkış gücü ve üretilen enerji gerçek performans parametreleri olarak kabul edilmişlerdir. Bu çalışmada
ortaya konan yeni yöntem, gerçek performansı iç ve dış ortam sıcaklık katsayıları için simüle etmekte ve
hangi tip sıcaklık katsayılarının daha doğru olduğunu belirleyebilmek için dış ortamda ölçülen gerçek
performansla karşılaştırmaktadır.
Anahtar Kelimeler: Sıcaklık Katsayısı, Fotovoltaik Modül, Fotovoltaik Örgü, Fotovoltaik
Performans
1. INTRODUCTION
The photovoltaic (PV) phenomenon provides clean and efficient energy to all humanity.
Forecasting the energy produced (E) by PV arrays is important for to analyze their economic
viability and inspect their operation (Rodrigues et al., 2016). PV arrays are formed from
identical PV modules that electrically connected in series-parallel combinations. Once knowing
the PV module's performance, it is possible to calculate the PV array's one (Rus-Casas et al.,
* Department of Physics, Faculty of Science, Muğla Sıtkı Koçman University, 48120,Turkey
Correspondence Author: Ali ŞENTÜRK ([email protected])

A.Şentürk,R.Eke: New Method to Cmp. Indoor and Outdoor Temp. Coefficients of Photovoltaic Modules
128
2014; Şentürk and Eke, 2015; Tian et al., 2012). The energy produced by PV modules and thus
PV arrays mainly depends on irradiation and temperature as well as the secondary parameters
such as operating period, orientation, montage type and etc. (Huld and Gracia Amillo, 2015).
According to method of calculating the output peak power (PM), there are two ways to simulate
the energy produced by PV modules; direct and in-direct methods (Chenni et al., 2007; Ciulla et
al., 2014; Humada et al., 2016; Rus-Casas et al., 2014; Tossa et al., 2014). In direct methods, PM
is usually calculated directly from empirical expressions. In indirect methods, at first, a current-
voltage (I-V) curve of PV module is obtained by means of a single or double diode models and
then corresponding PM is extracted from this curve (Nassar-eddine et al., 2016). Finally, the
produced energy (E) is calculated from PM which is obtained either by means of direct or
indirect methods (Jack et al., 2015; Rus-Casas et al., 2014).
Regarding the direct and indirect methods, to calculate the energy produced by PV modules,
the actual electrical parameters; short-circuit current (ISC), open-circuit voltage (VOC) and
output peak power (PM), are needed to be know (Hussein et al., 2004). The actual electrical
parameters (ISC, VOC and PM) mainly depend on the module temperature (TM), the irradiation (G)
that expose on PV module and their reference electrical parameters (ISCREF, VOCREF, and PMREF)
that given in PV module datasheet. The reference electrical parameters are rated under Standard
Test Conditions (STC) that cover irradiation level, module temperature and spectral distribution
with value of 1000 W/m2, 25 °C and AM1.5, respectively. The irradiation dependence of the
actual electrical parameters could be expressed with explicit formulations i.e. no need additional
information to be known(Ismail et al., 2013; Skoplaki and Palyvos, 2009). On the other hand,
the temperature dependence of these electrical parameters is described by concept of
temperature coefficient (Osterwald et al., 1987). Actually, the temperature coefficient of ISC,
VOC and PM that denoted with a symbol α, β, and γ, respectively, are obtained from complex
expressions that need many physical parameters to be known. Many studies have been
performed to obtain the theoretical values of the α, β, and γ (Cuce et al., 2013; Dupré et al.,
2015b; Jiang et al., 2012; Perraki and Kounavis, 2016; Singh and Ravindra, 2012). However,
previous studies reveal that these temperature coefficients nearly take constant values under
various operating conditions where PV modules are deployed outdoor (Dupré et al., 2015a;
Makrides et al., 2009; Osterwald, 1986; Osterwald et al., 1987; Perraki, 2013).
Usually, PV module manufacturers supply the temperature coefficients which are evaluated
at laboratory under particular constant conditions (1000 W/m2 and AM1.5); namely called as
indoor temperature coefficients (αIN, βIN, γIN). On the other hand, most of small-scale PV module
manufacturers are not able to evaluate these temperature coefficients (TCs) due to high cost
equipments (Paulescu et al., 2014). Thus to overcome this matter, the outdoor measurement
procedure must be performed to obtain these necessarily temperature coefficients which are
namely called as outdoor TCs (αOUT, βOUT, and γOUT).
Still there is a dilemma about which type of temperature coefficients; the indoor or outdoor,
are more accurate to simulate/calculate the actual performance of PV modules(Dubey et al.,
2015). In traditional way, the indoor and outdoor TCs are compared directly with each other as
taking into account the indoor TCs as true one (Dupré et al., 2015b). Indoor and outdoor TCs
obtained at two different locations were compared for several commercially available PV
modules in study reported elsewhere in (Makrides et al., 2009). The different types of outdoor
temperature coefficients were evaluated and compared with each other in studies reported
elsewhere in (Fanney et al., 2006; Granata et al., 2011). However, there is not certain judgment
in literature that indoor TCs are absolutely true or accurate. The more accurate TCs are, the
more accurate actual electrical parameters to be calculated and consequently the more accurate
produced energy to be simulated (Dupré et al., 2015b; Mihaylov et al., 2016). Thus, precise
simulation of the energy produced by PV modules or arrays depends on introducing the
accurate temperature coefficients which in turn allows to predict sensible payback time of PV
arrays formed by PV modules (Nassar-eddine et al., 2016; Şentürk and Eke, 2015).
Uludağ University Journal of The Faculty of Engineering, Vol. 23, No. 1, 2018
129
In this study, a new method is presented to compare the indoor and outdoor TCs. The actual
performance of PV module and array is simulated both for the indoor and outdoor TCs. Then
simulated performances are compared with actual (measured) ones to clarify which TCs (indoor
or outdoor) are more accurate in simulating the PV performance. The indoor TCs are taken from
a PV module datasheet whereas the outdoor TCs are evaluated by means of shading procedure
at field.
2. METHODOLOGY
2.1. Actual Performance of PV Module
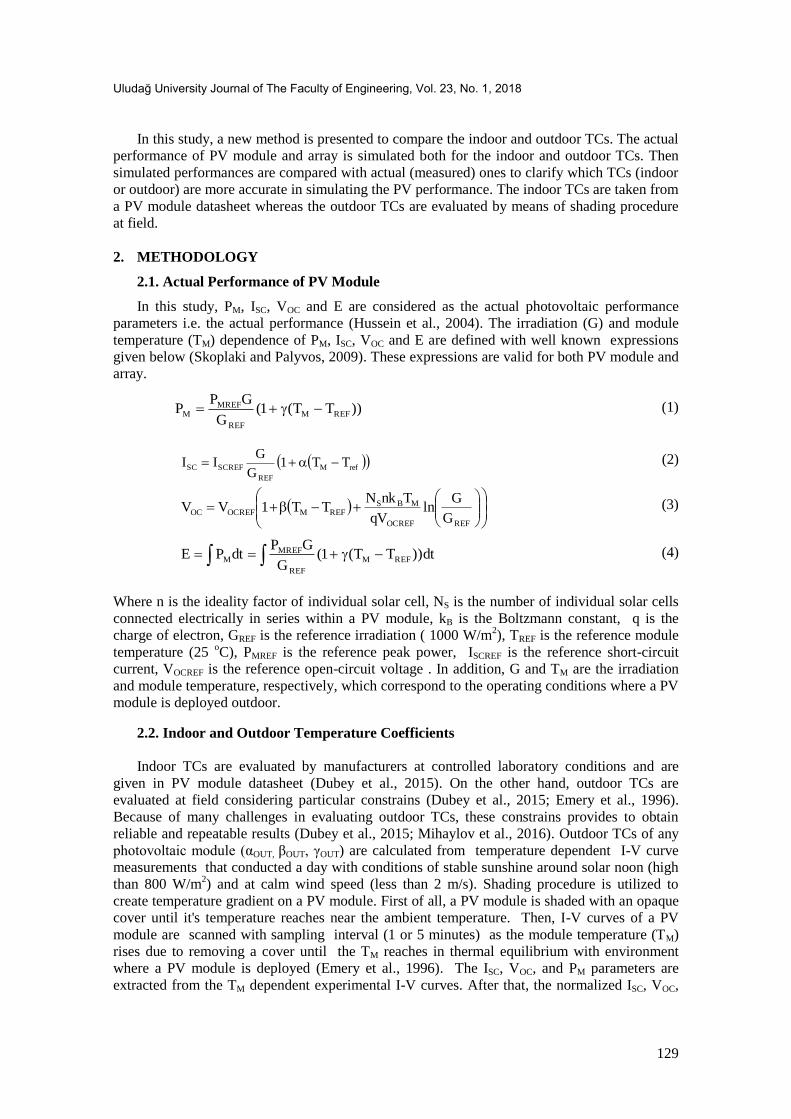
In this study, PM, ISC, VOC and E are considered as the actual photovoltaic performance
parameters i.e. the actual performance (Hussein et al., 2004). The irradiation (G) and module
temperature (TM) dependence of PM, ISC, VOC and E are defined with well known expressions
given below (Skoplaki and Palyvos, 2009). These expressions are valid for both PV module and
array.
)) TT(1(G
GPP REFM
REF
MREFM (1)
TT1G
GII refM
REF
SCREFSC (2)
G
Gln
qV
TnkNTT1VV
REFOCREF
MBSREFMOCREFOC
(3)
dt)) TT(1(G
GPdtPE REFM
REF
MREFM
(4)
Where n is the ideality factor of individual solar cell, NS is the number of individual solar cells
connected electrically in series within a PV module, kB is the Boltzmann constant, q is the
charge of electron, GREF is the reference irradiation ( 1000 W/m2), TREF is the reference module
temperature (25 oC), PMREF is the reference peak power, ISCREF is the reference short-circuit
current, VOCREF is the reference open-circuit voltage . In addition, G and TM are the irradiation
and module temperature, respectively, which correspond to the operating conditions where a PV
module is deployed outdoor.
2.2. Indoor and Outdoor Temperature Coefficients
Indoor TCs are evaluated by manufacturers at controlled laboratory conditions and are
given in PV module datasheet (Dubey et al., 2015). On the other hand, outdoor TCs are
evaluated at field considering particular constrains (Dubey et al., 2015; Emery et al., 1996).
Because of many challenges in evaluating outdoor TCs, these constrains provides to obtain
reliable and repeatable results (Dubey et al., 2015; Mihaylov et al., 2016). Outdoor TCs of any
photovoltaic module (αOUT, βOUT, γOUT) are calculated from temperature dependent I-V curve
measurements that conducted a day with conditions of stable sunshine around solar noon (high
than 800 W/m2) and at calm wind speed (less than 2 m/s). Shading procedure is utilized to
create temperature gradient on a PV module. First of all, a PV module is shaded with an opaque
cover until it's temperature reaches near the ambient temperature. Then, I-V curves of a PV
module are scanned with sampling interval (1 or 5 minutes) as the module temperature (TM)
rises due to removing a cover until the TM reaches in thermal equilibrium with environment
where a PV module is deployed (Emery et al., 1996). The ISC, VOC, and PM parameters are
extracted from the TM dependent experimental I-V curves. After that, the normalized ISC, VOC,
A.Şentürk,R.Eke: New Method to Cmp. Indoor and Outdoor Temp. Coefficients of Photovoltaic Modules
130
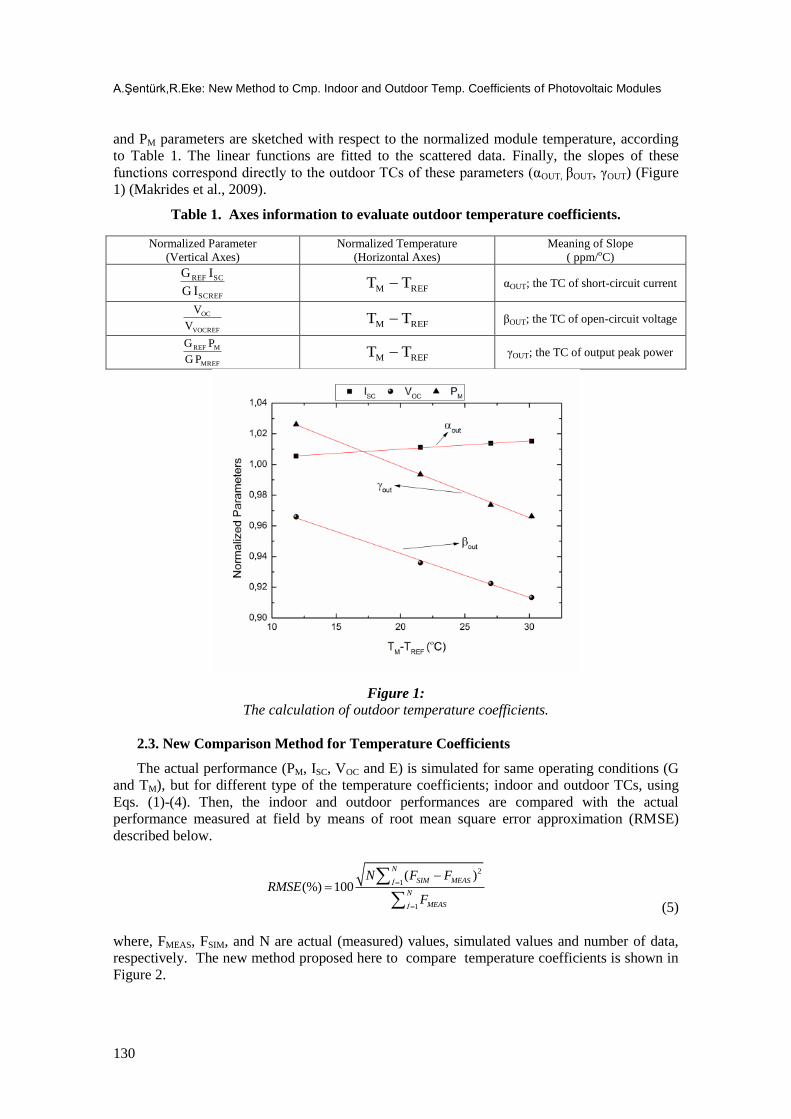
and PM parameters are sketched with respect to the normalized module temperature, according
to Table 1. The linear functions are fitted to the scattered data. Finally, the slopes of these
functions correspond directly to the outdoor TCs of these parameters (αOUT, βOUT, γOUT) (Figure
1) (Makrides et al., 2009).
Table 1. Axes information to evaluate outdoor temperature coefficients.
Normalized Parameter
(Vertical Axes)
Normalized Temperature
(Horizontal Axes)
Meaning of Slope
( ppm/oC)
SCREF
SCREF
I G
I G REFM TT αOUT; the TC of short-circuit current
VOCREF
OC
V
V REFM TT βOUT; the TC of open-circuit voltage
MREF
MREF
P G
P G REFM TT γOUT; the TC of output peak power
Figure 1: The calculation of outdoor temperature coefficients.
2.3. New Comparison Method for Temperature Coefficients
The actual performance (PM, ISC, VOC and E) is simulated for same operating conditions (G
and TM), but for different type of the temperature coefficients; indoor and outdoor TCs, using
Eqs. (1)-(4). Then, the indoor and outdoor performances are compared with the actual
performance measured at field by means of root mean square error approximation (RMSE)
described below.
2
1
1
( )(%) 100
N
SIM MEASİ
N
MEASİ
N F FRMSE
F
(5)
where, FMEAS, FSIM, and N are actual (measured) values, simulated values and number of data,
respectively. The new method proposed here to compare temperature coefficients is shown in
Figure 2.

Uludağ University Journal of The Faculty of Engineering, Vol. 23, No. 1, 2018
131
Figure 2:
The new method to compare the indoor and outdoor temperature coefficients.
The indoor performance and outdoor performance indicate which type of temperature
coefficients; indoor or outdoor, respectively, are used to simulate the actual performance.
3. MATERIAL
Since the main actor of PV market is crystalline silicon (Si) based PV modules, the back
contact single crystalline Si PV module was selected as device under test (DUT). Current -
voltage (I-V) curves of the DUT were traced using a multi-channel measurement system. Kipp-
Zonnen CM11 model type pyranometer was used to sense the irradiation (G) that exerted on the
DUT. The temperature of DUT (TM) was sensed via pasting four probes thin film Pt-100
temperature sensor on the back surface of DUT with thermal conducting paste and the
temperature sensor was covered with insulating tape. Datasheet values of the DUT are listed in
Table 2. In this study, the ideality factor of DUT is considered as 1.2 which is valid for a single
crystalline silicon based PV modules (Bellia et al., 2014). It is note to remember that, the
temperature coefficient that supplied in PV module datasheet are called as indoor ones (αIN, βIN,
and γIN).
Table 2. Datasheet parameters of DUT.
Parameter Value
NS 32
PMREF (W) 100.0
ISCREF (A) 6.0
VOCREF (V) 21.6
αIN (ppm/°C) 600
βIN (ppm/°C) -2800
γIN (ppm°/C) -3800
4. RESULTS AND DISCUSSION
Averaged outdoor TCs of the DUT were calculated from numerous I-V measurements
during annual period of 2014. In this study, these TCs are called as outdoor ones. The
A.Şentürk,R.Eke: New Method to Cmp. Indoor and Outdoor Temp. Coefficients of Photovoltaic Modules
132
calculation procedure of outdoor TCs is well described in Section 2.2. The indoor and outdoor
TCs are given in Table 3.
Table 3. Indoor (αIN, βIN, γIN) and outdoor (αOUT, βOUT, γOUT) temperature coefficients of
DUT.
Temperature Coefficient Value (ppm/oC)
γIN -3800
αIN 600
βIN -2800
γOUT -3690
αOUT 585
βOUT -2690
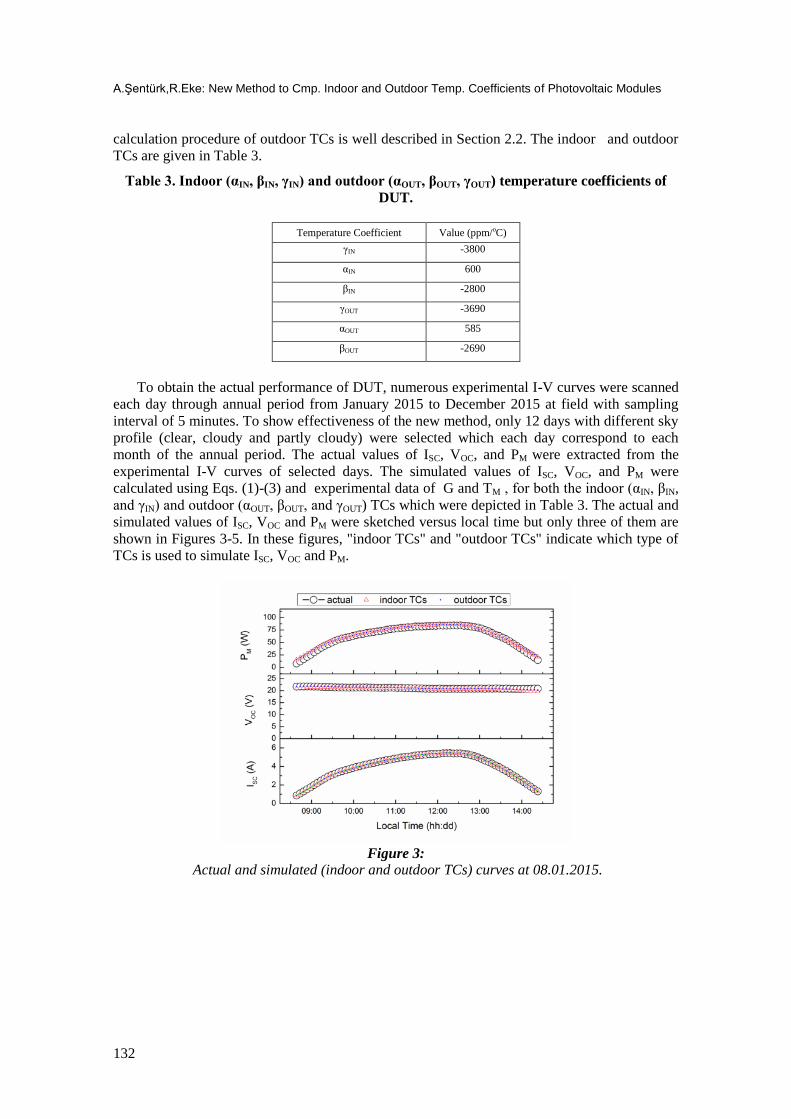
To obtain the actual performance of DUT, numerous experimental I-V curves were scanned
each day through annual period from January 2015 to December 2015 at field with sampling
interval of 5 minutes. To show effectiveness of the new method, only 12 days with different sky
profile (clear, cloudy and partly cloudy) were selected which each day correspond to each
month of the annual period. The actual values of ISC, VOC, and PM were extracted from the
experimental I-V curves of selected days. The simulated values of ISC, VOC, and PM were
calculated using Eqs. (1)-(3) and experimental data of G and TM , for both the indoor (αIN, βIN,
and γIN) and outdoor (αOUT, βOUT, and γOUT) TCs which were depicted in Table 3. The actual and
simulated values of ISC, VOC and PM were sketched versus local time but only three of them are
shown in Figures 3-5. In these figures, "indoor TCs" and "outdoor TCs" indicate which type of
TCs is used to simulate ISC, VOC and PM.
Figure 3:
Actual and simulated (indoor and outdoor TCs) curves at 08.01.2015.

Uludağ University Journal of The Faculty of Engineering, Vol. 23, No. 1, 2018
133
Figure 4:
Actual and simulated (indoor and outdoor TCs) curves at 06.09.2015.
Figure 5:
Actual and simulated (indoor and outdoor TCs) curves at 15.10.2015.
For all the 12 days, simulated (indoor TCs and outdoor TCs) curves match well with actual
ones. The RMSE values of simulated parameters were calculated and shown in Table 4.
Table 4. Error values of simulated ISC, VOC and PM for indoor and outdoor TCs.
Measurement Date
RMSE of ISC (%) RMSE of VOC (%) RMSE of PM (%)
Indoor TCs
Outdoor TCs
|Diff.| (%)
Indoor TCs
Outdoor TCs
|Diff.| (%)
Indoor TCs
Outdoor TCs
|Diff.| (%)
08.01.2015 0.6 0.6 0.0 1.7 1.6 0.1 4.6 4.6 0.0
07.02.2015 0.6 0.6 0.0 0.5 0.6 0.1 7.3 7.3 0.0
26.03.2015 1.5 1.5 0.0 0.8 0.9 0.1 3.0 3.2 0.2
14.04.2015 1.7 1.7 0.0 0.6 0.6 0.0 1.3 1.5 0.2
29.05.2015 2.0 2.0 0.0 0.6 0.6 0.0 4.9 5.0 0.1
27.06.2015 1.9 1.9 0.0 0.7 0.7 0.0 2.7 2.9 0.2
26.07.2015 2.1 2.1 0.0 0.5 0.6 0.1 2.9 3.2 0.3
A.Şentürk,R.Eke: New Method to Cmp. Indoor and Outdoor Temp. Coefficients of Photovoltaic Modules
134
07.08.2015 2.8 2.8 0.0 0.5 0.5 0.0 2.9 3.3 0.4
06.09.2015 1.6 1.6 0.0 0.6 0.6 0.0 1.6 1.7 0.1
15.10.2015 0.4 0.4 0.0 0.5 0.5 0.0 5.4 5.4 0.0
17.11.2015 1.7 1.7 0.0 0.7 0.7 0.0 2.0 2.0 0.0
02.12.2015 1.1 1.2 0.1 0.7 0.7 0.0 2.4 2.4 0.0
The actual (EACT), indoor TCs (EINDOOR) and outdoor TCs (EOUTDOOR) energy values were
calculated from actual PM-local time curves, indoor TCs PM-local time curves and outdoor TCs
PM-local time curves, respectively, according to the Eq.(4). The calculated energy values (EACT,
EINDOOR, EOUTDOOR) and corresponding error values are shown in Table 5.
Table 5. Measured, simulated and error values of produced energy for indoor and outdoor
TCs.
Measurement
Date
EACT
(Wh)
EINDOOR
(Wh)
EOUTDOOR
(Wh)
RMSE of EINDOOR
(%)
RMSE of EOUTDOOR
(%)
|Diff.|
(%)
08.01.2015 353.9 365.6 365.8 3.3 3.4 0.1
07.02.2015 211.8 224.3 224.3 5.9 5.9 0.0
26.03.2015 459.8 469.1 469.8 2.0 2.2 0.1
14.04.2015 678.7 686.8 688.5 1.2 1.4 0.3
29.05.2015 240.1 251.1 251.4 4.6 4.7 0.1
27.06.2015 472.9 484.5 485.7 2.5 2.7 0.3
26.07.2015 563.2 578.4 580.3 2.7 3.0 0.3
07.08.2015 401.7 413.5 415.1 2.9 3.3 0.4
06.09.2015 483.4 489.8 490.9 1.3 1.6 0.2
15.10.2015 158.8 166.8 166.8 5.0 5.0 0.0
17.11.2015 414.4 421.6 422.7 1.7 2.0 0.3
02.12.2015 394.8 407.3 408.2 3.2 3.4 0.2
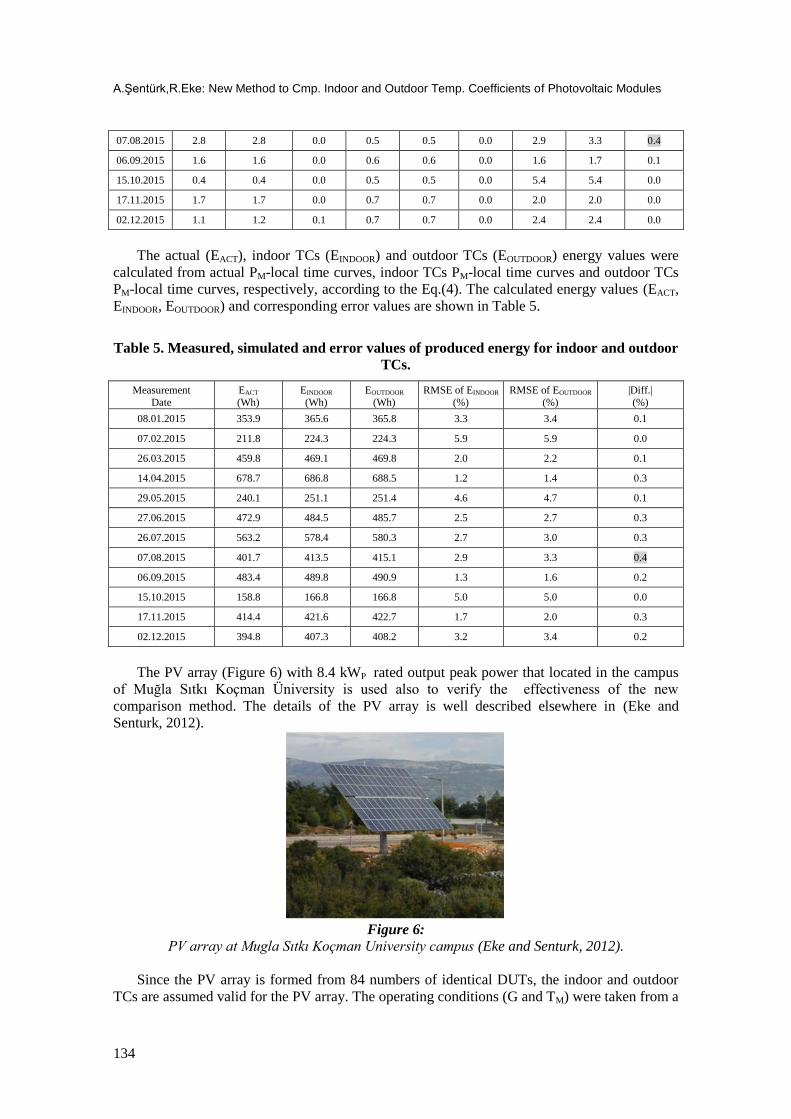
The PV array (Figure 6) with 8.4 kWP rated output peak power that located in the campus
of Muğla Sıtkı Koçman Üniversity is used also to verify the effectiveness of the new
comparison method. The details of the PV array is well described elsewhere in (Eke and
Senturk, 2012).
Figure 6:
PV array at Mugla Sıtkı Koçman University campus (Eke and Senturk, 2012).
Since the PV array is formed from 84 numbers of identical DUTs, the indoor and outdoor
TCs are assumed valid for the PV array. The operating conditions (G and TM) were taken from a

Uludağ University Journal of The Faculty of Engineering, Vol. 23, No. 1, 2018
135
data-logger that integrated into the PV array (Eke and Senturk, 2012). One day was selected to
test the new method. Since data-logger does not store actual values of ISC and VOC of the PV
array, only the PM and E values were simulated for both the indoor and outdoor TCs using
Eq.(1) and Eq.(4), respectively, and corresponding operating conditions (G and TM). The
simulated (indoor and outdoor TCs) and actual values of PM were sketched versus local time and
shown in Figure 7.
Figure 7:
Actual, simulated and error values of PV array.
The error value of output peak power of the PV array, shown in Figure 7,was 4.7% for both
the indoor and outdoor TCs. The actual and simulated energy values of the PV array denoted
with EACTUAL, EINDOOR and EOUTDOOR were calculated 41943 Wh, 43168 Wh, and 43170 Wh,
respectively. The error values of EINDOOR and EOUTDOOR were calculated which is 2.9% for both.
The actual and simulated produced energy values and corresponding error values are shown
inset Figure 7.
To see difference of the indoor and outdoor TCs clearly on simulating the actual
performance, the absolute differences (|Diff.| were calculated between the error values of the
indoor TCs and outdoor TCs. The RMSE and absolute difference values, shown in Table 4,
Table 5 and Figure 7, indicate that there is not significant discrepancy between the indoor and
outdoor TCs as simulating the actual performance of PV module and PV array at field. In some
measurements, discrepancies were observed for absolute differences (|Diff.| of simulated
parameters (see Table 4 and Table 5). These discrepancies could be attributed with the outdoor
TCs evaluation procedure where operating conditions are not exactly invariant as the indoor
procedure. Since the maximum absolute difference is 0.4% (marked with grey in Table 4 and
Table 5), these discrepancies are trivial.
5. CONCLUSION
In this study, a new method is presented to compare the indoor and outdoor temperature
coefficients. Different from the conventional comparison method, the novelty of new method is
to use the actual performance (ISC, VOC, PM and E) as decisive index to compare the indoor and
outdoor TCs. The new method is validated for the back contact mono-crystalline Si PV module
and PV array at field. It is concluded that both indoor and outdoor TCs could simulate the actual
performance of PV module and PV array almost with same accuracy. Thus despite they have
been evaluated at fixed laboratory conditions, the indoor temperature coefficients are quite
enough to simulate the actual photovoltaic performance at field. Since manufacturers of PV

A.Şentürk,R.Eke: New Method to Cmp. Indoor and Outdoor Temp. Coefficients of Photovoltaic Modules
136
modules always provide these temperature coefficients in PV module datasheet, it is not
necessary to obtain and utilize the outdoor TCs as simulating the actual performance of PV
module or PV array. Because obtaining outdoor temperature coefficients is cumbersome process
where all external parameters vary with respect to time.
ACKNOWLEDGEMENTS
This work was supported by Mugla Sıtkı Kocman University Scientific Research Project (BAP)
with the codes 15/254 and 13/181.
REFERENCES
1. Bellia, H., Youcef, R. ve Fatima, M. (2014) A detailed modeling of photovoltaic module
using MATLAB, NRIAG Journal of Astronomy and Geophysics, 3, 53–61.
doi:10.1016/j.nrjag.2014.04.001
2. Chenni, R., Makhlouf, M., Kerbache, T. ve Bouzid, A. (2007) A detailed modeling method
for photovoltaic cells, Energy, 32, 1724–1730. doi:10.1016/j.energy.2006.12.006
3. Ciulla, G., Lo Brano, V., Di Dio, V. ve Cipriani, G. (2014) A comparison of different one-
diode models for the representation of I–V characteristic of a PV cell, Renewable and
Sustainable Energy Reviews, 32, 684–696. doi:10.1016/j.rser.2014.01.027
4. Cuce, E., Cuce, P.M. ve Bali, T. (2013) An experimental analysis of illumination intensity
and temperature dependency of photovoltaic cell parameters, Appied Energy, 111, 374–382.
doi:10.1016/j.apenergy.2013.05.025
5. Dubey, R., Batra, P., Chattopadhyay, S., Kottantharayil, A., Arora, B.M., Narasimhan, K.L.
ve Vasi, J. (2015) Measurement of Temperature Coefficient of Photovoltaic Modules in
Field and comparison with Laboratory Measurements, doi:10.1109/PVSC.2015.7355852
6. Dupré, O., Vaillon, R. ve Green, M.A. (2015a) Physics of the temperature coefficients of
solarcells, Solar Energy Materials and Solar Cells, 140, 92–100.
doi:10.1016/j.solmat.2015.03.025
7. Dupré, O., Vaillon, R., Green, M.A., Dupr, O., Vaillon, R. ve Green, M.A. (2015b)
Experimental assessment of temperature coefficient theories for silicon solar cells, IEEE
Journal of Photovoltaics, 1–5. doi:10.1109/JPHOTOV.2015.2489864
8. Eke, R. ve Senturk, A. (2012) Performance comparison of a double-axis sun tracking versus
fixed PV system, Solar Energy, 86, 2665–2672. doi:10.1016/j.solener.2012.06.006
9. Emery, K., Burdick, J., Caiyem, Y., Dunlavy, D., Field, H., Kroposki, B., Moriarty, T.,
Ottoson, L., Rummel, S., Strand, T. ve Wanlass, M.W. (1996) Temperature dependence of
photovoltaic cells, modules and systems, Twenty Fifth IEEE Photovoltaic Specialist
Conference, doi:10.1109/PVSC.1996.564365
10. Fanney, A.H., Davis, M.W., Dougherty, B.P., King, D.L., Boyson, W.E. ve Kratochvil, J.
A. (2006) Comparison of Photovoltaic Module Performance Measurements, Journal of
Solar Energy Engineering, 128, 152. doi:10.1115/1.2192559
11. Granata, J.E., Boyson, W.E., Kratochvil, J.A., Li, B., Abbaraju, V., Tamizhmani, G. ve
Pratt, L. (2011) Successful Transfer Of Sandia National Laboratories Outdoor Test
Technology To Tüv Rheinland Photovoltiıc Testing Laboratory, Photovoltaic Specialists
Conference (PVSC) 37th IEEE, 003132–003137
12. Huld, T. ve Gracia Amillo, A.M. (2015) Estimating PV module performance over large
geographical regions: The role of irradiance, air temperature, wind speed and solar
spectrum, Energies, 8, 5159–5181. doi:10.3390/en8065159
Uludağ University Journal of The Faculty of Engineering, Vol. 23, No. 1, 2018
137
13. Humada, A.M., Hojabri, M., Mekhilef, S. ve Hamada, H.M. (2016) Solar cell parameters
extraction based on single and double-diode models: A review, Renewable and Sustainable
Energy Reviews, 56, 494–509. doi:10.1016/j.rser.2015.11.051
14. Hussein, H.M.S., Ahmad, G.E. ve El-Ghetany, H.H., (2004) Performance evaluation of
photovoltaic modules at different tilt angles and orientations, Energy Conversion and
Management, 45, 2441–2452. doi:10.1016/j.enconman.2003.11.013
15. Ismail, M.S., Moghavvemi, M. ve Mahlia, T.M.I. (2013) Characterization of PV panel and
global optimization of its model parameters using genetic algorithm, Energy Conversion
and Management, 73, 10–25. doi:10.1016/j.enconman.2013.03.033
16. Jack, V., Salam, Z. ve Ishaque, K. (2015) Cell modelling and model parameters estimation
techniques for photovoltaic simulator application: A review, Applied Energy, 154, 500–519.
doi:10.1016/j.apenergy.2015.05.035
17. Jiang, J.-A., Wang, J.-C., Kuo, K.-C., Su, Y.-L., Shieh, J.-C. ve Chou, J.J. (2012) Analysis
of the junction temperature and thermal characteristics of photovoltaic modules under
various operation conditions, Energy, 44, 292–301. doi:10.1016/j.energy.2012.06.029
18. Makrides, G., Zinsser, B., Georghiou, G.E., Schubert, M. ve Werner, J.H. (2009)
Temperature behaviour of different photovoltaic systems installed in Cyprus and Germany,
Solar Energy Materials and Solar Cells, 93, 1095–1099. doi:10.1016/j.solmat.2008.12.024
19. Mihaylov, B., Betts, T.R., Pozza, A., Mullejans, H. ve Gottschalg, R. (2016) Uncertainty
Estimation of Temperature Coefficient Measurements of PV Modules, IEEE Journal of
Photovoltaics, 6, 1–10. doi:10.1109/JPHOTOV.2016.2598259
20. Nassar-eddine, I., Obbadi, A., Errami, Y., El Fajri, A. ve Agunaou, M. (2016) Parameter
estimation of photovoltaic modules using iterative method and the Lambert W function: A
comparative study. Energy Conversion and Management, 119, 37–48.
doi:10.1016/j.enconman.2016.04.030
21. Osterwald, C.R. (1986) Translation of device performance measurements to reference
conditions, Solar Energy Materials and Solar Cells, 18, 269–279. doi:10.1016/0379-
6787(86)90126-2
22. Osterwald, C.R., Glatfelter, T. ve Burdick, J. (1987) Comparison of the Temperature
Coefficients of the Basic I-V parameters for Various Types of Solar Cell Devices, Energy
Conversion, 188–193.
23. Paulescu, M., Badescu, V. ve Dughir, C. (2014) New procedure and field-tests to assess
photovoltaic module performance, Energy, 70, 49–57. doi:10.1016/j.energy.2014.03.085
24. Perraki, V. (2013) Temperature Dependence on the Photovoltaic Properties of Selected
Thin-Film Modules, International Journal of Renewable and Sustainable Energy, 2, 140.
doi:10.11648/j.ijrse.20130204.12
25. Perraki, V. ve Kounavis, P. (2016) Effect of temperature and radiation on the parameters of
photovoltaic modules, Journal of Renewable and Sustainable Energy, 8, 13102.
doi:10.1063/1.4939561
26. Rodrigues, S., Torabikalaki, R., Faria, F., Cafôfo, N., Chen, X., Ivaki, A.R., Mata-Lima, H.
ve Morgado-Dias, F. (2016) Economic feasibility analysis of small scale PV systems in
different countries, Solar Energy, 131, 81–95. doi:10.1016/j.solener.2016.02.019
27. Rus-Casas, C., Aguilar, J.D., Rodrigo, P., Almonacid, F. ve Pérez-Higueras, P.J. (2014)
Classification of methods for annual energy harvesting calculations of photovoltaic
generators, Energy Conversion and Management, 78, 527–
A.Şentürk,R.Eke: New Method to Cmp. Indoor and Outdoor Temp. Coefficients of Photovoltaic Modules
138
536. doi:10.1016/j.enconman.2013.11.006
28. Singh, P. ve Ravindra, N.M. (2012) Temperature dependence of solar cell performance-an
analysis, Solar Energy Materials and Solar Cells, 101, 36–45.
doi:10.1016/j.solmat.2012.02.019
29. Skoplaki, E. ve Palyvos, J.A. (2009) On the temperature dependence of photovoltaic
module electrical performance: A review of efficiency/power correlations. Sol. Energy 83,
614–624. doi:10.1016/j.solener.2008.10.008
30. Şentürk, A. ve Eke, R. (2015) Predicting the energy yield of a photovoltaic system from an
individual photovoltaic module, Physica Status Solidi C, 3, 1280–1282.
doi:10.1002/pssc.201510087
31. Tian, H., Mancilla-David, F., Ellis, K., Muljadi, E. ve Jenkins, P. (2012) A cell-to-module-
to-array detailed model for photovoltaic panels, Solar Energy, 86, 2695–2706.
doi:10.1016/j.solener.2012.06.004
32. Tossa, A.K., Soro, Y.M., Azoumah, Y. ve Yamegueu, D. (2014) A new approach to
estimate the performance and energy productivity of photovoltaic modules in real operating
conditions, Solar Energy, 110, 543–560. doi:10.1016/j.solener.2014.09.043