new marriages, new families: u.s. racial and hispanic intermarriage
TRANSCRIPT

C E L E B R A T I N G 7 5 Y E A R S • 1 9 2 9 - 2 0 0 4
Vol. 60, No. 2 A publication of the Population Reference Bureau
BULLETINPopulation June 2005
New Marriages, New Families: U.S.Racial and Hispanic Intermarriage
by Sharon M. Lee and Barry Edmonston
Racial and Hispanic intermarriage is becoming more common in U.S. society.
Asian and Hispanic population growth contributes to intermarriage.
Intermarriage is changing how Americans think aboutrace and ethnicity.

Population Reference Bureau (PRB)Founded in 1929, the Population Reference Bureau is the leader in providing timely andobjective information on U.S. and international population trends and their implications.PRB informs policymakers, educators, the media, and concerned citizens working in the public interest around the world through a broad range of activities, including publications,information services, seminars and workshops, and technical support. Our efforts are sup-ported by government contracts, foundation grants, individual and corporate contributions,and the sale of publications. PRB is governed by a Board of Trustees representing diversecommunity and professional interests.
OfficersDouglas Richardson, Chair of the Board,
Executive Director, Association of American Geographers, Washington, D.C.Terry D. Peigh, Vice Chair of the Board
Executive Vice President and Director of Corporate Operations, Foote, Cone & Belding, Chicago, IllinoisWilliam P. Butz, President and Chief Executive Officer,
Population Reference Bureau, Washington, D.C.Michael P. Bentzen, Secretary of the Board,
Partner, Hughes and Bentzen, PLLC, Washington, D.C.Richard F. Hokenson, Treasurer of the Board,
Director, Hokenson and Company, Lawrenceville, New Jersey
TrusteesPatty Perkins Andringa, Consultant and Facilitator, Bethesda, MarylandJoel E. Cohen, Abby Rockefeller Mauzé Professor of Populations, Rockefeller University and Head,
Laboratory of Populations, Rockefeller and Columbia Universities, New YorkBert T. Edwards, Executive Director, Office of Historical Trust Accounting, Office of the Secretary,
U.S. Department of the Interior, Washington, D.C.Wray Herbert, Assistant Managing Editor, U.S. News & World Report, Washington, D.C.James H. Johnson Jr., William Rand Kenan Jr. Distinguished Professor and Director,
Urban Investment Strategies Center, University of North Carolina, Chapel HillWolfgang Lutz, Leader, World Population Project, International Institute for Applied Systems Analysis
and Director, Vienna Institute of Demography of the Austrian Academy of Sciences, Vienna, Austria. Elizabeth Maguire, President and Chief Executive Officer, Ipas, Chapel Hill, North CarolinaFaith Mitchell, Deputy Director, Division of Behavioral and Social Sciences and Education,
National Research Council/National Academy of Sciences, Washington D.C.Gary B. Schermerhorn, Managing Director of Technology, Goldman, Sachs & Company, New YorkBarbara Boyle Torrey, Independent Writer and Consultant, Washington, D.C.Leela Visaria, Professor, Gujarat Institute of Development Research, Ahmedabad, IndiaMontague Yudelman, Senior Fellow, World Wildlife Fund, Washington, D.C.
Editor: Mary Mederios KentProduction/Design: Jon Howard
The Population Bulletin is published four times a year and distributed to members of the Population Reference Bureau. Population Bulletins are also available for $7 (discounts for bulkorders). To become a Friend of PRB or to order PRB materials, contact PRB, 1875 ConnecticutAve., NW, Suite 520, Washington, DC 20009-5728; Tel.: 800-877-9881; Fax: 202-328-3937; E-mail: [email protected]; Website: www.prb.org.
The suggested citation, if you quote from this publication, is: Sharon M. Lee and BarryEdmonston, “New Marriages, New Families: U.S. Racial and Hispanic Intermarriage,” PopulationBulletin 60, no. 2 (Washington, DC: Population Reference Bureau, 2005). For permission to repro-duce portions from the Population Bulletin, write to PRB, Attn: Permissions, [email protected].
© 2005 by the Population Reference BureauISSN 0032-468X
Printed on recycled paper

1
Vol. 60, No. 2 A publication of the Population Reference Bureau
BULLETINPopulation June 2005
New Marriages, New Families: U.S.Racial and Hispanic Intermarriage
Introduction . . . . . . . . . . . . . . . . . . . . . . . . . . . . . . . . . . . . . . . . . . . . . . . . . . . 3
Significance of Intermarriage . . . . . . . . . . . . . . . . . . . . . . . . . . . . . . . . . . . 4Box 1. Antimiscegenation Laws . . . . . . . . . . . . . . . . . . . . . . . . . . . . . . . . . . . 5Box 2. Data on Intermarriage . . . . . . . . . . . . . . . . . . . . . . . . . . . . . . . . . . . . 6Box 3. Race, Ethnicity, and the U.S. Census . . . . . . . . . . . . . . . . . . . . . . . . . 8
U.S. Population Grows, Diversifies . . . . . . . . . . . . . . . . . . . . . . . . . . . . . . 9Table 1. U.S. Population by Major Racial Groups and Hispanic
Origin, 1950 to 2000 . . . . . . . . . . . . . . . . . . . . . . . . . . . . . . . . . . . . . . . . 10
Defining Intermarriage . . . . . . . . . . . . . . . . . . . . . . . . . . . . . . . . . . . . . . . . 11
Interracial Marriage Trends . . . . . . . . . . . . . . . . . . . . . . . . . . . . . . . . . . . . 11Figure 1. U.S. Interracial Couples in Millions and as Percent of
All Married Couples, 1970 to 2000 . . . . . . . . . . . . . . . . . . . . . . . . . . . . . 11Table 2. U.S. Interracial Marriage Rates by Race and Gender,
1970 to 2000 . . . . . . . . . . . . . . . . . . . . . . . . . . . . . . . . . . . . . . . . . . . . . . 12
Interracial Couples . . . . . . . . . . . . . . . . . . . . . . . . . . . . . . . . . . . . . . . . . . . 13Figure 2. Main Interracial Couple Types As Percent of All
Interracial Couples, 1970 to 2000 . . . . . . . . . . . . . . . . . . . . . . . . . . . . . . 13Table 3. Most Common Types of Interracial U.S. Couples by
Race of Husband and Wife, 1970 to 2000 . . . . . . . . . . . . . . . . . . . . . . . . 15
Sociodemographic Characteristics . . . . . . . . . . . . . . . . . . . . . . . . . . . . . 14Figure 3. Percent Interracially Married by Age for U.S. Whites,
Blacks, and Asians, 2000 . . . . . . . . . . . . . . . . . . . . . . . . . . . . . . . . . . . . . 16Figure 4. Percent of Married Blacks and Asians in Interracial
Marriages by Education, 2000 . . . . . . . . . . . . . . . . . . . . . . . . . . . . . . . . . 16Figure 5. Percent of Husbands and Wives Interracially Married
by Nativity and Citizenship, for Blacks and Asians, 2000 . . . . . . . . . . . . 17Figure 6. Number and Percent of Interracial Couples
by Region, 2000 . . . . . . . . . . . . . . . . . . . . . . . . . . . . . . . . . . . . . . . . . . . . 18Figure 7. Percent of Married Couples Who Are Interracial
by State, 2000 . . . . . . . . . . . . . . . . . . . . . . . . . . . . . . . . . . . . . . . . . . . . . . 18Box 4. Some Other Race (SOR) and Multiple-Race
(MR) People: Who Are They? . . . . . . . . . . . . . . . . . . . . . . . . . . . . . . . . . 19
Continued on page 2

2 Population Bulletin Vol. 60, No. 2 2005 www.prb.org
About the Authors
Sharon M. Lee is professor of sociology and director of the Center for Health & SocialInequality Research, Department of Sociology, Portland State University. Her research interestsinclude race and ethnicity; intermarriage; immigration; and cultural diversity, health, andhealthcare disparities. She represents the Population Association of America on the CensusAdvisory Committee of Professional Associations, has held elected and appointed offices in theAmerican Sociological Association, is a current or past member of advisory panels for healthand immigration studies, and was a 2004 Canada-U.S. Fulbright Scholar at the University ofToronto.
Barry Edmonston is professor in the School of Urban Studies and Planning and director ofthe Population Research Center, Portland State University. He has published widely on immi-gration, internal migration, and population distribution. He recently co-authored the chapteron international migration in Jacob S. Siegel and David A. Swanson, eds., The Methods andMaterials of Demography, 2d ed. (2004). He was previously at the Urban Institute where heco-edited Immigration and Ethnicity (1994) with Jeffrey S. Passel, and the NationalAcademy of Sciences, where he co-edited The New Americans (1997) with James P. Smith.
The authors would like to thank Richard Alba, Zhenchao Qian, and Sonya Tafoya whoreviewed an earlier draft of the manuscript, and Mary Mederios Kent for editorial suggestions.We wish to dedicate this Population Bulletin to the diverse interracial and interethnic familiesand individuals who are reshaping race and ethnicity in the United States.
© 2005 by the Population Reference Bureau
Children in Interracial Families . . . . . . . . . . . . . . . . . . . . . . . . . . . . . . . . . 20Figure 8. Children Age 18 and Younger Living in Interracial
Families, 1970 to 2000 . . . . . . . . . . . . . . . . . . . . . . . . . . . . . . . . . . . . . . . 21Table 4. Reported Race of Children Living in Interracial Families,
1970 to 2000 . . . . . . . . . . . . . . . . . . . . . . . . . . . . . . . . . . . . . . . . . . . . . . 22Table 5. Parental Characteristics and Family Income, 2000 . . . . . . . . . . . . . 23
Hispanic Intermarriage . . . . . . . . . . . . . . . . . . . . . . . . . . . . . . . . . . . . . . . . 24Figure 9. Inter-Hispanic U.S. Couples, 1970 to 2000 . . . . . . . . . . . . . . . . . . 25Table 6. Percent of Married Hispanics With a Non-Hispanic
Spouse, Selected Hispanic Groups, 1970 to 2000 . . . . . . . . . . . . . . . . . . 25Figure 10. Percent of Married Hispanics With a Non-Hispanic
Spouse, by Education, 2000 . . . . . . . . . . . . . . . . . . . . . . . . . . . . . . . . . . . 26Figure 11. Percent of Married Hispanics With a Non-Hispanic
Spouse, by Nativity and Citizenship, 2000 . . . . . . . . . . . . . . . . . . . . . . . . 26Figure 12. Percent of Married Couples Who Are Inter-Hispanic
by State, 2000 . . . . . . . . . . . . . . . . . . . . . . . . . . . . . . . . . . . . . . . . . . . . . . 27
Children in Inter-Hispanic Families . . . . . . . . . . . . . . . . . . . . . . . . . . . . . 27Figure 13. Children of Inter-Hispanic Parents Reported as Hispanic,
1970 to 2000 . . . . . . . . . . . . . . . . . . . . . . . . . . . . . . . . . . . . . . . . . . . . . . 28Table 7. Parental Characteristics and Family Income by Parents’
Ethnicity, 2000 . . . . . . . . . . . . . . . . . . . . . . . . . . . . . . . . . . . . . . . . . . . . . 28
Implications of Intermarriage . . . . . . . . . . . . . . . . . . . . . . . . . . . . . . . . . . 29
New Marriages, New Families . . . . . . . . . . . . . . . . . . . . . . . . . . . . . . . . . . 33
References . . . . . . . . . . . . . . . . . . . . . . . . . . . . . . . . . . . . . . . . . . . . . . . . . . . 33
Suggested Resources . . . . . . . . . . . . . . . . . . . . . . . . . . . . . . . . . . . . . . . . . 36

3Population Bulletin Vol. 60, No. 2 2005www.prb.org
Multiracial Americans havealways been a part of theU.S. population. In colonial
times, multiple-race children wereborn of unions between AmericanIndians, Europeans, and Africans.Early U.S. population censusesincluded multiple-race categoriessuch as mulatto and “mixed-blood”Indians. The 2000 Census alsoacknowledged interracial Americansby allowing U.S. residents to choosemore than one race, and about 7million people did so.
Social acceptance of multiple-raceAmericans and of marriages acrossracial boundaries has varied over thecountry’s history, but prejudice anddiscrimination have been constants.The last few decades, however, havewitnessed an apparent sea change inAmericans’ racial attitudes. Manyarticles on multiracial Americans,interracial couples, and multiracialfamilies appeared in the mass media,some generated by the new 2000Census option to choose more thanone race.1 New surveys of racial atti-tudes suggested dramatic improve-ments in American race relations.According to a Gallup poll conduct-ed at the end of 2003, 86 percent ofblack, 79 percent of Hispanic, and66 percent of white respondentswould accept a child or grandchildmarrying someone of a differentrace.2 The percentage of whites whofavored laws against marriagesbetween blacks and whites declinedfrom 35 percent in the 1970s to 10percent in the 2000s.3 And in anoth-er survey conducted in 2003, 77 per-cent of respondents agreed that it
was all right for blacks and whites todate each other.4
Interracial marriage has increasedacross most racial groups and,although they are still the exceptionto the norm, these interracial mar-riages are generating a growing popu-lation of multiracial Americans.5Marriage between Hispanics and non-Hispanics, already quite common, hasfurther contributed to changingracial and ethnic boundaries inAmerica. The shift to allow Americansto identify with more than one race inthe 2000 Census was both a reflectionof and response to these trends.
Of the 281 million people enumer-ated in the 2000 Census, more than2.4 percent, or 7 million people,reported more than one race.6 Severalobservers believe that these figures
New Marriages, New Families: U.S.Racial and Hispanic IntermarriageBy Sharon M. Lee and Barry Edmonston
Photo removed for copyright reasons.

4
underestimate the number ofAmericans who come from multiracialbackgrounds. Some people may not beaware of their multiracial back-grounds, while others choose to identi-fy with just one race even when theyare aware of their multiple origins.Many minority advocacy groupsadvised their members to report onlyone race (the minority race) in the2000 Census because these groupsfeared a loss of political clout if theirpopulation total was eroded by peoplechoosing more than one race.7
Parents were less hesitant to reporttheir children as multiracial, reflectingrecent increases in racial intermar-riages as well as the greater acceptanceof multiracial identities. In the 2000Census, 42 percent of persons whoreported more than one race wereunder age 18, compared with 25 per-cent of those reporting a single race.8
Significance ofIntermarriage People have a tendency to marry with-in their social group or to marrysomeone who is close to them insocial status. This tendency is termedhomogamy, and intermarriage runscounter to homogamy. Race is justone of many characteristics—includ-ing social class, ethnicity, religion—that affect the choice of a spouse; butrace has always been a major dividingline in America. In this PopulationBulletin, we focus on racial and ethnicintermarriage because such intermar-riage is a particularly significant indi-cator of the assimilation or integra-tion of racial and ethnic minorities.9
People often are identified withracial and ethnic groups that definetheir social status and restrict theiropportunities.10 Easily observed physi-cal characteristics such as skin colorand facial features become markers tocategorize individuals by race, whilecultural traits such as religion andlanguage often distinguish ethnicity.Social scientists generally agree thatraces and ethnic groups are social
constructions resulting from history,culture, politics, and other socialprocesses.11 However, once racial orethnic groups are formed, they oftenlead to racial or ethnic stratificationor inequality. In the United States, forexample, unequal rights and unequalaccess to society’s resources have longmarked the historical racial dividebetween whites and nonwhites.
Social norms governing marriageplay critical roles in preserving theracial or ethnic status quo in raciallyor ethnically stratified societies. Forexample, marriage between people ofthe same race (racial homogamy orendogamy) reflects and maintains rulesabout race and racial boundaries.When individuals marry someone ofthe same race, they guarantee racialsimilarities within families across gen-erations and the stability of racialgroups in society. Racial endogamy isespecially important when an individ-ual’s and group’s racial membershipdefines access to resources, power,and rewards. In the past, social normsagainst marriage between whites andnonwhites in the United States wereformalized into laws known asantimiscegenation laws (see Box 1).
In multiracial and multiethnic soci-eties such as the United States, theprevalence of and attitudes towardracial and ethnic intermarriagesreveal much about racial and ethnicrelations and integration. Children ofracially intermarried couples straddleracial boundaries and further chal-lenge the idea of clearly definedracial groups.12
This Population Bulletin coversthree aspects of intermarriage in theUnited States: racial intermarriage,interracial couples, and their chil-dren; Hispanic intermarriage, inter-Hispanic couples, and their children;and the implications of racial andHispanic intermarriage, family for-mation, and racial identification forfuture demographic and socialtrends.13 This report is based onanalyses of data from the 1970 to2000 censuses (see Box 2, page 6).The 1970 Census was the first censusconducted following the 1967 U.S.
Population Bulletin Vol. 60, No. 2 2005 www.prb.org
Interracialmarriage is anindicator ofracialassimilation.

5Population Bulletin Vol. 60, No. 2 2005www.prb.org
In the United States, states define laws governingmarriage. When a couple wants to marry, they applyfor a marriage license from the state in which theywish to marry and comply with that state’s rules, ifany, on minimum age, blood tests, waiting period,and other requirements. Today, marriages can befreely contracted between people of different racesin all states, but this was not always the case. Lawsbanning marriage between whites and other races—or antimiscegenation laws—were common through-out the United States from colonial times into the20th century.
The first antimiscegenation law was passed inMaryland in 1661. It prohibited marriage betweenblacks and whites. By the end of the 19th century,most states had similar antimiscegenation laws. In1880, California prohibited the issuance of licensesfor marriage between whites and negroes, mulattos,and Mongolians (a term that mainly applied toChinese at that time). A Missouri judge preventedwhite and black intermarriage in 1883, reasoningthat such marriages cannot lead to offspring, therebyjustifying the ban on such marriages. In 1909,California added Japanese to its list of races forbid-den from marrying whites, and in 1945, CaliforniaGovernor Earl Warren signed an expanded bill thatprohibited marriage between whites and negroes,mulattos, Mongolians (which included Chinese andJapanese), and Malays.
The end of World War II led to gradual erosion ofantimiscegenation laws. Between 1946 and 1957, largenumbers of foreign-born wives and children of U.S.military personnel were permitted to enter the U.S.under the G.I. Fiancées Act or War Brides Act of 1946.While most of those admitted were from Europe,some foreign-born Japanese wives and children werealso admitted. The occupation of Japan after WorldWar II and the Korean War and its aftermath led tosubstantial numbers of U.S. armed services personnelbeing stationed in both Japan and Korea. In spite ofstrict restrictions on contact with the local population,many U.S. servicemen formed relationships with localwomen. In 1947, in response to growing requests formarriage between U.S. servicemen and Japanesewomen, new federal legislation was passed amendingthe War Brides Act. This legislation specified require-ments for such marriages when they occurred over-seas, including extensive background checks on bothindividuals and the prohibition of marriages withwomen who had worked as prostitutes or bar host-esses. The rigorous requirements and checks were notrelaxed until 1957, paving the way for more marriagesbetween Japanese (and to a lesser extent, Korean)women and U.S. military personnel.
Meanwhile, antimiscegenation laws were beingchallenged in the courts. The years following WorldWar II brought the greatest changes to these laws,although there were some early exceptions (forexample, Pennsylvania was the first state to repeal itsantimiscegenation law in 1780, and Ohio repealed itslaw in 1887). Most states did not change their lawsuntil after World War II. In 1948, in Perez v. Sharp(also known as Perez v. Lippold), the CaliforniaSupreme Court ruled the state’s antimiscegenationlaw unconstitutional. Oregon repealed its antimisce-genation law in 1951, and 13 other states followedsuit over the next 16 years.
The most well-known and celebrated victory inthe struggle against antimiscegenation laws was the1967 U.S. Supreme Court ruling in the case ofLoving v. Virginia. Richard Loving, a white man, hadmarried Mildred Jeter, a black woman, inWashington, D.C. When the couple returned hometo Virginia, they were arrested and convicted of vio-lating Virginia’s antimiscegenation law. The couplewas sentenced to a year’s imprisonment or a 25-yearexile from Virginia. Rather than risk imprisonment,the couple moved to Washington, D.C., and sued thestate of Virginia in 1963. The Virginia SupremeCourt of Appeals upheld the antimiscegenation lawin 1966. The case was then appealed to the U.S.Supreme Court, which declared in 1967 thatVirginia’s antimiscegenation law (and similar laws in15 other states) was unconstitutional. However, sever-al states had bans on interracial marriage in theirconstitutions for many years, even though the lawswere not inforcable. Alabama was the last state torepeal its antimiscegenation law, through a state con-stitutional amendment in 2000.
The main purpose of antimiscegenation laws wasto prevent marriage between whites and individualsconsidered nonwhite. Marriages between differentnonwhite races generally were not prohibited. Thus,antimiscegenation laws were clearly meant to main-tain the power and privilege of whites and to upholdwidely held beliefs in those days about racial separa-tion, difference, and purity.
ReferencesRobert J. Sickels, Race, Marriage, and the Law (Albuquerque,NM: University of New Mexico Press, 1972); and WernerSollors, ed., Interracialism: Black-White Marriage in AmericanHistory, Literature, and Law (New York: Oxford UniversityPress, 2000). For more on state marriage laws, see www.law.cornell.edu/topics/Table_Marriage.htm; for moreon Loving v. Virginia, seewww.oyez.org/oyez/resource/case/214.
Box 1Antimiscegenation Laws

6 Population Bulletin Vol. 60, No. 2 2005 www.prb.org
Box 2Data on Intermarriage
Researchers who study intermarriageuse a variety of data, measures, andmethodologies. The data on interracialand inter-Hispanic marriage used in thisPopulation Bulletin come primarily fromthe Public Use Microdata Samples(PUMS) from the 1970, 1980, 1990, and2000 decennial censuses. For the 1970Census, we used six different 1 percentsamples to have an overall 6 percentsample of U.S. households. For the1980, 1990, and 2000 censuses, we usedthe 5 percent PUMS.1
For each household record, weexamined information for all personsin the household, including membersof subfamilies living in the household.Subfamilies refer to families (for exam-ple, a married couple or a parent andchild) in addition to the main house-hold family. Although only about 4percent of all married couples in 2000were in subfamilies, these couples aretypically younger, more likely to be for-eign-born, and more likely to be inter-married. In 2000, for example, 7.2 per-cent of all married couples in a mainfamily were intermarried; the compara-ble figure for married couples in a sub-family was 8.5 percent. Intermarriedcouples living in subfamilies represent-ed nearly 5 percent of all intermarriedfamilies in 2000, and excluding themwould distort the overall figures forintermarried couples and exclude adistinctive and important group ofmarried couples.
We searched for all married cou-ples in the files, checking that the hus-band and wife had both reportedthemselves as married and related toeach other as spouses.
This Population Bulletin focuses onmarried couples and their children, butintimate relationships are obviously notlimited to marriage. Some couples arein cohabitating or unmarried-partnerrelationships, including interracial orinter-Hispanic couples. Cohabitationhas become more frequent. In 1970,the ratio of cohabiting couples to mar-ried couples was 1 to 100; by 2000, theratio had increased to 6 per 100. In2000, about 2 percent of persons 15years and older were in cohabitating
heterosexual relationships. Data by racewere not reported.2
If a married couple was found in thehousehold, we then searched for allchildren of the married couple. Weincluded only children age 18 years oryounger. Again, while our interest is inchildren of intermarried couples, werecognize that many U.S. children donot live in married-couple families,including children who may be interra-cial or inter-Hispanic. In 2000, abouttwo-thirds of children lived in married-couple family households, 27 percentlived in single-parent family households,and 6 percent lived in unmarried part-ner households.3
We used the largest publicly availablePUMS files to obtain the best estimatesfor potentially small numbers of particu-lar types of intermarried couples andtheir children. For some demographicgroups, however, the census data setswere larger than required for this analy-sis. We used smaller samples from thesedata sets for some of the larger groups,including the following: We sampledone in every 10 all-white couples andtheir children; one in every three all-black couples and their children; andone in every two all-Hispanic couplesand their children. For all other combi-nations of spouses, including all interra-cial and inter-Hispanic couples, weselected all couples and their childrenfor analysis.
The final data set derived fromPUMS data from the 1970, 1980, 1990,and 2000 censuses includes the follow-ing unweighted sample sizes:
Married couples ChildrenTotal 2,047,231 2,406,3331970 400,113 594,9441980 437,196 524,8641990 518,999 557,4552000 690,923 729,070
We modified the original U.S.Census Bureau weights to ensure anaccurate description of all married cou-ples and their children age 18 oryounger who were living with them.
Census data have many advantagesfor intermarriage research, such as

Supreme Court ruling that over-turned remaining state antimisce-genation laws,14 while the 2000Census was the first to allowAmericans to report more than onerace. Racial and Hispanic identityare based on answers to census ques-tions on race and Hispanic originfrom the 1970 to 2000 censuses (seeBox 3, page 8).
This Population Bulletin finds that: ■ Racial intermarriage has increased
from less than 1 percent of all mar-ried couples in 1970 to more than5 percent of couples in 2000.
■ The typical interracial couple is awhite person with a nonwhitespouse. Intermarriage between twopeople from minority racial groupsis relatively infrequent.
■ Whites and blacks have the lowestintermarriage rates whileAmerican Indians, Hawaiians, andmultiple-race people have thehighest. Asians and people report-ing some other race have interme-diate intermarriage rates.
■ Black men are more likely tointermarry than black women,while Asian women are more like-ly to intermarry than Asian men.Men and women from other racial groups are equally likely to intermarry.
■ About one-fourth of Hispanic cou-ples are inter-Hispanic, a rate thathas been fairly stable since 1980.
■ Younger and better-educatedAmericans are more likely to inter-marry than older and less-educatedAmericans.
■ U.S.-born Asians and Hispanicsand foreign-born whites and blacksare more likely to intermarry thanforeign-born Asians and Hispanicsand U.S.-born whites and blacks.
■ More children are growing up ineither interracial or inter-Hispanicfamilies. Between 1970 and 2000,the number of children living ininterracial families increased near-ly fourfold—from 900,000 to morethan 3 million—while the numberin inter-Hispanic families increasednearly threefold—from 800,000 to2 million.
7Population Bulletin Vol. 60, No. 2 2005www.prb.org
large national samples that allowdetailed comparisons across groups.This capability is particularly impor-tant for smaller racial populationssuch as American Indians and forstudying intermarriage, becauseresearchers are interested in examin-ing different types of intermarriagesand the factors associated with them.In addition, because intermarriagemay be relatively uncommon amongsome groups or in some areas, censusdata allow researchers sufficient casesto investigate topics that may other-wise be unfeasible.
Census data also have disadvan-tages, because they only reflect thecurrent stock of marriages and arenot appropriate for answering ques-tions about why particular peoplechose to intermarry or not. In addi-tion, trend analyses using census-based racial data face other chal-lenges, including comparability ofracial categories over time.
References1. U.S. Census Bureau, Public Use
Microdata Sample (PUMS) Files, PROD-PR/03-3 (Washington, DC: U.S. CensusBureau, 2004). For additional details,contact the authors.
2. Rose M. Kreider and Tavia Simmons,“Marital Status: 2000,” Census 2000 Brief(Washington, DC: U.S. Census Bureau,2003); Jason Fields and Lynne M.Casper, “America’s Families and LivingArrangements: March 2000,” CurrentPopulation Reports P20-537 (2001); andU.S. Census Bureau, “QT-P18, MaritalStatus by Sex, Unmarried-PartnerHouseholds, and Grandparents asCaregivers: 2000,” accessed online athttp://factfinder.census.gov, on March10, 2005.
3. Terry Lugaila and Julia Overturf,“Children and the Households TheyLive In: 2000,” Census 2000 SpecialReports (Washington, DC: U.S. CensusBureau, 2004).
More U.S.children are
growing up ininterracial
families.

8 Population Bulletin Vol. 60, No. 2 2005 www.prb.org
Box 3Race, Ethnicity, and the U.S. Census
Race and ethnicity are considered social construc-tions, which means that society chooses particularphysiological or sociocultural attributes to defineracial or ethnic groups. Skin color, facial features,hair texture and color, and other physical characteris-tics may be used to differentiate races, while lan-guage, religion, and other cultural traits may be usedto define ethnic groups. How race and ethnicity aredefined varies across societies and may change overtime within a society.
The United States has a long history of countingits population according to race, and the decennialpopulation census has played a key role in this histo-ry. From 1790 to 2000, the U.S. population census hascategorized Americans into different groups thatreflected the prevailing attitudes and norms aboutrace. The 1790 Census collected data on “free” peo-ple and slaves, but did not specifically ask for race.No whites were enslaved at that time, and “free” resi-
dents were categorized as “white” or “other” (“other”included free blacks, American Indians, and Asians).These categories served as a de facto enumeration ofthe population by race or color.
The number of races listed on the census form hasexpanded over time. The 2000 Census questionnairespecified 15 different possible responses to the ques-tion on race (see table below). The composition ofracial categories has also changed from census to cen-sus. For example, Asian Indians were classified as“Other” race in 1960, “white” in 1970, “Asian/PacificIslander” in 1980 and 1990, and “Asian” in 2000. In2000, Native Hawaiians and Other Pacific Islanderswere separated from Asians to form a separate racialcategory. Mexicans were listed as a separate race in1930, but were routinely placed in the white popula-tion from the 1940 Census on. In recent censuses, themajority of persons reporting “other” or “Some OtherRace” are of Mexican origin.
Race and Hispanic Categories, 1970 to 2000 U.S. Censuses
Year 19701 1980 1990 20002
Color or race White White White WhiteNegro or Black Black or Negro Black or Negro Black, African Am., or NegroIndian (Amer.) Japanese Indian (Amer.) American Indian or Japanese Chinese Eskimo Alaska NativeChinese Filipino Aleut Asian IndianFilipino Korean Asian or Pacific Islander ChineseHawaiian Vietnamese (API) FilipinoKorean Indian (Amer.) Chinese JapaneseOther Asian Indian Filipino Korean
Hawaiian Hawaiian VietnameseGuamanian Korean Other AsianSamoan Vietnamese Native HawaiianEskimo Japanese Guamanian or ChamarroAleut Asian Indian SamoanOther Samoan Other Pacific Islander
Guamanian Some Other RaceOther
Hispanic Mexican Not Spanish/Hispanic Not Spanish/Hispanic Not Spanish/Hispanic/ LatinoPuerto Rican Mexican, Mex. Am., Mexican, Mex. Am., Mexican, Mex. Am., ChicanoCuban Chicano Chicano Puerto RicanCentral or Puerto Rican Puerto Rican Cuban
South American Cuban Cuban OtherOther Spanish Other OtherNone of these
1 In the 1970 Census, only a sample of households were asked about their Hispanic origin: A 15 percent sample was asked if they were“Spanish-American,” and a separate 5 percent sample was asked about their “Spanish descent,” including whether they were Mexican, PuertoRican, Cuban, Central or South American, or other Spanish. The remaining 80 percent of respondents in the 1970 Census were not askedabout their Hispanic origin. 2 In the 2000 Census, respondents were allowed to check more than one race. Source: S.M. Lee, Ethnic and Racial Studies 16, no. 1 (1993): 75-94; and S.M. Lee, “Using the New Racial Categories in the 2000 Census,” KIDSCOUNT/PRB Reports on Census 2000 (2001).

9Population Bulletin Vol. 60, No. 2 2005www.prb.org
The Role of OMBIn recent decades, census categories have followedguidelines from the U.S. Office of Management andBudget (OMB). In 1977, OMB issued StatisticalDirective No. 15, which defined the following fourofficial races for federal data collection on race:white, black, American Indian and Alaska Native, andAsian and Pacific Islander. Directive No. 15 alsoinstructed the gathering of data on ethnicity (definedas Hispanic or non-Hispanic origin) and specifiedthat Hispanics could be of any race. The 1980 and1990 censuses used these categories.
Opposition to Statistical Directive No. 15 led OMBto issue revised standards for racial and ethnic statis-tics in 1997. For the 2000 Census, there were five offi-cial races: American Indian and Alaska Native, Asian,black or African American, Native Hawaiian andother Pacific Islander, and white. However, peoplecould report more than one of these races. Ethnicitycontinued to be defined as Hispanic/not Hispanicand collected by a separate question.
In the past, racial data were collected from a ques-tion that asked about a person’s “color or race.” Inrecent censuses, the question either did not use theword “race” (in the 1980 Census, the lead-in to thequestion on race read “Is this person ...?”) or askedabout the person’s race (in 1990, the question read“What is ....’s race?”).
Another noteworthy change is the method bywhich racial data were collected. Prior to the 1970Census, census enumerators visited each householdand determined a person’s race in a personal inter-view based on observation. The 1970 Census form was
designed to be completed by respondents rather thanan enumerator, so respondents chose their race fromthe categories provided. Beginning with the 1980Census, responses to the race question were basedprimarily on self-identification, as most question-naires were received and returned by mail. If enumer-ators conducted follow-up interviews, they wereinstructed to ask respondents their race and notrecord race based on observation. The shift in howcensus racial data are collected is reflected in how theU.S. Census Bureau defined race during the 2000Census:
“Race is a self-identification data item in whichrespondents choose the race or races with which theymost closely identify.”
References Margo J. Anderson, The American Census: A Social History(New Haven, CT: Yale University Press, 1988); Office ofManagement and Budget (OMB), “Revisions to theStandards for the Classification of Federal Data on Race andEthnicity, 1997,” accessed atwww.whitehouse.gov/OMB/fedreg/ombdir15.html on Aug.10, 2004; Charles Hirschman, Richard Alba, and ReynoldsFarley, “The Meaning and Measurement of Race in the U.S.Census: Glimpses Into the Future,” Demography 37, no. 3(2000): 381-93; Sharon M. Lee, “Racial Classifications in theU.S. Census: 1890-1990,” Ethnic and Racial Studies 16, no. 1(1993): 75-94; Sharon M. Lee, “Using the New RacialCategories in the 2000 Census,” KIDSCOUNT/PRB Reports onCensus 2000 (Baltimore: Annie E. Casey Foundation, 2001);and Elizabeth M. Grieco and Rachel C. Cassidy, “Overview ofRace and Hispanic Origin: 2000,” Census 2000 Brief(Washington, DC: U.S. Census Bureau, 2001).
U.S. PopulationGrows, DiversifiesThe U.S. population was alreadyracially and ethnically diverse at thenation’s founding, and it has contin-ued to grow and become more raciallyand ethnically diverse, as shown inTable 1 (page 10).15 Historically, theU.S. population was composed of anoverwhelmingly large white majority;the black population was the only sig-nificant minority population, alongwith smaller populations of AmericanIndians, Mexicans, Asians, and others.As recently as 1970, whites were 88percent of the total population; blackswere 11 percent; and AmericanIndians, Asians, and Hawaiians wereless than 1 percent each. Hispanics
were estimated to be about 5 percentof the 1970 population.
By the 2000 Census, several changeshad occurred to alter the racial com-position of the U.S. population,including the change to allow peopleto report more than one race (see Box3). Thus, racial categories are notdirectly comparable between the 2000and earlier censuses. According to the2000 Census, the white population haddeclined to 75 percent of Americans;blacks, at slightly over 12 percent,remained the second largest racialgroup. The Asian population hadincreased to almost 4 percent of thepopulation, and other racial groupssuch as people who reported a singlesome other race (SOR) and peoplewho reported two or more races (MR)had also become more numerous.

10 Population Bulletin Vol. 60, No. 2 2005 www.prb.org
Meanwhile, Hispanics (who can be anyrace) were almost 13 percent of thetotal population and had overtakenblacks as the largest minority group.
ImmigrationHigh levels of immigration fromLatin America, Asia, and other partsof the world have contributed torecent U.S. population growth anddiversity. In 2000, more than 11 per-cent of the U.S. population was for-eign-born, a figure that had steadilyincreased since 1950. These highnumbers or percentages were not themost remarkable feature of recenttrends—immigration was also veryhigh in the early 20th century. Therecent immigration stream was dis-tinctive because of the origins ofimmigrants, who brought unprece-dented ethnic and racial diversity tothe country. While most early 20th-century immigrants were fromEurope, more than one-half (52 per-cent) of current immigrants are fromLatin America, and another 26 per-cent are from Asia.16
Net immigration has also becomea major contributor to recent U.S.
population growth. Since 1970, netimmigration has been responsible for30 percent to nearly 40 percent ofU.S. population growth.
Population ProjectionsThe U.S. population will becomeeven more diverse in the future, asimmigration from non-Europeancountries continues and the secondgeneration (the children of immi-grants) expands. The U.S. CensusBureau projects that by 2020, theHispanic population will be almostone-sixth (17 percent) of the totalpopulation and the combined popu-lation of Asians and Pacific Islanderswill rise to more than 7 percent.17
Under this scenario, the black andAmerican Indian populations wouldshow modest or little change, reduc-ing their share of the total; the whitepopulation (including Hispanics)would be about 80 percent of thetotal population. By 2050, one inevery four Americans would beHispanic and one in every 10 wouldbe Asian or Pacific Islander. Whiteswould still be the largest racial group,at 75 percent of the population.18
Table 1U.S. Population by Major Racial Groups and Hispanic Origin, 1950 to 2000
Percent of total population
Total American Asian & Pacific Multiple Year population All racesa White Black Indianb Islanderc SORd racee Hispanicf
1950 150,697,361 100 90 10 Z Z Z — 31960 179,323,175 100 89 11 Z 1 Z — 41970 203,211,926 100 88 11 Z 1 Z — 51980 226,545,805 100 83 12 1 2 3 — 61990 248,709,873 100 80 12 1 3 4 — 92000 281,423,426 100 75 12 1 4 6 2 13
— Not available or not applicable; z less than 0.5 percent.a Percents do not include Hispanics, who may be of any race.b Includes Eskimos and Aleuts (renamed Alaska Natives in 2000).c Includes all Asian groups, Hawaiians, and other Pacific Islanders (for example, Samoans and Guamanians). In the 2000 Census, Native Hawaiians and Other PacificIslanders were counted in a separate category from Asians; 3.6 percent were Asian and 0.01 percent were Native Hawaiian and Other Pacific Islander.d SOR= Some Other Race. Nearly all SORs also identified as Hispanic, but not all Hispanics identified as SOR (see Box 4, page 19). SOR increased between 1970 and1980 reflecting the addition of the Hispanic question to the 1980 Census and increased propensity for Hispanics to identify as SOR rather than white.e Not available prior to the 2000 Census, which allowed respondents to check more than one race.f Hispanics may be of any race.
Sources: C. Gibson and K. Jung, “Historical Census Statistics on Population Totals by Race, 1790 to 1990, and by Hispanic Origin, 1970 to 1990,For the United States, Regions, Divisions, and States,” U.S. Census Bureau Population Division, Working Paper Series no. 56 (2002): table 1;Hispanic percentages for 1950, 1960, and 1970 are from J.S. Passel and B. Edmonston, “Immigration and Race: Recent Trends in Immigration tothe United States,” in Immigration and Ethnicity, ed. B. Edmonston and J.S. Passel (1994): table 2.3; and U.S. Census Bureau, Statistical Abstract ofthe United States: 2002, 122d ed. (2002): tables 22 and 23.

11Population Bulletin Vol. 60, No. 2 2005www.prb.org
More than one-half of the white pop-ulation would be non-Hispanic (53percent), while 22 percent would beHispanic.
Role of IntermarriageImmigration is a key factor behindthe increased racial and ethnic diver-sity of the U.S. population in recentdecades. Intermarriage across racialand ethnic groups has also con-tributed to this diversity. Rates ofintermarriage have been steadily ris-ing over the last several decades, par-ticularly among nonblack minoritygroups. Previous studies have shownthat American Indians, Hawaiians,and Asians were more likely to inter-marry than blacks, suggesting thatsocial norms against white-black mar-riages were much stronger thannorms against marriages among theother groups.19 Because the growthand diversification of the U.S. popula-tion in recent decades have been pri-marily fueled by increases in the non-black minority groups—in particular,Asians and Hispanics—the role ofintermarriage in the continued diver-sification of the U.S. population willbecome even more important.
DefiningIntermarriageIn this Population Bulletin, intermar-riage can be interracial or inter-Hispanic.20 Racial intermarriage refersto people from one of seven differentracial groups who marry someonefrom a different racial group. Theseracial categories are white; black;Asian; American Indian; Hawaiian;some other race (SOR); and multiplerace (MR—available for 2000 only).The multiple-race category includesany of the 7 million Americans whochecked more than one racial cat-egory on the 2000 Census. The othersix categories include people whoidentified with one race only. Inter-Hispanic marriages were defined byresponses to the Hispanic origin ques-
tion in the census and refer to mar-riages between a Hispanic and non-Hispanic partner.
Endogamous marriage (or inmar-riage) refers to marriage betweenpeople of the same race or betweentwo Hispanics, and includes mar-riages in which both spouses report-ed some other race (SOR) or multi-ple race (MR).21
InterracialMarriage TrendsThe number of married couples inthe United States has increased fromabout 45 million in 1970 to 57 millionin 2000, largely because of overallpopulation growth. While racial inter-marriage remains the exception tothe norm, the numbers and propor-tions of couples that are interracialhave steadily increased from about300,000 in 1970 to 1.5 million in 1990and more than 3 million in 2000 (seeFigure 1).
Interracial couples increased fromless than 1 percent of married cou-ples in 1970 to more than 5 percentin 2000. Increased numbers and pro-portions of interracial couples reflectboth population growth and anincreased tendency to marry acrossracial lines.
1970 1980 1990 20000.3
1.01.5
2.9%
5.4%
0.7%
2.0% 3.1
Number (millions)
% of all couples
Figure 1U.S. Interracial Couples inMillions and as Percent of AllMarried Couples, 1970 to 2000
Source: Authors’ analysis of the Public UseMicrodata Sample (PUMS) files from the 1970,1980, 1990, and 2000 censuses.
Intermarriage iscontributing to
U.S. racial andethnic diversity.

12 Population Bulletin Vol. 60, No. 2 2005 www.prb.org
Group Size A racial group’s size can have a pow-erful effect on the likelihood that itsmembers will marry outside thegroup. Generally, the intermarriagerate is inversely related to a group’ssize—that is, intermarriage is morelikely among smaller populations.22
For a given number of interracialmarriages, the rate will be lower inthe larger group because of its largerdenominator (see Table 2). Thelarge U.S. white population has thelowest interracial marriage rate: Just0.4 percent of married whites werein interracial marriages in 1970.However, this percentage increasedmore than sevenfold, to 3 percent by2000.
Among minorities, blacks have thelowest intermarriage rate, althoughrates are increasing. In 1970, 1 per-cent of married blacks had a non-black spouse. In 2000, 7 percent ofmarriages involving at least one blackpartner were interracial.
Asians are the next largest racialgroup, and have intermarriage rateswell above those of whites or blacksbut lower than the rates of smallerracial groups. In 1970, one-fifth ofmarried Asians were in interracialmarriages; this rate had declinedslightly to 16 percent in 2000.
The smaller racial groups,American Indians and Hawaiians,have always had very high intermar-
riage rates. In 1970, nearly 40 per-cent of American Indians and one-half of Hawaiians were intermarried.Intermarriage rates for these twosmall populations remained highthroughout the 30-year period. In2000, close to 60 percent ofAmerican Indians and almost 50 per-cent of Hawaiians were intermarried.For these two small populations,intermarriage is as common, if notmore common, than inmarriage.People who report SOR also havefairly high intermarriage rates, usual-ly between 15 percent and 20 per-cent. And in 2000, almost 60 percentof married multiple-race Americanswere intermarried.
Gender Differences There are three patterns in intermar-riage rates by gender, as shown inTable 2. In the first pattern, men andwomen from a group are equallylikely to intermarry. This was the pat-tern for white, American Indian,Hawaiian, SOR, and MR groups. Inthe past, Hawaiian and AmericanIndian women were more likely thanmen in these groups to intermarry,but this gender differential was negli-gible in 2000.
In the second pattern, men froma particular group are more likely tointermarry than women in thatgroup. Blacks exemplify this pattern.Black men are more than twice as
Table 2 U.S. Interracial Marriage Rates by Race and Gender, 1970 to 2000
1970 1980 1990 2000
Race Total Men Women Total Men Women Total Men Women Total Men Women
White 0.4 0.4 0.3 1.0 1.1 1.0 1.5 1.6 1.4 2.7 2.9 2.6Black 1.1 1.5 0.8 2.4 3.6 1.2 4.1 5.8 2.3 7.0 9.7 4.1American Indian 37.6 35.9 39.1 53.1 52.7 53.6 59.7 58.7 60.6 56.7 55.7 57.6Asian 19.9 14.2 24.9 21.1 13.1 27.7 17.7 10.8 23.7 16.0 9.5 21.6Hawaiian 50.1 45.6 53.8 58.0 56.0 59.8 50.7 50.1 51.4 45.6 45.5 45.8Some other race (SOR) — — — 15.8 16.6 14.9 15.7 16.5 14.9 17.7 17.1 18.2Multiple race — — — — — — — — — 56.0 55.4 56.6
— Not reported or not applicable. The 1970 composition of the SOR race category was not comparable with later years.Notes: The interracial marriage rate is the percentage of married people within each group with a spouse of another race. Multiple race was reported only in the 2000Census. Nearly all SORs also identified as Hispanic, but not all Hispanics identified as SOR (see Box 4, page 19).
Source: Authors’ analysis of the Public Use Microdata Sample (PUMS) files from the 1970, 1980, 1990, and 2000 censuses.

likely as black women to intermarry,a differential that has widened inrecent years. In 1970, about 2 per-cent of black men were intermarried,compared with less than 1 percent ofblack women. In 2000, almost 10 per-cent of black men, but just 4 percentof black women, had a nonblackspouse.
In the third pattern, women in aracial group are more likely to inter-marry than are men in that group.Asians exemplify this pattern, andthis gender gap has remained fairlystable over the past 30 years. In1970, 25 percent of Asian womenand 14 percent of Asian men wereintermarried. In 2000, 22 percent ofAsian women were in interracialmarriages, compared with 10 per-cent of Asian men.
The gender differences in inter-marriage in some racial groups arenot easily explained, but many fac-tors probably contribute, includingmale and female roles within variousracial groups and social relationsamong specific groups. SociologistRobert Merton proposed the statusexchange thesis to explain why blackmen were more likely to intermarrythan black women.23 In his well-known theory, first described in1941, Merton suggested that mar-riage between a black man and awhite woman could be viewed as anexchange of the man’s higherachieved status (usually his educa-tion, income, or occupation) for thewoman’s higher racial status.24 Sincewomen had fewer socioeconomicopportunities in the past, a blackwoman is less likely to have the eco-nomic resources to exchange for awhite man’s higher racial status.However, several studies that evaluat-ed Merton’s thesis with more recentdata and with more groups havequestioned its applicability to othertypes of racial intermarriage—forexample, between nonblack minoritywomen and white men, or betweennonblack minority men and whitewomen. Researchers continue toexplore reasons behind differentgender patterns of intermarriage.25
Interracial CouplesSome types of interracial couples aremore common than others for demo-graphic and social reasons as well asbecause of individual preferences. Inaddition to the relative size of racialgroups, the age and sex profile ofthese groups can affect the probabilityof intermarriage. If there are far moremen than women in the prime mar-riage ages (for example, between ages20 and 35) in one group, then menfrom this group are more likely tointermarry than men in a group witha more balanced sex ratio in theseages. But individual preferences andsocial factors—such as perceivedattractiveness of potential marital part-ners—are also important.
Most interracial couples consist ofa white person married to a nonwhite(see Figure 2).26 Although interracialcouples have become much morediverse in the last 30 years, marriagebetween nonwhite minorities (Asiansand blacks, for example) is stilluncommon. In 1970, the most com-mon interracial couples were
13Population Bulletin Vol. 60, No. 2 2005www.prb.org
Figure 2Main Interracial Couple Types As Percent of AllInterracial Couples, 1970 to 2000
1970 1980 1990 2000
All other
White/Asian
White/American Indian
White/black
White/SOR
White/muliple race
100
80
60
40
20
0
Note: SOR = Some other race. Nearly all SORs also identified as Hispanic, but not all Hispanics iden-tified as SOR (see Box 4, page 19). Multiple race is available only for the 2000 Census.
Source: Authors’ analysis of the Public Use Microdata Sample (PUMS) files from the1970, 1980, 1990, and 2000 censuses.

14
white/Asian (over one-third);white/American Indian (27 percent);and white/black (20 percent).Beginning with the 1980 Census,white/SOR couples became one ofthe main types of interracial couples,reflecting changes in how the 1980Census collected information on raceand Hispanic origin (see Table 1,page 10, and Box 3, page 8).
After the introduction of multipleracial reporting in the 2000 Census,white/multiple-race couples becamethe most common, accounting for 25percent of interracial couples.White/SOR and white/Asian coupleseach accounted for 18 percent of inter-racial couples. Allowing people tocheck more than one race also con-tributed to declines in interracial cou-ples that included Hawaiians andAmerican Indians, who had a history ofintermarriage and who were more like-ly to report their multiracial back-grounds when given the opportunity inthe 2000 Census. Some interracialspouses who identified as Hawaiian,American Indian, or Asian in the 1990Census shifted to multiple racialreporting in 2000, which moved thatcouple into the white/multiple-racecategory for 2000.27
Gender and Race There are striking differences in thetypes of interracial couples accordingto the spouse’s gender—but not forall racial categories.
In 1970, five main interracial com-binations accounted for 75 percent ofall interracial couples: white hus-band/Asian wife (almost one-fourthof all interracial couples), white hus-band/American Indian wife (14 per-cent), black husband/white wife andAmerican Indian husband/white wife(13 percent each), and Asian hus-band/white wife (11 percent), asshown in Table 3.
Beginning in 1980, SOR husbandswith white wives became a commontype of interracial couple, reflectingchanges in the 1980 Census race andHispanic questions and categories.The shift to allow multiple-race
reporting in 2000 also affected themain interracial couple types by hus-bands’ and wives’ race. White hus-band/Asian wife couples continuedto be the most prevalent at 14 per-cent, but the other most commontypes now included at least one mul-tiple-race partner. These three cou-ple types, together with SOR/whitecouples, black husband/white wife,and white husband/American Indianwife couples, accounted for 70 per-cent of interracial couples in 2000.
In general, interracial couples havebecome more diverse, and trendssince 1970 suggest that this diversitywill continue.
SociodemographicCharacteristics Intermarriage is neither random noruniform across social and demo-graphic groups. As described above,it varies by group size, gender, andrace. Other sociodemographic char-acteristics also influence the likeli-hood of intermarriage. Previousresearch shows, for example, thatyounger adults are more likely tointermarry than older adults.28 Manyolder adults grew up in a time whenintermarriage was illegal or heavilyfrowned on by society, and few peo-ple even considered it. Recent sur-veys of racial attitudes in the UnitedStates show increased acceptance ofinterracial relationships such as dat-ing and marriage.29 Older adults alsohad fewer years of education becauseaccess to higher education was morerestricted in the past. Previousresearch has shown that education ispositively related to greater racial tol-erance and acceptance, and inter-married people are generally morehighly educated.30
Where people live can also influ-ence their likelihood of intermar-riage. The racial make-up of differ-ent regions varies widely, whichaffects intermarriage rates in thoseregions.31 Many African Americanslive in southern states such as
Population Bulletin Vol. 60, No. 2 2005 www.prb.org
Younger menand women aremore likely tointermarry.

Georgia, Louisiana, and Mississippi,while Asians, Hawaiians, and PacificIslanders are concentrated in west-ern states. Hispanics are concentrat-ed in certain states such asCalifornia, Florida, and Texas. Theracial composition of an area’s pop-ulation can influence rates of inter-marriage because of availability ofpotential spouses and because socialnorms about interracial relation-ships vary among regions.32 Forexample, intermarriage is less com-mon among blacks living in theSouth because blacks make up alarger proportion of the South’spopulation and because Southernsocial norms may be more disap-proving of intermarriage.
Whether people are born in theUnited States or abroad also affectstheir chances of intermarriage. Manyimmigrants arrive as adults and arealready married, almost always tosomeone with a similar racial origin.Foreign-born people may also bemore closely tied to a native culturethat may include norms againstintermarriage.33
While the proportion of men andwomen who intermarry is exactly thesame, the social and demographiccharacteristics of men and women whointermarry may differ. In general,youth, higher education, and U.S.birth are associated with a greater like-lihood of intermarriage, but this variesby race for men and women.
Age and Intermarriage There is a clear relationship betweenintermarriage and age. Younger menand women are more likely thanolder people to marry someone ofanother race, reflecting the recentincrease in intermarriage. About 9percent of married men and womenbelow age 30 were intermarried, com-pared with 7 percent of those ages 30to 44, 5 percent for those ages 45 to59, and about 3 percent among thoseage 60 or older.34
The proportion of older couplesthat are intermarried is likely toincrease in coming decades as these
younger intermarried couples growolder. And, if young people continueto intermarry at least as often as theydo today, the proportion of intermar-ried couples in the total U.S. popula-tion will increase.
Age and RaceThe percent intermarried amongwhites and blacks below age 30 is fourtimes to five times higher than thepercent for whites and blacks age 60or older—revealing just how sharplyintermarriage has increased forwhites and blacks in recent years (seeFigure 3, page 16).
15Population Bulletin Vol. 60, No. 2 2005www.prb.org
Table 3Most Common Types of Interracial U.S. Couples byRace of Husband and Wife, 1970 to 2000
Percent of Census year Husband Wife interracial couples
1970 White Asian 23White American Indian 14Black White 13American Indian White 13Asian White 11
Other combination 26
1980 White Asian 19SOR White 13White American Indian 12American Indian White 12White SOR 11
Other combination 32
1990 White Asian 21SOR White 13White SOR 11White American Indian 11American Indian White 11
Other combination 33
2000 White Asian 14White Multiple-race 13Multiple race White 12White SOR 9SOR White 9Black White 8White American Indian 6
Other combination 30
Notes: SOR = Some other race. Nearly all SORs also identified as Hispanic, but not all Hispanicsidentified as SOR (see Box 4, page 19). Multiple race was reported only in the 2000 Census.
Source: Authors’ analysis of the Public Use Microdata Sample (PUMS) files from the1970, 1980, 1990, and 2000 censuses.

16 Population Bulletin Vol. 60, No. 2 2005 www.prb.org
In contrast, the age gradient iseither small or absent amongAmerican Indian, Hawaiian, SOR,and MR groups, which are relativelysmall groups with long histories ofintermarriage. Asians are inbetweenthese two opposites: the percentintermarried among Asians belowage 30 is twice that of Asians ages 60and older, as Figure 3 shows. Theuniformly high intermarriage per-centages by age groups for the multi-ple-race group (56 percent) reflectsthe higher propensity for intermar-riage among people of multiple-racebackgrounds that had been going onfor some time, but was documentedonly in the 2000 Census.
Education Intermarriage rates tend to increasewith education. There are two distinctpatterns for this relationship. In thefirst pattern, intermarriage increaseslinearly with education. This patternholds for blacks, American Indians,Hawaiians, and SORs. Nine percent ofblacks with a bachelor’s degree orhigher are intermarried, for example,compared with 5 percent of blackswho have less than a high school edu-
cation, and 6 percent of high schoolgraduates and those with some college(see Figure 4).
In the second pattern, the percentintermarried increases up to the“some college” group, then declinesamong the most educated group, col-lege graduates and above. Whites,Asians, and multiple-race Americansfollow this pattern. Ten percent ofmarried Asians with less than highschool education are intermarried.The percent then increases to 19 per-cent for Asian high school graduatesand 22 percent for Asians with somecollege, but declines to 15 percentamong Asians with a college degreeor higher (see Figure 4).
Nativity U.S.-born adults have lower intermar-riage rates than foreign-born adults,but this relationship varies by raceand gender. About 5 percent of U.S.-born men and women were intermar-ried in 2000, compared with at least 8percent of foreign-born men andwomen. But the U.S.-born populationis dominated by whites and blacks,two groups with fairly low racial inter-marriage rates (see Table 2, page 12).
Figure 3Percent Interracially Married by Age forU.S. Whites, Blacks, and Asians, 2000
White Black Asian
54
21
12
8
6
3
20
17
15
11
<3030–4445–5960+
Years of age
Source: Authors’ analysis of the Public Use Microdata Sample(PUMS) files from the 1970, 1980, 1990, and 2000 censuses.
Figure 4Percent of Married Blacks andAsians in Interracial Marriagesby Education, 2000
Less than high school
High schoolSome collegeCollege degreeor higher
Asian Black
10
19
22
15
56 6
9
Source: Authors’ analysis of the Census 2000 PublicUse Microdata Sample (PUMS) files.

17Population Bulletin Vol. 60, No. 2 2005www.prb.org
About 8 percent of foreign-born men(regardless of citizenship status) wereintermarried, while 12 percent ofwomen who were naturalized citizenswere intermarried, and 9 percent offoreign-born women who were notcitizens were intermarried. Foreign-born spouses, especially wives, areimportant contributors to theincrease in intermarriage and, there-fore, to the increased diversity of theU.S. population.35
Among white and black husbands,foreign-born men have slightly higherrates of intermarriage than U.S.-bornmen. For other racial groups, we seethe reverse, with considerably higherrates of intermarriage for the U.S.-born. Almost one-third of U.S.-bornAsian husbands were intermarried,compared with 7 percent of foreign-born Asian husbands who are natural-ized citizens, and 5 percent of foreign-born Asian husbands who were not cit-izens (see Figure 5).
Foreign-born white and blackwives have higher rates of intermar-riage than U.S.-born white and blackwives. Seven percent of foreign-bornblack wives (regardless of citizenship)were intermarried, compared with 4percent of their U.S-born counter-parts (see Figure 5). For other racialgroups, foreign-born women hadmuch lower rates of intermarriagethan U.S.-born women. Among mar-ried Asian women, for example, 14percent of foreign-born noncitizenswere intermarried, compared with 22percent of naturalized citizens and 44percent of U.S.-born wives.
Geographic Variation Interracial couples are more likely toreside in more populous areas and inareas where the population is raciallydiverse because these factors facilitateintermarriage. Racially diverse areasalso tend to be more urbanized,which allows for more opportunitiesfor people of different racial back-grounds to meet at work or school.36
The West—with its large popula-tion centers and high racial diversi-ty—had twice the proportion of
interracial couples as other majorregions in 2000 (although residencereported in the 2000 Census maynot be where these couples met andgot married). About 10 percent ofmarried couples in the West wereinterracial in 2000, compared with 5percent nationwide. Accordingly, alarge proportion of the nation’sinterracial couples are found in theWest—almost four of every 10 inter-racial couples in 2000 (see Figure 6,page 18).
Among U.S. states, the percentinterracial ranges from a high of over29 percent in Hawaii to less than 2percent in West Virginia. More than10 percent of married couples wereinterracial in five states: Hawaii,California, Oklahoma, Alaska, andNevada (see Figure 7, page 18).
Most states with an extremely lowpercentage of interracial coupleshave an overwhelmingly white popu-lation (such as North Dakota, WestVirginia, Vermont, and Maine) orhave primarily white and black resi-dents (such as Alabama and
119
10
7 7
45
7
32
14
22
44Foreign-born noncitizen
Foreign-born naturalized citizen
U.S.-born
Black husbands Black wives Asian husbands Asian wives
Figure 5Percent of Husbands and Wives Interracially Marriedby Nativity and Citizenship, for Blacks and Asians,2000
Source: Authors’ analysis of the Census 2000 Public Use Microdata Sample (PUMS) files.

18 Population Bulletin Vol. 60, No. 2 2005 www.prb.org
Mississippi).37 Marriages betweenblacks and whites have been rare his-torically in these southern states.38
The five states with the largestproportions of white and multiple-race couples are Idaho, Alabama,Oklahoma, New Hampshire, andCalifornia. More than 2 percent ofmarried couples in each of thesestates included a white and a multi-ple-race spouse, reflecting high pro-portions of part-American Indian,
Asian, black, and SOR populations.SOR adults typically live in stateswith large Hispanic (in particular,Mexican-origin) populations (seeBox 4). More than 2 percent of mar-ried couples reporting themselves aswhite/SOR live in five states: NewMexico, California, Arizona,Colorado, and Texas. All are south-western states with large numbers ofMexican-origin Hispanics.California—which accounts foralmost one-third of U.S. Hispanics—had more than one-fourth of allwhite/SOR couples.
The states with high proportionsof white and Asian couples are alllocated in the western United States,which has the largest concentrationsof Asian Americans. The highest pro-portion is in Hawaii, where almost 9percent of all married couples arewhite/Asian couples. More than 2percent of married couples inWashington, Nevada, California, andAlaska are also white/Asian couples.
The top four places of residencefor white/black couples center onthe metropolitan Washington, D.C.,area, including the District ofColumbia, Delaware, Maryland, andVirginia. In these four areas,white/black couples were about 1percent of all married couples.These areas have large black popula-tions that may be younger and better
Northeast
Total interracial couples = 3.1 million
Number in millions
Percent of couples that are interracial
Midwest South West
3.8% 3.6%
4.7%
9.8%Northeast
Midwest
0.4
0.51.2
1.0
South
West
Figure 6Number and Percent of Interracial Couples by Region, 2000
Source: Authors’ analysis of the Census 2000 Public Use Microdata Sample (PUMS) files.
Figure 7Percent of Married Couples Who Are Interracial byState, 2000
10.0 to 29.34.0 to 9.92.0 to 3.9
U.S. average = 5.4 percent
Source: Authors’ analysis of the Census 2000 Public Use Microdata Sample (PUMS) files.

19Population Bulletin Vol. 60, No. 2 2005www.prb.org
Box 4Some Other Race (SOR) and Multiple-Race (MR) People: Who Are They?
Virtually all people who identify as some other race(SOR) are Hispanics, but not all Hispanics reporttheir race as SOR. In the 2000 Census, 2.2 millionhusbands, 2.2 million wives, and 3.5 million chil-dren living in married-couple families reported thattheir racial background was SOR—that is, they werenot white, black, Asian, American Indian/AlaskaNative, or Native Hawaiian/Other Pacific Islander.Nearly all of these people also reported Hispanicethnicity. Ninety-nine percent of married SORsreported that they were Hispanic. Of these, almosttwo-thirds said that they were Mexican; about 7 per-cent reported that they were Puerto Rican; and theremaining one-fourth reported that they wereanother Hispanic origin, as shown below. About 98percent of children in the SOR category were iden-tified as Hispanic origin. There are no apparent dif-ferences in Hispanic origin for males or females, orby age group, among children who were reportedas SOR.
While nearly all SORs are Hispanics, less thanone-half of Hispanics reported they are SOR. In the2000 Census, 42 percent of Hispanics reportedSOR, while 48 percent reported white race, 2 per-cent reported black race, 6 percent reported morethan one race, and the remaining 2 percent report-ed other races.
Multiple-Race Americans Most MR individuals are white and something else.In the 2000 Census, about 900,000 husbands, 1 mil-lion wives, and 1.8 million children identified them-selves as having two or more racial origins. Morethan two-thirds of these individuals said that theywere not Hispanic-origin and about one-third report-
ed Hispanic origin, as shown in the table below. Ofthose who reported themselves as Hispanic origin,about one-half reported that they were of Mexicanorigin, and the remaining were primarily otherHispanic origins:
To further examine the MR population, we ana-lyzed ancestry data from the 2000 Census. The 2000Census questionnaire asked respondents to provideas many as two ancestries. At least one-half of multi-ple-race children, husbands, and wives reportedeither Hispanic or European as their first majorancestry (as shown below). The other major ances-tries reported included Asian (18 percent for chil-dren, 13 percent for adults); American Indian (7percent for children, 11 percent for adults); andAfrican American (10 percent for children, 3 per-cent for adults). Relatively few multiple-race peoplereported other ancestries, such as Caribbean, NorthAfrican, Pacific Islander, or Central and SouthAmerican Indian. More than two-thirds of multiple-race children and adults reported various Europeanand non-European ancestries, for example, Germanand Chinese, or British and American Indian.
Source: Authors’ analysis of the Census 2000 Public Use MicrodataSample (PUMS) files.
Americans Reporting More Than OneRace, 2000
Multiple Race (MR) Children Husbands Wives
Total number 1,846,121 937,063 963,019
Percent reportingNot Hispanic 68 70 71Hispanic 32 30 29
Americans Reporting Some Other Race,2000
Hispanic origin Children Husbands Wives
Total number 3,481,991 2,214,646 2,246,788
Percent reportingNot Hispanic 2 1 1Hispanic 98 99 99
Mexican 68 65 64Puerto Rican 5 7 7Cuban 1 1 1Other Hispanic 24 26 28
First Ancestry Reported by Multiple-RaceChildren, Husbands, and Wives, 2000
Ancestry Children Husbands Wives
Total number 1,846,121 937,063 963,019
Percent reportingAfrican American 10 4 3Asian 18 12 14European 22 25 26Hispanic 26 29 27Middle Eastern 4 6 5American Indian 7 11 12

educated than the average, two char-acteristics that are associated withhigher rates of intermarriage.
The U.S. states with the highestproportions of white/AmericanIndian couples all have fairly largeAmerican Indian populations. In bothOklahoma and Alaska, more than 5percent of all married couples arewhite/American Indian. Montana,South Dakota, and New Mexico alsohave relatively high proportions ofwhite/American Indian couples.
Children inInterracial FamiliesAs interracial marriage rates continueto increase in the United States, thenumber and proportion of multiracialfamilies with children will alsoincrease. Because the increase inintermarriage is relatively recent andbecause intermarried couples are stilla small proportion of all married cou-ples, we are just beginning to learnabout children who grow up in inter-racial families.39 What is the racialidentification for children in multi-racial households, for example, andhow has this changed? And how doesthe socioeconomic environment ofchildren in interracial families com-pare with that for children in raciallyendogamous families?
Because an adult usually fills outthe census form for everyone else inthe household, the racial identityreported for a child may or may notbe the same one the child uses him-self or herself, or the same as theother parent would have reported.The results cannot reveal whetherthere is agreement among house-hold members about racial identity.
Also, census data do not revealwhether the child is the biologicaloffspring of both parents. Otherresearch has shown, however, thatabout 90 percent of children age 18or younger who lived in married cou-ple families in 2000 were the naturalson or daughter of the householder.For same-race couples, 91 percent of
children were natural sons or daugh-ters of the householder, 6 percentwere stepsons or stepdaughters, 2percent were adopted, and theremaining 1 percent were other rela-tives (usually grandchildren). Theresults are similar for intermarriedcouples: 88 percent are natural sonsor daughters, 8 percent are stepsonsor stepdaughters, 3 percent areadopted sons or daughters, andabout 1 percent are other relatives(usually grandchildren living in sub-families). In some cases, a house-holder with a natural son or daugh-ter may have remarried after havingthe child. In this case, the child isthe natural son or daughter of thehouseholder but is the stepson orstepdaughter of the householder’sspouse. Census data only record cur-rent marital status, and do not revealwhether either spouse had previousmarriages.
Increasing NumbersIn 2000, about two-thirds of the 71.8million American children under age18 lived in married-couple house-holds. Most of the remaining one-third lived with single parents, withabout 5 percent living with other rela-tives or in other types of householdarrangements.40 Although only 6 per-cent of children lived with interracial-ly married parents in 2000, this figurerepresented a dramatic increase fromthe numbers and relative proportionsof children in families with an interra-cially married couple just 30 years ago(see Figure 8). The number increasedfrom about 900,000 in 1970 to 3.4million in 2000.
Interracial Families The main types of interracial familiesfor children closely resemble themain types of interracial couplesshown in Figure 2, page 13. In 2000,the most common interracial familywith children included a white and amultiple-race spouse; almost 800,000children were in these families. In1980 and 1990, the most common
Population Bulletin Vol. 60, No. 2 2005 www.prb.org20
Most children in interracialfamilies havewhite andmultiple-raceparents.

type of interracial family waswhite/SOR, accounting for morethan one-fourth of all interracial fami-lies with children. In 1970, the mostcommon type was white/Asian, whichmade up more than one-third ofinterracial families.
Just over one-quarter of childrenin interracial families had white/SORparents in 1980 and 1990. With theintroduction of multiple-race report-ing in the 2000 Census, the propor-tion declined to 21 percent.
Although there have been increas-es in the absolute number ofwhite/Asian parents with children—the number of children living withwhite/Asian parents increased fromover 160,000 in 1970 to almost500,000 in 2000—the total number ofchildren living with interracially mar-ried parents increased at a faster rate.Accordingly, the proportion of allchildren living with white/Asian par-ents has declined steadily during thepast 30 years, reflecting trends inwhite/Asian intermarriage and fertili-ty rates as well as the change in racialreporting in the 2000 Census.
The proportion of children livingwith white/black interracial parents
has fluctuated over the years, but itseems to be decreasing, from 17 per-cent in 1970 to 12 percent in 2000.This category has remained thefourth most-common category forinterracially married parents withchildren throughout the 30-year peri-od. In 2000, about 410,000 childrenlived in families with one white andone black parent.
The proportion of children livingwith white/American Indian parentsdecreased sharply in 2000 after theintroduction of multiple-race report-ing. Between 1970 and 1990,white/American Indian parentsaccounted for one-fifth or more ofall children living in interracial fami-lies. In 2000, this proportiondropped below 10 percent (about330,000 children).41
Racial IdentificationWhat is the racial identification ofchildren who live in interracial fami-lies? As noted above, we do not knowwith certainty from decennial censusdata if the children in a householdare the actual biological children ofthe married couple with whom theylive. For instance, the children in aninterracial-couple household may befrom a previous marriage or relation-ship of either spouse, or they mayhave been adopted. But the vastmajority of children in married-cou-ple families are the biological off-spring of the married couple. Even ifonly one spouse of an interracial cou-ple is the biological parent of the chil-dren in the household, the coupleserves as the child’s social parents.They are responsible for the socialand economic environment in whichthe child grows up, and they play keyroles in the child’s future and forma-tion of racial identity.
The proportions of children iden-tified as single-race white, black,American Indian, or Asian decreasedconsiderably between 1970 and 2000(see Table 4, page 22). Around 50percent of children in earlier census-es were reported as white, comparedwith 33 percent in 2000. The propor-
21Population Bulletin Vol. 60, No. 2 2005www.prb.org
Figure 8Children Age 18 and YoungerLiving in Interracial Families,1970 to 2000
1970 1980 1990 2000
0.91.3
1.7
3.4
1.5%
2.4%
3.6%
6.4%
% of all children
Number (millions)
Source: Authors’ analysis of the Public UseMicrodata Sample (PUMS) files from the 1970,1980, 1990, and 2000 censuses.

22 Population Bulletin Vol. 60, No. 2 2005 www.prb.org
tions of children reported as black,American Indian, or Asian were about10 percent for each racial group from1970 to 1990, but decreased to 7 per-cent for black, 6 percent forAmerican Indian, and just 4 percentfor Asian in 2000.
At the same time, more than one-third of children in interracial fami-lies were reported as having two ormore racial origins. In 2000, the mostcommon racial reporting for childrenliving with interracially married par-ents was MR, followed by white (33percent) and SOR (14 percent).42
These trends in racial reporting ofchildren also reflect the changes inmain types of interracial couples andfamilies shown in Figure 2 (page 13).
Where Do InterracialFamilies Live? The geographic distribution of interra-cial families closely mirrors that ofinterracial couples (as shown inFigures 6 and 7, page 18). About two-thirds of children living in interracialfamilies reside in either the West orthe South. States with relatively highproportions of interracial couples alsotend to have high proportions of chil-dren living in interracial families. Morethan 10 percent of all children are ininterracial families in Hawaii,Oklahoma, Alaska, California, andNew Mexico. Hawaii, which has a histo-ry of high intermarriage rates amongits large Asian and Hawaiian popula-
tions, is particularly striking; almostone-third of the state’s children livedwith intermarried parents in 2000.
About one-fourth of all children ininterracial families reside in California;another fourth live in five other states:Texas, Florida, New York, Illinois, andArizona.
SocioeconomicCharacteristics The parents of children living in inter-racial families tend to be youngerthan parents in same-race couples,highlighting how recent and sharp theincrease in interracial marriage hasbeen (see Table 5). Overall, interra-cially married parents have slightly lesseducation than endogamous parents:13.0 years compared with 13.2 yearsfor fathers, and 12.8 years comparedwith 13.1 years for mothers. Butminority-race parents in interracial-couple families are more educatedthan similar minority-race parents inendogamous-couple families. Fathersin white/American Indian-couple fam-ilies have an average 12.8 years of edu-cation, for example, while fathers inendogamous American Indian couplefamilies have an average education of11.6 years. Even among Asians, whohave high average education, parentsin interracial-couple families havehigher educational levels than Asianparents in endogamous-couple fami-lies. Mothers in white/Asian familieshave an average of 14.2 years of edu-cation, compared with 13.1 years ofeducation for mothers in endogamousAsian families.
The higher educational levelsamong minorities in interracial mar-riages are consistent with the youngerages of intermarried people—younger cohorts have higher educa-tional attainment—and with therecency of the increase in intermar-riage. But the higher education levelsfor intermarried minorities alsoreflect a generally positive relation-ship between education and intermar-riage (as shown in Figure 4, page 16).
Parents’ education is important forchildren. Children of more highly
Table 4Reported Race of Children Living in InterracialFamilies, 1970 to 2000
Race reported (%) 1970 1980 1990 2000
White 55 48 48 33Black 14 11 12 7American Indian 13 13 11 6Asian 11 9 12 4Hawaiian 3 3 2 1Some other race (SOR) 5 17 15 14Multiple race — — — 36
Note: Nearly all SORs also identified as Hispanic, but not all Hispanics identified as SOR (see Box 4,page 19). Mulitple race was available only for the 2000 Census.
Source: Authors’ analysis of the Public Use Microdata Sample (PUMS) files from the1970, 1980, 1990, and 2000 censuses.
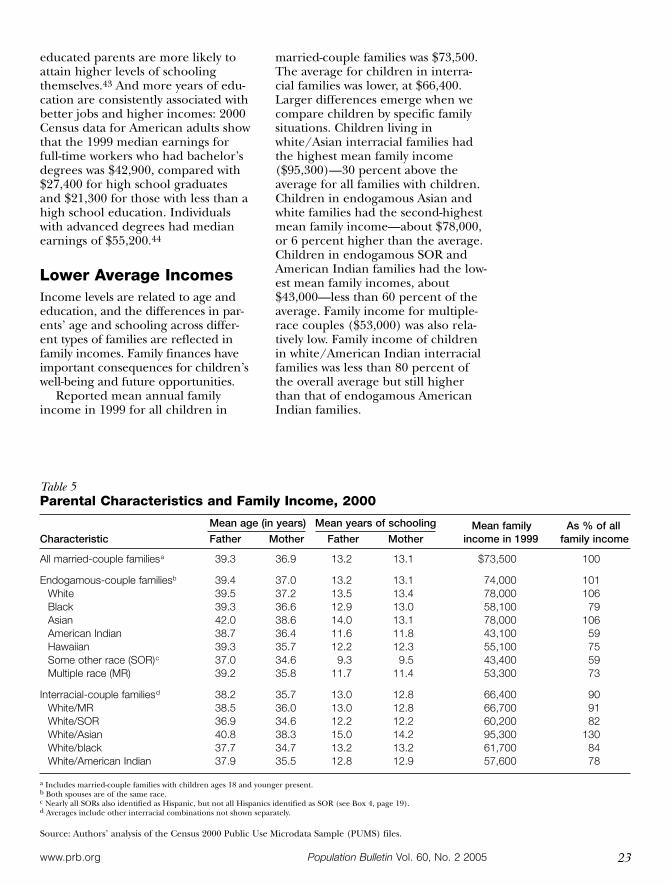
23Population Bulletin Vol. 60, No. 2 2005www.prb.org
educated parents are more likely toattain higher levels of schoolingthemselves.43 And more years of edu-cation are consistently associated withbetter jobs and higher incomes: 2000Census data for American adults showthat the 1999 median earnings forfull-time workers who had bachelor’sdegrees was $42,900, compared with$27,400 for high school graduatesand $21,300 for those with less than ahigh school education. Individualswith advanced degrees had medianearnings of $55,200.44
Lower Average Incomes Income levels are related to age andeducation, and the differences in par-ents’ age and schooling across differ-ent types of families are reflected infamily incomes. Family finances haveimportant consequences for children’swell-being and future opportunities.
Reported mean annual familyincome in 1999 for all children in
married-couple families was $73,500.The average for children in interra-cial families was lower, at $66,400.Larger differences emerge when wecompare children by specific familysituations. Children living inwhite/Asian interracial families hadthe highest mean family income($95,300)—30 percent above theaverage for all families with children.Children in endogamous Asian andwhite families had the second-highestmean family income—about $78,000,or 6 percent higher than the average.Children in endogamous SOR andAmerican Indian families had the low-est mean family incomes, about$43,000—less than 60 percent of theaverage. Family income for multiple-race couples ($53,000) was also rela-tively low. Family income of childrenin white/American Indian interracialfamilies was less than 80 percent ofthe overall average but still higherthan that of endogamous AmericanIndian families.
Table 5Parental Characteristics and Family Income, 2000
Mean age (in years) Mean years of schooling Mean family As % of allCharacteristic Father Mother Father Mother income in 1999 family income
All married-couple familiesa 39.3 36.9 13.2 13.1 $73,500 100
Endogamous-couple familiesb 39.4 37.0 13.2 13.1 74,000 101White 39.5 37.2 13.5 13.4 78,000 106Black 39.3 36.6 12.9 13.0 58,100 79Asian 42.0 38.6 14.0 13.1 78,000 106American Indian 38.7 36.4 11.6 11.8 43,100 59Hawaiian 39.3 35.7 12.2 12.3 55,100 75Some other race (SOR)c 37.0 34.6 9.3 9.5 43,400 59Multiple race (MR) 39.2 35.8 11.7 11.4 53,300 73
Interracial-couple familiesd 38.2 35.7 13.0 12.8 66,400 90White/MR 38.5 36.0 13.0 12.8 66,700 91White/SOR 36.9 34.6 12.2 12.2 60,200 82White/Asian 40.8 38.3 15.0 14.2 95,300 130White/black 37.7 34.7 13.2 13.2 61,700 84White/American Indian 37.9 35.5 12.8 12.9 57,600 78
a Includes married-couple families with children ages 18 and younger present.b Both spouses are of the same race.c Nearly all SORs also identified as Hispanic, but not all Hispanics identified as SOR (see Box 4, page 19).d Averages include other interracial combinations not shown separately.
Source: Authors’ analysis of the Census 2000 Public Use Microdata Sample (PUMS) files.

24
Diverse SocioeconomicConditions Children in interracial families aregrowing up in diverse socioeconomicconditions. Children in white/Asianfamilies benefit from the high averageeducational attainments of both par-ents and the higher family incomesthat accompany higher educationallevels. But children in many otherinterracial families are growing upwith parents with below-average edu-cational levels and below-average fam-ily incomes. However, many of theseinterracial families have higher levelsof parental education and familyincome than their endogamousminority counterparts.
Family background exerts a power-ful influence on children’s prospects.Besides the well-documented relation-ship between parental and child’s edu-cational attainment and income, arecent study found that almost three-quarters of students at the top 146highly selective colleges and universi-ties came from families in the topquarter of the socioeconomic scale(based on family income and parents’education and occupations). Onlyabout 10 percent of students at thesehighly selective institutions came fromfamilies in the bottom half of thesocioeconomic scale. The economicbenefits of attending highly selectivecolleges are clear, including moreresources per student, higher gradua-tion rates, higher rates of attendanceat graduate and professional schools,and higher lifetime earnings.45
HispanicIntermarriage The Hispanic population has grownfaster than the total population inrecent decades and is now the largestU.S. minority group.46 In 1950, lessthan 3 percent of the U.S. populationwas of Hispanic origin; but in 2000,almost 13 percent of the populationreported Hispanic origin.47 The sizeand rate of growth of the Hispanic
population raise important questionsabout the social integration ofHispanics, including marriage withnon-Hispanics.
In the 2000 Census, the majority ofHispanics identified as white only (48percent) and SOR (42 percent). Just2 percent of Hispanics identified asblack, and about 6 percent reportedmore than one race.
Two demographic characteristicsof Hispanics appear to favor theirintermarriage with non-Hispanics.First, few Hispanics report their raceas black, which minimizes thewhite/black barrier that had keptracial intermarriage historically low.Second, the rapid growth of theHispanic population is relativelyrecent, coinciding with and likely con-tributing to the secular increase inracial and ethnic intermarriage.
Overall TrendsThe numbers of Hispanic and inter-Hispanic couples have increased overtime, reflecting growth of the Hispanicpopulation. In 1970, 2.6 million of the45 million U.S. married couples wereHispanic couples; about 600,000 wereinter-Hispanic couples. In 2000, closeto 7.5 million of the nearly 57 millionmarried couples were Hispanic cou-ples; 1.8 million were inter-Hispanic.Inter-Hispanic couples as a proportionof married couples increased from 1percent in 1970 to over 3 percent in2000 (see Figure 9).
As the number of Hispanic coupleshas surged, the percentage thatinclude a non-Hispanic spouse hasbeen fairly stable at between 23 per-cent and 25 percent.
Main Hispanic Groups Some Hispanic groups are much morelikely to marry non-Hispanics than oth-ers. The trends in intermarriage forHispanic groups have fluctuated overthe last 30 years, in part because ofheavy immigration during the period(see Table 6). Many immigrants arrivealready married; single immigrants areless likely to marry outside their ethnic
Population Bulletin Vol. 60, No. 2 2005 www.prb.org
Puerto Ricansare theHispanic groupmost likely tointermarry.

group because they often maintaintheir native language and close cultur-al ties to their ethnic group. In 2000,Puerto Ricans were most likely to beintermarried, followed by “otherHispanics,” Mexicans, and Cubans.
The fastest-growing category ofHispanics between 1970 and 2000 was“other Hispanics,” which reflected anespecially large immigration fromCentral and South America duringthe 1990s. As this group increasedthrough immigration, intermarriagerates fell. In 1970, “other Hispanics”had intermarriage rates above theoverall Hispanic intermarriage rate(20 percent compared with 13 per-cent). Intermarriage among “otherHispanics” increased between 1970and 1980, but decreased from 25 per-cent in 1980 to 17 percent in 2000.Mexicans’ intermarriage ratesincreased from 10 percent to 14 per-cent between 1970 and 1990 butdeclined to 12 percent in 2000. Incontrast, intermarriage rates amongPuerto Ricans and Cubans increasedthroughout the 30-year period. In1970, 10 percent of Puerto Ricanswere intermarried; by 2000, PuertoRicans had the highest intermarriagerate at 21 percent. In 1970, Cubans’intermarriage rate was the lowest at 8
percent, but had increased to 12 per-cent in 2000. Declines in intermar-riage among Mexicans and “otherHispanics” were counterbalanced byincreased intermarriage amongPuerto Ricans and Cubans.
Differences across Hispanic groupsraise interesting questions aboutpotentially uneven marital integrationof different Hispanic groups. PuertoRicans had the highest intermarriagerates in 2000, which is not surprising,considering that Puerto Ricans aremostly U.S. citizens by birth. Between1970 and 2000, Cubans’ intermar-riage rate increased by 50 percent(from 8 percent to 12 percent), whileMexicans’ intermarriage rateincreased by 20 percent (from 10 per-cent to 12 percent), suggesting thatCubans’ marital assimilation into thenon-Hispanic population has beenfaster. In addition, Mexicans’ inter-marriage had increased from 1970 to1990 but decreased between 1990 and2000, reversing the trend of increasedintermarriage. Differences in inter-marriage trends also reflect changesin demographic trends of differentHispanic groups. For example, immi-gration has played a greater role inthe growth of Mexican and “otherHispanics” populations.
For most Hispanic groups, men areabout as likely as women to marry anon-Hispanic (findings not shown).Only women in the “other Hispanics”population are more likely to inter-marry than men. In 2000, 19 percentof “other Hispanics” women wereintermarried, compared with 15 per-cent of men. As with gender differen-
25Population Bulletin Vol. 60, No. 2 2005www.prb.org
Couples (millions)
0.60.9
1.2
1.81.3%
1.9%
2.3%
3.2%
As % of all couples
1970 1980 1990 2000
Source: Authors’ analysis of the Public UseMicrodata Sample (PUMS) files from the 1970,1980, 1990, and 2000 censuses.
Figure 9Inter-Hispanic U.S. Couples,1970 to 2000
Table 6Percent of Married Hispanics With a Non-HispanicSpouse, Selected Hispanic Groups, 1970 to 2000
Hispanic group 1970 1980 1990 2000
All married Hispanics 13 15 15 14Mexicans 10 12 14 12Puerto Ricans 10 14 18 21Cubans 8 8 12 12Other Hispanics 20 25 19 17
Source: Authors’ analysis of the Public Use Microdata Sample (PUMS) files from the1970, 1980, 1990, and 2000 censuses.

26
tials in interracial marriage for someracial groups described earlier, manyfactors contribute to gender variationsin intermarriage, including demo-graphic, cultural, and individual char-acteristics and personal preferences.
DemographicCharacteristicsSome of the same factors that influ-ence whether people marry someoneof another race may also influencewhether a Hispanic man or womanmarries a non-Hispanic. These factorsinclude age (younger people tend tointermarry); education (more highlyeducated people within a group tendto intermarry); the joint effects of ageand education (younger cohorts tendto be better educated); and nativity(U.S.-born Hispanics are more likelyto intermarry).48
The oldest married Hispanic menand women have the lowest intermar-riage rates. Less than 10 percent ofHispanic men and 12 percent ofHispanic women ages 60 and over wereintermarried. Among men youngerthan 60, intermarriage rates exceeded13 percent (findings not shown).
The relationship between educa-tion and intermarriage is substantialfor both Hispanic men and women,and this relationship illustrates theimportant role of social mobility in thesocial integration of ethnic minorities.Intermarriage increases as educationalattainment increases (see Figure 10).Intermarriage is uncommon amongHispanics who have less than a highschool education. Among high schoolgraduates, the percent intermarried isup to 15 percent among men and 17percent among women. The propor-tions intermarried increase to 23 per-cent among Hispanic men with somecollege and 27 percent amongHispanic women with some college.Hispanics with college degrees orhigher education have the highest pro-portions intermarried: 28 percentamong men and 35 percent amongwomen.
Intermarriage among U.S.-bornHispanic men and women was three
Population Bulletin Vol. 60, No. 2 2005 www.prb.org
Husbands Wives
29%
14%
10%
31%
18%
10%
Foreign-born noncitizenForeign-born naturalized citizenU.S.-born
Source: Authors’ analysis of the Census 2000 PublicUse Microdata Sample (PUMS) files.
Figure 10Percent of Married HispanicsWith a Non-Hispanic Spouse,by Education, 2000
Husbands Wives
5%
15%
23%
28%
5%
17%
27%
35%
Less than high schoolHigh schoolSome collegeCollege degree or higher
Source: Authors’ analysis of the Census 2000 PublicUse Microdata Sample (PUMS) files.
Figure 11Percent Married HispanicsWith a Non-Hispanic Spouse,by Nativity and Citizenship,2000

times that of foreign-born Hispanicswho were not naturalized citizens(Figure 11). Around 30 percent ofU.S.-born married Hispanic men andwomen were intermarried in 2000,compared with only 10 percent of for-eign-born Hispanics who were not cit-izens. Foreign-born Hispanics whowere naturalized citizens had interme-diate intermarriage rates: about 14percent among Hispanic men and 18percent among Hispanic women whowere naturalized citizens.
Geographic VariationsMore than 3 percent of all marriedcouples in 2000 were inter-Hispanic,but this percentage was at least 6 per-cent in the West, where 43 percent ofU.S. Hispanics live. In 2000, morethan 40 percent of all inter-Hispaniccouples lived in the West.
New Mexico, California, andArizona—which have large Hispanicpopulations—also have the highestproportions of inter-Hispanic couples(see Figure 12). The fourth leadingstate, Hawaii, does not have a largeHispanic population, but does havehigh intermarriage.49 Other stateswith high proportions of inter-Hispanic couples include Colorado,Nevada, Texas, Florida, Utah, andWyoming—all states with large andgrowing Hispanic populations.
Inter-Hispanic couples areuncommon in many states with smallHispanic populations. Less than 1percent of married couples areinter-Hispanic in West Virginia,Kentucky, Vermont, Maine, SouthDakota, Mississippi, North Dakota,and Alabama.
Children in Inter-Hispanic FamiliesIn 1970, there were around 800,000children age 18 and younger living infamilies with inter-Hispanic parents.As the number of Hispanics hasgrown and Hispanic intermarriageincreased, the number of children in
inter-Hispanic families passed 1 mil-lion in 1980 and 2 million in 2000. Infive states—New Mexico, Arizona,Hawaii, Colorado, and California— 7percent or more of all children live ininter-Hispanic families. These are thesame states with the highest propor-tions of inter-Hispanic couples.
Hispanic IdentityMost children living in families withinter-Hispanic married parents arereported as Hispanic (see Figure 13,page 28). In 1970, 42 percent of chil-dren living with inter-Hispanic cou-ples were reported as Hispanic. Theproportion of children who werereported as Hispanic increased to 66percent in 1980, and has since stabi-lized at around 63 percent. This highlevel throughout the period mayreflect the fact that people have beenable to choose race separately fromHispanic ethnicity. People couldchoose Hispanic ethnicity as well aswhite or another race category.
Because the majority of inter-Hispanic children are reported asHispanic, Hispanic intermarriagemay have been a factor in the phe-
27Population Bulletin Vol. 60, No. 2 2005www.prb.org
Figure 12Percent of Married Couples Who Are Inter-Hispanicby State, 2000
Source: Authors’ analysis of the Census 2000 Public Use Microdata Sample (PUMS) files.
5.0 to 10.52.0 to 4.90.5 to 1.9
U.S. average = 3.2 percent

28
nomenal growth of the U.S.Hispanic population in recent years,and it has important implications forfuture growth and characteristics ofthe Hispanic population. In particu-lar, if Hispanic intermarriage ratesincrease, more and more peoplewho identify as Hispanic may be partHispanic and part non-Hispanic. Atthe same time, there is a largeminority (over one-third) of part-Hispanic children who are notreported as Hispanic; thus, the “non-Hispanic” population includes largenumbers of people with Hispanicorigins.
SocioeconomicCharacteristicsFamily socioeconomic resources canhave significant effects on children’sopportunities, especially in education.Whether they are in endogamous orinter-Hispanic marriages, Hispanicmothers and fathers living with chil-dren under age 19 are younger thannon-Hispanic parents living with chil-dren under age 19 (see Table 7),reflecting the younger age distribu-tion of the Hispanic than the non-Hispanic population. But parents ininter-Hispanic families have nearlythe same educational level as parentsin non-Hispanic families, and muchhigher educational levels than par-ents in endogamous Hispanic fami-lies. In 2000, inter-Hispanic children’sfathers averaged 13.3 years of educa-tion, while non-Hispanic children’sfathers averaged 13.8 years; fathers inendogamous Hispanic families hadcompleted barely 10 years of educa-tion, on average.
The pattern was similar for familyincome in married-couple familieswith children at home. Inter-Hispanicmean family income was 92 percentthat of non-Hispanic families for 1999,while Hispanic families had averageincomes less than 60 percent of themean for non-Hispanic families.
Inter-Hispanic children fared bet-ter than children in families with twoHispanic parents with regard to par-ents’ education and income. Both areimportant indicators of child well-being. Children in inter-Hispanic fam-
Population Bulletin Vol. 60, No. 2 2005 www.prb.org
1970 1980 1990 2000
Number (millions)
% reported as Hispanic
0.3
42%
66%63%
63%
0.8 0.9
1.3
Figure 13Children of Inter-HispanicParents Reported as Hispanic,1970 to 2000
Source: Authors’ analysis of the Public Use MicrodataSample (PUMS) files from the 1970, 1980, 1990, and2000 censuses.
Table 7Parental Characteristics and Family Income by Parents’ Ethnicity, 2000
Mean age (in years) Mean years of schooling Mean family % of non-HispanicMarried-couple familiesa Father Mother Father Mother income, 1999 family Income
Non-Hispanic families 39.8 37.4 13.8 13.6 $78,700 100Endogamous Hispanic familiesb 37.4 34.8 9.9 10.0 45,700 58Inter-Hispanic familiesc 37.9 35.5 13.3 13.2 72,300 92
Note: Hispanics may be of any race.a Includes married-couple families with children ages 18 and younger present.b Both spouses are Hispanic.c Only one spouse is Hispanic.
Source: Authors’ analysis of the Census 2000 Public Use Microdata Sample (PUMS) files.

ilies were no different from non-Hispanic children with regard to par-ents’ education and income. Thesefindings are consistent with higherintermarriage among better-educatedand U.S.-born Hispanics, two charac-teristics generally associated withhigher socioeconomic status.
Implications ofIntermarriageTrends in racial and Hispanic inter-marriage affect American society inmany ways. The demographic effectsof intermarriage— such as changingracial and ethnic composition of thepopulation—are fairly evident and canbe studied using demographic dataand methods. Social effects are morecomplex and subtle. It is difficult tostudy how Americans will think aboutrace in the future when more andmore Americans are multiracial, or asmore people who identify as Hispanicalso have non-Hispanic origins. Thegrowing numbers of multiracial andmultiethnic Americans will also fuelthe debate over how best to count thepopulation by race and Hispanic sta-tus. In this concluding section, we dis-cuss some implications of racial andHispanic intermarriage for U.S. demo-graphic and social change.
Race, Ethnicity, andPopulation TrendsIntermarriage has a major influenceon future racial and Hispanic popu-lation trends. Throughout its history,the nation’s ethnic and racial com-position has changed with varyingsources of new immigrants as well aswith the different fertility and mor-tality rates of U.S.-born residents andnew immigrants. The large whitepopulation dominated U.S. popula-tion for most of the country’s history,although historically there has beena significant minority of blacks andother smaller groups such asAmerican Indians. The past 40 yearshave witnessed a revival of high levels
of immigration and a massive shift inthe countries of origin of immi-grants. Today’s immigrants are pre-dominantly Hispanic, Asian, andCaribbean, rather than the over-whelmingly European immigrants ofearlier years.
The fertility of the U.S.-born popu-lation is relatively low—at or slightlybelow the long-term replacementlevel—and any racial or ethnic groupthat does not have significant immi-gration will not increase in the com-ing decades. Current immigrationtrends ensure that the Hispanic andAsian populations will continue toincrease faster than other groups.
Racial intermarriage is increasingand Hispanic intermarriage is alreadyrelatively high, leading to a growingpopulation of people with multipleracial origins and part-Hispanic origin.The shift to allow reporting of morethan one race in the 2000 Census hadan enormous impact on the composi-tion of interracial couples and theirchildren in terms of how they reportedtheir race. More than one-third of chil-dren growing up in interracial familieswere reported as more than one racein 2000. Among children of inter-Hispanic couples, almost two-thirdswere reported as Hispanic.
Intermarriage andPopulation ProjectionsRecent trends in racial and ethnicchange—combined with increasingintermarriage—have changed theassumptions and methods demogra-phers use to project the future U.S.population. Population projectionsrecently prepared by the authors andJeffrey Passel suggest three importantimplications for future trends in theracial and Hispanic demography ofthe United States.50
First, regardless of trends in inter-marriage, the U.S. Hispanic and Asianpopulations will grow faster than non-Hispanics and other single-racegroups, fueled primarily by continuedhigh levels of immigration and by thegrowth momentum from their youngpopulations. Asians and Hispanics will
29Population Bulletin Vol. 60, No. 2 2005www.prb.org
Increases inintermarriage
will change how we think
about race.

30
therefore constitute an increasingshare of the U.S. population.
Second, increasing intermarriagerates among all groups ensures thatthere will be a rapid growth in thenumber of persons with multiple-raceand part-Hispanic origins, regardlessof how these people report their raceor Hispanic status on census forms.Population projections preparedprior to the release of 2000 Censusdata estimated a multiple-origin pop-ulation of 22 million in 2000, basedon an analysis of ancestry and racereported in the 1990 Census ratherthan on how people actually reportedtheir race in 2000. The estimatednumber is well above the 7 millionAmericans who reported more thanone race in 2000.51 The projectionssuggest that the number of multiple-origin Americans (both multiracialand part Hispanic) will increase to189 million by 2100, making up one-third of the total U.S. population.
Third, the actual size of future mul-tiple-origins groups depends heavilyon the racial self-reporting of multi-racial persons and the reporting ofHispanic origin by persons with part-Hispanic origins. There is a great dealof fluidity in self-reporting of race andethnicity.52 The social context forreporting racial and Hispanic origin,especially for multiple-originAmericans, is also changing. Just asreporting of American Indian ancestryincreased as images of AmericanIndians became more favorable53 (par-ticularly following the 1990 release of apopular movie about AmericanIndians, “Dances With Wolves”), thegrowing prominence of multiracialAmericans in sports, politics, andentertainment may make multiracialidentity acceptable and even desirablefor more Americans. Because manymore Americans could claim a multi-racial identity than have been report-ing it, there is a large potential forincreases in the multiple-race popula-tion. Unpredictable variations in howmultiple-origins people report theirrace or Hispanic status could greatlyaffect the future counts of single-raceand Hispanic populations.
Evidence from the recent censuses,and especially from Census 2000, sug-gest racial reporting by multiracialindividuals is complex and varied,while Hispanic identity is more sta-ble—most children of inter-Hispanicparents are reported as Hispanic. Theuncertainties and ambiguities of racialreporting will therefore continue tochallenge demographers trying to pro-ject the future racial composition ofthe U.S. population. What is certain,however, is that intermarriage and thegrowing population of multiple-originAmericans will be key factors in futureracial and Hispanic population trendsand will continue to challenge govern-ment and other agencies’ efforts tocollect and use racial and ethnic data.
Changing Significance ofRaceRace has been an American obsessionsince the beginning of its history. Theprimary racial divide was a color lineseparating white from black. Overtime, this divide encompassed othergroups such as American Indians,Chinese, Japanese, and Filipinos.Social, economic, spatial, and politi-cal separation of the races wasenforced formally by law and infor-mally by prejudice and discrimina-tion. Interracial marriage was relative-ly rare in the United States for mostof its history, although unions outsideof marriage have always occurred.
Three developments converged inthe late 1960s and early 1970s tospark a dramatic change inAmerican race relations. One was the1967 U.S. Supreme Court decisionthat overturned remaining stateantimiscegenation laws. The secondwas the large-scale immigration ofpeople from Asia and Latin Americafollowing amendments to the U.S.immigration laws in 1965. The newimmigration increased racial andethnic diversity. The third develop-ment was the civil rights movementthat began in the 1950s and gainedmomentum in the 1960s to chal-lenge discrimination against blacksand other minority groups.
Population Bulletin Vol. 60, No. 2 2005 www.prb.org

Intermarriage More Common Less than 35 years after the 1967U.S. Supreme Court ruling that over-turned antimiscegenation laws, racialintermarriage increased from lessthan 1 percent of married couples in1970 to more than 5 percent in2000. Hispanic intermarriageincreased from less than 1 percent ofmarried couples to more than 3 per-cent in 2000. More telling, morethan 10 percent of American Indian,Asian, Hawaiian, Hispanic, SOR, andmultiple-race individuals were inter-married in 2000. Interracial andinter-Hispanic couples and their chil-dren live in every state and comefrom all socioeconomic groups. Butintermarried couples and familiesare especially prevalent and are agrowing proportion of the married-couple population in the West andSouthwest, especially in states such asHawaii, California, Texas, Oklahoma,and Alaska.
Increased intermarriage, particu-larly racial intermarriage, serves as akey indicator of two important socialtrends. First, as more people marryacross racial groups, the social dis-tance between racial groups isreduced. Second, racial intermarriagechanges racial boundaries as familyand kin, the most intimate of socialgroups, become increasingly interra-cial. In this process, the meaning andsignificance of race is altered.
Intermarriage WillIncrease Discussions and surveys about inter-marriage in the United States used tofocus on black/white marriages, yetmost intermarriages are betweenwhites and nonblack minorities.While it is difficult to predict trendsin social attitudes, demographictrends suggest that the increase in thenumber of Asians and Hispanics willfuel more intermarriage.
There are several reasons whyintermarriage will continue toincrease. First, as the Asian,Hispanic, and multiracial popula-tions expand, more Americans will
be living, going to school, working,and playing with people who comefrom racial and ethnic backgroundsthat differ from their own. Increasedcontact, especially noncompetitiveinteractions among social equals atschool and work will facilitate friend-ship, dating, and marriage betweenpeople of diverse racial backgrounds.By their very presence and growingnumbers, multiracial Americans alsodemonstrate to the rest of societythat racial intermarriage is a demo-graphic and social reality.
Second, the U.S.-born share of theAsian and Hispanic American popula-tion will increase, and intermarriagerates are higher among U.S.-bornAsians and Hispanics. U.S.-bornAsians and Hispanics will be a drivingforce behind increased racial andHispanic intermarriage.
Third, substantial numbers of chil-dren are growing up in interracial fam-ilies. Although not all of these personsmay report themselves as multiracial incensuses or surveys, our analysis of2000 Census data showed that at leastone-half of multiracial persons marrysomeone from another single race.Only American Indians have higherintermarriage rates. As more childrenfrom multiracial families grow up, theyare especially likely to intermarry,adding to racial intermarriage and tothe multiple-race population.
Fourth, the wide socioeconomicgap separating the majority white pop-ulation from minority groups is nar-rowing, diminishing one of the majorobstacles to racial intermarriage. Lawsand efforts to help redress the socio-economic inequalities perpetuated bydiscrimination have allowed growingnumbers of minority people toadvance. The improvements are espe-cially large in education, an importantavenue for social mobility in theUnited States. In 1960, 43 percent ofwhites but only 20 percent of blackshad a high school education or more,and 8 percent of whites versus 3 per-cent of blacks had graduated from col-lege. By 2000, the gap had nearly dis-appeared for high school graduation,and it had narrowed for college: 26
31Population Bulletin Vol. 60, No. 2 2005www.prb.org
Thesocioeconomic
gap betweenwhites and
minorities isnarrowing.

32
percent of whites and 17 percent ofblacks had graduated from college in2000. Asians already had higher levelsof educational attainment than whites:44 percent were college graduates in2000. Hispanics have lower education-al attainment—in 2000, 11 percenthad a college-level education orabove.54 The narrowing of the educa-tion gap between whites and minori-ties and increased interracial contactat our nation’s colleges and universi-ties will also contribute to rising inter-marriage rates.
Finally, the American publicappears to be more accepting ofracial intermarriage. Given Americanracial history and the tenacious con-troversies that surrounded race inAmerican society, we should notexpect rapid changes in attitudesabout racial intermarriage, especiallyamong whites. However, recent opin-ion surveys show greater acceptanceof interracial romantic relationships,with majorities of respondents sayingthat they accept interracial dating andmarriage. These shifts in public opin-ion are remarkable, considering thatantimiscegenation laws were not over-turned until 1967 and that, as recent-ly as 1990, 67 percent of whites eitheropposed or strongly opposed a rela-tive marrying a black person.55
While many factors point to con-tinued increases in intermarriage,there are also countervailing trendsthat may slow or even reverse thistrend. High levels of immigration willcontinually refresh the foreign-bornpopulation, and will affect futureintermarriage rates for groups suchas Asians and Hispanics (particularlyMexicans). While racial attitudeshave shifted in recent years towardgreater acceptance of intimate inter-racial relationships (as discussedabove), there are still substantialpockets of strong opposition bywhites to intermarriage betweenwhites and blacks. In a 2000 survey,38 percent of white Americansopposed their relative marrying ablack person.56 While this is a dra-matic decline from the 67 percentopposing such marriages in 1990, it is
still a substantial percentage. Somemembers of minority groups also dis-approve of intermarriage, with someviewing intermarriage as a form ofracial disloyalty.57 Other observershave questioned the honesty of peo-ple surveyed; people may say theyapprove of interracial marriagebecause they consider it the sociallyacceptable answer.58 Apparent toler-ance and acceptance of interracialrelationships also appears to be con-tradicted by public behavior such asderogatory comments and looks ofdisapproval directed at interracialcouples.
Counting andCategorizing Children of interracially married cou-ples pose many challenges for peoplewho collect and use racial data. Whilethe number and relative proportion ofchildren of interracial couples will cer-tainly rise because of increases in thenumber of younger intermarried cou-ples, we do not know how these chil-dren will choose to identify racially inthe future. Their choice of racial iden-tity will be crucial to the future size andcomposition of America’s racial groupsand Hispanic-origin populations.
Intermarriage and the growingpopulation of multiracial Americansaccentuate the controversies over col-lecting and using racial data, issuesthat have been gathering momentumfor quite some time.59 Yet intermar-riage and multiple-origin people arepart of current American social reali-ty. There are an increasing number ofchildren of interracial and inter-Hispanic unions (including nonmari-tal unions not examined in thisPopulation Bulletin). There is a needfor a way to count the various multi-ple-origin groups, if only becausemany such groups are demanding aplace in official data. In addition, dif-ferent combinations of intermarriageare associated with significant differ-ences in such key socioeconomiccharacteristics as education andincome. The diversity of the intermar-ried and multiple-origin population
Population Bulletin Vol. 60, No. 2 2005 www.prb.org

33Population Bulletin Vol. 60, No. 2 2005www.prb.org
must also be acknowledged in officialstatistics. A single multiracial categorywould be socially and statisticallymeaningless.
On the other hand, there hasbeen countervailing pressure for sim-plicity, clarity, and continuity in racialdata collection and application.Affirmative action, equal opportunitylaws, voting rights laws, housing dis-crimination laws, and a host of othersocial and civil programs depend onthe availability of unambiguous racialdata. How can we as a society trackracial discrimination (and ultimatelyeliminate such discrimination) if wedo not have clearly defined racialgroups and racial data? To combatracism, there seems little choice butfor society to continue to categorizepeople by race. Multiracial categoriesmay muddle racial definitions, butthey do not eliminate the need forsuch data.
The tension over acknowledgingand counting the multiple-origin pop-ulation and the need for racial datathat can be usefully applied to a hostof social and economic programs canonly intensify in future years as racialand Hispanic intermarriage and themultiracial and multiethnic popula-tion continue to grow. Controversiesover the use of race in college admis-sions illustrate this well. When admis-sions officers use applicants’ race(self-defined by the applicants) as onefactor among many in reviewingapplications, how much weightshould be awarded an applicant whois single-origin black versus an appli-cant who is multiracial black/whiteversus another applicant who is multi-racial black/white and Hispanic?
The change to multiracial report-ing in the 2000 Census signaled thatprevious racial statistical schemesusing single-race identification areeroding. However, we do not knowwhat will replace them. As America’sintermarriage and multiracial historycontinues to develop and unfold, themeaning of race, its measurement,and its significance will no doubt becontinually challenged and changed.The topic of intermarriage and multi-racial Americans has clearly moved tocenter stage in public discussion.
New Marriages,New FamiliesRacial and Hispanic intermarriageproduces new marriages and familiesthat redefine the role and meaning ofrace and ethnicity in America.Intermarried couples, intermarriedfamilies, and multiracial and multi-ethnic children increasingly populatethe American landscape. In somecommunities, especially in Hawaii andCalifornia, it would not be surprisingif the average person were to con-clude that intermarriage and multi-racial and multiethnic children arethe norm. Intermarried couples andfamilies are racially and socioeconom-ically diverse, but most intermarriagestill involves a white person marriedto a minority spouse. In this sense,intermarriage is “whitening” U.S.minority populations. As intermar-riage continues to increase, furtherblurring racial and ethnic groupboundaries, Americans’ notions ofrace and ethnicity will surely change.
References1. Angie Chuang, “Politics, Culture Cloud Race Data,” The Oregonian, March 20, 2001. Other stories were Gaiutra Bahadur,
“Unions Breaking Tradition,” Philadelphia Inquirer, Jan. 19, 2004; Gregory Rodriguez, “Mongrel America,” The AtlanticMonthly 291, no. 1 (January 2003): 95-97; and Breea Willingham, “Interracial Relationships Make Gains,” Albany TimesUnion, June 3, 2004.
2. Gallup Poll results released in 2004, see www.gallup.com/poll; and Jack Ludwig, “Acceptance of Interracial Marriage atRecord High,” accessed online at www.nexis.com, on March 6, 2005.
3. General Social Survey conducted by the National Opinion Research Center, University of Chicago, 2002.

34
4. Survey by Princeton Survey Research Associates, sponsored by The Pew Research Center for the People and the Press,2003. See Public Agenda Issue Guides, “Race: Bills and Proposals: Most Americans Do Not Object to Interracial Dating orMarriage,” accessed online at www.publicagenda.org/issues/issuehome.cfm, on March 6, 2005.
5. See Matthijs Kalmijn, “Intermarriage and Homogamy: Causes, Patterns, and Trends,” Annual Review of Sociology 24 (1998):395-421; and Louie A. Woolbright and J. Selwyn Hollingsworth, “Cross-Racial Births in the United States, 1968-1988,” inDemographic and Structural Change: The Effects of the 1980s on American Society, ed. Dennis L. Peck and J. SelwynHollingsworth (Westport, CT: Greenwood Press, 1996): 187-204.
6. Elizabeth M. Grieco and Rachel C. Cassidy, “Overview of Race and Hispanic Origin: 2000,” Census 2000 Brief (Washington,DC: U.S. Census Bureau, 2001).
7. See Joshua R. Goldstein and Ann J. Morning, “The Multiple Race Population of the United States: Issues and Estimates,”Proceedings of the National Academy of Sciences 97, no. 11 (2000): 6230-35; and Joel Perlmann and Mary C. Waters,“Introduction,” in The New Race Question: How the Census Counts Multiracial Individuals, ed. Joel Perlmann and Mary C.Waters (New York: Russell Sage Foundation; and Annandale-on-Hudson, NY: The Levy Economics Institute of BardCollege, 2002): 1-30.
8. Nicholas A. Jones and Amy S. Smith, “The Two or More Races Population: 2000,” Census 2000 Brief (Washington, DC: U.S.Census Bureau, 2001).
9. Kalmijn, “Intermarriage”; and Richard Alba and Victor Nee, Remaking the American Mainstream: Assimilation andContemporary Immigration (Cambridge, MA: Harvard University Press, 2003).
10. Michael Omi and Howard Winant, Racial Formation in the United States, 2d ed. (New York: Routledge, 1994).
11. Sharon M. Lee “Racial Classifications in the U.S. Census: 1890 to 1990,” Ethnic and Racial Studies 16, no. 1 (1993): 75-94;and American Sociological Association, “The Importance of Collecting Data and Doing Social Scientific Research onRace” (Washington, DC: American Sociological Association, 2003).
12. Barry Edmonston, Sharon M. Lee, and Jeffrey S. Passel, “Recent Trends in Intermarriage and Immigration and TheirEffects on the Future Racial Composition of the U.S. Population,” in The New Race Question: How the Census CountsMultiracial Individuals, ed. Joel Perlmann and Mary C. Waters (New York: Russell Sage Foundation; and Annandale-on-Hudson, NY: The Levy Economics Institute of Bard College, 2002): 227-55; and Mary C. Waters, “Immigration,Intermarriage and the Challenges of Measuring Racial/Ethnic Identities,” American Journal of Public Health 90, no. 11(2000): 1735-37.
13. We did not combine race and Hispanic status to create categories of non-Hispanic whites, blacks, and other groups tocompare with Hispanics for conceptual and measurement reasons. Combining race and Hispanic status in a study ofintermarriage is fraught with problems given the different roles of race and Hispanic status in U.S. society as well as thehistories and characteristics of Hispanics and racial groups. Current federal guidelines on collecting racial andHispanic origin data also consider race and Hispanic origin as two distinct concepts, and that Hispanics can be anyrace (see Box 3, page 8).
14. See “Loving v. Commonwealth of Virginia, 1967,” in Interracialism: Black-White Intermarriage in American History, Literature,and Law, ed. Werner Sollors (New York: Oxford University Press, 2000): 26-34.
15. The American Indian population is an exception because it declined precipitously from initial contact with Europeans toabout 1900 before recovering. See Campbell Gibson and Kay Jung, Historical Census Statistics on Population Totals by Race,1790 to 1990, and by Hispanic Origin, 1790 to 1990, for the United States, Regions, Divisions, and States (Washington, DC: U.S.Census Bureau, 2002).
16. Immigration and Naturalization Service, Statistical Yearbook of the Immigration and Naturalization Service, 1970 to 2003, select-ed years.
17. These traditional U.S. Census Bureau population projections do not consider interracial or inter-Hispanic births on popu-lation trends. However, new and current U.S. Census Bureau population projections are based on the race and Hispanicorigin of mothers, cross-classified by race and Hispanic origin of fathers (Frederick W. Hollman, U.S. Census Bureau, per-sonal correspondence, Feb. 15, 2005).
18. U.S. Census Bureau, Statistical Abstract of the United States: 2002, 122d ed. (Washington, DC: U.S. Government PrintingOffice, 2002): table 16.
19. Robert N. Anderson and Rogelio Saenz, “Structural Determinants of Mexican American Intermarriage, 1975-1980,” SocialScience Quarterly 75, no. 2 (1994): 414-30; Kalmijn, “Intermarriage”; Kalmijn, “Trends in Black/White Intermarriage,” SocialForces 72, no. 1 (1993): 119-46; Sharon M. Lee and Marilyn Fernandez, “Trends in Asian American Racial/EthnicIntermarriage: A Comparison of 1980 and 1990 Census Data,” Sociological Perspectives 41, no. 2 (1998): 323-42; GarySandefur and Trudy McKinnell, “American Indian Intermarriage,” Social Science Research 15, no. 4 (1986): 347-71; PaulSpickard, Mixed Blood: Intermarriage and Ethnic Identity in Twentieth Century America (Madison, WI: University of WisconsinPress, 1989); and Jerry A. Jacobs and Teresa G. Labov, “Gender Differentials in Intermarriage Among Sixteen Race andEthnic Groups,” Sociological Forum 17, no. 4 (2002): 621-46.
20. See reference 13 above.
21. We considered SOR/SOR and MR/MR couples endogamous based on detailed examinations of these categories in 2000(see Box 4, page. 19). Also, in 2000, less than 4 percent of couples included an SOR individual, and the vast majority of

these SOR couples (82 percent) were endogamous. Less than 2 percent of couples included an MR individual; more thanone-half of these were intermarried. Less than 1 percent of all couples were MR/MR couples. Even if all MR/MR coupleswere considered intermarried, the small numbers would not affect overall results.
22. Several researchers have provided technical procedures to account for group size when measuring intermarriage rates. SeePaul H. Besanceney, “On Reporting Rates of Intermarriage,” American Journal of Sociology 70, no. 6 (1965): 717-21; andRobert Schoen, “A Methodological Analysis of Intergroup Marriage,” Sociological Methodology 16 (1986): 49-78.
23. Robert K. Merton, “Intermarriage and the Social Structure: Fact and Theory,” Psychiatry 4 (1941): 361-74.
24. Kalmijn, “Trends”; and Tim B. Heaton and Stan L. Albrecht, “The Changing Pattern of Interracial Marriage,” Social Biology43, no. 3-4 (1996): 203-17.
25. Tim B. Heaton and Cardell K. Jacobson, “Intergroup Marriage: An Examination of Opportunity Structures,” SociologicalInquiry 70, no. 1 (2000): 30-41; Jacobs and Labov, “Gender Differentials”; and Kalmijn, “Trends.”
26. “All Other” interracial couple types in Figure 2, page 13, include remaining combinations such as black/American Indian,Asian/Hawaiian, American Indian/SOR, and black/MR.
27. Jones and Smith, “The Two or More Races Population: 2000.”
28. Heaton and Albrecht, “The Changing Pattern”; Lee and Fernandez, “Trends”; and Sandefur and McKinnell, “AmericanIndian Intermarriage.”
29. See references 2, 3, and 4. Gallup Poll, results released in 2004; General Social Survey, “GSS Cumulative Datafile 1972-2002 - Quick Tables”; and Princeton Survey Research Associates.
30. Heaton and Albrecht, “The Changing Pattern”; Zhenchao Qian, Sampson Lee Blair, and Stacey D. Ruf, “Asian AmericanInterracial and Interethnic Marriages: Differences by Education and Nativity,” International Migration Review 35, no. 2(2001): 557-86; and Sandefur and McKinnell, “American Indian Intermarriage.”
31. Information on the racial and Hispanic percent of states’ populations can be found at http://factfinder.census.gov.
32. See Karl Eschbach, “The Enduring and Vanishing American Indian: American Indian Population Growth andIntermarriage in 1990,” Ethnic and Racial Studies 18, no. 1 (1995): 89-108; and Kalmijn, “Trends.”
33. Lee and Fernandez, “Trends”; and Greta Gilbertson, Joseph Fitzpatrick, and Lijun Yang, “Hispanic Intermarriage in NewYork City: New Evidence From 1991,” International Migration Review 30, no. 2 (1996): 445-59.
34. Authors’ analysis based on the Census 2000 Public Use Microdata Sample (PUMS).
35. Guillermina Jasso and Mark R. Rosenzweig, The New Chosen People: Immigrants in the United States (New York: Russell SageFoundation, 1990): chap. 4.
36. See Peter M. Blau, Carolyn Beeker, and Kevin Fitzpatrick, “Intersecting Social Affiliations and Intermarriage,” Social Forces62, no. 3 (1984): 585-605; and Steven Rytina et al., “Inequality and Intermarriage: A Paradox of Motive and Constraint,”Social Forces 66, no. 3 (1988): 645-75.
37. For further details, refer to www.factfinder.census.gov.
38. Kalmijn, “Trends.”
39. See Kenneth S.Y. Chew, David Eggebeen, and Peter Uhlenberg, “American Children in Multiracial Households,”Sociological Perspectives 32, no. 1 (1989): 65-86.
40. About 302,000 children were reported as living in group quarters. See Terry Lugaila and Julia Overturf “Children and theHouseholds They Live In: 2000,” Census 2000 Special Reports (Washington, DC: U.S. Census Bureau, 2004).
41. Authors’ analysis of census files.
42. See also the large variations by parents’ race reported by Sonya M. Tafoya, Hans Johnson, and Laura E. Hill, “WhoChooses to Choose Two?” The American People (New York: Russell Sage Foundation, 2004).
43. See Anthony P. Carnevale and Stephen J. Rose, Socioeconomic Status, Race/Ethnicity, and Selective College Admissions, A CenturyFoundation Paper (New York: The Century Foundation, 2003); and Gene Nichol, “Educating for Privilege,” The Nation 277,no. 11 (2003): 22-23.
44. U.S. Census Bureau, “Earnings by Occupation and Education,” accessed online at www.census.gov, on Aug. 9, 2004.
45. Carnevale and Rose, “Socioeconomic Status.”
46. For more information about the diversity within the Hispanic population, see Rogelio Saenz, “Latinos and the ChangingFace of America,” The American People (New York: Russell Sage Foundation, 2004).
47. The 1970 Census was the first census to include a question on Spanish-origin for a sample of respondents (see Table 1,page 10, and Box 3, page 8).
48. Gilbertson, Fitzpatrick, and Yang, “Hispanic Intermarriage in New York City”; and Anderson and Saenz, “StructuralDeterminants.”
49. Hawaii’s Hispanic population is distinctive from mainland Hispanics in several ways. In Hawaii, most Hispanics identify as“other Hispanics” or Puerto Rican; few identify as Mexican. About one-third of married Hispanics in Hawaii reportedmore than one race, and more than one-tenth of married Hispanics in Hawaii reported themselves as Filipino orHawaiian on the race question.
35

Suggested ResourcesKalmijn, Matthijs. “Intermarriage and Homogamy: Causes, Patterns, and Trends,” Annual Review of Sociology 24 (1998): 395-421.
Lieberson, Stanley, and Mary C. Waters. From Many Strands: Ethnic and Racial Groups in Contemporary America. New York: RussellSage Foundation, 1988.
Montagu, Ashley. Man’s Most Dangerous Myth: The Fallacy of Race. 5th ed. London and New York: Oxford University Press, 1974.
Omi, Michael, and Howard Winant. Racial Formation in the United States. 2d ed. New York: Routledge, 1994.
Perlmann, Joel, and Mary C. Waters, eds. The New Race Question: How the Census Counts Multiracial Individuals. New York: RussellSage Foundation and Annandale-on-Hudson, New York: The Levy Economics Institute of Bard College, 2002.
Root, Maria P.P., ed. The Multiracial Experience: Racial Borders as the New Frontier. Thousand Oaks, CA: Sage Publications, 1996.
Root, Maria P.P. Love’s Revolution: Interracial Marriage. Philadelphia: Temple University Press, 2001.
Smith, James P., and Barry Edmonston, eds. The New Americans: Economic, Demographic, and Fiscal Effects of Immigration.Washington, DC: National Research Council, 1997.
Sollors, Werner, ed. Interracialism: Black-White Intermarriage in American History, Literature, and Law. New York: Oxford UniversityPress, 2000.
“Symposium: Racial Identities.” Transaction: Social Science and Modern Society 34, no. 6 (1997): 9-47.
Websites
Racial and ethnic groups and multiracial groupswww.lib.berkeley.edu/TeachingLib/Guides/MixedRace.html
Association of Multiethnic Americanswww.ameasite.org
Interracial Voice www.webcom.com/intvoice
36
50. Edmonston, Lee, and Passel, “Recent Trends in Intermarriage and Immigration.”
51. Edmonston, Lee, and Passel, “Recent Trends in Intermarriage and Immigration.”
52. Goldstein and Morning, “The Multiple Race Population”; and Perlmann and Waters, “Introduction,” in The New RaceQuestion.
53. See Jeffrey S. Passel, “The Growing American Indian Population, 1960-1990: Beyond Demography,” in Changing Numbers,Changing Needs: American Indian Demography and Public Health, ed. Gary D. Sandefur, Ronald R. Rindfuss, and BarneyCohen (Washington, DC: National Academies Press, 1996): chap. 4.
54. U.S. Census Bureau, Statistical Abstract of the United States: 2003, 123d ed. (Washington, DC: U.S. Government PrintingOffice, 2003): table 227. See also Grace Kao and Jennifer S. Thompson, “Racial and Ethnic Stratification in EducationalAchievement and Attainment,” Annual Review of Sociology 29 (2003): 417-43.
55. Howard Schuman et al., Racial Attitudes in America: Trends and Interpretations, rev. ed. (Cambridge, MA: Harvard UniversityPress, 1997).
56. Maria Krysan, “Data Update to Racial Attitudes in America,” an updated website to complement Schuman et al., “RacialAttitudes,” accessed online at http://tigger.uic.edu, on March 6, 2005.
57. Zebroski, “Black-White Intermarriages”; and Randall Kennedy, “Interracial Intimacy,” The Atlantic Monthly 290, no. 5(December 2002).
58. See DeWayne Wickham, “Poll Has Numbers Too Good to be True,” USA Today, July 10, 2001.
59. Edmonston, Lee, and Passel, “Recent Trends in Intermarriage”; Perlmann and Waters, “Introduction,” in The New RaceQuestion; and Matthew Snipp, “Some Observations About Racial Boundaries and the Experiences of American Indians,”Ethnic and Racial Studies 20, no. 4 (1997): 667-89.

Recent Population Bulletins
Volume 60 (2005)No. 2 New Marriages, New Families: U.S. Racial and Hispanic Intermarriage,by Sharon M. Lee and Barry Edmonston
No. 1 Global Aging: The Challenge of Success, by Kevin Kinsella and David R. Phillips
Volume 59 (2004)No. 4 America’s Military Population, by David R. Segal and Mady WechslerSegal
No. 3 Disability in America, by Vicki A. Freedman, Linda G. Martin, and Robert F. Schoeni
No. 2 China’s Population: New Trends and Challenges, by Nancy E. Riley
No. 1 Transitions in World Population, by Population ReferenceBureau Staff
Volume 58 (2003)No. 4 Population: A Lively Introduction, 4th ed., by Joseph A. McFalls Jr.
No. 3 Critical Links: Population,Health, and the Environment, by Roger-Mark De Souza, John S. Williams,and Frederick A.B. Meyerson
No. 2 Immigration: Shaping andReshaping America, by Philip Martin and Elizabeth Midgley
No. 1 Population Dynamics in Latin America, by Jorge A. Brea
Volume 57 (2002)No. 4 What Drives U.S. PopulationGrowth? by Mary M. Kent and Mark Mather
No. 3 Facing the HIV/AIDS Pandemic, by Peter Lamptey, MerywenWigley, Dara Carr, and Yvette Collymore
No. 2 Poverty in America: BeyondWelfare Reform, by Daniel T. Lichterand Martha L. Crowley
No. 1 International Migration: Facing the Challenge, by Philip Martinand Jonas Widgren
Visit www.prb.org to read excerpts from The American People series.
To order PRB publications (discounts available):Population Reference Bureau1875 Connecticut Ave., NW, Suite 520Washington, DC 20009Phone: 800-877-9881Fax: 202-328-3937E-mail: [email protected]: www.prb.org
THEAMERICAN PEOPLE: Census 2000Russell Sage Foundation and Population Reference Bureau
This series of reports sets the results of Census 2000 in context. These user-friendly reports address a range of demographic issues—from race and immigra-tion to marriage and family trends. Each report is written by an author or teamof authors selected for their expertise with the data and broad understanding ofthe implications of demographic trends.
Politics and Science in Census Taking, by Kenneth Prewitt
African Americans and the Color Line, by Michael Stoll
Who Chooses to Choose Two? Multiracial Identification and Census2000,by Sonya M. Tafoya, Hans Johnson, and Laura Hill
Latinos and the Changing Face of America, by Rogelio Saenz
Immigration and Fading Color Lines in America, by Frank D. Bean, Jennifer Lee, Jeanne Batalova, and Mark Leach
Women, Men, and Work, by Liana C. Sayer, Philip N. Cohen, and Lynne M. Casper
A Demographic Portrait of Asian Americans, by Yu Xie and Kimberly A. Goyette
The Lives and Times of the Baby Boomers, by Mary Elizabeth Hughes and Angela M. O’Rand
Gender Inequality at Work, by David A. Cotter, Joan M. Hermsen, and Reeve Vanneman
Immigration and a Changing America, by Mary M. Kritz and Douglas T. Gurak
Cohorts and Socioeconomic Progress, by Dowell Myers
Marriage and Family in a Multiracial Society, by Daniel T. Lichter and Zhenchao Qian
Trends in the Well-Being of America’s Children, by William P. O’Hare
Diverging Fortunes: Trends in Poverty and Inequality, by Sheldon Danziger and Peter Gottschalk
Order The American People reports by calling 800-877-9881, or logging on toPRB’s online store at www.prb.org. Each report is $10.95, with discounts availablefor bulk orders. All orders must be prepaid.

Population Reference Bureau1875 Connecticut Avenue, NW, Suite 520Washington, DC 20009-5728202-483-1100www.prb.org
New Marriages, New Families: U.S. Racial and Hispanic IntermarriageRacial and Hispanic intermarriage has emerged as a significant feature of U.S. soci-ety since 1970. Changes in laws and social attitudes, narrowing education andincome gaps between whites and others, and growing Asian and Hispanic popula-tions have all contributed to increased intermarriage. The number of multiracialAmericans is growing through increased racial intermarriage. Multiracial childrenand their parents are helping to erode historical barriers between racial groups andare changing how Americans think about race.
As the U.S. Hispanic population continues its rapid growth, inter-Hispanic mar-riage and children are expanding the number of Americans with Hispanic ties.
C E L E B R A T I N G 7 5 Y E A R S • 1 9 2 9 - 2 0 0 4