new limitation change to - defense technical … new limitation change to ... technical documentary...
TRANSCRIPT

UNCLASSIFIED
AD NUMBER
AD800055
NEW LIMITATION CHANGE
TOApproved for public release, distributionunlimited
FROMDistribution authorized to U.S. Gov't.agencies and their contractors;Administrative/Operational use; 29 Sep1966. Other requests shall be referred toAFRPL[RPPR-STINFO], Edwards, California93523.
AUTHORITY
AFRPL ltr, 20 Dec 1971
THIS PAGE IS UNCLASSIFIED

° DOW NEY PLANT
00i RESEARCH DIVISION
PROJECT SOPHY
"SOLID PROPELLANT HAZARDS PROGRAM
Technical Documentary Report No.AFRPL-TR-66-26
Progress Report On
Contract AF 04(611)-10919
j . Report Number 0977-01(04)QP / September 1966 I Copy 7
"This dociument is sutject to special export controls and each trans-
mittal to foreign governments or foreign nationals may be made cnlywith prior approval of AFRPL (RPPR-STINFO), Edwards, California
ii. 93523.
GENERAL
_74

AEROJET-GENERAL CORPORATIONResearch Division
11711 Woodruff AvenueDowney, California
PROGRESS REPORT
PROJECT SOPHY
SOLID PROPELLANT HAZARDS PROGRAM
Technical Documentary Report No.AFRPL- TR -66-26
Cont ract AF 04(611)-10919
0977-01(04)QP
Period Covered: I June - 31 August 1966
_ ... ~R. B. Elwell I
0. R. IrwinPrepared by: R. W. Vail, Jr. Date; 29September 1966,
Reviewed by:'A'
M. Nishibayahi, Head No. of Pages: 93Explosive Kinetics Dept
Approved by: Classification: UNCLAI;SIFIEDghr Manager
Research Division
"This document is subject to special export controls and ýeach trans-.mittal to foreign• governments or foreign nationals may be made onlywith prior approval of AFRPL (RPPR-STINFO)0 Edwards, California93523.
I ,/

I'i
0977-0 1(04)QPPage ii
LI , CONTENTS
LaS2 No.
1. INTRODUCTION . 1~r
VZ. SUMMARY .......... I
ii 3. TECHNICAL DISCUSSION .................. 2
I. 1 Development of Data Analysis Techniques 2r 3. 2 Theory of Critical Geometry (Phase I) 12j L ~3.3 Theory of Critical Geometry (Phas~e 2)........39
3.4 Large Critical-Diameter Tests ............. 513.5 Propellant Defects Study . ....... ............... 66
RflEFERENCES ........... .......................... 77
DISTRIBUTION ................................ 79
!i ,
B C
i i:
} '." I

IR
0977-0 1(04)QPPage iii
,IILUST RA TIONSFigre No. fNe o
1. Critical Diameter Estimation for 7. 1% SamplesI Batch 4EH-84. ............................ 8' !
2. Critical Diameter Estimation from Fading Data for9. Z% RDX Samples, Batch 4EHI-86 .I................10
3, Criti,-al Dinyension Estimation from Fading Data for
9.2% RDX Samples, Bz.tch 4EH- 86 .... ............. 11
4, Critical Diameter Results Subtask 3. 2. 1 Batch4EH-85 ............................. J6
5. Critical-Geometry Results, Subtask 3. 2. 1 (squarecolumns) Batch 4EH-86 ........ ................ 19
6.. Combined Results SOPHY I and SOPHY II 9.2%RDX Adulterated Solid Cylindrical Samples ..... ........ Z3
7. 95% Joint Confidence Ellipses for L tnd a- ......... 24
8. Average Detonation Velocitv vc IReduced Size, Circlesand Squares, AAB-3189, Subtask 3.3.2 ........... 36
9. Blast Instrumentation Legs, AFRPL 1-36DFacility ...... .. ........................... 53
10. Detonation Velocity vs Distance, Task CD-98 55
11. Peak Overpressure Data from 60-in, Test. ......... 56
12. Peak Overpressure Data from 72-in. Test ..... ........ 57
13. Detonation Velocity vs Distance Along Charge ... . 61
14. Shock Attenuation in Plexiglas 6Z.................62
15. 7Z-in. and 60-in. Test Data Compared with Data fromPlexiglas and AP-PBAN Propellant ...... ............ 63
j1,6. CD-96 Fireball. Growth ......................... 65
•pI
I'

0977 -0 1(04)QP
K ILLUSTRATIONS (Cont.)
rFigure No. Paýge No.1?. CD-96 Fireball History 67
18. CD-98 Fireball Growth .................. 68
19. GD-98 Fireball History .. ....... .......... 69
20. The ýtffect of Temperature on the Viscosity
of ANB-3226 Binder ........................ 71
:• ,
It
II
I
iIi m i m i m i m i m im i m i m i m i m i m i

0977-0 1(04)QPPage v
TABLES
Table No. Page No.
i 1. Dctonation-Velocity Data, with StatisticalAnalysis for Sustainment Test 3. 2. 2. 47 6...
2. Sanriple-Size Distribution for the Variance and
Mean-Criticai-Geometry Subtask ........... 14
K 3. Test Results, Subtask 3.2. 1, Solid CylindricalSamples ........................... 15
4. Test'Results, Subtask 3. 2. 1, Solid Squar-
Columns ...... .......................... 17
5. Comparison of Critical-Diameter Estimates 9. 2%RDX Adulterated Solid Cylindrical Samples 22
0. Test Results, Subtask 3. 2. 2 (Batch 4EH- 107) .... 27
7. Comparison of Critical-Diameter Estimates
7. 1% RDX Adulterated Solid-Cylindrical"Samples. . ........ ............................ 28
8. Average Detonation Velocities for Supercritical
9. 2% RDX Adulterated Samples . .............. 31
9. Conductance-Probu Measurements,Subtask 3. Z. 3 ........ ........................ 32
10. Average Detonation Velocity and Conductance-
Zone Length ..................................... 33
11. Sample Size and Distribution for the Jetting IPhenomena Study, AAB-3189 .. .................. 40
12. Critical-Geometry Sample Description,AAB-3189 .......................... 43

Page vi
TABLES (Cont.
I F 13. Observed and Calculated Side-On Overpressureand TNT Equivalwices in the 72-in. and the60-in. Critical Diameter Tests ............ 58
14. The Solid Density of ANB-32Z6 Propellant Pre-pared from Aerated Binder ... .............. 73
15. Effect of Standing Time on Density of Aerated
ANB-32Z6 Binder ....... ....................... 75
F
I
1

0977-01104 VOPPage I
INTRODUCTION
This quarterly progress report is the fourth of a, series partially ful-filling Contract AF04(61.i)10919, Large Sol.id- Propellant Boosters Ex-plosives H-azards Stu~dy Program. The'puripose of this prograrm is to
gain additional knowledge, and to develop new techniques, for analyzingthe explosives hazard and dama'ge potential of large solid -propellant
rocket YxioLuis.
Thle objectives of this program are: (1) to determine the influence of
tiw critical diameter of a typical solid composite rocket-mnotor pro-
pellant, (3) to determine what changes a solid-propellarit grain M-ightundergo when exposed to operational mishaps, and (4) to, develop met~hods
-' to simulate and characterize these alterations.
2. SUMMARY
The mean critical diamqeter of AABE-3 189,, an AP-PBAN propellant &dul-terated with 9. 2 weight percent RDX,, has been deterniined t9 be, 2'.66,in.IThe mtsindard deviation of the data is 0.' 04 in. 'The mrean critical ge~o-.nketry of AAB-3189 in the square cross-sect~ion shape is 2.49, in.. witha standard deviation of 0. 041In.
The mnean critical diameter, of AAB-3225 (7. 1 wei ght percent ADX)ý hasbeen deterrmined for ea.ch'of three batches. "Analyiis'of the mixing andcasting records ha~s not provided an explanation for the large differencebetween tile critical diameter of Batch 4EH-"-84 aterial, (6. 36 n. andthe critical diameterp obtained from Batch 4EH-44 anid Batch 4EKH-107samplas (5. 22 arnd 5. 24 in. ), The standard deviaoionIn thedata L*'onany one batch was no greater than 0. 07 in*..
D~etonation velocities have been measured in circular -cylindrical, aridsquare-column shapes, in from near-critical to near-ideal sizes. The'samples, comnposed of AAB-3 189,adulterated propellant,. w~ere Linitru-mnented to obtain reaction-zone thickness data.- Analysis 6f the -data,,frorn these tests is- being performed to determine whether solid pro-pellant behaves according''to a Jones'-type detonation mnodel.ý
Samples have been Cast for the jetting jhenomr'eastd. he osist
-rof a. series of hollow-core circular cylinders with inner di~anetejrs ofvarious hsizoas.

1 ~0977-01(04 )QPIIfi Page 2
H Molds have been fabricated, a~id casting schediuled,. for the critical-geometry tents of triangular,, rectangular, and hollow-core shaped
[,ipls of AAb-3189.' Superc 'itical samples of'AAB-322 5 are also
ready to be, cast for use in con~vcitional c.ard-gap sensitivity testi.
'AýAcial resistancý -probes are being designed for use in:,the investigationBof the sensitivity to initiation of detonation of unadulterated propellant.
The critical-diam~eter test of a 60-in. -diameter cylindrical sample of,za'dulterstdA-PBAN (ANB-3226) resulted, in failure of th e propellantto suata n detonation., The NO-GO test result agrees with the predic-
fl ~~tion of the theoreticalI model that has bee deloeunrth OHY,-program.
fl 'The, testing of an 84-in, diameter sam~ple, in the la~rge critical-diamnetertask, has, been cacle oallow redirection of technical effort towardan, expanded study of the seqns itivity-of the deton~ble unadulterated, pro-pellant. '04ieial acctcptance of the propose sbttte program presentlyFil is being sought.
'T~he ek~pernimental'prograzn to prepar~e propellant samples containing
c ontr olled'defects 1`4 supcceeided in isolating the parameters mbst'effec-tive in determining (u~nconnected) pore'sizeti and'd~istributions. Effortsare being made to evaluate analytical methods by wýhich the porou~s"P'~,propu~llant can be Characterized.
13., 'TECHNICAL DLSCU5SION_
I ~.I 0XVELOPMENT OF DATA ANALYSIS TECHNIQUES,
During this period ýwqo techni4iues have been ~in the proeesa of deve~lop-ment that will assiot in the analysis of detonation vel ocity, (D),vs';e-&'dtcd disitance (x/d) data obtained fromn critical-gaorxietry test' records'.Iri one, the raw dista nce-tirne dA ta is put' int o a computer-programp that'calculates and prints out D vs, x/d data and an average de~tonatilon velo-rity ovesr the'.thir4 and fourth charge 4iaxneters. The program'i.ds-
1 crubed fully ýin Section 3A. I.

Pjage 3
A new niethod of eatin-ati~ig the mean cr~itical geometry, presently beingevaluated, imay prove to, be successful iii reducing ýthe numnber of testsrequired to provide a statistical eatimnate. The'method relics on tho'assumption that the attenuation rate of a fading detonation Wave, at 'agiven point. or over a given region in the iubcritical sarrfple, Ba. .nplefunction of the sam~ple size. This approach, and the resu4.i of iUs appli-c,-tiorn, are discussed in Section 3. 1. 2.
3. 1. 1 'Couiputer Analysis -- D vs x/d Da tA
In the work u~kder this contract~the. principal evidence used in deter.-mining whetheir or not a samzp'le sustained steady-state detona~aý,o is therecord of. detonatiori velocity ve reducedý distan.e.ý: Di Sectioii 3.4. 4. Zi
an Iexception to this criteriaah is discussedý that applies to materials such1.
as tunadulter~ted AP-PBAN propellant, for which the critical detonationlvelocity is near the hydrodynamnic sound velocity in~ the xnaterial, AAnthe ,adulterated-propellant forraulati-Ons tha~t ccwnprise the sanplop 'Use'4
in the prevent prograrn, the critical detonation veloc~ities are suffcientlyabove the hydrodynarnic sound velocity to jus~tify application of the, sus-taiziecl-velocity criterion; A' sample is consider~ed to have detonatedi if,after approximate'ly two diarn~pter* of travel, the detonation Wave, Pro-ceeds at A constant velocity ov e'r the remnaining sanmple length; A, sampleis, consiI dered to have -failed to dleto"Wte if the velocity of thie deton1ationwave decreaso~s in a ixeirly. continuo~s rnanner along the full length ofthe sample.*
A statistical tes~t for &steady-sta t6 4 etor~atiqn over the lower several dia -meters bas been pro rarni' as part of a comrputer progiramn that reduces
[ .distance-tiane dataL tovkc~-distance d,*t anpinto the -results, intabular and gra~phiqal"Jormn,ý The statisticAl, criteria i~r deterzzini~ th'occurrence'of a su-atained detonation a re develop Led, In the following
toxt aad a sample of their r esultsý Is Presented.
*Zn each critica1-gzoroetry test dexignqed for, t-his prograx'n, the samgilelength is at least (four times the iaseer or m inritar~i ur rossa--sectionalI
*diimenisioni. Thercfore, the, sustaiiWed velocity must occuar aovs *pproxi-rnatesly two, diameatirs.

0977-01(04)QP¶ Page 4
It is assumed that if steady-state de 4n is to occur, the detonationvelocity will approach a constant val, ome determinable distance
(x) away from the initiated end. 'The 'h of x is varizble from sampleto sample and test to test because it depends upon the oyerboosteringlevel of the initiating stimulus and upon the -harge diameter.
In this computer program, the initial value of x/d (the reduced distancein diameters) from which the computations progress, is part of the inputdata, in recognition~of the need for flexibility. A linear least-squaresfit to the velocity (D) vs x/d data first is calculated using those dataobtained at all probe positions beyond the arbitrary start points except
*', the last. (The numerical-differentiation method employed to determinevelocity is not as accurate when applied to interior points. Thus, ex-aggerated and suspect values of velocity are commonly calculated at theend points. ) The final exclusion of the end point is determined by com-paring it with the least-squares predicted value, using the t-statistic
SD D- b
D~Dtss. (1)
. where D is the estimated velocity, Dobs is the observed velocity calcu-lated through the numerical-differentiation process, and sD is the stand-ard deviation of the estimate. If the calculated value of t exceeds thetheoretical value at the 0. 05 significance level, the end point is excluded.Otherwise the point is included and the least-squares solution recom-puted to fit all the data points.
The test of whether the event is a steady-state detonation is accomplishedby applying another t-statistic to the hypothesis that the slope of the least-squares best-fit linear solution is not significantly different from zero.The statistic isl b
bt = (2)
where o is the estimated slope calculated by the least-squares fit and
sb is the standard deviation of that estimate, given by
2 Z (D - D)((n- Z) Z(X X-)

0977-01(04)QP
Page 5
where X = x/d and n equals the number of data points involved in the cal-culation. *Since b is the slope of the line, this statistic has n - 2 degreesof freedom. If the calculated Value of t exceeds the theoretical value atthe 0. 05 significance level, it is inferred that no steady-state detonationoccurred.
The computer prints out on the tabular page the results of the stadisticalanalysis of the velocity data. Included in this printout are: (1) the x/dstarting point, (2) the number of points used in the calculation, (3)whether or not the end point was included, (4) slope of the least-squaresfit solution, (5) standard deviation of the slope, (6) whether or not theslope is essentially zero, (7) average velocity, and (8) the standard devi-ation of the velocity data. An example of this printout is shown inTable 1.
3. 1. 2 Estimation of the Mean-Critical Geometry byFading-Velocity Data
An investigation has been in progress to determine whether or not theSfading detonation-velocity data gene.,dted in NO-GO tests could be used
to estimate the critical geometry of a specified shape. It is assumedthat attenuation in a sample very near the critical geometry, but sub-critical, would proceed at a rather slow rate because of the almost suf-"ficient size of the sample. A smaller size sample should cause theattenuation rate to be larger than in the above case because of greatercurvature of the decaying reaction front and increased loss of energyby rarefaction waves. It is asstumned further that over, a certain (un-
* specified) range of subcritical sizes, th-e rate of attenuation may varylinearly with sample size, As a first approxnimation, the rate of attenu-ation has been derived as an average rate over a specific portion of thelower part of the charge.
The procedure consists of the following steps:
a. Compute the average detonation-velocity attenuation rateover the last several charge lengths of the NO-GO samples.This is calculated as being the slope of a least-squares 7i.nebest fitting the velocity vs reduced distance data. (Tech-nically, the average attenuation rate is the negative of Zilis
- . slope.)

;CI
*. . .. .
IUI-V N
In W I
31 .L . .20
-' O**~rnn0 08.ZNN
I-, 'm0 C2a in 0C U,N-m a. In
Q xt
o ~~ 0 -01y 00 ( C.1
4 ~ ~~ I N"a0 0 N %0,MP
IL, r .
W- LL"'fIin Li 0AA 'I
0ILuC 0 00~ o0 I
09) 77-0 ].(41 )(1 P
)agc 7
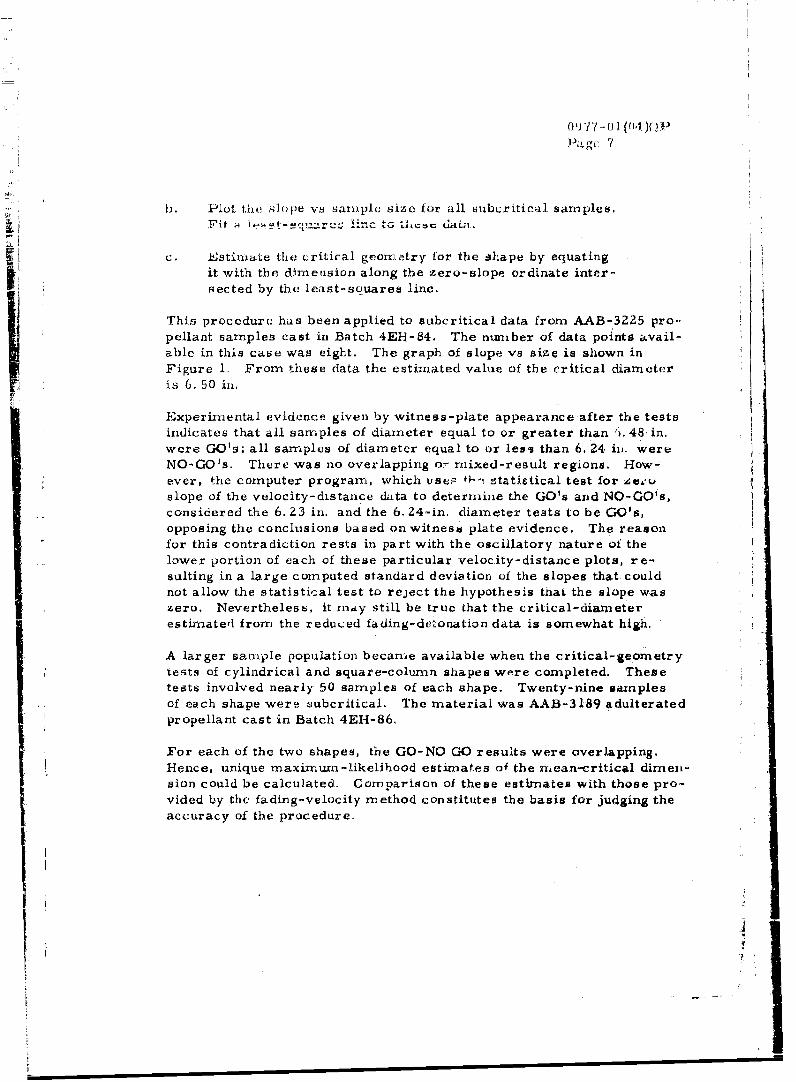
1. Pulot the I)Ipe vs sample size for all subcritical samples..F~it r C• ý';,,_ I. . In ',. G•'i t ' t=,;; M ~i t d .L
c. Estiniate the critical geomnetry for the shape by equatingit with the dimension along the zero-slope ordinate inter-fsected by the least-squares line.
This procedure has been applied to subcritical data from AAB-3225 pro-.pellant samples cast in Batch 4EH-84. The number of data points avail-able in this case was eight. The graph of slope vs size is shown inFigure 1. From these data the estimated value of the critical diameteris 6. 50 in.
Experimental evidence given by witness-plate appearance after the testsindicates that all samples of diameter equal to or greater than 1. 48 in.were GO's; all samnples of diameter equal to or less than 6. 24. iii. wereNO-GO's. There was no overlapping or mixed-result regions. How-ever, the computer program, which uses 01i statistical test for Ze,.uslope of the velocity-distance data to determine the GO's and NO-GO's,considered the 6. 23 in. and the 6. 24-in. diameter tests to be GO's,opposing the conclusions based on witnesd plate evidence. The reasonfor this contradiction rests in part with the oscillatory nature of thelower portion of each of these particular velocity-distance plots, re-sulting in a large computed standard deviation of the slopes that couldnot allow the statistical test to reject the hypothesis that the slope waszero. Nevertheless, it rn.y still be true that the critical-diaxmeterestimated from the reduced fading-detonation data is somewhat high.
A larger sample population became available when the critical-geometrytests of cylindrical and square-column shapes were completed. Thesetests involved nearly 50 samples of each shape. Twenty-nine saxnplesof each shape were subcritical. The material was AAB-3189 adulteratedpropellant cast in Batch 4EH1-86.
For each of the two shapes, the GO-NO GO results were overlapping.Hence, unique maximurn-likelihood estimates of the mean-critical dimen-sion could be calculated. Comparison of these estimates with those pro-vided by the fading-velocity method constitutes the basis for judging theaccuracy of the procedure.
Ii

0977-01(04)QPPage 8
S.....0.2
0
UNIT LENGTH 1 CHARGE DIAMETrEP
S-0.2 _ _ _ -4-- _
i tf • -0.4
J
"-1. 0_ _
-..
uj
t--1.2
__
!w
-J,
•.255.0 5.5 6 .0 6,.5 7.0
S~DIAMETER (IN,)
Figure 1. Critical Diameter Estimation for 7. Il Samples
.[ Batch 4EH-84,
Ii

On 77 - 0 1 t01 'QPPage 9
The C 'ý-!-'Putr'd PC vý- ... ".. . . . . .. . S... for.. .... ... yt*LLv L ^
are presented in Figure 2. The least-squares best-fit line to these data,shown in the figure has this equation:
6= -6. 907 + 2.403 d (4)
where
6 slope of velocity vs reduced distance
El and
d charge diameter
At 6 0, the estimated value of the critical diameter dc is 2. 87 in.The maximum likelihood estimate of dc is 2. 71 in. with an estimratedstandard deviation oi 0. 04 in. The former estimate clearly is four
standard deviations greater than the latter. Statistically, the fading-velocity estimate fails in this case, It should nevertheless be notedthat the difference in estimates of the mean is within 6% of the maxi-
T mum likelihood estimate.
Figure 3 plots slope vs side dimension for the subcritical square-columnsamples. The least-squares best-fit line shown has the equation,
6 = -6,625 + Z. 559 s (5)
where s is the length of one side of the square cross section. At6 = 0, the critical side of a square cross-section column is estimatedto be 2. 59 in. The maximum likelihood estimate of the critical di-nen-sion is 2. 49 in. , with a standard deviation ot 0. 04 in. Again, the for-
mtrir estimate is larger than the latter, in this case by 2. 5 standard
deviations (4%).
Statistically, the results of these trials show the present procedure to
be unsatisfactory. However, the results are not discouraging, becauseseveral simplifications were made in the formulation of this I rocedure
and revision of the procedure in accordance with theoretical t. nsider-ations may yet facilitate its development into an accurate estimatingtool.
'm •I

0(977,01(04)Q"1I Tktge 1 0
P I
2 -0.02
0.00
• -0.2
S-0.6
UAI-
w -1.2
0-J
-1.6 - -2.45 2.50 2.55 2.60 2.65 2.70 2.75
DIAMETER (IN.)
]Figure 2. Critical Diameter Estimation from Fading Data for
9. 2% RDX Samples, Batch 4EH-86.
I"I.
11
5•

0977-01(04)QPPage 1 1
4 -0.4
z -0.6
IJ
*( -,0j -- ,0
Lu
S~U.0 -1.2
0.J
-1.6 -
2.2 2.3 2.4 2.5 2..
SIDE DIMENSION (IN.)
Figure 3. Critical Dimension Estimation from Faling Data for9.2% RDX Samples, Batch 4EH-86.
f

0977-01 (04)QP
Page 1Z
One outstanding factor is immediately obvious- when mixed resultsoccur, there may be NO-GO results at sizes larger than the maximum-likelihood estimated critical geonmetry. Such was the case in both ofthe test cases just discussed. The presence of nonzero data points atthe supercritical sizes would be expected to cause the least-squares
; i line to be biased in that direction. It appears that results obtained in
the mixed-result region may be discarded legitimately when assemnblingdata for analysis by the fading-detonation method
3.2 THEORY OF CRITICAL GEOMETRY (PHASE I)
3.2. 1 Variance and Mean-Critical Geometry'F,3.2.1. 1 Test Objective
The object of this subtask is to evaluate the variance in critical-geometrytest data obtained from circular-cylindrical and square-column shapes,cast from AAB-3189 (9.2 weight percent RDX) adulterated propellant.Knowledge of the magnitude of the variance, and the effect of sampleshape on this quantity, are essential for the proper design of the critical-geometry tests that are to be performed in Subtasks 3.3. 2 and 3.3. 3.A large variance would require that sample sizes be selected that laywithin the expected region of mixed results and that a particular distri-
V bution of thesc sizes be selected to permit an accuratea estimation ofI' the mean-critical geometry to be made. On the other hand, should the
'material exhibit a relatively small variance, of the order' of the smallest"increment in charge size that the particular series reasonably will allow,
!' the number and distribution of the sample sizes that should be testedwould be quite different from that required under the previous set of
,1. conditions.
Batch-to-batch variation also is studied in this subtask by statisticallycomparing the mean-critical diameters and the variances of all thebatches cast. It is vital to be assured of minimal batch-to-batch varia-tion before initiating an extensive critical-geometry test series,
ILrI-

1< ~Page 13 I3. 2. 1.2 Test Setup and Inhtrumentation
The critical-geometry teal setup uses a high-explosive (or rpositipp, B)booster, the propellant ac~optor, a mAild steel wit~ness plate, and anionization- probe/ ra ater oac llogr aph instrumnentation system., Thebooster is a solid right circular cone, of height equal to three bas, ''dia.-meters. The acceptors 'are at least four diameters, or four square-side lengths high. In this particular subtask~the witness plate usedIis hot-rolled mild steel, 6 -in., by 6-in, by 318-itx. thick, iiuppur~ted atleast I in. above the ground.
The ionization probes are inserted at points along the ,side, of the testarticle to a uniforni depth. Assurance of equal spacing and correctangular placement is by means of a machined guide bar that directs'the tool that is used to formn t&e holes in the sample into which theT.robes are put.
3.2. 1. 3 "Test Results
Two acceptable batches of AAB -3189 propellant, that iinclude'd isamplestested under this subta'sk,, have b een cast since the program,.beg~n.The nurminal dimenesions and numbers of samples' at' each dim 'nonuionare shown in, Table Z.',
The results froiu t.ýe Batch 4EH--8,5 tests have been 'reported previouwily(Reference 1). A su'mmary of the results obtained from an additional48 critical-diametebr tests (Bý4tch 41ýH-I-b) is given iii Table 3.` _ hsamples are listed'in order of increasing diamnetor., and.' for those* 6fthe same diameter, io order of decreasing density ThkBtChLAEH-86GO-NO GO results areL shown graphically in Figure 4'.',
Table 4 presents the results of 54 critical-geometry "tests perfolrme'd onthe square column ishapes cast in Batch 4tEH-86." A graphical display'of the GO-NO, GO population is shown in Figure 5.'
3.Z. 1.4 Data Analysis
Maximnurn likelihood estimates ýof the inean criticakl isarntex and theýstandard ctieviation. of'th,&ABatch,4hLH-86 material are 2. 114n. ýand,9. 64in., reepcctively. since there wag; oew reVerseaj in the a" "

Pa ge 14
In b. ,2.: sampl-.izv Digptributiof for, the Variance andMean-Critical-Geometry Subtaask.
Size* Number ,of Sarnelis
0'. spe(n.) 4EH-8'5 4EH4 -86;
t 2..507 j2. 56 10I-1... .62 20 10
CirCular2.851
2.648 1
5' 4. 2.0 206
2.24'
I 2~.'38-6
C;Qluznn 2.44 .
2.50 6'2. 56 6-,6
2.Z-62 % ,6.
Z. 68 - .
*Oiau.r.A metr for ýcýir'cola r-ýcylinde r shaope, length 61~ aide of #'quareaI croa.-;'actionr for squa4rechrn Chap'I
ross~swri nshap44 U

0977-01(04)9PPage 15
Table 3. Test Results, Subtask 3. 2. 1Solid Cylindrical Samples.
t andara Average Detonation Std Dev. ofeviation Density Result of Velocity Velocity Test
Mear. l(in.-) (gm/cc) Test nim/4sec) (rnm/m aec) No. 3. ZI
Z. 49 0.002 1.731 No-Go - 762.49 0.001 1. 7Z8 No-Go - -742.49 "0.002 1.726 No-Go - - 772.49 0.002 1. 72Z No-Go - - 752.55 0.002 1. 726 No-Go - - 792.55 '0. 003 1. 725 No-Go - - 862.55 J.o001 1.724 No-Go - - 81Z. 55 .002 1. 723 No-Go - - 842.55 .':0.002 1. 722 No-Go - - 852.55 0.001 1.722 No-Go - - 802.55 0.002 1.722 No-Go - - 78Z. 55 0.002 i. 721 No-Go - - 83
"r2.55 0.001 1.721 No-Go - - 822.55 p0.002 1.721 No-Go - - 872.61 0.002 1. 727 No-Go - 962.61 0.001 1. 725 No-Go - - 95.2.61 0.003 1.725 No-Go - - 932.61 0.001 1. 725 No-Go - - 882. 61 0.002 1. 7Z4 No-Go - 972.61 0.002 1.724 No-Go - 942.61 0. 003 1.724 No-Go 912.61 0.002 1.724 No-Go 922.61 0.003 1. 723 No-Go 89
2.61 0.003 1. 721 No-Go - 902.67 0. 003 1. 728 No-Go - - 992.67 -0.06 1.727 No-Go - - 1002. 67 '0.0002 1. 727 No-Go - - 1042. 67 0.002 1.726 No-Go - - 105-2.67 0.002 1.725 No-Go - - 101"2 267 0.002 1.722 No-Go - - 1062.68 0. 001 1. 728 GO 4. 1Z 0.23 103Z. 68 o. 001 1. 777 Go 4. 19 102
!Z1:68 0.002 1.718 No-Go 982.74 0.004 1.732 No-Go - 1!52.74 0.001 1.7Z9 Go 4.21 0.1 0 1i12.74 0.001 1. 729 Go 4. 25 0.10 114Z. 74 0.001 1. 729 Go 4. Z5 0. !02.74 0. 003 1. 728 No-Go -- Z
:2. 74 0. 001 1. 727 Gc 4.5 0.03 109
2.74 0.001 1.727 No-Go - 1132.74 0.001 1.727 Go 4.29 • •-06 1082. 74 0. 001 1. 726 Go .1. 2 I.0t o02. 74 0. 001 1 724 GO 0no record} 1072.79 0.002 1. 731 Go 4.212.79 0.004 1.725 Go 4. Z9 !. 132.80 0.00Z 1. 730 Go 4.2'7 0. 0•62. 80 0. 003 1.729 Go 4.L7 12o. 1- 1.7.Z. 80 0. 003 728 Go 4. 16 1. 4. 1.7
Average Density 1. 726 7m/ccSta ida rd Dev iation 0. 00• 1 r .c:

w00
Cl'
C4
[-A

09 77 - 01 ( )0 )OP
Page 17
'a.,i 1. Test Results, Subtask 3.2, 1
Solid Squdre Coluinnso
Side Dimension Average Detonation Std Dev of TestMean Std Dev Density Result of Velocity Velocity No,(in.) (in.) (gm/cc) Test (mrnm/sec) (_ram/ Aasec) 3, 2. 1
"2.22 0. 012 1. 726 No-Gu - 1522.22 0. 024 1. 723 - 1542.22 0. 010 1. 723 - 1242.23 0. 006 724 - 153
.2 23 0. 006 1. 723 - 159
2.Z4 0. 086 . 724 - 132.27 0. 009 1. 727 - 1572.28 0. 011 1 .723
- 1562.29 0. 029 1. 723 . 1262.43 0. 009 1723 - 1272.30 0. 019 1725 - - 1552. 31 0.008 1 727 " - i3Z2.31 0.017 1 .724 - 1252.32 4 . 014 1 .721 N - 1292.33 0. 010 1. 723 o - 1332.34 0. 015 1. 726 G - 1282,34 0. 017 1. 721 - 1342.35 0. 014 .1 724 -4 1582. 38 0.050 1. 72G7 4 0 12,40 0. 028 1 7291Z. 41 0. 031 1 7.30 - 1362.41 0. 030 1, 727 - 137211Z 0, Oil I1 7Z-3 - -138,2.43 o' 0 1 ? 1 .7Z5 - - 1422.43 0. 037 1 724 132.45 0. 010 1 730 - 1402.45 0. 010 1. 727 - 1602.46 0, 016 1 . 729 "1.302,.46 (1,004 1 . 7U9 No-Go - 14 1Z .50 0. 015 1. 7Z8 Go 4. 12 0.,Z11 131
:' i250 0, 012 1. '72 6 Go 4. 2300714.50 0.018 L. 723 Go 427 0 078 1,612. 51 0,007 .1. 723 Go 4. 16 0,281 145
Z37, 53 0. 015 1, 728 Go 4. 30 0. 051 144
NrI

"097/-01 (04)QP
I k
Table 4. (Co.nntj,,pr.4
Std Average Detonation Std Dev of TestDeviation Density Result of Velocity Velocity No.Mean (in.) (•s/cc) Test (rII /"sec) (n/,sec,) 3.2. 1
I.54 1O.lu 1.727 Go 4.26 0.053 143- 2.54 0,017 1. 726 Go 4.31 0. 124 1622.55 0.014 1. 723 No-Go . 1472,57 0.015 1. 726 Go 4.28 0. 111 164258 0.024 1. 728 Go 4.23 0. 108 149SZ. 58 0.024 1. 724 Go 4. 28 0.078 1632.60 0.010 1. 726 Go 4.27 0. 125 1652. 62 0. 010 1. 726 ýGo 4. 28 0,053 1492.62 0.013 - Go 4 29 0.64 150Z. 63 0,027 1. 728 Go 4.35 0,046 1692.63 0. 025 1. 725 Go 4.29 0. 070 168Z. 65 0,011 1.729 Go 4.35 0.064 167S2. 68 0.041 1.727 Go 4.26 0.070 1512.168 0.019 . 726 Go 4.34 0.069 1662.68 0.022 1. 725 Go 4.31 0.060 172..68 0.010 1.725 Go 4. 30 0.091 1752. 68 0.016 1. 723 Go 4.27 0.075 174
2.70 0.011 1.729 Go 4.29 0.087 173S2. 7U 0.008 1. 726 Go 4.34 0. 059 1702.72 0.023 1.727 Go 4.32 0 054 171Average Density .1, 725 grn/cc
Standard Deviation 0. 0023 gi.i/cc
I
V
S I

m U977-01(04'AOP
Page .19
0
C4.
c4-4ý
"4)
.4.
4D-
IT
-~ z

0977-01 (04)QP
V-age 4¼U
data (i. e., a NO-GO response occurring at a size greater than thesmallest size at which a GO response was observed) maximum likeli-hood estimates of the mean critical geometry and the standard deviationcan be calculated. These values are 2. 49 in. and 0. 04 in., respec-tively. Since the standard deviations frorn the two sets of data areidentical, no statistical test of their similarity is necessary. It is con-cluded that variance, which is the square of the standard deviation, isindependent of shape in this instance. Because the square is similarto the circle (i. e. , solid, nonacute),extending this conclusion to allshapes would be unsound. Since a large number of equilateral triangularcross-section shapes will be tested in the critical-geometry subtask
ii (see Section 3,3.2), it will be possible to evaluate the effect of shapeon variance for an acute shape when those tests have concluded.
3. 2. 1. 4. 1 Evaluation of the Critical-Geometry Theory
The critical-geometry theory states that for a given material, there is
one critical geometry for all shapes. The critical geometry is equal to4A/P, where A is the cross-a ectional area and P is the total perimeterof the critical size. For a solid circular cylinder, 4A/P = d, so that
I at the critical size, the critical geometry is the critical dianmeter. Fora square cross-section, 4A/P = s, where s is the length nf ; side of thesquare. Therefore, the theory predicts that the critical geometry of asquare shape is equal to the side length of the critical square. If thetheory holds for squares and cylinders, se should be equal to dc.
Combining all the critical-diam eter data conmpiled on AAB-3189, in-cluding that generated under Contract AF 04(611)9945, the mean criticaldiameter is Z. 66 in. , with a standard deviation of 0. 080 in.
Comnparison of the predicted 2. 66 in. with the experimental meansquare critical geometry of 2. 49 in. shows the theory predicts a criticalgeometry approximately 6% too large for the square. Using 2. 71 in.,the critical diameter of Batch 4EH-86, the comparison shows an over-
I estimate by the theory of approximately 8%. These findings are corn-pletely consistent with those found for the same material under ContractAF04(611)9945, SOPHY I (Reference 2). From the SOPHY I data, how-ever, the overestimation seens to be the same for all nonsolid-cylindrical shapes, which implies that there is One critical geometryfor all such shapes and that its value is approximately 0. 92 dc.A
4,

0977-. 01 j(Q4)QPPage 21
3. Z;4. Z Bat -to- atch Variations
Since statistical tests of the SOPHY - data anw that from Batch 4EH-85(Referenpze i) showed batch-to-batch differences, Batch 4EH-86 .:--castto inves gate the variation more fully. Comparative statistic s o-.L thethree populations are shown in Table 5, and a graph of the ccrribLrke:GO-NO GO resu-lts is shown in Figure 6. It should be pointe6 out thatthe SOPHY I data, although it is treated as one population, actually in-cludes the combined results from three batches of pzopellant. The totalnumber of samples, however, is still much less than the number testedin eith6r of the recent batches. Also, the SOPHY I material was mixedand cast on a different line area at Sacramento; the ,batch size was 800 lb,compared to the 2000-lb batch size in SOPHY I1. Different mixing equip-ment and personnel were used in the previous effort. It mnight be ex-pected that under these circumstances, with the large number of differ-ences between the two casting operations, the data could reflect theintroduction of such parameters.
Inspection of Table 5 repeals that the results from Batch 4EH-86 arealmost identical to thos Ifrom SOPHY I. In fact, the 95% confidenceellipses for the mean (4) and the standard deviation (a-', calculated forthis batch, is completely contained within'the ellipse drawn from theSOPHY I data (Figure 7). This figure shows the ellipse drawn forBatch 4EH-85 as well, and the data indicate that a significant differencedoes exist between this batch and the two other sets of data.
Another statistical test, the likelihood ratio statistic, shows that thethree sets do not come from populations with the same cumulative nor-mal response function. This test states that -Z in% follows the chli-square distribution approximately, where
Ink = In L0 -inLI -lnL -inL3 (6)
L 0 is the maximized sample likelihood of the combined set of datz_.and Li, L2, and L 3 are the maximized sample likalihoods for the indi-viduýt. sets. In this case, the chi-square distributiob ha-three der~rees of
freedom. Substituting in Equatiof the in-likelihoods ninTable 5, If
in>%. -20. 12 (7}

I 2 0977-al (04)QP
3,3 0 ~N a,
-o 0 CD
~O 00 0a0 0 a CD
00u
0
C0 0 c
0 0d 14; 0 4
14 Q4 C)
0 4 M
V4 N
00
V))
44
4J1
00 0r 04w - 0 0 0 0
0 ~ m N 0V 0 '

0977-01 (04)QPPage 23
10
15
"" t~~UM4BE OF 101
20 _ jZ4 2.5 2.6 2.7 2.q
DIAMETER (IH.,
Figure 6. Combined Results SOPHY I and SOPHY I
9. 27 RDX Adulterated Solid Cylindrical Samnplcs.

0977 - 01 (04)QPPage 24
0.15
SOPHYI
SOPHY It DATA
/DoOwr ADATA 5
8-
: 1 SOPHY IIW §IATAC
BATCH 86
0.r05 r
0.02.50 2.60 2.70. 2.80
MEAN CRITICAL DIAMETER, ft. IN.
Figure 7. 95% Joint Confidence Ellipses
for p and o-.

0977-01(04)0P
VPage, 2 5
Therefore, X2 40.24. The probability of observing this value
with three degrees of freedom is less than 0. 0001. It nup bt inferred
by this test that the samples do corelfrorn different populations.
The within-batch standard deviations for Batches 4EH-85 and -86 areidentical (Table 5). The standard deviation from the SOPHY I data ri-n-cludes batch-to-batch variation as well as within-batch variation, sinceit is a pooled set of data from three batches. Similarly, when all theAAB-3189 data are pooled, giving a mean critical diameter of 2.66 in.,the standard deriation (0. 08 in. } contains both the wihin-batch and the,batch-to-batch variations. Subtracting the within-batch variance(0, 0016-in. squared) from the total variance (0.9064-in. squared), thebatch-to-batch standird deviation is estimated to be 0. 07 in.
I mnall these cM•culations, the standard deviation resulting from the. n'm "remeA rors and dimensional nonuniformity is one order ofrna i itude less than those calc trOm GO data. Theelfft of these human errors is the'fore trivial.
S' . 2 Mean Critical Diameter aid Variance, ,
3.2. 2.1 Test Objectives
Th~prime O ives are to obtain sufficient dad to provide (1) anaccL te eof the mean critical diameter±'and (2) a reasonablyEo fstima e the ariance. The first obj ective must be achievedbeca •se this composition will be used, later in, :ha•-e•2 tests to verifythe' &itical-geometry theory. The critic l-diameter value at th'RD eight percent will be useful in the further dei:opnent6f thethe ,tical model of detonation. The:second objective is required forthe Verification-tests design. It will provide a prelin•inary basis forestimating the effect of sample siz. on the variance, of 'critical-diameterdata.
3. 2. 2. z Test Setup and Instrumentation
The setup and instrumentation for these-tests ate identicak to that -inSubtask 3. Z. I except that the 'witness plate Is a iZ1-in. by 1 2-in. by3/8-in. thick plate. The larger plate~is required because the ear:! s---have twice the diamneter of the -AAB-3189 samples. The materialuInder this subtask is AAB-3225, which is an AP-PBAN forrnulati•oadultfrate'd with 7. 1 vReipb• % RDX.

0977- (04 )QPPage 26
.3. 2, 3 Test Results
S-•h ba es of AAB-3225 have been cast for this subtask. Results"-fromhe. o previous batches, 4EHI-44 and 4EH-84, have been re-
or e in previous quarterly reports (References 3 and 1, respectively).
Batch JH-l07 was cast to provide additional information on the appar-ently lrge batch-to-batch variation in the mean critical diameter ofthisrniaterial. The test design for this third batch was identical to thatfor batch 4EH-84 (Reference 1).
The results of the tests are shown, in Table 6. The need to cover a"Urge range of diameters in this test design precluded the casting ofv•nore than two samples at any of these sizes because of their weightý'and the 2000-lb limit on batch size. The test results are composed of,nine GO-NO GO data points. Testing at the larger sizes (greater than• $X75 in.,) serves no purpose once the critical region is establis'ied toe.at 5. 25 in.
4. -2.4 Data Analysis
t3. 2.2.4. 1 Calculation of ýj and a-
,.Mixed results occurred only at the 5. 25-in. -diameter. For results ofthis type, the maximum likelihood estimate of the mean is given by thetest level al which the mixed results occur, 5. 25 in. ; the-maximumlikelihood estimate of the standard deviation must be zero. The latterestimate is difficult to accept. One estimate that appears to be morerealistic is that obtained by combining estimates derived from two otherestimation techniques, i. e., the minimum overlapping subset method andthe two subset method' (Reference 4). Applying these techniques to
the data yields an estimate of the standard deviation of 0. 07 in.
3. 2.2.4. 2 Comparison with Previous Data
Sum •• sta.+istid from all three batches of 7. 1% RDX adulteratedsol;d cylindrical samples arc showvn in Table 7. it is obvious that the*,esul s obtained from Batches 4EH-44 and -107 agree quiic closelyand that they disagree strongly --ith the rI.t lobtane from a
_4 EH- 84.

097 7 01i(04'i)P
Ta-ble 6, Trest'lesuiato, Subtasic 3. 2.?Z (Batch irm-x o7).
Average Std ,DevMean Detonation o
Ma Diaetcr Rf'sult Velocity VlctoflentLi ruNo
5. 24 No-Go 3,2
5.5GO 4,B 0095 3
5.49 0O C.17 A 072 34.45.49 Go 4.,
5 74 GO 4.23 0
5,75 Go 4.17 0. 163 3- 2- 2-.-4.
5.99 Ca4,26 0.IZ4,

Int
0 rcb
41 14 CD ) )
C -4UIn
u 4
* 4J
EL t1I 4 0
In(Vm~L4 S
MI

0977-01(04)QPPage 29
"• A statistical test of the hypothesis that the data from Batches 4EH-44and -107 come from populations with identical cumulative normal res-ponse functions can be made using the likelihood-ratio criterion des-cribed in Paragraph 3. Z. 1.4. For these data, the in-likelihood ratiois calculated as
lnX 1-0. 13 + 8. 15 + 1.39 (8a)
-- 0.59 (Sb)
7 Therefore,
X = 1.18 (9)
The probability of observing a chi-square value of this size with twodegrees of freedom is approximately 0. 55. Hence, it is concluded thatboth sample batches come from populations with the same cumulativenormal response function.
An exact statistical comparison of all three batches is somewhat diffi-cult since it was impossible to calculate a likelihood for the Batch4EH-84 sarm'ples. However, the fact that the mean of this batch differ,significantly from the means of the other two batches is obvious; thebatch means differ by more than I in. with a within-batch standard de i-ation of 0. 07 in. It is statistically hard to believe that this large of avariation in batch means could be attributable to normal batch-to-bat Ah
]t variation. In fact, applying the Dixon-Mood criteria for extreme me',-nsto this data (Reference 5) it can be shown at the 0. 05 significance Icelthat the Batch 4EH-84 mean is a statistical outlier with respect to theotherftwo means.
4 Since the large difference in mean critical diameter exists betwee-7•Batclt4EH-84 and the other two batches, some explanation is rec-ired.To this date, all efforis at identifyin ' chemical or physical dliffcrencehave been unsuccessful. The compos itions of the three batches, asjudgeil from the preparation data, are identical. Furthermore, Batch4E--44 was bayonet cast, while the other two were vacuum cas7.. X-rayreports show that only Batch 4EH-44 sanmples contained large a-..ountsof pores visible by this technique, yet microscopic examrinatic- of sam-ples from this batch could not detect porosity in the 12 to 10C-;,1 diameterpore-size region. Density measurements on sections frorix.. s.:-7Aplesremaining from all three batches are being performed to dis-'.-verwhether there is a correlative difference in sample density 7 :tAveen thebatches.,
N,

0977-01.(04)QPf Page 30
3. 2. 3 Detonation Velocity as a Function of Size
3.2.3. 1 Test Objective
In developing the Aerojet detonation model (Reference Z), a modifiedJones detonation model was used. The purpose of this subtask is to
determine the validity of the Jones-type model to composite adulteratedpropellant and to determine further the perturbations to the model that
may be required when investigating a noncylindrically shaped sample.In this case, the square cross-section column was chosen to test themodel's applicahility.
3. Z. 3. 2 Test Setup and Instrumentation
The setup is similar to that used in Subtasks 3. 2. 1 and 3. 2.2. Thethree exceptions which hold in the tests under discussion here are(1) no witness plate is employed since all samples are supercritical,(Zythe probes are distributedto instrument the lower half of the sam-
ple since the object of the test is to determine the average detonationvelocity, and (3) one or two conductance probes are used to obtain data'that may provide a means of measuring the reaction-zone thickness.
Deicription of the conductance probe method has been given in a pre-vious report (Reference 3). The propellant formulation is AAB-3189.
3. 2.43. 3 Test Results 9The results of the detonation-velocity measurements in the cylindricaland souare-column shapes are shown in Table 8. The conductance-probemeasurements are shown in Table 9. The average detonation velocity
and conductance-zone 1-ngth for each size is presented in Table 10.

0U
'V.'al)lo 1,. Avc.vatg ct uuh itr vo VDeut c" for on ipvrlcritical
A. Solidi M1i-.1 a:', (Ty.irzr
Av eera gv Std. Dev.SiZ0 Velocity of V elocityS(in.) ra/_c•c) {rrm/bs ecC) Test N'o.
12 (dia) 4. 7' 0. 180 3.2.3. 14, 77 0. 100 3.2.3,24. 77 0. 083 3.2. 3.3.
8 4. 70 0. 065 3.2. 3.44. 71. 0. 035 3, 2. 3, 54C 71 U. 08l 3.2, 3.64.7U 0.110 3. 2.3, 74. 67 0. 160 3, 2. 3. 84. 72 0, 02.9 3. 7. 3. 104. 69 0. 012 3.2.3. 11
6 4. 62 0. 096 3. 2. 3.234.68 0. 140 3.2.3.284.52 0. 085 3.2.3. 37
4 (dia) 4.46 0. 086 3.2. 3. 254. 48 0. 051 3. 2. 3.314. 54 0. 100 3. 2. 3. 35
B. Solid Square Columns
6, 0 (side) 4. 62 0. 057 3. 2. 3.274.64 0.049 3.2.3.224. 64 0 19'7 3.2.3.38
4. 4. 63 0. 10 3,2. 3.214. 55 0. 077 3.2,3.264.54 0. 001 3.2.3.364.56 3.2.3, 30
3. 5 4. i3 0, 091 3. 2.3. 194.,45 0 046 3.2. 3.24
4.45 0, 121 3.2.3.294.44 O. 035 3.2.3.34
3. 0 ("Ide) 4.39 0. 029 3.2., 3. 154.44 0. 085 3.2.3. 164.47 0,), 44 3,2.3. 174, 36 0.08Z 322.3. 18

F(01977-01 (M4)OP
Table 9. L o .POh i. ~ 4 *.i+ .. I ~i
Detonation Pulse C onductanc c -Z oneTest No. Size Velocity Width Thickness3. . 3- (in.) (mrnlpc) (pseu) (in.
I 2 (dia) 4. 74 No data No data2 2 12 4. 77 No data No data3 12 4. 77 56 10.5
f 4 8 4. 70 33 6. 1' '5 8 4. 71 37 6. 8
6 8 4. 71 37 6,87 4. 70 50 9.28 8 4.67 30 5,69 8 No data 34 No data.
10 8 4, 72 3 8 7. 011 8 4.69 50 9,223 6 4.62 40 7.328 6 4.68 42 7.233 6 No data 40 No data37 6 4. 5Z 40 7. 320 4 No data 40 7, 125 4 4.46 34 6. 031 4 4.48 32 5. 635 4 (dLa) 4.54 32 5.6
Square Columns
ZZ 6 (side) 4. 64 35 6.427 6 4. 6Z 33 6.o38 6 4.65 ITot clear No dataZI 4.5 4-,63 30 5.426 4. 5 4. 55 33 5.930 4. 5 No data 30 No data36 4.. 4.54 32 5.819 3. 5 4.53 2 3,9Z4 3. 5 4.45 30 S. 3j9 3. 5 4 45 Not, cluar No data'14 3, • 4.44 3 P 5.315 ,• 4 39 14 2i41 16 3 4.44- 1.3 , 317 3 4.47 ZZ .3, 818 3 (side) 4. 36 22 3. 8
I

g': g:091T/ -0I(011)1 Ž1
Ii
Table 10. Average Detonation Velocity andConductance -Zone Length.
Average AverageDerýionation Conductance -Zone
Size Velocity Length
(in.)
12 (dia) 1. 76 10.5*
8 4.70 7.0
6 4.61 7.2
4 (dia) 4.49 6. 1
6 (side) 4,64 6. 2
4.5 4.57 5,6
3.5 4.47 4, 8
3 (side) 4.42 3. 1
*Thbis is the resutlt of one test and should be so weighted.
ALt

S977,01 (04)(.12
Pag.e 34
3.2.3.4 Data Anailysis
3 3. Z. 3. 4. 1 Correlation of Detonation Velocity and Size
The refined detonation model presented in Reference 2, Equation 18,states that
k I Rd 1/3d = ?i /-11 (10)
B [I - (D/D.)I 1
where
d = charge diameter
D 2 detonation velocity
dRDX = average RDX particle diameter
c equivalent weight fraction RDX to accountfor othr hot-spot initiation sites
f = weight fraction RDX
B '- Arrhenius rate expression for the linear
pyrolysis kinetics of anirioniun pirclilo-rate (AP)
" D, ideal detonation velocityI
k, GC constants
1B can be expressed as a function of T,, the surface teiperature of theregressing AP particles,
IB 0.000-l I exp (-Z1, 500/RT ) (Ii)
and T can bt! exprtriiued as follows:
"rT 1824, i8. 4 D .- 0. 137 p (I)
, where p is thlc AP bulk density in the charge.
I
I

' ~~0 97Y 0. 01 (04)Q V••
Page 3'5
i1;quation 10 1an be reduced, therefore, to an expression for d as a fusie- UStion of one ptraineter, the detonation velocity D. A computer programZ LtLwIx wl!tten 6ihit wJil use the detonation-velocity data and calculatecorresponding diameter data.. Correlation of the calculated diameters(d(aI) and the experimentally measured diameters (d 5,p) will be printedout, for visual interpretation, as a dcalc vs dexp plot, with a straightline through the origin of slope equal to one for refei-ence. Other pl,,tsthat will be printed include (1) a D vs dcaic curve with the (D,dexp)points plotted and (2) a g(f) vs dealt curve with tht .,f), dexp) pointsplotted. The g(f) function (Reference 2, Equation 4:6) i3 given by
Dg(f) (* 3)
33 [1-nD/D I/Z
Correlation of the experimental data with that calculated will justify theuse of the modified Jones detonation model in the SOPHY programn.These calculations will be made for both shapes tested.
The velocity data presented in Table 8, when plotted against a reduced
T diameter (d/dc) or reduced square-side dimnenuion (s/ere), gives an inter- Jesting correlation between the two shapes (Figur, 8). By normalizingthe data in this i-nanner, one curve can be' generated, which fits bothsets of data.
The theory of critical geuzkAetry states that for a given material thereis a critical geonmetry that is the same for all shapes. The criticalgeometry is defined by
Where
o- is the critical geometryc
A is the c.ross-sectional area
P is the total perineter
and fhe subscript c refers to the critical size.
II

09 7~/, 0 1(04 )Q [7
11a ge 16
A-Cl
U WJIu
A .~1w
P 00-4CI
-- ---____ ---------- - ~ Q
VpCod
Ln
- I)
I '@~ 7/-' 'A1LI:3U1lJ/ NOLLYNUiI~J

0977- 01 (04)QPPage 37
I1' The theory also states that oc cd., the critical diameter, However, the 3VI implication from SOPHY I tests iq that ac is n-e. rly rnnt_. P.Nv ric
of noncircular-cylindrical shapes, but it is smaller than dc by 6 to 8%.Therefore, the appropriate means of obtaining normnalized-size datafor a given shape would be to divide 4A/P by arc. For the special, case,the solid circular cylinder, the normalized diameter should be obtainedby dividing 4A/P by dc. For the circle and the square, 4A/P equals dand arespectively. Therefore, in Figure 8, the abscissa isld/dc and
3. 2. 3.4. 1 Conductive-Zone Lengths
A study of the conductance probe and its use in determining reaction-zone thickness made obvious the need for more intensive theoreticalanalysis of the conditions most likely to exist in, the high-conductingregion found in detonating propellant.
The bulk of investigations into the use of conductance probes for reaction-zone measurement have been concerned with high explosive&(Reference 6). In high explosives the reaction-zone thickness, which isthe distance from the detonation front to the C-J surface', is Very sinallc.compared to the distance from the detonation frol,. to the axial inter-section of the rarefaction regions. Since high explosives ; n, generallyeither composed of one homogeneous compound or two highly reactivespecies, their reaction tLies are very short.
Little continuing reaction should be expected behind the, C-J surLace;subsequently, there should be a rapid decrease in the coniductLvitylevel behind this surface. Under theme conditions conductivity probesshould faithfully map the reaction zone.
In the ca te of cuirpoite propellants, however, reaction times are niuchlonger and m~any side reactions occur. It is difficult to believe that theC-J sutface, in a propellant detonation, would include before 'it the re,-gion inwhich all these reactions reached completion. Instead, thehighly ionized region in which these reactiuns are progressing may quitelogically extend behind the G-J surface. Conductance probe measure-.ments mnade in composite propellant sawpl.es may be recording a region,of greater thickness than the defined reaction zone. This possibility hasoccasioned the substitution of conductance-zone length for reaction-zoaelength in describing the experimental data generated by the conductanceprobe:,. Further study of the probleii is in progress.

09717-0 1,(04.)Q.0
Page 38
IiLI ........- . .4 Jeting Phenom eLn Study
""3. 2.4. 1 Test Object' ve
Cr~ilcal'-geometrystout on hollow-core icylindersa using end-on booster
initiation techniques modified fqr thistype of acceptor shape, revealedthat a& new phenomenon was occurring (Reference 2). Xn brief, .sustaineddetonation'was Observed to degenerate into a fading detonaticniwhen
I samples Were tested that had web thicknesses larger thaan the predictedcritical thickness, Web thickne'ss doscribes the distance from the inner
1surface to the outer, surface of a hollow,,core sample. The length ofthe charge over which the detonation was sustained iticreased whenthicrker webs were tested. Eventually a sample was teated that hadc,,fl nouagh material in its web to permit the suwtained detonation to con-tinue to the bottom end of the .arne.
It was proposed that the reason for the unusual behavior of the hollow
charges was the unavoidable forn rtion oia jet withinthe core, for mna-tion was unavoidable because of the requirement that no confipernentbe applied to the samp es being tested.
The object of this subtask is to study detonation in hollow core sarmpleswith appropriate instrunentatiorl to provide data from which the Jettingphenomenon and its effect on the detonation behavior can be better-understood. Specificaly, the effect of core diameter on the propellantreaction in samples haVing identical web thicknesses will be studied.
Also to be studied is the question of whether any small-diameter+corehollow cylinder can be considered uparuritical iui the classical sense,i. e., is it possible for therq to be a finite web thickness for such aosample which will austtain detonation over an infinite length when,, au-ficiently initiated? The pertinence of this question results because in thecritical-geomnetry tests scheduled .or SOPIY I1,' ininer, dia•netors, ofthe hollow-cote cylinders will be, . 5 and 3 i:.. If such a size *#4nplecan be expected to torrn a jet that does cause the longitudinally-dirccteddetonation wave to attenuate at sonr@ point, dependent on the web thick-nesa, it is clear that their will be no reil critical geometry because
Sno supercritikal region Oxiits.
,,

0977-0l(04)QPPage 39
31Z. Setup and Instrumentation
The hollow-core sample will stand on a suitable size witness plate andbe initiated at the top by a solid, conical, high-explosive booster, ex-cept for the exceptionally large ID samples, which will be initiated bya spec-ially-designed annular-shape booster. To prevent jet formationby the booster, either a Plixiglas plate will be placed betw.veen thebooster and the acceptor charge or,,a plug will be i~nserted or cast intothe ID at the initiated end of the acceptor.
Ionization probes will be inserted i~to the propellant sample perpen-dicular to the axis of the charge. One column of probes will have theirtips aligned to coincide wi1ih Ihe axis, the second column will be in-Aerted a distance equal to 2/3 of the web thickness, and the third column.vwill be inserted to a distance equal to 1/3 of the web thickness. Eachcolumn will be monitored by a different rasteroscilloscope and a com -mon time reference will be. furnished by a pulse delivered simultaneouslyto each scope soon after tlb2 scopes are triggered to sweep. In this waydata will be accumulated t.' a', will permit a mapping of the detonationwave and jet positions at variou- times. The effect of the jet on theshape and olientation of the detonation wave will then be revealed.
3. 2.4.3 Current Status
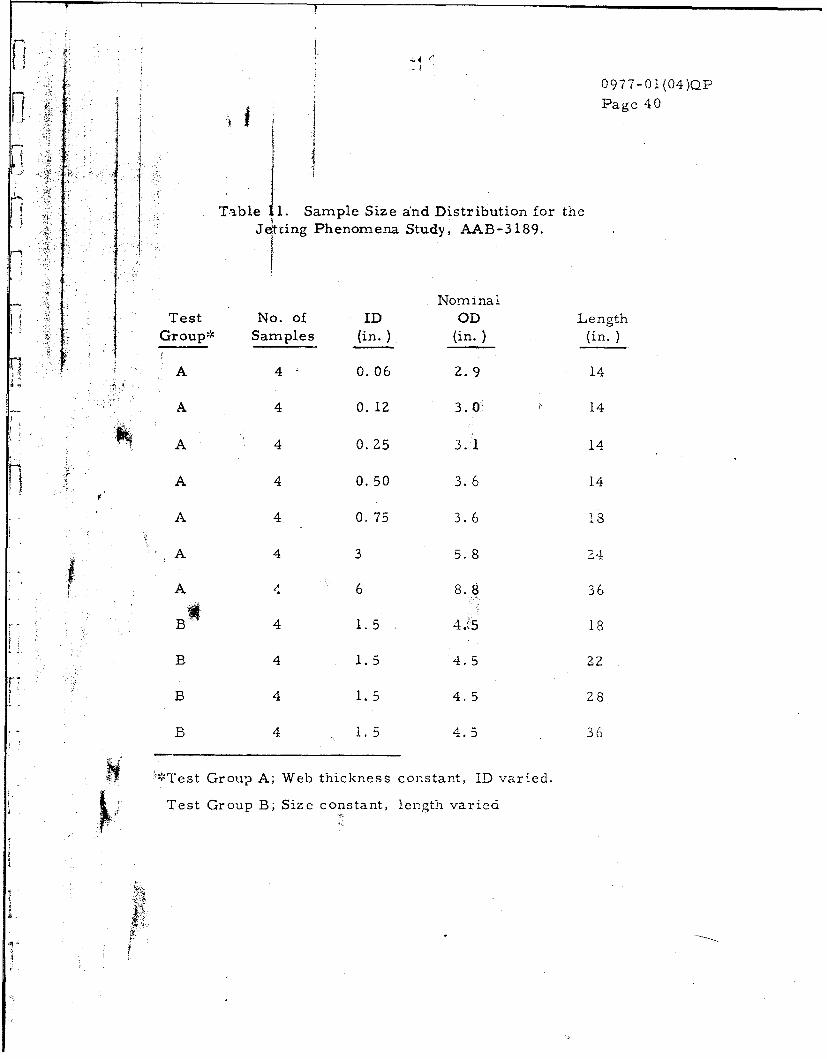
The samples have been cast and will be tested in September. Table 11
shows the dimensions of the samples and the number of samples ateach size that hdve been c;,s . The propellant formulation is AAB-3189.The critical-geometry theory, which does not account for interactionssuch as have been seen to exist in samples of this shape, predicts acritical web thickness of 1.25 ia. (1/z a-
c
3. 3 THEORY OF CRITICAL GEOMETRY (PHASE Z)
3.3.V Detonation oTcioc:-` is Function of Size
This subtfsk is designed to be an extension of the study in Subtask 3. Z. 3,to be initiated if the results from Subtask 3.2. 3 indicate that samole,zornmetrv affects the relationshp between size and the detonrtion velocity
S~4,c."
0977 -01 (04)QP
[7 :Page 40
"�IT-ble 1. Sample Size and Distribution for theJ cting Phenomena Study, AAB-3189.
NominalTest No. of ID OD Length
Group* Samples (in.) (in.) (in.)
A 4 0.06 2.9 14
A 4 0. 12 3. O0 14
SA 4 0. Z5 3.1 14
A 4 0.50 3.6 14
A 4 0.75 3.6 18
A 4 3 5.8 24
A 4 6 8.8 36
B• 4 1. 5 4.'5 18
B 4 1.5 4.5 22
B 4 1.5 4.5 28
B 4 1.5 4.5 36
" " 'Test Group A; Web thickness constant, ID varied.
Test Group B; Size constant, length varied
JU

SQ097?7-0(04)QP
Page 41
and reactio}-zone thickness. In order to fill the propellant hatch from-
which samples for the triangular critical-geometry and the jettingphenomenon, subtasks were cast, several supercritical triangular sam-ples were cast so that they would be available for use under this sub-task.ý These samples will be tested in September.
All the molds for the remainder of the samples intended for this sub-task have been iabricated, so that as soon as the results from Subtask3. 2. 3 are analyzed, it will be.possible to initiate plans to cast them ifneeded. The other shapes include circular-core and cross-shaped-core hollow cylinders, with two different perforation sizes for eachshape. The propellant formulation is AAB-3189.
3.3.2 Critical Geometry
3.3.2. 1 Test Description
The purpose of these tests is to evaluate the critical-geometry model,-c = (4A/P)C, for several shapes. It is a more intensive ftudy thanthat performed under Contract AF04(611)9945, to provide better esti-mates of the mean critical geometry fore ach shape. The solid sampleswill be of two cross-sectional shapes: the equilateral triangle and therectangle. The hollow-core circular-cylindrical samples will becircular-core and cross-core shapes, with each shape tested in twodifferent size perforations. The sample formulation is A-A.B-3189.
The standard critical-geometry test setup will be emplo-ed, usingboosters of cross -section matching that of the solid shapes, i. e. , tri-angular and rectangular cross-sections; for the hollow-core sarnp es,the booster arrangement will be similar to that employed in Subtask3.2.4. The criterion for detonation in the solid shapes will be taeobservance of a sustained detonation velocity over the lower half ofthe sanmple. The interpretation of the hollow-core sample data .il!depend on the results of the jetting phenomena study in S'b,:a- 3. 2.4.

0977-01(04)QPPage 42
3.3 12. Progress
All molds for this subtask have been fabricated and propellant castingoperations have be'gun. Several 2000-lb batches are required to pre-pare:these samples. Each batch will contain eight solid-cylindricalSsamples, in sizes near the mean critical diameter, to provide an esti-mate of the mean critical diameter of the batch. The numbers anddimensions of the samples being prepared for this series are given inTable 12.
Since thercritical-geometry theory states that the critical side of anequilateral triangular column, bc is " l
b= -[ (14)c
-selection of 0. 10-in. increments in b will permit the calculation of octo within 0. 06 in. maximum.
In determining the critical geometry of a rectangular cross-sectionshape, the technical approach this year will differ from that adoptedunder Contract AF04(611)9945. In the previous program (Reference 2)the various samples all were cast having the same width and length butdifferent thicknesses. The object was to determine the critical thick-ness for the width being tested. Using the critical-geometry theoryunder this set of test conditions, the predicted critical thickness tcwould be given by
(+lt = o-~ (15)c zx c
where x is the ratio of width to th..ckness (x > I for 'rectangle) and a-cis the critical geometr,° of the material. From Equation 15 it is clearthat tc is always less than -cr. When testing a series in which thevariable is smaller than Tc, the increments in which that variable (t)is taken must be sinilarly smaller than the increments in which G'cwas determined, to preserve the same accuracy in the two determina-tions and permit meaningful comparison between the tc (experimental)and the tc (predicted). Increments in critical-diameter tests this yearare approximately 1/16 in. A difficult situation would exist if therectangular cross-section samples were tested in the SOPHY i design,because increments :]elow 1/16 in. in thickness require dimensionaltolerances tighter than can be economically applied to the rectangularshapes.

077- 0 , (04}Q?
4 E:J -a. g e 4 3
Table 12. Critical-Geo•-- Sample Description, AAB-3>$9.
Equilatera Triangular Cross-Section
Side of Sarr1 eNo. of Triangle, b Length
Samples (in. ' (in.
5 4.05 205 4. 15 205 4.25 205 4.35 205 4.45 205 4. 55 z0
Rectangular Cross Section
Thickness of Width of HeiE•..... ofNo. of Slab, t Slab, w SIab
Samples (in.) (in.) (in.
30 1-3/4 12 2
Circular-Core Circular U;ylirker
No. of ID OD Sample _ngthSamples (in.) (in.) (in.)
"5 1.5 3. 62 205 1.5 3 75 Z05 -.5 3 .8 1&
° i5 1 .- 4.00•0S5 1.5 4. 1 05 1 5 4.25 20
3. 0 5125 3.0 5.23 3S
5 3.0 5.624
3.0 5. 75 "

W,'1 Will ()f~
Nu. of 01) 3A ID 1),ength
5 1 5 3 62 zO
s 7.U' .(1,) 20
1, 5 4, 12 2I . '1 5 4 2 Z0
S3. 0 ', i1 245 3.0 5. 5 •,4
3 3. 0 5.3S8 245 3.0 5. 50 24
5 3. 0 5. 75 24
'Shape, of cross-curt): JL. Each .ir,, cros, is quareO, SWUt UqUal. tO R .__]
4
I

Page 45
The test design adopted for gritical-geometry testing of the rectangularsamples will call for samples of constant thickness and length and variedwidths to find the critical width for the given thickness. The theoreticalprediction under these conditions is that
w (x +) (16)c 2x c
where wc is the critical width. From this equation it is clear that wc isalways greater than c" The sensitivity of the critical-geometry testsis improved by using width as the variable, because it allows greaterlatitude in selection of size increments without ieopardizing the com-parison with theoretical predictions.
Since w is the variable and x therefore is not constant it is necessary touse the following equation to determin. the theoretically predicted wc interms of t and
t o-
w c (17)c 2t - cT
c
In the hollow-core samples, the increments in OD are 1/8 in., which.means that the increments in the web thickness will be 1/16 in. By the
critical-geometry theory,
C
critical web - c (13)
so the inc ments are twice that used in testing for the criticall side of asouare column and the critical diameter of a solid cylinder. S Iallr
ncrements in the web thickness are beyond practical consideratlon.To match the 1/16-in. increments use] in the soiud c ,ý•Knc... an,-!column tests would require l/16-in. increments in the OD 1f t> ½02 'Osamoles. Tube sizes are not available to meet sur,- rcz•i...
economically.

a• 0977-0l(04)QPPage 46
3. 3. 3 Verification of Theory
'The purpose of this subtask is to determine the validity of the critical-geometry theory by testing a material (AAB-3225) that has a criticaldiameter different from AAB-3189. Progress in this subtask nmust follow!the satisfactory completion of Subtask 3.2.2, in which the critical dia-meter of AAB-3225 must be resolved, and it also awaits results fromthe critical-geometry tests to be performned in Subtask 3. 3. Z.
ý3.3.4 Initiation Pressure vs Pulse Width
The study of sensitivity to initiation of detonation custonmarily has con-sisted of Plexiglas card-gap tests. Data was acquired, under SOPHY 1,on the card-gap s2nsitivity of AAB-3189. it is 'of further interest toinvestigatl: the amount of sensitivity of this material when subj cttA toan impulse of longer duration than that in Plexiglas, to determinewhether the minimum shock pressure necessary to initiate a sample ofa given diameter is affected.
This subtask will consist of te-ts in which the sensitivity of a super-critical-dianeter sample of AAB-3189 will be tested either by the flying-
i.plate technique or by an underwater technique such as that described byLiddiard (Reference 7). The former method is being analyzed at this
*time to determine its applicability to this test requirement.
3. 3.5. Initiation Pressure vs Diameter
3. 3. 5. 1 Test Objective
The purpose of t study is to deternine the sensitivity of AAB-3225prciellant to init Ion of detonation by the conventional Plexiglas card-gap method. A parison with the sensitivity of AAB-3 189 will pro-vide qualitative " normation on the effect of RDX weight frac'-ion on sen-sitivity, to allow a crude first, estimate to be mnade of the &--Cnsilivity ofunadulterA ted propellant.

0977-01(04)QP/ Page 47
As part of this subtask, supporting tests will be conducted to determinethe shock wave-velocity attenuationhistory in the large diameters thatwill be used in the IIrd-gap tests.. The overall explosive weight of theboosters and acceptrs that will be involved in these tests preclude cam-era documentation `0: the attenuating shock wave in the card-gap testitself. Separate attenuation measurements will calibrate the card-gaptests by relating the shock velocity and distance traveled in Plexiglas.
To determine the shock pressure of the wave entering the propellant, theHugoniots of Plexiglas and AAB-3225 are required. The former isknown. The latter r'mist be determined experimentally. To do this, themethod described ir.~eference 2 will be used. This involves the shockloading of a column comprised alternately of Plexiglas discs (1/4-in.thick, l-in. diameter) and microtomed propellant Nafers (nominally0. 1-in. thick). Stre'k camera coverage of the backlighted event willprovide data on the shock velocity at each Plexiglas-propellant inter-face and the transit time through each propellant wafer. From thesedata it is possible to derive points on the propellant Hugoniot by theHug6nio-reflection method (Reference 2).
3. Y5. 2 Progress
Molds are being fabricated in diameters of 6, 7, 8, and 9 in. for samplesto be cast from AAB-3225 propellant. When these samples are cast(requiring two 2000-lb batches), additional samples will be cast fromthe same batches to determine the critical diameter of each batch.Thele control sarnples will provide more data that is necessary to Sub-task 3. 2. 2 in de6rmining the critical diameter of this formulation.
Propellant wafers will be microtorned from surplus AAB-32Z5 pro-pellant at Aerojet'Chino. Plexiglas discs with polished flats are being,finished, and the Hugoniot test series will be performed in September.
3. 3. 6 Sensitivilj of Unadulterated Propellant
3.3.6. 1 Test Objectives
Since it is clearly irnim .2ýtical to conduct card-gap tests on super-critical, unadulterated, composite-propeilant sa•i:ples, and it is equallydesirable that the sensitivity of this material be determined, a method

- (* 0977-01(04)QP
Page 48
to "estimate sensitivity by subcritical testing is required. In this su `-tadsk the objective is to evaluate the use of the axial resis%'ancc -probetechnique as a raeans to arrive at the minimum critical shock pressure,P*, required to initiate detonation ot adulterated propellant AAB-3189,and,if the technique does succeed, to determine P* for unadulteratedpropellant ANB-3226.
3 6.2 Background
3. 6. 2. 1 Probe Performance
"Th axial resistance probe has been used for somne time in the study ofde lagration-to-detonation in high explosives, (e. g., References 8, 9,anb 10). Theprobes consist of a nichrome wire and copper wire, eithercAt in the sample parallel to, and equidistant from, the axis or wrappedon6 about the other to form a coaxial probe. The probe is shorted by thehi~hly ionized medium immediately behind the shock front. As thedetonation wave moves down the sample the resistance of the probe is re-duLed in direct proportion to the reduction in the length of the probe lyingahead of the shock front. The resistance probe is in a constant-currentcitcuit, with the changing voltage being monitored on an oscilloscope.A's the'length of the probe ahead of the advancing wave diminishes, theresistance in the circuit diminishes, and since the current is held con-stint, the v age in the circuit drops. The oscilloscope trace recordsvoltage vs real time and, since the current "level is known, the resistancevs time data are easily computed. Since the probe is made t( 'knownresistance per unit length, it is a straight forward step to c.,- ,Iert todistance-time data. The axial resistance; probe thus suppli., a continuousrecord of the behavior of the detonationv~ve it the axis.
3. 3. 6. 2. Z Theoretical Basis for Application to Sub-critical Sensitivity Testing
There are three major assumptions involved in the theoretical justifica-tion for applying the axial resistance-probe technique to subr, ticalsensitivity tests. First, the material near the axis of a sub,':citical cylin-drical charge will not react differently from that in a supercritical or

0977-01(04)QPPage 49
ideal diameter charge until the effects of the incoming rarefaction reg-"ions are communicated to it. Experimental evidence obtained in SOPHY Iduring the testing of supercritical'samples initiated by boosters that haddiameters below the critical diameter of the acceptor (a nearly parallelexample) showed such to be the case (Reference 2). In a test that re-sulted in failure to initiate detonation because the booster was too small,the detonation wave attenuation profile in the acceo tor revealed thatalong the axis the wave was sustained at a constant velocity over the firstdiameter of the sample (4 in. ). Finally, of course, the wave began toattenuate. The important fact is that momentary sustainment did occur,and at a velocity equal to the detonation velocity in AAB-3189 propellant.
The second assumption is that in the card-gap testing of a very subcriticalsample, the small diameter will not reduce the time during which the velo-city is sustained along the axis to an immeasureably small value. In theexample cited above, the sample diameter was nearly 60% above dc andthe shockwave from the booster was not attenuated before reaching the
i prQpellant surface. Under these conditions; the sustainment lasted approxi-m nately 20 ýisec.
The third assumption is that P*, the mininium shock pressure requiredto initiate detonation in an infinite-diarmeter san'ple, is not significantlydifferent from the minimum shock pressure required to initiate chemicalreaction in the material.
If the second assumption holds, one wouid expect to find a shock pressureabove which the velocity stabilizes for a few microseconds and belowwhich the velocity continuously decreases. In this event,, determinationof this pressure would be by noting the lowest pressure that producesa linear portion in the output of the probe. This pressureý should be re-lated to, or equivalent to P*.
If the third assumption is true, below P' there may be insufficient ioniza-tion produced to electrically short the probe, and the niniurnum pressureat which any pulse was generated could be considered as an estimate ofp*'.

0977-01(04)QPPage 50
Sprecise probe reaction will not be evident without some ex-perirnental data, the first step that will be taken is to test samples ofAAB-3189, the formulation for which the initiation criterion was de-veloped in SOPHY I. Using an axial probe in each subcritical sample,
ý`,card-gap tests will be conducted at pressures above and below the P*estimated from the available data. The oscilloscope trace records will
.'be studied.-to determine if any change in the voltage curve is repeatedlyi'observefto occur at a specific and narrow pressure range. If a changeis observed, that pressure below which the change occurs will be com-,pare4d tolthe estimated P*. If the two values are comparable, the methodwill h*ave been considered proven, and small (< 12-in, diameter) sam-ples Of ANB-3226 will be tested to determine the minimum pressurebelow' w ich the same change is observed. That pressure will be con-side'ed to be a reasonably acceptable estimate of P* for ANB-3Z26.
3. 3.--" 4 Progress
The Lo'types of probe design that are candidates for use in this subtaskare the parallel-wire probe and the wrapped probe. The former con-sists of two copper wires and one nichrome wire placed near, and parallelto, the charge axis. The latter is made by wrapping the coated nichrornewireý spi'rally around a heavier copper wire. The sensitivity of the wrappedprobýe isladjustable by the number of turns per unit length, and it is cer-tainly greater than the sensitivity of the parallel-wire probe if the sameSsize'nicdrome wire is used in each design. Greater strength can be builtinto %a wrapped probe by using a larger diameter nichrome wire. A sen-
,,sitility ireater than that of a 40-gauge straight wire (2 ohm/cm) is easilyi.chicved with a 32-gauge wire wrapped around an I/8-in. diameter rod.
The attributes of both designs, including cost, accuracy, sensitivity, andstrength, are being evaluated at this time. Unless the wrapped probe istoo costly to be produced in the small quantity required for this series,,some samples will be cast with each probe for experimental evaluation.

0977-01(04)QP
"I I:Page 51
3 4 3 LARGE CRITICAL-DIAMEThR TESTS
1,3 Test Objective, Test CD-98
The Lrecr itical- diameter test program in SOPHY H was to experi-M ,n lly determine the detonation behavior of utnadulterated (ANB-3226)prop llant, using the SOPHY I detonation model to select the appropriatetest sample sizes. The SOPHY I1 test results are not intended to pro-v~de additional data ior the SOPHY I model, since the test c onfiigurz tion
is, njogra unconfined, single segment (Section 3. 4. Z).
'The occurrence of a sustained detonation in the 72-in. -diameter test(GD-96) made the choice of diameter for the CD-98 test fairly simple.In a previous test, an unconfined 48-in. -diameter sample containing0. 25 eight percent RDX adulterart failed to sustain detonation (Ref-eren e 2). Assuming that this RDX content would at least have the effecton'c itical diameter that confinement by 0.080 aluminum has, which doess.eet to be a safe assumption, it would be concluded that a 43-in. -diameter
S uhiad lterated sample confined by 0. 080 aluminum would fail to detonate.(the aluminum confinement is one requirement of the larger SOPHY IIt st to provide support for the mammoth grains. ) The 60 -in. -diameterc oS n for CD-98 is midWay between 48 in. (an frnplied NO-GO) and 72 in.(a v ified GO).
3.4. Test Setup, CD-98
'The st article consisted of a 60-in. -diameter by 2 4 0 -in. high, four-segment solid-cylindrical propellant acceptor weighing 43, Z0G lb, anda 60-in. base diameter by 180-in. high, stackea, conical TNT boosterthat weighed approximately 10, 700 lb.
The propellant sample was instrumented with T-2 targets, ionizationprobes, and ionization-mechanical probes to provide three. velocity-measuring systems, each of which covered the fll -ength of the sample,The progressive electrical shortings of the probes and 'r-.Z targetswere recorded on separate rasteroscillographs located in the controlbuilding.

0977-01 (04)QPPage 52
% rhe propellant sample was also fitted with an argon window, 6-in. wide,long the full length of the acceptor. A Beckman and Whitley streakamera recorded the event; the camera slit was lined up with the argon
I.ndow to ensure sufficient luminosity to obtain a distinct streak record.
"" In the fieldistler pressure transducers were mounted at gage stationsalong thettee instrumentation legs to a distance of 1500 ft (Figure 9).Peak overpressure and impulse data were recorded from these blasta- gaes.•
:-The prtle of obta, ining reducible radiometer data had been studiedthtduring ae weeks prior to this test; it was finally attributed to the fact
Sthat thel adometers were mounted in steel supported enclosures. Eva1 -ilation tests showed that the radiometers were very effective when theywere shock mounted in a simple wooden stand. This radionieter mountdesign isolates the detector from the severe high frequency vibrationalwaves, which can be transmitted to it by a steel structure. The excessivenoise ozI the records, such as those produced in the 72-in, diametertest, originated from the steel support.
Photographic coverage from the ground included (1) 16mm cameras,using color film, running at framing speeds of 64, 400, 1000, 4000,.and 8009 fps; (Z) a 35mrm camera running at 6 fps; and (3) an infraredsensitive film in a camera operating at 400 fps. Helicopter-borne cover-age: of the event was cancelled because the helicopter encountered sta-bility problems. Documentary coverage of e event, using a 6mrnm
-camera located 1-3/4 miles away from the st site, used color film runtat 50 fps.
•-A steel plate, 10 ft square by l/Z ft thick, was used as the witness plate.As in the 72-in. diameter test (Reference 11), a concrete box which,upporte he plate along its edges allowed an air gap beneath that por-
0 Mplate upon which the 60-in. ýdiameter sample rested.5in
3. 4.3 Test'Results, CD-98
3. 4. 3. 1 General Observations
SHi'h-speed cameras recorded, and eyewitnesses observed, that many*! ! bur.6ing propellant fragments were thrown off by the 6 0-in.-diameter
sample. The propellant fragments were thro0wn to a distance of 2500 ft,

0977-U I(04)QPPage 53
I-d
4bI-)
CL4
pf".. -V
ow
4-b"
'-4
0
3- I

0977-01(04)QPPage 54
and appeared to emanate from the lower third of the charge. The tra-
jectory of most of the fragments from a distance appeared to be nearlyhorizontal, a few large chunks were sent high in the air. Burnt pro-
pellant and burning brush were in evidence throughout the test area.
Large pieces of the aluminum restraint fixtures were recovered, some
as large as 4 ft by 1 ft. Their size was typical of that expected from a
nondetonation.
The witness plate was in position at ground zero, resting on a slightmound. The plate-was slightly dished, but bore no sign of indentation,and it was intact except for the loss of the lifting lugs that had beenwelded upright at the corners.
The detonation-velocity data obtained from three sets of probes, eachdifferent, and from the streak camera record, are shown in Figure 10.The rate of attenuation of the velocity is more gradual than has beenobserved in most NO-GO tests, but the data do agree with the expected
behavior of an attenuating wave near the hydrodynamic sound velocity.
This matter is discussed further in Section 3.4.4.
Peak overpressures from the 60-in. test are shown against a series ofKingery TNT curves in Figure 11. These overpressure data are ten-tative, awaiting calibration of the blast instrumentation. For compari-sonthe 7 Z-in. diameter peak overpressure data are shown in Figure 1Z.
The two sets of data are also presented in Table 13.
The radiometer data, measuring the thermal flux at 400 ft and 500 ftranges reduced to a maximum flux of 3. 5 w/cm2 at the rear stationand 2. 5 w/cm2 at the far station. These fluxes represent the levelincident on the radiometers at the distances and are not meant to be
estimations of the radiation flux at the fireball surface. Both radio-meters recorded the pulse duration to be 6. 5 sec.
3.4.4 Interpretation of SOPHY II Critical-Diameter Data
3.4.4. 1 SOPHY I Criteria
Tn the SOPHY I critical diameter program (Reference 2) the nature of
the detonation velocity-distance curves obtained from pin-probe andstreak-camera data and the effects of the steady-state or fading deto-•_nation waves on steel witness plates were used to classify the detonation

KV__ _ __
I.---.-~*----U' I
0 C)
I P4

CAITEO~L DIRMY]1 TOT 9somON xM L alu X 0 MJ N T~IN
F!WE±PWT WT (LB3i 4I2OOTNT BMW~EI WT CUMS 1.13700SI5TE arm Tht (our) LOS
* SITE 9W (1td OF HM 27,!N
wintwI 2 SCLaM* 0WTICU9WW. ED 9 0cKz
A t OcLint(94MMMM
Cf!tEO~ F"U -&- 2 OU=LK"EMAWf0 t~ x 0 a"V~LaCIZE3. *ito O"'A,([ b~ n
17
10 gewgG 0 10 0 o i pl IP14NNM ( VEET)
Figure 111. Peak 0Qverpi-essure Data from 60-in. Text.-

'~ ~ IZCRITIOIL OJFOfTOj TO5T 29
7,c iii fjijiX 2W ~IN tTLIMnOf
rWaVUJNT WT ILM5 7'WI
W~M 3T a(on 2 w d
IQ'.
RAGE UFCWE WTI)
Fiur 1. ea OcrrimorcDaa rm W -n. 'e

09 $7-01(04)QPPage 58
Table 13. Observed and Calculated Side-On Overpr :ssure and TNT:.Equivalences in the 7Z-in. and the 60-in. Critical Earneter Tests.
(IMPORTANT: The data presented in this table are preliminary. Their values are. 1bject to change pending further reduction and analysis.)
TNT Equivalence"ARad•!.l Peak Side-on Overpressuret From Measured From Calculatedblitarce Measured Calculated Overpressure Overpressure
fromi Radial (psi) (%) (_ _ _:
Charge Direction 72-in. 60--in. 72-in. 60-in. 72-in. 6 0-in. 7Z-in. 60-in.j , (o'clock) Test Test Test Test Test Test Test Test
140 z z5 -199
t IZ 0:•10 **' 126 - -:* 201 -
;42 2 54.0 31. 0 - 223 177-6 50.3 25.4 - - 208 129
10 * 24.2 -* 120
3** * 20.2 10.7 ** ** 193 1286 ** ** 19.9 10.4 ** 00 188 121
10 ** 19.6 10.4 * 0, 184 121
"$do 2 10.1 6. 12 155 124 - -
6 * 6.90 -, 157 - -10 ** 6.68 - * 147
:,6O ,2, ** 6.81 4. 11 136 1036 ** ** 6.71 3.98 *0 0* 131 95
10 6.35 4.24 128 110.700' 2 5.82 3.91 - - 177 160 - -
6 * 3.74 - - 1 145 - -10 5.51 3.79 - - 151 150 - -
i'000 2 2.98 2.09 - - 132 127 - -6 2.90 2.05 - - 126 121 - -
10 2.95 2.22 - - 130 149 -
00 2 1.45 0" 92 *0 : -6 1.72 1.09 - !45 91 .. -
10 1.57 *1 - - 15 *0 - -
t Measured overpressures are derived from Kistler transducer measurements. The calculatedoverpressures are calculated at midpoint distarcJ, between Kistler tr ,nsducer station- from
iwhlch1irne-of -arrival data are available. The calculations are performed using an equationd erived from the Rankine-Hugoniot equations:
where. p = peak overpressure on the shock fronty = ratio of specific heats for air
Po = test-site atmaopheric pressureUU velocity of shock front
co = sound velocity at teaZ site*No data, because of gauge failure.
**Nfside-on overpressure gauge placed at this location.

0977" I (04)QPPage 59
behavior of RDX-adulterated propellant samples as supercritical orsubcritical. Samples whose velocity-distance curve became essentiallyhorizontal after the initially overdriven wave had propagated about half-
way along the charge, and which either punched the witness plate or pro-duced definite metal flow, were considered supercritical. If the wavevelocity showed a nearly continuous decrease along the entire length of
sample, and if the witness plate was intact and either dished or undam-
aged, the sample was considered subcritical.
These criteria clearly distinguish between supercritical and subcritical
behavior in a material if the steady-state detonation velocity is (1) high
enough to transmit a sufficiently strong shockwave to the steel witnessplate to punch it or cause metal flow, and ýZ) is sufficiently above thehydrodynamic sound velocity so that the fading detonation wave in a sub-critical sample will not fade so slowly that its velocity-distance curveis undistinguishable from that of a supercritical sample. In the SOPHY I
tests, although the steady-state velocity at the critical diameter was.found to decrease with decreasing RDX content, the value for the sam-ples of lowest RDX content was high enough so that all of the critical dia-meter data could be interpreted in terms of the criteria as originallyformulated.
In the course of the SOPHY I program two phenomena were noted whichcorrelated perfectly with the velocity-distance and witness-plate criteria,and whi-h could serve as supplemental criteria for classifying detonationbehavior. First, it was noted that the witness plates from. GO reactionswith propellants of low RDX content were extensively broken up whilethose from NO-GO's were dished but intact. Second, examination ofthe documentary and Fastax films showed that in all of the tests thatwere classified as NO-GO's by the velocity-distance and witness-platecriteria, pieces of burning propellant were expelled laterally from thecharge. No burning propellant could be detected in the film records ofthe GO's.
3. 4. 4. Z Analysis of SOPHY II Test Results
The two SOPHY II large-critical-diameter test sizes (72-in. and 60-in.diameter) were chosen to give a GO and a NO-GO reaction with un-adulterated propellant, according to predictions of the model (Refer-ence 2). In terms of the supplemental criteria developed in the SOPHY I

0977-CI (04)QPPage 60
:program, the 72-in. diameter test was an unequivocable GO and the60-in. diameter test was an unequivocable NO-GO, i. e. , in the 7Z-in.
diameter test, no burning propellant could be detected in the documen-tary and Fastax film records, and the witness plate was extensivelyfractured; in the 60-in. diameter test, considerable burning propellantwas ejected from the charge and the witness plate was dished out un-broken. A cursory examination of the velocity-distance data showedthat the curves for the two tests were quite similar (Figures 10 and 13),confirming an earlier conjecture that at sufficiently low critical deto-nation velocities, there might be no apparent differences between sub-critical and supeicritical curves.
Because of the similarity between the D.vs x curves for the 7Z-in. and60-in. diamneter tests it has been necessary to examine them in greaterdetail in order to use them to classify the tests as supercritical or sub-critical. For this purpose, both curves have been compared with D vs x-data for a subcritical sample of an aluminized AP-PBAN propellantsample of similar composition (Reference 11) and with data for theattenuation of an unreactive shock in Plexiglas (Reference 12). Thedata for Plexiglas'are shown in Figure 14, where the observed velocityis plotted vs the reduced distance, x/d, that the shock wave has pro-gressed into the Plexiglas. (Although the data are for a 0. 5-in. Plexi-glas column, a previous, unpublished analysis indicates that the plotof shock strength vs x/d is nearly identical for Plexiglas columns withdiameters varying by a factor of 12. )
It is apparent from this plot that even in the case of a nonreactive shock,the rate of decay is so gradual at x/d = 4 that the curve appears essen-tially flat, ' although still appreciably above its hydrodynamic sound velo-city. Hadithe material been a propellant instead of Plexiglas, the originalD vs x criterion would have classified the behavior as supercritical.
In Figure 15 the data for the 72-in. and 60-in. diameter tests are com-pared with that for Ple;:iglas and the data for a subcritical (22-in. dia-meter) sample of aluminized AP-PBAN propellant. The velocity datafor the three propellant samples is expressed as the difference betweenthe observed velocity and the (estimated) hydrodynamic sound velocity(assumed to be the same as that previously determined for RDX-adulter-ated propellant containing 9. 2 weight percent RDX, i. e. , 1900 mm/4sec (Reference Z).

-4
0977-01(04)QPPage 61
SPRCTES (ION)10PRORES (SPLIT)
6
mi Y , ,,
4
-2 tI -
:•" ~DISTANCE ALONG CHAR01r (IN .HARGE DA.)
Figure 13. Detonation Velocity vs Distance Along Charge.

0977- 1of() I. d (
Page~ Q
ono
.11
6 00
rill".
too

Page 63
401~12,
0 0 I
zzzY
44IS
OU 70 4) 14MM 30 * LMA%

The comparison of Figure 15 indis-ates that the D vm ciirxr.ý fo"tI~
ou-in, 'arnmeter test closely follows the curve fuo: the subc. itical (22-
-he curve for the 7Z-in, test, however., is dis-
f tictlydiffrent It pprochesa steady-state velocity (-320Ornmi/jiec)I ~ which is considerably above that reached in the nonreactive curves at
the, sarne position~ (x/d = 4). The 60-in. test is therefore judged sub-critical and the 72-in, test supercritical, in agreement with the clear -p cut classification by the supplemental criteria.
This analysis clearly demonstrates that the approach of a detonationwave to an apparently steady-state value somewhat above the hydro-dyn~amic sound velocity is iiot adequate evidence of supercriticality whenthe critical velocity of the composition is near its bydrodynamnic soundveloc ity. In the present case, 'consideration of this data in conjunction
' 1.with 'the other evidence has permitted a clear distinction to be made.
*3.4. 5 Fireball Data, CD-96 and CD-918
The, 72-in, diameter test (CD-96) and the 60-in, diameter test (CD-98)were recorded by a number. of high-speed canmeras. The films wereread for fireball diameter and height. The data were finally plotted asfiret~aP growth, over t~he first 100 mnsec, and firekall size history, duringthe first 5' sec. Fireball diameter is taken to be the maximum horizon-tal dimension of the fireball fireball height is the maxir trnx vertical
dimension of the fireball, not the height; of the fireball above. ground.That is, when the fireball lifts off the ground, `ieight becomes, the verti-
T_ cal diameter of the fireball.
The fireball groiWth in CD-96 is shown in Figure 1,6. Only the fireballdiameter is graphed, because Al1 the cameras had the charge so high in[the frame that the top of the fireball was very quickly out of frame, which
* - prevents height measurement. Excellent, agreement 'is seen to have been
reached in thes filn-A taken at caxnera station~.4 F and G. Other records are[not reducible, either b~ecause of (I) poor focus, (2) to~o great'a range ofcameira speed'fromn the beginning of the event to the end, or (1) becausethe posts near the charge. which are used to obtain a distance -sealingII factor, were not detected in the ffilm.
r4
...............................

Pa gi- 6 s
FOI7FTT iIlp
Fa_~ .. .... ... ....
A-
IA
7I
; 7
-4-

ki9 7 7 - () 1, 0"1• )Q 1
:Page- 66
.Th f-- y 1.1 CD-56 is s1hown in x-igure IY. The short duratiofi
of the information is again a result of poor framing,
The CD-98 fireball growth, from the film taken at camera position Dis
shown in Figure 18. The "spikes" at the very start of the curves are
I the rneanurement of the initiaA flash size. The fireball bistory, plotted
"in Figure 19, shows the fireball had a total, duration time of 4. 25 sec, a
, maximnum diameter ot 410 it and a maximuni height of 345 ft.
3. 5 PROPELLANT DEFkCTS STUDY
S[3. 5. 1 Task Objective
In the interest of developing capability in producing controlled defects in,
compoSite propellant and deveioping methods by which the defects can be
anialyzed, the Research and Technology Operations of Aerojet t s
Sacramento Plant has begun a development study that haA the followingobjectives-
a, Attempt to synthesize uniformly-porous propellant havingaverage pore sizes of (1) 0. 1 - Imm diameter and (2) nearI 10I diameter.
b. Synthesize the material in (a) to 5 - 1070 and 20 - 301/6porosities,.
c. Prepare cracked g-ains havirl approximate surface area
per unit volume of 10 - 15 cm /cm 3 and 40 - 50 crn./ ck.
d. Developp techniques to characterize defective propellantmade in sections (a) -(s).
[ 3, .. 2 Pr-ogress
The major effort has been directed tv -the production arid characteriza-I tion of unconnected, pores in ANB-3226 propellant. Fourteen 10-lb. I
batches have been propared.
.

0977-oi(O. )QpPage 67?
WT 7T2411 ri[-t uriJ1-
111T
7.'ý

0977-O1(04)QPPage 68
*IT .
Ii-
I '!0
IOIj
~co

0977-Oi(04)oPPage 69
II
+44

"�"1 0977-01 (04)QP
Page 70
In twGcbatches, the binder ingredients, excluding diepoxide resin (DER),were preblended in beakers and subjected to 3 hr of gas entrai.nmnent bybubbling extra-dry nitrogen through the binder at a flow rate of 55. 5 ml/sec. One binder was held at 130 0°F and the other at 770°F during thenitrogen adsorption period. Both batches were mixed at 135 0 F withoutvacuum and vibrated for a short period to bring the air entrapped during-nixing to the surface.
Six 3 by 5 by 1-in. plastic containers were cast from each batch. Twocontainers from each batch were cured at each of three temperatures:110, 135, and 150 0 F. This was done to determine whether the adsorbednitrogen in the binder would be affected by the cure temperature. Asexpected, the propellant cured at 135 and 150aF cured to Shore "A" hard-ness values of 28 to 34 in I week. The samples cured at I10°F for 1 weekwere placed at 135°F for an additional I-week cure cycle. Samples fromthe four plastic containers cured at the higher temperatures were ex-an-iined microscopically; densities of these will be determined to establishthe total porosity.
,Preliminary microscopic examination indicates that pores of varying sizewithin the desired range (0. 1 to hmm diameter) were a-hi~eved and theirýdistribution was affected both by nitrogen adsorption in i inder andthe te-nperature of cure.
In the next six batches the binder ingredients (excluding the DER) were
Cowles dissolved at Z400 rpm under a nitrogen blanket to achieve corn-plete homogeneity of the binder. In order to remove the nitrogen worked
* into the binder by Cowles dissolving, the binder was degassed at ambienttemperature for 6 hr at Z9 in. of Hg vacuum. A study of the gas entrain--ment into a degassed binder was accomplished with standard laboratorygas flowrneters and heating mantles. The change in viscosity with tem-perature was measured with a Haake rotoviscorneter and is shown inFigure Z0. These data indicate that an appreciable change in viscosityoccurs between 80 and 140 0 F. This change in viscosity is useful in theproduction oi various size nitrogen bubbles in th'.s binder. At ambienttemperature (77 0 F) nitrogen bubbles of approximately imrn are pro-duced. The size distribution of these bubbles at this temperature is ina very narrow range. At 140 F the production of very small bubbles
* .takes place. A variation in the gas flow rate at ambient temperaturefrom 13. 5 ml/sec to 55 ml/sec produces a marked change in the numberof gas bubbles. At 55 ml/sec numerous bubbles are produced. How-ever, at 13. 5 ml/sec flow rate, a significantly-smaller number of bubblesis formed. This effect of difference resulting from gas flow is not pre-sent at 140 0 F.

Li
-~gc
2800 _ _ -_ _ --
2400 7
1200 M-- -
so 90 100 lie 130 160TWMERATURE, *F
Figure 21). The Effect of Tompo'rature an the Viscoaity of I
,\-26 idr
.. • D[I

0977-01 (04 )QPPage 72
The six batches of ANB-3Z26 propellant were made without vacuumaccoding to the following test plan:.
Binder Temperat'.ure Gas :P!ow RateBatch No. (OF) (rni/sec)
l140 25
z 77 Z5
.. .3 77 55
4 77 i
5A
6 140 10
'This test plan allowed test of variation in temperature of the binder with"the gas flow held constant and variation of the gas flow with the bindertemperature held constant. Three 3-in. by 5-in. by Z-in. plastic con-tainers were cast fron-m each batch and cured at 110, 135, and 150 0 F.
,These samples were trimmed. The density data with the test plan and"processing variables used are presented in Table 14. The first set
shown on the table indicated that the density of the propellant was sig''nificantly d4creased by maintaining a high submix temperature duringaeration. However, the second test set, in which flow rate was added
as a variable, showed that the only significant factor causing a changein the propellant density was the cure ternmerature; as the cure tempera-ture increases the propellant density becomes greater. Although these*significant effects were observed, the resulting void percentages arefar too low and the noted effects may disappear when processes are foundto produce higher void percentages.
The microscopic study of voids is being performed at two magnifications:(I) macrophotography of block sample, and (Z) microscopic examinationof n-iicrotorned thin sections at lZ5XL. From examination of photographsof Set 1, it was seen that the aeration at the highest temperature resultedin the smallest voids with the most uniform distribution. No differencein cureternperature could be seen. Fronm photographs of Set Z, .,he dif-ference in cure temperature was easily visible; the low temperature curesamples had more voids. The other processing differences, flow rates

- 0977-01i(D,4)Q?Pa~ge 7 3
U-) In C)
-44bfl
-44 -4
oo t
$4 ; DC) i nC
$4 fn' In ~ * -4*4 or) ,;_n *-4 r.- *L4 -. 4 .*..* 1-.4 .4 -n ,- .. 4
-4V4
-4 1.
0 o 101010

0977-01 (04)QPPage 74
and binder temperature, could not be seen from the photographs. Micro-scopically, the smallest voids in all the samples are the same and mea-•sure about 0. 10mnm diameter. The voids range to imm in size witha few in some cases up to 3mm.
Work is in progress to develop a method for the statistical evaluation ofthe void content of the samples from microscopic examination. A line-intercept method has been devised for this study which will permit evalu-ation of samples found to be homogeneous enough for counting of void
''distributions.
"Six additional batches of 10-lb batch size were prepared to study submixaerated with nitrogen during Cowles dissolving but not subsequently de-gassed and reaerated as with previous binders. (Subniix contains allbinder ingredients except DER, the diepoxide curing agent. ) Submixsufficient for the preparation of two batches was master batched andCowles dissolved under a nitrogen blanket. The density measurementswere made on the first and second cut of this subnlix for Batches I and 2."Since frothing does occur, the first cut is always less dense than thesecond. The density of the binder varies with the standing time afterZowles dissolving. Table 15 indicates the extent of this change. Thesedata indicate that in less than 4 hr the frothing or foaming has brokenand the density has increascd to a value that is stationary for at least24 hr. Although small gas bubbles can still be seen in the binder, theliquid density (within the limit of accuracy of this liquid density measure-ment) is close to that of the degassed binder. This shows that the Cowlesdissolving method of introducing gas bubbles will be highly time depen-dent. Also, the liquid density of the aerated binder is dependent uponthe piccedure for Cowles dissolving. However, a fairly precise liquiddensity may be achieved in. the aerated binder, and propellant batcheswere prepared with liquid densities from 0. 8406 to 0. 9260 grn/ml.
|7

0977-01(04)QPPage 75
Table 15. Effect of Standing Time on Density ofAerated ANB-3Z26 Binder.
Density LnmmediatelyAfter Cowles Density at Various Times
Sample Dissolving After Cowl es DissolvingNumber (gm /m) (hr)
4 8 19 24
1 0.8777 0.9255 0.9260
2 0. 8740 0.9298 0.9298
3 0..8784 0,9333 0.9333

0977-01 (04)QPPage 76
•IL addition to the study of Cowles dissolve aeration, it was thoughtthat mixing and casting techniques should be studied. The followingtest plan was used.
SBach Liquid Density
.Batch of Binder,Number (gmn/m1) Change in Mixing and Casting Technique
1 0. 8515 None; Icw density binder
2 0. 9260 None; high density binder
3 0. 8475 None; control for new submix
4 0. 9145* Same as No. 3 except Al is added withDER to submix to increase viscosity; de-crease foam
5 0. 8406 Same as No. 4 except a new submix andnew day of mixing is involved (Control)
6 0. 8556 Same as No. 5 except vacuu-n casting
*,Unable to achieve low density binder by Cowles dissolving becauseof too small an amount of subi-,ix left for this batch.
/1

0977-01(04)QP
Page 77
REFERENCES
1. Project SOPHY - Solid Propellant Hazards Program. TechnicalDocumentary Report AFRPL - TR - 66-25, Aerojet Report 0977-01(03)QP (28 june 1966).
2. Large Solid-Propellant Boosters Explosive Hazards Study Program(Project SOPHY), Technical Docmentary Report AFRPL-TR-65-211,Aerojet Report 0866-01(01)FP (24 November 1965).
3. Project SOPHY - Solidi Propellant Hazards Program, Technical Docu-nientary Report AFRPI,-TR-66-24, Aerojet Report 0977-01(02)QP(24 March 1966).
4. The Design and Analysis of Sensitivity Experiments, Rocketdyne Re-port R-615Z (May 1965).
5i' Dixon, W. J., "Analysis of Extreme Values, " Annals of MathematicalStatistics, Vol. 21, 488-506 (1950).
6. Cook, M. A., The Science of High Explosives. American ChemicalSociety Monograph Series, Reinhold Publishing Company, New York,N.Y., pp 144f (1958).
7... Liddiard, T. P., Jr., "The Initiation of Burning in High Explosivesby Shockwaves, " The Fourth Symposium on Detonation, Preprints,Vol. II C-109f (1965).
8. Gibson, F. C., M. L. Bowser, and C. M. Mason, "Method for theStudy of Deflagration to Detonation Transition, "Rev. Sci. Inst.-Vol. 30, No. 10, 916-919 (October 1959).
9. Jaffe, I., and D. Price, Progress Report on Adaption of Continous"Wire Method for Measuring Transient Phenomena, NOLTR-63-136.U.S. Naval Ordnance Laboratory, White Oak, Md. (7 June 1963).
-10. Price. D. , I. Jaffe, and J. P. Toscano, Development of the Con-tinuous Wire Method, Progress Repoit II, NOLTR 66-2 1, U.S.Naval Ordnance Laboratory, White Oak, Md. (17 Miazch 1966).

0977-01(04)QP
Page 78
REFERENCES (Continuej)'
41.2? fl-Inch Critical-Diameter ests of Minuteman Sta,~e g_.11_•_.
; Prbpellant. Aeroiet-General Corporation Final Report 0713-53-511,
COntract AF04(694)258, CCN Z8 (20 March 1964).
jZ. Analysis of Shock Attenuation for 0. 5- and Z. 0-in. Diameter Card-
Gap Sensitivity Tests, Aerojet-General Corporation Special Report
SRP 289 (20 January 196Z).

0977 - 0!4 .
DISTRIBUTION
AFRPL (RPMX) Aerospace CorporationEdwards, Calif. 93523 (10) P.O. Box 95085
Los Angeles, CaliforniaAFETR (MTDRD-4) Attn: Reports Acquisition Branch (1)Patrick AFB, Florida 3Z925Attn: Mr. G. Galfo (Z) NASA Headquart.rs
600 Independence Ave.AFETR (MTORS-3) Washington, D. C.PatrickAFB, Florida 32925 Attn: Mr. W. Cohen (1)Attn: Mr. L. J. Ullian (2)
Defense Supply AgencyNASA, Lewis Research Center Defense Contract Admin. ServicesChemical Propulsion Division 11099 South La Cienega Blvd.Cleveland, Ohio Los Angeles, California 900 t.Attn: Mr. J. J. Kramer (I) Attn: D. Baliain. ACO (i)
NASA-MSFC HeadquartersR#P & VE Air Force Flight Test CenterHuntsville, Alabama Air Force Systems CornmmandAttn: Mr. A. L. Wheeler (1) Edwards AFB, California
Attn: Mrs. A0.. PlacovicnArmed Services Explosive (FTMIR-4) (1)
Safety BoardRoom 2075, T-7 Bldg., Commander
Gravelly Pt Naval Ordnance Test StationWashington, D. C. 20315 China Lake, CaliforniaAttn: Technical Office (2) Attn: Mr. F. Weals 30.12 1)
NASA, Langley Research BSD (AFIAS-G2)Langley, Virginia Norton AFB, California 92400 (2)Attn: Mr. R. Swain (1)
USAF (AFRSTD)Rohm & Haas Chemical Co. Washington, D. C. 20546Redstone Arsenal Attn: Mr. J, Johnson .)Huntsville, AlabamaAttn: Dr. H. Shuey (1) AFSC (SCIZM.)
Andrews AFB, Wash. , D. "NASA/MSFC 20331R-P &VE - MCP Attn: Mr. H. Ackerman (I)Huntsville, AlabamaAttn: Dr. J. B. Gayle (1)

BL.ANK PAGE

UNCLASSIFIEDSecurity Classification
DOCUMENT CONTROL DATA - R&D(Security ctlasellcatIon of Iftle. body o! abstcr. t end Inderr. o,nnot-elan must be 01!0- `1n - , oi- , 0-n'2Ir w-'! 1,r
I OQIGINATIN G ACTIV1TY rComou. e* hor) IC, I OPT Y.' 'iTY C L A3ZIF:CA
Aerojet-General Corporation U • .'j:Ž;Downey, California •b . NIA
3. nEPONT TITLE
Project SOPHY - Solid Propellant Hazards ?roFrzxnn
4 DESCRIPTIVE NOTES (Type of report and Inclusive dates)
Progress Report, 1 June - 31 August 1966 4S5 AUTHOR(S) (Las name.. first no.o. Initial)
Elwell, B. B.Irwin, 0. R.Vail, R. W., Jr. ,,
.G. REPORT DATE 7Q~. TOTAL -4O. Or~ PA,.C- 7b. No. cý rmv
September 1966 13Ja. CONTRACT OR GRANT NO. go. OR!GINATOR'S! nrORT NUMUCI`S)
AF04(611)10919b. ReCT NO. 623A00201 0977- 0!(04)QP
C. 'b TNRRPO7rT NC0() (Any oeirC ,' 0 rnr' , on r
d. AFRPL-TR-66-2610. AVA ILABILITY/LIMITATION NOTICE$
Qualified requestors may obtain copies of this report from )DDC.
It SUPPL.EMENTARY NOTES 2i. SPONSnRING MiILITARFY ACTIVITY
AFRPL, Hazards Analysis Branch,AF Systems Command, Ed6-r,:rdI P,
13. ABSTRACT
The critical diameter of 9. 2/% RDX-adulterated AP-PBAN prcpeUlant
has been determined from the results of extensive testing.. The critics!dimension of a square cross-section column of the s.%m naterS!i 'Iefound to be 717o smaller than the critical diameter. D.t.a a beengather'ed from which an assessment of the p cabliv T .one-tpdetonation model to solid propellant wrill be made. Th1 crit.a!-diameter test of an unadulterated propellant (AN•B-32Z6) at 60-1n,
diameter resulted in failure to sustain detonation. Results of thiý'. trt
are presented. Progress is reported in the synthesas of prop'i.anthat contains uniform distribution of small unconnected porcý.
JAN D 4 1473 CTtC

securlW, C.AI$ a ifi cation14 tJINY A 7' -II ~ LN
KEY WORDS or Ia~jjO
PropIelant Aaza~rds& Critical Diameter
Crr IclGoer
so Y
sellittiandy
L'Rgropnumber! AC IVTY w Entapicbe , showae n tatdes inor~ byo~ -,c rit le sfciue tirtngan&*d-ae
neings hac ve oer used forganztou 3an d Gcrpoupte as uthor) sun (4) "Qu..rnlifiadrcy uctoces msy obtain copies of thi~sth *.d it. report diroml frmDDDthr uiii."sr
2a. REPORT T1 UIT L ASIFCTIN Enter thecmltrpotite in r all "hFllreign t throughrnn nctap uital tteta. r ities n of th caepot shoudibclat whthe eprlfiod. w-tauhr'7"fa ean.ingful Dta"is icluedMrkngitt be inetd ihu caccofic-
2b.idatl GROU wi: Au e tItl dongadn isseiidi i sr hl eusessalrqest throu gh
4.e g3Srout) V numrtEso whe appropicatle, snter theaty ofptional__________________reprtieg.. inteim pen rseogreGroupmary annualorp4a fnau. ~ fthore ".S rep raihas y be ,encfurn mahed bto i ' c Oficeý of TehnicGizedhe inlusirtdaterehenayspfioim eportngOpeiod qServies. Dpartmnt o3. erd REPtR tIL ,Etrtecmlt eotttei h als renuete the r icufgh n'v
capta AUtifR(s) T!Enter tll casesa sof utlod s be ucwshono 1. fied.NAYNTE:t~ oredloatepa
If rriary me howfu tiackando bear ofesevted wtheu nlame oficiPNOIN I!AYAC-T:E~ h aeothoaowtte pricip l ~ kcho aii o in ab llut maitimum rnuireent.ei t ) de Artetl pisribtonec offtine or abortor spcontrorled. e
6.mRedORtel followinte the dt tthee report asC dau ters se s shnd develpmet. thoudegh es
moth yer oES RIP monthOyEar. If mppopreathan onter the tpe o 3ffSRC:Etr nrbt-c iig re n atareonrthe report, usterm dat e m f ublicatin summary of theal do7etidctvf the report, ev enfrihe oti fi e of TChnJC2
Give tOTA incusiveR OFte w Ehenseic teortal g pgerount Sritcayaso aeppartmn oflse mher c nte, bod~ of the pubnicl red-shudc lo oms iainpocedure. ie.. enter thfaddtionad epacr ise preqired, if nontinei' lia hl
Sb. AUTbER O RS EENE E nterh nmes to e athotal 4sonume ofn i hIhl dUPEEsiARYl NtEat Vthe foaroc iiiionp- c~ex ploioref te renpeocte in the rlast. bame ufirstfed Eamch middlea~ oftil they anorttes.t wtIf-ra.ay so ON nkC ORd branTh ofMER srife Thrae, enter o nifcto ftemltr ecrt lsiin~no h n
the appinciable nmber of the bonutrae ornmu renqunreenthch.rmtoni the paraSORpN, MLT RepY ene ACIAsY ErS. (t). nam. orfrth rpot aswrttn.thedprtena Pr o jli ctato onftce or ; lab o fatory sprm i (pay--
6., REOR & d. ROEC NMB Enter the daeo te ap~rorast eve ngfr, the sugeated aendt isvfropment. Include 5ond-at.militarydepartrmenth idenicarItimon, tuh an ponect nupbear.s 4 fYW RS ~ywrtoe chiotn ri(5Jtr.
on ~ ~ ~ ~ ~ ~ ~ ~ ~ o ther report, uedtofpbisi.13 ABT CT: Etcroter an abstroct giv ng -.ir, r and factual9a. ORGINATR'S RPORT Jt&BERS): Etestmmoffy onde nthte forcumet O indctieo the report. even- :oC at houg
c7a. TOrTA NUMBER by PAC ES the docme tawlt pae cdentife seIte myaso thpat eolsecu ereiny thnos body of the tecnu ical r,anoud cotolled bymi theorginationg arctivity. Tise. enumer muth fier. Iuc asdtoa supaents roet cird ait~s cotinvtie- snoos slnll~tnuber niu tof thage rcortiignomt.on brocttacoed. ae eg~~i ocjn vyh t
7b. OTMBER OREFORT EN CERS). Enfe the rtootals n been word but wis ill besifolloed byhatnh zb'cstj of tchri,ýioel repr-aefeiened anye o nther report. bubr ere y P.oiaoeat Tnclassifnied t fc larignpis rofts e absr ss ,h %1l with-
ohe applcabe p numbr) alof nther thisraumber vatudrwihfs).~ni h ar~al.rpeetc " c.. U
ilthe re ontwa urither. Tiherieso of the remitatt, othe than those of
miliarydepatmet ientiicaion suc asprojct umbr. 1. N Y W RDS:NeY-orS e cu hrit lagif, i tticn