new jersey department of education · new jersey department of education ... perception of...
TRANSCRIPT

NEW JERSEY DEPARTMENT OF EDUCATION
OFFICE OF TITLE I
2015‐2016 TITLE I SCHOOLWIDE PLAN*
*This plan is only for Title I schoolwide programs that are not identified as a Priority or Focus Schools.

SCHOOLWIDE SUMMARY INFORMATION ‐ ESEA§1114
2
Principal’s Certification The following certification must be made by the principal of the school. Please Note: A signed Principal’s Certification must be scanned and included as part of the submission of the Schoolwide Plan. I certify that I have been included in consultations related to the priority needs of my school and participated in the completion of the Schoolwide Plan. As an active member of the planning committee, I provided input for the school’s Comprehensive Needs Assessment and the selection of priority problems. I concur with the information presented herein, including the identification of programs and activities that are funded by Title I, Part A.
________Mark Alfone_______________ ____ ________________ ______6‐15‐15_________________ Principal’s Name (Print) Principal’s Signature Date
DISTRICT INFORMATION SCHOOL INFORMATION
District: NEPTUNE TOWNSHIP SCHOOL DISTRICT School: Neptune Middle School
Chief School Administrator: DR. MICHAEL LAKE (INTERIM) Address: 2300 Heck Avenue, Neptune, NJ 07753 Chief School Administrator’s E‐mail: [email protected] Grade Levels: 6, 7, 8
Title I Contact: Audra Gutridge Principal: Dr. Mark Alfone
Title I Contact E‐mail: [email protected] Principal’s E‐mail: [email protected]
Title I Contact Phone Number: 732‐776‐2200 X7805 Principal’s Phone Number: (732) 776‐2000 X 6018

SCHOOLWIDE SUMMARY INFORMATION ‐ ESEA§1114
3
Critical Overview Elements
The School held _______4___________ (number) of stakeholder engagement meetings.
State/local funds to support the school were $ 9,680,500 , which comprised 96.81 % of the school’s budget in 2014‐2015.
State/local funds to support the school will be $ 9,824,500 , which will comprise 97.7 % of the school’s budget in 2015‐2016.
Title I funded programs/interventions/strategies/activities in 2015‐2016 include the following:
Item Related to Priority Problem #
Related to Reform Strategy
Budget Line Item (s)
Approximate Cost
ELA Supplies 1,2,3
Individualized Learning Instruction 100 – 300 $3,000.00
DRA and Data & Assessment Training 1,2,3 Data Analysis 200 – 300 $5,400.00
Family Engagement Activities 1, 2 Parental Involvement
100 – 100 200 – 600 $1,656.00
Technology 1,2,3 Technology Integration 200‐300 $6,000.00

SCHOOLWIDE COMPONENT: STAKEHOLDER ENGAGEMENT ESEA §1114(b)(2)(B)(ii)
4
ESEA §1114(b)(2)(B)(ii): “The comprehensive plan shall be . . . ‐ developed with the involvement of parents and other members of the community to be served and individuals who will carry out such plan, including teachers, principals, and administrators (including administrators of programs described in other parts of this title), and, if appropriate, pupil services personnel, technical assistance providers, school staff, and, if the plan relates to a secondary school, students from such school;”
Stakeholder/Schoolwide Committee
Select committee members to develop the Schoolwide Plan. Note: For purposes of continuity, some representatives from this Comprehensive Needs Assessment stakeholder committee should be included in the stakeholder/schoolwide planning committee. Identify the stakeholders who participated in the Comprehensive Needs Assessment and/or development of the plan. Signatures should be kept on file in the school office. Print a copy of this page to obtain signatures. Please Note: A scanned copy of the Stakeholder Engagement form, with all appropriate signatures, must be included as part of the submission of the Schoolwide Plan. *Add lines as necessary.
Name Stakeholder Group
Participated in Comprehensive
Needs Assessment
Participated in Plan
Development
Participated in Program Evaluation
Signature
Mark Alfone Principal YES YES On File
Hillary Wilkins Dept. Chair –LAL YES YES On File
Charles Kolinofsky Dept. Chair –Math YES YES On File
Michael Smurro Assistant Principal YES YES On File
Jacqueline Tinik Parent YES YES On File
Melinda Wright‐Swartz Parent YES YES On File
Eugene Stewart Parent YES YES On File
Luke Tirrell Teacher YES YES On File
Dana Glastein Teacher YES YES On File
Michael Petruzel Teacher YES YES On File

SCHOOLWIDE COMPONENT: STAKEHOLDER ENGAGEMENT ESEA §1114(b)(2)(B)(ii)
5
Stakeholder/Schoolwide Committee Meetings Purpose: The Stakeholder/Schoolwide Committee organizes and oversees the Comprehensive Needs Assessment process; leads the development of the schoolwide plan; and conducts or oversees the program’s annual evaluation. Stakeholder/Schoolwide Committee meetings should be held at least quarterly throughout the school year. List below the dates of the meetings during which the Stakeholder/Schoolwide Committee discussed the Comprehensive Needs Assessment, Schoolwide Plan development, and the Program Evaluation. Agenda and minutes of these meetings must be kept on file in the school and, upon request, provided to the NJDOE.
Date Location Topic Agenda on File Minutes on File
Yes No Yes No
3/27/14 NMS Comprehensive Needs Assessment
YES YES
12/8/14 NMS Comprehensive Needs Assessment (updated
action plan)
YES YES
8/19/14 NMS Schoolwide Plan Development
YES YES
3/26/15 NMS Program Evaluation YES YES
*Add rows as necessary.

SCHOOLWIDE COMPONENT: STAKEHOLDER ENGAGEMENT ESEA §1114(b)(2)(B)(ii)
6
School’s Mission
A collective vision that reflects the intents and purposes of schoolwide programs will capture the school’s response to some or all of these important questions:
What is our intended purpose? What are our expectations for students? What are the responsibilities of the adults who work in the school? How important are collaborations and partnerships? How are we committed to continuous improvement?
What is the school’s mission statement?
To become a school of excellence... Students will be provided the tools and skills needed to achieve academic success in a community of learners, and parents will be encouraged to take an active role in their child’s education. Furthermore, the vision of NMS is to prepare our students as 21st Century learners. Students are expected to acquire, apply and master: Common Core State Standards Information/media technology skills Critical thinking skills Collaborative problem solving skills Life and career skills
in order to empower the learners to enter an evolving, skills‐based workplace.

SCHOOLWIDE COMPONENT: EVALUATION ESEA §1114(b)(2)(B)(iii)
7
24 CFR § 200.26(c): Core Elements of a Schoolwide Program (Evaluation). A school operating a schoolwide program must—(1) Annually evaluate the implementation of, and results achieved by, the schoolwide program, using data from the State's annual assessments and other indicators of academic achievement; (2) Determine whether the schoolwide program has been effective in increasing the achievement of students in meeting the State's academic standards, particularly for those students who had been furthest from achieving the standards; and (3) Revise the plan, as necessary, based on the results of the evaluation, to ensure continuous improvement of students in the schoolwide program.
Evaluation of 2014‐2015 Schoolwide Program * (For schools approved to operate a schoolwide program in 2014‐2015, or earlier)
1. Did the school implement the program as planned?
YES, Transitioning to PARCC – With the implementation of PARCC, one of the priorities became giving each student the opportunity to practice online assessments prior to the official PARCC test. As originally planned, quarterly assessments would be administered online to provide this practice. Due to the extra testing time needed for PARCC, Quarter 1 and 3 Assessments were eliminated, with new midterms and finals created incorporating content from all four exams. Instead of administering the remaining midterm exam as an online assessment, all students were scheduled to take practice PARCC assessments online during Math and English classes.
2. What were the strengths of the implementation process?
Transitioning to PARCC – Strengths of the implementation process included the ability for every student to experience online testing prior to the official PARCC assessment and an increased understanding of the PARCC assessment by teachers and students as they reviewed practice tests.
3. What implementation challenges and barriers did the school encounter?
Transitioning to PARCC – The greatest barrier faced was the number of available devices for testing, which made scheduling practice sessions difficult.
4. What were the apparent strengths and weaknesses of each step during the program(s) implementation?
a. The implementation of Writer’s Workshop in 6th grade was successful in that teachers received training by an outside consultant as well as the Department Chair of Language Arts; instructional strategies were implemented in classrooms based on the training. Program strengths include teachers learning and implementing focused instructional strategies for
SCHOOLWIDE COMPONENT: EVALUATION ESEA §1114(b)(2)(B)(iii)
8
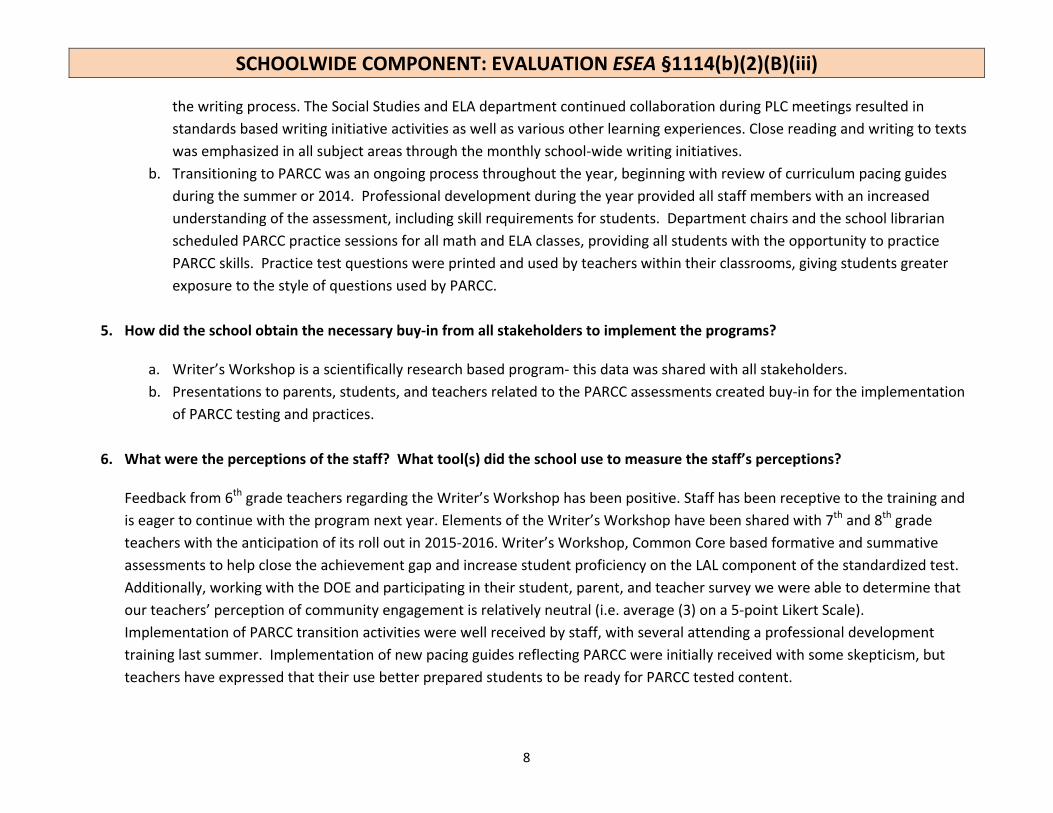
the writing process. The Social Studies and ELA department continued collaboration during PLC meetings resulted in standards based writing initiative activities as well as various other learning experiences. Close reading and writing to texts was emphasized in all subject areas through the monthly school‐wide writing initiatives.
b. Transitioning to PARCC was an ongoing process throughout the year, beginning with review of curriculum pacing guides during the summer or 2014. Professional development during the year provided all staff members with an increased understanding of the assessment, including skill requirements for students. Department chairs and the school librarian scheduled PARCC practice sessions for all math and ELA classes, providing all students with the opportunity to practice PARCC skills. Practice test questions were printed and used by teachers within their classrooms, giving students greater exposure to the style of questions used by PARCC.
5. How did the school obtain the necessary buy‐in from all stakeholders to implement the programs?
a. Writer’s Workshop is a scientifically research based program‐ this data was shared with all stakeholders. b. Presentations to parents, students, and teachers related to the PARCC assessments created buy‐in for the implementation
of PARCC testing and practices.
6. What were the perceptions of the staff? What tool(s) did the school use to measure the staff’s perceptions?
Feedback from 6th grade teachers regarding the Writer’s Workshop has been positive. Staff has been receptive to the training and is eager to continue with the program next year. Elements of the Writer’s Workshop have been shared with 7th and 8th grade teachers with the anticipation of its roll out in 2015‐2016. Writer’s Workshop, Common Core based formative and summative assessments to help close the achievement gap and increase student proficiency on the LAL component of the standardized test. Additionally, working with the DOE and participating in their student, parent, and teacher survey we were able to determine that our teachers’ perception of community engagement is relatively neutral (i.e. average (3) on a 5‐point Likert Scale). Implementation of PARCC transition activities were well received by staff, with several attending a professional development training last summer. Implementation of new pacing guides reflecting PARCC were initially received with some skepticism, but teachers have expressed that their use better prepared students to be ready for PARCC tested content.
SCHOOLWIDE COMPONENT: EVALUATION ESEA §1114(b)(2)(B)(iii)
9
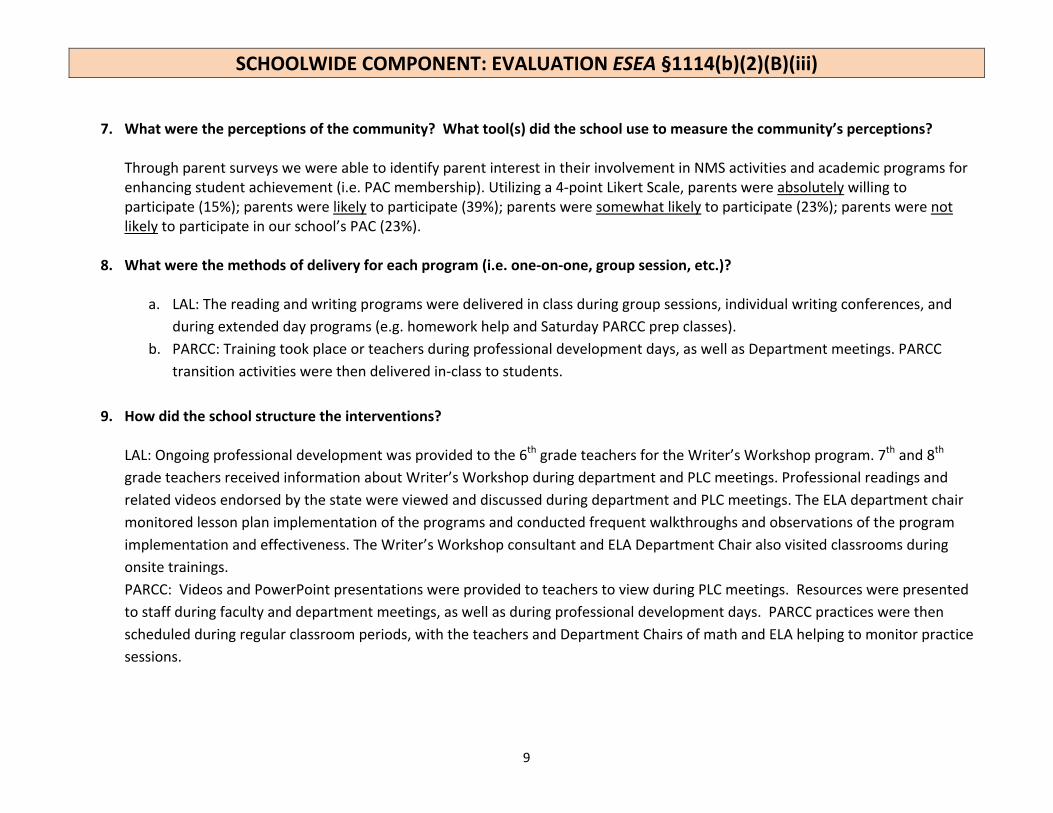
7. What were the perceptions of the community? What tool(s) did the school use to measure the community’s perceptions?
Through parent surveys we were able to identify parent interest in their involvement in NMS activities and academic programs for enhancing student achievement (i.e. PAC membership). Utilizing a 4‐point Likert Scale, parents were absolutely willing to participate (15%); parents were likely to participate (39%); parents were somewhat likely to participate (23%); parents were not likely to participate in our school’s PAC (23%).
8. What were the methods of delivery for each program (i.e. one‐on‐one, group session, etc.)?
a. LAL: The reading and writing programs were delivered in class during group sessions, individual writing conferences, and during extended day programs (e.g. homework help and Saturday PARCC prep classes).
b. PARCC: Training took place or teachers during professional development days, as well as Department meetings. PARCC transition activities were then delivered in‐class to students.
9. How did the school structure the interventions?
LAL: Ongoing professional development was provided to the 6th grade teachers for the Writer’s Workshop program. 7th and 8th grade teachers received information about Writer’s Workshop during department and PLC meetings. Professional readings and related videos endorsed by the state were viewed and discussed during department and PLC meetings. The ELA department chair monitored lesson plan implementation of the programs and conducted frequent walkthroughs and observations of the program implementation and effectiveness. The Writer’s Workshop consultant and ELA Department Chair also visited classrooms during onsite trainings. PARCC: Videos and PowerPoint presentations were provided to teachers to view during PLC meetings. Resources were presented to staff during faculty and department meetings, as well as during professional development days. PARCC practices were then scheduled during regular classroom periods, with the teachers and Department Chairs of math and ELA helping to monitor practice sessions.

SCHOOLWIDE COMPONENT: EVALUATION ESEA §1114(b)(2)(B)(iii)
10
10. How frequently did students receive instructional interventions?
PARCC: All students were scheduled for at least two PARCC practice sessions, with teachers individually scheduling extra sessions as labs were available. Implementation of PARCC style questions was done by individual teachers with varying frequencies based o time allowances.
11. What technologies did the school use to support the program? PARCC: SmartBoards, computer labs, laptop carts were used.
12. Did the technology contribute to the success of the program and, if so, how?
As PARCC is an online assessment, technology contributed significantly to the success, as it was used to implement practice sessions, and to share practice questions with students.
*Provide a separate response for each question.
Evaluation of 2014‐2015 Student Performance State Assessments‐Partially Proficient
Provide the number of students at each grade level listed below who scored partially proficient on state assessments for two years or more in English Language Arts and Mathematics, and the interventions the students received.
English Language Arts
2013‐2014
2014‐2015 Interventions Provided Describe why the interventions did or did not result in
proficiency (Be specific for each intervention).
Grade 6 168 Not yet Available
Continued use of Link‐It based Assessments for analyzing student areas of need.
Assessments could be analyzed to check for question reliability and correlation to NJASK Assessments and gave teachers feedback on areas of student weakness that could be used to address student needs prior to NJASK.
Grade 7 162 Not yet Available
Continued use of Link‐It based Assessments for analyzing student areas of need.
Assessments could be analyzed to check for question reliability and correlation to NJASK Assessments and gave teachers feedback on areas of student weakness that could be used to address student needs prior to

SCHOOLWIDE COMPONENT: EVALUATION ESEA §1114(b)(2)(B)(iii)
11
NJASK.
Grade 8 104 Not yet Available
Continued use of Link‐It based Assessments for analyzing student areas of need.
Assessments could be analyzed to check for question reliability and correlation to NJASK Assessments and gave teachers feedback on areas of student weakness that could be used to address student needs prior to NJASK.
Mathematics 2013‐2014
2014‐2015 Interventions Provided Describe why the interventions did or did not result in
proficiency (Be specific for each intervention).
Grade 6 112 Not yet Available
Continued use of LinkIt! Based Assessments for analyzing student areas of need.
Assessments could be analyzed to check for question reliability and correlation to NJASK Assessments and gave teachers feedback on areas of student weakness that could be used to address student needs prior to PARCC. Limited availability of PARCC style questions within LinkIt! Limited some of its effectiveness for preparing students to take PARCC, but that is currently being addressed by LinkIt!
Grade 7 146 Not yet Available
Continued use of LinkIt! Based Assessments for analyzing student areas of need.
Assessments could be analyzed to check for question reliability and correlation to NJASK Assessments and gave teachers feedback on areas of student weakness that could be used to address student needs prior to PARCC. Limited availability of PARCC style questions within LinkIt! Limited some of its effectiveness for preparing students to take PARCC, but that is currently being addressed by LinkIt!
Grade 8 158 Not yet Available
Continued use of LinkIt! Based Assessments for analyzing student areas of need.
Assessments could be analyzed to check for question reliability and correlation to NJASK Assessments and gave teachers feedback on areas of student weakness that could be used to address student needs prior to PARCC. Limited availability of PARCC style questions within LinkIt! Limited some of its effectiveness for preparing students to take PARCC, but that is currently being addressed by LinkIt!
SCHOOLWIDE COMPONENT: EVALUATION ESEA §1114(b)(2)(B)(iii)
12
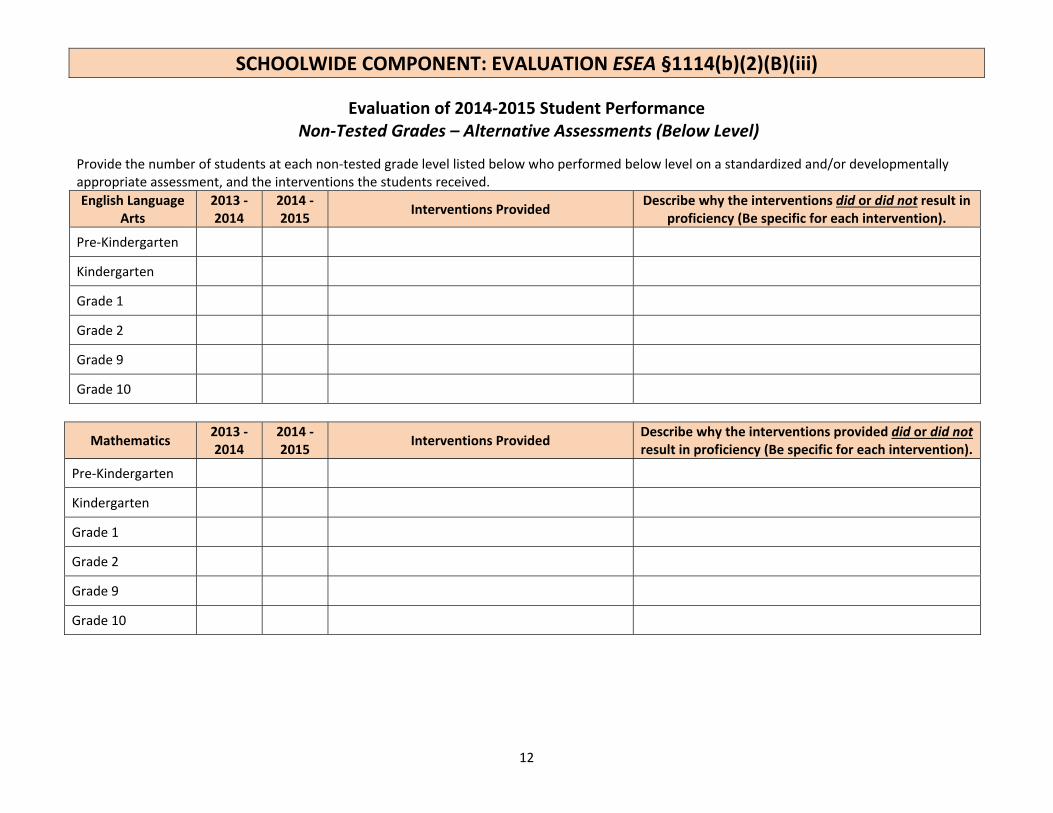
Evaluation of 2014‐2015 Student Performance Non‐Tested Grades – Alternative Assessments (Below Level)
Provide the number of students at each non‐tested grade level listed below who performed below level on a standardized and/or developmentally appropriate assessment, and the interventions the students received. English Language
Arts 2013 ‐2014
2014 ‐2015 Interventions Provided Describe why the interventions did or did not result in
proficiency (Be specific for each intervention).
Pre‐Kindergarten
Kindergarten
Grade 1
Grade 2
Grade 9
Grade 10
Mathematics 2013 ‐2014
2014 ‐2015 Interventions Provided Describe why the interventions provided did or did not
result in proficiency (Be specific for each intervention).
Pre‐Kindergarten
Kindergarten
Grade 1
Grade 2
Grade 9
Grade 10

SCHOOLWIDE COMPONENT: EVALUATION ESEA §1114(b)(2)(B)(iii)
13
Evaluation of 2014‐2015 Interventions and Strategies
Interventions to Increase Student Achievement – Implemented in 2014‐2015 1
Content 2
Group 3
Intervention 4
Effective Yes‐No
5 Documentation of
Effectiveness
6 Measurable Outcomes
(Outcomes must be quantifiable) ELA Students with
Disabilities Introduction to use of the various Inclusion Models as an intervention and appropriate use of accommodations (based on 2013‐2014 PD provided)
Yes LinkIt! Reports with quarterly assessment data, teacher SGOs
All teachers utilized pre‐assessments as part of the implementation of Student Growth Objectives (SGOs), with an accompanying growth assessment in late February: Significant areas of growth: 6th grade (Writer’s Workshop year 1 implementation)
Narrative Writing – 25% pre‐assessment – 62% midterm – Writer’s Workshop
RI 6.1 ‐ citing textual evidence; Pre‐assessment – midterm 24% ‐57%
RL 6.1 – citing textual evidence; Pre‐assessment – midterm 57% ‐62%
RI 8.6 CCSS.ELA‐Literacy.RI.6.6 (Determine an author's point of view or purpose in a text and explain how it is conveyed in the text); 30% pre‐assessment – 66% midterm
RI6.8 (Trace and evaluate the argument and specific claims in a text, distinguishing claims that are supported by reasons and evidence from claims that are not); 28% pre‐assessment ‐ 79% midterm
R6.5 (Analyze how a particular sentence, chapter, scene, or stanza fits into the overall structure of a text and contributes to the development

SCHOOLWIDE COMPONENT: EVALUATION ESEA §1114(b)(2)(B)(iii)
14
1 Content
2 Group
3 Intervention
4 Effective Yes‐No
5 Documentation of
Effectiveness
6 Measurable Outcomes
(Outcomes must be quantifiable) of the theme, setting, or plot.); 43% pre‐assessment – 55% midterm.
Significant areas of grown: 7th grade RI 7.1, citing textual evidence; 48%
pre‐assessment – 75% midterm RL 7.2, citing textual evidence; 47%
pre‐assessment – 59% midterm RI 7.2, determining 2 or more central
ideas, analyzing 29% pre‐assessment – 68% midterm
RI 7.6, point of view 54% pre‐assessment – 84% midterm.
Significant areas of grown: 8th grade Informative Writing – average score
77% (midterm) RI 8.1, citing textual evidence; 42%
pre‐assessment – 62% midterm RL 8.2, citing textual evidence; 48%
pre‐assessment – 71% midterm RL 8.4, word choice, impact on tone
and mood; 60‐% pre‐assessment – 74% midterm
RL 8.3, analyze how dialogue propels action; 57% pre‐assessment – 74% midterm
Math Students with Disabilities
Introduction to use of the various Inclusion Models as an intervention and appropriate use of accommodations (based on 2013‐2014
Yes LinkIt! Reports with quarterly assessment data, teacher SGOs
All teachers utilized pre‐assessments as part of the implementation of Student Growth Objectives (SGOs), with an accompanying growth assessment in late February: 6th grade: Summary – Weaknesses were similar but improved from Pre‐Assessment to
SCHOOLWIDE COMPONENT: EVALUATION ESEA §1114(b)(2)(B)(iii)
15
1 Content
2 Group
3 Intervention
4 Effective Yes‐No
5 Documentation of
Effectiveness
6 Measurable Outcomes
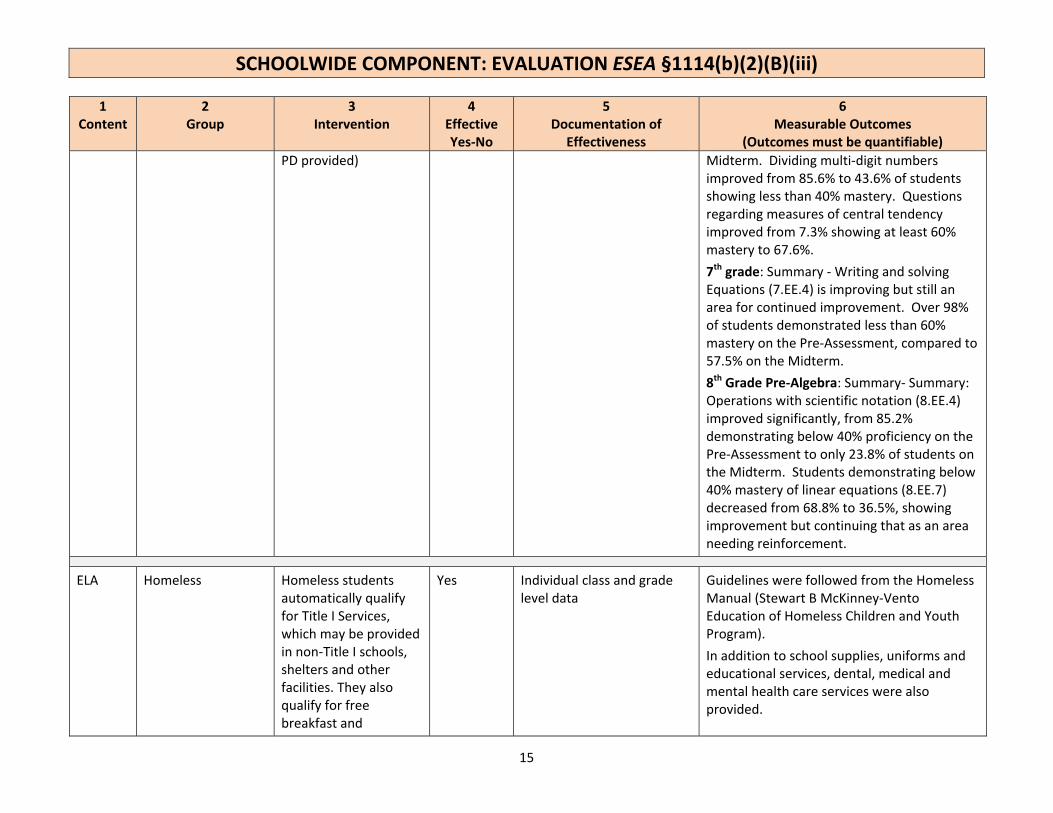
(Outcomes must be quantifiable) PD provided) Midterm. Dividing multi‐digit numbers
improved from 85.6% to 43.6% of students showing less than 40% mastery. Questions regarding measures of central tendency improved from 7.3% showing at least 60% mastery to 67.6%. 7th grade: Summary ‐ Writing and solving Equations (7.EE.4) is improving but still an area for continued improvement. Over 98% of students demonstrated less than 60% mastery on the Pre‐Assessment, compared to 57.5% on the Midterm. 8th Grade Pre‐Algebra: Summary‐ Summary: Operations with scientific notation (8.EE.4) improved significantly, from 85.2% demonstrating below 40% proficiency on the Pre‐Assessment to only 23.8% of students on the Midterm. Students demonstrating below 40% mastery of linear equations (8.EE.7) decreased from 68.8% to 36.5%, showing improvement but continuing that as an area needing reinforcement.
ELA Homeless Homeless students automatically qualify for Title I Services, which may be provided in non‐Title I schools, shelters and other facilities. They also qualify for free breakfast and
Yes Individual class and grade level data
Guidelines were followed from the Homeless Manual (Stewart B McKinney‐Vento Education of Homeless Children and Youth Program). In addition to school supplies, uniforms and educational services, dental, medical and mental health care services were also provided.

SCHOOLWIDE COMPONENT: EVALUATION ESEA §1114(b)(2)(B)(iii)
16
1 Content
2 Group
3 Intervention
4 Effective Yes‐No
5 Documentation of
Effectiveness
6 Measurable Outcomes
(Outcomes must be quantifiable) Math Homeless Homeless students
automatically qualify for Title I Services, which may be provided in non‐Title I schools, shelters and other facilities. They also qualify for free breakfast and
Yes Individual class and grade level data
Guidelines were followed from the Homeless Manual (Stewart B McKinney‐Vento Education of Homeless Children and Youth Program). In addition to school supplies, uniforms and educational services, dental, medical and mental health care services were also provided.
ELA Migrant N/A
Math Migrant N/A
ELA ELLs Utilization of WIDA standards in order to ensure appropriate delivery of instruction
Yes WIDA Assessment Results All teachers delivered instruction using the workshop model that emphasizes individual and small group instruction for reading and writing to increase level of vocabulary and Increase access to grade level curriculum. 80% of students scored at proficiency level 3(developing); 20% scored level 1 (emerging)
Math ELLs
LinkIt! Benchmark assessments
Yes LinkIt! Pre/Post Assessment and Final Exam Results
Use of LinkIt! Assessments tracked areas of student growth during the year and indicated areas of weakness that were analyzed by all (see SpEd Math and ELA content above).
ELA Economically Disadvantaged
LinkIt! Benchmark assessments
Yes LinkIt! Final Exam Results Use of LinkIt! Assessments tracked areas of student growth during the year and indicated areas of weakness that were analyzed by all teachers. The average final exam score for grade 6 – 57%, Grade 7 – 68%, Grade 8 – 66%

SCHOOLWIDE COMPONENT: EVALUATION ESEA §1114(b)(2)(B)(iii)
17
1 Content
2 Group
3 Intervention
4 Effective Yes‐No
5 Documentation of
Effectiveness
6 Measurable Outcomes
(Outcomes must be quantifiable) Math Economically
Disadvantaged
LinkIt! Benchmark assessments
Yes LinkIt! Final Exam Results Use of LinkIt! Assessments tracked areas of student growth during the year and indicated areas of weakness that were analyzed by all teachers. The average final exam for Grade 6‐ 67%, Grade 7‐ 69%, Grade 8‐ 59%.
ELA All Quarterly Assessments with Link‐It Analysis
Yes Link‐It reports with quarterly assessment data, teacher SGOs
There was significant growth shown from the pre‐assessment to the midterm for 6th‐8th grade. The average score of the pre‐assessment to the midterm is as follows: 6th grade – pre‐ midterm data, 37‐58% 7th grade – pre‐midterm data, 44‐70% 8th grade – pre‐midterm data, 45‐57% While students have not yet taken final exams for finalized data, all teachers utilized pre‐assessments as part of the implementation of Student Growth Objectives (SGOs), with an accompanying growth assessment in late February. 100% of SGOs completed using the pre‐post data achieved a score of 3 or above.
Math All Midterm Assessments with LinkIt! Analysis
Yes LinkIt! reports with midterm assessment data, teacher SGOs
Midterm Assessments were administered using LinkIt! with data reports providing teachers with feedback on areas of student strength and weakness. Teachers tied SGOs to this data, with every teacher succeeding with at least an SGO score of a 3 and most achieving a 4.

SCHOOLWIDE COMPONENT: EVALUATION ESEA §1114(b)(2)(B)(iii)
18
Extended Day/Year Interventions – Implemented in 2014‐2015 to Address Academic Deficiencies
1 Content
2 Group
3 Intervention
4 Effective Yes‐No
5 Documentation of
Effectiveness
6 Measurable Outcomes
(Outcomes must be quantifiable) ELA Students with
Disabilities Five week extended school year program for students who will regress over the summer break
Yes Annual IEP meetings to review achieved goal data Midterm assessments IEP progress reports
Students in the program demonstrate growth as measure by the midterm assessment: There was significant growth shown from the pre‐assessment to the midterm for 6th‐8th grade. The average score of the pre‐assessment to the midterm is as follows: 6th grade – pre‐ midterm data, 37‐58% 7th grade – pre‐midterm data, 44‐70% 8th grade – pre‐midterm data, 45‐57%
Math Students with Disabilities
Five week extended school year program for students who will regress over the summer break
Yes Annual IEP meetings to review achieved goal data Midterm assessments IEP progress reports
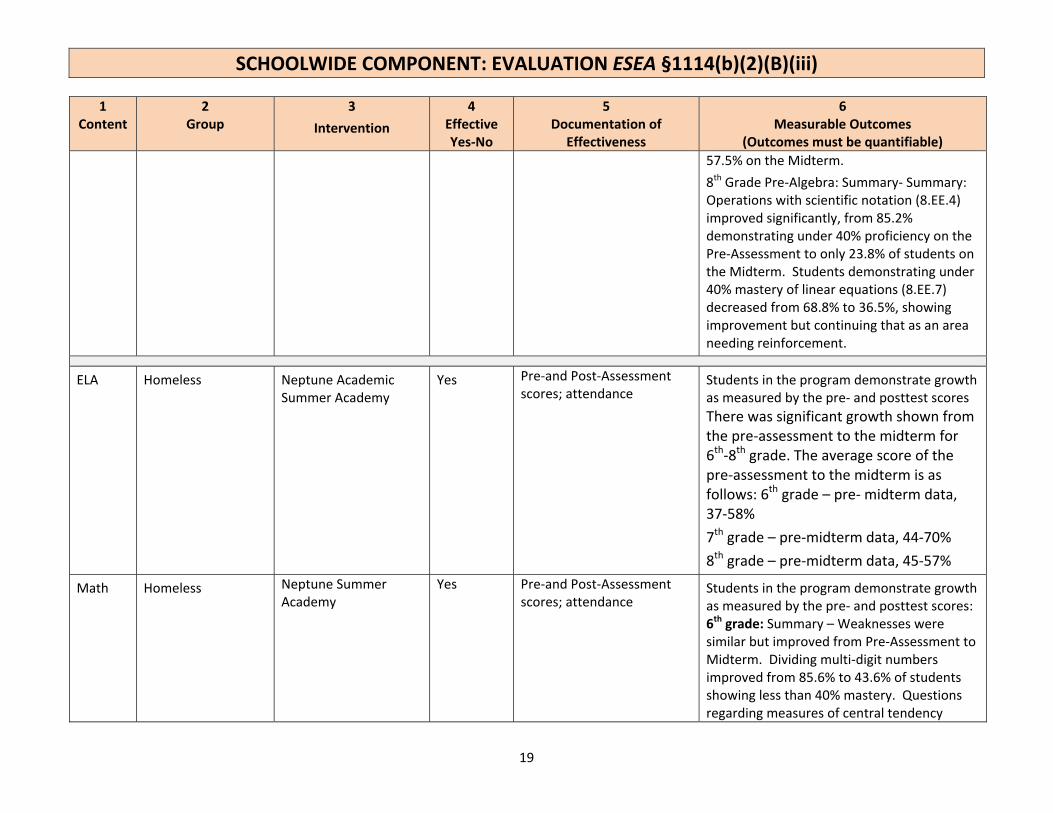
Students in the program demonstrate growth as measure by the midterm assessment: 6th grade: Summary – Weaknesses were similar but improved from Pre‐Assessment to Midterm. Dividing multi‐digit numbers improved from 85.6% to 43.6% of students showing less than 40% mastery. Questions regarding measures of central tendency improved from 7.3% showing at least 60% mastery to 67.6%. 7th grade: Summary ‐ Writing and solving Equations (7.EE.4) is improving but still an area for continued improvement. Over 98% of students demonstrated less than 60% mastery on the Pre‐Assessment, compared to
SCHOOLWIDE COMPONENT: EVALUATION ESEA §1114(b)(2)(B)(iii)
19
1 Content
2 Group
3 Intervention
4 Effective Yes‐No
5 Documentation of
Effectiveness
6 Measurable Outcomes
(Outcomes must be quantifiable) 57.5% on the Midterm. 8th Grade Pre‐Algebra: Summary‐ Summary: Operations with scientific notation (8.EE.4) improved significantly, from 85.2% demonstrating under 40% proficiency on the Pre‐Assessment to only 23.8% of students on the Midterm. Students demonstrating under 40% mastery of linear equations (8.EE.7) decreased from 68.8% to 36.5%, showing improvement but continuing that as an area needing reinforcement.
ELA Homeless Neptune Academic Summer Academy
Yes Pre‐and Post‐Assessment scores; attendance
Students in the program demonstrate growth as measured by the pre‐ and posttest scores There was significant growth shown from the pre‐assessment to the midterm for 6th‐8th grade. The average score of the pre‐assessment to the midterm is as follows: 6th grade – pre‐ midterm data, 37‐58% 7th grade – pre‐midterm data, 44‐70% 8th grade – pre‐midterm data, 45‐57%
Math Homeless Neptune Summer Academy
Yes Pre‐and Post‐Assessment scores; attendance
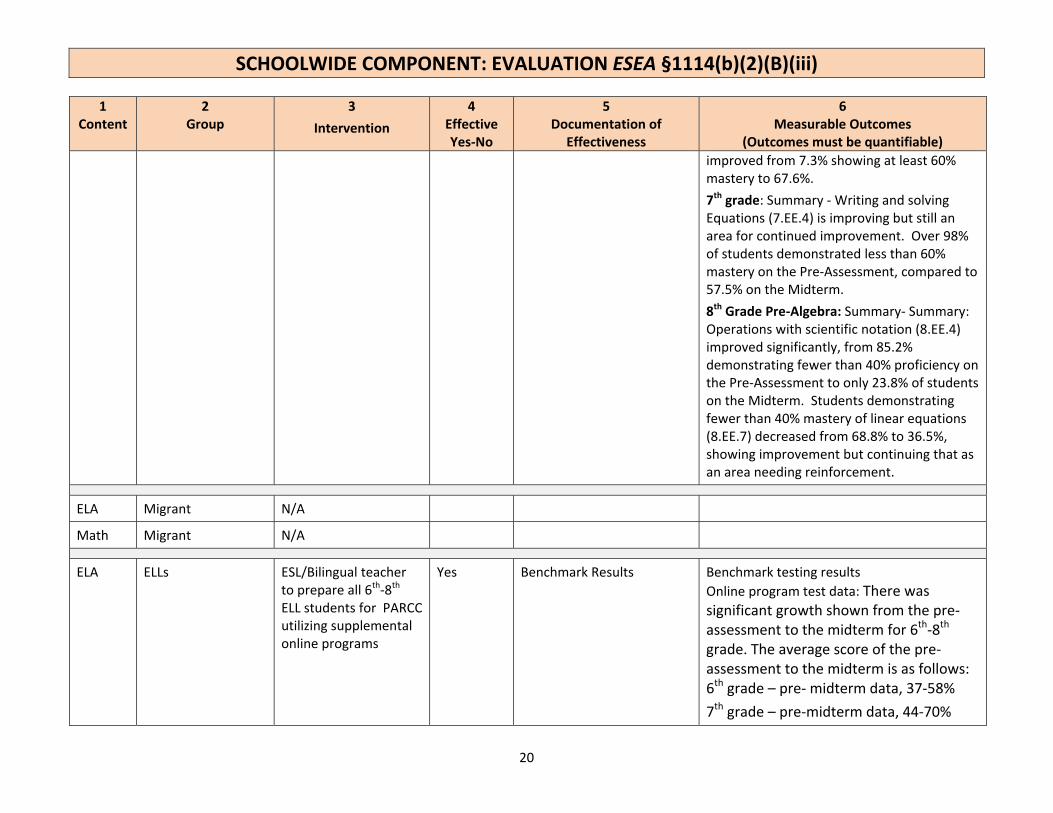
Students in the program demonstrate growth as measured by the pre‐ and posttest scores: 6th grade: Summary – Weaknesses were similar but improved from Pre‐Assessment to Midterm. Dividing multi‐digit numbers improved from 85.6% to 43.6% of students showing less than 40% mastery. Questions regarding measures of central tendency
SCHOOLWIDE COMPONENT: EVALUATION ESEA §1114(b)(2)(B)(iii)
20
1 Content
2 Group
3 Intervention
4 Effective Yes‐No
5 Documentation of
Effectiveness
6 Measurable Outcomes
(Outcomes must be quantifiable) improved from 7.3% showing at least 60% mastery to 67.6%. 7th grade: Summary ‐ Writing and solving Equations (7.EE.4) is improving but still an area for continued improvement. Over 98% of students demonstrated less than 60% mastery on the Pre‐Assessment, compared to 57.5% on the Midterm. 8th Grade Pre‐Algebra: Summary‐ Summary: Operations with scientific notation (8.EE.4) improved significantly, from 85.2% demonstrating fewer than 40% proficiency on the Pre‐Assessment to only 23.8% of students on the Midterm. Students demonstrating fewer than 40% mastery of linear equations (8.EE.7) decreased from 68.8% to 36.5%, showing improvement but continuing that as an area needing reinforcement.
ELA Migrant N/A
Math Migrant N/A
ELA ELLs ESL/Bilingual teacher to prepare all 6th‐8th ELL students for PARCC utilizing supplemental online programs
Yes Benchmark Results
Benchmark testing results Online program test data: There was significant growth shown from the pre‐assessment to the midterm for 6th‐8th grade. The average score of the pre‐assessment to the midterm is as follows: 6th grade – pre‐ midterm data, 37‐58% 7th grade – pre‐midterm data, 44‐70%

SCHOOLWIDE COMPONENT: EVALUATION ESEA §1114(b)(2)(B)(iii)
21
1 Content
2 Group
3 Intervention
4 Effective Yes‐No
5 Documentation of
Effectiveness
6 Measurable Outcomes
(Outcomes must be quantifiable) 8th grade – pre‐midterm data, 45‐57%
Math ELLs ESL/Bilingual teacher to prepare all 6th‐8th ELL students for PARCC utilizing supplemental online programs
Yes Benchmark Results Benchmark testing results Online program test data: 6th grade: Summary – Weaknesses were similar but improved from Pre‐Assessment to Midterm. Dividing multi‐digit numbers improved from 85.6% to 43.6% of students showing less than 40% mastery. Questions regarding measures of central tendency improved from 7.3% showing at least 60% mastery to 67.6%. 7th grade: Summary ‐ Writing and solving Equations (7.EE.4) is improving but still an area for continued improvement. Over 98% of students demonstrated less than 60% mastery on the Pre‐Assessment, compared to 57.5% on the Midterm. 8th Grade Pre‐Algebra: Summary‐ Summary: Operations with scientific notation (8.EE.4) improved significantly, from 85.2% demonstrating fewer than 40% proficiency on the Pre‐Assessment to only 23.8% of students on the Midterm. Students demonstrating fewer than 40% mastery of linear equations (8.EE.7) decreased from 68.8% to 36.5%, showing improvement but continuing that as an area needing reinforcement.
ELA Economically Disadvantaged
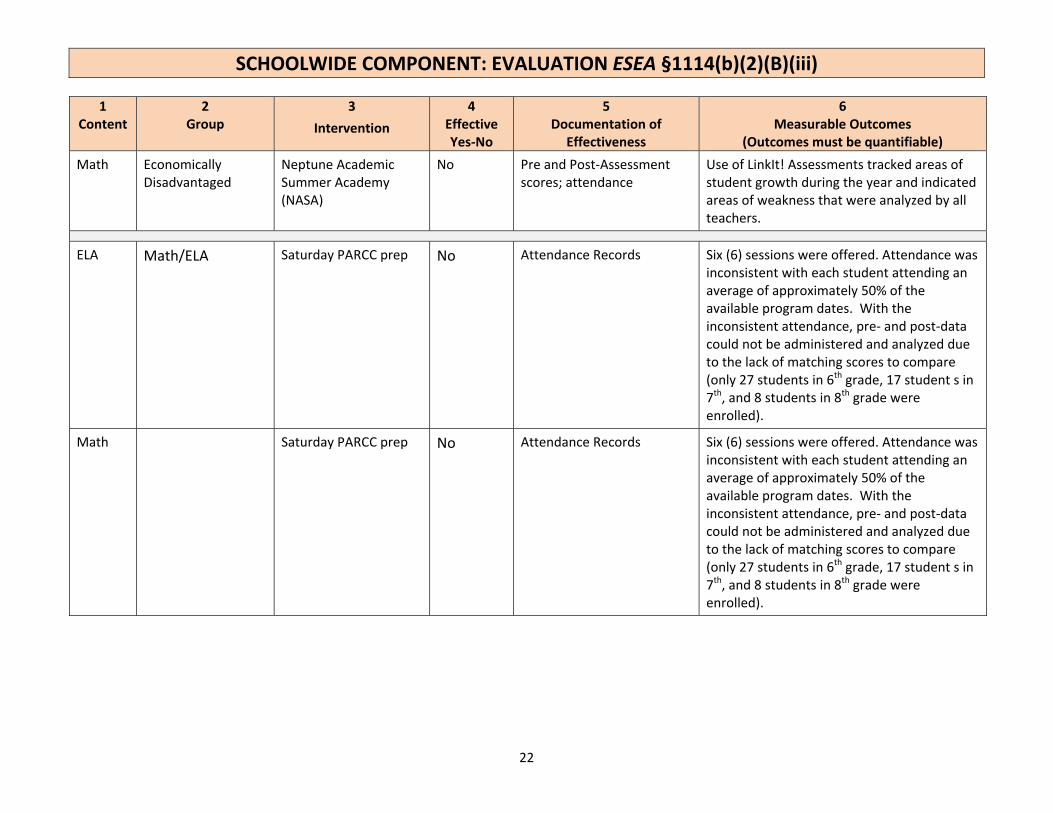
Neptune Academic Summer Academy (NASA)
No Pre and Post‐Assessment scores; attendance
Use of LinkIt! Assessments tracked areas of student growth during the year and indicated areas of weakness that were analyzed by all teachers.
SCHOOLWIDE COMPONENT: EVALUATION ESEA §1114(b)(2)(B)(iii)
22
1 Content
2 Group
3 Intervention
4 Effective Yes‐No
5 Documentation of
Effectiveness
6 Measurable Outcomes
(Outcomes must be quantifiable) Math Economically
Disadvantaged Neptune Academic Summer Academy (NASA)
No Pre and Post‐Assessment scores; attendance
Use of LinkIt! Assessments tracked areas of student growth during the year and indicated areas of weakness that were analyzed by all teachers.
ELA Math/ELA Saturday PARCC prep No Attendance Records Six (6) sessions were offered. Attendance was inconsistent with each student attending an average of approximately 50% of the available program dates. With the inconsistent attendance, pre‐ and post‐data could not be administered and analyzed due to the lack of matching scores to compare (only 27 students in 6th grade, 17 student s in 7th, and 8 students in 8th grade were enrolled).
Math Saturday PARCC prep No Attendance Records Six (6) sessions were offered. Attendance was inconsistent with each student attending an average of approximately 50% of the available program dates. With the inconsistent attendance, pre‐ and post‐data could not be administered and analyzed due to the lack of matching scores to compare (only 27 students in 6th grade, 17 student s in 7th, and 8 students in 8th grade were enrolled).
SCHOOLWIDE COMPONENT: EVALUATION ESEA §1114(b)(2)(B)(iii)
23
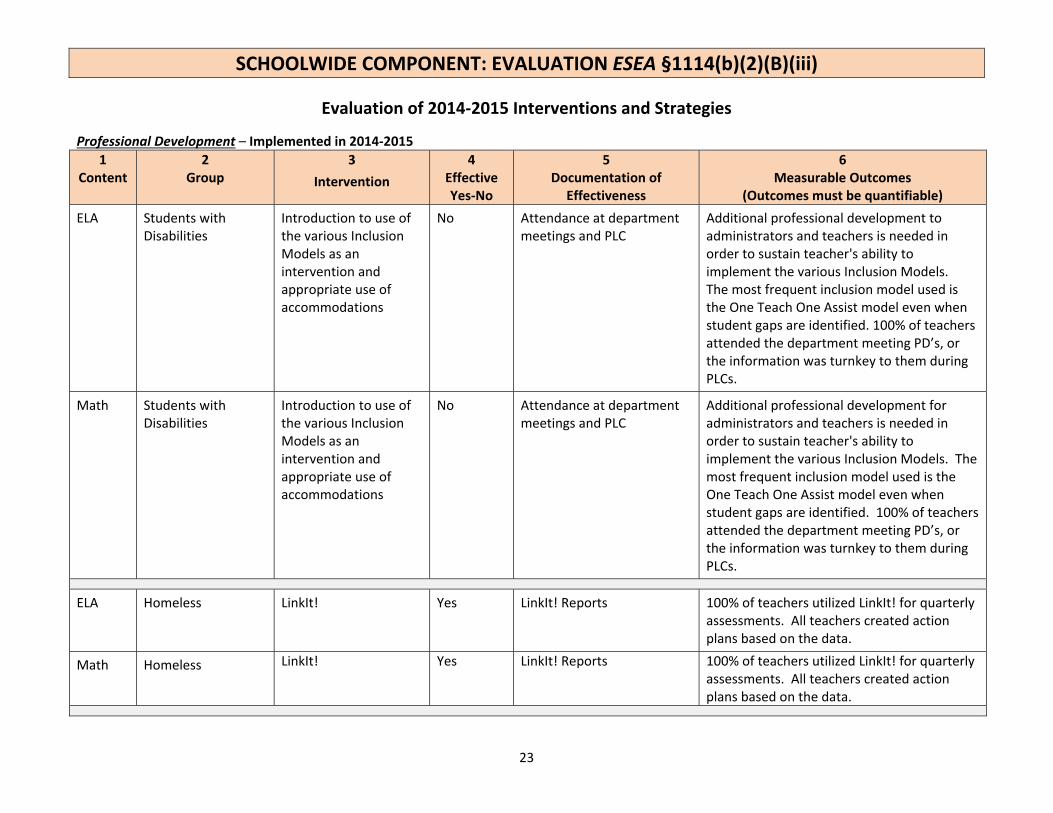
Evaluation of 2014‐2015 Interventions and Strategies
Professional Development – Implemented in 2014‐2015 1
Content 2
Group 3
Intervention 4
Effective Yes‐No
5 Documentation of
Effectiveness
6 Measurable Outcomes
(Outcomes must be quantifiable) ELA Students with
Disabilities Introduction to use of the various Inclusion Models as an intervention and appropriate use of accommodations
No Attendance at department meetings and PLC
Additional professional development to administrators and teachers is needed in order to sustain teacher's ability to implement the various Inclusion Models. The most frequent inclusion model used is the One Teach One Assist model even when student gaps are identified. 100% of teachers attended the department meeting PD’s, or the information was turnkey to them during PLCs.
Math Students with Disabilities
Introduction to use of the various Inclusion Models as an intervention and appropriate use of accommodations
No Attendance at department meetings and PLC
Additional professional development for administrators and teachers is needed in order to sustain teacher's ability to implement the various Inclusion Models. The most frequent inclusion model used is the One Teach One Assist model even when student gaps are identified. 100% of teachers attended the department meeting PD’s, or the information was turnkey to them during PLCs.
ELA Homeless LinkIt! Yes LinkIt! Reports 100% of teachers utilized LinkIt! for quarterly assessments. All teachers created action plans based on the data.
Math Homeless LinkIt! Yes LinkIt! Reports 100% of teachers utilized LinkIt! for quarterly assessments. All teachers created action plans based on the data.
SCHOOLWIDE COMPONENT: EVALUATION ESEA §1114(b)(2)(B)(iii)
24
1 Content
2 Group
3 Intervention
4 Effective Yes‐No
5 Documentation of
Effectiveness
6 Measurable Outcomes
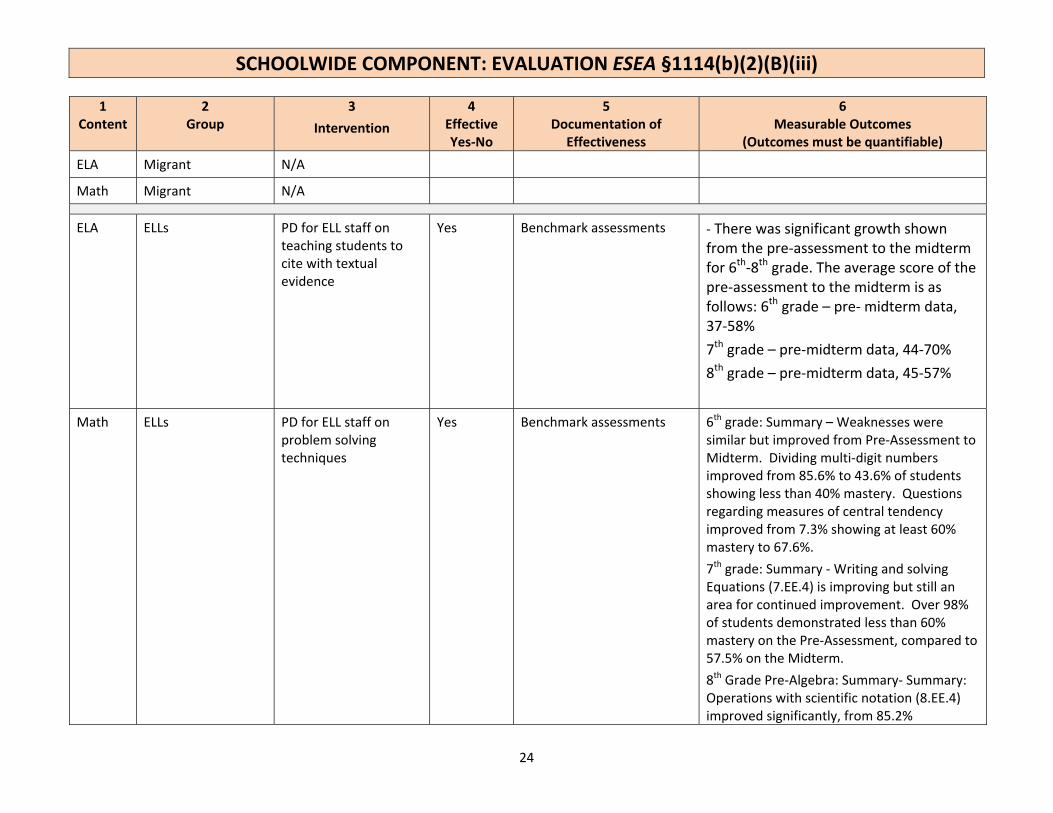
(Outcomes must be quantifiable) ELA Migrant N/A
Math Migrant N/A
ELA ELLs PD for ELL staff on teaching students to cite with textual evidence
Yes Benchmark assessments ‐ There was significant growth shown from the pre‐assessment to the midterm for 6th‐8th grade. The average score of the pre‐assessment to the midterm is as follows: 6th grade – pre‐ midterm data, 37‐58% 7th grade – pre‐midterm data, 44‐70% 8th grade – pre‐midterm data, 45‐57%
Math ELLs PD for ELL staff on problem solving techniques
Yes Benchmark assessments 6th grade: Summary – Weaknesses were similar but improved from Pre‐Assessment to Midterm. Dividing multi‐digit numbers improved from 85.6% to 43.6% of students showing less than 40% mastery. Questions regarding measures of central tendency improved from 7.3% showing at least 60% mastery to 67.6%. 7th grade: Summary ‐ Writing and solving Equations (7.EE.4) is improving but still an area for continued improvement. Over 98% of students demonstrated less than 60% mastery on the Pre‐Assessment, compared to 57.5% on the Midterm. 8th Grade Pre‐Algebra: Summary‐ Summary: Operations with scientific notation (8.EE.4) improved significantly, from 85.2%

SCHOOLWIDE COMPONENT: EVALUATION ESEA §1114(b)(2)(B)(iii)
25
1 Content
2 Group
3 Intervention
4 Effective Yes‐No
5 Documentation of
Effectiveness
6 Measurable Outcomes
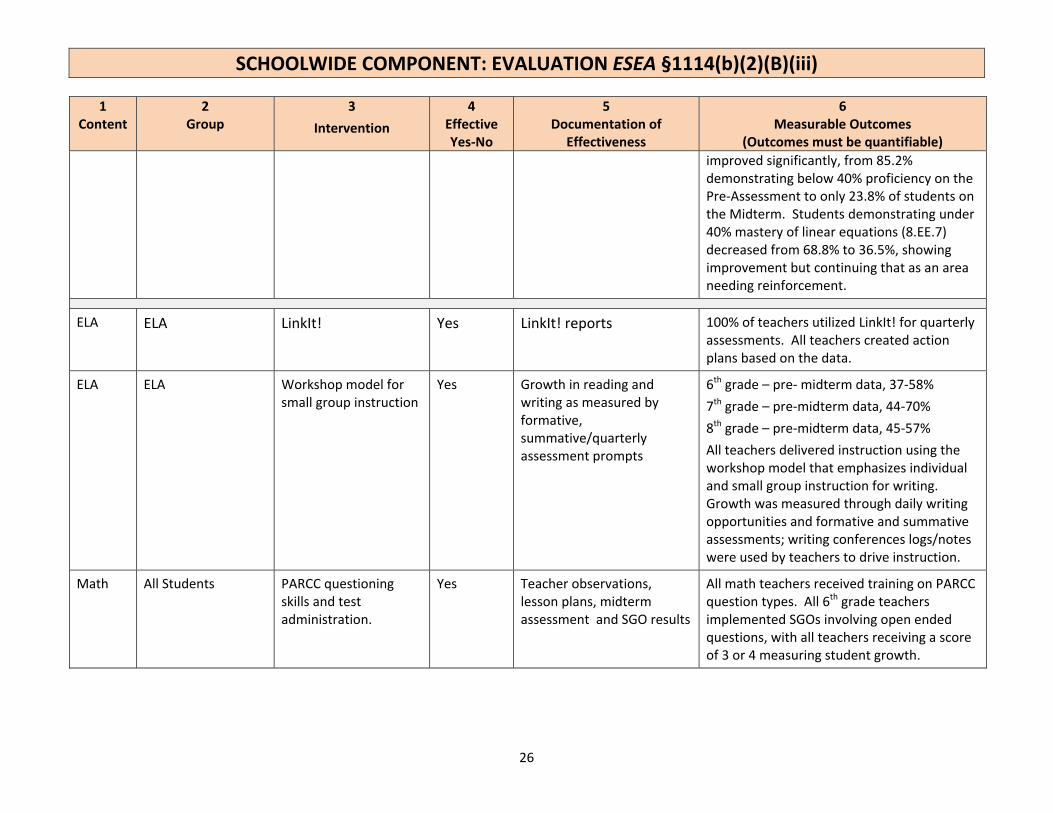
(Outcomes must be quantifiable) demonstrating below 40% proficiency on the Pre‐Assessment to only 23.8% of students on the Midterm. Students demonstrating below 40% mastery of linear equations (8.EE.7) decreased from 68.8% to 36.5%, showing improvement but continuing that as an area needing reinforcement.
ELA Economically Disadvantaged
Saturday PARCC prep No Pre and Post Assessment scores; attendance
There was significant growth shown from the pre‐assessment to the midterm for 6th‐8th grade. The average score of the pre‐assessment to the midterm is as follows: 6th grade – pre‐ midterm data, 37‐58% 7th grade – pre‐midterm data, 44‐70% 8th grade – pre‐midterm data, 45‐57%
Math Economically Disadvantaged
Saturday PARCC prep No Pre and Post Assessment scores; attendance
6th grade: Summary – Weaknesses were similar but improved from Pre‐Assessment to Midterm. Dividing multi‐digit numbers improved from 85.6% to 43.6% of students showing less than 40% mastery. Questions regarding measures of central tendency improved from 7.3% showing at least 60% mastery to 67.6%. 7th grade: Summary ‐ Writing and solving Equations (7.EE.4) is improving but still an area for continued improvement. Over 98% of students demonstrated less than 60% mastery on the Pre‐Assessment, compared to 57.5% on the Midterm. 8th Grade Pre‐Algebra: Summary‐ Summary: Operations with scientific notation (8.EE.4)
SCHOOLWIDE COMPONENT: EVALUATION ESEA §1114(b)(2)(B)(iii)
26
1 Content
2 Group
3 Intervention
4 Effective Yes‐No
5 Documentation of
Effectiveness
6 Measurable Outcomes
(Outcomes must be quantifiable) improved significantly, from 85.2% demonstrating below 40% proficiency on the Pre‐Assessment to only 23.8% of students on the Midterm. Students demonstrating under 40% mastery of linear equations (8.EE.7) decreased from 68.8% to 36.5%, showing improvement but continuing that as an area needing reinforcement.
ELA ELA LinkIt! Yes LinkIt! reports 100% of teachers utilized LinkIt! for quarterly assessments. All teachers created action plans based on the data.
ELA ELA Workshop model for small group instruction
Yes Growth in reading and writing as measured by formative, summative/quarterly assessment prompts
6th grade – pre‐ midterm data, 37‐58% 7th grade – pre‐midterm data, 44‐70% 8th grade – pre‐midterm data, 45‐57% All teachers delivered instruction using the workshop model that emphasizes individual and small group instruction for writing. Growth was measured through daily writing opportunities and formative and summative assessments; writing conferences logs/notes were used by teachers to drive instruction.
Math All Students PARCC questioning skills and test administration.
Yes Teacher observations, lesson plans, midterm assessment and SGO results
All math teachers received training on PARCC question types. All 6th grade teachers implemented SGOs involving open ended questions, with all teachers receiving a score of 3 or 4 measuring student growth.
SCHOOLWIDE COMPONENT: EVALUATION ESEA §1114(b)(2)(B)(iii)
27
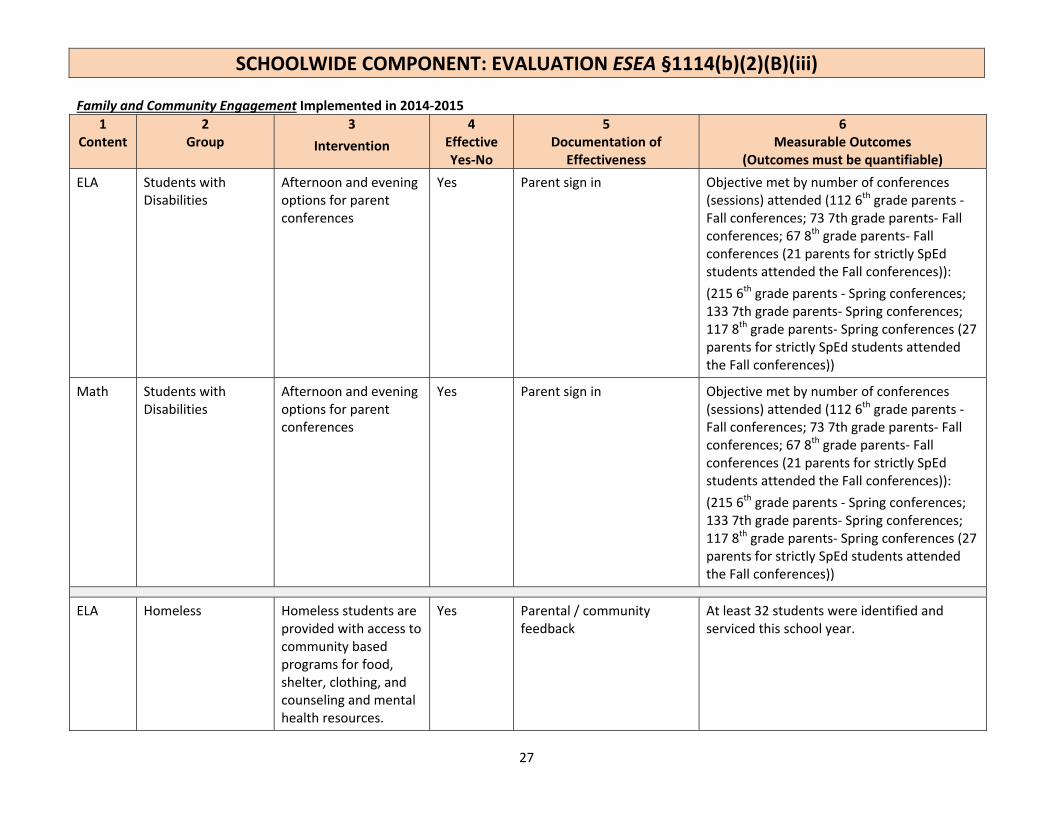
Family and Community Engagement Implemented in 2014‐2015 1
Content 2
Group 3
Intervention 4
Effective Yes‐No
5 Documentation of
Effectiveness
6 Measurable Outcomes
(Outcomes must be quantifiable) ELA Students with
Disabilities Afternoon and evening options for parent conferences
Yes Parent sign in Objective met by number of conferences (sessions) attended (112 6th grade parents ‐ Fall conferences; 73 7th grade parents‐ Fall conferences; 67 8th grade parents‐ Fall conferences (21 parents for strictly SpEd students attended the Fall conferences)): (215 6th grade parents ‐ Spring conferences; 133 7th grade parents‐ Spring conferences; 117 8th grade parents‐ Spring conferences (27 parents for strictly SpEd students attended the Fall conferences))
Math Students with Disabilities
Afternoon and evening options for parent conferences
Yes Parent sign in Objective met by number of conferences (sessions) attended (112 6th grade parents ‐ Fall conferences; 73 7th grade parents‐ Fall conferences; 67 8th grade parents‐ Fall conferences (21 parents for strictly SpEd students attended the Fall conferences)): (215 6th grade parents ‐ Spring conferences; 133 7th grade parents‐ Spring conferences; 117 8th grade parents‐ Spring conferences (27 parents for strictly SpEd students attended the Fall conferences))
ELA Homeless Homeless students are provided with access to community based programs for food, shelter, clothing, and counseling and mental health resources.
Yes Parental / community feedback
At least 32 students were identified and serviced this school year.

SCHOOLWIDE COMPONENT: EVALUATION ESEA §1114(b)(2)(B)(iii)
28
1 Content
2 Group
3 Intervention
4 Effective Yes‐No
5 Documentation of
Effectiveness
6 Measurable Outcomes
(Outcomes must be quantifiable) Math Homeless Homeless students are
provided with access to community based programs for food, shelter, clothing, and counseling and mental health resources.
Yes Parental / community feedback
At least 32 students were identified and serviced this school year.
ELA Migrant N/A
Math Migrant N/A
ELA ELLs Afternoon and evening options for parent conferences
Yes Parent sign in Objective met by number of conferences (sessions) attended (112 6th grade parents ‐ Fall conferences; 73 7th grade parents‐ Fall conferences; 67 8th grade parents‐ Fall conferences (21 parents for strictly SpEd students attended the Fall conferences)): (215 6th grade parents ‐ Spring conferences; 133 7th grade parents‐ Spring conferences; 117 8th grade parents‐ Spring conferences (27 parents for strictly SpEd students attended the Fall conferences))
Math ELLs Afternoon and evening options for parent conferences
Yes Parent sign in Objective met by number of conferences (sessions) attended (112 6th grade parents ‐ Fall conferences; 73 7th grade parents‐ Fall conferences; 67 8th grade parents‐ Fall conferences (21 parents for strictly SpEd students attended the Fall conferences)): (215 6th grade parents ‐ Spring conferences; 133 7th grade parents‐ Spring conferences; 117 8th grade parents‐ Spring conferences
SCHOOLWIDE COMPONENT: EVALUATION ESEA §1114(b)(2)(B)(iii)
29
1 Content
2 Group
3 Intervention
4 Effective Yes‐No
5 Documentation of
Effectiveness
6 Measurable Outcomes
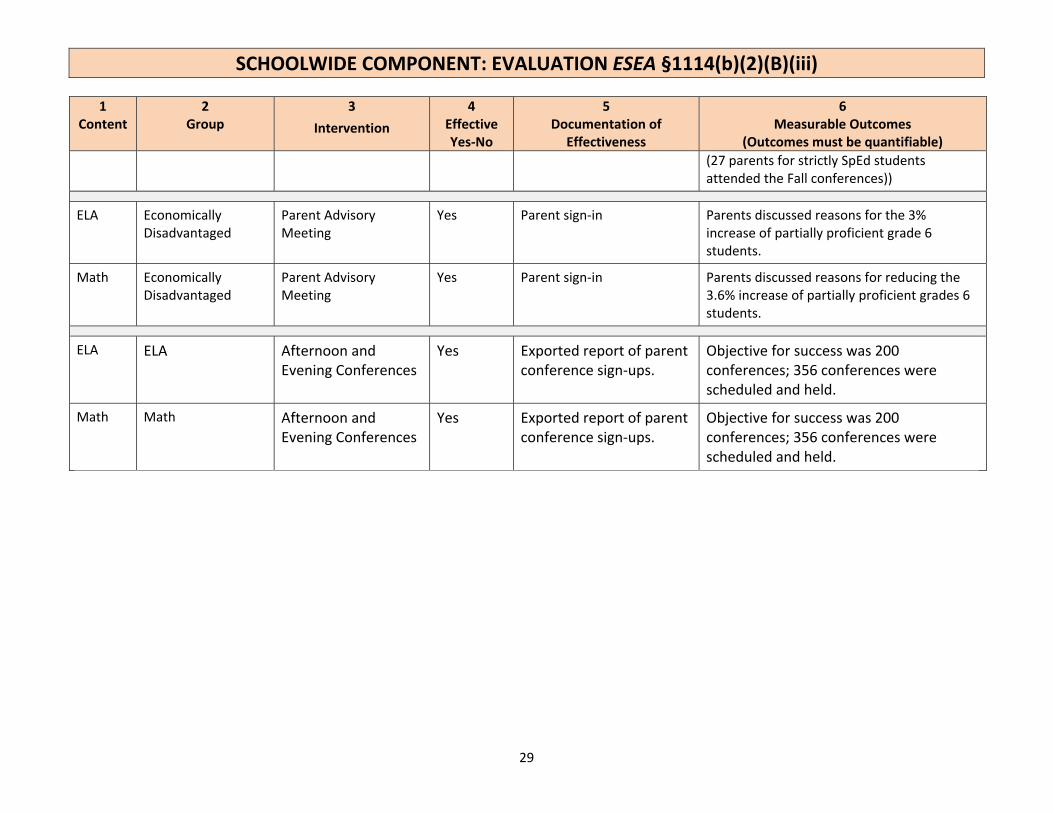
(Outcomes must be quantifiable) (27 parents for strictly SpEd students attended the Fall conferences))
ELA Economically Disadvantaged
Parent Advisory Meeting
Yes Parent sign‐in Parents discussed reasons for the 3% increase of partially proficient grade 6 students.
Math Economically Disadvantaged
Parent Advisory Meeting
Yes Parent sign‐in Parents discussed reasons for reducing the 3.6% increase of partially proficient grades 6 students.
ELA ELA Afternoon and Evening Conferences
Yes Exported report of parent conference sign‐ups.
Objective for success was 200 conferences; 356 conferences were scheduled and held.
Math Math Afternoon and Evening Conferences
Yes Exported report of parent conference sign‐ups.
Objective for success was 200 conferences; 356 conferences were scheduled and held.
SCHOOLWIDE COMPONENT: EVALUATION ESEA §1114(b)(2)(B)(iii)
30
Principal’s Certification The following certification must be completed by the principal of the school. Please Note: Signatures must be kept on file at the school. A scanned copy of the Evaluation form, with all appropriate signatures, must be included as part of the submission of the Schoolwide Plan. I certify that the school’s stakeholder/schoolwide committee conducted and completed the required Title I schoolwide evaluation as required for the completion of this Title I Schoolwide Plan. Per this evaluation, I concur with the information herein, including the identification of all programs and activities that were funded by Title I, Part A.
_____Mark Alfone ______________ __ ______________ _______6/15/15 ____ Principal’s Name (Print) Principal’s Signature Date
SCHOOLWIDE COMPONENT: COMPREHENSIVE NEEDS ASSESSMENT ESEA §1114 (b)(1)(A)
31
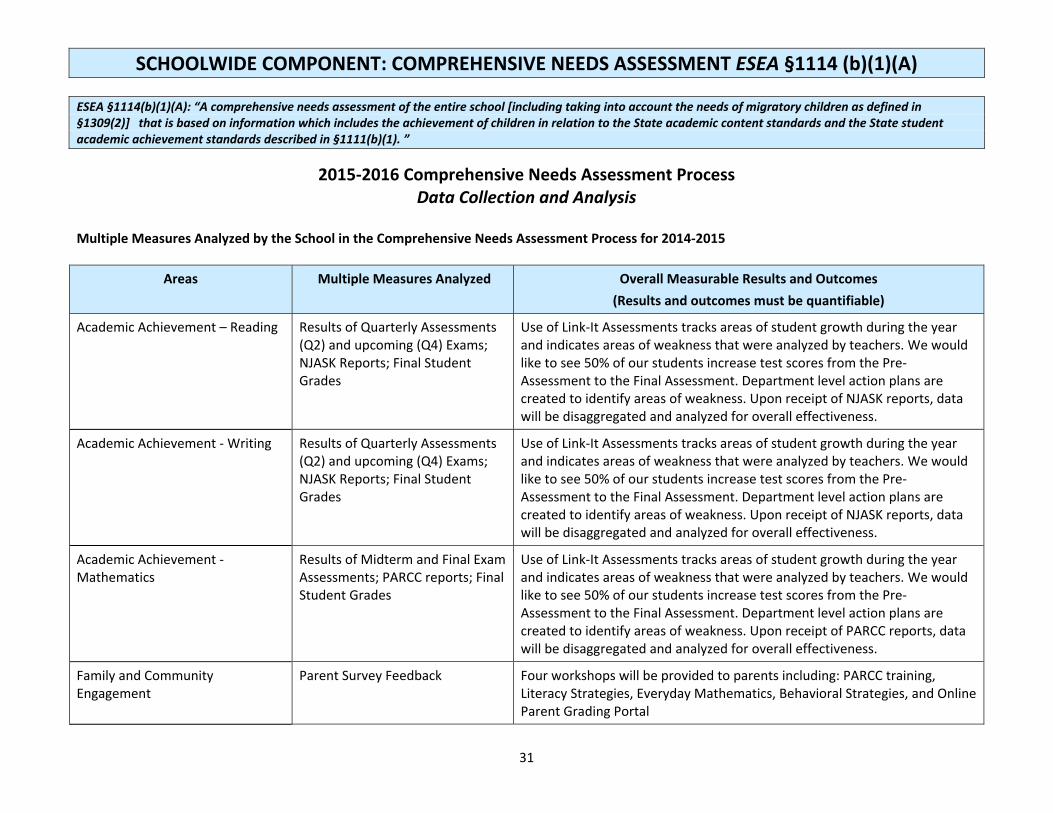
ESEA §1114(b)(1)(A): “A comprehensive needs assessment of the entire school [including taking into account the needs of migratory children as defined in §1309(2)] that is based on information which includes the achievement of children in relation to the State academic content standards and the State student academic achievement standards described in §1111(b)(1). ”
2015‐2016 Comprehensive Needs Assessment Process Data Collection and Analysis
Multiple Measures Analyzed by the School in the Comprehensive Needs Assessment Process for 2014‐2015
Areas Multiple Measures Analyzed Overall Measurable Results and Outcomes (Results and outcomes must be quantifiable)
Academic Achievement – Reading Results of Quarterly Assessments (Q2) and upcoming (Q4) Exams; NJASK Reports; Final Student Grades
Use of Link‐It Assessments tracks areas of student growth during the year and indicates areas of weakness that were analyzed by teachers. We would like to see 50% of our students increase test scores from the Pre‐Assessment to the Final Assessment. Department level action plans are created to identify areas of weakness. Upon receipt of NJASK reports, data will be disaggregated and analyzed for overall effectiveness.
Academic Achievement ‐ Writing Results of Quarterly Assessments (Q2) and upcoming (Q4) Exams; NJASK Reports; Final Student Grades
Use of Link‐It Assessments tracks areas of student growth during the year and indicates areas of weakness that were analyzed by teachers. We would like to see 50% of our students increase test scores from the Pre‐Assessment to the Final Assessment. Department level action plans are created to identify areas of weakness. Upon receipt of NJASK reports, data will be disaggregated and analyzed for overall effectiveness.
Academic Achievement ‐ Mathematics
Results of Midterm and Final Exam Assessments; PARCC reports; Final Student Grades
Use of Link‐It Assessments tracks areas of student growth during the year and indicates areas of weakness that were analyzed by teachers. We would like to see 50% of our students increase test scores from the Pre‐Assessment to the Final Assessment. Department level action plans are created to identify areas of weakness. Upon receipt of PARCC reports, data will be disaggregated and analyzed for overall effectiveness.
Family and Community Engagement
Parent Survey Feedback Four workshops will be provided to parents including: PARCC training, Literacy Strategies, Everyday Mathematics, Behavioral Strategies, and Online Parent Grading Portal
SCHOOLWIDE COMPONENT: COMPREHENSIVE NEEDS ASSESSMENT ESEA §1114 (b)(1)(A)
32
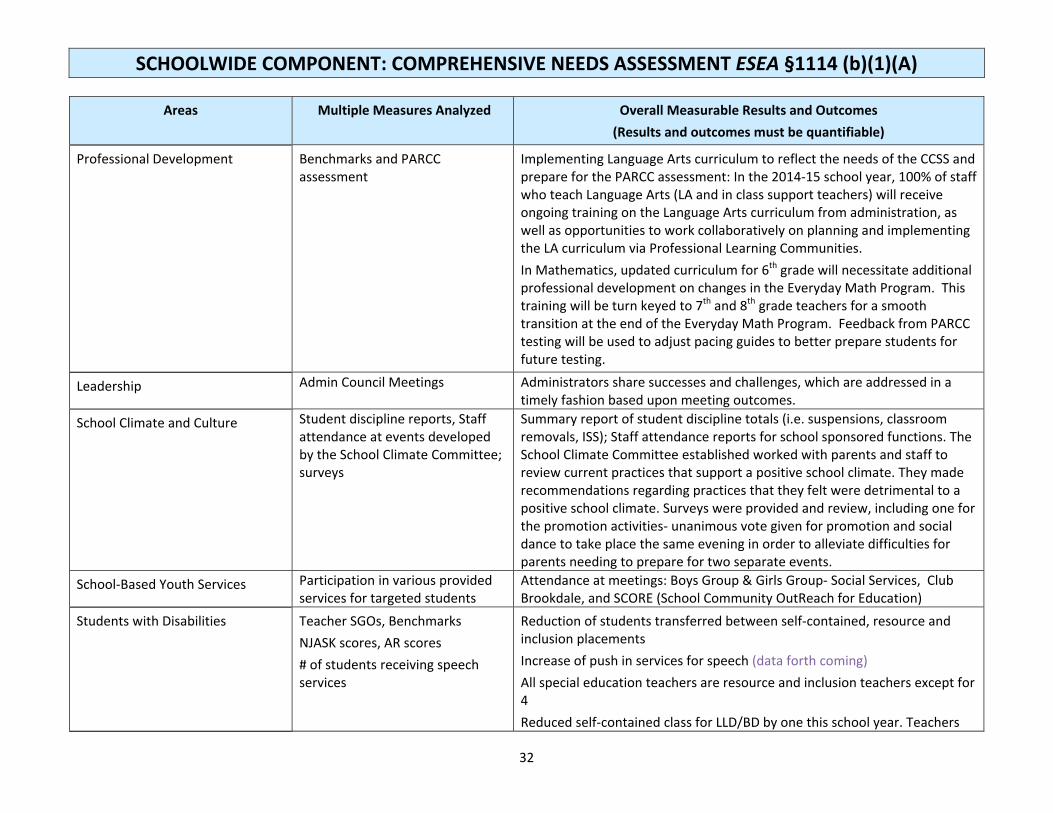
Areas Multiple Measures Analyzed Overall Measurable Results and Outcomes (Results and outcomes must be quantifiable)
Professional Development Benchmarks and PARCC assessment
Implementing Language Arts curriculum to reflect the needs of the CCSS and prepare for the PARCC assessment: In the 2014‐15 school year, 100% of staff who teach Language Arts (LA and in class support teachers) will receive ongoing training on the Language Arts curriculum from administration, as well as opportunities to work collaboratively on planning and implementing the LA curriculum via Professional Learning Communities. In Mathematics, updated curriculum for 6th grade will necessitate additional professional development on changes in the Everyday Math Program. This training will be turn keyed to 7th and 8th grade teachers for a smooth transition at the end of the Everyday Math Program. Feedback from PARCC testing will be used to adjust pacing guides to better prepare students for future testing.
Leadership Admin Council Meetings Administrators share successes and challenges, which are addressed in a timely fashion based upon meeting outcomes.
School Climate and Culture Student discipline reports, Staff attendance at events developed by the School Climate Committee; surveys
Summary report of student discipline totals (i.e. suspensions, classroom removals, ISS); Staff attendance reports for school sponsored functions. The School Climate Committee established worked with parents and staff to review current practices that support a positive school climate. They made recommendations regarding practices that they felt were detrimental to a positive school climate. Surveys were provided and review, including one for the promotion activities‐ unanimous vote given for promotion and social dance to take place the same evening in order to alleviate difficulties for parents needing to prepare for two separate events.
School‐Based Youth Services Participation in various provided services for targeted students
Attendance at meetings: Boys Group & Girls Group‐ Social Services, Club Brookdale, and SCORE (School Community OutReach for Education)
Students with Disabilities Teacher SGOs, Benchmarks NJASK scores, AR scores # of students receiving speech services
Reduction of students transferred between self‐contained, resource and inclusion placements Increase of push in services for speech (data forth coming) All special education teachers are resource and inclusion teachers except for 4 Reduced self‐contained class for LLD/BD by one this school year. Teachers

SCHOOLWIDE COMPONENT: COMPREHENSIVE NEEDS ASSESSMENT ESEA §1114 (b)(1)(A)
33
Areas Multiple Measures Analyzed Overall Measurable Results and Outcomes (Results and outcomes must be quantifiable)
rotate into one self‐contained class instead of having one teacher teach all four subjects at multiple grade levels Increased number of students who are hearing impaired attending the middle school from the elementary school Students with a disability are not failing courses due to Benchmarks (the current reasons are being identified in order to be addressed for the 2015‐2016 school year)
Homeless Students Report of Homeless Students (Provided by District Liaison); NJASK and benchmarks
School Homeless Liaison & Title I Coordinator ensures students listed are provided services. Based on previous data students continue to read below grade level, with grades declining from 6th through 8th grade. Students will increase in their level of English language proficiency.
Migrant Students N/A
English Language Learners Results of Final Exams; ACCESS for ELLs Results; and final student grades
Use of LinkIt Assessments tracks areas of student growth during the year and indicates areas of weakness that can be analyzed by 2015‐16 teachers. We would like to see 50% of our students increase test scores from the Pre‐Assessment to the Final Assessment and utilizing WIDA standards in conjunction with the Common Core.
Economically Disadvantaged LinkIt! Benchmark Assessments and Student Growth Objectives (SGOs)
Not all economically disadvantaged students are academically at risk. We will desegregate the data in the SGOs.
SCHOOLWIDE COMPONENT: COMPREHENSIVE NEEDS ASSESSMENT ESEA §1114 (b)(1)(A)
34
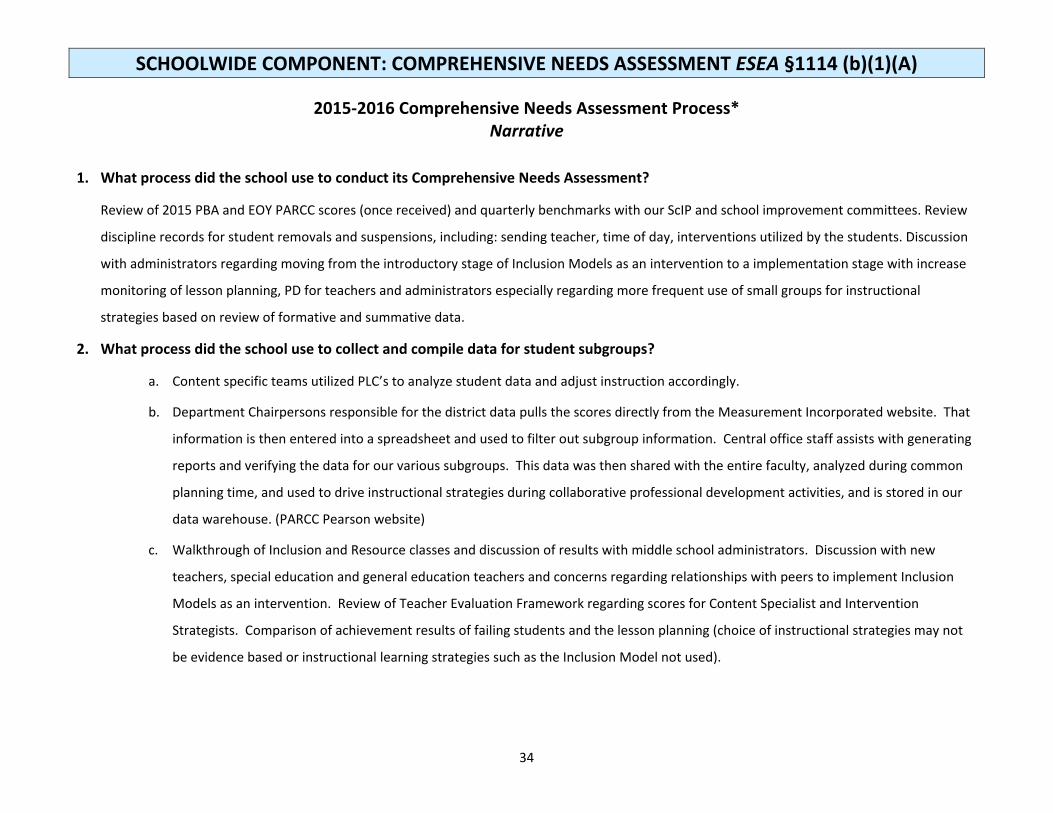
2015‐2016 Comprehensive Needs Assessment Process* Narrative
1. What process did the school use to conduct its Comprehensive Needs Assessment?
Review of 2015 PBA and EOY PARCC scores (once received) and quarterly benchmarks with our ScIP and school improvement committees. Review
discipline records for student removals and suspensions, including: sending teacher, time of day, interventions utilized by the students. Discussion
with administrators regarding moving from the introductory stage of Inclusion Models as an intervention to a implementation stage with increase
monitoring of lesson planning, PD for teachers and administrators especially regarding more frequent use of small groups for instructional
strategies based on review of formative and summative data.
2. What process did the school use to collect and compile data for student subgroups?
a. Content specific teams utilized PLC’s to analyze student data and adjust instruction accordingly.
b. Department Chairpersons responsible for the district data pulls the scores directly from the Measurement Incorporated website. That
information is then entered into a spreadsheet and used to filter out subgroup information. Central office staff assists with generating
reports and verifying the data for our various subgroups. This data was then shared with the entire faculty, analyzed during common
planning time, and used to drive instructional strategies during collaborative professional development activities, and is stored in our
data warehouse. (PARCC Pearson website)
c. Walkthrough of Inclusion and Resource classes and discussion of results with middle school administrators. Discussion with new
teachers, special education and general education teachers and concerns regarding relationships with peers to implement Inclusion
Models as an intervention. Review of Teacher Evaluation Framework regarding scores for Content Specialist and Intervention
Strategists. Comparison of achievement results of failing students and the lesson planning (choice of instructional strategies may not
be evidence based or instructional learning strategies such as the Inclusion Model not used).
SCHOOLWIDE COMPONENT: COMPREHENSIVE NEEDS ASSESSMENT ESEA §1114 (b)(1)(A)
35
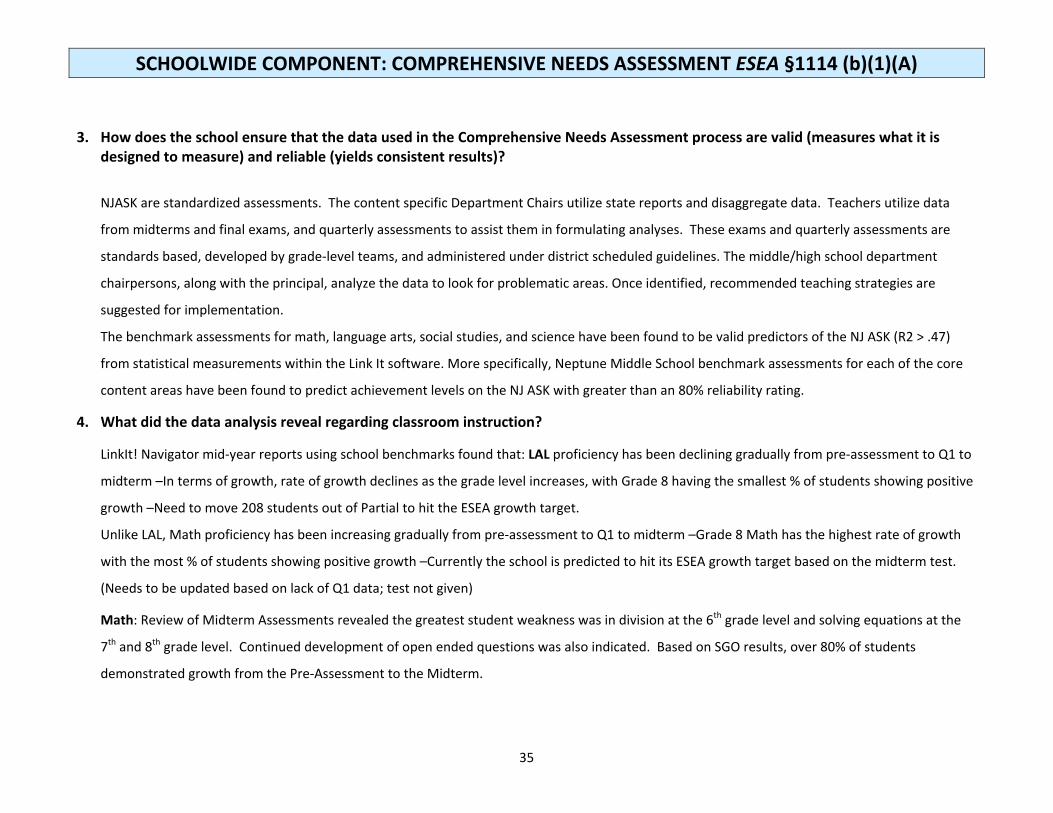
3. How does the school ensure that the data used in the Comprehensive Needs Assessment process are valid (measures what it is designed to measure) and reliable (yields consistent results)? NJASK are standardized assessments. The content specific Department Chairs utilize state reports and disaggregate data. Teachers utilize data
from midterms and final exams, and quarterly assessments to assist them in formulating analyses. These exams and quarterly assessments are
standards based, developed by grade‐level teams, and administered under district scheduled guidelines. The middle/high school department
chairpersons, along with the principal, analyze the data to look for problematic areas. Once identified, recommended teaching strategies are
suggested for implementation.
The benchmark assessments for math, language arts, social studies, and science have been found to be valid predictors of the NJ ASK (R2 > .47)
from statistical measurements within the Link It software. More specifically, Neptune Middle School benchmark assessments for each of the core
content areas have been found to predict achievement levels on the NJ ASK with greater than an 80% reliability rating.
4. What did the data analysis reveal regarding classroom instruction?
LinkIt! Navigator mid‐year reports using school benchmarks found that: LAL proficiency has been declining gradually from pre‐assessment to Q1 to
midterm –In terms of growth, rate of growth declines as the grade level increases, with Grade 8 having the smallest % of students showing positive
growth –Need to move 208 students out of Partial to hit the ESEA growth target.
Unlike LAL, Math proficiency has been increasing gradually from pre‐assessment to Q1 to midterm –Grade 8 Math has the highest rate of growth
with the most % of students showing positive growth –Currently the school is predicted to hit its ESEA growth target based on the midterm test.
(Needs to be updated based on lack of Q1 data; test not given)
Math: Review of Midterm Assessments revealed the greatest student weakness was in division at the 6th grade level and solving equations at the
7th and 8th grade level. Continued development of open ended questions was also indicated. Based on SGO results, over 80% of students
demonstrated growth from the Pre‐Assessment to the Midterm.

SCHOOLWIDE COMPONENT: COMPREHENSIVE NEEDS ASSESSMENT ESEA §1114 (b)(1)(A)
36
Special Education: Further professional development is needed for both administrator and teachers regarding evidence based strategies for
Resource and Inclusion classes.
5. What did the data analysis reveal regarding professional development implemented in the previous year(s)?
Analysis of our math assessments found increased proficiency levels with each assessment as teachers and students successfully adapted to the
transition of students from Everyday Math to a more traditional program. Continued LinkIt! training enabled teachers to use the data to identify
areas of student weakness and develop targeted standards‐based lessons for students as needed, leading to increased proficiency on subsequent
quarterly assessments analyzed in LinkIt! PD for ELA 6th grade Writer’s Workshop has yielded positive feedback from teachers for the first year of
this program. With limited availability of PARCC style questions within the LinkIt! program, data analysis is limited in determining the effectiveness
of professional development related to PARCC, however discussions with the LinkIt! developers have already taken place to address this. Special
Education: The knowledge base of Inclusion Models is increasing. Verbiage by teachers on lesson plans and by administrators on evaluation
documents or feedback is more frequently used. Professional development for Inclusion needs to move from an introduction stage to an
implementation stage. Evaluation of the professional development provided versus actual implementation by teachers and/or administrators
needs to occur more frequently in order to sustain the learning and to be consistent between departments in order to impact the culture of the
school to be “Inclusive”.
6. How does the school identify educationally at‐risk students in a timely manner?
Using Link‐It Assessments throughout the year to track areas of student growth and identify areas of weakness that can be promptly analyzed by
teachers.
7. How does the school provide effective interventions to educationally at‐risk students?
Through the implementation of daily/weekly programs (Teen Outreach Program; SCORE family mentoring; Girls’ Group & Boys’ Group; PARCC Test
Prep) and extended‐day (homework help) and year programs (e.g. NASA).
8. How does the school address the needs of migrant students?
N/A ‐ We do not have a migrant population
SCHOOLWIDE COMPONENT: COMPREHENSIVE NEEDS ASSESSMENT ESEA §1114 (b)(1)(A)
37
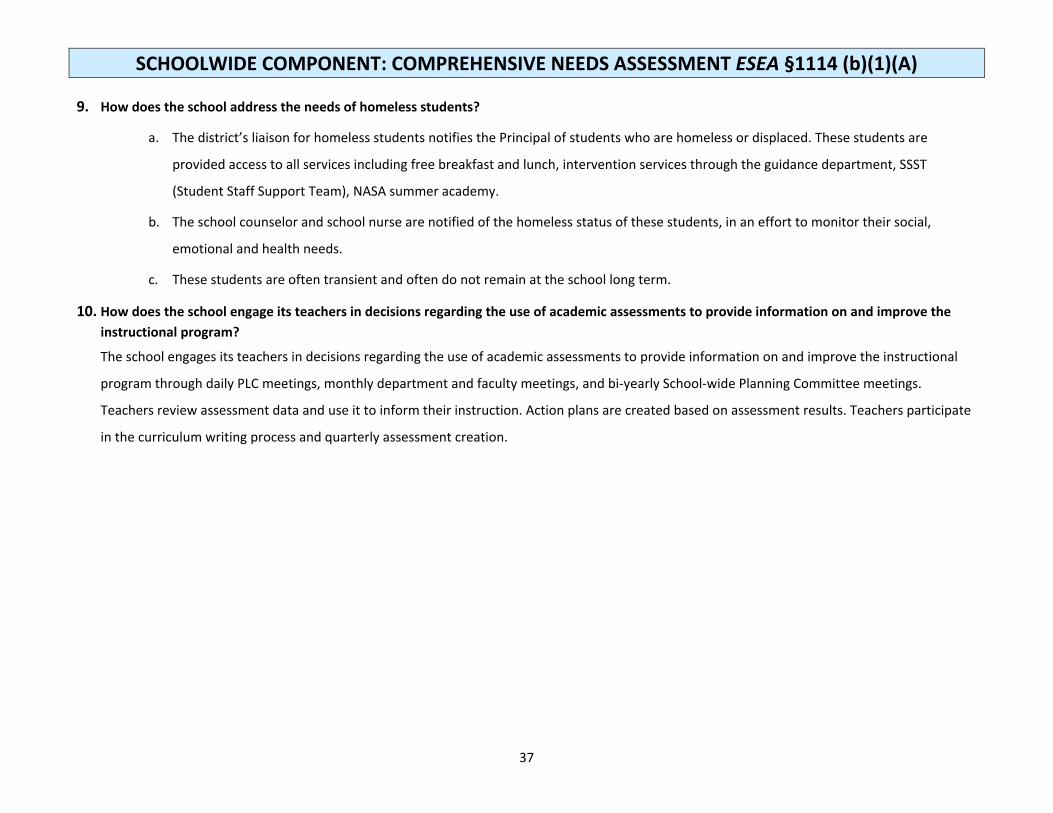
9. How does the school address the needs of homeless students?
a. The district’s liaison for homeless students notifies the Principal of students who are homeless or displaced. These students are
provided access to all services including free breakfast and lunch, intervention services through the guidance department, SSST
(Student Staff Support Team), NASA summer academy.
b. The school counselor and school nurse are notified of the homeless status of these students, in an effort to monitor their social,
emotional and health needs.
c. These students are often transient and often do not remain at the school long term.
10. How does the school engage its teachers in decisions regarding the use of academic assessments to provide information on and improve the instructional program?
The school engages its teachers in decisions regarding the use of academic assessments to provide information on and improve the instructional
program through daily PLC meetings, monthly department and faculty meetings, and bi‐yearly School‐wide Planning Committee meetings.
Teachers review assessment data and use it to inform their instruction. Action plans are created based on assessment results. Teachers participate
in the curriculum writing process and quarterly assessment creation.

SCHOOLWIDE COMPONENT: COMPREHENSIVE NEEDS ASSESSMENT ESEA §1114 (b)(1)(A)
38
11. How does the school help students transition from preschool to kindergarten, elementary to middle school, and/or middle to high school?
The department chairpersons provide vertical articulation between school levels. The MS and HS conduct two‐day Summer Transition Programs for
incoming 6th and 9th graders and their parents. Writer’s Workshop will continue to be implemented in 6th grade classes with the addition of 7th
grade training during the 2015‐2016 school year. This program is currently used in the elementary language arts class. 8th grade instruction
continues to feature research based analytical writing as demanded by the Common Core and PARCC expectations. During the year, four 8th grade
teachers were invited to spend time at the high school to observe classes and meet with teachers. This allowed teachers to see the expectations at
the high school and begin to implement strategies that will ease the transition from middle school to high school. Students who are deaf or autistic
during their 5th grade year along with teachers and their parents were invited to tour the middle school and to learn of the programs available.
Eighth grade students of the MD program will visit the high school and meet their future teachers in the 9th grade MD program. Students will also
be introduced to additional programs at the high school such as Structure Learning.
12. How did the school select the priority problems and root causes for the 2015‐2016 schoolwide plan?
Through collaborative efforts of the School‐wide Planning Committee members, based on results of quantitative measures gathered from
benchmark assessments (via Link It) and NJ ASK scores (PARCC scores not available yet). Additionally, priority problem (parent communications)
was identified through surveys, parent attendance at school events, and antidotal evidence gathered through PLC discussions and general
feedback.
*Provide a separate response for each question.

SCHOOLWIDE COMPONENT: COMPREHENSIVE NEEDS ASSESSMENT ESEA §1114 (b)(1)(A)
39
2015‐2016 Comprehensive Needs Assessment Process Description of Priority Problems and Interventions to Address Them
Based upon the school’s needs assessment, select at least three (3) priority problems that will be addressed in this plan. Complete the information below for each priority problem.
#1 #2
Name of priority problem English Language Arts Literacy (CCSS) – Analytical reading and writing skills across the content areas
Continued transition of instruction to promote success on PARCC Assessments.
Describe the priority problem using at least two data sources
Utilizing Quarterly ELA pre‐assessments; Quarterly 2 Assessments and various formative/summative classroom assessments; there is a need to increase proficiency in ELA achievement. Other content areas assessments should reflect analytical reading and writing skills.
NJASK results continue to show the need for improvement in both math and LAL; Student and teacher survey feedback from the PARCC administration
Describe the root causes of the problem
New types of writing and the focus on writing to texts based on the CCSS. Below grade level readers challenged with reading complex. Insufficient implementation of ELA writing and reading standards for Social Studies and Science in lessons and assessments; inconsistent differentiation of instruction.
Format of assessment has changed significantly, requiring ongoing teacher and student training on this new computer‐based test; including question types, typing and technology skills for students, and administration of online testing.
Subgroups or populations addressed
All students, including Special Education, African American Students, and Economically Disadvantaged Students.
All subgroups and populations
Related content area missed (i.e., ELA, Mathematics)
ELA Math and LAL
Name of scientifically research based intervention to address priority problems
Writer’s Workshop Model to be implemented with 6th and 7th grades in 2015‐16; Close Reading; writing to texts in response to reading/ text dependent questions; grade level Common Core/PARCC based formative and
Administration of online assessments
SCHOOLWIDE COMPONENT: COMPREHENSIVE NEEDS ASSESSMENT ESEA §1114 (b)(1)(A)
40
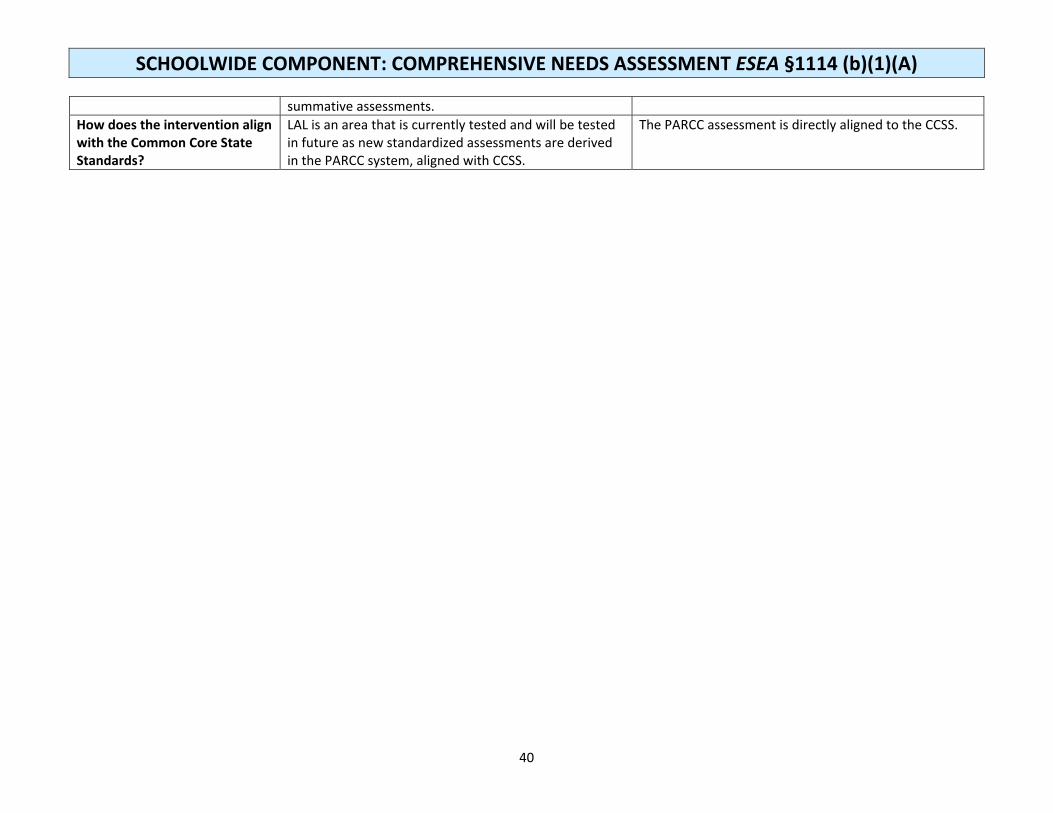
summative assessments. How does the intervention align with the Common Core State Standards?
LAL is an area that is currently tested and will be tested in future as new standardized assessments are derived in the PARCC system, aligned with CCSS.
The PARCC assessment is directly aligned to the CCSS.
SCHOOLWIDE COMPONENT: COMPREHENSIVE NEEDS ASSESSMENT ESEA §1114 (b)(1)(A)
41
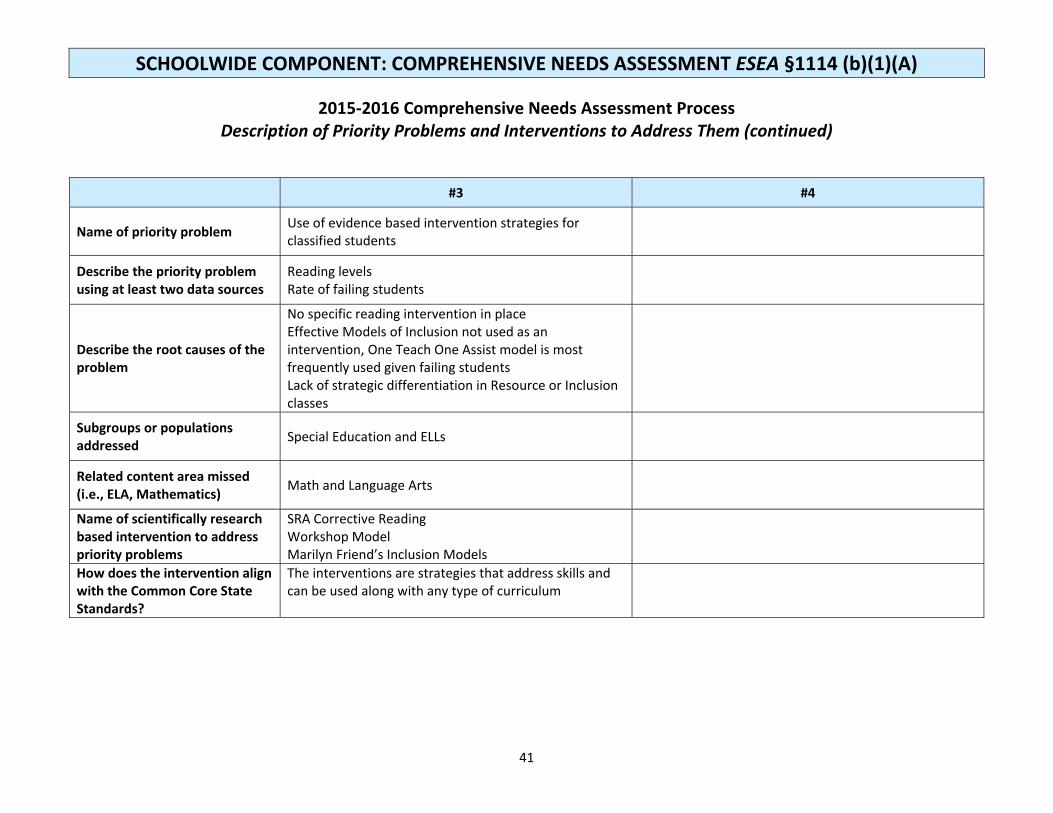
2015‐2016 Comprehensive Needs Assessment Process Description of Priority Problems and Interventions to Address Them (continued)
#3 #4
Name of priority problem Use of evidence based intervention strategies for classified students
Describe the priority problem using at least two data sources
Reading levels Rate of failing students
Describe the root causes of the problem
No specific reading intervention in place Effective Models of Inclusion not used as an intervention, One Teach One Assist model is most frequently used given failing students Lack of strategic differentiation in Resource or Inclusion classes
Subgroups or populations addressed Special Education and ELLs
Related content area missed (i.e., ELA, Mathematics) Math and Language Arts
Name of scientifically research based intervention to address priority problems
SRA Corrective Reading Workshop Model Marilyn Friend’s Inclusion Models
How does the intervention align with the Common Core State Standards?
The interventions are strategies that address skills and can be used along with any type of curriculum

SCHOOLWIDE COMPONENT: Reform Strategies ESEA §(b)(1)(B)(i‐iii)
42
ESEA §1114(b) Components of a Schoolwide Program: A schoolwide program shall include . . . schoolwide reform strategies that . . . “ Plan Components for 2013
2015‐2016 Interventions to Address Student Achievement ESEA §1114(b)(I)(B) strengthen the core academic program in the school;
Content Area Focus
Target Population(s)
Name of Intervention
Person Responsible
Indicators of Success (Measurable
Evaluation Outcomes)
Research Supporting Intervention (i.e., IES Practice Guide or What Works Clearinghouse)
ELA Students with Disabilities
‐SRA ‐Inclusion Models ‐Workshop Model
C. Wells C. Wells C. Wells/H. Wilkins
‐Increased reading scores ‐Models referenced in lesson plans, increase implementation of small group instruction, less student failures ‐Increased student writing and small group conferences
‐What Works Clearing House ‐Danielson Framework for Special Education Teachers ‐Marilyn Friend Inclusion Model ‐SRA Corrective Reading research articles ‐NJDOE special education resource “Three Tiered ELA Instructional Process” by Neal Webster http://www.state.nj.us/education/specialed/
Math Students with Disabilities
‐Scaffolding and learning strategies ‐Inclusion Model
C. Well/C. Kolinofsky
‐Increase use of scaffolds ‐Increased student work showing use of scaffolds ‐Models referenced in lesson plans, increase implementation of small group instruction, less student failures
‐NJDOE special education math webinars by Paul Riccomini http://www.state.nj.us/education/specialed/‐Danielson Framework for Special Education Teachers ‐Marilyn Friend Inclusion Model
ELA/Mathematics Homeless Neptune Academic Summer Academy (NASA)
Math/ELA dept. Chair
NASA Students selection on a district‐created multiple measures
What Works Clearinghouse Using Student Achievement Data to Support Instructional Decision Making
SCHOOLWIDE COMPONENT: Reform Strategies ESEA §(b)(1)(B)(i‐iii)
43
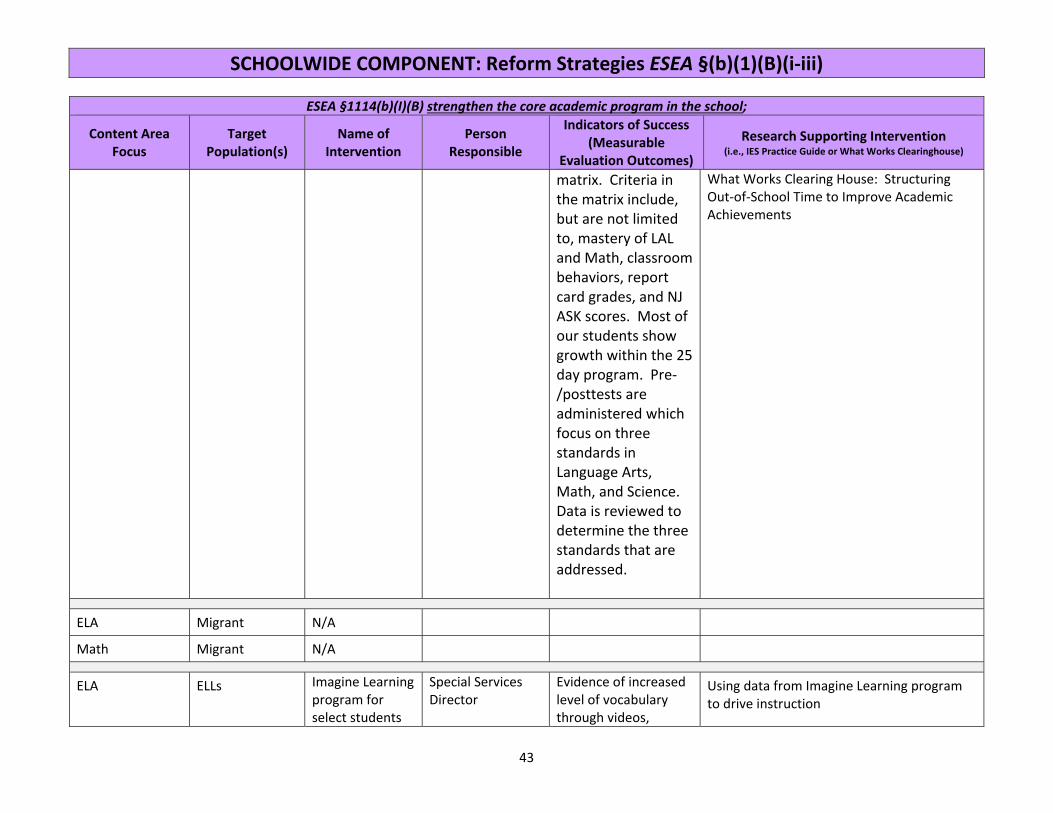
ESEA §1114(b)(I)(B) strengthen the core academic program in the school;
Content Area Focus
Target Population(s)
Name of Intervention
Person Responsible
Indicators of Success (Measurable
Evaluation Outcomes)
Research Supporting Intervention (i.e., IES Practice Guide or What Works Clearinghouse)
matrix. Criteria in the matrix include, but are not limited to, mastery of LAL and Math, classroom behaviors, report card grades, and NJ ASK scores. Most of our students show growth within the 25 day program. Pre‐/posttests are administered which focus on three standards in Language Arts, Math, and Science. Data is reviewed to determine the three standards that are addressed.
What Works Clearing House: Structuring Out‐of‐School Time to Improve Academic Achievements
ELA Migrant N/A
Math Migrant N/A
ELA ELLs Imagine Learning program for select students
Special Services Director
Evidence of increased level of vocabulary through videos,
Using data from Imagine Learning program to drive instruction
SCHOOLWIDE COMPONENT: Reform Strategies ESEA §(b)(1)(B)(i‐iii)
44
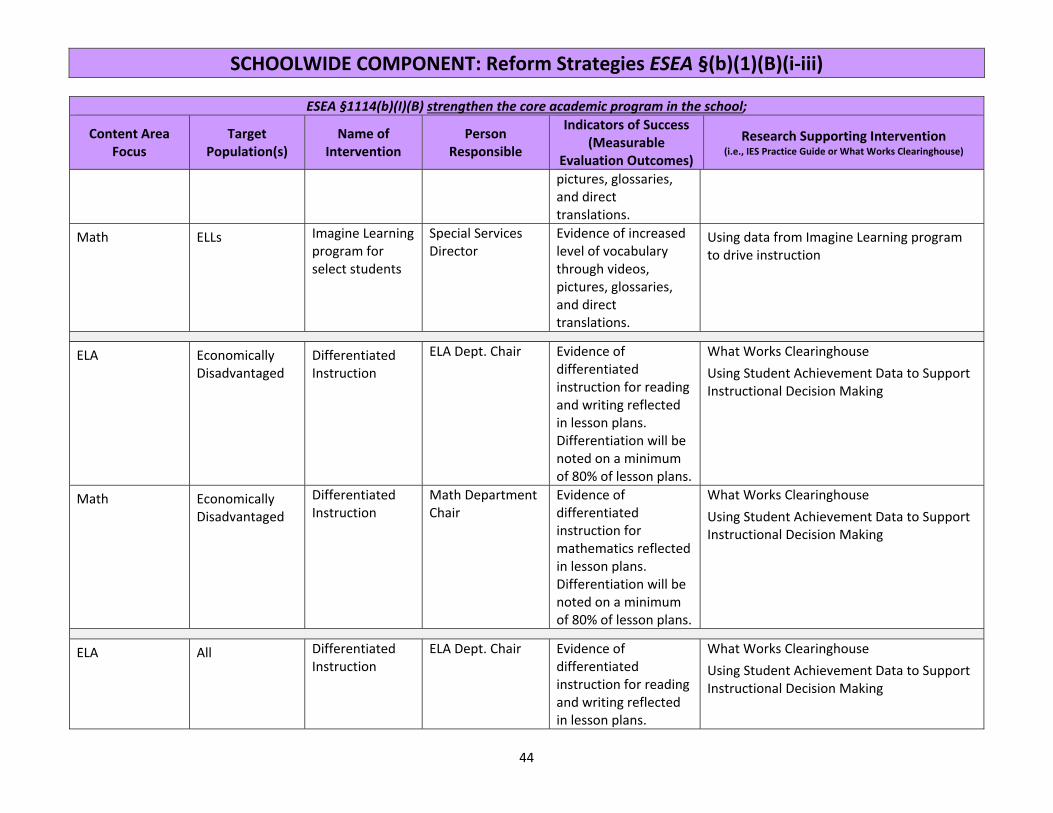
ESEA §1114(b)(I)(B) strengthen the core academic program in the school;
Content Area Focus
Target Population(s)
Name of Intervention
Person Responsible
Indicators of Success (Measurable
Evaluation Outcomes)
Research Supporting Intervention (i.e., IES Practice Guide or What Works Clearinghouse)
pictures, glossaries, and direct translations.
Math ELLs Imagine Learning program for select students
Special Services Director
Evidence of increased level of vocabulary through videos, pictures, glossaries, and direct translations.
Using data from Imagine Learning program to drive instruction
ELA Economically Disadvantaged
Differentiated Instruction
ELA Dept. Chair Evidence of differentiated instruction for reading and writing reflected in lesson plans. Differentiation will be noted on a minimum of 80% of lesson plans.
What Works Clearinghouse Using Student Achievement Data to Support Instructional Decision Making
Math Economically Disadvantaged
Differentiated Instruction
Math Department Chair
Evidence of differentiated instruction for mathematics reflected in lesson plans. Differentiation will be noted on a minimum of 80% of lesson plans.
What Works Clearinghouse Using Student Achievement Data to Support Instructional Decision Making
ELA All Differentiated Instruction
ELA Dept. Chair Evidence of differentiated instruction for reading and writing reflected in lesson plans.
What Works Clearinghouse Using Student Achievement Data to Support Instructional Decision Making

SCHOOLWIDE COMPONENT: Reform Strategies ESEA §(b)(1)(B)(i‐iii)
45
ESEA §1114(b)(I)(B) strengthen the core academic program in the school;
Content Area Focus
Target Population(s)
Name of Intervention
Person Responsible
Indicators of Success (Measurable
Evaluation Outcomes)
Research Supporting Intervention (i.e., IES Practice Guide or What Works Clearinghouse)
Differentiation will be noted on a minimum of 80% of lesson plans.
ELA 6‐8th students reading below grade level
Accelerated Reader
ELA Department Chair
STAR reports, AR quiz, various reports in AR; IRL scores will increase by a minimum average of 25% for students reading below grade level.
What Works Clearinghouse Using Student Achievement Data to Support Instructional Decision Making
ELA 6th grade ELA Writer’s Workshop
ELA Department Chair
Daily routine writing (Common Core/PARCC focus), modeled lessons, mini‐lessons, small group instruction; Targeted interventions will be noted on a minimum of 80% of teacher‐student writing conference notes.
What Works Clearinghouse Using Student Achievement Data to Support Instructional Decision Making
ELA All Writing Conferences
ELA Department Chair
Daily routine writing (Common Core/PARCC focus), modeled lessons, mini‐lessons, small group instruction; Targeted interventions will be noted on a minimum of 80% of teacher‐student writing
What Works Clearinghouse Using Student Achievement Data to Support Instructional Decision Making

SCHOOLWIDE COMPONENT: Reform Strategies ESEA §(b)(1)(B)(i‐iii)
46
ESEA §1114(b)(I)(B) strengthen the core academic program in the school;
Content Area Focus
Target Population(s)
Name of Intervention
Person Responsible
Indicators of Success (Measurable
Evaluation Outcomes)
Research Supporting Intervention (i.e., IES Practice Guide or What Works Clearinghouse)
conference notes. ELA All Assessments
with Link‐It Analysis
Department Chair Common Core State Standards, reports analyzing mastery of Standards. A minimum average of 50% of students will increase at least 20% points on their final exam in comparison to the pre‐assessment.
Using Student Achievement Data to Support Instructional Decision Making
Math All Students Differentiated Instruction
Math Department Chair
Evidence of differentiated instruction for mathematics reflected in lesson plans. Differentiation will be noted on a minimum of 80% of lesson plans.
What Works Clearinghouse Using Student Achievement Data to Support Instructional Decision Making
Math All Students Assessments with Link‐It Analysis
Department Chair Common Core State Standards, reports analyzing mastery of Standards. A minimum average of 50% of students will increase at least 20% points on their final exam in comparison to the pre‐assessment.
Using Student Achievement Data to Support Instructional Decision Making
*Use an asterisk to denote new programs.

SCHOOLWIDE COMPONENT: Reform Strategies ESEA §(b)(1)(B)(i‐iii)
47
2015‐2016 Extended Learning Time and Extended Day/Year Interventions to Address Student Achievement ESEA §1114(b)(I)(B) increase the amount and quality of learning time, such as providing an extended school year and before‐ and after‐school and summer programs and opportunities, and help provide an enriched and accelerated curriculum;
Content Area Focus
Target Population(s) Name of Intervention Person
Responsible
Indicators of Success (Measurable Evaluation
Outcomes)
Research Supporting Intervention (i.e., IES Practice Guide or What Works
Clearinghouse)
ELA Students with Disabilities
Extended School Year opportunities for classified students (5 week program 5 days per week)
Sp Ser Director
bench mark assessments ‐Special Education Code requirements regarding regression/recoupment
Math Students with Disabilities
Extended School Year opportunities for classified students (5 week program 5 days per week)
Sp Ser Director
bench mark assessments Special Education Code requirements regarding regression/recoupment
ELA Homeless Continued use of the Neptune Academic Summer Academy (NASA)
Math & ELA Department Chairs
Neptune Academic Summer Academy (NASA): Students selection on a district‐created multiple measures matrix. Criteria in the matrix include, but are not limited to, mastery of LAL and Math, classroom behaviors, report card grades, and NJ ASK scores. Most of our students show growth within the 25 day program. Pre‐/posttests are administered which focus on three standards in Language Arts, Math, and Science. Data is
What Works Clearinghouse Using Student Achievement Data to Support Instructional Decision Making What Works Clearing House: Structuring Out‐of‐School Time to Improve Academic Achievements
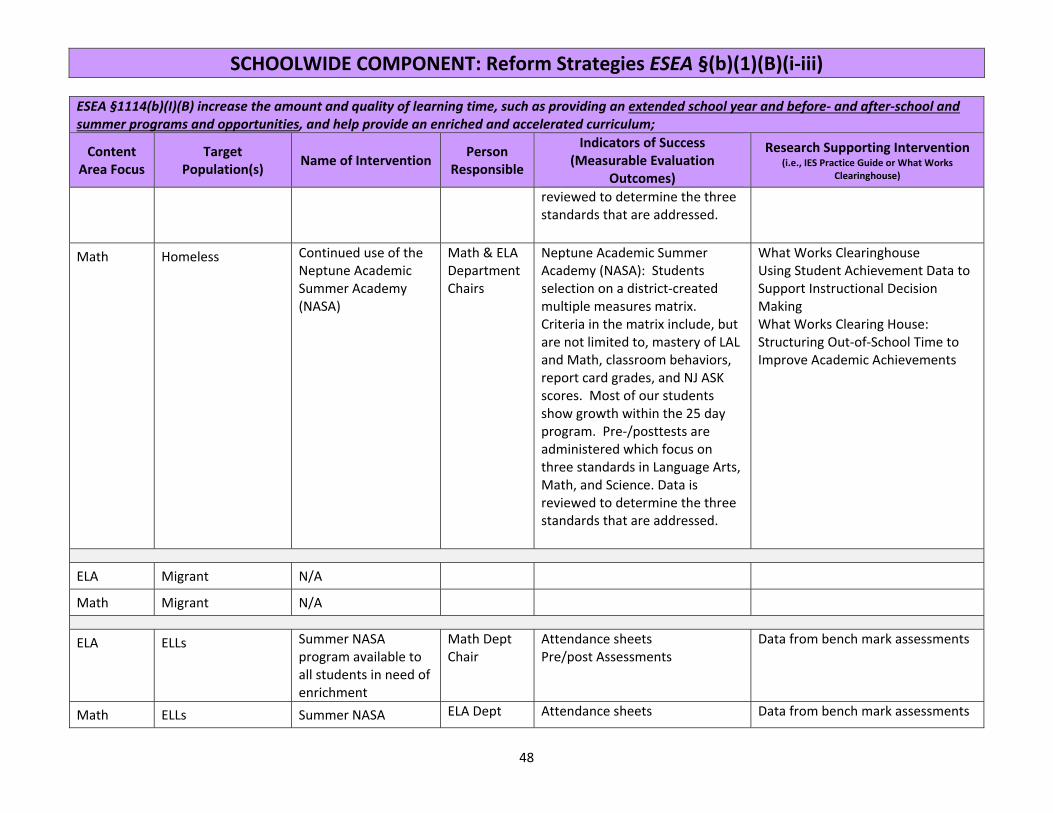
SCHOOLWIDE COMPONENT: Reform Strategies ESEA §(b)(1)(B)(i‐iii)
48
ESEA §1114(b)(I)(B) increase the amount and quality of learning time, such as providing an extended school year and before‐ and after‐school and summer programs and opportunities, and help provide an enriched and accelerated curriculum;
Content Area Focus
Target Population(s) Name of Intervention Person
Responsible
Indicators of Success (Measurable Evaluation
Outcomes)
Research Supporting Intervention (i.e., IES Practice Guide or What Works
Clearinghouse) reviewed to determine the three standards that are addressed.
Math Homeless Continued use of the Neptune Academic Summer Academy (NASA)
Math & ELA Department Chairs
Neptune Academic Summer Academy (NASA): Students selection on a district‐created multiple measures matrix. Criteria in the matrix include, but are not limited to, mastery of LAL and Math, classroom behaviors, report card grades, and NJ ASK scores. Most of our students show growth within the 25 day program. Pre‐/posttests are administered which focus on three standards in Language Arts, Math, and Science. Data is reviewed to determine the three standards that are addressed.
What Works Clearinghouse Using Student Achievement Data to Support Instructional Decision Making What Works Clearing House: Structuring Out‐of‐School Time to Improve Academic Achievements
ELA Migrant N/A
Math Migrant N/A
ELA ELLs Summer NASA program available to all students in need of enrichment
Math Dept Chair
Attendance sheets Pre/post Assessments
Data from bench mark assessments
Math ELLs Summer NASA ELA Dept Attendance sheets Data from bench mark assessments
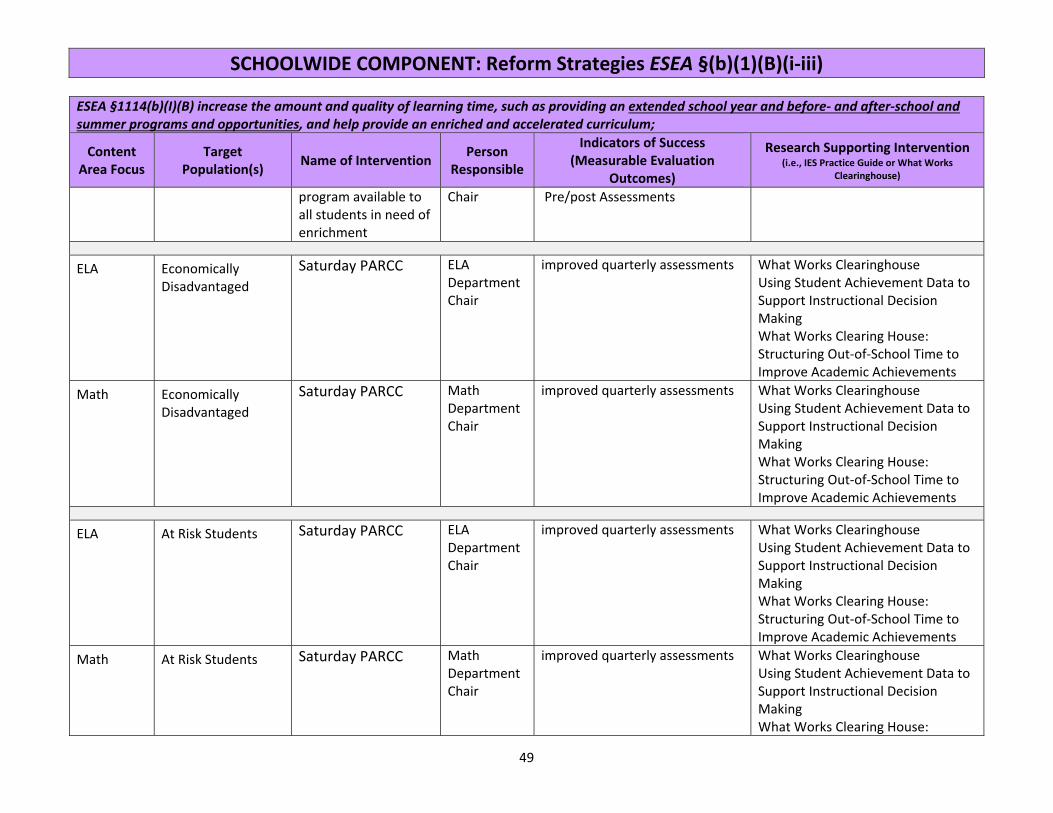
SCHOOLWIDE COMPONENT: Reform Strategies ESEA §(b)(1)(B)(i‐iii)
49
ESEA §1114(b)(I)(B) increase the amount and quality of learning time, such as providing an extended school year and before‐ and after‐school and summer programs and opportunities, and help provide an enriched and accelerated curriculum;
Content Area Focus
Target Population(s) Name of Intervention Person
Responsible
Indicators of Success (Measurable Evaluation
Outcomes)
Research Supporting Intervention (i.e., IES Practice Guide or What Works
Clearinghouse) program available to all students in need of enrichment
Chair Pre/post Assessments
ELA Economically Disadvantaged
Saturday PARCC ELA Department Chair
improved quarterly assessments What Works Clearinghouse Using Student Achievement Data to Support Instructional Decision Making What Works Clearing House: Structuring Out‐of‐School Time to Improve Academic Achievements
Math Economically Disadvantaged
Saturday PARCC Math Department Chair
improved quarterly assessments What Works Clearinghouse Using Student Achievement Data to Support Instructional Decision Making What Works Clearing House: Structuring Out‐of‐School Time to Improve Academic Achievements
ELA At Risk Students Saturday PARCC ELA Department Chair
improved quarterly assessments What Works Clearinghouse Using Student Achievement Data to Support Instructional Decision Making What Works Clearing House: Structuring Out‐of‐School Time to Improve Academic Achievements
Math At Risk Students Saturday PARCC Math Department Chair
improved quarterly assessments What Works Clearinghouse Using Student Achievement Data to Support Instructional Decision Making What Works Clearing House:
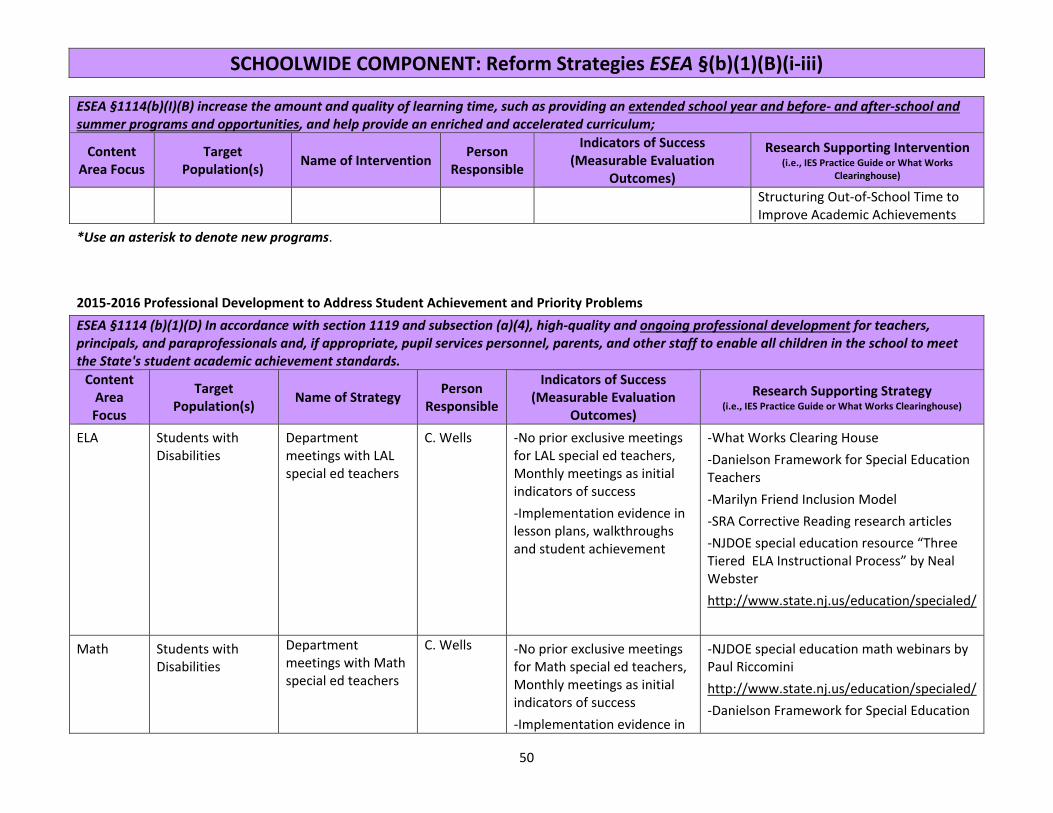
SCHOOLWIDE COMPONENT: Reform Strategies ESEA §(b)(1)(B)(i‐iii)
50
ESEA §1114(b)(I)(B) increase the amount and quality of learning time, such as providing an extended school year and before‐ and after‐school and summer programs and opportunities, and help provide an enriched and accelerated curriculum;
Content Area Focus
Target Population(s) Name of Intervention Person
Responsible
Indicators of Success (Measurable Evaluation
Outcomes)
Research Supporting Intervention (i.e., IES Practice Guide or What Works
Clearinghouse) Structuring Out‐of‐School Time to Improve Academic Achievements
*Use an asterisk to denote new programs. 2015‐2016 Professional Development to Address Student Achievement and Priority Problems ESEA §1114 (b)(1)(D) In accordance with section 1119 and subsection (a)(4), high‐quality and ongoing professional development for teachers, principals, and paraprofessionals and, if appropriate, pupil services personnel, parents, and other staff to enable all children in the school to meet the State's student academic achievement standards. Content Area Focus
Target Population(s) Name of Strategy Person
Responsible
Indicators of Success (Measurable Evaluation
Outcomes)
Research Supporting Strategy (i.e., IES Practice Guide or What Works Clearinghouse)
ELA Students with Disabilities
Department meetings with LAL special ed teachers
C. Wells ‐No prior exclusive meetings for LAL special ed teachers, Monthly meetings as initial indicators of success ‐Implementation evidence in lesson plans, walkthroughs and student achievement
‐What Works Clearing House ‐Danielson Framework for Special Education Teachers ‐Marilyn Friend Inclusion Model ‐SRA Corrective Reading research articles ‐NJDOE special education resource “Three Tiered ELA Instructional Process” by Neal Webster http://www.state.nj.us/education/specialed/
Math Students with Disabilities
Department meetings with Math special ed teachers
C. Wells ‐No prior exclusive meetings for Math special ed teachers, Monthly meetings as initial indicators of success ‐Implementation evidence in
‐NJDOE special education math webinars by Paul Riccomini http://www.state.nj.us/education/specialed/‐Danielson Framework for Special Education

SCHOOLWIDE COMPONENT: Reform Strategies ESEA §(b)(1)(B)(i‐iii)
51
ESEA §1114 (b)(1)(D) In accordance with section 1119 and subsection (a)(4), high‐quality and ongoing professional development for teachers, principals, and paraprofessionals and, if appropriate, pupil services personnel, parents, and other staff to enable all children in the school to meet the State's student academic achievement standards. Content Area Focus
Target Population(s) Name of Strategy Person
Responsible
Indicators of Success (Measurable Evaluation
Outcomes)
Research Supporting Strategy (i.e., IES Practice Guide or What Works Clearinghouse)
lesson plans, walkthroughs and student achievement
Teachers ‐Marilyn Friend Inclusion Model
ELA Homeless PARCC Assessment Training
Principal and Dept. Chairs
50% of students will show growth in comparing PARCC style questions from pre‐assessment to final assessment.
What Works Clearinghouse Using Student Achievement Data to Support Instructional Decision Making
Math Homeless PARCC Assessment Training
Principal and Dept. Chairs
50% of students will show growth in comparing PARCC style questions from pre‐assessment to final assessment.
What Works Clearinghouse Using Student Achievement Data to Support Instructional Decision Making
ELA Migrant N/A
Math Migrant N/A
ELA ELLs Districtwide department meetings with ELL staff
K. Skelton ‐Vertical articulation between the schools and grade levels for consistency of utilization of WIDA standards and Can Do descriptors
http://www.state.nj.us/education/lep
Math ELLs Districtwide department meetings with ELL
K. Skelton ‐Vertical articulation between the schools and grade levels for consistency of utilization
http://www.state.nj.us/education/lep

SCHOOLWIDE COMPONENT: Reform Strategies ESEA §(b)(1)(B)(i‐iii)
52
ESEA §1114 (b)(1)(D) In accordance with section 1119 and subsection (a)(4), high‐quality and ongoing professional development for teachers, principals, and paraprofessionals and, if appropriate, pupil services personnel, parents, and other staff to enable all children in the school to meet the State's student academic achievement standards. Content Area Focus
Target Population(s) Name of Strategy Person
Responsible
Indicators of Success (Measurable Evaluation
Outcomes)
Research Supporting Strategy (i.e., IES Practice Guide or What Works Clearinghouse)
staff of WIDA standards and Can Do descriptors
ELA Economically Disadvantaged
Differentiation/small group instruction
Principal, ELA/Math Dept. Chair
Pre/Post Assessments; improved quarterly assessments
What Works Clearinghouse Using Student Achievement Data to Support Instructional Decision Making
Math Economically Disadvantaged
Differentiation/small group instruction
Principal, ELA/Math Dept. Chair
Pre/Post Assessments; improved quarterly assessments
What Works Clearinghouse Using Student Achievement Data to Support Instructional Decision Making
*Use an asterisk to denote new programs.
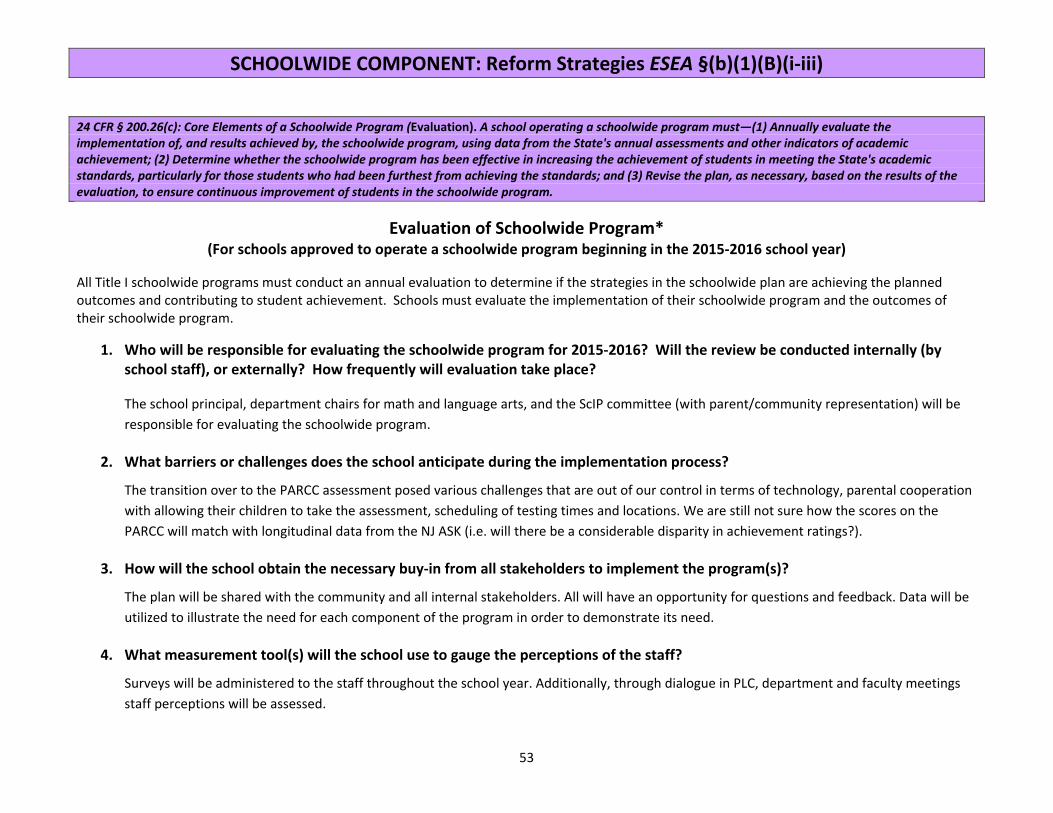
SCHOOLWIDE COMPONENT: Reform Strategies ESEA §(b)(1)(B)(i‐iii)
53
24 CFR § 200.26(c): Core Elements of a Schoolwide Program (Evaluation). A school operating a schoolwide program must—(1) Annually evaluate the implementation of, and results achieved by, the schoolwide program, using data from the State's annual assessments and other indicators of academic achievement; (2) Determine whether the schoolwide program has been effective in increasing the achievement of students in meeting the State's academic standards, particularly for those students who had been furthest from achieving the standards; and (3) Revise the plan, as necessary, based on the results of the evaluation, to ensure continuous improvement of students in the schoolwide program.
Evaluation of Schoolwide Program* (For schools approved to operate a schoolwide program beginning in the 2015‐2016 school year)
All Title I schoolwide programs must conduct an annual evaluation to determine if the strategies in the schoolwide plan are achieving the planned outcomes and contributing to student achievement. Schools must evaluate the implementation of their schoolwide program and the outcomes of their schoolwide program.
1. Who will be responsible for evaluating the schoolwide program for 2015‐2016? Will the review be conducted internally (by school staff), or externally? How frequently will evaluation take place?
The school principal, department chairs for math and language arts, and the ScIP committee (with parent/community representation) will be responsible for evaluating the schoolwide program.
2. What barriers or challenges does the school anticipate during the implementation process?
The transition over to the PARCC assessment posed various challenges that are out of our control in terms of technology, parental cooperation with allowing their children to take the assessment, scheduling of testing times and locations. We are still not sure how the scores on the PARCC will match with longitudinal data from the NJ ASK (i.e. will there be a considerable disparity in achievement ratings?).
3. How will the school obtain the necessary buy‐in from all stakeholders to implement the program(s)?
The plan will be shared with the community and all internal stakeholders. All will have an opportunity for questions and feedback. Data will be utilized to illustrate the need for each component of the program in order to demonstrate its need.
4. What measurement tool(s) will the school use to gauge the perceptions of the staff?
Surveys will be administered to the staff throughout the school year. Additionally, through dialogue in PLC, department and faculty meetings staff perceptions will be assessed.

SCHOOLWIDE COMPONENT: Reform Strategies ESEA §(b)(1)(B)(i‐iii)
54
5. What measurement tool(s) will the school use to gauge the perceptions of the community?
Surveys will be sent via email, and or webpage, to the community.
6. How will the school structure interventions?
Interventions will be shared with all stakeholders. Data will be collected as a means for determining a baseline. Benchmark data will be
collected for student academic and behavioral status. Multiple meetings with stakeholders will take place throughout the year to monitor the
progress of the interventions and determine their effectiveness.
7. How frequently will students receive instructional interventions?
Students have LAL everyday‐ the interventions will take place daily. Benchmarks will be administered four times throughout the year, including
pre‐assessments in September of 2014.
8. What resources/technologies will the school use to support the schoolwide program?
Computer data bases will be utilized to track discipline. LinkIt! Software will be utilized to analyze student assessments and pose resources for remediation.
9. What quantitative data will the school use to measure the effectiveness of each intervention provided?
LinkIt! Navigator reports will be utilized to analyze student benchmark data. School‐based discipline data will be collected and analyzed using MS Excel.
10. How will the school disseminate the results of the schoolwide program evaluation to its stakeholder groups?
Schoolwide program evaluation will be disseminated to the community during Meet the Teacher Night, at the ScIP committee meetings, and at
various faculty meetings throughout the year.
*Provide a separate response for each question.

SCHOOLWIDE COMPONENT: FAMILY AND COMMUNITY ENGAGEMENT ESEA §1114 (b)(1)(F)
55
ESEA §1114 (b)(1)(F) Strategies to increase parental involvement in accordance with §1118, such as family literacy services Research continues to show that successful schools have significant and sustained levels of family and community engagement. As a result, schoolwide plans must contain strategies to involve families and the community, especially in helping children do well in school. In addition, families and the community must be involved in the planning, implementation, and evaluation of the schoolwide program. 2015‐2016 Family and Community Engagement Strategies to Address Student Achievement and Priority Problems Content Area Focus
Target Population(s) Name of Strategy Person
Responsible
Indicators of Success (Measurable Evaluation
Outcomes)
Research Supporting Strategy (i.e., IES Practice Guide or What Works
Clearinghouse)
ELA Students with Disabilities
After school and evening parent conferences Parent meetings
MS staff Sp Ser Director
Attendance
Meeting/conference data
Math Students with Disabilities
After school and evening parent conferences Parent meetings
MS staff Sp Ser Director
Attendance
Meeting/conference data
ELA Homeless SCORE At‐home mentor
1. Greater than 70% of all scheduled home meetings will take place as planned 2. There will be an increase of at least 15 points on the targeted students’ NJ ASK math and/or LAL scores
OST programs can play a meaningful role in improving academic achievement and closing the gap between low‐ and high‐performing students (IES Practice Guide‐ NCEE 2009‐012)
Math Homeless SCORE At‐home mentor
1. Greater than 70% of all scheduled home meetings will take place as planned 2. There will be an increase of at least 15 points on the targeted students’ NJ ASK math and/or LAL scores
OST programs can play a meaningful role in improving academic achievement and closing the gap between low‐ and high‐performing students (IES Practice Guide‐ NCEE 2009‐012)
ELA Migrant N/A
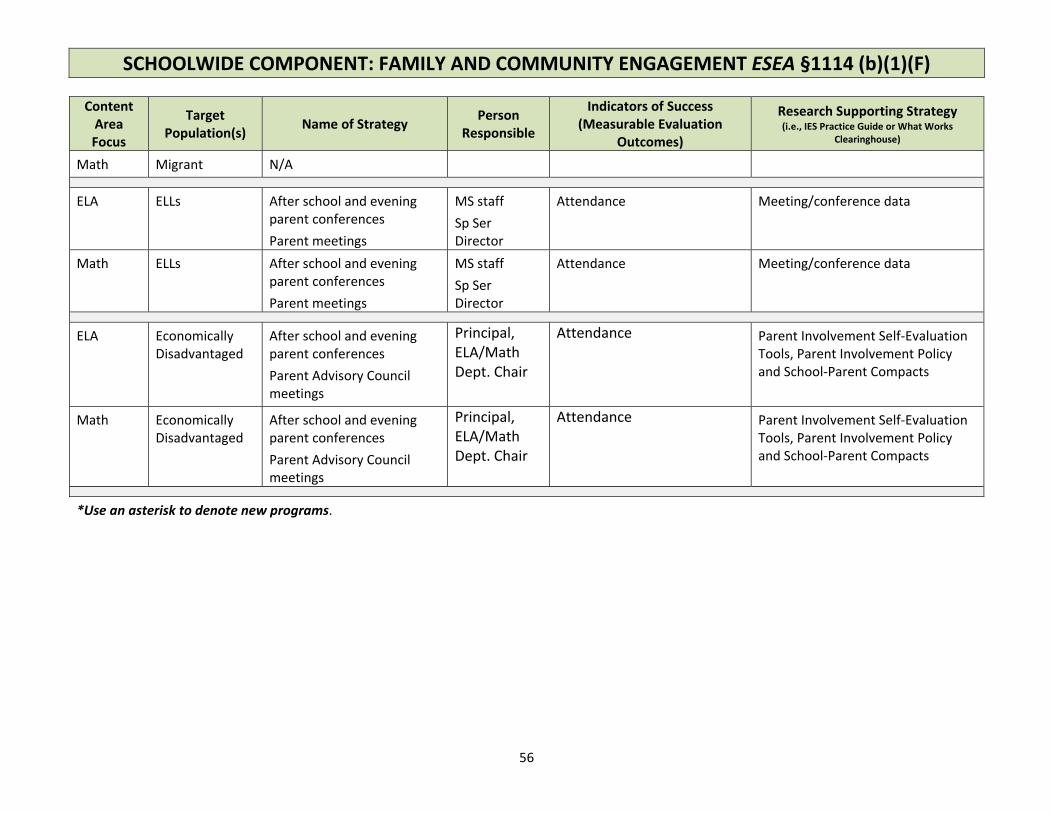
SCHOOLWIDE COMPONENT: FAMILY AND COMMUNITY ENGAGEMENT ESEA §1114 (b)(1)(F)
56
Content Area Focus
Target Population(s) Name of Strategy Person
Responsible
Indicators of Success (Measurable Evaluation
Outcomes)
Research Supporting Strategy (i.e., IES Practice Guide or What Works
Clearinghouse)
Math Migrant N/A
ELA ELLs After school and evening parent conferences Parent meetings
MS staff Sp Ser Director
Attendance
Meeting/conference data
Math ELLs After school and evening parent conferences Parent meetings
MS staff Sp Ser Director
Attendance
Meeting/conference data
ELA Economically Disadvantaged
After school and evening parent conferences Parent Advisory Council meetings
Principal, ELA/Math Dept. Chair
Attendance Parent Involvement Self‐Evaluation Tools, Parent Involvement Policy and School‐Parent Compacts
Math Economically Disadvantaged
After school and evening parent conferences Parent Advisory Council meetings
Principal, ELA/Math Dept. Chair
Attendance Parent Involvement Self‐Evaluation Tools, Parent Involvement Policy and School‐Parent Compacts
*Use an asterisk to denote new programs.
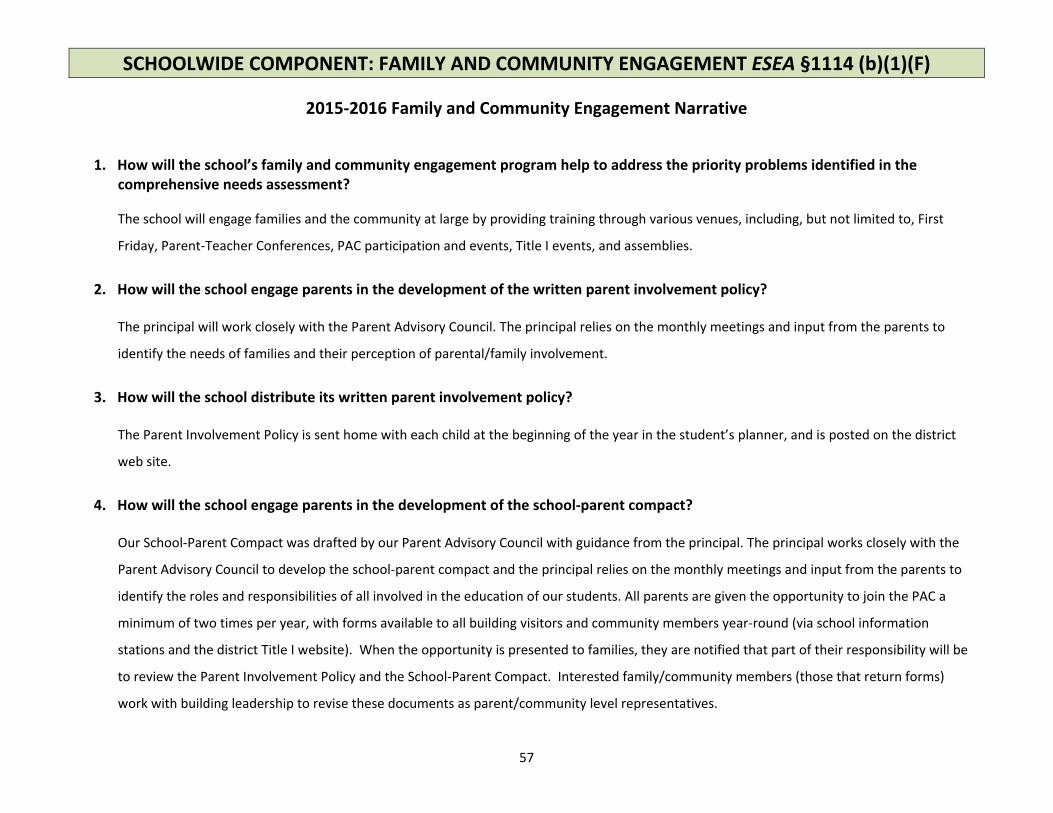
SCHOOLWIDE COMPONENT: FAMILY AND COMMUNITY ENGAGEMENT ESEA §1114 (b)(1)(F)
57
2015‐2016 Family and Community Engagement Narrative
1. How will the school’s family and community engagement program help to address the priority problems identified in the
comprehensive needs assessment?
The school will engage families and the community at large by providing training through various venues, including, but not limited to, First
Friday, Parent‐Teacher Conferences, PAC participation and events, Title I events, and assemblies.
2. How will the school engage parents in the development of the written parent involvement policy?
The principal will work closely with the Parent Advisory Council. The principal relies on the monthly meetings and input from the parents to
identify the needs of families and their perception of parental/family involvement.
3. How will the school distribute its written parent involvement policy?
The Parent Involvement Policy is sent home with each child at the beginning of the year in the student’s planner, and is posted on the district
web site.
4. How will the school engage parents in the development of the school‐parent compact?
Our School‐Parent Compact was drafted by our Parent Advisory Council with guidance from the principal. The principal works closely with the
Parent Advisory Council to develop the school‐parent compact and the principal relies on the monthly meetings and input from the parents to
identify the roles and responsibilities of all involved in the education of our students. All parents are given the opportunity to join the PAC a
minimum of two times per year, with forms available to all building visitors and community members year‐round (via school information
stations and the district Title I website). When the opportunity is presented to families, they are notified that part of their responsibility will be
to review the Parent Involvement Policy and the School‐Parent Compact. Interested family/community members (those that return forms)
work with building leadership to revise these documents as parent/community level representatives.
SCHOOLWIDE COMPONENT: FAMILY AND COMMUNITY ENGAGEMENT ESEA §1114 (b)(1)(F)
58
5. How will the school ensure that parents receive and review the school‐parent compact?
The School‐Parent Compact is sent home with each child at the beginning of the year. The parent, teacher, principal all sign off on the compact
in September of each school year.
6. How will the school report its student achievement data to families and the community?
Individual student NJASK reports are mailed home to every sixth, seventh, and eighth grader. Individual student reports mailed to parents via
our guidance dept. Parents also have access to the Parent Portal throughout the year to monitor classroom achievement/performance. At a
district level, the Assistant Superintendent conducts a "State of the District" meeting, with a presentation that includes, but is not limited to,
student achievement, state test score results, programmatic offerings and enhancements, and school progress targets. The presentation occurs
at a Board of Education meeting and the Assistant Superintendent provides opportunities for follow up and feedback from the families and
community members. Based on the "State of the District," an action plan is created to address areas in need of improvement.
7. How will the school notify families and the community if the district has not met its annual measurable achievement objectives (AMAO) for Title III?
District letter is sent from the superintendent’s office to all families with students in an ESL/bilingual program, as well as posting this
information on the district website, in various languages to meet the needs of our population.
8. How will the school inform families and the community of the school’s disaggregated assessment results?
Parents will be informed during their Title I event, as well as through their School Report Card on the NJDOE website. At a district level, the
Assistant Superintendent conducts a "State of the District" meeting, with a presentation that includes, but is not limited to, student
achievement, state test score results, programmatic offerings and enhancements, and school progress targets. The presentation occurs at a
Board of Education meeting and the Assistant Superintendent provides opportunities for follow up and feedback from the families and
community members. Based on the "State of the District," an action plan is created to address areas in need of improvement.
SCHOOLWIDE COMPONENT: FAMILY AND COMMUNITY ENGAGEMENT ESEA §1114 (b)(1)(F)
59
9. How will the school involve families and the community in the development of the Title I Schoolwide Plan?
The principal works closely with the Parent Advisory Council (PAC) and School‐wide planning committee, which is comprised of teachers,
parents, community members, and school administrators. The principal relies on the monthly meetings and input from the parents to identify
the needs. All parents are given the opportunity to join the PAC a minimum of two times per year, with forms available to all building visitors
and community members year‐round (via school information stations and the district Title I website). When the opportunity is presented to
families, they are notified that part of their responsibility will be to review the Parent Involvement Policy and the School‐Parent Compact.
Interested family/community members (those that return forms) work with building leadership to revise these documents as parent/community
level representatives.
10. How will the school inform families about the academic achievement of their child/children?
Individual student PARCC reports will be mailed home to every sixth, seventh, and eighth grader. Individual student reports mailed to parents
via our guidance dept. Parents also have access to the Parent Portal throughout the year to monitor classroom achievement/performance.
11. On what specific strategies will the school use its 2015‐2016 parent involvement funds?
Workshops will be provided to parents including: PARCC training, Literacy Strategies, Everyday Mathematics, Behavioral Strategies, and Online
Parent Grading Portal.
*Provide a separate response for each question.

SCHOOLWIDE: HIGHLY QUALIFIED STAFF ESEA §(b)(1)(E)
60
ESEA §1114(b)(1)(E) Strategies to attract high‐quality highly qualified teachers to high‐need schools.
High poverty, low‐performing schools are often staffed with disproportionately high numbers of teachers who are not highly qualified. To address this disproportionality, the ESEA requires that all teachers of core academic subjects and instructional paraprofessionals in a schoolwide program meet the qualifications required by §1119. Student achievement increases in schools where teaching and learning have the highest priority, and students achieve at higher levels when taught by teachers who know their subject matter and are skilled in teaching it.
Strategies to Attract and Retain Highly‐Qualified Staff
Number & Percent Description of Strategy to Retain HQ Staff
Teachers who meet the qualifications for HQT, consistent with Title II‐A
85 The school district conducts an orientation for new teachers each summer. Additionally, teachers receive training in the core programs at each school and are supported through work with teachers during PLC and grade level meetings.
100%
Teachers who do not meet the qualifications for HQT, consistent with Title II‐A
0
0%
Instructional Paraprofessionals who meet the qualifications required by ESEA (education, passing score on ParaPro test)
3 The school district conducts and orientation for new teachers/staff each summer and PD offerings are given regularly throughout the year.
100%
Paraprofessionals providing instructional assistance who do not meet the qualifications required by ESEA (education, passing score on ParaPro test)*
0
0%
* The district must assign these instructional paraprofessionals to non‐instructional duties for 100% of their schedule, reassign them to a school in the district that does not operate a Title I schoolwide program, or terminate their employment with the district.

SCHOOLWIDE: HIGHLY QUALIFIED STAFF ESEA §(b)(1)(E)
61
Although recruiting and retaining highly qualified teachers is an on‐going challenge in high poverty schools, low‐performing students in these schools have a special need for excellent teachers. The schoolwide plan, therefore, must describe the strategies the school will utilize to attract and retain highly‐qualified teachers.
Description of strategies to attract highly‐qualified teachers to high‐need schools Individuals Responsible
The district conducts an orientation for new teachers each summer. Additionally, teachers receive training in the core programs at each school and are supported through work with teachers during PLCs and grade level meetings. New this year, we have a Professional Development Coordinator who has developed a series of mentor/new teacher meetings and trainings throughout the school year.
Assistant Superintendent