new innovations in ultra high performance liquid chromatography and liquid chromatography mass...
TRANSCRIPT
New Innovations in UHPLC and LC-MS Workflows for the Comprehensive Ch t i ti f M l lCharacterization of Monoclonal Antibodies (mAbs) and Antibody Drug Conjugates (ADCs)Conjugates (ADCs)
Ken CookEU Bio-separations Support Expert
November 2014
1 The world leader in serving science
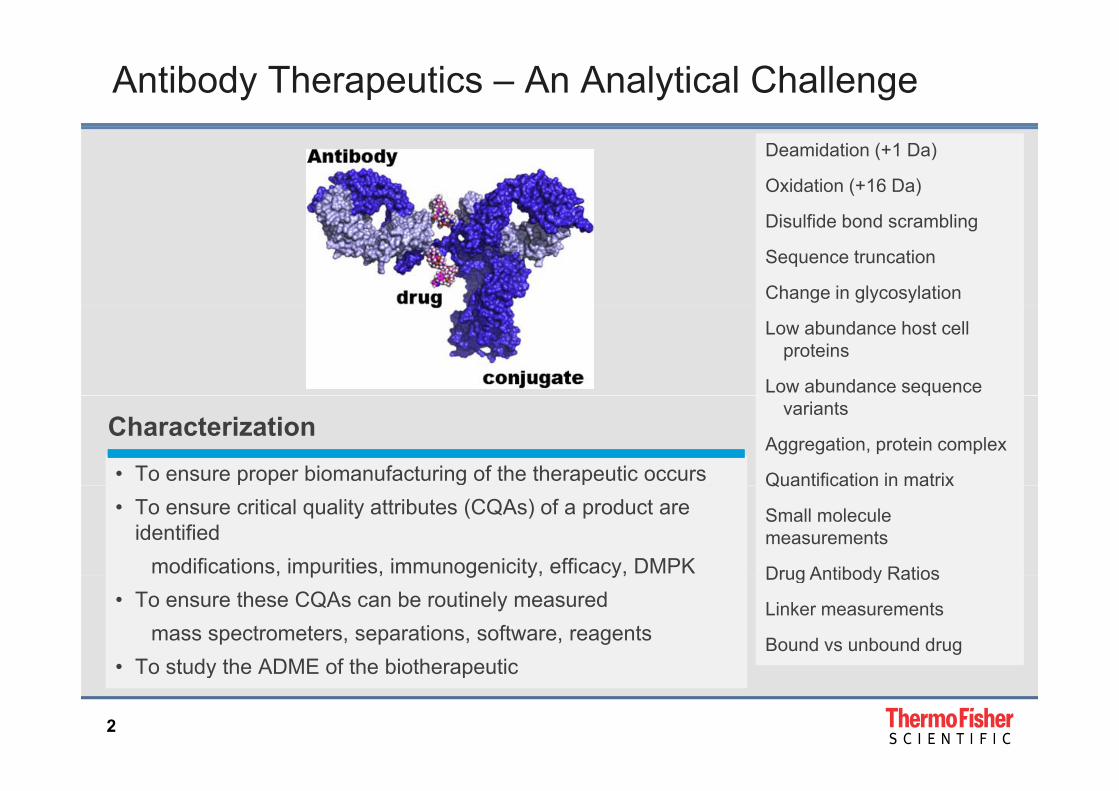
Antibody Therapeutics – An Analytical Challenge
Deamidation (+1 Da)
Oxidation (+16 Da)
Di lfid b d bliDisulfide bond scrambling
Sequence truncation
Change in glycosylation
Low abundance host cell proteins
Low abundance sequence qvariants
Aggregation, protein complex
Quantification in matrix• To ensure proper biomanufacturing of the therapeutic occurs
Characterization
Quantification in matrix
Small molecule measurements
Drug Antibody Ratios
• To ensure critical quality attributes (CQAs) of a product are identified
modifications, impurities, immunogenicity, efficacy, DMPK Drug Antibody Ratios
Linker measurements
Bound vs unbound drug
, p , g y, y,• To ensure these CQAs can be routinely measured
mass spectrometers, separations, software, reagents • To study the ADME of the biotherapeutic
2
• To study the ADME of the biotherapeutic
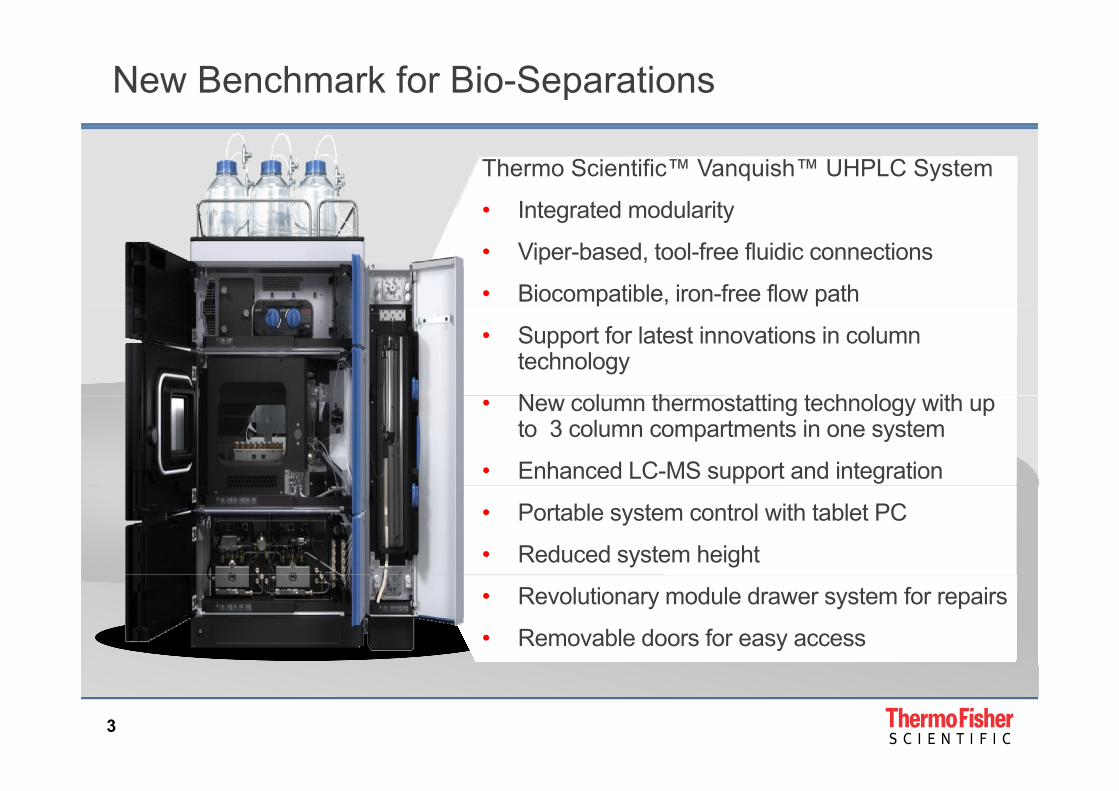
New Benchmark for Bio-Separations
Thermo Scientific™ Vanquish™ UHPLC System
• Integrated modularityIntegrated modularity
• Viper-based, tool-free fluidic connections
• Biocompatible, iron-free flow pathp p
• Support for latest innovations in column technology
N l th t tti t h l ith• New column thermostatting technology with up to 3 column compartments in one system
• Enhanced LC-MS support and integration
• Portable system control with tablet PC
• Reduced system height
• Revolutionary module drawer system for repairs
• Removable doors for easy access
3
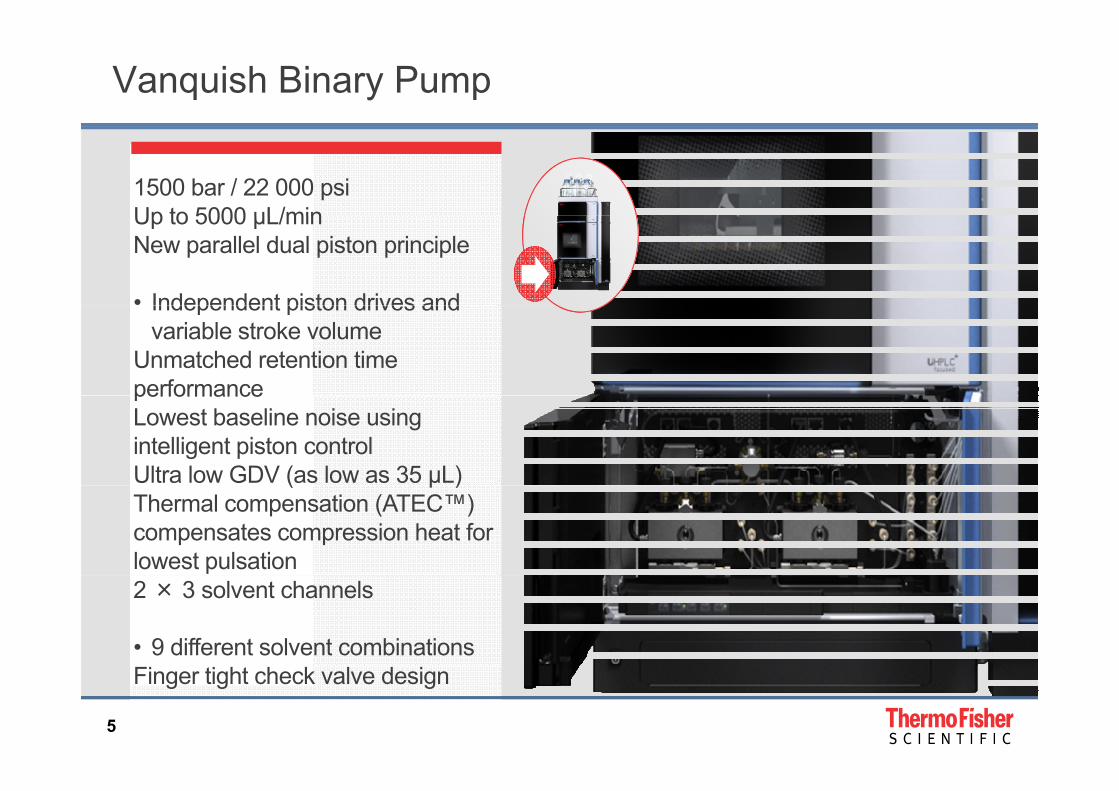
Vanquish Binary Pump
1500 bar / 22 000 psiUp to 5000 µL/minUp to 5000 µL/minNew parallel dual piston principle
• Independent piston drives andIndependent piston drives and variable stroke volume
Unmatched retention time performanceperformanceLowest baseline noise using intelligent piston controlUltra low GDV (as low as 35 µL)( µ )Thermal compensation (ATEC™) compensates compression heat for lowest pulsation2 × 3 solvent channels
• 9 different solvent combinations
5
Finger tight check valve design
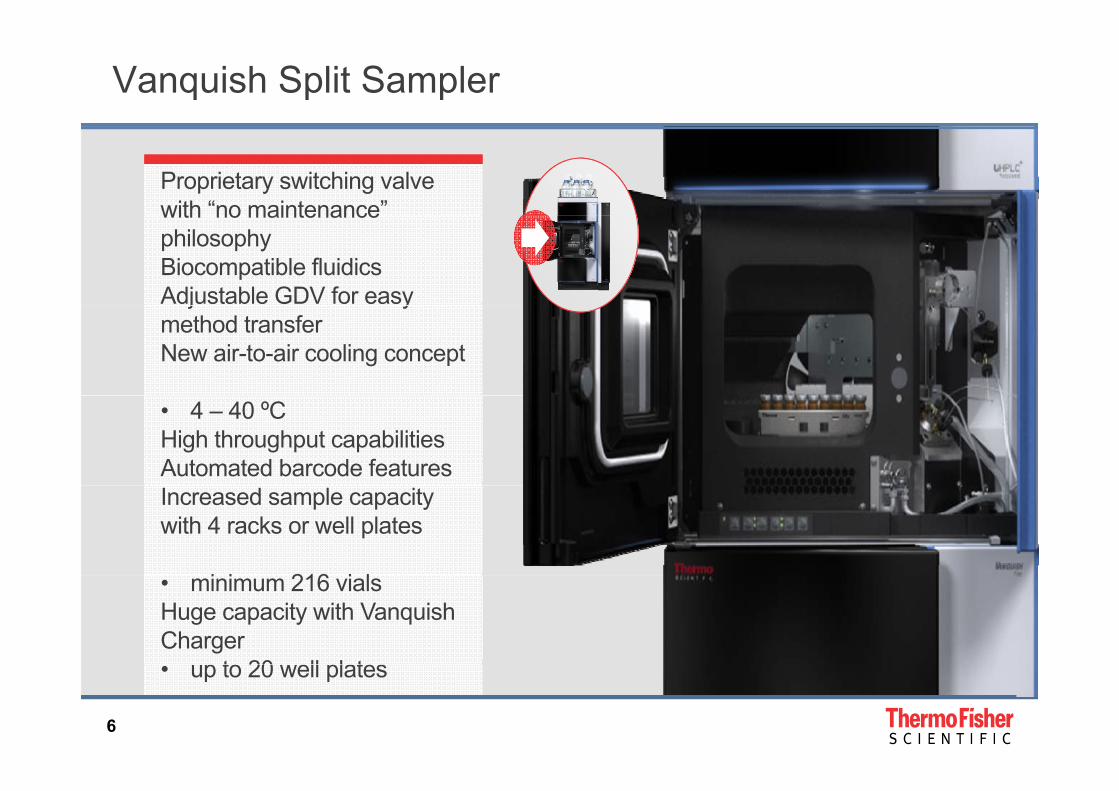
Vanquish Split Sampler
Proprietary switching valve with “no maintenance”with no maintenance philosophyBiocompatible fluidicsAdjustable GDV for easy j ymethod transferNew air-to-air cooling concept
• 4 – 40 ºCHigh throughput capabilitiesAutomated barcode featuresIncreased sample capacity with 4 racks or well plates
i i 216 i l• minimum 216 vialsHuge capacity with Vanquish Charger
up to 20 well plates
6
• up to 20 well plates

Vanquish Column Compartment
Unique actively regulated Pre-Heater• for perfect control of mobile phasefor perfect control of mobile phase
and column temperatureExtended temperature range 5–120 ºCCTwo thermostatting modes for easier method transfer and better peak shape managementshape management• still air mode to boost separation
speed and resolution• forced air mode to enable
seamless method transfer and mimic other column thermostats
Up to three independent column compartmentsNew column ID system
7
y
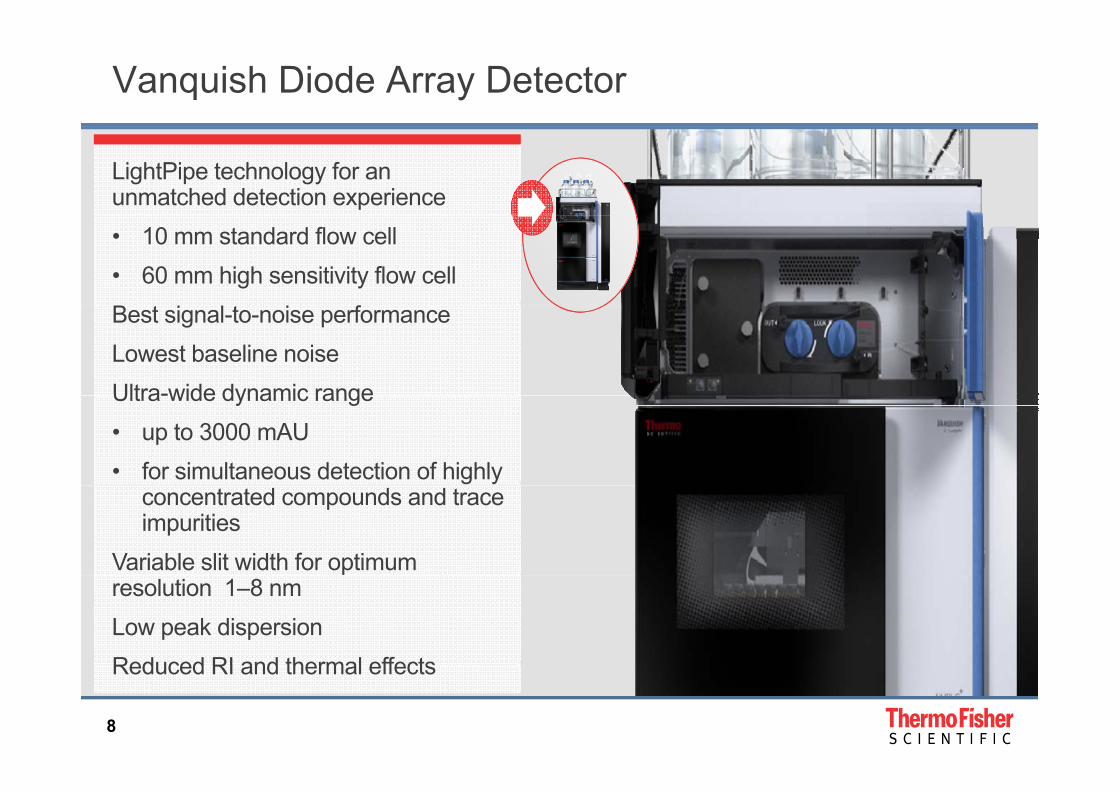
Vanquish Diode Array Detector
LightPipe technology for an unmatched detection experience• 10 mm standard flow cell• 60 mm high sensitivity flow cellB i l i fBest signal-to-noise performanceLowest baseline noiseUltra-wide dynamic rangeUltra-wide dynamic range• up to 3000 mAU• for simultaneous detection of highly
concentrated compounds and trace impurities
Variable slit width for optimum resolution 1–8 nmLow peak dispersionReduced RI and thermal effects
8
Reduced RI and thermal effects
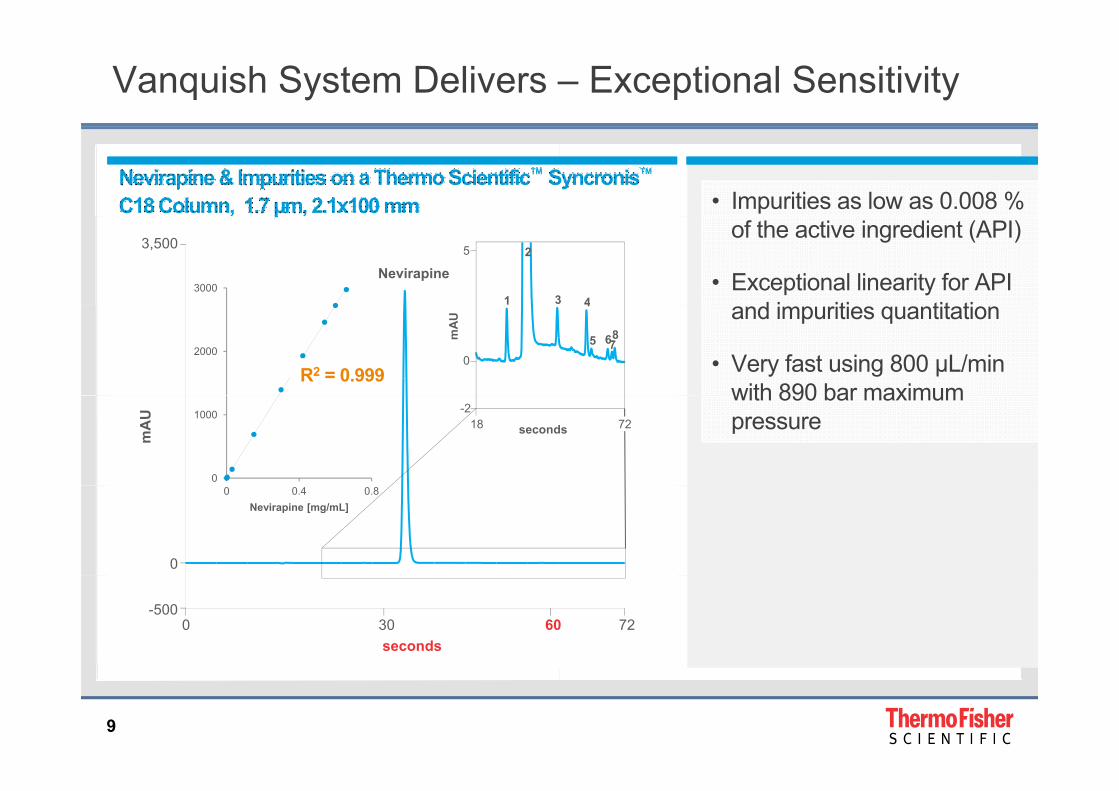
Vanquish System Delivers – Exceptional Sensitivity
• Impurities as low as 0.008 % of the active ingredient (API)
• Exceptional linearity for API d i iti tit ti
3,500
3000Nevirapine
5
1
2
3 4 and impurities quantitation
• Very fast using 800 µL/min with 890 bar maximum
R² = 0.9998
20000
mAU
4
5 678
R2 = 0.999with 890 bar maximum pressure
0
100018
-2
secondsmA
U
72
0
0 0.4 0.8Nevirapine [mg/mL]
0 60 72-500
30seconds
9
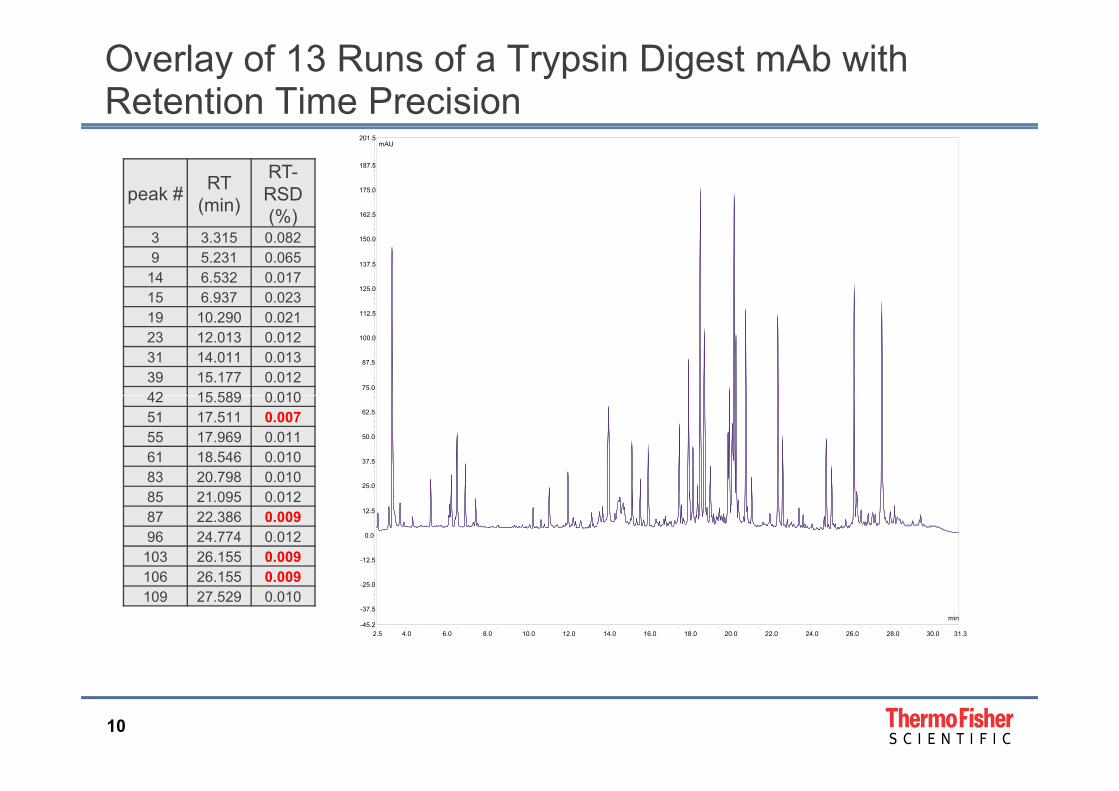
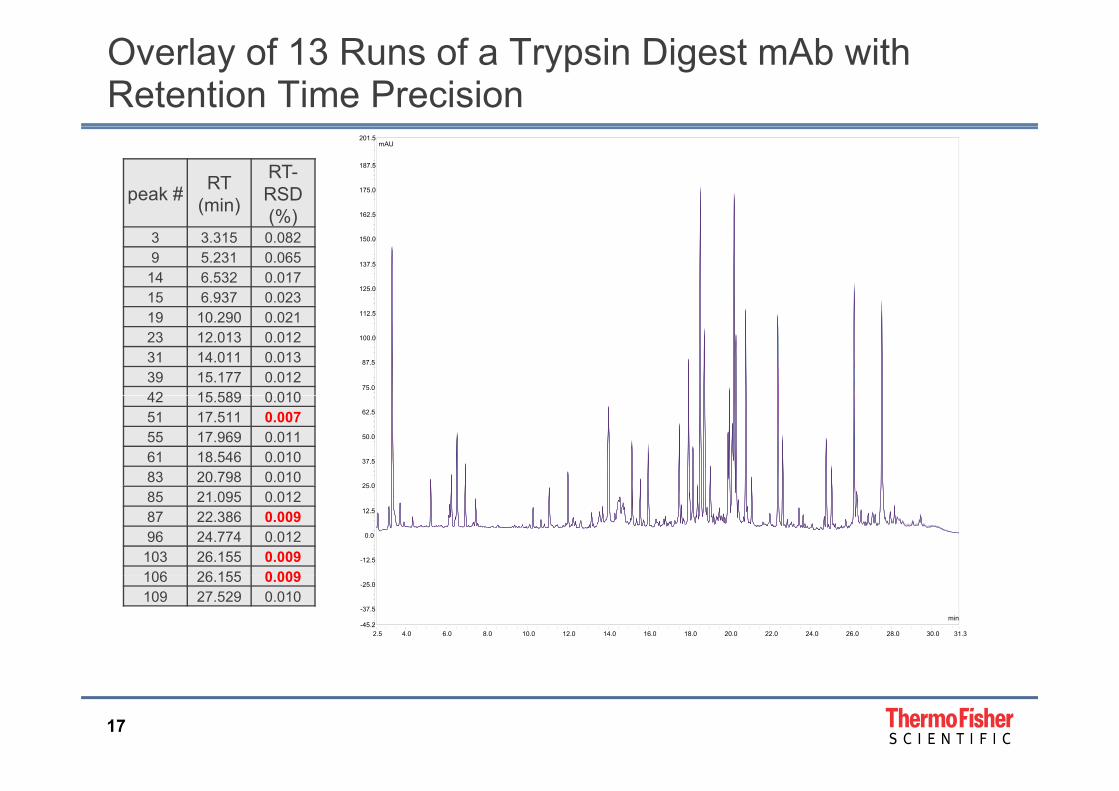
Overlay of 13 Runs of a Trypsin Digest mAb with Retention Time Precision
162 5
175.0
187.5
201.5mAU
peak # RT (min)
RT-RSD (%)
125.0
137.5
150.0
162.5(%)3 3.315 0.0829 5.231 0.065
14 6.532 0.01715 6.937 0.023
75.0
87.5
100.0
112.519 10.290 0.02123 12.013 0.01231 14.011 0.01339 15.177 0.01242 15 589 0 010
25 0
37.5
50.0
62.5
42 15.589 0.01051 17.511 0.00755 17.969 0.01161 18.546 0.01083 20.798 0.010
-12.5
0.0
12.5
25.0
85 21.095 0.01287 22.386 0.00996 24.774 0.012103 26.155 0.009106 26 155 0 009
2.5 4.0 6.0 8.0 10.0 12.0 14.0 16.0 18.0 20.0 22.0 24.0 26.0 28.0 30.0 31.3-45.2
-37.5
-25.0
min
106 26.155 0.009109 27.529 0.010
10
Thermo Scientific™ Trypsin Digestion
• Heat stable Trypsin• 70 ºC heat denaturation of proteins so no need for70 C heat denaturation of proteins so no need for
detergents or urea• Immobilized Trypsin in throw away PCR tubeImmobilized Trypsin in throw away PCR tube• No autolysis• Less steps and no clean up – much quicker and easier to• Less steps and no clean up – much quicker and easier to
use• Less modificationsLess modifications• More reproducible
11
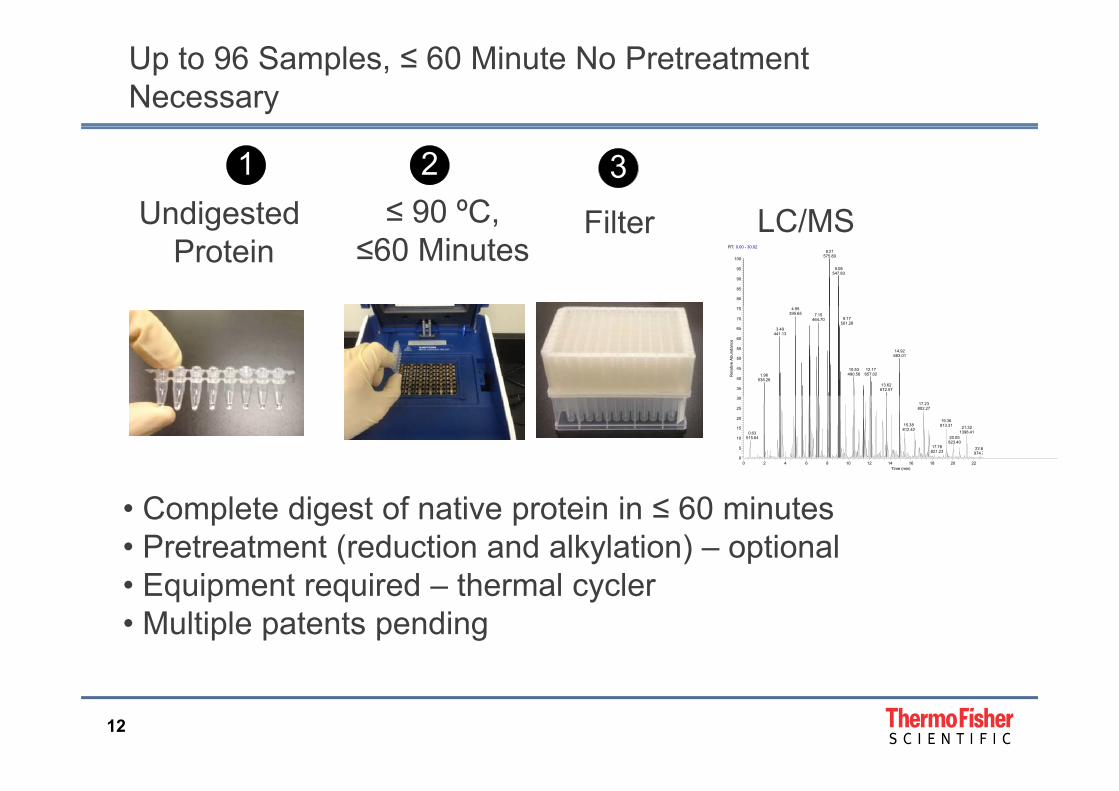
Up to 96 Samples, ≤ 60 Minute No PretreatmentNecessary
Undigested ≤ 90 ºC Filt LC/MSUndigested Protein RT: 0.00 - 30.02
80
85
90
95
100
8.21575.80
9.08547.83
≤ 90 C,≤60 Minutes
Filter LC/MS
35
40
45
50
55
60
65
70
75
Rel
ativ
e A
bund
ance
4.95395.65 7.15
464.70 9.17501.28
3.49441.13
14.92683.01
12.17657.02
10.53490.561.96
538.2613.62672.57
0 2 4 6 8 10 12 14 16 18 20 22Time (min)
0
5
10
15
20
25
3017.23802.27
19.36813.3115.38
812.42 21.321398.410.63
515.64 20.05823.40
17.78821.23
22.6974.7
• Complete digest of native protein in ≤ 60 minutes• Pretreatment (reduction and alkylation) – optional
E i t i d th l l• Equipment required – thermal cycler• Multiple patents pending
12
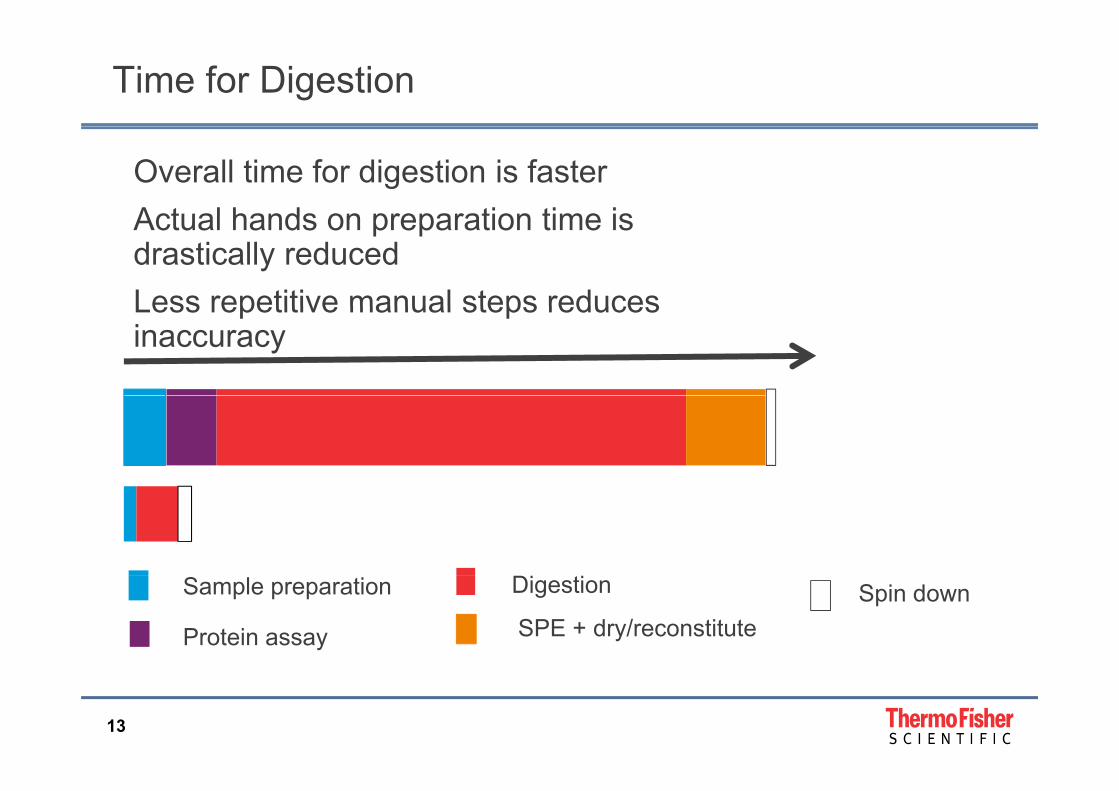
Time for Digestion
Overall time for digestion is fasterActual hands on preparation time isActual hands on preparation time is drastically reducedLess repetitive manual steps reducesLess repetitive manual steps reduces inaccuracy
Sample preparation
Protein assay
Digestion
SPE + dry/reconstituteSpin down
13
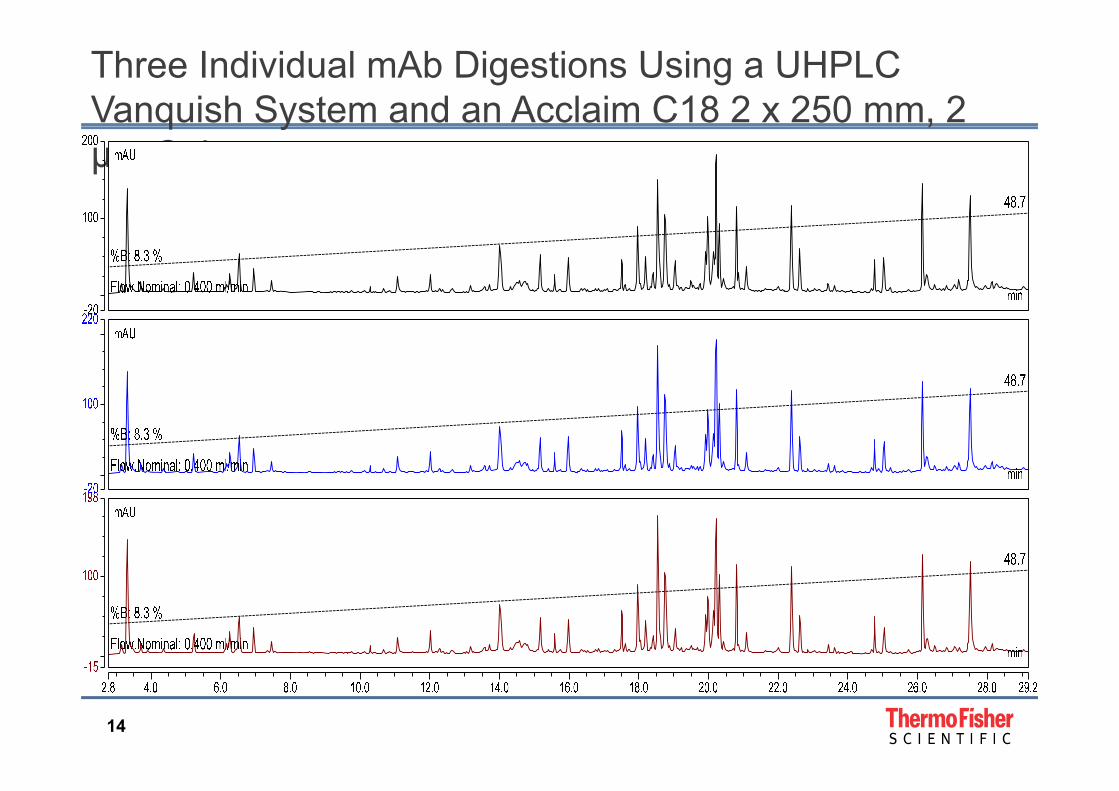
Three Individual mAb Digestions Using a UHPLC Vanquish System and an Acclaim C18 2 x 250 mm, 2 q y ,µm Column
14
Slide 14
JH5 Please format in title-case text and remove bold formatting.Jim Hegarty, 15/10/2014
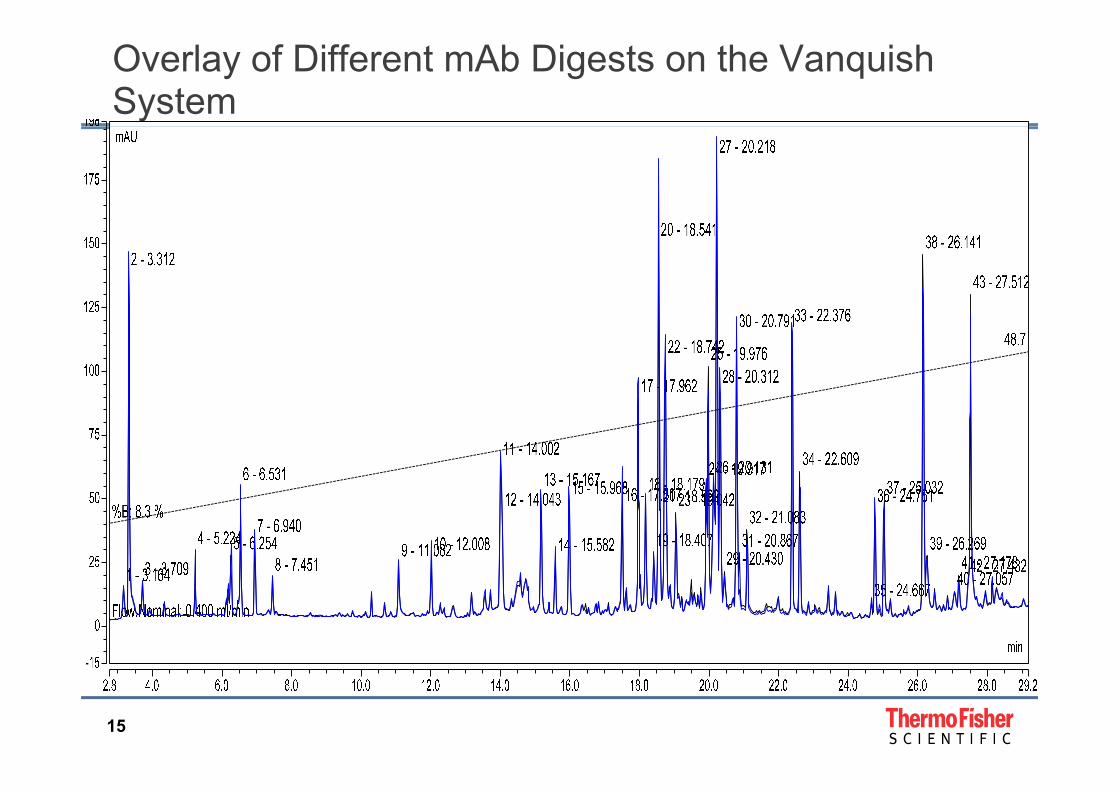
Overlay of Different mAb Digests on the Vanquish System
15
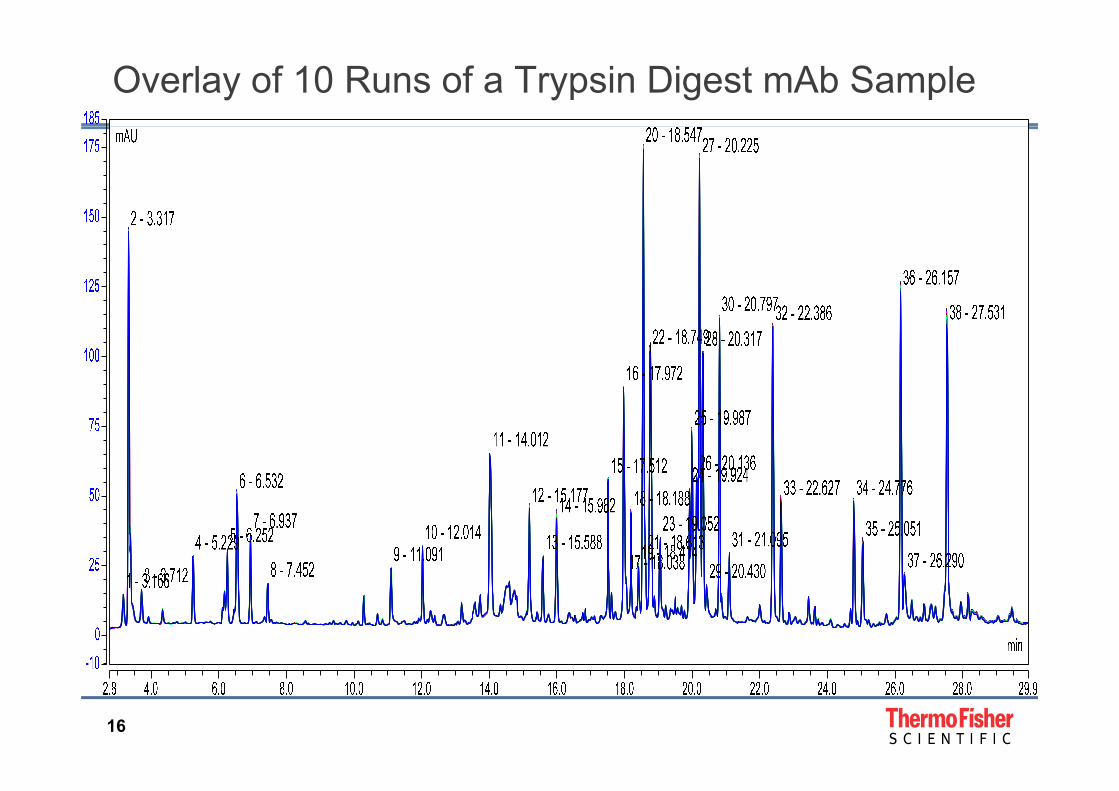
Overlay of 10 Runs of a Trypsin Digest mAb Sample
16
Overlay of 13 Runs of a Trypsin Digest mAb with Retention Time Precision
162 5
175.0
187.5
201.5mAU
peak # RT (min)
RT-RSD (%)
125.0
137.5
150.0
162.5(%)3 3.315 0.0829 5.231 0.065
14 6.532 0.01715 6.937 0.023
75.0
87.5
100.0
112.519 10.290 0.02123 12.013 0.01231 14.011 0.01339 15.177 0.01242 15 589 0 010
25 0
37.5
50.0
62.5
42 15.589 0.01051 17.511 0.00755 17.969 0.01161 18.546 0.01083 20.798 0.010
-12.5
0.0
12.5
25.0
85 21.095 0.01287 22.386 0.00996 24.774 0.012103 26.155 0.009106 26 155 0 009
2.5 4.0 6.0 8.0 10.0 12.0 14.0 16.0 18.0 20.0 22.0 24.0 26.0 28.0 30.0 31.3-45.2
-37.5
-25.0
min
106 26.155 0.009109 27.529 0.010
17

Slide 17
JH8 Please format with title-case text.Jim Hegarty, 15/10/2014
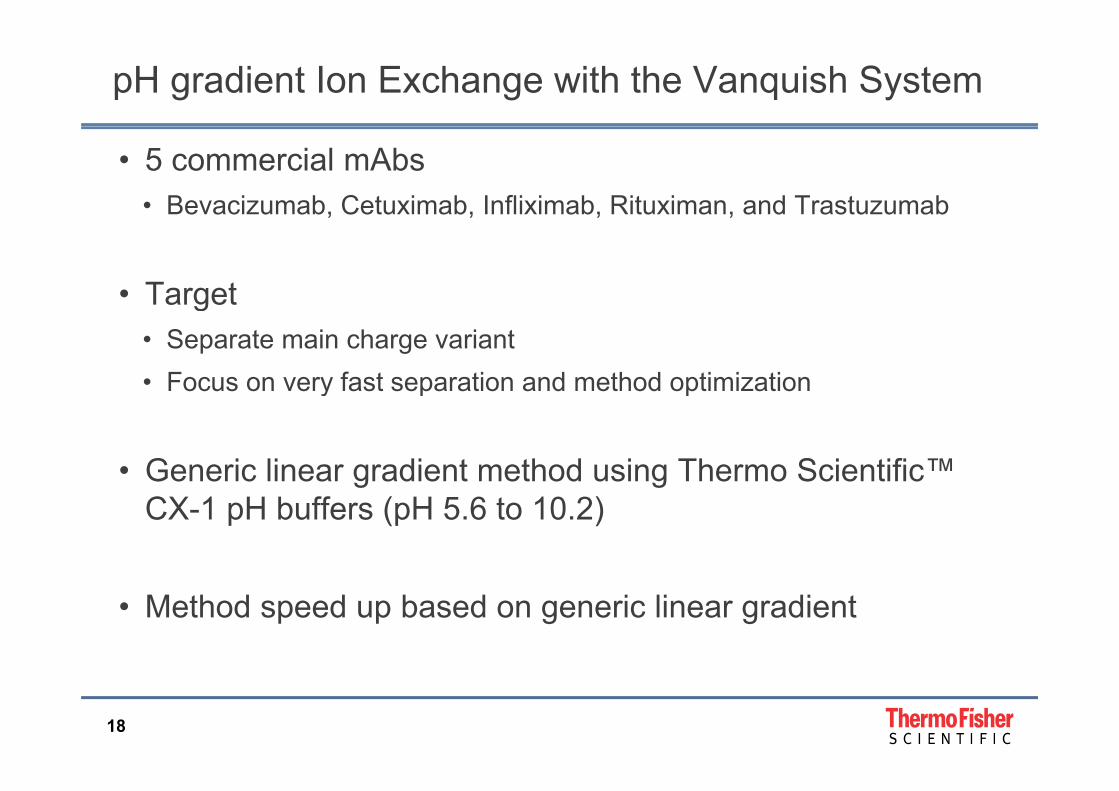
pH gradient Ion Exchange with the Vanquish System
• 5 commercial mAbs• Bevacizumab, Cetuximab, Infliximab, Rituximan, and Trastuzumab, , , ,
• Targetg• Separate main charge variant• Focus on very fast separation and method optimizationy p p
• Generic linear gradient method using Thermo Scientific™g gCX-1 pH buffers (pH 5.6 to 10.2)
• Method speed up based on generic linear gradient
18
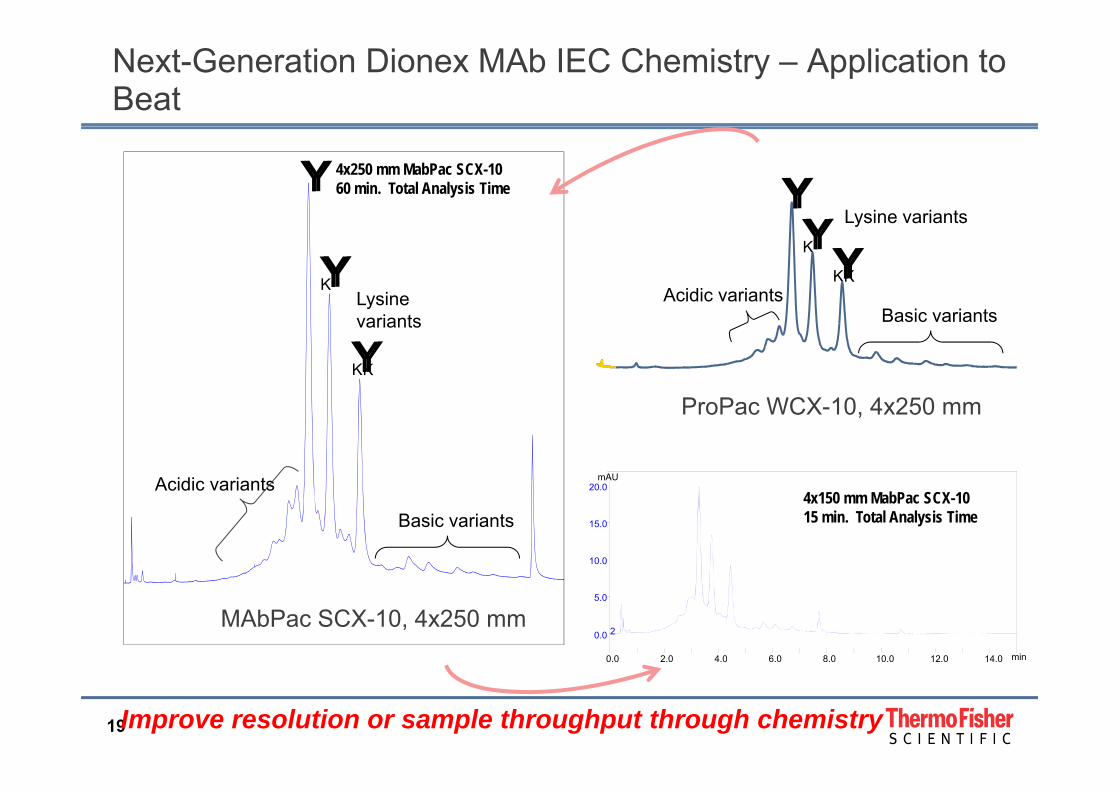
Next-Generation Dionex MAb IEC Chemistry – Application to Beat
Lysine variantsYYYY 4x250 mm MabPac SCX-10
60 min. Total Analysis Time
Lysine variants
YYKK
YYKAcidic variants
YYKLysine
Basic variants
YYKK
yvariants
ProPac WCX-10, 4x250 mm
20 0mAUAcidic variants
10.0
15.0
20.04x150 mm MabPac SCX-1015 min. Total Analysis Time
Acidic variants
Basic variants
0.0 2.0 4.0 6.0 8.0 10.0 12.0 14.0
0.0
5.0
min
2MAbPac SCX-10, 4x250 mm
19Improve resolution or sample throughput through chemistry
Slide 19
JH10 Please format with title-case text and use font size that conforms to the PPT template.
Jim Hegarty, 15/10/2014

Important Points to Consider
• Speed of analysisSpeed of analysis• Resolution• Time to develop the method• Time to develop the method• Global applicability
R b t• Robustness
20
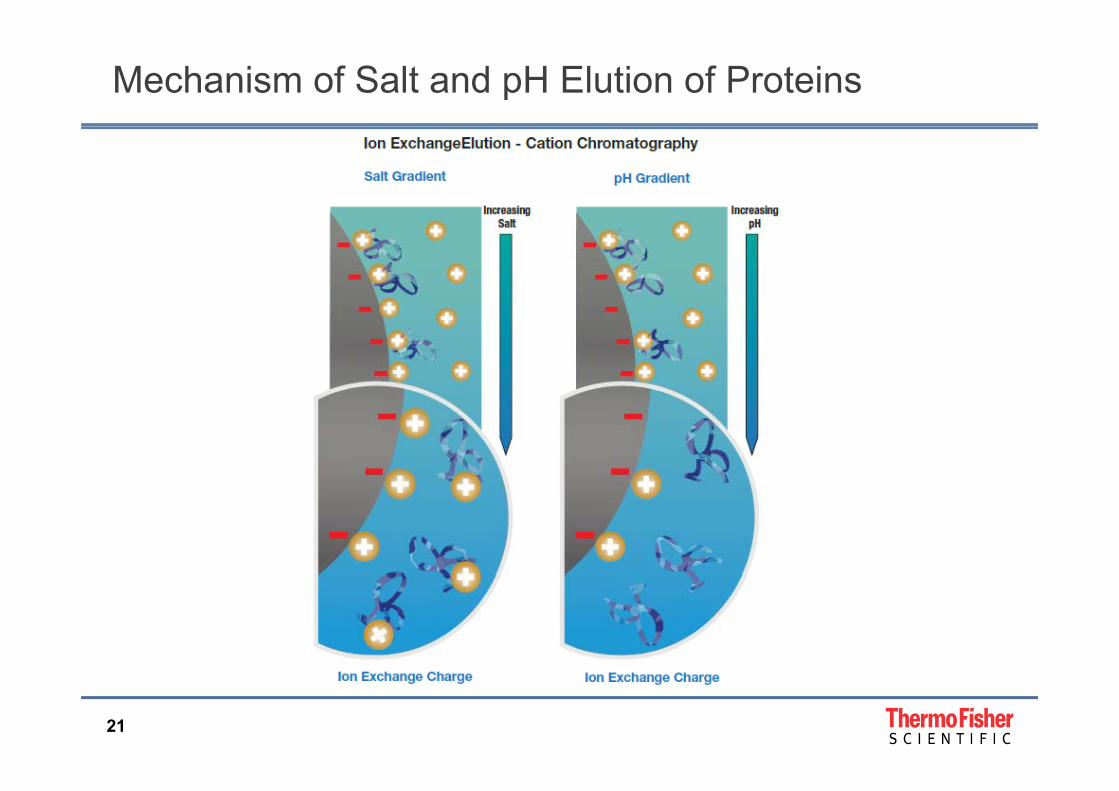
Mechanism of Salt and pH Elution of Proteins
21

Salt Versus pH Gradient IEC of mAb Sample
10.0
15.0
30.0
5.0
0.0 5.0 10.0 15.0 20.0 25.0 30.0
0.0
min%B: 10.0
Salt gradient
10 0
15.0
50.0
5.0
10.0
25 0
30 i di t MAbP SCX 10 10 4 250
0.0 5.0 10.0 15.0 20.0 25.0 30.0
0.0
min%B: 25.0
25.0pH gradient
22
30 min gradient, MAbPac SCX-10, 10 µm, 4×250 mm
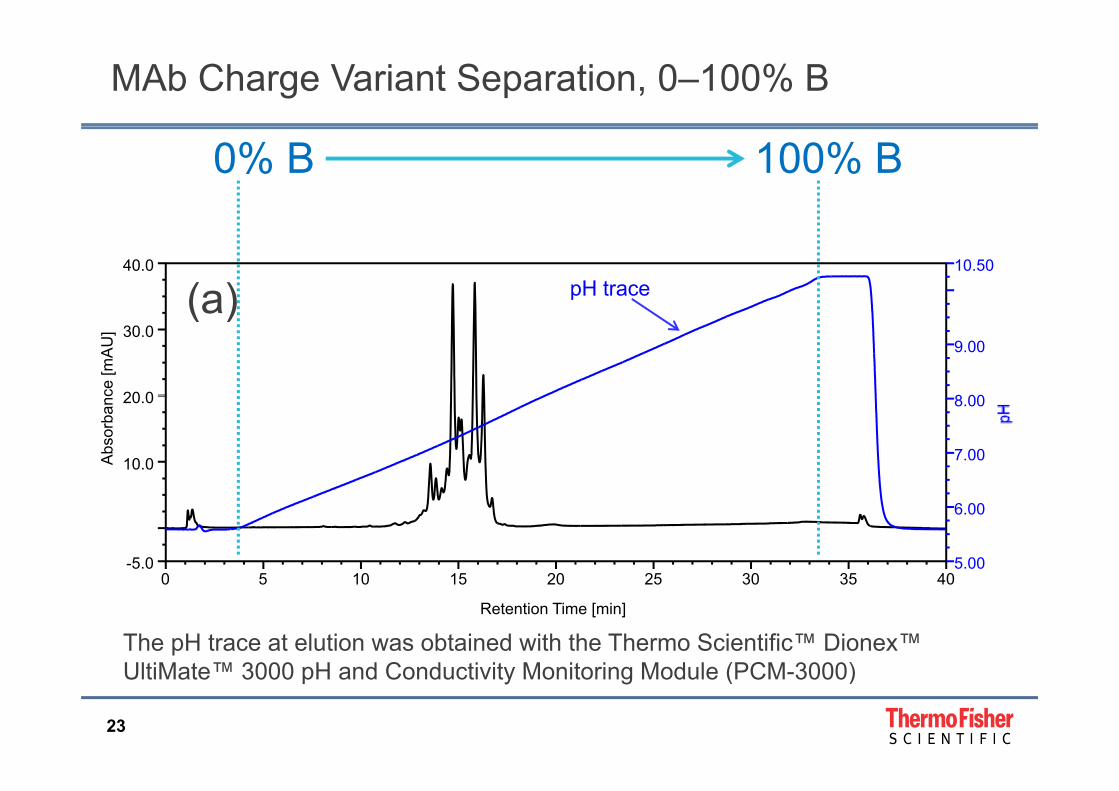
MAb Charge Variant Separation, 0–100% B
100% B0% B
40.0 10.50pH trace(a)
20 0
30.0
8 00
9.00
ce [m
AU
]
(a)
10.0
20.0
7.00
8.00
Abs
orba
nc
0 5 10 15 20 25 30 35 40-5.0 5.00
6.00
0 5 10 15 20 25 30 35 40
Retention Time [min]
The pH trace at elution was obtained with the Thermo Scientific™ Dionex™ UltiM t ™ 3000 H d C d ti it M it i M d l (PCM 3000)
23
UltiMate™ 3000 pH and Conductivity Monitoring Module (PCM-3000)
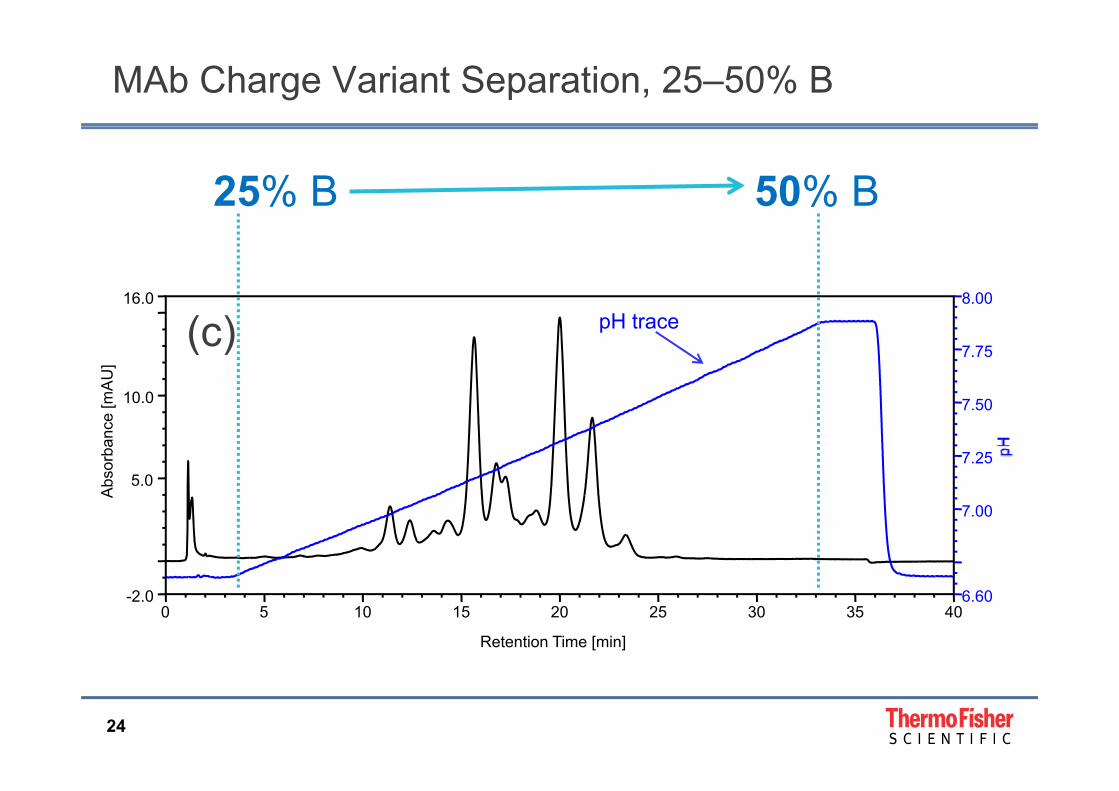
MAb Charge Variant Separation, 25–50% B
25% B 50% B
16.0 8.00
10 0
7.75
mAU
]
(c) pH trace
5.0
10.0
7.25
7.50
bsor
banc
e [m
5.0
7.00
Ab
0 5 10 15 20 25 30 35 40-2.0 6.60
Retention Time [min]
24
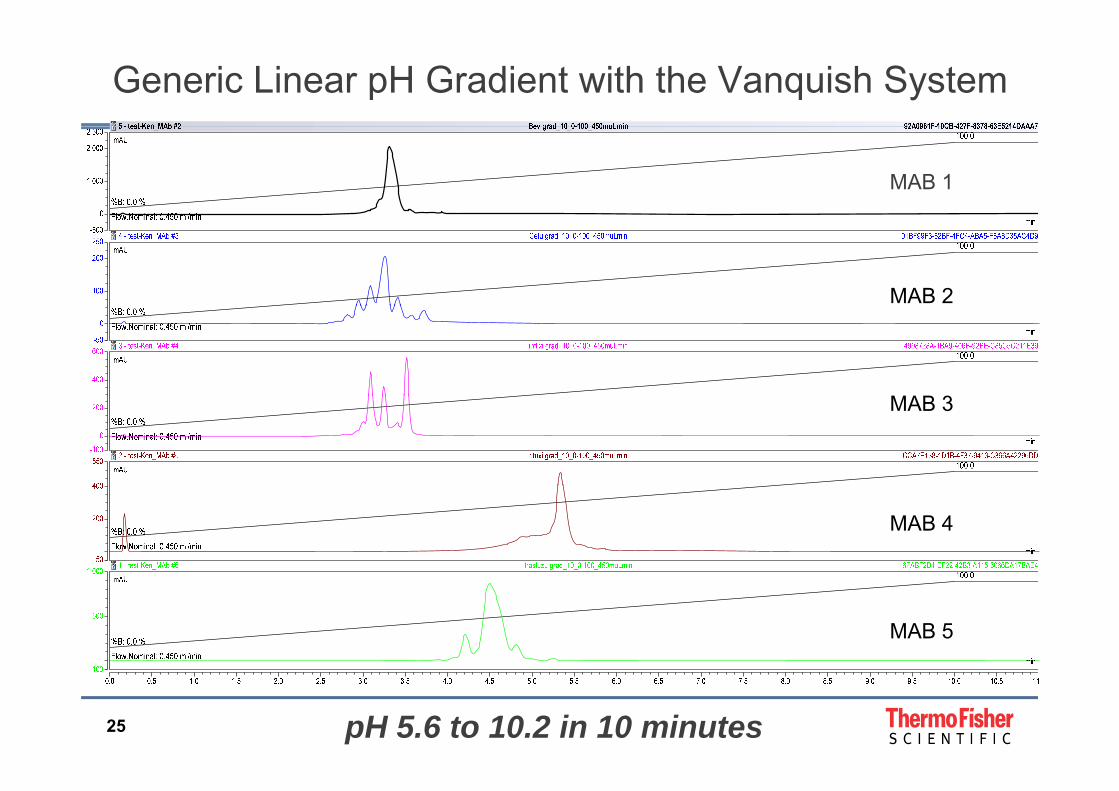
Generic Linear pH Gradient with the Vanquish System
MAB 1
MAB 2
MAB 3MAB 3
MAB 4
MAB 5
25 pH 5.6 to 10.2 in 10 minutes
Slide 25
JH14 Please format with title-case text.Jim Hegarty, 15/10/2014
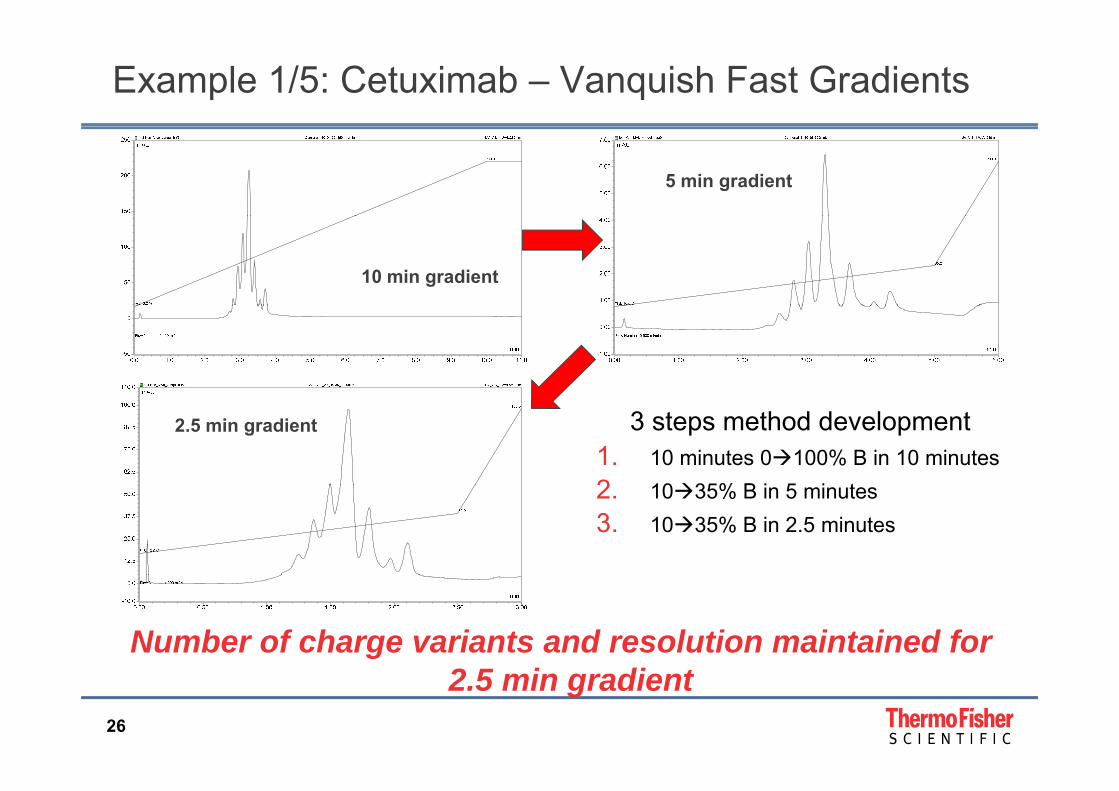
Example 1/5: Cetuximab – Vanquish Fast Gradients
5 min gradient
10 min gradient
3 steps method development1. 10 minutes 0100% B in 10 minutes2 1035% B i 5 i t
2.5 min gradient
2. 1035% B in 5 minutes3. 1035% B in 2.5 minutes
Number of charge variants and resolution maintained for
26
2.5 min gradient

Example 2/5: Infliximab – Vanquish Fast Gradients
10 min gradient
5 min gradient
3 steps method development1. 10 minutes 0100% B in 10
minutes
0.8 min gradient
minutes2. 2040% B in 5 minutes3. 1827% B in 0.8 minutes
Number of charge variants and resolution maintained for b i t di t
27
sub-minute gradient
Conclusions
• Very fast separation of mAb charge variants can be achievedVery fast separation of mAb charge variants can be achieved with the Vanquish UHPLC System through initial global methodology onto rapidly developed optimized methods• Run-time comparable or faster than cIEF
• First intact protein UHPLC Ion Exchange application successfully implemented using the Vanquish UHPLC System
28
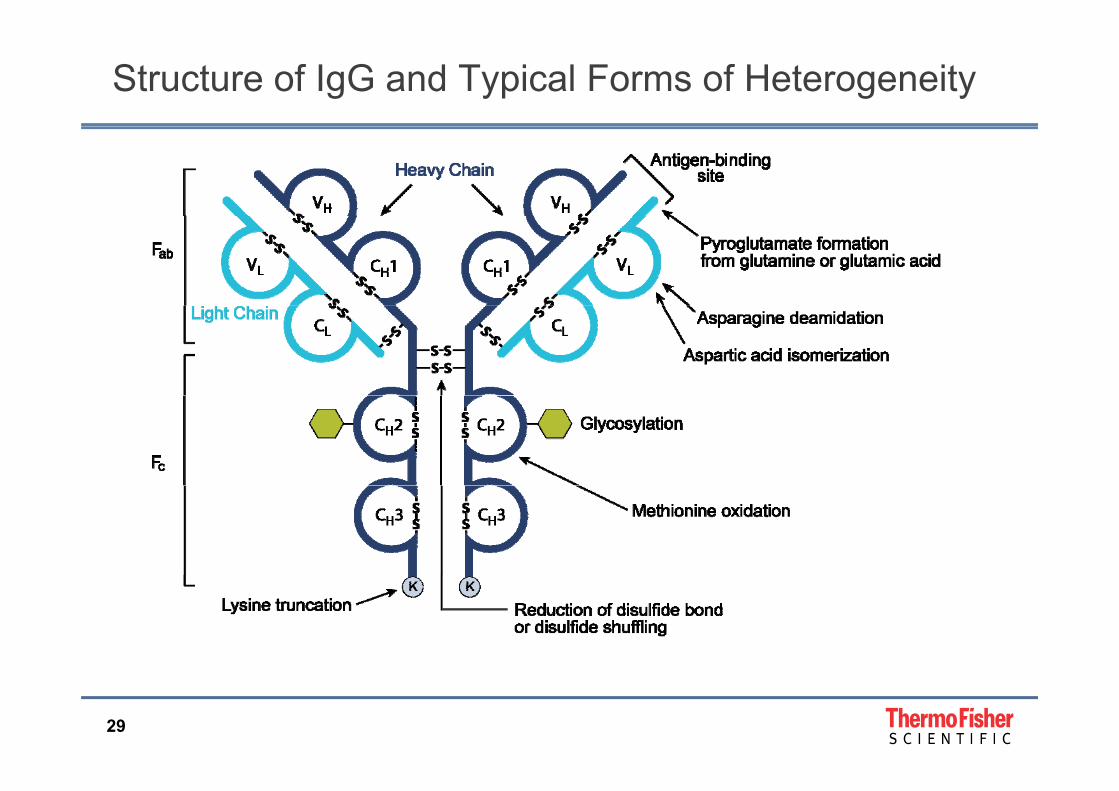
Structure of IgG and Typical Forms of Heterogeneity
29
Hydrophobic Interaction Chromatography (HIC)
• Principle
• Adsorption to a weakly hydrophobic surface at high salt concentrations
• Elution by a decreasing salt gradient
• Advantages
• Preserves biological activity of proteins during purification and native conformation
• Reversed phase solvents often denature, especially the most hydrophobic proteins
• Ideal mode after salt precipitations and ion exchange• Ideal mode after salt precipitations and ion exchange
• Excellent first step in purification due to its high capacity and low carryover
• Primary application• Primary application
• Purification of proteins and peptides
30
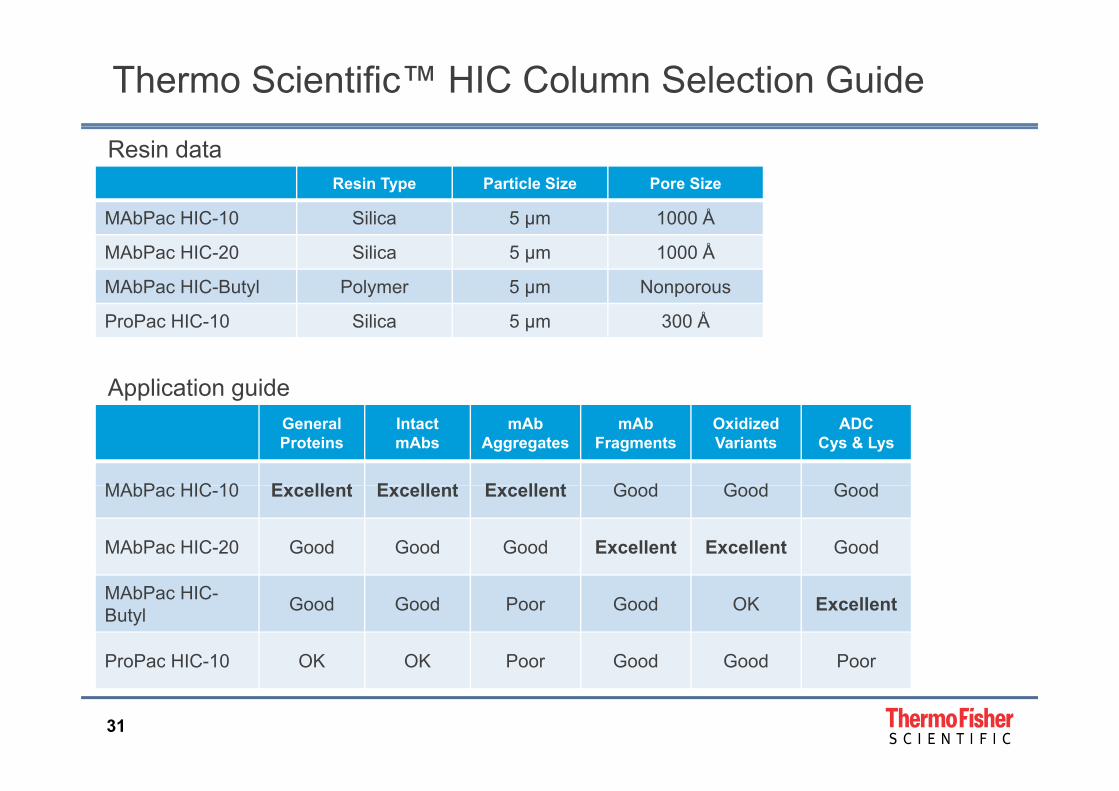
Thermo Scientific™ HIC Column Selection Guide
Resin Type Particle Size Pore Size
MAbPac HIC 10 Silica 5 µm 1000 Å
Resin data
MAbPac HIC-10 Silica 5 µm 1000 Å
MAbPac HIC-20 Silica 5 µm 1000 Å
MAbPac HIC-Butyl Polymer 5 µm Nonporous
ProPac HIC-10 Silica 5 µm 300 Å
Application guideGeneral Proteins
Intact mAbs
mAbAggregates
mAbFragments
Oxidized Variants
ADCCys & Lys
MAbP HIC 10 E ll t E ll t E ll t G d G d G d
Application guide
MAbPac HIC-10 Excellent Excellent Excellent Good Good Good
MAbPac HIC-20 Good Good Good Excellent Excellent Good
MAbPac HIC-Butyl Good Good Poor Good OK Excellent
ProPac HIC-10 OK OK Poor Good Good Poor
31
ProPac HIC 10 OK OK Poor Good Good Poor
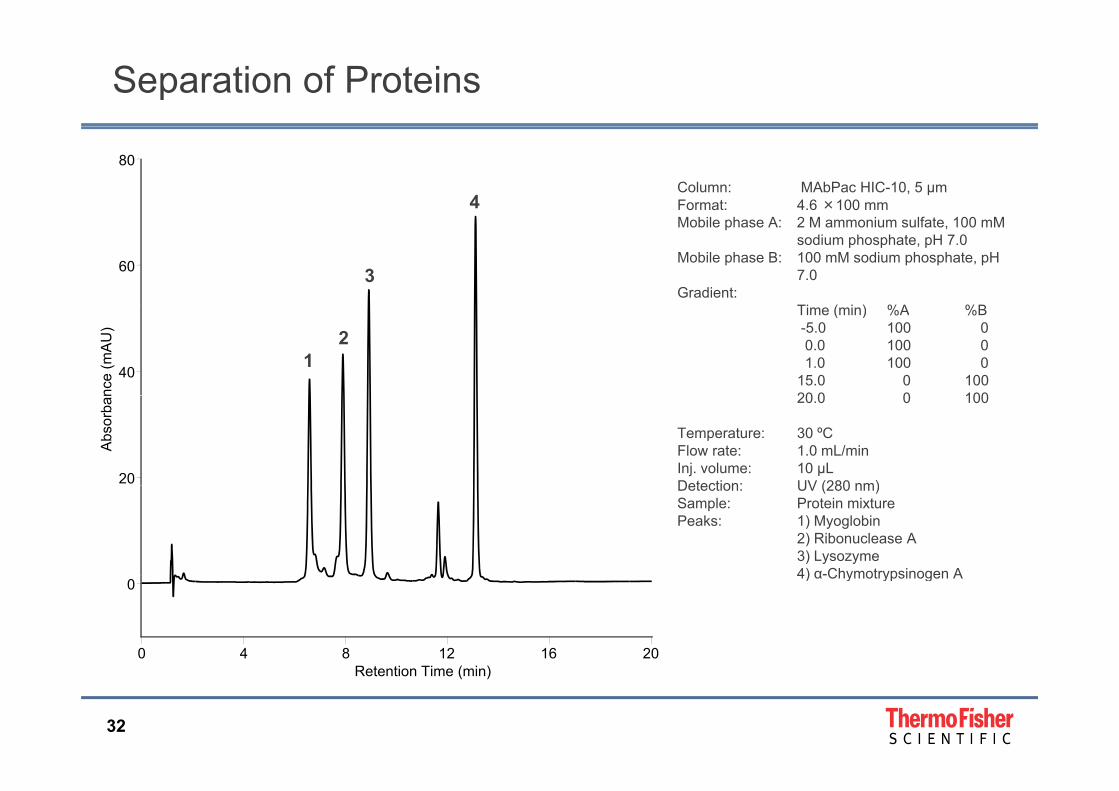
Separation of Proteins
80
Column: MAbPac HIC-10, 5 µmFormat: 4.6 ×100 mm4
60
Mobile phase A: 2 M ammonium sulfate, 100 mMsodium phosphate, pH 7.0
Mobile phase B: 100 mM sodium phosphate, pH 7.0
Gradient:Ti ( i ) %A %B
3
40
Time (min) %A %B-5.0 100 00.0 100 01.0 100 0
15.0 0 10020 0 0 100
12
nce
(mA
U)
20
20.0 0 100
Temperature: 30 ºCFlow rate: 1.0 mL/minInj. volume: 10 µL Detection: UV (280 nm)
Abs
orba
n
Detection: UV (280 nm)Sample: Protein mixturePeaks: 1) Myoglobin
2) Ribonuclease A 3) Lysozyme4) α-Chymotrypsinogen A
0 4 8 12 16 20
04) α-Chymotrypsinogen A
32
Retention Time (min)
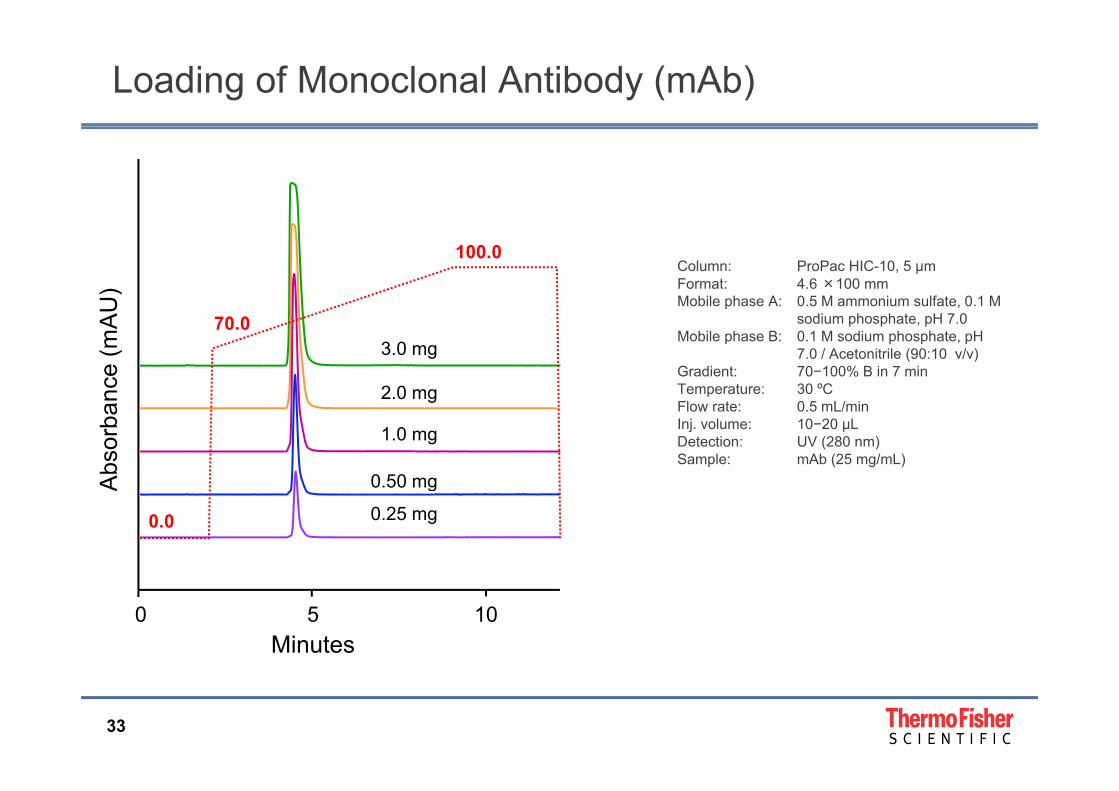
Loading of Monoclonal Antibody (mAb)
100.0Column: ProPac HIC-10, 5 µmFormat: 4.6 ×100 mmMobile phase A: 0.5 M ammonium sulfate, 0.1 MU
)
70.0
2 0 mg
3.0 mg
Mobile phase A: 0.5 M ammonium sulfate, 0.1 M sodium phosphate, pH 7.0
Mobile phase B: 0.1 M sodium phosphate, pH 7.0 / Acetonitrile (90:10 v/v)
Gradient: 70−100% B in 7 minTemperature: 30 ºCnc
e (m
AU
0 50 mg
1.0 mg
2.0 mg pFlow rate: 0.5 mL/minInj. volume: 10−20 µL Detection: UV (280 nm)Sample: mAb (25 mg/mL)
Abs
orba
n
0.0 0.25 mg
0.50 mgA
0 5 10Minutes
33
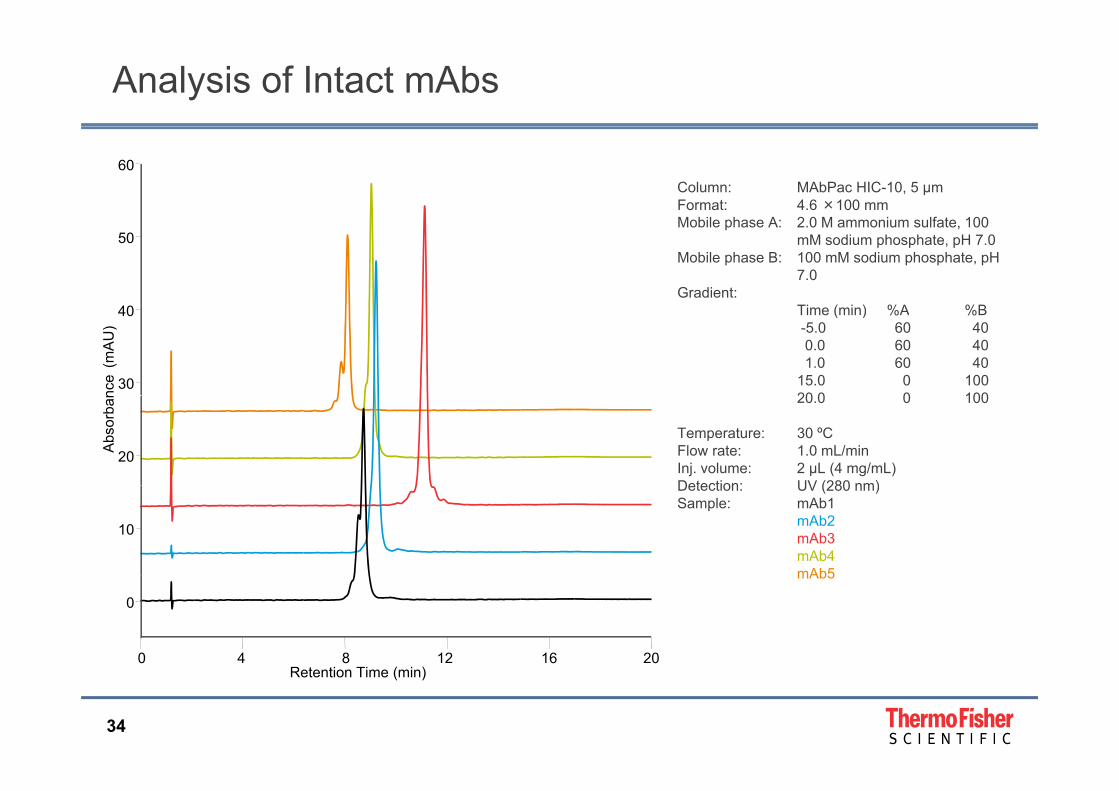
Analysis of Intact mAbs
60Column: MAbPac HIC-10, 5 µmFormat: 4.6 ×100 mm
40
50Mobile phase A: 2.0 M ammonium sulfate, 100
mM sodium phosphate, pH 7.0Mobile phase B: 100 mM sodium phosphate, pH
7.0Gradient:
Ti ( i ) %A %B
30
40 Time (min) %A %B-5.0 60 400.0 60 401.0 60 40
15.0 0 10020 0 0 100nc
e(m
AU
)
20
20.0 0 100
Temperature: 30 ºCFlow rate: 1.0 mL/minInj. volume: 2 µL (4 mg/mL)Detection: UV (280 nm)
Abs
orba
n
10
Detection: UV (280 nm)Sample: mAb1
mAb2mAb3mAb4mAb5
0 4 8 12 16 20
0
mAb5
34
Retention Time (min)
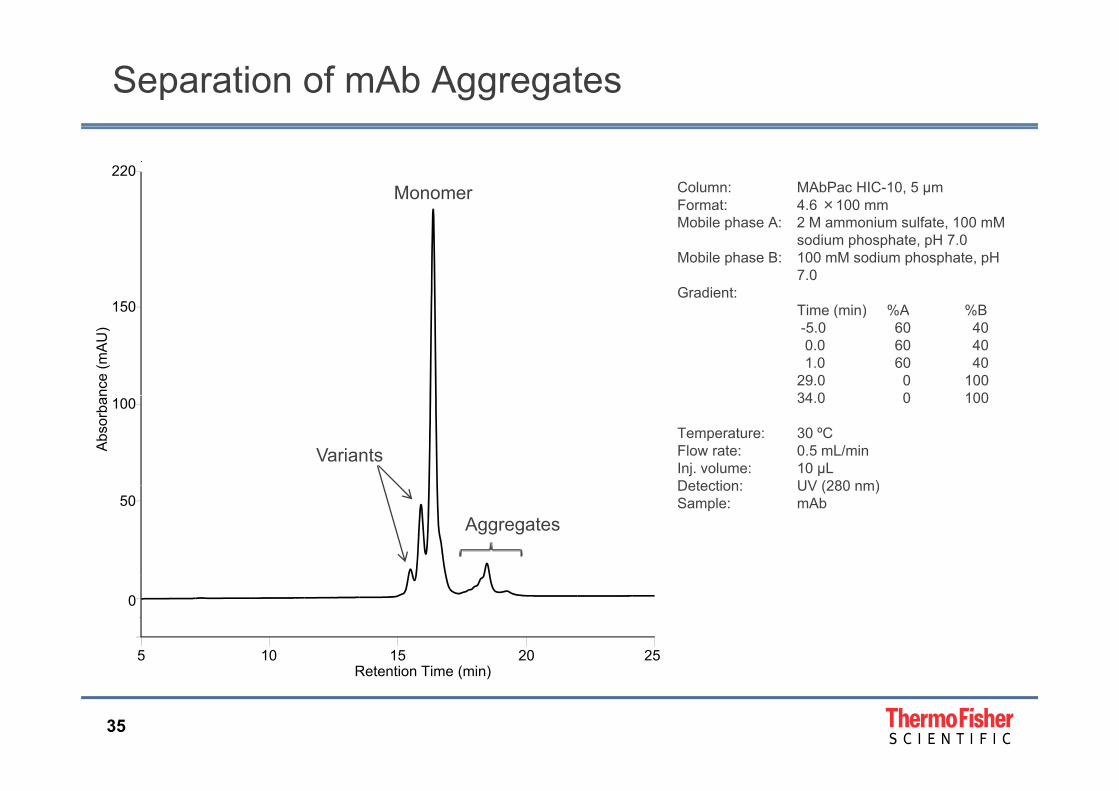
Separation of mAb Aggregates
220Column: MAbPac HIC-10, 5 µmFormat: 4.6 ×100 mm
Monomer
150
Mobile phase A: 2 M ammonium sulfate, 100 mMsodium phosphate, pH 7.0
Mobile phase B: 100 mM sodium phosphate, pH 7.0
Gradient:Ti ( i ) %A %B150 Time (min) %A %B-5.0 60 400.0 60 401.0 60 40
29.0 0 10034 0 0 100nc
e (m
AU
)
100 34.0 0 100
Temperature: 30 ºCFlow rate: 0.5 mL/minInj. volume: 10 µL Detection: UV (280 nm)
VariantsAbs
orba
n
50Detection: UV (280 nm)Sample: mAb
Aggregates
5 10 15 20 25
0
35
Retention Time (min)
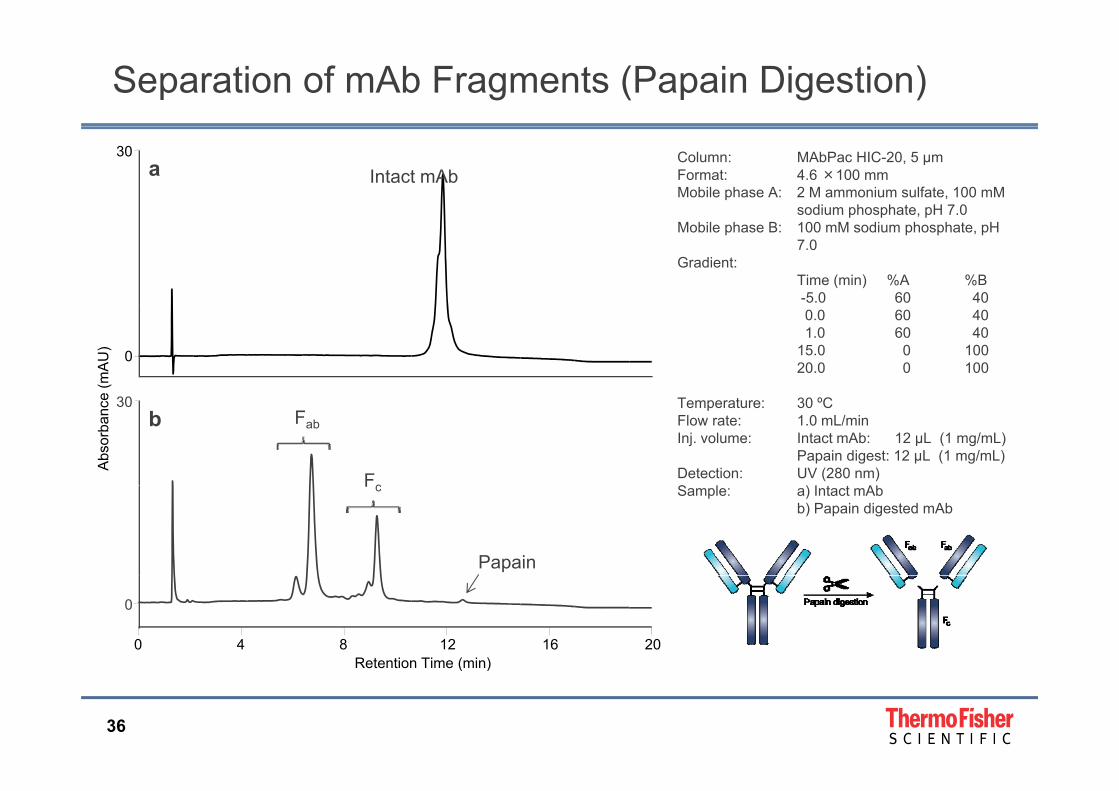
Separation of mAb Fragments (Papain Digestion)
Column: MAbPac HIC-20, 5 µmFormat: 4.6 ×100 mmMobile phase A: 2 M ammonium sulfate, 100 mM
sodium phosphate, pH 7.0
30a Intact mAb
p p , pMobile phase B: 100 mM sodium phosphate, pH
7.0Gradient:
Time (min) %A %B-5.0 60 400.0 60 401.0 60 40
15.0 0 10020.0 0 100
0
e (m
AU
)
Temperature: 30 ºCFlow rate: 1.0 mL/minInj. volume: Intact mAb: 12 µL (1 mg/mL)
Papain digest: 12 µL (1 mg/mL)Detection: UV (280 nm)S l ) I Ab
30
Abs
orba
nce
b Fab
Fc Sample: a) Intact mAbb) Papain digested mAb
Fc
Papain
0 4 8 12 16 20
0
Retention Time (min)
36
Retention Time (min)
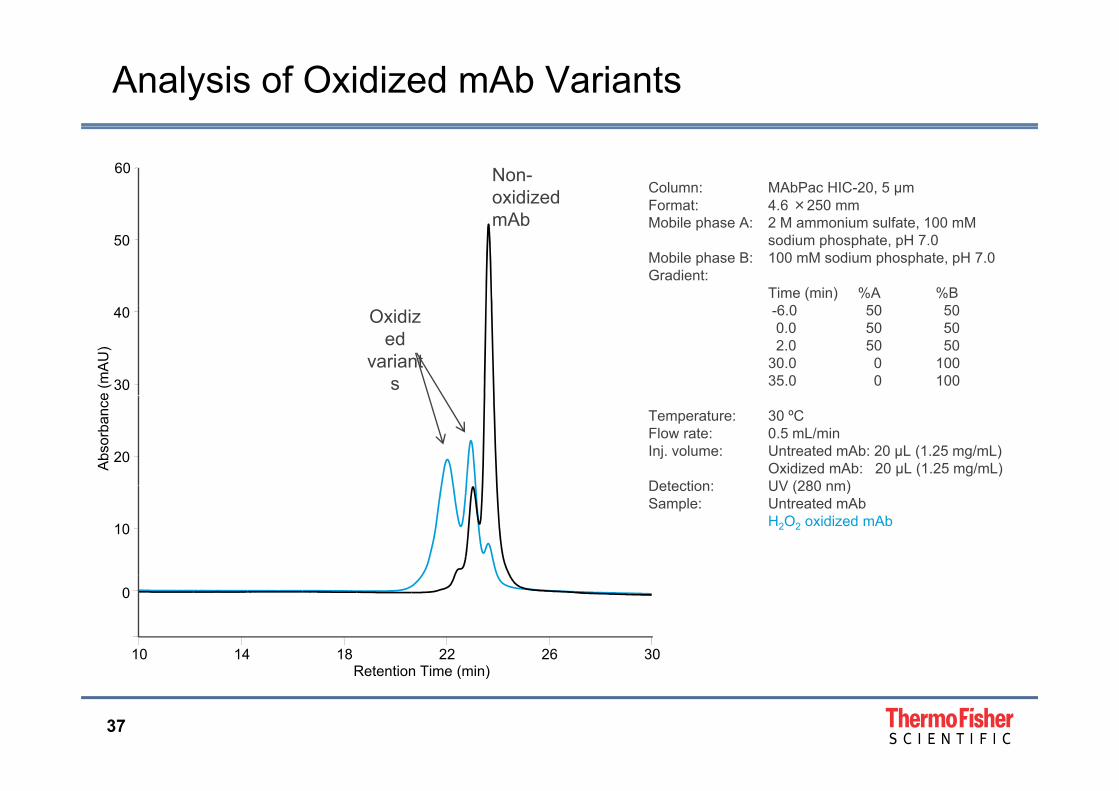
Analysis of Oxidized mAb Variants
60Column: MAbPac HIC-20, 5 µmFormat: 4.6 ×250 mm
Non-oxidized mAb
50Mobile phase A: 2 M ammonium sulfate, 100 mM
sodium phosphate, pH 7.0Mobile phase B: 100 mM sodium phosphate, pH 7.0Gradient:
Time (min) %A %B6 0 50 50
mAb
30
40 -6.0 50 500.0 50 502.0 50 50
30.0 0 10035.0 0 100
e (m
AU
)
Oxidized
variants
20
Temperature: 30 ºCFlow rate: 0.5 mL/minInj. volume: Untreated mAb: 20 µL (1.25 mg/mL)
Oxidized mAb: 20 µL (1.25 mg/mL)Detection: UV (280 nm)
Abs
orba
nce
10
Detection: UV (280 nm)Sample: Untreated mAb
H2O2 oxidized mAb
10 14 18 22 26 30
0
37
Retention Time (min)
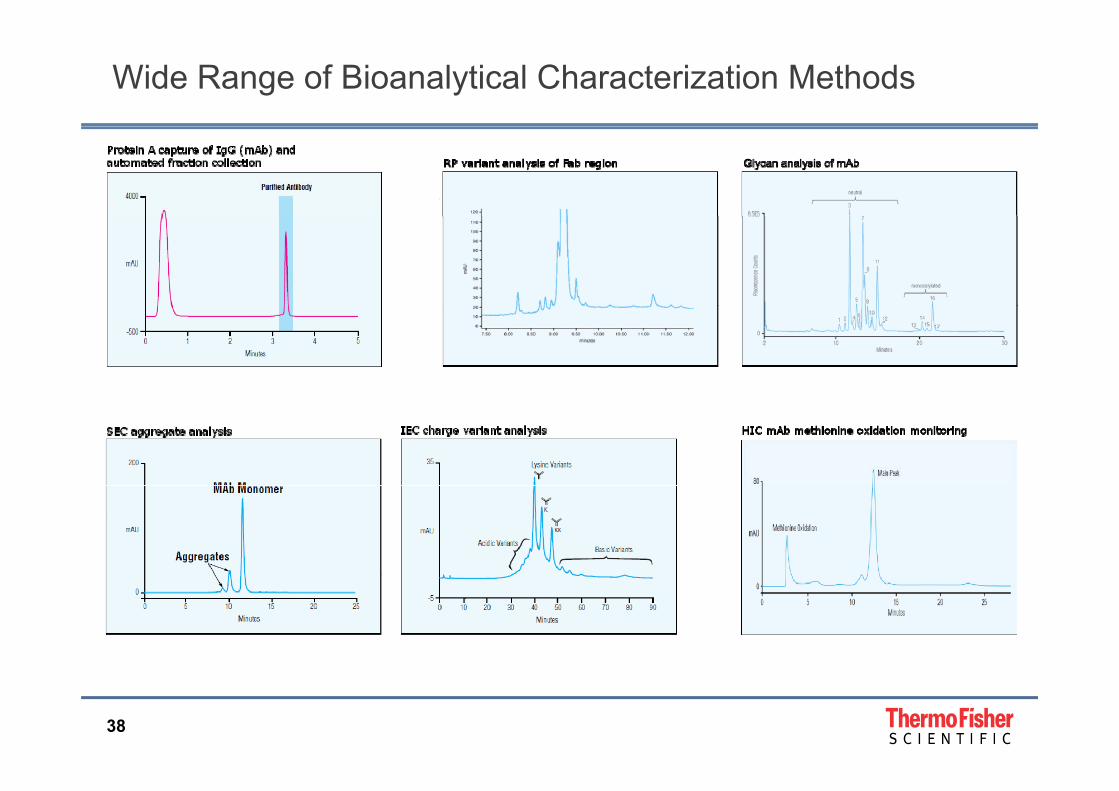
Wide Range of Bioanalytical Characterization Methods
38
New Members of the Thermo Scientific™ Orbitrap™ Family
39 The world leader in serving science
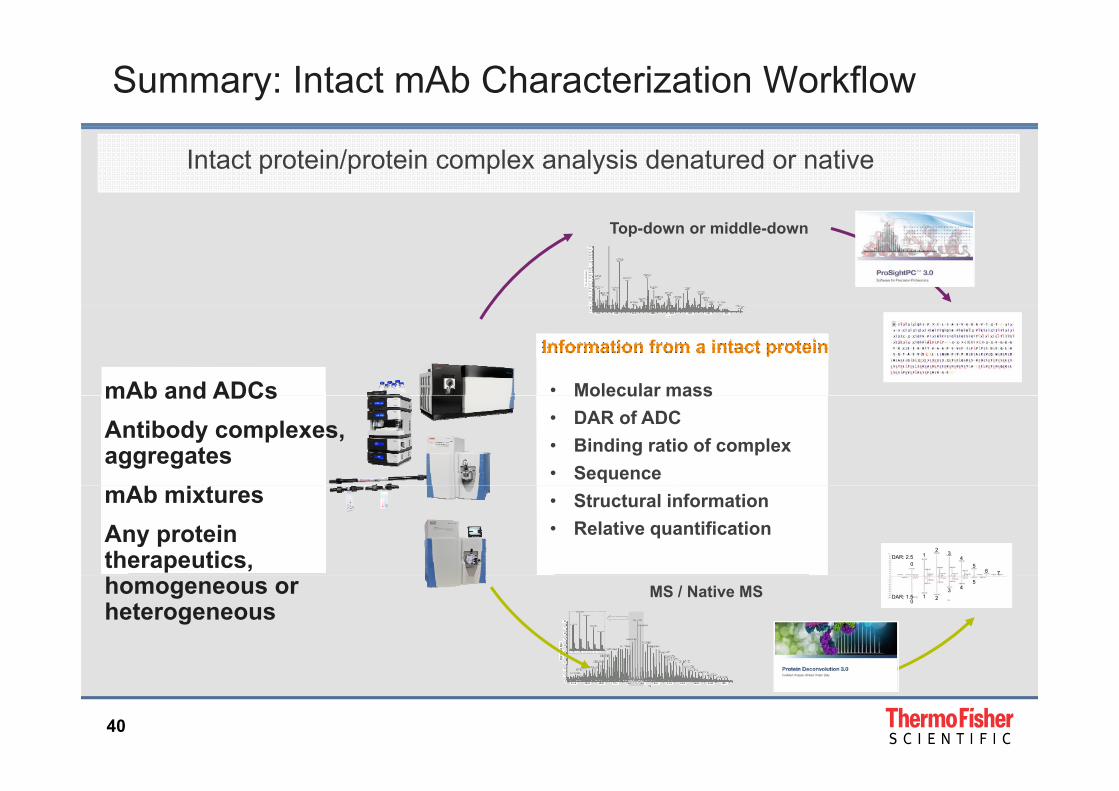
Summary: Intact mAb Characterization Workflow
Intact protein/protein complex analysis denatured or native
Top-down or middle-down
mAb and ADCs • Molecular massmAb and ADCsAntibody complexes, aggregates
Molecular mass• DAR of ADC• Binding ratio of complex• Sequence
00
1122 33
4455
66 77
DAR: 2.5 DAR: 2.5 0
12 3
45
6 7
DAR: 2.5
mAb mixtures Any protein therapeutics,
• Structural information• Relative quantification
MS / Native MS00
11 2233 44
55
DAR: 1.5DAR: 1.50
1 23 4
5
DAR: 1.5homogeneous or heterogeneous
40
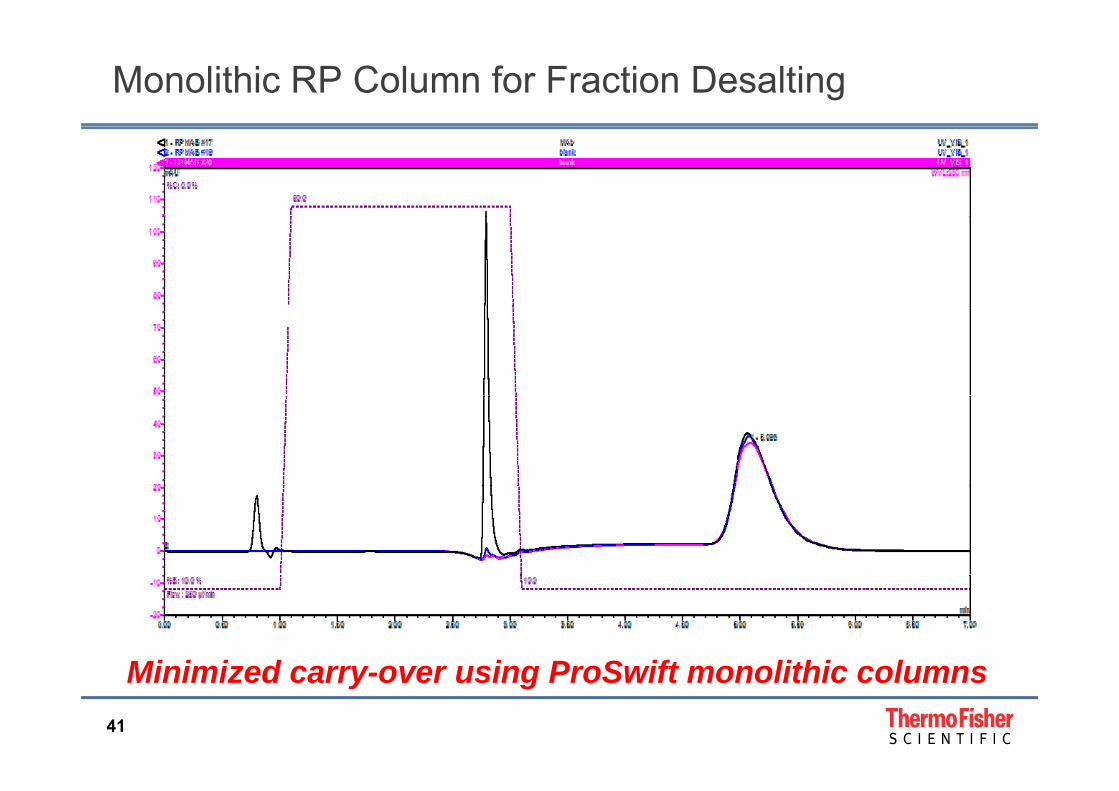
Monolithic RP Column for Fraction Desalting
Mi i i d i P S ift lithi l41
Minimized carry-over using ProSwift monolithic columns
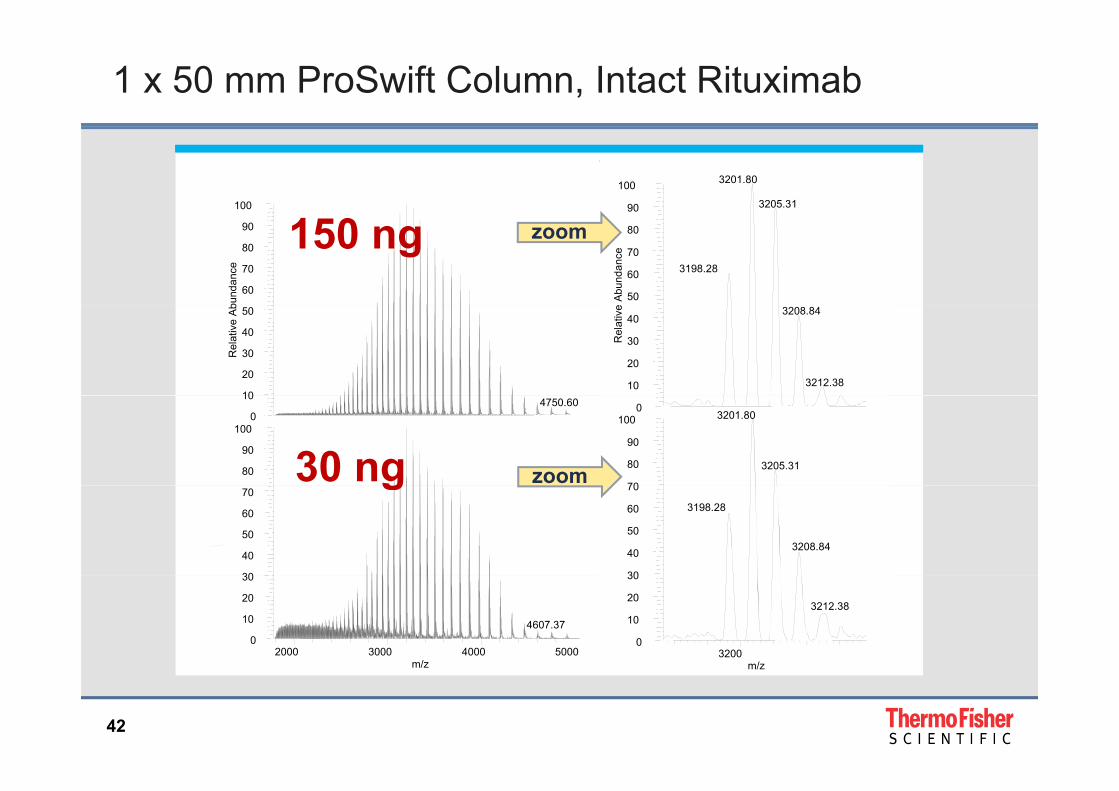
1 x 50 mm ProSwift Column, Intact Rituximab
90
100 3201.80
3205.31100
50
60
70
80
e A
bund
ance
3198.28
60
70
80
90bu
ndan
cezoom150 ng
10
20
30
40
Rel
ativ
e 3208.84
3212.3810
20
30
40
50
Rel
ativ
e A
b
70
80
90
1000
3201.80
3205.3180
90
1000
10 4750.60
zoom30 ng
30
40
50
60
70
3198.28
3208.84
30
40
50
60
70g
3200m/z
0
10
20
30
3212.38
2000 3000 4000 5000m/z
0
10
20
30
4607.37
42
m/zm/z
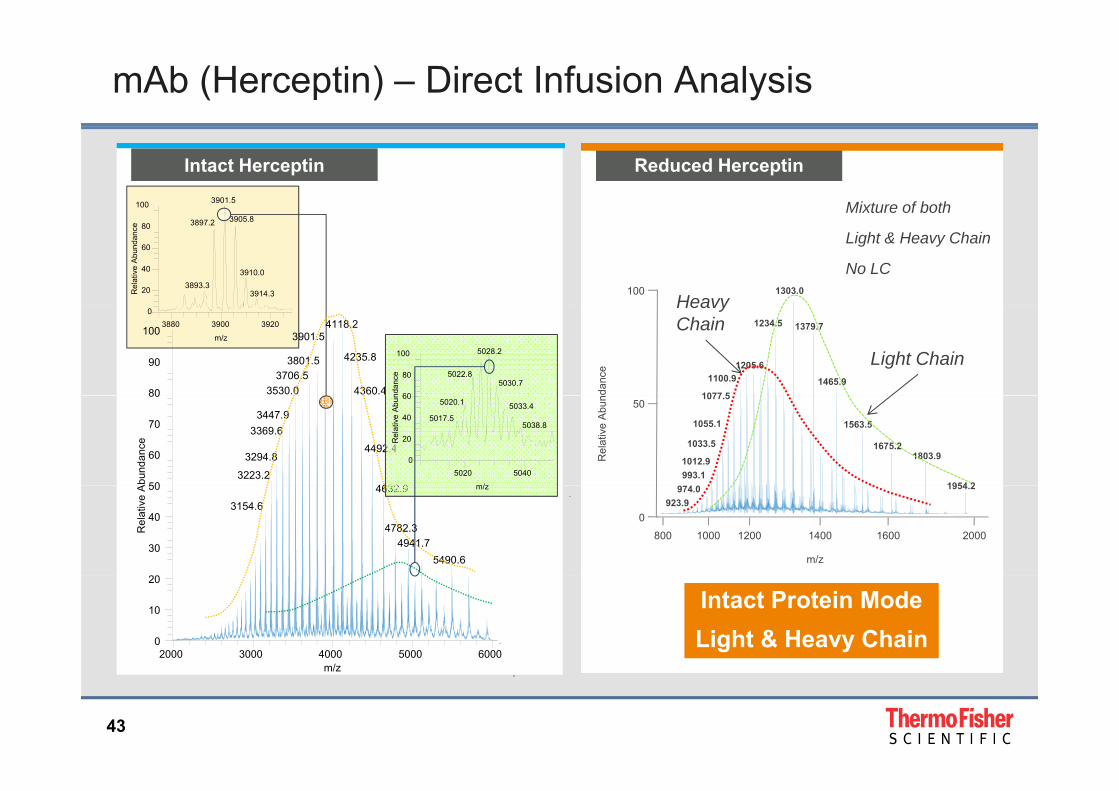
mAb (Herceptin) – Direct Infusion Analysis
Intact HerceptinIntact Herceptin Reduced HerceptinReduced Herceptin
Mixture of both 100 3901.5
390 8
1303.0100
Light & Heavy Chain
No LC20
40
60
80
Rel
ativ
e A
bund
ance
3905.83897.2
3910.03893.3
3914.3 Heavy
danc
e
1234.5 1379.7
1205.61100.9 1465.9
1077 5
3880 3900 3920
m/z
0
80
90
100 4118.23901.5
4235.83801.53706.5
4360.43530.0 60
80
100
ndan
ce
5028.2
5022.85030.7
Light Chain
Heavy Chain
Rel
ativ
e A
bun 1077.5
1055.1 1563.5
1033.5 1675.21803.91012.9
993.11954 2
50
50
60
70
80
Abu
ndan
ce
3447.93369.6
4492.43294.8
3223.24632 9
5020 5040
m/z
0
20
40
60R
elat
ive
Abu
n5020.1 5033.4
5017.55038.8
1200 1400 1600
m/z
1954.2974.0923.9
800 20001000
0
30
40
50
Rel
ativ
e A 4632.9
3154.6
4782.34941.7
5490.6
m/z
Intact Protein ModeLight & Heavy Chain
2000 3000 4000 5000 6000/
0
10
20
43
m/z

Accurate Monoisotopic Mass Measurement Using Ultra High Resolution
LC-MS of Antibody Light Chain and Heavy Chain
+23
70
80
90
100
ce
90
100
926.0595z=25
890.4806964 5199
100G0F G1F+45 +45 G1F
+45
80
90
100
1005.5 1006.0 1006.5 1007.0 1007.5m/z
0
10
20
30
40
50
60
Rel
ativ
e A
bund
anc
30
40
50
60
70
80
Rel
ativ
e A
bund
ance
z=26 964.5199z=24
857.5000z=27 1006.4988
z=231102.3079
z=211052.2487z=22
798.5352z=29
1157.3224z=20771.8840
z=30 1218.1823 45
50
55
60
65
70
75
80
85
90
95
elat
ive
Abun
danc
e
+451135.0 1135.2 1135.4 1135.6 1135.8 1136.0 1136.2 1136.4 1136.6 1136.8 1137.0
m/z
0
10
20
30
40
50
60
70
Rel
ativ
e Ab
unda
nce
800 900 1000 1100 1200 1300 1400m/z
0
10
20
30 z=30 1218.1823z=19
1285.9696z=18 1361.4380
z=17
m/z
1126 1128 1130 1132 1134 1136 1138 1140 1142 1144 1146m/z
0
5
10
15
20
25
30
35
40Re
G2F+45
0.7 ppmG0F G1F
G2F
2.3 ppm 1.8 ppm
20.2 ppm
Q Exactive Plus, 280K, protein modeQ Exactive Plus, 140K
44
, , p,
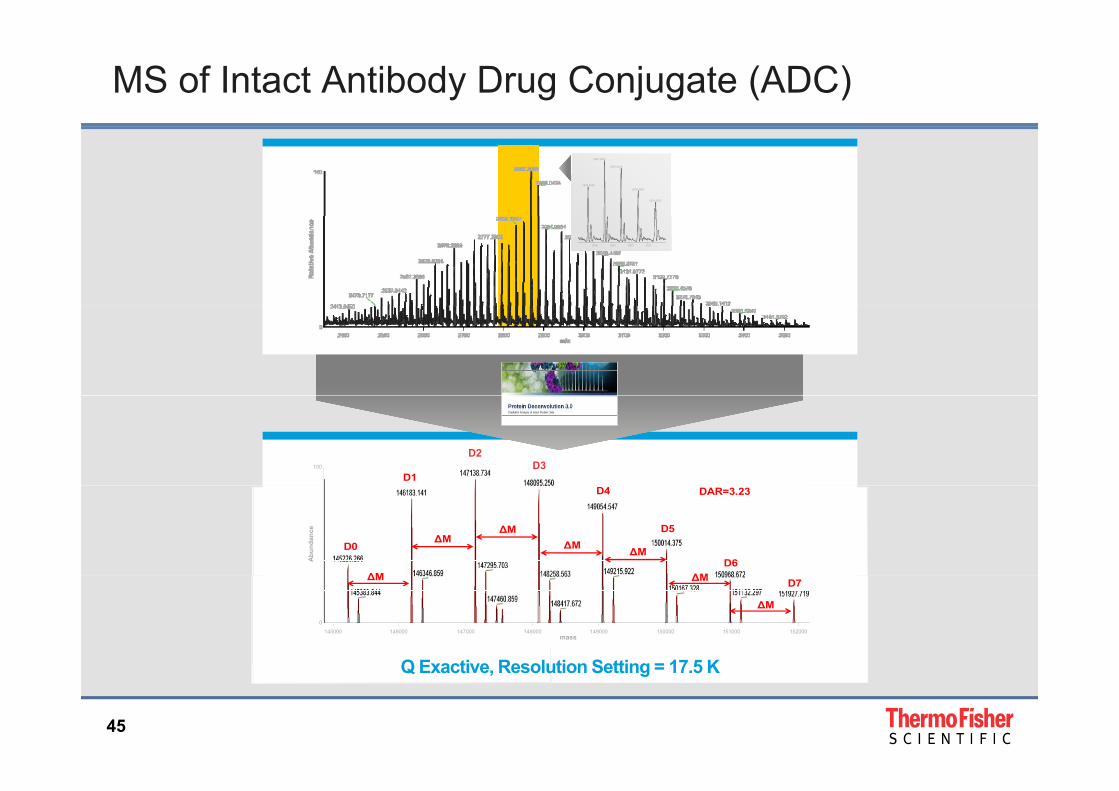
MS of Intact Antibody Drug Conjugate (ADC)
2867.3693
2886.0424
2848.90492904.9884
2924.6023
2860 2880 2900 2920
D1D3100
D2D3
D0
∆M
∆M
D4
D6
D5∆M∆M ∆M
∆M
DAR=3.23
Abun
danc
e
∆M D7∆M
∆M0
mass145000 146000 147000 148000 149000 150000 151000 152000
Q Exactive Resolution Setting = 17 5 K
45
Q Exactive, Resolution Setting = 17.5 K
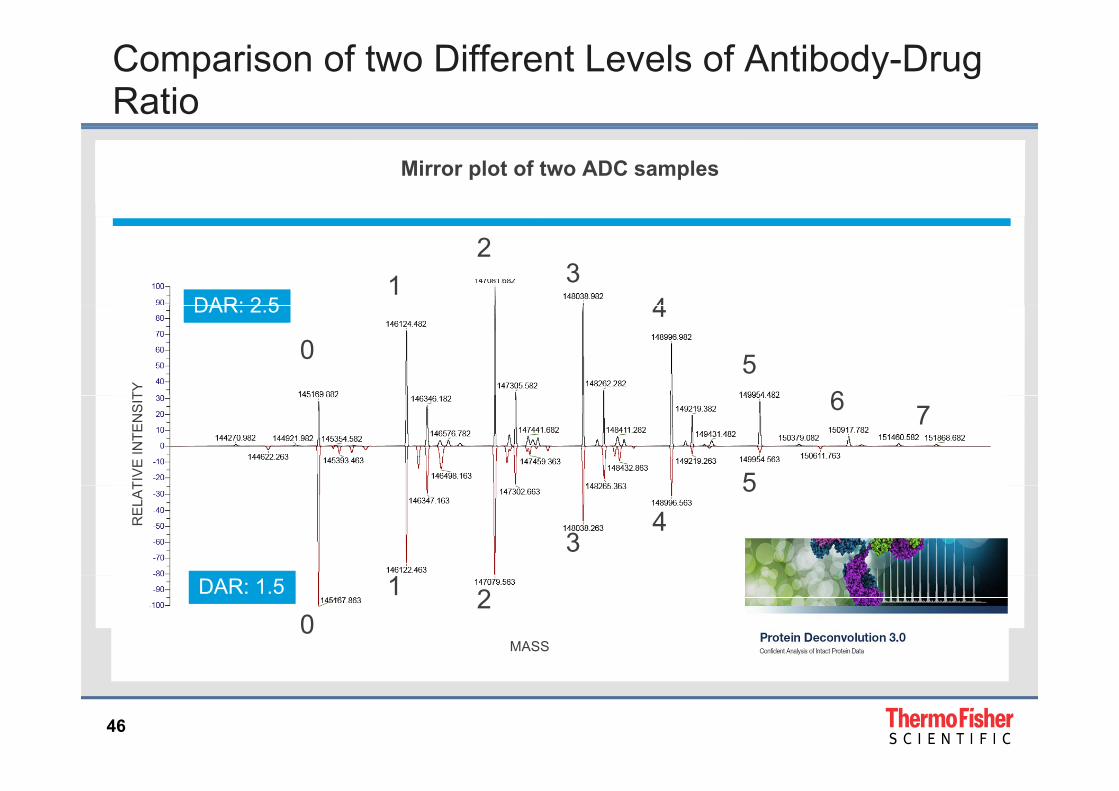
Comparison of two Different Levels of Antibody-Drug Ratio
Mirror plot of two ADC samples
12
34DAR: 2 5DAR: 2 5
04
56
DAR: 2.5DAR: 2.5
TY 6 7
5TIV
E IN
TEN
SIT
34
5
RE
LAT
01 2DAR: 1.5DAR: 1.5
MASS
46

Native MS Using Exactive Plus EMR
• An ESI compatible volatile solution with near neutral pH is
• Extended mass range up to m/z 20,000p
used to prepare protein samples. • Under these conditions, the
ionized proteins carry fewer
• Unmatched Desolvation using in-source CID and in HCD cell
• Improved high massp ycharges than those produced by ESI in acidic, denatured condition.
Improved high mass transmission for large protein assemblies
• Therefore, in native MS, protein ions are detected at a significantly higher m/z range (>5000 10 000 m/z for antibody
mAb, Acidic pH, Denatured 40
60
80
100
ative Abu
ndan
ce
3276.463350.953071.72
3428.83
3510.48
2948.91
3596.112835.51
3685 95(>5000 -10,000 m/z for antibody complexes) than conventional MS in acidic condition. mAb, Neutral pH, Native
20
40
60
80
1000
20Rela 3685.95
3780.492730.54
3984.74
6410.47
6701.82
5897.61
7020.98
5670.63
47
3000 4000 5000 6000 7000m/z
0
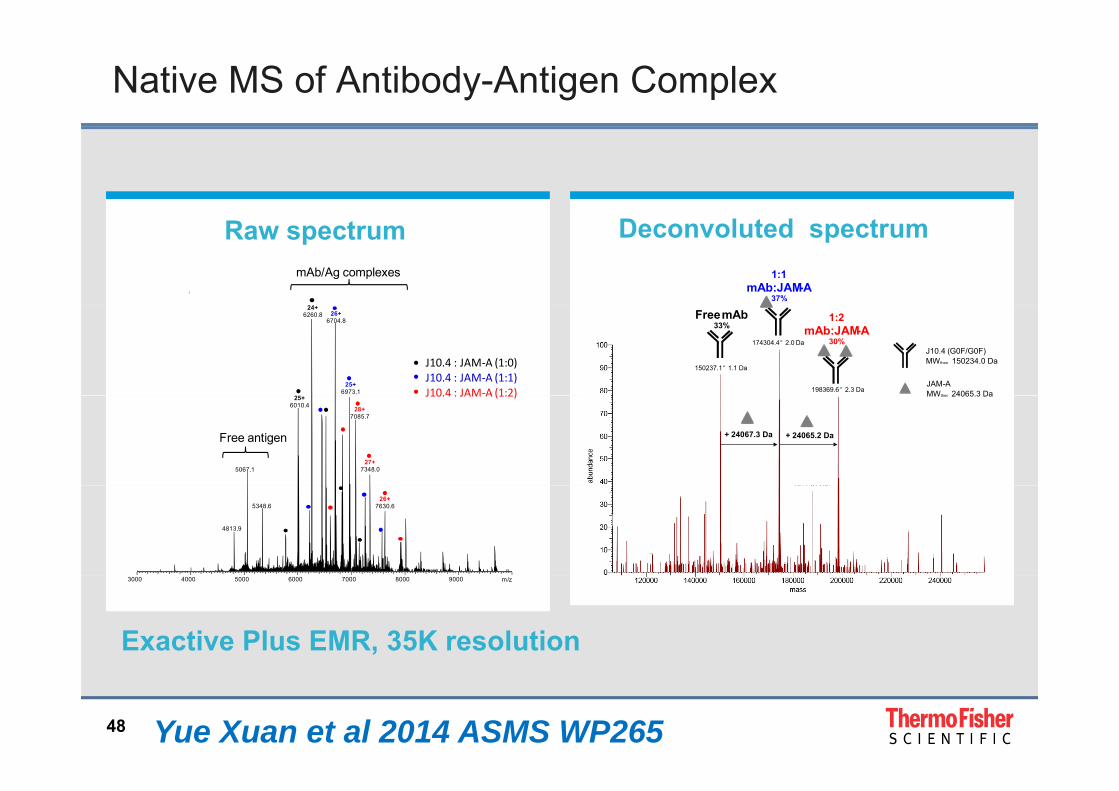
Native MS of Antibody-Antigen Complex
24
mAb/Ag complexes 1:1 mAb:JAM-A
37%
Raw spectrum Deconvoluted spectrum
26+6704.8
24+6260.8
25+6973.1
J10.4 : JAM‐A (1:0)J10.4 : JAM‐A (1:1)J10.4 : JAM‐A (1:2)
Free mAb33%
1:2 mAb:JAM-A
30%174304.4 “ 2.0 Da
150237.1 “ 1.1 Da
198369.6 “ 2.3 DaJAM-AMWtheo 24065.3 Da
J10.4 (G0F/G0F)MWtheo 150234.0 Da
25+6010.4 28+
7085.7
5067.127+
7348.0
J10.4 : JAM A (1:2)
Free antigen + 24065.2 Da+ 24067.3 Da
MWtheo 24065.3 Da
5348.626+
7630.6
4813.9
3000 4000 5000 6000 7000 8000 9000 m/z
Exactive Plus EMR, 35K resolution
48 Yue Xuan et al 2014 ASMS WP265
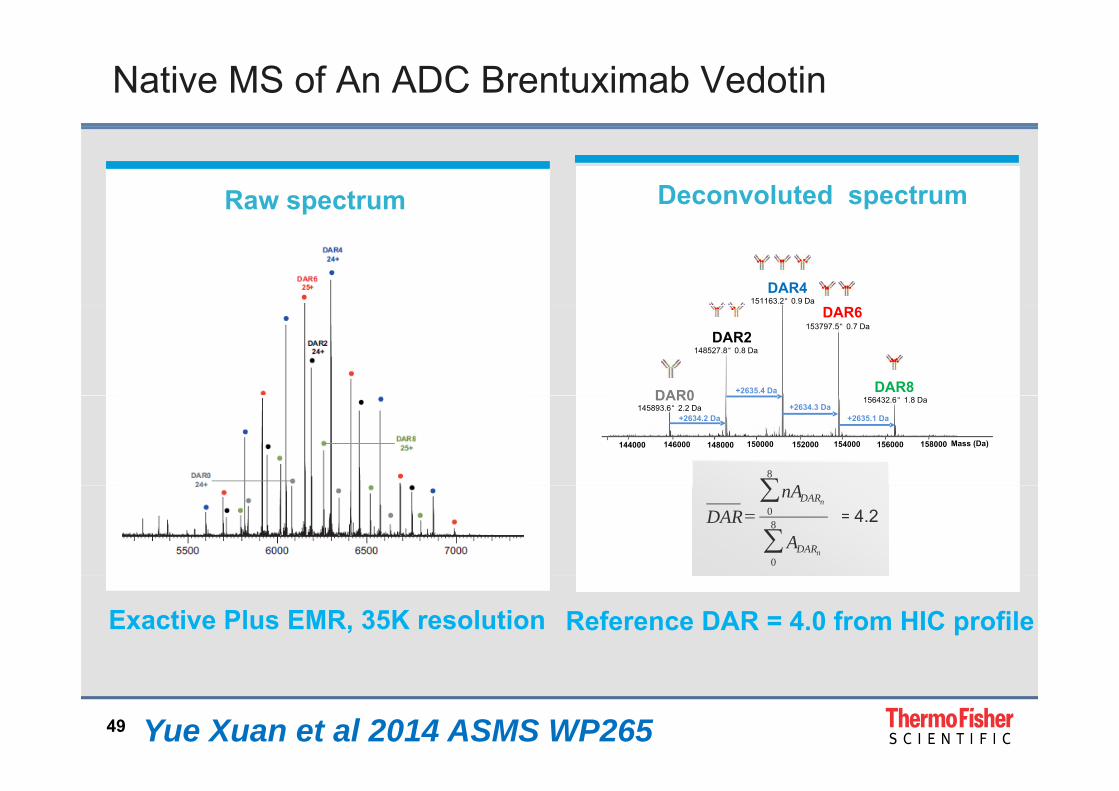
Native MS of An ADC Brentuximab Vedotin
Raw spectrum Deconvoluted spectrum
DAR4151163.2 “ 0.9 Da
DAR2DAR6
DAR8DAR0 +2635.4 Da
148527.8 “ 0.8 Da
153797.5 “ 0.7 Da
DAR8DAR0
146000144000 Mass (Da)150000148000 154000152000 158000156000
+2634.2 Da +2634.3 Da
+2635.1 Da145893.6 “ 2.2 Da
156432.6 “ 1.8 Da
8
A = 3.8
8
0
0
n
n
DAR
DAR
A
nADAR = 4.2
Exactive Plus EMR, 35K resolution Reference DAR = 4.0 from HIC profile
49 Yue Xuan et al 2014 ASMS WP265
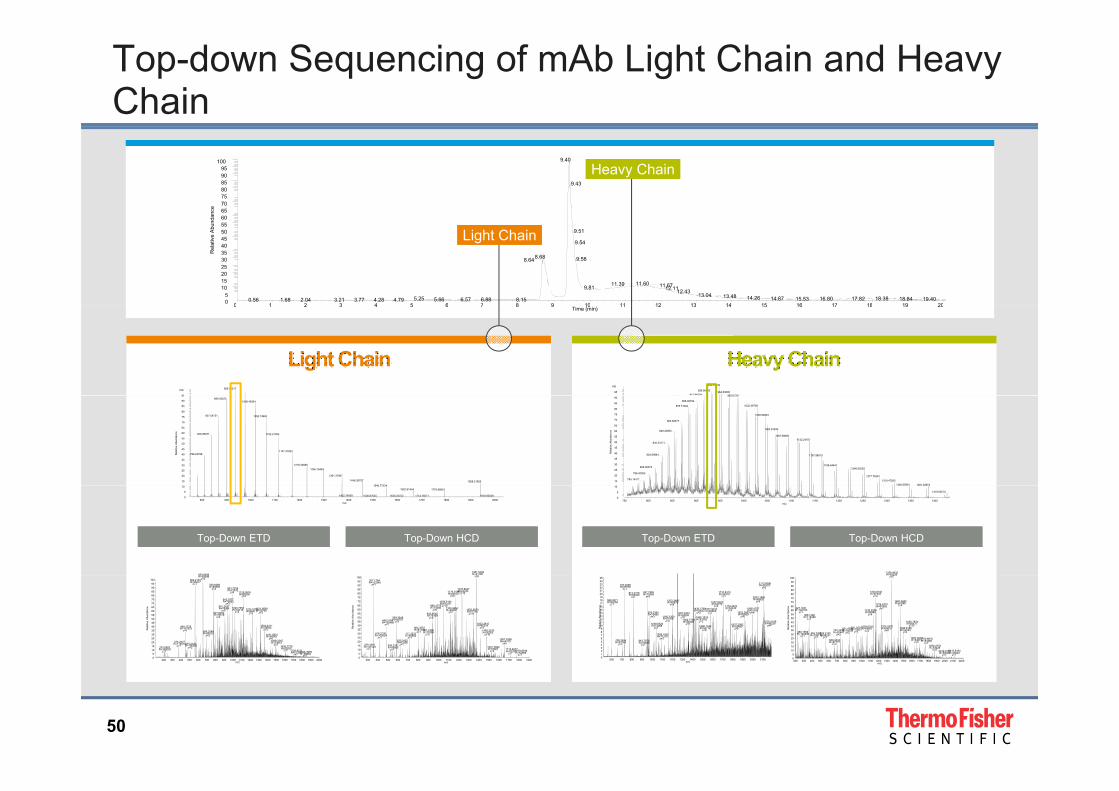
Top-down Sequencing of mAb Light Chain and Heavy Chain
6065707580859095
100
ance
9.40
9.43
Heavy ChainHeavy Chain
0 1 2 3 4 5 6 7 8 9 10 11 12 13 14 15 16 17 18 19 2005
1015202530354045505560
Rel
ativ
e A
bund
a
9.51
9.54
8.68 9.588.64
11.6011.39 11.679.81 12.1112.4313.04 13.48 14.26 18.3814.875.25 17.8216.80 18.8415.53 19.405.66 6.57 6.88 8.154.792.041.68 4.280.56 3.773.21
Light ChainLight Chain
95
100 926.0421795
100 943.70939
926.56803 964.53605912.94204 983 07214
0 1 2 3 4 5 6 7 8 9 10 11 12 13 14 15 16 17 18 19 20Time (min)
15
20
25
30
35
40
45
50
55
60
65
70
75
80
85
90
95
Rel
ativ
e A
bund
ance
890.435231006.48304
857.54731 1052.15994
826.95971 1102.21393
1157.31923798.43798
1218.24686
1285.76463
1361.37097
1446.36757 1928.219261542 77334
15
20
25
30
35
40
45
50
55
60
65
70
75
80
85
90
Rel
ativ
e A
bund
ance
983.07214
896.92702
1022.39706878.71644
1039.90923
863.82377
1064.91630849.42853
1087.596651132.24767
835.53171
824.69843 1157.98015
1188.64441809.06373 1246.60252
796.420031277.75291
784.14411 1310.472931340.65991 1381 20972
1358.4633R=63229
1381.5299R=61180654 8088
800 900 1000 1100 1200 1300 1400 1500 1600 1700 1800 1900 2000m/z
0
5
10 1542.773341652.91434 1779.96801
1402.74939 1714.18271 1978.920591500.87635 1620.24752
750 800 850 900 950 1000 1050 1100 1150 1200 1250 1300 1350 1400m/z
0
5
101340.65991 1381.20972
1419.60570
Top-Down ETDTop-Down ETD Top-Down HCDTop-Down HCD Top-Down ETDTop-Down ETD Top-Down HCDTop-Down HCD
600 700 800 900 1000 1100 1200 1300 1400 1500 1600 1700 1800 1900 2000 2100m/z
0123456789
10111213141516171819202122232425
Rel
ativ
e A
bund
ance
2113.6096R=50197
z=2727.4096R=87578
z=11710.8310R=52319
z=?957.7885R=75456
z=3814.4418R=83020
z=1 2053.1886R=48925
z=51203.3486R=65878
z=4
598.3671R=95258
z=11776.6622R=54444
z=4 1995.4757R=51193
z=61436.1799R=63602
z=21577.9014R=60803
z=1976.7954R=75485
z=31922.2693R=52609
z=6
1637.8022R=53772
z=4
1166.3300R=67418
z=41465.1915R=61782
z=21362.7739R=66235
z=51039.5523R=73268
z=11837.2082R=55489
z=8
1287.6322R=59804
z=5
1496.7342R=53712
z=8
2125.5108R=49229
z=4
1095.1932R=71210
z=3708.3556R=91164
z=?943.7979R=76929
z=?
200 300 400 500 600 700 800 900 1000 1100 1200 1300 1400 1500 1600 1700 1800 1900 2000 2100 2200m/z
05
101520253035404550556065707580859095
100
Rel
ativ
e A
bund
ance
R 63229z=5
1163.8148R=67305
z=4
1460.9685R=61888
z=41234.6791R=67883
z=11132.2208R=64880
z=6366.1392R=118389
z=1
227.1031R=140795
z=1
1059.6033R=69601
z=2931.2534R=73831
z=51498.9186R=59293
z=5851.4588R=78433
z=3740.4205R=82441
z=3280.1659R=120206
z=1555.3135R=98241
z=1456.2451R=109172
z=1 1657.8372R=54573
z=5
1324.2470R=59037
z=5
1760.8878R=53365
z=7669.0434R=87777
z=3
1560.7824R=46417
z=12
1876.2770R=53228
z=9 2110.8164R=49444
z=?2019.9175R=50055
z=?
300 400 500 600 700 800 900 1000 1100 1200 1300 1400 1500 1600 1700 1800 1900m/z
05
101520253035404550556065707580859095
100
Rel
ativ
e A
bund
ance
z=6357.1764R=123346
z=1
1237.8547R=62254
z=121176.0188R=64872
z=9
1058.5184R=67410
z=10996.4778R=73386
z=6 1163.4464R=66387
z=71350.3870R=57750
z=11943.9542R=76169
z=6589.2645R=92757
z=1488.2168R=103466
z=1804.3552R=81419
z=1 861.4256R=77459
z=51485.3243R=56303
z=10
1423.3610R=60219
z=3
416.2135R=109524
z=1717.3232R=85684
z=? 1657.6358R=54770
z=5630.3452R=93390
z=1329.1816R=125123
z=1546.2191R=95806
z=11531.7690R=57807
z=51715.6677R=57200
z=11779.8795R=52968
z=?
200 300 400 500 600 700 800 900 1000 1100 1200 1300 1400 1500 1600 1700 1800 1900 2000m/z
05
101520253035404550556065707580859095
100
Rel
ativ
e A
bund
ance
654.8088R=93049
z=2562.2153R=95417
z=1 780.6289R=80809
z=4 991.7209R=72442
z=4 1126.5516R=69306
z=4943.7977R=75893
z=3
1023.7354R=72418
z=41321.9569R=59790
z=31224.9176R=66411
z=3821.6454R=78519
z=4
901.2427R=76984
z=5
1364.6411R=58634
z=3448.1725R=107575
z=1 698.3248R=86222
z=2
1499.2345R=53814
z=2374.2027R=119210
z=1
1441.0831R=56542
z=5
470.2141R=106556
z=2 1609.7778R=52835
z=2203.0852R=166002
z=1 1726.8511R=57394
z=?1826.3965R=58552
z=?
50
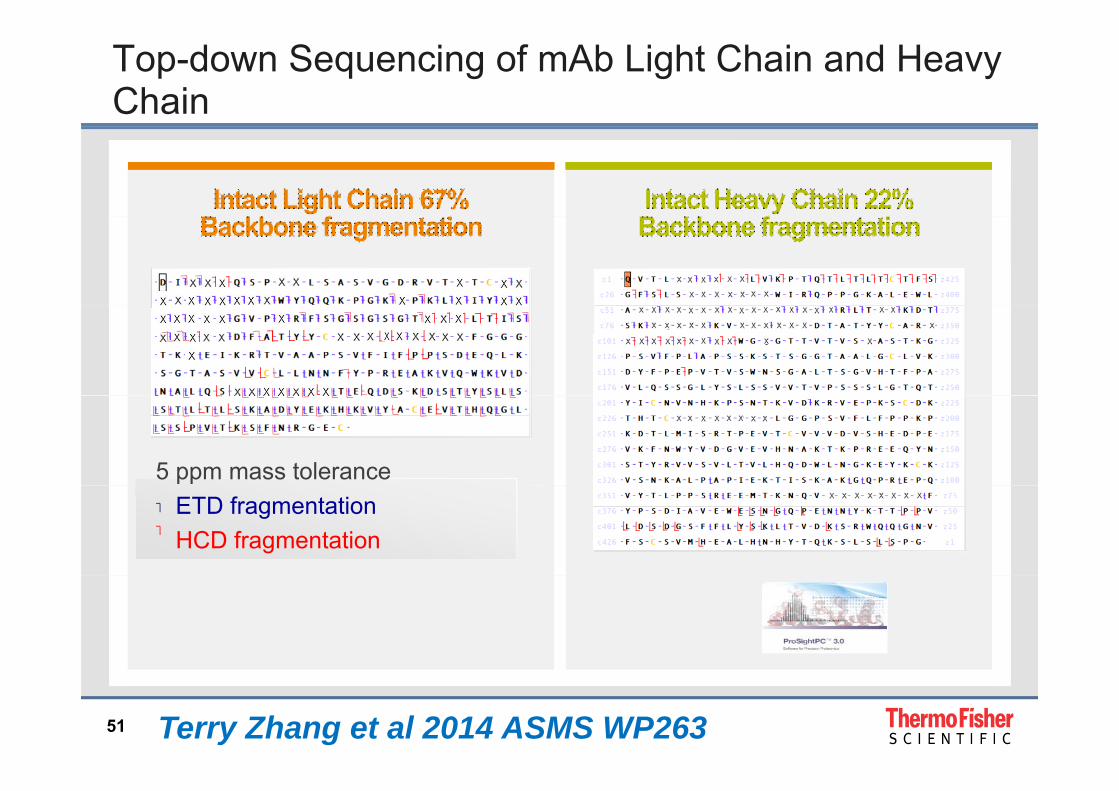
Top-down Sequencing of mAb Light Chain and Heavy Chain
5 ppm mass tolerance ETD fragmentation HCD fragmentation
51 Terry Zhang et al 2014 ASMS WP263
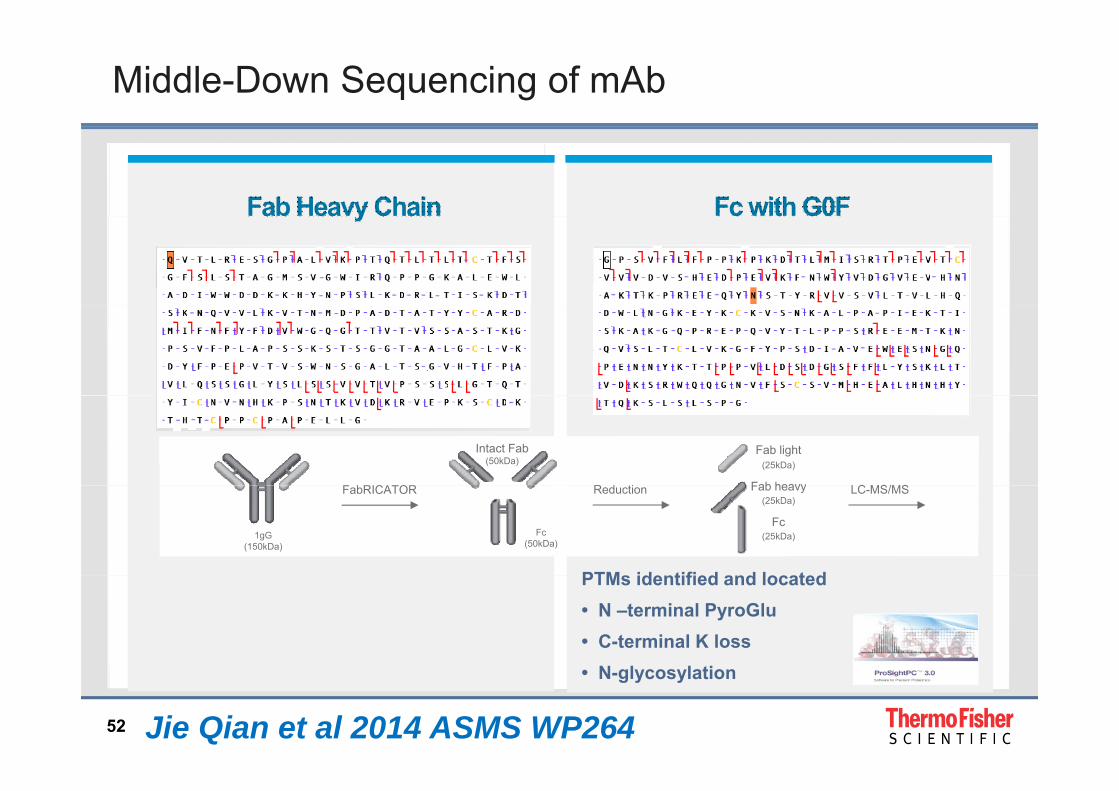
Middle-Down Sequencing of mAb
Intact Fab(50kDa)
F bRICATOR R d ti LC MS/MS
(25kDa)Fab light
Fab heavy
PTM id tifi d d l t d
1gG(150kDa)
Fc(50kDa)
FabRICATOR Reduction LC-MS/MS(25kDa)
Fab heavy
(25kDa)Fc
PTMs identified and located• N –terminal PyroGlu• C-terminal K loss
52
• N-glycosylation
Jie Qian et al 2014 ASMS WP264
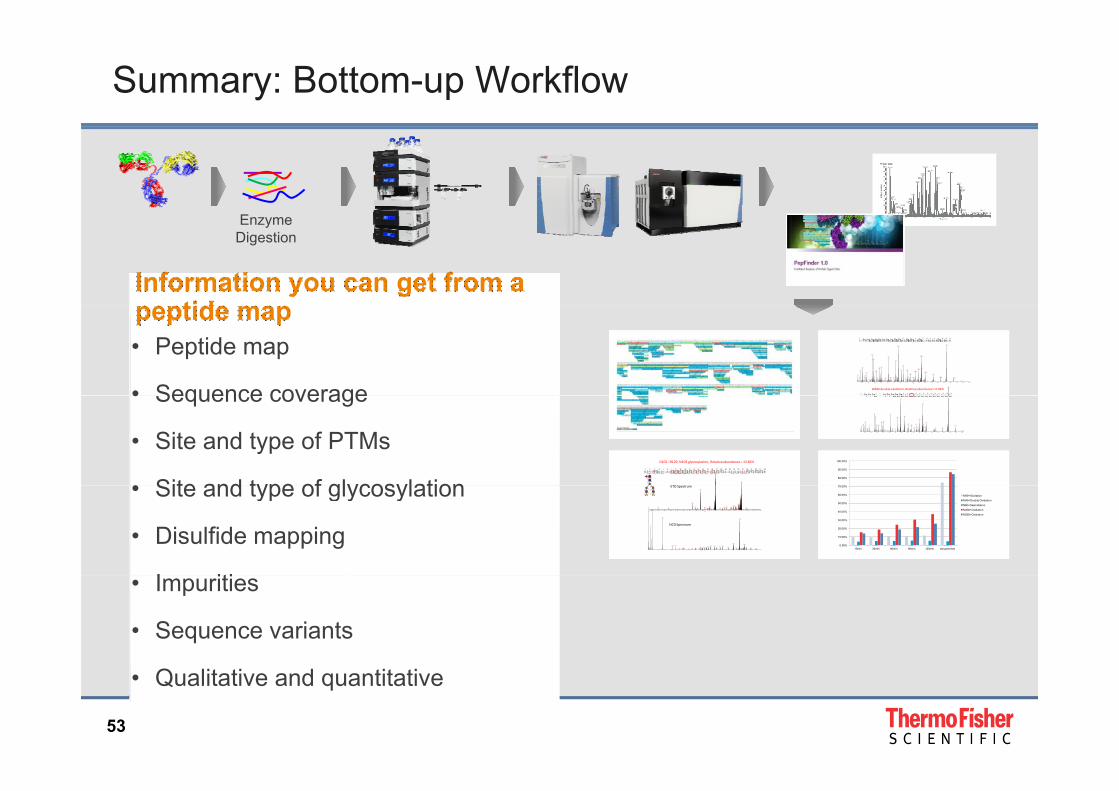
Summary: Bottom-up Workflow
EEnzyme Digestion
• Peptide map
• Sequence coverage 1573.7y13
W406 double oxidation, Relative abundance = 0.09%
200 300 400 500 600 700 800 900 1000 1100 1200 1300 1400 1500 1600 1700 1800 1900m/z
133.0
173.1
b2
204.1y2
242.2
270.1
326.2b6-H2O++
b6++
361.2b3
y3
381.2
424.2y4
b8++
446.2
y8++
474.2b4
b9++
511.3y5
b10++
571.3b5
y10++b11++
622.3
y6
654.3
y11++
707.4
b13++
735.4
b7
771.3y13++
b14++
827.9y14++
854.4b8
913.4y8
b16++
947.5
y16++
967.5b9
1008.5
1042.5y9
y19++
1095.6b10
1139.0y20++
y10
b21++y21++
1208.6b11
1329.6y11
1444.6y12
1541.7y13
1654.8y14
y15
• Sequence coverage
• Site and type of PTMs
• Site and type of glycosylation120 4.5M[4+]
160 6.0M[3+]
ETD S t
G102 –R129, N103 glycosylation, Relative abundance = 13.85%
200 300 400 500 600 700 800 900 1000 1100 1200 1300 1400 1500 1600 1700 1800m/z
145.1
y1
173.1
b2
204.1y2
242.2
270.1
361.2b3
y3
381.2
397.2
424.2y4
474.2b4
b9++
494.3
511.3y5
571.3
622.3
y6
661.2 707.4
735.4
b7 y7
787.3y13++
y14++
854.4b8
895.4
913.4y8
967.5b9
1009.5
1042.5y9
1077.5b10-H2O
1095.6b10
y10
1155.0y20++
1190.6b11-H2O
1208.6b11
1361.6y11 1476.6
y12
1686.7y14
y15
0 00%
80.00%
90.00%
100.00%
• Site and type of glycosylation
• Disulfide mapping
I iti
200 300 400 500 6 00 700 8 00 900 1 000 1100 1 200 1300 14 00 1500 160 0 1700 1800 1900m/z
159.1
z·2
303.2z·3
466.2z·4
z·10++ z·11++ z·12++ z·1 4++
838.9z·15 ++
z'15++88 9.4z·16++
z'1 6++
z·25[3 +]
9 24.5
963.6
1034.0z·18 ++
z'18++z19++z·19++
c·3++c3++z2 0++z·20++z'20++
1113.2
z2 1++z·21 ++
y·21++1266 .5c·7++c7++
c·8++c8++c·9++
13 39.0c9++
c·10++1374.5c10++
c·11++
1439.1c11++
c·24[3 +]c24[3 +]
1484.0
a ·25 [3+]
c·25 [3+]
c2 5[3 +]
c·12++c12++
c·26[3 +]c26[3+]a27 [3+]a·27[3+]
c·27[3+]
c27[3+]
c·13++
c13++
z27[3+]z·27[3+]
z'27[3+]
y·27[3+]
y27[3+]
a28[3+]
a·28[3+]
z2 8[3+]
z·28 [3+]
c14++
1677.8z·15
z'16c16++ c1 7++ c·18++c18++
200 300 400 500 600 700 800 900 1000 1100 1200 1300 1400 1500 1600 1700 1800 1900m/z
138.1
(G)
168.1
186.1
204.1(Gn)
366.1(GGn)
528 .2(GGnM)
579.3y5
y12++ (Bn-1)-GGnMy13++707.4
y6
y14++ y7y15++ y16++906.5y8
y26[3+]978 .0y17++
1009 .81042 .5y18++
y19++Y1-F[3+]
1106.5y20++ 1150.0
y21++
Y2-F[3+]
1214 .6y22++
y12
1300 .6y24++ 1344.1
y25++
1437.2y26++
1522.7
1564.2
1624.2Y1-F++
1697.3Y1++
Y2-F++1806.8M1++
M2++
ETD Spectrum
HCD Spectrum
0.00%
10.00%
20.00%
30.00%
40.00%
50.00%
60.00%
70.00%
15min 30min 60min 90min 120min Unquenched
M49+Oxidation
M49+Double Oxidation
N60+Deamidation
M304+Oxidation
M393+Oxidation
• Impurities
• Sequence variants
53
• Qualitative and quantitative
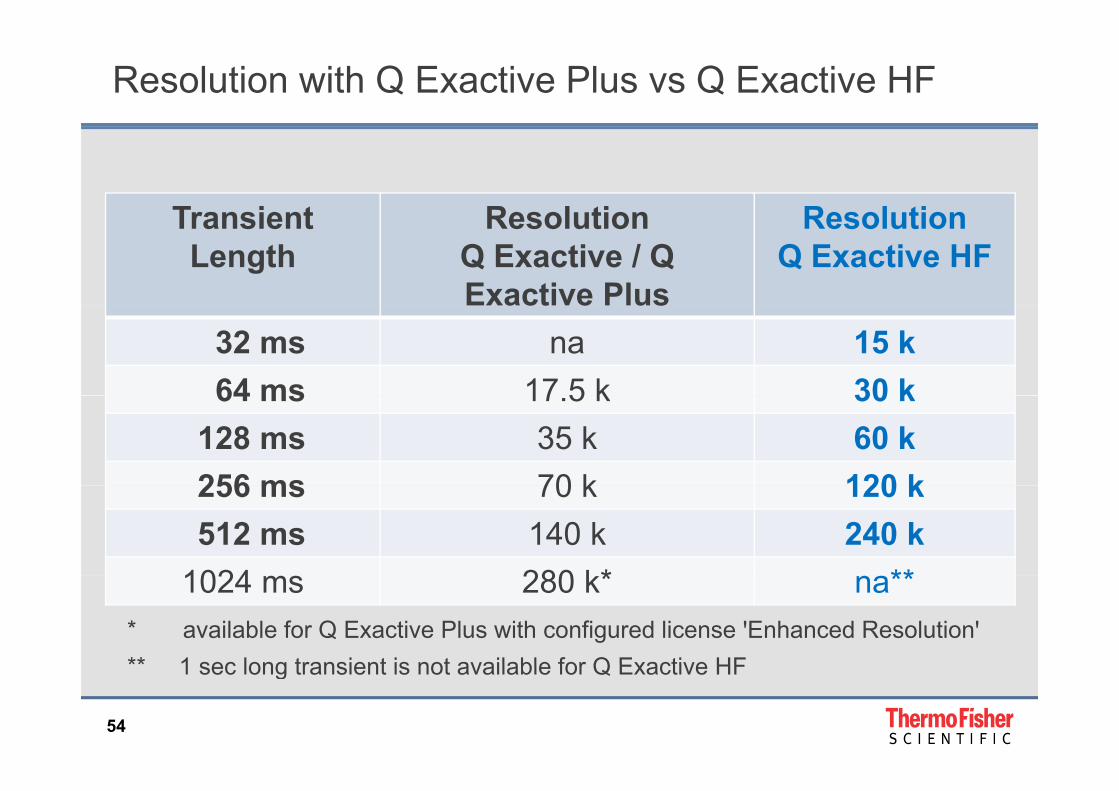
Resolution with Q Exactive Plus vs Q Exactive HF
Transient Resolution ResolutionTransient Length
ResolutionQ Exactive / Q Exactive Plus
ResolutionQ Exactive HF
32 ms na 15 k64 ms 17 5 k 30 k64 ms 17.5 k 30 k
128 ms 35 k 60 k256 ms 70 k 120 k256 ms 70 k 120 k512 ms 140 k 240 k
1024 280 k* **1024 ms 280 k* na*** available for Q Exactive Plus with configured license ꞌEnhanced Resolutionꞌ** 1 sec long transient is not available for Q Exactive HF
54
1 sec long transient is not available for Q Exactive HF
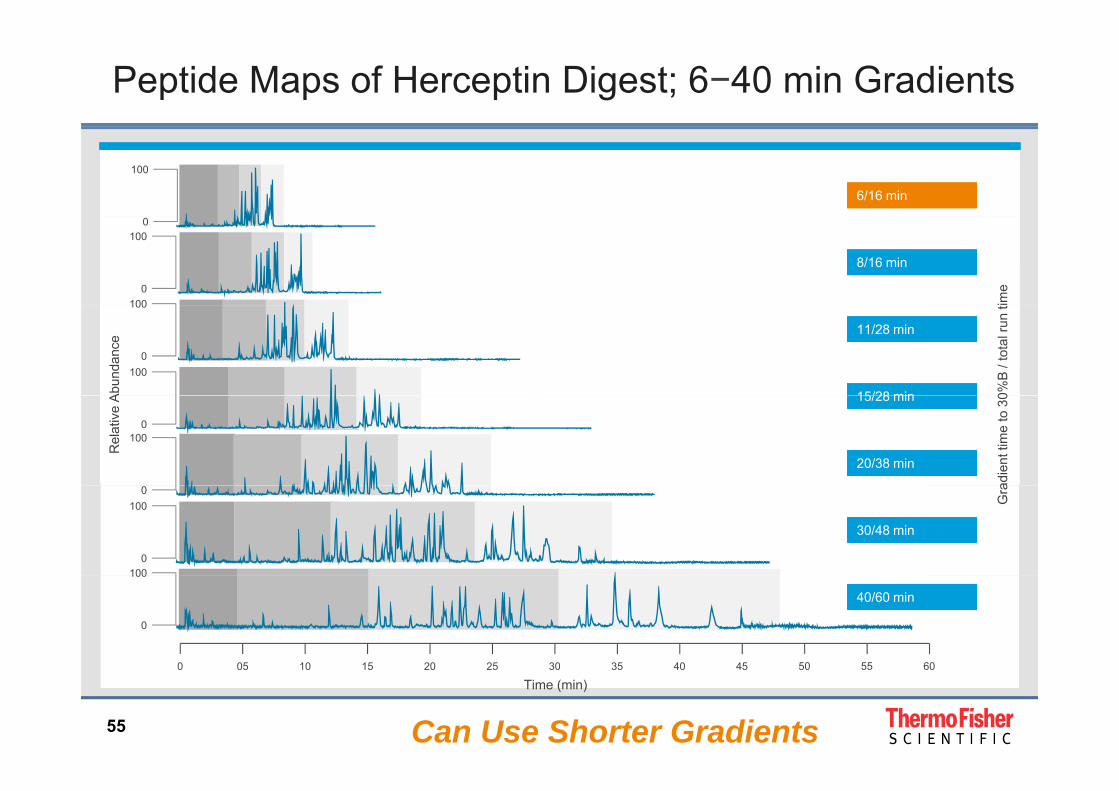
Peptide Maps of Herceptin Digest; 6−40 min Gradients
100
6/16 min6/16 min
time
0100
0100
8/16 min8/16 min
Abun
danc
e
0%B
/ to
tal r
un t100
0100
11/28 min11/28 min
15/28 min15/28 min
Rel
ativ
e A
adie
nt ti
me
to 3
0
0100
15/28 min15/28 min
20/38 min20/38 min
Gra0
100
0100
30/48 min30/48 min
0 05 10 15 20 25 30 35 40 45 50 55 60
100
0
40/60 min40/60 min
55
0 05 10 15 20 25 30 35 40 45 50 55 60
Time (min)
Can Use Shorter Gradients
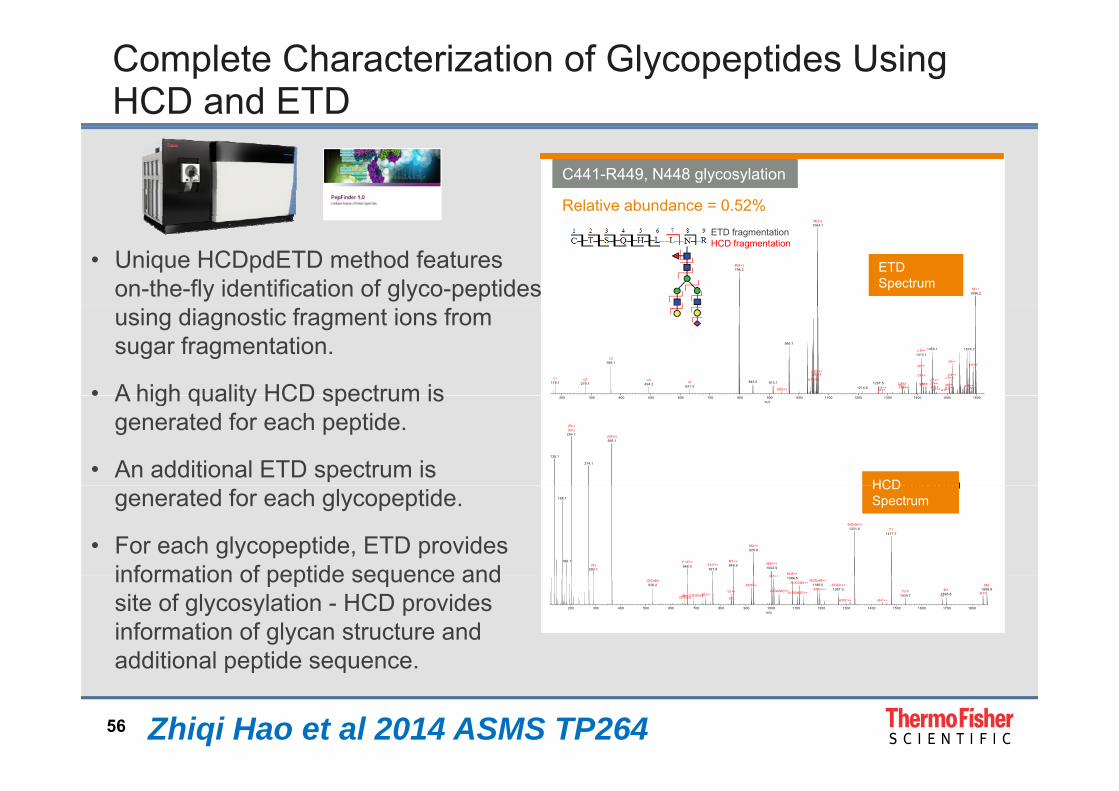
Complete Characterization of Glycopeptides Using HCD and ETD
C441-R449, N448 glycosylationC441-R449, N448 glycosylation
Relative abundance = 0.52%
• Unique HCDpdETD method features on-the-fly identification of glyco-peptides
798.3M[4+]
1064.1M[3+]
1596.2M++
ETD Spectrum ETD SpectrumETD Spectrum
ETD fragmentation HCD fragmentation
using diagnostic fragment ions from sugar fragmentation.
• A high quality HCD spectrum is178.1
c1279.1
c2
366.1c3
494.2c4
631.3c5 845.0 913.1
z6[3+]
966.7
a·9[3+]z9[3+]z·9[3+]
1214.01267.5
z4++z·4++
z5++z·5++z'5++y5++
z6++
1413.1z·6++
z'6++
y·6++y6++
1450.1
z7++z·7++
z'7++y7++ a·8++z8++
z·8++
b·8++
c·8++
c8++
a·9++
1574.7
z9++
z·9++
• A high quality HCD spectrum is generated for each peptide.
• An additional ETD spectrum is
200 300 400 500 600 700 800 900 1000 1100 1200 1300 1400 1500 1600m/z
138.1
204.1(Gn)(Gn)
274.1
366.1(GGn)
HCD SpectrumHCDHCDgenerated for each glycopeptide.
• For each glycopeptide, ETD provides information of peptide sequence and
168.1
186.1
292.1(S) 666.3
Y1-F++
767.9Y2-F++ 848.9
M1++
929.9M2++
1002.9M2F++
M3M3F++
1331.6-GGnM++
1477.7Y1
HCD Spectrum HCD SpectrumHCD Spectrum
information of peptide sequence and site of glycosylation - HCD provides information of glycan structure and additional peptide sequence
200 300 400 500 600 700 800 900 1000 1100 1200 1300 1400 1500 1600 1700 1800m/z
528.2(GGnM)
(SGGn)(Bn-1)-SGGnMY1++b7
Y2++
M1F++
M3++
A1G0M2++
1084.5
A1G0M2F++
A1G1M2++ 1186.0-SGGnM++
A1G1++ 1267.0-SGGn++
A2G1++ -G-F++1534.7
Y2-FY21696.8
M1M1F1858.8
M2
56
additional peptide sequence.
Zhiqi Hao et al 2014 ASMS TP264
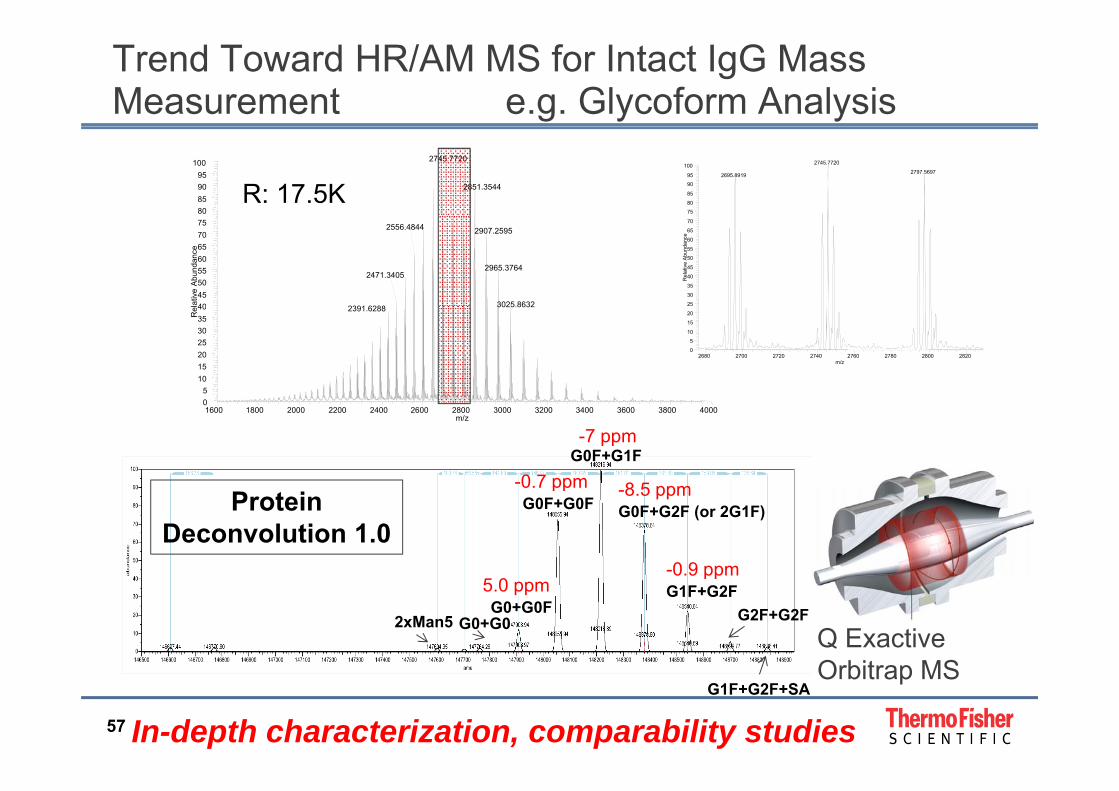
Trend Toward HR/AM MS for Intact IgG Mass Measurement e.g. Glycoform Analysis
80859095
100 2745.7720
2851.3544
75
80
85
90
95
100 2745.7720
2797.56972695.8919
R: 17.5K
4045505560657075
ativ
e A
bund
ance
2907.25952556.4844
2965.37642471.3405
3025 86322391 628825
30
35
40
45
50
55
60
65
70
Rel
ativ
e A
bund
ance
510152025303540
Rel 3025.86322391.6288
2680 2700 2720 2740 2760 2780 2800 2820m/z
0
5
10
15
20
25
1600 1800 2000 2200 2400 2600 2800 3000 3200 3400 3600 3800 4000m/z
0
-7 ppmG0F+G1F
-0 7 ppm 8 5G0F+G0F G0F+G2F (or 2G1F)
0.7 ppm -8.5 ppm
-0.9 ppm
Protein Deconvolution 1.0
G1F+G2FG2F+G2FG0+G0F
G0+G02xMan5
5.0 ppm0.9 ppm
Q ExactiveO bit MS
57
G1F+G2F+SA
In-depth characterization, comparability studies
Orbitrap MS