new hampshire - des.state.nh.us · of greatest concern is the projected increase in storm events...
TRANSCRIPT

NEW HAMPSHIRE NONPOINT SOURCE MANAGEMENT
PROGRAM PLAN 2020-2024

Cover image: Kimpton Brook wetland area, Wilmot, NH. Credit: Sandt Michener

i
R-WD-19-22
NEW HAMPSHIRE NONPOINT SOURCE MANAGEMENT
PROGRAM PLAN – 2020-2024
Prepared by the
Watershed Management Bureau
Watershed Assistance Section
Robert R. Scott, Commissioner
Clark Freise, Assistant Commissioner
Thomas O’Donovan, P.E., Water Division Director
October, 2019
www.des.nh.gov

ii
ACKNOWLEDGEMENTS Thank you to all of our Nonpoint Source Management Program partners for their input and advice for this
update to the New Hampshire Nonpoint Source Management Program Plan.
AGRICULTURE Jennifer Gornnert, Division of Regulatory Services, NH Department of Agriculture, Markets and Food Rob Johnson, II, New Hampshire Farm Bureau Federation Don Keirstead, USDA, Natural Resources Conservation Service Carl Majewski, UNH Cooperative Extension Richard Mellor, NH Association of Conservation Districts
CHLORIDE AND ROAD MAINTENANCE Stephanie Cottrell, UNH Technology Transfer Center Marilee LaFond, UNH Technology Transfer Center Linda Magoon, NHDES Air Resources Division Pat Santoso, Axiomatic
DEVELOPED LAND Sherry Godlewski, NHDES Air Resources Division and New Hampshire Coastal Adaptation Workgroup James Houle, UNH Stormwater Center Abigail Lyon, Piscataqua Region Estuaries Partnership Ridgely Mauck, NHDES Alteration of Terrain Bureau Sylvia von Aulock, Southern New Hampshire Regional Planning Commission
HYDROLOGIC AND HABITAT MODIFICATION Shane Csiki, NHDES NH Geological Survey Kirsten Howard, NHDES Coastal Program and NH Coastal Adaptation Workgroup Kevin Lucey, NHDES Coastal Program William Thomas, NHDES Dam Bureau
LANDSCAPE AND TURF MANAGEMENT Sherry Godlewski, NHDES Air Resource Division and NH Coastal Adaptation Workgroup Kirsten Howard, NHDES Coastal Program and NH Coastal Adaptation Workgroup Cathy Neal, UNH Cooperative Extension Julia Peterson, NH Sea Grant Extension Jamie Roberge, UNH Cooperative Extension David Rousseau, Division of Pesticide Control, NH Department of Agriculture
PARTNERSHIPS Cheryl Bondi, NHDES Aquatic Resource Mitigation Program Jennifer Gornnert, Division of Regulatory Services, NH Department of Agriculture, Markets and Food Erin Holmes, MtBE Remediation Bureau Don Keirstead, USDA, Natural Resources Conservation Service Beth Malcolm, Wastewater Engineering Gail McWilliam Jellie, Division of Agricultural Development, NH Department of Agriculture, Markets and Food Sarah Pillsbury, NHDES Drinking Water and Groundwater Bureau Christian Williams, NHDES Coastal Program Paul Susca, NHDES Drinking Water and Groundwater Bureau

iii
SUBSURFACE SYSTEMS Robert Tardif, NHDES Subsurface Systems Bureau Eric Thomas, NHDES Subsurface Systems Bureau
MINOR NPS POLLUTANT CATEGORIES Kathryn Black, NHDES Planning, Prevention & Assistance Unit Anthony Drouin, NHDES Wastewater Engineering Bureau Carolyn Parry, Marine Patrol Unit, New Hampshire Department of Safety
Special thanks to the United States Environmental Protection Agency (EPA) New England Nonpoint Source
Program staff and the New Hampshire Department of Environmental Services (NHDES) Watershed Management
Bureau staff.
UNITED STATES ENVIRONMENTAL PROTECTION AGENCY Erik Beck Sandra Fancieullo MaryJo Feuerbach
NHDES WATERSHED MANAGEMENT BUREAU Melanie Cofrin Jen Drociak Gregg Comstock Ted Diers Kenneth Edwardson Margaret Foss Stephen Landry Robert Livingston Deborah Loiselle Lisa Loosigian Jeffrey Marcoux Barbara McMillan Dave Neils Kate Politano Tracie Sales Amy Smagula Sally Soule Paul Susca Wendy Waskin Matthew Wood Katherine Zink

iv
CONTENTS Acknowledgements .................................................................................................................................................... ii
Acronyms ................................................................................................................................................................... vi
Introduction ................................................................................................................................................................1
Nonpoint Source Management Program Overview ...................................................................................................2
Who Implements the NPS Management Program? ...............................................................................................2
Description of Program Components – EPA Key Components ..............................................................................3
New Hampshire’s Watershed Management Framework ...........................................................................................4
New Hampshire’s Water Quality Standards ...........................................................................................................4
Water Quality Monitoring ......................................................................................................................................5
Surface Water Quality Assessments .......................................................................................................................6
Total Maximum Daily Load (TMDL) Studies ...........................................................................................................7
Watershed-Based Plans ..........................................................................................................................................8
NPS Management Program Evaluation ......................................................................................................................9
Partnerships ............................................................................................................................................................. 10
Partnerships Goal, Objectives and Milestones ........................................................................................................ 15
Section 319 Program Administration ...................................................................................................................... 17
Program Goal, Objectives and Milestones .............................................................................................................. 18
Priority Watersheds ................................................................................................................................................. 20
Priority Watersheds Goal, Objectives and Milestones ............................................................................................ 28
Priority NPS Pollutant Categories ............................................................................................................................ 32
Minor NPS Pollutant Categories .......................................................................................................................... 32
Marinas and Recreational Boating .................................................................................................................. 32
Residuals Management ................................................................................................................................... 33
Resource Extraction ......................................................................................................................................... 34
Timber Harvesting ........................................................................................................................................... 35
Major NPS Pollutant Categories .......................................................................................................................... 36
Agriculture ....................................................................................................................................................... 36
Agriculture Goal, Objectives and Milestones .................................................................................................. 41
Chlorides and Winter Road Maintenance ....................................................................................................... 44
Chlorides and Winter Road Maintenance Goal, Objectives and Milestones .................................................. 46
Developed Land ............................................................................................................................................... 48
Developed Land Goal, Objectives and Milestones .......................................................................................... 53
Hydrologic and Habitat Modification .............................................................................................................. 60

v
Hydrologic and Habitat Modification Goal, Objectives and Milestones ......................................................... 66
Lawns and Turf Grass Management ................................................................................................................ 70
Lawns and Turf Grass Management Goal, Objectives, and Milestones .......................................................... 74
Subsurface Systems ......................................................................................................................................... 78
Subsurface Systems Goal, Objectives and Milestones .................................................................................... 84
Emerging NPS Issues ................................................................................................................................................ 87
Perfluoroalkyl and Polyfluoroalkyl Substances (PFAS) ........................................................................................ 87
Pharmaceuticals and Personal Care Products ..................................................................................................... 88
Marine Debris, Trash and Microplastics .............................................................................................................. 90
References ............................................................................................................................................................... 91
Appendix A: Priority Areas for Nonpoint Source Management Activities in New Hampshire ................................ 95
Appendix B: River Watersheds Recovery Potential Ranking List .......................................................................... 106
Appendix C: Lake and Impoundment Recovery Potential Ranking List ................................................................. 125
Appendix D: Priority Restoration List for Beaches in New Hampshire .................................................................. 134
Appendix E: Restoration Recovery Potential Maps for New Hampshire Rivers by HUC8 Watershed .................. 148
Appendix F: Restoration Recovery Potential Maps by New Hampshire Regional Planning Commission Service
Areas ...................................................................................................................................................................... 165
Appendix G: Restoration Recovery Potential Maps by New Hampshire Stormwater Coalition ........................... 175
Appendix H: Ranking for Priority Protection Potential Watersheds (HUC 12) ...................................................... 179
Appendix I: Statewide Priority Protection Potential for New Hampshire Watersheds (HUC12) .......................... 189
Table 1: Location of EPA NPS Program Key Components ..........................................................................................3
Table 2: Number of Assessment Units (AUIDs) in each of NHDES' Assessment Categories for the Aquatic Life
Integrity Designated Use ......................................................................................................................................... 20
Table 3: NPS-related indicators ............................................................................................................................... 22
Table 4: Recoverability Metrics ............................................................................................................................... 24
Table 5: Priority Dams and Barrier Sites .................................................................................................................. 26
Table 6: Protection Metrics ..................................................................................................................................... 27
Table 7: Summary of Pollutant Loading Estimates for New Development Projects ............................................... 49
Table 8: Summary of septic system management approaches* ............................................................................. 80
Table 9: Examples of Nitrogen Load Reductions Achievable Through Advanced Treatment* ............................... 81
Figure 1: NHDES Watershed Management Framework .............................................................................................4
Figure 2: WMB Water Monitoring Strategy Conceptual Model .................................................................................6
Figure 3: NPS Nitrogen Delivered to Great Bay Estuary by Source Type (NHDES, 2014a) ...................................... 37

vi
ACRONYMS
ACRONYM DEFINITION ACEC American Council of Engineering Companies ACOE United States Army Corp of Engineers AOP Aquatic Organism Passage AoT Alteration of Terrain ARM Aquatic Resource Mitigation AU Assessment Unit AUID Assessment Unit Identification BMP Best Management Practice CALM Consolidated Assessment and Listing Methodology CWA Clean Water Act CWNS Clean Watershed Needs Survey CWSRF Clean Water State Revolving Fund CZMA Coastal Zone Management Act DBE Disadvantaged Business Enterprise DOT New Hampshire Department of Transportation EMD Environmental Monitoring Database EPA United States Environmental Protection Agency FEH Fluvial Erosion Hazards GBNNPSS Great Bay Nitrogen Nonpoint Source Study GIS Global Information Systems GRTS Grants Tracking and Reporting System GSDI Granite State Designers and Installers HUC Hydrologic Unit Code IPM Integrated Pest Management LAC Local Advisory Committee LCHIP Land and Community Heritage Investment Program LID Low Impact Development LLMP Lakes Lay Monitoring Program MBE Minority Owned Business MCL Maximum Contaminant Level MOA Memorandum of Agreement MS4 Municipal Separate Storm Sewer System MTRS Measures Tracking and Reporting System NEIWPCC New England Interstate Water Pollution Control Commission NHACD New Hampshire Association of Conservation Districts NHBOA New Hampshire Building Officials Association NHD National Hydrography Dataset NHDAMF New Hampshire Department of Agriculture, Markets and Food NHDES New Hampshire Department of Environmental Services NHDES P2 NHDES Pollution Prevention Program NHGS New Hampshire Geological Survey NHHOA New Hampshire Health Official Association NHMA New Hampshire Municipal Association NOAA National Oceanic and Atmospheric Administration NPDES National Pollutant Discharge Elimination System NPS Nonpoint Source

vii
NRCS Natural Resource Conservation Service NROC Natural Resource Outreach Coalition NWQI National Water Quality Initiative OCRM Ocean and Coastal Resource Management PDA Pease Development Authority PPA Performance Partnership Agreement PPG Performance Partnership Grant PPST Protection Potential Screening Tool PREP Piscataqua Region Estuaries Partnership QAPP Quality Assurance Project Plan REPP Regional Environmental Planning Program RFP Request for Proposal RMPP Rivers Management and Protection Program RPC Regional Planning Commission RPST Recovery Potential Screening Tool RSA Revised Statutes Annotated (i.e., New Hampshire State Laws) SADB Supplemental Assessment Database SNHRPC Southern New Hampshire Regional Planning Commission SOAKNH Soak Up the Rain New Hampshire Program SRF State Revolving Fund SSPP Site Specific Project Plan SWA Southeast Watershed Alliance SWQPA Shoreland Water Quality Protection Act TMDL Total Maximum Daily Load TSP Technical Service Provider UNH University of New Hampshire UNH CE UNH Cooperative Extension UNH T2 UNH Technology Transfer program UNHSC UNH Stormwater Center USDA United States Department of Agriculture USFS United States Forest Service VLAP Volunteer Lake Assessment Program VRAP Volunteer River Assessment Program WAS Watershed Assistance Section WMB Watershed Management Bureau WMNF White Mountain National Forest WQS Water Quality Standards

1
INTRODUCTION New Hampshire’s Nonpoint Source (NPS) Management Program was developed in response to the Federal
Water Pollution Control Act, commonly called the Clean Water Act (CWA), Section 319 provisions to address
water quality problems caused by pollution from NPSs. Unlike point source pollution, which comes from pipes or
other easily identifiable sources, NPS pollution comes from many different sources that are spread across the
landscape and are often difficult to identify and quantify.
NPS pollution contributes to approximately 90% of the water pollution problems in New Hampshire (NHDES,
2018). Statewide management of NPS problems relies on a mix of regulatory and voluntary programs that focus
on protecting clean water where it currently exists, and restoring it where development and other
environmental stressors have made the water unsuitable for fishing, swimming or other designated uses. Major
sources of NPS pollution in New Hampshire include developed lands, septic systems, landscape and turf grass
management activities, chloride and winter road maintenance activities, hydrologic and habitat modification,
and agriculture. The problems caused by these sources are compounded by the changing climatic conditions
that the state is currently facing.
New Hampshire has been getting warmer and wetter over the last century, and the rate of change has increased
over the last four decades. Annual precipitation has already increased 5-20% and is projected to increase an
additional 12-20% by the end of the century. Larger temperature and precipitation increases are expected for
winter and spring, raising the concerns of rapid snowmelt, high peak stream flows and flood risk. Extreme
precipitation events have also increased, the impact of which is evident in the several large floods that have
occurred across New Hampshire over the last several decades. These extreme events are expected to occur
more frequently. Of greatest concern is the projected increase in storm events that drop more than four inches
of precipitation in 48 hours (Wake, et al., 2014). Local and state stormwater-related infrastructure planning
needs to address potential impacts from these events including: stream crossings, erosion control, and
stormwater treatment and storage. In addition to increases in precipitation, as sea levels rise, groundwater
levels rise too. Groundwater rise has the potential to increase NPS pollution from septic systems, landfills,
basements and failing stormwater infrastructure or best management practices (BMPs). Existing stormwater
infrastructure and BMPs are not designed to accommodate these increases in precipitation and inundation from
groundwater, or the associated increase in runoff and pollution. Adaptation strategies to build community
resiliency and reduce the impacts of these changes are essential to achieving continued success of the NPS
Program in New Hampshire.
While there is more work to be done to address impacts of NPS pollution, successful programs in New
Hampshire continue to reduce pollution to New Hampshire’s surface waters. For example, since 2000,
restoration activities funded under the Watershed Assistance Grants Program with federal Section 319 funds
have led to eight EPA NPS Success Stories of documented water quality improvements and removal of
designated use impairments. Additional New Hampshire Section 319-funded projects have resulted in 10 more
waterbodies removed from the 2018 Draft Impaired Waters (303(d)) List and are eligible for EPA NPS Success
Stories. It is essential that resources and funding for NPS programs continue in order to maintain and achieve
additional success in protecting and restoring water quality in New Hampshire. The work of our partner
organizations and individuals is important to achieving NPS Program goals.

2
The NPS Program, described in this Plan, updates the 2014 NPS Management Plan goals, objectives and
measurable milestones to reduce the water quality impacts of major NPS Pollutant Categories, and sets a
schedule for planning and implementation over the next five years.
NONPOINT SOURCE MANAGEMENT PROGRAM OVERVIEW The mission of the New Hampshire Department of Environmental Services (NHDES) is to help sustain a high
quality of life for all citizens by protecting and restoring the environment and public health in New Hampshire.
New Hampshire’s Nonpoint Source (NPS) Management Program contributes to that mission by protecting and
restoring clean water in the state’s rivers, lakes, estuaries and other waters from the negative impacts of
nonpoint source pollution. Specifically, the NPS Management Program works toward improving land
management practices, such that water quality in impaired watersheds is restored and water quality in healthy
watersheds is not degraded.
The goals of this updated New Hampshire NPS Management Program Plan (Plan) are to:
Inform visitors, residents and NPS Management Program partners about the causes and impacts of NPS
pollution in New Hampshire.
Set priorities for addressing NPS pollution sources in New Hampshire.
Identify long-term goals for protecting and restoring waters and watersheds from NPS pollution.
Establish specific, short-term objectives and measurable milestones to be accomplished over the next
five years to work toward attaining long-term NPS program goals.
This current Plan serves as a non-regulatory road map to address NPS pollution problems and to guide
communication, outreach, collaboration, and NPS planning and implementation projects over the next five
years. The Plan documents progress that has been made to address priority NPS pollutant categories since the
2014 program plan update. A key component developed in the 2014 program plan update to address priority
NPS pollutant categories was the NHDES Recovery Potential Screening Tool (RPST) and the Protection Potential
Screening Tool (PPST). The RPST and PPST identify watersheds in the state with the greatest likelihood of water
quality restoration or protection project success, respectively. NHDES Water Quality Section Personnel updated
the RPST and PPST queries of the NHDES Supplemental Assessment Database (SADB) for all current 2018
assessment units (AUs) per the New Hampshire 2018 Section 305(b) and 303(d) Consolidated Assessment and
Listing Methodology (CALM) for this current Plan. This methodology, NPS pollutant parameters, and priority
watershed listings can be found in the Appendices. In addition, each section of this current Plan has been
updated to reflect past progress, current status and projected efforts relative to the NPS management efforts
associated with major NPS pollutant categories. Changes in programs, projects, personnel and regulations are
also reflected in these sections. Most importantly, the Plan identifies goals, objectives, milestones and measures
of success with a five-year schedule for completion.
WHO IMPLEMENTS THE NPS MANAGEMENT PROGRAM? The NPS Program is formally managed by the Watershed Assistance Section (WAS) in the Watershed
Management Bureau (WMB), in the Water Division at the NHDES; however, NHDES is just one of many
stakeholders working to keep the state’s waters clean. Individual homeowners, businesses, municipalities, non-
governmental organizations, universities and state and federal agencies all have a role to play in protecting and
restoring this valuable resource.

3
DESCRIPTION OF PROGRAM COMPONENTS – EPA KEY COMPONENTS
The 2013 EPA guidance (USEPA, 2013b) characterizes the essential Key Components of an Effective State
Nonpoint Source Management Program.
TABLE 1: LOCATION OF EPA NPS PROGRAM KEY COMPONENTS
1
The state program contains explicit short- and long-term goals, objectives and strategies to restore and
protect surface water and ground water, as appropriate.
PAGE 2-90: New Hampshire’s NPS Management Program
2
The state strengthens its working partnerships and linkages to appropriate state, interstate, tribal,
regional and local entities (including conservation districts), private sector groups, citizens’ groups and
federal agencies.
PAGE 4-5: New Hampshire’s Watershed Management Framework, PAGE 10-17: Partnerships and Public
Participation, PAGE 20-31: Priority Watersheds, PAGE 32-90: Priority NPS Pollutant Categories
3
The state uses a combination of statewide programs and on-the-ground projects to achieve water
quality benefits; efforts are well-integrated with other relevant state and federal programs.
PAGE 2-90: New Hampshire’s NPS Management Program
4
The state program describes how resources will be allocated between abating known water quality
impairments from NPS pollution and protecting threatened and high-quality waters from present and
future NPS impacts.
PAGE 20-31: Priority Watersheds
5
The state program identifies waters and watersheds impaired by NPS pollution as well as priority
unimpaired waters for protection. The state establishes a process to assign priority and progressively
address identified watersheds by conducting more detailed watershed assessments, developing and
implementing watershed-based plans.
PAGE 21-32: Priority Watersheds
6
The state implements all program components required by section 319(b) of the Clean Water Act, and
establishes strategic approaches and adaptive management to achieve and maintain water quality
standards as quickly as practicable. The state reviews and upgrades program components as
appropriate. The state program includes a mix of regulatory, non-regulatory, financial and technical
assistance, as needed.
PAGE 2-90: New Hampshire’s NPS Management Program
7
The state manages and implements its NPS program efficiently and effectively, including financial
management.
PAGE 9-10: NPS Management Program Evaluation, PAGE 17-20: Section 319 Program Administration
8
The state reviews and evaluates its NPS management program using environmental and functional
measures of success, and revises its NPS management program at least every five years.
PAGE 9-10: NPS Management Program Evaluation

4
NEW HAMPSHIRE’S WATERSHED MANAGEMENT
FRAMEWORK FIGURE 1: NHDES WATERSHED MANAGEMENT FRAMEWORK
The WMB uses an integrated approach to achieve clean water goals. Both regulatory and non-regulatory
programs work together within the WMB to integrate science, policy, planning and education to address point
and NPS pollution, stormwater and exotic species. There are 22 programs and activities within the WMB that
form the basis for watershed management in New Hampshire.
The NPS Management Program utilizes the data and assessments from WMB programs that make up the
Watershed Management Framework (Figure 1) to prioritize the development and implementation of watershed
plans, coordinate on Total Maximum Daily Load (TMDL) implementation, and develop and provide additional
NPS resources and assistance to internal and external stakeholders and partners.
NEW HAMPSHIRE’S WATER QUALITY
STANDARDS Water quality standards are used to protect the state's
surface waters. Water quality standards consist of three
parts:
1. Designated Uses, such as fish consumption, swimming
or other recreational uses, or aquatic life integrity.
2. Numerical or Narrative Criteria to protect the
designated uses.
3. An Antidegradation Policy, which maintains existing
high quality water that exceeds the criteria.
Criteria are established by statute (RSA 485-A:8) and
Administrative Rules (Env-Wq 1700). Surface waters are
routinely sampled and assessed on a biennial basis for
compliance relative to water quality standards as part of the
Surface Water Quality Assessments 305(b) and 303(d)
Program.
The Water Quality Standards Advisory Committee (WQSAC)
was established in the fall of 2000 to advise NHDES in
drafting revised water quality regulations. The purpose of
the committee is to facilitate public input, solicit advice and
provide a forum for the discussion of focused issues.
Membership in WQSAC is open to any stakeholder and all
WQSAC meetings are open to public.
Water Quality Standards
Desginated Uses
Water Quality Criteria
Antidegradation
Monitoring
Trend
Probabalistic
Synoptic
Water Quality Assessment 305(b)/303(d)
Develop Plan to Protect or Restore
Total Maximum Daily Load
Watershed Plans
Implementation Plans
Best Managmement Practices
Ordinances
Conservation
Other

5
WATER QUALITY MONITORING The WMB is responsible for many active water quality monitoring programs, including volunteer-based efforts
like the Volunteer Lake Assessment Program (VLAP) and the Volunteer River Assessment Program (VRAP). In
2017, over 100,000 data records were collected from the state’s surface waters through WMB programs.
Volunteer monitoring programs like VLAP and VRAP are operated through the WMB under the guidance and
requirements of Programmatic Quality Assurance Project Plans (QAPPs). The data is stored in the NHDES
Environmental Monitoring Database (EMD) for use by the NHDES Water Quality Section to assess surface waters
for the 305(b) and 303(d) Assessments. Relative to this Plan, the data collected by volunteer monitoring
programs are an integral component for identifying NPS pollutant sources and for the development of the RPST
and PPST. In addition to the data collected through WMB programs, the WMB utilizes data from other
organizations and NHDES programs not administered through the WMB.
The WMB Water Monitoring Strategy covers a 10-year time frame (2014-2024) and is designed to fulfill the dual
purpose of satisfying the requirements of the 2003 EPA guidance document, Elements of a State Water
Monitoring and Assessment Program (EPA-841-B-03-003), and serving as a "manual" to NHDES in implementing
surface water monitoring programs. The latter was recognized by NHDES staff as an important need in order to
maximize program efficiency and accountability.
The primary outcome of the strategy is high quality data that can be used to meet a variety of surface water
management objectives. To this end, the revised strategy is organized around a basic conceptual model (Figure
2). The strategy is based on the goal of the collection and usage of water quality data for water management
decisions and communication of waterbody conditions to the public.
The model relies on three primary monitoring program design components (for example: probabilistic, trend
and synoptic). Probabilistic water quality surveys allow NHDES to report on the overall status of surface water
quality through intensive sampling of a subset of randomly chosen sample locations within each lake, pond,
stream or river. Trend-based monitoring tracks the trajectory of important water quality indicators over time
through repetitive sampling at fixed monitoring stations. Synoptic monitoring maintains a statewide repository
of data from lakes, ponds, streams and rivers using a standardized rotational watershed approach to maintain
current records of water quality conditions where information is needed for assessment purposes or from
waters that would otherwise not be sampled. Trend and synoptic monitoring of estuarine and ocean water is
addressed through cooperation with state partners (for instance, The Piscataqua Region Estuaries Partnership,
the University of New Hampshire). Collectively, the strategy makes efficient use of limited monitoring resources
to sample New Hampshire's surface waters, analyze data and provide timely reporting.

6
FIGURE 2: WMB WATER MONITORING STRATEGY CONCEPTUAL MODEL
SURFACE WATER QUALITY ASSESSMENTS New Hampshire’s rigorous surface water quality assessment process identifies whether or not surface waters in
the state support their designated uses. With few waters being fully assessed for all designated uses, and in the
absence of a documented impairment, it is assumed that water quality standards are achieved in other surface
waters, making them eligible for protection activities that may include applying for NHDES Source Water
Protection Grants or NPS Program Watershed Assistance Grants to develop watershed-based plans. Surface
water quality assessments operate on a lowest common denominator hierarchal framework. Therefore, a
waterbody may be listed as impaired based upon a single parameter (for instance, dissolved oxygen) that fails to
meet state water quality standards despite any number of other parameters (for instance, pH, bacteria or
chlorophyll-a) that are fully attaining water quality standards.
The CWA requires each state to submit two surface water quality documents to EPA every two years.
1. Section 305(b) of the CWA requires submittal of a report (commonly called the "305(b) Report"), that
describes the quality of a state’s surface waters and an analysis of the extent to which waters provide
for the protection and propagation of a balanced population of shellfish, fish and wildlife, and support
recreational activities in and on the water.
2. Section 303(d) of the CWA requires the submittal of a report (commonly called the “303(d) List”), that
includes surface waters that are:
a) Impaired or threatened by a pollutant or pollutant(s).
b) Not expected to meet water quality standards within a reasonable time, even after application of
best available technology standards for point sources, or BMPs for nonpoint sources.
c) Require development and implementation of a comprehensive water quality TMDL study, which is
designed to meet water quality standards.
The NHDES Surface Water Quality Assessment Program produces an Integrated Surface Water Quality Report
(Integrated Report) every two years, containing the 305(b) Report and the 303(d) List. The Integrated Report
contains five categories of waters. While all categories are included in the Integrated Report, categories 4 and 5

7
represent all impaired waters, with category 5 representing the “303(d) Listed” waters that require a TMDL.
Categories include:
Category 1: Attaining all designated uses and no use is threatened.
Category 2: Attaining some of the designated uses; no use is threatened; and insufficient or no data
and information are available to determine if the remaining uses are attained or
threatened (i.e., more data are needed to assess some of the uses).
Category 3: Insufficient or no data and information are available to determine if any designated use
is attained, impaired or threatened (i.e., more monitoring is needed to assess any use).
Category 4: Impaired or threatened for one or more designated uses but does not require
development of a TMDL because;
4a: A TMDL has been completed, or
4b: Other pollution control requirements are reasonably expected to result in
attainment of the water quality standard in the near future, or
4c: The impairment is not caused by a pollutant.
Category 5: Impaired or threatened for one or more designated uses by a pollutant(s), and requires
a TMDL (this is the 303(d) List).
CALM describes, in detail, the process used to make surface water quality attainment decisions for 305(b)
reporting and 303(d) listing purposes from available data. The term "listing" refers to the process of placing a
waterbody on the Section 303(d) List of impaired waters. CALM also includes descriptions and definitions of the
many terms used in the presentation of assessment results; consequently, reviewing CALM prior to reviewing
the assessments helps with the understanding and interpretation of assessment results.
It is important to understand that assessment methodologies are dynamic and change as new information and
assessment techniques become available. This is why CALM is updated every two years. Such changes can also
impact monitoring strategies designed to determine if waterbodies are attaining water quality standards.
Periodic updates of the methodology should result in more accurate and reliable assessments and, therefore,
better management of water resources in the future.
TOTAL MAXIMUM DAILY LOAD (TMDL) STUDIES Under the federal CWA, NHDES must develop TMDL studies for waterbodies impaired by a pollutant. A TMDL
refers to a detailed plan that identifies the pollutant reductions needed to meet New Hampshire's water quality
standards for a particular waterbody and develops a restoration strategy to implement those reductions. The
general process by which TMDLs are developed includes identifying the problem pollutant, establishing the
water quality goals or target values needed to achieve water quality standards, identifying the specific sources
contributing the pollutant of concern, and assigning a specific load allocation to each of the sources. Follow-up
monitoring is needed to ensure that the TMDL results in the attainment of the water quality standards.

8
WATERSHED-BASED PLANS Watershed-based management or restoration plans are tools for managing existing and future watershed
conditions, including land use planning and confirmed and/or potential NPS impacts on water quality. Plans
identify existing pollution contributions and sources, establish water quality goals, estimate the reductions or
limits of pollutants needed to meet water quality goals, and identify the actions needed, regulatory or non-
regulatory, to achieve pollutant reductions sufficient to maintain or restore existing designated uses.
Watershed-based management and restoration plans prioritize recommended actions based on cost/benefit
analyses and set an implementation time line. They also describe potential sources of funding that may be
available to carry out components of the plan, identify responsible partners relative to carrying out
implementation actions and maintenance of BMPs, measures to document success of implementation actions,
etc., according to the nine ((a) through (i)), mandatory elements for watershed-based planning required by EPA
and NHDES. Although many different components may be included in a watershed-based plan, EPA has
identified a minimum of nine elements that are critical for achieving improvements in water quality. EPA
requires that these nine elements be addressed for watershed plans funded using Section 319 funds and
strongly recommends that they be included in all other watershed-based plans that are intended to remediate
water quality impairments.
(a) An identification of the causes and sources or groups of similar sources that will need to be
controlled to achieve the load reductions estimated in this watershed-based plan (and to achieve any
other watershed goals identified in the watershed-based plan), as discussed in item (b) immediately
below. Sources that need to be controlled should be identified at the significant subcategory level with
estimates of the extent to which they are present in the watershed (e.g., numbers of dairy cattle
feedlots needing upgrading, including a rough estimate of the number of cattle per facility; acres of row
crops needing improved nutrient management or sediment control; or linear miles of eroded
streambank needing remediation).
(b) An estimate of the load reductions expected for the management measures described under
paragraph (c) below (recognizing the natural variability and the difficulty in precisely predicting the
performance of management measures over time). Estimates should be provided at the same level as in
item (a) above (e.g., the total load reduction expected for dairy cattle feedlots; row crops; or eroded
streambanks).
(c) A description of the NPS management measures that will need to be implemented to achieve the
load reductions estimated under paragraph (b) above (as well as to achieve other watershed goals
identified in this watershed-based plan), and an identification (using a map or a description) of the
critical areas in which those measures will be needed to implement this plan.
(d) An estimate of the amounts of technical and financial assistance needed, associated costs, and/or
the sources and authorities that will be relied upon, to implement this plan. As sources of funding, states
should consider the use of their Section 319 programs, State Revolving Funds, USDA's Environmental
Quality Incentives Program and Conservation Reserve Program, and other relevant federal, state, local
and private funds that may be available to assist in implementing this plan.
(e) An information/education component that will be used to enhance public understanding of the
project and encourage their early and continued participation in selecting, designing and implementing
the NPS management measures that will be implemented.

9
(f) A schedule for implementing the NPS management measures identified in this Plan that is reasonably
expeditious.
(g) A description of interim, measurable milestones for determining whether NPS management
measures or other control actions are being implemented.
(h) A set of criteria that can be used to determine whether loading reductions are being achieved over
time and substantial progress is being made towards attaining water quality standards and, if not, the
criteria for determining whether this watershed-based plan needs to be revised or, if a NPS TMDL has
been established, whether the NPS TMDL needs to be revised.
(i) A monitoring component to evaluate the effectiveness of the implementation efforts over time,
measured against the criteria established under item (h) immediately above.
New Hampshire’s NPS Management Program website provides links to completed watershed-based plans and
guidance for the development of watershed-based plans to promote the development and implementation of
plans designed to address EPA’s key elements for watershed management planning and implementation. More
information on how the New Hampshire NPS Program prioritizes development and implementation of
watershed-based plans is described in the Priority Watersheds section of this Plan.
NPS MANAGEMENT PROGRAM EVALUATION The NPS Management Program staff review and, as appropriate, work with partners to revise and update the
Plan every five years to ensure that Section 319 funding, technical support and other resources are directed in
an effective and efficient manner to support state efforts to address water quality issues on a priority
watershed-scale basis. This allows for periodic revision to update program goals, objectives, milestones and
measures as existing activities are completed and new activities develop.
Section 319 provisions require that the states report on progress in meeting annual milestones to demonstrate
NPS Management Program success and track satisfactory performance and progress. The following evaluation
measures are used to determine NPS Management Program success.
Tracking of completed measurable milestones and other NPS activities in the NHDES Measures Tracking
and Reporting System (MTRS).
Annual reporting of completed goals, objectives, and measurable milestones in the NPS Management
Program Annual Report. Annual reports are available on the Watershed Assistance Section’s publication
web page.
Annual financial and performance reports are completed for each Section 319 grant, as required under
the grant’s terms and conditions.
In addition, each Section 319 Watershed Assistance Grant implementation project is required to follow an EPA
approved, “(a) through (i)” watershed-based plan. Implementation projects are required to report pollutant load
reductions achieved and to track these reductions against the total reduction goal in the watershed-based plan.
Most projects also measure water quality improvement through long-term monitoring, typically through the
NHDES VLAP, VRAP or UNH Lakes Lay Monitoring Program (LLMP). These data are tracked and reported in the
following ways:

10
Annual reporting of pollutant load reduction estimates as a result of Watershed Assistance Grant
implementation projects in the Grants Reporting and Tracking System (GRTS). GRTS is the primary tool for
management and oversight of the Nonpoint Source Pollution Control Program by EPA. Additional information
about GRTS is available on the EPA website.
Post-implementation water quality monitoring of restoration project sites is conducted in accordance with the
NHDES CALM to determine whether or not an impaired waterbody AU has been restored and can be removed
from the State’s 303(d) list of impaired waters. New Hampshire’s Surface Water Quality Assessment reporting,
including the 303(d) list is updated and reported to EPA every two years.
PARTNERSHIPS New Hampshire’s NPS Program partners with many organizations using a variety of formal and informal
mechanisms. These partners are identified, by milestone, in the Goals, Objectives and Milestones section of
each NPS category of this Plan.
NHDES seeks involvement and solicits comment on significant proposed program changes from NPS program
partners and stakeholders through a variety of ways, depending upon the change and the specific audiences
involved. When soliciting input for programmatic changes, NHDES may form expert advisory groups, host
informal meetings, attend stakeholder meetings and solicit input via email social media. When announcing
programmatic changes, NHDES may use social media, the NHDES Environmental Newsletter, press releases,
stakeholder email, NH Municipal EcoLink or other outreach venues to inform stakeholders.
Additional funding from partners may also be available to supplement or leverage Section 319 or 604(b) funds.
These funds are subject to congressional approval or other authority, and may vary in amount from year to year.
These include:
CLEAN WATER STATE REVOLVING FUND LOAN PROGRAM
The 1987 amendments to the Clean Water Act created the Clean Water State Revolving Fund (CWSRF) Loan
Program, which provides below-market interest rates on loans to assist communities with the planning, design
and construction of eligible water pollution control infrastructure projects. EPA capitalizes the CWSRF with
annual grants which are used to provide loans to eligible entities. Borrowers are typically municipal or other
local government entities. CWSRF funding is also available for water pollution control, watershed protection and
restoration, and estuary management projects that contribute to the protection of public health and water
quality. Projects that address stormwater or NPS pollution problems are also encouraged. Each year, New
Hampshire sets aside a portion of the CWSRF for “green infrastructure” projects. In addition, the NHDES CWSRF
currently offers additional subsidy for projects funded from the Project Priority List in the form of principal
forgiveness. NHDES presents the CWSRF Intended Use Plan for the upcoming year’s appropriation on an annual
basis. Special CWSRF Loan Program initiatives for 2019 include 100% principal forgiveness, up to $75,000, for
select wastewater and stormwater planning evaluations, including the development of (a) through (i)
watershed-based plans. It also provides up to $30,000 per phase in principal forgiveness on loans for the
development of a wastewater asset management program, and a maximum of $30,000 in principal forgiveness
on loans for the development of a stormwater asset management program.

11
NEW HAMPSHIRE DEPARTMENT OF AGRICULTURE, MARKETS AND FOOD
Agricultural Development Mini-Grants, administered through the New Hampshire Department of Agriculture,
Markets and Food (NHDAMF), have been established to provide grants for promotional efforts designed to
increase the demand for New Hampshire agricultural products in existing markets, as well as to identify new
markets and build product demand. Applicants my request up to $1,000 in a fiscal year through a competitive
process.
Agricultural Nutrient Management Grant Program – Agricultural nutrient management grants assist agricultural
land and livestock owners with efforts to minimize adverse effects to waters of the state by better managing
agricultural nutrients including commercial fertilizers, animal manures and agricultural composts. Priority is
given to projects that most clearly address protection of surface water and public drinking water sources.
Applicants may apply for cost assistance of up to $5,000, with no match required. The majority of funding is
used for on-farm projects that address or prevent water pollution through the implementation of structural and
non-structural BMPs. This grant program is administered through the NHDAMF Division of Regulatory Services.
EPA WATER QUALITY PLANNING GRANTS
Water Quality Planning Grants are available to New Hampshire Regional Planning Commissions and the
Connecticut River Joint Commissions for water quality planning purposes. Funding priority is given to projects
developing (a) through (i) watershed-based plans. Preference is also given to projects that address water quality
concerns in high-priority impaired or high-quality waters, as identified in the Plan. Between $40,000 to $75,000
is made available each year through a competitive application process managed by the NHDES NPS Program.
Funds are made available to NHDES through EPA, pursuant to section 604(b) of the CWA.
NEW HAMPSHIRE DRINKING WATER AND GROUNDWATER TRUST FUND GRANTS
In 2003, the State of New Hampshire brought suit against the manufacturers of the gasoline additive methyl
tertiary butyl ether (MtBE) because of its impact on the groundwater and drinking water of the State. All but
Exxon-Mobil settled before trial. NHDES won the lawsuit and the State was awarded damages for the harm
caused to its groundwater and drinking water. The Legislature used this money plus accumulated interest to
establish the Drinking Water and Groundwater Trust Fund (DWGTF) and designated the DWGTF Advisory
Commission to manage the loan and grant award program. The Commission awards funding for eligible
applicants and projects under three major funding categories: construction projects, source water protection
projects (water supply land protection grants) and NHDES Activities. The Commission endeavors to leverage the
DWGTF to the greatest extent possible and will only consider grants that are no more than 50% of the eligible
project cost and no more than $500,000 per project. Up to two million dollars is available specifically for Source
Water Protection Grants in the 2019 funding round.
NEW HAMPSHIRE LOCAL SOURCE WATER PROTECTION GRANTS
Local Source Water Protection Grants, administered through the Drinking Water Source Protection Program, are
available to public water systems, municipalities, regional planning commissions and nonprofit organizations for
source water protection projects that can include development and implementation of (a) through (i)
watershed-based plans to protect public water supply sources. Any eligible project outlined in the application
packet for the current grant round may apply for a grant of up to $20,000, with no match required.
Approximately $200,000 is available for the 2019 grant round.

12
CONSERVATION & HERITAGE LICENSE PLATE PROGRAM
(MOOSE PLATE GRANT)
The Moose Plate Grant, administered through the State Conservation Committee, funds projects that enhance
the environment by promoting the sustainability of the state’s public and private land, air, water and cultural
resources to prevent their pollution or degradation.
Eligible applicants include municipalities, County Conservation Districts, qualified nonprofit organizations
engaged in conservation programs, public and private schools, County Cooperative Extension natural resource
programs, and scout groups. The New Hampshire State Conservation Committee’s grant program is funded
through the purchase of Conservation License Plates, known as “Moose Plates.” All funds raised through the
purchase of Moose Conservation and Heritage Plates are used for the promotion, protection and investments in
New Hampshire’s natural, cultural and historic resources. In 2019, $335,768 was awarded to 16 New Hampshire
municipalities and conservation organizations. Moose Plate funding is entirely non-federal and can be used to
match Section 319 Watershed Assistance Grant funds when project goals meet the criteria for each funding
program.
AQUATIC RESOURCE MITIGATION (ARM) FUND
The ARM Fund, administered through the NHDES Wetland Bureau, is a Compensatory Mitigation option to
permit applicants for impacts to wetlands, streams and other aquatic resources in New Hampshire, and is
available once avoidance and minimization of impacts is achieved. NHDES is authorized to collect funds in-lieu of
other forms of wetland mitigation under RSA 482-A:28 and Env-Wt 800 as part of a wetlands permit application.
Using a watershed-based approach, the ARM Fund payments are collected according to nine service areas (HUC
08 watersheds) with funding availability announcements made on an annual or bi-annual basis, depending on
fund availability.
Eligible projects include those involving land acquisition; wetland, estuary or stream restoration; culvert or dam
repair, replacement or removal; and invasive species management. Any New Hampshire municipality, town
conservation commission, county government, regional planning commission, county conservation district,
watershed and river association, state agency, institution of higher education, public school district and
nonprofit organization with a project located in the service areas is eligible to apply.
NEW HAMPSHIRE COASTAL RESILIENCE MUNICIPAL PLANNING GRANTS
The NHDES Coastal Program has targeted funds available for municipal projects that can be used to plan for
resilience to coastal hazards and build sustained capacity to implement resilience plans. In 2019, approximately
$100,000 was available to fund projects ranging from $10,000 to $30,000. Funds for this grant opportunity are
provided by the National Oceanic and Atmospheric Administration’s (NOAA) Office for Coastal Management,
under the Coastal Zone Management Act, in conjunction with the NHDES Coastal Program.
Projects must take place within one of the 17 coastal zone municipalities and have project timeframes between
12 to 18 months. For the purposes of this funding opportunity, coastal resilience is defined as the capacity of a
community or system to proactively prepare for and bounce back better from hazardous events such as
hurricanes, coastal storms, and long-term sea-level rise and associated impacts, rather than the ability to simply
react and respond to events. Eligible applicants include all 17 coastal zone municipalities and/or municipal
consultants, including nonprofit, quasi-governmental, or private organizations. A 2:1 federal grant funds to non-
federal match through cash or in-kind services is required.
13
EXOTIC SPECIES PROGRAM GRANTS
The Exotic Species Grants are funded through boater registration fees and include the following:
Control Grants for Exotic Aquatic Plants – Control Grants are awarded to local lake associations and
municipalities for the control and treatment of exotic aquatic weeds, like milfoil and include the development of
long-term management plans for each waterbody that requests funding. NHDES Control Grants will cover 100%
of the treatment costs for a new infestation, and will match up to 50% for repeat management practices.
Approximately $250,000 is awarded each year.
Milfoil and Other Exotic Plant Prevention Grants – Grant monies are available each year for forward-thinking
strategies that seek to prevent new infestations of exotic plants, including outreach, education, Lake Host
Programs and other activities. Approximately $225,000 to $280,000 is awarded each year.
Research Grants – Grant monies are available for innovative research projects by institutions of higher learning
that focus on issues associated with exotic aquatic plant management, control, biology, ecology or prevention,
or other relevant projects. Awards have ranged from around $5,000 to $30,000 depending on the project
description and need.
NATURAL RESOURCES CONSERVATION SERVICE FUNDING OPPORTUNITIES
The United States Department of Agriculture, Natural Resource Conservation Service (NRCS) provides technical
and financial assistance to private landowners, many of which are agricultural producers. Some of these
“working lands programs” address resource concerns associated with agricultural operations. Applications for
funding are ranked and prioritized based on the environmental benefits associated with the completion of the
BMPs. Applications for program funding are accepted year-round at seven field office locations (Epping, Milford,
Walpole, Concord, Conway, Orford and Lancaster).
Conservation Stewardship Program – The Conservation Stewardship Program (CSP) is for working lands. It is the
largest conservation program in the United States with more than 70 million acres of productive agricultural and
forest land enrolled in CSP. Eligible producers have a single opportunity to enroll in a five-year contract. The
2018 Farm Bill authorizes NRCS to accept new CSP enrollments from now until 2023. The program provides
many benefits including increased crop yields, decreased inputs, wildlife habitat improvements and increased
resilience to weather extremes.
Environmental Quality Incentives Program – EQIP provides financial and technical assistance to agricultural and
forestry producers to address natural resource concerns and deliver environmental benefits such as improved
water and air quality, conserved ground and surface water, reduced soil erosion and sedimentation, and
improved or created wildlife habitat. Financial assistance covers part of the costs from implementing
conservation practices. These practices are geared towards working farms, ranches, and forests. Payment rates
for conservation practices are reviewed and set each fiscal year. Through the National Water Quality Initiative
(NWQI), EQIP funds and Section 319 funds can be targeted to mutually agreed upon priority watersheds.
Emergency Watershed Protection Program – The Emergency Watershed Protection (EWP) Program was set up
by Congress to respond to emergencies created by natural disasters. It is designed to relieve imminent hazards
to life and property caused by floods, hurricanes, tornadoes, windstorms, fires and other natural
occurrences. The purpose of EWP is to help groups of people with a common problem. It is generally not an
individual assistance program. All projects undertaken must be sponsored by a political subdivision of the state,

14
such as a city, town, county, or conservation district. The program is administered by NRCS, which provides
technical and financial assistance to preserve life and property threatened by excessive erosion and flooding.

15
PARTNERSHIPS GOAL, OBJECTIVES AND MILESTONES
Partnerships (P) Goal. The NPS Program has strong partnerships with local, state and federal agencies, as well as other organizations in New Hampshire.
Schedule
20
20
20
21
20
22
20
23
20
24
Objective Milestone Measure of Success
Objective P-1 Existing and new
NPS Program partnerships result in an increased
understanding of NPS issues and
the importance of clean water.
Milestone P-1.1 Existing and new NPS partners and stakeholders participate in statewide NPS programs and watershed projects. Partners: NHDES, 319 Grantees, watershed organizations, municipalities, nongovernmental organizations, universities.
Measure P-1.1a NPS Program staff represent NPS related issues in two NPS outreach activities per year through planning assistance or presentations.
Measure P 1.1b NPS Program staff assist with two watershed project outreach-related activities.
Milestone P-1.2 NPS Program partner/stakeholder audiences, including 319 grantees, have access to NPS information and are able to obtain answers to NPS-related questions. Partners: NHDES, 319 Grantees, municipalities, watershed organizations.
Measure P-1.2a Draft and distribute press releases for all 319 grant projects when awarded.
Measure P-1.2b Environmental indicators are updated annually on the NHDES website.
Measure P-1.2c Monthly updates provided to the Watershed Protection and Restoration Forum.
Milestone P-1.3 New Hampshire municipalities are familiar with low-impact development practices, local stormwater regulations, technical assistance and other technical and financial resources. Partners: NHDES, Natural Resource
Measure P-1.3a NPS staff provide and facilitate at least one NPS program agenda item for and participate in four Natural Resource Outreach Coalition meetings per year.

16
Outreach Coalition, municipalities, Nashua, Manchester and Seacoast Stormwater Coalitions.
Measure P-1.3b Coordinate and facilitate at least twenty meetings with New Hampshire stormwater coalitions.
Measure P-1.3c Coordinate one activity per year with Small Municipal Separate Storm Sewer Systems (MS4) municipalities to meet water quality goals
Measure P-1.3d Coordinate with MS4 Stormwater Coalition Chairs to convene a regional stormwater coalition meeting.
Measure P-1.3e maintain New Hampshire MS4 Stormwater Coalition Blog with meeting, resource or calendar updates.
Milestone P-1.4 Align priority watersheds with the TMDL Program. Partners: NHDES Watershed Assistance Section, NHDES TMDL Program.
Measure P-1.4a TMDL program consults the watershed priority list to identify priority watersheds for TMDL development.
Measure P-1.4b Watersheds with TMDLs are priorities for watershed-based plan development.
Milestone P-1.5 The CWSRF Program regularly funds stormwater and nonpoint source projects, including development of watershed-based plans. Partners: NHDES Watershed Assistance Section, NHDES SRF Program.
Measure P-1.5 At least six eligible CWSRF loans available for stormwater and nonpoint source projects are on the project priority list to be funded.
Milestone P-1.6 Explore the feasibility of dividing the single lake Winnipesaukee AUID into a separate AUID for each bay. Partners: NHDES Watershed Management Bureau, NHDES Water Quality Section, Lake Winnipesaukee Watershed Association.
Measure P-1.6 Moultonborough inlet is assigned an individual AUID. (Note: base on Lake Champlain model.)

17
SECTION 319 PROGRAM ADMINISTRATION The 1987 amendments to the CWA established the Section 319 NPS Management Program. Under
Section 319, EPA provides funding to states, territories and tribes to implement a wide variety of
activities including technical assistance, financial assistance, education, training, technology transfer,
demonstration projects and monitoring to assess the success of specific NPS implementation projects.
The NHDES WAS of the Watershed Management Bureau administers New Hampshire’s NPS Program. In
addition to collaborating with NPS partners to implement statewide programs, WAS administers the
Watershed Assistance Grants Program. Funding for NPS activities and for Watershed Assistance Grants
in New Hampshire comes primarily from EPA under Section 319 of the CWA. Under the grant program,
WAS staff work with municipalities, universities, state agencies, nonprofits, watershed associations,
regional planning commissions and other organizations to develop and implement watershed-based
plans in priority watersheds as well as collaborating on other water quality planning (funded under
Section 604b of the CWA) and implementation projects. These grants support local projects that
generate actions to restore or protect water quality and enhance the designated uses of the state’s
waters by addressing sources of NPS pollution, hydromodification of rivers and streams, and habitat
losses.
The 319 Program in New Hampshire follows EPA’s Nonpoint Source Program and Grants Guidelines for
States and Territories, issued in April 2013, and operates under the New Hampshire Section 319
Nonpoint Source Program Grant Program Quality Assurance Project Plan, updated August 23, 2013 and
under revision in 2019.
NHDES has well-established financial management and programmatic systems to ensure that Section
319 dollars are used efficiently and consistently within the Nonpoint Source Program and Grants
Guidelines for States and Territories. All statutory and grant conditions applicable to Section 319 grants
received by the State are included in contracts and grant awards made to subgrantees so that all
recipients must follow all federal requirements. Further, such requirements are included in grant
funding announcements and requests for proposals issued by the WAS so that subgrantees are aware of
them prior to commencing a project.
The State of New Hampshire has an integrated accounting system with separate accounts for individual
programs. The accounts are reconciled monthly between the State of New Hampshire’s accounting
System (NHFIRST) and NHDES’ Oracle system (NHDES Ledger) to ensure the proper recording of financial
transactions. Payment is then received via electronic transfer through the federal Automated Standard
Application for Payments (ASAP). Procedure manuals and approval processes are in place to strengthen
internal controls and ensure the terms and obligations defined in the grant agreement are met.

18
PROGRAM GOAL, OBJECTIVES AND MILESTONES
319 Program Administration (319) Goal. The NPS Management Program is managed efficiently and effectively.
Schedule
20
20
20
21
20
22
20
23
20
24
Objective Milestone Measure of Success
Objective 319-1 The Plan is up-to-date and used to track satisfactory progress.
Milestone 319-1.1 Completion of annual milestones, objectives and goals in the NPS Management Program Plan are tracked and reported in the NPS Program Annual Report. Partners: NHDES
Measure 319-1.1 Documentation of completed plan elements in the NPS Annual Report, the Measures Tracking and Reporting System (MTRS), and other relevant reports and systems.
Milestone 319-1.2 The NPS Management Program is updated every five years to reflect program changes and success toward meeting NPS Program goals and progress is reported annually. Partners: NHDES, NPS stakeholders to be determined.
Measure 319-1.2a The completed NPS Management Program Plan update for years 2025-2029 is approved by EPA prior to October 1, 2024.
Measure 319-1.2b NPS Program Report is submitted to EPA annually.
Milestone 319-1.3 Grant work plans are developed, applications for Section 319 funding are submitted, and required reports are completed. Partners: NHDES, EPA, 319 Grantees, NPS partners TBD
Measure 319-1.3a Annual update of 319 staff work plans in MTRS database with quarterly progress reporting.
Measure 319-1.3b Annual update of EPA's Priorities and Commitments List.
Measure 319-1.3c Annual grant progress reports are submitted to EPA.

19
Objective 319-2 Funding is adequate to fulfill NPS Program Plan objectives and dollars are used efficiently and are consistent with legal obligations.
Milestone 319-2.1 Apply and manage Section 319 funding from EPA as part of the NHDES Performance Partnership Grant (PPG) and continuing environmental program grant. Partners: NHDES, EPA
Measure 319-2.1 Grant dollars are spent by the grant end date and no later than five years from the start date.
Milestone 319-2.2 Streamline the Request for Proposal process. Determine the feasibility of developing an online, iterative grant application. Update review/scoring criteria and project eligibility requirements for 319 and other funded projects managed by the NPS Program. Partners: NHDES, grantees, New Hampshire Department of Information Technology
Measure 319-2.2a Feasibility determination of online application process.
Measure 319-2.2b Annual review and update of grant application scoring and eligibility criteria.
Milestone 319-2.3 Requests for Proposal (RFPs) for 319 sub-awards are released to allow ample time for state and EPA approval and the execution of 319 sub-awards by DES as soon as feasible after federal 319 dollars are made available. Partners: NHDES, EPA
Measure 319-2.3 319 sub-awards are obligated within one year after the EPA grant award.
Milestone 319-2.4 Coordinate and report on Disadvantaged Business Enterprises (DBEs) Partners: NHDES
Measure 319-2.4 Annual reporting on the utilization of minority and women-owned businesses.

20
PRIORITY WATERSHEDS Restoration of NPS-impaired waters remains the primary goal of the New Hampshire NPS Management
Program; however, only a small percentage of waters in New Hampshire have sufficient data to
determine whether or not water quality impairments exist. As of 2018, about 42% of lakes and 27% of
rivers had enough data to be assessed for the Aquatic Life Integrity designated use. This designated use
has the strongest correlation with NPS impacts from stormwater-related pollutants in New Hampshire.
With the majority of lakes and rivers unassessed, and therefore without a formal high quality or
impairment determination, New Hampshire’s NPS Management Program provides funding for both
restoration and protection activities at the watershed scale. Based upon history and current active
projects it is estimated that over the next five years, approximately 80% of the program’s time and
funding will be expended on restoring impaired waters with the remaining 20% devoted to protecting
and improving threatened waters.
TABLE 2: NUMBER OF ASSESSMENT UNITS (AUIDS) IN EACH OF NHDES' ASSESSMENT CATEGORIES FOR
THE AQUATIC LIFE INTEGRITY DESIGNATED USE
Fresh Waters Salt Waters
Grand Total NHDES
Assessment Category* Impoundment Lake River Estuary Ocean
2-G Full Support
- - 39 - 46 85
2-M - 8 93 - - 101
3-PAS Insufficient Information
107 211 1,864 8 - 2,190
3-ND 4,689 4,650 24,066 431 121 33,957
3-PNS 74 319 834 3 - 1,230
4A-M
Impairments
12 1,185 17 - - 1,214
4A-P - 318 16 - - 334
4B-M - - 6 - - 6
4B-P - - 4 - - 4
4B-T - - 57 46 - 103
4C-M 35 92 57 - - 184
4C-P 32 30 61 - - 123
5-M 538 1,533 6,503 92 - 8,666
5-P 149 511 3,086 1,462 - 5,208
5-T 4 - 21 - - 25
Grand Total 5,640 8,857 36,724 2,042 167 53,430
* Definitions for Assessment Categories can be found in the 2018 CALM

21
There are many factors that affect the actual allocation of program resources directed toward
restoration versus protection activities in a given year including, but not limited to partner participation,
response to project proposal solicitation, existence of an EPA and NHDES-approved, (a) through (i)
watershed-based plan, scheduling, and likelihood of success.
New Hampshire’s NPS Management Program recognizes that there are still important water quality
benefits to be gained from implementing protection projects that prevent further degradation or
protect high quality water where it exists. This section describes the process of prioritizing restoration
and protection activities to achieve clean watersheds in New Hampshire. Specific goals, objectives, and
milestones related to watershed prioritization are described on page 29 in this document.
PRIORITY AREAS FOR NPS MANAGEMENT ACTIVITIES
In 2013, NHDES completed a priority analysis, using the Recovery Potential Screening Tool (RPST)
developed by EPA, to identify geographic areas of the state where NHDES should focus limited resources
among large numbers of waters in need of restoration or protection.
The RPST uses the ecological, stressor and social characteristics of each watershed to identify those
places with the greatest likelihood for restoring or maintaining water quality. Representative indicator
metrics (shown in Tables 3 and 6), were selected by NHDES and used to calculate a specific
recoverability or protection score for each watershed. Depending on the score, each watershed was
assigned low, medium, or high recovery or protection potential.
The restoration and protection priorities and rationale are described in their respective sections below.
A complete description of the prioritization activity using the RPST, including the geographic scope, AU
and hydrologic unit code (HUC) 12 watershed delineation, indicator metrics used, data gathering,
sources, ranking and mapping results is described in the Priority Areas for Nonpoint Source Management
Activities in New Hampshire: NHDES Methodology for Prioritizing Water Quality Restoration and
Protection Activities in Appendix A.
Priority watersheds identified in the NPS Plan may also serve as the basis for decision-making with
respect to priorities for monitoring, TMDL development and implementation and CWSRF loans for NPS
projects and, most importantly, for developing (a) through (i) watershed-based plans in New Hampshire.

22
TABLE 3: NPS-RELATED INDICATORS
Nonpoint Source Indicator Name
Aluminum
Ammonia (Un-ionized)
BOD, Biochemical oxygen demand
Benthic-Macroinvertebrate Bioassessments (Streams)
Chloride
Chlorophyll-a
Cyanobacteria hepatotoxic microcystins
Dissolved oxygen saturation
Enterococcus
Escherichia coli
Excess Algal Growth
Fishes Bioassessments (Streams)
Habitat Assessment (Streams)
Low flow alterations
Ammonia (Total)
Other flow regime alterations
Oxygen, Dissolved
Sedimentation/Siltation
Fecal Coliform
Total Suspended Solids (TSS)
Turbidity
Nitrogen (Total)
Phosphorus (Total)

23
PRIORITIES FOR RESTORATION ACTIVITIES
In New Hampshire, impairments are made at the AU level. An AU is the basic unit of record for
conducting and reporting the results of all water quality assessments. To provide a finer level of detail
for the recoverability analysis, NHDES delineated the watershed boundary of each AU, which includes
every stream segment, lake, pond, impoundment or estuary in the state. The recoverability analysis for
restoration activities included all AU watersheds that have one or more NPS-related impairments.
NHDES determined that NPS-related impairments include those parameters listed in Table 3. The
recoverability analysis calculated recovery scores based upon the ecological, stressor and social metrics
in Table 4.
RIVERS
New Hampshire has nearly 17,000 stream and river miles that flow through the state. Priority for
restoration activities is given to those river AU watersheds that have completed NHDES and EPA-
approved watershed restoration plans (a) through (i), or that ranked medium or high priority in the RPST
analysis and meet the following river priority criteria:
1. The waterbody has a committed organization, association or other group associated with it (for
instance, Designated River Local Advisory Committee, watershed association, etc.).
2. The waterbody has an established water quality monitoring program.
3. The organization has regular interaction with water quality professionals.
The river priority criteria can be met by participating in VRAP. See Appendix B for the River Watersheds
Recovery Potential Ranking List and Appendices E, F, and G for associated maps.
LAKES
New Hampshire has over 800 lakes and ponds greater than 10 acres in size. The priority for restoration
activities is given to those lake watersheds that have completed NHDES- and EPA-approved watershed
restoration plans (a) through (i), or that ranked medium- or high-priority in the RPST analysis and meet
the following lake priority criteria:
1. The waterbody has a committed organization, association or other group associated with it.
2. The waterbody has an established water quality monitoring program.
3. The organization has regular interaction with limnology professionals.
4. The waterbody is an impoundment with impairments directly related to an artificial barrier, and
a decision has been made to investigate barrier removal.
The lake priority criteria can be met by participating in VLAP or UNH’s LLMP. See Appendix C for the
Priority Lake and Impoundments Recovery Potential Ranking List and Appendix E for associated maps.

24
TABLE 4: RECOVERABILITY METRICS
BEACHES
New Hampshire has nearly 400 freshwater and coastal beaches. Priority for restoration activities is given
to the nearly 150 public bathing beaches with documented allowable bacteria loadings and associated
reductions needed to meet water quality standards, as reported in one of the EPA-approved TMDL
studies available on the NHDES website. The list of priority beaches is included in Appendix D. Beach
TMDLs include the following:
Ecological Metrics R P Stressor Metrics R P Social Metrics R P
Watershed size X Watershed aquatic barriers
X X Watershed size X
Corridor road crossing density
X X Approved TMDL existence
X
Strahler Stream Order ≤ 3* X X Number of 303(d) listed causes
X X Watershed-based plan X X
Watershed % Watershed % (a) through (i) Watershed-based Plan
X X
Instate area X Impervious area
X X Jurisdictional complexity
X
Stream miles unimpaired
X
Agriculture
X Watershed population Number of drinking water intakes
X X
Lake acres unimpaired X Pasture X
Natural cover X X Developed X X Assessment unit class X
Forest X X Active River Area %
Local River Advisory Committee
X X
Wetlands X X Watershed % X X
Natural services network
X X Impervious area
X X Protected land X
Active River Area % Agriculture X
Stream miles assessed
X
Natural cover X X Pasture X Lake acres assessed X
Forest X X Developed X X Agriculture X
Wetlands X X Pasture X
* Strahler Stream Order ≤ 3 was not included in the ecological metrics for the lakes restoration priority
assessment.
“R” – designates metrics used for recovery potential analysis
“P” – designates metrics used for protection potential analysis

25
Final Report Total Maximum Daily Load (TMDL) Report for 3 Bacteria Impaired Waters in New
Hampshire. NHDES. September 2015.
Final Report Total Maximum Daily Load (TMDL) Report for 44 Bacteria Impaired Waters in New
Hampshire. NHDES. September 2013.
Final Report Total Maximum Daily Load (TMDL) Report for 58 Bacteria Impaired Waters in New
Hampshire. NHDES. August 2011.
Final Report New Hampshire Statewide Total Maximum Daily Load (TMDL) for Bacteria Impaired
Waters. FB Environmental for NHDES. September 2010.
Total Maximum Daily Load (TMDL) Study for Bacteria in Mill Pond Town Beach, Washington, NH.
NHDES. September 2006.
Total Maximum Daily Load (TMDL) Study for Bacteria in Sand Dam Village Pond Town Beach,
Troy, NH. NHDES. September 2006.
Total Maximum Daily Load (TMDL) Study for Bacteria in Hampton/Seabrook Harbor. NHDES.
May 2004.
ESTUARIES
The Great Bay and Hampton-Seabrook estuaries are the largest, distinct estuarine systems in New
Hampshire. The Great Bay Estuary begins at the confluence of the Piscataqua River with the Atlantic
Ocean and extends to the head-of-tide dams on the Winnicut, Squamscott, Lamprey, Oyster, Bellamy,
Cocheco, Salmon Falls and Great Works Rivers. The Great Bay estuary covers approximately 13,440
acres (21 square miles). The Hampton-Seabrook Estuary starts at the confluence of the Hampton River
with the Atlantic Ocean and extends to the head-of-tide on the Taylor, Blackwater, Browns and
Hampton Falls Rivers. The Hampton-Seabrook Harbor Estuary covers approximately 1,227 acres (1.9
square miles). Other estuaries of importance include Little Bay, Little Harbor and Rye Harbor, as well as
portions of their tidal tributaries. Because of their environmental, cultural and economic significance,
NHDES has assigned high priority to all of the state’s estuaries and their tidal tributaries.
DAMS AND BARRIERS
Under New Hampshire RSA 482:2, II and Env-Wr 101.12, a dam is any artificial barrier that impounds or
diverts water and has a height of 6 feet or more, or is located at the outlet of a great pond, or is an
artificial barrier which impounds liquid industrial or liquid commercial wastes, or septage or sewage,
regardless of height or storage.
New Hampshire has more than 4,800 active and inactive dams in the state and countless unregistered
dams and artificial barriers that impede stream flow and fish passage. Many of these barriers no longer
provide a valuable function and instead, contribute to water quality or habitat impairments. Selective
barrier removal can restore a river to a healthier, free-flowing condition and can remove barrier-related
impairments to water quality and habitat.
According to the New Hampshire NPS Management Program Plan, priority dams and barriers identified
for removal must meet the following criteria:

26
1. The structure impounds or diverts water.
2. The waterbody for which it is located must be on New Hampshire’s 303(d) list, as impaired for at
least one of the following parameters:
Chlorophyll-a
Dissolved oxygen
Cyanobacteria hepatotoxic microcystins.
3. The dam or barrier owner has contacted the NHDES River Restoration Program to express their
interest in removal.
Currently, the following dams and barriers, listed in Table 5 below, meet the criteria. As NHDES becomes
aware of additional dams or barriers meeting the criteria, this list will be updated.
TABLE 5: PRIORITY DAMS AND BARRIER SITES
Waterbody Name Waterbody AUID Municipality
Oyster River - Beards Creek Dam NHIMP600030902-06 Durham
Oyster River – Mill Pond Dam NHIMP600030902-04 Durham
Little Hale Pond – Little Hale Dam NHRIV600030607-20 Durham
Cocheco River – Gonic Dam Pond NHIMP600030607-02 Rochester
Peverly Brook - Lower Pond Dam NHIMP600030904-05 Newington
Bellamy River – Sawyers Mills Upper Dam NHIMP600030903-02 Dover
Souhegan River – Goldman Dam NHIMP700060906-07 Milford
PRIORITIES FOR PROTECTION ACTIVITIES
New Hampshire does not have a formal list of high-quality waters and, as noted in the EPA National
Water Quality Assessment, tends to have better than average water quality when compared to other
states in the U.S. Therefore, in the absence of a documented impairment, water quality is assumed to be
high and supporting designated uses. In many cases, an Assessment Unit (AU) impaired for one
parameter or designated use ranks high for protection consideration and NPS implementation activities
due to generally high quality for other parameters or designated uses. This Plan’s protection analysis
was completed at the HUC 12 scale by calculating protection scores based upon the ecological, stressor,
and social metrics in Table 6.

27
TABLE 6: PROTECTION METRICS
Ecological Metrics Stressor Metrics Social Metrics
Strahler Stream Order < 3* Watershed Aquatic Barriers Watershed-based Plan
Watershed % Corridor Road Crossing Density (a) through (i) Watershed-based
Plan
Natural Cover Number of 303(d) listed causes Jurisdictional Complexity
Forest Watershed % Number of Drinking Water
Intakes
Wetlands Impervious Area Local River Advisory Committee
Natural Services Network Developed Watershed %
Active River Area % Active River Area % Lake Acres Assessed
Natural Cover Impervious Area Agriculture
Forest Developed Pasture
Wetlands
Priority for protection activities is given to those watersheds that have completed, NHDES and EPA-
approved (a) through (i) watershed-based plans, or that ranked medium or high priority in the PPST
analysis. See Appendix H for the HUC 12 Protection Potential Ranking List.

28
PRIORITY WATERSHEDS GOAL, OBJECTIVES AND MILESTONES
Priority Watersheds(PW) Goal. Water quality in priority watersheds is protected and restored.
Schedule
20
20
20
21
20
22
20
23
20
24
Objective Milestone Measure of Success
Objective PW-1 Grant Funding is awarded to projects with the greatest likelihood for successful restoration or protection activities.
Milestone PW-1.1 Annual grant solicitation process utilizes watershed prioritization as the basis for funding projects. Partner: NHDES Water Quality Section
Measure PW-1.1 100% of grants awarded annually are in priority watersheds.
Objective PW-2 Watershed-based plans are developed and implemented in priority watersheds.
Milestone PW-2.1 Restoration and protection projects identified in existing watershed-based plans are implemented. Partners: NHDES, 319 Grantees
Measure PW-2.1 Through a competitive grant award process complete 16 restoration and four protection projects by 2024.

29
Milestone PW-2.2 New watershed-based plans are developed and existing watershed-based plans are updated, where needed, to comply with EPA's nine minimum elements; (a) through (i), of watershed-based plans, as part of implementation grants. Partners: NHDES, 319 Grantees
Measure PW-2.2 Develop five new or updated watershed-based plans in restoration or protection priority watersheds that meet EPA's nine minimum elements; (a) through (i), of watershed-based plans or alternative watershed-based plans.
Milestone PW-2.3 Progress toward implementing watershed-based plans is efficiently tracked, including action item implementation, condition and maintenance surveying of best management practices, and other relevant information. Partners: NHDES, 319 Grantees
Measure PW-2.3a Five BMP condition assessments per year to determine general conditions of 319 or CWSRF loan-funded BMP installations.
Measure PW-2.3b BMP Operation and Maintenance agreements are required of every BMP implementation project and supports follow-up maintenance for 319 funded or CWSRF loan-funded BMPs to improve performance and life expectancy.
Objective PW-3 Progress toward water quality improvement is quantified.
Milestone PW 3.1 Watershed-based plan implementation efforts result in measurable water quality benefits. Partners: NHDES, 319 Grantees, other monitoring programs
Measure PW-3.1a Estimated annual reductions of nitrogen, phosphorus, sediment and other project-relevant parameters as reported annually into GRTS and the NPS Program Annual Report.

30
Measure PW-3.1b The NPS Program Annual Report includes the number of waterbodies where the concentration of NPS pollutants have been reduced.
Milestone PW-3.2 Potential assessment unit delisting, partial delisting and implementation projects are tracked so that success stories may be drafted as soon as possible. Partners: NHDES, 319 Grantees, EPA, volunteer monitoring groups
Measure PW-3.2 Confirmation monitoring is completed annually in watersheds where watershed-based plans have been implemented to determine whether de-listing of impairments is warranted.

31
Milestone PW-3.3 EPA NPS Success Stories are approved and published on EPA, NHDES and other websites to demonstrate program success for pollutant-based, non-pollutant-based and partial restoration projects. Partners: NHDES, 319 Grantees, EPA
Measure PW-3.3 Two. EPA-approved NPS Success Stories that document fully or partially restored waterbodies.
Milestone PW-3.4 NHDES and agency partners establish a permitting process for in-lake treatments to prevent chronic cyanobacteria blooms and remove related impairments by addressing internal loading of phosphorus to lakes and ponds from benthic sediments. In-lake treatments occur once installations of BMPs to control external nutrient loading have achieved sufficient progress toward meeting pollutant load reduction targets established in watershed-based plans. Partners: NHDES, New Hampshire Fish and Game Department, 319 Grantees, others as identified.
Measure PW - 3.4 Successful treatment of a lake or pond using a permitted in-lake treatment to inactivate internal loading of phosphorus from benthic sediment.

32
PRIORITY NPS POLLUTANT CATEGORIES NPS pollutant sources are divided into minor and major categories. Goals, objectives, and measurable
annual milestones are included in this plan for each Major NPS Pollutant Category.
MINOR NPS POLLUTANT CATEGORIES The 2019 update to the Plan was the second time that pollutant categories have been divided into
minor and major categories. In the process of updating the 2019 Plan, a pollutant category remained
classified as minor if the category continues to not pose a major threat of NPS pollution due to increased
regulatory oversight, enforcement, technical or other assistance programs that continue to reduce the
water quality threat from these sources.
In order for these categories to remain minor, funding and support of the programs that protect and
restore water quality from these pollutant sources must be maintained. A general goal of the New
Hampshire NPS Program is to collaborate with and provide support to these programs as appropriate
and as needed to continue their effectiveness.
MARINAS AND RECREATIONAL BOATING
BACKGROUND
For the last five years, the number of recreational boats registered in New Hampshire increased each
year, from around 92,000 to over 95,000 (Parry, 2019). The environmental impacts associated with
boats require continuous attention.
The following programs and methods all work toward minimizing water quality impacts from marinas
and recreational boating activities. NHDES Boat Inspection Program, Lakes Management Advisory
Committee, On-site Fuel Storage requirements for marinas, New Hampshire Clean Lakes Program, Clean
Vessel Act Program, Federal No Discharge Areas for New Hampshire waters, the New Hampshire
Department of Transportation (NHDOT) Marine Patrol, New Hampshire Fish and Game Department, U.S.
Fish & Wildlife Service, the New Hampshire Marine Trades Association, and others,
Emerging concerns around the effects of recreational boating on lake shorelines have been identified by
multiple stakeholders. Legislation is pending to establish a study commission to evaluate the effects of
shoreline erosion caused by wake boats. The study commission will develop information to provide a
better understanding of shoreline erosion impacts so that approaches can be developed to minimize
NPS from this activity.
RESOURCES
BMPs for New Hampshire Marinas: Guidelines for Environmentally Proactive Marinas
The Boater’s Guide of New Hampshire: A Handbook of Boating Laws and Responsibilities
Pollution Prevention Marinas Project
33
Clean Vessel Act Program Resources/Links
NH Clean Lakes Program
RSA 487: Control of Marine Pollution and Aquatic Growth
NHDES Marinas - Design Standards Env-Wt 402.16
Env-OR 300 Petroleum Storage Facilities Above Ground (AST)
RESIDUALS MANAGEMENT
BACKGROUND
Septage
Septage is defined as “material removed from septic tanks, cesspools, holding tanks, or other sewage
treatment storage units, excluding sewage sludge from public treatment works and industrial waste and
any other sludge. New Hampshire generates over 100 million gallons of septage annually for disposal,
which is predominately treated at publicly-owned wastewater treatment plants (86%). Other
treatment/disposal methods, such as land application (8%), unlined lagoons (4%), and
innovative/alternative facilities (2%), comprise the remaining management options. In 2018, land
application of septage was reduced to five active sites where just over three million gallons were land-
applied. All septage land application sites in the state are regulated and permitted according to the New
Hampshire Code of Administrative Rule, Env-Wq 1600: Septage Management.
Biosolids
The State defines biosolids as any sludge derived from a sewage wastewater treatment facility that
meets the standards for beneficial reuse specified by NHDES. In response to legislation, NHDES has been
collecting sludge samples from New Hampshire wastewater treatment plants, paper mills generating
short paper fiber, residual management facilities, and water treatment facilities for chemical analysis
since 1999. NHDES is also monitoring and screening for emerging contaminants in biosolids and working
to establish screening standards for these contaminants. This legislation requires NHDES to make an
annual report to the legislature by November 1 regarding sludge quality for samples collected during the
year. These reports show few violations of State standards and that land-applied sludge is generally of
acceptable quality. In November 2002, Dr. Thomas Ballestero of the Environmental Research Group at
UNH reported to NHDES and the legislature on a statistical evaluation of the chemical quality of biosolid
samples collected by NHDES between 1999 and 2001. Specifically, Dr. Ballestero was evaluating
compliance with NHDES biosolids standards and the potential that land-applied sludges would violate
state standards. His assessment showed that the majority of regulated contaminants were not detected.
Further, those contaminants that were detected generally did not exceed standards.
In 2007, House Bill 699 established a commission to study various aspects of septage and sludge
management. One of the charges of the commission was to consider the potential health effects of
current disposal practices. The commission concluded that with adequate control and monitoring,
current disposal practices allow beneficial reuse of sludges as soil conditioner and fertilizer while
adequately protecting public health. The NHDES Residuals Management Program’s sludge management
rules (Env-Wq 800) were significantly updated in 2016.

34
RESOURCES
NHDES Wastewater Engineering Fact Sheets
RSA 485-A:4, XVI-a, b Water Pollution and Waste Disposal, Duties of Department
RSA 485-A:6, X-a Water Pollution and Waste Disposal, Rulemaking
NHDES Groundwater Discharge Permits and Registrations Rules Env-Wq 402
NHDES Sludge Management Rules Env-Wq 800
EPA Standards for the Use or Disposal of Sewage Sludge
RESOURCE EXTRACTION
BACKGROUND
Mining activities that can contribute to water quality degradation in New Hampshire include sand and
gravel mining and recreational mining for gold. Sand and gravel excavations are governed by RSA 155-E,
which includes both “express” standards – operational standards that all excavations must follow – as
well as “minimum” standards that certain excavations subject to local permitting must follow. The
operational standards address such issues as setbacks from abutters, maintenance of vegetation,
drainage, storage of fuels, and setbacks from waterbodies. Reclamation standards require that, within
12 months of the completion of an excavation operation, the area must be reclaimed, with attention
paid to reseeding, disposal of debris, grading of slopes and drainage. The law designates the planning
board as the local permitting authority, unless the municipality votes to vest such authority in the
selectmen or zoning board of adjustment.
Excavations larger than 100,000 square feet, or 50,000 square feet in the protected shoreland, also
require an AoT permit from NHDES. AoT permits govern stormwater and the effects of earth disturbance
on water quality.
Gold found in stream gravel is known as a placer deposit. Panning and dredging are methods for
separating the heavy gold flakes and nuggets from the stream gravels. Panners may not use a shovel to
dig into the stream bottom or stream banks. Scooping gravel up with a gold pan is allowed. Mineral
seekers in the White Mountain National Forest (WMNF) need to check out WMNF regulations. New
Hampshire state lands, such as state parks, geologic and historic sites, etc., have rules regarding mineral
collecting. See: Administrative Rule Res 7301.19 – Res 7301.21.
Dredging and the use of sluice boxes involves disturbing the stream sediments, but on a larger scale
than panning. Processing stream gravels in search of placer gold releases fine sediments back into the
stream. Sediment-laden streams can be an environmental issue. Therefore, certain regulations apply to
this activity in New Hampshire. Dredging and similar operations are regulated by the State under
statutes RSA 482-A and RSA 485-A:17 because of the potential for environmental damage. Gold seekers
who anticipate dredging, or similar work, in New Hampshire are required to obtain a permit.
RESOURCES
Vegetating New Hampshire Sand and Gravel Pits.

35
Local Regulation Excavations (RSA 155-E).
NHDES Wetlands Program, Dredge and Fill Permit (RSA 482-A, Env-Wt 700).
NHDES Terrain Alteration (RSA 485-A:17, Env-Wq 1500).
NHDES Environmental Fact Sheet CO-GEO-1: Gold in New Hampshire.
TIMBER HARVESTING
BACKGROUND
New Hampshire’s rural areas and working forests provide the backdrop for recreation and tourism as
well as the foundation for the state’s $1.4 billion forest products industry. Additionally, $1.4 billion is
generated annually as a result of forest-based recreation (NEFA, 2013). In the late 18th century, land
clearing for farms and pastures reduced forest cover to about 45% statewide. By 1998, forest cover had
rebounded to an estimated 84%. Of this, 94% (4.5 million acres) is classified as timberland, which is land
that is currently producing, or capable of producing, wood crops. Seventy-six percent of the timberland
in New Hampshire is privately owned. Among other duties, state Forest Rangers within the New
Hampshire Department of Cultural Resources, Division of Forests and Lands (NHDFL) are responsible for
enforcing laws pertaining to timber harvesting operations. In 2010, NHDFL produced the New
Hampshire Statewide Forest Resources Assessment, an update of the 2006 New Hampshire Forest
Resources Plan Revision Assessment Report. The NPS Program works with state partners, including
NHDFL and the New Hampshire Timberland Owners Association, to support sustainable forest
management and practices that protect water quality.
Despite the large percentage of forested land in New Hampshire, timber harvesting operations are
considered a minor category because there are no documented water quality impairments caused by
timber harvesting. The BMP manuals in place are referenced in the administrative rules for both the
Wetlands and Alteration of Terrain (AoT) bureaus.
RESOURCES
NH Stream Crossing Guidelines
NHDES Wetlands Rules Env-Wt 100-900
NHDES Shoreland Protection Rules Env-Wq 1400
NHDES AoT Rules, Env-Wq 1500
New Hampshire Office of Professional Licensure and Certification Board of Foresters
NH Timber Harvesting Council’s Professional Loggers Program
New Hampshire Best Management Practices for Erosion Control on Timber Harvesting
Operations
Best Management Practices for Forestry: Protecting New Hampshire’s Water Quality.
Good Forestry in the Granite State: Recommended Voluntary Forest Management Practices for
New Hampshire
Guide to New Hampshire Timber Harvesting Laws.

36
MAJOR NPS POLLUTANT CATEGORIES Major categories of NPS pollution are those sources that cause the most water quality impairments or
threaten water quality degradation in high quality watersheds. The priority restoration and protection
activities associated with these major categories include technical and financial assistance, planning, and
implementation. A detailed description of the pollutant category, measures to control NPS pollution, key
programs and partners, goals, objectives, milestones and measures of success are included for each
Major NPS Pollutant Category.
Major NPS Pollutant Categories in New Hampshire include:
Agriculture
Chlorides and Winter Road Maintenance
Developed Land
Hydrologic and Habitat Modification
Lawns and Turf Management
Subsurface (Septic) Systems
AGRICULTURE
Well-managed agricultural operations are an important part of New Hampshire’s working landscape and
are integral to maintaining good water quality. In light of changing climate conditions, agriculture best
management practices build more resilient farms, help sequester carbon and can save on costs.
Agriculture in New Hampshire contributes to the state’s economy with farm-related income in 2017 of
$29,736,000 (USDA, 2018). Good soil health, use of cover crops, reduced tillage and beneficial use of
nutrients, such as those contained in animal manure, are all key components to both healthy water and
a healthy agricultural sector.
According to the 2018 New Hampshire cropland data layer (USDA, 2018), 193,914 acres of New
Hampshire’s land area, or about 3.3%, is used for crops or pasture. Water quality concerns relative to
agriculture include nutrients, bacteria, herbicides and pesticides. The 2017 Census of Agriculture (USDA,
2018) counted 48,955 farm acres as being treated with commercial fertilizer, lime and soil conditioners;
24,835 acres treated with manure and 2,599 acres treated with organic fertilizer. The total number of
fertilized acres has increased slightly over the past five years.
To understand how agriculture can fit in proportionally with other nonpoint sources, it is helpful to
review the Great Bay Nitrogen Nonpoint Source Study (GBNNPSS) report (NHDES, 2014a). The GBNNPSS
researched the categories of sources contributing nitrogen to the impaired Great Bay Estuary and
determined the contributions of each source category. For agriculture, the study determined fertilizer
loading from data available through the US Department of Agriculture, National Agricultural Statistics
Service and several other sources. For animal waste, the study analyzed data available from US Census
of Agriculture and the New Hampshire Department of Agriculture Markets and Food (NHDAMF). Figure
3 summarizes the total NPS nitrogen load to the Great Bay estuary.

37
FIGURE 3: NPS NITROGEN DELIVERED TO GREAT BAY ESTUARY BY SOURCE TYPE (NHDES, 2014A)
The GBNNPSS found that chemical fertilizer on agricultural lands accounts for 58,562 lbs/year, or
approximately 4%, of the total NPS nitrogen load. Animal waste from agricultural operations was found
to contribute 133,396 lbs/year or about 8% of the total NPS nitrogen load.
The Conservation title of the Agriculture Improvement Act of 2018, aka, 2018 Farm Bill, is implemented
by NRCS, which provides assistance to agricultural producers and landowners to adopt conservation
activities on agricultural and forest lands to protect and improve water quality and quantity, soil health,
wildlife habitat and air quality. Financial assistance for approved conservation practices is provided
through the Environmental Quality Incentives Program (EQIP) and the Conservation Stewardship
Program, while land is protected via easements with the Agriculture Conservation Easement Program.
Several agronomic best management practices, such as cover crops, reduced till, no-till, nutrient
management, manure storage, rotational grazing and riparian buffers provide water quality benefits by
reducing sedimentation and excess nutrients to surface and ground water resources. Results from the
Human Septic
System Waste
29%
Atmospheric
Deposition
42%
Out of State Sources
220 tons/yr
In-State Sources
130 tons/yr

38
2017 Census of Agriculture show a five-year increase of around 69% for cropland under no-till or
reduced tillage practices and an increase of approximately 66% in acreage planted to a cover crop (USDA
2018).
As part of the 2018 Farm Bill, NRCS New Hampshire is developing many partnerships and training events
to help farmers understand the benefits of implementing conservation practices on their farms. A major
challenge in New Hampshire is the lack of Certified Crop Advisors or similar agricultural professionals
who are qualified to provide technical assistance to private famers via the Technical Service Provider
program. This program provides funds for farmers to hire private consultants to help plan and
implement practices on their farms. To help meet this need, three individuals were trained in nutrient
management planning in 2016 with the help of the New Hampshire Association of Conservation
Districts, NRCS New Hampshire and a Watershed Assistance Grant. In 2018, two more individuals began
training in grazing, nutrient management and transition to organic planning. To further improve the
technical delivery to private landowners, NRCS New Hampshire, along with UNH Cooperative Extension,
Conservation Districts and producer groups, provide a number of trainings to staff, partners and
landowners on a variety of topics each year. Specifically, nutrient management, working effectively with
organic producers, grazing school, cover cropping and reduced till are some of the topics commonly
covered that can help to reduce nonpoint source pollution from farming activities. Under the new Farm
Bill, NRCS New Hampshire will also be required to prioritize EQIP applications in source water protection
areas and is required to spend at least 10% of the annual allocation on projects that benefit water
quality within source water protection areas. NHDES has provided NRCS New Hampshire with GIS
information to help prioritize this effort.
NWQI was established in 2012 as a cooperative effort between NRCS, state water quality agencies and
the Environmental Protection Agency (EPA) to address agricultural sources, primarily nutrients and
sediments, of water pollution in jointly agreed upon priority watersheds. NHDES will work with NRCS
New Hampshire to develop watershed assessments or plans and provide in-stream water quality
monitoring assistance to track progress in meeting water quality goals through land protection efforts
and agricultural BMPs.
The NHDAMF Manual of Best Management Practices (BMPs) for Agriculture in New Hampshire provides
agronomic/vegetative and structural practices that allow for economically viable production while
achieving the least possible negative impact on the environment, including water quality. The BMPs also
decrease possible negative impacts on human, animal and plant health. To help operators with BMP
compliance, NHDAMF offers financial assistance through the Agricultural Nutrient Management Grant
Program.
The New Hampshire Fertilizer Law, RSA 431, is administered by the Commissioner of NHDAMF. State law
requires NHDAMF to investigate complaints of improper handling of manure, agricultural compost and
chemical fertilizer. Where improper management is found, NHDAMF is required to provide notice in
writing explaining the specific actions needed to conform with best management practices. If

39
compliance is not met, the local health officer and NHDES shall be notified to take such action as their
authority permits.
In 2019, NHDAMF published Best Management Wetlands Practices (BMWPs) for Agriculture as a
reference and planning tool for reducing erosion and sedimentation affecting wetlands. The BMWPs are
referenced in the NHDES revised Wetlands Rules (Env-Wt) adopted in June, 2019 and effective
December 15, 2019.
The NHDAMF, Division of Pesticide Control, in cooperation with federal agencies, works to ensure the
safe and proper use of pesticides by enforcing federal and state pesticide laws and regulations impacting
the sale, storage and application of all registered pesticides, examining and licensing pesticide dealers
and users, and registering pesticides sold and used within the state. In carrying out certain provisions of
the federal pesticide program. NHDAMF maintains a federally approved state plan for certification of
commercial and private pesticide applicators. The Rules of the New Hampshire Pesticide Control Board
require licensing of all commercial and private pesticide applicators as well as pesticide dealers through
an examination and recertification process every five years.
Integrated pest management (IPM) combines the use of biological, cultural, physical and chemical
tactics in ways that reduce economic, health and environmental risks when controlling pests. New
Hampshire’s IPM Program is a tool to promote, through education and training, a sustainable approach
to managing pests and “to bring about the broadest possible application of the principles of integrated
pest management to agriculture, horticulture, arboriculture, landscape and building maintenance, and
any other areas in which economic poisons are employed.”(RSA 430:50) In 2015, the New Hampshire
Legislature increased the percentage of pesticide registration fees that are deposited into the IPM fund
from ten to 25%. These sums of money are used to support New Hampshire’s IPM Program, including
the awarding of IPM grants.
EPA is the permitting authority for concentrated animal feeding operations (CAFOs) in New Hampshire.
Once permitted, a CAFO is legally no longer designated as a nonpoint source and becomes regulated
under the NPDES program. On December 21, 2018, EPA permitted the first CAFO in New Hampshire, the
Forbes Farm Partnership, Inc., located in Lancaster, NH and Guildhall, VT.
Agricultural easements are an important tool for land conservation and the long-term sustainability of
agriculture in New Hampshire. There are many programs and land trusts that develop and fund
conservation easements, resulting in conservation of farmland in perpetuity. Given the diversity of land
conservation programs, it is important to maintain flexibility when adopting conservation easements in
order to conserve natural resources as well as meet the needs of current and future farmers.
Improving soil health and protecting water quality are critical to the well-being of both New Hampshire
residents and visitors alike. By encouraging agricultural land easements, the development of nutrient
management plans, integrated pest management practices, agriculture BMPs and the installation of
riparian buffers to protect water quality, NHDES and its partners will help ensure the viability of a
healthy agriculture sector long into the future.

40
RESOURCES
Manual of Best Management Practices (BMPs) for Agriculture in New Hampshire
BMPs for Agriculture
New Hampshire Pesticide Laws and Administrative Rules (RSA 430 and Pes 100 – 1100)
USDA Natural Resources Conservation Service

41
AGRICULTURE GOAL, OBJECTIVES AND MILESTONES Agriculture (A) Goal. Agricultural land is well managed and demonstrated to be a water quality asset with local agricultural commissions, conservation commissions, regional planning commissions and others working on land use issues.
Schedule
20
20
20
21
20
22
20
23
20
24
Objective Milestone Measure of Success
Objective A-1 Foster good agricultural management through education, training and certification programs.
Milestone A-1.1 Promote nutrient management planning by providing comprehensive nutrient management training. Partners: Conservation Districts, NRCS, NHDAMF, UNH Cooperative Extension, other partners
Measure A-1.1 Training seminar held and technical service providers certified and re-certified.
Milestone A-1.2 Promote agriculture BMPs, including wetlands BMPs, through training workshops on BMPs for Agriculture, 2019 Wetland Rules, and 2019 BMWPs for Agriculture. Partners: NHDAMF, NRCS, UNH Cooperative Extension
Measure A-1.2 Two training workshops held.
Milestone A-1.3 Continue to support education and technical assistance to agriculture operations, including small scale farmers to promote conservation and improve soil health. Partners: NHACD, NHDAMF, NRCS, UNH Cooperative Extension
Measure A-1.3 Outreach and technical assistance is provided and partners are engaged through one event each year.
Objective A-2 Implementation of agricultural best
Milestone A-2.1 Promote buffers on agricultural lands, including working buffers. Partners: Conservation Districts, NRCS, UNH Cooperative Extension
Measure A-2.1 Riparian buffers installed on 25 properties encompassing 50 acres.

42
management practices.
Milestone A-2.2 Increase the number of farms with nutrient management plans. Partners: Conservation Districts, NHDAMF, UNH Cooperative Extension
Measure A-2.2 15 new farms have nutrient management plans.
Milestone A-2.3 Encourage IPM practices Partners: NHACD, NHDAMF, NRCS, UNH Cooperative Extension
Measure A-2.3 Establish an IPM workgroup and identify opportunities for advancing IPM in New Hampshire
Objective A-3 Support conservation easements for Agriculture.
Milestone A-3.1 Promote farms or farmland parcels under agricultural easements. Partners: Land and Community Heritage Investment Program (LCHIP), NHDAMF, NH Farm Bureau, NRCS
Measure A-2.4 25 new Agricultural Land Easements (ALE) and Wetland Reserve Easements (WRE) encompassing 5,000 acres.

43
Objective A-4 Maximize funding opportunities through partnerships with USDA and local stakeholders to make the best use of available resources to address NPS pollution.
Milestone A-4.1 Identify barriers and opportunities for leveraging resources to protect and improve water quality in New Hampshire as it relates to agricultural activities. Partners: State Technical Committee Members
Measure A-4.1 Five presentations at State Technical Committee meetings.
Milestone A-4.2 Work with NRCS to develop an approved watershed assessment/management plan and provide monitoring support to measure effectiveness of BMPs and conservation efforts within one NWQI priority watershed. Partners: NRCS, watershed coalitions, conservancies, and commissions.
Measure A-4.2 One (a) through (i) watershed-based plan, or alternative watershed-based plan will be developed in a priority watershed, as defined by NWQI.

44
CHLORIDES AND WINTER ROAD MAINTENANCE
Chloride impairment is a statewide issue. As of 2018, there are currently 48 known chloride-impaired
waterbodies across New Hampshire, mostly concentrated in the southeastern region. In several
watersheds analyzed in the southern I-93 corridor, more than 50% of the road salt load comes from
private roads and parking lots. The other major sources are state and local roads and highways. To
address this issue and to reduce the amount of road salt and chloride entering waterbodies, NHDES and
affected communities have developed multi-year chloride reduction plans and employed BMPs to
improve efficiency in road salt use such that the least amount of road salt is used to ensure safe
conditions on surfaces traveled by pedestrians and vehicles in winter conditions.
Guided by RSA 489-C, NHDES began the Green SnowPro Program in November 2013. New Hampshire Certified Green SnowPros are leaders in the snow removal industry who are trained in the most up-to-date technologies and snow management practices. This ensures a high level of service and safety to their customers while improving water quality. The three goals of the program are to improve efficiency in salt use, such that the least amount of salt is used to ensure safe conditions on surfaces traveled by pedestrians and vehicles in winter conditions; reduce the amount of salt used by commercial applicators, as measured in tons of salt per acre, per year, over time while maintaining safe conditions for pedestrians and vehicles in winter conditions; and establish a voluntary system for commercial salt applicators to track their salt use and provide information annually to the salt accounting system. The program has expanded since its inception in 2013 and has gained traction with applicators, and the legal and insurance communities. Since its inception in 2013, NHDES and UNH’s T2 Center have hosted approximately 45 Green SnowPro Initial Trainings and 20 Green SnowPro Refresher Trainings. In 2017, a new course was introduced, The Power of Salt Brine, which has been presented five times. The increase in projected attendance in the coming years has NHDES hosting monthly trainings, moving forward. On June 1, 2018, the New Hampshire Code of Administrative Rules (Env-Wq 2200) was enacted and added new and revised language to the original rules. One of the most significant changes was the Incorporation of a fee-funded program. This fee structure will provide NHDES the capacity to better provide resources and guidance to the New Hampshire communities and certified salt applicators; the ultimate goal being the reduction of chloride while maintaining safe conditions on roadways, parking lots and sidewalks.
To date, the program has issued over 1,200 certifications to applicators across New Hampshire. NHDES saw an influx of applications in the 2017-2018 season, which required new resources and fine tuning of processes to accommodate the increase in volume. NHDES anticipates the number of certified applicators to continue to grow over the next several years.
Future initiatives include enhanced tracking capabilities, the creation of a reportable database,
expanded legislation to recognize municipal participation, and added marketing and outreach of the
program to existing and new markets.
In compliance with the provisions of the CWA and in accordance with the NPDES General Permit for
Stormwater Discharges from MS4, several New Hampshire communities are required to administer the
requirements pertaining to chloride contained within the permit. The permittee shall develop,
implement and enforce a written Stormwater Management Plan (SWMP). The SWMP is the document
used by the permittee to describe the activities and measures that will be implemented to meet the

45
terms and conditions of the permit. Four New Hampshire communities are subject to an approved TMDL
for chlorides. These permittees have two options in order to comply with the permit:
1. Develop a Chloride Reduction Plan that includes specific actions designed to achieve chloride
reduction on municipal roads and facilities, and on private facilities that drain to the MS4; or,
2. Work with NHDES to develop an Alternative Chloride Reduction Plan consistent with the
applicable TMDL.
In addition, there are an additional 16 communities that have discharges to water quality limited
impaired waterbodies where chloride is the cause of the impairment. These permittees must identify
and implement BMPs designed to reduce chloride discharges in the impaired catchment(s). To address
chloride discharges they must comply with the requirements outlined in the permit.
RESOURCES
Salt Applicator Certification Option (RSA 489-C)
NHDOT Salt Reduction Plan for I-93
NHDES Road Salt Reduction Program
UNH T2 Green SnowPro Trainings
NHDES Green SnowPro Trainings
Training Materials for Best Management Practices for Winter Road, Parking Lot, and Sidewalk
Maintenance
NHDES fact sheet WD-DWGB-22-30 Storage and Management of Deicing Materials
Final 2017 New Hampshire Small MS4 General Permit

46
CHLORIDES AND WINTER ROAD MAINTENANCE GOAL,
OBJECTIVES AND MILESTONES
Chlorides & Winter Road Maintenance (C) Goal. Reduce salt loading while maintaining the current level of services on public and private roads, driveways, sidewalks and parking lots.
Schedule
20
20
20
21
20
22
20
23
20
24
Objective Milestone Measure of Success
Objective C-1 New Hampshire commercial salt applicators are trained in winter road maintenance BMPs.
Milestone C-1 Voluntary commercial salt applicators are trained in winter maintenance BMPs each year. Partners: NHDES, UNH Technology Transfer Center
Measure C-1 500 new, voluntary, commercial salt applicators complete Green Snow Pro certification training within five years.
Objective C-2 Increased understanding of the amount of road salt applied in New Hampshire.
Milestone C-2.1 Increase the number of voluntary commercial salt applicators using the online salt accounting database by 2024. Partners: UNH Technology Transfer Center
Measure C-2.1a Reporting and recertification reminders sent annually.
Measure C-2.1b 80% of voluntary commercial salt applicators submit salt usage annual reports using the UNH online accounting database.
Milestone C-2.2 Analyze salt use/salt loading data received from NHDOT and I-93 corridor municipalities and compare to TMDL sector allocation, adjusted for weather severity. Partners: UNH Technology Transfer Program, NHDOT, I-93 Salt Reduction Work Group
Measure C-2.2a 80% of municipal salt applicators submit salt usage annual reports using the UNH online accounting database.
Measure C-2.2b Complete report of salt use data annually.

47
Objective C-3 Identify priority watersheds for chloride impairments.
Milestone C-3 Develop and incorporate priority list of salt reduction watersheds in NPS Management Program Plan by reference. Partners: NHDES Water Quality Section.
Measure C-3 Develop priority list of salt reduction watersheds.
Objective C-4 Educate Small MS4 communities and enable them to implement salt reduction BMPs.
Milestone C-4 Work with Small MS4 communities and assist with addressing chloride impairments, salt reduction and BMPs.
Measure C-4 Provide guidance and templates to the Small MS4 communities through the New Hampshire Stormwater Coalitions.
Objective C-5 Establish a voluntary municipal salt applicator program.
Milestone C-5 Create a voluntary municipal salt applicator program for New Hampshire municipalities and other governmental organizations that models the voluntary commercial salt applicator program. Partners: NHDES, UNH Technology Transfer Center and municipalities
Measure C-5a Create enabling legislation to implement the voluntary municipal salt applicator program in New Hampshire.
Measure C-5b Create rules and adopt in statute to implement the voluntary municipal salt applicator program.
Measure C-5c Promote the voluntary municipal salt applicator program.
Measure C-5d 50 new voluntary municipal salt applicators complete Green Snow Pro certification training within three years.

48
DEVELOPED LAND
According to the 2018 Draft Surface Water Quality Assessment and Listing Methodology (CALM)
completed by NHDES, stormwater runoff from developed lands (for instance, cities, residential
neighborhoods and other developed areas) contributes to approximately 90% of the water pollution
problems in New Hampshire (NHDES, 2019a). Pollutants are carried by stormwater and are a major
concern for water quality. For example, the Great Bay Nitrogen Nonpoint Source Study (NHDES, 2014a)
reports that stormwater runoff delivers 34% of the nitrogen load to Great Bay. Without adequately
addressing the existing problems associated with stormwater runoff across the state, additional
degradation of the state’s water resources is likely.
New Hampshire’s population is continuing to grow. The Southern New Hampshire Regional Planning
Commission (SNHRPC) estimates that the population in their region, which includes the city of
Manchester and 13 surrounding communities, will grow by over 45,000 residents by 2035 (SNHRPC, draft
2014). This increase in growth brings pressure to expand and improve housing, roads and services, and
inevitably increases impervious surfaces that prevent stormwater runoff from soaking into the ground.
The total New Hampshire state population is projected to be 1,432,730 in 2040, which is an increase of
116,260 or 8.8% from the 2010 documented Census population (NHRPC, 2016). In 2013, the UNH Survey
Center conducted a survey for New Hampshire’s nine Regional Planning Commissions (Granite State
Future, 2013). One of the key findings was that residents believed that environmental protection and
natural resource protection are a top priority for investing public dollars. Responses from the Southern
Region were largely representative to those respondents statewide.
New Hampshire’s population continues to grow and impervious surfaces are increasing. In the Piscataqua
Region watershed, for example, impervious surfaces have increased to 46,634 acres in 2015 (5.6% of the
land area) compared to 45,377 acres in 2010. Population increased by 6% in the watershed while
impervious surfaces increased by 2.7% between 2010 and 2015 (PREP, 2018). For every additional person
in the watershed, impervious surfaces increased 0.06 acres, however, impervious surfaces are not
increasing uniformly across the state. Statewide, land consumption, as measured by urbanized acres per
capita, increased from 0.24 to 0.31, for an increase of 29% during the 1990-2010 time period (Granite
State Future, 2013).
As New Hampshire communities accommodate this growth, the challenge of climate change impacts
compound problems caused by increased imperviousness. In southern New Hampshire, precipitation has
already increased 12-20% since 1970 and is expected to increase by an additional 15-20% by 2100.
Extreme precipitation events have increased dramatically and are expected to double by 2050. The
growing season has lengthened by two to four weeks, on average, and may get even longer (Wake, et al.,
2014).
Addressing stormwater runoff from developed lands requires a mix of regulatory and voluntary
programs. At the State level, the AoT Program specifies procedures and criteria to protect surface water
quality by controlling soil erosion, and managing, treating and recharging stormwater runoff from

49
development activities. In 2013, NHDES completed an analysis of 10 (four new-development and six
redevelopment) approved AoT projects in impaired watersheds using the Simple Method (NHDES, 2008b)
to compare pre- and post-construction pollutant loading estimates under the permitted conditions and
under an alternate condition using enhanced treatment. Summary observations include:
1. Pollutant loading estimates of new development projects, as permitted, showed an increase in
total suspended solids (TSS), total phosphorus (TP) and total nitrogen (TN). While some new
development projects had reductions in TSS as permitted, every new development project had
an estimated increase in nutrient loading in the permitted condition. A summary of the estimated
percent increase in pollutant load, and the highest increase at a single site, is summarized in
Table 7.
TABLE 7: SUMMARY OF POLLUTANT LOADING ESTIMATES FOR NEW DEVELOPMENT PROJECTS
PARAMETER ESTIMATED % INCREASE IN POLLUTANT LOAD HIGHEST ESTIMATED INCREASE IN LOADING
AT SINGLE SITE (POUNDS/YEAR)
TSS 26-70% 9,400
TP 22-440% 108
TN 22-115% 416
2. Even with enhanced treatment using best management practices with the highest pollutant
removal efficiencies, two out of four new development projects resulted in increases in nutrient
loading.
3. Redevelopment projects more easily achieved reductions in pollutant loading compared to new
development, with four of the six redevelopment projects achieving reductions in TSS, TP and TN,
as permitted. However, substantial additional reductions were estimated for additional
treatment and enhanced treatment for redevelopment projects.
It is important to note that pollutant loading models provide relative estimates with varying degrees of
accuracy. The results of this modeling exercise serve to inform the discussion on potential ways to
strengthen the AoT Program and assure that stormwater runoff from new and redevelopment projects in
New Hampshire is managed in a way that is protective of water quality.
While large-scale new and redevelopment projects are permitted at the state level, smaller disturbances,
such as individual lots and small subdivisions, are regulated at the local level. Each municipality has its
own set of regulations, procedures and criteria with regard to development and managing stormwater
runoff from developed sites. This lack of uniformity in the regulation of stormwater runoff at the
municipal level poses challenges for developers and contractors. In an attempt to increase uniformity, in
2008, NHDES and the Regional Planning Commissions created the Innovative Land Use Planning
Techniques: A Handbook for Sustainable Development, which includes, among other techniques, a model
ordinance for post-construction stormwater management.

50
Further encouraging regional approaches to local solutions, New Hampshire legislators passed enabling
legislation in 2009 to create the Southeast Watershed Alliance (SWA) to provide a framework for
watershed communities to work together to protect and restore their water resources. The SWA
encompasses all 42 upstream and downstream communities in the New Hampshire coastal watershed
and ten Maine coastal communities located within the Piscataqua and Salmon Falls River watersheds. In
2012, the SWA created the Model Stormwater Standards for Coastal Watershed Communities to again
increase uniformity in managing stormwater in coastal communities. As of July 2017, in the 42 New
Hampshire municipalities, eight communities have adopted the complete set of stormwater standards;
seven communities are in the process of adoption; five communities have partial or a different set of
standards; and 22 communities have not adopted standards. Ten neighboring Maine communities are
required to adhere to state-level stormwater management regulations. Zero communities have adopted
a stormwater utility (PREP, 2018).
Municipalities statewide are under increasing pressure to address water quality issues caused by
stormwater runoff, primarily through MS4 general permits administered by EPA under the National
Pollutant Discharge Elimination System (NPDES). In New Hampshire, there are three Small MS4 general
permits: 1) traditional cities and towns, 2) state, federal, county and other publicly owned properties
(non-traditional) and, 3) “State transportation agency (NHDOT).” EPA is the permitting authority for New
Hampshire. NHDES provides technical assistance to the Small MS4 entities in complying with the permit
requirements and works collaboratively with these communities and non-traditionals to address their
needs. Three stormwater coalitions have been formed in New Hampshire and encompass the region of
the designated Small MS4 areas, which include southern and southeastern New Hampshire. The
following New Hampshire stormwater coalitions are active and meet on a monthly basis: 1) Manchester
Stormwater Coalition, 2) Nashua Stormwater Coalition and, 3) Seacoast Stormwater Coalition.
Requirements are being met through these collaborative efforts and provide a more efficient and holistic
means of addressing New Hampshire’s water quality issues.
Addressing the Small MS4 requirements, and other stormwater related issues associated with land
development, is financially challenging for communities. The NHDES CWSRF loan program offers low
interest loans and Principal Forgiveness for projects relating to stormwater and nonpoint source issues.
The CWSRF is a federal-state partnership that provides communities with low-cost financing for a wide
range of water quality infrastructure projects.
While specific activities required by MS4 permits are outside the scope of Section 319 funds, regulatory
pressure may eventually drive stormwater utility development in New Hampshire, as it has where EPA’s
use of Residual Designation Authority under the MS4 program resulted in stormwater utilities in cities
and towns in Maine, Massachusetts and Vermont. Stormwater utilities would provide a means to collect
fees from residents and businesses and used for stormwater resource improvements and
implementation of BMPs. Stormwater utilities could provide resources to address the significant
stormwater infrastructure needs documented in the Clean Watershed Needs Survey. This survey,
completed in 2012, estimated the cost of managing effective municipal stormwater programs in New

51
Hampshire to be over $272 million (USEPA, 2012). The documented needs occur both in regulated MS4
areas and outside of MS4 areas.
Funding municipal stormwater infrastructure has been an ongoing challenge in New Hampshire.
Stormwater competes for funding with services like schools, fire and police, and drinking water. Across
the country and in surrounding states, stormwater utilities are increasingly becoming a resource to assist
municipalities with meeting costs to manage effective stormwater programs. Despite several attempts to
engage municipalities in exploring different stormwater funding mechanisms, no stormwater utilities
have been adopted in New Hampshire. Assistance efforts include:
In 2008 and 2009, the NHDES Watershed Assistance Grants Program provided funding for studies
in Manchester, Dover, Portsmouth and Nashua to determine the feasibility of stormwater utilities
as a funding source for their municipal stormwater programs. The results of the studies have
provided some important background information and lessons learned.
In 2008, RSA 149-I was adopted to enable municipalities to create municipal stormwater utilities.
In 2010, the New Hampshire Legislative Committee to Study Issues Related to Stormwater
recommended using “stormwater utilities as a means of providing the revenues, as well as the
incentives needed to facilitate implementation of stormwater management programs
statewide.” (HB1295, 2010)
In 2017, EPA Region 1, UNH Stormwater Center, NHDES, and other partners hosted the New
England Stormwater Finance Forum at UNH, Durham, NH.
NHDES, EPA Region 1, UNH Stormwater Center, New Hampshire Stormwater Coalitions
(Manchester & Nashua Regional and Seacoast Stormwater Coalitions), and Great Bay National
Research Reserve hosted and/or promoted several stormwater utility related workshops,
presentations and webinars.
Moving forward, it has also been recognized how changing precipitation patterns and coastal flooding are
causing additional stress on stormwater infrastructure for New Hampshire municipalities. In 2019, the
NHDES Coastal Program was awarded a NOAA Coastal Fellow and Project of Special Merit funding to help
identify a funding mechanism to address more resilient stormwater infrastructure needs. The project
title, Keeping New Hampshire Coast Afloat: Creative Financing and Policy Making for Resilient Coastal
Communities, will include materials research, stakeholders’ assessments, collaborative policy analysis,
local project support and workshops related to supporting stormwater and resilience fees. WAS staff will
be working closely with the Coastal Program to implement this effort.
In 2012, WAS initiated the Soak Up the Rain New Hampshire (SOAKNH) program, with the goal of
reducing stormwater runoff and associated pollutants from residential and small business properties. The
program is based on the NHDES 2012 publication New Hampshire Homeowner’s Guide to Stormwater
Management Do-It-Yourself Stormwater Solutions for Your Home which will be updated in 2020 (NHDES,
2016). This statewide, voluntary program, works through outreach and education, technical assistance,
and capacity- and partnership building. To date the program has:
Presented to more than 30 different groups such as watershed/lake associations and at events
and conferences.

52
Formed more than 20 partnerships with various levels of involvement.
Assisted in installing 27 residential BMPs, including 13 rain gardens, which capture more than
805,000 gallons of runoff per year.
WAS has been working, and will continue to work, collaboratively and holistically with partners to
manage stormwater from newly developed and redeveloped properties. These measures include
education and outreach, training opportunities, social media resources, source controls, design
techniques, structural practices and construction practices designed to minimize adverse hydrologic and
water quality impacts to New Hampshire’s landscapes.
RESOURCES
New Hampshire Alteration of Terrain Permit Program (RSA 485-A:17)
New Hampshire Alteration of Terrain Permit Program (Env-Wq 1500)
EPA National Pollutant Discharge Elimination System Programs
New Hampshire Rivers Management and Protection Program
New Hampshire 401 Water Quality Certification
Soak Up the Rain New Hampshire
New Hampshire Stormwater Coalitions
New Hampshire Stormwater Manual
Innovative Land Use Planning Techniques: A Handbook for Sustainable Development (WD-08-19)
Section 2.1 Permanent (Post-Construction) Stormwater Management
Model Stormwater Standards for Coastal Watershed Communities
Model Stormwater Standards for Coastal Watershed Communities, 2017
New Hampshire Small MS4 General Permit

53
DEVELOPED LAND GOAL, OBJECTIVES AND MILESTONES
Developed Land (DL) Goal. Runoff from developed lands is managed in such a way that water quality is not degraded.
Schedule
20
20
20
21
20
22
20
23
20
24
Objective Milestone Measure of Success
Objective DL-1 NPS Program partners understand the costs associated with managing stormwater from developed lands.
Milestone DL-1.1 The need for sustainable funding of equitable stormwater programs is understood and supported. Partners: NHDES, Legislators, municipalities, New Hampshire Municipal Association, New Hampshire Stormwater Coalitions, NHDES Coastal Program, UNH Stormwater Center and Piscataqua Region Estuaries Partnership
Measure DL-1.1 Work with NOAA Fellow to convene steering committee to conduct surveys and research regarding the formation of a stormwater utility. Hold stormwater funding roundtables, including steering committee members and stakeholders. Report on progress annually.
Milestone DL-1.2 Federal, state and local decision makers understand New Hampshire's stormwater capital needs and associated costs, and identify potential funding sources. Partners: NHDES, municipalities, New Hampshire Stormwater Coalitions
Measure DL-1.2 Identify potential funding sources as they become available and provide announcements to municipalities regarding viable sources.

54
Milestone DL-1.3 The CWSRF Asset Management loans with Principal Forgiveness are used for the development of an Asset Management Program for municipalities. Partners: NHDES, municipalities, New Hampshire Stormwater Coalitions
Measure DL-1.3 At least four CWSRF Asset Management loans are awarded to New Hampshire municipalities specific to stormwater assets.
Objective DL-2 NPS Program partners have access to an array of funding opportunities to implement stormwater-related projects.
Milestone DL-2.1 The 604(b) Planning Grants are used for NPS and stormwater-related planning projects. Partners: NHDES, Regional Planning Commissions
Measure DL-2.1 At least one 604(b) grant is awarded to NPS and stormwater-related planning projects every year.
Milestone DL-2.2 Municipalities pursue the development of individual or regional stormwater utilities in New Hampshire to provide adequate, diverse and sustainable funding of equitable stormwater programs. Partners: NHDES, legislators, municipalities, New Hampshire Stormwater Coalitions, NHDES Coastal Program, UNH Stormwater Center
Measure DL-2.2 Provide assistance to municipalities to complete at least one new stormwater utility feasibility study.
Milestone DL-2.3 The CWSRF is used to fund NPS and stormwater projects in New Hampshire. Partners: NHDES CWSRF Program, New Hampshire municipalities, New Hampshire Stormwater Coalitions
Measure DL-2.3a Meet at least once annually with the NHDES Grants Management Section to identify barriers of the CWSRF funds, and work creatively to increase opportunities for stormwater and nonpoint source projects.
Measure DL-2.3b Annual announcement made to New Hampshire Stormwater Coalitions and other New Hampshire municipalities to promote stormwater projects for CWSRF applications.

55
Measure DL-2.3c Priority NPS and stormwater, stormwater asset management, stormwater planning and stormwater resiliency planning CWSRF projects are awarded loans.
Milestone DL-2.4 EPA 319 grants are used for nonpoint source and stormwater projects that protect or restore water quality in New Hampshire. Partners: New Hampshire municipalities, regional planning commissions, nonprofit organizations, county conservation districts, state agencies, watershed associations, water suppliers, LACs.
Measure DL-2.4 At least three priority NPS and stormwater projects that protect or restore water quality are awarded grants every year.
Objective DL-3 State and local regulatory programs are more fully protective of water quality and minimize the stormwater impacts from developed lands.
Milestone DL-3.1 Determine whether changes are needed to the AoT Rules (Env-Wq 1500) for the 2017 rules re-adoption to improve water quality protection and climate change preparedness through AoT permits. Partners: NHDES, NHDES AoT Bureau , New Hampshire Chapter of American Council of Engineering Companies, UNH Stormwater Center.
Measure DL-3.1 Determination of need for AoT rules containing NPS recommendations, including whether the 1-hour or 10-hour storms should be addressed in design criteria to prevent erosion from more intense, shorter duration storm events.
Milestone DL-3.2 Work with the AoT Bureau to draft redevelopment rules using the Southeast Watershed Alliance's 3-phase criteria as a model. Partners: NHDES, NHDES AoT Bureau, Southeast Watershed Alliance, UNH Stormwater Center
Measure DL-3.2 Progress toward completion of AoT redevelopment rules.
Milestone DL-3.3 Update and promote Post Construction Stormwater Management Standards for Site Plan Review Regulations Partners: Regional Planning Commissions, NHDES AoT Bureau, UNH Stormwater Center, Southeast Watershed Alliance
Measure DL-3.3 Document updated and published.

56
Objective DL-4 Professional engineers, state and local regulators, and regulated entities have an improved understanding of how stormwater BMPs function and perform over the long term.
Milestone DL-4.1 Research and determine the appropriateness of using continuous simulation precipitation modeling, as opposed to event-based modeling, to design stormwater practices. Partners: NHDES AoT Bureau, New Hampshire Municipal Association members, New Hampshire Chapter of American Council of Engineering Companies, UNH Stormwater Center.
Measure DL-4.1 Concept memo describing potential approaches for model development and use.
Milestone DL-4.2 Update or amend the New Hampshire Stormwater Manual Volumes 1-3 to reflect the new science and understanding of stormwater management, system design, installation and maintenance, as well as regulatory changes. Partners: NHDES AoT Bureau
Measure DL-4.2 Update or amend New Hampshire Stormwater Manual, Volumes 1-3 published.
Milestone DL-4.3 Encourage use of methods as described in Appendix F of the 2017 New Hampshire Small MS4 General Permit to calculate phosphorus and nitrogen load reduction credits for structural and non-structural BMPs. Partners: NHDES AoT Bureau, CWSRF Program, and ARM Program; UNH Stormwater Center, municipalities and watershed groups
Measure DL-4.3 BMP implementation activities are credited using methods outlined in the 2017 New Hampshire Small MS4 General Permit
Milestone DL-4.4 Promote tracking and accounting of NPS implementation activities thought the Great Bay Pollution Tracking and Accounting Project (PTAP). Encourage use and adoption of PTAP for municipalities beyond the Great Bay watershed. Partners: UNH Stormwater Center and municipalities
Measure DL-4.4 Municipalities use the PTAP database to track implementation and quantify performance of NPS implementation activities.

57
Milestone DL-4.5 Promote and encourage use of coastal watershed pollution hot spot maps for use in planning and implementing cost effective NPS controls. Encourage use of hot spot mapping methods for other regions of the state. Partners: UNH Stormwater Center, NH GRANIT, Regional Planning Commissions, municipalities and watershed groups
Measure DL-4.5 42 pollution hot spot maps are produced; regional and municipal partners use maps to plan and implement NPS management actions.
Milestone DL-4.6 Update the Innovative Land Use Planning Techniques: A Handbook for Sustainable Development based on new technologies, regulations and information. Partners: NHDES, New Hampshire Association of Regional Planning Commissions, New Hampshire Local Government Center, municipalities
Measure DL-4.6 Update and publish Innovative Land Use Planning Techniques document.
Objective DL-5 Stormwater BMPs are adequately maintained and continue to function through their intended design life.
Milestone DL-5.1 Request and review maintenance records from completed AoT permitted projects to determine effectiveness of a general adherence to maintenance conditions. Partners: NHDES AoT Bureau
Measure DL-5.1 Compilation of a subset of maintenance records and summary report of findings each year.

58
Milestone DL-5.2 Survey municipalities to determine if they currently require that maintenance records be kept for locally permitted projects. Encourage municipalities to request maintenance records for completed, locally permitted projects to determine compliance with maintenance conditions. Partners: NHDES AoT Bureau, New Hampshire Municipal Association members, New Hampshire Chapter of American Council of Engineering Companies, UNH Stormwater Center
Measure DL-5.2 List of municipalities that require maintenance records. Completed maintenance inspection/reporting recommendations for municipalities.
Milestone DL-5.3 Provide hands-on training and technical assistance to municipal public works staff and professional landscapers on the installation and maintenance of low-impact development stormwater practices. Partners: New Hampshire Municipal Association members, UNH Stormwater Center, New Hampshire Landscape Association, UNH Cooperative Extension, New Hampshire Sea Grant, NHDES
Measure DL-5.3 One training every other year.
Objective DL-6 New Hampshire residents understand the connection between land use and water quality, and have access to resources to help manage stormwater on their properties.
Milestone DL-6.1 Provide resources to local organizations interested in participating in SOAKNH. Partners: NHDES
Measure DL-6.1 SOAKNH resources are updated and made available through a variety of print and social media.
Milestone DL-6.2 Work with local organizations to build capacity to create local SOAK groups who work in their communities to spread the “soak up the rain” message and install BMPs. Partners: NHDES, SOAKNH Program-eligible organizations
Measure DL-6.2 At least one new local watershed group is engaged each year.
Milestone DL-6.3 Site level best management practices are installed through the SOAKNH program. Partners: NHDES, SOAKNH-eligible organizations
Measure DL-6.3 At least one BMP installation completed each year. Installation information including location and pollutant loading estimates are reported on the SOAKNH website and in the NPS Annual Report.

59

60
HYDROLOGIC AND HABITAT MODIFICATION
BACKGROUND
The management of rivers and streams in New Hampshire has deep historic roots due to persistent
human use of these resources for transportation, food, water, power and waste disposal. The benefits
provided by flowing waters brought human development to the banks of rivers, and caused conflicts
between humans and natural forces in river corridors and their floodplains. Evidence of these conflicts
are most noticeable on the valley floors and floodplains of large river basins where river channels were
physically moved and straightened across entire valleys to make room for agriculture, transportation
and housing. Early management of river channels often worked against natural river processes. When
trying to treat a problem in this manner, the typical end result is that the problem gets worse. This has
led to costly, long-term commitments to managing rivers in addition to increased risk to public and
private infrastructure. In New Hampshire and much of the northeast United States, historic changes to
river and stream corridors disrupted natural form and processes, and often lead to increased channel
instability, reduced water quality and the impairment of aquatic habitat.
There is a growing movement of managing and restoring rivers to return natural processes whenever
and wherever possible within the context and limitations of the current watershed condition (build-out).
As river restoration project planning has evolved, so to have the principals of design. Scientists and
community-based restoration and protection groups are coming together to try and move towards
standard design methodologies and monitoring protocols. Every project is different, yet standardization
of design protocols, based on problem identification, river type, corridor condition, watershed
characteristics and project objectives, advances the practice of river restoration toward a truly natural-
process approach.
New Hampshire is fortunate to have a strong river restoration community that thrives on networking,
sharing expertise and experiences, and partnering resources to address centuries-old impacts to river
and stream form and function. The NPS Management Program has been, and continues to be, an
important partner and leader in New Hampshire river and stream protection and restoration. This is only
possible with the support from an outstanding network of both external and internal fluvial
geomorphologists, natural stream channel design experts, fisheries specialists, NHDES Dam Bureau
personnel, wetland scientists, professional engineers who specialize in stream and river restoration
project design, permitting, and construction, and various nonprofit organizations throughout the state
and region dedicated to the protection and restoration of natural resources. This network of committed
river restoration professionals has been integral in generating two of the largest river restoration and
stabilization projects in New Hampshire history, multiple river and stream restoration projects through
selective dam removal, and a wide array of landmark stream crossing improvement, stream daylighting,
and natural channel design and bioengineering applications throughout the state. Hydrologic and
habitat restoration efforts supported by the NPS Management Program have restored aquatic organism
passage, enabled mobile wood additions, and re-connected tributary and river channels with
abandoned floodplains in the Nash Stream watershed. NPS Management Program staff and

61
stakeholders responded to devastating floods and their impacts in the Cold River and Suncook River
watersheds, where implementing in-stream and floodplain restoration goals while simultaneously
ensuring the safety of the traveling public were key drivers influencing design, permitting and
construction. Improving habitat and restoring stream quality for native populations of eastern brook
trout in the heavily urbanized McQuesten Brook watershed in Manchester, NH, and daylighting entire
segments of Berry Brook from closed drainage pipes in Dover, NH, are other successful examples of
natural systems and built-out landscape conflict resolution. Perhaps the most dramatic examples of
successful hydrologic and habitat modification restoration successes in New Hampshire are associated
with selective dam removal project sites. Although considered some of the most complex and
controversial environmental restoration projects to undertake, river and stream restoration projects
through selective dam removal have yielded multiple NPS success stories in New Hampshire. The NPS
Management Program and its network of river practitioners have become leaders in the region relative
to addressing hydromodification and habitat impacts upon 17,000 river and stream miles. Much work
remains to be done and it can only be accomplished with the continued support of committed stream
and river restoration professionals from other federal and state agencies, nonprofit organizations and
individual property owners who are dedicated to protect, restore and understand the impacts of human
activities that alter hydrology and habitat.
RIVERS
One of those partners is the New Hampshire Rivers Management and Protection Program (RMPP). The
RMPP was established in 1988 with the passage of RSA-483 to protect certain rivers, called designated
rivers, for their outstanding natural and cultural resources, and provide a forum to balance the
competing uses of the state’s rivers. Currently, there are over 1,000 miles of designated rivers, spanning
125 communities and five unincorporated places and state parks. Twenty-two Local River Management
Advisory Committees (LAC), made up of over 200 volunteers, are charged with developing local river
corridor management plans and reviewing and commenting on activities affecting the river, including
alteration of terrain, wetlands, shoreland, underground storage tank and pesticide permit applications.
LAC members also review and comment on FERC relicensing processes, and provide valuable outreach
and education services to their communities. In many cases, LACs are the first point of contact for
community members who notice unusual stormwater discharges into a stream or lake, or who are
concerned about erosion and stormwater runoff.
One aspect of the RMPP is the Instream Flow Program, which is designed to ensure that designated
rivers continue to flow during periods of drought in order to support the habitat needs of fish and
wildlife while also supplying water for drinking, agriculture, industry and recreation. Protected instream
flows are developed for each river that reflect the critical magnitude, timing, duration and frequency of
flows necessary for the most sensitive uses of the river. Once protected flows are defined, state agency
staff work with water users to ensure that critical water needs are met for both humans and wildlife.
One of the benefits of the Instream Flow Program is ensuring that water is always available in New
Hampshire’s rivers to dilute any NPS pollution that may occur.

62
WETLANDS AND SHORELAND
The Shoreland Water Quality Protection Act (SWQPA) was enacted in 1991 and established minimum
standards for the subdivision, use and development of shorelands adjacent to the state's public water
bodies. On July 1, 2005, Senate Bill 83 established a commission to study its effectiveness. In 2008, as a
result of the commission’s recommendations, several changes were made, including limits on
impervious surfaces, limitations on the removal of vegetation in water front buffers, shoreland
protection along rivers designated under RSA 483 (Designated Rivers), and the establishment of a permit
requirement for many new construction, excavation and filling activities within the Protected Shoreland.
During the 2011 legislative session, changes to vegetation requirements within the natural woodland
and waterfront buffers, the impervious surface limitations and a new shoreland permit by notification
process were included within the SWQPA.
In March 2004, the NHDES Wetlands Bureau adopted a set of mitigation rules that establish what is
necessary for an applicant to provide for wetland compensation. The rules spell out ratios for wetland
creation, restoration and upland preservation, relative to the type of wetland lost through the proposed
development. During the 2006 legislative session, the General Court enacted Senate Bill 140, known as
Aquatic Resource Mitigation (ARM). The law became effective on August 18, 2006 and NHDES adopted
rules for operation of a wetland mitigation fund on June 20, 2007.
In lieu of the traditional forms of mitigation, NHDES adopted a payment option for applicants unable to
find other meaningful mitigation. The ARM Fund provides wetland permit applicants the opportunity to
make a payment into a watershed account; payments are aggregated on a watershed basis and are then
disbursed to significant restoration or land conservation projects through a competitive application
process. The ARM Fund program has been very helpful for permit applicants and has resulted in many
significant wetland preservation and restoration projects across the state.
The NPS Management Program and sub-grantees have leveraged ARM resources on several occasions,
implementing comprehensive restoration projects to address severe degradation of aquatic and
shoreland habitats within scopes of work defined in Watershed Assistance Grant project areas. Several
of these projects have led to the removal of existing impairments and NPS success stories.
STREAM CROSSINGS AND FLOODING
The New Hampshire Geological Survey (NHGS) at NHDES houses a Flood and Geologic Hazards Program.
A key component of the program is stream crossing (culvert) assessments, as data derived from these
assessments can inform watershed-based planning and restoration prioritization efforts. Stream
crossing protocols have been developed for New Hampshire through the New Hampshire Stream
Crossing Initiative, a five-agency cooperative project. For each assessed crossing, final datasets are run
through a geomorphic compatibility tool, which provides guidance on crossings that are not fully
compatible with river and stream processes, and an aquatic organism passage compatibility tool, which
identifies crossings that are partially or completely incapable of aquatic species passage. Additionally,
NHGS, with multiple state partners, evaluates assessed culverts for hydraulic vulnerability, or the ability

63
of a culvert to pass a range of predicted flows. All of these data and outputs are available publicly in the
Aquatic Resource Mitigation mapper, which can be found on the NHDES website. The New Hampshire
Stream Crossing Initiative Field Manual specifies a total of six photographs be collected at each stream
crossing, including the bed and banks upstream and downstream. Given the number of crossings
assessed statewide, this provides a robust photographic library of the rivers and streams of New
Hampshire that can serve as a resource for a variety of stream diagnostic and restoration purposes.
Crossings, typically culverts, that are not fully compatible geomorphologically are those that are
undersized compared to the river or stream channel that enters them, or have an entry angle not
aligned with the stream. Hydraulic vulnerability evaluations identify culverts that are predicted to
overtop the roadway above the culvert during high-flow events. These types of geomorphologic and
hydraulic situations can cause water and sediment backup during flood events, increasing the risk of
culvert failures and downstream erosion hazards.
RIVER AND STREAM RESTORATION THROUGH SELECTIVE DAM REMOVAL
The New Hampshire River Restoration Task Force, formed in 2000, explores opportunities to selectively
remove dams for a variety of reasons, most notably for the purposes of restoring rivers and eliminating
public safety hazards. The NPS Management Program works directly with the NHDES Dam Bureau River
Restoration Coordinator, consultants, nonprofit organizations and river stakeholders to determine the
feasibility of restoring priority river segments throughout the state by removing existing barriers. A list
of priority river restoration and barrier removal sites, and the priority criteria behind development of
this list, are discussed in the Priority Watersheds section of this Plan.
According to the preliminary 2018 NHDES Water Quality Assessment, impoundments caused 41 water
quality impairments, including those for dissolved oxygen and chlorophyll-a. Many of these dams no
longer serve the purpose for which they were originally constructed. Often, dam regulations necessitate
costly infrastructure and safety-related repairs that dam owners weigh against the diminishing benefits
of owning and operating the dam, along with the liability inherent with being a dam owner. Dam
removal often becomes an appealing option that can reduce risk and liability, restore designated uses to
surface waters that were previously impaired, result in NPS success stories, and eliminate what can
often become a long-term economic and liability burden for the dam owner.
CLIMATE CHANGE, RESILIENCE AND SEA-LEVEL RISE
It continues to be important to recognize and adapt to existing and anticipated climate change impacts
on river, estuarine and coastal habitats (including wetlands), resulting from more frequent and intense
rain events. In New Hampshire coastal communities, the water quality impacts from sea-level rise, and
associated groundwater rise, become more evident with each passing year. Coastal resource experts
continue to document the existing and predicted changes to hydrology and habitats (salt marsh
migration and conversion to mudflats as well as freshwater wetlands emerging due to rising
groundwater) associated with sea-level rise. Existing regulations in New Hampshire are likely inadequate
to handle the increases in rainfall amounts and extreme precipitation events. It is necessary to begin

64
thinking about adaptation strategies. For instance, replacement of culverts with full, channel-spanning
bridges; dam removals; or installation of living shorelines and nature-based shoreline management can
be incorporated into state and municipal regulations, policies and programs.
One of the groups that worked to develop adaptation strategies was the New Hampshire Coastal Risk
and Hazards Commission. Established by legislation in 2013, the Commission helped coastal
communities and the State prepare for projected sea-level rise and other coastal watershed hazards. In
addition, Sea-Level Affecting Marsh Migration models were run for the coastal watershed, which
provide additional information about how sea-level rise may impact estuarine river systems and their
marsh systems. The Commission completed its work in 2016 with the publication of the Preparing New
Hampshire for Projected Storm Surge, Sea-Level Rise, and Extreme Precipitation Final Report and
Recommendations. An audit of NHDES rules and regulations was completed in 2018 to determine and
recommend needed rule changes. Recommendations generated from the audit are intended to enable
NHDES to better manage the precipitation and sea-level rise challenges mentioned in the Final Report.
Recommendations are specific for coastal areas but many apply statewide.
Another major effort to address sea-level rise and resiliency in the coastal watersheds of New
Hampshire is the NHDES Coastal Program’s Resilient Tidal Crossings Initiative. In 2018, the NHDES
Coastal Program and its partners assessed all known tidal crossings in New Hampshire’s 17 coastal
communities, in accordance with the New Hampshire Tidal Crossing Assessment Protocol. Tidal crossing
assessment data were used to rank and prioritize sites based upon structure condition, flood risk and
ecosystem health. The Resilient Tidal Crossings New Hampshire project was designed to better enable
community officials and road managers to enact the strategic repair or replacement of tidal crossing
infrastructure, and to identify high-priority restoration and conservation opportunities at tidal crossing
sites.
In addition to tidal crossing impacts and strategies to repair, replace or remove them, increasing erosion
and inundation of coastal wetlands due to sea-level rise and storms continues to threaten property and
natural resources in New Hampshire. Historic shoreline stabilization practices of rip rap, revetments and
seawalls can actually make erosion worse, destroy intertidal habitat and alter sediment transport
patterns. For these reasons, hard structural solutions are either the least preferred alternative or
prohibited in sensitive coastal areas. In suitable areas, living shorelines present a resilient approach to
shoreline stabilization that can protect people, property and important coastal habitats.
The NHDES Coastal Program is working with partner organizations to advance understanding,
application and success of living shoreline stabilization approaches in coastal New Hampshire. Several
initiatives and support networks have been established by the NHDES Coastal Program to inform and
support stakeholders interested in design and implementation of living shorelines in New Hampshire.
It is critical to consider the environmental permitting aspects associated with any proposed construction
activities associated with jurisdictional wetlands in New Hampshire. The New Hampshire Joint
Legislative Committee on Administrative Rules issued final approval of new wetland rules on May 17,

65
2019. This approval was the culmination of a significant, multiyear initiative to improve the technical
review standards and decision-making processes of the NHDES Wetlands Bureau through consensus-
based rulemaking, while ensuring consistency with New Hampshire’s wetlands statute and NHDES’
mission. The initiative engaged a variety of groups and individuals with diverse interest in wetlands
rules, including the Associated General Contractors, Local River Advisory Committees (LACs), The Nature
Conservancy, New Hampshire Association of Conservation Commissions, New Hampshire Association of
Natural Resource Scientists, New Hampshire Farm Bureau, New Hampshire Timberland Owners
Association, utility providers, and New Hampshire state agencies such as NHFG, NHDOT, and the
Department of Natural and Cultural Resources. NHDES activities included substantial outreach,
numerous public meetings, several rulemaking hearings, and response to 2,000 comments on the draft
rules. The new wetland rules will become effective December 15, 2019.
Resources
New Hampshire Rivers Management and Protection Program (RSA 483)
Designated River Nomination Rules (Env-Wq 1800)
Instream Flow Rules (Env-Wq 1900)
Shoreland Water Quality Protection Act (RSA 483-B)
Shoreland Protection Administrative Rules (Env-Wq 1400)
Stream Crossings Administrative Rules (Env-Wt 900)
Aquatic Resource Compensatory Mitigation (RSA 482-A:29)
Innovative Land Use Planning Techniques: A Handbook for Sustainable Development (WD-08-
19), Section 2.4 - Wetland Protection, Section 2.6 - Shoreland Protection and Section 2.7 - Fluvial
Erosion Hazard Area Planning
A Guide to River Nominations (WD-17-01)
Report of the Instream Flow Pilot Program (WD-15-1)
Shoreland Water Quality Protection Act, A Summary of the Minimum Standards
Generic Quality Assurance Project Plan for Fluvial Geomorphology Data Collection – on file with
the NHDES Geological Survey
Generic Quality Assurance Project Plan for Stream Crossing Assessment Data Collection (2017) –
on file with the NHDES Geological Survey
Guidelines for Naturalized River Channel Design and Bank Stabilization
White Paper – River Restoration and Fluvial Geomorphology

66
HYDROLOGIC AND HABITAT MODIFICATION GOAL, OBJECTIVES
AND MILESTONES Hydrologic and Habitat Modification (H) Goal. The NPS program works with partners to identify, prioritize and implement projects such as living shorelines, culvert upgrades, and dam removal/stream and river restoration to address hydrologic and habitat modification.
Schedule
20
20
20
21
20
22
20
23
20
24
Objective Milestone Measure of Success
Objective H-1 Living shorelines (LS) NPS program develops partnerships and capacity to implement living shoreline projects to address hydrologic and habitat modification.
Milestone H-1.1 Build NPS program capacity for living shoreline projects. NPS program staff develop understanding of living shoreline concepts, current state-of-the-science, existing regional partnerships and on-going local efforts to identify, prioritize and implement living shoreline projects. Partners: NHDES Coastal Program, NHDES Land Resources Management, NHFG
Measures of Success H-1.1 NPS program staff participate in workshops, conferences, living shoreline site tours and partner meetings to learn about living shoreline work. A framework for NPS living shoreline project partnerships is developed.
Milestone H-1.2 Identify and prioritize living shoreline projects for NPS funding. NPS program partners identify potential living shoreline projects for funding and implementation through NPS program grants. Partners: NHDES Coastal Program, NHFG, NOAA Office for Coastal Management, UNH Coastal Habitats Restoration Team
Measures of Success H-1.2 A list of potential priority living shoreline projects and partners for NPS funding is developed.

67
Milestone H-1.3 Implement living shoreline project(s). A proposal for NPS funding to implement at least one priority living shoreline project with project partners is submitted for funding and the project is implemented. Partners: NHDES Coastal Program, NHDES Land Resources Management, NHFG, UNH Coastal Habitats Restoration Team
Measures of Success H-1.3 A living shoreline proposal for NPS funding is developed and submitted.
Measures of Success H-1.4 If application is selected for NPS funding, the project is implemented and a final report of living shoreline project implementation is on file and available as reference for future NPS living shoreline projects.
Objective H-2 Stream crossings that do not meet geomorphic integrity thresholds or AOP criteria, are identified within watershed-based plans.
Milestone H-2.1 Tidal crossings are identified and considered for NPS program funding. Work with regional partners to review existing tidal crossing data, plans and priorities to identify potential priority tidal crossings for replacement funding. Partners: NHDES Coastal Program, NHDES Geological Survey, NHDES Land Resources Management, NHFG
Measures of Success H-2.1 NPS program partners develop partnership and application for NPS funding to replace at least two priority tidal crossings.
Measures of Success H-2.2 A tidal crossing project is submitted and selected for WAG NPS project funding. The project is implemented and a final report is submitted to the NPS Management Program.

68
Milestone H-2.2 Freshwater stream crossings not meeting geomorphic or AOP thresholds are identified and prioritized for restoration efforts within watershed-based plans or geomorphic assessments performed at the watershed scale. Partners: NHDES Coastal Program, Great Bay Stewards, NHDES Geological Survey, watershed organizations, municipalities, NHDOT, The Nature Conservancy
Measures of Success H-2.3 The NHDES Stream Crossing Assessment Protocols are fully executed in at least one freshwater watershed undergoing development of a watershed-based plan. Protocol results are then used to develop a priority ranking for culverts, barriers and stream crossings within the watershed in need of removal or upgrade to improve geomorphic equilibrium and/or AOP.
Milestone H-2.3 New Hampshire NPS Management Program staff become members of the New Hampshire State Stream Crossing Steering Team to become certified stream crossing professionals recognized by the NHDES Geological Survey. Partners: NHDES Geological Survey, NHFG, NHDOT, Trout Unlimited, U.S. Forest Service
Measures of Success H-2.3 One or more New Hampshire NPS Management Program staff are actively serving on the New Hampshire State Stream Crossing Steering Team. The required equipment (iPads, software, topographical survey equipment, etc.) has been procured and utilized to generate stream crossing assessment data suitable for incorporation into the New Hampshire Statewide Asset Data Exchange System.
Objective H-3 Barrier and dam removals in New Hampshire result in NPS Success Stories.
Milestone H-3.1 Freshwater and tidal barriers that co-occur with impoundments on the 303(d) list have Feasibility Studies completed or are identified within a watershed-based plan as a priority action item. Partners: New Hampshire River Restoration Task Force, NHDES Geological Survey, NHDES Dam Bureau, NHDES Water Quality Section, dam owners, NHFG
Measures of Success H-3.1 At least one barrier removal project receiving partial funding from the NPS Program generates restoration of designated uses and an EPA-approved NPS Success Story that documents a fully or partially restored waterbody. See Milestone CW-3.3.
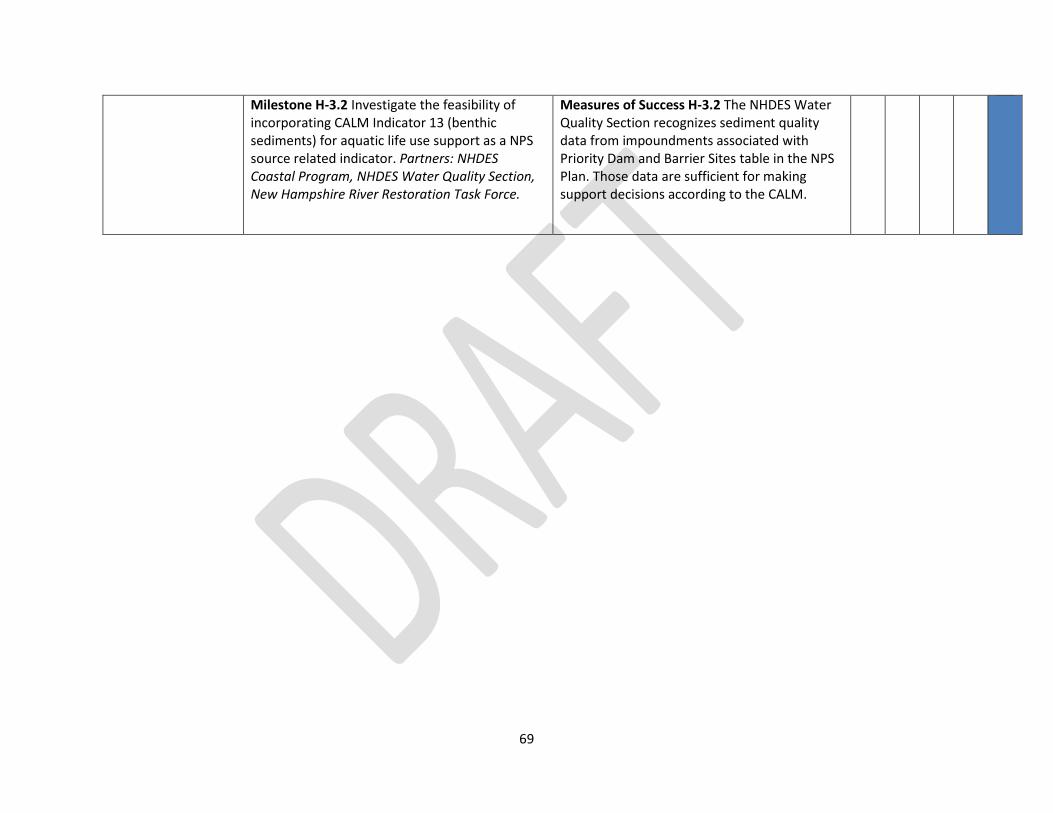
69
Milestone H-3.2 Investigate the feasibility of incorporating CALM Indicator 13 (benthic sediments) for aquatic life use support as a NPS source related indicator. Partners: NHDES Coastal Program, NHDES Water Quality Section, New Hampshire River Restoration Task Force.
Measures of Success H-3.2 The NHDES Water Quality Section recognizes sediment quality data from impoundments associated with Priority Dam and Barrier Sites table in the NPS Plan. Those data are sufficient for making support decisions according to the CALM.

70
LAWNS AND TURF GRASS MANAGEMENT
Turf grass – the lawn making up our yards, recreation fields and other landscapes – is the largest “crop”
in the United States. It is estimated there are between 225,600 and 330,900 acres of turf, including
lawns, municipal fields and golf courses, in New Hampshire, which would cover between 3.8-5.5% of the
state (Milesi, et al., 2005). Therefore, another important part of protecting and restoring water quality in
New Hampshire is proper management of lawns and turf grass areas. Thoughtful fertilizer use is a key
component, given that fertilizer use on turf grass is a source of nitrogen and phosphorus to New
Hampshire waters, and both fresh and salt waterbodies are showing signs of excessive nutrient inputs.
Further components include ongoing education efforts and guidance for communities wishing to
establish turf management guidelines.
Plants will not absorb more phosphorus and nitrogen than they can use. Soil and soil microbes actively
absorb and recycle nutrients in the root zone, but excessive amounts of nutrients can be carried by
stormwater into nearby waterbodies. Excess phosphorus is of primary concern in New Hampshire’s
freshwater lakes and rivers, while excess nitrogen is of primary concern because it has adversely
impacted salt water systems, including estuaries like Great Bay on New Hampshire’s seacoast.
NHDES VLAP data from 1990 through 2017 (NHDES, 2019d) show stable median total phosphorus and
chlorophyll-a levels, and a decrease in transparency in New Hampshire lakes. In 2009, NHDES published
a Lake Nutrient Assessment Study that determined upper thresholds for chlorophyll-a and phosphorus
by trophic class using data from 233 lakes in New Hampshire. In the 2018 305(b)/303(d) assessment,
(NHDES, 2019a) 65 of the 256 lakes that have current data are considered impaired for aquatic life due
to elevated concentrations of chlorophyll-a and phosphorus.
Total annual nitrogen load to the Great Bay Estuary from 2009-2011 was 1,225 tons (PREP, 2013). There
is currently no clear trend for total nitrogen in the Great Bay Estuary (NHDES, 2019c). However, parts of
the Estuary are exhibiting classic symptoms of too much nitrogen, such as low dissolved oxygen,
macroalgae blooms and declining eelgrass. Between 1974 and 2011, data indicate a significant overall
increasing trend for dissolved inorganic nitrogen at Adams Point, which is of concern (PREP, 2013).
The GBNNPSS report (NHDES, 2014a) details the following regarding delivered loads of nitrogen to Great
Bay Estuary:
Chemical fertilizer contributed 15% of the total NPS load, or 110-150 tons of nitrogen per year.
Lawns contributed 70% of the chemical fertilizer load, or about 10.5% of the total NPS load.
Recreational fields, including golf courses, were responsible for 8% of the chemical fertilizer
load, or about 1% of the total NPS load.
The solution to reduce water quality impacts from fertilizer is complicated by many factors. Turf grass
nutrient needs vary depending on existing soil conditions, as well as turf use and management
objectives. Each turf grass manager will have different goals or objectives based on intensity of use,
desired appearance, environmental impacts, or available funds or time. For example, a school playing
field has different requirements than a backyard lawn.

71
A soil test is an important part of turf grass management. It can be a great first step in identifying
existing soil condition and providing recommendations for other amendments needed to support
healthy turf grass, for example, pH, phosphorus and organic matter. Soil test results provide standard
nitrogen application recommendations based on a range of management objectives for turf grass, but
do not provide a measurement of nitrogen in the soil, limiting its site specificity.
While trees and shrubs are considered the optimum vegetation types for promoting filtration and
infiltration of stormwater, turf grass that is NOT overly fertilized, growing in soils that are NOT overly
compacted, can contribute some degree of filtration and infiltration function (especially when compared
to impervious areas). If lawns and other turf grass areas are not properly maintained, bare spots may
appear and contribute to erosion issues. Healthy grass roots can hold the soil together, reducing
sediment runoff into nearby waterbodies. Additionally, turf areas that are not over fertilized can help
absorb nutrients from stormwater.
Various research-based strategies for managing turf grass are available, which provide guidelines as to
how much – if any – fertilizer, pesticides and water turf grass needs to meet the users desired objective.
When either synthetic or organic fertilizers are needed (as determined by soil testing), and are applied
in the proper amounts at appropriate times during the growing season, in conjunction with good
cultural practices and water management, lawns can thrive and the threats to water quality can be
minimized. Reduced mowing schedules and allowing turf grass areas to revert to more natural mixtures
of wildflowers, weeds and grasses, where appropriate, can save money and energy and eliminate the
potential for fertilizer and pesticides in runoff. Choosing ground covers or planting groups of perennials,
shrubs and/or trees in home landscapes is another strategy to reduce turf areas and reduce fertilizers,
pesticides and other inputs, as well as promote filtration and infiltration to reduce harmful effects of
stormwater runoff.
UNH Cooperative Extension and New Hampshire Sea Grant work with local partners to incorporate the
latest science into outreach and education efforts. Educational programs/resources include Landscaping
for Water Quality, Green Grass & Clean Water and continuing education for licensed pesticide
applications. Extension specialists regularly advise clients from homeowners (through the call-in center)
to landscapers, municipalities and other land managers on best management practices for lawns and
landscapes. The Extension also partners with Master Gardeners, Natural Resource Stewards, New
Hampshire Landscapers’ Association, New Hampshire Plant Growers’ Association and other interested
stakeholders to promote ecologically sound landscape and turf management practices.
In 2013, the New England Interstate Water Pollution Control Commission (NEIWPCC) worked closely
with states and EPA to facilitate the Northeast Voluntary Turf Fertilizer Initiative – a turf fertilizer
stakeholder process to develop Regional Clean Water Guidelines for Fertilization of Urban Turf aimed at
protecting water quality. The guidelines provide consistent recommendations to potentially alleviate the
need for legislation in states that have not passed laws on turf fertilizer, to supplement laws in states
that have passed legislation and to serve as a basis for public education and outreach.

72
Local and state regulations can complement or reinforce voluntary efforts to reduce nutrient pollution
from fertilizer. RSA 483 B: Shoreland Water Quality Protection Act, July, 2008, states that no fertilizer,
except limestone, can be used within 25 feet of the reference line. Between 25 and 100 feet, slow or
controlled release fertilizer may be used. Local town ordinances in several New Hampshire towns and
cities have restrictions that are more stringent than the SWQPA.
In 2014, New Hampshire adopted legislation limiting the nitrogen and phosphorus application rates in
instructions on fertilizer bags sold at retail and intended for use on home lawns.
RSA 431:4-a: Nitrogen Content of Fertilizer, Jan, 2014 - No turf fertilizer sold at retail shall
exceed 0.7 pounds per 1,000 square feet of soluble nitrogen per application when applied
according to the instructions on the label. No turf fertilizer sold at retail shall exceed 0.9 pounds
per 1,000 square feet of total nitrogen per application when applied according to the
instructions on the label. No turf fertilizer shall exceed an annual application of 3.25 pounds per
1,000 square feet of total nitrogen when applied according to the instructions on the label. No
enhanced efficiency fertilizer shall exceed a single application rate of 2.5 lbs. per 1,000 square
feet of total nitrogen and an annual application rate of 3.25 pounds per 1,000 square feet of
total nitrogen nor release at greater than 0.7 pounds per 1,000 square feet per month when
applied according to the instructions on the label.
RSA 431:4-b: Phosphorus Content of Fertilizer, Jan, 2014 - No fertilizer sold at retail that is
intended for use on turf shall exceed a content level of 0.67% available phosphate unless
specifically labeled for establishing new lawns, for repairing a lawn, for seeding, or for use when
a soil test indicates a phosphorus deficiency. No fertilizer sold at retail that is intended for use
on newly established or repaired lawns, or for lawns testing deficient in phosphorus shall exceed
an application rate of one pound per 1,000 square feet annually of available phosphate. No
natural organic turf fertilizer shall exceed a per application rate of one pound of available
phosphate per 1,000 square feet when applied according to the instructions on the label.
NHDES, along with many of our partners, is moving forward on outreach and education efforts related
to turf management and water quality. Consistent science-based information is more important than
ever as many New Hampshire municipalities, watershed organizations, professional landscapers, and
residents are looking at organic or other alternative methods to reducing impacts to water quality from
turf management. Sharing the results of research and the appropriate best management practices will
continue to be a focus of the milestones related to maintaining lawns and commercial turf grass.

73
RESOURCES
UNH Cooperative Extension and NHDES SOAKNH: 2018 Landscaping for Water Quality
Workshop
UNH Cooperative Extension:
o Spring Landscape Conferences Workshop for professional landscape and turf businesses
o Pesticide Safety Education Training
o New Hampshire Master Gardener Course
o Natural Resource Stewards Volunteer Training
New England Regional Nitrogen and Phosphorus Fertilizer and Associated Management Practice
Recommendations for Lawns Based on Water Quality Considerations
Changing Homeowner’s Lawn Care Behavior to Reduce Nutrient Losses in New England’s
Urbanizing Watersheds: The Report of Findings from Social Science Research
Proper Lawn Care within the Protected Shoreland (Fact Sheet WD-SP-2)
Green Grass and Clear Water: Environmentally Friendly Lawn Care Recommendations for
Northern New England
Landscaping for Water Quality
Landscaping at the Water’s Edge
New Hampshire’s Turf Fertilizer Law: What You Should Know
Northeast Voluntary Turf Fertilizer Initiative
Best Management Practices for Pesticide-Free, Cool-Season Athletic Fields
Environmental Management for Golf Courses
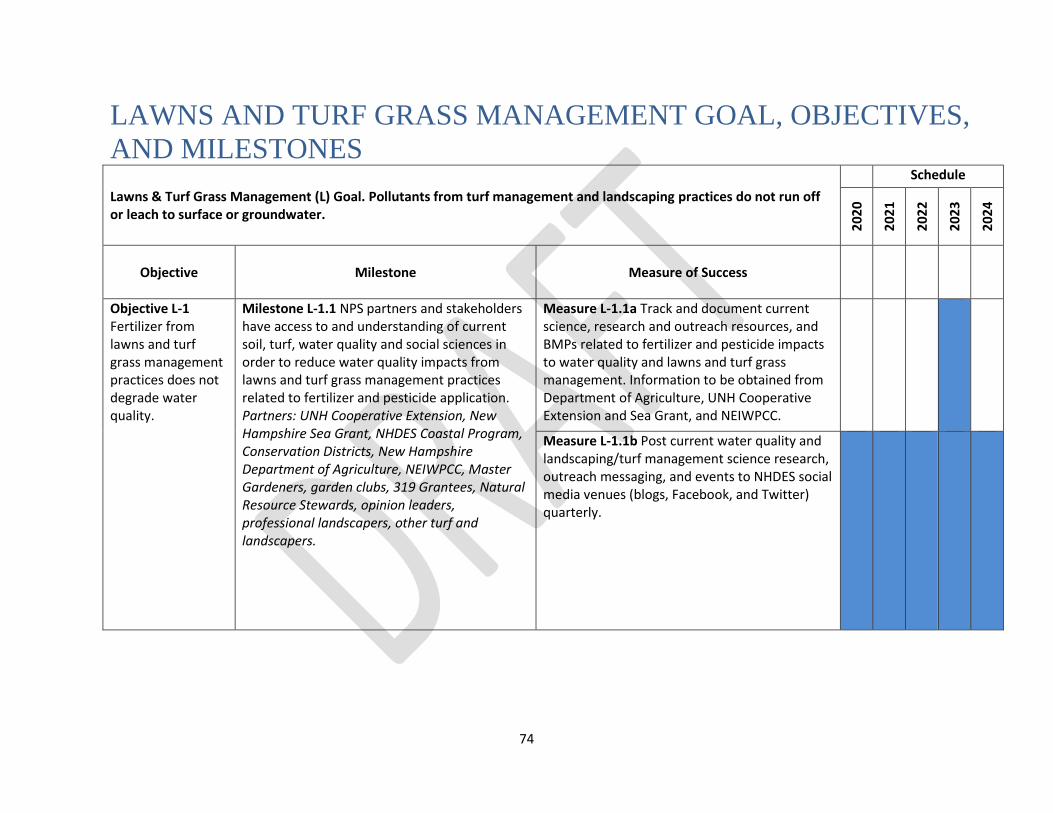
74
LAWNS AND TURF GRASS MANAGEMENT GOAL, OBJECTIVES,
AND MILESTONES
Lawns & Turf Grass Management (L) Goal. Pollutants from turf management and landscaping practices do not run off or leach to surface or groundwater.
Schedule
20
20
20
21
20
22
20
23
20
24
Objective Milestone Measure of Success
Objective L-1 Fertilizer from lawns and turf grass management practices does not degrade water quality.
Milestone L-1.1 NPS partners and stakeholders have access to and understanding of current soil, turf, water quality and social sciences in order to reduce water quality impacts from lawns and turf grass management practices related to fertilizer and pesticide application. Partners: UNH Cooperative Extension, New Hampshire Sea Grant, NHDES Coastal Program, Conservation Districts, New Hampshire Department of Agriculture, NEIWPCC, Master Gardeners, garden clubs, 319 Grantees, Natural Resource Stewards, opinion leaders, professional landscapers, other turf and landscapers.
Measure L-1.1a Track and document current science, research and outreach resources, and BMPs related to fertilizer and pesticide impacts to water quality and lawns and turf grass management. Information to be obtained from Department of Agriculture, UNH Cooperative Extension and Sea Grant, and NEIWPCC.
Measure L-1.1b Post current water quality and landscaping/turf management science research, outreach messaging, and events to NHDES social media venues (blogs, Facebook, and Twitter) quarterly.

75
Measure L-1.c Track turf pesticide use reporting for registered pesticide applicators through New Hampshire Department of Agriculture.
Measure L-1.d Provide information and present on water quality impacts from lawns and turf grass fertilizer, pesticide management practices and BMPs to protect water resources to partners and other organizations doing outreach in related topics. For example: New Hampshire Coastal Landowner Technical Assistance Program, Natural Resource Stewards, NHDES staff.
Milestone L-1.2 New Hampshire residents are aware of BMPs to reduce water quality impacts from lawn care activities including fertilizer and pesticide use. Partners: UNH Cooperative Extension, UNH Marine Docents, UNH Coastal Research Volunteers
Measure L-1.2a Continue to implement and evaluate existing homeowner outreach program components, focused on fertilizer use.
Measure L-1.2b Create, update and implement new outreach messages and methods as identified in Measure L-1.2a evaluations.
Measure L-1.2c Track changes in number of non-commercial soil tests completed at UNH Cooperative Extension following outreach effort(s).
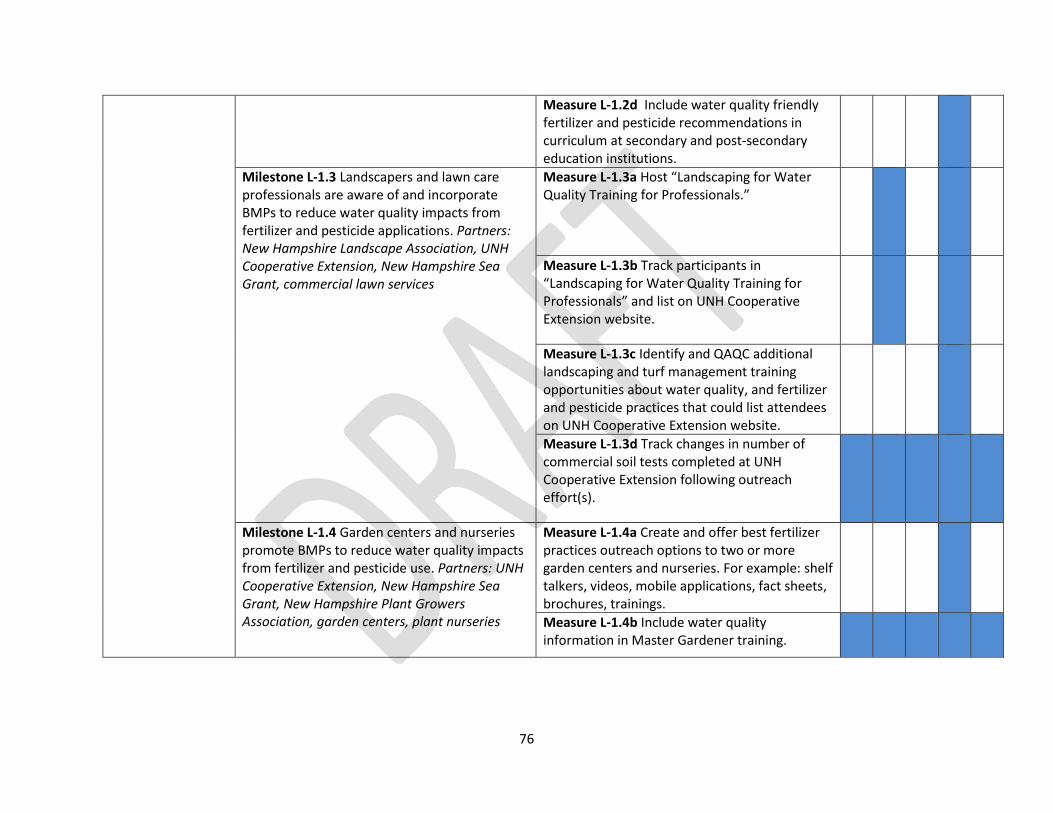
76
Measure L-1.2d Include water quality friendly fertilizer and pesticide recommendations in curriculum at secondary and post-secondary education institutions.
Milestone L-1.3 Landscapers and lawn care professionals are aware of and incorporate BMPs to reduce water quality impacts from fertilizer and pesticide applications. Partners: New Hampshire Landscape Association, UNH Cooperative Extension, New Hampshire Sea Grant, commercial lawn services
Measure L-1.3a Host “Landscaping for Water Quality Training for Professionals.”
Measure L-1.3b Track participants in “Landscaping for Water Quality Training for Professionals” and list on UNH Cooperative Extension website.
Measure L-1.3c Identify and QAQC additional landscaping and turf management training opportunities about water quality, and fertilizer and pesticide practices that could list attendees on UNH Cooperative Extension website.
Measure L-1.3d Track changes in number of commercial soil tests completed at UNH Cooperative Extension following outreach effort(s).
Milestone L-1.4 Garden centers and nurseries promote BMPs to reduce water quality impacts from fertilizer and pesticide use. Partners: UNH Cooperative Extension, New Hampshire Sea Grant, New Hampshire Plant Growers Association, garden centers, plant nurseries
Measure L-1.4a Create and offer best fertilizer practices outreach options to two or more garden centers and nurseries. For example: shelf talkers, videos, mobile applications, fact sheets, brochures, trainings.
Measure L-1.4b Include water quality information in Master Gardener training.

77
Milestone L-1.5 Municipal field managers are aware of and use BMPs to reduce water quality impacts from turf grass management. Partners: NHDES Coastal Program, New Hampshire Municipal Association, New Hampshire Stormwater Coalitions, UNH Cooperative Extension, New Hampshire Sea Grant
Measure L-1.5a Promote guidance and tools regarding BMPs for municipal turf management and water quality to local decision makers, MS4 permit responsible staff, municipal field managers, and other interested parties. For example: municipal turf conference, UCONN Best Management Practices for Pesticide-Free, Cool-Season Athletic Fields, MS4 Good Housekeeping requirement-related presentation, and reflectance meter demonstrations.

78
SUBSURFACE SYSTEMS
BACKGROUND
According to the 2000 census, 65% of New Hampshire’s housing units, or about 400,000 residences,
relied on individual sewage disposal systems (septic systems) for wastewater disposal. For new
development, the figure is higher; about 80% of new housing units have septic systems. (NHDES, 2008c)
If a septic system is not functioning properly, it may be because it was either before state standards
were in effect (1967), the system was not properly maintained, or the system has simply exceeded its
functional life. Current NHDES data indicate that approximately one-third of new septic system approval
applications address repair or replacement of existing systems. The Subdivision and Individual Sewage
Disposal System Design Rules (Env-Wq 1000) require that if approval for a replacement system is
obtained for a septic system in failure, that replacement system must be installed prior to the expiration
date of the approval (90 days). Further, since the 2016 re-adoption of Env-Wq 1000, if approval for a
replacement system is obtained for any reason other than to address a system in failure, and the system
being replaced has never received prior NHDES approval, the system must be installed. This change was
intended to address systems installed prior to 1967 and to help ensure that all septic systems in New
Hampshire are designed and constructed in accordance with current standards.
As a result of a law (RSA 485-A:39) passed in 1993, a site assessment must be performed on properties
served by septic systems and that are within 200 feet of a great pond or fourth order or higher river
before the property changes hands. This assessment, which includes an on-site inspection, is done to
determine if the site meets the current standards for septic disposal system established by NHDES. The
site assessment does not necessarily evaluate the septic system that exists on the site unless there are
obvious signs of system failure. If the designer performing the site assessment deems the septic system
to be functioning properly, upgrading substandard systems is not required.
While direct observable impacts of septic systems on water quality are difficult to quantify, several
watershed studies have modeled the impact of septic systems with respect to nutrient contamination.
According to the GBNNPSS (NHDES, 2014a), septic systems contribute 29% of the nonpoint source
nitrogen load to Great Bay. This calculation was determined from a detailed analysis of the number of
septic systems in the watershed, a nitrogen generation rate of 10.6 pounds per person, and the distance
of septic systems from the estuary.
Several recent watershed-based plans estimated phosphorus contributions from septic systems based
on a count of septic systems in the watershed, number of people per housing unit, seasonal occupancy,
pounds of phosphorus per person using the system (based upon literature estimates of phosphorus
values) and soil retention rates. The plans found the following percent contributions of phosphorus from
septic systems:
Baboosic Lake 43% (NHDES, 2008a); note that this has now been reduced through installation of
a community septic system serving approximately 30 homes.
Pawtuckaway Lake 27% (NHDES, 2008d).

79
Cobbett’s Pond 22% (NHDES, 2010a).
Province Lake 17% (NHDES, 2014b).
NHDES is responsible for both subsurface system regulation (RSA 485-A:29) and licensing of designers
and installers (RSA 485-A:35 and RSA 485-A:36). Septic system design and installation has been
regulated since 1967; licensing of designers and installers since 1979. The State’s controlling role in
subsurface systems has made for consistently high standards throughout the state. As concerns about
water quality impacts from septic systems increase, communities, including Rye and Meredith, NH are
developing regulations to address septic system management at the local level. These locally-driven
regulations often focus on requiring periodic inspection or maintenance of individual disposal systems
which are more stringent than state regulations.
Since 1994, RSA 485-A:29 – Submission and Approval of Plans and Specifications has provided a
regulatory process for innovative/alternative septic systems, which allows for review and approval of
designs that are not specified in Env-Wq 1000. The review process entails submittal of detailed technical
specifications and operational data, which NHDES reviews to determine whether the technology will be
at least as protective of the environment and will function as reliably as or better than a conventional
septic system.
NITROGEN
There has been increased attention nationally on nitrogen loading from septic systems, particularly on
Cape Cod due to groundwater contamination and the Chesapeake Bay watershed due to eutrophication
of the Bay. In 2013, EPA produced A Model Program for Onsite Management in the Chesapeake Bay
Watershed (USEPA, 2013a) that quantifies some of the options for alternative septic systems in terms of
nitrogen reduction and costs.
The model program recommends a tiered, risk-based approach for nitrogen management, where
nitrogen reduction goals are recommended based on the proximity of a site to a water body of concern,
recognizing that there is a greater potential for attenuation of nitrogen for septic systems located
farther from the nitrogen-limited water body. Table 11, reproduced from the EPA model program,
describes the tiered management system approach. Table 12, also from the EPA model program,
compares conventional systems with advanced treatment systems in terms of nitrogen removal and
costs.
With each model, the complexity of requirements and management options increases. The first model is
roughly equivalent to the current system of management in New Hampshire. The second model
introduces nitrogen removal goals and system maintenance requirements. The third model includes
operating permits with operation and maintenance provided by a qualified service provider. The fourth
and fifth models require a responsible management entity to operate or own the system, respectively.

80
TABLE 8: SUMMARY OF SEPTIC SYSTEM MANAGEMENT APPROACHES*
Model # Description Comments
1 Homeowner
Awareness
Homeowner management of existing systems is promoted through
outreach and education programs. Appropriate for conventional
systems which provide limited nitrogen removal.
2 Maintenance Contracts A property owner contracts with a qualified service provider to
ensure O&M is conducted and nitrogen removal goals are met.
3 Operating Permits
The regulatory agency issues a limited-term operating permit to
the property owner that requires sustained performance levels for
nitrogen reduction. O&M is performed by a qualified service
provider with regular monitoring. This provides a greater level of
oversight and accountability compared to Model #2.
4 Responsible
Management Entity
(RME) O&M
Frequent and highly reliable O&M is the responsibility of a
management entity, further increasing the level of accountability.
This approach is appropriate for clustered systems or complex
treatment systems providing high levels of nitrogen reduction.
5 RME Ownership
Ownership passes to a management entity which is responsible for
all management aspects, similar to publicly owned treatment
works, providing a high level of assurance that nitrogen removal
goals are met.
* Source: U.S. Environmental Protection Agency. A Model Program for Onsite Management in the Chesapeake
Bay Watershed. June 2013

81
TABLE 9: EXAMPLES OF NITROGEN LOAD REDUCTIONS ACHIEVABLE THROUGH ADVANCED
TREATMENT*
Type of System
Nitrogen
Discharge1
Concentration
(mg/L)
Load
Reduction
Provided
Loading
(per person/yr)
Nitrogen
Reduction
(per person/yr)
Approx. Total
System Cost
kg lb kg lb
Conventional
System 39 0% 4 9 0 0
$8,000 -
$10,0004
Advanced
Treatment2 20 49% 2 5 2 4
conventional +
$10,000 -
$15,0005
Advanced
Treatment with
Denitrification3
10 74% 1 2 3 7 conventional +
$22,0005
* Source: U.S. Environmental Protection Agency. A Model Program for Onsite Management in the
Chesapeake Bay Watershed. June 2013
1 This is the concentration of wastewater effluent as it enters the drainfield. 2 Advanced treatment system refers to a system that includes a septic tank, an aeration system, and a
recirculation system into the septic tank, or equivalent. 3 Advanced treatment system with denitrification refers to a septic tank, an aeration system, and an anoxic
environment separate from the septic tank, or equivalent. 4 Source: NHDES Subsurface Systems staff (August 26, 2014). Personal communication. 5 Source: Maryland Dept. of Environmental Protection Bay Restoration Fund
The EPA model program recommends varying approaches to septic system management, depending on
the distance from the septic system to a bay or to the tidal portion of tributaries to a bay. For septic
systems within 200 meters (about 650 feet) of the Great Bay Estuary or large rivers (5th order or
greater), the GBNNPSS (NHDES, 2014a) assumes that there is too little distance for denitrification to
occur, and therefore assumes that all of the nitrogen discharged from septic systems within 200 meters
is delivered to Great Bay. Therefore, any programs developed to promote or finance installation of
denitrifying systems should consider this area to be the highest priority for such systems.
Several pilot projects are underway in New Hampshire’s coastal watershed to test the performance and
feasibility for widespread use of septic system permeable reactive barriers (PRBs) in denitrification of
effluent.

82
Nitrate travels long distances in groundwater where oxygen is abundant. Installing PRBs to intercept and
treat septic system effluent is a treatment solution that can reduce groundwater migration of nitrogen
to sensitive waterbodies.
A PRB is essentially a trench filled with wood chips, sand and gravel that creates conditions for nitrogen
removal. As septic system effluent enters the PRB, it is typically high in nitrate, but after denitrification,
it exits the PRB with most of the nitrate removed. The removal of nitrate occurs during denitrification
through biological respiration of nitrate by anaerobic bacteria. Nitrate is converted to nitrogen gas as
part of this process. In order for sufficient anaerobic bacteria to accumulate in the PRB, the
concentration of dissolved oxygen must be significantly reduced and there must be a carbon food
source for the bacteria. The nitrogen gas is released to the atmosphere through voids in the PRB media
and surrounding soil. PRBs use no electricity and do not have moving parts. Once the PRB is in the
ground, it functions on its own.
PHOSPHORUS
For freshwater bodies, phosphorus is the nutrient of concern delivered by septic systems. Phosphorus is
not removed by conventional onsite systems, but rather is adsorbed to varying degrees by the soil and
plant roots through which the treated effluent passes on its way to surface waters. When the adsorption
capacity of the soil is reached, phosphorus export will occur. This problem is typical of densely
developed shoreland areas near lakes and ponds. Increasing the distance from the leach field to the
waterbody will provide greater adsorption of phosphorus by the soil.
Many of New Hampshire’s shorelines were developed prior to regulations regarding septic system
design, including setbacks to waterbodies. This lack of regulation contributed to the dense development
of small, waterfront lots and allowed for the use of cesspools, dry wells or other disposal systems that
were often inadequate in treating waste. Many of these systems, which may be considered failed by
statutory definition, remain in place because they have not been brought to the attention of NHDES.
RSA 485-A:37 requires that all septic systems be operated and maintained in such a manner as to
prevent a nuisance or potential health hazard due to failure of the system. Inadequate or failed systems
on these types of waterfront lots may be replaced in accordance with current rules in Env-Wq 1000.
While individual lot characteristics may not allow for all standards, including setbacks, to be met, newly
approved system designs must meet all requirements to the maximum extent practicable. Additionally,
nutrient loading concerns increase in situations where seasonal waterfront homes are converted to
year-round housing. Env-Wq 1000 requires that a new application for septic system approval be
submitted for conversion from seasonal to year-round use. As discussed above, if the system that served
the property at the time of conversion had never received prior NHDES approval, the newly designed
system must be constructed. However, if the system is State-approved, the system is not required to be
upgraded to accommodate the additional use. In situations where waterfront lots have inadequate
systems, a single community system that collects wastewater from multiple residences may be a viable
solution to wastewater disposal.

83
PATHOGENS
Parasites, bacteria and viruses, found in septic wastewater can cause communicable diseases through
direct or indirect body contact or ingestion of contaminated water or shellfish. Pathogens can be
transported for significant distances in ground water and surface waters (USEPA, 2002). Septic systems
in failure can allow untreated, or incompletely treated, septic wastewater to be present at the ground
surface, or in surface waters.
RESOURCES
Design and Installation Criteria: RSA 485-A and administrative rules Env-Wq 1000
Training: County Conservation Districts, New Hampshire Association of Natural Resource
Scientists, Granite State Designers and Installers, provide training opportunities for septic
system designers and installers
NHDES Subsurface Systems Environmental Fact Sheets

84
SUBSURFACE SYSTEMS GOAL, OBJECTIVES AND MILESTONES
Subsurface Systems (S) Goal. Septic systems are designed, installed and maintained in a way that allows them to function without degrading water quality.
Schedule
20
20
20
21
20
22
20
23
20
24
Objective Milestone Measure of Success
Objective S-1 Reduce nitrogen and phosphorus pollution and bacterial contamination from septic systems through system maintenance, system replacement, alternative technologies and the development of community systems.
Milestone S-1.1 Continue to evaluate and demonstrate alternative technologies that reduce nitrogen export to Great Bay. Partners: Rockingham County Conservation District, Strafford County Conservation District, Granite State Designers and Installers, Strafford Regional Planning Commission
Measure S-1.1a Building on the success of previous PRB projects, install a permeable reactive barrier system within the Great Bay watershed.
Measure S-1.1b Completion of monitoring report documentation showing two years of effectiveness monitoring data from the permeable reactive barrier system.
Measure S-1.1c Identification of candidate sites for installation of other types of de-nitrifying systems in the Great Bay watershed.
Milestone S-1.3 Collect phosphorus data on Baboosic Lake (volunteer monitoring) to measure the results of a community septic system. Partners: Town of Amherst, UNH Lakes Lay Monitoring Program (LLMP)
Measure S-1.3 Completed analysis of phosphorus trend in LLMP annual reports.

85
Milestone S-1.4 Develop capacity to implement a community septic system in a phosphorus-impaired lake watershed that has an approved watershed-based plan. Partners: Granite State Designers and Installers, New Hampshire Municipal Association, New Hampshire CWSRF, New Hampshire Health Officers Association, New Hampshire Building Officials Association, watershed organizations
Measure S-1.4 A candidate community septic system site is identified.
Milestone S-1.5 Provide increased opportunities for septic system replacement and development of community systems. Partners: NHDES, Granite State Designers and Installers, New Hampshire Municipal Association, New Hampshire State Revolving Loan Fund Program CWSRF, New Hampshire Health Officers Association, New Hampshire Building Officials Association, Southeast Watershed Alliance, Piscataqua Region Estuaries Partnership, New Hampshire Housing Authority, US Department of Agriculture Rural Development
Measure S-1.5 Annual State Revolving Fund (SRF) loans and State Aid Grants are made available for septic systems.
Milestone S-1.6 Encourage septic system evaluation and priority ranking for replacement of older, malfunctioning septic systems in high-quality waters and watersheds with bacteria and nutrient impairments; implement septic system replacement programs for high-priority systems.
Measure S-1.6 Prioritized list of septic systems in high quality and/or impaired waters for replacement; at least three priority systems are replaced.
Objective S-2 Research approaches and policies for improved septic
Milestone S-2.1 Review septic system districts or utilities in California, Connecticut, New York, and Texas. Partners: Granite State Designers and Installers, New Hampshire Municipal Association, Southeast Watershed Alliance, Piscataqua Region Estuaries Partnership
Measure S-2.1 Report evaluating legal structure of septic system authorities in other states.

86
system management.
Milestone S-2.2 Track and participate in efforts led by the Shoreland Septic System Study Commission to develop approaches to remediate septic systems. Partners: New Hampshire legislators and appointed study commission members
Measure S-2.2 A final report of the commission's findings is issued and follow-up actions are identified.

87
EMERGING NPS ISSUES Emerging contaminants, or contaminants of emerging concern, can refer to many different kinds of
chemicals, including those found in medicines, personal care products, pesticides and herbicides, fire
suppressants, and household cleaning products. When these chemicals make their way to lakes and
rivers, they can have a detrimental effect on fish and other aquatic species. This section provides
information about three areas of emerging concern related to New Hampshire’s efforts to control NPS
pollution:
Perfluoroalkyl and polyfluoroalkyl substances (PFAS).
Pharmaceuticals and personal care products.
Marine debris, trash and microplastics.
Numerous federal and state regulations and programs are being created, updated or are already in place
to control the release of toxic substances to the environment and, when needed, to clean up
contaminated areas. However, in many cases, more research is needed on potential impacts and threats
from PFAS and pharmaceuticals, and marine debris, trash and microplastics. As more information
becomes available on the sources of these pollutants, the New Hampshire NPS Management Program
may have a future role to help reduce these threats to human health, aquatic life and ground and
surface water quality.
PERFLUOROALKYL AND POLYFLUOROALKYL SUBSTANCES (PFAS)
BACKGROUND
Over the past few years, drinking water quality issues related to perfluorinated compounds has become
a major focus for NHDES. According to the Technical Background for the June 2019 Proposed
Maximum Contaminant Levels and Ambient Groundwater Quality Standards for
Perfluorooctane sulfonic Acid, Perfluorooctanoic Acid, Perfluorononanoic Acid, and
Perfluorohexane sulfonic Acid., (NHDES, 2019e) related to the establishment of maximum
contaminant levels (MCLs) for drinking water:
“Perfluorooctanesulfonic acid (PFOS), perfluorooctanoic acid (PFOA), perfluorononanoic acid
(PFNA), and perfluorohexanesulfonic acid (PFHxS) are individual compounds in a large class of
chemicals known as perfluorinated compounds (PFCs) and more broadly as per- and
polyfluoroalkyl substances (PFAS). They have been widely used since the 1940s in commercial,
industrial, and household products and applications, including production of water, grease, and
stain-resistant materials, fire suppression foams, non-stick cookware, wax removers, etc.
(ATSDR 2018b).

88
All four compounds have been detected in New Hampshire’s groundwater and surface water.
Their widespread use, persistence and mobility in the environment and bioaccumulative
properties has resulted in the detection of PFAS in blood serum in humans and animals
worldwide. This has led to considerable research into their toxicity and health effects. The
health effects associated with PFAS exposure are currently being researched extensively by
toxicologists and epidemiologists worldwide, resulting in numerous publications being released
on a continuous basis.” (NHDES, 2019e)
These compounds are a class of so-called “forever chemicals” because they are so persistent in the
environment, and as such, have the potential to cause human harm. In addition to developing MCLs,
NHDES has also been charged with the development of a plan for, and the eventual adoption of, surface
water quality standards for the same four PFAS listed above. This will most likely occur over the next few
years.
The implications of these new regulations on stormwater and other NPSs of pollution are unknown at
this time. NHDES has data that show that some PFAS contamination comes from airborne sources
possibly contaminating our rain and snow. This implies that stormwater runoff could be one means for
their transport across the landscape. Agriculture runoff is of concern where PFAS-contaminated soil
amendments have been utilized. Septic systems and land application of sludge are other potential
sources of contamination. The scientific research on PFAS is showing that these contaminants are wide-
spread across the environment. These chemicals are difficult to remove and NPS treatment technologies
are only beginning to be developed. Therefore, the likely near future of PFAS regulation and restoration
in surface water will need to be focused on controls at the source.
Future NPS management activities could include source identification, watershed-based plans
development, BMP and treatment demonstration programs, and outreach to affected communities.
RESOURCES
EPA’s Per- and Polyfluoroalkyl Substances (PFAS) Action Plan.
Interstate Technology Regulatory Council PFAS Fact Sheets.
New Hampshire PFAS investigation website.
PHARMACEUTICALS AND PERSONAL CARE PRODUCTS
BACKGROUND
According to the NHDES fact sheet on the subject, “Pharmaceuticals and personal care products (PPCPs)
comprise a diverse group of chemicals including, but not limited to, prescription and over-the-counter
human drugs, veterinary drugs, diagnostic agents, nutritional supplements and other consumer
products, such as fragrances, cosmetics, bug repellant and sun-screen agents. PPCPs include a broad

89
array of synthetic and naturally occurring compounds that are not commonly monitored or regulated in
drinking water or aquatic environments.” (NHDES, 2010b)
These types of substances find their way into the environment through a variety of pathways, such as
spills, wastewater effluent, landfill leachate, and Aquaculture waste. In recent years, concerns about the
effects of PPCPs have led to sampling in surface and groundwater. Many PPCPs can be detected in these
waters at low concentrations, often measured in parts per trillion. Research is ongoing as to the health
impacts on human and aquatic creatures, however, some of these PPCPs have been implicated in
studies of deformities and behavior changes in fish and other organisms.
Many unknowns remain regarding the potential for negative ecological and human health effects from
exposure to ingredients in PPCPs once released and accumulated in the environment. For this reason,
NHDES strongly supports research on this topic, especially for human health effects on sensitive
populations such as children, pregnant women and those with compromised immune systems.
To this end, NHDES has conducted a few small PPCP groundwater studies; and, drinking water systems
are required to take annual samples of 10 common PPCPs in there finished product. In addition, U.S.
Geological Survey and EPA recently published a nationwide study on PPCPs in surface water that are
sources of drinking water for public water systems (Bradley, et al.2019). This study looked at 475 unique
chemical compound, including PPCPs.
NHDES has taken some actions on PPCPs. First, New Hampshire adopted a low groundwater standard
for 1,4-dioxane, which is associated with personal care products. Next, NHDES is partnering with the
New Hampshire of Health and Human Services. Antibiotic Resistance Workgroup. Together, they are
broadening the medical community’s understanding of sources of antibiotic resistance other than
patient or prescribing practices. And finally, in New Hampshire, the biggest success story with PPCP has
to do with NHDES spearheading efforts to change State laws and regulations over the last 10 years to
enable both police stations and pharmacies to have medicine disposal drop boxes. These were not
allowed until NHDES coordinated efforts to change the law. There are now around 80 collection boxes
throughout the state. Recently, NHDES coordinated with the Governor’s office and the Northeast Waste
Management Officials’ Association to apply for and receive a grant from USDA to improve medicine
disposal practices at long-term health care facilities in rural New Hampshire.
From a NPS pollution perspective, the focus around PPCPs should be on encouraging additional research
and educating the public about source control. The effectiveness of medicine drop boxes has been
demonstrated. In addition, while conventional wastewater treatment systems are not very effective at
removing PPCPs, septic systems appear to remove them fairly well. This is another benefit of promoting
septic systems maintenance and replacement. Though little is published on the subject, given the way
that septic systems remove PPCPs, other infiltration technologies may also be effective in their
treatment. Like other chapters in this document, this demonstrates the need for stormwater BMPs that
increase biological treatment and infiltration.

90
RESOURCES
NHDES Medicine Disposal Information for New Hampshire
MARINE DEBRIS, TRASH AND MICROPLASTICS
BACKGROUND
When waste is not properly recycled or disposed, it can become NPS pollution by entering oceans,
streams, rivers and lakes.
NOAA funding through the NHDES Coastal Program enabled Blue Ocean Society for Marine Conservation
to organize the annual Coastweek Cleanup. Each year over a thousand participants clear hundreds of
miles and thousands of pounds of trash. The amount and types of debris recorded becomes part of the
international ocean trash index, which is compiled by Ocean Conservancy. Volunteers have removed
over 170,000 pounds of litter from New Hampshire beaches since 2001 (Blue Ocean Society for Marine
Conservation 2019).
In 2017-2018, EPA Trash Free Waters convened stakeholders from Maine and New Hampshire, forming
Trash Free Waters Piscataqua, to help identify the waste streams of greatest concern to waters in the
Piscataqua Region. They identified single-use plastics, derelict fishing gear and pet waste. The
Piscataqua Region Estuaries Partnership and partners, including NHDES, are continuing to identify
projects and partnerships to work to reduce these waste streams from entering inland and coastal
waters in New Hampshire and Maine.
Plastics in the aquatic environment are of increasing concern because of their persistence and effect on
the environment, wildlife and human health.
When larger plastics break down, they form microplastics – pieces of plastic between 1-5 millimeters.
Microplastics can also enter waterbodies through wastewater from every day use of personal care
products and washing of clothes made from synthetic fabrics. When microplastics are ingested by fish,
the chemicals they contain can become concentrated in fish tissue and ultimately consumed by humans.
Research is ongoing on the extent and impact of microplastics. With funding provided by a New
Hampshire Sea Grant development grant, researchers worked with citizen scientists to collect
microplastic samples on eight New Hampshire beaches. In addition to raising awareness about
microplastics, results compiled in 2014 indicate there are potentially 7.5 million pieces of microplastics
present on those beaches (UNH Sea Grant 2017). This research created sampling protocols and provided
a baseline estimate of microplastic abundance that will help to inform future studies on the topic.
RESOURCES
EPA Trash Free Waters Program

91
REFERENCES Blue Ocean Society for Marine Conservation, 2019. Beach Cleanups. Available at:
http://www.blueoceansociety.org/beachcleanup/beach-cleanup-information/
Bradley, P., Journey, C., Berninger, J., Button, D., Clark, J., Corsi, S., DeCicco, L., Hopkins, K., Huffman, B.,
Nakagaki, N., Norman, J., Nowell, L., Qi, S., VanMetre, P. and Waite, I., 2019. Mixed-chemical
exposure and predicted effects potential in wadeable southeastern USA streams. Science of The
Total Environment, 655, pp.70-83. Available at: https://doi.org/10.1016/j.scitotenv.2018.11.186
Granite State Future, 2013. Statewide Existing Conditions and Trends Assessment. Available at:
http://www.granitestatefuture.org/files/4813/9178/7683/StatewideExistingConditions.pdf
Milesi, C., Running, S., Elvidge, C., Dietz, J., Tuttle, B., and Nemani, R., 2005. Mapping and modeling the
biogeochemical cycling of turf grasses in the United States. Environmental Management, 36(3),
pp.426–438. Available at: https://www.ncbi.nlm.nih.gov/pubmed/16086109
New Hampshire Department of Environmental Services (NHDES), 2008a. Baboosic Lake Watershed
Based Plan. Acton, MA: Geosyntec Consultants. Available at:
http://des.nh.gov/organization/divisions/water/wmb/was/documents/
wbp_baboosic.pdf
New Hampshire Department of Environmental Services, 2008b. New Hampshire Stormwater Manual:
Volume 1, Revision: 1.0, Available at:
https://www.des.nh.gov/organization/commissioner/pip/publications/wd/documents/wd-08-
20a.pdf
New Hampshire Department of Environmental Services, 2008c. New Hampshire Water Resources
Primer, December 2008. Available at:
https://www.des.nh.gov/organization/divisions/water/dwgb/wrpp/documents/primer_front_m
atter.pdf
New Hampshire Department of Environmental Services, 2008d. Pawtuckaway Lake Watershed Based
Plan. Acton, MA: Geosyntec Consultants. Available at:
http://des.nh.gov/organization/divisions/water/wmb/was/documents/wbp_pawtuckaway_lake.
New Hampshire Department of Environmental Services, 2010a. Cobbett’s Pond Watershed Restoration
Plan. Acton, MA: Geosyntec Consultants. Available at:
http://projects.geosyntec.com/BW0131/Documents/FINAL%20Cobbetts%20WRP_12102010.pd
f
New Hampshire Department of Environmental Services, 2010b. Pharmaceuticals and Personal Care
Products in Drinking Water and Aquatic Environments - Answers to Frequently Asked Questions:

92
WD-DWGB-22-28. Available at:
https://www.des.nh.gov/organization/commissioner/pip/factsheets/dwgb/documents/dwgb-
22-28.pdf
New Hampshire Department of Environmental Services, 2014a. Great Bay Nitrogen Non-Point Source
Study: R-WD-13-10 Available at:
http://des.nh.gov/organization/divisions/water/wmb/coastal/documents/gbnnpss-report.pdf
New Hampshire Department of Environmental Services, 2014b. Province Lake Watershed-based Plan, FB
Environmental. Available at:
https://www.des.nh.gov/organization/divisions/water/wmb/was/documents/province-lake-
plan.pdf
New Hampshire Department of Environmental Services, 2016. New Hampshire Homeowner’s Guide to
Stormwater Management Do-It-Yourself Stormwater Solutions for Your Home. Available at:
https://www4.des.state.nh.us/SoakNH/wp-content/uploads/2016/04/NH-Homeowner-Guide-
2016.pdf
New Hampshire Department of Environmental Services, 2019a. 2018 Section 305(b) and 303(d)
Consolidated Assessment and Listing Methodology. Available at:
https://www.des.nh.gov/organization/divisions/water/wmb/swqa/2018/documents/r-wd-19-
04.pdf
New Hampshire Department of Environmental Services, 2019b. 2018 Status of Each Assessment Unit.
Available at:
https://www.des.nh.gov/organization/divisions/water/wmb/swqa/2018/documents/2018-
303d.xlsx
New Hampshire Department of Environmental Services, 2019c. NHDES Environmental Dashboard.
Coastal Waters: Total Nitrogen Concentration. Available at:
http://www4.des.state.nh.us/NHEnvironmentalDashboard/
New Hampshire Department of Environmental Services, 2019d. NHDES Environmental Dashboard. Lakes
and Rivers: Lake Water quality. Available at:
http://www4.des.state.nh.us/NHEnvironmentalDashboard/
New Hampshire Department of Environmental Services, 2019e. Summary of Comments on Initial
Proposals with NHDES Responses Attachment 1: Technical Background for the June 2019
Proposed Maximum Contaminant Levels and Ambient Groundwater Quality Standards for
Perfluorooctane sulfonic Acid, Perfluorooctanoic Acid, Perfluorononanoic Acid, and
Perfluorohexane sulfonic Acid. Available at: https://www4.des.state.nh.us/nh-pfas-
investigation/wp-content/uploads/Summary-of-Comments-Responses-with-Attachments.pdf

93
New Hampshire Regional Planning Commissions, 2016. County Populations Projections 2016 by Age and
Sex. RLS Demographics, Inc., Rensselaerville, NY. Available at: https://www.nh.gov/osi/data-
center/documents/2016-state-county-projections-final-report.pdf
North East State Foresters Association (NEFA), 2013. The Economic Importance of New Hampshire’s
Forest-Based Economy. Available at:
https://extension.unh.edu/resources/files/Resource001848_Rep2650.pdf
Parry, C. (2019). Boat Registration Numbers. [email].
Piscataqua Region Estuaries Partnership, 2013. State of Our Estuaries. PREP Reports & Publications. 259.
Available at: https://scholars.unh.edu/prep/259
Piscataqua Region Estuaries Partnership, 2018. State of Our Estuaries Report 2018. PREP Reports &
Publications. 391. Available at: https://scholars.unh.edu/prep/391
Southern New Hampshire Planning Commission, 2014. Moving Southern NH Forward Volume 1 2015 –
2035 Draft. Available at: http://www.snhpc.org/pdf/GSFVol1Draft070814.pdf
University of New Hampshire Sea Grant, 2017. A Microplastics Survey of New Hampshire Beaches: A
Citizen Science Pilot Study. NH Sea Grant Development Project Completion Report M/D-1302.
Available at: https://seagrant.unh.edu/sites/default/files/projects/reports/M-D-
1302%20Bradt%202014%20CR.pdf
U.S. Department of Agriculture, 2019. 2017 Census of Agriculture, Summary and State Data, Volume 1.
Available at:
https://www.nass.usda.gov/Publications/AgCensus/2017/Full_Report/Volume_1,_Chapter_1_U
S/usv1.pdf
U.S. Department of Agriculture, Forest Service, 2016. Mineral Collecting Guide: White Mountain
National Forest – Gold Panning. Available at:
https://www.fs.usda.gov/Internet/FSE_DOCUMENTS/fseprd503508.pdf
U.S. Department of Agriculture, National Agriculture Statistics Service, 2018. CropScape Cropland Data
Layer. Available at: http://nassgeodata.gmu.edu/CropScape
U.S. Environmental Protection Agency, 2002. Onsite Wastewater Treatment Systems Manual.
Washington, D.C.: Office of Research and Development. Available at:
https://www.epa.gov/sites/production/files/2015-
06/documents/2004_07_07_septics_septic_2002_osdm_all.pdf
U.S. Environmental Protection Agency, 2011. Waters Assessed as Impaired Due to Nutrient-Related
Causes. Available at: http://www2.epa.gov/nutrient-policy-data/waters-assessed-impaired-due-
nutrient-related-causes

94
U.S. Environmental Protection Agency, 2012. Clean Watersheds Needs Survey 2012 New Hampshire
State Fact Sheet. Available at: https://www.epa.gov/sites/production/files/2015-
10/documents/cwns_fs-nh.pdf
U.S. Environmental Protection Agency, 2013a. A Model Program for Onsite Management in the
Chesapeake Bay Watershed. Available at:
https://federalleadership.chesapeakebay.net/130627_Ches_Bay_Tech_Assist_Manual.pdf
U.S. Environmental Protection Agency, 2013b. Nonpoint Source Program and Grants Guidelines for
States and Territories. Available at: https://www.epa.gov/sites/production/files/2015-
09/documents/319-guidelines-fy14.pdf
Wake, C., Burakowski, R., Wilkinson, P., Hayhoe, K., Stoner, A., Keeley, C., LaBranche, J., 2014. Climate
Change in Northern New Hampshire: Past, Present, and Future. Durham, NH: The Sustainability
Institution of the University of New Hampshire. Available at:
https://sustainableunh.unh.edu/sites/sustainableunh.unh.edu/files/media/unhsi-csne-
northernnh_climateassessment_june_4_2014.pdf.

95
APPENDIX A: PRIORITY AREAS FOR NONPOINT
SOURCE MANAGEMENT ACTIVITIES IN NEW
HAMPSHIRE
NHDES METHODOLOGY FOR PRIORITIZING
WATER QUALITY RESTORATION AND PROTECTION ACTIVITIES
2020 - 2024
I. About the Recovery Potential Screening Tool
The Recovery Potential Screening Tool (RPST) was developed by EPA as a resource for states to
identify areas to focus limited resources among large numbers of NPS-impaired waters. RPST
provides a systematic approach for comparing waters or watersheds and identifying differences in
how well they may respond to restoration. Using representative ecological, stressor and social
characteristics of each watershed, RPST identifies the geographic areas in the state with the greatest
likelihood of successful water quality restoration efforts.
NHDES selected the RPST for its availability, ease of use, flexibility and usefulness of results. In
addition to using RPST for determining recovery potential, NHDES also used the tool for determining
protection potential. Throughout this document, NHDES refers to this protection-related screening
as the Protection Potential Screening Tool (PPST), which provides the geographic areas in the state
with the greatest likelihood of successful water quality protection projects.
The NHDES methodology for using the RPST/PPST is described in this appendix.
II. Defining a Geographic Scope for Analysis
Screening can take place on any geographic scale that contains multiple smaller units (waters or
watersheds) that need to be compared and contrasted. For recovery screening using RPST, NHDES
chose to look at the AU level, as it would provide the most useful scale of information to assign
priority to waters and watersheds impaired or threatened by NPS pollution. For protection screening
using PPST, NHDES chose to look at the HUC12 level, as it would provide the most useful and
manageable scale of information. This recovery and protection potential assignment will assist in
determining priority geographic areas to guide NHDES work and direct where grant funds and
technical resources should be focused to obtain the maximum benefit for restoration and protection
activities, as required in key component 5 of the Section 319 Program Guidance: Key Components of
an Effective State Nonpoint Source Management Program.
Each waterbody type (lakes, rivers, estuaries, etc.) in New Hampshire is divided into smaller
segments called AUs. In general, AUs are the basic unit of record for conducting and reporting the
results of all water quality assessments. AUs are intended to be representative of homogenous
segments; consequently, sampling stations within an AU can be assumed to be representative of the
segment. In general, the size of AUs should not be so small that they result in an unmanageable

96
number of AUs for reporting. On the other hand, AUs should not be so large that they result in
grossly inaccurate assessments.
Many factors can influence the homogeneity of a segment. Factors used to establish homogenous
AUs are presented in the following table. Based on the criteria shown in the table, lake, river,
impoundment, ocean and estuarine surface waters in New Hampshire were divided into over 8,800
AUs for assessment and reporting purposes.
Factor Comments
Waterbody Type
Different waterbody types (i.e., river, lake, impoundment, estuary, ocean)
have different water quality standards and may respond differently to
pollutants. Consequently, to help ensure homogeneity, different AUs are
needed for different waterbody types.
HUC-12 Boundaries
HUC stands for hydrologic unit code. Separate AUs were established
wherever 12-digit HUC boundaries were crossed to prevent AUs from
becoming too large and to facilitate the naming convention for AUs.
Water Quality
Standards
All waters represented by an AU should have the same water quality
standard; otherwise it’s possible that a portion of an AU could meet
standards while the other portion is in violation. This would lead to
inaccurate assessments.
Pollutant Sources:
The presence of major point and/or nonpoint sources of pollutants can have
a significant impact on water quality and, therefore, homogeneity within an
AU.
Maximum AU size for
rivers and streams
To keep AUs for rivers and streams from becoming too large, the following
criteria were applied:
AU < 10 miles for rivers and streams of 3rd order or less.
AU < 25 miles for rivers and streams greater than 3rd order.
Major changes in Land
Use
Land use can have a significant impact on pollutant loading and quality of
surface waters.
Stream
Order/Location of
Major Tributaries
Stream order and location of major tributaries can have a significant impact
on the quantity and quality of water due to the amount of dilution available
to assimilate pollutants.
Public Water Supplies Separate AUs were developed for these surface waters to facilitate
reporting.

97
Factor Comments
Outstanding Resource
Waters
Outstanding Resource Waters are defined in the surface water quality
regulations as surface waters of exceptional recreational or ecological
significance and include all surface waters of the national forests and surface
waters designated as natural under RSA 483:15.
Shellfish Program
Categories
Tidal waters were divided into AUs based on the classification system for the
shellfish program to facilitate reporting.
Designated Beaches Designated beaches have more stringent bacteria criteria; consequently,
separate AUs were established for these waterbodies.
Cold water fish
spawning areas
Coldwater fish spawning areas have different dissolved oxygen criteria than
other surface waters. Consequently, separate AUs were established for
these waterbodies where information was available from NHFG.
III. Query NHDES’ Supplemental Assessment Database (SADB)
NHDES Water Quality Section personnel ran a query of the SADB for all current (2018) AUs that are
impaired for a NPS-related parameter, per the CALM. NHDES has chosen the following list of
parameters to represent NPS-related parameters. This list only includes parameters that are able to
be remediated through BMP implementation, stream restoration/alteration and changes to land use
practices. Although copper, lead and zinc are typically considered NPS parameters, they were not
chosen for this analysis because of the aforementioned rational.
SADB Impairment ID SADB Impairment Name
87 Aluminum
91 Ammonia (Un-ionized)
100 BOD, Biochemical oxygen demand
105 Benthic-Macroinvertebrate Bioassessments (Streams)
138 Chloride
150 Chlorophyll-a
170 Cyanobacteria hepatotoxic microcystins
205 Dissolved oxygen saturation
215 Enterococcus

98
SADB Impairment ID SADB Impairment Name
217 Escherichia coli
227 Excess Algal Growth
230 Fishes Bioassessments (Streams)
243 Habitat Assessment (Streams)
270 Low flow alterations
308 Ammonia (Total)
319 Other flow regime alterations
322 Oxygen, Dissolved
371 Sedimentation/Siltation
400 Fecal Coliform
403 Total Suspended Solids (TSS)
413 Turbidity
458 Nitrogen (Total)
462 Phosphorus (Total)
Impairments are defined as a NHDES sub-category beginning with a 4 or 5, as defined in the CALM.
The definitions of the NHDES sub-categories are presented in the table below.

99
EPA
ATTAINS
Category
NHDES
Sub-
Category
Definition of NHDES Sub-Category for PARAMETERS
4A
4A-M
The parameter is a pollutant which is assessed as an impairment per the CALM, and an EPA-approved TMDL has been completed. However, the impairment is relatively slight or marginal, as defined below: 1. For parameters where the 10% rule applies, the number of exceedances
equals or exceeds the number of exceedances needed to assess the parameter as impaired in Table 3-13, however, all of the exceedances are < the MAGEXC criterion; or
2. For bacteria, there are no magnitude of exceedances of the geometric mean and/or no MAGEX of the single sample criterion;
3. the Benthic Index of Biological Integrity (B-IBI) marginal category in under development
4. For trophic class based assessments, the calculated median > criteria.
4A-P
The parameter is a pollutant which is assessed as an impairment per the CALM,
and an EPA-approved TMDL has been completed. However, the impairment is
more severe and causes poor water quality conditions, as defined below:
1. For parameters where the 10% rule is violated, at least 1 violation is an exceedance of the MAGEXC criterion; or
2. Non-support is based upon 2 or more exceedances of the MAGEXC criterion; or
3. For bacteria, there is at least one magnitude of exceedance of the geometric mean or
4. there are two or more exceedances of the single sample criterion with at least one exceeding the MAGEX; or
5. the Benthic Index of Biological Integrity (B-IBI) fails the bioregion criteria. 6. For trophic class based assessments, the calculated median > 2X criteria.
4B
4B-M
Parameter is a pollutant that is causing impairment as per the CALM but a TMDL
is not necessary since other controls are expected to attain water quality
standards within a reasonable time. The impairment is marginal as defined in
NHDES sub-category 4A-M above.
4B-P
Parameter is a pollutant that is causing impairment as per the CALM but a TMDL
is not necessary since other controls are expected to attain water quality
standards within a reasonable time. The impairment is more severe and causes
poor water quality as defined in NHDES sub-category 4A-P above.
4C
4C-M Parameter is not a pollutant but is causing impairment per the CALM. The
impairment is marginal as defined in NHDES sub-category 4A-M above.
4C-P
Parameter is not a pollutant but is causing impairment per the CALM. The
impairment is more severe and causes poor water quality as defined in NHDES
sub-category 4A-P above.

100
EPA
ATTAINS
Category
NHDES
Sub-
Category
Definition of NHDES Sub-Category for PARAMETERS
5
5-M Parameter is a pollutant that requires a TMDL. The impairment is marginal as
defined in NHDES sub-category 4A-M above.
5-P Parameter is a pollutant that requires a TMDL. The impairment is more severe
and causes poor water quality as defined in NHDES sub-category 4A-P above.
IV. Delineate Watersheds for Recovery Potential Screening
All lakes, rivers, impoundments and estuaries impaired for one or more of the NPS parameters
described in Section II, had a unique watershed delineated for it. Watersheds were delineated using
an automated ArcGIS model developed by Ken Edwardson, NHDES Senior Scientist. The tool uses a
flow direction raster, which has been modified with Walls (HUC12 boundaries), Breaches (NHD
network) and Sinks (NHD network) for each of the five HUC6 basins (i.e., Androscoggin, Connecticut,
Merrimack, Piscataqua and Saco).
After the watersheds were delineated/created, they were clipped to the New Hampshire borders.
This allowed for consistent data analysis, as some GIS coverages and data were only available for
New Hampshire. The watersheds were also clipped using the HUC12 boundaries that the AUID
resides in. For AUs that span multiple HUC12s, the watershed was clipped to include all appropriate
HUC12s. This provided a manageable and realistic extent for which watershed organizations might
seek grant funding to produce and implement a watershed management plan.
V. Delineate Watersheds for Protection Potential Screening
HUC12 sub-watersheds, which are small watersheds covering typically 10,000 to 40,000 acres were
used for the PPST analysis. The USGS has assigned Hydrologic Unit Codes (HUCs) from two to 12
digits long to watersheds across the country. These watersheds were delineated using topographical
features and local information. A HUC12 sub-watershed is the smallest watershed unit in the USGS
system and is denoted with a unique 12-digit code.
VI. Data Gathering
NHDES personnel used three primary methods to gather information on a variety of ecological,
stressor and social metrics (described below) to categorize watersheds by their recovery or
protection potential. The primary method used to gather data was through the use of ArcGIS
analyses. NHDES also queried data from internal databases, including the EMD and the SADB.
Some of the metrics were calculated at two levels. 1) The watershed level, which includes the area
delineated as part of Section III. 2) The Active River Area level, which is a framework based upon
dominant processes and disturbance regimes used to identify areas within which important physical
and ecological processes of the river or stream occur. The framework identifies five key
subcomponents of the active river area: 1) material contribution zones, 2) meander belts, 3) riparian

101
wetlands, 4) floodplains and 5) terraces. The Active River Area framework was developed by The
Nature Conservancy in 2009.
The Active River Area framework was mapped using a 30-meter Digital Elevation Model and
1:100,000 scale hydrography. The AUs were mapped using high resolution aerial imagery and
1:24,000 scale hydrography. Because of this difference in scale there were some AUs that did not
have an active river area to associate with. In these instances, the data analysis returned ‘no value’.
In these and in other instances where ‘no values’ were obtained (e.g., % stream miles or lake acres
in a watershed) the median value for the metric was calculated and used. This allowed for an
unbiased look across metrics. When this occurred a note was added to the record in the
spreadsheet for posterity.
Ecological Metrics R P Stressor Metrics R P Social Metrics R P
Watershed size X Watershed aquatic barriers
X X Watershed size X
Strahler Stream Order ≤ 3* X X Corridor road crossing density
X X Approved TMDL existence
X
Watershed % Number of 303(d) listed causes
X X Watershed-based plan X X
Instate area X Watershed % (a) through (i) Watershed-based Plan
X X
Stream miles unimpaired X Impervious area X X Jurisdictional complexity
X X
Lake acres unimpaired X Agriculture X Watershed population X
Natural cover X X Pasture X Number of drinking water intakes
X X
Forest X X Developed X X Assessment unit class X
Wetlands X X Active River Area % Local River Advisory Committee
X X
Natural services network X X Impervious area X X Watershed %
Active River Area % Agriculture X Protected land X
Natural cover X X Pasture X Stream miles assessed X
Forest X X Developed X X Lake acres assessed X
Wetlands X X Agriculture X
Pasture X
* Strahler Stream Order ≤ 3 was not included in the ecological metrics for the lakes restoration priority
assessment.
“R” – designates metrics used for recovery potential analysis
“P” – designates metrics used for protection potential analysis
“X” – designates metric was weighted in analysis

102
Ecological Metrics
Watershed Size – Full size of the watershed delineated for a particular AU, extending to the HUC6 or Basin level.
Watershed % In-state Area – The amount of area used to collect data relative to its full Watershed Size. Full watersheds were clipped to the New Hampshire border and to the HUC12 they resided in, as described in Section III.
Watershed % Stream Miles Unimpaired – All linear AUs that were within a particular watershed were captured and the stream miles were calculated. AUs were then compared to data housed in the SADB to determine their overall status. The sum of stream miles from unimpaired AUs were compared to the total number of stream miles to determine the percent unimpaired. If an AU was impaired for any parameter (not just stormwater), it was considered impaired.
Watershed % Lake Acres Unimpaired – All polygon type AUs (lakes, impoundments and estuaries) that were within a particular watershed were captured and the acres were calculated. AUs were then compared to data housed in the SADB to determine overall status. The sum of acres form unimpaired AUs were compared to the total number of acres to determine the percent unimpaired. If an AU was impaired for any parameter (not just stormwater), it was considered impaired.
Watershed % Natural Cover – Calculated as area of land within the watershed categorized in the 2016 National Land Cover Dataset (NLCD) as class: 52 (Shrub/Scrub), 71 (Grassland/Herbaceous), 90 (Woody Wetlands), 95 (Emergent Herbaceous Wetlands), 41 (Deciduous Forest), 42 (Evergreen Forest) and 43 (Mixed Forest).
Watershed % Forest – Calculated as area of land within the watershed categorized in the 2016 NLCD as class: 41 (Deciduous Forest), 42 (Evergreen Forest) and 43 (Mixed Forest).
Watershed % Wetlands – Calculated as area of wetlands within the watershed categorized in the 2016 NLCD as class: 90 (Woody Wetlands) and 95 (Emergent Herbaceous Wetlands).
Watershed % Natural Services Network – Calculated as area of Natural Services Network areas within the watershed. New Hampshire Audubon Society developed the Natural Services Network dataset, which includes lands that provide important ecological services that are difficult and expensive to replicate. Natural Services Networks include water supply lands, flood storage lands, productive soils and important wildlife habitat.
Active River Area % Natural Cover – Calculated as area of land within the active river area categorized in the 2016 NLCD as class: 52 (Shrub/Scrub), 71 (Grassland/Herbaceous), 90 (Woody Wetlands), 95 (Emergent Herbaceous Wetlands), 41 (Deciduous Forest), 42 (Evergreen Forest) and 43 (Mixed Forest).
Active River Area % Forest – Calculated as area of land within the active river area categorized in the 2016 NLCD as class: 41 (Deciduous Forest), 42 (Evergreen Forest) and 43 (Mixed Forest).
Active River Area % Wetlands – Calculated as area of wetlands within the active river area from the 2016 NLCD categorized as class: 90 (Woody Wetlands) and 95 (Emergent Herbaceous Wetlands).
Strahler Stream Order ≤ 3rd – Yes/No field describing if the river AU is less than or equal to third order. Lakes, impoundments and estuaries were entered as N/A.
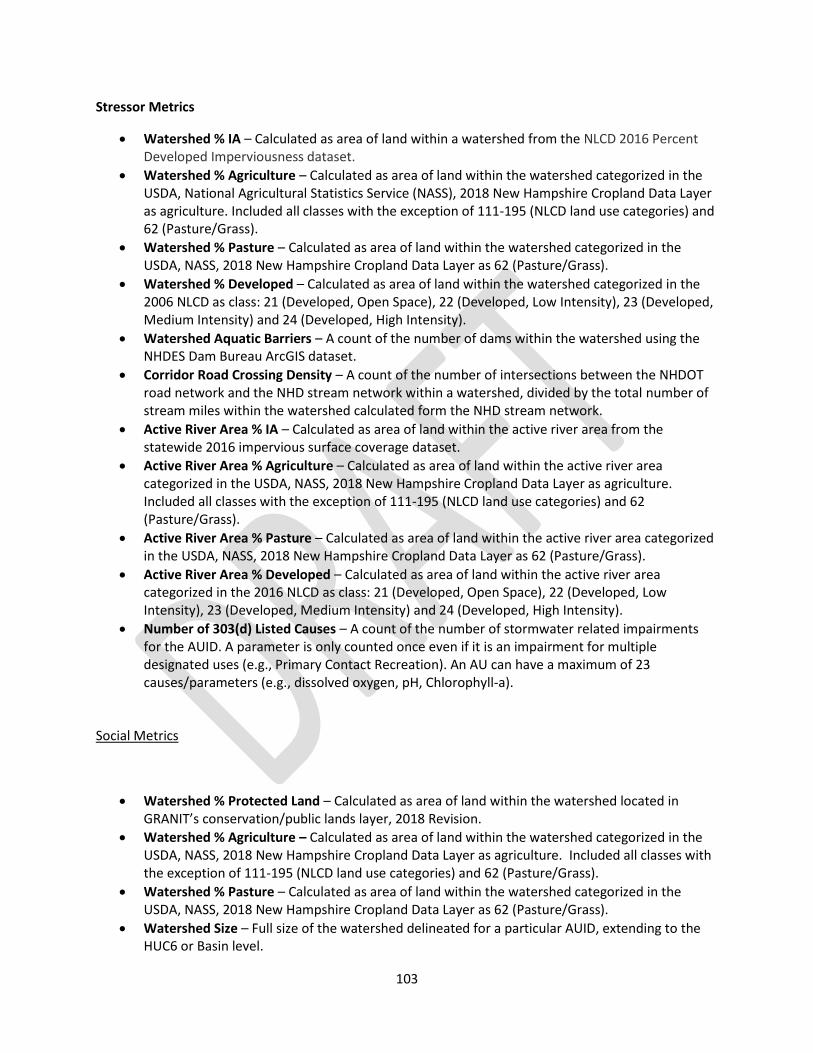
103
Stressor Metrics
Watershed % IA – Calculated as area of land within a watershed from the NLCD 2016 Percent Developed Imperviousness dataset.
Watershed % Agriculture – Calculated as area of land within the watershed categorized in the USDA, National Agricultural Statistics Service (NASS), 2018 New Hampshire Cropland Data Layer as agriculture. Included all classes with the exception of 111-195 (NLCD land use categories) and 62 (Pasture/Grass).
Watershed % Pasture – Calculated as area of land within the watershed categorized in the USDA, NASS, 2018 New Hampshire Cropland Data Layer as 62 (Pasture/Grass).
Watershed % Developed – Calculated as area of land within the watershed categorized in the 2006 NLCD as class: 21 (Developed, Open Space), 22 (Developed, Low Intensity), 23 (Developed, Medium Intensity) and 24 (Developed, High Intensity).
Watershed Aquatic Barriers – A count of the number of dams within the watershed using the NHDES Dam Bureau ArcGIS dataset.
Corridor Road Crossing Density – A count of the number of intersections between the NHDOT road network and the NHD stream network within a watershed, divided by the total number of stream miles within the watershed calculated form the NHD stream network.
Active River Area % IA – Calculated as area of land within the active river area from the statewide 2016 impervious surface coverage dataset.
Active River Area % Agriculture – Calculated as area of land within the active river area categorized in the USDA, NASS, 2018 New Hampshire Cropland Data Layer as agriculture. Included all classes with the exception of 111-195 (NLCD land use categories) and 62 (Pasture/Grass).
Active River Area % Pasture – Calculated as area of land within the active river area categorized in the USDA, NASS, 2018 New Hampshire Cropland Data Layer as 62 (Pasture/Grass).
Active River Area % Developed – Calculated as area of land within the active river area categorized in the 2016 NLCD as class: 21 (Developed, Open Space), 22 (Developed, Low Intensity), 23 (Developed, Medium Intensity) and 24 (Developed, High Intensity).
Number of 303(d) Listed Causes – A count of the number of stormwater related impairments for the AUID. A parameter is only counted once even if it is an impairment for multiple designated uses (e.g., Primary Contact Recreation). An AU can have a maximum of 23 causes/parameters (e.g., dissolved oxygen, pH, Chlorophyll-a).
Social Metrics
Watershed % Protected Land – Calculated as area of land within the watershed located in GRANIT’s conservation/public lands layer, 2018 Revision.
Watershed % Agriculture – Calculated as area of land within the watershed categorized in the USDA, NASS, 2018 New Hampshire Cropland Data Layer as agriculture. Included all classes with the exception of 111-195 (NLCD land use categories) and 62 (Pasture/Grass).
Watershed % Pasture – Calculated as area of land within the watershed categorized in the USDA, NASS, 2018 New Hampshire Cropland Data Layer as 62 (Pasture/Grass).
Watershed Size – Full size of the watershed delineated for a particular AUID, extending to the HUC6 or Basin level.

104
Approved TMDLs Existence – Yes/No field describing if there is a TMDL for one of the 23 stormwater parameters for the AU.
Watershed-Based Plan Existence – Yes/No field describing if a watershed-based plan has been created for the primary HUC12 that the AU is associated with. Looks at all watershed-based plans developed in New Hampshire through a variety of partnerships and funding mechanisms.
(a) through (i) Watershed-based Plan Existence – Yes/No field describing if the watershed-based plan adheres to EPA’s (a) through (i), nine, mandatory elements required for watershed-based planning methodology.
% of Stream Miles Assessed – All linear AUs that are within a particular watershed were captured and the stream miles were calculated. AUs were then compared to data housed in the SADB to determine its overall status. The sum of stream miles from all categories except 3-ND (no current data) were compared to the total number of stream miles to determine the percent assessed.
% of Lake Acres Assessed – All polygon type AUs (lakes, impoundments and estuaries) that are within a particular watershed were captured and the acres were calculated. AUs were then compared to data housed in the SADB to determine its overall status. The sum of acres from all categories except 3-ND (no current data) were compared to the total number of acres to determine the percent assessed.
Jurisdictional Complexity – A count of the number of New Hampshire municipalities that intersect the watershed.
Watershed Population – Calculated by intersecting the 2010 US census block population data with the watershed boundaries. Census blocks that were bisected by a watershed boundary were pro-rated using the proportion of area within the watershed. The population from all census blocks within a watershed were summed.
# of Drinking Water Intakes – A count of the number of community wells designated as active systems and having an active source, in the NHDES Drinking Water and Groundwater Bureau’s ArcGIS layer.
AUID Class – The designated use of the AU as described in RSA 485-A:8. Class A or B.
Watershed % MS4 – Calculated as area of land within the watershed covered by EPA’s MS4 General Permit.
Local River Advisory Committee – Yes/No field describing if the watershed intersects with a Designated River as defined under RSA 483. Once a river is designated, a volunteer LAC is formed and tasked with developing and implementing a River Management Plan so that the outstanding qualities of the river may be protected.
VII. Rank Data to Determine Recovery Potential and Protection Potential
In order to determine the recovery or protection potential of each of the watersheds relative to
each other, NHDES used a methodology developed by EPA.
The tool uses a semi-automated process/spreadsheet to generate a recovery or protection potential
score and rank for each watershed. The process involves:
Entering the raw data for each metric into the spreadsheet.
Normalizing indicator values to correct the unintentional weighting that would happen in a multi-metric index when some indicators measure values in thousands while others may be measured in fractions.
Assigning weights, if desired.

105
Calculate ecological, stressor and social indices. Within each of the three classes (ecological, stressor, social), a summary index is calculated for each watershed in the dataset by adding along each row all the normalized indicator values, dividing by the number of indicators you selected in that class, and then multiplying by 100.
Calculate the Recovery Potential Integrated (RPI) or Protection Potential Integrated (PPI) score. The RPI/PPI score is calculated by adding Ecological, Social and 100 minus the Stressor index values and dividing by three, for each watershed. A higher RPI score implies better recovery potential.
RPI or PPI Score = Ecological Index + Social Index + (100 – Stressor Index)
3
Rank-ordering. Rank-ordering organizes screened watersheds from highest to lowest recovery potential based on their RPI scores.
VIII. Mapping the Results
Once the rank order was determined using the RPST, NHDES was able to map the data in ArcGIS by
creating a simple join between NHDES’ AU coverages and an excel spreadsheet containing the AU
and rank. These maps group the RPI rank into three evenly distributed categories: low, medium and
high recovery potential. All AUs that were not impaired for a stormwater parameter were grouped
into their own category so that the full hydrography network could be shown on the maps at the
selected HUC8 scale. Recovery potential ranking maps are presented by HUC8 watersheds, Regional
Planning Commission service areas, and by Stormwater Coalitions in Appendices E, F, and G
respectively.
Similarly, once the rank order was determined using the PPST, NHDES was able to map the data in
ArcGIS by creating a simple join between NHDES’ HUC12 coverage and an excel spreadsheet
containing the HUC12 and rank. This map, included in Appendix I, groups the Protection Potential
rank into three evenly distributed categories: low, medium and high protection potential presented
at the statewide scale.

106
APPENDIX B: RIVER WATERSHEDS RECOVERY POTENTIAL RANKING LIST
Stormwater Impaired Watershed AUID Watershed Name
Recovery Potential Indicator
Score
Recovery Potential Indicator
Rank 2020-2024 Recovery
Potential
NHRIV600030902-02 OYSTER RIVER - CALDWELL BROOK 76.46 1 High
NHRIV600030902-03 OYSTER RIVER 75.13 2 High
NHRIV700020103-12 SHANNON BROOK - UNNAMED BROOK 73.11 3 High
NHRIV600031002-24 CHAPEL BROOK 73.00 4 High
NHRIV600030601-08 MAD RIVER 72.17 5 High
NHRIV600031002-23 TRIB TO CHAPEL BROOK 72.10 6 High
NHRIV700060904-07 PURGATORY BROOK 71.86 7 High
NHRIV600030902-01 UNNAMED TRIBUTARY - TO WHEELWRIGHT POND 70.85 8 High
NHRIV600030704-07 MOUNTAIN BROOK - UNNAMED BROOKS 70.79 9 High
NHRIV700010603-19 KENDALL BROOK 70.73 10 High
NHRIV801060101-16 CANAAN STREET LAKE-INLET AT FERNWOOD FARMS 70.73 11 High
NHRIV600030903-07 BELLAMY RIVER 70.66 12 High
NHRIV700030403-09 BRADLEY BROOK - UNNAMED BROOK 70.54 13 High
NHRIV802010101-08 ASHUELOT RIVER 70.36 14 High
NHRIV600031002-10 EEL POND OUTLET TO ATLANTIC OCEAN 70.31 15 High
NHRIV600030902-04 OYSTER RIVER - CHELSEY BROOK 70.22 16 High
NHRIV700020103-08 WEED BROOK - UNNAMED BROOK 70.08 17 High
NHRIV801060101-09 UNNAMED BROOK - TO NORTH INLET OF CANAAN STREET LAKE 69.86 18 High
NHRIV600031002-03 PARSONS CREEK EAST 69.86 19 High
NHRIV600030607-16 SCRUTON POND OUTLET BROOK 69.75 20 High
NHRIV700060102-07 TANNERY BROOK - COLD BROOK 69.47 21 High
NHRIV600020201-01 SWIFT RIVER - MEADOW BROOK 69.45 22 High
NHRIV600030902-05 OYSTER RIVER - UNNAMED BROOK 69.42 23 High

107
Stormwater Impaired Watershed AUID Watershed Name
Recovery Potential Indicator
Score
Recovery Potential Indicator
Rank 2020-2024 Recovery
Potential
NHRIV600030603-02 POKAMOONSHINE BROOK 69.35 24 High
NHRIV600030904-21 UNNAMED BROOK - TO GREAT BAY 69.17 25 High
NHRIV600030605-14 STONEHOUSE BROOK - HALL BROOK 69.12 26 High
NHRIV600020702-02 DAN HOLE RIVER 69.01 27 High
NHRIV600030603-04 RATTLESNAKE RIVER 68.95 28 High
NHRIV700060901-17 APPLETON-GIBBS BROOK 68.77 29 High
NHRIV600020202-07 FALLS BROOK - CILLEY BROOK 68.76 30 High
NHRIV600030606-06 BERRY RIVER - FROM LONG POND TO ISINGLASS RIVER 68.63 31 High
NHRIV600030902-06 LONGMARSH BROOK - BEAUDETTE BROOK 68.49 32 High
NHRIV600030703-04 DUDLEY BROOK - UNNAMED BROOK 68.45 33 High
NHRIV801070201-08 COLD RIVER - UNDERWOOD BROOK 68.40 34 High
NHRIV600030902-14 HORSEHIDE BROOK 68.38 35 High
NHRIV801010405-01 CONE BROOK - UNNAMED BROOK 68.28 36 High
NHRIV700060906-01 BEAVER BROOK 68.23 37 High
NHRIV700060302-08 HAYWARD BROOK 68.17 38 High
NHRIV600030903-06 BELLAMY RIVER - UNNAMED BROOK 68.16 39 High
NHRIV600030702-06 NORTH BRANCH RIVER - UNNAMED BROOKS 68.09 40 High
NHRIV600031002-01 BERRYS BROOK 68.08 41 High
NHRIV801040204-06 ROBINSON DETENTION POND EAST INLET 68.07 42 High
NHRIV700020101-03 WILEY BROOK 68.02 43 High
NHRIV700010603-01 CILLEY BROOK - FRETTS BROOK 67.87 44 High
NHRIV600030608-16 JACKSON BROOK 67.83 45 High
NHRIV600030401-02 PIKE BROOK 67.80 46 High
NHRIV600030601-09 COCHECO RIVER 67.74 47 High
NHRIV801010102-02 CONNECTICUT R - UNNAMED BRK - BIG BRK - COZZIE BRK - SMITH BRK - DRY BRK 67.66 48 High

108
Stormwater Impaired Watershed AUID Watershed Name
Recovery Potential Indicator
Score
Recovery Potential Indicator
Rank 2020-2024 Recovery
Potential
NHRIV600030707-07 LITTLE RIVER 67.65 49 High
NHRIV801040402-04 HEWES BROOK 67.64 50 High
NHRIV700010603-16 CAMP ONAWAY BROOK 67.62 51 High
NHRIV600020902-07 SOUTH RIVER - TO PROVINCE LAKE 67.60 52 High
NHRIV600030605-16 ISINGLASS RIVER 67.47 53 High
NHRIV600030701-01 LAMPREY RIVER - AND HEADWATER TRIBUTARIES 67.42 54 High
NHRIV600030802-10 TOWLE BROOK - TO PANDOLPIN DAM 67.18 55 High
NHRIV600020301-03 EAST BRANCH SACO RIVER - UNNAMED BROOK - GARDINER BROOK - WHITTEN BROOK 67.11 56 High
NHRIV801030701-05 OLIVERIAN BROOK - UNNAMED BROOK - MORRIS BROOK 67.04 57 High
NHRIV700030302-08 DAVIS BROOK 67.00 58 High
NHRIV600030702-07 NORTH BRANCH RIVER - UNNAMED BROOKS 66.98 59 High
NHRIV600030606-04 BERRYS RIVER - UNNAMED BROOK 66.97 60 High
NHRIV700061101-05 TAYLOR BROOK 66.91 61 High
NHRIV700010205-09 MILL BROOK 66.90 62 High
NHRIV801070201-03 UNNAMED BROOK - TO CRESCENT LAKE FROM NORTHEAST INLET 66.72 63 High
NHRIV600020104-03 WILDCAT BROOK 66.69 64 High
NHRIV600030605-05 MOHAWK BROOK 66.68 65 High
NHRIV600030608-02 BLACKWATER BROOK-CLARK BROOK 66.66 66 High
NHRIV801070201-01 COLD RIVER 66.61 67 High
NHRIV700060603-07 PISCATAQUOG RIVER 66.53 68 High
NHRIV600030707-02 HOWE BROOK 66.52 69 High
NHRIV700030502-10 AMEY BROOK 66.46 70 High
NHRIV801010704-04 PHILLIPS BROOK - JODRIE BROOK - NUMBER TWO BROOK - UNNAMED BROOK 66.45 71 High
NHRIV600030806-09 UNNAMED BROOK - TO SQUAMSCOTT RIVER 66.38 72 High

109
Stormwater Impaired Watershed AUID Watershed Name
Recovery Potential Indicator
Score
Recovery Potential Indicator
Rank 2020-2024 Recovery
Potential
NHRIV700060606-05 SOUTH BRANCH PISCATAQUOG RIVER 66.38 73 High
NHRIV700010301-04 BAKER RIVER - BATCHELDER BROOK 66.31 74 High
NHRIV700010602-05 FOWLER RIVER - UNNAMED BROOK 66.21 75 High
NHRIV801010704-03 PHILLIPS BRK - W BRANCH PHILLIPS - NELSON - WATKINSON - WELLS BRKS - AND TRIBS 66.19 76 High
NHRIV600020301-04 EAST BRANCH SACO RIVER - UNNAMED BROOK 66.16 77 High
NHRIV600030903-08 BELLAMY RIVER - KELLY BROOK - KNOX MARSH BROOK 66.14 78 High
NHRIV600030401-08 BRANCH RIVER 66.12 79 High
NHRIV600030402-04 JONES BROOK - HART BROOK 66.11 80 High
NHRIV700060503-16 BEAR BROOK 66.05 81 High
NHRIV802010101-20 UNNAMED BROOK - TO SAND POND 66.02 82 High
NHRIV700060501-22 PERRY BROOK - SANBORN BROOK 66.01 83 High
NHRIV700060906-12 GREAT BROOK - OX BROOK 65.98 84 High
NHRIV801010301-02 BISHOP BROOK - POND BROOK 65.97 85 High
NHRIV700010402-09 BEEBE RIVER 65.92 86 High
NHRIV600030802-03 EXETER RIVER 65.92 87 High
NHRIV600031001-03 SAGAMORE CREEK 65.87 88 High
NHRIV700010302-06 ORE HILL BROOK 65.86 89 High
NHRIV801060701-05 CHASE BROOK 65.85 90 High
NHRIV700010403-03 BOG BROOK 65.84 91 High
NHRIV700020201-20 GOVERNORS PARK STREAM 65.82 92 High
NHRIV700060901-08 FURNACE BROOK 65.78 93 High
NHRIV700060901-04 STARK BROOK 65.76 94 High
NHRIV802010303-11 QUARRY BROOK - UNNAMED BROOK 65.76 95 High
NHRIV700030104-29 GRIDLEY RIVER - UNNAMED BROOK 65.75 96 High
NHRIV700060607-15 HARRY BROOK 65.66 97 High

110
Stormwater Impaired Watershed AUID Watershed Name
Recovery Potential Indicator
Score
Recovery Potential Indicator
Rank 2020-2024 Recovery
Potential
NHRIV700010404-01 UNNAMED BROOK ALONG MEADOWVIEW DR 65.65 98 High
NHRIV700020101-22 NORTH INLET TO RUST POND 65.63 99 High
NHRIV600020802-05 RED BROOK 65.63 100 High
NHRIV700060901-09 SOUHEGAN RIVER - FURNACE BROOK 65.62 101 High
NHRIV700060604-10 RAND BROOK 65.53 102 High
NHRIV801030401-09 DARTMOUTH BROOK - TO AMMONOOSUC RIVER 65.53 103 High
NHRIV700060905-13 MCQUADE BROOK 65.48 104 High
NHRIV600030904-06 PICKERING BROOK 65.47 105 High
NHRIV700010401-06 SNOWS BROOK 65.47 105 High
NHRIV700020202-18 NORTHERN INLET TO SAWYER LAKE 65.45 107 High
NHRIV801030504-01 WILD AMMONOOSUC R - CLAY - STONY - BLACK - OLESONS - STARK FALLS -UNDERHILL BRKS 65.42 108 High
NHRIV700060301-13 TURKEY RIVER - BOW BROOK 65.42 109 High
NHRIV801070507-01 WEST RIVER - ASH SWAMP BROOK - LILY POND BROOK - UNNAMED BROOK 65.41 110 High
NHRIV801060106-04 BLODGETT BROOK 65.40 111 High
NHRIV801030401-03 SEBOSIS BROOK 65.34 112 High
NHRIV801040204-02 GRANT BROOK 65.29 113 High
NHRIV600030607-03 AYERS POND BROOK 65.25 114 High
NHRIV700060602-06 PISCATAQUOG RIVER - CENTER BROOK 65.19 115 High
NHRIV801010902-02 CONNECTICUT RIVER 65.19 116 High
NHRIV600030901-02 WINNICUT RIVER - BARTON BROOK - MARSH BROOK - THOMPSON BROOK 65.18 117 High
NHRIV600030903-09 BELLAMY RIVER - UNNAMED BROOK 65.18 118 High
NHRIV700060202-09 SHAKER BRANCH 65.12 119 High
NHRIV700030101-37 SUNSET LANE BROOK 65.05 120 High

111
Stormwater Impaired Watershed AUID Watershed Name
Recovery Potential Indicator
Score
Recovery Potential Indicator
Rank 2020-2024 Recovery
Potential
NHRIV700060402-03 NIGHTHAWK HOLLOW BROOK - VARNEY BROOK - UNNAMED BROOK 65.05 121 High
NHRIV801010403-01 SIMMS STR - EAST BR SIMMS STR - UNNAMED BRK - URAN BRK - MORAN BRK - BOY BRK 65.04 122 High
NHRIV802020202-07 LAUREL LAKE-KEENE AVE TRIB 65.04 123 High
NHRIV700060801-05-01 BLACK BROOK - HARDY BROOK 65.02 124 High
NHRIV400010502-01 CLEAR STREAM - FLUME BROOK - UNNAMED BROOK - CASCADE BROOK 65.00 125 High
NHRIV600030902-13 JOHNSON CREEK - GERRISH BROOK 64.99 126 High
NHRIV801010803-01 STAG HOLLOW BROOK - UNNAMED BROOK 64.96 127 High
NHRIV801030201-01 CUSHMAN BROOK 64.89 128 High
NHRIV700061001-06 MUDDY BROOK - UNNAMED BROOK 64.85 129 High
NHRIV600030708-07 PISCASSIC RIVER 64.84 130 High
NHRIV700060902-13 SOUHEGAN RIVER 64.83 131 High
NHRIV600020902-06 PROVINCE LAKE-ISLAND INLET 64.78 132 High
NHRIV700020109-01 HAWKINS BROOK - TO PRESCOTT PARK DAM 64.75 133 High
NHRIV801060105-08 LOVEJOY BROOK - SCALES BROOK - UNNAMED BROOK 64.72 134 High
NHRIV700060604-09 BRENNAN BROOK 64.69 135 High
NHRIV801030401-10 MT STICKNEY BROOK - TRIBUTARY TO CRAWFORD BK 64.67 136 High
NHRIV700060201-09 GUES MEADOW BROOK 64.67 137 High
NHRIV700010206-05 WEST BRANCH BROOK - GREAT BROOK 64.66 138 High
NHRIV700010401-17 MAD RIVER 64.60 139 High
NHRIV700010804-18 LAKE AVE TRIB 64.59 140 High
NHRIV801070201-11 DODGE BROOK - UNNAMED BROOK 64.59 140 High
NHRIV700030403-17 BLACKWATER RIVER 64.53 142 High
NHRIV700010804-05 SUCKER BROOK - UNNAMED BROOKS 64.53 143 High
NHRIV700010602-09 BOG BROOK 64.49 144 High

112
Stormwater Impaired Watershed AUID Watershed Name
Recovery Potential Indicator
Score
Recovery Potential Indicator
Rank 2020-2024 Recovery
Potential
NHRIV600030603-01 COCHECO RIVER 64.47 145 High
NHRIV700010401-05 TECUMSEH BROOK 64.45 146 High
NHRIV801070503-07 WASES GROVE INLET 64.44 147 High
NHRIV700010804-07 SUCKER BROOK - UNNAMED BROOK 64.43 148 High
NHRIV700060607-20 CATAMOUNT BROOK 64.43 149 High
NHRIV801060105-05 MASCOMA RIVER 64.42 150 High
NHRIV700020202-11 BADGER BROOK 64.40 151 High
NHRIV700060905-18 RIDDLE BROOK 64.38 152 High
NHRIV600020202-05-01 SWIFT RIVER - UNNAMED BROOK 64.34 153 High
NHRIV802010103-22 ASHUELOT RIVER 64.33 154 High
NHRIV802010101-19 UNNAMED BROOK - TO SAND POND 64.33 155 Medium
NHRIV600030904-09 KNIGHT BRANCH 64.28 156 Medium
NHRIV700060607-02 BOG BROOK 64.22 157 Medium
NHRIV600020106-08 MEADOW BROOK - SACO RIVER - UNNAMED BROOK - BARTLETT BROOK - STONY BROOK 64.20 158 Medium
NHRIV600030902-16 WENDYS BROOK 64.15 159 Medium
NHRIV600020203-07 SWIFT RIVER 64.13 160 Medium
NHRIV600030801-05 FORDWAY BROOK - UNNAMED BROOK 64.13 161 Medium
NHRIV801070503-10 SEAMANS INLET 64.11 162 Medium
NHRIV700060502-30 LYNN GROVE BROOK 64.11 163 Medium
NHRIV700060901-05 SOUHEGAN RIVER - WEST SOUHEGAN RIVER 64.10 164 Medium
NHRIV801010303-02 HALLS STREAM 64.09 165 Medium
NHRIV801010806-06 ISRAEL RIVER 64.03 166 Medium
NHRIV801070202-09 CRANE BROOK - UNNAMED BROOK 63.97 167 Medium
NHRIV600030902-08 HAMEL BROOK - LONGMARSH BROOK 63.96 168 Medium
NHRIV700010803-07 WEEKS BROOK 63.95 169 Medium

113
Stormwater Impaired Watershed AUID Watershed Name
Recovery Potential Indicator
Score
Recovery Potential Indicator
Rank 2020-2024 Recovery
Potential
NHRIV700060904-13 SOUHEGAN RIVER - STONY BROOK 63.94 170 Medium
NHRIV802010302-06 UNNAMED BROOK - PINE INLET B 63.92 171 Medium
NHRIV700061403-18 BACK RIVER - UNNAMED BROOK 63.88 172 Medium
NHRIV600030709-07 LAMPREY RIVER 63.88 173 Medium
NHRIV700020110-01 FOOTE POND BROOK - TO PICKEREL COVE PAUGUS BAY 63.86 174 Medium
NHRIV801010405-03 CONNECTICUT RIVER 63.84 175 Medium
NHRIV600030805-04 GREAT BROOK - BRICKYARD BROOK - HOBBS BROOK - YORK BROOK 63.83 176 Medium
NHRIV700060502-11 GULF BROOK - UNNAMED BROOK 63.83 177 Medium
NHRIV700060502-05 FLAT MEADOW BROOK 63.79 178 Medium
NHRIV600030701-09 LAMPREY RIVER 63.78 179 Medium
NHRIV600030603-06 COCHECO RIVER 63.73 180 Medium
NHRIV600030608-03 COCHECO RIVER - UNNAMED BROOK 63.73 181 Medium
NHRIV600030805-02 EXETER RIVER 63.70 182 Medium
NHRIV700060905-12 MCQUADE BROOK 63.69 183 Medium
NHRIV802010303-12 SOUTH BRANCH ASHUELOT RIVER 63.68 184 Medium
NHRIV801060102-03 INDIAN RIVER - UNNAMED BROOK 63.66 185 Medium
NHRIV802010102-11 ASHUELOT RIVER - UNNAMED BROOK 63.64 186 Medium
NHRIV600030706-02 NORTH RIVER 63.64 187 Medium
NHRIV700060502-20 UNNAMED BROOK - TO JENNESS POND 63.63 188 Medium
NHRIV700060606-02 SOUTH BRANCH PISCATAQUOG RIVER 63.61 189 Medium
NHRIV600030401-10 UNNAMED BROOK - TO BRACKETT POND 63.61 190 Medium
NHRIV802010402-06 MIREY BROOK - BLACK BROOK 63.57 191 Medium
NHRIV801060106-05 BLODGETT BROOK - UNNAMED BROOK 63.56 192 Medium
NHRIV600020802-07 WEETAMOE BROOK 63.54 193 Medium
NHRIV700020201-22 HUEBER BROOK 63.51 194 Medium

114
Stormwater Impaired Watershed AUID Watershed Name
Recovery Potential Indicator
Score
Recovery Potential Indicator
Rank 2020-2024 Recovery
Potential
NHRIV801070202-04 COLD RIVER - BOWERS BROOK 63.49 195 Medium
NHRIV400020102-02 PEABODY RIVER - COWBOY BROOK - NINETEEN BROOK 63.47 196 Medium
NHRIV600030608-10 ROLLINS BROOK 63.46 197 Medium
NHRIV801070201-09 UNNAMED BROOK - DODGE POND NORTH INLET 63.44 198 Medium
NHRIV600030803-01 EXETER RIVER 63.43 199 Medium
NHRIV801060105-11 MASCOMA RIVER - UNNAMED BROOK 63.40 200 Medium
NHRIV700060302-33 UNNAMED BROOK - TO MERRIMACK RIVER 63.38 201 Medium
NHRIV600020604-06 CHOCORUA RIVER 63.35 202 Medium
NHRIV600030708-02 PISCASSIC RIVER - UNNAMED BROOK 63.34 203 Medium
NHRIV801060402-04 BUCKLIN BROOK - TO LITTLE SUNAPEE LAKE 63.33 204 Medium
NHRIV802020102-03 PRIEST BROOK 63.27 205 Medium
NHRIV802010104-08 DART BROOK 63.26 206 Medium
NHRIV802010202-16 MINNEWAWA BROOK - ROBBINS BROOK - UNNAMED BROOK 63.22 207 Medium
NHRIV700061403-05 BARTLETT BROOK - COLBY BROOK - UNNAMED BROOK 63.19 208 Medium
NHRIV600030601-07 DAMES BROOK 63.18 209 Medium
NHRIV802020203-05 TULLY BROOK - UNNAMED BROOKS 63.15 210 Medium
NHRIV700060902-05 SOUHEGAN RIVER - TUCKER BROOK 63.12 211 Medium
NHRIV801010806-09 ISRAEL RIVER 63.11 212 Medium
NHRIV700040301-05 SQUANNACOOK RIVER - WALKER BROOK 63.07 213 Medium
NHRIV600030701-08 HARTFORD BROOK 63.02 214 Medium
NHRIV801030703-02 CLARK BROOK - UNNAMED BROOK 63.02 215 Medium
NHRIV801070203-09 COLD RIVER 63.00 216 Medium
NHRIV600030803-07 LITTLE RIVER - UNNAMED BROOK 63.00 217 Medium
NHRIV600020105-07 ELLIS RIVER - UNNAMED BROOK 62.98 218 Medium
NHRIV700061203-09 BEAVER BROOK 62.96 219 Medium
NHRIV700020107-08 UNNAMED BROOK TO SANDERS BAY 62.91 220 Medium

115
Stormwater Impaired Watershed AUID Watershed Name
Recovery Potential Indicator
Score
Recovery Potential Indicator
Rank 2020-2024 Recovery
Potential
NHRIV700020109-02 HAWKINS BROOK - TO MERIDETH BAY 62.86 221 Medium
NHRIV400010405-05 DEAD DIAMOND RIVER 62.84 222 Medium
NHRIV700061001-07 PENNICHUCK BROOK - WITCHES BROOK 62.81 223 Medium
NHRIV600030607-04 AYERS POND BROOK 62.80 224 Medium
NHRIV600020302-05-02 KEARSARGE BROOK - UNNAMED BROOK - ARTIST BROOK 62.80 225 Medium
NHRIV600030607-10 ISINGLASS RIVER 62.79 226 Medium
NHRIV700010802-10 SALMON BROOK 62.76 227 Medium
NHRIV802010403-20 ASHUELOT RIVER - 300FT US OF HINSDALE WWTF TO CONNECTICUT R 62.75 228 Medium
NHRIV700010305-11 BAKER RIVER 62.74 229 Medium
NHRIV801060106-03 HARDY HILL BROOK - UNNAMED BROOK 62.72 230 Medium
NHRIV700030104-02 GRIDLEY RIVER 62.69 231 Medium
NHRIV801030403-09 BAKER BROOK - UNNAMED BROOK 62.68 232 Medium
NHRIV600020602-08 COLD RIVER 62.65 233 Medium
NHRIV700061403-17 POWWOW RIVER - UNNAMED BROOK - GRASSY BROOK 62.62 234 Medium
NHRIV700060905-19 BABOOSIC BROOK - RIDDLE BROOK 62.57 235 Medium
NHRIV802010202-44 ALDRIDGE 62.55 236 Medium
NHRIV700060703-05 COHAS BROOK - LONG POND BROOK 62.54 237 Medium
NHRIV700061001-02 WITCHES BROOK 62.50 238 Medium
NHRIV600030806-01 NORRIS BROOK 62.49 239 Medium
NHRIV700010601-05 COCKERMOUTH BROOK 62.47 240 Medium
NHRIV700010702-02 WILD MEADOW BROOK 62.45 241 Medium
NHRIV600030805-09 EXETER RIVER 62.39 242 Medium
NHRIV600020703-05 POLAND BROOK 62.33 243 Medium
NHRIV700060201-10 GUES MEADOW BROOK 62.29 244 Medium
NHRIV700061203-22 BEAVER BROOK 62.27 245 Medium

116
Stormwater Impaired Watershed AUID Watershed Name
Recovery Potential Indicator
Score
Recovery Potential Indicator
Rank 2020-2024 Recovery
Potential
NHRIV700061203-16 BEAVER BROOK 62.22 246 Medium
NHRIV801070502-04 CHICKERING FARM BROOK 62.20 247 Medium
NHRIV600030608-04 REYNERS BROOK 62.15 248 Medium
NHRIV600030708-14 BROWN BROOK - TO PISCASSIC RIVER 62.15 248 Medium
NHRIV700020201-16 JEWETT BROOK 62.12 250 Medium
NHRIV600020203-06 SWIFT RIVER 62.06 251 Medium
NHRIV600030903-13 GARRISON BROOK 62.01 252 Medium
NHRIV700030202-24 NORTH BRANCH - JACKMAN RES TO BEARDS BK 61.99 253 Medium
NHRIV600030901-03 HAINES BROOK 61.92 254 Medium
NHRIV600030901-01 WINNICUT RIVER - UNNAMED BROOK - CORNELIUS BROOK 61.88 255 Medium
NHRIV700040301-03 WALKER BROOK 61.82 256 Medium
NHRIV600020203-01 SWIFT RIVER - UNNAMED BROOK - DEER BROOK - BIG BROOK 61.81 257 Medium
NHRIV600020804-03 PHILLIPS BROOK 61.80 258 Medium
NHRIV700030106-08 CONTOOCOOK RIVER - OTTER BK TO POWDER MILL POND 61.79 259 Medium
NHRIV600030803-05 EXETER RIVER 61.78 260 Medium
NHRIV700040401-04 SCAB MILL BROOK - UNNAMED BROOK 61.75 261 Medium
NHRIV700030304-31 PLEASANT POND BROOK - TO TOM POND 61.73 262 Medium
NHRIV700060801-05-02 BLACK BROOK 61.69 263 Medium
NHRIV802010403-19 ASHUELOT RIVER 61.68 264 Medium
NHRIV700060905-17 BABOOSIC BROOK - MCQUADE BROOK 61.68 265 Medium
NHRIV802010303-13 SOUTH BRANCH ASHUELOT RIVER - UNNAMED BROOK 61.68 266 Medium
NHRIV600030901-05 PACKER BROOK 61.65 267 Medium
NHRIV700060301-11 TURKEY RIVER - UNNAMED BROOK 61.65 268 Medium
NHRIV700060906-13 SOUHEGAN RIVER 61.62 269 Medium
NHRIV801070203-07 GREAT BROOK - UNNAMED BROOK - LITTLE BROOK - UNNAMED TRIB TO TLITTLE BROOK 61.59 270 Medium

117
Stormwater Impaired Watershed AUID Watershed Name
Recovery Potential Indicator
Score
Recovery Potential Indicator
Rank 2020-2024 Recovery
Potential
NHRIV600030804-11 LITTLE RIVER - SCAMEN BROOK 61.58 271 Medium
NHRIV600030607-01 ISINGLASS RIVER 61.58 272 Medium
NHRIV801010805-06 OTTER BROOK - UNNAMED BROOK 61.55 273 Medium
NHRIV700030202-06 NORTH BRANCH - BAILEY BROOK 61.52 274 Medium
NHRIV801070203-04 COLD RIVER - WARREN BROOK - UNNAMED BROOK 61.52 275 Medium
NHRIV600031001-09 BORTHWICK AVE TRIBUTARY 61.46 276 Medium
NHRIV801030102-08 JOHNS RIVER - CHASE BROOK 61.44 277 Medium
NHRIV600030608-05 COCHECO RIVER 61.38 278 Medium
NHRIV802010303-23 SOUTH BRANCH ASHUELOT RIVER 61.36 279 Medium
NHRIV700060906-18 SOUHEGAN RIVER 61.35 280 Medium
NHRIV600030804-10 LITTLE RIVER 61.31 281 Medium
NHRIV700060906-16 SOUHEGAN RIVER 61.29 282 Medium
NHRIV600030608-11 FRESH CREEK 61.25 283 Medium
NHRIV600030901-07 WINNICUT RIVER - UNNAMED BROOK 61.24 284 Medium
NHRIV600030703-01 UNNAMED BROOK - TO ONWAY LAKE 61.21 285 Medium
NHRIV700060302-34 UNNAMED BROOK - TO MERRIMACK RIVER 61.17 286 Medium
NHRIV700061401-04 KELLY BROOK - SEAVER BROOK 61.14 287 Medium
NHRIV700030101-16 CONTOOCOOK RIVER - UNNAMED BROOK 61.06 288 Medium
NHRIV600030901-06 NORTON BROOK 61.04 289 Medium
NHRIV600030806-04 PARKMAN BROOK 61.03 290 Medium
NHRIV801060402-17 UNNAMED BROOK - TO HERRICK COVE SUNAPEE LAKE 61.03 291 Medium
NHRIV700061203-11 BEAVER BROOK 61.00 292 Medium
NHRIV600030703-18 LAMPREY RIVER 60.97 293 Medium
NHRIV801030403-01 AMMONOOSUC RIVER - UNNAMED BROOK 60.93 294 Medium
NHRIV600030703-14 PAWTUCKAWAY RIVER - UNNAMED BROOK 60.93 295 Medium
NHRIV400020101-11 MOOSE BROOK 60.92 296 Medium

118
Stormwater Impaired Watershed AUID Watershed Name
Recovery Potential Indicator
Score
Recovery Potential Indicator
Rank 2020-2024 Recovery
Potential
NHRIV801010404-02 CONNECTICUT RIVER 60.89 297 Medium
NHRIV801070503-08 CAMP SPOFFORD INLET - UNNAMED BROOK 60.88 298 Medium
NHRIV600030703-15 LAMPREY RIVER 60.82 299 Medium
NHRIV801010603-05 CONNECTICUT RIVER 60.81 300 Medium
NHRIV700030104-17 CONTOOCOOK RIVER - NORTH VILLAGE DAM TO US OF PETERBOROUGH WWTF 60.81 301 Medium
NHRIV700010307-11 BAKER RIVER 60.78 302 Medium
NHRIV700061002-04 NESENKEAG BROOK 60.73 303 Medium
NHRIV700030304-16 WARNER RIVER 60.71 304 Medium
NHRIV801030506-02 PETTYBORO BROOK - UNNAMED BROOK - MOULTON HILL BROOK 60.65 305 Medium
NHRIV600030902-11 LITTLEHOLE CREEK 60.65 306 Medium
NHRIV700060902-21 UNNAMED TRIB. TO THE SOUHEGAN RIVER 60.65 306 Medium
NHRIV700061002-05 NESENKEAG BROOK 60.63 308 Medium
NHRIV600020303-07 PEQUAWKET BROOK 60.55 309 Low
NHRIV700010302-03 BAKER RIVER 60.54 310 Low
NHRIV802010303-20 SOUTH BRANCH ASHUELOT RIVER 60.52 311 Low
NHRIV801030402-04 AMMONOOSUC RIVER - UNNAMED BROOK - CRAWFORD BROOK - DECEPTION BROOK 60.49 312 Low
NHRIV700030101-11 CONTOOCOOK RIVER - UNNAMED BROOK 60.49 313 Low
NHRIV700010603-18 NUTTINGS BEACH BROOK 60.43 314 Low
NHRIV600030608-08 FRESH CREEK - TWOMBLY BROOK 60.40 315 Low
NHRIV801060303-04 WINE BROOK 60.40 316 Low
NHRIV801030403-03 AMMONOOSUC RIVER 60.37 317 Low
NHRIV802010303-18 SOUTH BRANCH ASHUELOT RIVER 60.31 318 Low
NHRIV802010401-19 ASHUELOT RIVER - 3000 FT DS OF SWANZEY WWTF TO OLD WINCHESTER DAM 60.30 319 Low

119
Stormwater Impaired Watershed AUID Watershed Name
Recovery Potential Indicator
Score
Recovery Potential Indicator
Rank 2020-2024 Recovery
Potential
NHRIV600030904-05 FOSS BROOK 60.30 320 Low
NHRIV802010401-15 ASHUELOT RIVER - SOUTH BRANCH TO UNNAMED BROOK 3000' US OF THOMPSON BRIDGE 60.28 321 Low
NHRIV801070203-08 GREAT BROOK - RAM BROOK - UNNAMED BROOK 60.23 322 Low
NHRIV802010401-16 ASHUELOT RIVER - ~3000 UPSTREAM OF THOMPSON BRDG TO 300 FT US OF SWANZEY WWTF 60.21 323 Low
NHRIV600031001-01 PICKERING BROOK -FLAGSTONE BROOK 60.17 324 Low
NHRIV801070503-02 PARTRIDGE BROOK - UNNAMED BROOK 60.16 325 Low
NHRIV400010606-02 DEAD RIVER - JERICHO BROOK - UNNAMED BROOK 60.15 326 Low
NHRIV801060404-11 NORTH BRANCH SUGAR RIVER - PERKINS BROOK 60.11 327 Low
NHRIV801060403-12 SOUTH BRANCH SUGAR RIVER - GUNNISON BROOK 60.05 328 Low
NHRIV801030403-11 AMMONOOSUC RIVER 59.98 329 Low
NHRIV801040401-05 MINK BROOK 59.92 330 Low
NHRIV700010203-01 PEMIGEWASSET RIVER 59.90 331 Low
NHRIV802010302-07 PINE INLET A 59.90 331 Low
NHRIV600030603-08 COCHECO RIVER 59.86 333 Low
NHRIV600030608-06 INDIAN BROOK 59.85 334 Low
NHRIV600030804-06 DUDLEY BROOK - UNNAMED BROOK 59.84 335 Low
NHRIV801060703-06 CLAY BROOK - UNNAMED BROOK 59.63 336 Low
NHRIV700010402-12 UNNAMED BROOK - TO BEEBE RIVER 59.56 337 Low
NHRIV700061002-26 NESENKEAG BROOK - UNNAMED BROOK 59.53 338 Low
NHRIV600030904-13 SHAW BROOK 59.50 339 Low
NHRIV802010202-23 BEAVER BROOK - UNNAMED BROOK 59.48 340 Low
NHRIV802010201-18 OTTER BROOK - SPAULDING BROOK - MEETINGHOUSE BROOK - UNNAMED BROOK 59.47 341 Low
NHRIV700060804-05 LITTLE COHAS BROOK - UNNAMED BROOK 59.47 342 Low
NHRIV700061403-14 POWWOW RIVER 59.46 343 Low

120
Stormwater Impaired Watershed AUID Watershed Name
Recovery Potential Indicator
Score
Recovery Potential Indicator
Rank 2020-2024 Recovery
Potential
NHRIV700030101-15 CONTOOCOOK RIVER - UNNAMED BROOK 59.43 344 Low
NHRIV802010403-07 ASHUELOT RIVER - 300FT US OF WINCHESTER WWTF TO 3000FT DS OF WWTF 59.41 345 Low
NHRIV801060303-08 BLOW-ME-DOWN BROOK - UNNAMED BROOK - CLAY BROOK 59.38 346 Low
NHRIV700061203-26 LAUNCH BROOK 59.23 347 Low
NHRIV802010201-19 OTTER BROOK - HUBBARD BROOK - UNNAMED BROOK - WHEELER BROOK 59.21 348 Low
NHRIV700040402-03 FLINTS BROOK 59.13 349 Low
NHRIV700060904-14 SOUHEGAN RIVER 59.09 350 Low
NHRIV600030703-11 LAMPREY RIVER 58.98 351 Low
NHRIV801060301-05 BLOODS BROOK - UNNAMED BROOK 58.96 352 Low
NHRIV801060303-10 BLOW ME DOWN BROOK 58.86 353 Low
NHRIV600030405-14 SALMON FALLS RIVER - UNNAMED BROOK 58.86 354 Low
NHRIV801060303-11 BLOW-ME-DOWN BROOK 58.82 355 Low
NHRIV600020305-02 SACO RIVER 58.82 356 Low
NHRIV801060407-16 SUGAR RIVER 58.77 357 Low
NHRIV600030903-11 VARNEY BROOK - CANNEY BROOK 58.74 358 Low
NHRIV801010902-03 CONNECTICUT RIVER - EMERY BROOK - SHERIDAN BROOK - UNNAMED BROOK 58.68 359 Low
NHRIV700060503-03 SUNCOOK RIVER 58.56 360 Low
NHRIV801010903-02 CONNECTICUT RIVER 58.53 361 Low
NHRIV700030108-23 CONTOOCOOK RIVER - 3000 FT DS OF ANTRIM WWTF TO NORTH BRANCH 58.49 362 Low
NHRIV700060503-06 SUNCOOK RIVER 58.43 363 Low
NHRIV600030402-06 BRANCH RIVER 58.33 364 Low
NHRIV802010301-04 ASHUELOT RIVER - ACOE DAM TO ASHUELOT RIVER DAM POND 58.28 365 Low

121
Stormwater Impaired Watershed AUID Watershed Name
Recovery Potential Indicator
Score
Recovery Potential Indicator
Rank 2020-2024 Recovery
Potential
NHRIV700030104-23 CONTOOCOOK RIVER - BOGLIE BROOK DAM TO OTTER BROOK 58.10 366 Low
NHRIV600030902-09 COLLEGE BROOK 58.02 367 Low
NHRIV801070503-03 PARTRIDGE BROOK - UNNAMED BROOK 57.97 368 Low
NHRIV600031001-06 GRAFTON DITCH 57.94 369 Low
NHRIV700030108-15 CONTOOCOOK RIVER - MONADANOCK PAPER NPDES TO US OF ANTRIM WWTF 57.91 370 Low
NHRIV700061102-21 UNNAMED BROOK - TO HARRIS BROOK 57.88 371 Low
NHRIV600031001-10 NEWFILEDS DITCH 57.87 372 Low
NHRIV700060607-35 SAINT ANSELM BROOK - TO PISCATAQUOG RIVER 57.86 373 Low
NHRIV801060106-09 GREAT BROOK - UNNAMED BROOK 57.85 374 Low
NHRIV700061001-10 PENNICHUCK BROOK 57.78 375 Low
NHRIV600030603-10 WILLOW BROOK 57.77 376 Low
NHRIV700010502-09 SQUAM RIVER 57.66 377 Low
NHRIV700030104-18 CONTOOCOOK RIVER - US OF PETERBOROUGH WWTF TO BOGLIE BK 57.50 378 Low
NHRIV700060607-22 PISCATAQUOG RIVER 57.36 379 Low
NHRIV802010301-05 BLACK BROOK - DICKINSON BROOK - UNNAMED BROOK 57.32 380 Low
NHRIV700061204-01 DINSMORE BROOK 57.29 381 Low
NHRIV801010305-01 CONNECTICUT RIVER 57.04 382 Low
NHRIV801030403-16 AMMONOOSUC RIVER 56.98 383 Low
NHRIV700060802-09 MESSER BROOK 56.57 384 Low
NHRIV600031004-09 FOLLY MILL BROOK 56.55 385 Low
NHRIV802010301-11 ASHUELOT RIVER - OTTER BR TO KEENE WWTF 56.39 386 Low
NHRIV700061102-23 UNNAMED BROOK TO WESTERN EMBAYMENT 56.28 387 Low
NHRIV801060407-09-02 SUGAR RIVER 56.28 388 Low
NHRIV801030506-10 AMMONOOSUC RIVER 56.26 389 Low

122
Stormwater Impaired Watershed AUID Watershed Name
Recovery Potential Indicator
Score
Recovery Potential Indicator
Rank 2020-2024 Recovery
Potential
NHRIV600030806-14 STUART DAIRY FARM BROOK 56.23 390 Low
NHRIV600030405-09 SALMON FALLS RIVER 56.20 391 Low
NHRIV802010301-09 ASHUELOT RIVER - ASHUELOT RIVER DAM POND TO OTTER BR 56.14 392 Low
NHRIV400020101-12 ANDROSCOGGIN RIVER 56.03 393 Low
NHRIV801060405-25 SUGAR RIVER 56.03 394 Low
NHRIV801060406-30 SUGAR RIVER 55.95 395 Low
NHRIV700060302-24 MERRIMACK RIVER 55.95 396 Low
NHRIV700060804-11 MERRIMACK RIVER 55.81 397 Low
NHRIV700061102-18 POLICY BROOK - PORCUPINE BROOK 55.61 398 Low
NHRIV700060703-09 COHAS BROOK 55.54 399 Low
NHRIV700060402-05 SUNCOOK RIVER 55.49 400 Low
NHRIV801060405-10 SUGAR RIVER 55.40 401 Low
NHRIV700061002-13 MERRIMACK RIVER 55.36 402 Low
NHRIV400020103-06 ANDROSCOGGIN RIVER 55.25 403 Low
NHRIV400010605-10 ANDROSCOGGIN RIVER 55.04 404 Low
NHRIV700060803-12 PATTEN BROOK 55.03 405 Low
NHRIV700010502-08 SQUAM RIVER 54.91 406 Low
NHRIV700060302-25-02 MERRIMACK RIVER 54.63 407 Low
NHRIV600031004-10 CAINS BROOK - UNNAMED BROOK 54.60 408 Low
NHRIV700061204-06 CONNIES BROOK 54.52 409 Low
NHRIV801060405-27 SUGAR RIVER 54.51 410 Low
NHRIV600030902-10 RESERVOIR BROOK 54.48 411 Low
NHRIV400010605-11 ANDROSCOGGIN RIVER 54.45 412 Low
NHRIV700060802-07 PETERS BROOK 54.26 413 Low
NHRIV700060302-55 SUGAR BALL OXBOX 54.18 414 Low

123
Stormwater Impaired Watershed AUID Watershed Name
Recovery Potential Indicator
Score
Recovery Potential Indicator
Rank 2020-2024 Recovery
Potential
NHRIV700061102-16 POLICY BROOK - FROM CANOBIE LAKE 54.17 415 Low
NHRIV801060401-33 NORTH COVE WEST BROOK 54.14 416 Low
NHRIV700061102-17 POLICY BROOK 54.03 417 Low
NHRIV801030201-02 CONNECTICUT RIVER 53.99 418 Low
NHRIV700060802-14-02 MERRIMACK RIVER 53.90 419 Low
NHRIV700061002-14 MERRIMACK RIVER 53.80 420 Low
NHRIV801060106-15 MASCOMA RIVER 53.69 421 Low
NHRIV801060106-16 MASCOMA RIVER 53.67 422 Low
NHRIV400010606-07 ANDROSCOGGIN RIVER 53.65 423 Low
NHRIV600020104-04 THORN HILL BROOK 53.62 424 Low
NHRIV801060106-17 MASCOMA RIVER 53.53 425 Low
NHRIV801060401-31 TAMARI BROOK 53.39 426 Low
NHRIV801060106-19 MASCOMA RIVER 53.26 427 Low
NHRIV400010606-08 ANDROSCOGGIN RIVER 53.25 428 Low
NHRIV700061001-12 UNNAMED BROOK - ROUND POND TO HOLTS POND 52.82 429 Low
NHRIV700060802-15 RAYS BROOK 52.78 430 Low
NHRIV801060106-20 MASCOMA RIVER 52.71 431 Low
NHRIV802010501-05 CONNECTICUT RIVER 52.64 432 Low
NHRIV400010606-09 ANDROSCOGGIN RIVER 52.59 433 Low
NHRIV801060405-29 SUGAR RIVER 52.49 434 Low
NHRIV600031004-12 CAINS BROOK 52.41 435 Low
NHRIV400010606-10 ANDROSCOGGIN RIVER 52.22 436 Low
NHRIV700030504-14 FRENCH BROOK 51.83 437 Low
NHRIV700061205-01 BEAVER BROOK - TONYS BROOK 51.65 438 Low
NHRIV600030608-15 BERRY BROOK 51.59 439 Low
NHRIV600020304-01-01 SACO RIVER 51.32 440 Low

124
Stormwater Impaired Watershed AUID Watershed Name
Recovery Potential Indicator
Score
Recovery Potential Indicator
Rank 2020-2024 Recovery
Potential
NHRIV700060802-13 DORRS POND INLET BROOK 50.90 441 Low
NHRIV700040402-05 NASHUA RIVER 50.65 442 Low
NHRIV801060302-05 CONNECTICUT RIVER 50.14 443 Low
NHRIV700060802-16 DORRS POND-E INLET 49.50 444 Low
NHRIV700040402-09 NASHUA RIVER 49.28 445 Low
NHRIV700040402-08 NASHUA RIVER 49.27 446 Low
NHRIV600031004-21 UNNAMED BROOK - TO CAINS MILL POND 48.55 447 Low
NHRIV600030406-04 SALMON FALLS RIVER 48.51 448 Low
NHRIV600031001-04 LOWER HODGSON BROOK 48.47 449 Low
NHRIV700061201-07 SALMON BROOK 48.15 450 Low
NHRIV600031001-05 UPPER HODGSON BROOK 47.90 451 Low
NHRIV700061206-24 MERRIMACK RIVER 47.84 452 Low
NHRIV700060803-14-02 MERRIMACK RIVER 47.47 453 Low
NHRIV600031001-07 PAULS BROOK - PEASE AIR FORCE BASE 47.16 454 Low
NHRIV700061201-05 SALMON BROOK - HASSELLS BROOK - OLD MAIDS BROOK - HALE BROOK 46.66 455 Low
NHRIV700060804-12 SOUTH PERIMETER BROOK 46.56 456 Low
NHRIV700061001-09 BOIRE FIELD BROOK - TO PENNICHUCK BROOK 46.00 457 Low
NHRIV700060803-16 MCQUESTEN BROOK 45.08 458 Low
NHRIV700060803-15 HUMPHREY BROOK 44.74 459 Low
NHRIV700060803-08 BAKER BROOK 43.87 460 Low
NHRIV801060302-01 CONNECTICUT RIVER 42.74 461 Low
NHRIV600030406-03 SALMON FALLS RIVER 42.32 462 Low

125
APPENDIX C: LAKE AND IMPOUNDMENT RECOVERY POTENTIAL RANKING
LIST
Stormwater Impaired AUID AUID Name
Recovery Potential Indicator
Score
Recovery Potential Indicator
Rank 2020-2024 NPS Plan
Rank
NHLAK700010201-03 LONESOME LAKE 70.85 1 High
NHLAK700060804-03-01 SANDY POND - CAMP FOSTER POND 69.35 2 High
NHLAK801010706-01 LITTLE BOG POND 69.30 3 High
NHLAK700010401-04 UPPER GREELEY POND 69.19 4 High
NHLAK600030902-02 WHEELWRIGHT POND 68.36 5 High
NHLAK400010502-06 DUSTAN POND 68.21 6 High
NHLAK700020103-03 GARLAND POND 68.10 7 High
NHLAK700010204-01 EAST POND 68.05 8 High
NHLAK801010706-04 WHITCOMB POND 67.93 9 High
NHLAK700020101-05-01 LAKE WENTWORTH 67.91 10 High
NHLAK802010101-04 LONG POND 67.22 11 High
NHLAK600020602-02 FLAT MOUNTAIN POND (1&2) 67.16 12 High
NHLAK400010502-02 CORSER POND 67.12 13 High
NHLAK600030704-02-01 PAWTUCKAWAY LAKE 67.07 14 High
NHLAK700010306-02 MIDDLE THREE PONDS 67.02 15 High
NHLAK600020102-02 LITTLE SAWYER POND 67.00 16 High
NHIMP700061203-01 HARANTIS LAKE - HARANTIS LAKE DAM 66.75 17 High
NHLAK700010306-03 UPPER THREE PONDS 66.72 18 High
NHLAK700010307-01 LOON LAKE 66.51 19 High
NHLAK600030703-01 GOVERNORS LAKE 66.46 20 High
NHLAK700010203-02 RUSSELL POND 66.37 21 High
NHIMP801030401-02 AMMONOOSUC LAKE 66.36 22 High
NHLAK801060401-07 HALFMILE POND 66.26 23 High

126
Stormwater Impaired AUID AUID Name
Recovery Potential Indicator
Score
Recovery Potential Indicator
Rank 2020-2024 NPS Plan
Rank
NHLAK700060601-05-01 WEARE RESERVOIR 66.25 24 High
NHLAK700060905-01-01 BABOOSIC LAKE 66.16 25 High
NHLAK700060302-08 TURTLE POND 66.15 26 High
NHLAK700010104-01 BLACK POND 65.92 27 High
NHLAK700010304-02 DERBY POND 65.86 28 High
NHLAK700020108-02-02 LAKE WINONA 65.84 29 High
NHLAK700020108-04 HAWKINS POND 65.76 30 High
NHIMP600030708-03 PISCASSIC RIVER 65.49 31 High
NHLAK700010402-04 MIDDLE HALL POND 65.43 32 High
NHLAK600030606-01 LONG POND 65.30 33 High
NHLAK600031002-01 EEL POND 65.16 34 High
NHLAK700010402-02 GUINEA POND 65.16 35 High
NHLAK700060302-15 HORSESHOE POND 65.13 36 High
NHLAK700010603-02-01 NEWFOUND LAKE 65.12 37 High
NHIMP700030204-05-01 BEARDS BROOK - EAST WASHINGTON DAM 64.92 38 High
NHLAK801060402-04-01 LITTLE SUNAPEE LAKE 64.86 39 High
NHLAK801030701-01 CONSTANCE LAKE 64.79 40 High
NHLAK600020803-01-02 MIDDLE DANFORTH POND 64.78 41 High
NHLAK700061203-05 RAINBOW LAKE 64.74 42 High
NHLAK700010306-01 STINSON LAKE 64.72 43 High
NHIMP600030903-02 BELLAMY RIVER - SAWYERS MILL DAM POND 64.56 44 High
NHLAK700030403-01 ADDER POND 64.56 45 High
NHLAK700060702-03 MASSABESIC LAKE 64.56 46 High
NHIMP700030503-01-01 HOPKINTON DIKE ELM BROOK 64.54 47 High
NHLAK700030301-01 LAKE SOLITUDE 64.50 48 High
NHLAK700010205-02 PEAKED HILL POND 64.49 49 High

127
Stormwater Impaired AUID AUID Name
Recovery Potential Indicator
Score
Recovery Potential Indicator
Rank 2020-2024 NPS Plan
Rank
NHLAK801010706-03 ONE AND TWO TRIO PONDS 64.48 50 High
NHLAK600030602-03 ROCHESTER RESERVOIR 64.40 51 High
NHLAK600030903-03 SWAINS LAKE 64.31 52 High
NHLAK700020110-02-19 LAKE WINNIPESAUKEE 64.30 53 High
NHLAK700060101-02-01 SONDOGARDY POND 64.27 54 High
NHIMP700020203-01 KNOWLES POND - TR WILLIAMS BROOK 64.21 55 High
NHIMP600030902-04 OYSTER RIVER - MILL POND DAM 64.18 56 High
NHLAK700061403-03-01 COUNTRY POND 64.09 57 High
NHLAK802010101-06-01 MILLEN POND 64.04 58 High
NHIMP700010302-03 ORE HILL MINE POND 63.74 59 High
NHIMP600030607-02 COCHECO RIVER - GONIC DAM POND 63.72 60 High
NHLAK700020108-02-01 LAKE WAUKEWAN 63.71 61 High
NHLAK802020103-08 PEARLY LAKE 63.70 62 High
NHIMP600030603-02 COCHECO RIVER - HATFIELD DAM 63.51 63 High
NHLAK700060502-05 HARVEY LAKE 63.45 64 High
NHLAK600031003-02 TAYLOR RIVER REFUGE POND 63.35 65 High
NHLAK700061403-08 HALFMOON POND 63.24 66 High
NHLAK700060605-01-01 DANIELS LAKE 63.20 67 High
NHLAK801060103-01 GOOSE POND 63.09 68 High
NHLAK700010402-01 BLACK MOUNTAIN POND 63.05 69 High
NHLAK700010304-06 ROCKY POND 63.05 70 High
NHLAK700030204-03 ISLAND POND 63.02 71 High
NHLAK700030506-02 WALKER POND 62.98 72 High
NHLAK600030802-02 LILY POND 62.96 73 High
NHLAK700030108-02-01 GREGG LAKE 62.91 74 Medium
NHLAK801040402-02-01 STORRS POND 62.84 75 Medium

128
Stormwater Impaired AUID AUID Name
Recovery Potential Indicator
Score
Recovery Potential Indicator
Rank 2020-2024 NPS Plan
Rank
NHLAK400010502-05 SWEAT POND 62.83 76 Medium
NHLAK400010404-01 FOUR MILE POND 62.70 77 Medium
NHLAK802010201-03 CENTER POND 62.62 78 Medium
NHLAK700061403-10 TUXBURY POND 62.62 79 Medium
NHLAK801010103-03 WRIGHT POND 62.48 80 Medium
NHIMP700030101-02 CONTOOCOOK RIVER DAM 62.30 81 Medium
NHLAK801030502-04 ROUND POND 62.29 82 Medium
NHLAK700061102-08 SEAVEY POND 62.26 83 Medium
NHLAK700010804-02-01 WEBSTER LAKE 62.24 84 Medium
NHLAK700030402-02-01 PLEASANT LAKE 62.23 85 Medium
NHIMP700030101-03 CONTOOCOOK RIVER 62.20 86 Medium
NHLAK802010401-01-01 FOREST LAKE 62.19 87 Medium
NHLAK700061403-07 GREENWOOD POND 62.13 88 Medium
NHLAK801060402-05-01 SUNAPEE LAKE 62.12 89 Medium
NHLAK600031001-02 UNKNOWN POND 62.12 90 Medium
NHLAK600030802-03-01 PHILLIPS POND 61.99 91 Medium
NHLAK801030505-03 LOWER MOUNTAIN LAKE 61.85 92 Medium
NHLAK802010303-02 MEETINGHOUSE POND 61.80 93 Medium
NHLAK700061203-02-01 BEAVER LAKE 61.75 94 Medium
NHLAK801060101-05 RESERVOIR POND 61.57 95 Medium
NHLAK700030103-01 BEAVER POND 61.56 96 Medium
NHLAK400010602-14 SIGNAL POND 61.55 97 Medium
NHLAK801060402-02 BAPTIST POND 61.49 98 Medium
NHLAK400010403-02 LITTLE DIAMOND POND 61.49 99 Medium
NHLAK801030502-01 DODGE POND 61.45 100 Medium
NHLAK700030402-01 CHASE POND 61.39 101 Medium

129
Stormwater Impaired AUID AUID Name
Recovery Potential Indicator
Score
Recovery Potential Indicator
Rank 2020-2024 NPS Plan
Rank
NHLAK700060503-04 MARSH POND 61.39 102 Medium
NHLAK400010606-01 JERICHO LAKE 61.32 103 Medium
NHIMP700060201-04 GUES MEADOW BROOK 61.31 104 Medium
NHLAK700060605-04-01 HAUNTED LAKE 61.30 105 Medium
NHIMP700061403-04 POWWOW RIVER - POWWOW POND 61.27 106 Medium
NHLAK700060502-09-01 PLEASANT LAKE 61.25 107 Medium
NHLAK700030101-02 CHESHIRE POND 61.17 108 Medium
NHLAK700010501-04-01 SQUAM LAKE 61.15 109 Medium
NHIMP600030901-02 WINNICUT RIVER DAM POND 61.15 110 Medium
NHIMP600030603-01 COCHECO RIVER - CITY DAM 1 61.05 111 Medium
NHIMP700020102-01-01 JONES DAM POND 61.02 112 Medium
NHLAK600030602-01 BAXTER LAKE 61.02 113 Medium
NHLAK700020102-02 DOWNING POND 60.96 114 Medium
NHLAK600030802-04 SHOWELL POND 60.94 115 Medium
NHIMP700020102-01-02 MARSH POND 60.85 116 Medium
NHLAK700060502-08-01 NORTHWOOD LAKE 60.84 117 Medium
NHLAK801030502-03 PARTRIDGE LAKE 60.81 118 Medium
NHLAK700040401-02-01 POTANIPO POND 60.72 119 Medium
NHIMP700060906-08 SOUHEGAN RIVER - MCLANE DAM 60.67 120 Medium
NHLAK700020101-07-01 RUST POND 60.53 121 Medium
NHLAK700061203-06-01 ROBINSON POND 60.40 122 Medium
NHLAK700061101-04 ARLINGTON MILL RESERVOIR 60.27 123 Medium
NHLAK801010203-01-01 BACK LAKE 60.20 124 Medium
NHLAK700060302-05 HOTHOLE POND 60.03 125 Medium
NHLAK700060201-05 SHELLCAMP POND 60.00 126 Medium
NHLAK700020201-05-01 LAKE WINNISQUAM 59.99 127 Medium

130
Stormwater Impaired AUID AUID Name
Recovery Potential Indicator
Score
Recovery Potential Indicator
Rank 2020-2024 NPS Plan
Rank
NHIMP700010804-03 SUCKER BROOK-SUCKER BROOK I DAM 59.94 128 Medium
NHLAK700061101-01-01 ISLAND POND 59.92 129 Medium
NHLAK600030605-01 NIPPO POND 59.90 130 Medium
NHLAK700010701-05 WAUKEENA LAKE 59.84 131 Medium
NHLAK700060202-03-01 CLOUGH POND 59.78 132 Medium
NHLAK700030102-01-01 THORNDIKE POND 59.73 133 Medium
NHLAK801070203-01 WARREN LAKE 59.71 134 Medium
NHLAK700040402-01 FLINTS POND 59.63 135 Medium
NHLAK801010701-02 YORK POND 59.59 136 Medium
NHLAK700020201-07 RAILROAD POND 59.54 137 Medium
NHLAK700061001-06 HOLT POND 59.54 138 Medium
NHLAK700030107-03 POWDER MILL POND 59.46 139 Medium
NHLAK700010502-01-01 LITTLE SQUAM LAKE 59.32 140 Medium
NHLAK700060402-03 HALFMOON LAKE 59.22 141 Medium
NHLAK700061204-02 LITTLE ISLAND POND 59.22 142 Medium
NHLAK700060607-02 NAMASKE LAKE 59.18 143 Medium
NHLAK700030304-05 TOM POND 59.00 144 Medium
NHIMP600030405-04 SALMON FALLS RIVER - BAXTER MILL DAM POND 58.97 145 Medium
NHIMP700060906-07 SOUHEGAN RIVER - GOLDMAN DAM 58.91 146 Medium
NHLAK801060105-04-01 MASCOMA LAKE 58.76 147 Low
NHIMP700060904-08 SOUHEGAN RIVER - PINE VALLEY MILL 58.53 148 Low
NHLAK801060401-06 EASTMAN POND 58.51 149 Low
NHIMP700060402-02 WEBSTER STREAM - LOCKE LAKE 58.47 150 Low
NHIMP700060503-02 SUNCOOK RIVER - HUCKINS MILL DAM 58.39 151 Low
NHLAK600020902-01 PROVINCE LAKE 58.12 152 Low
NHLAK600030601-05-01 SUNRISE LAKE 58.06 153 Low

131
Stormwater Impaired AUID AUID Name
Recovery Potential Indicator
Score
Recovery Potential Indicator
Rank 2020-2024 NPS Plan
Rank
NHLAK700060502-06 JENNESS POND 58.03 154 Low
NHLAK700030202-02-01 ISLAND POND 57.99 155 Low
NHLAK700061001-02-01 SILVER LAKE 57.96 156 Low
NHLAK600030405-03 WILLAND POND 57.91 157 Low
NHLAK700060201-03 NEW POND 57.83 158 Low
NHLAK700060906-01 HONEY POT POND 57.80 159 Low
NHLAK801070503-01-01 SPOFFORD LAKE 57.78 160 Low
NHLAK802020103-06 LAKE MONOMONAC 57.75 161 Low
NHLAK700061102-03-01 CAPTAIN POND 57.70 162 Low
NHLAK700061002-03 HORSESHOE POND 57.44 163 Low
NHLAK801060402-03 CHALK POND 57.34 164 Low
NHLAK700030105-01-01 ZEPHYR LAKE 57.31 165 Low
NHLAK801030102-02 MARTIN MEADOW POND 57.20 166 Low
NHLAK600030705-03 NORTH RIVER POND 57.19 167 Low
NHLAK802020103-04 EMERSON POND 57.18 168 Low
NHLAK700030303-04 MESSER POND 57.14 169 Low
NHLAK801030302-01-01 ECHO LAKE 56.86 170 Low
NHLAK700061403-01-01 ANGLE POND 56.77 171 Low
NHIMP801010305-01 CONNECTICUT RIVER - CANAAN HYDRO 56.70 172 Low
NHIMP801060406-08 SUGAR RIVER 56.68 173 Low
NHLAK700060804-02 SEBBINS POND 56.64 174 Low
NHLAK801030506-01 LAKE GARDNER 56.62 175 Low
NHIMP802010301-02 ASHUELOT RIVER DAM POND 56.57 176 Low
NHLAK600030608-01 FRESH CREEK POND 56.47 177 Low
NHLAK700061001-04-01 HARRIS POND 56.08 178 Low
NHLAK700060703-04 PINE ISLAND POND 56.07 179 Low

132
Stormwater Impaired AUID AUID Name
Recovery Potential Indicator
Score
Recovery Potential Indicator
Rank 2020-2024 NPS Plan
Rank
NHLAK700030504-03 KEYSER POND 56.07 180 Low
NHLAK700061102-02 CANOBIE LAKE 56.05 181 Low
NHLAK700030504-02-01 FRENCH POND 55.87 182 Low
NHLAK700061002-01-01 DARRAH POND 55.57 183 Low
NHIMP801060106-02 MASCOMA RIVER - RIVERMILL 55.46 184 Low
NHIMP600030902-06 BEARDS CREEK 55.33 185 Low
NHIMP700020203-07 WINNIPESAUKEE RIVER - FRANKLIN FALLS HYDRO DAM 2 55.10 186 Low
NHIMP801060106-04 MASCOMA RIVER 54.89 187 Low
NHIMP801060106-05 MASCOMA RIVER - GLEN ROAD DAM 54.79 188 Low
NHIMP801030506-02 AMMONOOSUC RIVER DAM POND 54.76 189 Low
NHLAK700020201-02 HUNKINS POND 54.48 190 Low
NHLAK700061206-02 OTTERNICK POND 54.37 191 Low
NHLAK801060405-03 PERKINS POND 54.32 192 Low
NHIMP400010605-01 ANDROSCOGGIN RIVER - D. C. POWER DAM 54.27 193 Low
NHIMP400010605-02 ANDROSCOGGIN RIVER - RIVERSIDE DAM 54.10 194 Low
NHIMP801030506-03 AMMONOOSUC RIVER - WOODSVILLE DAM 53.82 195 Low
NHIMP400010605-03 ANDROSCOGGIN RIVER - SMITH DAM 53.45 196 Low
NHIMP400010606-02 ANDROSCOGGIN RIVER - CROSS POWER DAM 52.88 197 Low
NHIMP400010606-03 ANDROSCOGGIN RIVER - CASCADE DAM 52.67 198 Low
NHIMP700060902-01 SOUHEGAN RIVER 52.53 199 Low
NHLAK700061204-01-01 COBBETTS POND 52.53 200 Low
NHLAK700020110-02-01 PAUGUS BAY 52.05 201 Low
NHLAK700020102-04 MILL POND 51.57 202 Low
NHLAK700061205-02-01 LONG POND 51.33 203 Low
NHIMP700060802-04 MERRIMACK RIVER - AMOSKEAG DAM 51.31 204 Low
NHIMP600031004-04 SECORD POND DAM 50.63 205 Low

133
Stormwater Impaired AUID AUID Name
Recovery Potential Indicator
Score
Recovery Potential Indicator
Rank 2020-2024 NPS Plan
Rank
NHIMP600031004-06 CAINS BROOK - NOYES POND 49.69 206 Low
NHLAK700060802-01 DORRS POND 49.07 207 Low
NHIMP600031004-05 CAINS BROOK 48.81 208 Low
NHIMP700040402-05 NASHUA RIVER - JACKSON PLANT DAM POND 47.75 209 Low
NHIMP600030406-04 SALMON FALLS RIVER - SOUTH BERWICK DAM 46.70 210 Low
NHIMP600030806-08 CLEMSON POND 45.52 211 Low
NHIMP700040402-02 NASHUA RIVER - MINE FALLS DAM POND 45.21 212 Low
NHLAK700060803-02 STEVENS POND 44.23 213 Low
NHLAK700060803-01 NUTT POND 43.10 214 Low
NHLAK700060302-02 HORSESHOE POND 42.69 215 Low
NHIMP600030406-02 SALMON FALLS RIVER - LOWER GREAT FALLS DAM 42.64 216 Low
NHLAK801010902-01 BAKER POND 42.19 217 Low
NHIMP700040402-03 NASHUA RIVER - NASHUA CANAL DIKE 41.85 218 Low

134
APPENDIX D: PRIORITY RESTORATION LIST FOR
BEACHES IN NEW HAMPSHIRE

135
AUID Name Rank
NHIMP400020101-01-02 MOOSE BROOK - TOWN POOL-RAVINE BEACH High
NHIMP400020101-02-02 MOOSE BROOK - MOOSE BROOK STATE PARK BEACH High
NHIMP600020702-01-02 DAN HOLE RIVER - MILL POND TOWN BEACH High
NHIMP700010401-01-02 SNOWS BROOK - CORCORAN POND TOWN BEACH High
NHIMP700030204-05-02 BEARDS BROOK - MILL POND TOWN BEACH High
NHIMP700030304-04-02 SILVER BROOK - SILVER LAKE RESERVOIR BEACH High
NHIMP700030503-01-02 STATE PARK BEACH ON ELM BROOK High
NHIMP700060402-02-05 LOCKE LAKE - COLONY BEACH High
NHIMP700060501-03-02 CLARKS POND - TOWN BEACH High
NHIMP801070202-01-02 COLD RIVER - VILAS POOL BEACH High
NHIMP802010303-04-02 VILLAGE POND DAM - SAND DAM VILLAGE POND TOWN BEACH High
NHLAK400020102-01 PEABODY RIVER - LIBBY TOWN POOL High
NHLAK600020801-06-02 SILVER LAKE - MONUMENT BEACH High
NHLAK600020802-04-05 OSSIPEE LAKE - OSSIPEE LAKE NATURAL AREA High
NHLAK600030404-01-03 MILTON THREE PONDS - MILTON POND REC AREA BEACH High
NHLAK600030601-05-02 SUNRISE LAKE - TOWN BEACH High
NHLAK600030704-02-02 PAWTUCKAWAY LAKE - PAWTUCKAWAY STATE PARK BEACH High
NHLAK600030802-03-02 PHILLIPS POND - SEELEY TOWN BEACH High
NHLAK700010603-02-13 NEWFOUND LAKE - CAMP WI-CO-SU-TA BEACH High
NHLAK700010802-03-02 HERMIT LAKE - TOWN BEACH High
NHLAK700010804-02-02 WEBSTER LAKE - GRIFFIN TOWN BEACH High
NHLAK700010804-02-03 WEBSTER LAKE - LAGACE TOWN BEACH High
NHLAK700020101-05-02 LAKE WENTWORTH - ALBEE BEACH High
NHLAK700020101-05-03 LAKE WENTWORTH - WENTWORTH STATE PARK BEACH High

136
AUID Name Rank
NHLAK700020110-02-04 LAKE WINNIPESAUKEE - MELVIN VILLAGE LAKE TOWN PIER BEACH High
NHLAK700020110-02-07 LAKE WINNIPESAUKEE - PUBLIC BEACH High
NHLAK700020110-02-09 LAKE WINNIPESAUKEE - BREWSTER BEACH High
NHLAK700020110-02-10 LAKE WINNIPESAUKEE - ALTON BAY TOWN BEACH High
NHLAK700020110-02-12 LAKE WINNIPESAUKEE - ELACOYA STATE PARK BEACH High
NHLAK700020110-02-13 LAKE WINNIPESAUKEE - GILFORD TOWN BEACH High
NHLAK700020110-02-14 LAKE WINNIPESAUKEE - ENDICOTT PARK WEIRS BEACH High
NHLAK700020110-02-39 LAKE WINNIPESAUKEE - ELLACOYA RV PARK BEACH High
NHLAK700020201-05-02 LAKE WINNISQUAM - SANBORNTON TOWN BEACH High
NHLAK700020201-05-03 LAKE WINNISQUAM - BARTLETTS BEACH High
NHLAK700020201-05-05 LAKE WINNISQUAM - AHERN STATE PARK High
NHLAK700020201-06-03 OPECHEE BAY - OPECHEE POINT BEACH High
NHLAK700020201-06-04 OPECHEE BAY - OPECHEE PARK COVE BEACH High
NHLAK700030102-01-02 THORNDIKE POND - TOWN BEACH High
NHLAK700030103-06-02 MACDOWELL RESERVOIR - MACDOWELL RESERVOIR BEACH High
NHLAK700030105-01-02 ZEPHYR LAKE - TOWN BEACH High
NHLAK700030105-02-03 OTTER LAKE - GREENFIELD SP PICNIC BEACH High
NHLAK700030105-02-04 OTTER LAKE - GREENFIELD SP MIDDLE BEACH High
NHLAK700030105-02-05 OTTER LAKE - GREENFIELD SP CAMPING BEACH High
NHLAK700030201-03-02 HIGHLAND LAKE-HIGHLAND LAKE BOAT LAUNCH High
NHLAK700030202-03-02 JACKMAN RESERVOIR - MANAHAN PARK TOWN BEACH High
NHLAK700030402-03-02 TANNERY POND - BEACH High
NHLAK700030501-01-02 GOULD POND - EASTMAN PARK BEACH High
NHLAK700030501-01-04 GOULD POND - EMERALD BEACH High
NHLAK700030504-02-02 FRENCH POND - PUBLIC ACCESS High
NHLAK700040401-02-02 LAKE POTANIPO - TOWN BEACH High
NHLAK700060101-02-02 SONDOGARDY POND - GLINES PARK BEACH High

137
AUID Name Rank
NHLAK700060401-02-02 CRYSTAL LAKE-TOWN BEACH High
NHLAK700060402-10-03 UPPER SUNCOOK LAKE - CAMP FATIMA BEACH High
NHLAK700060502-08-02 NORTHWOOD LAKE - TOWN BEACH High
NHLAK700060503-02-02 CATAMOUNT POND - BEAR BROOK STATE PARK BEACH High
NHLAK700060601-01-02 DEERING RESERVOIR - DEERING LAKE BEACH High
NHLAK700060703-02-02 CRYSTAL LAKE-TOWN BEACH High
NHLAK700060804-02-02 SEBBINS POND - CAMP KETTLEFORD BEACH High
NHLAK700060905-01-02 BABOOSIC LAKE - TOWN BEACH High
NHLAK700060905-01-03 BABOOSIC LAKE - YOUNG JUDAEA BEACH High
NHLAK700061001-02-02 SILVER LAKE - STATE PARK BEACH High
NHLAK700061002-04-02 NATICOOK LAKE - WASSERMAN PARK BEACH High
NHLAK700061101-01-02 ISLAND POND - CHASE'S GROVE High
NHLAK700061101-03-02 WASH POND - TOWN BEACH High
NHLAK700061101-04-02 ARLINGTON MILL RESERVOIR-SECOND ST BEACH High
NHLAK700061101-04-03
ARLINGTON MILL RESERVOIR-ARLINGTON POND IMPROVEMENT
ASSOCIATION High
NHLAK700061102-03-02 CAPTAIN POND - CAPTAIN'S BEACH High
NHLAK700061102-03-03 CAPTAIN POND - CAMP OTTER SWIM AREA BEACH High
NHLAK700061102-03-06 CAPTAIN POND - CAMP HADAR High
NHLAK700061102-06-02 MILLVILLE LAKE - TOWN BEACH High
NHLAK700061102-13 HEDGEHOG POND - TOWN BEACH High
NHLAK700061203-02-02 BEAVER LAKE - GALLIEN'S BEACH High
NHLAK700061203-03-02 HOODS POND - TOWN BEACH High
NHLAK700061203-05-02 RAINBOW LAKE - KAREN-GENA BEACH High
NHLAK700061203-06-02 ROBINSON POND - TOWN BEACH High
NHLAK700061204-01-03 COBBETTS POND - TOWN BEACH High
NHLAK700061403-03-02 COUNTRY POND - TOWN BEACH High

138
AUID Name Rank
NHLAK700061403-03-03 COUNTRY POND - LONE TREE SCOUT RESV. BEACH High
NHLAK700061403-03-04 COUNTRY POND - TASKER DAY CAMP BEACH High
NHLAK700061403-06-02 GREAT POND - KINGSTON STATE PARK BEACH High
NHLAK700061403-06-05 GREAT POND- GREAT POND PARK ASSOCIATION BEACH High
NHLAK801030302-01-02 ECHO LAKE - FRANCONIA STATE PARK BEACH High
NHLAK801060101-01-02 CANAAN STREET LAKE - TOWN BEACH High
NHLAK801060402-05-03 SUNAPEE LAKE - DEWEY (TOWN) BEACH High
NHLAK801060402-05-04 SUNAPEE LAKE - BLODGETT'S LANDING BEACH High
NHLAK801060402-05-05 SUNAPEE LAKE - SUNAPEE STATE PARK BEACH High
NHLAK802010104-02-02 SURRY MOUNTAIN RESERVOIR - REC AREA BEACH High
NHLAK802010201-06-02 OTTER BROOK LAKE - OTTER BROOK PK BEACH High
NHLAK802010202-07-02 RUSSEL RESERVOIR - CHESHAM BEACH High
NHLAK802010302-01-02 SWANZEY LAKE - RICHARDSON PARK TOWN BEACH High
NHLAK802010401-01-02 FOREST LAKE - TOWN BEACH High
NHLAK802010402-01-02 SANDY POND - CAMP WIYAKA BEACH High
NHLAK802020103-08-02 PEARLY LAKE-PEARLY LAKE BEACH High
NHOCN000000000-02-02 ATLANTIC OCEAN - NEW CASTLE BEACH High
NHOCN000000000-02-09 ATLANTIC OCEAN - STATE BEACH High
NHRIV600020304-10-02 SACO RIVER - SMITH EASTON REC AREA BEACH High
NHRIV600030703-07-02 LAMPREY RIVER - CARROLL LAKE BEACH High
NHRIV700030204-15-02 BEARDS BROOK - TOWN BEACH High
NHRIV801030402-07-02 TUTTLE BROOK - TWIN MTN REC AREA BEACH High
NHRIV801040205-02-02 BEAN BROOK-TOWN BEACH High
NHIMP700060402-02-02 LOCKE LAKE - NORTH BARNSTEAD ROAD BEACH Medium
NHLAK400010606-01-02 JERICHO MOUNTAIN STATE PARK BEACH Medium
NHLAK600020605-02-02 WHITE LAKE - STATE PARK BEACH Medium
NHLAK600020703-01-02 DUNCAN LAKE - TOWN BEACH Medium

139
AUID Name Rank
NHLAK600020804-01-05 BROAD BAY - CAMP HUCKINS BEACH Medium
NHLAK700010303-02-03 UPPER BAKER POND - CAMP MOOSILAUKE BEACH Medium
NHLAK700010603-02-10 NEWFOUND LAKE - CAMP MOWGLIS BEACH Medium
NHLAK700020105-02-03 LAKE KANASATKA - CAMP QUINEBARGE BEACH Medium
NHLAK700020110-02-27 LAKE WINNIPESAUKEE - WINAUKEE ISLAND CAMP BEACH Medium
NHLAK700020201-05-04 LAKE WINNISQUAM - BELMONT TOWN BEACH Medium
NHLAK700020201-06-02 OPECHEE BAY - BOND BEACH Medium
NHLAK700030103-05-02 HARRISVILLE LAKE - SUNSET TOWN BEACH Medium
NHLAK700030401-03-02 EAGLE POND - CAMP KENWOOD-EVERGREEN BEACH Medium
NHLAK700030501-01-03 GOULD POND - HUMMINGBIRD BEACH Medium
NHLAK700060401-06-02 MANNING LAKE - CAMP BELL BEACH Medium
NHLAK700060403-01-02 BIG WILLEY POND - CAMP FOSS BEACH Medium
NHLAK700060502-08-04 NORTHWOOD LAKE - LYNN GROVE ASSOCIATION BEACH Medium
NHLAK700060601-05-02 WEARE RESERVOIR - CHASE PARK TOWN BEACH Medium
NHLAK700061102-03-04 CAPTAIN POND - CAMP Y WOOD BEACH Medium
NHLAK700061205-02-02 LONG POND - TOWN BEACH Medium
NHLAK700061403-06-04 GREAT POND - CAMP LINCOLN BEACH Medium
NHLAK801010701-02-02 YORK POND - BARRY CONSERVATION CAMP BEACH Medium
NHLAK801040203-01-02 POST POND - CHASE TOWN BEACH Medium
NHLAK801040402-02-02 STORRS POND - RECREATION AREA BEACH Medium
NHLAK801060105-04-02 MASCOMA LAKE - SHAKOMA BEACH Medium
NHLAK801060105-04-04 MASCOMA LAKE - DARTMOUTH COLLEGE BEACH Medium
NHLAK801060105-04-05 MASCOMA LAKE - LAKEVIEW CONDOMINIUM ASSOCIATION BEACH Medium
NHLAK802020103-06-02 MONOMONAC LAKE - CAMP MONOMONAC BEACH Medium
NHRIV600020302-02-02 SACO RIVER - FIRST BRIDGE REC AREA BEACH Medium
NHRIV600020304-01-02 SACO RIVER - DAVIS PARK REC AREA BEACH Medium
NHEST600031004-09-05 HAMPTON/SEABROOK HARBOR - SEABROOK HARBOR BEACH Low

140
AUID Name Rank
NHEST600031004-09-06 HAMPTON/SEABROOK HARBOR - HAMPTON HARBOR BEACH Low
NHIMP600030702-01-02 BEAVER POND - BEAVER POND BEACH Low
NHIMP700030101-04-02
UNNAMED RIVER - ARK POND - MONADNOCK CHRISTIAN
CONFERENCE BEACH Low
NHIMP700030507-02-02 KIMBALL POND - HOPKINTON TOWN BEACH Low
NHIMP700060402-02-01 LOCKE LAKE - GEORGETOWN BEACH #6 Low
NHIMP700060402-02-03 LOCKE LAKE -N SHORE RD BEACH Low
NHIMP700060402-02-04 LOCKE LAKE - POINT BEACH Low
NHIMP700060402-02-06 LOCKE LAKE - VARNEY BEACH Low
NHIMP700060402-02-07 LOCKE LAKE - WINCHESTER DRIVE BEACH Low
NHIMP700061403-04-02 POWWOW RIVER - TRICKLIN' FALLS BEACH Low
NHLAK600020302-01-02 ECHO LAKE - STATE PARK BEACH Low
NHLAK600020304-01-02 CONWAY LAKE - TOWN BEACH Low
NHLAK600020304-02-02 CRYSTAL LAKE-TOWN BEACH Low
NHLAK600020304-02-03 CRYSTAL LAKE - WAUKEELA BEACH Low
NHLAK600020601-01-02 BEARCAMP POND - TOWN BEACH Low
NHLAK600020604-01-03 LAKE CHOCORUA - TOWN BEACH Low
NHLAK600020604-01-04 LAKE CHOCORUA - PUBLIC BEACH Low
NHLAK600020604-03-02 MOORES POND - MOORES POND SKI AND BEACH Low
NHLAK600020604-03-03 MOORES POND - ASSOCIATION BEACH Low
NHLAK600020701-02-02 LOWER BEECH POND - WILLIAM LAWRENCE CAMP BEACH Low
NHLAK600020702-01-02 DAN HOLE POND - CAMP MERROVISTA BEACH Low
NHLAK600020702-01-03 DAN HOLE POND - CAMP SENTINEL BAPTIST BEACH Low
NHLAK600020801-06-03 SILVER LAKE - FOOT OF THE LAKE BEACH Low
NHLAK600020801-06-04 SILVER LAKE - NICHOLS BEACH Low
NHLAK600020801-06-05 SILVER LAKE - KENNETT PARK BEACH Low
NHLAK600020802-04-02 OSSIPEE LAKE - CAMP CALUMET BEACH Low

141
AUID Name Rank
NHLAK600020802-04-04 OSSIPEE LAKE - CAMP CODY FOR BOYS BEACH Low
NHLAK600020803-06-02 PURITY LAKE - CAMP TOHKOMEUPOG BEACH Low
NHLAK600020804-01-04 LEAVITT BAY - CAMP MARIST BEACH Low
NHLAK600020804-01-06 BROAD BAY - CAMP ROBIN HOOD BEACH Low
NHLAK600020901-01-02 LOON LAKE - CAMP LUETHI-PETERSON BEACH Low
NHLAK600020901-01-03 LOON LAKE - CAMP CRAGGED MOUNTAIN FARM Low
NHLAK600030401-01-02 LOVELL POND - TOWN BEACH Low
NHLAK600030601-04-02 MARCHS POND - BIRCH HILL SUMMER CAMP BEACH Low
NHLAK600030604-01-02 BOW LAKE - TOWN BEACH Low
NHLAK600030604-01-03 BOW LAKE - MARY WALDRON BEACH Low
NHLAK600030604-01-04 BOW LAKE - BENNETT BRIDGE BEACH Low
NHLAK600030607-01-02 AYERS POND - CAMP FIRESIDE BEACH Low
NHLAK600030703-03-03 ONWAY LAKE - CAMP ONWAY BEACH Low
NHLAK600030704-02-03 PAWTUCKAWAY LAKE - TOWN BEACH Low
NHLAK600030705-02-03 LUCAS POND - CAMP YAVNEH BEACH Low
NHLAK600030802-05-01 SANDLOT SPORTS SWIMMING AREA Low
NHLAK700010205-01-01 MIRROR LAKE - MIRROR LAKE BEACH Low
NHLAK700010303-01-02 LOWER BAKER POND - CAMP PEMIGEWASSET BEACH Low
NHLAK700010303-02-02 UPPER BAKER POND - CAMP MERRIWOOD BEACH Low
NHLAK700010306-01-02 STINSON LAKE - CAMP HAPPY T RANCH BEACH Low
NHLAK700010501-04-02 SQUAM LAKE - LIVERMORE BEACH Low
NHLAK700010501-04-03 SQUAM LAKE-TOWN BEACH Low
NHLAK700010501-04-04 SQUAM LAKE - CAMP DEERWOOD BEACH Low
NHLAK700010501-04-05 SQUAM LAKE - CAMP HALE BEACH Low
NHLAK700010501-04-06 SQUAM LAKE - WISTER POINT WEST BEACH Low
NHLAK700010501-04-07 SQUAM LAKE - MOON ISLAND SOUTH BEACH Low
NHLAK700010501-04-08 SQUAM LAKE - WISTER POINT EAST BEACH Low

142
AUID Name Rank
NHLAK700010502-01-02 LITTLE SQUAM LAKE - TOWN BEACH Low
NHLAK700010601-01-02 SPECTACLE POND - GROTON TOWN BEACH Low
NHLAK700010601-01-03 SPECTACLE POND - CIRCLE CAMP Low
NHLAK700010603-02-02 NEWFOUND LAKE - TOWN BEACH Low
NHLAK700010603-02-04 NEWFOUND LAKE - CUMMINGS BEACH Low
NHLAK700010603-02-05 NEWFOUND LAKE - WELLINGTON STATE PARK BEACH Low
NHLAK700010603-02-06 NEWFOUND LAKE - CAMP MASQUEBEC HILL BEACH Low
NHLAK700010603-02-07 NEWFOUND LAKE - CAMP MAYHEW BEACH Low
NHLAK700010603-02-09 NEWFOUND LAKE - CAMP BEREA BEACH Low
NHLAK700010603-02-11 NEWFOUND LAKE - CAMP ONAWAY BEACH Low
NHLAK700010603-02-12 NEWFOUND LAKE - CAMP PASQUANEY BEACH Low
NHLAK700010603-02-14 NEWFOUND LAKE - HEBRON TOWN BEACH Low
NHLAK700010701-02-02 KILTON POND - HUFF BEACH Low
NHLAK700010804-01-02 HIGHLAND LAKE - TOWN BEACH Low
NHLAK700020101-05-05 LAKE WENTWORTH - CAMP BERNADETTE BEACH Low
NHLAK700020101-05-07 LAKE WENTWORTH - PIERCE CAMP BIRCHMONT BEACH Low
NHLAK700020101-07-02 RUST POND - WOLFEBORO CAMP SCHOOL BEACH Low
NHLAK700020102-03-02 MERRYMEETING LAKE - CAMP CAREFREE/CAMP PRIDE BEACH Low
NHLAK700020105-02-02 LAKE KANASATKA - DEER HILL BEACH Low
NHLAK700020106-02-02 MIRROR LAKE - MIRROR LAKE BEACH Low
NHLAK700020108-02-03 LAKE WAUKEWAN - TOWN BEACH Low
NHLAK700020110-02-05 LAKE WINNIPESAUKEE - MOULTONBOROUGH TOWN BEACH Low
NHLAK700020110-02-08 LAKE WINNIPESAUKEE - CARRY BEACH Low
NHLAK700020110-02-11 LAKE WINNIPESAUKEE - PUBLIC DOCK TOWN BEACH Low
NHLAK700020110-02-15 LAKE WINNIPESAUKEE - LEAVITT PARK BEACH Low
NHLAK700020110-02-16 LAKE WINNIPESAUKEE - TOWN BEACH (CENTER HARBOR) Low
NHLAK700020110-02-17 LAKE WINNIPESAUKEE - STATES LANDING TOWN BEACH Low

143
AUID Name Rank
NHLAK700020110-02-21 LAKE WINNIPESAUKEE - BROOKWOOD/DEER RUN BEACH Low
NHLAK700020110-02-22 LAKE WINNIPESAUKEE - CAMP KABEYUN BEACH Low
NHLAK700020110-02-23 LAKE WINNIPESAUKEE - CAMP LAWRENCE BEACH Low
NHLAK700020110-02-24 LAKE WINNIPESAUKEE - CAMP MENOTOMY BEACH Low
NHLAK700020110-02-25 LAKE WINNIPESAUKEE - CAMP NOKOMIS BEACH Low
NHLAK700020110-02-26 LAKE WINNIPESAUKEE - GENEVA POINT CENTER BEACH Low
NHLAK700020110-02-28 LAKE WINNIPESAUKEE - CAMP ROBINDEL FOR GIRLS BEACH Low
NHLAK700020110-02-29 LAKE WINNIPESAUKEE - CAMP TECUMSEH BEACH Low
NHLAK700020110-02-30 LAKE WINNIPESAUKEE - CAMP WINAUKEE BEACH Low
NHLAK700020110-02-31 LAKE WINNIPESAUKEE - CAMP BELKNAP BEACH Low
NHLAK700020110-02-32 LAKE WINNIPESAUKEE - CAMP NORTH WOODS BEACH Low
NHLAK700020110-02-33 LAKE WINNIPESAUKEE - CAMP SANDY ISLAND BEACH Low
NHLAK700020110-02-35
LAKE WINNIPESAUKEE - WANAKEE UNITED METHODIST CHURCH
BEACH Low
NHLAK700020110-02-37 LAKE WINNIPESAUKEE - WAWBEEK CONDO ASSOC BEACH Low
NHLAK700020110-02-38 LAKE WINNIPESAUKEE - CAMP ADVENCHUR Low
NHLAK700020110-02-40 PLEASANT VALLEY CAMP BEACH Low
NHLAK700030101-03-02 CONTOOCOOK LAKE - TOWN BEACH Low
NHLAK700030101-10-02 HUBBARD POND - CAMP WILDWOOD BEACH Low
NHLAK700030102-01-03 THORNDIKE POND - CAMP WA-KLO BEACH Low
NHLAK700030102-01-04 THORNDIKE POND - CAMP WANOCKSETT BEACH Low
NHLAK700030103-04-02 HALFMOON POND - SARGENT CAMP/BOSTON UNIVERSITY BEACH Low
NHLAK700030104-02-02 CUNNINGHAM POND - TOWN BEACH Low
NHLAK700030105-02-06 OTTER LAKE - CAMP UNION BEACH Low
NHLAK700030105-03-02 SUNSET LAKE - TOWN BEACH Low
NHLAK700030107-02-02 NORWAY POND - TOWN BEACH Low
NHLAK700030108-01-02 WHITTEMORE LAKE - TOWN BEACH Low

144
AUID Name Rank
NHLAK700030108-02-02 GREGG LAKE - TOWN BEACH Low
NHLAK700030108-02-03 GREGG LAKE - CAMP CHENOA BEACH Low
NHLAK700030202-02-02 ISLAND POND - PUBLIC BEACH Low
NHLAK700030203-01-02 BLACK POND - CAMP INTERLOCKEN BEACH Low
NHLAK700030203-01-03 BLACK POND - WEDIKO BEACH Low
NHLAK700030203-04-02 WHITE POND - WINDSOR HILLS CAMP SCHOOL BEACH Low
NHLAK700030302-02-02 BLAISDELL LAKE - CAMP WABASSO BEACH Low
NHLAK700030302-04-02 LAKE MASSASECUM - MASSASECUM CASINO BEACH Low
NHLAK700030302-04-03 LAKE MASSASECUM - FRENCH'S PARK TOWN BEACH Low
NHLAK700030303-03-02 KEZAR LAKE - WADLEIGH STATE PARK BEACH Low
NHLAK700030401-05-02 WHITE POND - CAMP WILMOT BEACH Low
NHLAK700030402-02-02 PLEASANT LAKE - ELKINS BEACH Low
NHLAK700030501-01-05 GOULD POND - HILLSBORO TREATMENT CENTER BEACH Low
NHLAK700030505-01-02 CLEMENT POND - CAMP MERRIMAC BEACH Low
NHLAK700030505-04-01 ROLF POND - SANDY BEACH CAMPGROUND BEACH Low
NHLAK700040401-01-02 MELENDY POND - TOWN BEACH Low
NHLAK700040401-02-03 POTANIPO POND - CAMP TEVYA BEACH Low
NHLAK700060201-01-02 LOON LAKE - LOON LAKE BEACH Low
NHLAK700060201-02-01 LYFORD POND-SHERWOOD FOREST SHORES BEACH 5 Low
NHLAK700060201-03-01 NEW POND-SHERWOOD FOREST SHORES BEACH 1 Low
NHLAK700060201-03-02 NEW POND-SHERWOOD FOREST SHORES BEACH 2 Low
NHLAK700060201-03-03 NEW POND-SHERWOOD FOREST SHORES BEACH 3 Low
NHLAK700060202-03-02 CLOUGH POND - TOWN BEACH Low
NHLAK700060401-09-02 LAKE EILEEN - HIDDEN VALLEY BEACH Low
NHLAK700060401-12-01 SUNSET LAKE HIDDEN VALLEY BEACH Low
NHLAK700060402-03-02 HALFMOON LAKE - CAMP MI-TE-NA BEACH Low
NHLAK700060402-03-03 DALTON DRIVE BEACH Low

145
AUID Name Rank
NHLAK700060402-10-04 UPPER SUNCOOK LAKE - TOWN BEACH Low
NHLAK700060403-01-03 BIG WILLEY POND - PARKER MTN BEACH Low
NHLAK700060501-01-02 ADAMS POND - CAMP BEACH Low
NHLAK700060502-08-03 NORTHWOOD LAKE - CAMP WAH-TUT-CA BEACH Low
NHLAK700060502-09-02 PLEASANT LAKE - VEASEY PARK BEACH Low
NHLAK700060601-03-02 PLEASANT LAKE - PUBLIC ACCESS BEACH Low
NHLAK700060602-01-02 EVERETT LAKE - CLOUGH STATE PARK BEACH Low
NHLAK700060605-04-02 HAUNTED LAKE - TOWN BEACH Low
NHLAK700060607-01-02 GLEN LAKE - PARK BEACH Low
NHLAK700060607-04-02 UNCANOONUC LAKE - MOUNTAIN BASE BEACH Low
NHLAK700060703-02-03 CRYSTAL LAKE - MELODY PINES DAY CAMP BEACH Low
NHLAK700060703-03-02 LONG POND - CAMP CARPENTER BEACH Low
NHLAK700061001-02-03 SILVER LAKE - WALLACE GROVE BEACH Low
NHLAK700061002-01-02 DARRAH POND - TOWN BEACH Low
NHLAK700061002-04-03 NATICOOK LAKE - NATICOOK DAY CAMP BEACH Low
NHLAK700061002-04-04 NATICOOK LAKE - CAMP SARGENT BEACH Low
NHLAK700061101-01-03 ISLAND POND - SANBORN SHORE ACRES Low
NHLAK700061101-03-03 SUNSET LAKE - SUNSET PARK BEACH Low
NHLAK700061101-03-04 WASH POND - CAMP TEL NOAR BEACH Low
NHLAK700061102-09-02 SHADOW LAKE - SHADOW LAKE ASSOCIATION BEACH Low
NHLAK700061203-05-03 RAINBOW LAKE HILMARK ASSOC Low
NHLAK700061204-02-02 LITTLE ISLAND POND - CAMP RUNELS BEACH Low
NHLAK700061403-01-02 ANGLE POND - ANGLE POND GROVE BEACH Low
NHLAK700061403-06-03 GREAT POND - CAMP BLUE TRIANGLE BEACH Low
NHLAK700061403-07-02 GREENWOOD POND - GREENWOOD POND BEACH Low
NHLAK801010707-04-02 SOUTH POND - REC AREA BEACH Low
NHLAK801010806-01 WAUMBEK INN BROOK - TOWN BEACH Low

146
AUID Name Rank
NHLAK801030101-01-02 BURNS POND - PUBLIC BEACH Low
NHLAK801030101-02-02 FOREST LAKE - FOREST LAKE STATE PARK Low
NHLAK801040201-01-02 LAKE ARMINGTON - CAMP WALT WHITMAN BEACH Low
NHLAK801040201-03-02 LAKE TARLETON - KINGSWOOD CAMP BEACH Low
NHLAK801040201-03-03 LAKE TARLETON - LAKE TARLETON STATE PARK BEACH Low
NHLAK801040205-01-02 INDIAN POND - TOWN BEACH Low
NHLAK801040402-02-03 STORRS POND - ADULT BEACH Low
NHLAK801060101-01-04 CANAAN ST LAKE - CRESCENT CAMPSITES Low
NHLAK801060303-03-01 SINGING HILLS Low
NHLAK801060401-08-02 KOLEMOOK LAKE - TOWN BEACH Low
NHLAK801060402-02-02 BAPTIST POND - CAMP SUNAPEE Low
NHLAK801060402-04-02 LITTLE SUNAPEE LAKE - BUCKLIN TOWN BEACH Low
NHLAK801060402-05-02 SUNAPEE LAKE - GEORGES MILL TOWN BEACH Low
NHLAK801060402-05-06 SUNAPEE LAKE - DEPOT BEACH Low
NHLAK801060402-12-02 OTTER POND - MORGAN BEACH Low
NHLAK801060403-04-02 RAND POND - PUBLIC WAY BEACH Low
NHLAK801060405-01-02 LAKE CONISTON - CAMP CONISTON BEACH Low
NHLAK801070201-02-02 DODGE POND - CAMP KIRKHAM BEACH Low
NHLAK801070503-01-03 SPOFFORD LAKE - N SHORE RD TOWN BEACH Low
NHLAK801070503-01-04 SPOFFORD LAKE - WARES GROVE TOWN BEACH Low
NHLAK801070503-01-05 SPOFFORD LAKE - CAMP SPOFFORD BEACH Low
NHLAK801070503-01-06 SPOFFORD LAKE - ROADS END FARM BEACH Low
NHLAK802010101-06-02 MILLEN POND - TOWN BEACH Low
NHLAK802010202-17-02 UNKNOWN POND - CAMP GLEN BROOK BEACH Low
NHLAK802010302-01-03 SWANZEY LAKE - CAMP SQUANTO BEACH Low
NHLAK802010303-05-02 STONE POND - TOWN BEACH Low
NHLAK802020101-01-02 PECKER POND - CAMP TOAH NIPI BEACH Low

147
AUID Name Rank
NHLAK802020202-02-02 LAUREL LAKE - TOWN BEACH Low
NHLAK802020202-02-03 LAUREL LAKE - CAMP FLEUR DE LIS BEACH Low
NHLAK802020203-01-02 CASS POND - CAMP TAKODAH BEACH Low
NHLAK802020203-01-03 CASS POND BEACH Low
NHOCN000000000-02-04 ATLANTIC OCEAN - WALLIS SANDS BEACH AT WALLIS ROAD Low
NHOCN000000000-02-05 ATLANTIC OCEAN - CABLE BEACH Low
NHOCN000000000-02-06 ATLANTIC OCEAN - SAWYER BEACH Low
NHOCN000000000-02-07 ATLANTIC OCEAN - JENNESS BEACH Low
NHOCN000000000-02-10 ATLANTIC OCEAN - HAMPTON BEACH STATE PARK BEACH Low
NHOCN000000000-02-11 ATLANTIC OCEAN - SEABROOK TOWN BEACH Low
NHOCN000000000-02-12 ATLANTIC OCEAN - NORTH BEACH Low
NHOCN000000000-02-13 ATLANTIC OCEAN - NORTHSIDE PARK BEACH Low
NHOCN000000000-02-14 ATLANTIC OCEAN - FOSS BEACH Low
NHOCN000000000-02-16 ATLANTIC OCEAN - WALLIS SANDS STATE PARK BEACH Low
NHOCN000000000-03-02 ATLANTIC OCEAN - BASS BEACH Low
NHOCN000000000-08-03 ATLANTIC OCEAN - SUN VALLEY BEACH Low
NHRIV600020602-04-02 COLD RIVER - POT HOLE TOWN BEACH Low
NHRIV700060601-04-01 THE WILDS OF NEW ENGLAND Low
NHRIV700060903-16-02 STONY BROOK - TOWN BEACH (GOSS PARK) Low
High – Beach that is impaired for one of the stormwater parameters and has a TMDL completed (category 4A)
Medium – Beach that is impaired or potentially not attaining standards for one of the stormwater parameters and does not have a TMDL completed (category 5 or 3-PNS)
Low – Beach that is not impaired for one of the stormwater parameters (category 2 or 3-PAS)

148
APPENDIX E: RESTORATION RECOVERY POTENTIAL
MAPS FOR NEW HAMPSHIRE RIVERS BY HUC8
WATERSHED

149

150

151

152

153

154

155

156

157

158

159
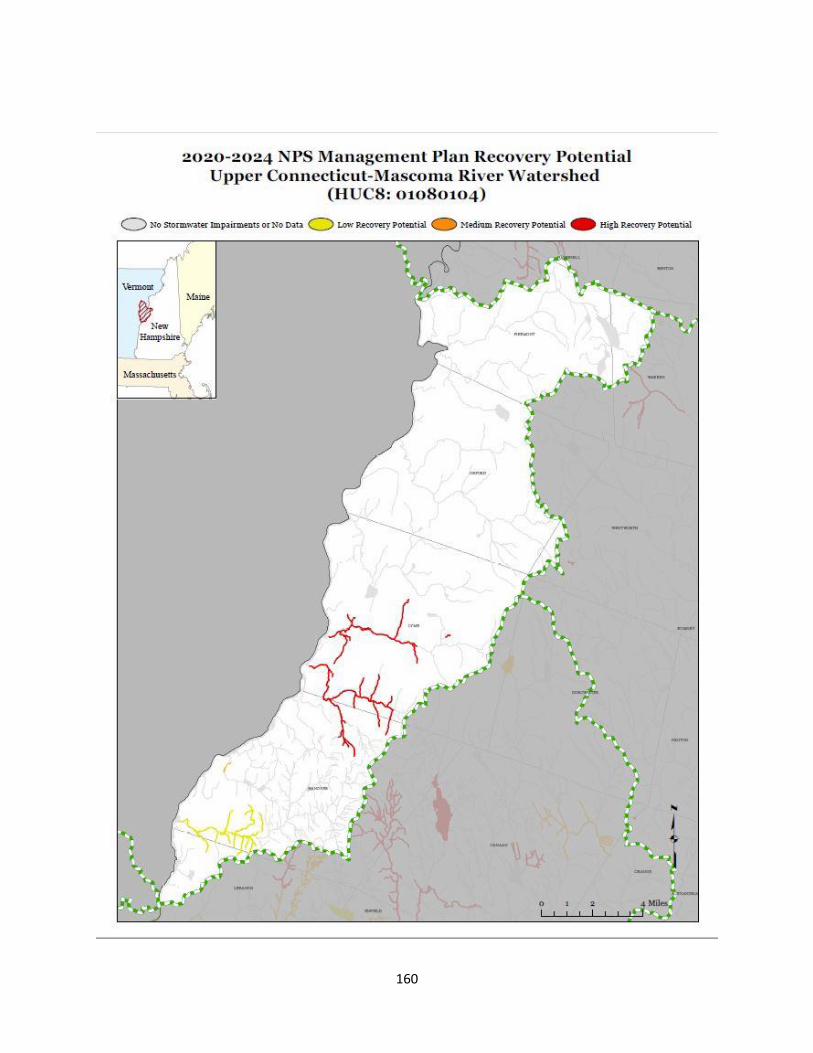
160

161

162

163

164

165
APPENDIX F: RESTORATION RECOVERY POTENTIAL
MAPS BY NEW HAMPSHIRE REGIONAL PLANNING
COMMISSION SERVICE AREAS

166

167

168

169

170
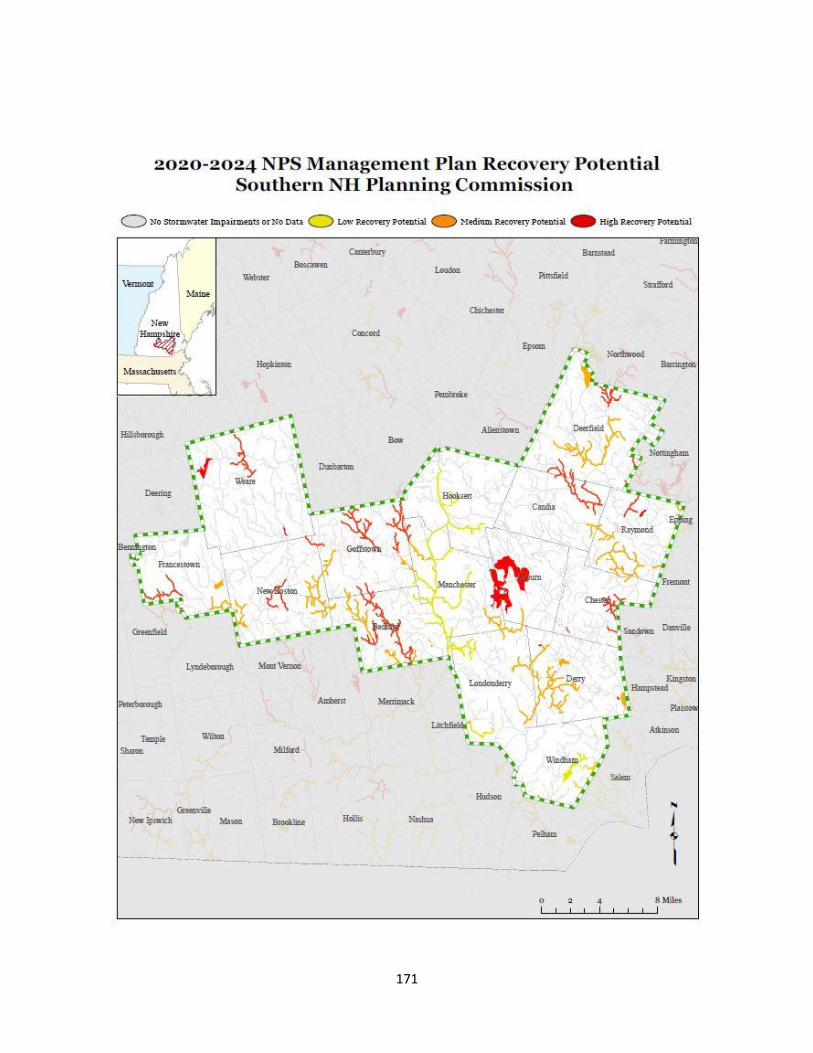
171

172

173

174
175
APPENDIX G: RESTORATION RECOVERY POTENTIAL
MAPS BY NEW HAMPSHIRE STORMWATER
COALITION

176

177

178

179
APPENDIX H: RANKING FOR PRIORITY PROTECTION
POTENTIAL WATERSHEDS (HUC 12)
Watershed
ID (HUC 12) Watershed Name
Priority
Potential
Indicator
Score
Priority
Potential
Indicator
Rank
2020 - 2024
Protection
Potential
010600020201 Upper Swift River 66.23 1 High
010600020202 Middle Swift River 65.72 2 High
010600030805 Great Brook-Exeter River 64.87 3 High
010801010602 Bog Brook 63.97 4 High
010801010706 Nash Stream 63.91 5 High
010700060603 Upper Piscataquog River 62.47 6 High
010801010603
Connecticut mainstem-Nulhegan River to Upper Ammonoosuc River 62.45 7 High
010700010301 Baker River Headwaters 62.26 8 High
010600020203 Lower Swift River 61.63 9 High
010700060602 Everett Lake 61.17 10 High
010801010903 Lancaster Tributaries 61.14 11 High
010600030802 Towle Brook-Lily Pond 61.06 12 High
010700020103 Moultonborough Inlet 61.04 13 High
010700060904 Purgatory Brook 61.01 14 High
010801010202 Lower Indian Stream 60.97 15 High
010600030704 Pawtuckaway Pond 60.87 16 High
010700060102 Boscawen-Canterbury Tributaries 60.84 17 High
010600030803 Spruce Swamp-Little River 60.42 18 High
010700060403 Big River 60.32 19 High
010700010103 Franconia Brook 60.26 20 High
010700010101 North Fork 60.21 21 High
010801030301 North Branch Gale River 59.90 22 High
010802010101 Ashuelot Pond 59.81 23 High
010801010704 Phillips Brook 59.66 24 High
010400010402 West Branch Dead Diamond River 59.63 25 High
010801010103 Perry Stream 59.54 26 High
010700060604 Rand Brook-South Branch 59.48 27 High
010400010401 Middle Branch-East Branch 59.47 28 High
010700010306 Stinson Brook 59.47 29 High
010801010902 Northumberland Tributaries 59.44 30 High

180
Watershed
ID (HUC 12) Watershed Name
Priority
Potential
Indicator
Score
Priority
Potential
Indicator
Rank
2020 - 2024
Protection
Potential
010700060601 Weare Reservoir 59.43 31 High
010600031002 Berrys Brook-Rye Harbor 59.40 32 High
010700010302 Wentworth-Warren Tributaries 59.39 33 High
010600020102 Sawyer River 59.38 34 High
010600020101 Headwaters-Saco River 59.31 35 High
010600030605 Nippo Brook-Isinglass River 59.28 36 High
010700060701 Sucker Brook 59.21 37 High
010700060606 South Branch Piscataquog River 59.19 38 High
010700010102 East Branch Pemigewasset Headwaters 59.18 39 High
010801010201 Upper Branches 59.12 40 High
010600030801 Watson Brook 58.92 41 High
010801010101 Second Connecticut Lake 58.91 42 High
010700060605 Middle Branch Piscataquog River 58.82 43 High
010700060901 Headwater Branch Tributaries 58.80 44 High
010801010802 Mill Brook 58.70 45 High
010600020305 Swans Falls 58.58 46 High
010801010404 Stratford Tributaries 58.56 47 High
010801010801 The Mystic-South Branch 58.50 48 High
010400010305 Aziscohos Lake 58.49 49 High
010400020201 Wild River 58.44 50 High
010801030401 Upper Ammonoosuc River 58.41 51 High
010801070201 Headwaters-Dodge Brook 58.34 52 High
010600020103 Rocky Branch 58.33 53 High
010801010403 Simms Stream 58.16 54 High
010400010406 Magalloway River-Sturtevant Stream 58.16 55 High
010700010305 Middle Baker River 58.09 56 High
010600030702 North Branch River 58.07 57 High
010700030204 Beards Brook 58.00 58 High
010400010304 Little Magalloway River 57.86 59 High
010801010401 Upper Mohawk River 57.81 60 High
010600020301 East Branch 57.73 61 High
010600030601 Upper Cocheco River 57.72 62 High
010400010601 Mollidgewock Brook 57.69 63 High
010801010402 Lower Mohawk River 57.68 64 High
010700060101 Webster Place Tributaries 57.68 65 High
010400010405 Dead Diamond River 57.59 66 High

181
Watershed
ID (HUC 12) Watershed Name
Priority
Potential
Indicator
Score
Priority
Potential
Indicator
Rank
2020 - 2024
Protection
Potential
010700030303 Hopkinton Lake 57.46 67 High
010600030606 Long Pond 57.42 68 High
010700030601 Hopkinton-Everett Reservoir 57.41 69 High
010400010306 Magalloway River-Abbott Brook 57.40 70 High
010700010303 Pond Brook/ Tural Brook 57.19 71 High
010700010203 Glover Brook 57.16 72 High
010801070202 Vilas Pool 57.15 73 High
010700030302 Amey Brook 57.08 74 High
010600020601 Upper Bearcamp River 56.99 75 High
010600030706 North River 56.93 76 High
010700060801 Black Brook 56.92 77 High
010801010405 Cone Brook to Nulhegan River 56.91 78 High
010801030504 Upper Wild Ammonoosuc River 56.89 79 High
010700010304 South Branch 56.89 80 High
010700060401 Crystal Lake 56.87 81 High
010600030804 Little River 56.85 82 High
010600020802 Lovell River - Ossipee Lake 56.77 83 High
010802010102 Marlow Tributaries 56.63 84 High
010801030701 Oliverian Brook 56.57 85 High
010801040203 Clay Brook 56.56 86 High
010700060903 Stony Brook 56.47 87 High
010801010702 Middle Tributaries 56.46 88 High
010600030901 Winnicut River 56.44 89 High
010600030705 Bean River 56.44 90 High
010400010404 Swift Diamond River 56.33 91 High
010801030402 Middle Ammonoosuc River 56.32 92 High
010700030603 Blackwater River 56.31 93 High
010600030806 Squamscott River 56.30 94 High
010801070203 Lower Tributaries 56.25 95 High
010801010806 Lower Israel River 56.25 96 High
010802010103 Gilsum Tributaries 56.24 97 High
010700060902 Temple Brook 56.10 98 High
010600020106 Bartlett Tributaries 56.08 99 High
010600031003 Taylor River-Hampton River 56.06 100 High
010700010202 Moosilauke Brook 56.04 101 High
010801010104 Lake Francis 56.04 102 High
010801010705 Mill Brook 55.95 103 High

182
Watershed
ID (HUC 12) Watershed Name
Priority
Potential
Indicator
Score
Priority
Potential
Indicator
Rank
2020 - 2024
Protection
Potential
010802020202 Lawrence Brook 55.95 104 High
010600030902 Oyster River 55.86 105 High
010600020803 Danforth Ponds 55.85 106 High
010600020603 Swift River 55.81 107 High
010700010206 West Branch Brook 55.74 108 High
010801030102 Johns River 55.72 109 High
010700060905 Baboosic Brook 55.65 110 Medium
010801010303 Halls Stream mainstem 55.63 111 Medium
010700060301 Turkey River 55.60 112 Medium
010700010205 Hubbard Brook to Mill Brook 55.60 113 Medium
010600020602 Cold River 55.54 114 Medium
010400010604 Stearns Brook 55.54 115 Medium
010700010204 Eastman Brook 55.45 116 Medium
010400010302 West Branch Magalloway River 55.40 117 Medium
010600030707 Little River 55.38 118 Medium
010700010602 Hornet Cove 55.36 119 Medium
010600030708 Piscassic River 55.36 120 Medium
010700010307 Lower Baker River 55.32 121 Medium
010801060101 Canaan Street Lake 55.30 122 Medium
010600030701 Headwaters-Lamprey River 55.26 123 Medium
010700060501 Pittsfield Tributaries 55.25 124 Medium
010700010403 Campton Tributaries 55.22 125 Medium
010700010201 Upper Pemigewasset Headwaters 55.19 126 Medium
010700010402 Beebe River 55.18 127 Medium
010600020605 Lower Bearcamp River 55.16 128 Medium
010700060503 Lower Suncook River 55.11 129 Medium
010700010601 Cockermouth River 55.11 130 Medium
010700030105 Otter Brook 55.05 131 Medium
010802010104 Surry Dam 55.01 132 Medium
010700061207 Merrimack mainstem-Concord River to Shawsheen River 54.95 133 Medium
010802010403 Hinsdale-Winchester Tributaries 54.91 134 Medium
010600020701 Beech River 54.90 135 Medium
010700061403 Powwow River 54.89 136 Medium
010700030106 Ferguson Brook 54.88 137 Medium
010801030101 Forest Lake-Bog Brook 54.85 138 Medium
010801010701 Headwater Branches 54.84 139 Medium

183
Watershed
ID (HUC 12) Watershed Name
Priority
Potential
Indicator
Score
Priority
Potential
Indicator
Rank
2020 - 2024
Protection
Potential
010600031004 Hampton Harbor 54.73 140 Medium
010801010102 Third Connecticut Lake 54.70 141 Medium
010801030303 Ham Branch 54.64 142 Medium
010801030502 Ogontz Brook 54.64 143 Medium
010600020401 Charles River 54.60 144 Medium
010600030607 Lower Isinglass River 54.58 145 Medium
010801010301 Bishop Brook 54.51 146 Medium
010700030107 Powder Mill Pond 54.50 147 Medium
010801030505 Lower Wild Ammonoosuc River 54.50 148 Medium
010801010703 North Branch 54.40 149 Medium
010801010804 Garland Brook 54.36 150 Medium
010700010401 Mad River 54.34 151 Medium
010700010803 Above Franklin Falls Dam 54.34 151 Medium
010600030709 Lower Lamprey River 54.23 153 Medium
010700010804 Sucker Brook-Webster Lake 54.16 154 Medium
010801040204 Grant Brook 54.15 155 Medium
010700030602 Hopkinton Dam to the Blackwater River 54.02 156 Medium
010700030203 Shedd Brook 53.93 157 Medium
010700030301 Sand Brook 53.86 158 Medium
010801010803 Israel River at Jefferson 53.86 159 Medium
010600020902 South River 53.77 160 Medium
010801040202 Jacobs Brook 53.76 161 Medium
010700060906 Beaver Brook 53.69 162 Medium
010700030404 Lower Warner River 53.52 163 Medium
010600020904 Kezar Falls 53.49 164 Medium
010700020101 Wolfeboro Bay 53.47 165 Medium
010600030602 Axe Handle Brook 53.45 166 Medium
010801030302 Meadow Brook-Middle Tributaries 53.43 167 Medium
010801030206 Bath Tributaries 53.40 168 Medium
010801040201 Eastman Brook 53.34 169 Medium
010600020104 Wildcat Brook 53.33 170 Medium
010700030503 Middle Blackwater River 53.25 171 Medium
010801060701 Little Sugar River 53.25 172 Medium
010801010203 Clarksville Tributaries 53.23 173 Medium
010400010502 Clear Stream 53.22 174 Medium
010600020302 Lower Bartlett-North Conway Tributaries 53.18 175 Medium

184
Watershed
ID (HUC 12) Watershed Name
Priority
Potential
Indicator
Score
Priority
Potential
Indicator
Rank
2020 - 2024
Protection
Potential
010801010805 Otter Brook 53.16 176 Medium
010600030904 Great Bay 53.12 177 Medium
010400010602 Bog Brook 53.11 178 Medium
010801070502 Westmoreland-Putney Tributaries 53.11 179 Medium
010802010302 Perry Brook 53.06 180 Medium
010600020703 Pine River 53.02 181 Medium
010801060102 Indian River 53.01 182 Medium
010700010702 Smith River Lower 52.99 183 Medium
010700010603 Sanborn Bay to Newfound R. 52.98 184 Medium
010700030202 Franklin Pierce Lake 52.97 185 Medium
010801040205 Hanover-Piermont Tributaries 52.96 186 Medium
010600020406 Lovewell Pond-Pleasant Pond 52.95 187 Medium
010700030604 Contoocook River Mouth 52.95 188 Medium
010700030201 Highland Lake 52.93 189 Medium
010600020702 Dan Hole River 52.90 190 Medium
010801060103 Goose Pond Brook 52.88 191 Medium
010700061404 Merrimack River-East Meadow River to mouth 52.87 192 Medium
010700030502 Frazier Brook 52.79 193 Medium
010600020405 Shepards River 52.73 194 Medium
010802020101 Whitney Pond 52.61 195 Medium
010801060104 Crystal Lake Brook 52.60 196 Medium
010700030504 Lower Blackwater River 52.59 197 Medium
010801030205 McIndoe Falls 52.55 198 Medium
010400010603 Chickwolnepy Stream 52.51 199 Medium
010801010707 Lower Tributaries 52.46 200 Medium
010600030903 Bellamy River 52.37 201 Medium
010600020903 Mill Brook 52.36 202 Medium
010600030502 Junes Brook-Branch River 52.33 203 Medium
010802010401 Winchester-Swanzey Tributaries 52.25 204 Medium
010400010303 Parmachenee Lake 52.24 205 Medium
010801030703 Haverhill Tributaries 52.24 206 Medium
010700010104 Hancock Brook 52.22 207 Medium
010400010501 Millsfield Pond Brook 52.20 208 Medium
010600020303 Lower Pequawket Brook 52.19 209 Medium
010801060702 North Charlestown Tributaries 52.11 210 Medium
010700020202 Tioga River 52.11 211 Medium

185
Watershed
ID (HUC 12) Watershed Name
Priority
Potential
Indicator
Score
Priority
Potential
Indicator
Rank
2020 - 2024
Protection
Potential
010801070505 Chesterfield Tributaries 52.07 212 Medium
010400010403 Nathan Pond Brook-Swift Diamond 52.06 213 Medium
010801070501 Walpole Tributaries 52.06 214 Medium
010600020105 Ellis River 52.04 215 Medium
010700061401 Little River 52.03 216 Medium
010802020102 Priest Brook 51.93 217 Medium
010700020107 Sanders Bay 51.75 218 Medium
010600021002 Branch Brook 51.71 219 Low
010400020101 Moose River-Moose Brook 51.69 220 Low
010700030402 Upper Warner River 51.68 221 Low
010700040302 Squannacook River 51.60 222 Low
010700030108 Great Brook-Antrim Tributaries 51.55 223 Low
010600030604 Bow Lake 51.45 224 Low
010802020203 Tully River 51.38 225 Low
010600020604 Chocorua River 51.33 226 Low
010700060402 Upper Suncook River 51.30 227 Low
010700060202 Soucook River 51.29 228 Low
010700020104 Moultonborough Bay 51.29 229 Low
010600020901 Maine State Line 51.28 230 Low
010801060305 Cornish Tributaries 51.25 231 Low
010801030503 Pearl Lake Brook-Mill Brook 51.23 232 Low
010700030401 Andrew Brook 51.22 233 Low
010600030608 Lower Cocheco River 51.21 234 Low
010700060607 Lower Piscataquog River 51.17 235 Low
010802010501 Winchester Tributaries 51.15 236 Low
010801060404 North Branch 51.10 237 Low
010802010402 Mirey Brook-Sunny Valley 51.10 238 Low
010600020404 Old Course Saco River 51.01 239 Low
010801070507 Hinsdale Tributaries 50.98 240 Low
010801030506 Pettyboro Brook-Woodsville Tributaries 50.92 241 Low
010801030501 Salmon Hole Brook 50.90 242 Low
010400020103 Shelburne Tributaries 50.88 243 Low
010600020304 Conway Lake-Center Conway Tributaries 50.84 244 Low
010700010701 Smith River Upper 50.80 245 Low
010801060105 Mascoma Lake 50.70 246 Low
010700020106 The Broads 50.69 247 Low

186
Watershed
ID (HUC 12) Watershed Name
Priority
Potential
Indicator
Score
Priority
Potential
Indicator
Rank
2020 - 2024
Protection
Potential
010801030201 Dalton Tributaries 50.62 248 Low
010801040401 Mink Brook 50.56 249 Low
010801060301 Bloods Brook 50.52 250 Low
010700060502 Little Suncook River 50.49 251 Low
010700010801 Bristol-New Hampton Tribs. 50.36 252 Low
010400020102 Upper Peabody River 50.30 253 Low
010700020108 Lake Waukewan 50.26 254 Low
010600030501 Upper Branch River-Lovell Lake 50.15 255 Low
010700060201 Gues Meadow Brook 49.99 256 Low
010700061204 Golden Brook 49.98 257 Low
010700010404 Plymouth/Ashland Tributaries 49.93 258 Low
010700061402 Merrimack River-Shawsheen River to East Meadow River 49.92 259 Low
010600030603 Middle Cocheco River 49.78 260 Low
010801060703 South Charlestown Tributaries 49.76 261 Low
010600020801 West Branch 49.73 262 Low
010400010605 Milan Tributaries 49.62 263 Low
010801030304 Lower Tributaries 49.46 264 Low
010700061101 Arlington Mill Reservoir 49.27 265 Low
010801030203 Comerford Dam Reservoir 49.21 266 Low
010700020102 Alton Bay 49.17 267 Low
010801070503 Partridge Brook 49.13 268 Low
010600020804 Broad Bay-Leavitt Bay 49.12 269 Low
010801060407 Lower Tributaries 49.04 270 Low
010700030104 Peterborough Tributaries 49.03 271 Low
010802010201 Otter Brook Reservoir 48.88 272 Low
010802010303 South Branch Ashuelot River 48.81 273 Low
010600030504 Milton Pond 48.78 274 Low
010700040301 Willard Brook 48.76 275 Low
010700030501 Upper Blackwater River 48.70 276 Low
010700061001 Pennichuck Brook 48.69 277 Low
010700030102 Stanley Brook 48.68 278 Low
010600030503 Headwaters-Great East Lake 48.63 279 Low
010400010205 Lake Umbagog 48.59 280 Low
010801030202 Moore Reservoir 48.58 281 Low
010700061002 Litchfield Tributaries 48.46 282 Low
010801010305 Halls Stream to Mohawk River 48.40 283 Low
010400010203 Swift Cambridge River 48.37 284 Low

187
Watershed
ID (HUC 12) Watershed Name
Priority
Potential
Indicator
Score
Priority
Potential
Indicator
Rank
2020 - 2024
Protection
Potential
010801040402
Connecticut mainstem-Ompompanoosuc River to White River 48.07 285 Low
010700020201 Winnisquam Lake 47.94 286 Low
010700010502 Squam River 47.88 287 Low
010801060403 South Branch 47.84 288 Low
010700061205 Lower Beaver Brook 47.83 289 Low
010801060303 Blow-me-down Brook 47.82 290 Low
010700030101 Town Farm Brook 47.78 291 Low
010700060302 Merrimack River Drainage 47.75 292 Low
010600030703 Middle Lamprey River 47.71 293 Low
010700060702 Massabesic Lake 47.55 294 Low
010700030103 Nubanusit Brook 47.33 295 Low
010700010802 Salmon Brook 47.27 296 Low
010801060401 Sawyer Brook-Stocker Brook-Eastman 47.18 297 Low
010700020109 Meredith Bay 47.02 298 Low
010700061203 Upper Beaver Brook 47.01 299 Low
010801060406 Middle Tributaries 46.97 300 Low
010700040401 Nissitissit River 46.66 301 Low
010802020103 Torbell Brook 46.60 302 Low
010802010202 The Branch 46.59 303 Low
010700020105 Center Harbor 46.34 304 Low
010400010606 Berlin Tributaries 46.25 305 Low
010801030403 Lower Ammonoosuc River 46.17 306 Low
010700020203 Silver Lake to the Merrimack River 45.69 307 Low
010700030403 Lane River 45.36 308 Low
010600030506 Middle Salmon Falls River 45.23 309 Low
010801060302 Plainfield Tributaries 45.12 310 Low
010700010501 Squam Lake Drainage 44.93 311 Low
010700060804 Londonderry Tributaries 44.79 312 Low
010801060106 Lower Mascoma River 44.62 313 Low
010600030507 Lower Salmon Falls River 43.91 314 Low
010600021001 Shapleigh Pond 43.84 315 Low
010801060402 Sunapee Lake 43.55 316 Low
010802010301 Keene Tributaries 43.27 317 Low
010700061102 Lower Spickett River 43.08 318 Low
010700060703 Cohas Brook 42.73 319 Low

188
Watershed
ID (HUC 12) Watershed Name
Priority
Potential
Indicator
Score
Priority
Potential
Indicator
Rank
2020 - 2024
Protection
Potential
010801060405 Newport Tributaries 42.67 320 Low
010700061206 Merrimack mainstem-Nashua River to Concord River 39.24 321 Low
010700020110 Paugus Bay 38.99 322 Low
010700060802 North Manchester Tributaries 38.34 323 Low
010700040402 Nashua mainstem-Squannacook River to mouth 37.17 324 Low
010600031001 Portsmouth Harbor 30.79 325 Low
010700061201 Salmon Brook 26.51 326 Low
010700060803 South Manchester Tributaries 25.08 327 Low

189
APPENDIX I: STATEWIDE PRIORITY PROTECTION
POTENTIAL FOR NEW HAMPSHIRE WATERSHEDS
(HUC12)

190