new epi-fluorescence optical system for independent analysis of two different fluorochromes in...
TRANSCRIPT
0 1995 Wiley-Liss, Inc. Cytometry 20:95-101 (1995)
New Epi-Fluorescence Optical System for Independent Analysis of Two Different Fluorochromes
in Microscopy Thomas Heiden and Bernhard Tribukait
Department of Medical Radiobiology, Karolinska Institute, S- 17176 Stockholm, Sweden
Received for publication February 23, 1994; accepted December IS, 1994
A new epi-fluorescence optical system is de- scribed that uses splitting of the primary excitation and emission light beams, independent modifka- tion of the separated beams, and their reunification. The optical system was constructed for analysis of two different fluorochromes, e.g., DAPI and TRITC. Modiacations in the separated beams comprise: (1) isolation of speciac wavelengths (365 nm, 546 nm, 435-500 nm, and 590-750 nm), (2) wavelength switching without image displacement and blur by means of a light chopper alternating between ultra- violet-excitationhlue-detection and green-excita- tiodred-detection at frequencies of up to 140 Hz for observation by eye without image flicker, and (3)
separate positioning of lenses for compensation of chromatic aberrations. This system demonstrates a good transmission of the chosen wavelengths. A high specificity of double fluorescence analysis with minimal effects of spectral overlap was ob- tained with good temporal resolution. It has been shown that it is feasable to obtain separate chro- matic compensations for the use of a microscope objective in spectral regions outside the range for which the objective is corrected. 0 1995 Wiley-Liss, h c .
Key terms: Dichroic double mirror, wavelength switching, chromatic correction, video microscopy
Fluorescence microscopy provides a highly selective and sensitive tool for analysis of biological cells with spa- tial and temporal resolution. For quantification of fluo- rescence, imaging detectors such as CCD cameras can be used. Multiple physiological parameters and chemical compounds can be examined, and it has been shown that up to five different fluorescent dyes can be measured separately in the same cell (3). The basis for such corre- lated analyses is staining with fluorochromes, which can be spectrally isolated.
In conventional microscopes, manual exchange of fil- ter sets is used for spectral selection. Alternative ap- proaches aim at computer-controlled isolation of wave- lengths for fluorescence excitation and detection and/or wavelength selection at higher speeds than those given by manual switching. Described systems utilize a motor- ized filtercube holder ( 4 ) , motorized filter wheels and monochromators (options in the Zeiss microscopes MSPZO and MPM800), acousto-optic tunable filters (5 ,8 ) , liquid crystal tuning Vari Spec filters from Cambridge Research and Instrumentation, a device for splitting of emission light and simultaneous analyses of two fluores- cence wavelengths with two cameras by Nikon (9), and special Omega filter sets exhibiting multiple spectral bands of transmission and reflection for simultaneous analysis of two or three different fluorochromes ( 6 ) . A disadvantage with the last two methods for simultaneous
analysis of multiple fluorescences is that overlap of fluo- rescence emission spectra and unbalanced fluorescence intensities can reduce the specificity of the analysis. Other approaches are discussed below in more detail.
A general problem with all methods of wavelength se- lection in microscopes is that chromatic aberrations of the microscope objective and other lenses in the optical path can impede analysis and restrict the usable spectral range to wavelengths roughly between 400 and 700 nm.
The optical system described here uses light splitting of the primary beams in both the excitation and emission paths, independent modification of the separated beams, and their reunification. As an option, the separated emis- sion light beams can be directed to different cameras or eyepieces.
The optical system was constructed for the analysis of two different fluorochromes. It exhibits a good transmis- sion for all four spectral regions isolated. The modifica- tions in the separated beams comprise, besides isolation of different wavelengths, vibration-free on-off switching at specific times by means of a light chopper placed on a
This investigation was supported by the Heinrich Warner Foundation. Address reprint requests to Bernhard Tribukait, Department of Medical
Radiobiology, Karolinska Institute, S- 171 76 Stockholm, Sweden.

96 HEIDEN AND TRIBUKAIT
separate table and the positioning of lenses to compen- sate for chromatic aberration (7). Using this system, a high specificity of analysis can be obtained at a reason- ably high frequency of wavelength switching without im- age displacement and blur, and it has been shown that the spectral range of the fluorescence imaging can be ex- tended to spectral regions outside this range, for which the microscope objective is chromatically corrected. The possibility of using the optics in automated analyses is discussed.
MATERIALS AND METHODS Epi-Fluorescence Optics
The optical configuration is shown schematically in Figure 1. Light from a mercury arc lamp is divided into two beams, which are filtered, reunited, and almost com- pletely reflected by a dichroic double mirror (Fig. 1, po- sition l l ) into a microscope objective. The filters and dichroic mirrors are chosen in such a way that an ultra. violet (365 nm) and a green (546 nm) light beam are formed and united. The pass band at one-half the peak transmittance of the combined filters for heat protection and the ultraviolet light is 33 nm; the pass band of the exitation filter for green light is 23 nm. The red-blue fluorescence light is transmitted efficiently by the di- chroic double mirror, the transmission curve of which is shown in Figure 2. The fluorescence light beam is split, scattered excitation light is removed by barrier filters, the separated blue (435-500 nm) and red (590-750 nm) beams are reunited and directed to a CCD camera (C3077, Hamamatsu, Japan; Fig. 1, position A). The sep- arated emission light beams can also be directed to two eyepieces (CFW 10 X , Nikon, Japan; Fig. 1, positions B and C). In all three positions, A, B, and C, eyepieces or CCD cameras can be used interchangeably. Two mirrors (Fig. I , positions 9 and 17) can be moved by adjustors in the x, y, and z directions providing fine adjustment for illumination and registration of the two images. For su- perimposed images, a control microscope slide with DAPI-SR101 staining solution between slide and cover- slip was used to check registration. This specimen partly contained dried regions surrounding regions of concen- trated dye solution with sharp and irregular contors. With the help of the adjustors on mirror 17 (Fig. l), the posi- tion of the blue image of such contours can be changed in relation to the red image.
The transmission through the optical system for all four wavelengths was calculated taking into account loss caused by filters, mirrors, and lens surfaces in the exci- tation path, including the lamp collector and excluding the microscope objective, and in the emission path ex- cluding the objective. The spectral transmission curves were obtained from the manufacturers or measured as described below. The calculated transmission values were 20% at 365 nm, 41% at 546 nm, 46% at 450 nm, and 59% at 650 nm. The high reflection at 365 nm and 546 nm and the good transmission at 450 nm and 650 nm provided by the dichroic double mirror are of crucial importance for this result.
FIG. 1. Schematic representation of the optical system. The direction of the light is indicated by arrows on the thick lines. The four thin arrows indicate the places where the light beams can be interrupted by the rotating light chopper, a partial view of which is shown to the right. Mercury arc lamp HBO 100 with collector and heat protection colored glass filters KGI and BG38 (1) (a rear reflector was not used), dichroic long pass mirror with edge at 420 nm ( 2 ) . bandpdss filter with a central wavelength of 546 nm (3), UGI filter with peak transmission at 360 nm ( 4 ) , full mirror ( 5 ) , correction lens (6 ) , aperture stops (7, 8) , full mirror with adjustor (9), dichroic long pass mirror with edge at 420 nm (10). dichroic double mirror ( 1 l) , microscope objective (12 ) . object glass (13), full mirror ( 1 4 ) , dichroic long pass mirror with edge at 590 nm ( 1 5 ) , long pass barrier filter with edge at 590 nm ( 1 6 ) , full mirror with adjustor (17). combined long pass filter with edge at 435 nm and short pass filter with edge at 500 n m (18). full mirror (19), insertable beam splitters or hill mirrors (20, 21), correction lens ( 2 2 ) , eyepicces (23, 2 4 ) , dichroic short pass mirror with edge at 585 nm ( 2 5 ) .
A light chopper (Fig. 1), driven by a 20 W motor (Gro- schopp & Co., Rheydt Rhld., Germany), was installed so that the ultraviolet-blue light beam pair can be transmit- ted while the green-red light beam pair is blocked and vice versa, switching at rates of up to 140 Hz. The light chopper has a duty cycle of 31%. Switching is achieved without image displacement since no mirrors or filters are moved or changed. The light chopper was placed on a separate table in order to achieve vibration-free analysis.
Switching frequency was measured with a phototransis- tor and oscilloscope. The phototransistor was mounted beside the motor and directed toward the apertures of the light chopper. On the other side of the chopper blade, an incandescent lamp was installed opposite to the pho- totransistor.
The system base has microbench optical components such as filter holders, rods, and two beam steering mirror assemblies from Spindler 81 Hoyer (Gottingen, Ger-

NEW EPI-FLUORESCENCE OPTICAL SYSTEM 97
0,o 250 350 450 550 650 750
nm FIG. 2. Transmission spectrum of the dichroic double mirror at an
incident angle of 45".
many). All other mirror holders, as well as the optical bench and the light chopper, are home-built. A HBO 100 lamp housing with power supply from Partec (Munster, Germany) and a stage of a C. Baker microscope (London, U.K.) were used. The heat protection filters KG1 and BG38 as well as the UGl filter were purchased from Schott (Mainz, Germany), the green bandpass filter 540 DF23 from Omega Optical (Brattleboro, VT), and the sin- gle-window dichroic mirrors from Partec (Miinster, Ger- many). The dichroic double mirror was custom-manufac- tured by Spindler & Hoyer.
The optical system can be supplemented by radiant field stops and also by iris diaphragms as aperture stops (Spindler & Hoyer; Fig. 1, positions 7 and 8 ) or neutral filters for independent attenuation of each excitation wavelength intensity. In the separated beams, lenses can be added for correction of chromatic aberration (Fig. 1, positions 6 and 22) depending on the wavelengths used and the correction characteristics of the microscope ob- jective. The positions of the radiant field stops and aper- ture stops are also defined by these parameters and can be chosen independently of each other. The microscope objectives used were a Zeiss Planapo 40 NA 0.6-1.0 oil and a Zeiss Achromat UV-Kond. NA 0.3-0.8 (Zeiss, Oberkochen, Germany) as well as a Partec Quartz 40 NA 1.25 Glyc. objective (Partec). The Partec objective was used to study the feasibility of simple chromatic com- pensation in the branched light path, since it was not chromatically corrected for the wavelengths chosen. If the blue image was focused at an object-to-image dis- tance of 195 mm, the uncorrected red image appeared at a distance of 300 mm with a magnification 50% greater. Parfocality of the three objectives used was not tested, since the objectives could be changed only if the micro- scope stage was turned down. However, the blue and red images were focused at the same object-to-image distance when the Planapo objective was used. The same is true for the Achromat UV-Kond. but not for the Partec objec- tive.
Cell Preparation and Staining Human ascites tumor cells from a patient with ovarian
cancer were washed with Tris buffer (0.1 M Tris, 0.07 M NaCI, 0.005 M EDTA, pH 7.5) and fixed in ice-cold 95% ethanol. DNA and protein staining was performed using DAPI (Serva 18860) and sulforhodamine 101 (SR 101, Sigma S-7635) as described by Stohr et al. (1 1).
BrdUrd in vivo labeling of mouse sarcoma cells, which were passaged by intraperitoneal injection into NMRI mice, and mouse bone marrow cells was done by injec- tion of 0.2 ml BrdUrd solution ( 12.5 mg BrdUrd / ml Tris buffer) into the peritoneal cavity. The animals were sac- rificed 30 min later. Immunostaining was carried out us- ing a combined acid- and heat-denaturation technique as described by Beisker et al. ( 1). Monoclonal anti-BrdUrd (Boehringer Mannheim Scandinavia AB, Bromma, Swe- den), diluted 1 :200 in Tris buffer containing additionally 0.5% BSA and 0.5% Tween 20, TRITC-conjugated anti- mouse goat IgG (Sigma T-5393), diluted 1:80 in Tris buffer, and CY3-conjugated antimouse goat IgG (Jackson Immuno-Research Laboratories, West Grove, PA), diluted 1 :SO in Tris buffer were used. DNA was stained with DAPI (5 p,M DAPI, 800 mM trisodium-citrate in distilled wa- ter).
Spectrophotometric Measurements of Stains and Filters
Measurements of excitation and emission spectra were performed using a Perkin-Elmer LS-5 Luminescence Spec- trophotometer (Perkin-Elmer, Stockholm, Sweden). Solu- tions of 8 pM DAPI and 50 pM SRlOl in Tris buffer (0.1 M Tris, 0.07 M NaCI, pH 7.5), of TRITC-conjugated anti- mouse goat IgG (Sigma T-5393), diluted 1530 in Tris buffer, and of CY3-conjugated antimouse goat (Jackson Immuno-Research Laboratories) diluted 1 :80 in Tris buffer were analyzed. The transmission spectrum of the dichroic double mirror was measured at an incident an- gle of 45" using a Varian Spectrophotometer (Varian, Stockholm, Sweden).
RESULTS Figure 3 shows the excitation and emission spectra of
the fluorochromes used as well as the excitation wave- lengths and spectral ranges used for fluorescence detec- tion. Good spectral isolation is possible for all dye com- binations. In Figure 4A, the conventional, separate ultraviolet-blue (left) and green-red (middle) analyses as well as the combined analysis using all four wavelengths simultaneously (right) are shown for proliferating mouse sarcoma cells stained with DAPI and TRITC-marked anti- BrdUrd antibody.
Specificity of the separate TRITC analysis is demon- strated by one nonproliferating nucleus that is com- pletely negative when excited with green light (Fig. 4A, middle). The TRITC analysis cannot be impaired by DAPI fluorescence, since DAPI is not excited by green light. However, TRITC excitation with ultraviolet light does not give blue fluorescence (result not shown) and so

98 HEIDEN AND TRIBUKAIT
L
1 DAP I TRITC
I DAPI SR101 I
250 350 450 550 650 750
nm FIG. 3. Excitation and emission spectra of the dye combinations DAPI-
TRITC, DAPI-0’3, and DAPI-SR101. The arrows indicate the two exci- tation wavelengths; the thick straight lines show the ranges of fluores- cence detection.
does not degrade the DAPI-analysis. Flow cytometric analysis confirmed that both these fluorescences can be measured with high specificity and precision when the stains are analyzed separately (results not shown).
Simultaneous analysis (Fig. 4A, right) is achievable for qualitative evaluations either by eye or with a color CCD camera. The advantage of this optical system in compar- ison with an optical system using Omega dual color filter sets is that if one fluorescence dominates over the other in simultaneous analysis, selective attenuation by a sepa- rate aperture stop or neutral filter can be introduced in the branched excitation light path.
For quantitative analysis, it is certainly better to use separate rather than simultaneous interrogation. Figure 4B shows that isolation of the red fluorescence light did not make it possible to achieve a selective CY3 analysis when DAPI and CY3 were excited at the same time. There was “spillover” of DAPI fluorescence into the red (Fig. 5B, left), mainly because of overlapping emission spectra as confirmed by red fluorescence analysis of cells only stained with DAPI and excited with ultraviolet light (result not shown). Eventually, energy transfer from DAPI to CY3 also plays a role resulting in false red fluo-
rescence intensities of double stained cells. However, the fact that CY3-negative cells showed substantial DAPI red fluorescence (see Fig. 4B) indicates spectral emission overlap, which can impede even the qualitative CY3-im- munofluorescence analysis. This “spillover” can be re- duced by selective attenuation of the DAPI excitation using a neutral filter, but it cannot be completely avoided in this way. For an unambiguous analysis especially of weak immunofluorescence, single green excitation should be used (Fig. 4B, right; Fig. 4A, middle). CY3 did not show blue fluorescence when excited with ultravio- let light (result not shown). Hence, the DAPI fluores- cence can be analyzed separately and specifically in dou- ble-stained cells, too.
Specificity of the separated analyses is maintained when introducing a light chopper for switching between the ultraviolet-blue and green-red wavelength pairs and good temporal resolution is achieved, since switching is done at frequencies of up to 140 Hz. The independent, specific images can be evaluated in the positions A, B, or C (Fig. 1) of the optical system. This can be done by eye without image flicker via eyepieces or with the aid of one (position A) or two (positions B and C ) CCD cameras.
The fine-adjustor on mirror 17 (Fig. 1 ) for registration can also be used for displacement of the two images to show them side by side instead of superimposed in posi- tion A. Figure 4C shows an example of this kind of anal- ysis at a chopping frequency of 50 Hz. Two-color images can be observed more closely for specific contributions in this way. The more general approach is exact registra- tion of the two images and their acquisition and storage in two different frames synchronized to the switching of the light chopper. Figure 4C also shows that vibration-free mechanical wavelength switching was possible. The im-
FIG. 4. A: Analysis of BrdUrd-pulse marked mouse sarcoma cell nuclei stained with DAPI and with TRITC-anti BrdUrd-immunostaining. Con- ventional, separate ultraviolet-excitatiodblue fluorescence-detection (left) and green-excitatiodred fluorescence-detection (middle) were used as well as simultaneous ultraviolet-green.excitation/blue.red-fluo- rescence detection (right). The two BrdUrd-positive nuclei in the right photo showed blue and red fluorescence. All three photomicrographs were taken with the same magnification. B: Analysis of BrdUrd-pulse marked mouse bone marrow cell nuclei stained with DAPI and by CYJ- anti BrdUrd-immunostaining. Ultraviolet-green-excitatiodred fluores- cence-detection (left) and green-excitatiodred fluorescence-detection (right) were used. Some of these cell nuclei showed a weak intensity of immunofluorescence. The photomicrographs were taken with the Same magnification. C Alternating ultraviolet-excitatiodblue fluorescence- analysis and green-excitatiodred flurescencedetection of a DAPI-SRIOI stained human ascites tumor cell from a patient with ovarian cancer. The analysis was made in position A (see Fig. 1) at a light chopper frequency of 50 Hz. The red (right) and blue (left) images were displaced by the adjustor on mirror 17 (Fig. 1) in order to show them side by side. D: Images of weak blue (left) and weak red (right) autofluorescence of an object glass with a micrometer scale. A microscope objective with severe chromatic aberrations was used. The blue image was photographed at position C (Fig. 1) and the red image at position B (Fig. 1) using an additional lens correcting for lateral chromatic aberration. The photo- micrographs were taken with the same magnification. One unit on the scale corresponds to 10 pn,
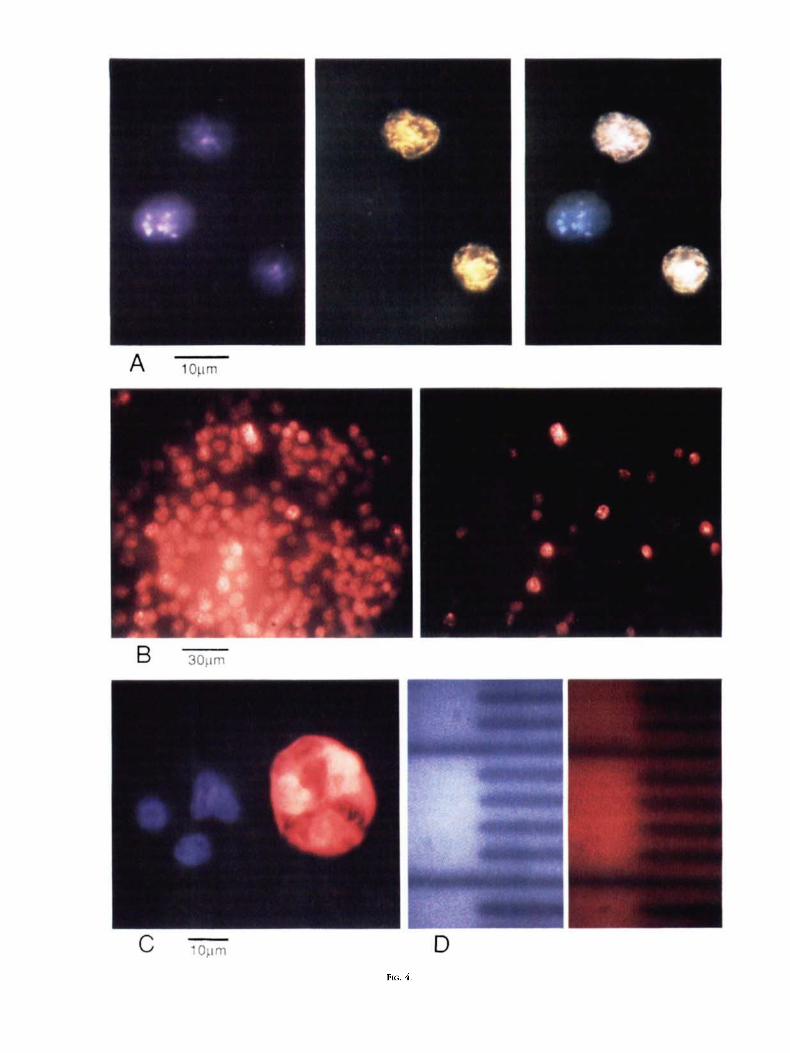
FIG. 4.

100 HEIDEN AND TRIBUKAIT
ages are unblurred, since the light chopper was placed on a separate table.
This optical system also offers the interesting possibil- ity that in the branched excitation and emission light beams chromatic aberration can be compensated. This is shown using a microscope objective with severe chro- matic aberrations (see Material and Methods: Epi-fluores- cence optics). A micrometer scale was used as object instead of cells. Figure 4D shows that for observation in positions B and C (Fig. I), the lateral chromatic aberra- tion of this objective, which resulted in an red image with 50% greater magnification compared to the blue image, could be compensated for the blue and red emission wavelengths. Additional correction of the longitudinal chromatic aberration for observation in position A (Fig. 1) is also possible, but this requires a more sophisticated design for the compensating lenses.
DISCUSSION There are approaches and conceivable combinations
that make it possible to replace conventional manual ex- change of filter sets by computer-controlled, flexible, and effective selection of wavelengths for excitation and de- tection or imaging of fluorescence in stained biological cells. For instance, a motorized eight-position filtercube holder has been used (4) as well as motorized filter wheels and incorporated into different commercially available microscopes. Filter wheels have been included in both the excitation and emission path making it pos- sible to use analysis rates of -0.5 s per wavelength (Zeiss MSP20). Motorized monochromators are used in the ex- citation path and nonimaging emission path of the Zeiss MPM 800 microscope photometer. A dual light-source, dual monochromator, rapid switching mirror system has been described for fura-2 ratio-imaging, allowing photo- metric analysis of single cells at light chopping frequen- cies of up to 30 Hz (12).
A promising approach for high-speed, vibration-free switching of wavelengths has been described in which large aperture acousto-optic tunable filters are used for microsecond frequency tuning and control of light inten- sity (5, 8). The excitation light from a broad-spectrum light source such as a xenon arc lamp can be selected by such a filter. Acousto-optic wavelength tuning in the im- aging path is more difficult, since significant image dis- tortions may occur.
Liquid crystal tuning (Vari Spec filters from Cambridge Research & Instrumentation) offers millisecond fre- quency tuning of wavelengths for imaging performance. The transmission of this filter, e.g., -30% for red unpo- larized light, is as yet relatively low in comparison with interference filters.
So far, up to five different fluorochromes have been spectrally separated in correlated analyses (3). Suitable combinations of spectral and lifetime selections could further extend the number of separately measurable dyes per cell.
Spectral selection and the use of probes that are labeled with three different fluorochromes at certain dye ratios
can increase the number of separately detectable probes to 12 in chromosome painting fluorescence in situ hy- bridization studies (2). With the aid of “multiple epitope ligand mapping microscopy,” which uses repeated bleaching-restaining combined with spectral selection of up to five dyes, the number of analyzed probes per cell has been extended to 17 (10). In recent experiments, as many as 45 different antigens have been analyzed in the same cell, and the upper limit has not yet been reached (Schubert, pers. comm.).
The optical system described here specifically ad- dresses the problem of extending the usable spectral range of available, conventional microscope objectives. In summary, the characteristics of our optical system are:
1. Good transmission for selected excitation and emis- sion wavelengths.
2. The possibility of providing independent attenua- tion of the excitation wavelengths.
3. Combined excitation and fluorescence detection wavelength switching for independent analysis of two flu- orochromes with high specificity and good temporal res- olution for observation by eye without image flicker.
4. Vibration-free wavelength switching without change of filters or mirrors and without image displacement.
5. The possibility of providing independent correction of chromatic aberration as an extension of the usable spectral range of the microscope objective.
One obvious limitation of the present system is the restriction to two fluorochromes. Probably, it is possible to increase the number of dyes by replacing the dichroic double mirror with a three- or four-window dichroic mir- ror, by the introduction of additional branchings in the light path and by the use of shutters instead of the light chopper.
The transmission efficiency of the optical system can be increased still further by consistent use of antireflec- tion coatings, by replacing full mirrors with dichroic mir- rors with high reflectivity, and by using hard-coated, tem- perature-resistant dichroic filters for heat protection instead of colored glass filters.
The good excitation light transmittance of this optical system, together with the high-radiance HBO 100 lamp, results in light intensities that certainly are often too high for studies on viable cells. However, high excitation en- ergies combined with good transmission of emission light make it possible to shorten the time of image acquisition in analyses of fixed cells. Yet, it can be advantageous to lower excitation intensity in order to reduce bleaching.
When observing the images directly by eye using the rotating light chopper, the fluorescence intensity is sub- stantially decreased since the duty cycle of the light chopper is 3 1 % . When using gated analysis by a CCD camera synchronized with the light chopper, analysis without loss of signal intensity can be achieved.
The use of an image intensifier can further reduce anal- ysis time by increasing detection sensitivity. Future im- provements will include synchronization of the light chopper with the CCD camera for analysis in position A (Fig. 1) and the addition of an image intensifier. This will

NEW EPI-FLUORESCENCE OPTICAL SYSTEM 101
probably make it possible to perform quantitative analy- ses of weak immunofluorescences at frequencies of up to 25 Hz. The synchronization is a prerequisite for exact quantitative recording of the fluorescence intensities and for automated analysis using two frames of the image stor- ing device.
As alternatives to the mechanical light chopper, liquid crystal shutters and acousto-optical modulators can be used for wavelength switching. The rapidity with which acousto-optic modulators, or acousto-optic tunable fil- ters, can alternate between the two spectral images ( lo5 Hz or more) can be fully exploited only in video rnicros- copy subsequent to the development of fast-scanning cameras and high-frame-rate, image-storing devices. Prob- ably, higher excitation energies and the development of dyes with larger extinction coefficients and high quan- tum yields are also necessary to increase substantially the analysis rate provided by standard video cameras (33 Hz, 25 Hz).
LITERATURE CITED 1. Beisker W, Dolbeare F, Gray JW: An improved immunocytochemical
procedure for high-sensitivity detection of incorporated Bromode- oxyuridine. Cytometry 8:235-239, 1987.
2. Dauwerse JG, Wiegant J, Raap Ay Breuning MH, van Ommen GJB: Multiple colors by fluorescence in situ hybridization using ratio-
labelled DNA probes create a molecular karyotype. Hum Mol Genet
3. DeBiasio R, Bright GR, Ernsp LA, Waggoner AS, Taylor DL: Five- parameter fluorescence imaging: Wound healing of living Swiss 3T3 cells. J Cell Biol 105:1613-1622, 1987.
4. Galbraith W, Wagner MCE, Chao J, Abaza M, Ernst LA, Nederlof MA, Hartsock RJ, Taylor DL, Waggoner AS: Imaging cytometry by multi- parameter fluorescence. Cytometry 12:579-596, 1991.
5. Gottlieb M, Feichtner JD, Conroy J: Programmable acousto-optic filter-a device for multispectral processing. Proc SOC Photo-Opt lnstrum Eng 232:33-41, 1980.
6. Haugland RP: Fluorescein substitutes for microscopy and imaging. In: Optical Microscopy for Biology, Herman B, Jacobson K (cds) Wiley-Liss, New York, 1990, pp 143-157.
1 (8h593-598, 1992.
7. Heiden T, Tribukait B: Germany Patent DE 4221063 Al. 8. Kurtz I, Dwelle R, Katzka P Rapid scanning fluorescence spectros-
copy using an acousto-optic tunable filter. Rev Sci lnstrum 58 ( I 1 ):
9. Morris SJ: Real-time multi-wavelength fluorescence imaging of living cells. Biotechniques 8 (3):296-307, 1990.
10. Schubert W: Multiple antigen-mapping microscopy of human tissues. In: Advances in Analytical Cellular Pathology, Burger G, Oberholzer M, Vooijs GP (eds). Exerpa Medica, Amsterdam, 1990, pp 97-98.
1 1. Stohr M, Vogt-Schaden M, Knobloch M, Vogel R, Futtermann G: Eval- uation of eight fluorochrome combinations for simultaneous DNA- protein flow analyses. Stain Tech 53:205-215, 1978.
12. Tsien RY, Rink TJ, Poenie M: Measurement of cytosolic free Ca2 + in individual small cells using fluorescence microscopy with dual ex- citation wavelengths. Cell Calcium 6:145-157, 1985.
1996-2003, 1987.