new energy solar (asx: new) presentation … · 2. 2. disclaimer. this document is prepared by new...
TRANSCRIPT

13 April 2018
NEW ENERGY SOLAR (ASX: NEW) PRESENTATION MORGAN STANLEY CLEAN ENERGY DAY
Today, New Energy Solar1 will be presenting at Morgan Stanley’s Clean Energy Day conference. The presentation is attached.
For further information, contact:
Fleur Jouault GRACosway 0405 669 632
About New Energy Solar
New Energy Solar was established in November 2015 to invest in a diversified portfolio of solar assets across the globe and help investors benefit from the global shift to renewable energy. The Business acquires large scale solar power plants with long term contracted power purchase agreements. In addition to attractive financial returns, this strategy generates significant positive environmental impacts for investors.
Since establishment, New Energy Solar has raised over A$500 million of equity, acquired a portfolio of world-class solar power plants, and has a deep pipeline of opportunities primarily across the United States and Australia. New Energy Solar’s initial public offering was led by Morgan Stanley and its securities trade on the Australian Securities Exchange under the ticker, NEW.
New Energy Solar is a listed stapled entity consisting of New Energy Solar Fund (ARSN 609 154 298) and New Energy Solar Limited (ACN 159 902 708). For more information, visit: www.newenergysolar.com.au
1 New Energy Solar Limited (Company) and Walsh & Company Investments Limited as responsible entity of New Energy Solar Fund (Trust), together New Energy Solar.

1
Morgan Stanley Clean Energy DaySydney, 13 April 2018
Questions to the New Energy Solar management team can be addressed to [email protected]
RENEWABLE ENERGY. SUSTAINABLE INVESTING

22
DisclaimerThis document is prepared by New Energy Solar Manager Pty Limited (ACN 609 166 645) (Investment Manager), a corporateauthorised representative (CAR No. 1237667) of Walsh & Company Asset Management Pty Limited (ACN 159 902 708, AFSL 450 257),and investment manager for New Energy Solar Fund (ARSN 609 154 298) (Trust), and New Energy Solar Limited (ACN 609 396 983)(Company). The Trust and the Company (together with their controlled entities) are referred to as the ‘Business’, ‘NEW’ or ‘NewEnergy Solar’.
This document may contain general advice. Any general advice provided has been prepared without taking into account your objectives,financial situation or needs. Before acting on the advice, you should consider the appropriateness of the advice with regard to yourobjectives, financial situation and needs.
This document may contain statements, opinions, projections, forecasts and other material (forward looking statements), based onvarious assumptions. Those assumptions may or may not prove to be correct. The Investment Manager and its advisers (including all oftheir respective directors, consultants and/or employees, related bodies corporate and the directors, shareholders, managers, employeesor agents of any of them) (Parties) do not make any representation as to the accuracy or likelihood of fulfilment of the forward-lookingstatements or any of the assumptions upon which they are based. Actual results, performance or achievements may vary materially fromany projections and forward looking statements and the assumptions on which those statements are based. Readers are cautioned notto place undue reliance on forward looking statements and the Parties assume no obligation to update that information.
The Parties give no warranty, representation or guarantee as to the accuracy or completeness or reliability of the information containedin this document. The Parties do not accept, except to the extent permitted by law, responsibility for any loss, claim, damages, costs orexpenses arising out of, or in connection with, the information contained in this document. Any recipient of this document shouldindependently satisfy themselves as to the accuracy of all information contained in this document.

33
Agenda
Transformation to renewables
1
Comparison: Australian and US markets
2
Progress since listing
3
PresentersJohn Martin, Chief Executive OfficerLiam Thomas, Head of Investments
4
5 Conclusion and Outlook
Introduction to NEW
6 Q&A

44
1 Introduction to NEW

55
CAPITAL AND ENVIRONMENTAL IMPACT GROWTH
52,000
82,000
156,000
0
80,000
160,000
0.0
0.5
1.0
2016 2017 2018
Hom
es P
ower
ed
Cum
ulat
ive
capi
tal c
omm
itted
(A$b
n)
Cumulative Capital Committed (AU$) Homes Powered
About New Energy Solar (ASX: NEW)
Notes: 1. Based on full year expected production assuming committed MWDC is operational and average household consumption of approximately 8,375KWh per annum. 2, Before taxes, management expenses, administration costs and external borrowing costs.
NEW is an Australian based business focused on acquiring attractive large scale solar power plants with contracted cashflows from creditworthy offtakers
Investment Mandate Business GrowthPARAMETER NEW MANDATE
Asset Type
Renewable energy generation with a focus on large-scale solar PV with long-term contracted off-take agreements with creditworthy counterparties
LocationDeveloped and stable economies with an initial focus on US, Australia and selected OECD
Portfolio MixInvest in a diversified portfolio of generation projects at a stage which minimises exposure to development risk
Return expectations
Secure and stable cash flows suitable for infrastructure and sustainable investors with the aim of achieving gross portfolio returns of 7-10% pa2
1

66
Portfolio Summary
Notes: Includes plants that are either wholly or partly owned by NEW. Total portfolio of 680MWDC includes plants that are operational, acquired and under construction or committed. 1. PPA terms of committed projects have been determined from commercial operations date. 2. Rigel Portfolio refers to portfolio of assets NEW has acquired, or has committed to acquire from Cypress Creek Renewables.
Oregon PlantsName Capacity
(MWDC)Location Offtaker
Bonanza 6.8 Klamath PacifiCorp
Total 6.8
North Carolina Plants
NameCapacity (MWDC) Location Offtaker
NC-31 43.2 Bladenboro Duke Energy Progress
NC-47 47.6 Maxton Duke Energy Progress
Arthur 7.5 Columbus Duke Energy Progress
Hanover 7.5 Onslow Duke Energy Progress
Heedeh 5.4 Columbus Duke Energy Progress
Organ Church
7.5 Rowan Duke Energy Carolinas
County Home
7.2 Richmond Duke Energy Progress
Total 125.9
Key
Operational
Acquired / under construction
Committed
Nevada Plants
NameCapacity (MWDC) Location Offtaker
Boulder Solar 1 125.0 Clarke County
NV Energy
Total 125.0
United States of America
Additional Committed US Projects
NameCapacity (MWDC) Location Expected Offtaker
Rigel Portfolio2 87.4 North Carolina and Oregon
Duke Energy Progress and PacifiCorp
Total 87.4
20 plants with blue-chip offtake and a capacity weighted PPA term remaining of 17.7 years as at 31 December 2017
California Plants
NameCapacity (MWDC) Location Offtaker
Mount Signal 2 200.0 California Southern California Edison
Stanford SGS 67.4 Rosamond Stanford University
TID SGS 67.4 Rosamond Turlock Irrigation District
Total 334.8

77
2 The Renewable Energy Transformation

88
GLOBAL NEW INVESTMENT IN CLEAN ENERGY BY SECTOR2 US$bnUS ELECTRICITY GENERATION BY FUEL TYPE1
A Global TransformationThe growth in renewable energy continues with 2017 marking the second largest year ever for investment in renewable technologies
48% 44% 45% 42% 37% 39% 39% 33% 30% 30%
20%20% 20%
19%19% 19% 19%
19% 20% 20%
22% 24% 24%25% 31% 28% 28%
33% 34% 32%
9% 11% 10% 13% 12% 13% 13% 14% 15% 18%
2008 2009 2010 2011 2012 2013 2014 2015 2016 2017
Coal Oil Nuclear Natural gas Renewables (including hydro)
11 16 22 3962 64
103158 140 120
145179
137161
2840
61
75 80
102
8784
86
111
125
122107
29
27
18 10
11
11
27
34
40
5551 53
61
68
5957
60
53
64 63
2004 2005 2006 2007 2008 2009 2010 2011 2012 2013 2014 2015 2016 2017
Solar Wind Biofuels Other
Notes: 1. Bloomberg New Energy Finance, Sustainable Energy in America 2018 Factbook. 2. Bloomberg New Energy Finance, Clean Energy Investment Trends

99
GLOBAL INSTALLED GENERATION CAPACITY
Projection of Global Generation CapacityBy 2040, solar PV is projected to represent 32% of global installed electricity generation capacity, up from 5% in 2016
2016 2040E
Source: Bloomberg New Energy Finance, New Energy Outlook 2017

1010
GLOBAL WEIGHTED LEVELISED COST OF SOLAR PV1 US$/MWh LEVELISED COST OF ELECTRICITY 1H 2018 AUSTRALIA2 US$/MWh
The Cost ArgumentRenewable technology is quickly becoming the most cost effective means of producing electricity
42 47 68 111
45 57 84 135 152
207
75 85 83
146 145
337 330
583
326
407
Onshorewind
No trackPV
CCGT Coal Onshorewind+battery
No trackPV+battery
Utilityscale
battery
Pump-hydro
OCGT Gasrecip.
engine
Notes: 1. IRENA Renewable Power Generation Costs in 2017. 2. Bloomberg New Energy Finance, 1H 2018 LCOE Update - Global
$0
$50
$100
$150
$200
$250
$300
$350
$400
2010 2011 2012 2013 2014 2015 2016 2017
US$
/MW
h

1111
3 Comparison: Australian and US Utility Scale Solar Markets

1212
UTILITY SCALE SOLAR CAPACITY BY DEVELOPMENT PHASE AS AT 11 APRIL 2018
Relative Investment opportunityWhile the US Solar market has had superior depth and scale, Australia has a growing pipeline
[x]TW total installed capacity
$ Long term PPAs: Rare
Uncertain future pricing due to
indecisive policy
0.62.7
13.9
30.0
16.9
26.7
0
5
10
15
20
25
30
35
Operational Under Construction Development Pipeline
Inst
alle
d C
apac
ity (G
WD
C)
Australia USA
Source: GTM Research, US Solar Market Insight: 2017 Year In Review and SERA Solar Market Tracker
1313
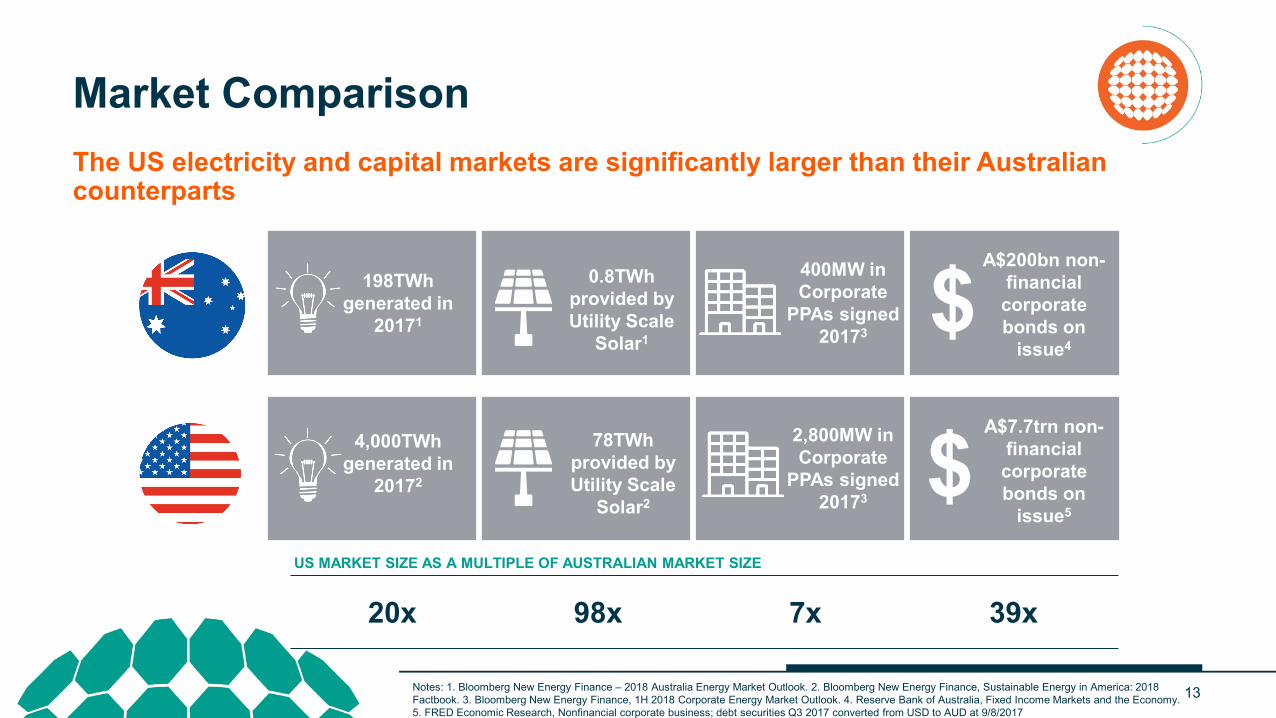
Market ComparisonThe US electricity and capital markets are significantly larger than their Australian counterparts
198TWh generated in
20171
4,000TWh generated in
20172
78TWh provided by Utility Scale
Solar2
2,800MW in Corporate
PPAs signed 20173
A$7.7trn non-financial corporate bonds on
issue5
0.8TWh provided by Utility Scale
Solar1
Notes: 1. Bloomberg New Energy Finance – 2018 Australia Energy Market Outlook. 2. Bloomberg New Energy Finance, Sustainable Energy in America: 2018 Factbook. 3. Bloomberg New Energy Finance, 1H 2018 Corporate Energy Market Outlook. 4. Reserve Bank of Australia, Fixed Income Markets and the Economy. 5. FRED Economic Research, Nonfinancial corporate business; debt securities Q3 2017 converted from USD to AUD at 9/8/2017
400MW in Corporate
PPAs signed 20173
$
A$200bn non-financial corporate bonds on
issue4$
US MARKET SIZE AS A MULTIPLE OF AUSTRALIAN MARKET SIZE
20x 98x 7x 39x

1414
4 Progress since listing

1515
Underlying performance – FY 2017
At the asset level, operational solar plants produced US$21.7m of underlying revenue and US$17.3m of underlying EBITDA during 2017
Performance Earnings
Note: Operating financial performance for NC-31 and NC-47 cover the period since commercial operations date (COD) (March 2017 and May 2017, respectively) to 31 December 2017. There are some differences in the earnings figures due to rounding.
TID SGS – October 2017
CAPACITY GENERATION
NC-31 43.2MWDC 54GWh
NC-47 47.6MWDC 45GWh
Stanford SGS 67.4MWDC 153GWh
TID SGS 67.4MWDC 153GWh
Total 225.6MWDC 405GWh
Revenue US$21.7m
Less: Opex (US$4.4m)
EBITDA US$17.3m
Less: Distributions to tax equity and EBITDA attributed to minorities
(US$5.5m)
EBITDA attributable to NEW US$11.9m

1616
TOTAL RETURN SINCE 1 DECEMBER 20174
Securityholder returns since listing
Notes: 1. Based on 11 April 2018 security price of $1.43. 2. CO2 emission reduction is calculated using the United States Environmental Protection Agency’s “Avoided Emissions and Generation Tool”, which estimates the regional displacement of fossil fuels for a new solar PV installation and based on 326,297,684 securities as at 31/12/2017. 3. Based on Net Asset Value of $1.45 as at 31 December 2017 and 11 April 2018 stapled security price of $1.43. 4. Bloomberg data period 1 December 2017 to 6 April 2018
With a 4c distribution paid in February, NEW has performed well against benchmarks since IPO
1
-15.00%
-10.00%
-5.00%
0.00%
5.00%
10.00%
ASX200 NEW ASX200 A-REIT ASX200 Utilities
Capital
Distribution
Total
FY18 target distribution of
7.75cps…
$… representing
5.4% gross yield at current security
price1
Net Asset Value of $1.45ps, a premium of
1.5% to current security price3
Expected 1.2kg reduction in C02 per
security in 20182

1717
ONCE OPERATIONAL, NEW ENERGY SOLAR’S CURRENT PORTFOLIO IS EXPECTED TO…2
Growth of portfolio since IPO
New Energy Solar’s portfolio has increased in size by over 90% since IPO
1
PORTFOLIO COMPARISON
AT IPO CURRENT
Committed (MWDC) 129 87
Under Construction (MWDC) 0 242
Operational (MWDC) 226 351
Total Capacity (MWDC) 355 680
Capital Committed (A$m)1 419 833
Displace 895,000 tons of CO2
…or powering 156,000 homes
Equivalent to removing
213,000 cars from the road…
Generate in excess of
1,400,000MWh of electricity
annually
Notes: 1. Capital committed converted from US$ to A$ at 1/12/2017 and 9/4/2018 respectively. 2. Solar energy plant CO₂ emission reduction calculated using the US Environmental Protection Agency’s AVoided Emissions and geneRation Tool (AVERT). CO₂ emissions displacement is calculated as the emissions that would be produced during the calculation period if the same amount of energy was produced by a coal fired plant instead. Average household consumption of approximately 8,375KWh pa and car emissions of 4.2tCO2 pa assumed.

1818
Key
Mount Signal 2
Existing Californian Assets
Acquisition Update: Mount Signal 2In March, New Energy Solar acquired 100% of the cash equity interests in the 200MW Mount Signal 2 project from an affiliate of D.E. Shaw Renewable Investments
1
TECHNICAL INFORMATION
Location California, US
Capacity 200MW(DC)
Expected Operational Date Late 2019
EPC Contractor Swinerton Renewable Energy
PPA Offtaker Southern California Edison (SCE)
PPA Term 20 years, beginning June 2020

1919
TOP 5 US PPA OFFTAKERS BY GWH PURCHASED, Q3 2013 - Q4 20171
PPA Offtaker Case Study: SCESCE is the primary electricity provider for central, southern and coastal California, serving more than 15 million people
1
CALIFORNIA RENEWABLES PORTFOLIO STANDARD – AGGREGATED IOU PROGRESS2
47,635
43,903
34,434
28,925
18,434
PG&E Corp
Southern California Edison Company
Xcel Energy Inc
Public Service Company of Colorado
Tennessee Valley Authority
Note: 1. Bloomberg New Energy Finance, U.S. Power Purchase Agreement and Offtake Prices. 2. California Public Utilities Commission, Renewables Portfolio Standard Annual Report - 2017

11
Update on acquisition pipeline
• The acquisition of the Rigel Portfolio, Boulder Solar 1 and Mount Signal 2 project represent execution of identified pipeline opportunities described in the Offer Document1
• In addition to the identified pipeline, NEW has continued to source and evaluate new assets for the portfolio
– Includes both reviewing repeat transaction opportunities with developers it has previously partnered with, as well as leveraging NEW’s relationships and market presence to access new opportunities
• The recent US tariff announcement on imported panels will likely impact project build costs, but was largely expected, and NEW continues to see opportunities that fit with the investment strategy
• Development activity in Australia has increased markedly during recent months, and NEW continues to evaluate opportunities for its first Australian acquisition
Note: 1. Product Disclosure Statement and prospectus dated 2 November 2017
Offer document acquisition goals realised, pipeline of quality opportunities still strong
20

2121
5 Conclusion and Outlook

2222
Conclusion and outlook
• Investment in and the development of renewable energy infrastructure has continued pace with US$333.5bn invested globally in 2017, up 3% from 20161
• Significant markets include:– The US, where 37 states now have legislative regimes that are favourable for renewable energy2;– Europe, where 30% of total electricity is generated from renewable sources3 and;– China, which installed 53GW of solar PV capacity in 2017, 58% higher than capacity installed in 20161
• Having met the earnings expectations and acquisition goals set out in its Offer document, NEW is completing construction and transaction processes, as well as developing new acquisition and development opportunities
• Once all portfolio assets are operational, NEW will have interests in a substantial portfolio of 20 assets across four US states generating in excess of 1,400,000 MWh pa
• As a result of portfolio growth the 2018 stapled security distribution is expected to be 7.75cps, representing year-on-year distribution growth of 7.6%
Note: 1. Bloomberg New Energy Finance, The Force Is With Clean Energy: 10 Predictions for 2018. 2. National Conference of State Legislatures – State renewable portfolio and goals. 3. Eurostat – Renewable energy statistics

2323
6 Q&A

2424
Stanford SGS & TID SGS site at sunset - September 2017
Stanford SGS and TID SGS sites at sunset – September 2017