new developments in portable fast gas chromatography
TRANSCRIPT
Louisiana State UniversityLSU Digital Commons
LSU Historical Dissertations and Theses Graduate School
1997
New Developments in Portable Fast GasChromatography.Elena Ursula EhrmannLouisiana State University and Agricultural & Mechanical College
Follow this and additional works at: https://digitalcommons.lsu.edu/gradschool_disstheses
This Dissertation is brought to you for free and open access by the Graduate School at LSU Digital Commons. It has been accepted for inclusion inLSU Historical Dissertations and Theses by an authorized administrator of LSU Digital Commons. For more information, please [email protected].
Recommended CitationEhrmann, Elena Ursula, "New Developments in Portable Fast Gas Chromatography." (1997). LSU Historical Dissertations and Theses.6480.https://digitalcommons.lsu.edu/gradschool_disstheses/6480
INFORMATION TO USERS
This manuscript has been reproduced from the microfilm master. UMI
films the text directly from the original or copy submitted. Thus, some
thesis and dissertation copies are in typewriter face, while others may be
from any type o f computer printer.
The quality of this reproduction is dependent upon the quality o f the
copy submitted. Broken or indistinct print, colored or poor quality
illustrations and photographs, print bleedthrough, substandard margins,
and improper alignment can adversely afreet reproduction.
In the unlikely event that the author did not send UMI a complete
manuscript and there are missing pages, these will be noted. Also, if
unauthorized copyright material had to be removed, a note will indicate
the deletion.
Oversize materials (e.g., maps, drawings, charts) are reproduced by
sectioning the original, beginning at the upper left-hand comer and
continuing from left to right in equal sections with small overlaps. Each
original is also photographed in one exposure and is included in reduced
form at the back o f the book.
Photographs included in the original manuscript have been reproduced
xerographicalty in this copy. Higher quality 6” x 9” black and white
photographic prints are available for any photographs or illustrations
appearing in this copy for an additional charge. Contact UMI directly to
order.
UMIA Bell & Howell Information Company
300 North Zeeb Road, Ann Aibor MI 48106-1346 USA 313/761-4700 800/521-0600
Reproduced with permission of the copyright owner. Further reproduction prohibited without permission.

Reproduced with permission of the copyright owner. Further reproduction prohibited without permission.
NEW DEVELOPMENTS IN PORTABLE FAST GAS CHROMATOGRAPHY
A Dissertation
Submitted to the Graduate Faculty of the Louisiana State University and Agricultural and Mechanical
College in partial fulfillment of the requirements for the degree of
Doctor of Philosophy
in
The Department of Chemistry
byElena U. Ehrmann
B. S., Universidad Simon Bolivar - Caracas, 1980 August 1997
Reproduced with permission of the copyright owner. Further reproduction prohibited without permission.
UMI Number: 9808737
Copyright 1997 by Ehrmann, Elena UrsulaAll rights reserved.
UMI Microform 9808737 Copyright 1997, by UMI Company. AU rights reserved.
This microform edition is protected against unauthorized copying under Title 17, United States Code.
UMI300 North Zeeb Road Ann Arbor, MI 48103
Reproduced with permission of the copyright owner. Further reproduction prohibited without permission.

©Copyright 1997 Elena U. Ehrmann All rights reserved
Reproduced with permission of the copyright owner. Further reproduction prohibited without permission.

ACKNOWLEDGMENT
The best things in life are those which you love and hate at the same time.. .this
certainly applies to the completion of this dissertation. Now, almost at the end of the
road that I started 5 years ago, I wish to thank everybody who helped me, not only for
the completion of this “partial requirement,” but also for making these past five years an
enjoyable experience.
First and foremost, I like to thank Roland, my husband, for his patience, support,
and belief in me. He shared moments o f frustration and joy along the journey, and above
all, kept me focused on the main goal. I also thank my children, Daniel, Tamara and
Anabel, who never complained when they had to stay with baby-sitters or in after school
care, who helped wherever they could, and encouraged me at the time of writing this
document. Special thanks go to my parents, who, even though saddened by our long
absence, always supported me and shared my excitement about this wonderful
opportunity.
I wish to express my appreciation to my major professor, Dr. Ed Overton, for
continuous support during my research. I am also thankful to my committee members,
Dr. Robert Gale, Dr. Robin McCarley, Dr. Steven Soper, and Dr. Michael Henson, for
helpful hints, and continuous support during my years at LSU. Special thanks go to Dr.
Isiah Warner, chairman of the Chemistry Department, for allowing me to participate in
his group meetings, and supporting me throughout my years at LSU.
I owe a big “Thank You” to my laboratory colleague and friend, Hettihe
Dharmasena, “Dharme." His outstanding electronic expertise made this work possible;
iii
Reproduced with permission of the copyright owner. Further reproduction prohibited without permission.
his unconditional friendship brightened my days in the lab. I also thank Dr. Ken Carney,
for helpful discussions, editing of papers, and proofreading of this document, Dr.
Roberto Wong, for solving my problems with the computers, and all the staff and
faculty of the Institute for Environmental Studies, for making the Atkinson basement a
second home to me. Especially, I thank Ann Zoeller for offering her true friendship
from the first day on, helping through the difficult first months o f adaptation to a new
country and culture. I also like to thank all the friendly people of LSU, Baton Rouge,
and Louisiana, who made the integration in this society an easy task, and the departure
from this place hard.
I would like to extend my appreciation to my first boss and good friend, Dr.
Joaquin Lubkowitz and his wife, Adela Fernandez, for helping out with needed
supplies, encouragement and advice, and offering enjoyable weekends in Pensacola
Beach.
Last, but not least, I like to thank INTEVEP, the Venezuelan Institute for Oil
Research and Development, for awarding me the scholarship that made this possible. I
thank all my friends and colleagues there, who always stayed in touch, looking forward
to my return, and making me feel, even across the miles, part of them.
As I prepare to depart, half of me saddens, and the other half rejoices; and I am
thankful for it. The years in Louisiana have shaped our lives, and will stay for ever in
our hearts and minds.
iv
Reproduced with permission of the copyright owner. Further reproduction prohibited without permission.

TABLE OF CONTENTS
ACKNOWLEDGMENTS--------------------------------------------------------------- iii
LIST OF TABLES........................................................................................................... viii
LIST OF FIGURES........................................................................................................... ix
ABSTRACT...................................................................................................................... xv
CHAPTER 1INTRODUCTION...............................................................................................................1
1.1 On-site Chemical Analysis........................................................................................11.2 On-site Gas Chromatography..................................................................................31.3 Portable Gas Chromatography - Current Sate of the A rt...................................41.4 Objective.....................................................................................................................71.5 References for Chapter 1......................................................................................... 8
CHAPTER 2FAST GAS CHROMATOGRAPHY THEORETICAL BACKGROUND................ 10
2.1 Gas Chromatography..............................................................................................102.2 Historical Development...........................................................................................122.3 The Separation Process and Basic Definitions..................................................... 152.4 The Flow of Gases in Capillary Columns.............................................................202.5 Separation Efficiency - the Plate Theory..............................................................222.6 Column Efficiency - the Rate Theory..................................................................27
2.6.1 The A Term -Eddy Diffusion or Multipath Term............................................292.6.2 The B term — Linear or Axial Diffusion...........................................................302.6.3 The C Term - Radial Diffusion or Resistance to Mass Transfer..................... 312.6.4 The Generalized Plate Height Equation for Capillary Columns...................... 36
2.7 The van Deemter Plot............................................................................................. 382.8 Other Contributions to the Plate Height: Extra-column Effects and
Non-uniformities..................................................................................................... 402.9 Column Performance, Optimization and Analysis Speed..................................432.10 Sample Capacity................................................................................................... 492.11 Temperature Programming.................................................................................512.12 Fast Gas Chromatography Today.......................................................................572.13 References for Chapter 2 .....................................................................................59
CHAPTER 3PRELIMINARY COLUMN AND INSTRUMENT EVALUATION FOR FAST G C.......................................................................................................................... 64
3.1 Introduction —...................................................................................................—643.2 Preliminary Column Selection, Practical Considerations and Constrains 64
3.2.1 Column Diameter.............................................................................................. 643.2.2 The Extra-column Effect...................................................................................65
v
Reproduced with permission of the copyright owner. Further reproduction prohibited without permission.

3.2.3 Column Length..................................................................................................653.2.4 Film Thickness..................................................................................................663.2.5 The Multicapillary Column...............................................................................67
3.3 Experimental.................................... .......------ ...................._........__........___673.4 Results and Discussion.........................................._...... ............................... 69
3.4.1 Column Efficiency and Extra-column Effects.................................................. 693.4.2 Column Length..................................................................................................723.4.3 Film Thickness..................................................................................................753.4.4 The Multicapillaiy Column...............................................................................79
3.5 Conclusions ........................ ........................................__ .....____________833.6 References for Chapter 3...............__ ............— ............................................ 84
CHAPTER 4RESISTIVE AT-COLUMN HEATING FOR FAST TEMPERATURE PROGRAMMING IN GAS CHROMATOGRAPHY...................................................85
4.1 Introduction...........................................................................................................854.2 Experimental...........................................................................................................88
4.2.1 Column Assembly............................................................................................. 884.2.2 Electronic Control.............................................................................................904.2.3 Experimental Set-up.......................................................................................... 934.2.4 Evaluation of Scope, Accuracy and Precision o f the Temperature Control.. 1004.2.5 Chromatographic Performance - Preliminary Evaluation...............................1014.2.6 Comparison of the At-column Heater Performance with a Standard GC
Oven..................................................................................................................1024.2.7 Effect of the Sensor Wire Material.................................................................. 1034.2.8 Evaluation of Temperature Non-uniformities Along and Across the
Column............... ........................................................................................... 1034.2.9 Evaluation of the Effect of an External Sheath Gas Flow along the Column. 1034.2.10 Influence of the Thermal Insulation on the Performance of the At-column
Heater............................................................................................................ 1044.2.11 Influence of the Fused Silica Wall Thickness on the At-column Heater
Performance.................................................................................................. 1044.2.12 Temperature Transference into the Stationary Phase....................................105
4.3 Results and Discussion ...................................................................................1064.3.1 Evaluation of Scope, Accuracy and Precision o f the Temperature Control... 1064.3.2 Chromatographic Performance — Preliminary Evaluation............................. 1134.3.3 Comparative Evaluation.................................................................................. 1294.3.4 Accuracy of the Temperature Control.............................................................1354.3.5 Causes of Efficiency Erosion........................................................................... 1404.3.6 Effect of Sheath Gas Flow............................................................................... 1514.3.7 Effect of the Column Insulation on Chromatographic Performance and Power
Requirements.................................................................................................. 1544.3.8 Column Arrangement, Chromatographic Efficiency and Power Management -
Practical Considerations.................................................................................1594.3.9 Influence of the Column Wall Thickness on the At-column Heater
Performance.................................................................................................... 161vi
Reproduced with permission of the copyright owner. Further reproduction prohibited without permission.
4.3.10 Heat Transfer into the Column’s Stationary Phase...................................... 1654.4 Conclusions.....................................— __......................__................................ 1714.5 References for Chapter 4..— ........— .— .........—..... ______ ....._... 174
CHAPTER 5A PRESSURE DRIVEN INJECTOR FOR VOLATILE AND SEMI-VOLATILE SAMPLES IN FAST PORTABLE GC____________________________________ 177
5.1 Introduction.........................................................................................................1775.2 Experimental..........................................-------------------- ..............................—. 182
5.2.1 Description of the Injector................................................................................1825.2.2 Operation of the Injector...................................................................................1855.2.3 Materials and Methods.....................................................................................188
5.3 Results and Discussion... ....---------—.....---------........................................ .1885.3.1 General Overview.............................................................................................1885.3.2 Volatility Range................................. 1935.3.3 Effect of the Trap Preheating Time..................................................................1975.3.4 Injection Time and Injection Band...................................................................1995.3.5 Injection Time and Sensitivity......................................................................... 2035.3.6 Quantitative Analysis...................................................................................... 206
5.4 Conclusions and Future W ork............................................................................ 2105.5 References for Chapter 5 ........................... —......................................211
CHAPTER 6ELECTRONIC PRESSURE CONTROL IN FAST PORTABLE GAS CHROMATOGRAPHY................................................................................................ 213
6.1 Introduction.......................................................................................................... 2136.2 Pressure Programming- Theoretical Aspects.................................................... 2166.3 Experimental......................................................................................................... 2206.4 Results and Discussion......................................................................................... 223
6.4.1 Selection of the Micro valve............................................................................. 2236.4.2 Pressure Control Performance......................................................................... 2256.4.3 Pressure-Programmed GC............................................................................... 2296.4.4 Pressure Programming for Optimization of the Injection................................235
6.5 Conclusions ........................................................................................ 2406.6 References for Chapter 6 ....................................................................................241
CHAPTER7SUMMARY......................................................................................................................243
APPENDIXCALCULATION OF BINARY DIFFUSION COEFFICIENTS IN THE GAS PHASE..............................................................................................................................247
VITA.................................................................................................................................248
vii
with permission of the copyright owner. Further reproduction prohibited without permission.
LIST OF TABLES
Table 2.1 Viscosities of carrier gases and their dependence on temperature............. 22
Table 2.2 Diffusion coefficients for heptane and octane in different carrier gases at30°C (2.35)................................................................................................. 37
Table 3.1 Effect o f column length on efficiency and resolution in the presence ofsignificant extra-column contributions....................................................... 73
Table 3.2 Effect of film thickness on efficiency and resolution................................ 76
Table 4.1 Temperature control precision and accuracy........................................... I l l
Table 4.2 Retention times, peak widths, and separation numbers at three differenttemperature programming ramps.............................................................. 121
Table 4.3 Retention time reproducibility of the collinear at-column heater 123
Table 5.1 Retention time reproducibility obtained with the prototype portable GC. 194
Table 5.2 Peak area reproducibility obtained with the prototype portable G C 207
Table 6.1 Effect of pressure and temperature programming on the retention time, peak width, resolution and reproducibility of volatile compounds.................. 232
Table 6.2 Effect of injection with low column inlet pressure followed by a fast pressure ramp upon retention times, retention time reproducibility and resolution .239
viii
Reproduced with permission of the copyright owner Further reproduction prohibited without permission
Figure 2.1
Figure 2.2
Figure 2.3
Figure 2.4
Figure 3.1
Figure 3.2
Figure 3.3
Figure 3.4
Figure 3.5
Figure 3.6
Figure 3.7
Figure 4.1
Figure 4.2a
LIST OF FIGURES
Parameters of a Gaussian p eak ......................................................................26
Computer generated plot o f H versus average carrier gas velocity according to the Golav-Giddings equation................................................................. 39
Computer generated plot o f the contribution of extra-column effects to the apparent column efficiency 42
Effect of carrier gas (top) and internal diameter (bottom) on column efficiency....................................................................................................... 46
Experimental and theoretical van Deemter plots obtained with a O.I-mm x 1-m. 0.4-um film colum n........................................................................ 72
Experimental and theoretical van Deemter plots for columns o f different length............................................................................................................ 74
Experimental and theoretical van Deemter plots for columns o f different film thickness................................................................................................. 77
Relative increases in retention times and Trennzahl obtained for a 0.4 am film column, as compared to a 0.1 am film column, under temperature programmed conditions................................................................................ 78
Theoretical and experimental van Deemter plots o f the muiticapillarv column.......................................................................................................... 80
Chromatograms of the column performance testmix obtained with a single fast GC column (top), and the multicapillary column (bottom)............. 81
Chromatograms of nerve gas agent simulants obtained with a single fast GC column (top), and the multicapillary column (bottom)..................... 82
Schematic diagrams of the coaxial (a) and collinear (b) at-column heating assemblies.................................................................................................... 89
Block diagram of the original column temperature control u n it 91
: \
Reproduced with permission of the copyright owner. Further reproduction prohibited without permission.
Figure 4.2b Block diagram of the revised (software controlled) temperature controlunit.......................................................................................................... 91
Figure 4.3 Schematic diagram of the experimental set-up type A (miniaturizedGC).......................................................................................................... 95
Figure 4.4 Schematic diagram of the experimental set-up type B. The HP 5890 oven and the at-column heater were heated simultaneously at the same temperature program to assure thermal homogeneity along the column... 97
Figure 4.5 Schematic diagram of the experimental set-up type C. The HP 5890 oven and the at-column heater were heated simultaneously at the same temperature program for thermal homogeneity along the column 98
Figure 4.6 Schematic diagram of the experimental set-up type D. The HP 5890 oven heater was turned off during a run and the column heated with the at-column heater only............................................................................. 99
Figure 4.7 Comparison of the temperature versus time profiles obtained with the new collinear at-column heater and the HP 5890 oven for a linear temperature program of l°C/s.................................................................................... 107
Figure 4.8 Sensor wire resistance vs. time profiles obtained for different temperature programming rates with the collinear at-column heater..................... 108
Figure 4.9 Effect of the fiberglass sleeve around the heater wire on the temperature control: a) oscillations around the set-points caused by the temperature transport delay b) the use of a temperature control algorithm instead o f the hardware based compensation network allowed the compensation of the temperature transport delay c) theoretical temperature time profile .... 110
Figure 4.10 Electronic control accuracy and precision for a nominal temperatureprogramming rate of lC/s. a) Accuracy of the instantaneous temperatureb) accuracy of the slope c) standard deviation from 3 consecutiveruns......................................................................................................... 112
Figure 4.11 Fast GC chromatograms of n-C8 to n-C20 obtained with the collinear at-column heater assembly, at different temperature programming rates........................................................................................................ 114
x
Reproduced with permission of the copyright owner. Further reproduction prohibited without permission.
Figure 4.12 Fast GC chromatogram of Louisiana Light Crude Oil, obtained with thecollinear at-column heater.................................................................... 115
Figure 4.13 Fast GC-FID chromatogram of chemical warfare agent simulants (di-alky 1- methyl-phosphonates, 3 ppm each in /-PrOH), obtained with the collinear at-column heater.................................................................................. 116
Figure 4.14 Fast GC-FID chromatogram of a standard polycyclic aromatic hydrocarbon mixture, obtained with the collinear at-column heater........................ 117
Figure 4.15 Fast GC-FID chromatogram of a standard base/neutrals mixture, obtained with the collinear at-column heater..................................................... 118
Figure 4.16 Typical peak shape obtained with the collinear at-column heater 120
Figure 4.17 Comparison of the reconstructed total ion chromatograms of a gas oil sample (unknown source), obtained with the standard high resolution GC-MS method (top), and fast GC-MS using the collinear at-column heater (bottom)..................................................................................... 126
Figure 4.18 Comparison of corresponding regions in the m/z 184 ion chromatograms (dibenzothiophene family) of a gas oil sample, obtained with the standard high resolution GC-MS method (top), and fast GC-MS using the collinear at-column heater (bottom)................................................................... 127
Figure 4.19 Comparison of corresponding regions in the m/z 184 ion chromatograms (dibenzothiophene family) from two different gas oil samples. Both ion chromatograms were obtained with fast GC-MS using the collinear at-column heater................................................................................... 128
Figure 4.20 Comparison of retention times and peak widths obtained with the HP 5890 oven and the collinear at-column heater, using a type B set-up 131
Figure 4.21 Comparison of retention times and peak widths obtained with the HP 5890 and the collinear at-column heater, using a type C set-up................. 134
Figure 4.22 Resistance vs. temperature relationship of the Nickel Alloy 120™ sensor wire (top); and error introduced when the relationship was assumed linear (bottom).................................................................................................. 136
xi
Reproduced with permission of the copyright owner. Further reproduction prohibited without permission.

Figure 4.23 Comparison of retention times and peak widths obtained with the collinear at-column heater when the sensor wire material was Nickel Alloy 120™ (using a linear control function), and when the sensor material was platinum................................................................................................. 138
Figure 4.24 Comparison of the peak widths obtained from the coaxial at-column heater.the collinear at-column heater, and the HP 5890 oven.......................... 148
Figure 4.2S Addition of an external flow o f sheath gas along the directly heatedcolumn: effect on the retention times (a) and the peak widths (b)........ 1S2
Figure 4.26 Relationship between the power requirements, the type of insulation, and the temperature programming rate of the collinear at-column heater assembly................................................................................................ 155
Figure 4.27 Effect of the external insulation upon the retention times and peak widths eluted from the collinear at-column heating assembly.......................... 158
Figure 4.28 Effect of the column wall thickness upon the retention times of compounds eluted from the collinear at-column heated assembly........................... 163
Figure 4.29 Difference between the inner and the outer temperature of a fused silicatubing for various temperature programming rates............................... 167
Figure 4.30 Maximum difference between inner and outer fused silica tubingtemperature vs. temperature programming rate...................................... 168
Figure 5.1 Schematic diagram of the pressure driven injector............................... 183
Figure 5.2 Schematic diagram of the carrier gas flow paths during the different time events that comprise an injection......................................................... 186
Figure 5.3 Typical chromatogram of a gaseous sample obtained with the prototypeportable G C .......................................................................................... 190
Figure 5.4 Typical chromatogram of a wide boiling point range liquid sampleobtained with the prototype portable G C ............................................ 191
Figure 5.5 Typical chromatogram of a headspace sample (BTX in water) 192
xii
Reproduced with permission of the copyright owner. Further reproduction prohibited without permission.
Figure 5.6 Typical chromatogram of a PAH liquid sample obtained with the prototype portable G C ......................................................................................... 195
Figure 5.7 Peak area versus trap preheating time for various compounds in gaseous(top) and liquid (bottom) samples......................................................... 198
Figure 5.8 Van Deemter plots obtained with the new injector (prototype GC).... 201
Figure 5.9 Effect o f the injection time on the sensitivity and peak shape of thechromatograms obtained with the prototype GC: a) 50 ms b) 1 s, c) 5 s.204
Figure 5.10 Peak area versus concentration for various compounds in gaseoussamples.................................................................................................. 208
Figure 6.1 Computer generated plots of average linear carrier gas velocity versus column head pressure (assuming atmospheric pressure at the column outlet) for various columns and carrier gases....................................... 219
Figure 6.2 Schematic diagram of the pressure driven injector.............................. 221
Figure 6.3 Pressure vs. time profiles, measured at the pressure transducer output, for different pressure ramps: 0.4 psi/s (a), 0.8 psi/s (b), 1 psi/s ( c), 1.2 psi/s (d), 1.6 psi/s (e), and 2 psi/s (f)............................................................. 227
Figure 6.4 Comparison of the expected and the measured pressure-time profile for a 0.8 psi/s inlet pressure ramp.................................................................. 227
Figure 6.5 Difference between the expected pressure and the measured pressure(average of 4 runs), for a 0.8 psi/s pressure ramp............................... 228
Figure 6.6 Standard deviation vs. expected gauge pressure for a 0.8 psi/s ramp(4 runs)................................................................................................. 228
Figure 6.7 Chromatograms of n-paraffins C4 to C9 in air obtained at 40°C and 8 psi constant pressure (a), 40°C and a linear pressure ramp of 1.2 psi/s, starting at 8 psi (b), constant pressure and a linear temperature ramp of 5°C/s, starting at 40°C ( c), and a linear pressure ramp of 1.2 psi/s with a simultaneous temperature ramp of 5°C/s (d )..................................... 230
Figure 6.8 Comparison of isobaric chromatograms and pressure programmedchromatograms of semi-volatile compounds...................................... 233
X lll
Reproduced with permission of the copyright owner. Further reproduction prohibited without permission.
Figure 6.9 Effect of linear pressure and temperature programming upon the separation of semi-volatile organic compounds..................................................... 234
Figure 6.10 Effect of the column inlet pressure upon the amount of sample injectedinto the column..................................................................................... 237
xiv
Reproduced with permission of the copyright owner. Further reproduction prohibited without permission.
ABSTRACT
Currently commercially available portable gas chromatographs are suitable only
for the analysis of volatile organic compounds, and do not include temperature
programming capability. This dissertation presents the development o f a novel direct
at-column heater design and a pressure driven injection system that is compatible with
semi-volatile analytes.
The collinear and coaxial at-column heater designs incorporate heater and
temperature sensing elements placed along the column. Resistive heating controls the
column temperature via a feedback circuit and a software selected program. Linear
temperature programming ramps up to 14°C/s were obtained, with a total power
consumption of less than 100 Watt. The accuracy and precision of the temperature
control were satisfactory. Relative standard deviations of the retention times were less
than 0.3% for temperature ramps from 0.5°C/s to lO°C/s. Peak shapes were symmetric,
indicating good linearity. Comparison with a conventional oven showed that peaks
eluted from the directly heated column with slightly longer retention times (<10%), and
an up to 50% increase in peak width. Long range and short range temperature gradients
along the column were identified as possible causes for the observed efficiency losses.
The injection system designed in this work is based on the deviation of flows via
solenoid valves that are located far away from the actual injector. An in-line
pre-concentration trap serves for analyte enrichment and reduction of the detection limit.
The injector permits the modulation of the injection band width. The fastest injection
band achieved was 30 ms. It significantly reduced the influence of extra-column effects
on column efficiency observed with the split injector. Long injection bands (30-60
xv
Reproduced with permission of the copyright owner. Further reproduction prohibited without permission.
seconds) permitted the integration of compounds at the head of the column, prior to the
column temperature program, reducing detection limits for those compounds. Retention
time reproducibility was not affected by the pressure driven injector. However,
quantitative reproducibility was less than 20%. This aspect of the injector needs further
study and improvement. The injector and column assembly developed in this work,
together with a small FID, permitted the construction o f a prototype portable gas
chromatograph suitable for the fast analysis of volatile and semi-volatile organic
compounds.
Reproduced with permission of the copyright owner. Further reproduction prohibited without permission.
CHAPTER 1
INTRODUCTION
1.1 On-site Chemical Analysis
The development of analytical techniques and instrumentation has lead to
impressive analytical capabilities. Most o f the time, instrumentation required to perform
such determinations is quite sophisticated, large in size, demanding in power and
environmental stability, costly, and designed for use by skillful operators. Most
analytical instruments are stationary in a laboratory, and the sample, taken at its source,
is transported to the instrument for analysis. The interested party has to wait for the
laboratory to generate and report the results. This process works well in many situations,
but has serious shortcomings in other instances. For example, the simple procedures of
taking a sample, storing it in a container, and transporting it to the laboratory, is a source
of error since the sampling procedure may discriminate between analytes or the sample
degrades over time. Containers may compromise sample integrity by differential
adsorption, decomposition, evaporation, permeation, etc. (1.1). The analytical result is
often the piece of information needed for the subsequent actions in a process. Frequently,
the delay time in obtaining this information can lead to substantial losses or wrong
operational decisions. For example, in a chemical plant, operating parameters are
adjusted according to the composition o f the different process streams. Delayed
information about this composition brings about delayed adjustments to the process.
Process failure, like the poisoning of a catalyst, or production out of specifications can be
avoided by timely detection of contaminants in the feed. Similarly, in environmental
monitoring, prompt detection of a pollutant leads to rapid and appropriate removal,
1
Reproduced with permission of the copyright owner. Further reproduction prohibited without permission.
avoiding health or environmental hazards. Rapid detection of compounds like chemical
warfare agents or explosives can be life saving. Arson investigations during a fire (1.2),
immediate forensic analyses at a crime scene, breath and blood gas analysis for medical
diagnosis (1.3), and analysis of the gaseous environment in space missions, are other
examples in which fast on-site analysis would represent definite advantages.
The obvious advantages of fast sample analysis at their source resulted in the
development of dedicated branches of analytical chemistry, namely process or on-line
analytical chemistry, andfieldable or on-site analytical chemistry. As the name indicates,
the former group comprises the instruments installed in the chemical plants themselves,
used mainly for process control. The second group includes all the instruments used for
chemical analysis at the source of the sample, and not intended for process control. There
are instances where the two groups overlap, as in the case of environmental monitoring
in a chemical plant, or the monitoring of a superfund remediation process.
Process and fieldable analytical techniques have some distinctive differences, but
share some important features. In both cases, analysis speed, automation, reliability,
simplicity, ruggedness and cost are important features. Fieldable instrumentation has the
additional requirements of small size, weight and power consumption. Hazardous
environment in a chemical plant imposes stringent engineering requirements regarding
safety to on-line analyzers.
A wide variety of analytical instruments have been adapted for process as well as
field work. These include spectroscopic, electrochemical, chromatographic, bioanalytical
and gravimetric methods. Most of the optical spectroscopy and chemical sensor based
methods have the advantage of delivering truly continuous measurements. However, they
Reproduced with permission of the copyright owner. Further reproduction prohibited without permission.
are capable of determining only specific target analytes, and are therefore not suitable for
the direct qualitative and quantitative analysis of complex mixtures, or unknown
samples. Since they rely on specific spectroscopic and/ or chemical characteristics of the
analyte, they suffer from interferences o f compounds with similar response. Multivariate
analysis and neural networks may have use extracting information from complex
unresolved sensor or spectroscopic responses. However, these techniques only deliver
reliable results when the sample resembles the calibration or training samples (1.4).
Chromatographic methods, although not truly continuous, have the advantage of
flexibility by allowing qualitative and quantitative analyses of complex and/or unknown
mixtures. Since the column separates the analytes prior to their detection, potential
interferences are greatly reduced. High speed chromatography has very short cycle times,
possibly approaching those of so called continuous methods. When coupled with
selective detectors, chromatographic methods combine the advantage o f flexibility with
selectivity.
1.2 On-site Gas Chromatography.
Gas chromatography (GC) is the chromatographic technique most commonly
adapted to process and field analysis. Indeed, gas chromatographs are among the most
widely used process analytical instruments. However, they are big, bulky, and expensive
instruments located in shelters within the plant, and must be attached to complex
sampling systems that deliver the sample streams from the plant to the instrument. They
rely on conventional chromatographic techniques like packed columns, or, in the best
circumstances, long, wide bore capillary columns. Consequently, analysis times are
relatively long (several tens of minutes), limiting either the frequency o f analysis of one
Reproduced with permission of the copyright owner. Further reproduction prohibited without permission.
4
stream or the number of streams one instrument can analyze. Annino developed a field
mountable GC system for volatile organic compound analysis designed to be attached
very close to the sampling point, and update analysis data to the control system in
seconds rather than minutes (1.5).
In the area of field gas chromatography, two different approaches are commonly
used. The first type corresponds to conventional laboratory instruments set up for
analysis at the sample site. This may either be inside a mobile laboratory, or in a
specially designed shelter. Often the laboratory instruments are set up for automated
analysis. The analytical capabilities of such mobile laboratories are similar to the
capabilities o f a conventional laboratory. However, the installation of laboratory
instruments in a specially designed vehicle or a shelter is expensive, and rather complex.
Such “field laboratories” can be justified only for extensive and long term projects (1.6).
The other family of fieldable gas chromatographs comprises instruments that are
specially designed for portability. They are ideally small, lightweight, and low power
demanding systems. These systems are easily transported to the field, and from one
sampling site to another. Their cost is only a fraction of the cost of a mobile laboratory.
However, currently available portable gas chromatographs also have limited analytical
capabilities (1.7). The extension of the current analytical scope of portable gas
chromatographs through new developments in some of their subsystems was the
objective of the present dissertation work.
1.3 Portable Gas Chromatography - Current Sate of the Art
The first truly portable gas chromatograph appeared on the market in the early
eighties (1.8). It used a short, non-heated packed column, and a flame ionization
Reproduced with permission of the copyright owner. Further reproduction prohibited without permission.
detector. This system was operated isothermally at ambient temperatures, and
consequently, suitable only for volatile organic compounds (VOCs). It provided modest
resolution and peak capacity, with analysis times in the order o f 10 minutes.
Photovac offers a portable capillary gas chromatograph with automated injection,
and a photoionization (PID) detector (1.9). The wide bore column (0.S3 mm i.d.) is
housed in an isothermal oven with a maximum operating temperature of 40°C. This
column provides enhanced resolution compared to the packed columns, without reaching
the performance commonly observed in laboratory instruments. The high sample
capacity and low flow restriction of the wide bore column reduce the detection limit and
analysis time (around 5 minutes analysis time). Low temperature isothermal operation
still limits its use to VOCs, and compromises the peak capacity. The incorporation of the
PQ) adds selectivity to the system, a useful feature if the target analytes respond to this
detector. It has the additional advantage of not requiring external fuel gases, avoiding the
hazardous transportation o f hydrogen cylinders associated with a flame detector.
Some commercial portable GCs have heated injectors and detectors, and
conventional temperature programmable convection ovens (1.10-1.12). These systems
are suitable for the analysis of semi-volatile compounds; however, they are rather bulky,
and require external power supply for this operation mode. Generally, they are equipped
with wide bore capillary columns, and offer a selection of conventional GC detectors.
Analysis times are in the order of minutes, and cycle times rather long when temperature
programming is used due to the additional cool-down time.
The systems described so far rely on conventional GC technology, and represent
“scaled-down” — in size as well as scope - laboratory instruments. A unique column
Reproduced with permission of the copyright owner. Further reproduction prohibited without permission.
6
technology offered by MSA Instruments in their EKHO Gas Chromatograph reduces the
analysis time to a few tens of seconds (1.13). This column is composed of hundreds of
short narrow bore parallel columns fused together. The high efficiency of each individual
column derived from its small internal diameter (40pm) permits the fast analysis times.
At the same time, the multiplicity o f the composed columns increases dramatically the
sample capacity and, consequently, reduces the detection limit (0.001 ppb, according to
the manufacturer). This system includes conventional injection and detection devices
(electron capture detector, ECD), both of which conceivably introduce peak broadening
to the system, and consequently reduce the theoretical efficiency o f the multicapillary
column. The isothermal column operation (40°C) limits the EKHO to the analysis of
volatiles. The ECD, although very sensitive for halogenated compounds, limits the
system to the analysis o f these types of compounds. Additionally, it imposes the use of
argon, and requires frequent calibration of each individual analyte.
Terry et al. designed in 1975 a truly revolutionary miniaturized GC, which was
entirely fabricated by silicon micromachining techniques (1.14, 1.15). The injector and
column were etched into a single 5cm diameter wafer. An also micromachined
micro-thermal conductivity detector QiTCD) was fabricated on a separate wafer, and
attached to the wafer containing the column and injector. Unfortunately, this system did
not provide the efficiency expected from the narrow bore column and the minimized
dead volumes. Since the column was an isotropically etched channel covered with a
Pyrex glass cover plate, it was not cylindrical. This caused difficulties in obtaining a
homogeneous stationary phase coating, resulting in poor column efficiency. More
recently, Reston and Kolesar reported the fabrication of a similar “GC-chip” (1.16,1.17).
Reproduced with permission of the copyright owner. Further reproduction prohibited without permission.

7
They etched the column channel in both, base and cover plate, and coated the channels
with solid microparticle stationary phase prior to the anodic bonding of the two plates.
However, the chromatograms reported do not show the expected short analysis times and
narrow peak widths.
To date, the complete “Microchip Gas Chromatograph” has not developed into a
commercial product. However, it constitutes die basis o f the M200 gas chromatograph
(Microsensor Technology, Fremont, CA), the smallest GC now commercially available
(1.18-1.20). This instrument includes a solid state injection chip, and a pTCD similar to
the ones developed by Terry et al. at Stanford University. The injector adds extremely
small dead volumes to the system and permits fast injections o f very small sample plugs
necessary for fast gas chromatography (1.21). Analysis times are in the order of seconds;
however, the injection o f small sample plugs compromises the sensitivity o f the system.
Each instrument is configured with two independent microGCs, each one containing a
column with a different stationary phase. This feature permits two dimensional
chromatography, adding selectivity to the system.
The main limitations o f this GC are its low sensitivity, isothermal operation
mode and the temperature limit of the micromachined components, restricting its use to
relatively concentrated volatile organic compounds with retention indices below 1200.
1.4 Objective
The preceding review reveals the limitations of currently available fast portable
GCs for the analysis of broad boiling point range samples that include semi-volatile
compounds up to or beyond retention indices o f2000. Typical examples of such samples
are poly aromatic hydrocarbons, and chemical warfare agents.
Reproduced with permission of the copyright owner. Further reproduction prohibited without permission.
s
The present dissertation work is part o f a larger effort aimed to develop a portable
gas chromatographic system capable o f analyzing broad boiling point range samples at
low concentration. This dissertation work includes novel developments in the injection
device, and particularly, in the column heating technology.
1.S References for Chapter I
1.1 “Compendium of Methods for the Determination of Toxic Organic Compounds in Ambient Air”, EPA-600/4-84-041, U.S. Environmental Protection Agency, Environmental Monitoring Systems Laboratory; Research Triangle Park, NC, 1984.
1.2 Bertsch, W. Anal. Chem. 1996,68, 541A-545A.
1.3 Grote, C.; Pawliszyn, J. Anal. Chem. 1997,69, 587-596.
1.4 Carey, W. P.; Kowalski, B. Anal. Chem. 1988, 60,541-544.
1.5 Annino, R. J. Chromatogr. A, 1994, 678, 279-288.
1.6 Mainga, A. Ph. D. Thesis, Louisiana State University, Baton Rouge, LA, 1992
1.7 Overton, E. B.; Camey, K. R. Trends Anal. Chem. 1994,13, 252-257.
1.8 a) Century OVA 128 Portable Organic Vapor Analyzer, specifications PSS 6-12Z1 F, The Foxboro Company, P. O. Box 500, 500 N. Bedford Street, East Bridegewater, MA 02333,1985 b) Century Organic Vapor Analyzer for Soil Gas Monitoring, laboratory application data LAD 001-027, The Foxboro Company 1989.
1.9 a) Snapshot™ Hand-Held Toxic Vapor Analyzer specifications, Photovac International, Inc. 25-B Jeffin Blvrd, West, Deer Park, NY 11729,1993 b) 10S Plus Portable GC specifications, Photovac International, Inc. 199?.
1.10 Models Scentoscreen™ and Scentograph “Plus IT™ portable gas chromatographs specifications, Sentex Systems, Inc., 553 Broad Av., Ridgefield, NJ 07657.
1.11 Chromato Sud Gas Analysers product specifications, Chromato-Sud, 19 rue Nauville, 33000 Bordeaux, France.
1.12 Model 8610 Gas Chromatograph product specifications, SRI Instruments, 6700-B Paradise Rd., Las Vegas, NV 89119,1990.
1.13 EKHO Gas Chromatograph product specifications, MSA instruments, P. O. Box 427, Pittsburgh, PA 15230,1993.
Reproduced with permission of the copyright owner. Further reproduction prohibited without permission.
9
1.14 Terry, S. C.; Jerman, J. H.; Angell, J. B. IEEE Tram. Electron. Devices, 1979, ED- 26 (12), 1880-1886.
1.15 Manz, A.;. Harrison, D. J.; Verpoorte, E.; Widmer, H. M. in Advances in Chromatography, vol. 33, Brown, P. R.; Grushka, E., Eds., Marcel Dekker, New York, 1993, pp. 1-66.
1.16 Reston, R. R.; Kolesar Jr., E. S. J. Microelectromech. Syst. 1994,3, 134-146.
1.17 Kolesar Jr., E. S.; Reston, R. R. J. Microelectromech. Syst. 1994,3 ,147-152.
1.18 P200 and M200 Micro Gas Analyzer product specifications, MTT, 41762 Christy Street, Fremont, CA.
1.19 Lee, G.; Ray, C.; Siemers, R ; Moore, R. Am. Lab. Feb. 1989,110-119.
1.20 Bruns, M. W. Erdol Kohle Erdgas Petrochem. 1994,47, 80-84.
1.21 Annino, R. High Resol. Chromatogr. 1996,19,285-290.
Reproduced with permission of the copyright owner. Further reproduction prohibited without permission.
CHAPTER 2
FAST GAS CHROMATOGRAPHY THEORETICAL BACKGROUND
2.1 Gas Chromatography
Chromatography, and particularly gas chromatography is today one of the most
widely used analytical techniques. According to the HJPAC, chromatography is defined
as (2.1)
‘.. .a method used primarily for the separation of the components o f a sample, in which those components are distributed between two phases, one o f which is stationary while the other moves. The stationary phase may be a solid, or a liquid supported on a solid, or a gel. The stationary phase may be packed in a column, spread as a layer, or distributed as a film, etc.; in these definitions ‘chromatographic bed’ is used as a general term to denote any o f the different forms in which the stationary phase may be used. The mobile phase may be gaseous or liquid.’
Rephrasing this definition, chromatography is any separation method based on
the dynamic distribution o f the analytes between two phases. The characteristics of the
mobile phase serve as basis for the primary classification of the principal chromato
graphic methods (gas chromatography, liquid chromatography and supercritical fluid
chromatography). Further subdivisions are based on the physical arrangement of the
stationary phase (e.g., column chromatography, planar chromatography, open tubular
chromatography), the driving force for the movement o f the mobile phase (e.g., electro
chromatography, high pressure chromatography), the characteristics of the stationary
phase (e.g., gel-permeation chromatography, micellar chromatography), the combin&ion
of mobile and stationary phase (e.g., gas-solid chromatography, gas-liquid
chromatography), the type of interaction between the analytes and the stationary phase
(e.g., adsorption chromatography, partition chromatography, ion pair chromatography),
10
Reproduced with permission of the copyright owner. Further reproduction prohibited without permission.
11
the quality of the separation (e.g., high resolution chromatography, high performance
chromatography), among others. Often several of the above mentioned factors are
combined to name specific chromatographic methods. Micellar electrokinetic capillary
chromatography and high resolution capillary gas chromatography, are typical examples.
Gas chromatography (GC) is any chromatographic method in which the mobile
phase is a gas, forced to flow through a column by a pressure drop between the head and
the end of the column. The stationary phase is either a solid (gas-solid chromatography,
GSC), or a liquid supported on a solid (gas-liquid chromatography, GLC), arranged
inside the column. In GSC, the separation mechanism is based on adsorption-desorption;
in GLC, the separation mechanism is based on partition between the stationary and the
mobile phase. When the stationary phase (solid particles for GSC, or solid particles
coated with a liquid for GLC) fills the cross section of the column as a particulate bed,
the column is said to be a “packed column.” When the stationary phase covers only the
column wall, the column is called an “open tubular” column. In case o f a GSC open
tubular column, the stationary phase is a thin layer of microparticles covering the inner
wall of the column; these columns are denominated ‘porous layer open tubular columns’
(PLOT). For an open tubular GLC column, the stationary phase is directly supported on
the column wall, and sometimes chemically bound to the column wall. These columns
are known as “wall coated open tubular columns” (WCOT). In general, open tubular
columns are of capillary dimensions (i.d. < 0.53 mm); while packed columns might
range from Vi” tubes to a few micron capillaries (“micropacked” capillary columns).
Most commonly used capillary columns have internal diameters (i.d.) ranging from 0.2
to 0.32 mm. Columns with larger internal diameters (typically 0.53 mm) are known as
Reproduced with permission of the copyright owner. Further reproduction prohibited without permission.
12
wide bore (Megabore™) columns. Columns with i.d.s < 0.2 mm are known as narrow
bore columns.
The analysis time is a further characteristic for the classification o f gas
chromatography. Conventional GC renders analysis times in tens o f minutes. Fast gas
chromatography typically has analysis times in the order o f few minutes, and ultra-fast
GC has analysis times of a few seconds. The boundaries o f this classification are rather
vague because analysis times are a function o f the volatility range and the complexity of
the sample.
2.2 Historical Development
The development o f chromatography started almost a century ago. However, the
decades of the 1950’s to 1970’s can be considered the golden era o f gas chromatography.
It was during those years that the technique underwent an exponential development, not
matched by any other technique in analytical chemistry. Although gas chromatography is
considered a mature technique, used routinely in almost every laboratory, many of its
pioneers are still alive, and active in the field. The following paragraphs summarize the
milestones in chromatographic history, and their significance (2.2).
The Russian botanist Mikhail Tswett (2.3-2.4) is generally acknowledged as the
father o f chromatography. In 1903 he developed a technique for the separation o f plant
pigments by passing their solution through open columns packed with solid adsorbents.
He observed the separation o f the components into colored zones or bands along the
column. This led Tswett to name his method ‘chromatography’ that means ‘color
writing’ in Greek. The particular type o f chromatography developed by Tswett was
column liquid-solid chromatography.
Reproduced with permission of the copyright owner. Further reproduction prohibited without permission.
13
After Tswett’s publication, the method remained dormant for 25 years, until in
1931 Kuhn, Winterstein and Lederer (2.5) rediscovered the technique for the separation
of plant carotenes. Three years later, Zechmeister (2.6) published a book that contained a
detailed account o f the principles and applications of liquid-solid elution
chromatography. The technique rapidly became an important tool for preparative
separations in the fields o f organic and biochemistry.
In the 1940’s and 1950’s the development o f diverse chromatographic methods
exploded. Tiselius and Claesson developed the techniques o f displacement liquid-solid
chromatography (2.7), and frontal analysis (2.8). Several authors (2.7-2.12) worked, with
limited success, on displacement and frontal analysis applied to mixtures in the gas
phase. Cremer and her research group (2.13-2.14) pioneered the analysis o f gas mixtures
by gas-solid chromatography using the elution technique. This group also has the credit
of first using GC for the determination o f physico-chemical properties o f gases.
The use o f partition in a liquid stationary phase rather than adsorption on a solid
phase, with a liquid mobile phase, was first described in 1941 by Martin and Synge
(2.15). They developed a theoretical model o f the technique based on the concept of
theoretical plates derived from distillation. Martin and Synge received the 1952 Nobel
Prize in Chemistry for their invention o f partition chromatography.
In their original publication, Martin and Synge had clearly proposed the idea of
using a gas instead o f a liquid as the mobile phase in partition chromatography (2.15).
However, it was not until 1950, when Martin himself, together with James demonstrated
the practical feasibility o f gas-liquid partition chromatography (2.16). In their paper they
also included the theory of gas-liquid chromatography. This theory was based on the
Reproduced with permission of the copyright owner. Further reproduction prohibited without permission.
14
original work o f liquid-liquid partition chromatography, modified to include the
compressibility o f the mobile phase. Further work by Ray (2.17), demonstrated that GLC
was applicable to a wide range of organic and inorganic compounds.
During the 1950s, GC’s began to appear as commercial instruments. Jaroslav
Janak (2.18) filed the first world patent on a gas chromatograph in 1952, in the former
Republic o f Czechoslovakia. This system used COz as carrier gas and columns packed
with solid adsorbents. It was not until 1957 that the first commercial GC became
available - the Model 154 by Perkin-Elmer (2.1). By the end o f the 50’s, gas
chromatography was recognized as a powerful analytical technique, available already in
many laboratories.
During the same period, van Deemter, Zuiderweg and Klinkenberg developed the
rate theory and their well-known equation that describes the relationship between
column efficiency and various column parameters (2.19). In 1957, Golay introduced the
use of wall coated capillary columns (2.20), and developed the theory associated with
these columns (2.21). The simultaneous introduction of highly sensitive ionization
detectors (2.22-2.25) permitted the extraordinary development o f capillary gas
chromatography. The first capillary columns were made from metal tubes, and presented
the typical peak tailing o f polar compounds from poorly deactivated columns. Desty and
his colleagues at British Petroleum pioneered the use o f less active glass capillary
columns (2.26). Glass open tubular capillary columns delivered impressive resolution
power; however, they did not become popular for routine analysis due to their inherent
fragility. The development of inert, flexible fused silica capillary columns by Dandeneau
Reproduced with permission of the copyright owner. Further reproduction prohibited without permission.
15
and coworkers at Hewlett-Packard (2.27) represented a real breakthrough in the
fabrication and further widespread use o f capillary chromatography.
Temperature programmed gas chromatography was first suggested by Griffiths
(2.28). It was Dal Nogare who implemented it and demonstrated the advantages o f linear
temperature programming (2.29-2.30). Parallel to the developments in column
technology, GC instrumentation, and endless applications, numerous researchers worked
on the theoretical aspects o f the technique. Giddings developed his molecular statistics
based random walk theory (2.31); Gaspar and coworkers included the contribution of
extra-column effects (2.32). Work on retention time predictions, resolution optimization,
and analysis time reductions flourished during the 70s and 80s.
Today, gas chromatography is considered a mature technique. It is used
worldwide in almost every chemical laboratory. New developments focus on the increase
in analysis speed, the miniaturization of the instrument, and the integration of GC into
fully automated systems. These systems would include sample preparation, analysis,
evaluation o f results, and decision making. Most modem GCs include microprocessor
based control and few micromachined components. Advances in microprocessor
technology and micromachining will significantly shape the design of GCs in the future
(2.33).
2.3 The Separation Process and Basic Definitions
Many excellent textbooks for gas chromatography have been published over the
years. Some o f them contain elaborate accounts of the theoretical aspects of the
technique (2.34-2.44). The following sections summarize the most important aspects of
GC theory, and their relevance in fast gas chromatography.
Reproduced with permission of the copyright owner. Further reproduction prohibited without permission.
16
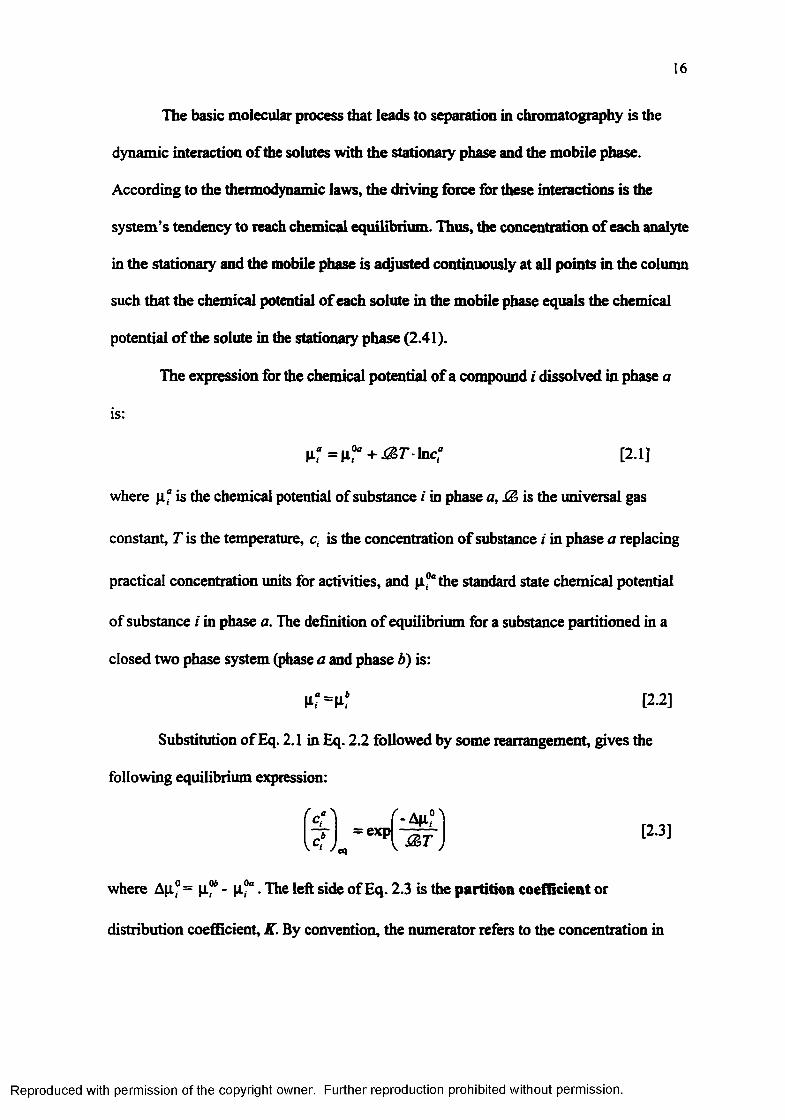
The basic molecular process that leads to separation in chromatography is the
dynamic interaction o f the solutes with the stationary phase and the mobile phase.
According to the thermodynamic laws, the driving force for these interactions is the
system’s tendency to reach chemical equilibrium. Thus, the concentration of each analyte
in the stationary and the mobile phase is adjusted continuously at all points in the column
such that the chemical potential o f each solute in the mobile phase equals the chemical
potential o f the solute in the stationary phase (2.41).
The expression for the chemical potential o f a compound / dissolved in phase a
where p." is the chemical potential o f substance i in phase a, & is the universal gas
constant, T is the temperature, c, is the concentration o f substance i in phase a replacing
of substance i in phase a. The definition o f equilibrium for a substance partitioned in a
closed two phase system (phase a and phase b) is:
Substitution of Eq. 2.1 in Eq. 2.2 followed by some rearrangement, gives the
following equilibrium expression:
where Ap.° = p.“ - p.°“ . The left side of Eq. 2.3 is the partition coefficient or
distribution coefficient, K. By convention, the numerator refers to the concentration in
is:
[2.1]
practical concentration units for activities, and p-,0athe standard state chemical potential
[2.2]
[2.3]
Reproduced with permission of the copyright owner. Further reproduction prohibited without permission.

17
the stationary phase and the denominator to the concentration in the mobile phase. From
K depends on the analyte, the nature o f the stationary phase, and the temperature o f the
system. Complete equilibrium is beyond reach in any chromatographic system because
the mobile phase continuously transports the solute molecules that are in that phase to
new portions o f stationary phase. However, partitioning is a very fast, first order process,
and the movement o f the individual bands occurs very close to equilibrium. Therefore,
the equilibrium concentrations are good approximations to the actual distribution o f the
components within the system. Under conditions o f constant partition coefficient
(homogeneous stationary phase at constant temperature), the total moles o f solutes in
phase a at any time equals c“ Va. Similarly, the moles o f solute in phase b is cf Vb, where
Va and Vb are respectively, the total volume o f phase a in the column and the total
volume o f phase b in the column. Thus, the ratio o f the moles in phase a to the moles in
phase b is:
In gas chromatography, if a is the stationary phase and b the mobile phase, then
Eq. 2.3
[2.4]
[2.5]
n,,[2.6]
and [2.7]
Reproduced with permission of the copyright owner. Further reproduction prohibited without permission.
18
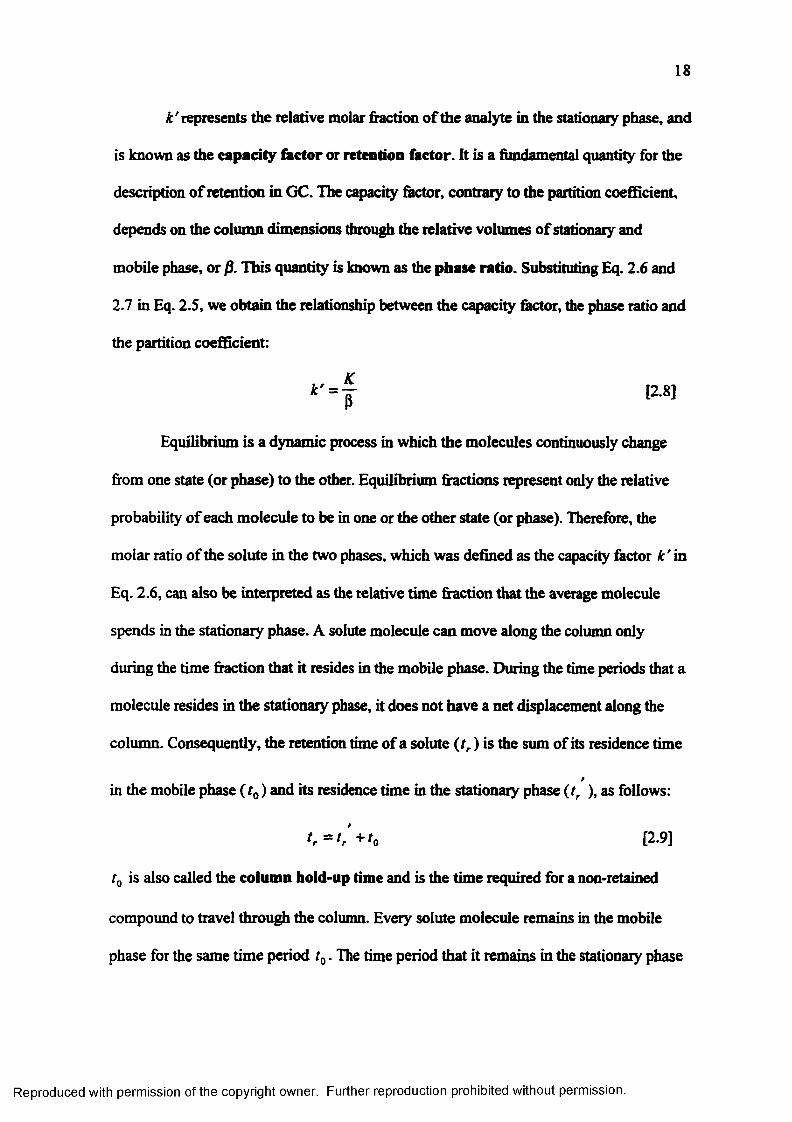
£ 'represents the relative molar fraction o f the analyte in the stationary phase, and
is known as the capacity factor or retention factor. It is a fundamental quantity for the
description o f retention in GC. The capacity factor, contrary to the partition coefficient,
depends on the column dimensions through the relative volumes o f stationary and
mobile phase, or 0. This quantity is known as the phase ratio. Substituting Eq. 2.6 and
2.7 in Eq. 2.5, we obtain the relationship between the capacity factor, the phase ratio and
the partition coefficient:
Equilibrium is a dynamic process in which the molecules continuously change
from one state (or phase) to the other. Equilibrium fractions represent only the relative
probability o f each molecule to be in one or the other state (or phase). Therefore, the
molar ratio o f the solute in the two phases, which was defined as the capacity factor k ' in
Eq. 2.6, can also be interpreted as the relative time fraction that the average molecule
spends in the stationary phase. A solute molecule can move along the column only
during the time fraction that it resides in the mobile phase. During the time periods that a
molecule resides in the stationary phase, it does not have a net displacement along the
column. Consequently, the retention time of a solute (tr ) is the sum of its residence time
p
in the mobile phase ( t0) and its residence time in the stationary phase (tr ), as follows:
fr = //+ /« , [2.9]
r0 is also called the column hold-up time and is the time required for a non-retained
compound to travel through the column. Every solute molecule remains in the mobile
phase for the same time period t0. The time period that it remains in the stationary phase
Reproduced with permission of the copyright owner. Further reproduction prohibited without permission.
19
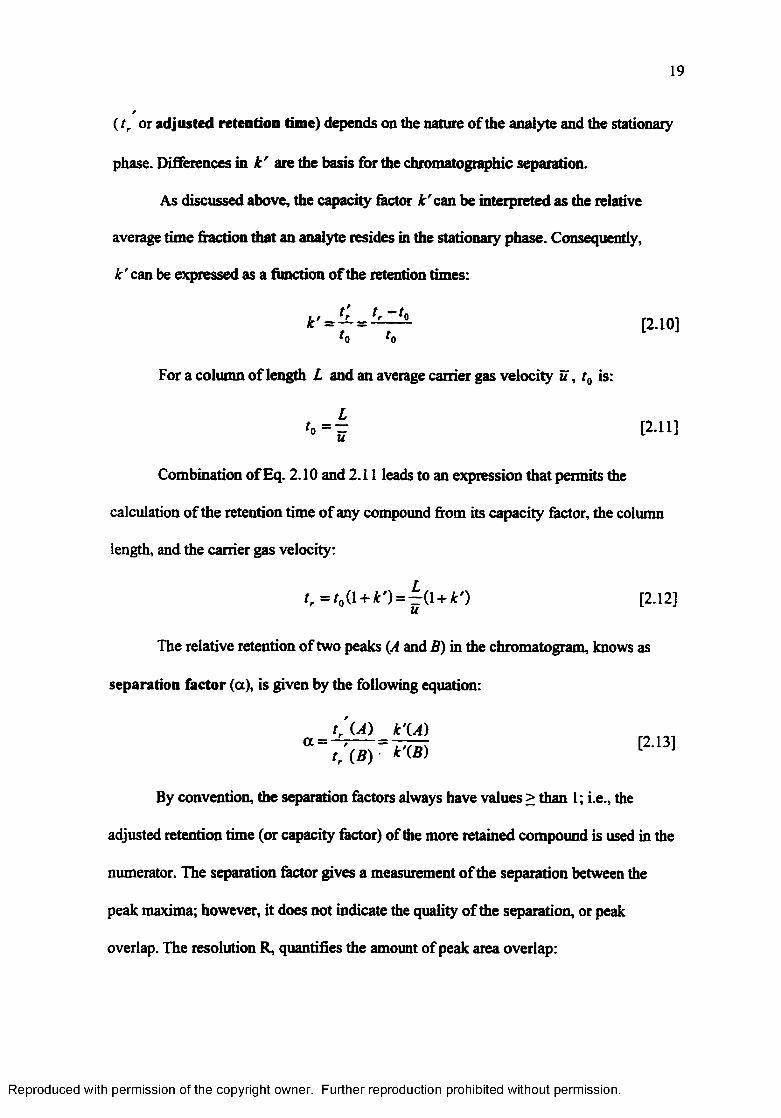
( tr or adjusted retention time) depends on the nature o f the analyte and the stationary
phase. Differences in k ' are the basis for the chromatographic separation.
As discussed above, the capacity factor £ 'can be interpreted as the relative
average time fraction that an analyte resides in the stationary phase. Consequently,
k ' can be expressed as a function o f the retention times:
* = 7 = “ - [2.10]*0 *0
For a column of length L and an average carrier gas velocity u , t0 is:
'o = f [2.11]
Combination of Eq. 2.10 and 2.11 leads to an expression that permits the
calculation of the retention time of any compound from its capacity factor, the column
length, and the carrier gas velocity:
tr = tQ(l + k ') = ( l + k ') [2.12]
The relative retention of two peaks (A and B) in the chromatogram, knows as
separation factor (a), is given by the following equation:
t ’U ) kXA)o l = —,----- = — — [2.13]
tr (B) kXB) L
By convention, the separation factors always have values > than 1; i.e., the
adjusted retention time (or capacity factor) of the more retained compound is used in the
numerator. The separation factor gives a measurement of the separation between the
peak maxima; however, it does not indicate the quality of the separation, or peak
overlap. The resolution R, quantifies the amount of peak area overlap:
Reproduced with permission of the copyright owner. Further reproduction prohibited without permission.
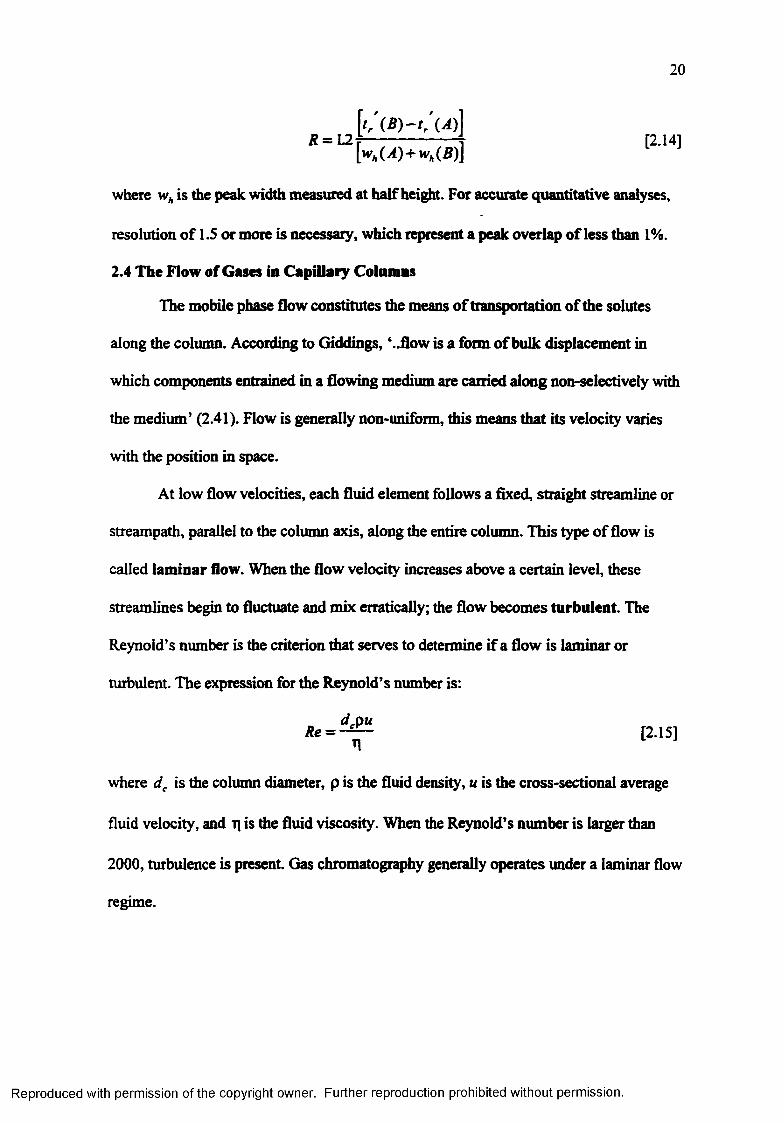
20
R = 12tr ( B ) - t r (A)
[2.14]
where wh is the peak width measured at half height. For accurate quantitative analyses,
resolution o f 1.5 or more is necessary, which represent a peak overlap o f less than 1%.
2.4 The Flow of Gases in Capillary Columns
The mobile phase flow constitutes the means o f transportation o f the solutes
along the column. According to Giddings, ‘..flow is a form o f bulk displacement in
which components entrained in a flowing medium are carried along non-selectively with
the medium’ (2.41). Flow is generally non-uniform, this means that its velocity varies
with the position in space.
At low flow velocities, each fluid element follows a fixed, straight streamline or
streampath, parallel to the column axis, along the entire column. This type o f flow is
called lam inar flow. When the flow velocity increases above a certain level, these
streamlines begin to fluctuate and mix erratically; the flow becomes turbulent. The
Reynold’s number is the criterion that serves to determine if a flow is laminar or
turbulent. The expression for the Reynold’s number is:
drouRe = - ^ ~ [2.15]
r\
where dc is the column diameter, p is the fluid density, u is the cross-sectional average
fluid velocity, and q is the fluid viscosity. When the Reynold’s number is larger than
2000, turbulence is present. Gas chromatography generally operates under a laminar flow
regime.
Reproduced with permission of the copyright owner. Further reproduction prohibited without permission.
21
Laminar flow is the result o f a balance between the driving forces and the viscous
forces. In gas chromatography, the driving force is a pressure drop along the column.
Viscous forces are the drag forces that resist the sliding of one fluid element past
another.
In a capillary tube, the pressure acts against the viscous forces. When they
balance, the flow in the tube is steady. Mathematically, the solution o f the force balance
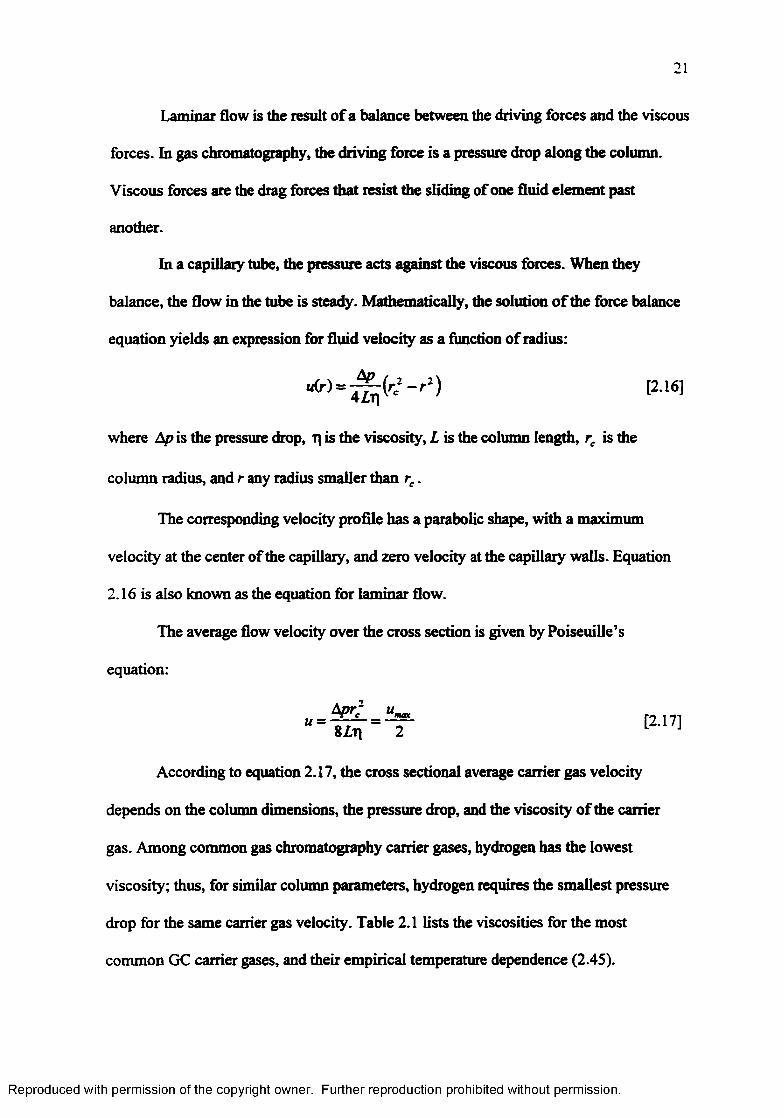
equation yields an expression for fluid velocity as a function o f radius:
“ ( r ) = ^ 2 _ r 2 ) [ 2 I 6 ]
where Ap is the pressure drop, T| is the viscosity, L is the column length, rc is the
column radius, and r any radius smaller than rc.
The corresponding velocity profile has a parabolic shape, with a maximum
velocity at the center of the capillary, and zero velocity at the capillary walls. Equation
2.16 is also known as the equation for laminar flow.
The average flow velocity over the cross section is given by Poiseuille’s
equation:
mac m '" = W T t 2 I 7 ]
According to equation 2.17, the cross sectional average carrier gas velocity
depends on the column dimensions, the pressure drop, and the viscosity o f the carrier
gas. Among common gas chromatography carrier gases, hydrogen has the lowest
viscosity; thus, for similar column parameters, hydrogen requires the smallest pressure
drop for the same carrier gas velocity. Table 2.1 lists the viscosities for the most
common GC carrier gases, and their empirical temperature dependence (2.45).
Reproduced with permission of the copyright owner. Further reproduction prohibited without permission.
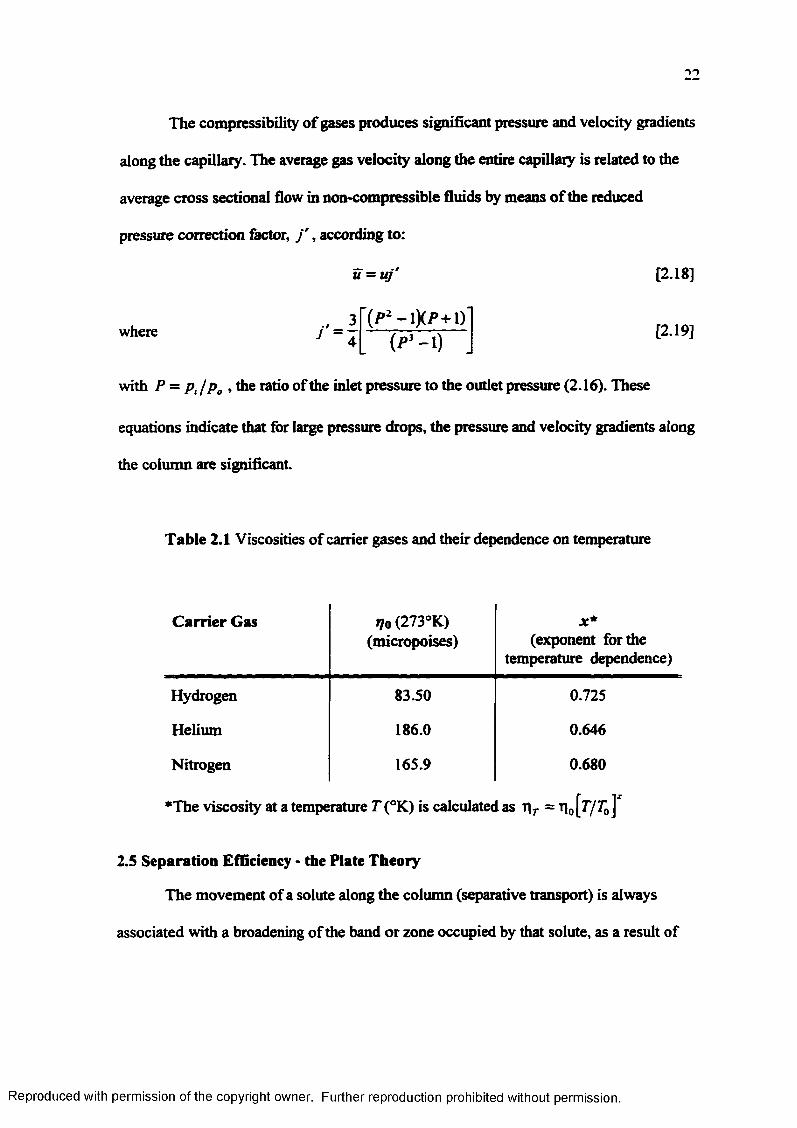
The compressibility o f gases produces significant pressure and velocity gradients
along the capillary. The average gas velocity along the entire capillary is related to the
average cross sectional flow in non-compressible fluids by means o f the reduced
pressure correction factor, j ' , according to:
u = u f [2.18]
where / =(p 2 ~ iXp -h )
(P3- 1)[2.19]
with P = p 0 , the ratio of the inlet pressure to the outlet pressure (2.16). These
equations indicate that for large pressure drops, the pressure and velocity gradients along
the column are significant.
Table 2.1 Viscosities of carrier gases and their dependence on temperature
C arrier Gas tyo(273°K) (micropoises)
Jt*(exponent for the
temperature dependence)
Hydrogen 83.50 0.725
Helium 186.0 0.646
Nitrogen 165.9 0.680
♦The viscosity at a temperature T (°K) is calculated as Tlr = Ti0[r/7^]
2.5 Separation Efficiency - the Plate Theory
The movement of a solute along the column (separative transport) is always
associated with a broadening of the band or zone occupied by that solute, as a result of
Reproduced with permission of the copyright owner. Further reproduction prohibited without permission.
23
the systems natural tendency towards dispersion or higher entropy (dispersive transport).
The relationship between the retention time and the band width is a measure o f the
separation efficiency. Large retention times and narrow band zones are synonyms for
high separation efficiencies. According to Giddings, ‘separation is the art and science of
maximizing separative transport relative to dispersive transport' (2.41).
The first theory that attempted to describe the relationship between the width of a
zone and its retention time was developed by Martin and Synge in 1941 (2.15). In their
model, they approximated the column to a series o f sequential extraction stages, similar
to a Craig apparatus (2.46). Equilibrium would be reached in each stage, before the
mobile phase containing a fraction o f the solute moves to the following stage.
Equilibrium is reestablished in the subsequent stage, and the mobile phase transferred to
the following stage. This process is repeated sequentially until the complete analyte band
leaves the system (i.e., elutes from the column). In analogy to Peter’s model for
distillation columns (2.47), each stage is considered a theoretical plate.
If a is the amount of the solute in the stationary phase in plate number 0 during
the first extraction step, and b is the amount of solute in the mobile phase in the same
plate, then a/b = k ' . If for simplicity, the amount o f solute is normalized to the total
amount of solute in the system, theno+6=l. Simple successive application of mass
balance and equilibrium equations for all stages leads to an expression similar to a
binomial expansion o f (a+b)n for the amounts o f solute present in each stage or plate.
Consequently, the amount of solute in plate (r+1) after the passage of n plate volumes
through that plate is (2.48),
Reproduced with permission of the copyright owner. Further reproduction prohibited without permission.

For large n and r values, Eq. 2.19 can be approximated to:
[2-21]
where H-l is the total number o f theoretical plates o f the column and Wn,«» the number of
plate volumes required to transport the mass center of the band to the last plate.
Eq. 2.21 is similar in form to the familiar expression for a Gaussian distribution:
where y is the dependent variable, x the center o f mass of the independent variable, and
distribution in Eq. 2.21 approaches a normal or Gaussian distribution.
Equation 2.21 was derived from a discrete multistage model, while
chromatography is a continuos process. Glueckauf (2.49) and Kilinkerberg (2.50) applied
a continuous flow model that led to a Poisson type distribution. For large number of
extraction and plates, the Poisson distribution also approaches a Gaussian distribution.
The discontinuous as well as the continuous extraction model demonstrate that an
ideal chromatographic zone follows a Gaussian distribution. The value of Qr+X in Eq.
2.21 is maximized when the exponent equals zero. Therefore,
2 (x -x )M[2.22]
V
cr the variance of the distribution. For very large values of n and r, the binomial
0n“x-r+I r V2ic f[2.23]
By analogy to the Gaussian distribution,
Reproduced with permission of the copyright owner. Further reproduction prohibited without permission.

25
a = J ? = j N [2.24]
where a expresses the standard deviation of the band in plate units, and N is the number
of theoretical plates.
Every theoretical plate has an equivalent length equal to H, or height equivalent
to a theoretical plate, defined as:
H = [2.25]
H represents the length of column that would correspond to each theoretical plate. From
Eq. 2.24, the standard deviation o f the band, expressed in distance units is then:
a d = H j N [2.26]
From Eq. 2.12, the velocity at which the band moves along the column can be
calculates as:
>’= f = T J -------- a T F T [2'271tr = a + n ( ’u
The standard deviation of the band or zone, expressed in time units is consequently:
p .2g]v u
On the other hand, from Eq. 2.12 and 2.25,
tr = ~ { k ' + \) = - { k ' + i) [2.29]
The combination of Eq. 2.28 and 2.29 results in Eq. 2.30 that permits the
evaluation o f the number o f theoretical plates (N) from the parameters o f a
chromatographic peak:
Reproduced with permission of the copyright owner. Further reproduction prohibited without permission.
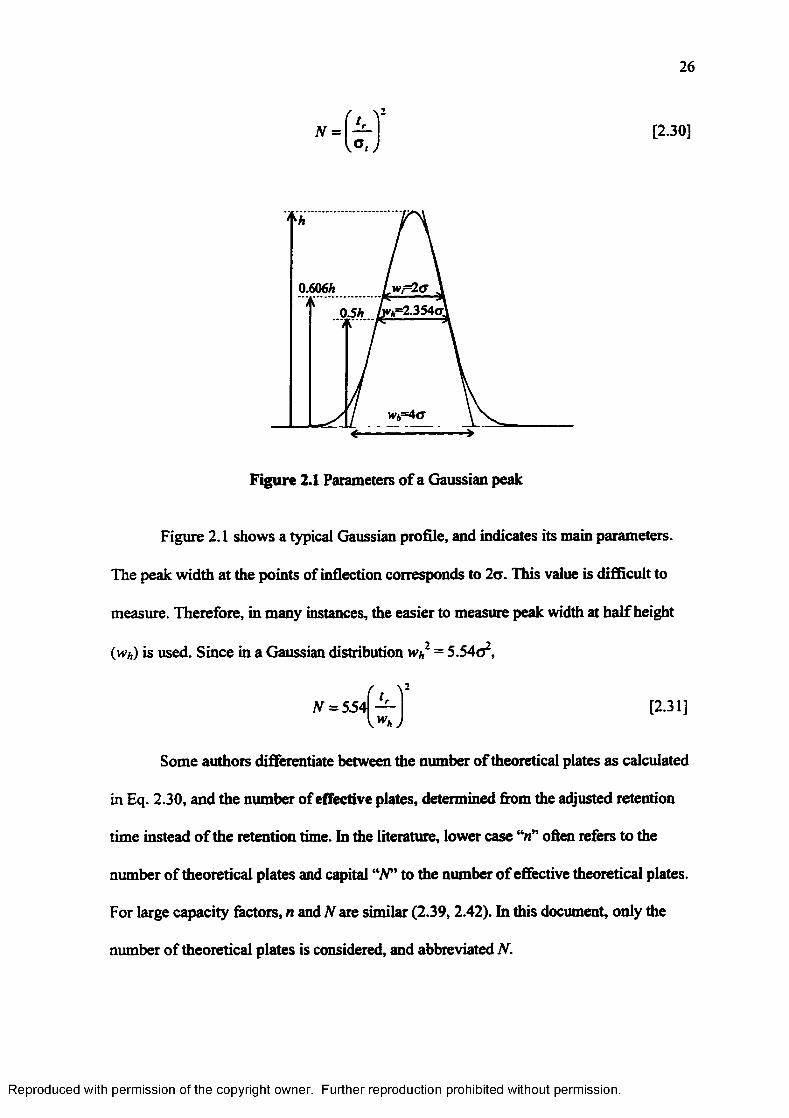
26
\2t f = — [2.30]
0.60€h0.5/i. . . .
Figure 2.1 Parameters o f a Gaussian peak
Figure 2.1 shows a typical Gaussian profile, and indicates its main parameters.
The peak width at the points of inflection corresponds to 2a. This value is difficult to
measure. Therefore, in many instances, the easier to measure peak width at half height
(w/,) is used. Since in a Gaussian distribution w/,2 ~ 5.54a2,
N — 554V 2 [2.31]
Some authors differentiate between the number o f theoretical plates as calculated
in Eq. 2.30, and the number of effective plates, determined from the adjusted retention
time instead o f the retention time. In the literature, lower case “n” often refers to the
number o f theoretical plates and capital “AT’ to the number o f effective theoretical plates.
For large capacity factors, n and N are similar (2.39,2.42). In this document, only the
number of theoretical plates is considered, and abbreviated N.
Reproduced with permission of the copyright owner. Further reproduction prohibited without permission.
27
From Eq. 2.25 and Eq. 2.26, we obtain an expression for H that defines this
column efficiency parameter independently of the theoretical plate model:
H = [2.32]
According to this definition, the height equivalent to a theoretical plate is,
without reference to a particular model, *... the variance of zone dispersion per unit
length of column’ (2.44). The former definition o f FT is based on ideal chromatography,
i.e., constant partition coefficient along the column, and instantaneous equilibrium.
When these conditions are not met along the entire column, the value of H varies along
the column. The local plate height, Hx, is defined as (2.41):
According to this definition, H is the rate o f increase o f the peak variance with its
migration distance along the column. Although local plate heights cannot be measured
from chromatographic data, the mathematical expression is useful for theoretical models
of zone spreading in non-uniform separation systems.
2.6 Column Efficiency - the Rate Theory
The plate theory describes the zone dispersion as a result of successive
equilibrium steps. It fails to provide a relationship between the column parameters and
the column efficiency that would allow the prediction and optimization of the column’s
behavior. Additionally, the plate model is based on two major assumptions that do not
describe accurately the peak broadening phenomenon. First, it ignores the contribution of
the longitudinal diffusion in the mobile and the stationary phase to the band width. Second,
it assumes complete equilibrium at all points and times. This is impossible in practice.
Reproduced with permission of the copyright owner. Further reproduction prohibited without permission.
28
When a zone contained in the mobile phase migrates, the solute concentration in the
stationary phase at the leading edge is continuously below the equilibrium concentration
for the enriched incoming mobile phase. At the trailing edge the opposite happens. The
concentration o f the solute in the stationary phase is continuously above the equilibrium
concentration as a result o f the migration o f the solute in the mobile phase.
Diffusion and non-equilibrium phenomena make large contributions to the
variance o f a chromatographic zone. The various rate theories developed take into
account these kinetic processes that contribute to the non-ideality o f the system.
Although several authors previously published partial aspects o f the rate theory, van
Deemter, Zuiderweg and Klinkerman (2.19), developed the first general approach. Golay
(2.20) later adapted the theory for the particular case o f capillary columns. Many minor
modifications to the model have been proposed, all resulting in a general expression that
can be summarized as:
The various versions of the rate theories are based on the assumption that the
different processes that contribute to peak broadening are independent, and that each one
generates a Gaussian distribution. According to the central limit theorem, the resulting
overall distribution is Gaussian, and its variance is a sum of the variances o f the
individual processes that generate the distribution:
o [2.34]
[2.35]
Consequently, [2.36]
Reproduced with permission of the copyright owner. Further reproduction prohibited without permission.

29
Each of the terms in Eq. 2.34 corresponds to one Ht component o f the overall H
value in Eq. 2.36. Each Ht arises from an independent process that contributes to the
peak broadening, and can be expressed as a function o f column parameters, retention
parameters, and operational parameters.
Two general approaches for the solution o f Eq. 2.34 in terms o f known
parameters prevail. The more rigorous method developed by van Deemter (2.19) and
Golay (2.21) is based on bulk mass balance equations. The simpler stochastic approach,
developed by Giddings, is based on molecular statistics (2.37). Both ultimately yield
similar results. The exact mathematical treatment o f the different rate models is
somewhat cumbersome, and beyond the scope of this work. The following paragraphs
summarize the most important aspects o f the currently accepted form o f the generalized
plate height equation for capillary GC.
2.6.1 The A Term - Eddy Diffusion o r M ultipath Term
The first term in Eq. 2.34 accounts for the distribution of possible flow paths
encountered in packed columns. This distribution is a probability function that depends
on the size and geometry of the packing particles, as follows,
A — f Eddy — 2 \d p [2.37]
where X is the packing factor and dp the average particle diameter.
Giddings (2.37) convincingly argues that the multipath flow effect is not
independent of radial diffusion. He substitutes for a coupled Hc term. In any
case, open tubular capillary columns have no multiple flow paths due to column packing;
therefore, HEdjt>l becomes zero. In the Giddings equation, the complex Hc term becomes
a simple Hetk6gjM term for uncoupled radial diffusion in the mobile phase.
Reproduced with permission of the copyright owner. Further reproduction prohibited without permission.
30
2.6.2 The B term — Linear or Axial Diffusion
This term describes the axial diffusion that occurs as a result o f the concentration
gradient, according to Fick’s second law:
3c,, 3 2c,p '381
where ciy is the concentration of solute / in the matrix j , and Dtj is the diffusion
coefficient o f the solute i in the matrix j . Axial diffusion occurs in the stationary phase
and the mobile phase. Because D ijn » A.»» the axial diffusion in the stationary phase is
generally neglected. A general solution to Eq. 2.38 is the Gaussian type expression:
1 | ( x - x ) ]
V47tD^ t 4A j j[2.39]
where c. - - - - - [2.40]
By analogy to the Gaussian equation (Eq. 2.22). it follows that,
W = 2DtJ„t [2.41]
which is also known as Einstein’s equation for Brownian motion. Substitution of Eq.
2.41 in Eq. 2.32 yields:
a* 2 D , t 2Dimr r IM X tO i t J H t J HHljaial = —— = — -— = —r — [2.42]
L L u
The diffusion coefficient depends on the pressure. Since the pressure in the
column changes along the column, the value o f Dljn depends on the position of the zone
in the column. Therefore, Dt m in Eq. 2.42 should be substituted by the average diffusion
coefBcient over the entire column length, DIjn. The linear gas velocity at a distance x in
Reproduced with permission of the copyright owner. Further reproduction prohibited without permission.
31
the column, uz , also depends on the column pressure. However, Dzzjn /u z is constant.
Thus,
= _ - = ------- [2.43]uz u ua
where D0 and ua are the diffusion coefficient and carrier gas velocity at the column
outlet. Substituting Eq. 2.43 in Eq. 2.42, we get,
[2.44]—O
From equation 2.44 it is evident that axial diffusion is proportional to the
residence time of the compound in the mobile phase. Therefore, Hanoi is independent of
the partition coefficient. Its contribution to the peak broadening is only important at low
carrier gas velocities, and is negligible at high carrier gas velocities. Furthermore, the
axial diffusion is minimized by the use o f carrier gases with low diffusion coefficients
(e.g., nitrogen, argon).
2.6.3 The C Term - Radial Diffusion or Resistance to Mass Transfer
The C term in Eq. 2.34 describes the dispersion of the solute band that arises
from the deviations from equilibrium, or dispersions of the equilibration times. This term
is called the resistance to mass transfer term because it results from finite mass transfer
rates. Three main phenomena can cause dispersion of the equilibration times:
a) slow radial diffusion in the vapor phase
b) slow radial diffusion in the stationary phase
c) finite rate constant for the partitioning process at the interface
These three effects are independent; thus the C term can be divided into a sum of
three independent resistance to mass transfer coefficients: Cm, or resistance to mass
Reproduced with permission of the copyright owner. Further reproduction prohibited without permission.
transfer in the mobile phase; Cs, or resistance to mass transfer in the stationary phase;
and Cu or interfacial resistance to mass transfer.
2.6.3.1 Resistance to Mass Transfer in the Mobile Phase
When the solute molecules leave the stationary phase and mix with the mobile
phase, they diffuse in all directions as a consequence of Brownian motion. The radial
component of the diffusion generates a continuous concentration gradient across the
column. This can also be interpreted as a distance distribution from the interface to the
position o f the solute molecules in the cross section of the column, or, a distribution of
the times required by the molecules in the mobile phase to diffuse back to the stationary
phase. The variance of the molecular distribution across the column causes an increment
of the variance of the band or zone.
Under the conditions used in chromatography, the mobile phase flow is laminar.
This means that the mobile phase velocity has a parabolic profile across the column, as
discussed in section 2.4 (p. 20). Solute molecules that diffuse to the column center move
ahead faster than solute molecules that remain close to the stationary phase. This
enriches the analytes in the center o f the column cross section at the leading edge. It
simultaneously depletes the analytes in the center of the column cross section at the
trailing edge. This radial concentration gradient generated as a result o f the flow velocity
distribution causes radial diffusion, that partially offsets the laminar flow effect. The net
effect of the parabolic flow profile is an enhancement of the zone dispersion, caused by
radial diffusion. This can be interpreted as a finite probability that some fraction of the
solute always diffuses to the column center and moves ahead faster than the average
solute molecule, while another fraction of the solute always remains close to the
Reproduced with permission of the copyright owner. Further reproduction prohibited without permission.
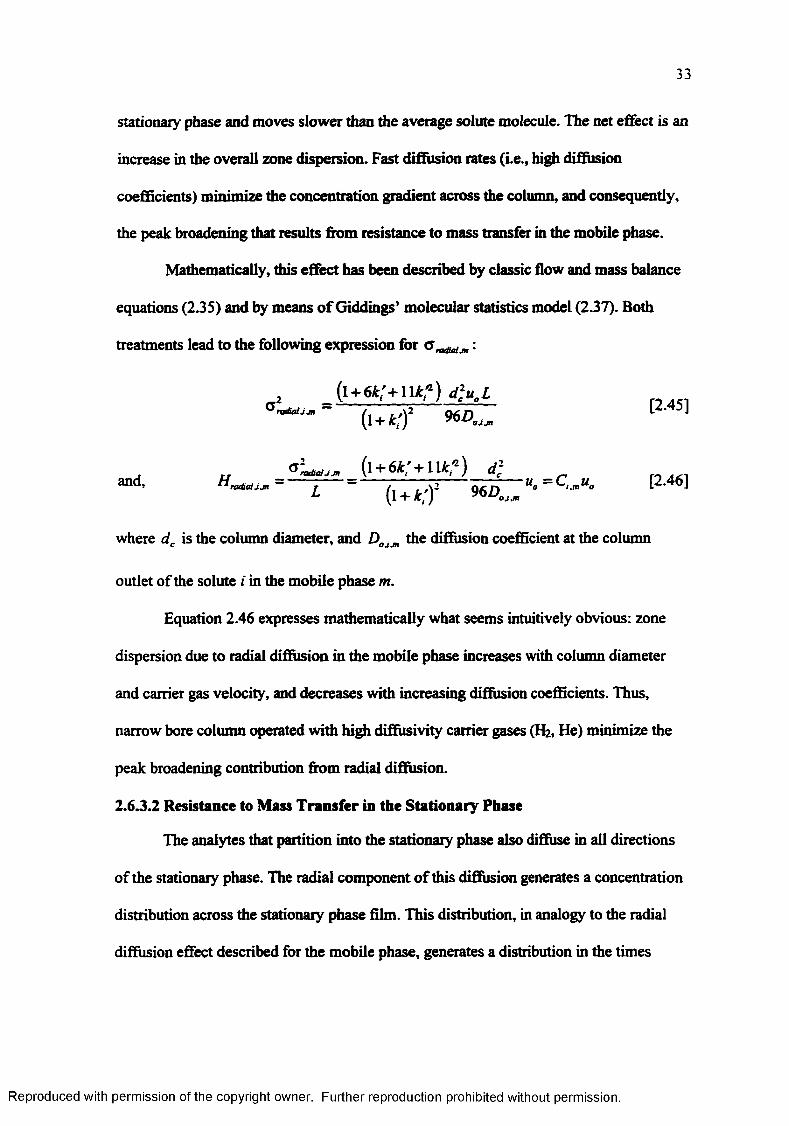
33
stationary phase and moves slower than the average solute molecule. The net effect is an
increase in the overall zone dispersion. Fast diffusion rates (i.e., high diffusion
coefficients) minimiVe the concentration gradient across the column, and consequently,
the peak broadening that results from resistance to mass transfer in the mobile phase.
Mathematically, this effect has been described by classic flow and mass balance
equations (2.35) and by means o f Giddings’ molecular statistics model (2.37). Both
treatments lead to the following expression for <5ntbiM:
J l+ 6 * ;+ l l* ,« ) d lu .L '***** Qfif) [ J
Q4jn( l+k;Y 96R
(\ + 6k;+ U k?) dIand, K = C ,„u. [2.46]
oj jn
where dr is the column diameter, and D„,m the diffusion coefficient at the columnC ’ OJJtl
outlet of the solute i in the mobile phase m.
Equation 2.46 expresses mathematically what seems intuitively obvious: zone
dispersion due to radial diffusion in the mobile phase increases with column diameter
and carrier gas velocity, and decreases with increasing diffusion coefficients. Thus,
narrow bore column operated with high diffiisivity carrier gases (H2 , He) minimize the
peak broadening contribution from radial diffusion.
2.6.3.2 Resistance to Mass Transfer in the Stationary Phase
The analytes that partition into the stationary phase also diffuse in all directions
of the stationary phase. The radial component of this diffusion generates a concentration
distribution across the stationary phase film. This distribution, in analogy to the radial
diffusion effect described for the mobile phase, generates a distribution in the times
Reproduced with permission of the copyright owner. Further reproduction prohibited without permission.
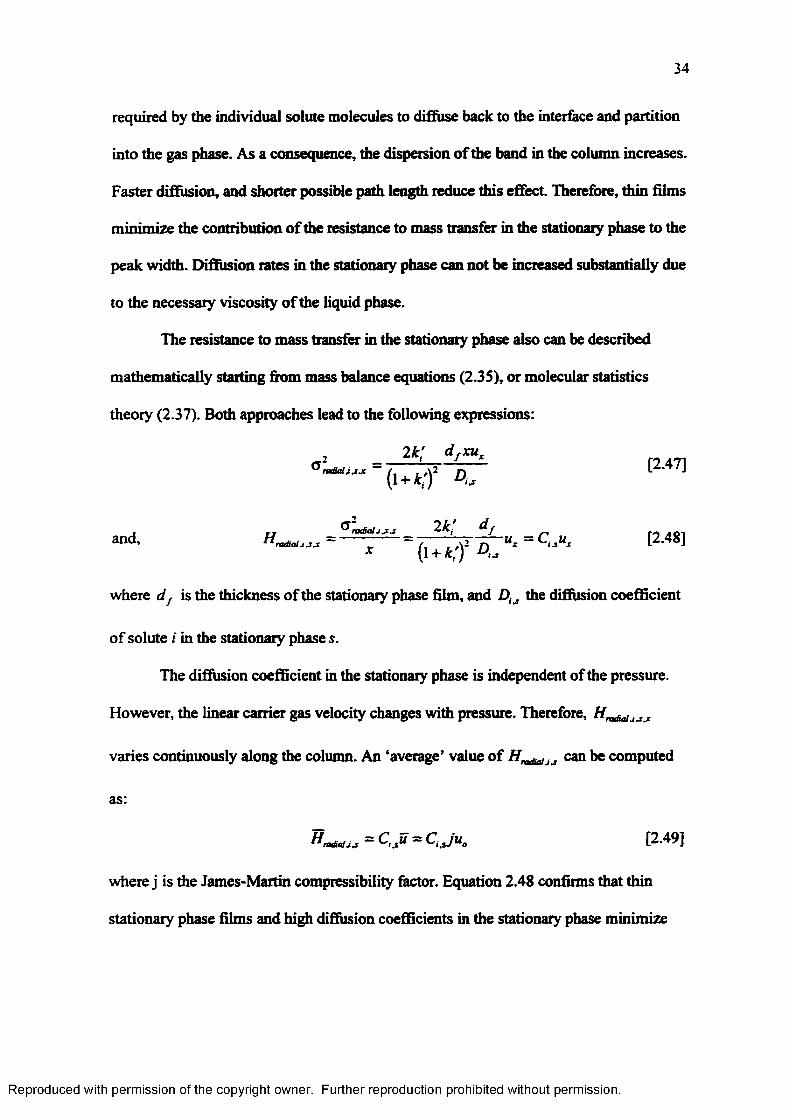
34
required by the individual solute molecules to diffuse back to the interface and partition
into the gas phase. As a consequence, the dispersion o f the band in the column increases.
Faster diffusion, and shorter possible path length reduce this effect. Therefore, thin films
m inim ize the contribution o f the resistance to mass transfer in the stationary phase to the
peak width. Diffusion rates in the stationary phase can not be increased substantially due
to the necessary viscosity o f the liquid phase.
The resistance to mass transfer in the stationary phase also can be described
mathematically starting from mass balance equations (2.35), or molecular statistics
theory (2.37). Both approaches lead to the following expressions:
2k ' drxu .
= M ? r t r [2 -47]
J r r ® r a t6 a lj jc j 2 ^ d j - m is i
and, = ----- : ----- = /, ' 'ys n “ “x = C„ux [2.48]
where df is the thickness o f the stationary phase film, and Du the diffusion coefficient
o f solute i in the stationary phase s.
The diffusion coefficient in the stationary phase is independent of the pressure.
However, the linear carrier gas velocity changes with pressure. Therefore, , x
varies continuously along the column. An ‘average’ value o f _ can be computed
as:
ffrodua = C>J“ = CtJ u 0 [2.49]
where j is the James-Martin compressibility factor. Equation 2.48 confirms that thin
stationary phase films and high diffusion coefficients in the stationary phase minimize
Reproduced with permission of the copyright owner. Further reproduction prohibited without permission.
35
the contribution o f the resistance to mass transfer in the stationary phase to the zone
dispersion.
2.6.3.3 Finite Rate Constant for the Partitioning Process or Interfacial Resistance
This term refers to the rate o f the interfacial process by itself. The physical
process that occurs at the interface can be represented as the reaction:
s , — ^ — > s „
where Ss is the solute in the stationary phase, Sm the solute in the mobile phase, and kd the
rate constant o f the reaction. If the rate of reaction is slower than the migration of the
band in the mobile phase, equilibrium can never be established. This would significantly
increase the peak width o f the zone.
The rate o f the interfacial process is generally regarded as instantaneous, and its
contribution to the zone dispersion negligible. Khan (2.51) introduced the following term
to describe the influence o f a finite equilibration rate at the interface to the band width:
2 k'd ,H u = r ~~ \ 2 ~ - fu a = C J U Q [2.50]
In practice, the measurement of this term is extremely difficult, because it has the
same net effect as the resistance to mass transfer terms due to radial diffusion. Berngard
and Blomberg (2.52) found values for Cx that were comparable to the magnitude o f the
Cs values for conventional film thickness. However, the values of Cm were significantly
larger, and dominated completely the resistance to mass transfer term. Most textbooks
and publications neglect the C, term in the plate height equation.
Reproduced with permission of the copyright owner. Further reproduction prohibited without permission.
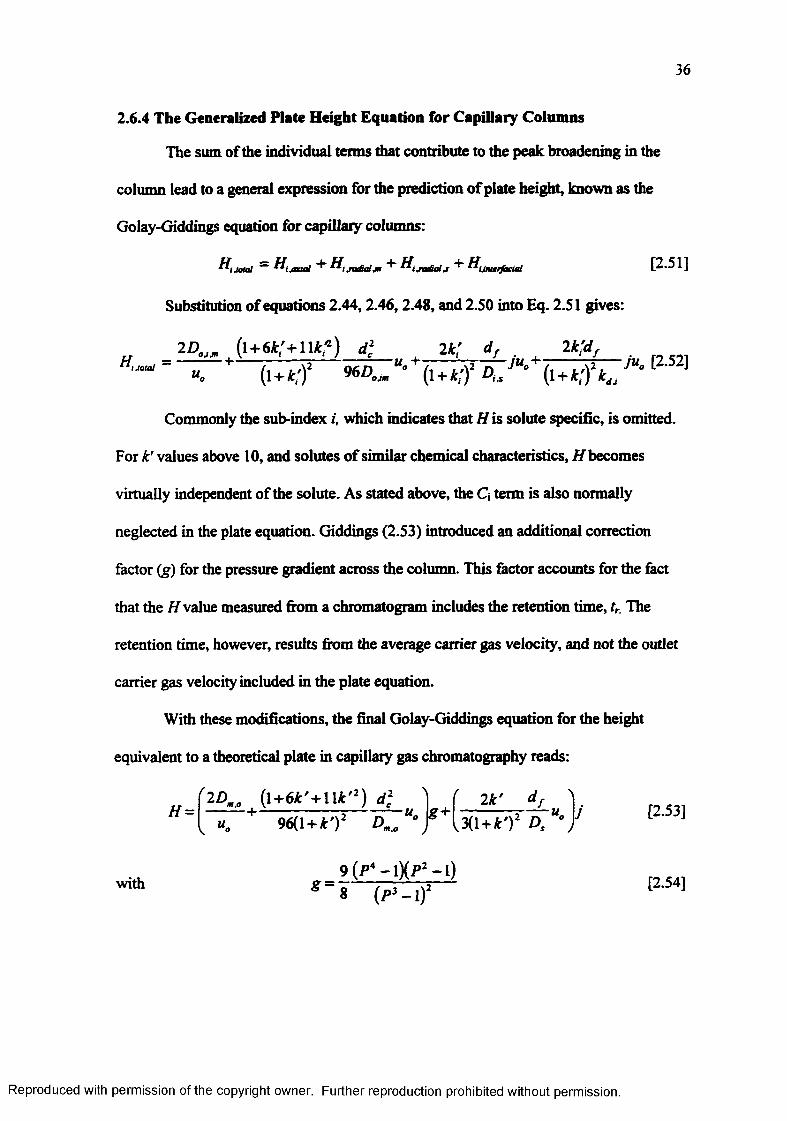
36
2.6.4 The Generalized Plate Height Equation for Capillary Columns
The sum of the individual terms that contribute to the peak broadening in the
column lead to a general expression for the prediction of plate height, known as the
Golay-Giddings equation for capillary columns:
Substitution of equations 2.44,2.46,2.48, and 2.S0 into Eq. 2.51 gives:
u d \ . 2k; d , . . 2k;d, .k ( i+Jt/)J %£>„. (i+*/)J A „J " M ; ) 2* , /
Commonly the sub-index i, which indicates that H is solute specific, is omitted.
For k' values above 10, and solutes o f similar chemical characteristics, H becomes
virtually independent of the solute. As stated above, the Q term is also normally
neglected in the plate equation. Giddings (2.53) introduced an additional correction
factor (g) for the pressure gradient across the column. This factor accounts for the fact
that the //value measured from a chromatogram includes the retention time, tT. The
retention time, however, results from the average carrier gas velocity, and not the outlet
carrier gas velocity included in the plate equation.
With these modifications, the final Golay-Giddings equation for the height
equivalent to a theoretical plate in capillary gas chromatography reads:
ijotal [2.51]
[2.53]
with9 (/>4 - l X P 2 - l )
g ~ 8 ( p > - 1)2[2.54]
Reproduced with permission of the copyright owner. Further reproduction prohibited without permission.
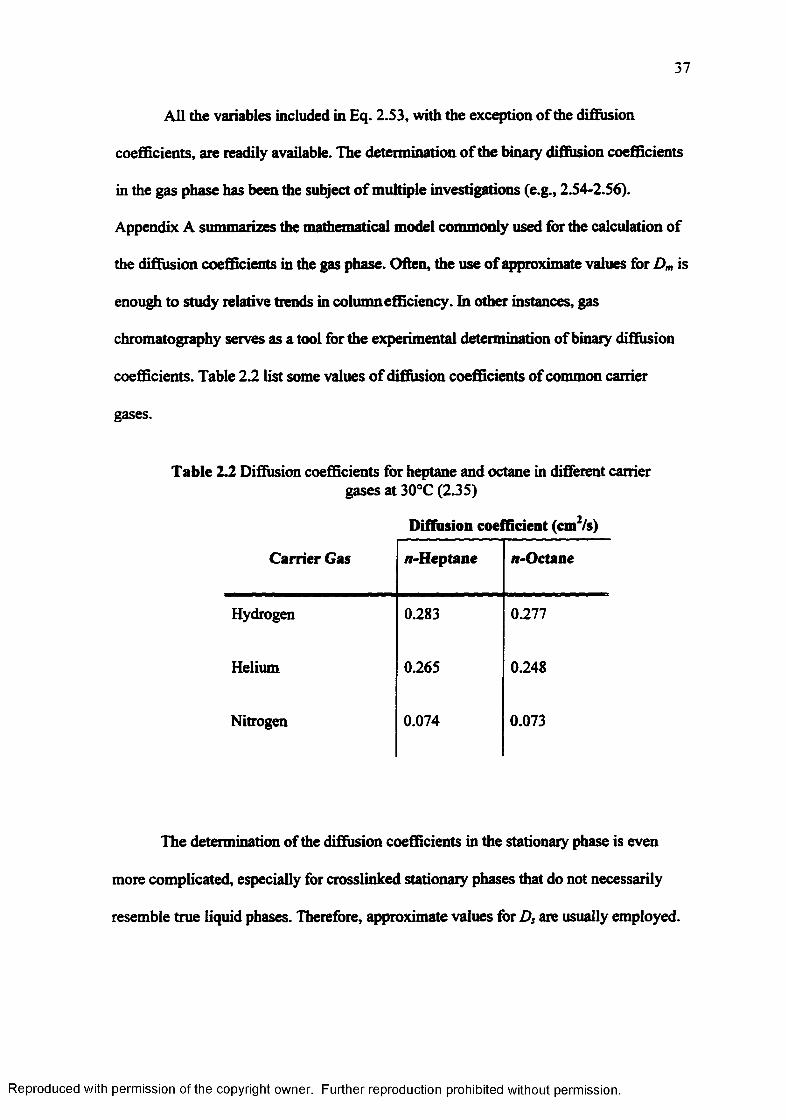
37
All the variables included in Eq. 2.S3, with the exception of the diffusion
coefficients, are readily available. The determination o f the binary diffusion coefficients
in the gas phase has been the subject o f multiple investigations (e.g., 2.54-2.56).
Appendix A summarizes the mathematical model commonly used for the calculation of
the diffusion coefficients in the gas phase. Often, the use o f approximate values for Dm is
enough to study relative trends in column efficiency, hi other instances, gas
chromatography serves as a tool for the experimental determination of binary diffusion
coefficients. Table 2.2 list some values o f diffusion coefficients of common carrier
gases.
Table 2.2 Diffusion coefficients for heptane and octane in different carriergases at 30°C (2.35)
Diffusion coefficient (cm2/s)
C arrier Gas /r-Heptane ir-Octane
Hydrogen 0.283 0.277
Helium 0.265 0.248
Nitrogen 0.074 0.073
The determination of the diffusion coefficients in the stationary phase is even
more complicated, especially for crosslinked stationary phases that do not necessarily
resemble true liquid phases. Therefore, approximate values for Ds are usually employed.
Reproduced with permission of the copyright owner. Further reproduction prohibited without permission.
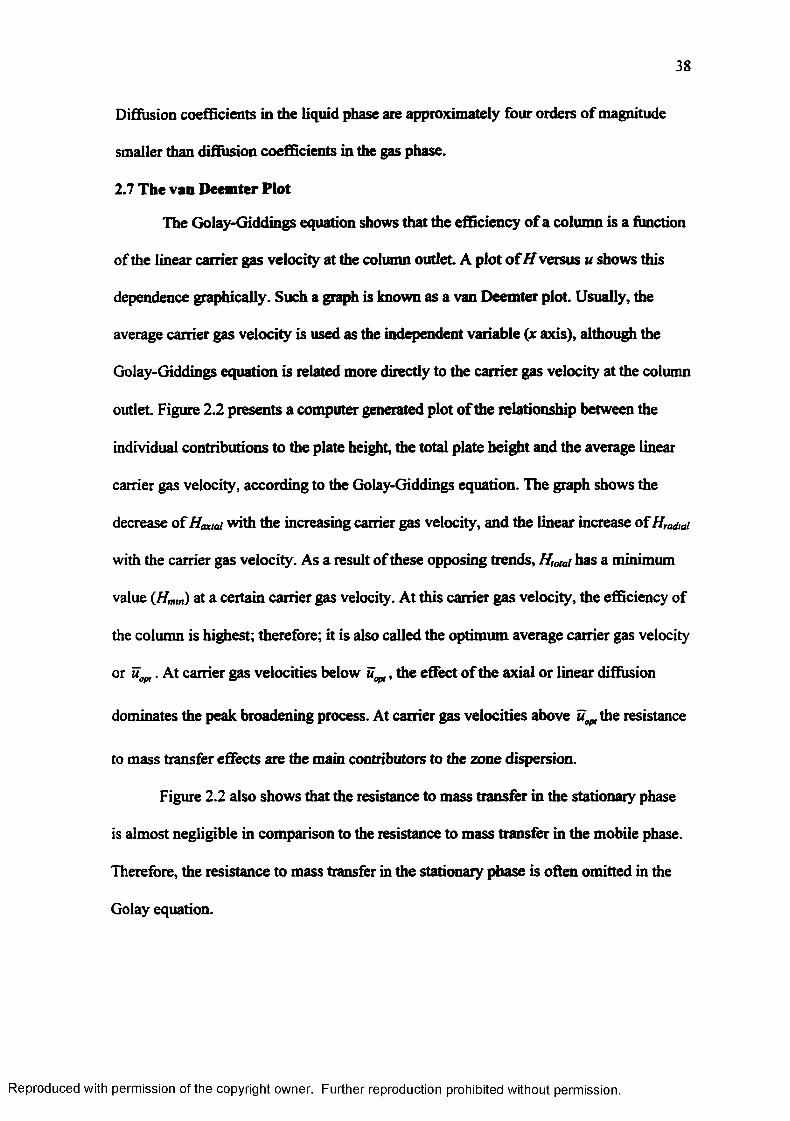
38
Diffusion coefficients in the liquid phase are approximately four orders o f magnitude
smaller than diffusion coefficients in the gas phase.
2.7 The van Deemter Plot
The Golay-Giddings equation shows that the efficiency o f a column is a function
of the linear carrier gas velocity at the column outlet. A plot o iH versus u shows this
dependence graphically. Such a graph is known as a van Deemter p lo t Usually, the
average carrier gas velocity is used as the independent variable (x axis), although the
Golay-Giddings equation is related more directly to the carrier gas velocity at the column
outlet. Figure 2.2 presents a computer generated plot of the relationship between the
individual contributions to the plate height, the total plate height and the average linear
carrier gas velocity, according to the Golay-Giddings equation. The graph shows the
decrease o f Hmai with the increasing carrier gas velocity, and the linear increase o f Hradiai
with the carrier gas velocity. As a result o f these opposing trends, f f lolai has a minimum
value (Hmm) at a certain carrier gas velocity. At this carrier gas velocity, the efficiency of
the column is highest; therefore; it is also called the optimum average carrier gas velocity
or uopl. At carrier gas velocities below , the effect o f the axial or linear diffusion
dominates the peak broadening process. At carrier gas velocities above uopt\he resistance
to mass transfer effects are the main contributors to the zone dispersion.
Figure 2.2 also shows that the resistance to mass transfer in the stationary phase
is almost negligible in comparison to the resistance to mass transfer in the mobile phase.
Therefore, the resistance to mass transfer in the stationary phase is often omitted in the
Golay equation.
Reproduced with permission of the copyright owner. Further reproduction prohibited without permission.

39
0.08 *H axial- H radial, s- H radial, m -H total0.06
«, 0.04
0.02
m * r f t* I t H ^ ^ i* f f f 1 T i~ i~T I f ~ [ r ' r r j
20 40 60 80 100 120 140 160 1800.00
0
Average u (cm/s)
Figure 2.2 Computer generated plot o f //versus average carrier gas velocity according to the Golay-Giddings equation. Column: 25m x 0.25mm, df=0.4 pm, carrier gas: H2
An experimental van Deemter plot (//determined from peak widths and retention
times in a chromatogram) resembles a ‘theoretical1 van Deemter plot (H calculated from
the Golay-Giddings equation). Experimental values o f//a re always equal or larger than
the values calculated theoretically. Differences between the two values result from poor
column quality, extra-column effects, or column non-uniformities. The relation between
the theoretical and the experimental Hmm values is sometimes called coating efficiency,
and utilized for column evaluation. It is important to note that this value reflects the true
column coating efficiency only when the contributions from extra-column effects to the
peak variance are relatively small.
The Golay-Giddings equation and the van Deemter type graphs readily permit
modeling the column behavior and studying the effect o f the different variables upon
Reproduced with permission of the copyright owner. Further reproduction prohibited without permission.
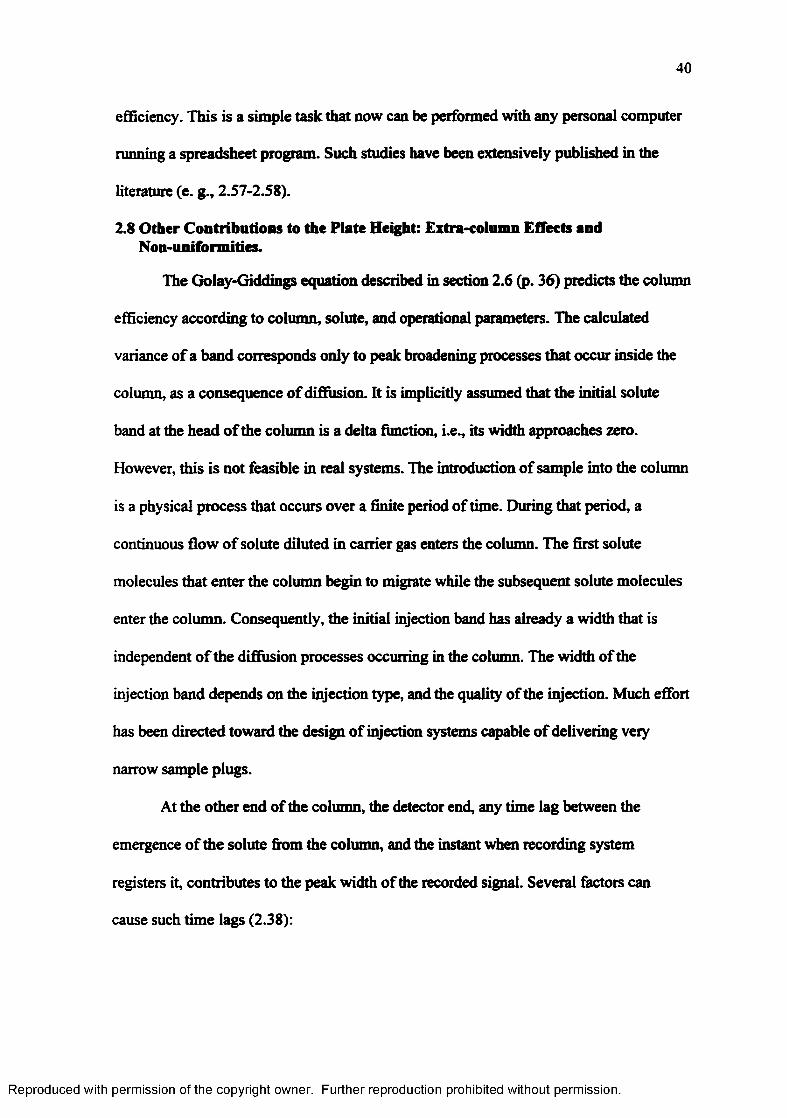
40
efficiency. This is a simple task that now can be performed with any personal computer
running a spreadsheet program. Such studies have been extensively published in the
literature (e. g., 2.57-2.58).
2.8 Other Contributions to the Plate Height: Extra-column Effects and Non-uniformities.
The Golay-Giddings equation described in section 2.6 (p. 36) predicts the column
efficiency according to column, solute, and operational parameters. The calculated
variance of a band corresponds only to peak broadening processes that occur inside the
column, as a consequence o f diffusion. It is implicitly assumed that the initial solute
band at the head o f the column is a delta function, i.e., its width approaches zero.
However, this is not feasible in real systems. The introduction of sample into the column
is a physical process that occurs over a finite period o f time. During that period, a
continuous flow o f solute diluted in carrier gas enters the column. The first solute
molecules that enter the column begin to migrate while the subsequent solute molecules
enter the column. Consequently, the initial injection band has already a width that is
independent o f the diffusion processes occurring in the column. The width o f the
injection band depends on the injection type, and the quality of the injection. Much effort
has been directed toward the design of injection systems capable o f delivering very
narrow sample plugs.
At the other end o f the column, the detector end, any time lag between the
emergence o f the solute from the column, and the instant when recording system
registers it, contributes to the peak width o f the recorded signal. Several factors can
cause such time lags (2.38):
Reproduced with permission of the copyright owner. Further reproduction prohibited without permission.
41
a) significant dead volume between the column outlet and detector (plumbing)
b) large detector volume (i.e., cell)
c) slow response time o f the detector electronics
d) slow sampling rate relative to the peak width
Since the peak broadening processes at the injector and detector are independent
of the processes that occur inside the column, the variance of the recorded peak
corresponds to the sum o f the variances associated with the injector, the detector, and the
column:
aLanr.* = < + P-55]
2 7Consequently, Hmtcaurrd = ~ ~ + H cal + [2.56]
The direct application o f Eq. 2.56 requires the knowledge of (?~, and <r*{ in
distance units. However, the phenomena that cause peak width increases in the injector
and detector are constant time events (i.e., injection plug time, detector response time).
The variance o f the injector and detector in distance units is then,
72 ^ m j j 2 r-» c m
G mjM ~ Q + £')2 ^ P-57]
and [2.58]
If we add the variance of all extra-column effects into one term ( o ^ ), and approximate
= “*, = u , then
CfC(r)(l + k' )2L'
Reproduced with permission of the copyright owner. Further reproduction prohibited without permission.
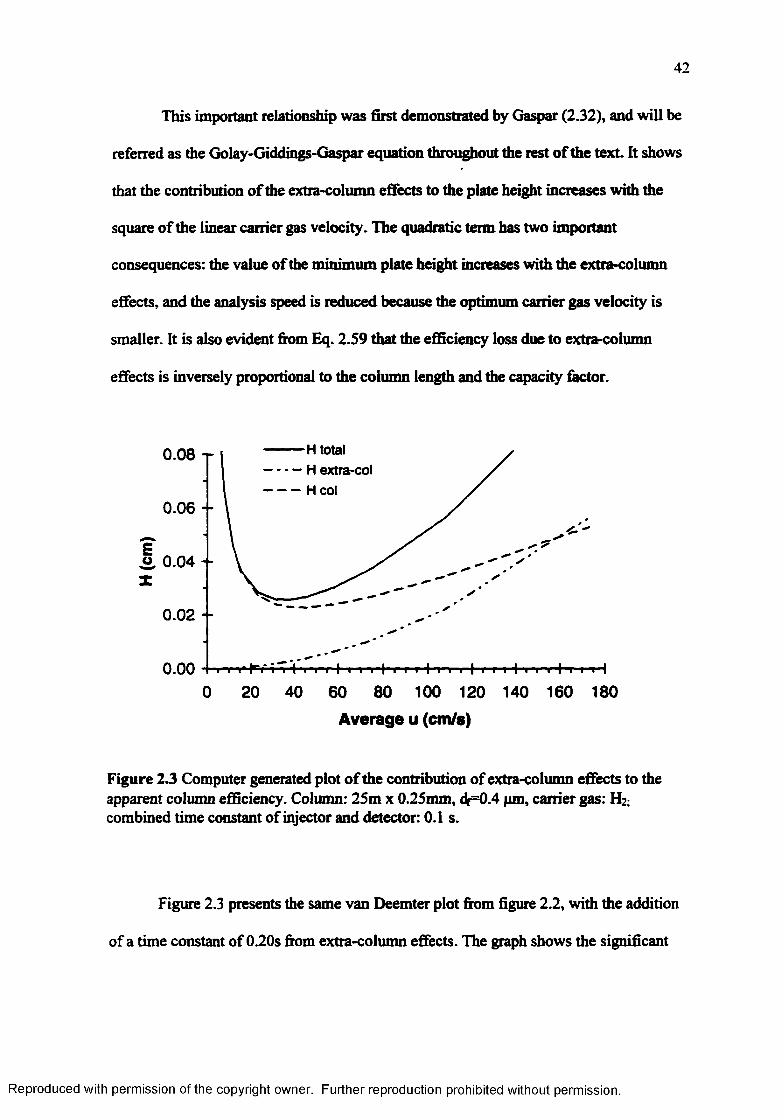
42
This important relationship was first demonstrated by Gaspar (2.32), and will be
referred as the Golay-Giddings-Gaspar equation throughout the rest o f the text. It shows
that the contribution o f the extra-column effects to the plate height increases with the
square o f the linear carrier gas velocity. The quadratic term has two important
consequences: the value o f the minimum plate height increases with the extra-column
effects, and the analysis speed is reduced because the optimum carrier gas velocity is
smaller. It is also evident from Eq. 2.59 that the efficiency loss due to extra-column
effects is inversely proportional to the column length and the capacity factor.
H total H extra-col H col
0.08
0.06
o, 0.04
0.02
0.000 20 40 60 80 100 120 140 160 180
Average u (cm/s)
Figure 2.3 Computer generated plot o f the contribution of extra-column effects to the apparent column efficiency. Column: 25m x 0.25mm, df=0.4 pm, carrier gas: H2: combined time constant of injector and detector: 0.1 s.
Figure 2.3 presents the same van Deemter plot from figure 2.2, with the addition
of a time constant of 0.20s from extra-column effects. The graph shows the significant
Reproduced with permission of the copyright owner. Further reproduction prohibited without permission.
43
efficiency losses that result from the injector and detector time constants at high carrier
gas velocities. At very high carrier gas velocities the extra-column effects dominate the
apparent plate height o f the system.
hi addition to the extra-column effects, Blumberg (2.59-2.61) demonstrated that
column non-uniformities contribute to the efficiency erosion. The author derived
extensive mathematical expressions in his demonstration. From a stochastic point o f
view, this can be explained as follows. Non-uniformities along the column represent
spatial variations o f the capacity factor. For non-uniformities to exist, there must be
capacity factor gradients at the boundaries o f those non-uniformities. There is always a
finite probability that certain fraction o f solutes partition mainly at the leading end (or
trailing end) of the peak that moves along the boundary gradient o f a non-uniform
region. This probability distribution in the capacity factors experienced by different
solute molecules translates into a net peak broadening.
The additive property of the variances has important consequences in the design
of a chromatographic system, or the selection of a column. In a GC system, the element
that introduces the largest variance will always determine the overall dispersion of the
peaks, and therefore, the efficiency o f the system. To effectively improve the efficiency
of a chromatographic system, the component that introduces the largest variance to the
zone has to be improved first.
2.9 Column Performance, Optimization and Analysis Speed
The main goal of design efforts is optimization. The main goal in
chromatography is to obtain the highest resolution in the minimum analysis time. Other
Reproduced with permission of the copyright owner. Further reproduction prohibited without permission.
44
criteria such as sensitivity, peak capacity, cost, may play an important role in the
selection o f a chromatographic method; and eventually compromise resolution or speed.
The Golay-Giddings equation constitutes a powerful tool for efficiency
optimization. It allows to readily determine maximum efficiency, and the optimum
carrier gas velocity. The condition for minimum plate height is:
d f fBu j Uu-opt o<opt
r ~ + C = 0 [2.60]
Rearrangement and substitution o f the complete expression for B and C,
assuming that Cm » C„ yields:
_ Ij «p .j i+ tyUo.opr ■y q
For large values o fk ’,
4 D[2-62]
Substitution o f Eq. 2.62 into the Golay-Giddings equation yields the
corresponding expression for Hmm,
For large values of k ’, and high pressure drops:
Hmm=dc [2.64]
Thus, for thin film columns with negligible contribution o f C, to the plate height,
the minimum plate height is approximately equivalent to the column diameter, and
independent o f the carrier gas. According to Eq. 2.64, theoretically the column efficiency
could be increased almost indefinitely upon reduction o f the column diameter. However,
Reproduced with permission of the copyright owner. Further reproduction prohibited without permission.
45
factors like sample capacity, gas compressibility, and relative contributions of
extra-column effects impose a practical limit to the minimum column diameter.
Equation 2.62 demonstrates that the optimum carrier gas velocity is inversely
proportional to the column diameter; increasing die analysis speed. The use of carrier
gases with high diffusion coefficients further increases the optimum velocity. Hydrogen
has the highest diffusion coefficients, followed closely by helium. However, the viscosity
of helium imposes a high pressure drop, which reduces the efficiency. In addition to the
larger Ugpt obtained with narrow bore columns operated with hydrogen, the increase of
the plate height with the linear carrier gas velocity beyond Ugpt is smallest for this
column/carrier gas combination, as seen from Eq. 2.46. This signifies that the system can
be operated at significantly higher than linear carrier gas velocities, increasing the
analysis speed without sacrificing substantial column efficiency. In conclusion, narrow
bore columns, operated with hydrogen deliver the highest efficiencies, and fastest
optimum carrier gas velocities. The computer generated van Deemter plots of figure 2.4
illustrate the effect o f the nature o f the carrier gas and the column diameter on the
column efficiency.
The aim for the highest efficiency should not be the only criterion for
chromatographic optimization. Increases in efficiency almost always imply increases in
analysis times. High chromatographic efficiency could therefore turn into low analytical
efficiency due to excessively long analysis times. The concept o f column performance
links efficiency to analysis time. Giddings (2.62) proposed the number of plates per unit
time, or the rate o f generation of theoretical plates (dN/dt) as a measurement of
Reproduced with permission of the copyright owner. Further reproduction prohibited without permission.
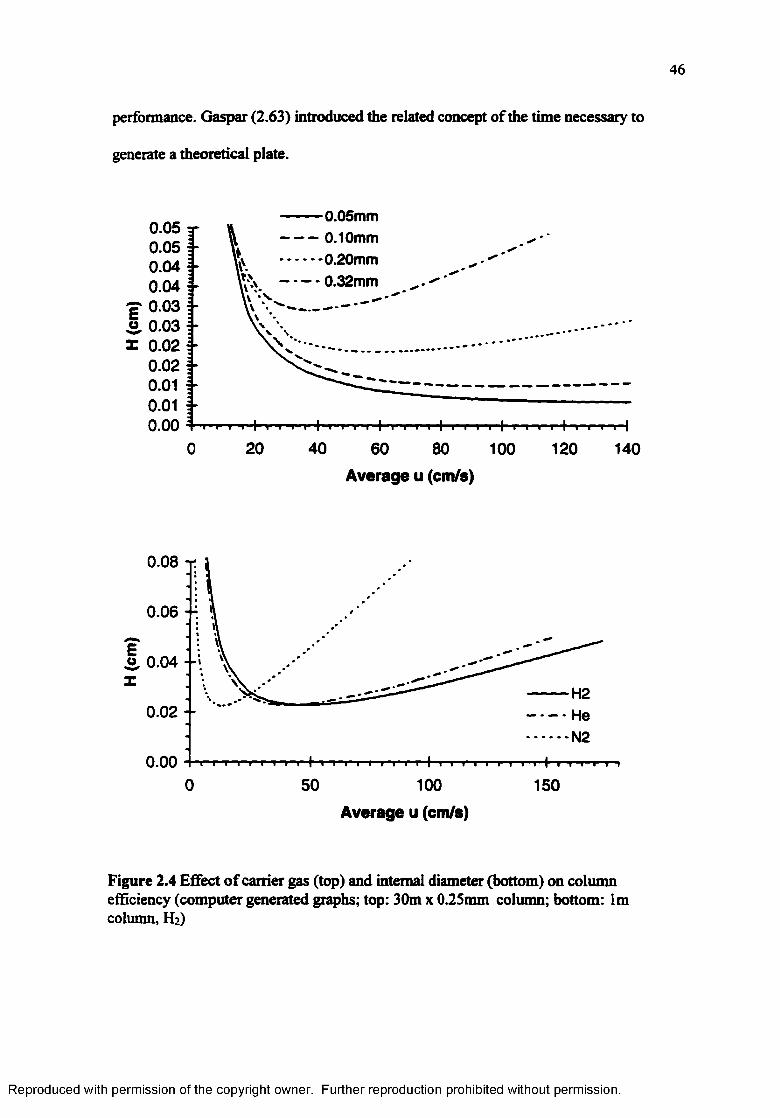
46
performance. Gaspar (2.63) introduced the related concept of the time necessary to
generate a theoretical plate.
0.050.050.04 - V-0.04 Y&. “ *t. . v
E 0 ^w *\u *. ^
0 , 0.03 \ \ \ \> Nr 0 . 0 2 V* **Vv^
0.020.010.010.00
'0.05mm
-0.20mm
\ ........................
■i i t i t I r i t t 4' t -H20 40 60 80
Average u (cm/s)100 120 140
0.08
0.06
o, 0.04
H2HeN2
0.02
0.0050 1000 150
Average u (cm/s)
Figure 2.4 Effect o f carrier gas (top) and internal diameter (bottom) on column efficiency (computer generated graphs; top: 30m x 0.25mm column; bottom: lm column, H2)
Reproduced with permission of the copyright owner. Further reproduction prohibited without permission.

47
Another, more practical form o f determining the chromatographic performance
takes into account the particular analytical problem. The most efficient analytical method
is the one that requires the smallest amount o f time to solve the analytical problem at
hand. In chromatography, obtaining a desired resolution between a two or more
compounds o f a mixture is the analytical challenge. Achieve this in the shortest amount
of time possible is the goal of the optimization.
From the definition o f resolution (Eq. 2.14), capacity factor (Eq. 2.6) and
separation factor (Eq. 2.13), the following relationship between resolution, plate number,
selectivity and retention can be derived:
This equation is also known as Purnell’s resolution equation (2.35). The number
of theoretical plates required to obtained the desired resolution with a separation factor
of a between two analytes o f approximate capacity factor k is then:
^ =,6*2feT P f1)’Since trm = ^ ( l + k ‘) = N- ^ — — (l + k ') [2.67]
^Opt tlgp,
then frjBW = (1 + ( l + 6* ' + l l* 'M /Vojn
d; [2.68]I ( 1 + n 2 A J J
Thus, according to theory, for equivalent resolution, significant reductions in
analysis times are expected when the column diameter is reduced. The other two
variables that can be manipulated for a reduction in analysis time are the phase ratio, and
the choice of carrier gas. A large phase ratio (i.e., small film thickness, and consequently,
Reproduced with permission of the copyright owner. Further reproduction prohibited without permission.
48
reduced capacity factor), and a large diffusion coefficient (use o f hydrogen or helium)
contribute to the reduction o f the analysis time. However, the column diameter has the
largest effect in retention time reduction due to its quadratic relationship with the
retention time (2.64-2.67).
The previous discussion assumes constant resolution, or equivalently, constant
plate number. Because the minimum plate height is approximately equal to the column
i.d., and the plate number is N=L/H,
t 2 W ]
Thus, to keep a constant plate number, the column length should be reduced
concomitantly with the column diameter.
In the foregoing discussion, only the column was considered in the analysis time
predictions, and the influence o f extra-column effects neglected. However, from Eq.
2.59, we know that the importance of extra-column effects increases with the square of
the carrier gas velocity. Because narrow bore columns are operated at high carrier gas
velocities, the relative importance o f the extra column effects increases for these
columns. Gaspar (2.67) derived a relationship between analysis time, required plate
numbers, and operational variables that includes the extra-column effects:
d] fl+ 6Jk' + l l k '20 ^ ' + l)A n a+*')2
This relationship corresponds to operation at the optimum carrier gas velocity,
and with the minimum column length. The extra-column effects are inherent to the
instruments, and not related to the column, as indicated by their name. Therefore, they
Reproduced with permission of the copyright owner. Further reproduction prohibited without permission.
49
are constants for a given GC system, and their relative contribution to the analysis time
increases as the analysis time required by the column itself decreases.
In conclusion, significant analysis time can be gained by reducing the column
diameter. However, the use o f reduced column diameter imposes the reduction of
extra-column effects; otherwise, those effects will dictate the performance of the system.
Therefore, the used o f specialized instrumentation is necessary for ultra-fast gas
chromatography.
2.10 Sample Capacity
The fundamental theories in gas chromatography are based on linear models of
the equilibrium process. This means that the ratio o f sample concentration in the vapor
phase and in the stationary phase is constant at all points and times in the column. This
linear relationship is known as Henry’s law, and applies only to dilute solutions. When
the local solute concentration in the column is too large, Henry’s law does not apply. The
stationary phase becomes ‘saturated’; its affinity for more solute decreases, lowering the
capacity factor. As a result the concentration o f solute in the mobile phase is above the
linear equilibrium concentration. Thus, a larger concentration of solute migrates past the
solute band in the stationary phase, to new regions of stationary phase that are not
saturated. This causes a distortion of the zone, characterized by a fronting peak. This
phenomenon is commonly referred to as column overloading, and corresponds to an
anti-Langmuir isotherm.
The sample capacity of a column is the maximum amount of solute that does
not cause peak distortion due to overloading. In practice, the sample capacity is difficult
to establish, because the local sample concentrations depends on the injection profile.
Reproduced with permission of the copyright owner. Further reproduction prohibited without permission.
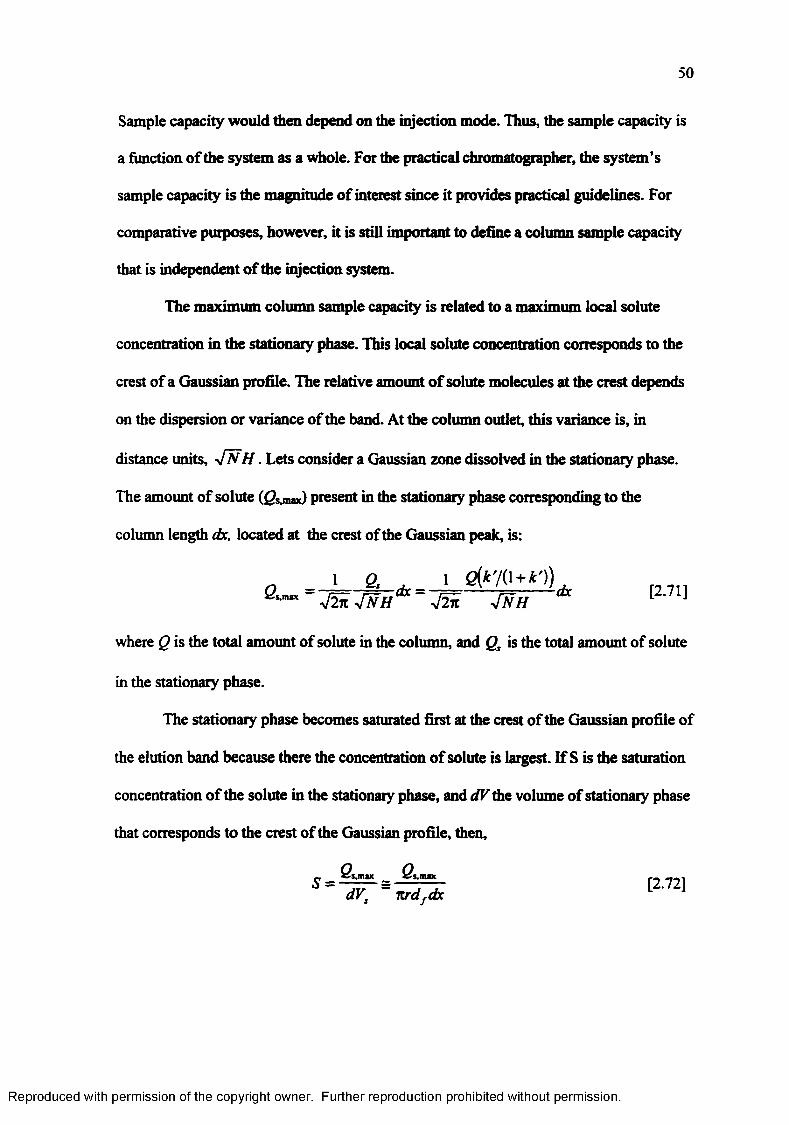
50
Sample capacity would then depend on the injection mode. Thus, the sample capacity is
a function of the system as a whole. For the practical chromatographer, the system’s
sample capacity is the magnitude o f interest since it provides practical guidelines. For
comparative purposes, however, it is still important to define a column sample capacity
that is independent o f the injection system.
The maximum column sample capacity is related to a maximum local solute
concentration in the stationary phase. This local solute concentration corresponds to the
crest of a Gaussian profile. The relative amount o f solute molecules at the crest depends
on the dispersion or variance of the band. At the column outlet, this variance is, in
distance units, -J~NH. Lets consider a Gaussian zone dissolved in the stationary phase.
The amount of solute (£2s,max) present in the stationary phase corresponding to the
column length dx, located at the crest of the Gaussian peak, is:
n 1 g . ,, 1 e (* y o •*•*'>).- -v/Sit -JTfH ~ -J2n - iN H * [ ]
where Q is the total amount of solute in the column, and Qs is the total amount o f solute
in the stationary phase.
The stationary phase becomes saturated first at the crest of the Gaussian profile of
the elution band because there the concentration o f solute is largest. If S is the saturation
concentration o f the solute in the stationary phase, and dFthe volume of stationary phase
that corresponds to the crest of the Gaussian profile, then,
_ [2.721dVs nrdf dx 1 1
Reproduced with permission of the copyright owner. Further reproduction prohibited without permission.
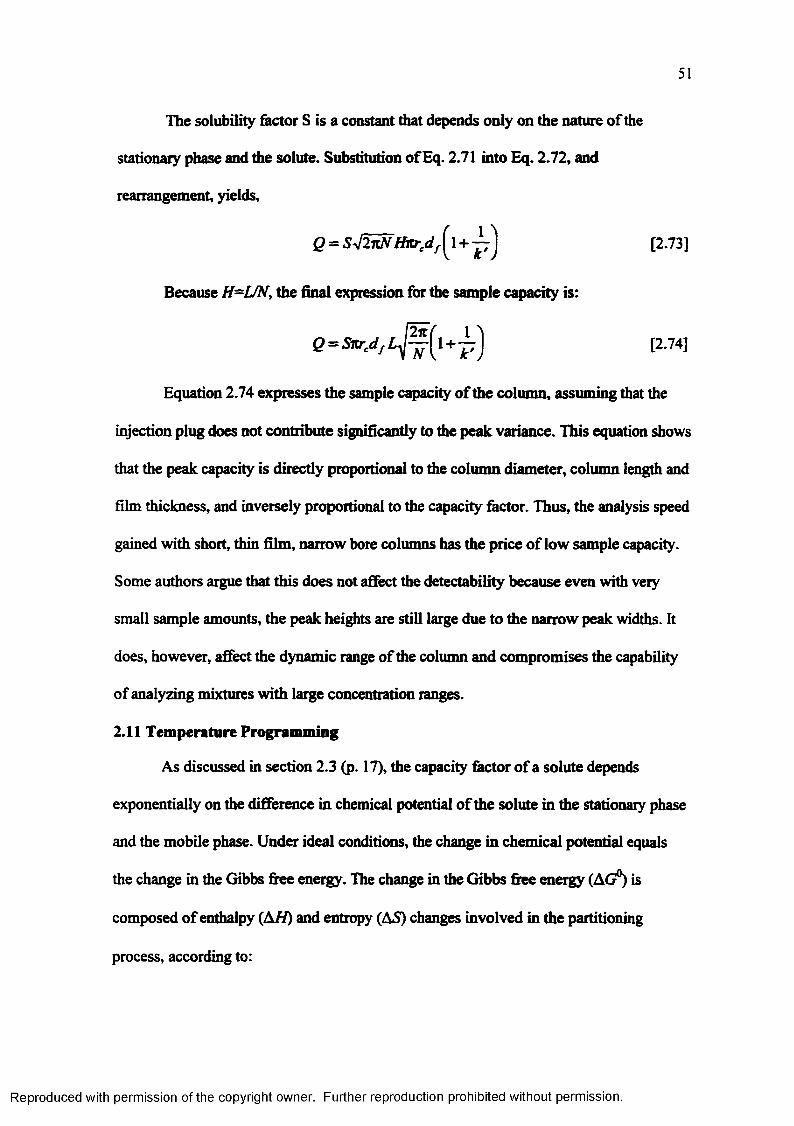
51
The solubility factor S is a constant that depends only on the nature o f the
stationary phase and the solute. Substitution o f Eq. 2.71 into Eq. 2.72, and
rearrangement, yields,
Equation 2.74 expresses the sample capacity o f the column, assuming that the
injection plug does not contribute significantly to the peak variance. This equation shows
that the peak capacity is directly proportional to the column diameter, column length and
film thickness, and inversely proportional to the capacity factor. Thus, the analysis speed
gained with short, thin film, narrow bore columns has the price o f low sample capacity.
Some authors argue that this does not affect the detectability because even with very
small sample amounts, the peak heights are still large due to the narrow peak widths. It
does, however, affect the dynamic range of the column and compromises the capability
of analyzing mixtures with large concentration ranges.
2.11 Temperature Programming
As discussed in section 2.3 (p. 17), the capacity factor o f a solute depends
exponentially on the difference in chemical potential o f the solute in the stationary phase
and the mobile phase. Under ideal conditions, the change in chemical potential equals
the change in the Gibbs free energy. The change in the Gibbs free energy (AG°) is
composed of enthalpy (A//) and entropy (AS) changes involved in the partitioning
process, according to:
Q = Sj2nN H itred [2.73]
Because H=L/N, the final expression for the sample capacity is:
[2-74]
Reproduced with permission of the copyright owner. Further reproduction prohibited without permission.

52
A*i,° =AG° = AH° + TAS°
Combination o f equations 2.4,2.8 and 2.75 yields:
[2.75]
* = p e x p ‘ L " ^ r ~ J = F e x p ‘AH*& T
[2.76]
where a is a constant related to the entropy o f the partitioning process. The partitioning
process resembles a vaporization process; thus, the magnitude o f the enthalpy is similar
to the enthalpy o f vaporization.
According to Trouton’s law (2.35), for most substances
__23 cal
T„ K xm ol[2.77]
where 7& is the boiling point and A t h e heat o f vaporization of the substance. The
boiling points o f the members o f a homologous series follow the empirical relationship:
Tbj =c, + c2n, [2.78]
where c/ and ci are constants that depend on the homologous series, and n, is the number
of carbon atoms of the compound. For n-alkanes larger than n-C6, cj = -95, and q =
27.3.
From equations 2.76,2.77, and 2.78, the following approximate relationship
between the capacity factor and the carbon number can be established:
23(c, +c2nt)* ,'= p ex p - [2.79]
This relationship shows that samples with relatively small boiling point or carbon
number range, cover very large intervals o f capacity factors. As a consequence, under
constant capacity factor conditions, samples o f only relatively narrow carbon number
Reproduced with permission of the copyright owner. Further reproduction prohibited without permission.
range can be separated within a reasonable amount o f time. Wide boiling point range
samples do not present good resolution over the entire sample range. Early eluting peaks
(low k ’ values) are not well separated, and high boiling point compounds do not elute, or
have excessively large retention times and peak widths, compromising detectability. For
any given temperature, only compounds with boiling points close to the column
temperature will be well separated. These difficulties in achieving separation are also
referred as the “general elution problem”. One solution to this problem is the systematic
variation o f the capacity factor of the solutes over time. This is achieved by temperature
programming in time, hi such an elution mode, at every time fraction (that corresponds
to a specific column temperature) a specific group o f solutes has the appropriate capacity
factor to undergo separation. Compounds o f lower boiling point essentially travel
unretained along the column, while higher boiling point compounds are retained at the
head of the column “waiting” for their capacity factor to be reduced (2.68).
Temperature programming is a powerful technique that allows the separation of
complex mixtures that cover over 30 carbon numbers. The most common temperature
programs are linear increases of temperature over time. For complex mixtures, multiple
linear ramp rates are not uncommon. The theory of temperature programmed gas
chromatography has been extensively elaborated by Harris and Habgood (2.69,2.70),
and Dal Nogare (2.71). The equations that govern retention time and peak widths in
temperature programmed gas chromatography do not have exact analytical solutions.
Numerous research groups have developed approximate models and numeric methods
that permit the prediction of retention times and peak widths for temperature
programmed conditions (2.72-2.85). Several commercial software packages, based on
Reproduced with permission of the copyright owner. Further reproduction prohibited without permission.
54
approximate algorithms and data derived from isothermal runs are commercially
available. Details about these methods are beyond the scope of this work.
Without detailing in the rigorous mathematical treatment of temperature
programmed GC, it is still possible to analyze qualitatively the behavior o f solutes in
temperature programmed gas chromatography. Since, for chemically similar solutes, the
heats of vaporization increase approximately linearly with the boiling points , the
capacity factors, and consequently, the retention times also increase approximately
linearly with the boiling points. However, the capacity factors decrease exponentially
with linear temperature increases. Thus, under temperature programmed conditions,
there is an approximately linear relationship between the boiling point o f the solutes of
chemically related compounds, and their retention times. In simulated distillation, this
linear relationship is used to predict the boiling point distribution o f petroleum products
from GC data (2.35).
With reference to peak widths, it can be assumed that every solute undergoes true
partitioning only for a fixed time fraction o f its residence time in the column. This time
fraction corresponds to the period when the column temperature is such that the partition
coefficient is small enough for solute migration, and large enough for solute interaction
with the stationary phase. The center o f this temperature window depends on the boiling
point of the solute and its affinity for the stationary phase; the width o f the temperature
window is similar for every compound. Consequently, under linear temperature
programming, each compound undergoes peak broadening due to resistance to mass
transfer for a fixed and equal time period. During this period, each solute has also a
similar average capacity factor. As a result, all the solutes elute from the column with
Reproduced with permission of the copyright owner. Further reproduction prohibited without permission.
55
similar peak widths. This was demonstrated by Habgood and Harris (2.69) who found
experimentally that the peak width at the retention temperature is approximately equal to
the width o f the same peak eluted in an isothermal process at the retention temperature.
The reduced peak widths o f high boiling point compounds in temperature programmed
GC has the additional advantage o f increased detectability due to the higher local
concentration o f the solute in the emerging carrier gas.
The former discussion only approximately reflects the physical phenomena that
occur under temperature programmed gas chromatography. The situation is complicated
by several factors such as the decrease in carrier gas velocity with temperature.
The efficiency o f a column during temperature programming cannot be measured
by the plate height because this value changes with temperature, and consequently, with
time. Several forms o f expressing efficiency in temperature programmed GC have been
proposed (6.86, 6.87). The methods that prevail are the measurement of resolution
between adjacent peaks (see Eq. 2.14), and the somewhat related separation number or
Trennzahl (TZ). The TZ is defined as the number o f baseline resolved peaks that would
fit between to consecutive n-alkanes. The corresponding equation reads:
t z = - - V \ - 1 [2.8°]
The temperature programming rate should be fast enough to accelerate the elution
of the last compounds within a reasonable time, and slow enough to keep appropriate
resolution.
From the perspective of a solute, the column in temperature programmed GC can
be approximated to a sequence of small isothermic segments, with the temperature of
Reproduced with permission of the copyright owner. Further reproduction prohibited without permission.
56
each segment slightly above the temperature of the previous segment. Let the
temperature o f each segment be T . Then the elution temperature is the temperature of the
last segment, T r. The time that the solute spends in each segment is;
dx etc< //=— (! + * ;) = —u
' a A H } 1+—exp——— 3 K <2>T
[2.81]
where ux is the local linear carrier gas velocity in segment dx. Under linear temperature
programming, the temperature at any time is given by
[2.82]r = r 0+rr
Thus, dT = rdt
Substitution in 2.81 yields:
[2.83]
dT dxr ux V
' a AH ^ p ex|> i s r [2.84]
and f d T
a AH 1 + —exp ——
3 v t&TJ0 U„
[2.85]
This integral does not have an exact analytical solution. Assuming that ux is constant,
and equal to the average linear gas velocity, and that T o is sufficiently low, such that the
solute does not migrate while the column is at T o , then,
A H
T ;
expA H
& T expA H
& T JA H
aL r3 u
[2.86]
From equation 2.85 it is clear that in order to keep similar elution temperatures when
working at different carrier gas velocities, the temperature programming rate has to
Reproduced with permission of the copyright owner. Further reproduction prohibited without permission.
57
change proportionally to the change in carrier gas velocity (2.64, 2.86,2.89). On the
contrary, i f the column length is increased, an equivalent decrease in the temperature
program m ing rate maintains similar elution temperatures, hi other words, in order to
keep the elution temperature constant, the ratio Lr/u must stay constant. This means
that a similar interval o f capacity factors is covered during the flow of one complete
elution volume through the column. The value o f Lrju is ideally selected such that each
compound elutes at its ideal elution temperature, close to its boiling point. Blumberg
(2.89) derived a practical rule o f thumb from the dependence between retention
temperature, flow, column length, heat o f vaporization and boiling point, that states that
the temperature programming rate should not exceed 25°C per hold-up time.
The previous results have important implications in fast gas chromatography.
Since the linear carrier gas velocities are very fast, and the columns short, very high
temperature programming rates may be required. The required rates are often beyond the
capabilities o f commercial GCs.
One additional advantage of temperature programming, often overlooked, and
particularly useful in fast GC of semi-volatile compounds is the ability to focus the
sample and reduce the effect of the injection band upon the peak width. Because the
capacity factors o f the solutes are high at the injection temperatures, they do not migrate
significantly during the injection process. As seen in Eq. 2.59, the contribution o f the
extra-column effects to the plate height decreases with the square of the capacity factor.
2.12 Fast Gas Chromatography TodayDesty (2.2) had recognized the reduction o f the column diameter as an effective
way to dramatically reduce the analysis speed more than 30 years ago. This fact did not
Reproduced with permission of the copyright owner. Further reproduction prohibited without permission.
58
receive much attention until the early 1980s, when Shutjes and coworkers (3.66)
demonstrated it in theoretical derivations, and practical applications. Even though
narrow bore columns permit the analysis o f a sample in a fraction of the time required
with standard columns, their use has not gained wide acceptance for routine analysis to
this date. The major limitation is the lack o f suitable commercially available
instrumentation. Varian markets an accessory for the sample injection in fast GC,
developed originally by Sacks and coworkers (2.90). However, the rest of the instrument,
particularly the data acquisition rate and maximum temperature programming rate
capability, limit the scope of the device. MTI offers a miniaturized gas chromatograph
optimized for fast GC (2.91). This instrument is suitable only for the analysis of volatile
compounds in gaseous samples. Hewlett-Packard’s latest GC, the 6890, has a fast
automatic split injector and fast electrometer compatible with fast GC; however, the
maximum temperature programming rate is still limited to 2°C/s (2.92). A
multidimensional GC recently developed by Thermedics has ultrafast temperature
programming capabilities. This instrument, however, is also fairly expensive, complex,
and requires very large amounts of power for its operation (2.93).
Fast gas chromatography is the method o f choice for the analysis o f mixtures in
short analysis times. To make the technique accessible to routine analysis, instrumental
developments are still needed. In the present dissertation, alternate designs for very fast
heating ramps, and suitable injection devices for portable instruments were developed
and evaluated. The approach was not towards the highest column efficiency, but towards
a compromise between efficiency, power consumption, sensitivity, applicability, and
practical feasibility.
Reproduced with permission of the copyright owner. Further reproduction prohibited without permission.
59
2.13 References for Chapter 22.1 Irving, H. M. N. H.; Freiser, H.; West, T. S. (Eds.) “Compendium of Analytical
Nomenclature. Definitive Rules 1977.” International Union o f Pure and Applied Chemistry - Analytical Division; Pergamon, Oxford - UK, 1978.
2.2 Ettre, L. S.; Zlatkis, A. (Eds.), “75 Years of Chromatography. A Historical Dialogue”, Elsevier, Amsterdam, 1979.
2.3 Tswett, M.; Ber. Deut. Botan. Ges. 1906,24, 316,384.
2.4 Tswett, M. S.; “Chromatographic Adsorption Analysis. Selected Works,” Berezkin, V. G. (compiler); Masson, M. R. (translation Ed.); Ellis Horwood, Chichester-UK, 1990.
2.5 Kuhn, R.; Winterstein, A.; Lederer, E.; Z. physiol, chem. 1931,197,141.
2.6 Zechmeister, L.; Cholnoky, L. V.; “Principles and Practice of Chromatography”, Wiley, New York, 1943.
2.7 Tiselius, A.; Ark. Kemi, Mineral. Geol. 1943,16A (18).
2.8 Claesson, S.; Ark. Kemi, Mineral. Geol. 1946, 23A (1).
2.9 Turner, W. C.; Natl. Petrol. News 1943, 35, 234.
2.10 Phillips, C. S. G.; Disc. Faraday Soc. 1949, 7,241.
2.11 Clough, K. H.; Petrol. Engr. 1955,27,686
2.12 Cremer, E.; Prior; F. Z. Elektrochem. 1951, 55, 66.
2.13 Cremer, E.; Muller; MikrochemJMikrochim Acta 1951,36/37, 553.
2.14 Cremer, E.; Muller; Z. Elektrochem. 1951, 55, 217.
2.15 Martin, A. J. P.; Synge, R. L. M.; Biochem. J. 1941, 35, 1358.
2.16 James, A. T.; Martin, A. J. P.; Biochem. J. 1952, 5 0 ,679.
2.17 Ray, N. H.; J. Appl. Chem. 1954,4, 21, 82.
2.18 Janak, J.; Czechoslovak Patent No 83,992 (filed: September 20,1952; issued: February 1, 1955).
2.19 Van Deemter, J. J.; Zuiderweg, F. J.; Klinkenberg, A.; Chem. Eng. Sci. 1956,5, 271.
Reproduced with permission of the copyright owner. Further reproduction prohibited without permission.
60
2.20 Golay, M. J. E.; in “Gas Chromatography (1957 Lansing Symposium)”, Coates, V. J.; Noebels, H. J.; Fagerson, I. S., Eds., Academic Press, New York 1958, pp. 1-13.
2.21 Golay, M. J. E., in “Gas Chromatography (1958 Amsterdam Symposium)”, Desty, D. H., ed., Butterworths, London, 1958, pp. 36-55.
2.22 McWilliam, I. G.; Dewar, R. A., in “Gas Chromatography (1958 Amsterdam Symposium)”, Desty, D. H., ed., Butterworths, London, 1958, pp. 142-152.
2.23 Harley, J.; Nel, W.; Pretorius, V.; Nature (London) 19S8,181,171.
2.24 Lovelock, J. E., J. Chromatogr. 1958,1, 35.
2.25 Lovelock, J. E., Lipsky, S. K.,J. Amer. Chem. Soc. 1960,82,431.
2.26 Desty, D. H.; Haresnape, J. N.; Whyman, B. H. F.;Anal. Chem. 1960,32, 302.
2.27 Dandeneau, R.; Zerenner, E. H.; J. High Resol. Chromatogr. Chromatogr. Commun., 1979,2,351.
2.28 Griffiths, J.; James, D. H.; Phillips, C. S. G. Analyst 1952, 77, 897.
2.29 Dal Nogare, S.; Bennett, C. E. Anal. Chem: 1958,3 0 ,1157.
2.30 Dal Nogare, S.; Harden, J. C. Anal. Chem. 1959, 3 1 ,1829.
2.31 Giddings, J. C.; “Dynamics of Chromatography”, M. Dekker, New York, 1965.
2.32 Gaspar, G.; Annino, R.; Vidal-Madjar, C.; Guichon, G. Anal. Chem. 1978, 50, 1512.
2.33 Overton, E. B.; Dharmasena, H. P.; Ehrmann, U.; Camey, K. R. Field Anal. Chem. Technol. 1996, / , 87-92.
2.34 Keulemans, A. I. M.; “Gas Chromatography”, Reinhold Publishing, New York, 1960, pp. 106-153.
2.35 Purnell, H.; “Gas Chromatography”, Wiley, New York 1962, pp. 73-205.
2.36 Dal Nogare, S.; Juvet, R. S. Jr.; “Gas-Liquid Chromatography. Theory and Practice”, Interscience, New York 1962, pp. 55-102
2.37 Giddings, J. C. “Dynamics of Chromatography. Part I. Principles and Theory”; Chromatographic Science Series; Giddings, J. C.; Keller, R. A. (eds.); Vol. I; Marcel Dekker, New York, 1965.
2.38 Littlewood, A. B.; “Gas Chromatography. Principles, Techniques, and Applications” 2nd Ed.; Academic Press, New York, 1970; pp. 144-229
Reproduced with permission of the copyright owner. Further reproduction prohibited without permission.
61
2.39 Lee, M. L.; Yang, F. J.; Bartle, K. D.; “Open Tubular Colunm Gas Chromatography. Theory and Practice” Wiley-interscience, New York, 1984; pp. 14-49.
2.40 Jonsson, J. A. (Ed.); “Chromatographic Theory and Basic Principles”; Chromatographic Science Series, Vol. 38; Marcel Dekker, New York, 1987.
2.41 Giddings, J. C.; “Unified Separation Science”; Wiley-Interscience, New York, 1991.
2.42 Poole, C. F.; Poole, S. K.; “Chromatography Today1*, Elsevier, Amsterdam, 1991, pp. 1-105.
2.43 Robards, K.; Haddad, P. R.; Jackson, P. E.; “Principles and Practice of Modem Chromatographic Methods” Academic Press, London, 1994; pp. 35-74.
2.44 Grant, D. W.; “Capillary Gas Chromatography*’; Separation Science Series; Scott, R. P. W.; Simpson, C.; Katz, E. D. (eds.), Wiley, Chichester-UK 1996, pp. 1-51.
2.45 Hinshaw, J. V. LC -G C1995,13, 792-798.
2.46 Craig, L. C.J. Biolog. Chem. 1944,155, 519.
2.47 Peters, K. Ind. Eng. Chem. 1922,14,476.
2.48 Freund, J. F.; Wilson, W. J.; “Statistical Methods”; Academic Press, San Diego, CA 1993, pp. 72.
2.49 Glueckauf, E. Trans. Faraday Soc. 1955,51, 34.
2.50 Klinkenberg, A. Sjenitzer, F.; Chem. Eng. Sci. 1956, 5 ,258.
2.51 Khan, M. A.; In “Gas Chromatography 1958”; Desty, D. H., (Ed.), Butterworths, London 1958, p. 36-55.
2.52 Berngard, A. K.; Blomberg, L. G.Anal. Chem. 1989, 6 1 ,2165-2171.
2.53 Giddings, J. C. Anal. Chem. 1964,36,741.
2.54 Arnold, J. H. Ind Eng. Chem. 1930,2 2 ,1091.
2.55 Gilliland, E. R. Ind. Eng. Chem. 1934,26 ,681.
2.56 Fuller, E. N.; Schettler, P. D.; Giddings, J. C. Ind. Eng. Chem. 1966,5 8 ,19-27.
2.57 Ingraham, D, F.; Shoemaker, C. F.; Jennings, W. J. High Resol. Chromatogr. 1982, 5 , 227-235.
2.58 Leclercq, P. A.; Cramers, C. A .J. High Resol. Chrom. 1985,8, 764-771
Reproduced with permission of the copyright owner. Further reproduction prohibited without permission.

62
2.59 Blumberg, L. M. J. C hrom atogr1992,596 ,1-13.
2.60 Blumberg, L. M .J. High Resol. Chromatogr., 1993,16, 31-37.
2.61 Blumberg, L. M.J . Chromatogr. 1993, 637 ,119-128.
2.62 Giddings, J. C. Sep. Sci. 1969, 4, 181.
2.63 Caspar, G.; Vidal-Madjar, C.; Guichon, G. Chromatographia 1982,1 5 ,125.
2.64 Tijssen, R.; van den Hoed, N.; van Kreveld, M. E. Anal. Chem. 1987,5 9 ,1007- 1015.
2.65 Hyver, K. J.; PhiUips, R. J.J. Chromatogr. 1987,399,33-46.
2.66 Schutjes, C. P. M.; Vermeer, E. A.; Rijks, J. A.; Cramers, C. A. J. Chromatogr. 1982,25 3 ,1-16.
2.67 Gaspar, G. J. Chromatogr. 1991,556, 331-351.
2.68 Giddings, J. C.J. Chem. Educ. 1962,39, 569-573.
2.69 Habgood, H. W.; Harris, W. E. Anal. Chem. 1960,32,767.
2.70 Habgood, H. W.; Harris, W. E. Anal. Chem. 1960,3 2 ,1206.
2.71 Dal Nogare, S.; Langelois, W. E. Anal. Chem. 1960,32, 767-770.
2.72 Saxton, W. L. J. Chromatogr. 1984, 312,59-68.
2.73 Saxton, W. L.J. High Resol. Chromatogr. 1984, 7,245-251.
2.74 Cavalli, E. J.; Guinchard, C. J. Chromatogr. Sci. 1995,33,370-376.
2.75 Snijders, H.; Janssen, H. G.; Cramers, C. J. Chromatogr. A, 1995, 718, 339-355.
2.76 Akhporhonor, E. E.; Le Vent, S.; Taylor, D. R.J. Chromatogr. 1987,405,67.
2.77 Akhporhonor, E. E.; Le Vent, S.; Taylor, D. R.7. Chromatogr. 1989,463, 271.
2.78 Akhporhonor, E. E.; Le Vent, S.; Taylor, D. R.J. Chromatogr. 1990,504, 269.
2.79 Al-Baijari, T. I.; Le Vent, S.; Taylor, D. K.J. Chromatogr. A, 1994, 683, 367-76.
2.80 Sibley, E. M.; Eon, C.; Karger, B. L. J. Chromatogr. Sci., 1973,11,309-319.
2.81 Bartu, V. J. Chromatogr., 1983,260,255-264.
Reproduced with permission of the copyright owner. Further reproduction prohibited without permission.
63
2.82 Bautz, D. E.; Dolan, J. W.; Raddaz, W. D.; Snyder, L. R. Anal. Chem., 1990, 62, 1560-67.
2.83 Curvers, A.; Rijks, J.; Cramers, C.; Knauss, K.; Larson, P. J. High Resol. Chromatogr., 1985,8 ,611-617.
2.84 Hawkes, S. J. J. Chromatogr. A, 1996, 753, 147-150.
2.85 Dose, E. V. Anal. Chem. 1987,5 9 ,2414-2419.
2.86 Habgood, H. W.; Harris, W. E. Anal. Chem., 1960,32,450-453.
2.87 Grob, K. Jr.; Grob, K. J. Chromatogr., 1981,207,291-297.
2.88 Grant, D. W., Hollis, M. G. J. Chromatogr. 1978,158,3-19.
2.89 Blumberg, L.; personal communication, Hewlett-Packard Corp., Analytical Division, Little Falls, DE; Oct. 1995.
2.90 Klemp, M.; Peters, A.; Sacks, R. Environ. Sci. Technol., 1994,28, 369A-376A.
2.91 Lee, G.; Ray, C.; Siemers, R.; Moore, R. Am. Lab. 1989,110,21.
2.92 HP-6890 Gas Chromatograph, Hewlett-Packard Corp. Analytical Division, Little Falls, DE, 1995.
2.93 Flash 2D Analizer™ System; Thermedics Detection Inc., 220 Mill Road, Chelmsford, MA 01824.
Reproduced with permission of the copyright owner. Further reproduction prohibited without permission.
CHAPTER 3
PRELIMINARY COLUMN AND INSTRUMENT EVALUATION FOR FAST GC
3.1 Introduction
The previous chapter discussed some theoretical aspects o f gas chromatography,
with special emphasis on fast GC. It demonstrated that the fastest analysis times could be
obtained theoretically with short, narrow bore, thin film columns. However,
considerations such as sample capacity, pressure drop, and extra-column effects limit the
minimum practical column diameter, length, and film thickness.
Clearly several factors determine the selection o f the “optimal practical” column
for fast portable GC. This chapter presents the evaluation o f several columns for their
potential practical use in portable fast gas chromatography. Efficiency, analysis speed,
instrumental requirements, sample capacity, and their activity towards polar compounds
were compared. The objective was to assess the limitations of conventional
instrumentation, and, considering these limitations, to determine a range o f column
parameters suitable for the on-site analysis o f volatile and semi-volatile compounds.
3.2 Preliminary Column Selection, Practical Considerations and Constraints
3.2.1 Column Diameter
Equation 2.70 predicts that the analysis time is proportional to the square of the
column diameter; thus, narrow bore columns are best suited for fast GC. The smallest
column diameter compatible with conventional instrumentation is 0.1 mm. Annino (3.1)
demonstrated that, in the presence of the extra-column effects introduced by
conventional GC injectors and detectors, 0.1 mm diameter columns do not represent any
significant speed advantage over 0.2 mm diameter columns o f equivalent efficiency. For
64
Reproduced with permission of the copyright owner. Further reproduction prohibited without permission.
65
similar performance, however, the ratio o f the column length to the column diameter
must remain approximately constant (see Eq. 2.69). Thus, wider bore columns must be
longer to keep the desired resolution. While column length is not a limiting factor in
conventional GC, it constitutes an important factor in portable GC. The physical space
occupied by a column increases in direct proportion to its length. What is more
important, when the column is directly heated, the heat dissipation, and consequently, the
power consumption, increase in direct proportion to the column length. Therefore, it is
desirable to keep the column as short as possible.
In consideration of the above mentioned factors, we compromised between
speed, instrumental requirements, and column length considerations, and selected a
column diameter o f 0 . 1 mm.
3.2.2 The Extra-column Effects
As described in chapter 2, the contributions from the injector and detector to the
peak width increase the plate height in direct proportion to the square o f the carrier gas
velocity, and reduce the optimum carrier gas velocity. Much of the work presented in this
dissertation was performed with conventional GC instrumentation. The total contribution
to the peak width introduced by the injector and the detector was unknown; thus,
optimum column pressure ranges could not be derived from theoretical considerations.
Van Deemter plots of the columns served to establish the pressure windows that yielded
the highest working efficiency for each column.
3.2.3 Column Length
Longer columns provide a larger number of theoretical plates, and consequently
higher resolution, with the tradeoff of increased analysis times (see Eq. 2.25, 2.65 and
Reproduced with permission of the copyright owner. Further reproduction prohibited without permission.
66
2.70). They also reduce the contribution of extra-column effects to the efficiency erosion
(see Eq. 2.59). However, the large pressure drops necessary to provide the fast carrier gas
velocities needed with narrow bore columns rapidly offset the advantage o f long
columns. Additionally, as explained in section 3.2.1 (p. 64), in portable GC, the column
length has important consequences in space and power requirements. Furthermore, in
portable GC, the use o f high inlet pressures with hydrogen as carrier gas represents a
potential hazard. Thus, for safety reasons, we limited the upper column head pressure to
30 psi. This value corresponds to the maximum column head pressure of most laboratory
GCs. For 0.1-mm i.d. columns, the maximum column length is limited by the maximum
inlet pressure to approximately 3-4 meters. To assess the effect o f the column length, 1,2
and 3 meter columns were evaluated for efficiency and analysis times.
3.2.4 Film Thickness
Only very thick stationary phase films (>0.5 pm) cause a significant deterioration
of the column efficiency due to resistance to mass transfer in the stationary phase.
However, analysis times increase in direct proportion to the capacity factor (Eq. 2.12 and
2.70). The capacity factor increases with decreasing phase ratio (Eq. 2.8), which, in turn,
decreases with the film thickness. Consequently, the analysis times increase in direct
proportion to the film thickness, for a given resolution and separation factor. As a result,
thin film columns seem preferable for fast analysis.
On the other hand, for a fixed column diameter and length, the sample capacity
increases in direct proportion to the film thickness (see Eq. 2.74). Thus, thicker films
provide a larger sample capacity. Consequently, larger concentration ranges o f solutes
can be separated without peak distortion. In addition to the advantage o f sample capacity,
Reproduced with permission of the copyright owner. Further reproduction prohibited without permission.
67
thicker films trap more efficiently the incoming solutes at the head of the column,
reducing the relative contribution o f the extra-column effects to the plate height (see
Eq. 2.59).
To evaluate the importance of the factors associated with the film thickness, 0.1
mm i.d columns with a 0.1 pm, and 0.4 pm stationary phase films were tested.
3.2.5 The Multicapillary Column
One o f the main disadvantages o f narrow bore capillary columns is their reduced
sample capacity. The multicapillary column represents a potential solution to this
limitation. This column was developed in Russia, and is commercialized in USA by
MSA (3.2) and Alltech (3.3). It consists o f a 1-m long bundle of approximately 900
parallel glass columns, each with an internal diameter o f 0.04 mm, and a 0.2 pm thick
stationary phase film. In theory, this column provides the efficiency and speed o f 40 pm
i.d. columns, with a 900 fold increase in sample capacity. The increased solute
concentration range and sensitivity of the multicapillary column seemed very attractive
for a fast portable GC. Therefore, we evaluated the practical performance o f this novel
column.
3.3 Experimental
All columns were evaluated in an HP 5890 gas chromatograph, with a
split/splitless injector, and a flame ionization detector. The original electrometer was
replaced by an in-house built electrometer that allowed sampling rates up to 100Hz. The
instrument was controlled from the front panel, while the data was collected using a
Macintosh Classic II computer. The software used for data acquisition was an in-house
Reproduced with permission of the copyright owner. Further reproduction prohibited without permission.
68
developed chromatographic software package (M2001; Institute for Environmental
Studies, LSU).
The carrier gas used for the column evaluation was helium. Samples were
injected manually, using the split mode with high split ratios (>1000:1). For most
columns, a van Deemter plot was obtained for n-Cu to n-Cn, at 150°C. The sample used
was an internal standard mixture for simulated distillation (Separation Science; Gulf
Breeze, FL) that contained 1% w/w of each of the n-paraffins in hexane. The column’s
activity toward polar compounds was evaluated with a column performance test mixture
(J&W; Folsom, CA), and a mixture of DMMP, DEMP and DEMP (provided by Midwest
Research Institute; Kansas City, KS).
All columns had a 5%pheny-methyl silicone stationary phase. The following
columns were evaluated:
1. 3m x 0.1 mm i.d., 0.1 pm film (Quadrex; New Haven, CT)
2. 3m x 0.1 mm i.d., 0.1 pm film (J&W)
3. 3m x 0.1 mm i.d., 0.4 pm film (Quadrex)
4. 2m x 0.1 mm i.d., 0.4 pm film (Quadrex)
5. lm x 0.1 mm i.d., 0.4 pm film (Quadrex)
For each column, the approximate theoretical van Deemter curve was calculated
with an Excel spreadsheet (Microsoft, Seattle, WA), and compared with the
experimental data. For the van Deemter plot models, an approximate value for the binary
diffusion coefficients in the gas phase was used. This value was taken from the literature
(3.4), and not corrected for type of compound and temperature. The variance introduced
by the extra-column effects was estimated from the experimental van Deemter plot o f the
Reproduced with permission of the copyright owner. Further reproduction prohibited without permission.
69
1 m x 0.1 mm, 0.4pm film column. For this, the plate height values were multiplied by
the corresponding average linear carrier gas velocities. This converted the Golay-
Giddings-Gaspar equation into a third degree polynomial function o f u. Least square
regression analysis of ( Hx u) vs. u was used to estimate the contribution o f the
extra-column effects to the observed plate height. SAS System for Windows v. 6.12 (The
SAS Institute, Cary, NC) was used for the regression analysis.
3.4 Results and Discussion
3.4.1 Column Efficiency and Extra-column Effects
Figure 3.1 shows the van Deemter plot obtained for n-Cu (k= 10) and n-C\$
(k = 25) with a 1 m long, 0.4 pm film column. The experimental data covered only the
region of the van Deemter plot where the resistance to mass transfer and the
extra-column effects dominated the peak broadening process. The manual pressure
control o f the HP5890 did not permit linear carrier gas velocities below 40 cm/s for this
column.
The optimal carrier gas velocity window obtained experimentally forn-Cn and
n-C 17 was between 40 and 60 cm/s, corresponding to a column head pressure between 6
and 8 psi (with helium carrier gas). The theoretical value is approximately 100 cm/s;
thus, the extra-column effects reduced the maximum analysis speed by 50%. More
important than the reduction in uop, itself, was the exponential deterioration in column
efficiencies at linear carrier gas velocities above uopt. It is a common practice in GC to
operate at carrier gas velocities above u^t to increase analysis speed. In theory, this can
be done with narrow bore columns over a very wide range o f carrier gas velocities
without affecting the resolution significantly. In this system, the practice would cause
Reproduced with permission of the copyright owner. Further reproduction prohibited without permission.

70
detrimental resolution losses, especially for solutes with capacity factors below 25, as
seen in figure 3.1. For solutes with larger capacity factors, carrier gas velocities above
uopt can be used to speed up analysis times without detrimental efficiency erosion.
The Golay-Giddings-Gaspar equation (Eq. 2.59) can be expressed in the
simplified form:
HmaI= ~ + C u -h D u 2 [3.1]u
where B /u represents the contribution from the axial diffusion to the plate height, Cu
represents the contribution of the combined resistance to mass transfer terms to the plate
height, and D u2 represents the contribution from extra-column effects to the plate
height. The dependence o f the axial diffusion term on the inverse of the linear carrier gas
velocity complicated the regression fit o f the experimental data points to the Golay-
Giddings-Gaspar model, and consequently, the statistical estimation of the coefficients of
the model. Multiplication of the experimental plate height values by the corresponding
carrier gas velocities converted Eq. 3.1 into a simple third degree polynomial equation,
according to:
HwaiU — B + C u1 + Du3 [3.2]
Least square regression of the resulting Htotalu versus u values permitted a
rough estimation o f the coefficients B, C, and D. From the value of A the variance
introduced by the injector and detector to the total peak variance was estimated.
For the data set obtained for «-Cu, the coefficient o f the cubic term was
6x1 O'6 s2/cm with a standard error of 3x1 O'6 s2/cm. Application of Eq. 2.59 yielded an
estimated value of 0.07 ± 0.03-s2 for the total variance introduced by the injection and
Reproduced with permission of the copyright owner. Further reproduction prohibited without permission.
71
detection system to the peak variance. The corresponding time constant was then
approximately 0.3 ± 0 . 1 seconds. The order o f magnitude o f this value is comparable to
the values found by Hyver and Phillips (3.5) for a similar instrumental set-up (0.70
seconds for manual split injection).
It is noteworthy that the column efficiency at the optimum carrier gas velocity
was not significantly reduced as a result of the extra-column effects. The minimum plate
height found for all columns was approximately 0 . 1 mm, which corresponded to the
theoretical Hmin o f the column (see Eq. 2.64).
In conclusion, the maximum efficiency of the 100 pm i.d. columns evaluated
were close to the theoretically expected values. However, the optimum linear carrier gas
velocities, as well as the ‘useful’ carrier gas velocity windows were significantly smaller
than expected, as a result o f extra-column effects. The estimated time constant of the
injection and detection system was 0.3 ±0.1 s.
The efficiency loss resulting from the non-ideal injection band mainly affected
solutes with low capacity factors. Solutes with high capacity factors presented much
flatter van Deemter curves. One alternative to offset the effect o f the injection band on
the peak width is temperature programmed GC (TPGC). In TPGC, most solutes have
high capacity factors at the initial column temperature. However, without the use of
sub-ambient temperatures, solutes of higher volatility than n-C io still undergo significant
peak broadening due to the injection band in short, narrow bore columns. Even with
temperature programming, the time constant and sampling rate o f the detector must be
optimized to avoid further efficiency erosion at high linear carrier gas velocities.
Reproduced with permission of the copyright owner. Further reproduction prohibited without permission.
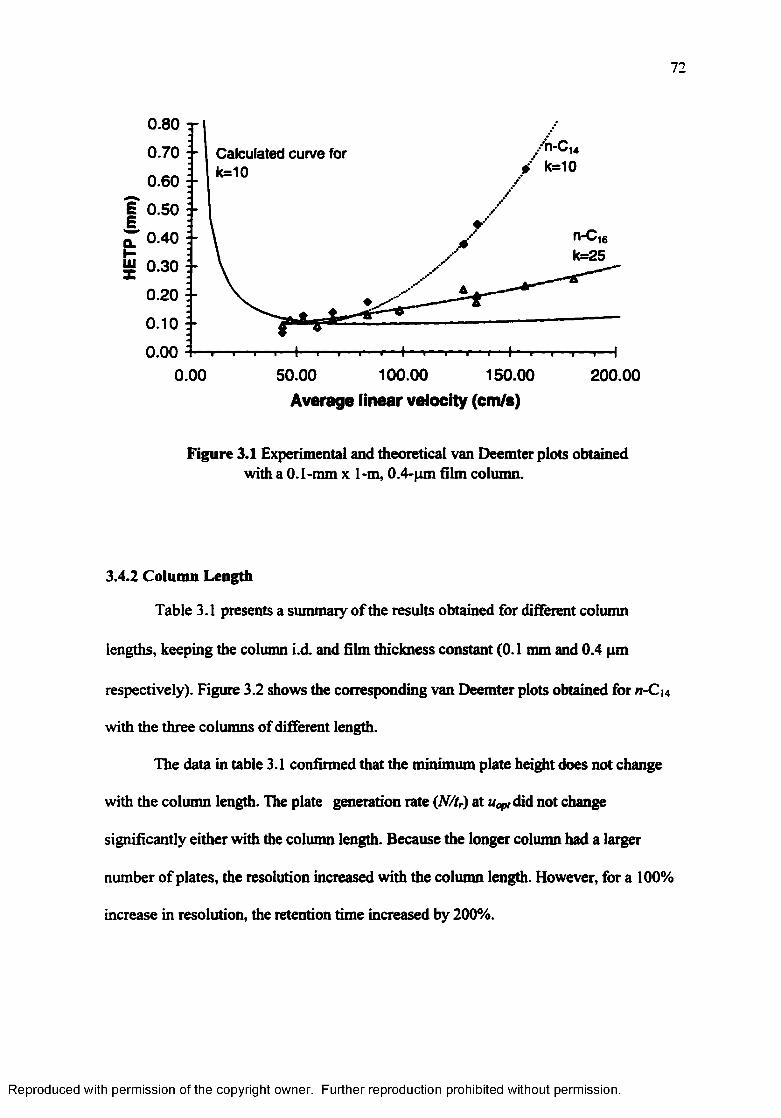
72
0.80
0.70 Calculated curve for k= 1 00.60
“l 0.50
0-40
0.30H*UlX
0.20
0.10
0.00100.00 150.000.00 50.00 200.00
Average linear velocity (cm /s)
Figure 3.1 Experimental and theoretical van Deemter plots obtained with a 0.1-mm x 1-m, 0.4-pm film column.
3.4.2 Column Length
Table 3.1 presents a summary of the results obtained for different column
lengths, keeping the column i.d. and film thickness constant (0.1 mm and 0.4 pm
respectively). Figure 3.2 shows the corresponding van Deemter plots obtained for n-C | 4
with the three columns of different length.
The data in table 3.1 confirmed that the minimum plate height does not change
with the column length. The plate generation rate (NZtr) at u ^ d id not change
significantly either with the column length. Because the longer column had a larger
number of plates, the resolution increased with the column length. However, for a 100%
increase in resolution, the retention time increased by 2 0 0 %.
Reproduced with permission of the copyright owner. Further reproduction prohibited without permission.

73
Table 3.1 Effect o f column length on efficiency and resolution in the presence of significant extra-column contributions. (Column i.d. 0.1mm, film: 0.4 pm 5% phenyl- methyl silicone (Quadrex))
Length 1 m 2 m 3 m
Solute n-C14k=10
n-C16k=25
n-C14k=10
n-C16k=25
n-C14k=10
U-C16k=25
uopt (cm/s) 60 60 60 60 60 60
Hmin (mm) 0 . 1 0 . 1 0 . 1 0 . 1 0 . 1 0 . 1
N/tr @ u„pt (plates/s) 460 218 516 237 580 229
tr ® uopt {cva/s) 16.8 41.3 37.4 91.7 50.0 124.9
P for Uopt (psi) 7 7 14 14 2 2 2 2
P W @ uopt(s) 0.45 1 . 0 0 0.63 1.46 0.69 1.72
R 1 0 . 1 12.5 15.6 17 19.5 19.6
The onset o f the second order increase of the plate height with the carrier gas
velocity, at u>uopf was observed also for the 2 meter column. However, this increase
seemed proportionally smaller than for the 1 m column. Furthermore, the 2 m column
presented a slightly wider ‘useful’ window o f u, where remained approximately
constant (50-90 cm/s, corresponding to 12-20 psi head pressure). Operation at 90 cm/s
permitted a 30% reduction in analysis time, without significant resolution loss.
The available pressure range limited the carrier gas velocity range covered for the
3m column. Over the interval tested, extra-column contributions to the plate height were
not observed. H remained approximately constant and close to Hmm between 60 and 100
cm/s carrier gas velocities, which corresponded to 17-30 psi head pressure. The
acceleration of analysis times in this column was therefore limited by the maximum inlet
Reproduced with permission of the copyright owner. Further reproduction prohibited without permission.
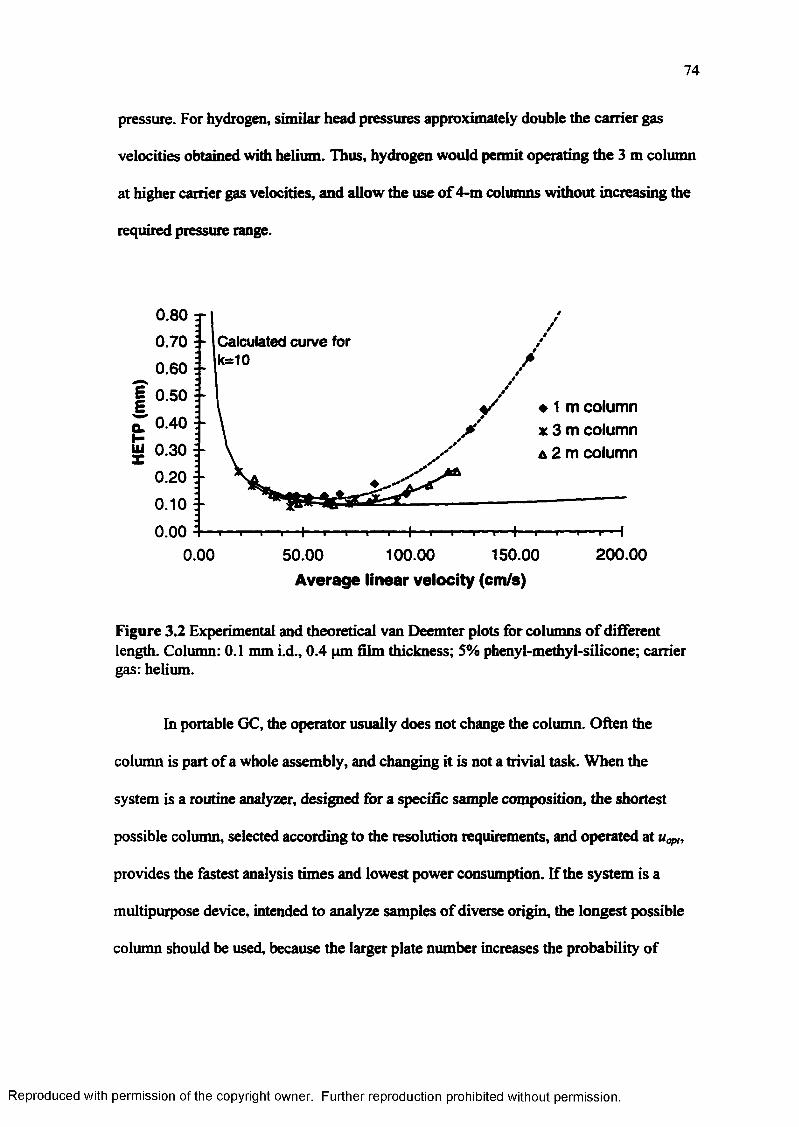
74
pressure. For hydrogen, similar head pressures approximately double the carrier gas
velocities obtained with helium. Thus, hydrogen would permit operating the 3 m column
at higher carrier gas velocities, and allow the use o f 4-m columns without increasing the
required pressure range.
0.80
0.70
0.60
*| 0.50
a 0.40
M 0.30
0.20 0.10
0.00
Calculated curve for k=10
T ~ T——1 ' ' I | »■■■■■■ I I ■ +
♦ 1 m column x 3 m column a 2 m column
0.00 50.00 100.00 150.00Average linear velocity (cm/s)
200.00
Figure 3.2 Experimental and theoretical van Deemter plots for columns o f different length. Column: 0.1 mm i.d., 0.4 pm film thickness; 5% phenyl-methyl-silicone; carrier gas: helium.
In portable GC, the operator usually does not change the column. Often the
column is part o f a whole assembly, and changing it is not a trivial task. When the
system is a routine analyzer, designed for a specific sample composition, the shortest
possible column, selected according to the resolution requirements, and operated at uop„
provides the fastest analysis times and lowest power consumption. If the system is a
multipurpose device, intended to analyze samples o f diverse origin, the longest possible
column should be used, because the larger plate number increases the probability of
Reproduced with permission of the copyright owner. Further reproduction prohibited without permission.
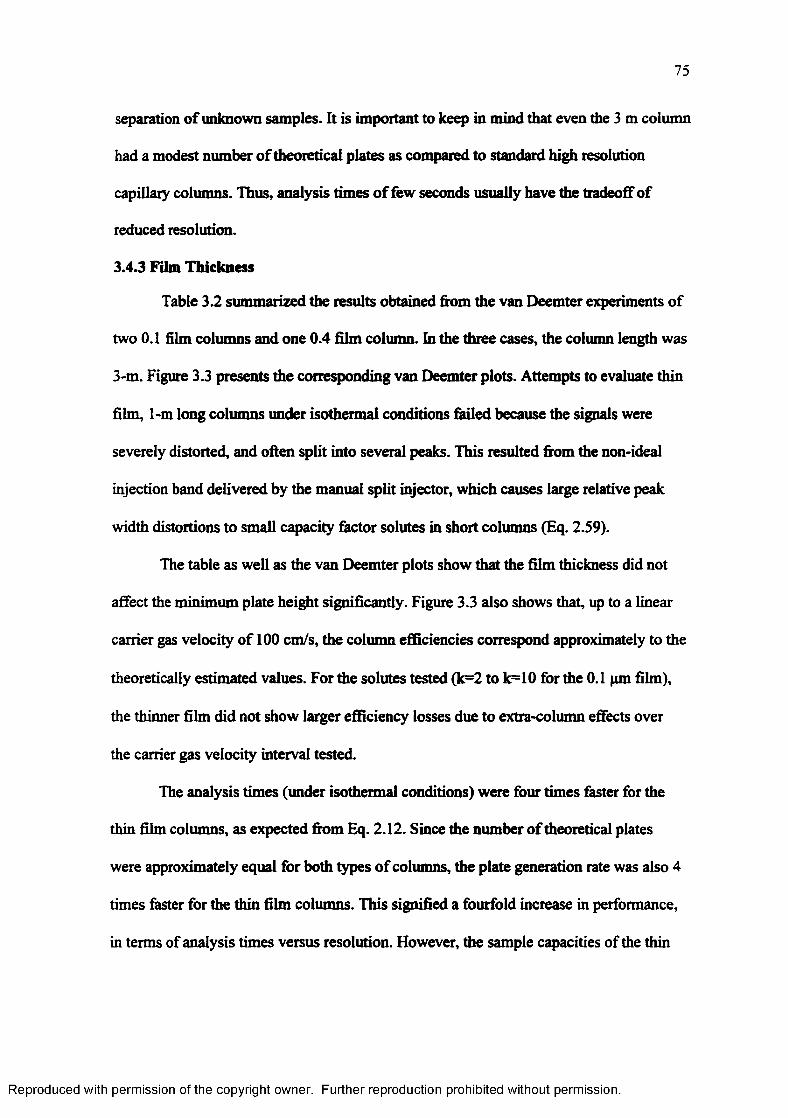
75
separation of unknown samples. It is important to keep in mind that even the 3 m column
had a modest number of theoretical plates as compared to standard high resolution
capillary columns. Thus, analysis times o f few seconds usually have the tradeoff of
reduced resolution.
3.4.3 Film Thickness
Table 3.2 summarized the results obtained from the van Deemter experiments of
two 0.1 film columns and one 0.4 film column. In the three cases, the column length was
3-m. Figure 3.3 presents the corresponding van Deemter plots. Attempts to evaluate thin
film, 1-m long columns under isothermal conditions failed because the signals were
severely distorted, and often split into several peaks. This resulted from the non-ideal
injection band delivered by the manual split injector, which causes large relative peak
width distortions to small capacity factor solutes in short columns (Eq. 2.59).
The table as well as the van Deemter plots show that the film thickness did not
affect the minimum plate height significantly. Figure 3.3 also shows that, up to a linear
carrier gas velocity of 1 0 0 cm/s, the column efficiencies correspond approximately to the
theoretically estimated values. For the solutes tested ( l r f to k=10 for the 0.1 pm film),
the thinner film did not show larger efficiency losses due to extra-column effects over
the carrier gas velocity interval tested.
The analysis times (under isothermal conditions) were four times faster for the
thin film columns, as expected from Eq. 2.12. Since the number o f theoretical plates
were approximately equal for both types o f columns, the plate generation rate was also 4
times faster for the thin film columns. This signified a fourfold increase in performance,
in terms of analysis times versus resolution. However, the sample capacities of the thin
Reproduced with permission of the copyright owner. Further reproduction prohibited without permission.
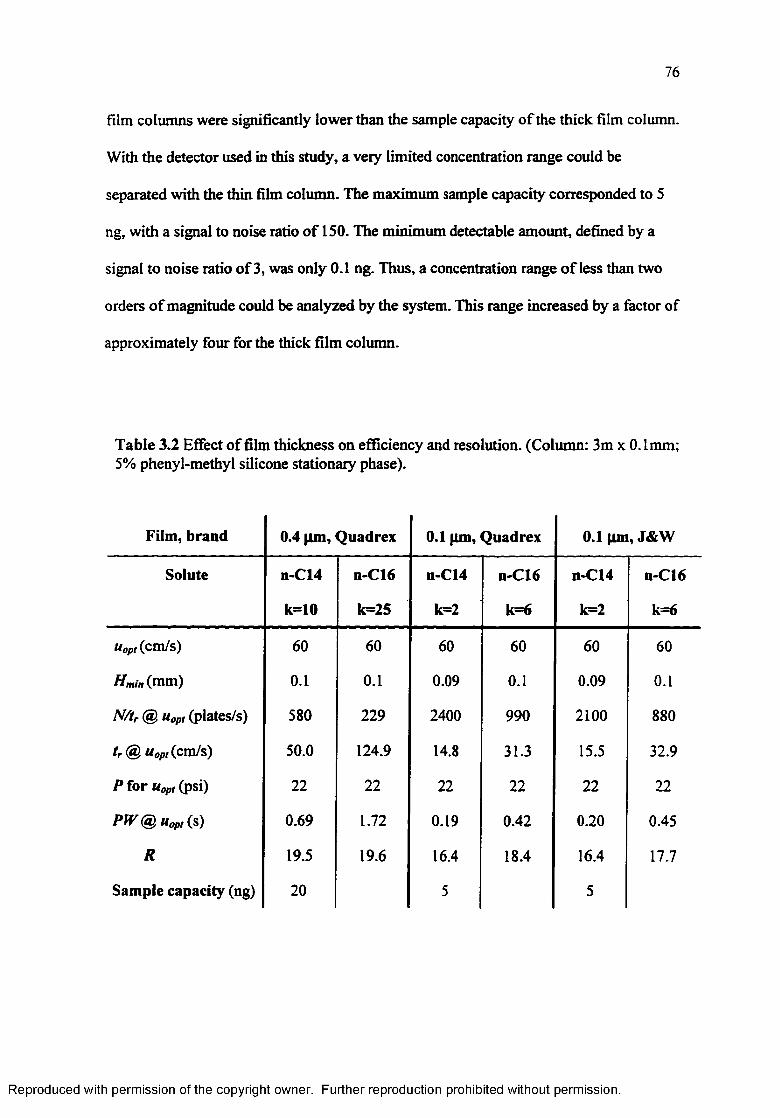
76
film columns were significantly lower than the sample capacity o f the thick film column.
With the detector used in this study, a very limited concentration range could be
separated with the thin film column. The maximum sample capacity corresponded to 5
ng, with a signal to noise ratio o f 150. The minimum detectable amount, defined by a
signal to noise ratio o f 3, was only 0.1 ng. Thus, a concentration range o f less than two
orders o f magnitude could be analyzed by the system. This range increased by a factor of
approximately four for the thick film column.
Table 3.2 Effect o f film thickness on efficiency and resolution. (Column: 3m x 0.1mm; 5% phenyl-methyl silicone stationary phase).
Film, brand 0.4 pm, Quadrex 0.1 pm, Quadrex 0.1 pm, J&W
Solute n-C14 n-C16 n-C14 n-C16 n-C14 n-C16
k= ! 0 k=25 k= 2 k= 6 k= 2 k= 6
Uopt (cm/s) 60 60 60 60 60 60
Hmin (mm) 0 . 1 0 . 1 0.09 0 . 1 0.09 0 . 1
N/tr @ u0pt (plates/s) 580 229 2400 990 2 1 0 0 880
tr @ Uopt (cm/s) 50.0 124.9 14.8 31.3 15.5 32.9
P for Uopt (psi) 2 2 2 2 2 2 2 2 2 2 2 2
PW @ Uopt (s) 0.69 1.72 0.19 0.42 0 . 2 0 0.45
R 19.5 19.6 16.4 18.4 16.4 17.7
Sample capacity (ng) 2 0 5 5
Reproduced with permission of the copyright owner. Further reproduction prohibited without permission.
0.3
0.25
E ° ’2Ea 0.15HUJX 0.1
0.05
0 ~ r ~i~ r | t 'r i H-i- t- t-H-i1 i i ■ t - r ~i~ H0.00 20.00 40.00 60.00 80.00 100.00 120.00
Average linear carrier gas velocity (cm/s)
Figure 3.3 Experimental and theoretical van Deemter plots for columns of different film thickness. Column: 3m x 0.1 mm, 5% phenyl methyl silicone; carrier gas: helium.
In conclusion, thin film columns, operated under isothermal conditions, deliver
faster analysis times while keeping similar resolution. However, for very short columns
the quality of the injection (short, narrow plugs) was critical. Therefore, of the thin film
columns, only the 3m column could be of practical use in a portable fast GC.
Because of the limited sample capacity, the thin film columns are only useful for
samples where all the analytes o f interest are in approximately equal concentrations,
unless much more sensitive detectors are used. For a general purpose instrument, thick
film columns offer more versatility.
Operation at higher column temperatures, or under temperature programmed
conditions, can accelerate the analysis times in thick film columns, with the tradeoff of
increased power consumption. For wide boiling point mixtures, separated under
temperature programmed conditions, the gains in analysis times with the thinner film
♦ df=0.4, n-Cl 6 o df=0.i (Quad.), n-Cl6 + df=0.1 (J&W), n-Cl6 — theory, df=0.4. k=10
Reproduced with permission of the copyright owner. Further reproduction prohibited without permission.

78
columns are far less substantial. As described in chapter 2 ( pp. 51 >57), in TPGC, the
analytes undergo partitioning for a relatively short fraction o f their residence time in the
column. Only the duration o f that time fraction is affected by the film thickness. The
temperature programming rate dictates the duration of the period during which the
analytes remain immobilized at the head o f the column.
150 -- ^ 130-■
^ 1 1 0 “ c 90 --§ 70 --S 50 --> 30 -S 10 - -o* -10 „
-30 :*
Figure 3.4 Relative increases in retention times and Trennzahl obtained for a 0.4 pm film column, as compared to a 0 . 1 pm film column, under temperature programmed conditions. Column: 3 m x 0.1 mm; 5% phenyl-methyl-silicone stationary phase; carrier gas: He @ 60 cm/s. Temperature program: 50°C ( 6 s) to 250°C @ 0.5°C/s.
Figure 3.4 shows the relative retention time increases (%) observed for n-Cg to
n-C20, when they were separated, under temperature programmed conditions, in a 0.4
pm film column as compared to a 0 . 1 pm column. The figure shows that even for the
most volatile compounds, the retention time differences were much smaller than under
isothermal operation. The retention times o f the least volatile compounds were only 20%
faster in the thin film column than in the thick film column. Separation efficiencies (TZ
values) were approximately 1 0 to 15% higher for the thin film column, for C 12 and
Relative RT difference (0.4um film - 0.1 um film)
Relative TZ difference (0.4um film * 0.1 um film)
1 ^
O ^ O O O O O O O O O O OS f c . I I I I I I I I I I I
V c c c c c c c c c c cQ.
Compound
Reproduced with permission of the copyright owner. Further reproduction prohibited without permission.
79
higher. These compounds had a sufficiently large capacity factor at the injection
temperature to be trapped at the head o f the column, i.e., their peak width was not
affected by the injection band.
The previous results demonstrate that TPGC permits the use o f thick film
columns without large sacrifices in analysis times and separation efficiency. Therefore,
in fast portable GC with temperature programming capabilities, thick film columns
provide the best compromise between sample capacity, operational simplicity, separation
efficiency and analysis speed.
3.4.4 The MulticapiUary Column
The maximum inlet pressure o f the HP 5890 GC (30 psi) limited the evaluation
o f the multicapillary column. The maximum carrier gas velocity obtained at 30 psi was
40cm/s, which is less than half o f the theoretically expected u0p t . Figure 3.5 shows the
portion of the van Deemter plot that was obtained with the available pressure range. It
shows a tendency of H to stabilize for carrier gas velocities between 30 and 40 cm/s. The
corresponding H m in values were between 0.13 and 0.19 mm, depending on the solute.
These values more than tripled the theoretically expected values according to Eq. 2.64.
The reduced efficiency probably resulted from the enhanced impact o f extra-column
effects to the peak width in the ultranarrow bore columns. Addition o f a time constant of
200ms (within the range determined in section 3.4.1 (p. 69) as characteristic o f the
instrumentation used) in the Golay-Giddings-Gaspar model resulted in a theoretical
H m in value o f 0.13, at a linear carrier gas velocity o f 30 cm/s. A coating efficiency
distribution among the 900 individual columns of the multicapillary column could also
cause a retention time distribution in the column, with the net result o f an increased peak
Reproduced with permission of the copyright owner. Further reproduction prohibited without permission.
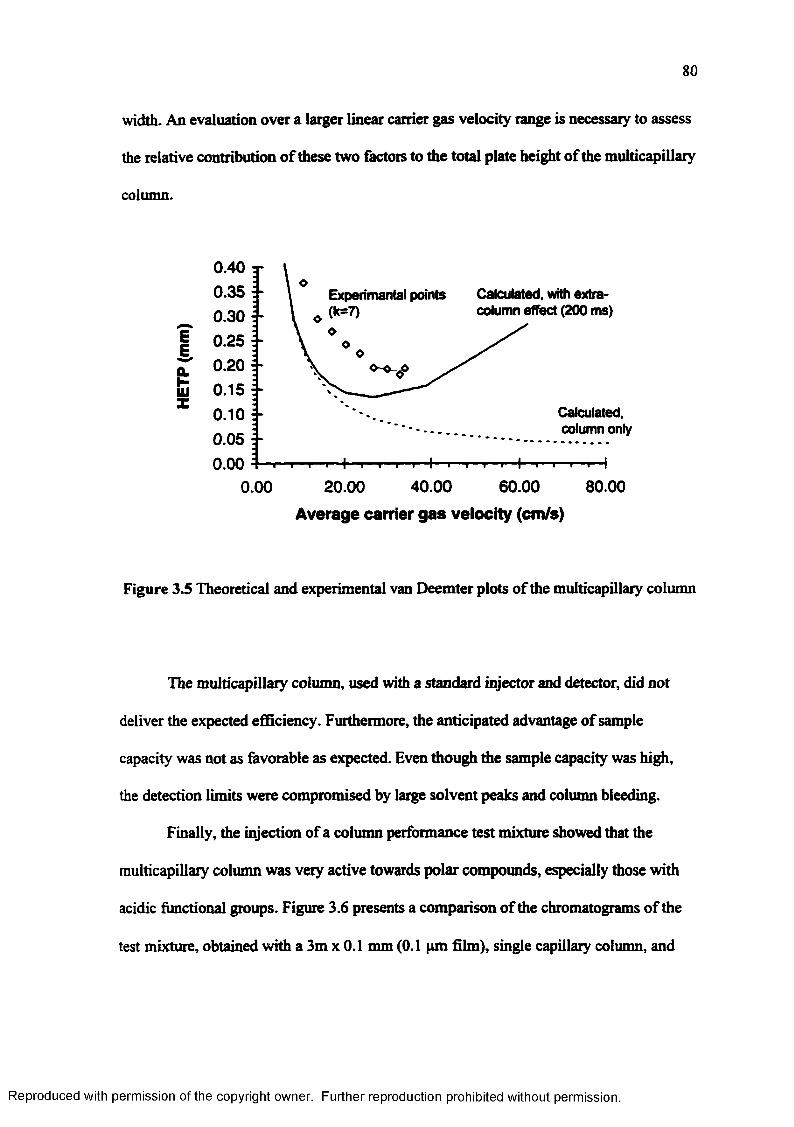
80
width. An evaluation over a larger linear carrier gas velocity range is necessary to assess
the relative contribution o f these two factors to the total plate height o f the multicapillary
column.
EE
ijjx
40.3530252015100500
0
Experimantal points Calculated, with extra*(k=7) column effect (200 ms)
Calculated, column only
r - i - T i
00 20.00 40.00 60.00 80.00
Average carrier g a s velocity (cm/s)
Figure 3.5 Theoretical and experimental van Deemter plots of the multicapillary column
The multicapillary column, used with a standard injector and detector, did not
deliver the expected efficiency. Furthermore, the anticipated advantage of sample
capacity was not as favorable as expected. Even though the sample capacity was high,
the detection limits were compromised by large solvent peaks and column bleeding.
Finally, the injection o f a column performance test mixture showed that the
multicapillary column was very active towards polar compounds, especially those with
acidic functional groups. Figure 3.6 presents a comparison of the chromatograms of the
test mixture, obtained with a 3m x 0.1 mm (0.1 pm film), single capillary column, and
Reproduced with permission of the copyright owner. Further reproduction prohibited without permission.

81
3mx(Li0inmS% phenyl methyl sScone, 0.1 pm fin
Temperature: 11Q*C isothermal Cam6rg*c 60 cm/s Ha Infection: 1 pLspfitSpit ratio: 750:1
e o o o
a o o o
0.000.00Minutes
1.9««
X .4«4> 1. 3« -
X. ,Z»+-
i . Xi .o»+-
BOO O-
8000 -
TOOO -
a o o o -
Multicapillaiy column(1 m x 0.04-mm) xSOO5% phenyl methyl silicone, 0.2 pm film
Temperature: 110*C isothermal Carrier gas: 11Q cm/s HeInfection: 0.1 pL splitSplit ratio: 6:1
o.o o .s x .o i.SMinutes
1. n-Decane 2 . 1-Octanol
3. 2, 6-Dimethylphenol 4 .2 ,6-Dimethyianiline
5. Naphtalene6 .1 -Decarol
7. n-Tridecane8. Methyl-decanoate
Figure 3.6 Chromatograms o f the column performance testmix obtained with a single fast GC column (top), and the multicapillary column (bottom).
Reproduced with permission of the copyright owner. Further reproduction prohibited without permission.
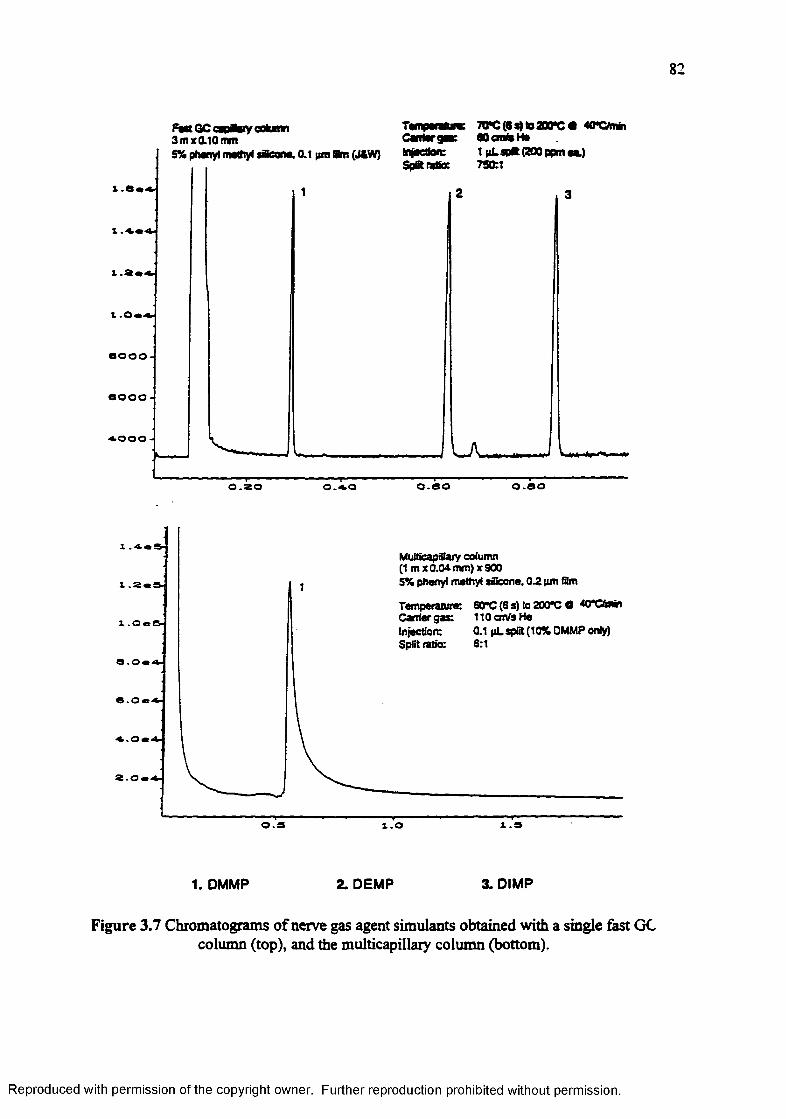
82
Fm GC a p ta y column 3mx0.l0mm
Tampentora: TVC (6 s) to 330*0 O 40*0*1*1 Canter gn: 60 crnte Ha
5% phanyl methyl sflfcone, 0.1 pm fifen (J4W) Inaction: 1 pLsp«(2Q0 ppmea.)Split ratio: 750:1
X
1 .0 *4 -
a o o o
o o -
0.60 0.600.20
x
X .2«i
x . o « s -
Q.O«<4~
MultScapiflary column(1 m x 0.04. mm) x 9005% phanyl methyl sSeone, 0.2 pm film
Temperatura: 60*C (6 s) to 200*C O 40*CtetinCarrier gas: 110 cmte HeInjection: 0.1 pLsplit (10% DMMP only)Split ratio: 6:1
0-3 i.O S .9
1. DMMP 2. DEMP 3. DIMP
Figure 3.7 Chromatograms of nerve gas agent simulants obtained with a single fast GC column (top), and the multicapillary column (bottom).
Reproduced with permission of the copyright owner. Further reproduction prohibited without permission.

83
the multicapillary column. Figure 3.7 presents a similar comparison o f the
chromatograms o f nerve agent simulants (dimethy l-alky l-phosphonates). Clearly, the
single capillary column outperformed the multicapillary column in resolution, peak
shape, and activity towards polar compounds.
As a result o f the previous evaluation, we concluded that the multicapillary
column, at its present stage o f development, was unsuitable for fast portable GC.
3.5 Conclusions
The selection o f the column for portable fast GC depends on the purpose of the
instrument, and the characteristics o f the instrument. In general, 0.1 mm i.d. were well
suited for fast GC. They were compatible with standard injectors and detectors.
Extra-column effects reduced the optimum carrier gas velocities and ‘useful’ carrier gas
velocity windows significantly. However, the maximum efficiencies remained close to
the theoretical values. The time constant introduced by the manually operated split
injector and the FID was approximately 250 ms. Optimal carrier gas velocity windows
were established for 1,2, and 3m long columns.
The upper limit o f the inlet pressure dictated the maximum column length. The
retention time increased faster with the column length than the resolution. For a target
analyzer, the shortest possible column should be selected, while a general purpose
instrument should include the largest possible column.
Under isothermal conditions, thin film columns delivered significantly faster
analysis times than thick film columns, with comparable maximum efficiencies. Only
3m long columns performed satisfactorily with thin films. For short columns (lm ), thick
films were necessary to avoid peak distortions. In general, thick film columns were
Reproduced with permission of the copyright owner. Further reproduction prohibited without permission.
84
easier to operate due to their larger sample capacity and the lower impact o f
extra-column effects.
Under temperature programmed conditions, thick film columns combine the
advantages of larger sample capacities and reduced impact o f extra-column effects on the
peak profiles, without the sacrifice o f large analysis times.
The multicapillary column showed poor resolution and significant activity
towards polar compounds, and was considered unsuitable for fast portable GC.
3.6 References for C hapter 3
3.1 Annino, R. J. High Resol. Chromatogr. 1996,19,285-290.
3.2 MSA Instrument Division, P.O. Box 427, Pittsbourgh, PA 15230.
3.3 Alltech Associates, Inc. 2051 Waukegan Road, Deerfield, IL 60015
3.4 Purnell, H.; “Gas Chromatography”, Wiley, New York 1962, pp. 49.
3.5 Hyver, K. J.; Phillips, R. J. J. Chromatogr. 1987,399,33-46.
Reproduced with permission of the copyright owner. Further reproduction prohibited without permission.
CHAPTER 4
RESISTIVE AT-COLUMN HEATING FOR FAST TEMPERATURE PROGRAMMING IN GAS CHROMATOGRAPHY
4.1 Introduction
As discussed in chapter 1, the use o f portable instrumentation for on-site analysis
has certain advantages over laboratory analysis such as faster response times, less sample
degradation, and fewer errors due to handling, transport and storage of the sample.
However, portable analytical instruments have their own requirements and limitations.
They should be lightweight, consume little power, and have very short turnaround times
in order to fully exploit the advantages o f portability. At the same time, they should have
appropriate accuracy and precision (4.1-4.3).
Among the variety of instruments adapted to on-site analysis, gas
chromatography presents the advantage o f flexibility over selective sensors by allowing
qualitative and quantitative analyses o f complex mixtures rather than the determination
of single target compounds. Also, GC separates the analytes in the column prior to their
detection, reducing the problems that could arise from potential interferences.
In chapter 2, theoretical derivations demonstrated that short, narrow bore
capillary columns exhibit high resolution at elevated carrier gas velocities due to their
small resistance to mass transfer contribution. This allows very fast GC analyses in a
technique known as fast or high speed GC. Portable gas chromatographs with these types
of columns, though commercially available, are limited to isothermal operation. This
severely restricts the scope of the instrument because only samples within a relatively
narrow boiling point range may be analyzed in a reasonable amount of time.
Temperature programming extends the potential o f GC by expanding the accessible
85
Reproduced with permission of the copyright owner. Further reproduction prohibited without permission.
86
volatility ranges and reducing analysis times (4.4). However, as demonstrated in chapter
2 , the temperature programming rate should increase proportionally with the carrier gas
velocity. Thus, the fast carrier gas velocities used with short, narrow bore columns
require very fast temperature programming rates for optimal separation of wide boiling
point range samples.
Almost all commercially available laboratory gas chromatographs include the
capability of accurate oven temperature programming. However, the ovens are bulky,
require large amounts o f electrical power, and their temperature programming capability
typically has an upper limit o f about 40°C/min. An alternative to large ovens, direct
resistive heating of the column itself, requires a minimum amount o f power, since only
the column is heated. The idea of direct resistive heating had been proposed several years
ago (4.5), but only proven experimentally more recently. Yost and coworkers (4.6)
heated commercial aluminum-clad columns by passing electrical current through the
coating of the column. This approach, although theoretically very appealing, has
practical limitations. For example, experiments performed in our laboratory showed that
the differences between the thermal expansion coefficients of the fused silica and the
aluminum caused the rupture of the aluminum coating and damage to the column itself
after a few thermal cycles.
Using the same concept, Phillips and coworkers (4.7-4.9) coated capillary
columns externally with a conductive paint for resistive heating. Electrical current
through the coating was programmed as a function of time so that the retention times of
n-paraffins would show a linear dependence on their Kovat’s indices. The appropriate
electrical current profile was determined by iterative experiments until the desired
Reproduced with permission of the copyright owner. Further reproduction prohibited without permission.
87
normal paraffin separation was achieved. The process was rather time consuming, and
the flexibility in temperature programs was limited. Moreover, the actual column
temperature and heating rate were unknown. Mechanical instability o f the conductive
film could result in problems such as uneven heating and physical damage to the column.
The present work implemented the concept o f resistive at-column heating using
either a separate metal tube or a metal wire as the heating element. A microprocessor
controlled feedback circuit directly controlled the column temperature. The feedback
circuit required an additional temperature sensing element, collinear with the column and
the heater. The electronic circuit compared the signal from the temperature sensor with
the expected value according to the software-selected temperature program. A pulse
width modulator on the electronic control board continuously adjusted the power applied
to the column heater to maintain the desired temperature.
The applicability of the two different at-column heating devices for fast,
controlled temperature programming o f narrow bore capillary columns was evaluated.
The scope and limitations of the electronic control were established and compared with a
standard commercial GC oven. The applicability of the at-column heater for fast GC-FID
and fast GC-MS was demonstrated. The overall GC performance (retention times and
peak widths) for n-paraffins Cio to C20 was likewise compared to a commercial GC oven
in terms of accuracy, precision, and efficiency. The influence o f an external sheath gas
flow, characteristics o f the insulating material, and the column wall thickness were
evaluated. Finally, the efficiency of temperature transference to the stationary phase was
studied.
Reproduced with permission of the copyright owner. Further reproduction prohibited without permission.
88
4.2 Experimental
4.2.1 Column Assembly.
All experiments were performed with 0.1 mm i.d. WCOT capillary columns of
various lengths (1 to 3 m). Unless stated otherwise, the columns were thin wall
capillaries (approx. 0.1 mm) with a 0.4 pm film of methyl phenyl (5%) silicone
stationary phase (Quadrex; New Haven, CT).
Two different types o f heating systems were assembled. One o f them, the coaxial
heater, used a 0.014-in. i.d. (0.022-in. o.d.) stainless steel tube (Small Parts, Miami, FL)
as the heating element. For one meter columns the stainless steel tube was used directly.
For three meter columns, a three meter long piece of stainless steel tube was
electroplated with a thin silver film to reduce the electrical resistance (AAA Polishing
and Plating; Baton Rouge, LA). The thickness of the silver film was neither monitored
nor determined; instead, the electrodeposition process was allowed to proceed until the
total resistance o f the tubing reached a value of approximately 3.5 ohm.
The coaxial heater comprised a piece of capillary column inserted along with the
same length o f an electrically insulated 0.002” diameter Nickel Alloy 1 2 0 ™ sensor wire
(California Fine Wire, Glover City, CA) into a slightly shorter piece o f silver plated
stainless steel tubing. For electrical insulation between column coils, the whole assembly
was inserted into a 0.032” i.d. thin wall piece of Teflon™ tubing (Cole Parmer; Niles,
IL). The insulating Teflon™ tubing was shorter than the stainless steel tube, allowing
about V2 cm of exposed metal tube at each end. The ends o f both the metal tube and the
sensor wire were soldered to copper wires and connected to the electronic control board.
Reproduced with permission of the copyright owner. Further reproduction prohibited without permission.
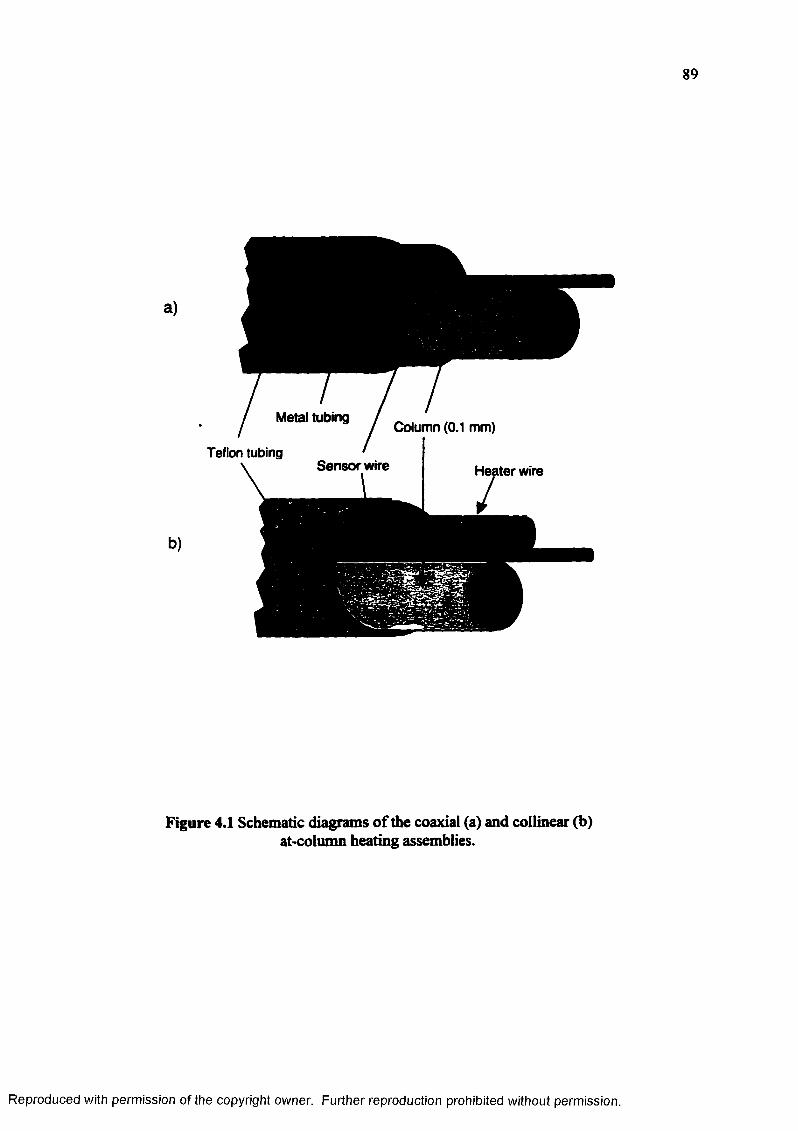
89
Column (0.1 mm)
Teflon tubingSensor wire Heater wire
Figure 4.1 Schematic diagrams o f the coaxial (a) and collinear (b) at-column heating assemblies.
Reproduced with permission of the copyright owner. Further reproduction prohibited without permission.
90
The second type of heating system, the collinear heater, was built using a 0.020”
diameter Nickel Alloy 9 0 ™ wire (California Fine Wire) or a 0.015” diameter Alomega®
wire (Omega, Stamford, CT) as the heating element instead o f the stainless steel tubing.
The type o f heating wire was selected according to the column length, such that the total
electrical resistance of the heater would be between 2 and 4 ohm.
In the collinear heater, the column, sensor wire, and heater wire were inserted
together into a 0.032” i.d. thin wall Teflon™ tube (Cole Parmer). As with the coaxial
heater, copper leads were soldered to each end o f both the heater and the sensor wire for
connection to the electronic control board, hi a slightly different version o f the collinear
heater, the heater wire was inserted into a 26 gauge fiberglass sleeve (Omega), for
electrical and moderate thermal insulation. In this case, the sensor wire, insulated heater
wire, and the column were inserted into an %” diameter braided ceramic high
temperature sleeve (Omega). Figure 4.1 contains schematic diagrams of the coaxial and
the collinear column heater assemblies.
4.2.2 Electronic Control
The electronic control for the resistive column heating was an integral part of a
control board that was built in-house for a prototype portable gas chromatograph (4.10).
Figure 4.2a shows a block diagram o f the original column heater control unit. The
controller used an 8 bit Intel 87C51GB microcontroller (Intel, Santa Clara, CA) that
included 256 bytes o f RAM, two programmable counter arrays, an 8 -channel 8 -bit A/D
converter and three 16-bit timer/counters. The firmware for the control board was written
in 8031 assembly language and resided on a 128K EPROM. The controller board worked
Reproduced with permission of the copyright owner. Further reproduction prohibited without permission.

L w , i
s
OAC
Heaterwire
RS 232serial link
Pulse width modulator
I
-► Powerdriver
8031 Compensation Sensor signalmicrocontroller network amplifier
Erroramplifier
ADC
Sensorwire
Figure 4.2a. Block diagram of the original temperature control unit
Tc—
RS 232 serial link
M
Heaterwire
Powerdriver
Enhanced 8031 ADC ___ Sensor signalmicrocontroller amplifier
Sensorwire
Figure 4.2b. Block diagram of the revised (software driven) temperature control unit.
Reproduced with permission of the copyright owner. Further reproduction prohibited without permission.

92
with DC input voltages that ranged from 10 to 30 VDC. In this work, two 12-V deep
cycle batteries (34 Ah) were connected in series for the column heating.
The control board communicated with an external computer via an RS232 serial
port. A Toshiba T3200 computer running Procomm v. 2.3 (PIL Software Systems;
Columbia, MO), or a Macintosh Classic II (Apple Computer, Cupertino, C A ) running
Red Ryder v. 10.3 (FreeSoft, Beaver Falls, PA) served as dumb terminal for setting
operational parameters. The sensor wire resistance, initial and final temperatures, delay
times, and heating rate were downloaded to the controller via the serial link.
The controller maintained the column temperature using a pulse width modulator
as follows. A small constant current (I) passes through the sensor wire. The resulting
voltage drop (V) along the wire is proportional to the resistance ( R) o f the wire
according to:
V = /x R [4.1]
The resistance Rt of the sensor wire at temperature T (°C) is given by:
Rt = Ro x (1 + a T) [4.2]
where Ro is the resistance at 0°C and a is the temperature resistance coefficient, that is
characteristic for a given metal. Combining Equations 4.1 and 4.2 shows that the voltage
drop is proportional to the temperature o f the sensor wire:
Vt = / x Ro x (1 + a T ) [4.3]
Every 10 ms the controller computed the expected voltage according to the
desired temperature-time profile and compared it with the measured voltage. The
difference between the expected value and the actual value o f the voltage constituted an
error signal. A compensation network modified the phase and amplitude of the error
Reproduced with permission of the copyright owner. Further reproduction prohibited without permission.
93
signal in order to achieve proper temperature control and closed-loop stability. The
output of the compensation network controlled a pulse width modulator, that in turn,
drove a power MOSFET that was connected to the heating element. The width o f the
pulses was proportional to the amplitude o f the compensation network output and
determined the heating rate.
A revised version of the temperature control unit used a software implemented
control algorithm instead of the compensation network and pulse width modulator. The
control algorithm was based on proportional, integral and derivative gains, and
temperature transport delays. The coefficients for these parameters could be user
modified, and optimized for each system, adding considerable flexibility. Figure 4.2b
presents a block diagram o f this version of the temperature control unit.
4.2.3 Experimental Set-up.
Most experiments were performed using split type injection with a high split ratio
( > 500:1). For trace concentrations, splitless injection was used occasionally. Unless
stated otherwise, the detector used was a flame ionization detector (FID). Both, injector
and detector were heated to a temperature at least 1 0 °C above the maximum column
operation temperature. The carrier gas was helium, unless stated otherwise. Data were
acquired either with a Pascal ChemStation (Hewlett-Packard, Little Falls, DE), or with
an IBM compatible personal computer using Windows ChemStation software (Hewlett-
Packard). In both cases, the sampling rate was 20 Hz. Alternatively, an in-house built
electrometer with a maximum sampling rate o f 100 Hz was interfaced to a Macintosh
computer. The software used in this case was an in-house developed chromatographic
software package (M2001, Institute for Environmental Studies, LSU).
Reproduced with permission of the copyright owner. Further reproduction prohibited without permission.
94
All experiments were performed using one or several of the following
experimental set-ups.
4.2J.1 Miniaturized GC (Set-up A)
This set-up comprised an in-house built miniaturized GC. It contained a
split/splitless injector that was removed from a Hewlett-Packard GC model HP 5710,
and an in-house built miniaturized FID. The two parts were housed in the same heater
block allowing the injector and detector to be located in close proximity. This
arrangement facilitated the insulation of the whole column assembly, including the ends
leading to the injector and detector; thus, enhancing thermal homogeneity along the
column. The column was carefully coiled into a 5” diameter flat spiral, and thermally
insulated. The insulation comprised two 7 x 7 x 1 ” silica-alumina composite squares
machined from large panels of this material (Zircar, Florida, NY). A 0.25” deep,
6.5 x 6.5” square depression was carefully carved in one o f the plates. The column was
sandwiched inside the depression, between the two plates o f the silica-alumina
composite. Figure 4.3 shows a schematic diagram of the miniaturized GC.
The injector/detector block was heated with its original heater cartridge
connected to a variable transformer (Ohmite, Skokie, IL). The output voltage of the
transformer was adjusted to keep the block at 320°C. The FED detector was connected to
the in-house constructed electrometer. GC data were collected at 100 points per second
sampling rate, using a Macintosh Classic H computer running M2001 (LSU).
4.2.3.2 HP 5890 Based Set-ups (B-D)
These three types of experimental set-ups were built around an HP 5890 gas
chromatograph with a split-splitless capillary injection port and an FID (Hewlett-
Reproduced with permission of the copyright owner. Further reproduction prohibited without permission.
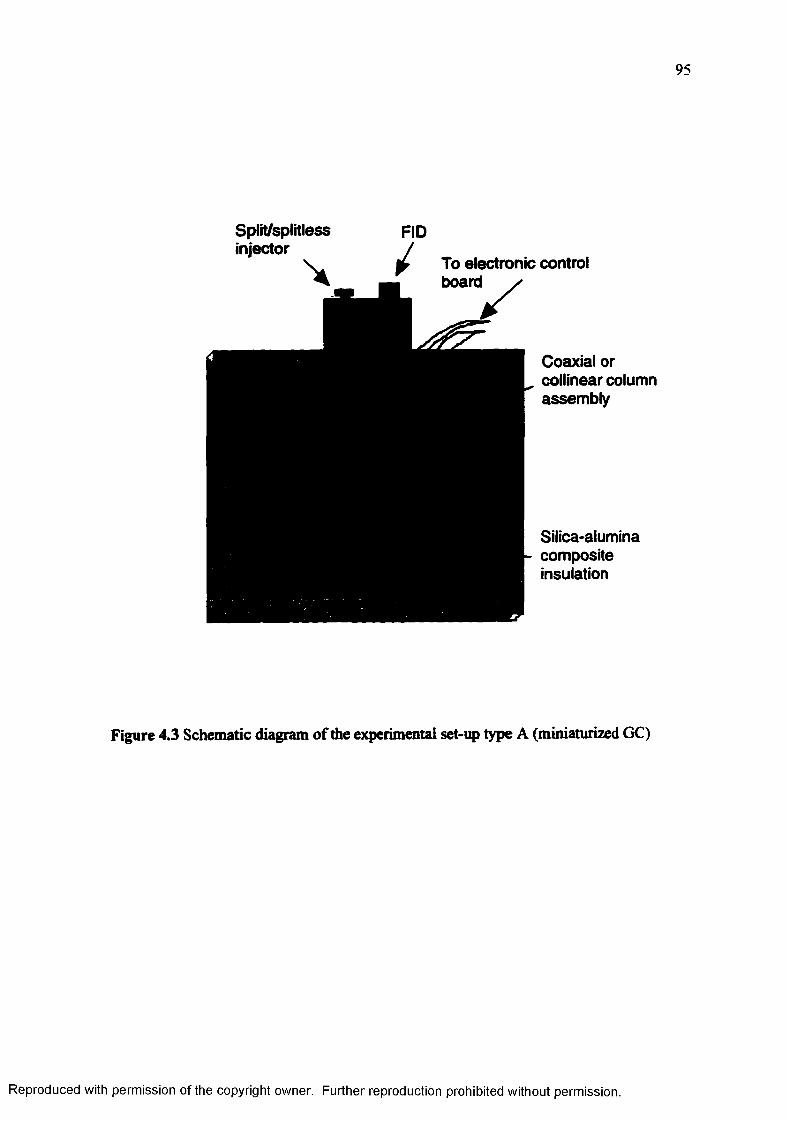
95
Split/splitless injector
FID
To electronic controlboard
Coaxial or collinear column assembly
Silica-alumina composite insulation
Figure 4.3 Schematic diagram o f the experimental set-up type A (miniaturized GC)
Reproduced with permission of the copyright owner. Further reproduction prohibited without permission.
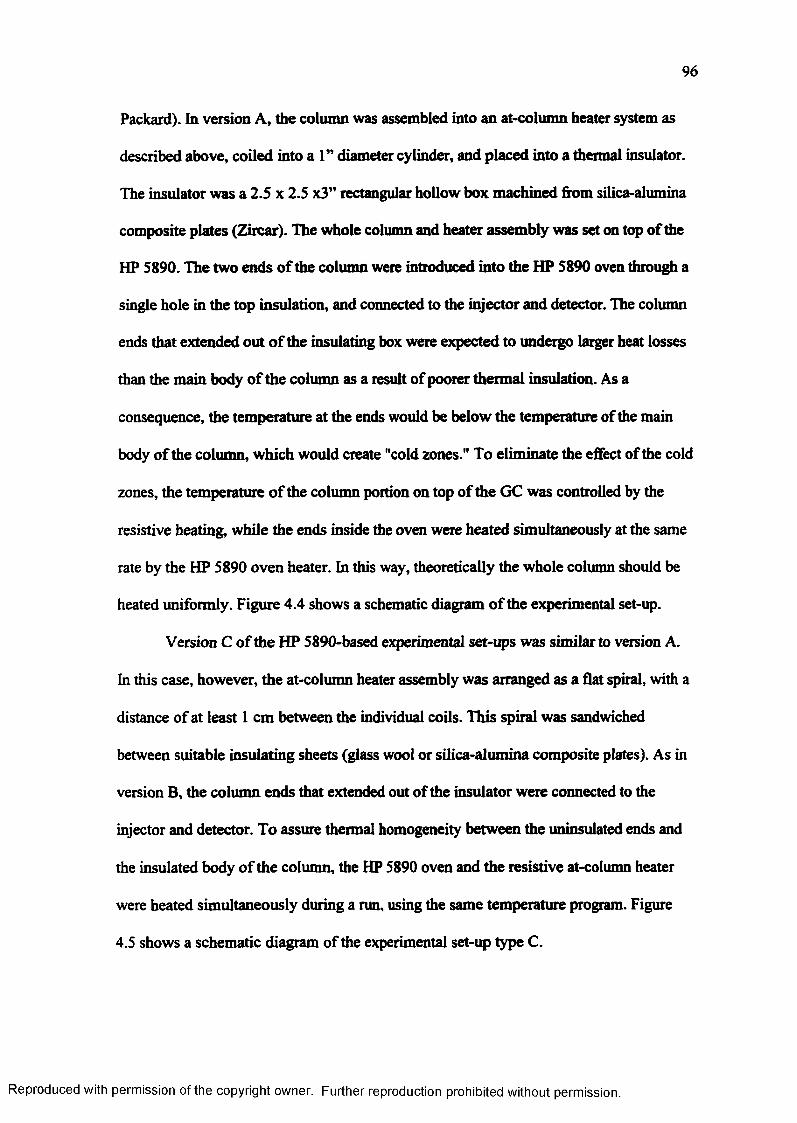
96
Packard). In version A, the column was assembled into an at-column heater system as
described above, coiled into a 1” diameter cylinder, and placed into a thermal insulator.
The insulator was a 2.5 x 2.5 x3” rectangular hollow box machined from silica-alumina
composite plates (Zircar). The whole column and heater assembly was set on top of the
HP 5890. The two ends o f the column were introduced into the HP 5890 oven through a
single hole in the top insulation, and connected to the injector and detector. The column
ends that extended out o f the insulating box were expected to undergo larger heat losses
than the main body o f the column as a result of poorer thermal insulation. As a
consequence, the temperature at the ends would be below the temperature of the main
body o f the column, which would create "cold zones." To eliminate the effect of the cold
zones, the temperature o f the column portion on top of the GC was controlled by the
resistive heating, while the ends inside the oven were heated simultaneously at the same
rate by the HP 5890 oven heater. In this way, theoretically the whole column should be
heated uniformly. Figure 4.4 shows a schematic diagram o f the experimental set-up.
Version C o f the HP 5890-based experimental set-ups was similar to version A.
In this case, however, the at-column heater assembly was arranged as a flat spiral, with a
distance of at least 1 cm between the individual coils. This spiral was sandwiched
between suitable insulating sheets (glass wool or silica-alumina composite plates). As in
version B, the column ends that extended out of the insulator were connected to the
injector and detector. To assure thermal homogeneity between the uninsulated ends and
the insulated body o f the column, the HP 5890 oven and the resistive at-column heater
were heated simultaneously during a run, using the same temperature program. Figure
4.5 shows a schematic diagram of the experimental set-up type C.
Reproduced with permission of the copyright owner. Further reproduction prohibited without permission.
97
Column assembly
To electronic board Insulating box
Splrt/splitlessinjector
HP 5890 oven
Figure 4.4 Schematic diagram o f the experimental set-up type B. The HP 5890 oven and the at-column heater were heated simultaneously at the same temperature program to assure thermal homogeneity along the column. This set-up minimized the influence of the oven heater on the at-column heater. However, it introduced cold zones where the column passed through the insulation at the top o f the oven.
Reproduced with permission of the copyright owner. Further reproduction prohibited without permission.

98
To electronic board
Split/splitlessinjector
HP 5890 oven
Column-assembly inside thermal insulator
Figure 4.5 Schematic diagram o f the experimental set-up type C. The HP 5890 oven and the at-column heater were heated simultaneously at the same temperature program to assure thermal homogeneity along the column. This set up minimized cold zones and intercoil heat transfer.
Reproduced with permission of the copyright owner. Further reproduction prohibited without permission.

99
To electronic board
Split/splitlessinjector
At-column heater assemblyHP 5890 oven
Figure 4.6 Schematic diagram of the experimental set-up type D. The HP 5890 oven heater was turned off during a run and the column heated with the at-column heateronly.
Reproduced with permission of the copyright owner. Further reproduction prohibited without permission.
100
Version D o f the experimental set-up comprised a collinear at column heater that
was inserted longitudinally in an %” diameter braided ceramic fiber sleeve (Omega).
The column assembly was coiled into a helix, keeping a distance o f at least 2-cm
between coils. Fiberglass tape (Cole Parmer) helped keep the column coils in place. The
ends were connected to the injector and detector. The metallic injector and detector
connections that protruded into the GC oven were covered with glass wool, together with
the first inch of each end of the column assembly. With this arrangement, the GC oven
heater was turned off during a run, and the column temperature was controlled only by
the at-column heater. The oven fan was used between runs to accelerate cool-down
times, and establish constant ambient temperature at the beginning of each run. Figure
4.6 shows a diagram o f column arrangement D.
4.2.4 Evaluation of the Scope, Accuracy and Precision o f the Tem perature Control.
To evaluate the performance, repeatability, and accuracy o f the temperature
control, the voltage-versus-time traces of the sensor wire were monitored and collected
using a Nicolet 3091 digital storage oscilloscope (Nicolet, Madison, WI). These traces
were downloaded as text files to the Macintosh Classic II computer (Apple), via a serial
link, using Red Ryder v. 10.3 (FreeSoft) as the communication program. The
oscilloscope was calibrated with a variable DC voltage source (General Resistance
Instruments, Mt. Vemon, NY). Microsoft Excel (Microsoft, Seattle, WA) was used for
the data processing (smoothing, data reduction, calculation o f error and precision) and
chart preparation.
Reproduced with permission of the copyright owner. Further reproduction prohibited without permission.

101
4.2.5 Chromatographic Performance - Preliminary Evaluation
4.2.5.1 GC-FED Experiments
Chromatograms o f a C5-C44 w-paraffin blend (Separation Systems; Gulf Breeze,
FL) were obtained using both the coaxial and the collinear at-column heaters in the
miniaturized GC, under different temperature programming rates. Chromatograms o f a
polycyclic aromatic hydrocarbons standard mixture (Supelco, Bellofonte, PA), two
base/neutrals standard mixtures (Supelco), Louisiana light crude oil (Institute for
Environmental Studies, LSU), and chemical warfare agents simulants were obtained with
the collinear heater only, under different temperature programming conditions.
Retention time reproducibility for different heating rates was determined from 5
consecutive runs o f the n-paraffin blend. Separation efficiency under different
temperature programming rates was calculated from the retention times and peak widths
of the n-paraffins.
4.2.5.2 GC-MS Experiments.
A 3-m long collinear at-column heater assembly was installed in an HP 5890
with an HP 5971 mass selective detector (Hewlett-Packard), in an arrangement similar to
the experimental set-up type D. One end of the column was connected to the
split/splitless injector o f the system, the other end was connected, via a zero dead volume
connector (Valeo; Houston, TX) to a short capillary tube that, in turn, was connected to
the mass spectrometer interface. The column was resistively heated during a run, at
various temperature programming rates. The control of all the other operational
parameters, as well as the data acquisition were performed with the dedicated IBM
compatible computer o f the GC-MS. Diluted diesel oil samples were injected in the split
Reproduced with permission of the copyright owner. Further reproduction prohibited without permission.
102
mode, with a split ratio o f500:1. Two sets o f ions were monitored in separate runs,
operating the mass spectrometer in single ion monitoring (SIM) mode. The first set
comprised the ions corresponding to m/z values o f85,178, 184, 192, and 198. The
second set included m/z values o f85,191,220 and 226. Dwell times o f 25 and 10 ms
were used.
Results were compared to existing ion chromatograms o f the same samples that
had been obtained with a conventional high resolution capillary column (0.25 mm i.d. x
30-m, 0.25-pm film of 5% phenyl-methyl-silicone).
4.2.6 Comparison of the At-column Heater Performance with a Standard GC Oven.
A 3-m-long column was first installed as received in the GC oven, and five
replicated chromatograms for n-paraffin headspace samples were obtained; the oven was
heated from 50°C to 250°C at a temperature programming rate o f 0.5°C/s (upper limit of
the HP 5890 oven). Subsequently, the same column was assembled into a collinear
at-column heater system as described above, and installed in a HP 5890, using type B
and type C arrangements. Five replicate chromatograms of the n-paraffin test mixture
headspace were obtained at a temperature programming rate of 0.5°C/s.
Retention times and peak widths of the n-paraffins from C6 to C20 were
determined for all chromatograms. The results were compared statistically using analysis
of variance (ANOVA) in a completely randomized design. Carbon numbers and heater
type were tested as the factors affecting retention times and peak widths. The response
variables, retention times (RT) and peak widths (PW) were analyzed individually in an
univariate approach. The effect o f time or sequence in which the experiments were
performed was considered negligible, based on the well-known stability o f gas
Reproduced with permission of the copyright owner. Further reproduction prohibited without permission.
103
chromatographs and columns over time. The statistical analysis was performed with SAS
software, version 6.08 (The SAS Institute; Cary, NC).
4.2.7 Effect o f the Sensor W ire M aterial
The effect of the temperature versus resistance linearity o f the sensor wire upon
retention times and peak widths was evaluated with a 1-m collinear at-column heating
assembly, arranged in a set-up type C. This set-up minimized possible cold spots and
intercoil influences. The column assembly contained two different sensor wires: the
standard Nickel Alloy 120™ wire, and a 0.0015-in. diameter platinum 99.99% wire
(California Fine Wire). Three chromatograms o f n-parafGn headspace samples were
obtained for each sensor wire. When the platinum wire was used, the original EPROM
was replaced with an EPROM that contained the appropriate temperature vs. resistance
coefficient for pure platinum (a = 0.00385). Results of retention times and peak widths
were compared statistically.
4.2.8 Evaluation of Tem perature Non-uniformities Along and Across the Column
Cio to C20 retention times and peak widths obtained using a 1-m coaxial and a
1-m collinear at column heater with similar columns, were compared statistically. The
two column assemblies were used in a type C arrangement in order to minimize
temperature variations along the column (cold zones and intercoil effects).
4.2.9 Evaluation of the Effect of an External Sheath Gas Flow Along the Column.
Additional experiments were performed to evaluate the effect o f an external flow
of sheath gas along the column, through the outer annular space in the Teflon™* tube.
Retention times and peak widths that were obtained with and without sheath gas were
statistically compared using univariate analysis of variance (The SAS Institute). The
Reproduced with permission of the copyright owner. Further reproduction prohibited without permission.

104
chromatograms without sheath gas were obtained with the collinear at-column heater in a
type B set-up. For the sheath gas supply, a piece o f deactivated fused silica tubing
(15 cm x 0.32 mm, Restek; Bellofonte, PA) was inserted up to 3-cm into the detector end
of the Teflon™ tubing. The opening o f the Teflon™ tubing was sealed with high
temperature silicone sealant (Permatex; Loctite; Cleveland, OH). The other end o f the
fused silica tubing was connected to the packed column injection port of the HP S890,
which delivered a sheath helium flow o f approximately 5 mL/min to the Teflon™ tube.
4.2.10 Influence of the Thermal Insulation on the Performance of the At-column Heater
Retention times and peak widths of -paraffins from chromatograms obtained
with a 1-m collinear column assembly insulated with different materials were compared
statistically. The insulators evaluated were silica-alumina composite plates, glass wool,
empty Pietri dishes (Pyrex glass), and the external ceramic fiber sleeve only. The
experiment was performed using arrangement type C (0.5C/s only), as well as
arrangement A (various column heating rates). The power consumed in each case
(arrangement A only) was measured with a digital multimeter (Protek S06, Hung Chang
Products, Seoul, Korea) operated as ampmeter. For this purpose, the multimeter was
connected in series between the negative terminal of the power supply and the electronic
control board. Data from the multimeter were continuously sent to a personal computer
via an RS232 interface. Excel (Microsoft) was used for data processing.
4.2.11 Influence of the Fused Silica Wall Thickness on the At-coiumn Heater Performance
One and three meter columns with two different fused silica wall thicknesses
(0.1 mm wall thickness, Quadrex; 0.2 mm wall thickness, J&W; Folsom, CA) were first
Reproduced with permission of the copyright owner. Further reproduction prohibited without permission.
105
installed as received in the HP 5890 oven. Triplicate chromatograms o f the w-paraffin
mixture were obtained for each column, heating the oven from 50 to 250°C at a
temperature programming rate o f 0.5°C/s. These chromatograms served to compare the
columns by themselves, regardless o f the column heater and/or thermal insulation.
Subsequently, each column was assembled into a collinear at-column heater, using an
insulated heater wire, and ceramic fiber tubing as outer sleeve. Again triplicate
chromatograms for each column assembly heated resistively at the same temperature rate
program, were obtained. This was repeated using two types o f experimental set-ups or
arrangements: type C and type D. Additionally, chromatograms with temperature
programming rates o f l°C/s, 2°C/s and 5°C/s were obtained with the type C
arrangement.
4.2.12 Temperature Transference Into the Stationary Phase
A sensor wire (Nickel Alloy 120™) was inserted into a 1—m x 0.53-mm
deactivated fused silica tubing (Restek), such that 2-cm o f the wire extended out o f each
end of the tubing. With this tubing instead of the column, a collinear at-column heating
assembly was constructed. All four sensor wire extremes were soldered to copper wires
for connection to the electronic board. The sensor wire outside the tube was used for the
column temperature control while the sensor inside served for simultaneously monitoring
the temperature inside the tubing. Voltage vs. time traces for both sensor wires were
collected with a digital storage oscilloscope (Nicolet) and transferred as text files to a
Macintosh Classic II computer (Apple). These traces were obtained for different heating
rates and column insulating materials.
Reproduced with permission of the copyright owner. Further reproduction prohibited without permission.
106
Temperature dependent differences between the outside (control) and inside of
the fused silica tubing were determined for the various heating ramps and insulating
materials.
4.3 Results and Discussion
4.3.1 Evaluation of the Scope, Accuracy and Precision of the TemperatureControl
Figure 4.7 shows the wire resistance vs. time profiles obtained with the HP 5890
oven heater and with the new collinear at-column heater at a linear temperature
programming rate of l°C/s. These profiles demonstrate the improvement in ramp
accuracy and linearity achieved by the direct at-column heating system. Moreover, the
HP 5890 required approximately 1500 Watt o f power for the oven heating, while the at-
column heater required less than 60 Watt for the more accurate temperature ramp.
At-column heater temperature ramps from 0.5°C/s up to 10°C/s exhibited very
good linearity and negligible overshoot at the final temperature (Figure 4.8). The
maximum linear heating rate achieved varied with the type of column insulator, the
resistance o f the heating element, and the power supply. For a 2 to 4 ohm heater and a
moderately well insulated column, powered with two 12V batteries in series, heating
rates up to 15°C/s were possible. A power supply with higher voltage output would
allow much faster temperature programming rates; however, this is not necessary for
100 pm i.d. capillary columns, and impractical for field applications.
The profiles reproduced in figure 4.8 correspond to a collinear at-column heater
with a nude heater wire. When the heater wire was covered with a thin fiberglass tubing,
temperature transport delay caused an appreciable oscillation at the beginning of the
ramp, as seen in figure 4.9. To compensate for this effect, it was necessary to use the
Reproduced with permission of the copyright owner. Further reproduction prohibited without permission.

107
Collinear at-column Heater
320.00 q-
280.00 “
O 240.00 : -
5 200.00 * - eSg 160.00 +CL
| 120.00 +80.00 +
40.00 I r T i r l f i n I n n 0 50 100
HP 5890 Oven
150 200 250Time (s)
300 350 400
Figure 4.7 Comparison of the temperature versus time profiles obtained with the new collinear at-column heater and the HP 5890 oven for a linear temperature program of l°C/s. The temperatures were calculated from the resistance versus time traces of calibrated platinum sensor wires
Reproduced with permission of the copyright owner. Further reproduction prohibited without permission.
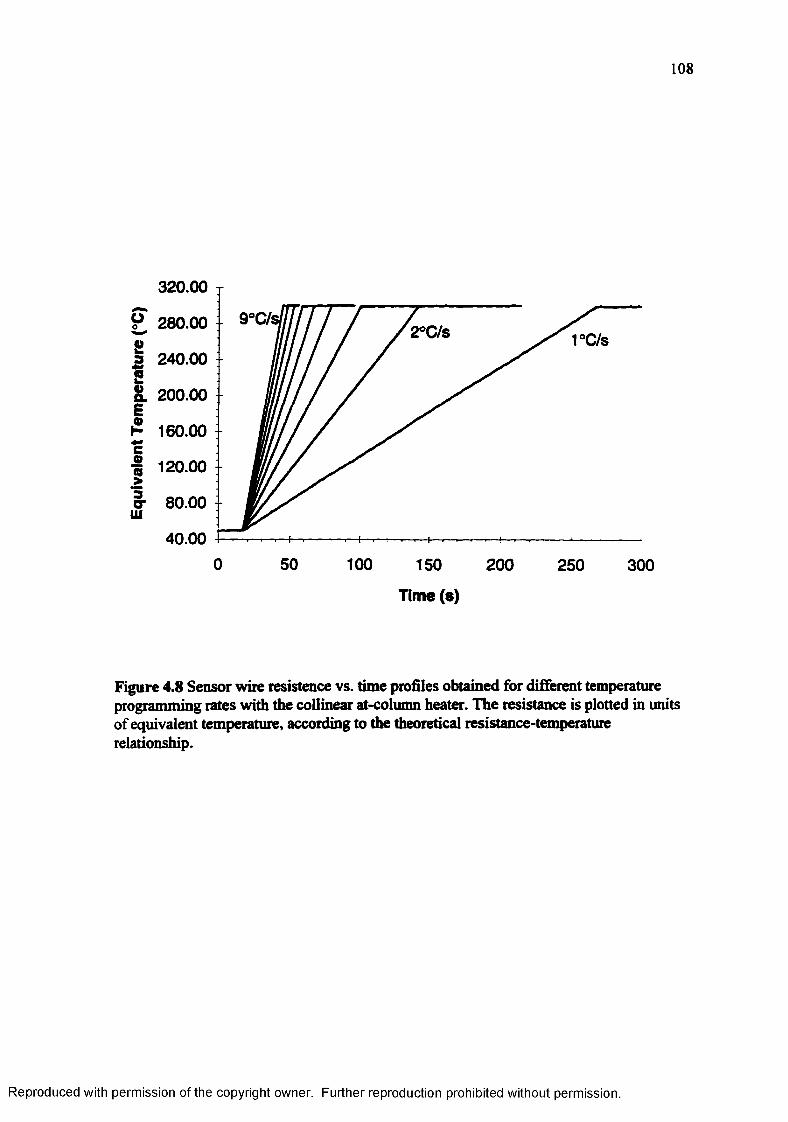
108
s3IS
£
co«>3orUl
320.00
280.00 2°C/s 1°C/s240.00
200.00
160.00
120.00
80.00
40.0050 1000 150 200 250 300
Time (s)
Figure 4.8 Sensor wire resistence vs. time profiles obtained for different temperature program m ing rates with the collinear at-column heater. The resistance is plotted in units of equivalent temperature, according to the theoretical resistance-temperature relationship.
Reproduced with permission of the copyright owner. Further reproduction prohibited without permission.

109
electronic board with the software implemented control function. Appropriate
coefficients for the control algorithm permitted minimize the transport delay effect.
However, the selection o f the optimum parameters was a tedious process. Five mutually
interacting parameters had to be optimized simultaneously for minimum steady state
error, m inim um initial and final overshoot, and maximum ramp linearity, h i practice, it
was not possible to obtain perfect temperature ramps, due to the natural inertia of the
system. Therefore, it was necessary to compromise steady state errors, ramp accuracy,
transport delay and overshoot, to obtain the best temperature time profile. To achieve
this in a less time consuming and more consistent way, a performance function should be
defined. This function should include weighted contributions o f the factors to optimize,
according to their relative importance for the chromatographic performance.
Implementation o f a statistical optimization procedure (such as simplex or a factorial
design) would then facilitate and standardize the selection o f the control parameter
coefficients.
The accuracy and reproducibility of the temperature control depended on the
heating rate and the control parameters used. As an example o f the temperature control
accuracy, figure 4.10a presents a typical trace of the difference between the actual sensor
resistance and the expected resistance, according to the temperature-time profile, and the
theoretical resistance-temperature dependence o f the sensor wire (for 50°C to 300°C at a
l°C/s heating rate). Maximum deviations from the expected resistance values were
observed at the beginning of the ramp (equivalent to < 1°C). The error during the main
portion o f the ramp was below a resistance difference equivalent to 0.2°C. Likewise,
figures 4.10 b and c present data for the slope accuracy and the temperature
Reproduced with permission of the copyright owner. Further reproduction prohibited without permission.
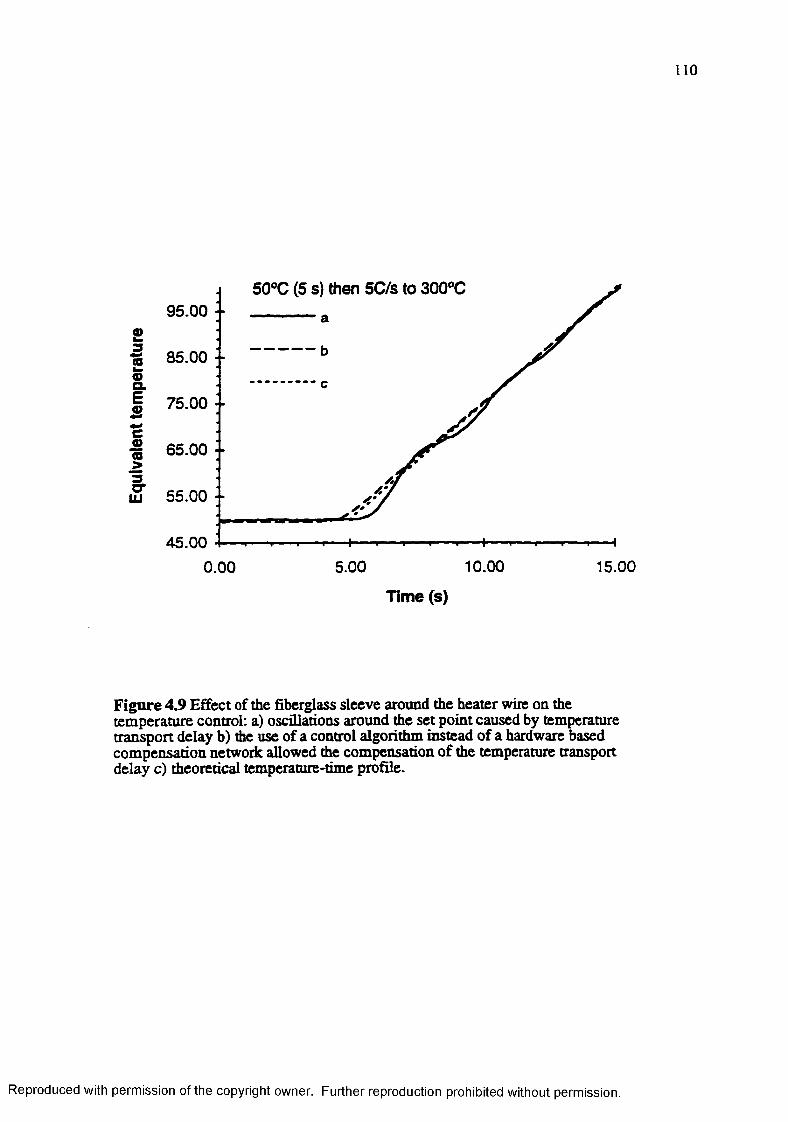
110
50°C (5 s) then 5C/S to 300°C95.00
22(O 85.00oaE® 75.00
c1 65.00
3f i 55.00
45.0010.005.00 15.000.00
Time (s)
Figure 4.9 Effect of the fiberglass sleeve around the heater wire on the temperature control: a) oscillations around the set point caused by temperature transport delay b) the use of a control algorithm instead of a hardware based compensation network allowed the compensation of the temperature transport delay c) theoretical temperature-time profile.
Reproduced with permission of the copyright owner. Further reproduction prohibited without permission.
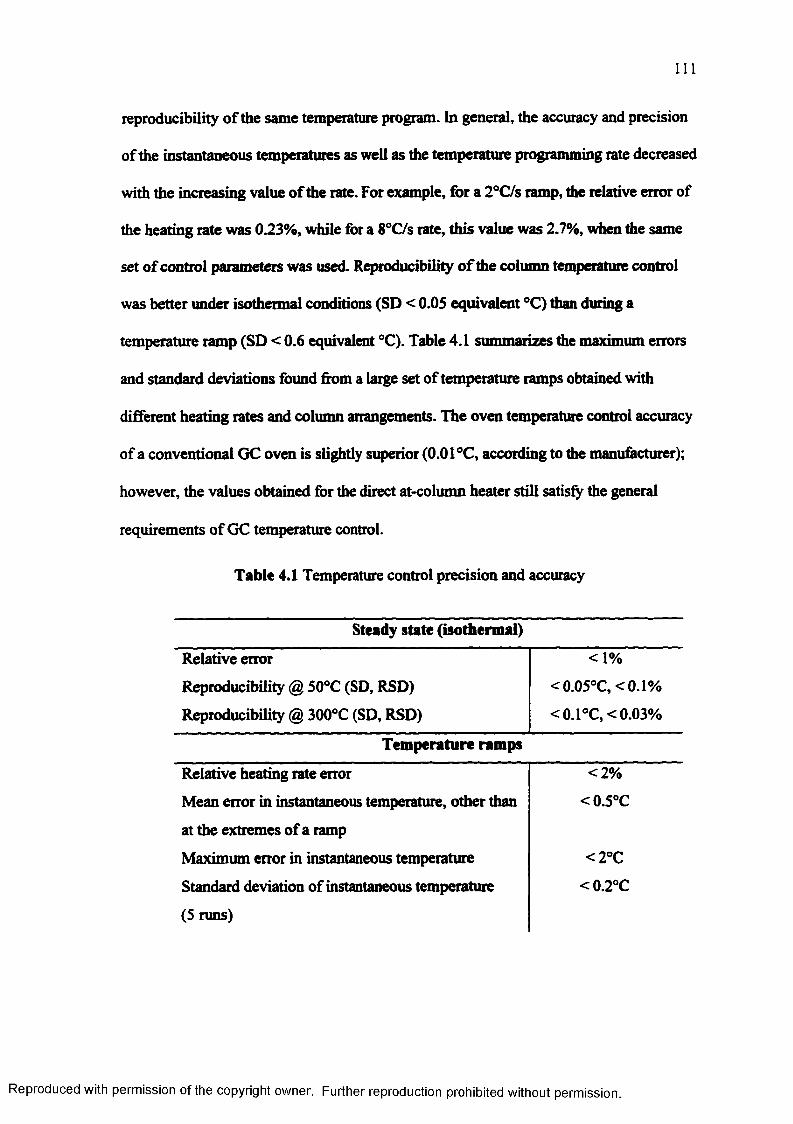
I l l
reproducibility o f the same temperature program. In general, the accuracy and precision
of the instantaneous temperatures as well as the temperature programming rate decreased
with the increasing value o f the rate. For example, for a 2°C/s ramp, the relative error of
the heating rate was 0.23%, while for a 8°C/s rate, this value was 2.7%, when the same
set o f control parameters was used. Reproducibility o f the column temperature control
was better under isothermal conditions (SD < 0.05 equivalent °C) than during a
temperature ramp (SD < 0.6 equivalent °C). Table 4.1 summarizes the maximum errors
and standard deviations found from a large set o f temperature ramps obtained with
different heating rates and column arrangements. The oven temperature control accuracy
of a conventional GC oven is slightly superior (0.01°C, according to the manufacturer);
however, the values obtained for the direct at-column heater still satisfy the general
requirements o f GC temperature control.
Table 4.1 Temperature control precision and accuracy
Steady state (isothermal)
Relative error <1%
Reproducibility @ 50°C (SD, RSD) <0.05°C, <0.1%
Reproducibility @ 300°C (SD, RSD) <0.1°C, <0.03%
Tem perature ramps
Relative heating rate error <2%
Mean error in instantaneous temperature, other than < 0.5°C
at the extremes of a ramp
Maximum error in instantaneous temperature <2°C
Standard deviation of instantaneous temperature < 0.2°C
(5 runs)
Reproduced with permission of the copyright owner. Further reproduction prohibited without permission.

112
Oo
(0CO0E
oVaxUi
- 0.20 OCD OSi
oinCM
Oo>CM
Expected T(°C)
4» 1.05ao0a.o(0x>0V.3wta«
1.00
0.95
0.90
: b >
:|H . 1
- ■ i r i' i-i-i -i 4 ■4 t f t-H -I-H t 1 -t i » 1 r 1 I-I-I 1 r 1 i 1 i 1 i | i-1-1-1-1 -111 ■ 1 ■ 1oin oCT> O
COot*. o
CMoinCM
o03CM
Expected T(°C)
Ooeo«s0■>0■o2 <n
0.08 t c )
0.06
0.04
0.02
0.00oinCM
o03CM
©1- oSi
oCO
o03in
Expected T (°C)
Figure 4.10 Electronic control accuracy and precision for a nominal temperature programming rate of l°C/s. a) Accuracy of the instantaneous temperature b) accuracy of the slope c) standard deviation from 3 consecutive runs
Reproduced with permission of the copyright owner. Further reproduction prohibited without permission.
113
It is important to emphasize that the objective o f the previous experiments was to
test the ability o f the electronic feedback control system to closely follow a software
selected resistance versus time profile. The absolute accuracy o f the temperature was not
tested in this experiment Under accurate electronic control, the accuracy o f the
temperature ultimately depends on the accuracy o f the resistance versus temperature
model included in the EPROM. For this work, accurate, linear resistance-temperature
behavior was assumed, with an a value o f0.0052, according to information supplied by
the manufacturer.
4.3.2 Chromatographic Performance — Preliminary Evaluation
4.3.2.1 GC-F1D Experiments
To evaluate the potential o f the coaxial end the collinear at-column heater,
chromatograms o f several wide boiling point range samples were obtained under
different temperature programming rates. The injections were performed in split mode
with a high split ratio (>500:1); the detector was an FID. Figures 4.11 to 4.15 reproduce
selected chromatograms of typical samples o f environmental interest. Each figure
includes details about the particular experimental conditions. All the chromatograms
show good separation in very short run times. Mixtures containing compounds with
retention indices that ranged from 500 to 2000 were well separated in 1 to 5 minutes.
Standard methods for the GC analyses o f many of these samples have up to ten times
longer run times. For example, figure 4.12 shows an impressive separation o f a light
crude oil sample in 5 minutes at a temperature programming rate o f l°C/s. This
constitutes a more than six fold reduction in analysis time compared to current GC
methods used for oil fingerprinting (4.11).
Reproduced with permission of the copyright owner. Further reproduction prohibited without permission.
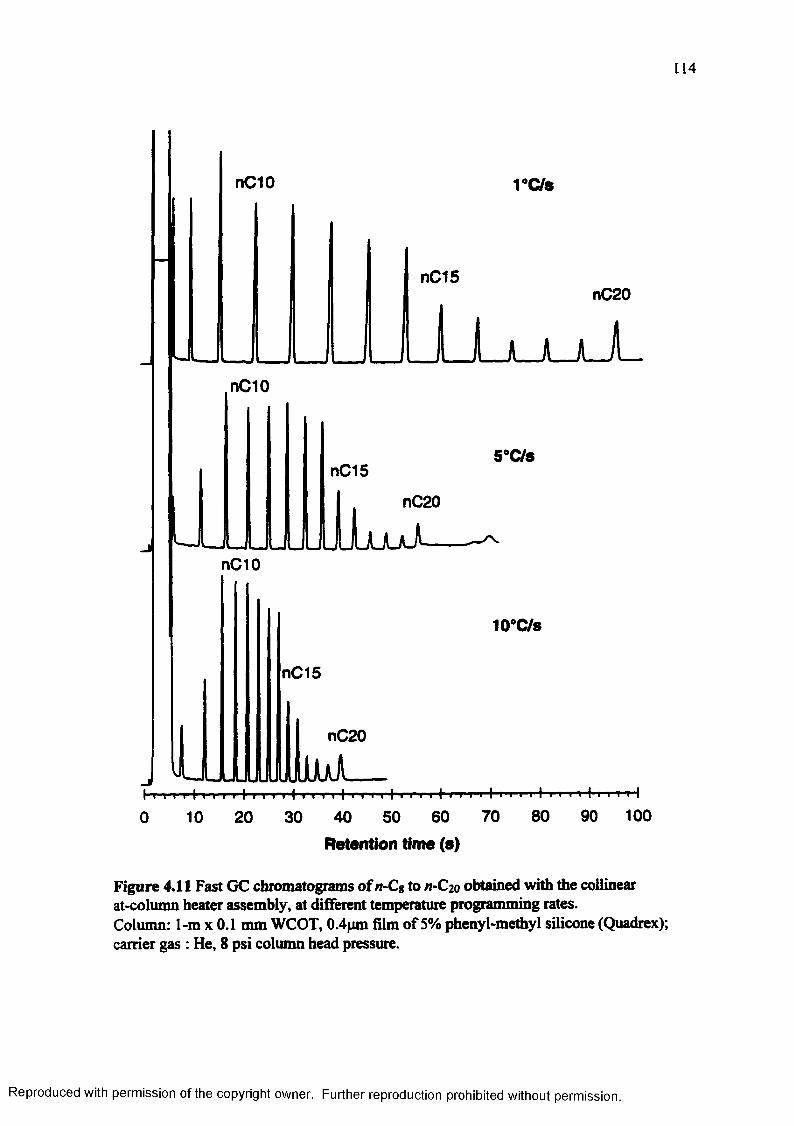
114
nC10
nC15nC20
I __I_I_JLJLJ il—nC10
nC15
nC20
nC10
nC15
nC20
10 20 30 40 50 60 70 80 90 1000
Retention time (s)
Figure 4.11 Fast GC chromatograms of n-Cg to /1-C2 0 obtained with the collinear at-column heater assembly, at different temperature programming rates.Column: 1-m x 0.1 mm WCOT, 0.4pm film of 5% phenyl-methyl silicone (Quadrex); carrier gas : He, 8 psi column head pressure.
Reproduced with permission of the copyright owner. Further reproduction prohibited without permission.
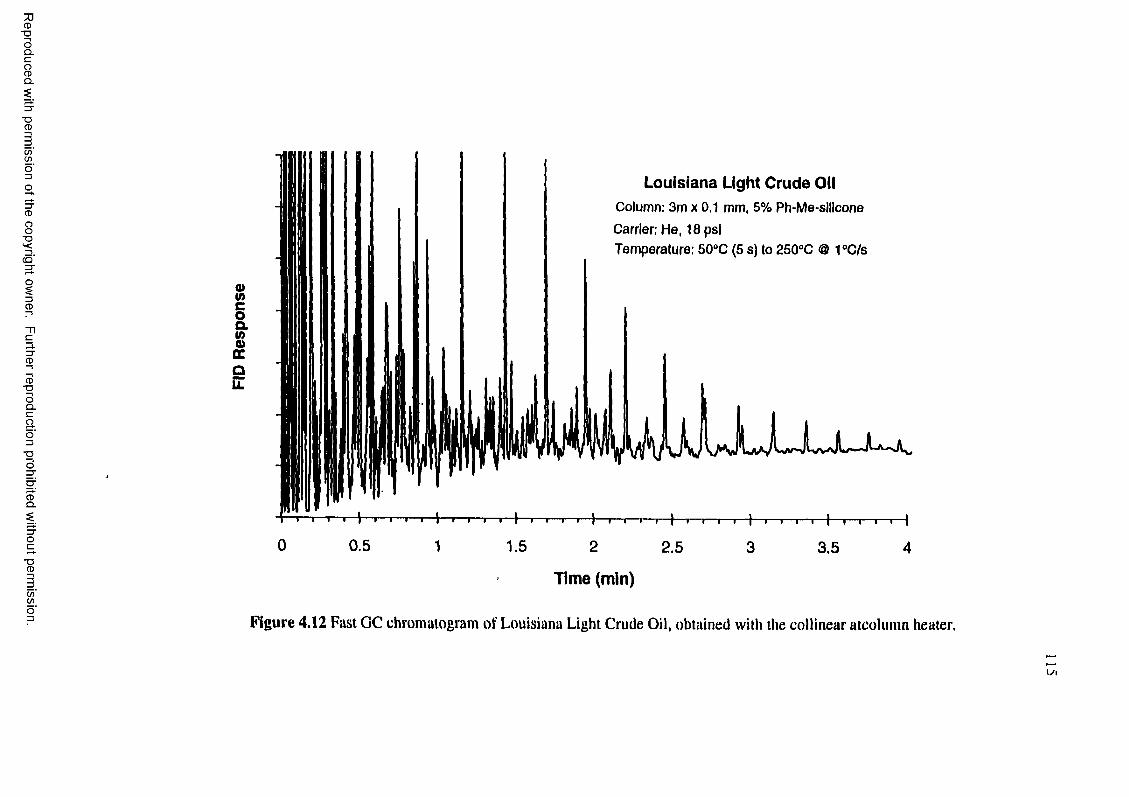
Reproduced
with perm
ission of the
copyright ow
ner. Further
reproduction prohibited
without
permission.
O)(ACoo.ina>CCQLL
Louisiana Light Crude OilColumn: 3m x 0.1 mm, 5% Ph-Me-sillcone Carrier: He, 18psiTemperature: 50°C (5 s) to 250°C <8 1°C/s
Time (min)
Figure 4.12 Fast GC chromatogram of Louisiana Light Crude Oil, obtained with the collinear atcolumn heater.
Ul
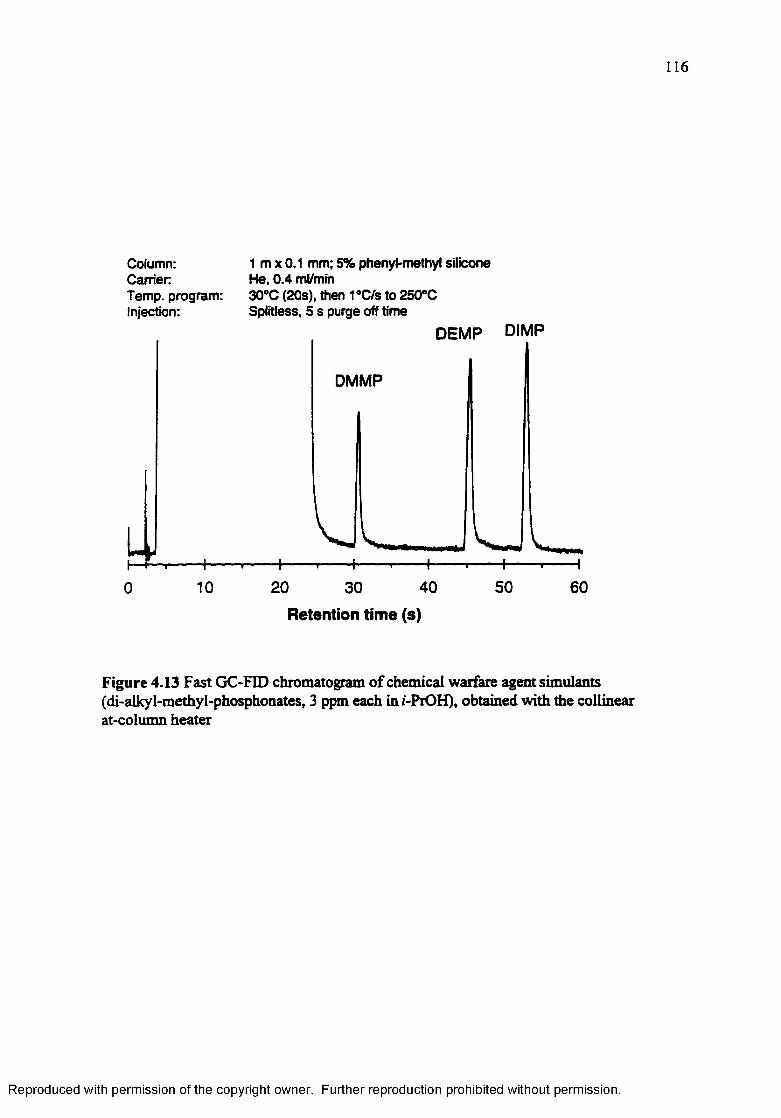
116
Column: 1 m x 0.1 mm; 5% phenyl-methyl siliconeCarrier. He, 0.4 ml/iminTemp, program: 30°C (20s), then 1°C/s to 250°CInjection: Splitless, 5 s purge off time
DEMP DIMP
DMMP
T
0 10 20 30 40 50 60
Retention time (s)
Figure 4.13 Fast GC-FID chromatogram of chemical warfare agent simulants (di-alkyl-methyl-phosphonates, 3 ppm each ini-PrOH), obtained with the collinear at-column heater
Reproduced with permission of the copyright owner. Further reproduction prohibited without permission.
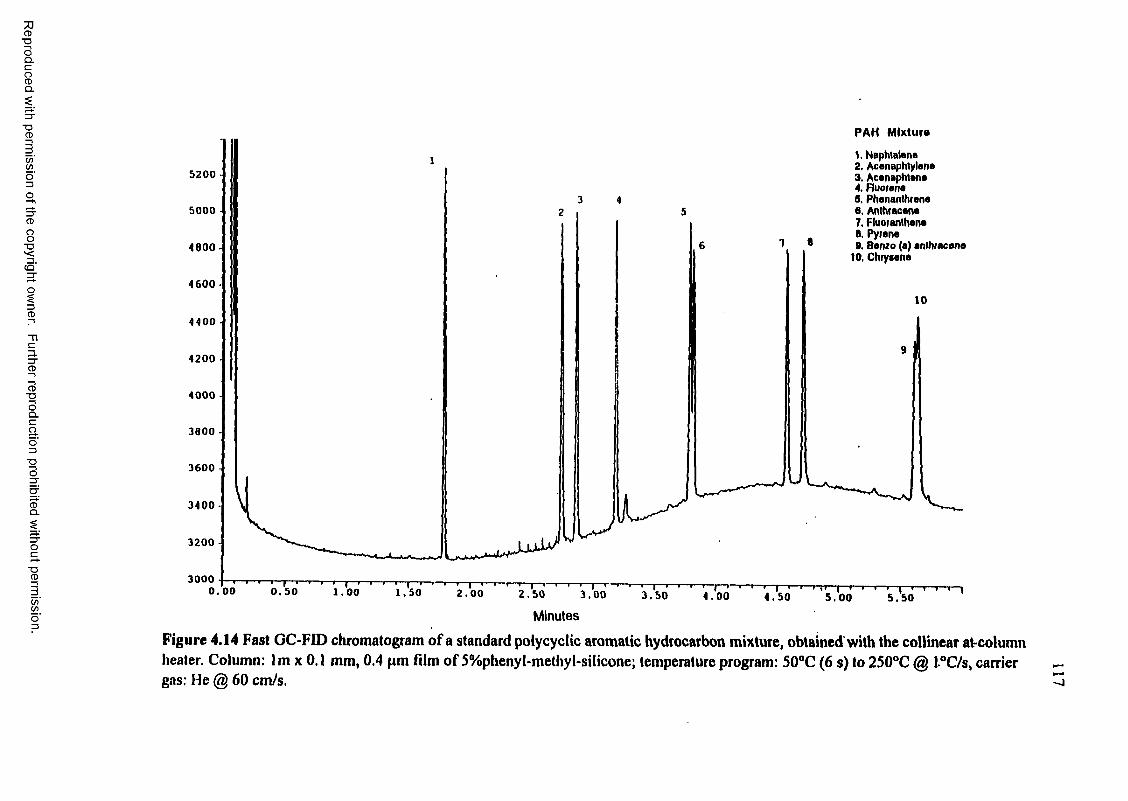
Reproduced
with perm
ission of the
copyright ow
ner. Further
reproduction prohibited
without
permission.
PAH Mlxtura
1. Naphtalena2. Acenaphtylane3. Acenaphtena4. Fluoreno6. Phenanthrene6, Anthracene7. Fluoranthene 6, Pyrene9, Benzo (a) anthracene
to, Chryaene
5200 •
5000 -
4800 -
4 6 0 0 -
4400 •
4200
4000 -
3800 ■
3600 -
3 4 0 0 -
3200 -
30000 . 00 1.00 1. 50 2 . 0 0 2 .5 0 3 .00 3 .5 0 4 .0 0 4 .5 0 5 . 0 0 5 ,5 0
MinutesFigure 4.14 Fast GC-FID chromatogram of a standard polycyclic aromatic hydrocarbon mixture, obtained'with the collinear at-column heater. Column: I m x 0.1 mm, 0.4 pm film of 5%phenyl-methyl-siIicone; temperature program: 50°C (6 s) to 250°C @ 1 “C/s, carrier — gas: He @ 60 cm/s.
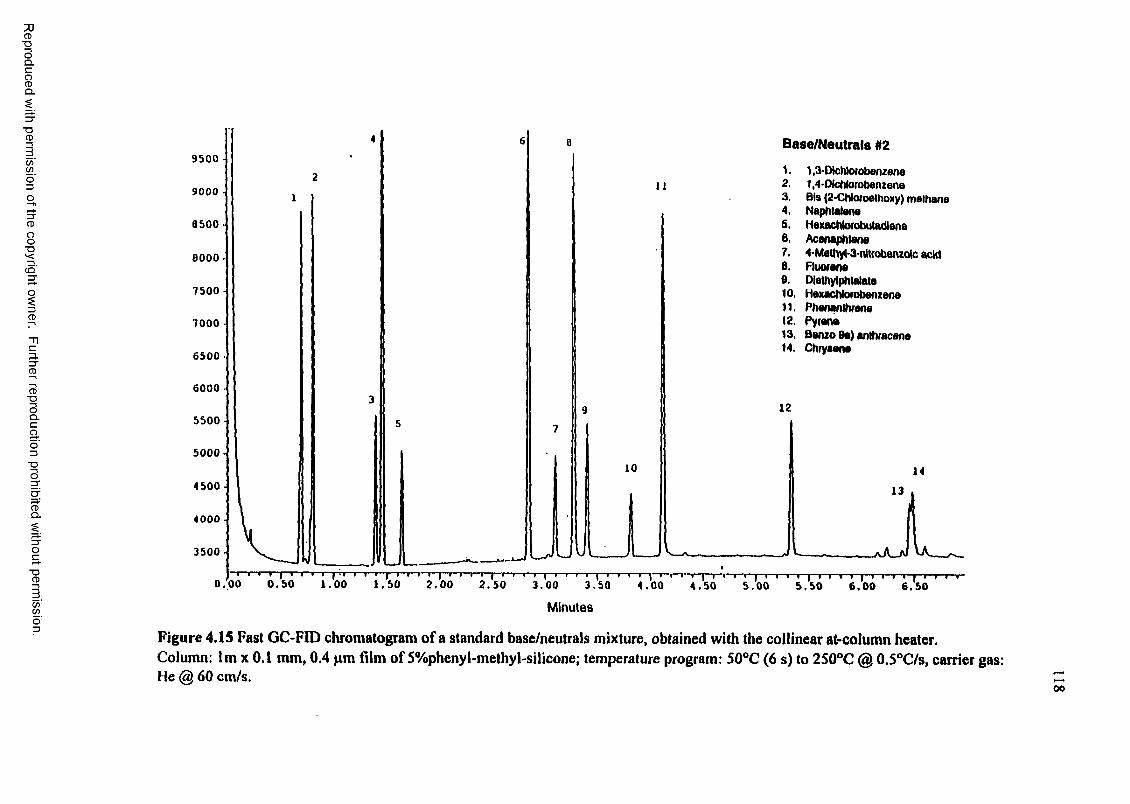
Reproduced
with perm
ission of the
copyright ow
ner. Further
reproduction prohibited
without
permission.
9500
9000
6500
8000 •
7500
7000
6500
6000 ■
5500
5000 '
4500 -
4 000 -
3500 L
u
10
Base/Neutrals # 2
V 1,3-Dtchtofobenzene2. 1,4-DlctUorobenzene3. Bis (2-Chloroelhoxy) methane4. Naphtalena5. Hexachkxobutadiene6. Acenaphtene7. 4-Methyt'3*nluobenzo|o acid8. Floorene8. Diethylphtalate10. Hexachkxobenzene11. Phenanthrene t2. Pyrana13. Benzo 9a) anthracene14, Chryaane
12
14
13
_aA_a
’ ' ' ' I ' ' ' ' I '* ' ' ’ I ' ' ' ' I ' ' ' •' I > ' '• I"| I r - r I—1--|—i I-I I-I- I I I I—I -I- I T-I I I I -r-r-r r r >~| i " i - »— i- r1 »■ i t0 .0 0 0 . 5 0 1 .0 0 1 .5 0 2 .0 0 2 .5 0 3 .0 0 3 .5 0 4 .0 0 4 .5 0 5 .0 0 5 ,5 0 6 .0 0 6 ,5 0
Minutes
Figure 4.15 Fast GC-FID chromatogram of a standard base/neutrals mixture, obtained with the collinear at-column heater.Column: lm x 0.1 mm, 0.4 )im film of 5%phenyl-methyl-silicone; temperature program: 50°C (6 s) to 250°C @ 0.5°C/s, carrier gas: He @ 60 cm/s.
00
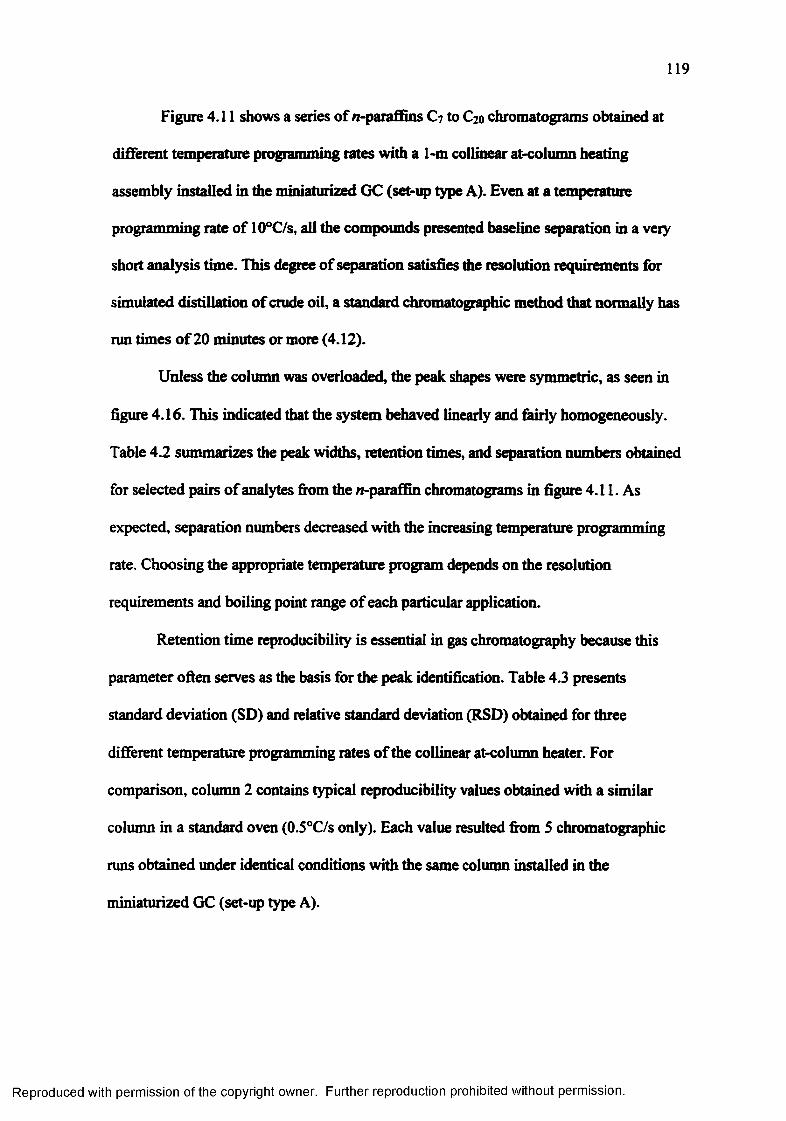
119
Figure 4.11 shows a series o f n-paraffins C7 to C20 chromatograms obtained at
different temperature programming rates with a 1-m collinear at-column heating
assembly installed in the miniaturized GC (set-up type A). Even at a temperature
programming rate of 10°C/s, all the compounds presented baseline separation in a very
short analysis time. This degree of separation satisfies the resolution requirements for
simulated distillation o f crude oil, a standard chromatographic method that normally has
nm times o f 20 minutes or more (4.12).
Unless the column was overloaded, the peak shapes were symmetric, as seen in
figure 4.16. This indicated that the system behaved linearly and fairly homogeneously.
Table 4.2 summarizes the peak widths, retention times, and separation numbers obtained
for selected pairs o f analytes from the n-paraffin chromatograms in figure 4.11. As
expected, separation numbers decreased with the increasing temperature programming
rate. Choosing the appropriate temperature program depends on the resolution
requirements and boiling point range o f each particular application.
Retention time reproducibility is essential in gas chromatography because this
parameter often serves as the basis for the peak identification. Table 4.3 presents
standard deviation (SD) and relative standard deviation (RSD) obtained for three
different temperature programming rates o f the collinear at-column heater. For
comparison, column 2 contains typical reproducibility values obtained with a similar
column in a standard oven (0.5°C/s only). Each value resulted from 5 chromatographic
runs obtained under identical conditions with the same column installed in the
miniaturized GC (set-up type A).
Reproduced with permission of the copyright owner. Further reproduction prohibited without permission.
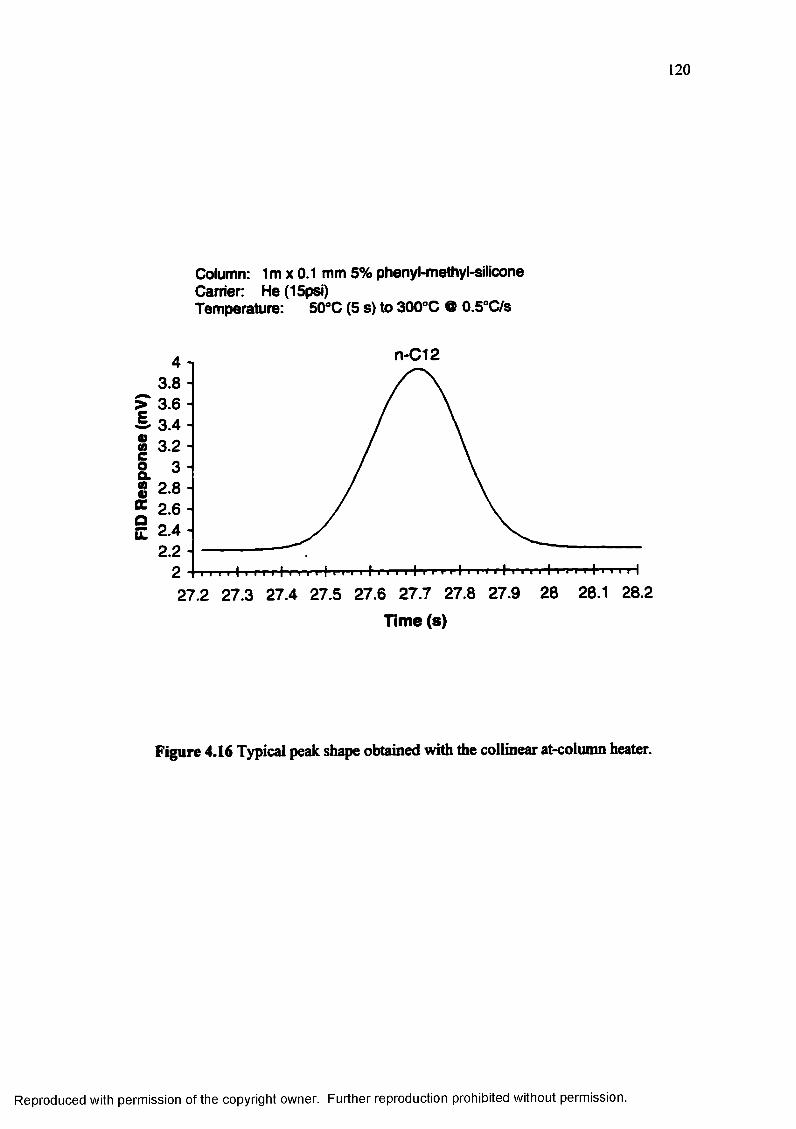
FID
Res
pons
e (m
V)
120
Column: 1m x 0.1 mm 5% phenyl-methyl-silicone Carrier: He (15psi)Temperature: 50°C (5 s) to 300°C 9 0.5°C/s
n-C12
3.83.63.43.2
2.8 -
2.6 -
2.4 - 2.2 -
27.2 27.3 27.4 27.5 27.6 27.7 27.8 27.9 28 28.1 28.2
Time (s)
Figure 4.16 Typical peak shape obtained with the collinear at-column heater.
Reproduced with permission of the copyright owner. Further reproduction prohibited without permission.

121
Table 4.2 Retention times, peak widths and separation numbers at three temperatureprogramming ramps
Compound Retention time (s) Peak W idth (s) Separationnum ber
l°C/s ramp
n-C9 26.31 0.62 9.3n-CIO 40.04 0.71n-C14 99.88 1.10 5.4n-C15 113.95 1.11n-C19 167.02 1.20 4.2n-C20 180.11 1.34
5°C/s ramp
n-C9 10.58 0.31 7.6n-CIO 15.68 0.28n-C14 34.99 0.36 3.5n-C15 38.24 0.37n-C19 51.31 0.50 2.2n-C20 54.55 0.52
10°C/s ramp
n-C9 14.98 021 5.4n-CIO 17.67 0.21n-C14 26.35 0.27 2.5n-C15 28.26 0.28n-C19 36.28 0.50 1.2n-C20 38.84 0.64
Reproduced with permission of the copyright owner. Further reproduction prohibited without permission.

122
The retention times obtained with the collinear heater showed standard deviations
between 0.05 and 0.5 seconds, with a mean value o f 0.3 s (RSD < 0.3%). The average
retention time SD obtained with the HP 5890 GC oven was 0.2s (RSD < 0.1%). Despite
the lower retention time precision o f the at-column heater, its absolute reproducibility
was still satisfactory. RSDs o f less than 1% allow reliable identification o f analytes using
a relative retention time strategy such as the Kovat’s index system (4.13). The lower
precision in retention times achieved with the resistive column heating device indicates
a lower precision or repeatability in the actual temperature profile over time. This is
partly a consequence o f the slightly lower temperature control precision discussed in the
preceding section. Additional causes that may contribute to this phenomenon arise from
heat transfer variabilities, and will be examined and discussed in section 4.3.4.
The retention time reproducibility did not deteriorate with increasing temperature
rates. Moreover, the retention time reproducibility o f the less volatile compounds (C13
and higher) observed under very fast temperature ramps was consistently better than the
reproducibility observed with slower heating rates. In GC, the time that an analyte
spends in the mobile phase does not depend significantly on the column temperature
program (neglecting flow reduction due to increase o f the gas viscosity with
temperature), but is a function of the column flow. On the contrary, the fraction o f time
that a compound remains in the stationary phase is strongly related to the column
temperature. At higher temperature programming rates, a compound remains in the
stationary phase for a smaller fraction of its total retention time. Thus, temperature
fluctuations do cause greater retention time variations in runs performed under slower
Reproduced with permission of the copyright owner. Further reproduction prohibited without permission.
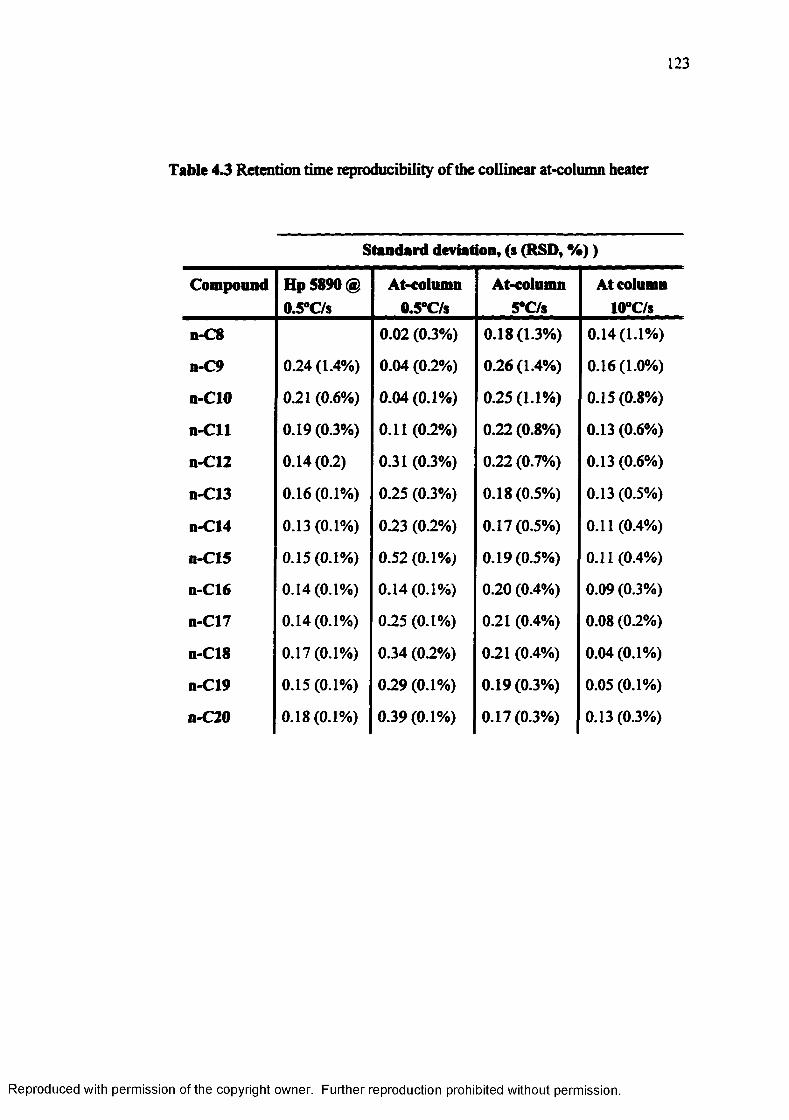
123
Table 4.3 Retention time reproducibility o f the collinear at-column heater
Standard deviation, (s (RSD, % ) )
Compound [email protected]°C/s
At-column0.5°C/s
At-column5°C/s
At column10°C/s
n-C8 0.02 (0.3%) 0.18 (1.3%) 0.14(1.1%)
n-C9 0.24 (1.4%) 0.04 (0.2%) 0.26(1.4%) 0.16 (1.0%)
n-CIO 0.21 (0.6%) 0.04 (0.1%) 0.25(1.1%) 0.15(0.8%)
n-Cll 0.19 (0.3%) 0.11 (0.2%) 0.22(0.8%) 0.13 (0.6%)
n-C12 0.14(0.2) 0.31 (0.3%) 0.22 (0.7%) 0.13 (0.6%)
n-C13 0.16 (0.1%) 0.25 (0.3%) 0.18 (0.5%) 0.13 (0.5%)
n-C14 0.13 (0.1%) 0.23 (0.2%) 0.17(0.5%) 0.11 (0.4%)
n-C15 0.15 (0.1%) 0.52 (0.1%) 0.19(0.5%) 0.11 (0.4%)
n-C16 0.14(0.1%) 0.14(0.1%) 0.20 (0.4%) 0.09 (0.3%)
n-C17 0.14(0.1%) 0.25 (0.1%) 0.21 (0.4%) 0.08 (0.2%)
n-C18 0.17(0.1%) 0.34 (0.2%) 0.21 (0.4%) 0.04(0.1%)
n-C19 0.15(0.1%) 0.29 (0.1%) 0.19 (0.3%) 0.05 (0.1%)
n-C20 0.18(0.1%) 0.39 (0.1%) 0.17(0.3%) 0.13 (0.3%)
Reproduced with permission of the copyright owner. Further reproduction prohibited without permission.
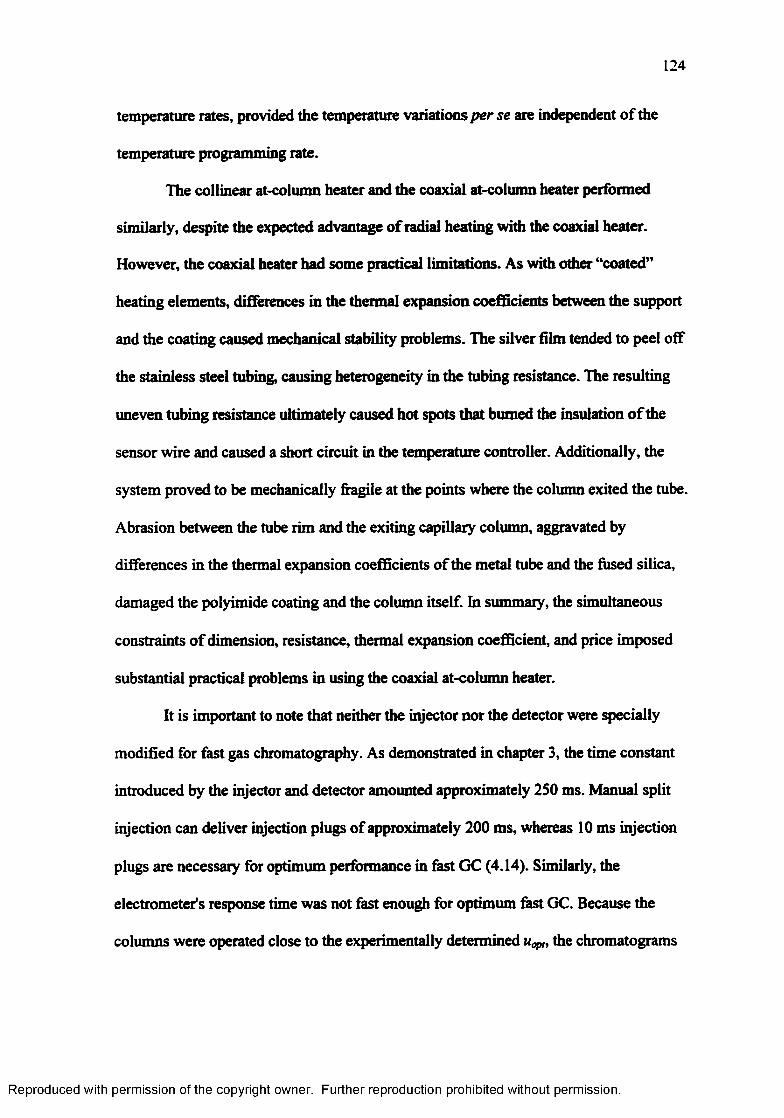
124
temperature rates, provided the temperature variations per se are independent o f the
temperature programming rate.
The collinear at-column heater and the coaxial at-column heater performed
similarly, despite the expected advantage o f radial heating with the coaxial heater.
However, the coaxial heater had some practical limitations. As with other “coated”
heating elements, differences in the thermal expansion coefficients between the support
and the coating caused mechanical stability problems. The silver film tended to peel off
the stainless steel tubing, causing heterogeneity in the tubing resistance. The resulting
uneven tubing resistance ultimately caused hot spots that burned the insulation o f the
sensor wire and caused a short circuit in the temperature controller. Additionally, the
system proved to be mechanically fragile at the points where the column exited the tube.
Abrasion between the tube rim and the exiting capillary column, aggravated by
differences in the thermal expansion coefficients o f the metal tube and the fused silica,
damaged the polyimide coating and the column itself. In summary, the simultaneous
constraints o f dimension, resistance, thermal expansion coefficient, and price imposed
substantial practical problems in using the coaxial at-column heater.
It is important to note that neither the injector nor the detector were specially
modified for fast gas chromatography. As demonstrated in chapter 3, the time constant
introduced by the injector and detector amounted approximately 250 ms. Manual split
injection can deliver injection plugs of approximately 200 ms, whereas 10 ms injection
plugs are necessary for optimum performance in fast GC (4.14). Similarly, the
electrometer's response time was not fast enough for optimum fast GC. Because the
columns were operated close to the experimentally determined uop„ the chromatograms
Reproduced with permission of the copyright owner. Further reproduction prohibited without permission.
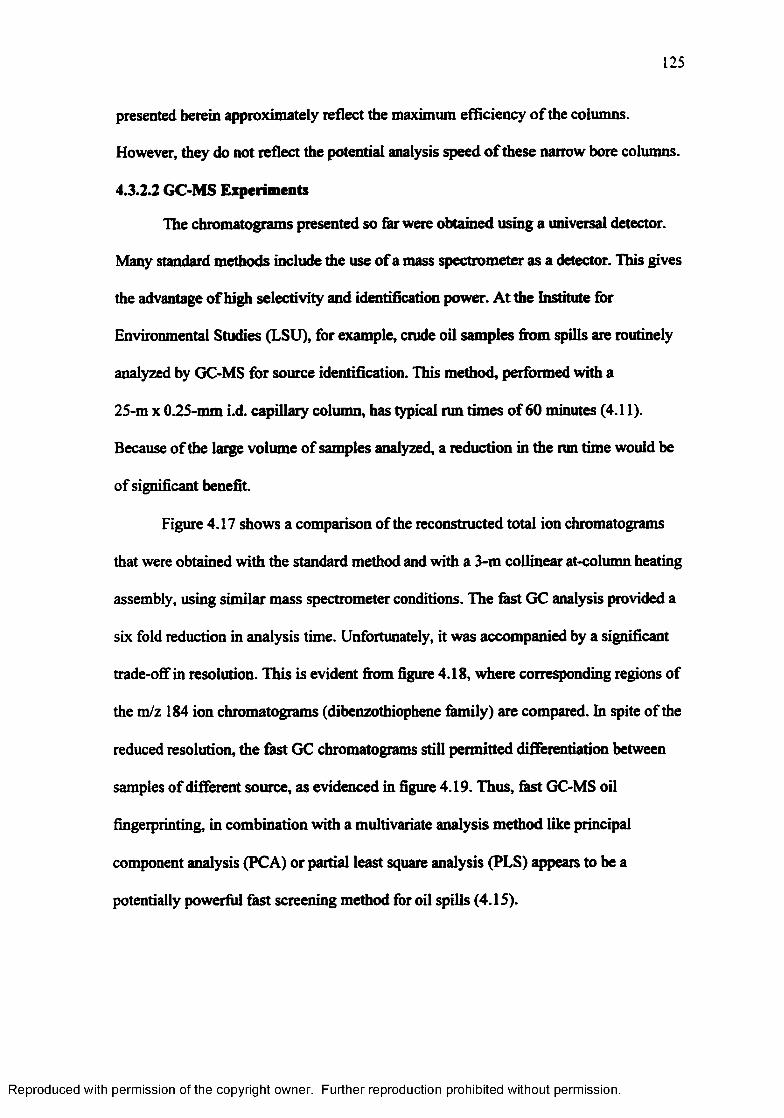
125
presented herein approximately reflect the maximum efficiency o f the columns.
However, they do not reflect the potential analysis speed o f these narrow bore columns.
4.3.2.2 GC-MS Experiments
The chromatograms presented so far were obtained using a universal detector.
Many standard methods include the use o f a mass spectrometer as a detector. This gives
the advantage o f high selectivity and identification power. At the Institute for
Environmental Studies (LSU), for example, crude oil samples from spills are routinely
analyzed by GC-MS for source identification. This method, performed with a
25-m x 0.25-mm i.d. capillary column, has typical run times o f 60 minutes (4.11).
Because o f the large volume o f samples analyzed, a reduction in the run time would be
of significant benefit
Figure 4.17 shows a comparison of the reconstructed total ion chromatograms
that were obtained with the standard method and with a 3-m collinear at-column heating
assembly, using similar mass spectrometer conditions. The fast GC analysis provided a
six fold reduction in analysis time. Unfortunately, it was accompanied by a significant
trade-off in resolution. This is evident from figure 4.18, where corresponding regions of
the m/z 184 ion chromatograms (dibenzothiophene family) are compared. In spite o f the
reduced resolution, the fast GC chromatograms still permitted differentiation between
samples of different source, as evidenced in figure 4.19. Thus, fast GC-MS oil
fingerprinting, in combination with a multivariate analysis method like principal
component analysis (PCA) or partial least square analysis (PLS) appears to be a
potentially powerful fast screening method for oil spills (4.15).
Reproduced with permission of the copyright owner. Further reproduction prohibited without permission.

126
ur.cia. rice
3 0 0 0 0 0 -
2 5 0 0 0 0 -
2000 0 0 -
1 5 0 0 0 0
100000
5 0 0 0 0
4o!oo 5 0 . 0 030 . 0 02 0 . 0010 . 0 0.sie— >Q - 00
1 3 0 0 0 0 4
1 3 0 0 0 0 4
2 0 0 0 0 ■
100000 -
8 0 0 0 0 -
6 0 0 0 0 -
4 0 0 0 0 -
2 0 0 0 0 -
40 . 0 0 5 0 . 0 03 0 . 0 02 0 . 0 0time—>0.00 1 0 . 0 0
Figure 4.17 Comparison of the reconstructed total ion chromatograms of a gas oil sample (unknown source), obtained with the standard high resolution GC-MS method (top), and fast GC-MS using the collinear at-column heater (bottom).
Reproduced with permission of the copyright owner. Further reproduction prohibited without permission.
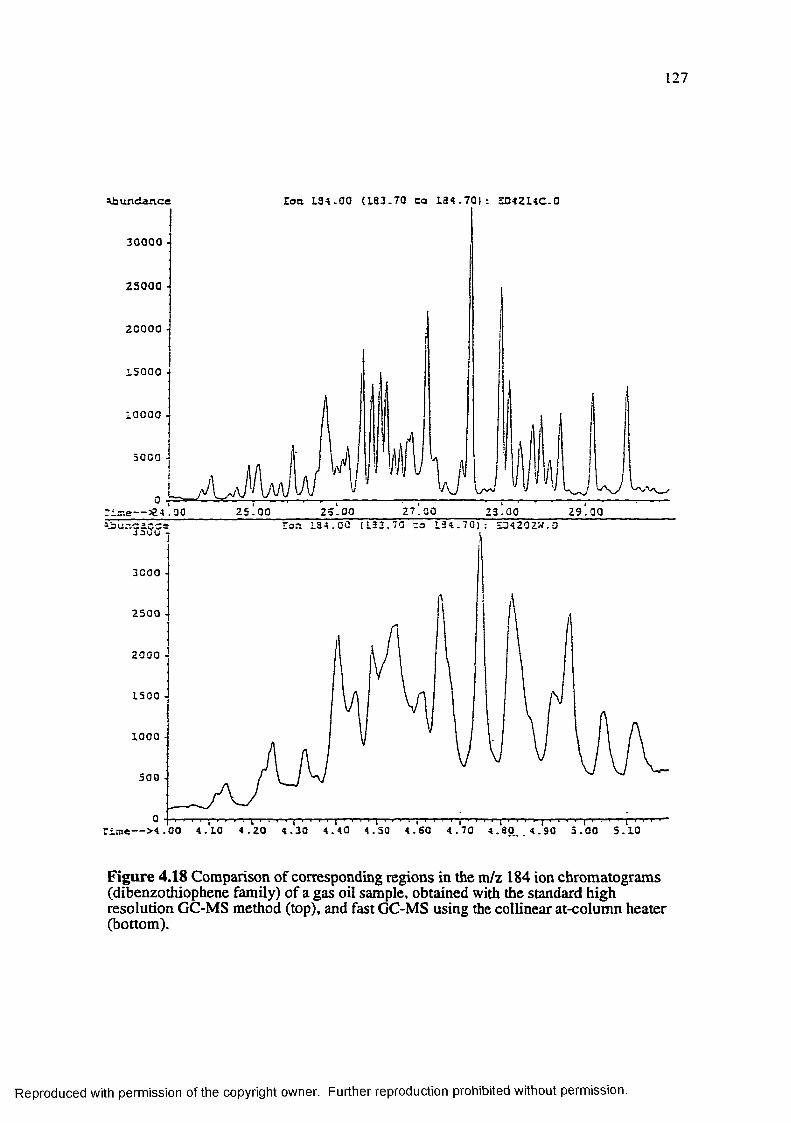
127
ron 1.34.00 (1.33.70 Co i a 4 . 7 0 | : 2Q42UC-0
3 0000 ■
2 3000 •
2 0 0 0 0 •
15 000 ■
10000 -
5000 ■
r i s s e — 5 2 4 ‘. 0 0 23^002 5 ‘-00 2 9 ‘.00z s l o o 2 7 . 0 0
3000 -
25 00 -
20 00 -
1500 -
500 •
Figure 4.18 Comparison of corresponding regions in the m/z 184 ion chromatograms (dibenzothiophene family) of a gas oil sample, obtained with the standard high resolution GC-MS method (top), and fast GC-MS using the collinear at-column heater (bottom).
Reproduced with permission of the copyright owner. Further reproduction prohibited without permission.
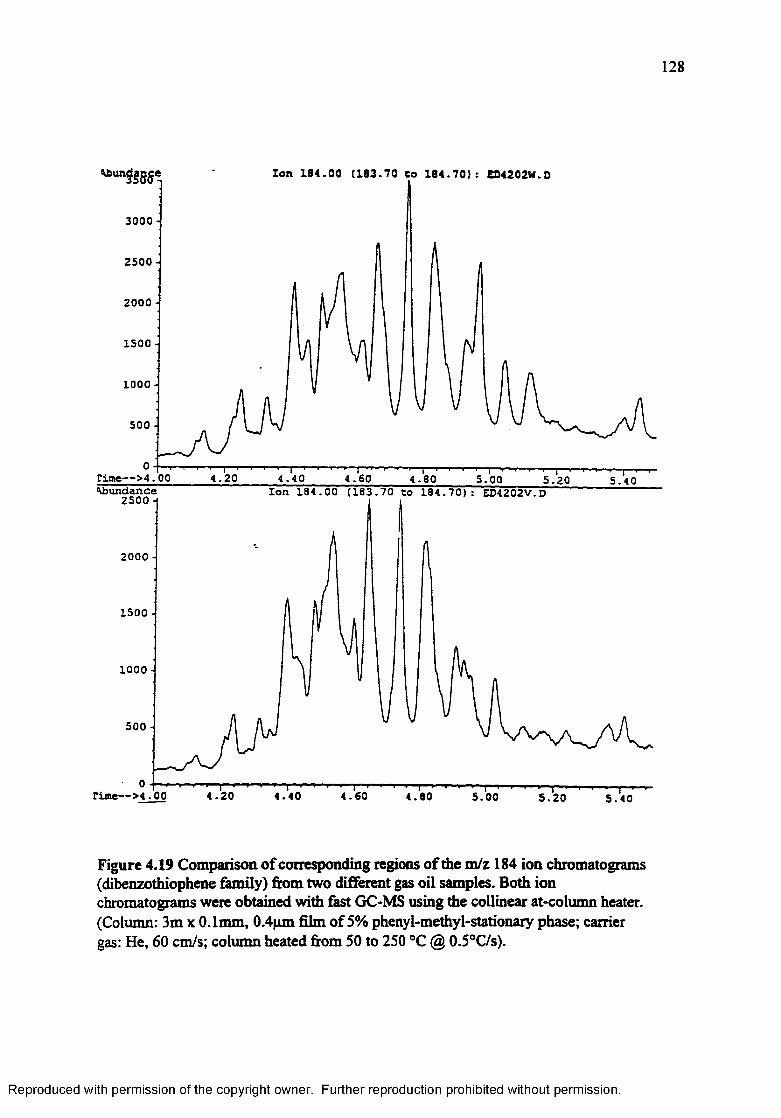
128
Xon 184.00 (183.70 co 184.70): ED4202W.D
3000
2500
2000
1500
1000
500
Tim e— > 4 .0 0 4 .2 0 4 .4 0 4 .6 0 4 .8 0 5 .00 5 .2 0 5 .4 0Io n 1 8 4 .0 0 ( 1 8 3 .7 0 to 1 8 4 . 7 0 ) : ED4202V.D
2 0 0 0
1500
1 000
500
r im e — > 4 . 0 0 4.20 4.40 4.60 4.80 5.00 5 . 2 0 5.40
Figure 4.19 Comparison of corresponding regions of the m/z 184 ion chromatograms (dibenzothiophene family) from two different gas oil samples. Both ion chromatograms were obtained with fast GC-MS using the collinear at-column heater. (Column: 3m x 0.1mm, 0.4pm film of 5% phenyl-methyl-stationary phase; carrier gas: He, 60 cm/s; column heated from 50 to 250 °C @ 0.5°C/s).
Reproduced with permission of the copyright owner. Further reproduction prohibited without permission.
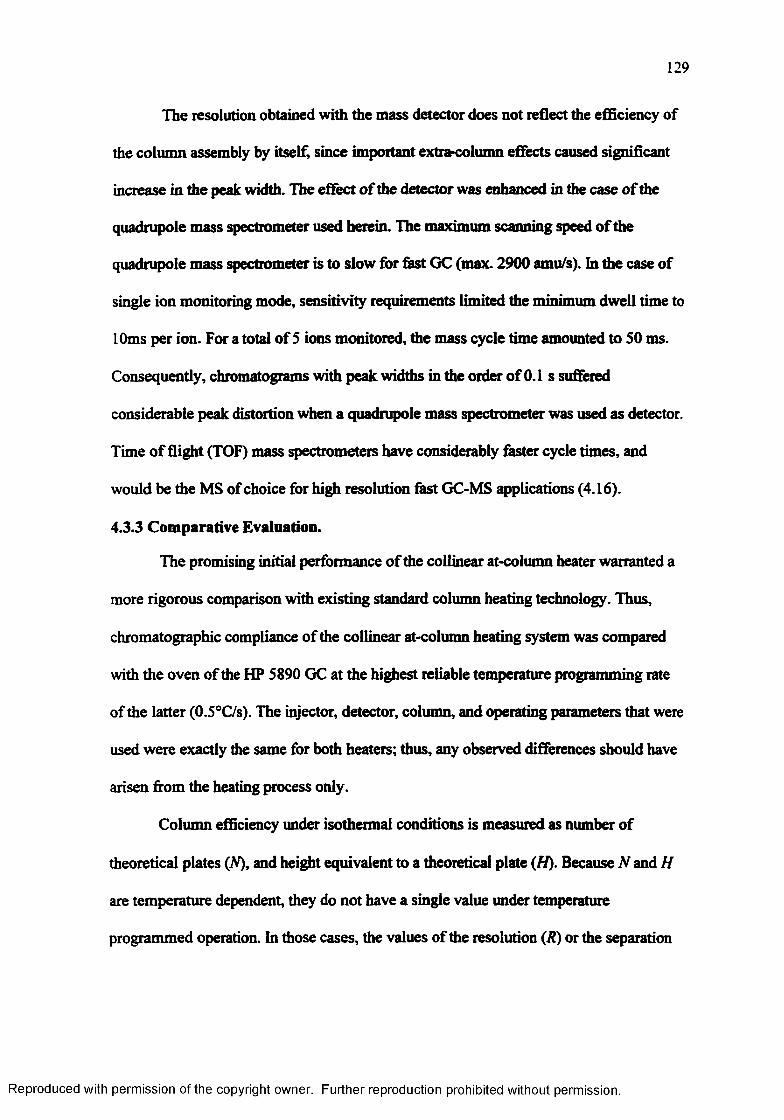
129
The resolution obtained with the mass detector does not reflect the efficiency of
the column assembly by itself, since important extra-column effects caused significant
increase in the peak width. The effect o f the detector was enhanced in the case o f the
quadrupole mass spectrometer used herein. The maximum scanning speed of the
quadrupole mass spectrometer is to slow for fast GC (max. 2900 amu/s), hi the case of
single ion monitoring mode, sensitivity requirements limited the minimum dwell time to
10ms per ion. For a total o f 5 ions monitored, the mass cycle time amounted to SO ms.
Consequently, chromatograms with peak widths in the order o f 0.1 s suffered
considerable peak distortion when a quadrupole mass spectrometer was used as detector.
Time o f flight (TOF) mass spectrometers have considerably faster cycle times, and
would be the MS of choice for high resolution fast GC-MS applications (4.16).
4.3.3 Comparative Evaluation.
The promising initial performance o f the collinear at-column heater warranted a
more rigorous comparison with existing standard column heating technology. Thus,
chromatographic compliance of the collinear at-column heating system was compared
with the oven of the HP 5890 GC at the highest reliable temperature programming rate
of the latter (0.5°C/s). The injector, detector, column, and operating parameters that were
used were exactly the same for both heaters; thus, any observed differences should have
arisen from the heating process only.
Column efficiency under isothermal conditions is measured as number of
theoretical plates (N), and height equivalent to a theoretical plate {H). Because N and H
are temperature dependent, they do not have a single value under temperature
programmed operation. In those cases, the values of the resolution (R) or the separation
Reproduced with permission of the copyright owner. Further reproduction prohibited without permission.

130
number (TZ) are commonly used to measure column efficiency (see section 2.10, p. 55).
All these parameters are determined from the retention time and the peak width o f one or
more analytes. However, some factors affect the retention times and peak widths
differently (4.17). The aim o f this work was to compare the performance achieved with
the conventional GC oven versus the collinear at-column heating device. For every set of
comparative experiments, exactly the same column and conditions were used. The
resulting retention times and peak widths were analyzed independently, and the
separation numbers (TZ) were compared.
As described in the experimental section, chromatograms o f /i-paraffins were
obtained first with the bare column in the HP 5890 oven. The same column, assembled
into a collinear at-column heating system was installed in the HP 5890. Because o f the
large physical distance between the injector and the detector in the HP 5890 oven,
relatively long portions o f the at column heater assembly had to be extended out o f the
insulation. These portions were subjected to greater thermal losses than the main portion
of the column. To ensure thermal homogeneity along the whole column, the ends were
heated simultaneously with the HP 5890 oven heater, as described in the experimental
part (experimental set-up type B and C, section 4.2.3.2).
The type B arrangement eliminated completely the possibility of any influence of
the oven temperature on the temperature of resistively heated column. It was expected to
reflect only the effect o f the resistive heating upon the chromatographic performance.
The TZ values that resulted from this type of arrangement showed significant reductions
compared to the runs in the HP 5890 oven. Examination o f the peak widths of the
n-paraffins Cio to C20 showed an exponential increase in the variance of the signals
Reproduced with permission of the copyright owner. Further reproduction prohibited without permission.
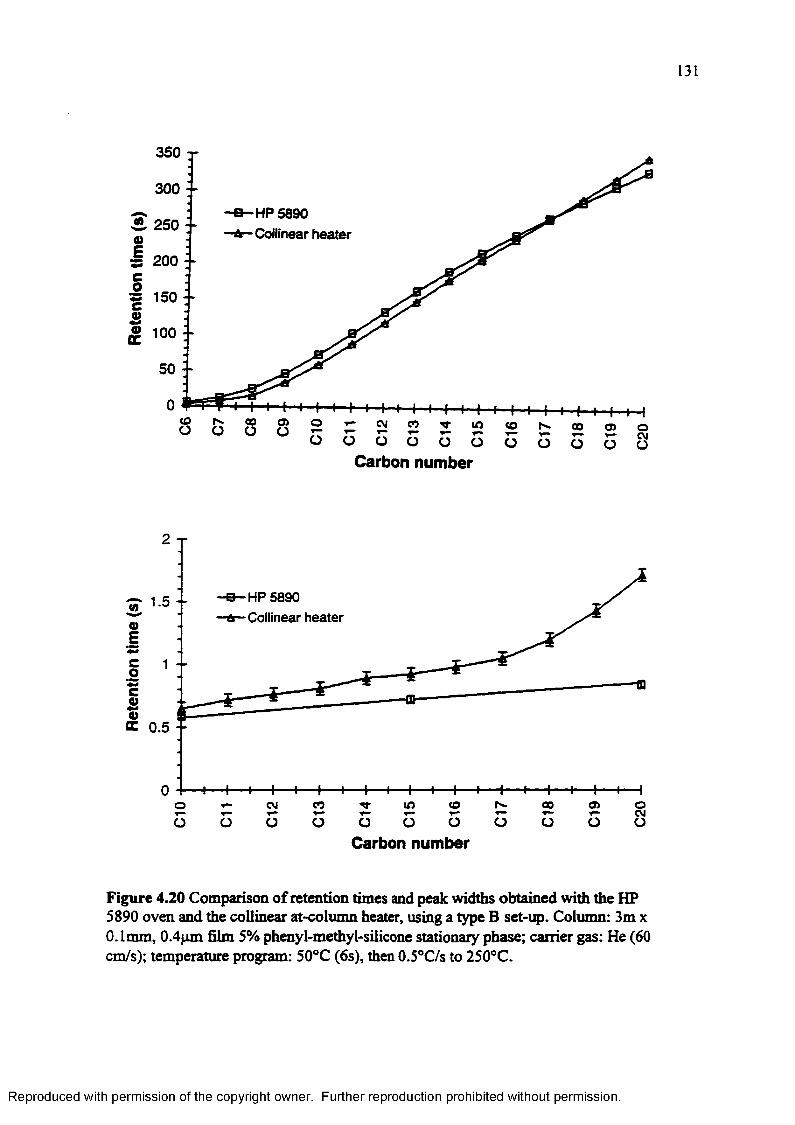
131
350
300
HP 5890 Collinear heater2 . 250
200
150 --
a> © in 00 o>C\J
Carbon number
2 T
HP 5890 Collinear heater
1.5 --
00 0.5 --
co CO 05 oCM
in aoo CM
Carbon number
Figure 4.20 Comparison o f retention times and peak widths obtained with the HP 5890 oven and the collinear at-column heater, using a type B set-up. Column: 3 m x 0.1mm, 0.4pm film 5% phenyl-methyl-silicone stationary phase; carrier gas: He (60 cm/s); temperature program: 50°C (6s), then 0.5°C/s to 250°C.
Reproduced with permission of the copyright owner. Further reproduction prohibited without permission.
132
corresponding to rt-C\i to /1-C20 (figure 4.20). Under linear temperature programmed
conditions, GC signals usually present similar peak widths over the entire solute
volatility range (see section 2.10, p. 54), as observed for the chromatograms obtained
with the HP 5890 oven heater (figure 4.20). The exponential increase in peak width
indicated either a very strong deviation o f the temperature ramp from linearity (i.e.,
continuous deceleration o f the heating rate), or the presence o f a cold zone close to the
detector.
Since the maximum relative difference in retention times that was observed
between the HP 5890 oven and the collinear at column heater was only 20s (6 %), strong
deviations from the expected linear temperature ramp seemed unlikely (assuming that
the results obtained with the conventional oven correspond to a linear ramp).
Additionally, the pronounced peak width increase for the least volatile n-paraffins
pointed towards the presence o f a cold zone. After examining the experimental set-up
used (figure 4.4), it seemed probable that the uncontrolled section of the column that
penetrated the oven top constituted a relatively cold zone in which high boiling point
compounds experienced significant peak broadening. In addition, inspections of the
column temperature with an infrared temperature sensor probe revealed temperature
differences between the column coils at the center o f the assembly, and the column coils
at the extremes of the assembly. This long range gradient resulted from intercoil heat
transfer that was less efficient for the last coils because they had only one neighboring
column coil. Also, larger temperature gradients between the end coils and their
environment (no heated elements at one side) increased the heat transfer rate from these
coils to the environment. As a consequence, the temperature of those portions of the
Reproduced with permission of the copyright owner. Further reproduction prohibited without permission.
133
column decreased in comparison to the center part o f the column coil cylinder. This
created an additional cold zone close to the detector end, that contributed to the
exponential peak width increase observed for the less volatile analytes.
In order to eliminate this potential cold zone, the experiment was repeated using
a type C set-up, with thick sheets of glass wool as column insulating material, as
described in the experimental part (section 4.2.3.2). This arrangement completely
eliminated the possibility o f a cold zone along the column. It also minimized possible
temperature gradients along the column that could arise from intercoil heat transfer.
Figure 4.21 presents a comparison of the retention times and peak widths for the
/7-paraffins C 10-C20 obtained with the HP 5890 oven and with the collinear at-column
heater, using arrangement C. The peak widths obtained with the collinear at-column
heater still were larger than those obtained with the HP 5890 oven. However, the peak
widths did not increase exponentially with the carbon number of the analyte, indicating
that cold zones were reduced. In section 4.3.5, causes o f the peak width differences will
be explored and discussed.
Statistical analysis confirmed that the differences in retention times that were
observed between the two heating systems were significant for the paraffins C15 and
higher. Also, the interaction between the heating device and the carbon number o f the
analyte was statistically significant. In other words, the differences between the retention
times that were obtained for the collinear at-column heater and the GC oven varied with
the analyte. The retention times of the compounds eluted from the resistively heated
columns were larger than the retention times eluted from the column heated with the
Reproduced with permission of the copyright owner. Further reproduction prohibited without permission.
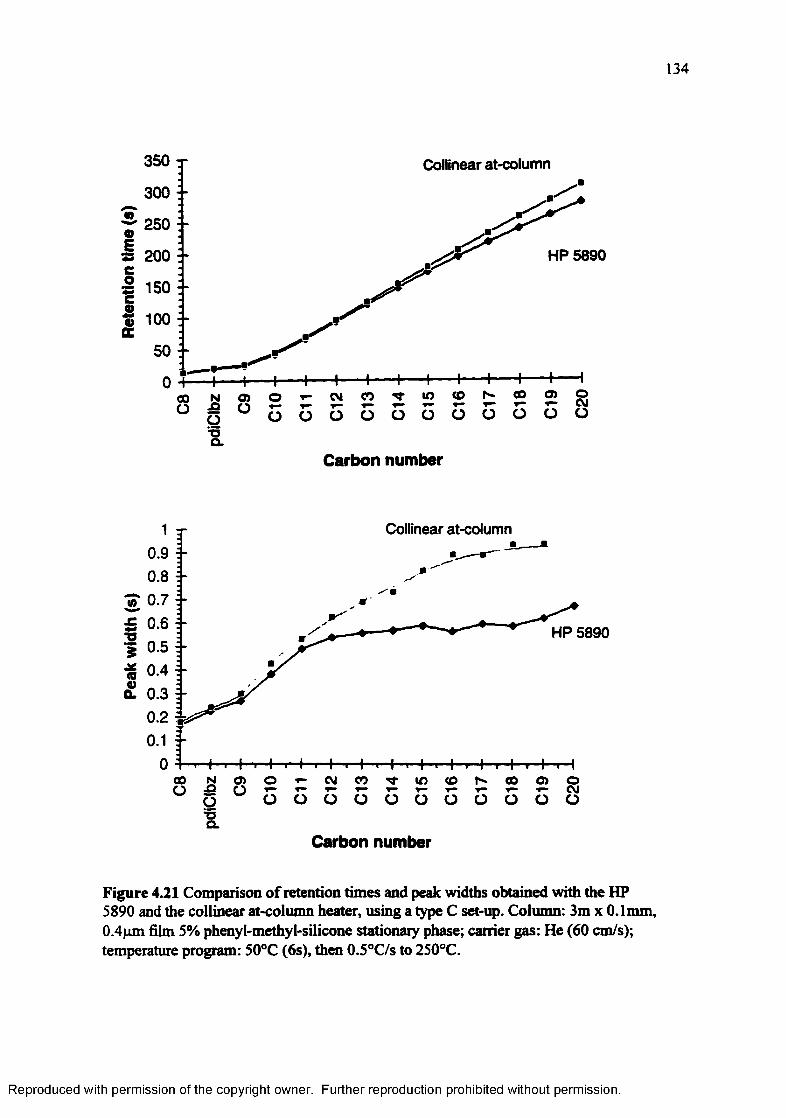
134
350 t
300 --<0r 25001 200 i -e» 150:-
§ 100 i -S
50 i-
Coliinear at-column
HP 5890
+ H 1-----1-----1-----1-----H -I 1------1------1------100 N ® O r C M O t l O « N « ® g0 ~ 0 5 o o o o o u o o o oo
CL
Carbon number
Collinear at-column
0.9 i-0.8 ■ -
0.6 i-
0.4 i-0.30.2 i0.1 i-
HP 5890
f—i—I—t—I—r i -|' i | i | i
p ° o o o o o o o o o o o sCL
Carbon number
Figure 4.21 Comparison o f retention times and peak widths obtained with the HP 5890 and the collinear at-column heater, using a type C set-up. Column: 3m x 0.1mm, 0.4pm film 5% phenyl-methyl-silicone stationary phase; carrier gas: He (60 cm/s); temperature program: 50°C (6s), then 0.5°C/s to 250°C.
Reproduced with permission of the copyright owner. Further reproduction prohibited without permission.
135
conventional oven. This absolute difference in retention times increased with the carbon
number o f the analyte; the relative difference was approximately 10% for n-Cn to n- C20-
The increase in retention time indicated that the compounds in the directly heated
column experienced lower temperature than the compounds in the column heated with
the oven, at the same temperature set-point. This could result from several factors:
a) an actual error in the control function used, i.e. the assumed resistance-
temperature relationship o f the sensor wire
b) inefficient temperature transfer to the stationary phase in case of the directly
heated system
c) uneven heating of the column resulting in accurate average column
temperatures but non-homogeneous localized temperatures.
The following sections explore the these three possibilities.
4.3.4 Accuracy of the Tem perature Control
In section 4.3.1 it was demonstrated that the temperature control accurately
followed the control function, that is, the sensor wire resistance increased according to
the selected temperature program and the temperature-resistance equation. The results of
the preceding section showed that the actual temperature o f the resistively heated column
appeared to be below set-point. Thus, an error in the temperature-resistance equation
seemed possible.
Careful characterization of the sensor wire revealed a significant source o f error
in the temperature control function. The actual resistance versus temperature profile of
the Nickel Alloy 120™ wire followed a quadratic relationship, as evidenced in figure
4.22a. Thus, when the temperature control unit controlled the system for a linear increase
Reproduced with permission of the copyright owner. Further reproduction prohibited without permission.
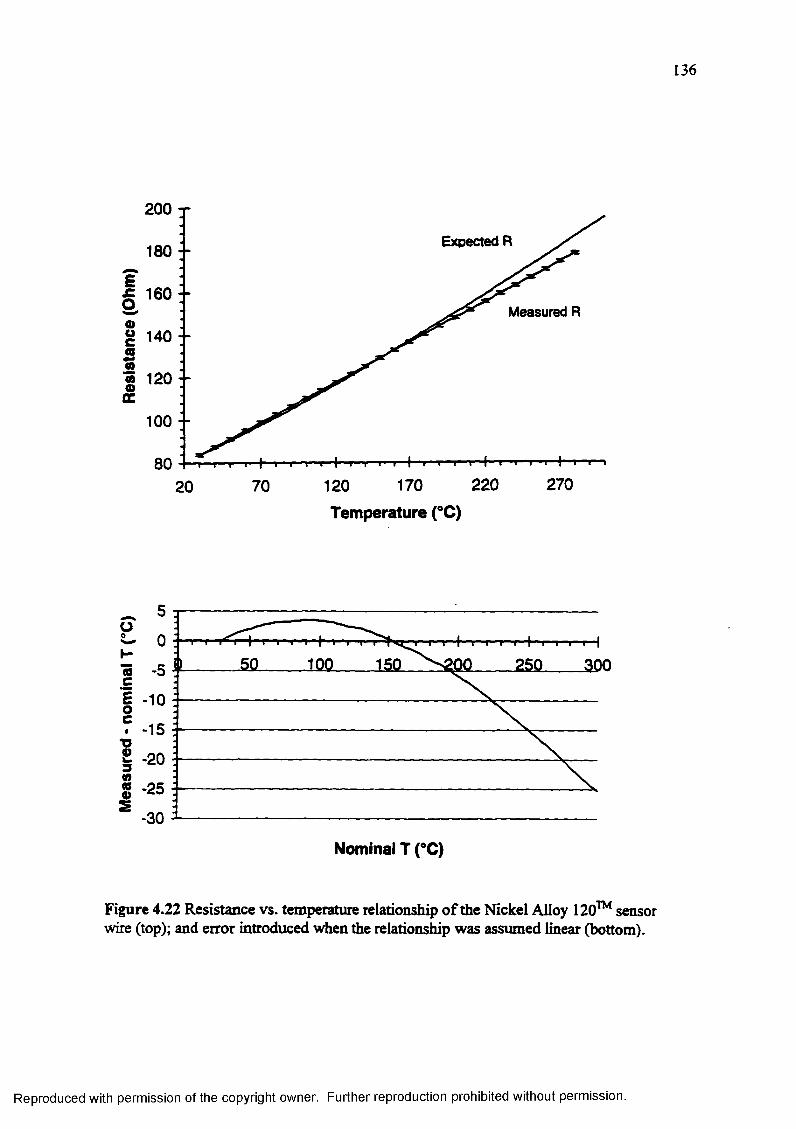
136
2 0 0
Expected R180
| 16°
0g 140a0a 120 0tr
100
Measured R
2702201701207020Temperature (°C)
1 0 0 iso oo 2 5 0 3 0 0
-10
a - 2 5
-30Nominal T (°C)
Figure 4.22 Resistance vs. temperature relationship o f the Nickel Alloy 120™ sensor wire (top); and error introduced when the relationship was assumed linear (bottom).
Reproduced with permission of the copyright owner. Further reproduction prohibited without permission.
137
in the sensor wire resistance, the resulting temperature-time profile was not linear but
quadratic. The coefficient o f the quadratic component in the resistance vs. temperature
relationship, obtained by least square regression was only 0.08% o f the coefficient of its
linear component. Nevertheless, this factor became important at elevated temperatures.
For example, at a nominal temperature of200°C, the actual temperature was only 197°C.
Figure 4.22b shows the relationship between the nominal temperature and the measured
temperature for the sensor wire and the control equation used.
This problem had two possible solutions. One was to modify the control equation
in the EPROM. Achieving linear temperature control this way was relatively simple.
However, reading a temperature back from a given measured resistance was not a trivial
programming task. It implied the solution o f a second degree equation, and would
impose significant additional computing demands on the microprocessor. The other
alternative was to substitute the nickel alloy wire for a pure platinum wire that has a
well-characterized linear temperature-resistance relationship. This alternative was tested
experimentally, using a lm column.
Figure 4.23a presents an overlay o f the retention times obtained using the original
nickel sensor wire with the original linear equation, the platinum wire as sensor, and the
HP 5890 oven heater. The retention times obtained with the platinum sensor wire
presented statistically significant differences from the retention times obtained with the
original nickel alloy sensor wire. The differences in retention times followed the
temperature error trend calculated when the nickel alloy sensor wire was used for the
temperature control (see figure 4.22). However, as seen in figure 4.23, the magnitude of
the retention time differences obtained Math both sensor wires was small compared to the
Reproduced with permission of the copyright owner. Further reproduction prohibited without permission.
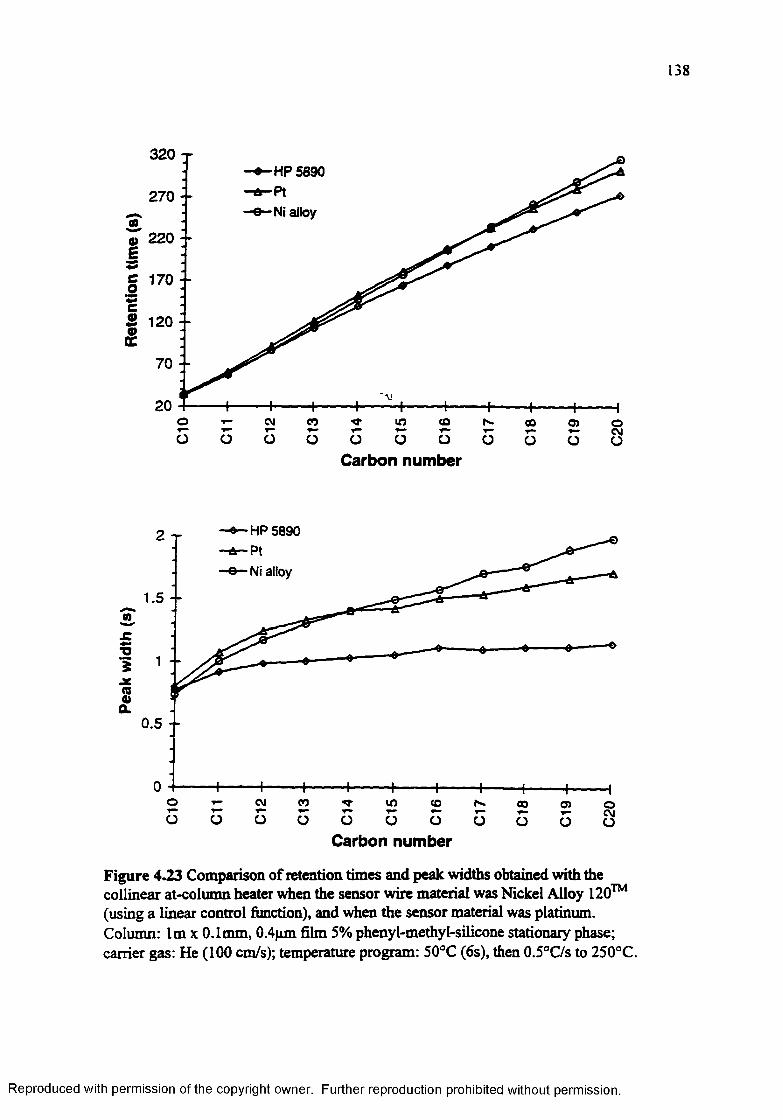
138
320 ~rHP 5690
270Ni alloy(0
7 220 £g 170-- oe«vcc
70 --
20o CMY"“ CO com oo a> o
CM
Carbon number
HP 58902 T
Ni alloy
1.5 --co£TJi
.X(B0)0L
0.5 --
o CM CO in co co 05 oCM
Carbon number
Figure 4.23 Comparison of retention times and peak widths obtained with the collinear at-column heater when the sensor wire material was Nickel Alloy 120™ (using a linear control function), and when the sensor material was platinum. Column: lm x 0.1mm, 0.4nm film 5% phenyl-methyl-silicone stationary phase; carrier gas: He (100 cm/s); temperature program: 50°C (6s), then 0.5°C/s to 250°C.
Reproduced with permission of the copyright owner. Further reproduction prohibited without permission.

139
differences o f retention times between the resistively heated column and the HP 5890
oven. This indicated that more important effects than the lack o f linearity in the
resistance temperature relationship o f the sensor wire retain the solutes in the resistively
heated column longer than in the column heated with the conventional oven. Non-
homogeneous heating along the column, and slow temperature transfer to the stationary
phase are two possible causes that will be explored in the following sections.
The use o f a platinum wire had several practical limitations. It is a very expensive
material, and not readily available with a polyimide insulating coating. Specially ordered
coated platinum wire had a prohibitively high cost. Therefore we used bare wire, which
turned out to be extremely fragile. The construction o f an at-column heater assembly
with this wire was impractical. Consequently, and considering the negligible magnitude
in chromatographic improvement obtained with the platinum wire, the nickel alloy
sensor was used throughout this work.
Figure 4.23b shows the peak widths o f n-Cio to n-C20 obtained with the collinear
at-column heater, using the platinum wire as sensor, and an experimental set-up type C,
with glass wool as insulating material. With this type o f arrangement, the width of the
signals corresponding to the /7-paraffins C13 and higher increased only slightly with the
carbon number of the solute. However, it is also evident from the graph that the analytes
eluted from the directly heated column with a 50% larger peak width than from the
column heated with the conventional oven. This increase was too large to result from the
slightly larger retention times o f the o f the compounds in the directly heated column. The
comparison of the TZ values showed a significant reduction in column efficiency for the
Reproduced with permission of the copyright owner. Further reproduction prohibited without permission.
140
collinear at-column heater assembly. Consequently, an additional phenomenon induced
by the direct heating mode must have affected the column efficiency.
To summarize, the comparative study o f the collinear at-column heating mode
versus the conventional GC oven heating mode demonstrated that:
a) Retention times obtained from the collinear at-column heater were slightly
larger than those obtained from the conventional oven (<10%). The
difference increased with the elution temperature o f the analyte, indicating
that at high column temperatures, the directly heated column is colder than
expected.
b) Peak widths o f compounds with retention indices o f 1300 and higher were up
to 50% larger for directly heated columns as compared to conventionally
heated columns.
c) Column efficiencies, measured by TZ values, were consistently smaller
(TZ<20% lower) in the directly heated column than in the column heated
with the conventional oven.
The following section covers some possible causes for these observations.
4.3.5 Causes of Efficiency Erosion
The peak width or variance o f a chromatographic signal, together with its
retention time, reflect the efficiency o f the system. The results presented in section 4.3.4
showed that the peak widths obtained with the at-column heater were about 50% larger
than those obtained when the column was heated with the HP 5890 convection oven.
Retention times, on the contrary, were only slightly longer with the directly heated
Reproduced with permission of the copyright owner. Further reproduction prohibited without permission.
141
column (< 10%). This represented a 20%-30% efficiency loss o f the system, measured in
terms of TZ values o f consecutive n-paraffins.
The general model o f the peak broadening rate (Eq. 2.53 and 2.59) includes the
linear carrier gas velocity, column dimensions, carrier gas and stationary phase
characteristics, pressure drop, and extra-column effects as factors that affect the column
efficiency. Blumberg demonstrated that spatial gradients (non-uniformities) o f one or
more o f the factors included in the Golay-Giddings model have the net effect of
decreasing the column’s efficiency (4.18-4.20). The non-uniformity can refer to gradients
in the column packing, the stationary phase, the pressure, the temperature, or any other
factor that affects retention. Consequently, temperature gradients in the column induced
by the direct heating process could cause the observed loss in column efficiency.
The collinear wire used as heating element in the at-column heater could cause
temperature non-uniformities in two possible directions: across and along the column.
The following two sections discuss these two possibilities.
4.3.5.1 Tem perature Gradients Along the Column
In the collinear at-column heater, the heater wire randomly touched the outer
column wall. This affected the heat transfer processes between the wire and the column,
and likely caused thermal gradients along the column. The following paragraphs include
a very brief review o f the heat transfer processes (4.21). It will allow an analysis of the
impact o f the time variant distance distribution between the heater and the column.
The temperature of any object is a physical manifestation o f an energy form
known as heat. The heat is a component of the total energy of the object. In order to
change the temperature o f a material, a change in the amount o f heat stored in that
Reproduced with permission of the copyright owner. Further reproduction prohibited without permission.
142
material is necessary. This change can result from the transformation o f other energy
forms, or from heat exchange or heat flow. The variation o f the temperature of a material
with the amount o f heat stored in it depends on the specific heat o f the substance. The
specific heat is defined as the energy necessary to increase one mass unit o f a substance
by one °C. Thus,
where AE is the energy change, cp the specific heat, m the total mass o f the substance,
and AT the temperature change of the substance.
When electrical current passes through a resistor, the electrical energy is
transformed to heat or thermal energy according to the expression:
(power), / is the current that passes through the resistor, and R is the electrical resistance.
The combination of equations 4.4 and 4.5 yields equation 4.6:
Thus, when the current pulses passed through the heater wire, the temperature of
the heater wire increased in direct proportion to the total current and the wire resistance,
and in inverse proportion to the mass o f the wire and its specific heat. Equation 4.6
applies only if no heat exchange occurs between the heater wire and its environment. In
reality energy passes as heat, from a system at higher temperature (heater wire) to the
AE = cp x m x A T [4.4]
[4.5]
where is the total amount o f electrical energy transformed into heat per unit time
Reproduced with permission of the copyright owner. Further reproduction prohibited without permission.

143
system at lower temperature (surroundings). In these cases, equation 4.7 substitutes
equation 4.6, to satisfy energy balance requirements:
AT (/2 x £ ) - q *Af cp x m
[4.7]
where q* represents the rate of heat transfer from the system to the environment. It is this
heat transfer that caused the temperature o f the sensor wire and the column to increase.
Heat transfer occurs through various processes; they are usually classified into
three basic types or modes: conduction, convection, and radiation, hi practice, heat
transfer most often involves two or three o f these modes occurring simultaneously.
Heat conduction refers to heat transfer by exchange of the kinetic energy of the
molecules, without appreciable displacement o f matter. Convection is the heat transfer
mechanism that takes place in a fluid because o f a combination of conduction within the
fluid and thermal energy transport from one point in space to another by means o f the
displacement o f the fluid. Convection is classified into forced and free convection. In the
former case, the movement of the fluid is caused by external mechanical means; in the
latter case the fluid motion is caused by density gradients originated by the temperature
differences.
Finally, thermal radiation is a heat transfer process that results from
electromagnetic radiation emitted from the surface of a body. It is the only heat transfer
mode that does not require a medium of transport.
In the case of the at-column heater assembly, conduction and free convection
were the main transfer mechanisms. Where the heater wire touched the column or the
sensor wire, these elements were heated by direct conduction. Wherever air was between
Reproduced with permission of the copyright owner. Further reproduction prohibited without permission.
144
the heater and the column or sensor, heat transfer occurred by a free convection
mechanism.
The rate o f heat flow due to conduction, that occurs across a region of surface
area A and thickness n , is proportional to the surface area (A), the thermal conductivity
GO o f the substance through which the heat is transferred, and the temperature gradient
across that surface. This is expressed in the following equation:
dTq * = - * 4 ' f c t4-8!
The important point in this equation is that the rate o f heat transfer depends
directly on the thermal conductivity o f the medium. The rate at which the temperature of
the surroundings increases depends additionally on the specific heat and the density of
the surrounding material. The general law o f conduction (in one dimension) states:
z . M U ) [4.9,dt p c p { d x - )
The value , abbreviated a , is called the thermal difiusivity. It is a physical
property o f a material.
The thermal difiusivity of air (at 20°C) is approximately 2 x 10"5 m2/s; the
thermal difiusivity of fused silica is an approximately 1CT7 m2/s. If conduction was the
only heat transfer process present, the temperature o f the air surrounding the wire would
increase much faster than the temperature o f the fused silica that touches the wire. After
a short delay time, the fused silica regions that were not touched by the wire would be
surrounded by air at the same temperature as the surface of the wire. Therefore, the heat
conduction process through the fused silica would be similar to the heat transfer
Reproduced with permission of the copyright owner. Further reproduction prohibited without permission.
145
observed at the points where the wire touched the column. However, the air that
surrounded the heater wire expanded upon heating, and diffused away from the wire
surface, being replaced immediately by colder air. The movement o f the air, as well as its
expansion upon heating represents work done by the gaseous system, using heat as
energy source. The mathematical treatment o f free convection is complex, and beyond
the scope o f the present work. The net effect of free convection is an asymptotic
temperature decrease normal to the surface, from a temperature similar to the solid body
at the solid-fluid boundary, to a homogeneous temperature in the bulk of the fluid, that is
lower than the solid surface temperature. The thickness o f the boundary layer, the
temperature difference between the boundary and the bulk o f the fluid, and the shape of
the temperature distribution depend on the viscosity, density, specific heat, thermal
conductivity, and coefficient of volume expansion, o f the fluid.
In the current discussion, the important point is that, wherever the heater wire
was separated from the sensor wire or column, the air that was in contact with the sensor
or the column was at a temperature below the temperature of the surface of the heater
wire. Heat conduction into the column or sensor depended on the temperature at their
surface, and was less efficient at an air-column surface interface than at a heater
wire-column surface interface. The net effect was a non-homogeneous temperature
distribution along the sensor and the column. These temperature gradients were of short
range, that is they were present over short column distances. The average temperature
gradient along the whole column probably remained at 0°C/cm.
Visual inspection of a column and sensor wire that were pulled out from a
collinear at-column heating assembly after undergoing numerous thermal cycles
Reproduced with permission of the copyright owner. Further reproduction prohibited without permission.
146
confirmed the presence o f heterogeneous temperature distributions along the column and
sensor. Both elements showed signs o f physical damage due to exposure to elevated
temperatures, randomly distributed along the element The column presented, along its
entire length, discrete dark areas o f burned polyimide coating. Similarly, the sensor wire
presented randomly distributed zones with burned polymer insulation. Occasionally,
during normal at-column heater assembly operation, the burned insulation exposed the
metal of the sensor wire, and caused a short-circuit between the sensor and the heater
wire, with the resulting column overheating and irreversible column-assembly damage.
A fiberglass sleeve around the heater wire proved useful to diminish the outer
surface temperature o f the heating element, and eliminated the appearance o f burned
areas on the column and sensor wire. This extended the useful life of the collinear
at-column heater assembly from few months to more than a year. However, no
significant improvement in column efficiency was observed when the heater wire was
coated with the fiberglass sleeve, which indicated that significant temperature non
uniformities still persisted.
In addition to causing column efficiency erosion, the heater-column and
heater-sensor distance distribution is a probable source for the slight increase in retention
time variability observed between runs, and discussed in section 4.3.2. Because the wire
expanded more than the fused silica during a heating ramp, the wire bent as it was heated
in order to fit in the available space. As the wire cooled down, it shrunk to its original
length, but did not necessarily return to exactly the same position at all its points, relative
to the column. These slight differences in the relative heater-column and heater-sensor
Reproduced with permission of the copyright owner. Further reproduction prohibited without permission.
147
position between runs caused small changes in the temperature-time-distance profiles
along the column, and consequent retention time variability.
4.3.S.2 Temperature Gradients Across the Column
In the collinear at-column heater the heater wire and the column were located
side-by-side. Consequently, heat transferred from the wire to the column laterally, i.e.,
from one side o f the column’s cross sectional circumference. Because heat transfer is not
an instantaneous process, potentially every point in the cross section o f the column was
at a slightly different temperature at any point in time during the temperature ramp. The
retention time o f a solute would depend on the average cross sectional temperature of the
column. However, there is a finite probability that a certain proportion o f the solute
molecules always partitioned in the hotter area of the column, while another fraction of
the solute molecules interacted mainly with the cooler parts o f the column. This would
result in a capacity factor distribution for each solute, which would translate into an
increased variance or peak width.
In a coaxial at-column heater assembly, the heating element (metal tube)
surrounded the whole circumference of the column. Heat was not only transferred to the
column from one side, but radially from around the column. Thus, temperature gradients
across the column should be greatly reduced in the coaxial at-column heater as compared
with the collinear at-column heater.
Figure 4.24 shows the results obtained from an experiment where the same 1-m x
0.1-mm column was assembled first into a coaxial at-column heater, and then into a
collinear at-column heater. A type C experimental set-up was used to eliminate possible
Reproduced with permission of the copyright owner. Further reproduction prohibited without permission.
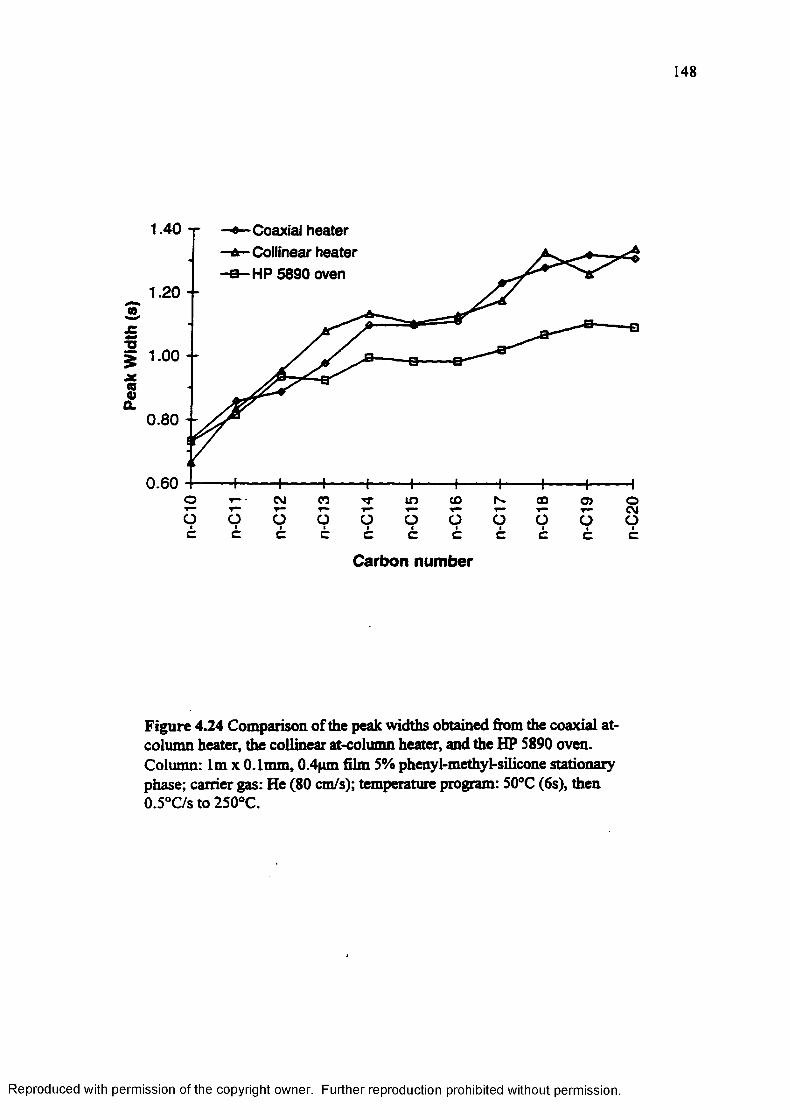
Peak
W
idth
(s)
148
1.40 x Coaxial heater Collinear heater HP 5890 oven
1.20 - -
1.00 - -
0.80 • -
0.60© CM n co coID o>Oic
OIcOIc
OicOic
OlcOtc
OIcOIc
OtcCarbon number
Figure 4.24 Comparison of the peak widths obtained from the coaxial at- column heater, the collinear at-column heater, and the HP S890 oven. Column: lm x 0.1mm, 0.4pm film 5% phenyl-methyl-silicone stationary phase; carrier gas: He (80 cm/s); temperature program: S0°C (6s), then 0.5°C/s to 250°C.
Reproduced with permission of the copyright owner. Further reproduction prohibited without permission.
n-C
20

149
cold zones and gradients along the column due to intercoil heat transfer. All the other
experimental conditions were identical for both at-column heating assemblies.
The results from figure 4.24 show no significant difference in the peak widths of
the H-paraffins C 10-C20, between the coaxial and the collinear at-column heater
assemblies, under a linear temperature programming rate o f 0.5°C/s. This indicates that
transversal temperature gradients in the column did not contribute significantly to the
efficiency erosion observed with the directly heated columns. The column internal
diameter was small compared to the heater wire diameter, and the thermal equilibrium in
the cross section of the column was probably attained in a time scale compatible with the
solute partitioning process.
Because in the coaxial at-column heater assembly the column still randomly
touched the inner wall of the tube (heating element), longitudinal temperature gradients
in the column and sensor wire were still present as in the case o f the collinear at-column
heater.
In conclusion, temperature gradients along the column appear to be the main
factor responsible for column efficiency erosion in the directly heated systems. They are
an inherent limitation of the current design. To eliminate this source o f peak broadening
and retention time variations, it would be necessary to redesign the column heater
assembly in a way that assures homogeneous heat transfer along the entire column. For
homogeneous conduction, the heating element must be in intimate contact with the
sensor and the column at all points, times and temperatures. The “on-column” heating
coatings, like the aluminum clad or the conductive paint, provide that intimate contact,
and assure a “conduction only” heat transfer process to the column. However, as
Reproduced with permission of the copyright owner. Further reproduction prohibited without permission.
150
discussed in the introduction, these systems are mechanically fragile. A heating element
(wire, tube or strip) with a thermal expansion coefficient similar to the fused silica, and
physically attached to the column could provide an alternative heat source where
conduction is the main temperature transfer process. However, few metals have thermal
expansion coefficients comparable to fused silica. Physical attachment o f the column to a
large, low thermal mass heated surface is an interesting alternative, since temperature
gradients across the column appear to be negligible. MTI’s M200 and P200 micro GC's
(4.22,4.23) use a circular plate for the isothermal temperature control o f the column that
is coiled as a flat spiral and placed horizontally on the plate. Preliminary attempts,
performed in this institute, to program the temperature o f the plate showed promising
results (4.24). However, no attempt to study the thermal homogeneity of the plate surface
during temperature programming was made. A further limitation o f the system was its
large cool down times. Coiling the column around a low thermal mass resistively heated
cylinder, similar to the design proposed by Ruby for thermal gradient programmed GC
(4.25), is another possible alternative for direct column heating. The tensile strength of
the fused silica limits the radius of the cylinder to approximately 1-cm (in the case of
0.1 mm i.d. thin wall columns). Consequently, as with the plate, the cylinder would have
a relatively large surface, and the difficulty to achieve thermal homogeneity over the
entire cylinder surface could be a limitation. If the column could be coiled into a smaller
cylinder (1-nun diameter), perhaps coiling the fused silica tubing during its
manufacturing process, it would fit onto a smaller resistively heated “core” cylinder. The
cylinder would be similar to the heater wire used in this study. This type o f design, could
have the additional advantage of reduced resistance to mass transfer in the mobile phase,
Reproduced with permission of the copyright owner. Further reproduction prohibited without permission.
151
as a result o f centrifugal forces experienced by the solutes. Tijssen and coworkers
showed that such a tightly coiled helical shape enhances separation speed in open tubular
columns (4.26).
Construction of a “convection” at-column heater requires the placement o f a
column at a fixed distance from the heat source, at all its points. To avoid temperature
non-uniformities, this distance should be large enough to assure separation from the
boundary layer o f the heating element Convection has the advantage that the whole
column would be surrounded by air at the same temperature (as is the case in a
conventional oven). However, it implies the heating o f a larger mass o f air, and is
energetically less efficient, hi any of the alternatives for fast, energy efficient column
heating, the connection o f the column to the injector and detector, without introducing
cold zones is an additional design challenge.
4.3.6 Effect o f Sheath Gas Flow.
The previous section showed that temperature non-uniformities along the
column, caused mainly by mixed conduction and free convection heat transfer
mechanisms, were the main cause for the efficiency reduction observed with the coaxial
and collinear at-column heaters as compared to the conventional oven. The objective of
this section was to study the potential o f moderate forced convection to homogenize the
temperature along the column. For this purpose, the effect o f a small flow of external
sheath gas along the outside of the column and the heater wire was investigated. By
forced convection heat transfer, the sheath gas could have carried away excess heat from
hot spots to cooler areas o f the column; thus, enhancing thermal homogeneity along the
column. This smoothing of the temperature should translate into a reduction of the peak
Reproduced with permission of the copyright owner. Further reproduction prohibited without permission.
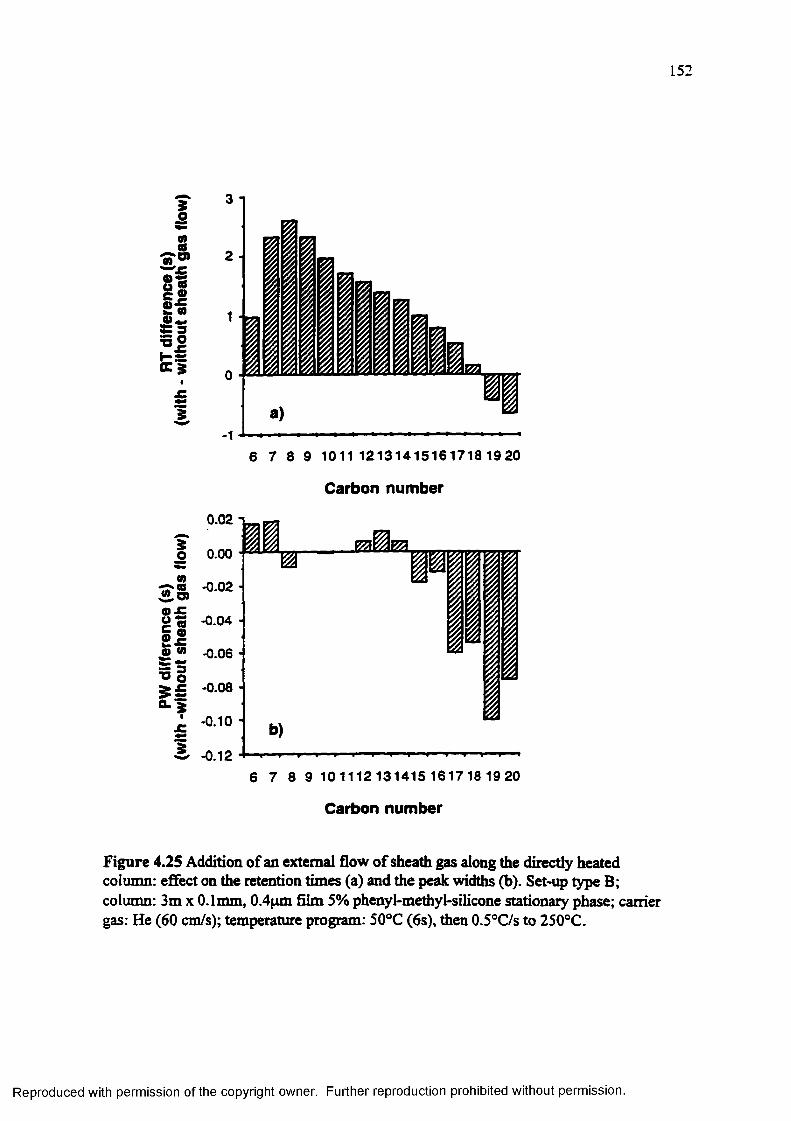
152
20co
^ CB42,8) o -c c «S-C 01 <n
= 313 o 5 i “■51
£i
i
i
-1a)
lEL
6 7 8 9 1011 12131415161718 1920 Carbon number
0.02 -j
0.00
-0.02 H
-0.04 -0.06 H -0.08 -0.10 H
-0.12
E l l
1
b)
6 7 8 9 101112131415 161718 1920 Carbon number
Figure 4.25 Addition of an external flow of sheath gas along the directly heated column: effect on the retention times (a) and the peak widths (b). Set-up type B; column: 3m x 0.1mm, 0.4pm film 5% phenyl-methyl-silicone stationary phase; carrier gas: He (60 cm/s); temperature program: 50°C (6s), then 0.5°C/s to 250°C.
Reproduced with permission of the copyright owner. Further reproduction prohibited without permission.
153
widths; and possibly changes in the retention times. It is important to mention that the
experiments with the sheath gas were performed with type B experimental set-up. In this
set-up, «-Cis and higher experienced exponentially increasing peak broadening due to a
cold zone where the column passed through the oven insulation (see section 4.3.3).
The differences between retention times with and without sheath gas (figure
4.25a) showed that the effect of the sheath gas depended on the volatility o f the analytes.
The sheath gas flow increased the retention times o f the compounds below Cu and
decreased the retention times of /1-C19 and n-C20. The difference in retention time was
largest for n-C8 (2.58s, 12%) and decreased almost linearly with the carbon number o f
the analyte. This indicates that the sheath gas reduced the average temperature o f the
entire column, but increased the temperature of the cold zones, where the elution o f C19
and C20 was retarded. As interesting as these results seemed, a closer look at the relative
magnitudes of the retention time shifts using a sheath gas flow (maximum, 2.58 s)
compared to the maximum differences encountered between the two heating systems
(19s, see section 4.3.3) clearly showed that the effect o f sheath gas, although statistically
significant, was rather negligible upon the heater performance.
Figure 4.25b shows the effect o f sheath gas on peak widths. The statistical
comparisons o f peak widths with and without sheath gas for each carbon number showed
no significant effect for n-paraffins Cn and lower. Normal paraffins C 18-C20 presented a
statistically significant reduction in peak widths. These are the compounds that were
broadened in the cold zone at the end o f the column, and showed a retention time
reduction with the sheath gas. These results demonstrated that the sheath gas transferred
heat from the main part o f the column to the cold zone. The lack of peak width reduction
Reproduced with permission of the copyright owner. Further reproduction prohibited without permission.

154
for compounds o f lower volatility than n-Cn demonstrated that the sheath gas could not
significantly reduce the temperature gradients along the column. Probably, the sheath gas
could not flow between the column and the heater where both elements touched; thus,
the heterogeneous conduction/convection heat transfer process could not be improved
significantly by addition o f sheath gas.
Overall, the results o f the sheath gas evaluation show that sheath gas can
homogenize temperatures over the regions surrounded by the fluid (gas); however, it can
not reduce the impact o f hot spots that arise from localized direct heater-column heat
conduction.
4.3.7 Effect of the Column Insulation on Chromatographic Performance and Power Requirements
In portable instrumentation, power consumption is a factor o f major
consideration. Power is usually transported in form of batteries, which often are the main
contributors to the instrument’s weight. The size and weight of a battery is directly
proportional to it’s energy storage capability; thus, power requirements have a direct
incidence on the weight o f a portable instrument.
As discussed in section 4.3.5, whenever an object is at a higher temperature than
its surroundings, that object transfers heat (energy) to its surroundings. Thus, the heater
wire not only transfers heat to the column and the sensor wire, but to its whole
immediate environment. To minimize power consumption, ideally, the heat transfer to
the sensor and column should be very efficient, while the heat transfer to the remaining
environment should be as small as possible. One way to accomplish this is to cover the
system with a solid material o f low thermal conductivity to eliminate convection and
reduce thermal conduction. These types of materials are commonly known as thermal
Reproduced with permission of the copyright owner. Further reproduction prohibited without permission.

155
9000-
2*C/s Insulation5*C/s
T. rate
T. rate
Figure 4.26 Relationship between the power requirements, the type of insulation, and the temperature program ming rate o f the collinear at-column heater assembly, a) total energy consumed for a 50°C to 300°C ramp, and b) maximum power required for the ramp.
Reproduced with permission of the copyright owner. Further reproduction prohibited without permission.
156
insulators. Typical high temperature thermal insulators include glass wool, asbestos,
diatomaceous earth, rock wool, and alumina, silica, or zirconia composites. Typically,
the low thermal conductivity o f porous insulating materials is due mainly to the air that
is contained in the pores (air is a poor thermal conductor), and not to a low thermal
conductivity o f the solid material by itself (4.21).
Figures 4.26 a and b compare the total energy consumed and the maximum
power required for different temperature ramps and column insulating materials,
measured for a 1-m long column. The absolute magnitudes of these values depend on the
column length and the heater wire characteristics, but the relative trends are consistent.
As expected, in all cases, the column without additional insulation material imposed the
highest energy and power demands on the system. It is interesting, however, that the
relative gain in total energy consumption as well as maximum power demand depended
on the temperature programming rate. The effects o f the insulation were largest for the
slowest temperature programming rate tested (l°C/s), and almost negligible for the
fastest temperature programming rate (5°C/s). Also, while the maximum power required
increased with the temperature programming rate, the total energy consumed during a
temperature ramp decreased significantly with the increasing temperature programming
rate. These observations are a consequence o f the kinetic nature o f the heat transfer
process. At fast temperature programming rates, the rate o f heat transfer to the
environment was slower than the rate o f temperature increase. Thus, heat generated in
the heater wire was used more efficiently to heat the immediate environment of the wire
(sensor wire and column), before it could dissipate into the outer environment. The graph
Reproduced with permission of the copyright owner. Further reproduction prohibited without permission.
157
also shows that glass wool was an energetically more efficient insulator than the silica-
alumina plates.
Thermal insulation improved the power requirements o f the column heater
assembly; however, it diminished the chromatographic efficiency o f the column. Figures
4.27 a and b show the retention times and peak widths o f n-paraffins C9 to C2 0 obtained
from a 1-m x 0 . 1 mm collinear at-column heater covered with different insulating
materials. For reference, the results obtained with the HP 5890 oven heater are also
included. As seen in figure 4.27a, the insulating material had a small effect upon the
retention times, which, in all cases, remained larger than the corresponding retention
times obtained with the conventional oven. Thus, thermal insulation o f the column did
not improve the heat transfer to the stationary phase. Moreover, the thermal insulation
seemed to reduce the effective temperature of the stationary phase, since retention times
obtained from the less insulated column were faster than the retention times of
compounds eluted from the well-insulated column.
Peak widths however, experienced a significant relative increase (max. 20%)
when the column was insulated. This peak width increase was largest for the silica-
alumina plates, which are less porous and more dense than the glass wool. The negative
effect o f the thermal insulation upon peak widths apparently indicates an enhancement of
temperature non-uniformities for well-insulated columns. One possible explanation for
this observation is that hot spots remained more localized and could not be dissipated to
the environment in the well-insulated columns. Therefore, the column temperature at the
hot spots was higher. To compensate, the temperature at the other column zones had to
be lower because the system controlled only the average temperature. As a result, the
Reproduced with permission of the copyright owner. Further reproduction prohibited without permission.
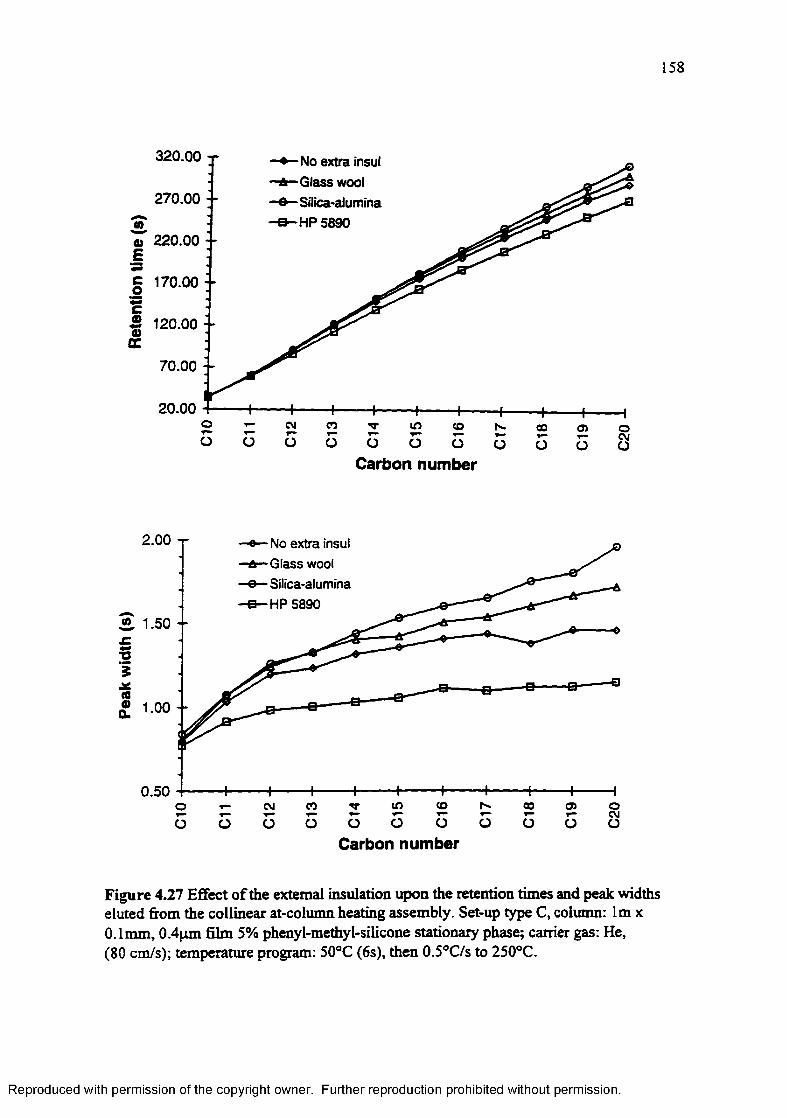
158
320.00 No extra insul Glass wool Silica-alumina HP 5890
270.00(0o 220.00 E
§ 170.00 ; - c* 120.00 : -
70.00 - -
20.00o CMv— CO CO fx. 00 05 O
CM
Carbon number
2.00 No extra insul Glass wool Silica-alumina HP 5890
S 1-50
1.00
0.50(A CO 02 O
CMCMO
Carbon number
Figure 4.27 Effect of the external insulation upon the retention times and peak widths eluted from the collinear at-column heating assembly. Set-up type C, column: lm x 0 1mm, 0.4pm film 5% phenyl-methyl-silicone stationary phase; carrier gas: He,(80 cm/s); temperature program: 50°C (6s), then 0.5°C/s to 250°C.
Reproduced with permission of the copyright owner. Further reproduction prohibited without permission.
159
temperature gradients along the column were of higher amplitude in the well-insulated
columns, causing more peak broadening and larger retention times. Peak width increases
in the column coveted with glass wool were smaller than in the column covered with the
silica-alumina plates. This could be a result o f a certain degree o f free convection due to
the air contained in the See spaces o f the glass wool. This free convection might have
partially smoothened temperature gradients in the column.
In summary, thermal insulation reduced the power requirements o f the system,
specially for relatively slow temperature programming rates. However, it also reduced
heat dissipation from hot spots, enhancing temperature non-uniformities along the
column. The results of the influence o f thermal insulation on column efficiency support
the hypothesis that temperature non-uniformities caused the column efficiency erosion in
the at-column heating system.
4.3.8. Column Arrangement, Chromatographic Efficiency and Power Management - Practical Considerations
The previous sections demonstrated that temperature non-uniformities along the
column reduced the efficiency o f the directly heated column. The addition o f thermal
insulation seemed to enhance the effect temperature gradients along the column. At the
same time, thermal insulation reduced the power consumption of the system, making it
more energy efficient. Thus, chromatographic efficiency and power requirements have
opposite trends as a result o f thermal insulation in the at-column heaters.
The need for simultaneous low power consumption, fast cool-down times, and
high column efficiency restricted the at-column heater arrangement design, especially in
a standalone system. Tight thermal insulation along the whole column eliminated long
range gradients along the column due to intercoil heat transfer. However, it enhanced
Reproduced with permission of the copyright owner. Further reproduction prohibited without permission.
160
short range gradient along the column, deteriorating the column efficiency, hi addition,
cool-down times were prohibitively long.
Reduced, homogeneous thermal insulation along the whole column (as provided
by the outer fiberglass sleeve) reduced long and short range temperature gradients along
the column, improving the chromatographic efficiency. A small fan mounted next to the
column reduced cool-down time to few seconds by means o f forced convection. The
disadvantage o f this design was the lower power efficiency as a result o f heat losses to
the environment by free convection, especially at relatively slow temperature
programming rates.
A hollow box machined from silica-alumina plates in which the coiled column
cylinder was placed, constituted an alternative arrangement tested in this study. The
confined air volume that surrounded the column allowed heat dissipation from hot spots
by free convection in a limited space. The insulating material of the box reduced heat
transfer to the external environment, and consequently, power consumption. A fan
placed at one face o f the box, opposite to a box face with a small hole (1 cm diameter),
allowed for the acceleration of cool-down times by forced convection. However, as
discussed in section 4.3.3, intercoil heat transfer caused long range temperature gradients
along the column. The effect of uneven column temperature caused by intercoil heat
transfer was particularly critical in the standalone system that had no independent heater
for the column ends. Even when the injector and detector were mounted next to the
insulation box, the first and last portions of the column had to be straightened for
connection. These straight portions o f the column did not touch any neighboring column
coils. Their temperature, measured with an infrared probe, was more than 50°C below
Reproduced with permission of the copyright owner. Further reproduction prohibited without permission.
161
the average column temperature. This caused very large increases in the peak widths,
especially for compounds with retention indices o f 1600 and above. The addition of
external heaters for these portions o f the column could probably improve the efficiency
o f the system for compounds o f low volatility. This option was not tested in a standalone
system, and would increase the instrument’s complexity. The energy efficiency gained
with the use o f an insulator might be partially offset by the added energy requirements o f
external heaters. Nevertheless, this arrangement remains a possibility worth testing for a
practical GC unit with at-column heating.
Among all the configurations tested, the at-column heater covered only with the
outer fiberglass sleeve, arranged as a helix with well separated coils, provided the best
chromatographic performance. At slow temperature programming rates this arrangement
had larger power requirements, but at fast temperature programming rates, power
requirements were comparable to a well-insulated column (see section 4.3.6 and figure
4.26). Therefore we selected a collinear at-column heater assembly with no additional
insulation for a prototype portable GC (standalone system).
4.3.9 Influence of the Column Wall Thickness on the At-column Heater Performance
As discussed in section 4.3.5, heat transfer is a kinetic process. The flow of heat
through the fused silica wall o f the column is not instantaneous; consequently, the
stationary phase reaches the control temperature with a certain delay compared to the
sensor wire. Because, according to heat transfer theory, the temperature transport delay
increases with the thickness o f the layer through which the heat is transferred, thin wall
(0.04 mm walls) capillary columns were used throughout this study.
Reproduced with permission of the copyright owner. Further reproduction prohibited without permission.
162
Most column manufacturers offer 0.1 mm i.d. capillary columns with thicker wall
tubing (0.1 mm).The limited availability o f thin wall capillary columns restricted the
column selection. For example, some o f the columns with more desirable selectivity
towards analytes o f interest were only available with thick wall tubing. It was therefore
important to determine whether the thicker column wall had a significant effect upon the
chromatographic performance o f the collinear at column heater assembly.
For this purpose, the performance o f a Quadrex column (0.04 mm wall) and a
J&W column (0.1 mm wall) was compared at different temperature programming rates,
and for two different column lengths. The columns from both manufacturers had the
same stationary phase (5% phenyl-methyl-silicone) and equal film thickness (0.1pm).
Chromatograms o f n-paraffins Cg-Czo with the columns heated in the conventional oven
(HP 5890) showed that the two columns indeed were comparable. The retention times,
peak widths and separation numbers o f compounds C8-C20 obtained were similar for
both columns.
When tested in the at-column heater assembly, the two columns showed
significant differences in the retention times o f n-Cu and higher. These differences
increased with the carbon number of the analyte and varied with the temperature
programming rate. Figure 4.28 shows a three dimensional plot o f the relationship
between the column wall thickness, the carbon number o f the analyte, and the
temperature programming rate. The dependent variable (y axis) plotted is the difference
in retention time obtained from the thin wall column and the thick wall column.
As seen in figure 4.28, only compounds Cm and higher exhibited differences in
their retention times due to the wall thickness of the column. At slow temperature
Reproduced with permission of the copyright owner. Further reproduction prohibited without permission.
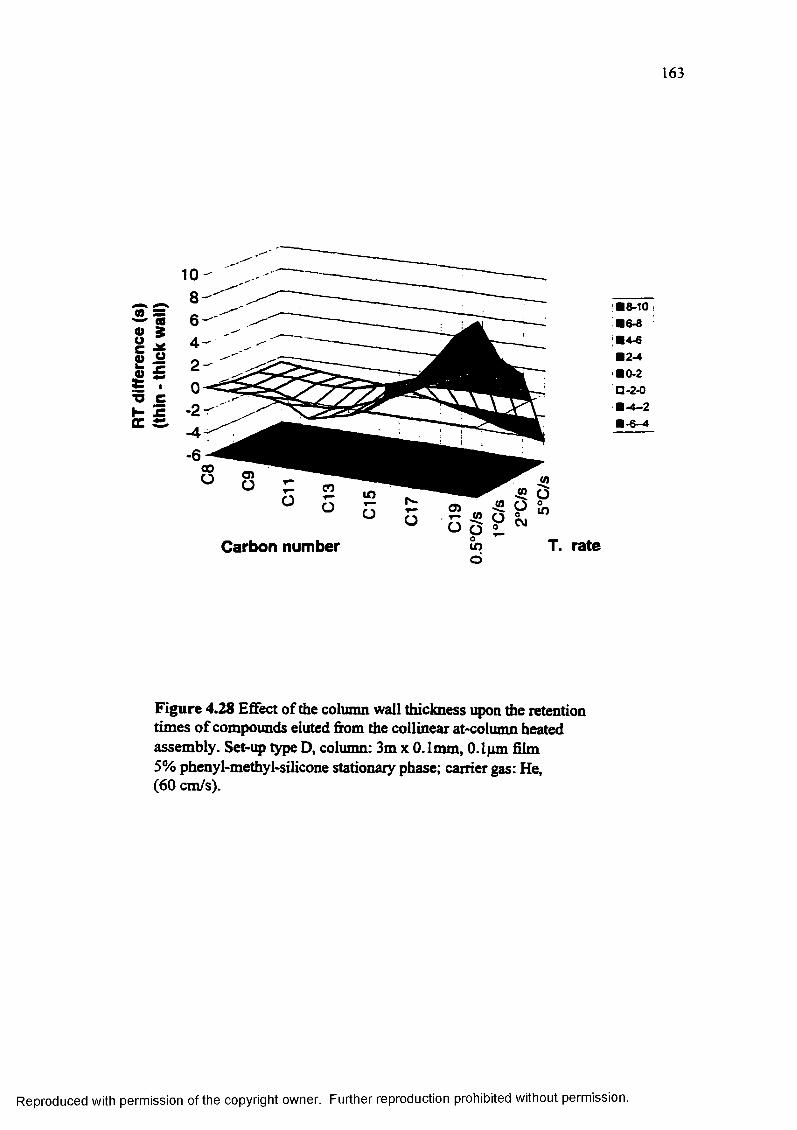
163
Carbon number
Figure 4.28 Effect of the column wall thickness upon the retention times o f compounds eluted from the collinear at-column heated assembly. Set-up type D, column: 3m x 0.1mm, 0.1pm film 5% phenyl-methyl-silicone stationary phase; carrier gas: He,(60 cm/s).
Reproduced with permission of the copyright owner. Further reproduction prohibited without permission.
164
programming rates, the retention times obtained with the thick wall column were shorter
than the retention times obtained with the thin wall column. The higher temperature
experienced by the stationary phase of the thick wall column at slow temperature
programming rates was probably a consequence o f a better physical contact between the
heater wire and the column, as a result o f the larger outer diameter o f this column.
At faster temperature programming rates, the situation reversed. The retention
times o f n-Cu and higher were larger in the thick wall column. The retention time
difference between the two columns increased almost linearly with the temperature
programming rate. This trend clearly demonstrated the temperature transport delay effect
of the thicker fused silica wall. The increasing retention time difference with the carbon
number o f the analyte implies that the stationary phase actually was heated at a slightly
slower rate in the thick wall column.
Examination o f the peak widths revealed similar trends. Differences between the
peak widths eluted from the thick and the thin wall columns were significant for
compounds Cu and higher. These differences increased with the carbon number and
varied with the temperature programming rate, maintaining the trend observed for the
retention times. The changes in peak width were relatively small and did correspond only
to the differences in retention times of the analytes. Analysis of the TZ differences
between both columns showed no significant main effects, confirming that the wall
thickness did not affect the column efficiency significantly.
The former results have two important practical consequences. First, they
demonstrated that thick wall columns can be used in the collinear at-column heating
assembly without significant losses in resolution. Second, the results indicate that the
Reproduced with permission of the copyright owner. Further reproduction prohibited without permission.
165
heat transfer process to the stationary phase limits the actual linear temperature
programming rate in fast gas chromatography. Results o f direct temperature
measurements inside a fused silica capillary tube, presented in detail in the following
section, confirmed this observation.
4.3.10 Heat Transfer into the Column’s Stationary Phase
In capillary gas chromatography it is usually assumed that the oven temperature
and the stationary phase temperature are equivalent. These assumptions are correct for
traditional gas chromatography, where the temperature programming rates are in the
order of a few degrees per minute. Even though fused silica is a good thermal insulator,
the mass o f a column is small enough to allow heat transfer into the column at rates that
are compatible with slow temperature programming rates (4.27). hi fast gas
chromatography, the insulation effect o f the fused silica wall may significantly reduce
the stationary phase temperature-time profile compared to the external temperature-time
profile. The results reported in the preceding section indeed indicated that the fused silica
wall of the column had a significant effect upon the retention times o f the solutes. To
study this phenomenon in more detail, an additional sensor wire was inserted inside a
0.53 mm i.d. capillary column (0.08 mm wall thickness), which was subsequently
assembled into a collinear at-column heating system, with fiberglass tubing as outer
sleeve. The voltage vs. time traces o f both, the control sensor wire outside of the fused
silica column, and the sensor wire inside the column, were monitored simultaneously for
various temperature ramps. This was repeated for a type A (additional external
insulation), and a type D arrangement (no additional external insulation).
Reproduced with permission of the copyright owner. Further reproduction prohibited without permission.
166
The fused silica tubing used in this experiment had a larger radius than the actual
GC columns. The thickness o f fused silica walls o f the tubing was twice the thickness o f
the thin wall column, and 20% smaller than the thickness o f the thick wall column. Thus,
the observed temperature differences between the inside and the outside of the tubing do
not represent accurately the differences present in neither the thin wall nor the thick wall
column. These differences should be smaller in the thin wall column and larger in the
thick wall GC column. However, the observed trends should be indicative for the
behavior o f any fused silica tubing.
Figure 4.29 shows typical traces obtained for the difference between the
measured equivalent temperature o f the control sensor and the sensor inside the column.
The data in figure 4.29 correspond to the type A set-up, where the column assembly was
covered with additional external insulation. For all temperature programming rates,
relatively large differences between the temperature, measured as sensor wire resistance,
outside o f the fused silica column (control) and the inside o f the column were found.
These differences increased with the column temperature, reaching a maximum value at
the final temperature (300°C). At the final temperature, the inside of the column did not
match the outer column temperature, even after several minutes of isothermal
temperature control.
The differences between the outside and inside o f the column increased with the
temperature program m ing rate, as expected from the retention time data discussed in the
preceding section. Figure 4.30 summarizes the maximum temperature differences
between the outside and the inside of the column, for different nominal temperature
program m ing rates. These differences increased almost linearly with the temperature
Reproduced with permission of the copyright owner. Further reproduction prohibited without permission.

Outer
- in
ner
tem
pera
ture
(°C
)
167
10 T 300°C
8 -
6 --
rc/s2 -
00 00 00 COTT rrcvi o ' oriO) cot- -- CVJ
Control temperature (°C)
00in00CVJ
05-2 ■L
Figure 4.29 Difference between the inner and the outer temperature o f a fused silica tubing for various temperature program m ing rates. Set-up type A, column: lm x 0.53mm.
Reproduced with permission of the copyright owner. Further reproduction prohibited without permission.
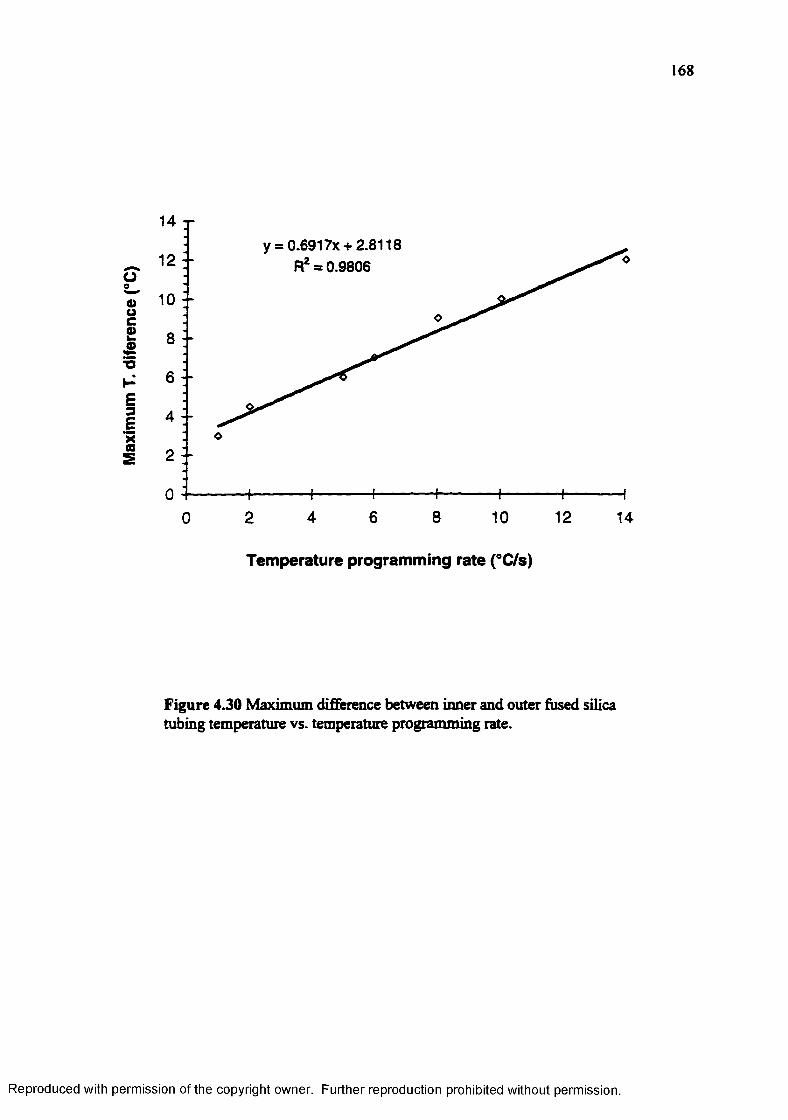
Max
imum
T.
dife
renc
e (°C
)
168
14 xy = 0.6917x + 2.8118
R2 = 0.9806
10 - -
8 - -
4 --
2 - -
8 124 6 1020 14
Temperature programming rate (°C/s)
Figure 4.30 Maximum difference between inner and outer fused silica tubing temperature vs. temperature programming rate.
Reproduced with permission of the copyright owner. Further reproduction prohibited without permission.
169
programming rate, over the interval of 2 to l4°C/s. The slope o f the temperature
difference versus the temperature programming rate (0.7 s) is related to the temperature
transport delay o f the fused silica walls, at the temperature at which this difference was
measured. This temperature transport delay depends on the material and the thickness of
the fused silica tubing. Further exploration o f the dependence between the temperature
programming, temperature transport delay, and column dimensions is beyond the scope
of the present work.
The results presented need careful interpretation. The temperature inside the
column was measured via the change in electrical resistance o f the sensor wire located
inside the column. This sensor wire was not attached to the inner fused silica tubing
walls. It randomly touched those walls in the same fashion that the outer control sensor
wire randomly touched the outer column walls (see section 4.3.5). Thus, the inner sensor
wire also underwent heating by mixed conduction/convection heat transfer. The
stationary phase of a column, however, is intimately attached to the inner column wall,
and consequently heated mainly by conduction from the fused silica walls. Therefore, it
is likely that the sensor wire inside the fused silica tubing underestimated the
temperature o f the stationary phase. As a result, the temperature differences measured
between the inside and the outside o f the column overestimated the actual temperature
differences between the stationary phase and the outside o f the column.
Even if the absolute temperature differences measured did not correspond to the
actual temperature differences between the outside of the column and the stationary
phase, the trends were still indicative for the insulating effect o f the fused silica. The
study demonstrated that effectively, the fused silica wall constitutes a thermal insulator
Reproduced with permission of the copyright owner. Further reproduction prohibited without permission.
170
for the column stationary phase. Nevertheless, the temperature-time profiles inside the
column still present reasonably good linearity up to 14°C/s. This implies that for
practical purposes, nominal temperature programming rates up to at least 14°C/s should
still deliver good resolution o f the high boiling point compounds. However, the study
also suggests that the temperature increasing rate o f the stationary phase is limited by the
temperature transport delay o f the fused silica walls.
For theoretical studies, in which fast GC would be used to determine
thermodynamic properties o f solutes, it would be necessary to include the insulation
effect o f the fused silica into the model used. Similarly, algorithms designed to predict
retention times and optimize resolution in fast GC should take into account the
difference between the outer and inner column temperature, when dealing with fast
temperature programming rates. For such studies, a general model for the
temperature-time profile o f the stationary phase as a function of the temperature-time
profile outside the column, applicable to columns o f different physical dimensions
should be developed.
A different approach would be the use o f a suitable temperature sensing
mechanisms inside the column for the temperature control. Recently, Mustacich (4.28)
proposed the measurement o f pressure changes inside an additional column collinear to
the analytical column, and sealed at one end, as temperature sensor. This approach,
although interesting, appears to present practical difficulties regarding the connection of
the analytical column end to the detector, and the temperature sensor column end to the
pressure transducer without introducing cold zones.
Reproduced with permission of the copyright owner. Further reproduction prohibited without permission.
171
Section 4.3.7 demonstrated that additional insulation around the column affected
the column’s chromatographic performance. Retention times as well as peak widths were
largest for the densest insulating material, with the net result o f efficiency erosion for
well-insulated columns. The enhancement o f thermal gradients along the column as a
result o f localized hot spots was considered as a possible cause for these observations.
Still, the possibility o f significant differences o f the temperature o f the stationary phase
when the column was insulated or not could not be discarded as cause for the efficiency
losses. Therefore, the temperature inside the column was monitored for an open column
(type D set-up, outer fiberglass sleeve only) and a well-insulated column (type A set-up,
glass wool sheets around the at-column heater assembly). The internal temperature of the
open column presented no statistically significant differences compared to the internal
temperature o f the well-insulated column. In conclusion, the column insulation did not
seem to affect the average stationary phase temperature, and efficiency advantages in the
non-insulated column most probably resulted from reductions in the amplitude of the
short range temperature gradients.
4.4 Conclusions
In this part o f the project, two low power consuming at-column resistive heating
systems were described and evaluated. These systems were capable o f directly
controlling and accurately programming the temperature o f the column from 50°C to
300°C at linear temperature programming rates up to 10°C or more. The control
mechanisms proceeded via an electronic feedback system based on a high resistance
temperature sensor wire for maximum accuracy. The heating systems were tested for a
variety o f broad boiling point range samples, in both, GC-FID and GC-MS modes. They
Reproduced with permission of the copyright owner. Further reproduction prohibited without permission.
172
provided satisfactory resolution and symmetric peak shapes over the entire range. The
size, power consumption, and cool down times o f both systems were compatible with
portable fast GC of volatile and semivolatile compounds.
The collinear at-column heating system provided a satisfactory retention time
reproducibility for temperature programming rates from 0.5°C/s to 10°C/s, with RSDs of
less than 1%. Comparison with a standard GC oven showed up to 10% deviations in
retention times, and to 50% increases in peak widths, particularly for compounds Cu
and higher. This resulted in an up to 30% reduction in column efficiency, measured in
terms of separation numbers (TZ).
Long and short range temperature gradients along the column were identified as
the causes for the observed peak broadening. The long range gradients resulted from
heterogeneous intercoil heat transfer. This was particularly critical at the column ends
that extended out from the coiled body o f the column. These regions showed
temperatures well below the nominal column temperature, and caused exponential peak
width increases for compounds C17 and higher. The long range temperature gradients
were minimized by arranging the column assembly in well-separated coils; however, this
approach was energetically less efficient.
Short range temperature gradients resulted from a variable distance distribution
between the heating element and the column, causing heterogeneous heat transfer
mechanisms along the column. This is an inherent limitation o f the current design.
Changes in the assembly that control the distance between the heater and the column are
necessary to reduce these non-uniformities. Temperature gradients across the column
were negligible, at least at temperature programming rates of 0.5°C/s.
Reproduced with permission of the copyright owner. Further reproduction prohibited without permission.

173
Addition of an external flow o f sheath gas along the column had a statistically
significant beneficial effect upon the retention times and peak widths o f heavier
compounds. The sheath gas apparently reduced the long range thermal gradients,
specially at the column ends. It could not effectively reduce the short range temperature
non-uniformities along the column. Overall, the magnitude of the improvements from
sheath gas flow was too small to justify the additional instrumental complexify.
The column insulation affected the chromatographic efficiency. Insulating
material seemed to enhance the temperature non-uniformities along the column, because
it inhibited the dissipation of heat from hot spots. As expected, well-insulated columns
imposed smaller power requirements on the system. However, the energy savings due to
thermal insulation decreased with the increasing temperature programming rate, and
were minor at temperature programming rates of 5°C/s and higher. Consequently, a
system with uniform moderate insulation along the entire column (including ends),
arranged as a helix with well-separated coils, was selected for a prototype portable GC.
The wall thickness of the capillary column had a heating rate dependent effect on
the performance of the collinear at-column heated assembly. At slow temperature
programming rates, better physical contact between the column and the reduced the RT
o f compounds that eluted from of thick wall columns. At higher temperature
programming rates, the insulating effect o f the fused silica wall was evident. Compounds
that eluted from thin wall columns had shorter RTs than compounds that eluted from
thick wall columns. Up to the fastest temperature programming rate tested in this
experiment (5°C/s), this effect was relatively small and did not deteriorate the column
efficiency (TZ values).
Reproduced with permission of the copyright owner. Further reproduction prohibited without permission.
174
Comparative measurements o f the resistance versus time traces o f a sensor wire
inside a fused silica tube, and an identical sensor wire, used for temperature control
outside o f the fused silica tube confirmed the insulating effect o f the fused silica wall.
The temperature differences between the outside and the inside o f the tube increased
with the nominal column temperature and the temperature programming rate. The
column insulation material did not show any significant effect upon the average inside
temperature o f the fused silica tube.
An additional advantage of the collinear and coaxial at-column heating
assemblies is their versatility. The design allows the simultaneous insertion o f a second
capillary column in the same heating assembly. The second column could have a
different stationary phase, or interface to a different detector. Both alternatives would
contribute significantly to increase the selectivity o f the instrument. Another interesting
possibility is the use o f independent at-column heater devices coupled in series. Often,
the incompatibility o f temperature programs suitable to stationary phases o f different
selectivity limits the implementation of multidimensional chromatography in
conventional GC instruments. The at-column heaters would permit the independent
heating of each column, and consequently, the use o f individual optimum temperature
programming conditions in multidimensional gas chromatography.
4.5 References for Chapter 4
4.1 Overton, E. B.; Carney, K. R.; Trends Anal. Chem. 1994,13, 252-257.
4.2 Newman, A. R.; Anal. Chem. 1991, 63,641A-644A.
4.3 Reed, L., Proceedings of the 2nd International Symposium on Field ScreeningMethods for Hazardous Wastes and Toxics, Las Vegas, NV, February 12-14,1991, pp. 3-4.
Reproduced with permission of the copyright owner. Further reproduction prohibited without permission.

175
4.4 Dal Nogare, S.; Juvet, R. S. Jr.; “Gas-Liquid Chromatography. Theory and Practice”, Interscience, New York 1962, p. 319-342.
4.5 Lee, M. L.; Yang, F. J.; Bartle, K. D.; “Open Tubular Column Gas Chromatography. Theory and Practice” Wiley-Interscience, New York, 1984; p. 110.
4.6 Hail, M. E.; Yost, R. A. Anal. Chem. 1989, 61,2410-16.
4.7 Jain, V.; Phillips, J. B. J. Chromatogr. Set 1995,33, 55-59.
4.8 Jain, V.; Phillips, J. B. J. Chromatogr. Sci. 1995,33, 541-50.
4.9 Jain, V. “High Speed Gas Chromatography with Simultaneous Temperature Gradients in Time and Distance Along the Column”, Ph.D. Dissertation, Southern Illinois University, Carbondale, IL, 1992.
4.10 Overton, E. B.; Camey, K. R. U.S. Patent No. 5 611 864.
4.11 Roques, D. E.; Overton, E. B.; Henry, C. B. J. Environmental. Quality 1994,23, 852-55.
4.12 “Proposed Test Method for Boiling Point Range Distribution of Crude Petroleum by Gas Chromatography”, ASTM Method D-2887, American Society for Testing and Materials, 1989.
4.13 Robards, K.; Haddad, P. R.; Jackson, P. E.; “Principles and Practice of Modem Chromatographic Methods” Academic Press, London, 1994; p. 464-466.
4.14 Annino, R. J. High Resol. Chromatogr. 1996,19,285-290.
4.15 Carey, W. P.; Kowalski, B.; Anal. Chem. 1988,60, 541-544.
4.16 Holland, J. F.; Enke, C. G.; Allison, J.; Stults, J. T.; Pinkston, J. D.; Newcome, B.; Watson, J. T. Anal. Chem. 1983, 55,997A-1012A.
4.17 Cavalli, E. J.; Guinchard, C. J. Chromatogr. Sci. 1995, 33, 573-577.
4.18 Blumberg, L. M. 7. High Resol. Chromatogr. 1993,16, 31-37.
4.19 Blumberg, L. M. J. Chromatogr. 1992,596,1-13.
4.20 Blumberg, L. M. J. Chromatogr. 1993,637, 119-128.
4.21 Chapman, A. J. “Heat Transfer” 4th Ed.; McMillan, New York, 1984.
4.22 Lee, G.; Ray, C.; Siemers, R.; Moore, R. Am. Lab. Feb. 1989, 110-119.
Reproduced with permission of the copyright owner. Further reproduction prohibited without permission.
176
4.23 Bruns, M. W. Erdol Kohle Erdgas Petrochem. 1994,47, 80-84.
4.24 Mainga, A. “Development of a Portable and Selective Volatile Organic Compound Analyzer Based on an Enhanced Micro Gas Chromatograph” Ph. D. Dissertation, Louisiana State University, Baton Rouge, LA, 1992
4.25 Rubey, W.J . High. Resol. Chromatogr. 1991,14, 542-548.
4.26 Tijssen, R.; van den Hoed, N.; van Kreveld, M. E. Anal. Chem. 1987,5 9 ,1007- 1015.
4.27 Dandeneau, R.; Zerenner, E. H.; J. High Resol. Chromatogr. Chromatogr. Commun., 1979,2,351.
4.28 Mustacich, B.; Holland, P. M.; Everson, J. F.; paper presented at the 5th International Symposium for Field Analysis, Seattle, WA, February 1997.
Reproduced with permission of the copyright owner. Further reproduction prohibited without permission.

CHAPTER 5
A PRESSURE DRIVEN INJECTOR FOR VOLATILE AND SEMI-VOLATILE SAMPLES
IN FAST PORTABLE GC
5.1 Introduction
The most common injection port for conventional laboratory capillary column
GC is the spilt/splitless injector (5.1-5.3). As demonstrated in chapter 3 (p. 69-72), split
injections with large split ratios > 500:1, are compatible with fast GC (only <0.1 mm i.d.
columns) over a limited carrier gas velocity window (5.4). The variance introduced by
the injection band reduces the optimum carrier gas velocity and increases the peak
widths. Under temperature programmed conditions, the high capacity factor of the
analytes during the injection reduces the relative contribution of the injection band to the
total peak width.
Only relatively concentrated samples are suitable for split type injection because
only a minute amount o f sample enters the column. For trace analysis, preconcentration
is necessary when using the split injection mode. The splitless injection mode allows an
“in column” analyte preconcentration through the solvent effect. However, this injection
mode requires column temperature programming capability, and is not suitable for
volatile analytes.
The connection of a multi-port rotary valve with a sample loop, in series with the
carrier gas supply line, typically serves for the injection of gaseous samples with the split
injector. However, the sample transfer rate from the loop to the injector is usually too
slow for fast GC, unless refocusing or preconcentration takes place at the head of the
column.
177
Reproduced with permission of the copyright owner. Further reproduction prohibited without permission.

178
In addition to the inherent operational limitations of the split/splitless injector for
fast GC, its size, weight, and thermal mass are prohibitive for portable instrumentation.
Apart from the conventional split type injector, several alternative injectors
specially designed for fast and ultra-fast GC have been developed. Cram (5.5), Gaspar
(5.6), and Annino (5.7) described the use o f fluidic logic gates or fluidic switches as GC
valves for high speed gas chromatography. They achieved injection bands o f few
milliseconds, and claim high reliability for the device. However, fluidic switches
typically require very large amounts o f sample and carrier gas, and are difficult to adjust
properly.
Tijssen and coworkers (5.8) developed a split type injector based on a moving
capillary tube with a small lateral orifice. The capillary contained the sample stream, and
moved perpendicularly to the carrier gas flow path. Only during the instant when the
orifice was aligned with the carrier gas flow path, a minute amount o f sample exited the
capillary and was flushed to the column. Injection pulses of few milliseconds were
possible with this device; however, the small sample size precluded trace analysis
without a preconcentration step.
The M200 portable GC (5.9) contains a solid state injection chip manufactured
using silicon micromachining technology. The silicon wafer includes a sample loop and
two micromachined, low dead volume, switching valves. A microprocessor controls the
actuation times o f the valves. The switching times o f the valves are 1.5 ms. This injector
can deliver rectangular injection pulses o f 5 to 255 ms duration. Annino (5.10)
determined that this injector is able to support the high speed analyses that are possible
with narrow bore capillary columns. However, the short injection pulses compromise the
Reproduced with permission of the copyright owner. Further reproduction prohibited without permission.
179
sensitivity o f the system, and the temperature limit o f the micromachined injector
precludes the analysis o f semivolatile compounds.
To overcome the limitation o f the sample size, several in line focusing techniques
for fast injections have been proposed. Phillips and coworkers developed multiplex gas
chromatography via thermal desorption modulation (S.l 1-5.14). In this technique, a
continuous stream o f gaseous sample entered the column. A low thermal mass, open
tubular cryotrap at the head o f the column immobilized the analytes, which were released
periodically into the column through rapid pulse heating o f the trap. Narrow sample
plugs resulted from very fast heating rates o f the trap achieved by capacity discharge
resistive heating.
In a similar approach, Sacks and coworkers (5.15-5.22) used open tubular
cryotraps plumbed in series with the column for the cryofocusing o f discrete samples
supplied through a vaporization injector or a multiport valve. As in Phillips’ work, rapid
heating pulses via a capacitive discharge provided narrow injection bands. Varian offers
the device commercially, as an accessory for fast GC (5.23). The system is, however,
large and power demanding. These features, together with the additional requirement of
cryogenic fluids, are impractical for portable GC.
In a modification o f the in-line cryofocusing technique, Borgerding and
Wilkerson (5.24) placed the cryotrap in a sample loop o f a 8 port rotary valve. After
completing the sample preconcentration, a block heater heated the sample loop at
moderate heating rates over a period o f 20 to 60 s. Once the trap reached the final
temperature, the valve rotated to injection position, and the carrier gas swept the loop
content into the column. The authors reported injection bands o f less than 10ms with
Reproduced with permission of the copyright owner. Further reproduction prohibited without permission.
180
short, narrow sample loops and high carrier gas flows. The need of cryogenic fluids, and
the size o f automated rotary valves restrict this system also to laboratory use.
Mitra and coworkers (5.25-5.27) reported the use o f packed in line microtraps
instead o f cryotraps for the preconcentration and focusing o f gas phase samples. They
heated the trap resistively at approximately 200°C/s, using a 20-50 AC V power supply.
The use o f microtraps eliminated the need for cryogenic fluids, and had the advantage of
compatibility with humid samples. However, required desorption temperatures are
higher due to the adsorbent-analyte interaction.
Besides in-line preconcentration/focusing techniques, other pre-injector
preconcentration schemes have been attached to fast GC injectors, to increase the sample
load to the column. Mainga (5.28) incorporated a microtrap into a M200 micromachined
GC, between the carrier gas supply and the solid state injector chip. A vacuum pump
pulled the sample through the trap, which retained the analytes. After resistive heating of
the trap, the carrier gas backflushed the desorbed analytes to the injector chip. The
inherent temperature limit of the injector limited the use o f the system to volatile
analytes. A more recent development comprises a two stage microtrap preconcentration
unit that attaches directly to the M200 microGC (5.29).
In a different preconcentration approach, Shirey (5.30) and Pawlizyn (5.31)
reported the compatibility of solid phase microextraction (SPME) with fast GC. For this,
they used a low thermal mass, capacitive discharge heater for the flash desorption of the
analytes from the SPME fiber. The method is, however, power demanding, and difficult
to automate.
Reproduced with permission of the copyright owner. Further reproduction prohibited without permission.
181
From the former discussion, clearly no single injector is ideally suited for
portable gas chromatography. Such an injection system should fulfill the following
requirements:
a) compatible with volatile and semi-volatile organic compounds (Ci to C20);
b) suitable for liquid and gas phase samples;
c) suitable for trace analysis (integrated preconcentration);
d) compatible with purge and trap, and headspace sample preparation devices;
e) small, lightweight, low power consuming;
f) no requirement o f cryogenic coolants;
g) capable of delivering fast sample plugs.
This chapter describes a new injector that balances all the aforementioned
requirements. The system is based on the Dean box concept for pneumatic switching
(5.32-5.34). These devices comprise gas flow switches that are driven by different
pressure levels, and solenoid valves located far from the actual switching points. The
injector includes a microtrap for preconcentration, and is compatible with gaseous and
liquid samples, and a wide range o f analyte concentration levels.
A prototype version of the injector was built, and assembled, together with a
collinear at-column heating assembly and a miniaturized FID, into a prototype portable
GC. A general qualitative evaluation of the performance and scope o f the injector was
performed, and the effect o f some operational variables was determined. It is important
to emphasize that the results reported in this chapter are very preliminary. The purpose of
this work was to determine the feasibility o f the proposed injection scheme, and not to
fully develop the system.
Reproduced with permission of the copyright owner. Further reproduction prohibited without permission.
182
S.2 Experimental
5.2.1 Description of the Injector
Figure 5.1 shows a schematic diagram o f the injector, and specifies its
components. The main elements o f the injector were: 4 small solenoid valves (SMC;
Tokyo, Japan), a small vacuum pump (KNF; Renton, NJ), a preconcentration micro-trap,
and zero death volume, 1/32” crosses sand tees (Valeo; Houston, TX) for the connection
of gas lines inside the heated zone o f the detector. This first prototype injector was
constructed with 1/32” stainless steel tubing for the plumbing. A 10 cm long, 0.1 mm i.d.
piece o f deactivated fused silica tubing (Restek, Bellofonte, PA ) served as flow
restrictor between the preconcentration trap and the column
All the components in the sample path were enclosed in a 4-in. x 4-in. insulation
box machined from silica-alumina composite plates (Zircar; Florida, NY). A 2” x 2”,
I Oft heating pad (Minco; Minneapolis, MN) inside the insulation box served as heater
for those components. A small 100ft RTD element (Minco) provided feed-back control
of the injector temperature. The temperature sensitive elements (vacuum pump, solenoid
valves, pressure regulators and sensors) were not in the actual sample flow path.
Consequently, they did not need to be heated, and were located outside the insulating
box.
The microtrap comprised a 5-cm long piece of 1/16” diameter fused silica lined
stainless steel tubing (Restek, Bellofonte, PA) packed with a 2 bed adsorbent. The first
layer, located at the end of the trap, was a 1.5-cm long bed o f35/60 mesh Carbosieve
(Supelco, Bellofonte, PA); the rest of the trap was packed with 35/60 mesh Tenax
(Supelco). The ends of the trap were silver soldered to 1/32” stainless steel tubing. The
Reproduced with permission of the copyright owner. Further reproduction prohibited without permission.
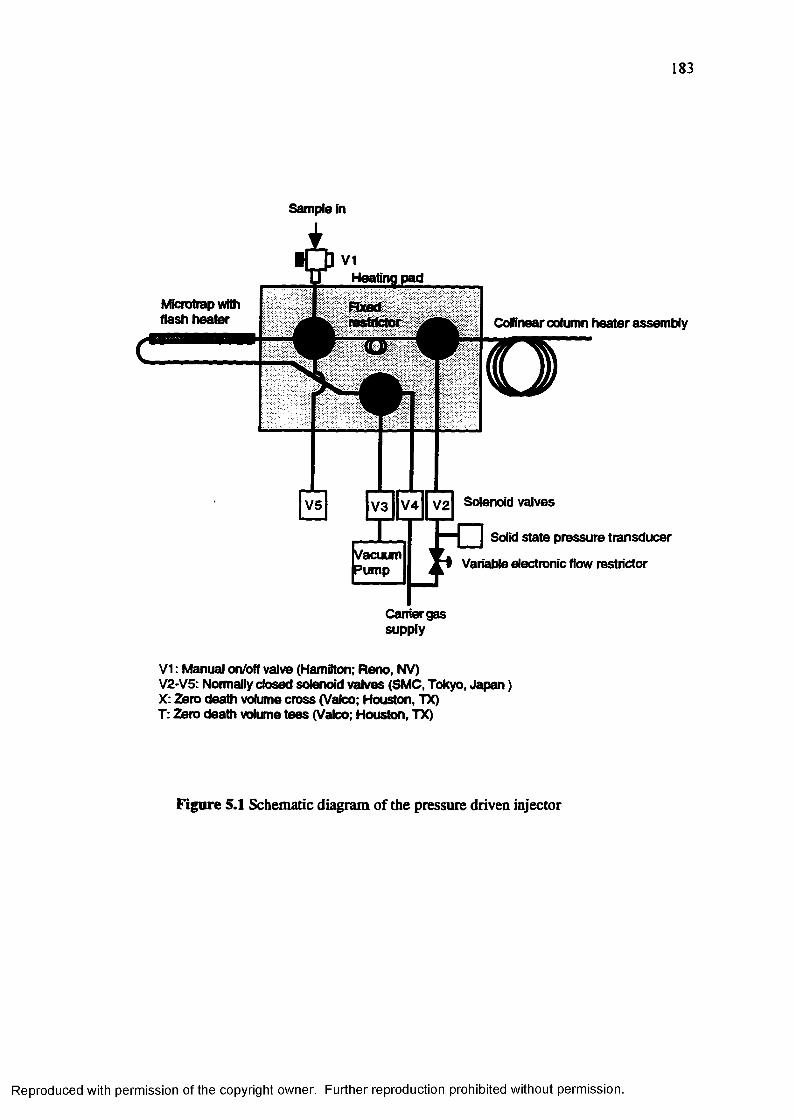
183
Sample in
heater assembly
Solenoid valves
Solid state pressure transducer
Variable electronic flow restrictor
V5
VacuumPump
V3 V4 V2
Camer gas supply
V1: Manual on/off valve (Hamilton; Reno, NV)V2-V5: Normally closed solenoid valves (SMC, Tokyo, Japan) X: Zero death volume cross (Valeo; Houston, TX)T; Zero death volume tees (Valeo; Houston, TX)
Figure 5.1 Schematic diagram of the pressure driven injector
Heating pad
Microtrap with flash heater Colinear column
Reproduced with permission of the copyright owner. Further reproduction prohibited without permission.
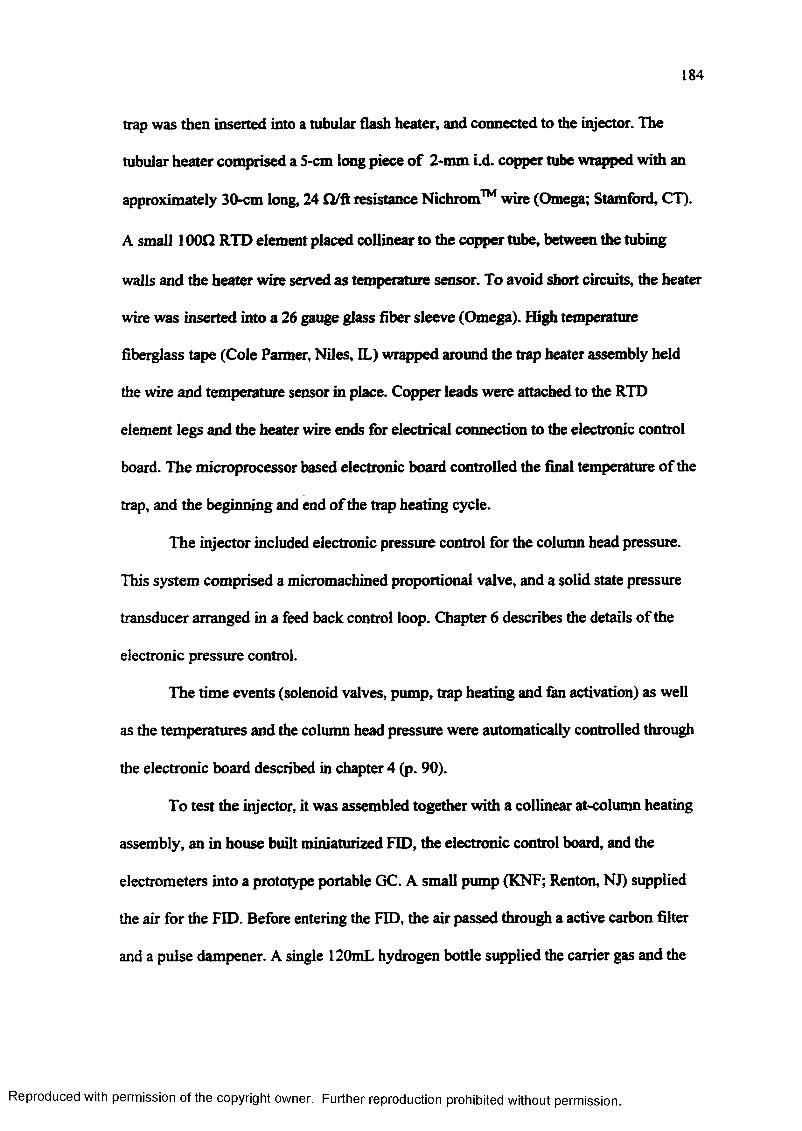
184
trap was then inserted into a tubular flash heater, and connected to the injector. The
tubular heater comprised a 5-cm long piece o f 2-nun i.d. copper tube wrapped with an
approximately 30-cm long, 24 Q/ft resistance Nichrom™ wire (Omega; Stamford, CT).
A small 1000 RTD element placed collinear to the copper tube, between the tubing
walls and the heater wire served as temperature sensor. To avoid short circuits, the heater
wire was inserted into a 26 gauge glass fiber sleeve (Omega). High temperature
fiberglass tape (Cole Parmer, Niles, IL) wrapped around the trap heater assembly held
the wire and temperature sensor in place. Copper leads were attached to the RTD
element legs and the heater wire ends for electrical connection to the electronic control
board. The microprocessor based electronic board controlled the final temperature o f the
trap, and the beginning and end o f the trap heating cycle.
The injector included electronic pressure control for the column head pressure.
This system comprised a micromachined proportional valve, and a solid state pressure
transducer arranged in a feed back control loop. Chapter 6 describes the details o f the
electronic pressure control.
The time events (solenoid valves, pump, trap heating and fan activation) as well
as the temperatures and the column head pressure were automatically controlled through
the electronic board described in chapter 4 (p. 90).
To test the injector, it was assembled together with a collinear at-column heating
assembly, an in house built miniaturized FID, the electronic control board, and the
electrometers into a prototype portable GC. A small pump (KNF; Renton, NJ) supplied
the air for the FID. Before entering the FID, the air passed through a active carbon filter
and a pulse dampener. A single 120mL hydrogen bottle supplied the carrier gas and the
Reproduced with permission of the copyright owner. Further reproduction prohibited without permission.
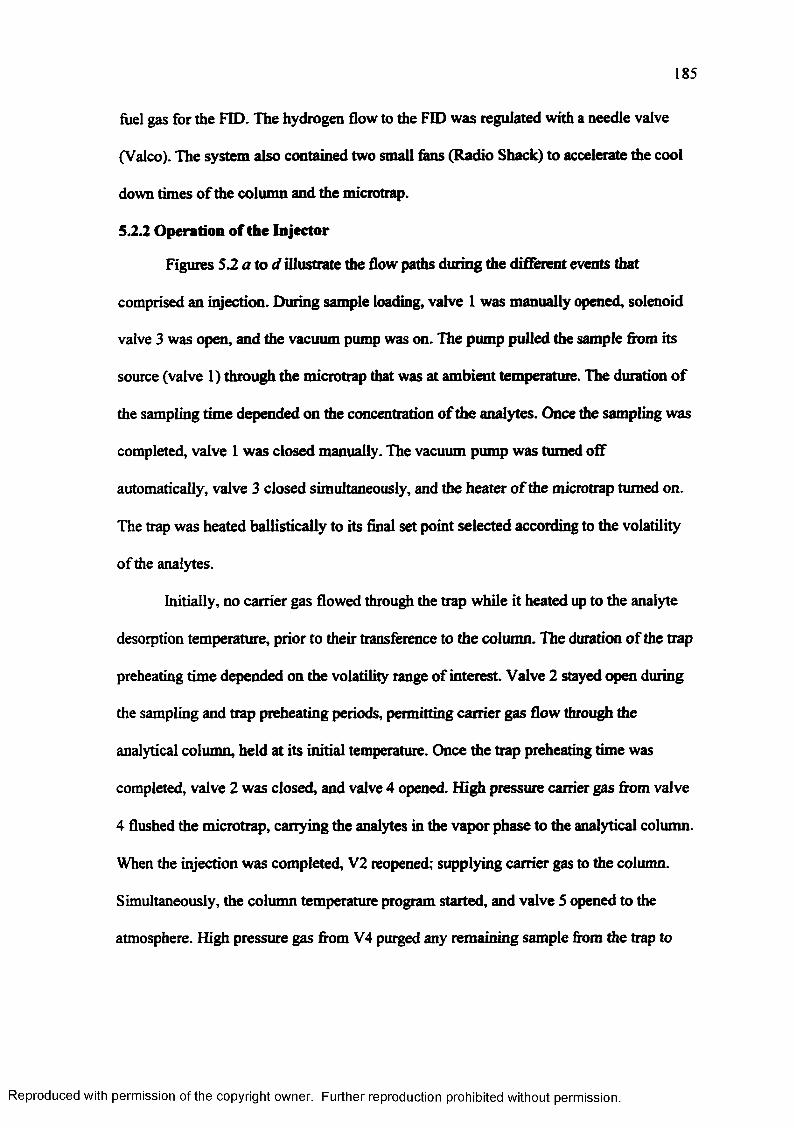
185
fuel gas for the FID. The hydrogen flow to the FED was regulated with a needle valve
(Valeo). The system also contained two small fens (Radio Shack) to accelerate the cool
down times o f the column and the microtrap.
5.2.2 Operation of the Injector
Figures 5.2 a to d illustrate die flow paths during the different events that
comprised an injection. During sample loading, valve I was manually opened, solenoid
valve 3 was open, and the vacuum pump was on. The pump pulled the sample from its
source (valve 1) through the microtrap that was at ambient temperature. The duration o f
the sampling time depended on the concentration o f the analytes. Once the sampling was
completed, valve 1 was closed manually. The vacuum pump was turned off
automatically, valve 3 closed simultaneously, and the heater o f the microtrap turned on.
The trap was heated ballistically to its final set point selected according to the volatility
of the analytes.
Initially, no carrier gas flowed through the trap while it heated up to the analyte
desorption temperature, prior to their transference to the column. The duration o f the trap
preheating time depended on the volatility range of interest. Valve 2 stayed open during
the sampling and trap preheating periods, permitting carrier gas flow through the
analytical column, held at its initial temperature. Once the trap preheating time was
completed, valve 2 was closed, and valve 4 opened. High pressure carrier gas from valve
4 flushed the microtrap, carrying the analytes in the vapor phase to the analytical column.
When the injection was completed, V2 reopened; supplying carrier gas to the column.
Simultaneously, the column temperature program started, and valve 5 opened to the
atmosphere. High pressure gas from V4 purged any remaining sample from the trap to
Reproduced with permission of the copyright owner. Further reproduction prohibited without permission.
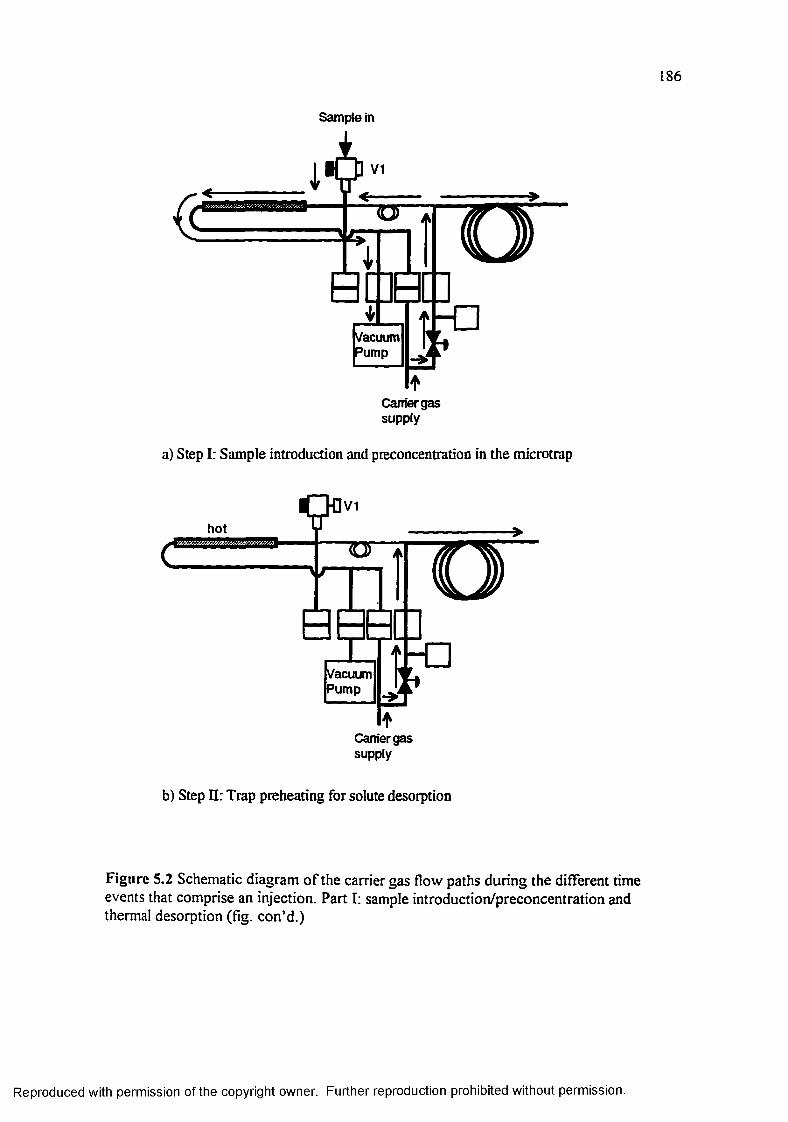
186
Sample in
vacuumPump
Camer gassupply
a) Step I: Sample introduction and preconcentration in the microtrap
hotV1
----------
m
VacuumPump J 1
tCamer gas supply
b) Step II: Trap preheating for solute desorption
Figure 5.2 Schematic diagram of the carrier gas flow paths during the different time events that comprise an injection. Part I: sample introduction/preconcentration and thermal desorption (fig. con’d.)
Reproduced with permission of the copyright owner. Further reproduction prohibited without permission.
187
\ CV
S" V1
TOT
taLtVacuumPump
tF
Camer gas supply
c) Step HI: transference of desorbed solutes from the trap to the column head
Of"“O '
taVacuum Pump Jp
tCamer gas supply
d) Step IV: Development of the chromatogram and clean out of the trap
Part II: sample injection and elution o f the chromatogram/trap purging.
Reproduced with permission of the copyright owner. Further reproduction prohibited without permission.
188
the vent, and a small portion o f carrier gas flow from V2 cleaned out the flow restictor
between the trap and the column. The splitting o f the flow from V2 to the column and
the vent also served to cut the injection band and prevent its tail from entering the
column. Thus, fast injection bands were delivered to the column. The width o f the
injection band was limited by the resolution o f the valve timing events, the valve
actuation times themselves, and the pressure drop between the trap and the head o f the
column.
5.2.3 Materials and Methods
The injector was tested for the analysis o f gas, liquid and head-space samples.
The gas phase test sample contained 100 ppm-mol o f n-C4, n-Cs, n-Ci, n-C%, and /1-C9,
and 150 ppm-mol of n-Ce, with air as balance (Liquid Carbonic; Chicago, IL). For
sensitivity and calibration studies, known volumes o f this mixture were transferred to
Tedlar bags (SKC; Houston, TX) and diluted with appropriate volumes o f99.99%
nitrogen.
The liquid n-paraffin test mixture was prepared gravimetrically in house, from
99.9% pure standards. It contained approximately 3000 ppm w/v in n-hexane, of each of
the following compounds: n-Cg, n-Cg, n-Cio, n-Cn, n-C13, «-C|4, n-C\s, n-C 16, n-Cn,
n-C ig, p-di-Cl-benzene, and 2-ethyl-naphtalene. Aliquots of this mixture were diluted by
a factor o f 10, 100, and 1000 to render 300, 30, and 3 ppm w/v solutions.
5.3 Results and Discussion
5.3.1 General Overview
The injector described in this chapter was very versatile, allowing the injection of
gaseous, liquid and head-space samples into a 100 mm i.d. column, without any
Reproduced with permission of the copyright owner. Further reproduction prohibited without permission.
189
configuration changes. As described in section 5.2.2, in this injector, a vacuum pump
pulled the sample through a microtrap for preconcentration. For the injection of gaseous
samples, the container (Tedlar bag or syringe) attached directly to the inlet valve. The
vacuum pump pulled the sample from its container to the microtrap, where the solutes
were retained, while the matrix exited the system through the pump vent. The duration of
the sampling time, controlled by the electronic board, determined the sample volume
preconcentrated in the microtrap.
Because the injector was hot, it was also compatible with liquid samples. In this
case, the liquid sample was slowly deposited with a syringe inside the tubing that
connected internally to the inlet valve. As the sample exited the needle, it encountered
elevated temperatures, and vaporized rapidly. The pump pulled the vapor through the
microtrap, where the solutes adsorbed and accumulated over the entire sampling period.
Most of the solvent passed through the trap leaving the system through the pump vent.
This was an additional advantage of the present injection system because it eliminated
excessively large solvent peaks that could mask the more volatile analytes.
Figures 5.3 and 5.4 present typical chromatograms o f a gaseous sample and a
liquid sample. In both cases, narrow symmetrical peaks for all analytes are observed.
Figure 5.4 corresponds to a sample that contained approximately 30 ppm w/v of each
analyte. The chromatogram clearly shows the reduction o f the solvent peak as a result of
the trap preconcentration.
The sampling and preconcentration features o f this injector were completely
compatible with static and dynamic headspace analyses. For this, the sample was placed
into a large vial with a septum cap. A transfer line attached to a hypodermic needle that
Reproduced with permission of the copyright owner. Further reproduction prohibited without permission.
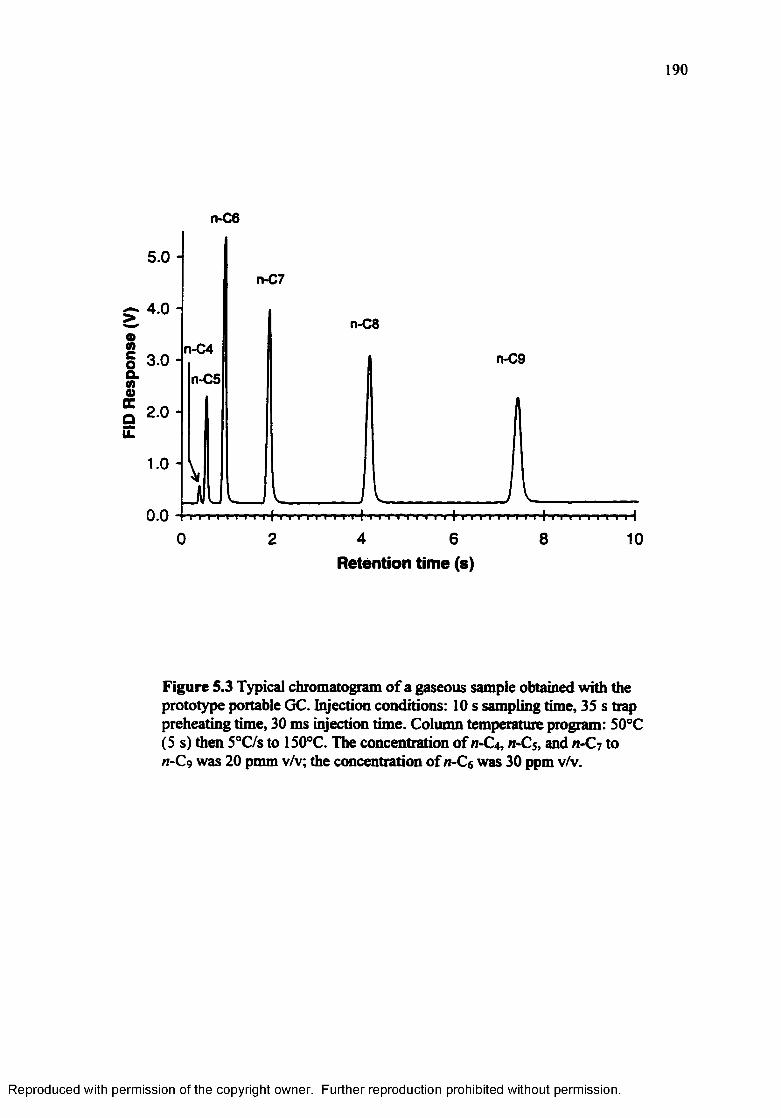
FID
Res
pons
e (V
)
190
n-C6
5.0 -n-C7
4.0 -n-C8
n-C4n-C93.0 -
n-C5
2.0 -
0.0 t r f r r r r r r r r r l
40 2 6 8 10Retention time (s)
Figure 5.3 Typical chromatogram o f a gaseous sample obtained with the prototype portable GC. Injection conditions: 10 s sampling time, 35 s trap preheating time, 30 ms injection time. Column temperature program: 50°C (5 s) then 5°C/s to 150°C. The concentration o f n-C*, n~Cs, and n-C7 to n-Cg was 20 pmm v/v; the concentration o f n-C& was 30 ppm v/v.
Reproduced with permission of the copyright owner. Further reproduction prohibited without permission.
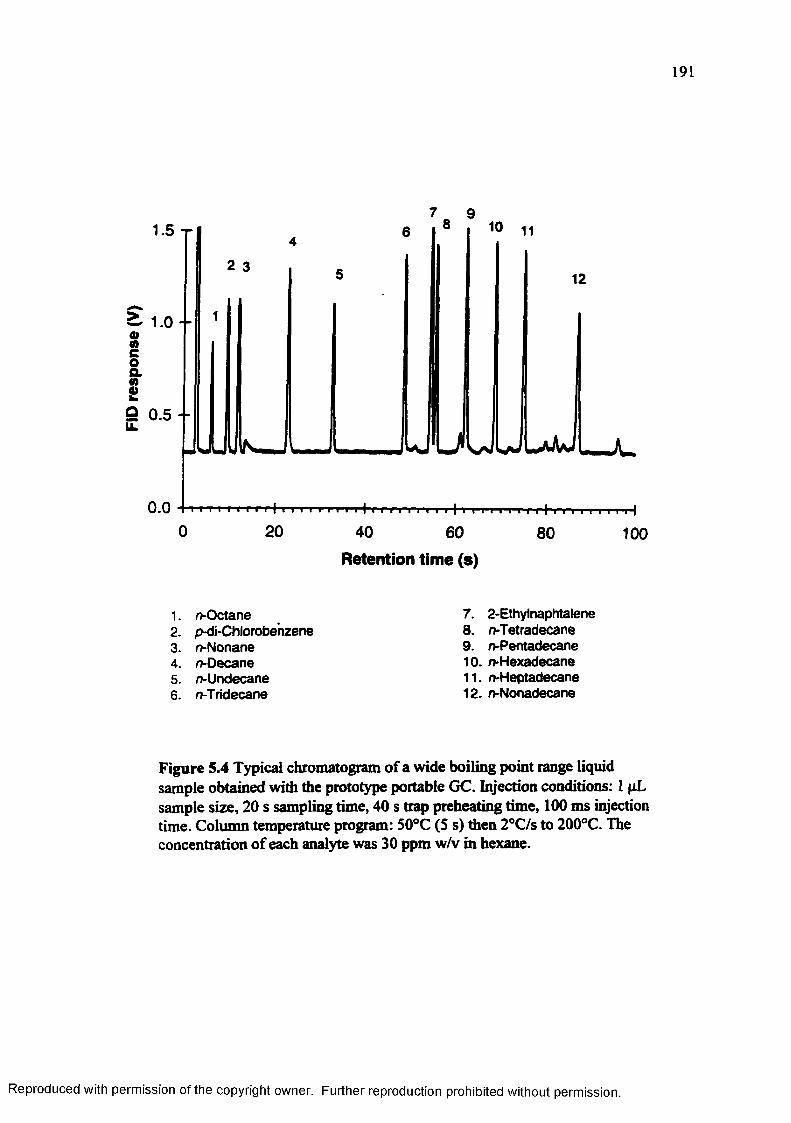
FID
resp
onse
(V
)
191
1.5 r
1.0 - -
0.5 --
0.0200 40 60 100
Retention time (s)
1. n-Octane 7. 2-Ethylnaphtalene2. p-di-Chlorobenzene 8. />Tetradecane3. n-Nonane 9. o-Pentadecane4. n-Decane 10. o-Hexadecane5. n-Undecane 11. n-Heptadecane6. n-Tridecane 12. n-Nonadecane
Figure 5.4 Typical chromatogram o f a wide boiling point range liquid sample obtained with the prototype portable GC. Injection conditions: 1 pL sample size, 20 s sampling time, 40 s trap preheating time, 100 ms injection time. Column temperature program: 50°C (5 s) then 2°C/s to 200°C. The concentration o f each analyte was 30 ppm w/v in hexane.
Reproduced with permission of the copyright owner. Further reproduction prohibited without permission.
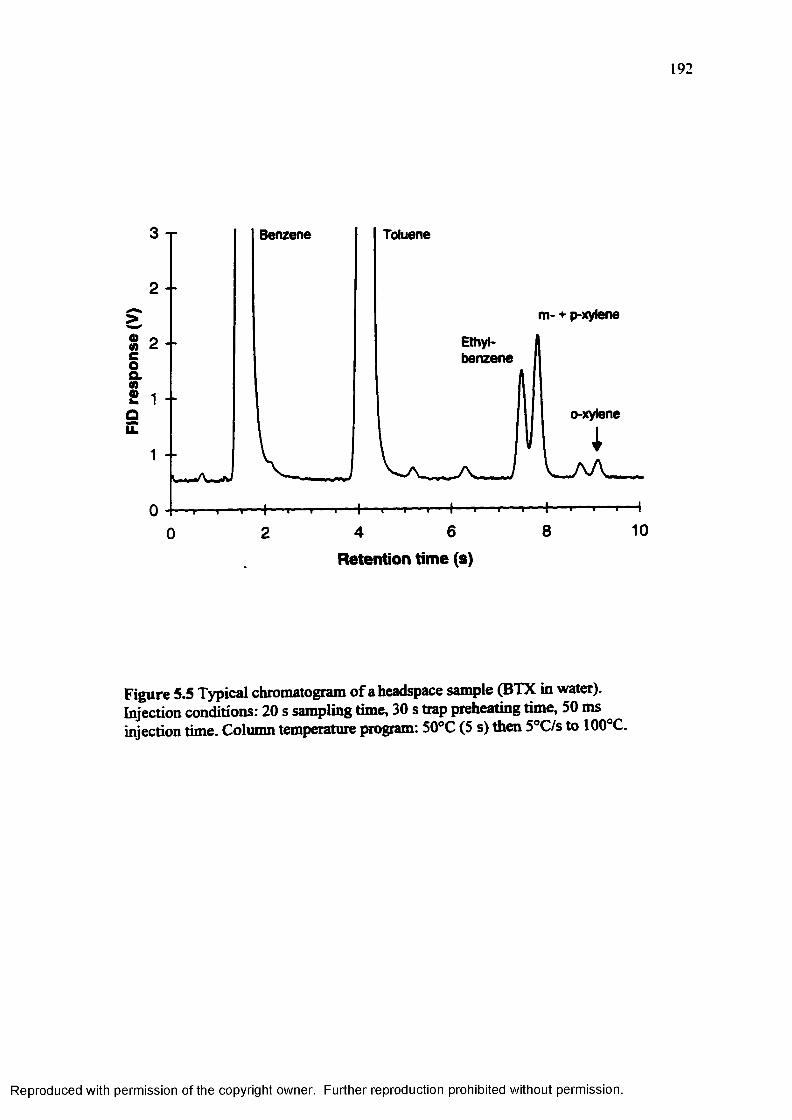
192
3
2
2o (0 c o aCO £ 1
1
TolueneBenzene
m- + p-xylene
Ethyl-benzene
o-xytene
J
TT
4 6
Retention time (s)8 10
Figure 5.5 Typical chromatogram o f a headspace sample (BTX in water). Injection conditions: 20 s sampling time, 30 s trap preheating time, 50 ms injection time. Column temperature program: 50°C (5 s) then 5°C/s to 100°C.
Reproduced with permission of the copyright owner. Further reproduction prohibited without permission.
193
pierced through the septum connected the sample vial directly to the inlet valve. In this
way, the vacuum pump directly pulled the headspace of the sample through the
preconcentration microtrap. For static headspace analysis, the sample vial was
maintained in a thermostatic bath and allowed to equilibrate at a suitable temperature
prior to the beginning of the headspace sampling. Figure S.5 presents a chromatogram of
BTX in water, analyzed by static headspace mode, using the prototype portable GC. The
figure shows good peak shape, and fast separation of the compounds.
In this preliminary evaluation, dynamic head space or purge and trap modes were
not tested. However, with the addition o f a controlled purge gas flow to the sample vial,
these modes could be easily implemented with the present injection system.
Table 5.1 presents the retention time reproducibility obtained with the prototype
GC, for gaseous as well as for liquid samples. The standard deviations as well as the
relative standard deviations are below the values found for the collinear at-column heater
with a conventional split injector (see chapter 4, p. 123), demonstrating the accuracy of
the time events that comprise the pressure driven injection system.
The previous paragraphs demonstrated the performance and versatility o f the new
injector for a wide variety of samples. The following sections will discuss the volatility
range compatible with the injector, the effect of various operational parameters,
preliminary quantitative evaluation, and limitations of the current design.
5.3.2 Volatility Range
One of the main limitations of currently available portable GCs is the reduced
sample volatility range covered by these analyzers. The injector described herein,
Reproduced with permission of the copyright owner. Further reproduction prohibited without permission.
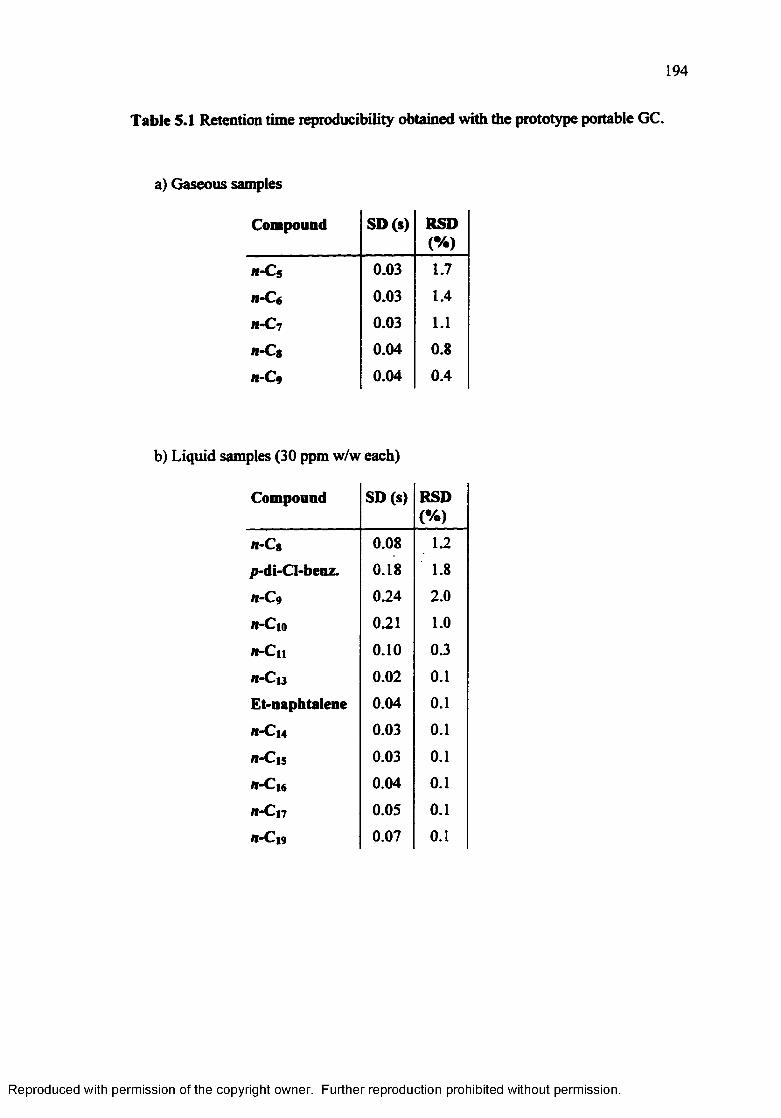
194
Table 5.1 Retention time reproducibility obtained with the prototype portable GC.
a) Gaseous samples
Compound SD(s) RSD(•/.)
H-Cg 0.03 1.7
n-Cf 0.03 1.4
H-C7 0.03 1 .1
n-Cg 0.04 0 . 8
11-C9 0.04 0.4
b) Liquid samples (30 ppm w/w each)
Compound SD (s) RSD(*/.)
n-Cg 0.08 1 . 2
p-di-Cl-benz. 0.18 1 . 8
n -C 9 0.24 2 . 0
rt-Cjo 0 . 2 1 1 . 0
n-C 11 0 . 1 0 0.3
n -C j3 0 . 0 2 0 . 1
Et-naphtalene 0.04 0 . 1
n -C j4 0.03 0 . 1
n-Cjs 0.03 0 . 1
«-Cl6 0.04 0 . 1
n -C i7 0.05 0 . 1
n - C n 0.07 0 . 1
Reproduced with permission of the copyright owner. Further reproduction prohibited without permission.
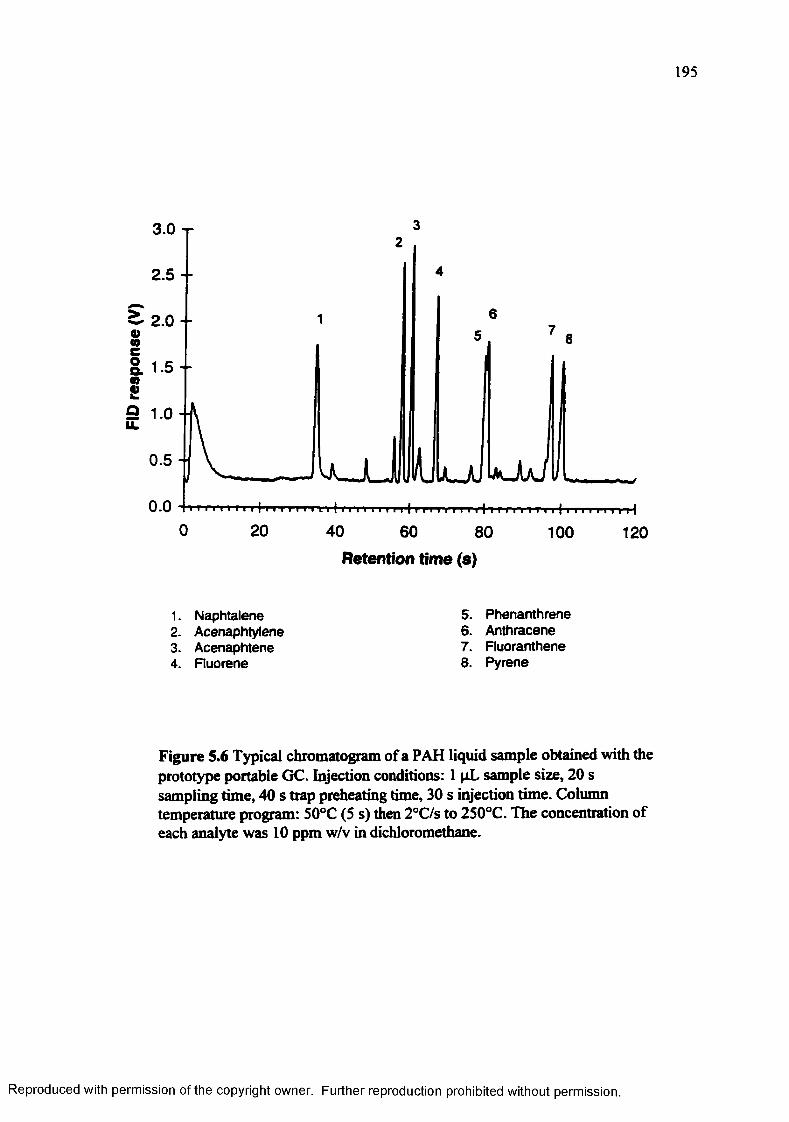
FID
resp
onse
(V
)
195
3.0 T
2.5 --
2.0 - -
1.5 --
1.0 - ■
0.5
0.00 20 40 60 80 100 120
Retention time (s)
1. Naphtalene2. Acenaphtylene3. Acenaphtene4. Fluorene
5. Phenanthrene6. Anthracene7. Fluoranthene8. Pyrene
Figure 5.6 Typical chromatogram of a PAH liquid sample obtained with the prototype portable GC. Injection conditions: 1 pL sample size, 20 s sampling time, 40 s trap preheating time, 30 s injection time. Column temperature program: 50°C (5 s) then 2°C/s to 250°C. The concentration of each analyte was 10 ppm w/v in dichloromethane.
Reproduced with permission of the copyright owner. Further reproduction prohibited without permission.
196
connected to the at-coiumn heater assembly, was capable o f injecting and separating
volatile and semi-volatile organic compounds in very short total analysis times.
Prior to its transfer to the column, the sample flowed along an almost entirely
heated path. The maximum operation temperature o f the heated zone determined the
upper sample volatility limit compatible with this injector. This value was 280°C,
limited by the maximum operation temperature o f the heating pad.
As seen in the chromatogram o f figure 5.4, paraffins up to n-C2o were
successfully transferred to the column. The sample contained equal weights o f each
component (30 ppm). The chromatogram shows only a small discrimination o f the less
volatile compounds, demonstrating satisfactory performance o f the injector for semi-
volatile organic compounds. Likewise, figure 5.6 shows a chromatogram of a standard
polycyclic aromatic compound test mixture containing equivalent weights o f each
compound. It demonstrates that even a tetracyclic aromatic compound (pyrene) was
transferred satisfactorily into the column, without significant discrimination relative to
the tricyclic and bicyclic compounds.
The microtrap efficiency limited the minimum analyte volatility suitable for
injection. Compounds that were too volatile to be retained in the microtrap would break
through the trap during the sample period. Consequently, their concentration in the
injection band was not representative for the original sample concentration, and their
peak areas smaller than the areas o f the less volatile compounds.
Figure 5.3 reproduces a typical chromatogram obtained for the standard gaseous
test mixture. The molar concentration of each of the solutes was approximately equal.
The relative peak size o f /1-C4 clearly indicates that this compound was not well retained
Reproduced with permission of the copyright owner. Further reproduction prohibited without permission.
197
in the microtrap. The particular trap used in this study retained only compounds Q and
higher. A first layer of different packing material in the microtrap, such as active
charcoal, would reduce the minimum volatility suitable for the injector described herein.
5 3 3 Effect of the Trap Preheating Time
Figures 5.3 and 5.4 show certain degree o f analyte discrimination based on their
volatility. The magnitude of this discrimination depended partially on the trap heating
parameters. As described in section 5.2, the microtrap remained at ambient temperature
during the sampling period. For the thermal desorption o f the analytes, the trap was then
heated ballistically to a software selected final temperature. During this trap pre-heating
period, no carrier gas flowed through the trap. Generally, the sample transfer from the
trap to the column took place during the trap heating process, before the trap reached the
final temperature. This way, the trap temperature during the clean out period was above
the trap temperature at injection, ensuring complete desorption o f heavy contaminants
during the trap purging period.
Because the trap was heated ballistically, the heating rate o f the trap was
constant, and determined only by the resistance of the heater, the thermal mass o f the
trap plus heater, the heat dissipation, and the voltage o f the power source. Therefore, the
trap temperature at injection depended on the trap preheating time. Larger trap
preheating times resulted in higher trap temperatures at injection, and consequently,
more efficient desorption and injection o f high boiling point compounds. However, for
large trap preheating periods, low boiling point compounds remained in vapor phase
during relatively long time, and diffused within the system. This translated in reduced
sample transfer efficiency of volatile compounds to the column. Consequently, the trap
Reproduced with permission of the copyright owner. Further reproduction prohibited without permission.
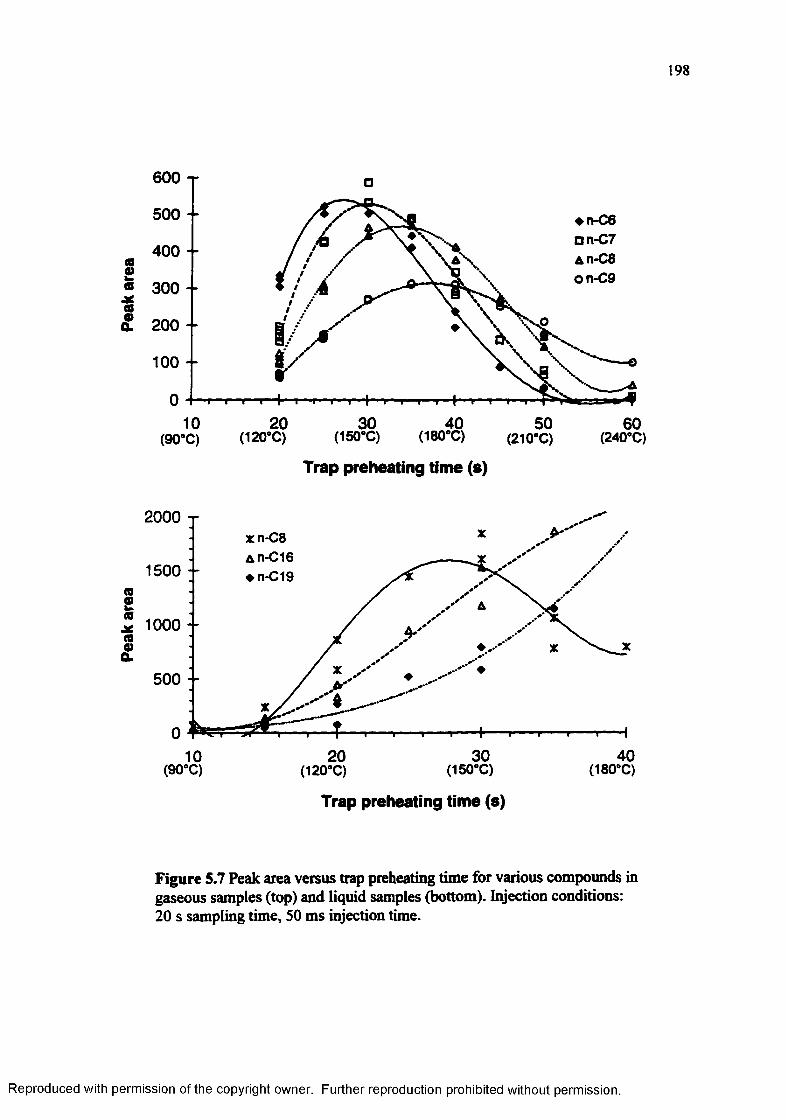
Peak
are
a Pe
ak a
rea
198
600 T
♦ n-C6 an-C7 A n-C8 on-C9
400 --
300 --
200 - -
100 -
20(120°C) 30(150°C)10(90°C) 40(180°C) 50(210°C) 60(240°C)Trap preheating time (s)
2000xn-C8 an-C16 ♦ n-Cl91500
1000
500
30 402010(90°C) (120°C) (150°C) (180°C)Trap preheating time (s)
Figure 5.7 Peak area versus trap preheating time for various compounds in gaseous samples (top) and liquid samples (bottom). Injection conditions: 20 s sampling time, 50 ms injection time.
Reproduced with permission of the copyright owner. Further reproduction prohibited without permission.
199
preheating time had to be optimized for the volatility range of the analytes, as a
compromise between minimum diffusion o f volatile compounds and maximum
desorption o f high boiling point compounds.
Figure 5.7a shows the peak areas o f n-C$ to n-C9 obtained from the injection of
the gaseous test sample, as a function o f the trap preheating time. The graph shows that
trap preheating time, and consequently, the trap temperature for maximum peak area,
increased with the carbon number o f the analyte. Similar trends are observed in figure
5.7b obtained for the injection o f liquid samples.
These graphs demonstrate the loss of volatile analytes for long trap preheating
times. Thus, short desorption times are desirable. However, the trap must reach the
necessary temperature for the thermal desorption of the less volatile compounds.
Therefore, to maximize desorption over the whole volatility range and minimize
diffusion, the trap heating rate should be high. The trap used in this case had a heating
rate of approximately 3°C/s. Its heater wire resistance was approximately 12£2, and its
thermal mass relatively large. Reduction o f the heater resistance and modifications in the
trap design to reduce its thermal mass would lead to a considerably faster heating rate,
which in turn would reduce the total analysis time and the analyte discrimination due
their boiling point distribution.
5.3.4 Injection Time and Injection Band
Chapter 3 (pp. 69-72) as well as section 5.1 described the need for fast injection
bands in narrow bore capillary columns. This is particularly critical for analytes with low
capacity factors. Under temperature programmed conditions, only the low boiling point
Reproduced with permission of the copyright owner. Further reproduction prohibited without permission.

200
compounds have a low capacity factor at injection. Therefore, narrow injection bands are
most critical for the analysis o f samples containing analytes Cq and lower.
The injector described herein permitted the modification o f the injection times
through software selected changes of the time events. The injection time was determined
by the time period during which valves 2 ,3 and 5 remained closed, and valve 4 was open
(see figure 6.1 and section 5.2.2). The actuation times o f these valves as well as the time
event resolution o f the electronic control board were 10 ms. Thus, theoretically, the
fastest injection band was 10 ms. In practice, however, the shortest injection time that
effectively transferred sample into the column was 30 ms. The peak width at half height
of a non-retained compound (solvent) obtained with a 30 ms injection time was 60ms.
Figure 5.8 shows the partial van Deemter plot obtained for n-Cu and n-Ci6 with
the prototype portable GC. For comparison, the van Deemter plot for a similar column,
obtained with the split injector (see chapter 3, p. 72), is included in the graph. Clearly,
the quadratic increase of H with the earner gas velocity, that results from extra-column
effects was greatly reduced with the present injection system, as compared to the split
injector. However, for carrier gas velocities close to the plate height obtained with
the prototype microGC was more than two times larger than the minimum plate height
obtained with the split injector.
Interpretation o f this van Deemter plot requires special considerations. In chapter
2 (p. 40-43), it was demonstrated that the plate height contribution from the injection
band to the total plate height of a GC system is described by the following equation:
Hmj = a + k ' ) 2 L K j [ 5 l ]
Reproduced with permission of the copyright owner. Further reproduction prohibited without permission.
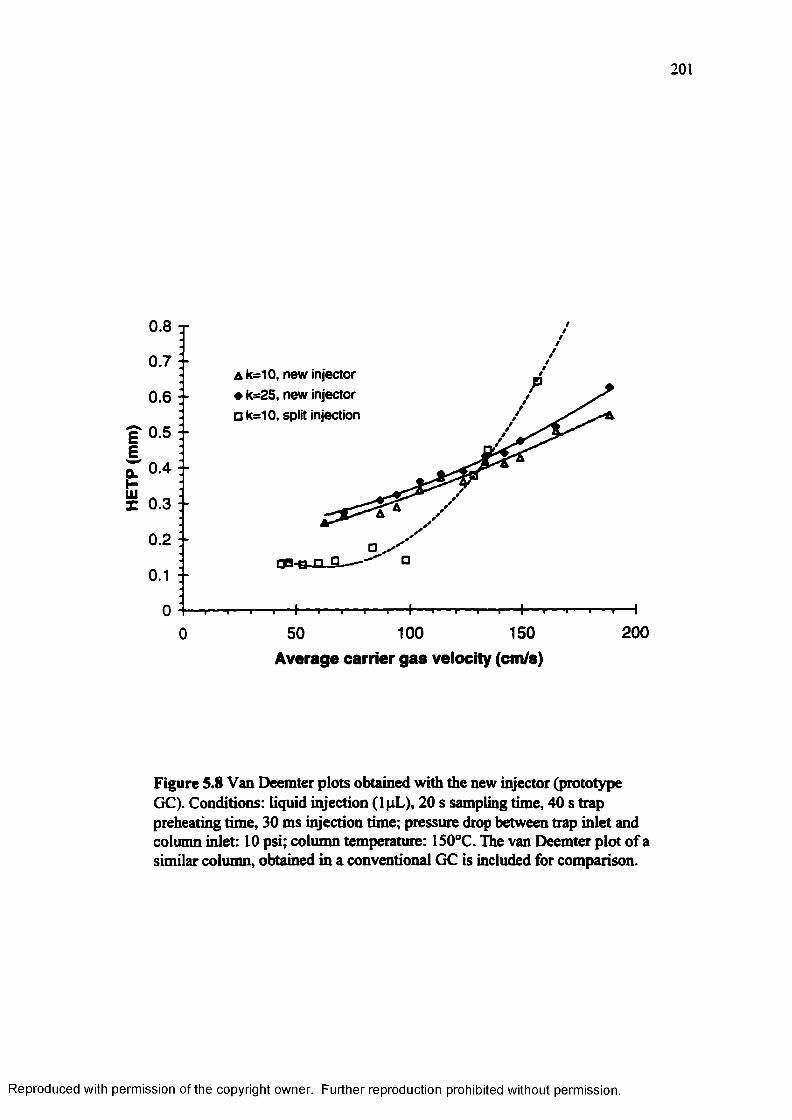
HETP
(m
m)
201
0.8
0.7k=l0, new injector k=25, new injector k=10, split injection
0.6
0.5
0.4
0.3
0.2
0.1
0200150100500
Average carrier g a s velocity (cm/s)
Figure 5.8 Van Deemter plots obtained with the new injector (prototype GC). Conditions: liquid injection (lpL), 20 s sampling time, 40 s trap preheating time, 30 ms injection time; pressure drop between trap inlet and column inlet: 10 psi; column temperature: 150°C. The van Deemter plot of a similar column, obtained in a conventional GC is included for comparison.
Reproduced with permission of the copyright owner. Further reproduction prohibited without permission.

202
where cr^ corresponds to the variance o f the injection band in time units, and um] to the
carrier gas velocity at injection. In a split injector, umi is the carrier gas velocity o f the
column. Hence, the variance o f the injection band causes a quadratic increase of the plate
height with the column carrier gas velocity in the van Deemter plot (see chapter 2, p. 40).
The injection using the new injector proceeded always at the same carrier gas
velocity, namely, the carrier gas velocity supplied by the high pressure carrier gas from
valve 4, that flushed the sample from the trap to the head o f the column. Therefore, the
peak broadening introduced by the injector was independent o f the actual column linear
carrier gas velocity during the elution of the chromatogram. This peak broadening
depended on the linear carrier gas velocity during injection, which was constant, and
should consequently be reflected in the van Deemter plot as a constant offset.
The van Deemter plot in Figure 5.8 appears to present such a constant offset. This
offset corresponds to approximately 0.15 mm. Because the carrier gas velocity during the
injection was unknown, it was not possible to determine the time constant of the injector
from this experiment. However, the plate height offset seems relatively large,
considering the short nominal injection band. The column used in the prototype GC had
been subjected to many temperature cycles, and was even heated accidentally without
carrier gas flow in several occasions. Thus, it was not clear if the coating efficiency of
the column was deteriorated and contributed to the relatively high plate height observed
in this system. For the accurate determination of the peak broadening introduced by the
new injection system, a similar experiment, using a column o f known efficiency, should
be performed.
Reproduced with permission of the copyright owner. Further reproduction prohibited without permission.
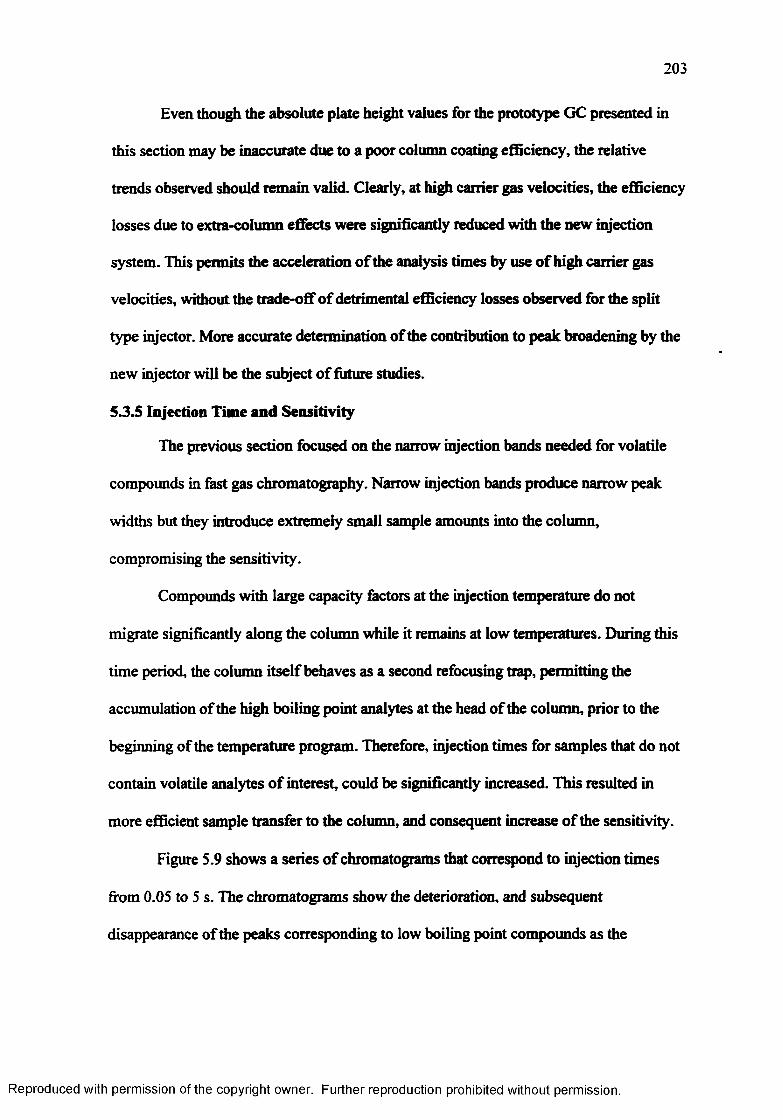
203
Even though the absolute plate height values for the prototype GC presented in
this section may be inaccurate due to a poor column coating efficiency, the relative
trends observed should remain valid. Clearly, at high carrier gas velocities, the efficiency
losses due to extra-column effects were significantly reduced with the new injection
system. This permits the acceleration o f the analysis times by use o f high carrier gas
velocities, without the trade-off o f detrimental efficiency losses observed for the split
type injector. More accurate determination of the contribution to peak broadening by the
new injector will be the subject o f future studies.
5.3.5 Injection Time and Sensitivity
The previous section focused on the narrow injection bands needed for volatile
compounds in fast gas chromatography. Narrow injection bands produce narrow peak
widths but they introduce extremely small sample amounts into the column,
compromising the sensitivity.
Compounds with large capacity factors at the injection temperature do not
migrate significantly along the column while it remains at low temperatures. During this
time period, the column itself behaves as a second refocusing trap, permitting the
accumulation of the high boiling point analytes at the head o f the column, prior to the
beginning of the temperature program. Therefore, injection times for samples that do not
contain volatile analytes o f interest, could be significantly increased. This resulted in
more efficient sample transfer to the column, and consequent increase o f the sensitivity.
Figure 5.9 shows a series of chromatograms that correspond to injection times
from 0.05 to 5 s. The chromatograms show the deterioration, and subsequent
disappearance of the peaks corresponding to low boiling point compounds as the
Reproduced with permission of the copyright owner. Further reproduction prohibited without permission.
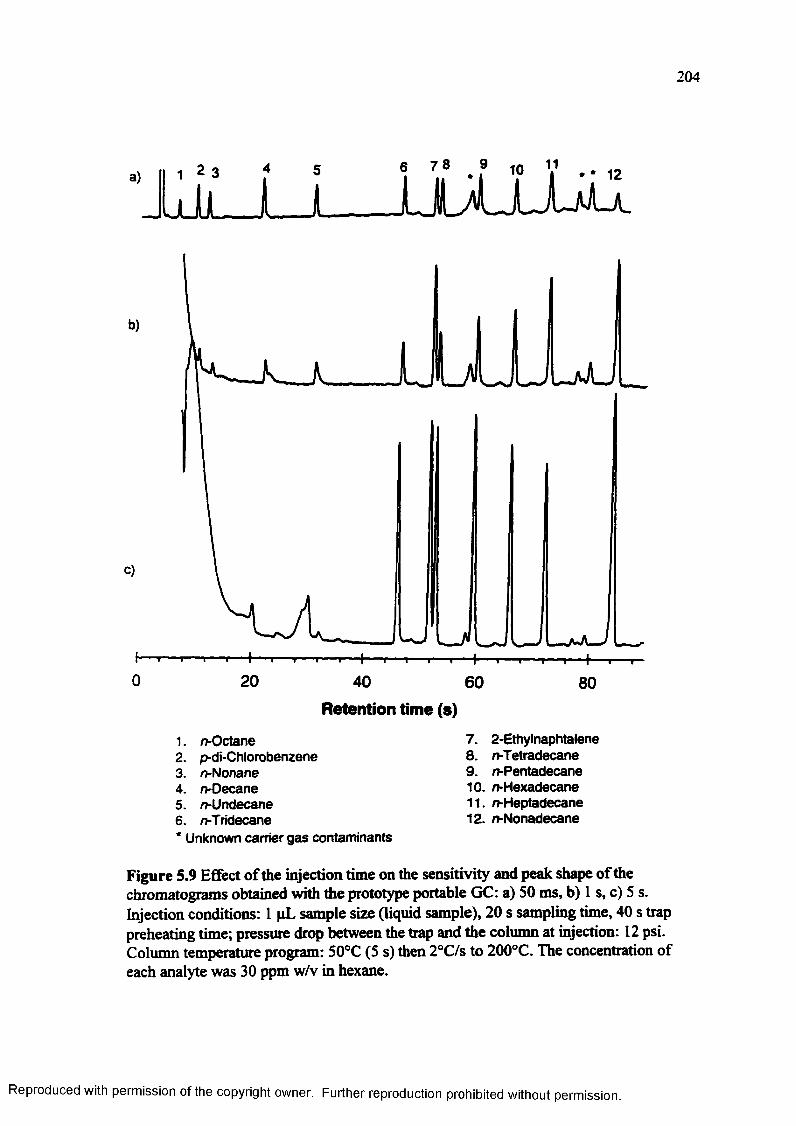
204
a) LILJU-JlI I jlIau
t T T T T T T T T T TT20 40 60
Retention time (s)80
1. o-Octane2. p-di-Chlorobenzene3. n-Nonane4. n-Decane5. n-Undecane6. />Tridecane* Unknown carrier gas contaminants
7. 2-Ethylnaphtalene8. n-Tetradecane9. n-Pentadecane10. n-Hexadecane11. n-Heptadecane12. n-Nonadecane
Figure 5.9 E£fect o f the injection time on the sensitivity and peak shape of the chromatograms obtained with the prototype portable GC: a) 50 ms, b) 1 s, c) 5 s. Injection conditions: 1 (iL sample size (liquid sample), 20 s sampling time, 40 s trap preheating time; pressure drop between the trap and the column at injection: 12 psi. Column temperature program: 50°C (5 s) then 2°C/s to 200°C. The concentration of each analyte was 30 ppm w/v in hexane.
Reproduced with permission of the copyright owner. Further reproduction prohibited without permission.
205
sampling time increased. It simultaneously shows the increase o f the peak area of
compounds n-C 13 and higher with increasing injection time. These chromatograms
clearly demonstrate the advantage o f long injection times for low boiling point
compounds. The peak area o f the solute in the 5 s injection was more than 10 times
larger than the peak area o f the 50 ms injection. In this study, it was not determined up to
which injection times the peak areas would increase. However, injection times up to 40 s
showed no peak shape deterioration for compounds C14 and higher.
Since the column behaved as an in line preconcentrator for compounds Cm and
higher, the initial preconcentration step in the microtrap is not required for these
compounds. The sample could continuously flow into the column, generated, for
example, in a permeation device, and be analyzed in a multiplex chromatography mode.
Alternatively, the sample could be contained in a large sample loop and transferred
periodically to the column. None o f these injection modes would be compatible with
volatile organic compounds. The advantage of the injection system described herein is its
flexibility that permits fast and slow injections, selected simply by small changes in the
operational parameters.
Two additional operational parameters that permit adjust the sensitivity of the
system are the sampling time and the pressure drop between the microtrap and the
column head. Increasing the sampling time increases the analyte loading on the trap, and
consequently, the amount o f analyte injected into the column.
The pressure drop between the trap and the column head during the sample
transfer to the column dictates the flow rate to the column during injection. A higher
Reproduced with permission of the copyright owner. Further reproduction prohibited without permission.
206
flow rate results in a more efficient sample transfer to the column. This aspect o f the
present injector will be discussed in more detail in chapter 6.
5.3.6 Quantitative Analysis
This work includes only a preliminary evaluation o f the quantitative performance
of the new injector. Table 5.2 summarizes the peak area reproducibility found for
gaseous and liquid standard mixtures o f different concentrations. As seen in the table, the
quantitative precision at this stage o f development was rather poor. Absolute standard
deviations o f the gaseous samples increased with the sample concentration, while the
relative standard deviations varied between 5 and 25%. Peak area variations were largest
for the most and the least volatile compounds in the sample. This indicates that the
diffusion in the trap during the preheating period, and the desorption of the least volatile
compounds was subjected to random variations. As discussed in section 5.3.3, in these
preliminary experiments, the sample injection proceeded during the temperature increase
cycle of the trap, and not after the trap reached a final stable temperature. This probably
caused variations in the precise trap temperature at injection, and consequently, in the
vapor phase composition inside the trap. The use o f a trap heater with faster heating rates
should reduce this problem, because the trap could be heated to the final temperature in a
shorter time period. This would permit injections at the final trap temperature, without
significant losses o f the volatile compounds as a result o f diffusion.
The operation o f the manual inlet valve is another possible source o f error. Ia a
recent study, the manual injection valve was replaced by a check valve, rendering RSD
values for the peak areas of approximately 8% (5.35). Careful elimination o f possible
cold zones and dead volumes, minimization of plumbing lines, and the use of fused silica
Reproduced with permission of the copyright owner. Further reproduction prohibited without permission.
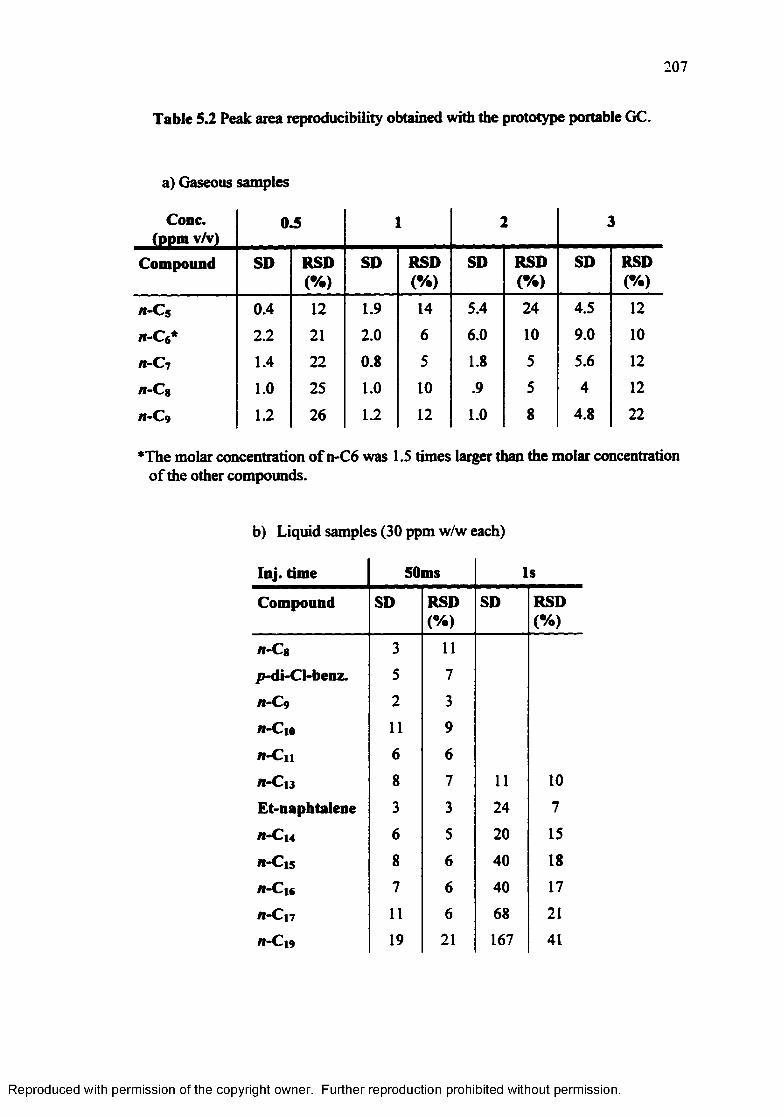
207
Table 5.2 Peak area reproducibility obtained with the prototype portable GC.
a) Gaseous samples
Cone, (ppm v/v)
0.5 L tI *\
Compound SD RSD(% )
SD RSD(% )
SD RSD(% )
SD RSD(%)
n-C$ 0.4 1 2 1.9 14 5.4 24 4.5 1 2
n-C«* 2 . 2 2 1 2 . 0 6 6 . 0 1 0 9.0 1 0
n-C^ 1.4 2 2 0 . 8 5 1 . 8 5 5.6 1 2
/i-Cg 1 . 0 25 1 . 0 1 0 .9 5 4 1 2
/1-C9 1 . 2 26 1 . 2 1 2 1 . 0 8 4.8 2 2
*The molar concentration o f n-C6 was 1.5 times larger than the molar concentration o f the other compounds.
b) Liquid samples (30 ppm w/w each)
Inj. time 50ms Is
Compound SD RSD(%)
SD RSD(% )
n-Cg 3 1 1
p-di-Cl-benz. 5 7
n-C9 2 3
n-Cio 1 1 9
n-Cii 6 6
n-C 13 8 7 1 1 1 0
Et-naphtalene 3 3 24 7
n-C u 6 5 2 0 15
n-C 15 8 6 40 18
n-Cj6 7 6 40 17
n-Ci7 11 6 6 8 2 1
n-C | 9 19 2 1 167 41
Reproduced with permission of the copyright owner. Further reproduction prohibited without permission.
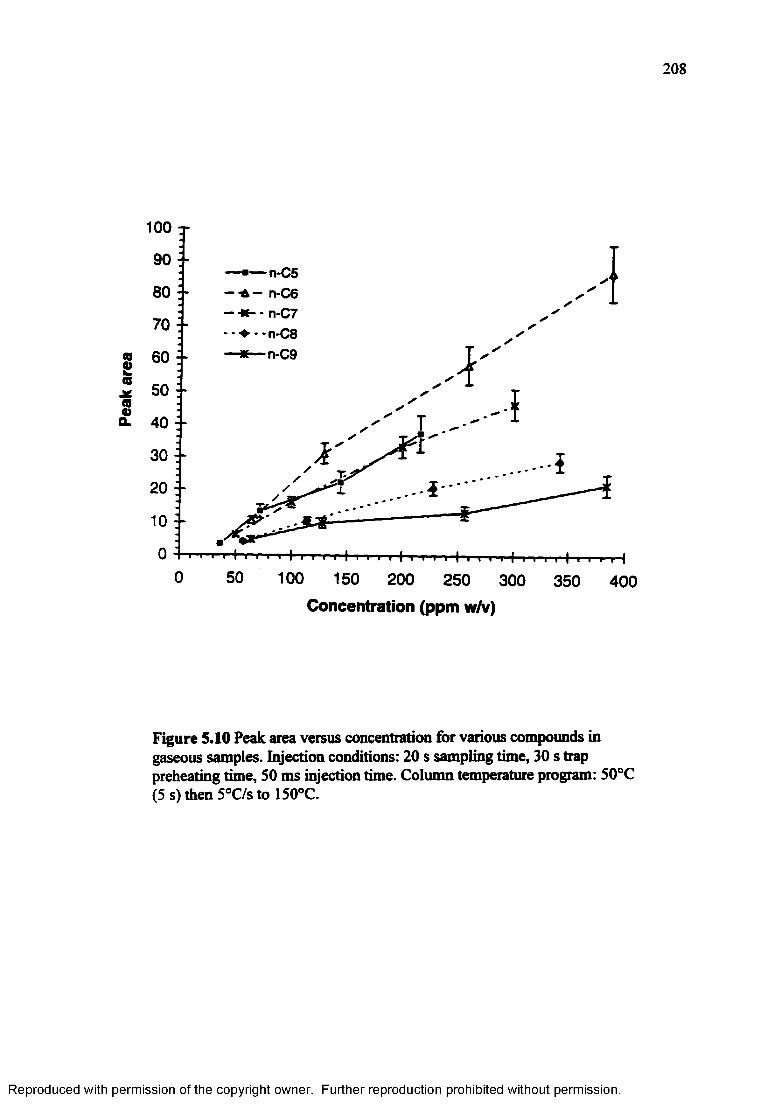
Peak
ar
ea
208
100
— ■— n-C5 — - A - n-C6 - - n-C7•-♦ * * n -C 8 — * — n-C9
10
0 50 100 150 200 250 300 350 400
Concentration (ppm w/v)
Figure 5.10 Peak area versus concentration for various compounds in gaseous samples. Injection conditions: 20 s sampling time, 30 s trap preheating time, 50 ms injection time. Column temperature program: 50°C (5 s) then 5°C/s to 150°C.
Reproduced with permission of the copyright owner. Further reproduction prohibited without permission.
209
lined tubing instead o f bare stainless steel tubing may also improve the quantitative
reproducibility of this injector. In addition, leaks in the solenoid valves used in this
prototype injector, which were designed to withstand pressure from only one inlet port,
but received pressure in this injector from 2 inlet ports, may contribute to the observed
peak area variations.
In spite o f the relatively large peak area variations encountered, the peak areas
varied clearly as a function o f the analyte concentration. Figure 5.10 shows the
calibration curves obtained for gaseous samples o f different concentration. The
concentration was calculated as ppm w/v, because the FID is a mass sensitive detector.
The graph shows an almost linear increase of the peak areas o f all the analytes with their
concentration. However, contrary to the response expected by the FID, the peak area
increase per unit concentration varied for each analyte. The trap preheating time in this
series of experiments was 30s. Figure 5.7a shows that under these conditions the
desorption of n-C 7 is most efficient. Thus, the relative slopes o f the curves in figure 5.10
reflect the desorption/diffusion profiles of the analytes from the trap. Again, faster trap
heating times that would ensure volatilization of all the analytes without significant
losses by diffusion could improve the quantitative behavior o f the injector.
The peak area reproducibility found for wide boiling point range liquid samples
was even poorer than for gaseous samples. As in the case o f gaseous samples, the least
volatile compound (n-C 19) showed the largest peak area variations. In the case of these
high boiling point analytes, memory effects o f the injector, caused by cold spots,
probably added to the analyte desorption variability, rendering poor peak area
reproducibility.
Reproduced with permission of the copyright owner. Further reproduction prohibited without permission.
210
As stated before, this work contains only preliminary evaluations o f the
quantitative performance o f the injector. However, it clearly demonstrates that the
system needs some modifications in order to improve the quantitative performance.
5.4 Conclusions and Future W ork
The work described in this chapter constitutes a preliminary evaluation and proof
of concept of the pressure driven injector. It demonstrated that system is capable o f
delivering narrow sample plugs into a 100pm i.d capillary column. The system is
suitable for the injection o f gaseous and liquid samples, that cover a carbon number
range from n-C6 to n-C20. It is compatible with special sampling techniques such as
headspace analysis and purge and trap methods. The injector presents great flexibility,
allowing fast injection pulses needed for fast GC o f volatile compounds, as well as time
integrated injections o f semi-volatile compounds, with simple changes in the software
selected operating parameters.
However, some aspects o f this injector need further development. First, the
quantitative performance needs improvement. The use of faster solenoid valves that
withstand pressure from all three ports, fused silica lined tubing to reduce activity, and
faster trap heaters are some o f the modifications that could lead to improved quantitative
reproducibility.
Ideally, the size of the injector should be minimized for use in a portable GC.
This has the advantage of smaller size and weight, but, more importantly, it requires less
power to be maintained at high temperatures. The elements that limit the size o f the
current design are mainly the connectors inside the heated zone. Ideally, the flow paths
of the injector should be contained in a single, solid state device, like a manifold. This
Reproduced with permission of the copyright owner. Further reproduction prohibited without permission.
211
would reduce significantly the size and dead volumes o f the injector, improving its
performance. Bulk micromachining techniques for the fabrication of microstructures
with high aspect ratio, such as LIGA (lithography, electroforming, and micromolding,
5.36) could produce such an “injector chip”. Still, leak free, heat resistant connections of
the peripherals (trap, solenoid valves, column) to the chip would be a technical
challenge.
5.5 References for Chapter 5
5.1 Lee, M. L.; Yang, F. J.; Bartle, K. D.; “Open Tubular Column Gas Chromatography. Theory and Practice” Wiley-Interscience, New York, 1984
5.2 Poole, C. F.; Poole, S. K.; “Chromatography Today”, Elsevier, Amsterdam, 1991.
5.3 Grant, D. W.; “Capillary Gas Chromatography”; Separation Science Series; Scott,R. P. W.; Simpson, C.; Katz, E. D. (eds.), Wiley, Chichester-UK 1996.
5.4 Hyver, K. J.; Phillips, R. J. J . Chromatogr. 1987, 399, 33-46.
5.5 Wade, R. L., Cram, S. P. Anal. Chem. 1972, 4 4 , 131-139.
5.6 Gaspar, G., Arpino, P., Guichon, G. J . Chromatogr. Sci. 1977,15, 256-261.
5.7 Annino, R.; Leone, J . J . Chromatogr. Sci. 1982, 2 0 ,19-26.
5.8 Tijssen, R.; Van den Hoed, N.; Van Kreveld, M. E. Anal. Chem. 1987,5 9 ,1007- 1015.
5.9 Lee, G.; Ray, C.; Siemers, R.; Moore, R. Am. Lab. Feb. 1989, 110-119.
5.10 Annino, R. J. High Resol. Chromatogr. 1996,19,285-290.
5.11 Phillips, J. B.; Luu, D..; Pawliszyn, J. Anal. Chem. 1985,57,2779-2787.
5.12 Phillips, J. B.; Luu, D.; Lee, R. J. Chromatogr. Sci. 1986,2 4 ,396-399.
5.13 Mitra, S.; Phillips, J. B. J. Chromatogr. Sci. 1988,2 8 ,620-623.
5.14 Liu, Z.; Zhang, M.; Phillips, J. J . Chromatogr. Sci. 1990,28, 567-71.
5.15 Ewels, B. A.; Sacks, R. D. Anal. Chem. 1985,5 7 ,2774-2779.
Reproduced with permission of the copyright owner. Further reproduction prohibited without permission.
212
5.16 Lanning, L. A.; Sacks, R. D.; Mouradin, R. F.; Levine, S. P.; Foulke, J. A .Anal. Chem. 1988,6 0 ,1994-1996.
5.17 Mouradin, R., Levine, S., Sacks, R. J. Chromatogr. Sci. 1990,28 ,643-648.
5.18 Klemp, M.; Sacks, R. D.J. Chromatogr. Sci. 1991,29, 114-121.
5.19 Peters, A.; Klemp, M.; Puig, L.; Rankin, C.; Sacks, R. Analyst 1991,116,1313- 1320.
5.20 Klemp, M. A.; Akard, M. L.; Sacks, R. D. Anal. Chem. 1993,65 ,2516-2521.
5.21 Akard, M.; Sacks, R. D. J. Chromatogr. Sci. 1994,32,499-505.
5.22 Rankin, C. L.; Sacks, R. D.J. Chromatogr. Sci. 1994,32, 7-13.
5.23 Varian Analytical Instruments, Box 9000, Dept. 87, San Fernando, CA 91340.
5.24 Borgerding, A. J.; Wilkerson Jr., W. Anal Chem. 1996, 68, 701-707.
5.25 Mitra, S.; Lai, A. J. Chromatogr. Sci. 1995,33,285-289.
5.26 Mitra, S.; Xu, Y. H.: Chen, W.; Lai, A. J. Chromatogr. A 1996, 727, 111-118.
5.27 Mitra, S.; Zhu, N.; Zhang, X.; Kebbekus, B. J. Chromatogr. A 1996, 736, 165-173.
5.28 Mainga, A., Ph. D. Thesis, Louisiana State University, Baton Rouge, LA, 1992
5.29 Overton, E. B.; Camey, K. R.; Steward, M. T. J. Hazardous Materials 1995,43, 77-89.
5.30 Shirey, R. E. J. High Resol. Chromatogr. 1995,18,495-499.
5.31 Gorecki, T.; Pawliszyn, J. Anal. Chem. 1995,6 7 ,3265-3274.
5.32 Deans, D. R. Chromatographia, 1968,1 ,18.
5.33 Schomburg, G.; Husmann, H.; Weeke, F. J. J. Chromatogr. 1975, 91,603.
5.34 Van Es, A.; Janssen, J.; Bally, R.; Cramers, C.; Rijks, J. A. J. High Resol. Chromatogr., 1987,10, 273-279.
5.35 Overton, E. B., personal communication, Baton Rouge, 1997.
5.36 Ristic, L., Ed. “Sensor Technology and Devices”, Artech House, Boston 1994, p.146-149.
Reproduced with permission of the copyright owner. Further reproduction prohibited without permission.
CHAPTER 6
ELECTRONIC PRESSURE CONTROL IN FAST PORTABLE GAS CHROMATOGRAPHY
6.1 Introduction
The column temperature and the carrier gas flow rate through the column are
the most important operational variables in gas chromatography. Both affect the
retention time and width o f the chromatographic peaks; hence, maximum accuracy
o f these two parameters is mandatory for reproducible chromatographic results (see
chapter 2, p. 15-20).
The column temperature as well as the carrier gas flow can be programmed
in time to optimize peak distribution and partially offset the general elution problem
(6.1). Chapter 4 described two novel column heating designs compatible with fast
portable gas chromatography. However, in portable chromatography, pressure
programming instead of, or combined with temperature programming, has potential
advantages over temperature programming under isobaric conditions. First, pressure
programming is significantly less power demanding than temperature programming.
This translates into an increased life cycle o f the batteries. In addition, carrier gas
flow rates reset almost instantaneously, whereas column cooling is a relatively slow
process. Thus, inlet pressure programming can significantly reduce the total cycle
time. Finally, pressure programming can be used advantageously for the
optimization o f a pressure driven injection system, as the one described in the
previous chapter.
Until recently, standard pneumatic pressure controllers with manual
adjustment served for the pressure, and consequently, flow control of the carrier gas213
Reproduced with permission of the copyright owner. Further reproduction prohibited without permission.

214
in most commercial capillary column gas chromatographs. While these systems
were very rugged and reliable, the manual setting was a source o f operational
variability, and their size and weight are impractical for portable gas
chromatography. In the early 1980s, electronic pressure controllers (EPC) were
developed (6.2-6.6), and became commercially available. Offered first as an optional
feature for the HP5880 and 5890 gas chromatographs, the EPCs became a standard
part o f the HP6890, launched commercially in 1995 (6.7). Other vendors offered
standalone electronic pressure programming units designed for their use with any
commercial gas chromatograph (6.8). The EPCs greatly improved the accuracy of
the pressure setting by digital feedback control; however, the size and weight of
commercially available stand-alone EPCs remain incompatible with portable
instrumentation.
Besides o f the increased flow reproducibility of the EPCs, these systems
allow accurate pressure programming (6.4,6.5). The potential o f flow programming
as an alternative to isobaric temperature programming in order to accelerate the
elution of the compounds with larger capacity factors has long been recognized. As
early as 1959, Lipsky and co workers reported the use of step programming of the
column head pressure to speed up the analysis time o f fatty acids (6.9). Since then,
several researchers investigated the effect o f different pressure and flow versus time
profiles for gas chromatography (6.3-6.6,6.9-6.14). For example, Nygren and
coworkers showed that an exponential increase in the carrier gas flow rates under
isothermal conditions resulted in similar peak distribution than a linear temperature
increase under isobaric conditions (6.14). More recently, Peters and Sacks
Reproduced with permission of the copyright owner. Further reproduction prohibited without permission.
215
demonstrated the advantages o f inlet pressure programming in high-speed gas
chromatography using a very short column combined with a cryofocusing inlet
system (6.15).
One disadvantage o f inlet pressure programming is the reduction in column
efficiency caused by the increase in the carrier gas velocities, as demonstrated in the
Golay-Giddings-Gaspar equation (Eq. 2.59). Additionally, inlet pressure
programming can only cover a fraction o f the solute volatility range covered by
temperature programming. Therefore, temperature programming is generally
preferred over inlet pressure programming. There are, however, cases in which inlet
pressure programming has advantages over temperature programming.
The reduction in elution temperatures of the solutes under pressure
programmed conditions represented a significant advantage in the early days of GC
development, when the stationary phases had low thermal stability. With the advent
of crossiinked and bonded stationary phases, their thermal stability greatly increased,
and maximum operation temperature no longer was a limiting factor in most GC
analyses. Inlet pressure programming, however, is still a useful alternative for the
analysis of thermally labile compounds. Another common application is to keep
constant column flow during temperature programmed runs, which results in
improved peak shapes of the late eluting compounds and better stability of flow
sensitive detectors (6.6). Negative inlet pressure programming can improve the
quality of splitless injections (6.16), and reduce the decomposition o f thermally
labile compounds during this injection mode (6.17). Ease o f implementation,
Reproduced with permission of the copyright owner. Further reproduction prohibited without permission.
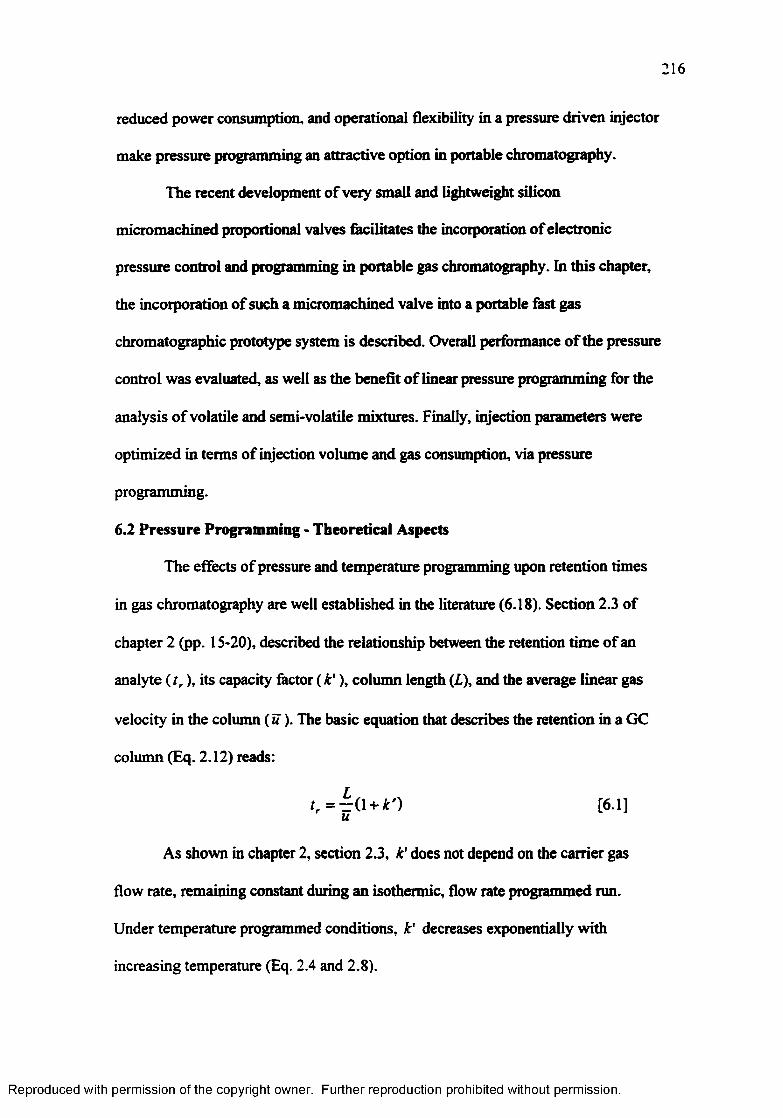
2 1 6
reduced power consumption, and operational flexibility in a pressure driven injector
make pressure programming an attractive option in portable chromatography.
The recent development o f very small and lightweight silicon
micromachined proportional valves facilitates the incorporation of electronic
pressure control and programming in portable gas chromatography. In this chapter,
the incorporation o f such a micromachined valve into a portable fast gas
chromatographic prototype system is described. Overall performance o f the pressure
control was evaluated, as well as the benefit of linear pressure programming for the
analysis o f volatile and semi-volatile mixtures. Finally, injection parameters were
optimized in terms o f injection volume and gas consumption, via pressure
programming.
6.2 Pressure Programming - Theoretical Aspects
The effects of pressure and temperature programming upon retention times
in gas chromatography are well established in the literature (6.18). Section 2.3 of
chapter 2 (pp. 15-20), described the relationship between the retention time o f an
analyte ( tr ), its capacity factor (k ' ), column length (I), and the average linear gas
velocity in the column (u). The basic equation that describes the retention in a GC
column (Eq. 2.12) reads:
tr = | ( l + r ) [6.1]
As shown in chapter 2, section 2.3, k' does not depend on the carrier gas
flow rate, remaining constant during an isothermic, flow rate programmed run.
Under temperature programmed conditions, k' decreases exponentially with
increasing temperature (Eq. 2.4 and 2.8).
Reproduced with permission of the copyright owner. Further reproduction prohibited without permission.
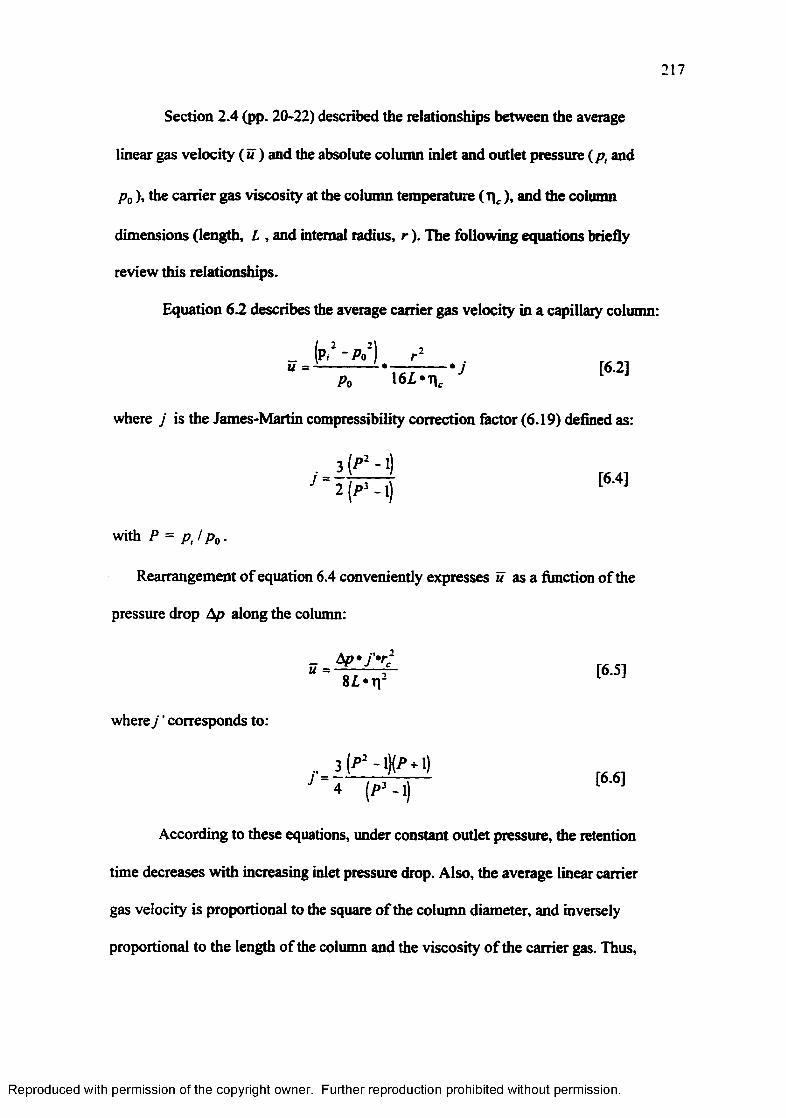
217
Section 2.4 (pp. 20-22) described the relationships between the average
linear gas velocity ( u ) and the absolute column inlet and outlet pressure (p, and
p 0), the carrier gas viscosity at the column temperature (T)c ), and the column
dimensions (length, L , and internal radius, r ). The following equations briefly
review this relationships.
Equation 6.2 describes the average carrier gas velocity in a capillary column:
where j is the James-Martin compressibility correction factor (6.19) defined as:
with P = p , l p 0.
Rearrangement o f equation 6.4 conveniently expresses u as a function of the
pressure drop Ap along the column:
where j ’ corresponds to:
According to these equations, under constant outlet pressure, the retention
time decreases with increasing inlet pressure drop. Also, the average linear carrier
gas velocity is proportional to the square o f the column diameter, and inversely
proportional to the length of the column and the viscosity o f the carrier gas. Thus,
[6.2]
[6.4]
Reproduced with permission of the copyright owner. Further reproduction prohibited without permission.
218
short, wide bore columns operated with hydrogen are most suitable for pressure
program m ing, since small changes in pressure bring about large changes in linear
carrier gas velocity, and consequently, retention time. Figure 6.1 shows several
computer generated plots o f the average linear gas velocity versus the column
pressure drop, according to equation 6.2. It illustrates the dramatic effects o f the
nature of the carrier gas and column dimensions. For example, an increase o f the
inlet pressure from 20 to 40 psi causes an average carrier gas velocity increase of
350cm/s (90%) in a lm x 0.1 mm column operated with hydrogen. The same
increase in inlet pressure applied to a 3m x 0.1mm column, operated also with
hydrogen produces only one third o f the increase in carrier gas velocity.
To obtain significant benefit in retention time reduction, large increases in
carrier gas velocities are necessary. According to the Golay-Giddings equation, an
increase of the linear carrier gas velocity beyond the optimum value is always
accompanied by a reduction o f the column efficiency, as a consequence o f the
increased resistance to mass transfer in the mobile and the stationary phase, and the
carrier gas compressibility. A column/carrier gas combination with a broad
minimum in the van Deemter plot experiences the smallest losses in efficiency when
u increases with the inlet pressure programming. Narrow bore columns operated
with hydrogen fulfill this requirement. However, as discussed in the previous
paragraph, low flow restriction is necessary to obtain significant benefits from the
inlet pressure programming. Thus, combining column efficiency and pressure drop
considerations, very short, narrow bore columns, as used in fast gas
Reproduced with permission of the copyright owner. Further reproduction prohibited without permission.
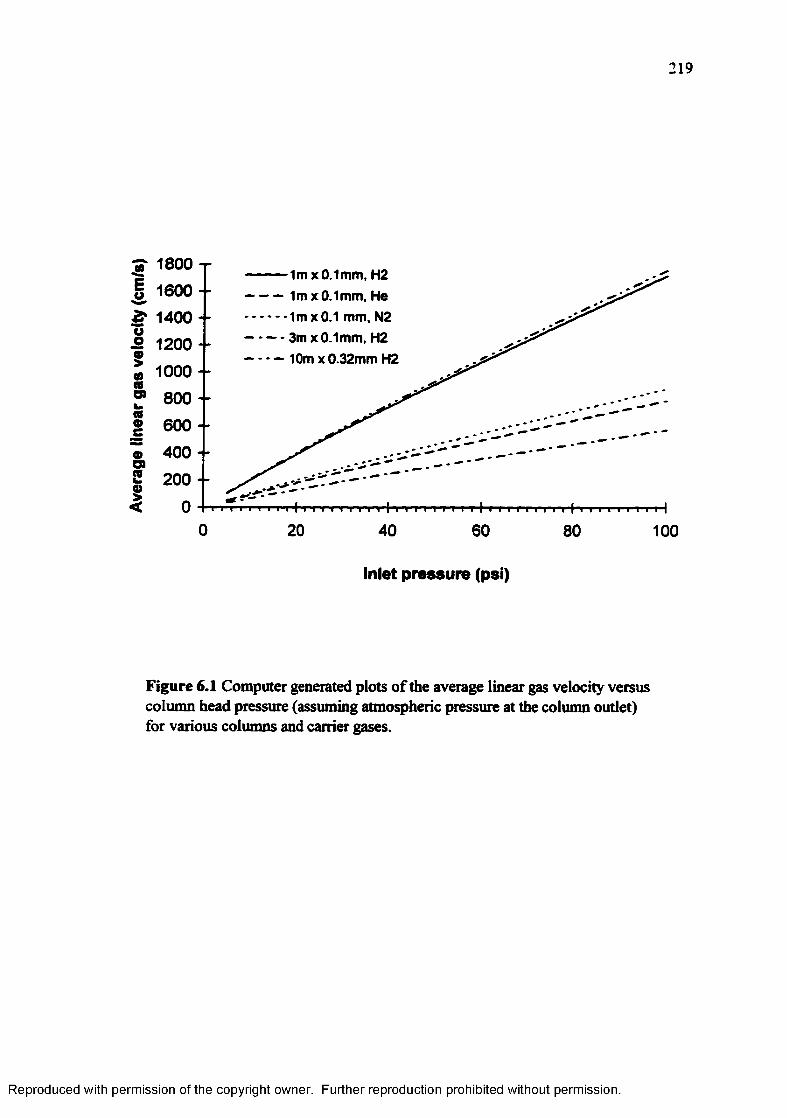
219
42Eu
o01(0(0W>.
«o>2I
1800
1600
1400
12001000800
600
400
2000
1mx 0.1mm, H2 1m x 0.1mm, He 1m x 0.1 mm, N2 3m x 0.1 mm, H2 10m x 0.32mm H2
■>-n T7i TT r t r r r r r n ' n ' f T T n i T T i r t m n
20 40 60 80 100
Inlet pressure (psi)
Figure 6.1 Computer generated plots o f the average linear gas velocity versus column head pressure (assuming atmospheric pressure at the column outlet) for various columns and carrier gases.
Reproduced with permission of the copyright owner. Further reproduction prohibited without permission.
220
chromatography, operated with hydrogen as carrier gas are best suited for column
inlet pressure programming.
As discussed in chapter 2 (pp. 40-43),.and demonstrated in chapter 3 (pp. 69-
72), extra-column effects have a detrimental effect upon the plate heights obtained
for compounds o f low capacity factor separated in short columns. The relative
impact o f these extra-column effects increases with the square o f the carrier gas
velocity, reducing the useful carrier gas velocity range for fast GC. However, it is
the carrier gas velocity at which the sample is introduced into the column that affects
the peak broadening due to the injection band. In a pressure programmed run, the
sample injection occurs at low carrier gas velocities. Therefore, pressure
programming should permit the use of high carrier gas velocities without the
efficiency losses associated with the injection band. In the system described herein,
this potential advantage could not be exploited, because the sample was injected into
the column by an independent pulse of high pressure gas (see chapter 5, p. 182).
6.3 Experimental
Figure 6.2 shows a schematic diagram of the system used for these studies. The
pressure control system was an integral part o f a prototype portable gas
chromatograph (microGC) designed and built in our lab. The injection system was
described in detail in chapter S (pp. 182-188). Shortly, the carrier gas split into three
branches. One branch supplied fuel gas to the FID. The second branch was kept at
high pressure, and used only to flush desorbed analytes from the trap to the capillary
column. A normally closed silicon micromachined microvalve (Redwood
Microsystes, Menlo Park, CA) regulated the flow through the other branch, which
Reproduced with permission of the copyright owner. Further reproduction prohibited without permission.
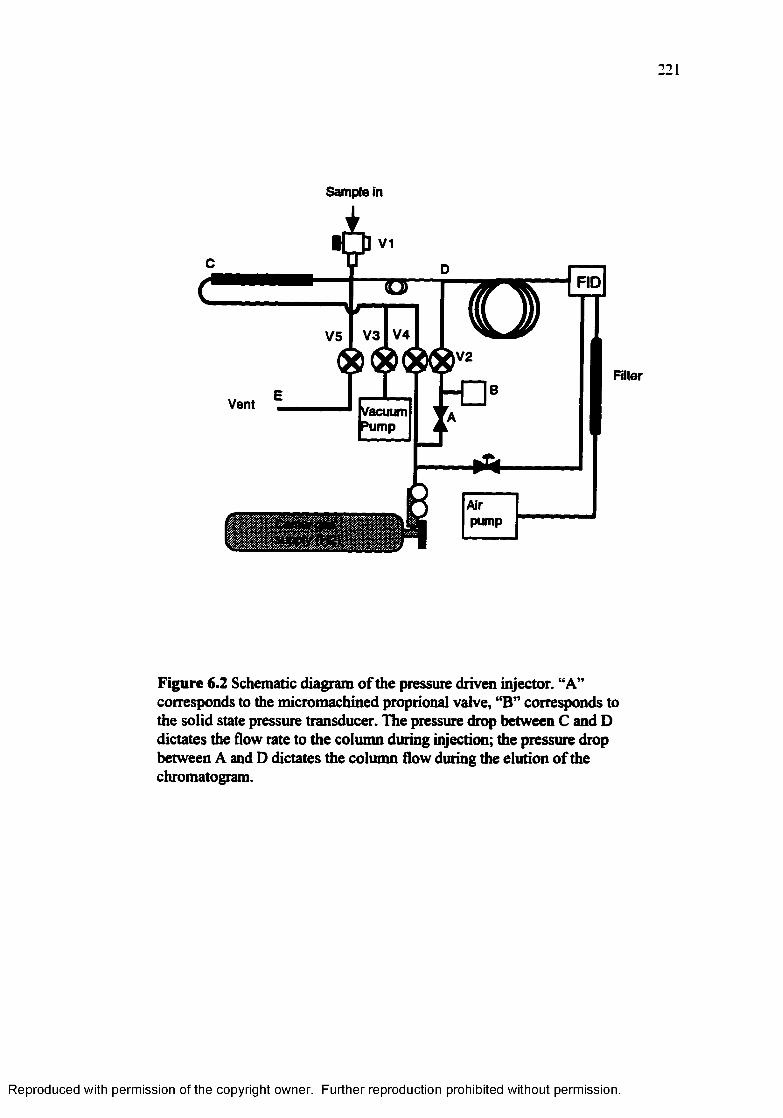
221
Sample in
Vacuumsump
Figure 6.2 Schematic diagram of the pressure driven injector. “A” corresponds to the micromachined proprional valve, “B” corresponds to the solid state pressure transducer. The pressure drop between C and D dictates the flow rate to the column during injection; the pressure drop between A and D dictates the column flow during the elution o f the chromatogram.
Reproduced with permission of the copyright owner. Further reproduction prohibited without permission.
provided the carrier gas for the column (proportional valve “A” in figure 6.2). The
microvalve functioned as a forward pressure regulator. For this purpose, a
micromachined gauge pressure transducer (SenSym, Milpitas, CA) was connected
downstream to the valve (labeled “B” in figure 6.2). The pressure control was
achieved through a microprocessor based feedback control loop.
The desired pressure parameters (initial, final, rate o f increase, and start and
stop time o f the pressure ramp) were introduced in a dumb terminal interfaced to the
controller board via an RS232 serial port. The parameters were downloaded to the
controller board. The pressure transducer sent an analog voltage signal proportional
to the measured pressure to the electronic board. A 12 bit A/D converter digitized
this signal and sent it to the microprocessor. The microprocessor compared the
measured pressure signal with the internally calculated dynamic setpoint, generated
an error signal (difference between actual and setpoint), and applied the control
algorithm (proportional, integral and derivative gains) to the error signal. The output
of the control algorithm was converted into an analog voltage signal (D/A converter)
and applied to the microvalve to adjust the pressure. The pressure was updated 4
times per second, matching the time scale o f the microvalve response.
This version of the pressure controller only included capability for linear
pressure programming. Other pressure-time profiles, like exponential pressure
increases, or constant flow for temperature programmed runs could be implemented.
However, these profiles are computationally more demanding, and would require the
use of a more powerful microprocessor if temperatures and valve timing are
controlled simultaneously.
Reproduced with permission of the copyright owner. Further reproduction prohibited without permission.
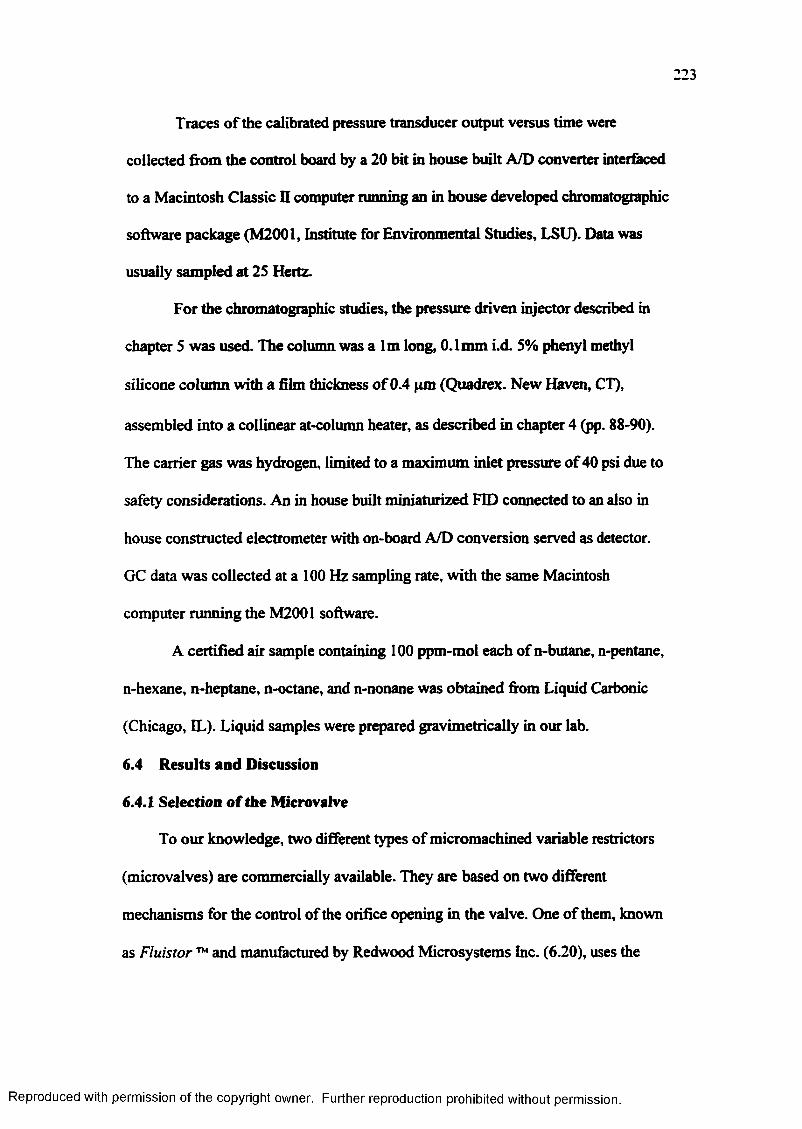
223
Traces o f the calibrated pressure transducer output versus time were
collected from the control board by a 20 bit in house built A/D converter interfaced
to a Macintosh Classic II computer running an in house developed chromatographic
software package (M2001, Institute for Environmental Studies, LSU). Data was
usually sampled at 25 Hertz.
For the chromatographic studies, the pressure driven injector described in
chapter 5 was used. The column was a lm long, 0.1mm i.d. 5% phenyl methyl
silicone column with a film thickness o f 0.4 pm (Quadrex. New Haven, CT),
assembled into a collinear at-column heater, as described in chapter 4 (pp. 88-90).
The carrier gas was hydrogen, limited to a maximum inlet pressure of 40 psi due to
safety considerations. An in house built miniaturized FID connected to an also in
house constructed electrometer with on-board A/D conversion served as detector.
GC data was collected at a 100 Hz sampling rate, with the same Macintosh
computer running the M2001 software.
A certified air sample containing 100 ppm-mol each of n-butane, n-pentane,
n-hexane, n-heptane, n-octane, and n-nonane was obtained from Liquid Carbonic
(Chicago, EL). Liquid samples were prepared gravimetrically in our lab.
6.4 Results and Discussion
6.4.1 Selection o f the Microvalve
To our knowledge, two different types of micromachined variable restrictors
(microvalves) are commercially available. They are based on two different
mechanisms for the control of the orifice opening in the valve. One of them, known
as Fluistor ™ and manufactured by Redwood Microsystems Inc. (6.20), uses the
Reproduced with permission of the copyright owner. Further reproduction prohibited without permission.
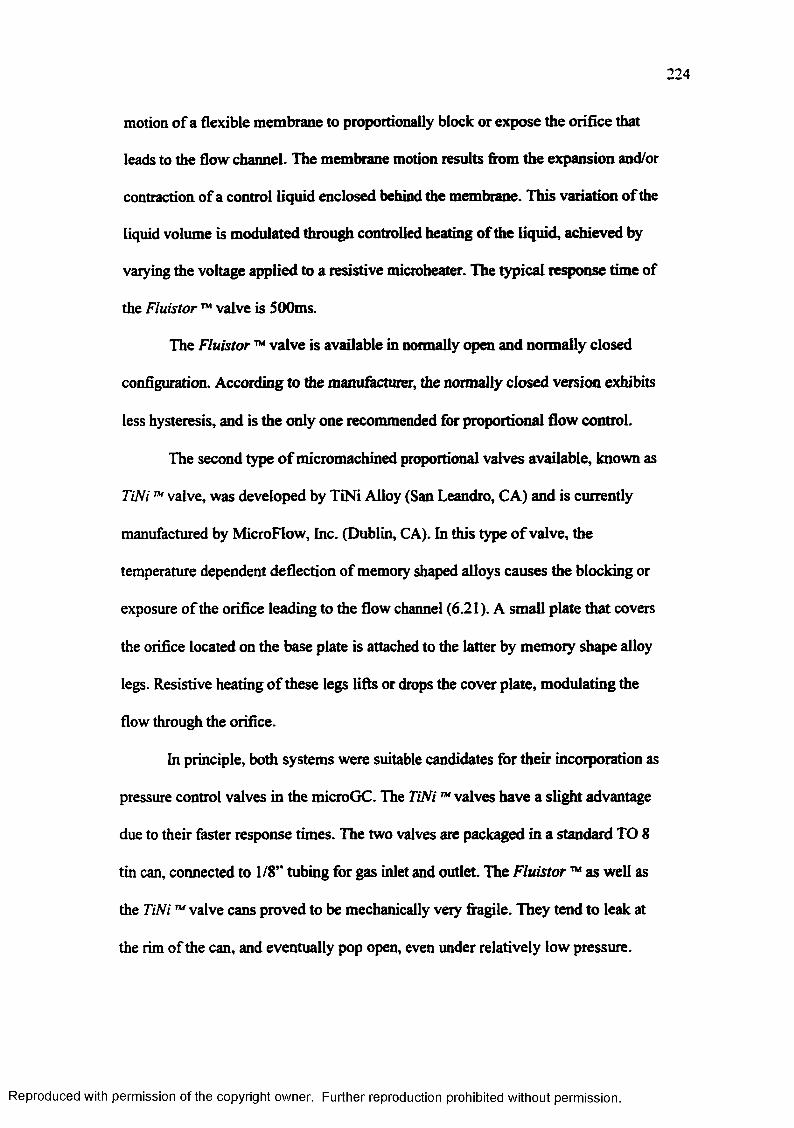
224
motion of a flexible membrane to proportionally block or expose the orifice that
leads to the flow channel. The membrane motion results from the expansion and/or
contraction of a control liquid enclosed behind the membrane. This variation of the
liquid volume is modulated through controlled heating of the liquid, achieved by
varying the voltage applied to a resistive microheater. The typical response time of
the Fluistor ™ valve is 500ms.
The Fluistor ™ valve is available in normally open and normally closed
configuration. According to the manufacturer, the normally closed version exhibits
less hysteresis, and is the only one recommended for proportional flow control.
The second type o f micromachined proportional valves available, known as
TiNi ™ valve, was developed by TiNi Alloy (San Leandro, CA) and is currently
manufactured by MicroFlow, Inc. (Dublin, CA). In this type o f valve, the
temperature dependent deflection of memory shaped alloys causes the blocking or
exposure o f the orifice leading to the flow channel (6.21). A small plate that covers
the orifice located on the base plate is attached to the latter by memory shape alloy
legs. Resistive heating o f these legs lifts or drops the cover plate, modulating the
flow through the orifice.
In principle, both systems were suitable candidates for their incorporation as
pressure control valves in the microGC. The TiNi ™ valves have a slight advantage
due to their faster response times. The two valves are packaged in a standard TO 8
tin can, connected to 1/8’' tubing for gas inlet and outlet. The Fluistor ™ as well as
the TiNi ™ valve cans proved to be mechanically very fragile. They tend to leak at
the rim of the can, and eventually pop open, even under relatively low pressure.
Reproduced with permission of the copyright owner. Further reproduction prohibited without permission.
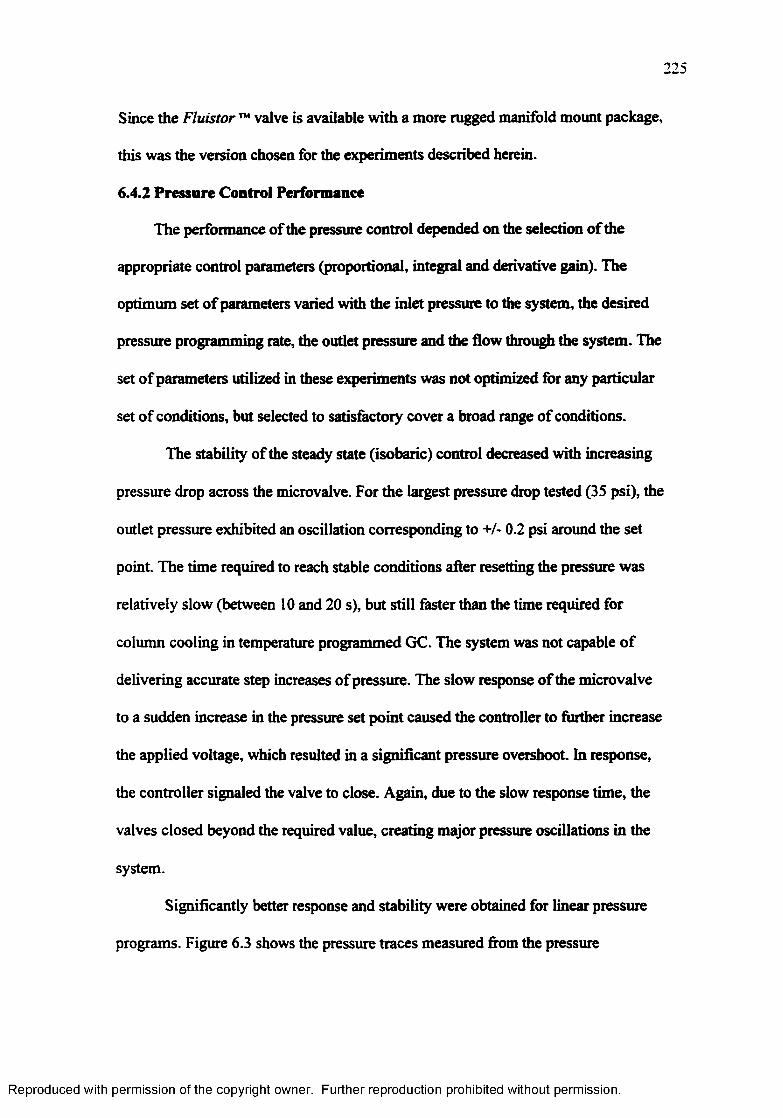
225
Since the Fluistor ™ valve is available with a more rugged manifold mount package,
this was the version chosen for the experiments described herein.
6.4.2 Pressure Control Performance
The performance of the pressure control depended on the selection of the
appropriate control parameters (proportional, integral and derivative gain). The
optimum set of parameters varied with the inlet pressure to the system, the desired
pressure programming rate, the outlet pressure and the flow through the system. The
set of parameters utilized in these experiments was not optimized for any particular
set of conditions, but selected to satisfactory cover a broad range of conditions.
The stability of the steady state (isobaric) control decreased with increasing
pressure drop across the microvalve. For the largest pressure drop tested (35 psi), the
outlet pressure exhibited an oscillation corresponding to +/- 0.2 psi around the set
point. The time required to reach stable conditions after resetting the pressure was
relatively slow (between 10 and 20 s), but still faster than the time required for
column cooling in temperature programmed GC. The system was not capable o f
delivering accurate step increases of pressure. The slow response of the microvalve
to a sudden increase in the pressure set point caused the controller to further increase
the applied voltage, which resulted in a significant pressure overshoot. In response,
the controller signaled the valve to close. Again, due to the slow response time, the
valves closed beyond the required value, creating major pressure oscillations in the
system.
Significantly better response and stability were obtained for linear pressure
programs. Figure 6.3 shows the pressure traces measured from the pressure
Reproduced with permission of the copyright owner. Further reproduction prohibited without permission.

226
transducer response for linear pressure programs from 5 to 38 psi at 0.4 to 2 psi/s.
All the traces had an isobaric period o f 20 s before the pressure program began. In
all cases, a small delay between the expected beginning o f the pressure ramp, and
the actual increase of the pressure was observed. This delay was between 0.5 s for
the fastest ramp (2 psi/s) and 1 s for the slowest ramp tested (0.4 psi/s). The delay
corresponded approximately to the valve response time advertised by the
manufacturer, and is acceptable for this application.
As a result from the delayed response time, all the profiles presented a slight
overshoot at the beginning of the pressure program. This overshoot was rapidly
compensated, and, on average, the pressure traces followed the expected pressure
time profile, as exemplified in figure 6.4 for a 0.8 psi/s ramp. Towards the end of the
pressure program the rate of pressure increase declined smoothly to isobaric
conditions, rendering no overshoot at the final pressure value.
Even though the traces followed on average the expected pressure - time
profiles, they exhibited oscillations over the entire pressure interval. Figure 6.5
shows the difference between set point and measured pressure versus time for a 0.8
psi/s ramp. The largest oscillations around the set point were observed during the
first part of the initial isobaric period. These oscillations correspond to the initial
stabilization period after resetting the low pressure. Towards the end of the ramp, a
continuously increasing positive deviation was observed. It corresponded to the
smooth transition towards isobaric conditions delivered by the controller, as
compared to the ideal, but practically not attainable theoretical ramp, in which the
Reproduced with permission of the copyright owner. Further reproduction prohibited without permission.

227
40
2. 30S5 2 5 : - «co 20:-
• 1 5 i -q>
10 : -
S
aIQO
0 20 40 60 80 100 120Time (s)
Figure 6.3 Pressure vs. time profiles measured at the pressure transducer output for different pressure ramps: 0.4 psi/s (a), 0.8psi/s (b), I psi/s ( c), 1.2 psi/s (d), 1.6 psi/s (e), and 2psi/s (f).
40 q-^ 35 (0& 30 :-95 25 i- (02 20 : -
« 15 ^ Q3 10 j -100 5
i 1 i T T i l 'i m | i i i r h r r r r j i i i f h m -f i i n - 1
10 20 30 40 50 60 70 80
Time (s)
Figure 6.4 Comparison of the expected and the measured pressure - time profiles for a 0.8 psi/s inlet pressure ramp.
Reproduced with permission of the copyright owner. Further reproduction prohibited without permission.
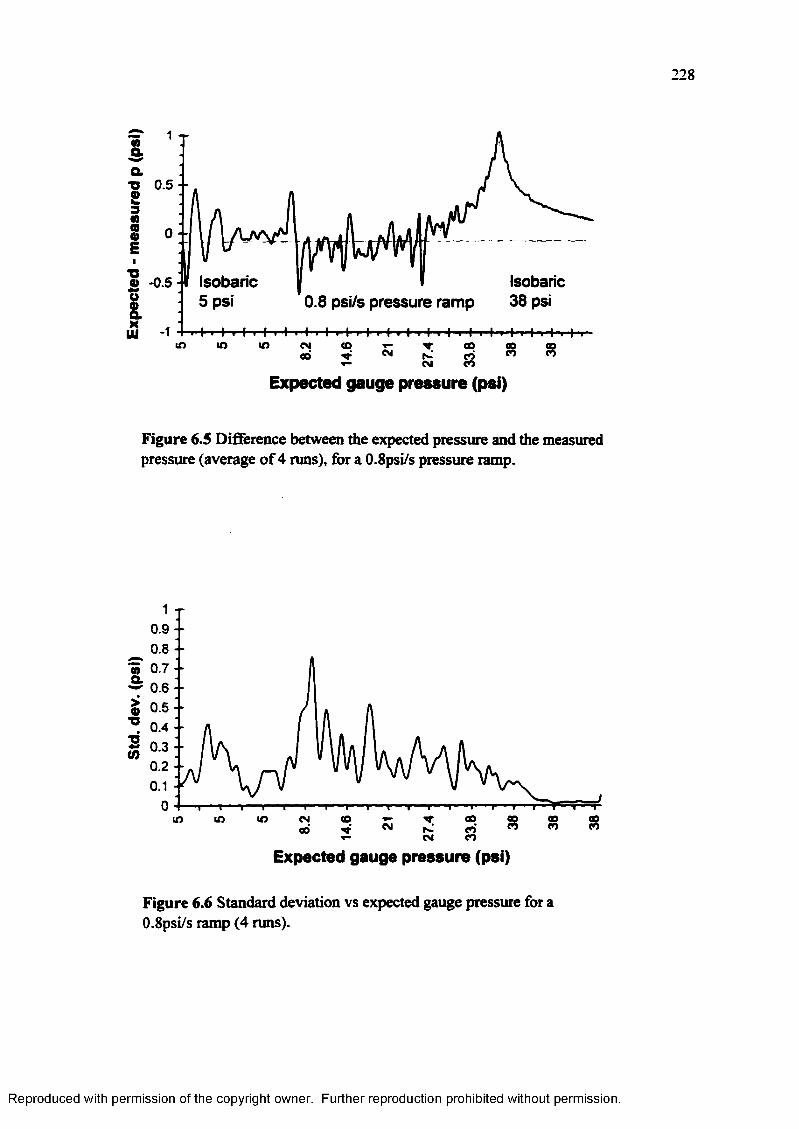
228
0 - - I
I Isobaric0.8 psi/s pressure ramp 38 psi
Isobaric 5 psi
® -0.5
inin <o■m-
coCMCO CM
CM CO
Expected gauge pressure (psi)
Figure 6.5 Difference between the expected pressure and the measured pressure (average of 4 runs), for a 0.8psi/s pressure ramp.
Expected gauge pressure (psi)
Figure 6.6 Standard deviation vs expected gauge pressure for a 0.8psi/s ramp (4 runs).
Reproduced with permission of the copyright owner. Further reproduction prohibited without permission.
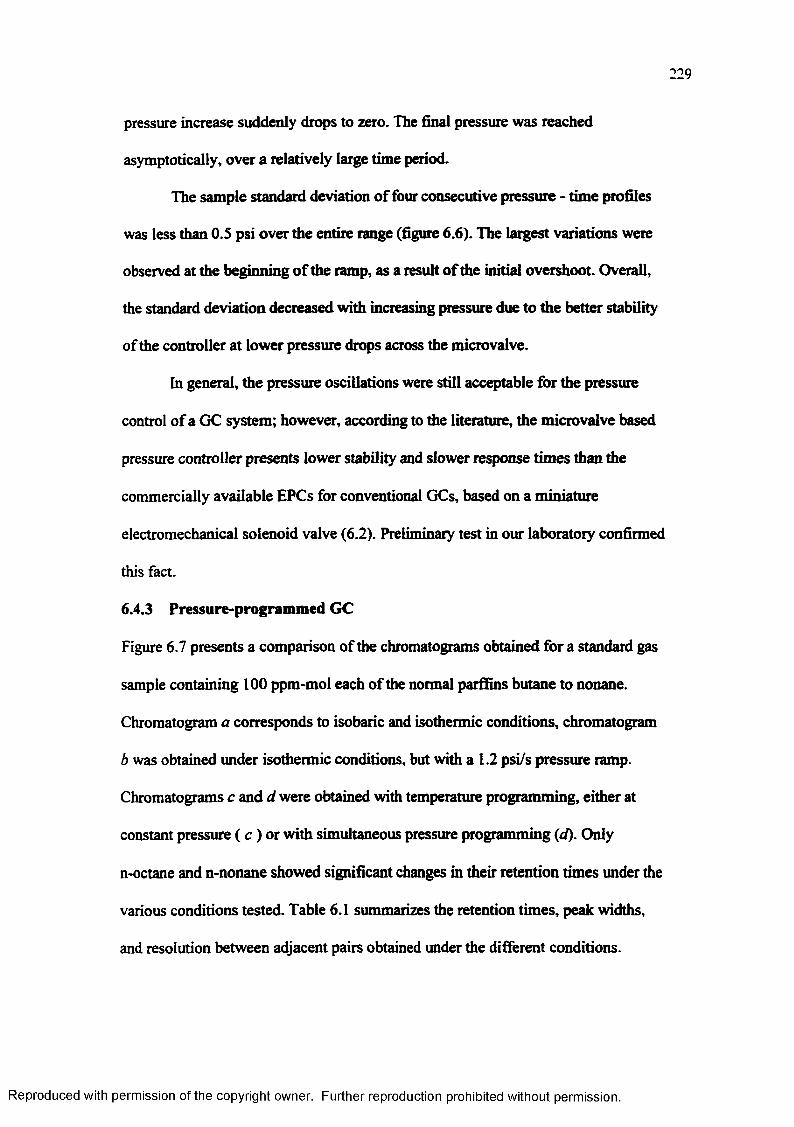
229
pressure increase suddenly drops to zero. The final pressure was reached
asymptotically, over a relatively large time period.
The sample standard deviation o f four consecutive pressure - time profiles
was less than 0.5 psi over the entire range (figure 6.6). The largest variations were
observed at the beginning of the ramp, as a result o f the initial overshoot. Overall,
the standard deviation decreased with increasing pressure due to the better stability
of the controller at lower pressure drops across the microvalve.
In general, the pressure oscillations were still acceptable for the pressure
control of a GC system; however, according to the literature, the microvalve based
pressure controller presents lower stability and slower response times than the
commercially available EPCs for conventional GCs, based on a miniature
electromechanical solenoid valve (6.2). Preliminary test in our laboratory confirmed
this fact.
6.4.3 Pressure-programmed GC
Figure 6.7 presents a comparison of the chromatograms obtained for a standard gas
sample containing 100 ppm-mol each of the normal parffins butane to nonane.
Chromatogram a corresponds to isobaric and isothermic conditions, chromatogram
b was obtained under isothermic conditions, but with a 1.2 psi/s pressure ramp.
Chromatograms c and d were obtained with temperature programming, either at
constant pressure ( c ) or with simultaneous pressure programming (d). Only
n-octane and n-nonane showed significant changes in their retention times under the
various conditions tested. Table 6.1 summarizes the retention times, peak widths,
and resolution between adjacent pairs obtained under the different conditions.
Reproduced with permission of the copyright owner. Further reproduction prohibited without permission.
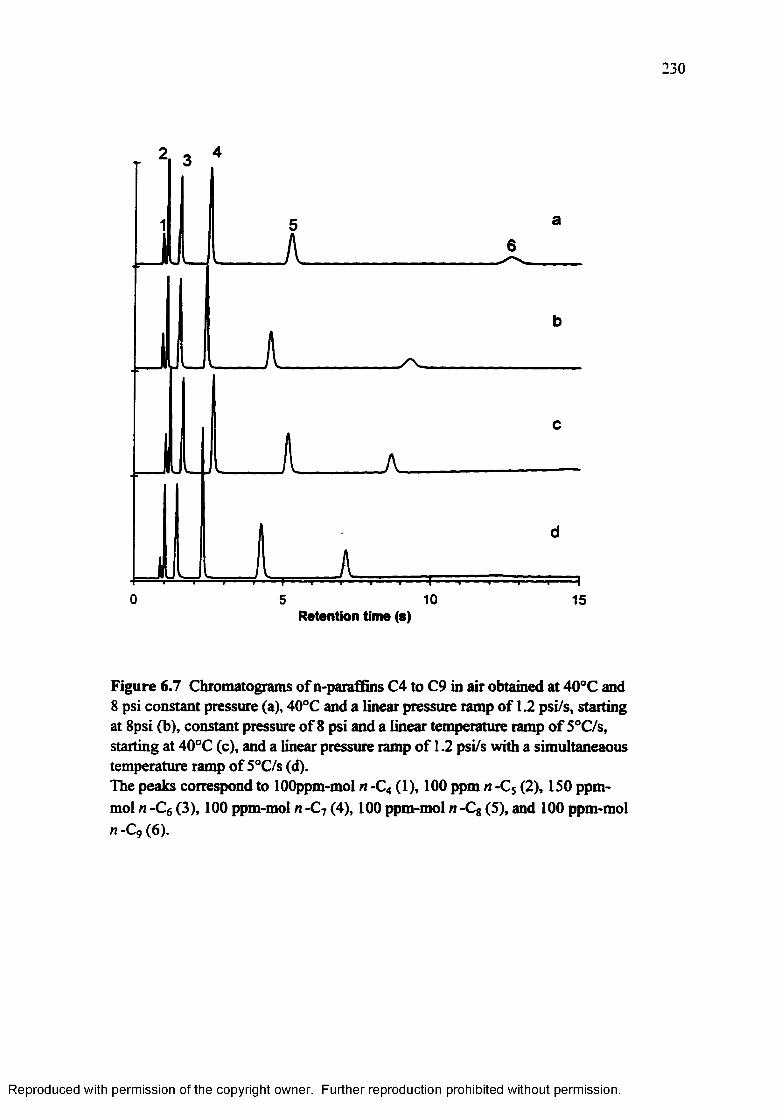
230
0 105 15Retention time (s)
Figure 6.7 Chromatograms of n-paraffins C4 to C9 in air obtained at 40°C and 8 psi constant pressure (a), 40°C and a linear pressure ramp of 1.2 psi/s, starting at 8psi (b), constant pressure of 8 psi and a linear temperature ramp of 5°C/s, starting at 40°C (c), and a linear pressure ramp of 1.2 psi/s with a simultaneaous temperature ramp of 5°C/s (d).The peaks correspond to lOOppm-mol n -C4 (1), 100 ppm n -C5 (2), 150 ppm- mol n -C6 (3), 100 ppm-mol n -C7 (4), 100 ppm-mol n -C8 (5), and 100 ppm-mol n -C9 (6).
Reproduced with permission of the copyright owner. Further reproduction prohibited without permission.
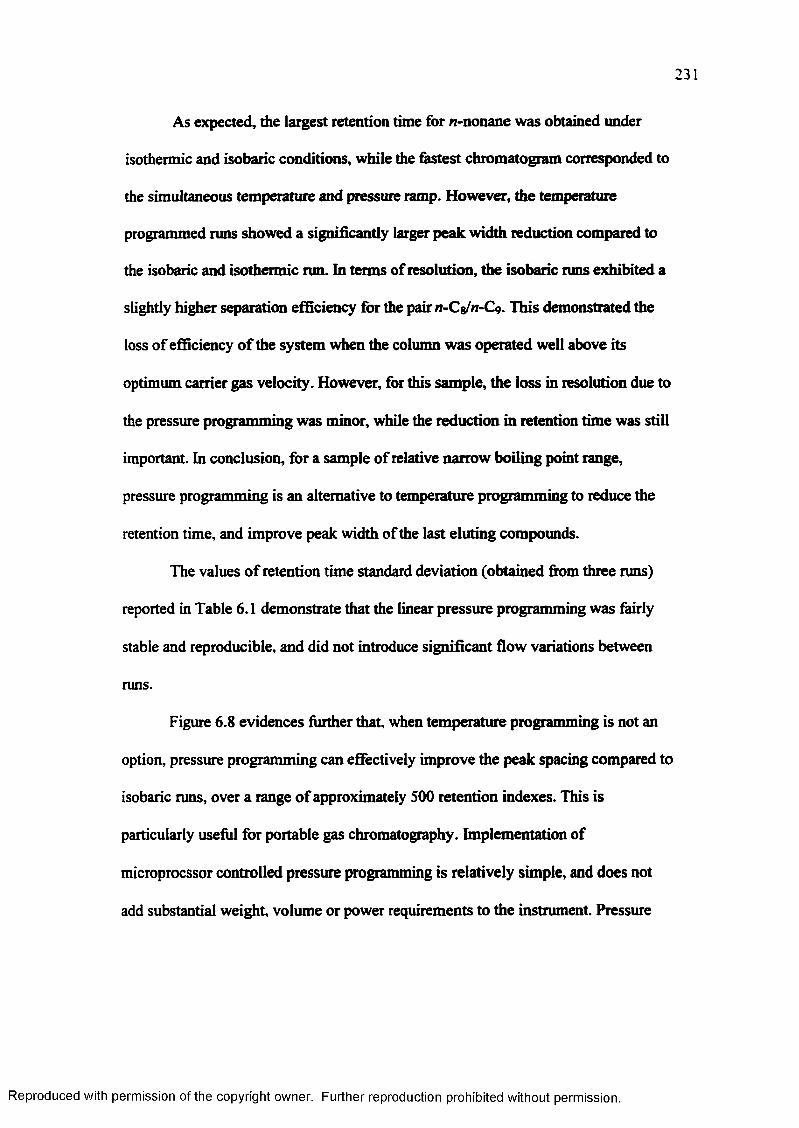
231
As expected, the largest retention time for n-nonane was obtained under
isothermic and isobaric conditions, while the fastest chromatogram corresponded to
the simultaneous temperature and pressure ramp. However, the temperature
programmed runs showed a significantly larger peak width reduction compared to
the isobaric and isothermic run. In terms of resolution, the isobaric runs exhibited a
slightly higher separation efficiency for the pair n-C&fn-Cg. This demonstrated the
loss of efficiency o f the system when the column was operated well above its
optimum carrier gas velocity. However, for this sample, the loss in resolution due to
the pressure programming was minor, while the reduction in retention time was still
important. In conclusion, for a sample of relative narrow boiling point range,
pressure programming is an alternative to temperature programming to reduce the
retention time, and improve peak width of the last eluting compounds.
The values of retention time standard deviation (obtained from three runs)
reported in Table 6.1 demonstrate that the linear pressure programming was fairly
stable and reproducible, and did not introduce significant flow variations between
runs.
Figure 6.8 evidences further that, when temperature programming is not an
option, pressure programming can effectively improve the peak spacing compared to
isobaric runs, over a range of approximately 500 retention indexes. This is
particularly useful for portable gas chromatography. Implementation of
microprocssor controlled pressure programming is relatively simple, and does not
add substantial weight, volume or power requirements to the instrument. Pressure
Reproduced with permission of the copyright owner. Further reproduction prohibited without permission.
Table 6.1 Effect o f pressure and temperature programming on the retention time, peak width, resolution and reproducibility of volatile compounds.
Conditions RT(s) SD (s) PW (s) R SD
Isobaric, isothermic n-C8 5.24 0.03 0.21 20.2 0.5
n-C9 12.66 0.05 0.52
Isothermic, pressure programmed
n-C8 4.51 0.04 0.16 18.1 0.4
n-C9 9.32 0.08 0.36
Isobaric, temperature programmed
n-C8 5.19 0.06 0.16 19.8 0.4
n-C9 8.69 0.08 0.19
Pressure and temperature programmed
n-C8 4.35 0.06 0.14 17.4 0.9
n-C9 7.10 0.1 0.17
Reproduced with permission of the copyright owner. Further reproduction prohibited without permission.
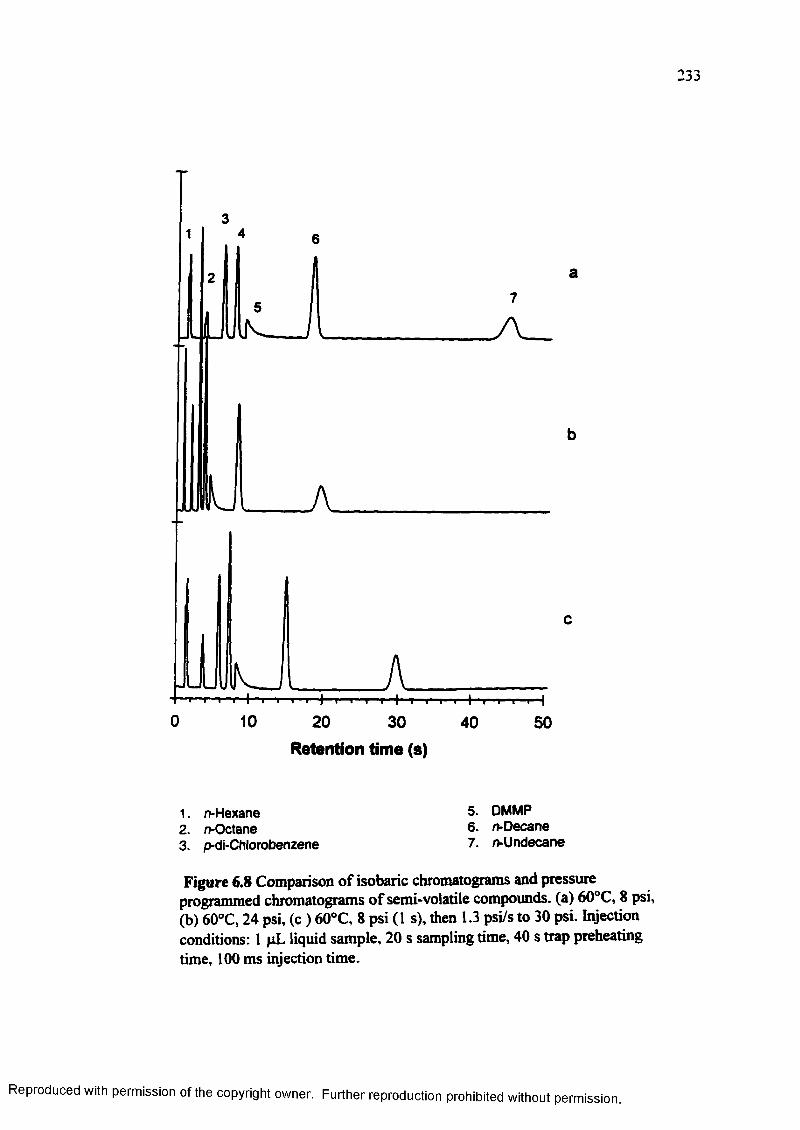
2j j
0 10 20 30 40 50
a
Retention time (s)
1. n-Hexane2. n-Octane3. p-di-Chlorobenzene
5. DMMP6. n-Decane7. n-Undecane
Figure 6.8 Comparison of isobaric chromatograms and pressure programmed chromatograms of semi-volatile compounds, (a) 60°C, 8 psi, (b) 60°C, 24 psi, (c ) 60°C, 8 psi (1 s), then 1.3 psi/s to 30 psi. Injection conditions: 1 pL liquid sample, 20 s sampling time, 40 s trap preheating time, 100 ms injection time.
Reproduced with permission of the copyright owner. Further reproduction prohibited without permission.
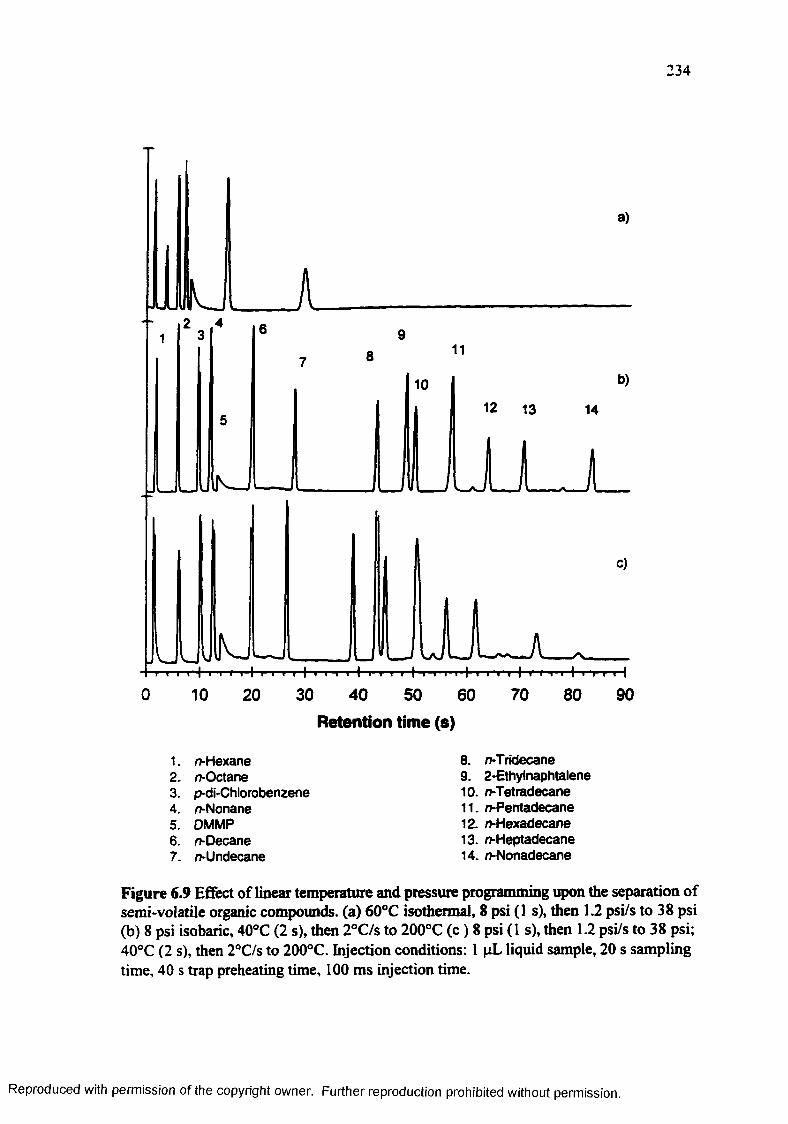
234
a)
11
b)
12 13 14
ULU Lc)
I
10 20 30 40 50 60 70 80
Retention time (s)
1. n- Hexane 8. n-Tridecane2 . n-Octane 9. 2-Ethylnaphtalene3. p-di-Chlorobenzene 10. n-Tetradecane4. n-Nonane 11. n-Pentadecane5. DMMP 12. n-Hexadecane6 . n- Decane 13. n-Heptadecane7. n-Undecane 14. n-Nonadecane
90
Figure 6.9 Effect of linear temperature and pressure programming upon the separation of semi-volatile organic compounds, (a) 60°C isothermal, 8 psi (1 s), then 1.2 psi/s to 38 psi (b) 8 psi isobaric, 40°C (2 s), then 2°C/s to 200°C (c ) 8 psi (I s), then 1.2 psi/s to 38 psi; 40°C (2 s), then 2°C/s to 200°C. Injection conditions: 1 pL liquid sample, 20 s sampling time, 40 s trap preheating time, 100 ms injection time.
Reproduced with permission of the copyright owner. Further reproduction prohibited without permission.

235
programming does not comprise substantial engineering problems to ensure thermal
homogeneity at the interfaces, as is the case in temperature programming.
For the separation o f samples covering a large boiling point range, pressure
programming cannot substitute temperature programming. This is evident from
figure 6.9, which shows that a linear pressure ramp could not accelerate the elution
of compounds over a large volatility range. Since the retention time is a linear
function of 1/Ap, but an exponential function of 1/T, only exponential pressure
increases could lead to separations comparable to those obtained under linear
temperature program m ing conditions (6.14). However, there is a practical limit up to
which the pressure can be increased, especially when using hydrogen as carrier gas
in portable instrumentation. Very high pressures in the system increase the risk of
leaks, and can constitute a major hazard. The upper pressure limit used in this study
was 40 psi.
Pressure programming reduced the elution temperature o f the solutes, as seen
in figure 6.7 and 6.9. Besides of saving power, this reduced cool-down times, and
eased somewhat the long range temperature gradients at the detector end
encountered with direct at-column heating. Pressure programming appears useful to
extend the scope of a GC system few retention indices above its limit under
temperature programming conditions alone.
6.4.4 Pressure Programming for Optimization of the Injection
In the injection system used in these experiments, a short plug of high
pressure gas swept the trap and transferred the thermally desorbed sample from the
trap into the column (see chapter 5, p. 182). The effective flow from the trap to the
Reproduced with permission of the copyright owner. Further reproduction prohibited without permission.
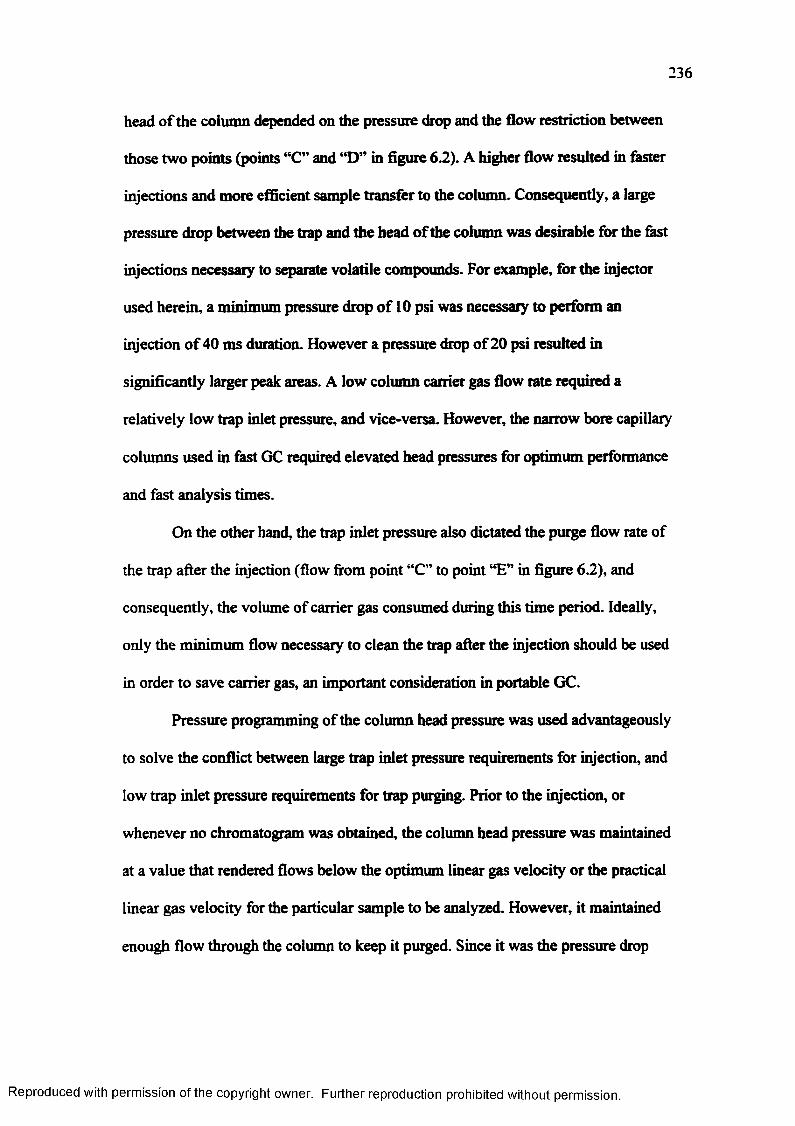
head of the column depended on the pressure drop and the flow restriction between
those two points (points “C” and “D” in figure 6-2)- A higher flow resulted in faster
injections and more efficient sample transfer to the column. Consequently, a large
pressure drop between the trap and the head of the column was desirable for the fast
injections necessary to separate volatile compounds. For example, for the injector
used herein, a minimum pressure drop o f 10 psi was necessary to perform an
injection of 40 ms duration. However a pressure drop of 20 psi resulted in
significantly larger peak areas. A low column carrier gas flow rate required a
relatively low trap inlet pressure, and vice-versa. However, the narrow bore capillary
columns used in fast GC required elevated head pressures for optimum performance
and fast analysis times.
On the other hand, the trap inlet pressure also dictated the purge flow rate of
the trap after the injection (flow from point “C” to point “E” in figure 6.2), and
consequently, the volume of carrier gas consumed during this time period. Ideally,
only the minimum flow necessary to clean the trap after the injection should be used
in order to save carrier gas, an important consideration in portable GC.
Pressure programming of the column head pressure was used advantageously
to solve the conflict between large trap inlet pressure requirements for injection, and
low trap inlet pressure requirements for trap purging. Prior to the injection, or
whenever no chromatogram was obtained, the column head pressure was maintained
at a value that rendered flows below the optimum linear gas velocity or the practical
linear gas velocity for the particular sample to be analyzed. However, it maintained
enough flow through the column to keep it purged. Since it was the pressure drop
Reproduced with permission of the copyright owner. Further reproduction prohibited without permission.
237
n-C14
n-C15
n-C16
10X
n-C14
n-C15
n-C16
n-C17
30 4020100
Retention time (s)
Figure 6.10 Effect of column inlet pressure upon the amount of sample injected into the column, a) 10 psi column, 30 psi trap, b) 10 psi column, 22 psi trap, c) 2 psi column during the injection, than 0.8 psi/s to 10 psi, 22 psi trap pressure.
Reproduced with permission of the copyright owner. Further reproduction prohibited without permission.
238
between trap and column head that dictated the sample transfer, a much smaller trap
inlet pressure was now sufficient for a fast injection plug. When the injection was
completed, a fast linear pressure increase brought the column head pressure to its
normal operation value. The trap inlet pressure remained constant, and needed to be
only sufficiently large to effectively clean the trap for the next run while the
chromatography proceeded.
Figure 6.10 shows a series of chromatograms ofn-Cu to n-Cn, obtained
under isobaric conditions with different trap inlet pressures, compared to a
chromatogram obtained with column head pressure programming immediately after
injection. In all the cases the column temperature was 150°C, and the nominal
injection time 40ms.
The top chromatogram (a) corresponds to an injection with 20 psi pressure
drop between the trap inlet and the column inlet (column: 10 psi, trap inlet: 30 psi).
Chromatogram (b) was obtained under identical conditions than chromatogram (a),
except for the trap inlet pressure, which was reduced by 8 psi. It shows a dramatic
reduction in peak size as a consequence o f the reduced pressure drop between the
trap inlet and the column. The chromatogram at the bottom ( c) was obtained with
the same 22 psi trap inlet pressure than (b), but during the injection the column head
pressure was 2 psi. Immediately after injection, the column head pressure was
programmed to 10 psi at a linear rate of 0.8 psi/s. The results show that the peak
sizes obtained in the first chromatogram were restored due to the increased pressure
drop between trap and column during the moment of injection. The almost 30%
Reproduced with permission of the copyright owner. Further reproduction prohibited without permission.

239
Table 6.2 Effect of injection with low column inlet pressure followed by a fast pressure ramp upon retention times, retention time reproducibility and resolution.
Isobaric injection Fast column inlet pressure programming after injection
Compound RT(s) SD (s) R RT(s) SD(s) R
(4 runs) (n-C„/n-Cn+t) (4 runs) (n-Cn/n-Cn+i)
n-Ci4 5.55 .03 11 8.60 .07 12
n-Cis 9.13 .05 11 12.33 .09 12
n-Cf6 15.60 .05 12 18.69 .08 12
n-Ci7 27.17 .06 30.25 .1
Reproduced with permission of the copyright owner. Further reproduction prohibited without permission.
240
reduction in trap inlet pressure, translated in a 30% reduction in carrier gas
consumption for the trap purging.
The retention times of the analytes were shifted to higher values as a
consequence of the lower initial column head pressure. However the pressure
program rapidly established final operating pressure at the head of the column, and
the spacing o f the peaks, their widths, and resolution remained unchanged. The
precision of the retention times remained satisfactory with this injection routine, and
comparable to the reproducibility obtained under isobaric conditions, as evidenced
from the data reported in table 6.2.
6.5 Conclusions
Implementation of microprocessor controlled electronic pressure control in
the portable micro GC is a relatively simple procedure. It facilitates considerably the
column head pressure control compared to a mechanical pressure controller, and
reduces significantly the weight of the instrument, without adding significant power
consumption. The micromachined valve used in this study provided satisfactory
steady state stability and linear pressure time profiles. Stability increased with
decreasing pressure drop across the microvalve. The system was not suitable for
stepwise increases o f pressure.
The reset time of the system, from the maximum to the minimum operating
pressure was 26 s. The stabilization period of the controller to reach steady
conditions was approximately I Os. Oscillations of less than 0.5 psi around the set
point were observed over the entire pressure interval tested.
Reproduced with permission of the copyright owner. Further reproduction prohibited without permission.
241
Pressure programming proved useful to reduce retention time and peak
widths o f the last eluting compounds within a relatively narrow solute boiling point
range (about 1000 retention indexes). However, for wide boiling point range
samples, pressure programming could not substitute temperature programming.
Nevertheless, simultaneous pressure and temperature programming reduced the
elution temperature o f the solutes, and consequently, the power requirements of the
system.
A particular advantage o f column inlet pressure programming in the pressure
driven injection system was the added flexibility in the operation of the injector.
Pressures could be automatically modulated in such a way to maximize sample
injection while minimizing purge gas consumption.
6.6 References for Chapter 6
6.1. Poole, C. F.; Poole, S. K. “Chromatography Today”, Elsevier, Amsterdam - The Netherlands 1991, Chapter I, pp. 50-58.
6.2. Augenblick, K. B.; Casale, M. A.; Cusack, J. E., and Murphy, A. J. Hewlett- Packard J. 1983, 35.
6.3. Wicar, S. J Chromatogr. 1984,295,395-403.
6.4. Dodo, G. H.; Hawkes, S. J.; Thomas, L. C. J. Chromatogr. 1985,328,49-53.
6.5. Nygren, S.; Anderson, S.Anal. Chem. 1985,5 7 ,2748-2751.
6.6. Hermann, B. W.; Freed, L. M.; Thompson, M. Q.; Phillips, R. J.; Klein, K. J.; Snyder, W. D. J. High Resol. Chromatogr. 1990,13,361-365.
6.7. Hewlett-Packard Gas Chromatograph Model 5890, Hewlett-Packard, U.S. Analytical Division, 2850 Centerville Rd., Wilmington, DE.
6.8. Alltech Associates, Inc. 2051 Waukegan Road, Deerfield, IL 60015
6.9. Lipsky, S. R.; Landowne, R. A.; Lovelock, J. E.Anal. Chem. 1959,31, 852- 856.
Reproduced with permission of the copyright owner. Further reproduction prohibited without permission.
6.10. Costa Neto, C.; Koffer, J. T.; de Alencar, J. W. J. Chromatogr. 1964,15,301- 313.
6.11. Zlatkis, A.; Fenimore, D. C.; Ettre, L. S.; Purcell, J. E.J. Gas Chromatogr. 1965, J, 75-81.
6.12. Ettre, L. S.;. Mazor, L. M; Takacs, J.; in “Advances in Chromatography”, vol. 8, Giddings, J. C.; Keller, R. A., Eds., Marcel Dekker, New York, 1969, pp.271-325.
6.13. Grayson, M. A.; Levy, R. L.; Wolf, C. J.Anal. Chem. 1973,45, 373-376.
6.14. Nyrgen, S. J. Chromatogr. 1977,142,109-116.
6.15. Peters, A.; Sacks, R. J. Chromatogr. Sci. 1992,3 0 ,187-191.
6.16. Wylie, P. L.; Phillips, R. J.; Klein, K. J.; Thompson, M. Q.; Hermann, B. W.J . High Resol Chromatogr. 1991,14,649-655.
6.17. Wylie, P. L.; Klein, K. J.; Thompson, M. Q.; Hermann, B. W .J . High Resol Chromatogr. 1992,15, 763-768.
6.18. Hinshaw, J. V. LC GC 1995, 13, 792-798.
6.19. James, A. T.; Martin, A. J. P. Biochem. J., 1952,5 0 ,679.
6.20. Redwood Microsystems, Inc., Menlo Park, CA. Application Note “Controlling Flow with the Fluistor ™ Microvalve.”
6.21. A. David Johnson, TiNi Alloy Company, personal communication, 1994, Palo Alto, CA.
Reproduced with permission of the copyright owner. Further reproduction prohibited without permission.
CHAPTER 7
SUMMARY
On site analysis potentially reduces many of the problems associated with
chemical analyses. Fast response times, reduced sample degradation, and high sample
throughput are some of the advantages of on-site analysis. Portable gas chromatography
is particularly useful for field analysis because it permits the qualitative and quantitative
analysis of complex mixtures. However, the scope of commercially available portable
gas chromatographs is reduced. They are suitable only for the analysis of volatile organic
compounds, and lack o f temperature programming capability. This dissertation addresses
both aspects. It presents the development o f a novel direct at-column heater design and a
pressure driven injection system that are compatible with the analysis of semi-volatile
organic compounds.
The collinear and coaxial at-column heater designs incorporated heater and
temperature sensing elements placed along the column. Resistive heating controlled the
column temperature via a feed-back circuit and a software selected program. Linear
temperature programming ramps up to !4°C/s were obtained, with a total power
consumption of less than 100 Watt.
The accuracy and precision of the temperature control were satisfactory.
Retention time relative standard deviations were less than 0.3% for temperature ramps
from 0.5°C/s to 10°C/s. Peak shapes were symmetric, indicating good linearity. The
directly heated column behaved well in a GC-FTD system as well as a GC-MS system for
a variety of samples. Significant analysis time reductions compared to conventional
methodologies were achieved with the at-column heating system.
243
Reproduced with permission of the copyright owner. Further reproduction prohibited without permission.
244
Comparison with a conventional oven showed that peaks eluted from the directly
heated column with slightly longer retention times (<10%), and an up to 50% increase in
the peak width. This reduced the efficiency of the column by approximately 30%. Long
range and short range temperature gradients along the column were identified as possible
causes for the observed efficiency losses. The long range temperature gradients can be
eliminated with the appropriate column and interface arrangements. The short range
temperature gradients are an inherent limitation of the current design. Alternatives to
reduce these short range temperature gradients are proposed.
Addition of external insulation reduced the power requirements, especially at
slow temperature programming rates. However, tight insulation increased the peak
widths, probably because the insulation kept hot spots more localized. The addition of
sheath gas had no significant temperature smoothing effect.
The fused silica wall behaved as a thermal insulator for the column stationary
phase. The effect was negligible at low temperature programming rates (<l°C/s), but
increased with the temperature programming rate. Thus, temperature transfer will
ultimately limit the temperature programming rate in fast gas chromatography.
The injection system designed in this work constitutes a prototype injector for a
portable gas chromatograph. It is based on the deviation of flows by differential pressure
changes. This was achieved with solenoid valves located far away from the actual
injector. This way, no temperature sensitive element was located in the sample path prior
to the sample transfer to the column. Consequently, the area of the injector that were in
contact with the sample could be heated up to 280°C, and effectively transfer compounds
up to n-C20 into a chromatographic column.
Reproduced with permission of the copyright owner. Further reproduction prohibited without permission.
245
The injector designed in this study was compatible with gaseous and liquid
samples. Static headspace sampling permitted the analysis o f volatile organic compounds
in liquids and solids. An in-line pre-concentration trap served for analyte enrichment and
consequent reduction o f the detection limits.
The injector permitted the software selection o f the injection band width. The
fastest injection band achieved was 30 ms. With this sharp injection plug, even very
volatile compounds (n-G») showed narrow peak widths. The fast injection plug
significantly reduced the influence of extra-column effects on column efficiency at high
carrier gas velocities observed with the conventional split injector.
The capillary column refocused effectively compounds C13 and higher at 50°C.
Very long injection times (30-60 seconds) permitted the accumulation of those analytes
at the head of the column, prior to the column temperature program, increasing the
sensitivity of the system.
Retention time reproducibility was not affected by the pressure driven injector.
However, quantitative reproducibility in this prototype injector was poor. Peak areas
presented standard deviations up to 40%. Slow trap heating rates, cold spots, active
surfaces, and small leaks in the solenoid valves are possible causes for the poor
quantitative behavior. These issues are currently addressed in the laboratory.
Electronic pressure programming using a feed-back control circuit that included a
micromachined proportional valve and a solid state pressure transducer was
implemented in the prototype portable GC. This feature facilitated the column head
pressure control, and reduced the size and weight of the instrument. Satisfactory steady
Reproduced with permission of the copyright owner. Further reproduction prohibited without permission.
246
state pressure stability and linear pressure-time profiles were obtained, with maximum
errors of 0.5 psi relative to the set-point.
Linear pressure programming from 2 to 40 psi under isothermic conditions was
of limited chromatographic utility. It could reduce retention times and peak widths over a
limited capacity factor interval. However, it added considerably flexibility to the
operation of the injector. Appropriate column head pressure modulation allowed
maximization of sample injection and simultaneous minimization o f purge gas
consumption.
The systems designed in this study are the basic elements o f a prototype portable
gas chromatograph suitable for the analysis of volatile and semi-volatile organic
compounds. This prototype instrument included a conventional flame ionization
detector. Clearly, a further direction in the development of portable gas chromatography
should be the design of specialized miniaturized selective detectors.
Reproduced with permission of the copyright owner. Further reproduction prohibited without permission.

APPENDIX
CALCULATION OF BINARY DIFFUSION COEFFICIENTS IN THE GAS PHASE
The determination o f the binary diffusion coefficients in the gas phase has been
the subject of multiple investigations. Several methods for the estimation of binary
diffusion coefficients have been published (e. g., A.1-A.3); most of them are based on the
hard sphere model of the original Stefan-Maxwell equation (A.4):
where DAB is the binary diffusion coefficient of gas A and gas B, n is the total
concentration o f A and B, T is the absolute temperature, k is the Boltzman constant, mA
and mB are the molecular masses of A and B, and c AB is the collision diameter or
separation between molecule centers of unlike pairs upon collision. Fuller, Schettler and
Giddings (A.3) optimized the equation, adjusting the parameters by least square fitting
with experimental data. Their final equation, applied most commonly for the estimation
of diffusion coefficients in gas chromatography, is given by:
where p is the pressure in atm., v, are the diffusion volumes of the atoms in molecule A
and B respectively, Ma is the molecular weight of A, and MB is the molecular weight of B.
References for the Appendix
A. 1.Gilliland, E. R. Ind. Eng. Chem. 1934,26,681.
AB 32na2AB it m8>3 \%kT( 1 1 Y|^
— ; 1------ [A.1]
D [A.2]
A.2.Fuller, E. N.; Schettler, P. D.; Giddings. J. C. Ind. Eng. Chem. 1966, 5 8 ,19-27.
247
Reproduced with permission of the copyright owner. Further reproduction prohibited without permission.
VITA
Elena Ursula Ehrmann was bom in Caracas, Venezuela, on August 13, 1957, to
Alfons and Marianne Ehrmann. She graduated in 1975 with honors from High School at
the Venezuelan-German School “Colegio Humboldt” in Caracas. That same year she
enrolled the “Universidad Simon Bolivar” in Caracas, and pursued a bachelor of science
degree in chemistry. During her senior year she worked on her thesis in new routes for the
synthesis of anthraquinones, synthetic precursors o f chemotherapeutic drugs. She jointly
published three papers in reviewed journals as a result from this effort. In June 1980 she
obtained her bachelor of science degree graduating cum laude, first in her class, and with
the highest GPA in the history of the chemistry department.
After a four month backpack vacation in the Old World, she was hired in 1981 by
Intevep, the Venezuelan Institute for Oil Research and Development. There she worked in
the Chromatography Unit of the Analytical Division. At Intevep, her responsibilities were
developing new chromatographic methods, providing analytical support to ongoing
projects, performing specialized chromatographic analyses, and training refinery
personnel in gas chromatography (GC). In 1982 she installed the first desktop GC-MS in
the country and implemented several analytical methods such as detailed hydrocarbon
analysis of gasolines, analysis of biomarkers in crude oil and fractions, and several
methods of environmental interest. All of these methods are routinely used at Intevep, and
many of them, throughout the Venezuelan Oil Industry. Other projects include the
characterization of the naphtha fraction, acid fraction, basic fraction, asphaltenes and
vacuum residues of heavy and extraheavy cmde oil, using GC, GC-MS, Py-GC, etc. She
is the author of several papers in national and international journals.
248
Reproduced with permission of the copyright owner. Further reproduction prohibited without permission.

249
In 1991, she was in charge of the development and routine implementation of the
analytical methods to be used during the process development and commercial operation
of five MTBE/TAME plants in the country. A manual of analytical methodology for the
process and quality control in Etherol™ plants was the product of this effort, and is
currently part o f this proprietary technology.
In 1991 she was appointed as head of the GC unit in Intevep. During that year she
also supervised and coordinated a nationwide project aimed at characterizing the natural
gas sources of Venezuela.
In 1992, Intevep awarded her a scholarship to pursue her doctor of philosophy
degree in the area o f field or process gas chromatography. She began her doctoral
program at the Chemistry Department in the Louisiana State University in January 1993.
There she worked in the area of fast portable gas chromatography, under the supervision
of Dr. Edward Overton. During her years at LSU, she presented papers at Pittcon 1995-
1997. She published one paper in the Journal of Chromatographic Science. Several other
papers are in preparation.
Ursula Ehrmann is a member o f the American Chemical Society, and The
Venezuelan Society for Analytical Chemistry.
Reproduced with permission of the copyright owner. Further reproduction prohibited without permission.
DOCTORAL EXAMINATION AND DISSERTATION REPORT
cand idate! Elena U. Ehrmann
Major Fiaid: Chemistry
title of Dissertation: New Developments in Portable Fast G as Chromatography
Approval:
Major Professor and Chairman
Graduate School
EXAMINING COMMITTEE:
Date of Examination;
6/13/97
Reproduced with permission of the copyright owner. Further reproduction prohibited without permission.