new definitions for moisture recycling and the relationship with land.use changes i8n the sahel (1)
TRANSCRIPT

Journal of Hydrology
ELSEVIER
[4]
Journal of Hydrology 167 (1995) 57-78
New definitions for moisture recycling and the relationship with land-use changes in the Sahel
H u b e r t H . G . Saveni je International Institute for lnfrastructural, Hydraulic and Environmental Engineering (1HE), P.O. Box 3015,
2601 DA, Delft, Netherlands
Received 29 May 1994; accepted 7 September 1994
Abstract
In the Sahel, recycling of moisture through evapotranspiration appears to be responsible for more than 90% of the rainfall. As a result, there exists an important feedback mechanism between land-use and climate, which has immediate implications for the management of natural resources. The challenge is to find sustainable combinations of land-use and vegetation that maximize recycling of moisture, while at the same time allowing adequate agricultural production. In this paper, a theory of moisture recycling is presented including the derivation of moisture recycling indicators, one of which is based on the salinity of the rainfall. Subsequently, the theory is verified with observations of rainfall and runoff in the Sahel over the period 1950- 1990.
1. Introduction
In the Sahel, since the 1970s, below-average rainfall has been observed as well as reduced runoff in the major rivers draining West Africa: in the Casamance (leading to hypersalinity (Savenije and Pagrs, 1992)), the Gambia , the Volta, the Senegal and the Niger (see Fig. I). In the Niger~ the reduction of the runoff during the period 1970-1980 appears to be part of a general pattern of periodicity rather than a downward trend.
With rainfall, however, it seems as if the periodic cycle of wet and dry years has been broken and that the drought is more persistent than one would expect from long- term fluctuations related to feedback between land-use and climate (Entakhabi et al., 1992). In this feedback, the role of vegetation is important.
It can be seen f rom Figs. 2 and 3 that the isohyets and the vegetation belts show a similar pattern. Obviously, the type of vegetation depends on the availability of
0022-1694/95/$09.50 © 1995 - Elsevier Science B.V. All rights reserved SSDI 0022-1694(94)02632-7

58 H.H•G. Savenije / Journal of Hydrology 167 (1995) 57-78
I I I F I I I I I I f I I I I I I - I I I
o
o
(S/~W) J~ounJ lenuue ueetu
0
,,..,
t--
Q
t~
do
0 o.~.
Z
+

H.H.G. Savenije / Journal of Hydrology 167 (1995) 57-78 59
Fig. 2. Isohyets of West Africa.
rainfall. However, is there also a reverse relationship, in that vegetation influences the amount of rainfall in a measurable way?
In this paper, the role of vegetation in the feedback mechanisms is explored and analytical relationships are derived to quantify the reuse of moisture as a function of hydrological parameters describing the proport ion of interception, infiltration, transpiration, percolation and runoff.
2. The role of vegetation in the hydrological cycle
The exchanges of mass, momentum and energy between the atmosphere and the Earth's surface are heavily dependent upon the nature and structure of that surface. Indeed, as Avissar and Verstraete (1990) noted in a recent review, the representation of the land surface remains one of the principal difficulties in developing atmospheric numerical models.
The processes at work at the surface are notable for their complexity. For example, the albedo of the surface influences directly the partitioning of insolation. However, the surface albedo is strongly dependent upon the type of vegetation and the dryness of the soil, which itself varies as a function of precipitation, and soil processes, such as infiltration, and evaporation. In turn, evaporation depends upon the availability of

60 H.H.G. Savenije / Journal of Hydrology 167 (1995) 57-78
0
0
d~
2
~d
E
0
b
e~
<
,=.
0
rd

H.H.G. Savenije / Journal of Hydrology 167 (1995) 57-78 61
water at the surface, the vapour pressure gradient between the surface and the atmosphere, and the wind profile. I f the surface is vegetated, a substantial proportion of the evaporation is contributed by transpiration, which is governed by the physiology of the plants. Furthermore, the canopy of vegetation modifies the roughness of the surface, thereby affecting the wind pattern and the fluxes of moisture and heat.
These feedback mechanisms operate over a range of temporal and spatial scales that are of particular importance in the forecasting of extremes, such as floods and droughts, and the prediction of available water resources. The question remains as to whether these mechanisms are as obvious at the scales over which changes in climate are considered to become apparent. Although albedo may be important, Folland et al. (1986) believed it to be less so than sea-surface temperature (SST) changes. The following treatment therefore concentrates on the effects of vegetation on the principal hydrological mechanisms of evaporation, transpiration and infiltration.
Vegetation affects the components of the hydrological cycle in several ways. Fig. 4 shows a schematic presentation of the hydrological cycle for the West African continent under a prevailing wind direction. The main circulation consists of the input of moist air from the sea, which returns to the ocean through river runoff. Within this main circulation there is intensive recycling of moisture through re-evaporation of rainfall. The two recycling mechanisms are evaporation e (mainly interception) and transpiration 7, which are expressed as dimensionless numbers reflecting the proportions of the rainfall P and the infiltration F, respectively, that return to the atmosphere. Hence,
e + f + s = 1
T + g = 1
(1)
(2)
P
¥
G
P
G G
E T
Fig. 4. The hydrological cycle for a land surface with prevailing wind direction, indicating possible feedback mechanisms through evaporation and transpiration,

62 H.H.G. Savenije / Journal of Hydrology 167 (1995) 57-78
where s, e, f , g and ~- represent surface runoff, evaporation and infiltration (as a proportion of the rainfall), and groundwater recharge, and transpiration through plants (as a proportion of infiltration F), respectively. In this definition, the total feedback to the atmosphere through evapotranspiration amounts to E = P(e + f r ) and the total loss from the atmospheric system R = P(s +fg), composed of surface runoff and groundwater recharge, part of which wiU eventually contribute to runoff.
Directly, or indirectly, these elements of the hydrological cycle depend on vegeta- tion cover. The direct evaporation eP mainly depends on vegetation cover through the interception of water by foliage. Wigham (1973) estimated this interception, depending on the type of vegetation, to be approximately 20% of the precipitation. The infiltration F = f P also depends on vegetation cover. Bare soil is generally less permeable than vegetated soil, partly as a result of crust formation. As both e and f decrease as the vegetation cover decreases, the surface runoff ratio s is higher in sparsely vegetated areas.
After the water has reached the unsaturated soil through infiltration, there remain two hydrological links: transpiration -r and percolation (recharge of groundwater) g. The groundwater contribution to runoff in semi-arid zones, however, is known to be almost negligible. Consequently, an increase in recharge (equal to Pfg) mainly results in an increase of groundwater storage. Reduction of transpiration (for equal infiltration), hence, leads to increase of groundwater storage, part of which may contribute to sub-surface runoff.
An important feedback mechanism in the unsaturated zone is that accumulation of moisture as a result of reduced transpiration results in less infiltration (infiltration capacity depends on the dryness of the soil) and hence more surface runoff. Hence loss of vegetation results in an increase of surface runoff both through a decrease of e and a decrease of ' r and as recharge equals Pf(1 - r), the question as to whether ground- water storage increases or decreases as a result of vegetation cover loss depends on which of the following effects is more pronounced: a decrease in rainfall, a decrease in infiltration, or a decrease in transpiration. In the Sahel, at a number of places near Ouagadougou a rise of the piezometric level has been observed, which was not as a result of a reduction of groundwater withdrawal (IWACO, 1993), indicating that in these areas the reduction of 7- predominates.
Eagleson (1978) described the processes by which rainfall is intercepted, evaporated, discharged, infiltrated, percolated and transpired as a function of vegetation cover, but he did not describe the process of rainfall and how evaporation and transpiration again contribute to the atmospheric moisture through recycling. A very interesting and useful theory of Eagleson (1978), however, is that in the undisturbed environment, natural selection will result in a species mix where the available soil moisture is used in a way that maximizes transpiration from the soil. If there is a part of the soil profile that is not efficiently used by vegetation, then there is apparently a niche for a plant with a root depth adequate for that part of the soil profile, which will eventually develop. This implies that a natural mix of vegetation maximizes transpiration and that all other land-uses favouring a limited number of species (such as agriculture, pasture, etc.) reduce the amount of evaporation and hence the recycling of moisture to the atmosphere. From water balance

H.H.G. Savenije / Journal of Hydrology 167 (1995) 57-78 63
considerations, it follows that reduction of transpiration as a result of land-use change eventually leads to more runoff.
The mechanism of rainfall formation has been described by Wiesner (1970). Rainfall is always the result of cooling of air masses through an uplift. The two most important mechanisms here are the rise of unstable pockets of air (thunder- storms) and the orographic effect where air is forced up over a land slope by advection. In both cases, the amount of precipitation is proportional to the amount of precipitable water. I f the air is saturated, then rainfall intensities are highest, but if the air is completely dry there cannot be any precipitation. Wiesner assumed the precipitation to be proportional to the amount of precipiable water and the velocity of horizontal air movement:
P = p W (3)
where W is the moisture content of the atmosphere (in mm) and p is a coefficient proportional to the horizontal velocity u.
This assumption is compatible with Budyko's (1974) approach, where the atmosphere is assumed to be well mixed and where the ratio of rainfall originating from advective moisture Pa to rainfall originating from locally evaporated water Pe is assumed to be equal to the ratio of advected to evaporated moisture present in the atmosphere.
To evaluate the proport ion of these quantities of moisture, use is made of the one-dimensional moisture balance equation of the atmosphere (Peixoto, 1973):
O W OWu 0--T + ~ = E - P (4)
where u is the instantaneous advective velocity in x-direction averaged over the vertical and e is the total evapotranspiration from the Earth's surface. In the symbols defined earlier, E = P(e + T f ) . Rearrangement of Eq. (4) yields
O W O W wCgU___ 0----7- + U-~x + Ox = E - P = (e + T f -- 1)P (5)
Let us assume a Lagrangian movement of the air mass over the Earth's surface with a near-constant average velocity (Ou/Ox ~ 0), where u = dx /d t ; then Eq. (5), combined with Eq. (3), can be written as
dW d W dt = U-d--xx = E - P = - c ~ p W (6)
where a = (1 - e - 70. Integration of Eq. (6), assuming a p / u is constant with x, yields the solution
W = W0 e x p ( - ~PuX ) (7)
As p, according to Wiesner (1970), is proportional to u, p/u is a constant and the assumption that c~p/u is constant with x implies a homogeneous distribution of ~ over X.
In the literature, often use is made of Budyko's (1974) method for the

64 H.H.G. Savenije / Journal of Hydrology 167 (1995) 57-78
determination of the rate of moisture recycling, e.g. by Brubaker et al. (1993) and Entekhabi et al. (1992). This method is based on the integration of Eq. (6) where (E - P) is, incorrectly, assumed to remain constant with x. Integration of Eq. (6) over a distance / with (E - P) assumed independent of x, yields
(E - P)t wt Wo + - - (8)
U
where Wt = W(l) and W 0 = W(0). The areal average moisture content (W) in the Lagrangian volume then reads
(W) ~ wt + Wo El Pl W0 + - - - (9)
2 2u 2u
where the first term on the right-hand side is the moisture originating from advection, the second term is the moisture originating from evapotranspiration and the third term is the reduction of moisture owing to precipitation. Hence, the areal average ratio of rainfall originating from advection to rainfall originating from evapo- transpiration, according to Budyko (1974), can be determined as
(P-~ee) ~ 2WOUEI (10)
With P = Pa + Pc, the areal average recycling rate (7) can be computed:
Pe [ 2Wou] -1 (7) = --e ~ [1 + ~ ] (11)
With this formula, Brubaker et al. (1993) computed, on the basis of 10 years of observations of moisture fluxes, rainfall and precipitation (Oort, 1983), that in the Sahel (in the area enclosed between 7°30'N and 15°N, and between 10°W and 15°E) during the highest rainfall months of July and August, the recycling rate (7) reached values of 47% and 48%, respectively. However, owing to the non-linear decrease of moisture with x, Budyko's method tends to underestimate the rate of recycling.
Although the results of Brubaker et al. (1993) are interesting, they give the wrong impression that recycling in the Sahel amounts to about 50%. From the definition of their recycling rate, it follows that at the upstream boundary (7°30'N) 100% of the rainfall originates from advective moisture transport and 0% originates from evapo- transpiration. As the average contribution over the whole area of water originating from evapotranspiration is near 50%, this implies that at the downstream boundary (15°N) the precipitation originating from evapotranspiration must be near 100%. Moreover, at the upstream boundary, the moisture has already travelled 350 km over land and at least part of the air moisture at that point is recycled moisture. In any case, as the rates of recycling obtained by Brubaker et al. (1993) are average values for the total area and recycling becomes more important the further the air mass travels inland, it is clear that in the driest parts of the Sahel the recycling rate is considerably higher than 50% and, hence, recycling of moisture from the Earth's surface is a very important mechanism.
Through the use of a simple linear model, the importance of recycling can be

H.H.G. Saven~e / Journal of Hydrology 167 (1995) 57-78 65
demonstrated. Subsequently, the model results are compared with observed precipitation and runoff data in the field and the effect of land-use changes on the hydrological process is demonstrated.
3. Analytical model for moisture feedback
In the Sahel, the land has a gradual slope in a northern direction, there are no major mountain ranges that cause inhomogeneities in the orographic effect, and thunder- storms may be assumed to have a homogeneous density. Under these assumptions, a simple linear relationship may be assumed to exist between air moisture content and rainfall.
The following equation from Savenije and Hall (1994) is a linear adveotion- dispersion model which includes a loss term on the right-hand side:
O-W ~_ O W d O 2 W - p W ( 1 - e - ' r f ) (12) " ~ OX - - GOX 2 - -
where the overbar signifies the time average of the variable over the rainy season. In the following derivations, only time average values will be used and hence the overbar will be disregarded for reasons of simplicity. Eq. (12) is the time average version of Eq. (5), under the assumption that the term containing Ou/Ox can be neglected. The advective term represents the mean motion and the dispersion term caters for the transient eddy transport of moisture (Brubaker et al., 1994). It can be seen from Eq. (12) that, at a time scale of several years, the loss term of the system P- E is equal to the runoff from the system R, if the accumulation of groundwater can be neglected:
R = p W ( 1 - e - T/) = a p W (13)
where a is the loss coefficient which equals the runoff coefficient if there is no accumulation of groundwater. However, it has been observed that, at a time scale of one rainy season, in certain parts of the Sahel this accumulation can be consider- able (IWACO, 1993). If a = 1, then all rainfall is lost from the atmospheric system, partly through runoff in the streams and partly through groundwater accumulation, leading to zero recycling of moisture; if a = 0, the feedback is complete and all moisture is recycled into the atmosphere.
Under the assumption that the dispersion process is less important than advection, an acceptable assumption in the wet season (Savenije and Hall, 1994), the following simple solution can be obtained for the time average variation of moisture on a Lagrangian pocket of air moving along a stream line at a constant velocity:
x W _ P _ e x p { _ ] ~, )
where
u
pc~
(14)
(15)

66 H.H.G. Savenije / Journal of Hydrology 167 (1995) 57-78
which is the same equation as Eq. (7), which applied to the instantaneous variation of moisture along a stream line.
The precipitation that originates purely from advection of ocean moisture Pa, can be computed with Eq. (12) under the condition that there is no feedback of moisture (e + ~-f = 0). The solution of Eq. (12) then reads
ea x ( £ "~1/~ (16) - ~ o = e X p ( - P x ) =exp( - -~-~ ) = \po j
Subsequently, the time average (but x-dependent) recycling rate of moisture can be defined as
3 ~ _ Pep ~ P - P a - I - ( ~ - ~ O ) ( ' - ~ ) / ~ (17)
Another parameter that can be used as a measure of recycling is the return rate p: the average number of times that a moisture particle returns to the Earth as rainfall. If we define the average residence time of moisture in the atmosphere as W / P = l /p, and the average travel time of moisture along the stream line over a distance I as l/u, then the return rate is defined as the ratio of these times:
pl l p = - (18)
u ceA
This implies that over a length I equal to A the return rate is the inverse of the loss coefficient. If ~ = 1 (no recycling), then p = 1 over a length equal to the length scale, meaning that moisture is used only once; if c~ = 0, then the same moisture is reused infinitely. F rom Eq. (18) the length scale of moisture recycling can be derived. If p = 1, the length I reflects the average distance which a water particle travels before it reaches the ground and is possibly recycled. The length scale then equals I = p /u = c~A, which is a constant depending on the rainfall bringing mechanism.
3.1. The effect o f land-use
Change in land-use practices and vegetation (such as cultivation, pasture, deforestation, urbanization and road construction) introduces changes in the propor- tion of surface runoff s, infiltration f , interception e and, of course, transpiration from soil moisture "r. As stated above, the combined effect of these changes generally results in an increase of the loss coefficient c~ = (1 - e - "rf) = (s + g f ) . Hence, the change of P and R as a result of a change in c~ are important indicators to investigate. Partial differentiation of Eqs. (3) and (13) with respect to a, making use of Eqs. (14) and (15), yields
OP x - - - P (19)
Oc~ ~A
0 a 1 P (20)

H.H.G. Savenije / Journal of Hydrology 167 (1995) 57-78 67
E E
1000
9OO
800
700
600
5O0
400
3OO
2OO
100
0
-100
-200
-300
-400
-500
-600
• ~1011
+ P
,s P+O.2aaPIc3a
] i i I I I I i I I I I i I 1 I I I i
0 200 400 600 800 1000 1200 1400 1600 1800 2000
distance (km)
Fig. 5. Longitudinal variation o f rainfall P and the variation of the rainfall with the loss coefficient a.
1000
E E
9OO I
+ R
soo R +O.2 a aRl aa
700
6o0
5oo
4oo
3oo
2oo
- 2 ~ I i i i i i i i i i i i i i i I i I i
0 200 400 600 800 1000 1200 1400 1600 1800 2000
distance (kin)
Fig. 6. Longitudinal variation o f runoff R and the variation of the runoff with the loss coefficient a .

68 H.H.G. Savenije / Journal of Hydrology 167 (1995) 57-78
In Fig. 5, both P and OP/Oa are plotted and the effect on the rainfall distribution of an increase of a by 20% is illustrated. In Fig. 6, a similar plot is shown for R, OR/Oa and R after an increase of a by 20%.
Fig. 5 shows that rainfall is reduced upstream from a forced boundary value P0 at x -- 0 as a result of an increase in runoff, with the maximum reduction occurring at x = A. Fig. 6 shows that runoff increases on the interval x E [0, A) but that runoff decreases for x > A. The maximum reduction occurs at x = 2~. It is interesting to note that in the interval x E [0, A) runoff increases whereas precipitation is reduced. In the portion further downstream, the runoff decreases as a result of the reduced precipitation.
In the following section, these results are checked against observed annual rainfall and runoff data in the Sahel.
4. Verification by observations
4.1. Rainfall
For the calibration of the simple analytical model of Eqs. (3) and (14) on average conditions during a wet season, two easily determinable quantities are used: A, the length scale of Eq. (14), and
Po = pWo (21)
where P0 is the amount of rainfall during the wet season at the coast. Both numbers result directly from a plot of the rainfall as a function of the distance to the coast on semi-logarithmic paper. Values of e, f and ~- can be estimated by the hydrologist, which leaves three unknown parameters: u, p and W 0, with only two equations: (14) and (15). Consequently, a value for W0, the precipitable moisture on the coast should be estimated. Wiesner (1970) suggested that W be determined as a function of the dew-point temperature near the Earth's surface. Hence W0 is a function of the dew- point temperature near the coast. Wiesner (1970) also stated that the seasonal mean temperature of the source region is related to the maximum dew-point which the air mass might attain. Hence the mean sea-surface temperature (SST) for the respective months of the year indicates the maxima which the dew-point inland might reach. A dew-point of 26°C corresponds to W0-= 89 mm, and a dew-point of 27°C corresponds to W0 = 97 mm. Off the coast of Liberia, in the rainfall months of JJA (June, July, August), the mean SST is between 26 and 27°C (Hayward and Oguntoyinbo, 1987). Hence, it is reasonable to assume that W0 = 90 mm.
The model has been applied to the annual rainfall averages of a large number of rainfall stations in Ghana, Burkina Faso, Nigeria, Mali, Niger, Senegal and Mauretania, the data on which have partly been collected by Quaye (1993) and partly been made available by ORSTOM. In Fig. 7, the annual rainfall has been plotted against the distance to the ocean, represented by the distance to latitude 4°N on the south coast of West Africa.
The model has been fitted to this longitudinal profile by considering an inflection

E E E
H.H.G. Savenije / Journal of Hydrology 167 (1995) 57-78 69
2600 I
2400 - - ~ [] 1951-1970 I N 2200 - ~ + 1971-1990
200011600800 _!_ + ~ ~ ~' 1971-1980
t o o o ++ + + ++ []
+ o o _ .+.
_
400 -
200 .Q o.
0 I I I I I I I I I I [ I I I I P ~ I I I I
0 200 400 600 800 1000 1200 1400 1600 1800 2000 distance (kin)
Fig. 7. Calibration of the analytical model to observed annual average rainfall in the Sahel for the periods 1951-1970, 1971-1980 and 1971-1990.
point at 1000 km from the coast, where a clear change can be observed in the behaviour of the system. This point lies near to the annual rainfall of 600 mm year -1 , which is considered by ecologists as the transition of savanna to the very marginal rangeland of the South Sahel (Breman, 1992). In the first reach, lines were fitted with a length scale of 968 km, whereas in the second reach the length scale is much shorter (337 km in the period 1951-1970 and 260 km in the most recent period, 1971-1990).
The scatter is caused partially by the practical assumption that the longitudinal positioning of the dots can be represented by the shortest distance to the 4°N latitude along a streamline perpendicular to the isohyets (as we do not know the exact path which an air mass follows from the ocean to the point of observation), and partly by the assumption that the coefficients of the model u, d, p, e, r and f a r e homogeneous over the distance.
It is interesting to note that the relatively low values observed in the nearest 400 km to the coast correspond to the 'depression' in the isohyets in the south-eastern part of Ghana (see Fig. 2), but that the observations further north are not affected by this feature, probably as a result of lateral dispersion.
The transition of the length scale from 968 to 337 km at the inflection point is probably the result of the change in the vegetation type or coverage in accordance with the transition of the Sudan to the South Sahel belt, which results in other values of e and ~-, but it may also be caused by a change in the transport mechanism. One

70 H.H.G. Savenije / Journal of Hydrology 167 (1995) 57-78
could argue that at 1000 km from the ocean, near 12°N, the transport mechanism would gradually become less advective and more dispersive, because near the maximum penetration of the Inter-Tropical Convergence Zone (ITCZ) (at 20°N) wind velocity may be expected to decrease. An argument that contradicts the latter possibility is that such a transition would not be instantaneous, but gradual, and Fig. 7 clearly shows an instantaneous change. Also, the modelling of Folland et al. (1986) does not indicate a reduction of the advection until 20°N. In any case, whatever the mechanism, a change in the length scale over time would be the result of a change in e or 7- rather than a result of a change from an advection-driven to a dispersion-driven moisture transport.
If we assume that the transport remains primarily advection driven until at least 15°N, then the following annual average values of the parameters correspond to W0 = 90 mm and A = 968 km: u = 0.2 ms -1, p : 0.07 day -1, e = 0.2, f = 0.7, r - - 0 . 8 . Hence, in the forest belt, the percentage of surface runoff is assumed to amount to s = 0.1 during the rainy season, the total loss of the system a = 24%, and the return rate over a length equal to the length scale is p = 4.2. The difference between s and a is mainly groundwater accumulation during the wet season. During the dry season the groundwater storage is depleted both by runoff and by transpiration, which does not contribute to rainfall through lack of rainfall mechanisms.
In the South Sahel, where A -- 337 km (in the period 1950-1970), the interception is less and the infiltration is higher: e = 0.15, f = 0.8; as much of the transpiration of the infiltrated water occurs during the dry season, when the transpiration does not contribute to rainfall, the transpiration contributing to rainfall is less: r = 0.2. The percentage of surface runoff, s, is 5% and the loss of moisture from the system, a, in this belt, is 69%. Hence the accumulatation of groundwater during the wet season is substantial: f g = 49%. As in this belt sub-surface runoff is negligible, this implies that about 50% of the rainfall is available for transpiration during the dry season (assum- ing no change in groundwater storage). If there is no capacity for transpiration through lack of vegetation cover, then groundwater is expected to rise, as has indeed been observed in parts of the Sahel. The return rate over a length equal to the length scale is p --- 1.4, which is substantially lower than in the forest belt.
Obviously, the establishment of these parameters, to a large extent, is guesswork and it is very important that better estimates be made, based on measurements. It is not the intention of this paper to give a final answer to the exact values of these parameters. Rather, it is intended to demonstrate the hydrological processes and feedback mechanisms that exist in the Sahel and to supply an order of magnitude of the process parameters.
4.1.1. The drought o f 1970-1990 In the reach nearest the coast, the change in the rainfall profile after 1970, observed
in Fig. 7, was primarily caused by a decrease of the available moisture by 10%, as the length scale of the process remained essentially the same (968 km). This decrease in available moisture indicates a general drought effect, which is probably the result of large-scale changes related to SST changes. In the second reach, the decrease of the

H.H.G. Savenije / Journal of Hydrology 167 (1995) 57-78 71
1.1
0 . m
1 . 0 m
0 .9
0 .8 -
0 , 7 -
0 . 6 -
0 .5
0 , 4
0.3
0.2
0.1 -~
0.0
+ ~ m
-t-
d~ +
+ + t-
-p P 1971 - 1990
P 1951 - 1970
P 1971 - 1960
P 1951 - 1970
E3
I I I I I I I i I I I 1 I I I I I i
200 400 600 800 1000 1200 1400 1600 1800 2000
distance (kin)
Fig. 8. Ratio between mean annual rainfall over the periods 1971-1980 and 1951-1970 in the Sahel, measured and modelled.
precipitation, and hence the precipitable moisture, became steeper (length scale reduced by 24%), as is clearly illustrated by Fig. 8, which shows the ratio of the rainfall in the period 1971-1980 (and 1971-1990 where available) to the rainfall in the period 1951-1970.
The drawn line in Fig. 8 represents the ratio of the two lines in Fig. 7. It appears that there is more reduction further inland, in the most vulnerable area (the very marginal Southern Sahel). In the interior of the Sahel, the rainfall decreased by 50% or more. I f we assume that u/p (which depends upon orography and storm convergence) remained essentially unchanged, then this length scale reduction can only be caused by a considerable decrease of e, f a n d r owing to land-use change and loss of vegetation. The shorter length scale corresponds to a moisture loss rate of c~ -- 89% and a return rate over a length equal to the length scale o f p = 1.1. Hence the conclusion can be drawn that the drought in the Sahel is most probably aggravated, if not caused, by a decrease in the total evaporation over the years 1970-1980 as a result of loss of vegetation cover by over-grazing, over-browsing and cutting of scrub and trees.
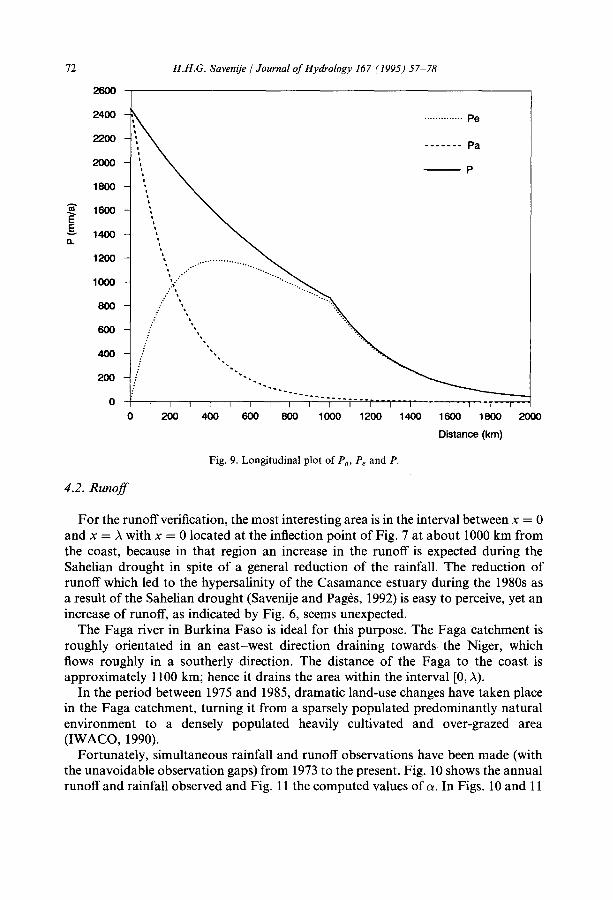
Finally, to analyse the theoretical value of 7 in the Sahel, Pa is plotted together with P and Pe in Fig. 9. The line of Pa is obtained by assuming that all rainfall comes to runoff(~ = 1) and that there is no recycling of moisture. On the basis of the results, it can be seen that the recycling rate at x = 1000 km amounts to "y = 93% and that in the interior of the Sahel recycling is near 100%.
72 H.H.G. Saven~ie / Journal of Hydrology 167 (1995) 57-78
E E O.
2400
220O
2OOO
1800
1600
1400
1200
1000
800
60O
400
200
0
"'\, \
0 200
.............. Pe
Pa
P
400 600 800 1000 1200 1400 1600 1800 2000
Distance (kin)
Fig. 9. Longitudinal plot of Pa, Pe and P.
4.2. Runoff
For the runoff verification, the most interesting area is in the interval between x = 0 and x = A with x = 0 located at the inflection point of Fig. 7 at about 1000 km from the coast, because in that region an increase in the runoff is expected during the Sahelian drought in spite of a general reduction of the rainfall. The reduction of runoff which led to the hypersalinity of the Casamance estuary during the 1980s as a result of the Sahelian drought (Savenije and Pag6s, 1992) is easy to perceive, yet an increase of runoff, as indicated by Fig. 6, seems unexpected.
The Faga river in Burkina Faso is ideal for this purpose. The Faga catchment is roughly orientated in an east-west direction draining towards the Niger, which flows roughly in a southerly direction. The distance of the Faga to the coast is approximately 1100 km; hence it drains the area within the interval [0, A).
In the period between 1975 and 1985, dramatic land-use changes have taken place in the Faga catchment, turning it from a sparsely populated predominantly natural environment to a densely populated heavily cultivated and over-grazed area (IWACO, 1990).
Fortunately, simultaneous rainfall and runoff observations have been made (with the unavoidable observation gaps) from 1973 to the present. Fig. 10 shows the annual runoff and rainfall observed and Fig. 11 the computed values of a. In Figs. 10 and 11

H.H.G. Savenije / Journal of Hydrology 167 (1995) 57-78 73
700
E
600
500
400
300
200
1 O0
/
/
0 i 1973
I I I I I I I I I I I I I I I
1975 1977 1979 1981 1983 1985 1987 1989
years
Fig. 10. Variation of rainfall P and runoff R over time in the Faga catchment.
a clear upward trend can be observed in both R and a, in agreement with the predictions of Fig. 6. However, to be able to draw a more objective conclusion, the changes in the ra infal l - runoff process have to be analysed in more detail.
For the analysis of the change in rainfall and runoff patterns, two periods of equal length and comparable wetness have been selected: 1973-1974, to represent the more or less natural environment (pre-drought) situation; and 1988-1989, the disturbed situation after a period of considerable land-use change. Data have been analysed on the basis of 10 day (decade) average values of runoff and 10 day (decade) rainfall sums.
To analyse the ra infal l - runoff relationship, use is made of a linear transfer function:
R( t ) = b l m a x [ P ( t ) - T , 0] + b 2 m a x [ P ( t - 1) - T,0] + . . . (22)
where Tis a threshold value for runoff, which is related to e, and bi are partial surface runoff coefficients, which are related to s. In fact, if T ---- 0, ~ b i = o~.
Through multiple linear regression, the values of bi and T have been obtained and are presented in Table 1. Fig. 12 shows the shapes of the typical hydrographs obtained on the basis of b i.

74 H.H.G. Savenije / Journal of Hydrology 167 (1995) 57-78
15
Q.
14
13
12
11
10
9
8
7
6
5
4
3
2
1
0
973
/ I 1 I I I l I I I l I I I I I
1975 1977 1979 1981 1983 1985 1987 1989
years
Fig. 11. Variation of the runoff coefficient (in per cent) over time in the Faga catchment.
It can be concluded from Table 1 that, although rainfall in the period 1988-1990 is slightly less than rainfall observed in 1973-1974, the runoff has nearly tripled and the runoff coefficient increased from 2.8 to 8.0%; an increase by a factor of three. This result confirms the theory described above. Also, it can be seen that the threshold to runoff has decreased (decrease of interception) by 34% and that the surface runoff has increased both in quantity ()--] bi) and in intensity (reduction of the base time and time
Table 1 Results of multiple regression of decade runoff on rainfall in previous decades
1973-1974 1988-1990
Mean runoff R (mm year - l) 16 Mean rainfall P (mm year -1) 610 Runoff coefficient R/P (%) 2.6 Threshold rainfall T (mm per decade) 50 ~bi (%) 18 Base length (decades) 7 Explained variance r 2 (%) 96
44 556
8.0 33 25 4
84

0.12 l
H.H.G. Savenije / Journal of Hydrology 167 (1995) 57-78 75
0.11
0.1
0.09
0.08
0.07
0.06
0.05
0.04
0.03
0.02
0.01
0
II 1973-74
+ 1988-90
I I I I [ r r T
0 1 2 3 4 5 6 7 8 decades
Fig. 12. Shapes of the hydrographs consisting of the transfer function coefficients bi for the periods 1973 1974 and 1988-1990.
to peak). The effect of land-use change on rainfall and runoff and the importance of the feedback mechanism have herewith clearly been demonstrated.
5. The use of rainfall salinity measurements for recycling estimation
An alternative approach to assess the importance of moisture recycling, or to confirm the results obtained by an independent set of data, is by using the salinity of the rainfall as a tracer. Salinity of rainfall can be used as a very efficient indicator for the rate of moisture recycling. A Lagrangian salt balance of the atmospheric moisture can be used to illustrate this approach. In analogy to Eq. (6), the salt balance of the atmosphere reads:
d Wc d Wc - u = - P c (23)
dt dx
where c is the salinity of the atmospheric moisture. Here the assumptions are made

76 H.H.G. Saven~ie / Journal of Hydrology 167 (1995) 57-78
that the amount of salt present in the atmosphere is of marine origin and that it is equally distributed over W. The latter assumption, in particular, is mostly untrue. The salt in the atmosphere is probably only present in condensed water and not in vapour. The condensed part of the atmospheric moisture is generally small compared with the total amount of moisture (Peixoto, 1973). However, for the moment it is assumed that for the description of the processes of precipitation and advection, the salt can be assumed to be equally distributed over W (if the condensed phase is a fixed percentage of the total moisture content, then this assumption is justified). In the salt balance of Eq. (24) the inflow of salt from evapotranspiration is zero and the outflow of salt through precipitation is equal to Pc.
Elaboration of Eq. (23) under the assumption that the advective velocity is constant yields
dW dc c--~- + W ~ = - P c (24)
Substitution of Eq. (6) yields
c ( E - P) + W dc = - P C dt
(25)
d c u W-~x = - E c (26)
dc E - - - - dx
c W u
As E-----pW(1 - a),
d c _ P ( 1 - o 0 d x - 1 - a d x C U /~O~
Integration and substitution of Eq. (14) yields
( 1 - , ~ x X) (~o) (~-~/~ c -- - exp = CO--
(27)
(28)
(29)
Substitution in Eq. (17) results in a useful equation to determine the rate of recycling on the basis of rainfall salinity:
c 7 = 1 - - (30) Co
Eq. (30) simply implies that, for example, if the salinity of the rainfall is 10% of the salinity of the rain water near the coast, the rate of recycling is 90%.
This relationship should not be difficult to verify with available data on rainfall salinity. Such data in the Sahel and elsewhere have been gathered for the purpose of recharge assessments, for example, by Edmunds and Gaye (1994). Investigations should be carried out to assess the importance of the assumption that salinity is equally distributed over W. If the salinity is indeed concentrated in the condensed form of atmospheric moisture, then one would expect the precipitation of salt in the

H.H.G. Savenije / Journal of Hydrology 167 (1995) 57-78 77
area nearest the coast to be larger than predicted by Eq. (27) and the decline with x to be steeper, resulting in an overestimation of recycling. Calibration on monthly rain- fall and rainfall salinity measurements during the wet season would be required to test the validity and usefulness of Eq. (30).
6. Conclusion
It appears that the recycling of moisture through vegetation is the most important condition for rainfall in the Sahelian belt. This conclusion is important for the hydrologist, but it has even more important implications for the planners and managers of natural resources development in West Africa. Not only does the rain- fall in the interior of the Sahel depend significantly on land-use practices in the Sahelian belt itself, it also depends on land-use practices in the Savanna and forest belt. In the Sahel, this means that there are interesting international aspects to this issue (rainfall in Mali and Burkina Faso, for instance, is influenced by land-use in Guinea, Ivory Coast and Ghana), which could be important inputs to discussions on the sharing of international water resources. In this respect, a very interesting line of research is to investigate which combinations of crops and natural vegetation permit a sustainable development in which both a good productivity is obtained and the capacity of recycling of moisture is maintained.
It can be observed that irrigation in the dry season on fields which have been cleared of natural vegetation implies a loss of moisture recycling capacity, as water evaporated in the dry season does not enhance rainfall for lack of rainfall-bringing mechanisms. An important element of sustainable natural resources management would be to maximize evapotranspiration during the wet season. Straightforward irrigation has a negative impact on recycling, and the same applies to deep reservoirs. On the other hand, shallow lakes, wetlands and swamps can contribute substantially to wet season evaporation, particularly in the Sahelian belt. The recycling parameters A and p, described in Eqs. (17) and (18), are useful and easy-to-determine indicators for the importance of recycling of moisture and the dependence of recycling on the loss coefficient a. In addition, it is recommended to investigate further the applicability of Eq. (30) for the analysis of moisture recycling, as an on-line and rapid indicator of changes in recycling of moisture.
References
Avissar, R. and Verstraete, M.M., 1990. The representation of continental surface processes in atmospheric models. Rev. Geophys., 28(1): 35-52.
Breman, H., 1992. Desertification control, the West African case: prevention is better than cure. Biotropiea, 24(2b): 328-334.
Brubaker, K.L., Entekhabi, D. and Eagleson, P.S., 1993. Estimation of continental precipitation recycling. J. Climate, 66: 1077-1089.
Brubaker, K.L., Entekhabi, D. and Eagleson, P.S., 1994. Atmospheric water vapor transport and continental hydrology over the Americas. J. Hydrol., 155: 407-428.

78 H.H.G. Savenije / Journal of Hydrology 167 (1995) 57-78
Budyko, M.I., 1974. Climate and Life. Academic Press, New York. Eagleson, P.E., 1978. Climate, soil and vegetation, 1-7. Water Resour. Res., 14(5): 705-776. Edmunds, W.M. and Gaye, C.B., 1994. Estimating the spatial variability of groundwater recharge in the
Sahel using chloride. J. Hydrol., 156: 47-59. Entekhabi, D., Rodriguez-Iturbe, I. and Bras, R.L., 1992. Variability in large-scale water balance with land
surface-atmosphere interaction. J. Climate, 5(8): 798-813. Folland, C.K., Palmer, T.N. and Parker, D.E., 1986. Sahel rainfall and worldwide sea temperatures,
1901-85. Nature, 320: 602-607. Hare, F.K., 1985. Climate Variations, Drought and Desertification. WMO No. 653, Secretariat of the
World Meteorological Organization, Geneva. Hayward, D. and Oguntoyinbo, J., 1987. Climatology of West Africa. Hutchinson, London. IWACO, 1990. L'impact de la d6gradation de l'environnement sur l'~coulement superficiel dans les bassins
versants du Nakanbe er du Nazinon. Etude du Bilan d'Eau, Ouagadougou, Burkina Faso. IWACO, 1993. Observations pi6zom&rique. Etude du Bilan d'Eau, Ouagadougou, Burkina Faso. Oort, A.H., 1983. Global atmospheric circulation statistics, 1958-1973. NOAA Prof. Paper 14,
Geophysical Fluid Dynamics Laboratory-NOAA, Princeton, NJ, 180 pp. Peixoto, J.P., 1973. Atmospheric Vapour Flux Computations for Hydrological Purposes. WMO No. 357,
Secretariat of the World Meteorological Organization, Geneva. Quaye, G.N.A., 1993. Drought analysis of the Sahel Region. M.Sc. Thesis, International Institute for
Infrastructure, Hydraulics and Environment, Delft. Savenije, H.H.G. and Hall, M.J., 1994. Climate and landuse: a feedback mechanism? In: IHE Report Series
29, Water and Environment Key to Africa's Development. IHE, Delft, pp. 93-108. Savenije, H.H.G. and Pag6s, J., 1992. Hypersalinity: a dramatic change in the hydrology of Sahelian
estuaries. J. Hydrol., 135: 157-174. Wiesner, C.J., 1970. Hydrometeorology. Chapman and Hall, London. Wigham, J.M., 1973. Interception. In: D.M. Gray (Editor), Handbook on the Principles of Hydrology.
Water information Centre, Port Washington, NY.