new construction and catalyst support ... -...
TRANSCRIPT
General rights Copyright and moral rights for the publications made accessible in the public portal are retained by the authors and/or other copyright owners and it is a condition of accessing publications that users recognise and abide by the legal requirements associated with these rights.
• Users may download and print one copy of any publication from the public portal for the purpose of private study or research. • You may not further distribute the material or use it for any profit-making activity or commercial gain • You may freely distribute the URL identifying the publication in the public portal
If you believe that this document breaches copyright please contact us providing details, and we will remove access to the work immediately and investigate your claim.
Downloaded from orbit.dtu.dk on: Sep 15, 2018
New Construction and Catalyst Support Materials for Water Electrolysis at ElevatedTemperatures
Nikiforov, Aleksey Valerievich; Petrushina, Irina; Bjerrum, Niels J.; Jensen, Jens Oluf; Christensen, Erik
Publication date:2011
Document VersionPublisher's PDF, also known as Version of record
Link back to DTU Orbit
Citation (APA):Nikiforov, A., Petrushina, I., Bjerrum, N., Jensen, J. O., & Christensen, E. (2011). New Construction and CatalystSupport Materials for Water Electrolysis at Elevated Temperatures. Kgs. Lyngby, Denmark: DTU Chemistry.

Aleksey Nikiforov
New Construction and CatalystSupport Materials for WaterElectrolysis at ElevatedTemperatures
Ph.D. Thesis, June 2011


Aleksey Nikiforov
New Construction and CatalystSupport Materials for WaterElectrolysis at ElevatedTemperatures
Ph.D. Thesis, June 2011

New Construction and Catalyst Support Materials for Water Electrolysis at ElevatedTemperatures
AuthorAleksey Nikiforov
SupervisorsNiels J.Bjerrum, ProfessorErik Christensen, Associate professorIrina Petrushina, Associate professor
Release date: June 2011Category: 1 (public)
Edition: First
Comments: This thesis is part of the requirements to achieve the Ph.D. inChemistry degree at the Technical University of Denmark.
Rights: ©Aleksey Nikiforov, 2011
Department of ChemistryEnergy and Materials Science groupTechnical University of DenmarkKemitorvet building 207DK-2800 Kgs. LyngbyDenmark
www.energi.kemi.dtu.dkTel: (+45) 45 25 24 19Fax: (+45) 45 88 31 36E-mail: [email protected]

Preface
The present work was conducted at the Energy and Materials Science Groupat the Department of Chemistry, DTU, during the period from June 2008to June 2011.
I would like to express my high acknowledgement to all my supervisors.Firstly, to Professor Niels J. Bjerrum for the excellent and professional super-vision, whose effective guidance helped to complete the Ph.D. program, fullycovering all requirements for it. My co-supervisors, Drs. Irina Petrushinaand Erik Christensen daily supported my research and writing, giving highlyvaluable feedback, providing challenging ideas and having constant availabil-ity to put work aside while having a busy schedule and help me with myproblems.
I would also like to thank our current Ph.D. student Antonio, who helped mea lot during his master project, both with experimental and data analysispart.
I would like to express my sincere acknowledgements to Sinh Hy Nguyen,a principal technician at the Department of Enviromental Engineering atDTU, whose professional help with measurements can not be overestimated.
During February 2010 I had a pleasure of doing research at the Depart-ment of Materials Technology, NTNU. Professor Svein Sunde and Dr MikhailTsypkin are thanked for their cooperation in help with experimental workand providing worthwhile discussions. It was a very fruitful time with muchinspiration and obtained experience in the field of catalyst characterisation.
I would also like to acknowledge Professor Karel Bouzek, who provided mystay at the Department of Inorganic Technology at the Institute of ChemicalTechnology in Prague during the summer 2010. He assured that my workat the group was interesting and worthwhile, while Drs. Milan Kouril andMartin Paidar showed interest in my efforts and provided ideas for further

investigations.
After all, I would like to thank my parents for sincere guiding and supportthought all the time in spite of today’s geographical distance between us.
This work was financially supported by the Center for renewable hydrogencycling (HyCycle), Denmark, contract No. 2104-07-0041 and WELTEMPproject under EU Seventh Framework Programme (FP7), grant agreementNo. 212903 [1, 2].
Thanks
Aleksey Nikiforov, DTU, Lyngby, June 2011
Abstract
Proton exchange membrane (PEM) water electrolysis presents an attrac-tive technology allowing to produce hydrogen for further use as a renewableenergy source in the “Hydrogen cycle”. Electrolysis of water steam at ele-vated temperatures has several advantages over the low temperature process.However, at the same time it involves increased demands to dimensional andchemical stability of components against corrosion environment.
Therefore, materials utilized in low temperature PEM electrolyzers cannotbe used in systems operating above 100 °C and new candidates should betested.
The materials in question are those for bipolar plates, gas diffusion lay-ers (GDLs), catalysts and catalyst supports. This work is focused on de-veloping bipolar plate, GDL and catalyst support materials for the anodecompartment of PEM electrolyzers, operating at elevated temperatures.
The thesis starts with Chapter 1, which gives an introduction into the sub-ject and Chapter 2 subsequently presents the theoretical background of thetopic and describes techniques used to characterize catalysts and construc-tion materials.
Chapter 3 presents general principles and overview of materials used forPEM water electrolysis.
Chapter 4 reports results of testing different types of commercially availablestainless steels, Ni-based alloys as well as titanium and tantalum as possiblemetallic bipolar plates and construction materials for HTPEMEC. The cor-rosion resistance was measured under simulated conditions of high temper-ature PEM steam electrolyzer. Steady-state voltammetry was used in com-bination with scanning electron microscopy (SEM) and energy-dispersiveX-ray spectroscopy (EDX) to evaluate the stability of the mentioned mate-rials. It was found that stainless steels were the least resistant to corrosion
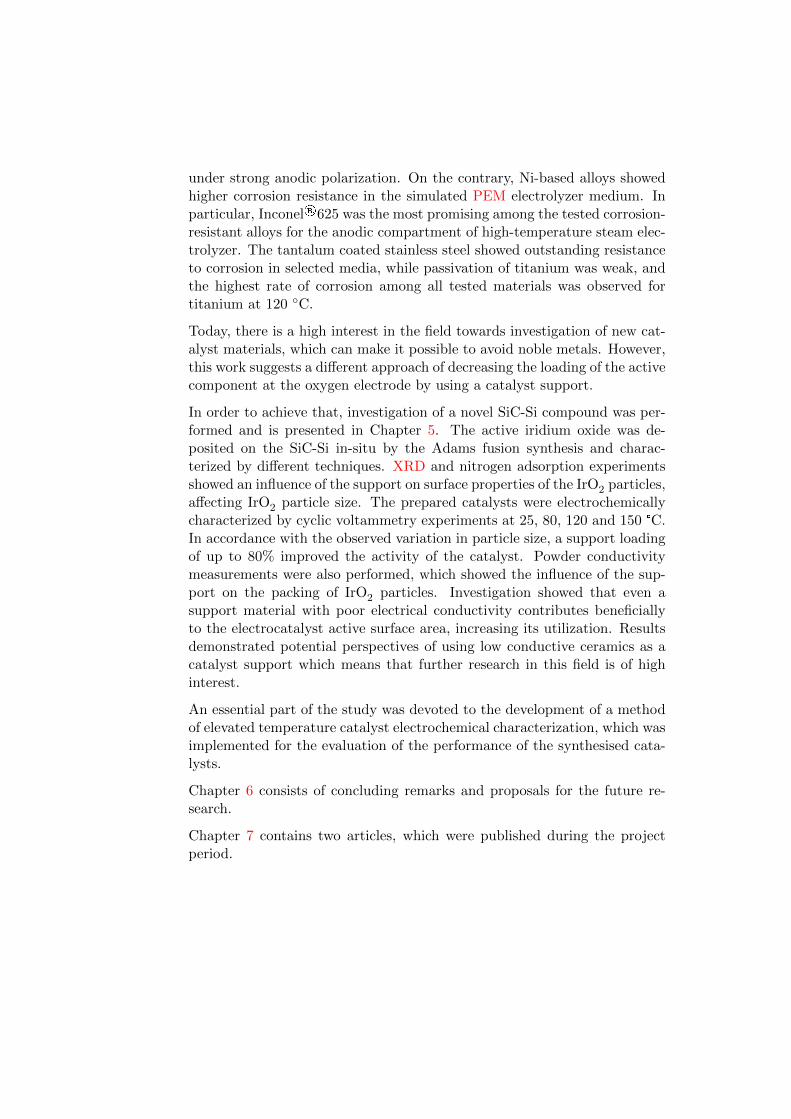
under strong anodic polarization. On the contrary, Ni-based alloys showedhigher corrosion resistance in the simulated PEM electrolyzer medium. Inparticular, Inconel®625 was the most promising among the tested corrosion-resistant alloys for the anodic compartment of high-temperature steam elec-trolyzer. The tantalum coated stainless steel showed outstanding resistanceto corrosion in selected media, while passivation of titanium was weak, andthe highest rate of corrosion among all tested materials was observed fortitanium at 120 C.
Today, there is a high interest in the field towards investigation of new cat-alyst materials, which can make it possible to avoid noble metals. However,this work suggests a different approach of decreasing the loading of the activecomponent at the oxygen electrode by using a catalyst support.
In order to achieve that, investigation of a novel SiC-Si compound was per-formed and is presented in Chapter 5. The active iridium oxide was de-posited on the SiC-Si in-situ by the Adams fusion synthesis and charac-terized by different techniques. XRD and nitrogen adsorption experimentsshowed an influence of the support on surface properties of the IrO2 particles,affecting IrO2 particle size. The prepared catalysts were electrochemicallycharacterized by cyclic voltammetry experiments at 25, 80, 120 and 150 °C.In accordance with the observed variation in particle size, a support loadingof up to 80% improved the activity of the catalyst. Powder conductivitymeasurements were also performed, which showed the influence of the sup-port on the packing of IrO2 particles. Investigation showed that even asupport material with poor electrical conductivity contributes beneficiallyto the electrocatalyst active surface area, increasing its utilization. Resultsdemonstrated potential perspectives of using low conductive ceramics as acatalyst support which means that further research in this field is of highinterest.
An essential part of the study was devoted to the development of a methodof elevated temperature catalyst electrochemical characterization, which wasimplemented for the evaluation of the performance of the synthesised cata-lysts.
Chapter 6 consists of concluding remarks and proposals for the future re-search.
Chapter 7 contains two articles, which were published during the projectperiod.
Dansk Resume
Vandelektrolyse baseret pa polymer elektrolyt membraner (PEM) er enlovende teknologi, som tillader at produktion af brint. Da brint muligvis kanblive en fremtidig energibærer i en “Brint cyklus”. Elektrolyse af vanddampved forhøjede temperaturer har flere fordele i forhold til en lavtemperaturelektrolyse proces. Dog betyder den forøgede temperatur samtidig et øgetkrav til konstruktionsmaterialerne i cellen, f.eks. kommer der et øget kravtil dimensionsstabiliteten og den kemiske stabilitet under de stærkt korro-sive forhold som findes i systemet. Materialer der benyttes i lavtemperaturelektrolyse kan saledes ikke nødvendigvis anvendes i systemer, som virkerved temperaturer over 100 C og nye materialer skal derfor undersøges.
I afhandlingens kapitel 1 gives en generel introduktion til emnet, medensKapitel 2 gennemgar teoretiske aspekter vedrørende elektrokatalyse. Desu-den beskrives de teknikker, der er blevet benyttet til karakterisering afkatalysatorerne og kontruktionsmaterialerne.
I kapitel 3 gennemgas opbygningen af PEM elektrolysatorer, samt litter-aturen vedrørende de forskellige materialer der indgar, dvs. membraner,katalysatorer og konstruktionsmaterialer.
I kapitel 4 fremlæggers resultaterne af korrosionstests af forskellige typerkommercielle rustfrie stalmaterialer, nikkel-baserede legeringer, samt tita-nium og tantal for anvendelse som mulige bipolare plader og konstruktion-smateriale for højtemperatur PEM elektrolyseceller (HTPEMEC). Korro-sionsresistensen er blevet malt under betingelser som simulerer en højtem-peratur PEM dampelektrolysecelle. Steady state voltammetri er blevet an-vendt i kombination med skanning elektron mikroskopi (SEM), og energi dis-persiv røntgen spektroskopi (EDX) er benyttet for at evaluere stabilitetenaf ovenfor nævnte materialer. Det blev fundet at blandt legeringerne varde rustfri staltyper mindst modstandsdygtige overfor korrosion under stærkanodisk polarisering. Af nikkel-legeringerne udviste Inconel 625 størst po-
tentiale som et muligt materiale i højtemperatur elektrolyse celler, da denvar den mest korrosionsbestandig blandt de testede stalmaterialer og nikkel-legeringer.
Tantal-belagt rustfrit stal viste fremragende korrosionsbestandighed ved deundersøgte betingelser, derimod var der ringe passivering af titanium, somda ogsa havde den højeste korrosionshastighed blandt de undersøgte mate-rialer ved 120 C.
I dag er der stor interesse for nye katalysatormaterialer, som kan gøre detmulig at undga ædelmetaller, men der mangler stadig et afgørende gennem-brud. I dette arbejde er der benyttet en anden strategi, nemlig formindskelseaf den anvendte katalysatormængde pa anodesiden, ved brug af et bærema-teriale.
Som mulig anodekatalysatorbærer er her undersøgt et SiC-Si-materiale. Ud-førelsen og præsentationen af dette findes i kapitel 5. Det katalytisk aktiveIrO2 er blevet paført pa SiC-Si ved “Adams fusion synthesis”, og karakteris-eret med forskellige teknikker. XRD og BET malinger viste indflydelse afbærematerialet pa egenskaberne af de dannede IrO2 partikler. De frem-stillede katalysatorer blev karakteriserede gennem cyklisk voltammetri ogandre elektrokemiske metoder ved 25, 80, 120 og 150 C. I overensstem-melse med den observerede variation i partikelstørrelsen, vil en 80 % load-ing af IrO2 pa bærematerialet give en maximal forbedring af aktivitet afkatalysatoren. Malinger af elektrisk ledningsevne af pulverene viste en ind-flydelse af bærematerialet pa pakningen af IrO2 partiklerne. I dette tilfældekunne det konkluderes, at et materiale med darlig elektrisk ledningsevnegodt kunne bidrage til en forøgelse af udnyttelsen af en elektrokatalysator.Resultaterne peger saledes pa fremtidige perspektiver ved brug af lavt ledendekeramiker som bærematerialer, og for videre forskning inden for dette emne.
En væsentlig del af arbejdet har været helliget udvikling af en metode tilelektrokemisk karakterisering af katalysatorer ved forhøjede temperaturer.
Kapitel 6 bestar af afsluttende bemærkninger og forslag til fremtidigt arbe-jde.
Kapitel 7 udgøres af to artikler der er publicerede i løbet af projekt perioden.

Contents
List of Acronyms xi
List of Figures xiii
List of Tables xvii
1 Introduction 1
1.1 Hydrogen and modern society . . . . . . . . . . . . . . . . . . 1
1.2 Hydrogen production . . . . . . . . . . . . . . . . . . . . . . . 2
1.3 Hydrogen and renewable energy . . . . . . . . . . . . . . . . . 4
1.4 Targets of the project . . . . . . . . . . . . . . . . . . . . . . 6
1.4.1 Corrosion tests . . . . . . . . . . . . . . . . . . . . . . 6
1.4.2 Supported catalysts . . . . . . . . . . . . . . . . . . . 7
1.5 List of publications . . . . . . . . . . . . . . . . . . . . . . . . 7
2 Theory and Background 9
2.1 Principles of water electrolysis . . . . . . . . . . . . . . . . . . 9
2.2 Thermodynamics and kinetics . . . . . . . . . . . . . . . . . . 10
2.2.1 Thermodynamics . . . . . . . . . . . . . . . . . . . . . 10
2.2.2 Kinetics . . . . . . . . . . . . . . . . . . . . . . . . . . 11
2.3 Electrode reactions in PEM water electrolysis . . . . . . . . . 19
2.3.1 Hydrogen evolution reaction (HER) . . . . . . . . . . 19
2.3.2 Oxygen evolution reaction (OER) . . . . . . . . . . . 21
2.4 Electrochemical analysis techniques . . . . . . . . . . . . . . . 26
2.4.1 Cyclic voltammetry . . . . . . . . . . . . . . . . . . . 26
2.4.2 Steady state polarisation and corrosion studies . . . . 30
2.5 Physicochemical analysis techniques . . . . . . . . . . . . . . 33
2.5.1 X-Ray powder diffraction (XRD) . . . . . . . . . . . . 33
2.5.2 Scanning electron microscopy (SEM) . . . . . . . . . . 35
2.5.3 Energy dispersive X-ray spectroscopy (EDX) . . . . . 37
2.5.4 Sample preparation for scanning electron microscopy(SEM) and energy dispersive X-ray spectroscopy (EDX)for catalyst powder analysis. . . . . . . . . . . . . . . 38
2.5.5 SediGraph particle size analysis . . . . . . . . . . . . . 39
2.5.6 Brunauer-Emmett-Teller (BET) surface area . . . . . 42
2.6 Electrocatalysts and their properties . . . . . . . . . . . . . . 43
2.6.1 Crystal structure of catalysts . . . . . . . . . . . . . . 43
2.6.2 Electrical conductivity . . . . . . . . . . . . . . . . . . 44
2.6.3 Catalyst support . . . . . . . . . . . . . . . . . . . . . 46
2.6.4 Electrochemical behaviour of IrO2 and RuO2 . . . . . 47
3 High Temperature PEM Water Electrolysis 51
3.1 Principles of polymer electrolyte membrane (PEM) water elec-trolysis . . . . . . . . . . . . . . . . . . . . . . . . . . . . . . . 51
3.2 High temperature PEM electrolysis. Advantages and drawbacks 54
3.3 Construction materials for high temperature PEM water elec-trolysis (bipolar plates and current collectors) . . . . . . . . . 55
3.3.1 Metal coatings and a CVD technique . . . . . . . . . . 57
3.4 Oxygen evolution electrodes (OEEs) . . . . . . . . . . . . . . 58
3.5 Preparation of powder electrocatalysts and films for the OER 60
3.5.1 Adams fusion technique . . . . . . . . . . . . . . . . . 60
3.5.2 Polyol method . . . . . . . . . . . . . . . . . . . . . . 61
3.5.3 Modified polyol method (colloid method) . . . . . . . 61
3.5.4 Catalyst film preparation methods . . . . . . . . . . . 62
3.6 DSA-type electrodes, their preparation and properties . . . . 62
3.7 Electrolytes for water electrolysis . . . . . . . . . . . . . . . . 66
3.7.1 Alkaline electrolyte . . . . . . . . . . . . . . . . . . . . 67
3.7.2 Solid oxide electrolyte . . . . . . . . . . . . . . . . . . 67
3.7.3 Acidic electrolyte and polymer electrolyte membranes 67
3.8 Catalyst supports in PEM systems and possibilities of userefractory ceramics . . . . . . . . . . . . . . . . . . . . . . . . 70
4 Construction Materials for High Temperature PEM Elec-trolyzers 73
4.1 Experimental part . . . . . . . . . . . . . . . . . . . . . . . . 73
4.1.1 Materials and reactants . . . . . . . . . . . . . . . . . 73
4.1.2 Materials and sample preparation . . . . . . . . . . . . 74
4.1.3 Characterisation . . . . . . . . . . . . . . . . . . . . . 74
4.2 Results and discussion . . . . . . . . . . . . . . . . . . . . . . 76
4.3 Conclusions . . . . . . . . . . . . . . . . . . . . . . . . . . . . 86
5 Preparation and Study of IrO2/SiC−Si Supported AnodeCatalyst for High Temperature PEM Steam Electrolyzers 87
5.1 Experimental part . . . . . . . . . . . . . . . . . . . . . . . . 87
5.1.1 Materials and reactants . . . . . . . . . . . . . . . . . 87
5.1.2 SiC-Si/IrO2 powder catalyst preparation . . . . . . . . 88
5.1.3 The electrochemical characterization . . . . . . . . . . 89
5.1.4 Physico-chemical characterization . . . . . . . . . . . . 93
5.2 Results and discussion . . . . . . . . . . . . . . . . . . . . . . 98
5.2.1 Structural and electrical properties . . . . . . . . . . . 98
5.2.2 Electrochemical characterization . . . . . . . . . . . . 112
5.3 Conclusions . . . . . . . . . . . . . . . . . . . . . . . . . . . . 126
6 Concluding Remarks, Perspectives and Further Research 131
x Contents
7 Papers 133
References 158
Appendix 184
A Rietveld Treatment of the XRD Data for the SiC-Si PowderCatalyst Support 185
B Optimisation of the SEM and EDX Sampling for SupportedIrO2/SiC-Si Catalyst 191
B.1 Sample preparation . . . . . . . . . . . . . . . . . . . . . . . . 191
B.2 Results and discussion . . . . . . . . . . . . . . . . . . . . . . 192
B.2.1 SEM analysis . . . . . . . . . . . . . . . . . . . . . . . 192
B.2.2 EDX analysis . . . . . . . . . . . . . . . . . . . . . . . 192
B.3 Conclusion . . . . . . . . . . . . . . . . . . . . . . . . . . . . 197

List of Acronyms
AISI American Iron and Steel Institute
ASTM american society for testing and materials
BET Brunauer-Emmett-Teller
CR corrosion rate
CV cyclic voltammetry
CVD chemical vapour deposition
DSA dimensionally stable anode
EDX energy dispersive X-ray spectroscopy
EMF electromotive force
ESD equivalent spherical diameter
GDL gas diffusion layer
HER hydrogen evolution reaction
HHV higher heating value
HTPEMEC high temperature PEM electrolyzer cell
HTPEMFC high temperature PEM fuel cell
LHV lower heating value
MEA membrane electrode assembly
NIST National Institute of Standards and Technology

xii List of Acronyms
OEE oxygen evolution electrode
OER oxygen evolution reaction
ORR oxygen reduction reaction
PBI Poly[2,2’-(m-phenylene)-5,5’-bibenzimidazole
PEM polymer electrolyte membrane
PEMFC PEM fuel cell
PEMEC PEM electrolyzer cell
PTFE polytetrafluoroethylene
RF radio frequency
SCE standard calomel reference electrode
SCSI strong catalyst support interaction
SEM scanning electron microscopy
SHE standard hydrogen electrode
SOEC solid oxide electrolyzer cell
SOFC solid oxide fuel cell
SPE solid polymer electrolyte
SPEEK sulfonated polyetheretherketone
SPPQ sulfonated polyphenyl quinoxaline
TEM transmission electron microscopy
UPD underpotential deposited
URFC unitized regenerative fuel cell
XRD X-Ray powder diffraction
XRF X-ray fluorescence
List of Figures
1.1 A taste of 20th century: Smog over New York in 1988 [3]. . . 2
1.2 A possible application of hydrogen as an energy vector: theconversion of solar energy into fuel for transportation [4]. . . 5
2.1 The theoretical cell voltage [5] . . . . . . . . . . . . . . . . . . 12
2.2 Plot of the electrode current according to the Butler-Volmerequation. . . . . . . . . . . . . . . . . . . . . . . . . . . . . . 17
2.3 Tafel behaviour at large η [6]. . . . . . . . . . . . . . . . . . . 19
2.4 Volcano plot of the HER for dirrerent metals [7]. . . . . . . . 20
2.5 CV for Pt in 1.0 M H2SO4 solution [8]. . . . . . . . . . . . . . 21
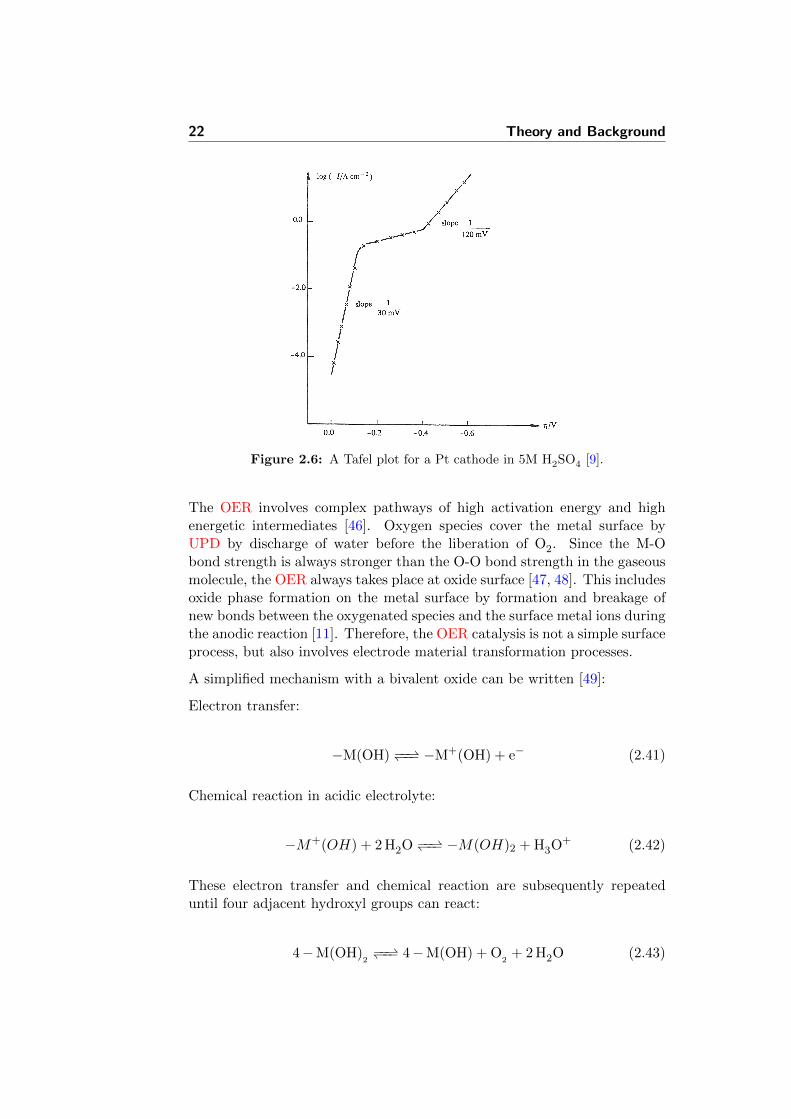
2.6 A Tafel plot for a Pt cathode in 5M H2SO4 [9]. . . . . . . . . 22
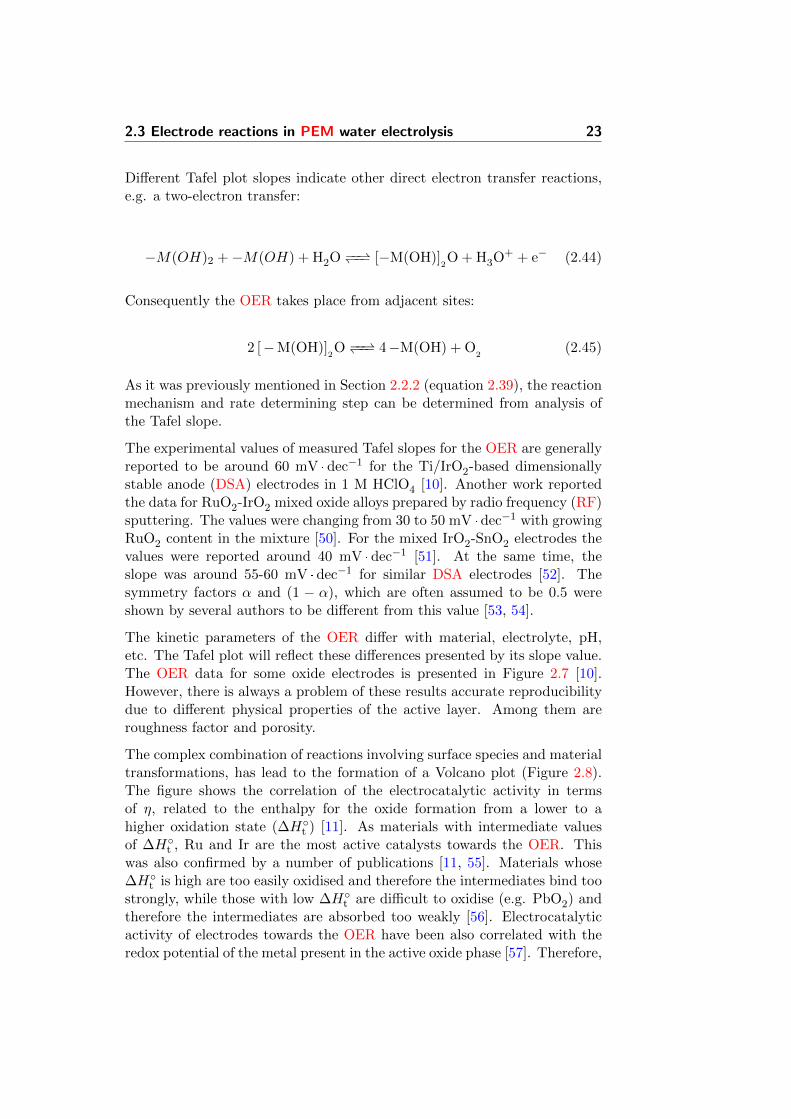
2.7 Schematic overpotential-logi curves for the OER on variousoxides from acid solutions [10]. . . . . . . . . . . . . . . . . . 24
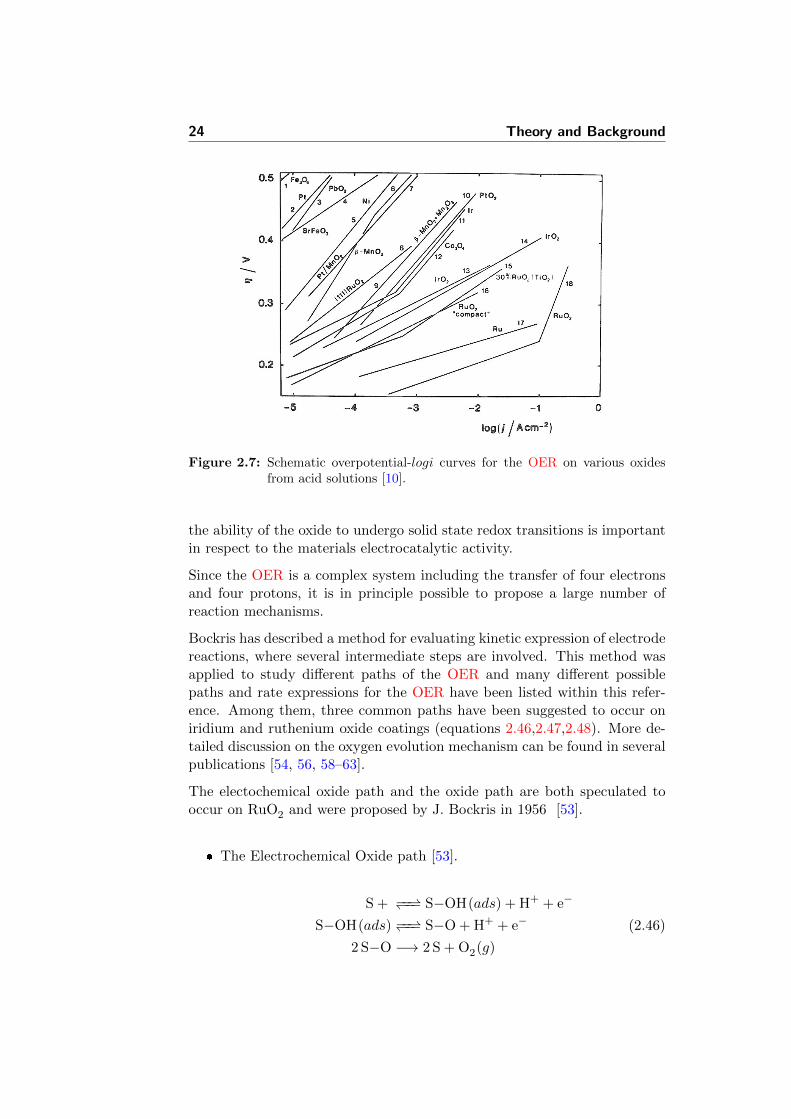
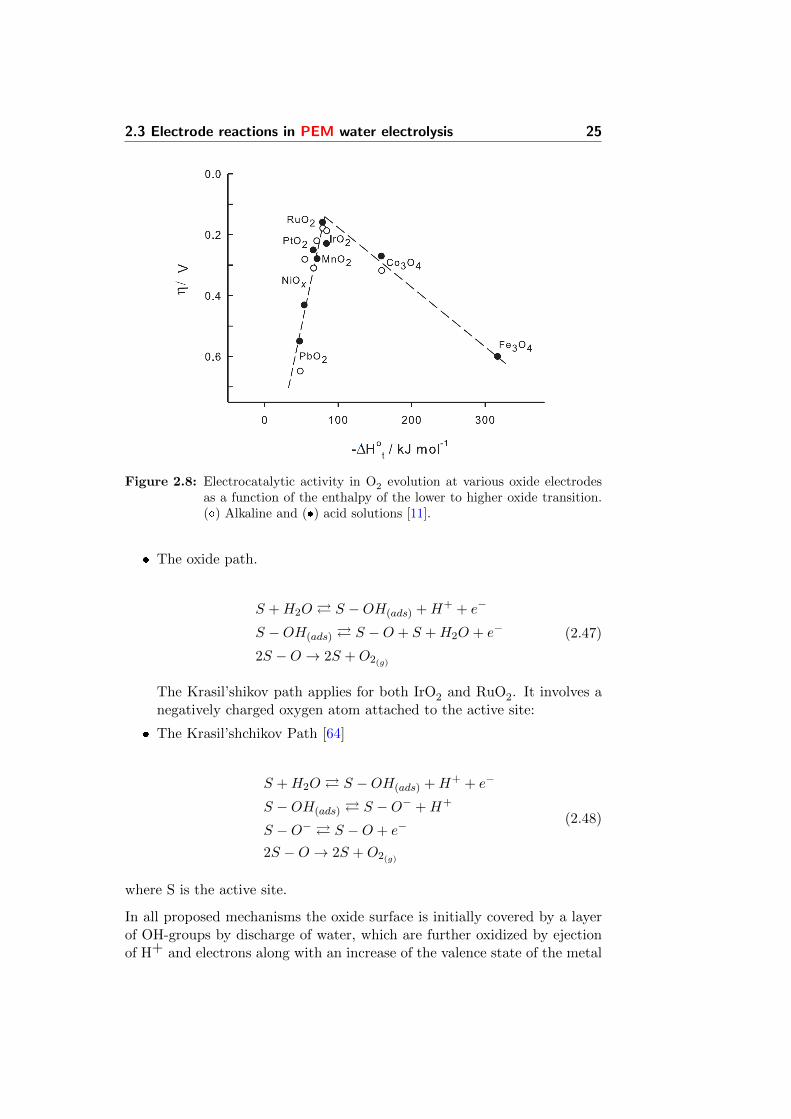
2.8 Electrocatalytic activity in O2 evolution at various oxide elec-trodes as a function of the enthalpy of the lower to higheroxide transition. () Alkaline and () acid solutions [11]. . . . 25
2.9 Typical cyclic voltammogramm and its basic parameters [9]. . 27
2.10 Dependence of the peak potential one the log of potentialsweep rate. . . . . . . . . . . . . . . . . . . . . . . . . . . . . 27
2.11 Dependence of the Ip on the v2, showing the transition fromreversible to irreversible regimes [9]. . . . . . . . . . . . . . . 27
xiv LIST OF FIGURES
2.12 A CV curve of the reversible electrochemical adsorbtion re-action [9]. . . . . . . . . . . . . . . . . . . . . . . . . . . . . . 28
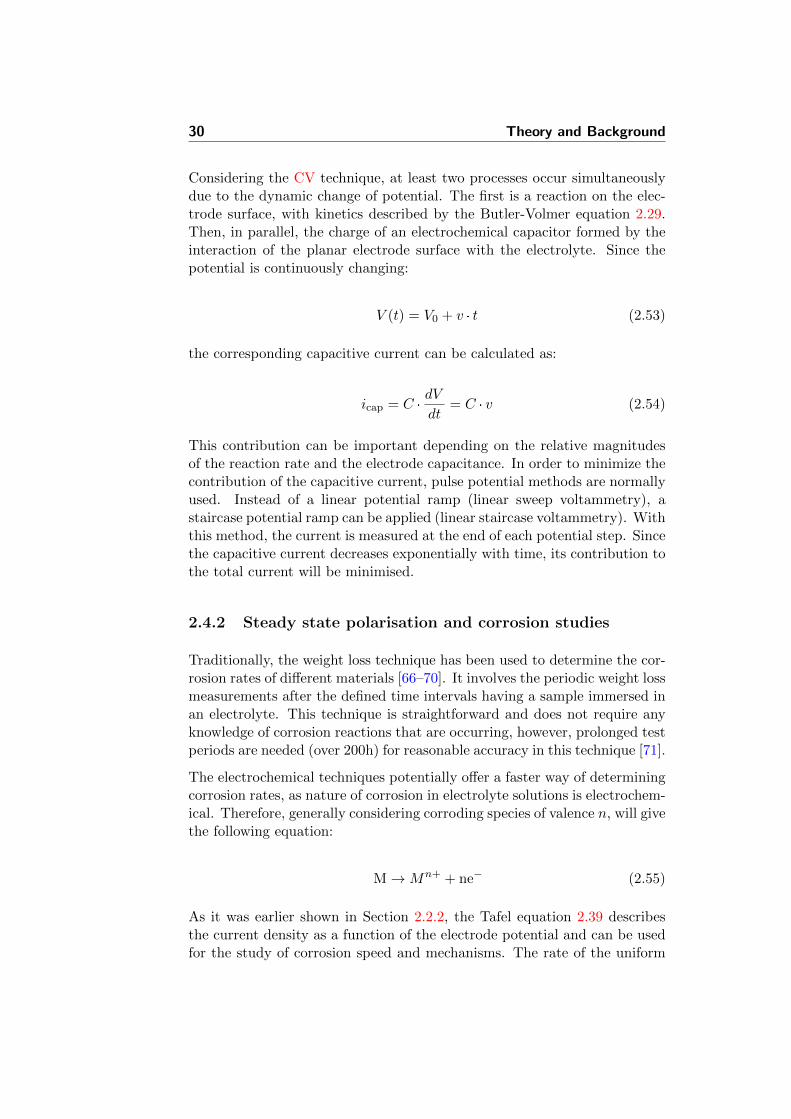
2.13 Hypothetical cathodic and anodic polarization diagram [12]. . 31
2.14 Illustration of Bragg’s Law. . . . . . . . . . . . . . . . . . . . 34
2.15 Scanning electron microscope schematic overview. . . . . . . . 35
2.16 Interaction between an incident beam and a specimen [13]. . 37
2.17 The principle scheme of EDX spectroscopy. . . . . . . . . . . 38
2.18 Dependence of the components of the potential difference ap-plied to an electrolysis cell on current flow [14]. . . . . . . . . 44
2.19 Rutile structure of IrO2 . . . . . . . . . . . . . . . . . . . . . 45
2.20 The idealised structure of carbon-supported platinum cata-lyst for PEMFC [15]. . . . . . . . . . . . . . . . . . . . . . . . 47
2.21 TEM image of a TiC-supported Ir catalyst [16]. The darkestzones are richer in Ir. . . . . . . . . . . . . . . . . . . . . . . . 48
2.22 Cyclic voltammogram of RuxIr1−xO2 for x=1, 0.5 and 0 in 1N H2SO4 [17]. . . . . . . . . . . . . . . . . . . . . . . . . . . . 48
2.23 One-catalytic site model for the OER on Ir surface . . . . . . 50
3.1 The schematic diagram of a PEM electrolyzer cell [18]. . . . . 52
3.2 Commercial Hogen® PEM water electrolyzer unit [19]. . . . . 53
3.3 General structure of Poly[2,2’-(m-phenylene)-5,5’-bibenzimidazole(PBI) [20]. . . . . . . . . . . . . . . . . . . . . . . . . . . . . . 68
4.1 The electrochemical cell. . . . . . . . . . . . . . . . . . . . . . 75
4.2 Potential window for Pt and Au in 85% H3PO4, 120 C, 1mV/s (vs. SHE). . . . . . . . . . . . . . . . . . . . . . . . . . 76
4.3 Tafel plot for AISI 316L in 85% H3PO4, 80 C, 1 mV/s (vs.SHE). . . . . . . . . . . . . . . . . . . . . . . . . . . . . . . . 77
4.4 Tafel plot for AISI 316L in 85% H3PO4, 120 C, 1 mV/s (vs.SHE). . . . . . . . . . . . . . . . . . . . . . . . . . . . . . . . 78
4.5 Tafel plot for AISI 321 in 85% H3PO4, 80 C, 1 mV/s (vs.SHE). . . . . . . . . . . . . . . . . . . . . . . . . . . . . . . . 79
4.6 Tafel plot for AISI 321 in 85% H3PO4, 120 C, 1 mV/s (vs.SHE). . . . . . . . . . . . . . . . . . . . . . . . . . . . . . . . 80
LIST OF FIGURES xv
4.7 Tafel plot for titanium in 85% H3PO4, 120 C, 1 mV/s (vs.SHE). . . . . . . . . . . . . . . . . . . . . . . . . . . . . . . . 81
4.8 Tafel plot for tantalum in 85% H3PO4, 120 C, 1 mV/s (vs.SHE). . . . . . . . . . . . . . . . . . . . . . . . . . . . . . . . 82
4.9 SEM image of the CVD-tantalum coated stainless steel sam-ple. Numbers refer to EDX points and areas measured. . . . 83
4.10 SEM of AISI 321 before(a) and after(b) the electrochemicaltests. Numbers refer to EDX points and areas measured. . . . 84
4.11 SEM of Inconel®625 before(a) and after(b) the electrochem-ical tests. Numbers refer to EDX points and areas measured. 84
5.1 Three-electrode setup designed for controlled potential elec-trolysis study [9]. . . . . . . . . . . . . . . . . . . . . . . . . . 89
5.2 A typical three-electrode cell (provided by Radiometer ana-lytical [21]). . . . . . . . . . . . . . . . . . . . . . . . . . . . . 90
5.3 The electrochemical cell used in cyclic voltammetry (CV) ex-periments . . . . . . . . . . . . . . . . . . . . . . . . . . . . . 95
5.4 A photograph of the electrochemical cell used in CV experi-ments. . . . . . . . . . . . . . . . . . . . . . . . . . . . . . . . 96
5.5 The working electrode, designed for the CV experiments. . . 96
5.6 The electrical conductivity setup. The outermost rods are theanvil and spindle of a micrometer. . . . . . . . . . . . . . . . 97
5.7 A photograph of the setup used for electrical conductivitymeasurements. . . . . . . . . . . . . . . . . . . . . . . . . . . 97
5.8 Cumulative mass percent finer vs. diameter of SiC-Si com-posite, ball milled during different time. . . . . . . . . . . . . 98
5.9 XRD spectrum for IrO2. . . . . . . . . . . . . . . . . . . . . . 99
5.10 Diffractogram of a ball milled SiC-Si support, showing peakassignations for corresponding phases. . . . . . . . . . . . . . 100
5.11 XRD spectra for IrO2, SiC-Si support, and a 50% composite. 101
5.12 XRD spectra for the prepared support powder. . . . . . . . . 102
5.13 Correlation of XRD relative phase signals with nominal pow-der composition. . . . . . . . . . . . . . . . . . . . . . . . . . 104
5.14 Calculated average crystal sizes for different samples. . . . . . 105
xvi LIST OF FIGURES
5.15 BET area trend with sample composition. . . . . . . . . . . . 106
5.16 SEM micrograph of a sample with composition 60% IrO2 and40% SiC-Si support . . . . . . . . . . . . . . . . . . . . . . . . 107
5.17 SEM micrograph for EDX analysis at 5 kV on a gold plate.Sample composition: 60 wt.% IrO2 and 40 wt.% SiC-Si support108
5.18 Evolution of resistance with powder thickness for some samples.109
5.19 Resistivities of all samples, calculated from conductivity val-ues (the latter are presented in Figure 5.20). . . . . . . . . . . 110
5.20 Powder conductivities of all samples. . . . . . . . . . . . . . . 111
5.21 The Tafel plot for a SiC-Si plate. Scan rate 1 mV/s, elec-trolyte: 85% H3PO4, 120 °C. . . . . . . . . . . . . . . . . . . 112
5.22 Comparison of the voltammograms of the support and somesamples. Scan rate 20 mV/s. . . . . . . . . . . . . . . . . . . 113
5.23 CV experiment of the SiC-Si support in H3PO4. Room tem-perature, 20 mV/s. . . . . . . . . . . . . . . . . . . . . . . . . 114
5.24 CV experiments in H3PO4 at room temperature. 20 mV/s.a) pure IrO2. b) 90%. c) 80%. d) 70%. e) 60%. f) 50%. g)40%. h) 30%. i) 20%. j) 10%. . . . . . . . . . . . . . . . . . 115
5.25 CV experiment of pure IrO2 at different scan speeds. Roomtemperature. . . . . . . . . . . . . . . . . . . . . . . . . . . . 116
5.26 Calculated capacitance for different speeds. Pure IrO2, roomtemperature. . . . . . . . . . . . . . . . . . . . . . . . . . . . 117
5.27 CV experiments of several supported catalysts in 85% H3PO4
at room temperature. Scan rate 20 mV/s. . . . . . . . . . . . 118
5.28 Capacitance calculated with charge integration. Same condi-tions as in Figure 5.26. . . . . . . . . . . . . . . . . . . . . . . 119
5.29 Peak current for the IrO2 90% sample at different scan rates. 120
5.30 Integrated anodic peak charge for the IrO2 90% sample atdifferent speeds. H3PO4, room temperature. . . . . . . . . . . 121
5.31 Characteristic i-E curve for the reaction of adsorbed species [22].122
5.32 Integrated peak charge of all samples. 85% H3PO4, roomtemperature. Scan rate 20 mV/s. . . . . . . . . . . . . . . . . 123
5.33 Total capacitance for all sample compositions. 85 % H3PO4,room temperature. . . . . . . . . . . . . . . . . . . . . . . . . 123

LIST OF FIGURES xvii
5.34 CV experiments for the 90% IrO2 sample at different temper-atures in 85% H3PO4. Scan rate 20 mV/s. . . . . . . . . . . . 124
5.35 CV experiments for some samples at 150 C in 85% H3PO4.Scan rate 20 mV/s. . . . . . . . . . . . . . . . . . . . . . . . . 124
5.36 Evolution of capacitance with temperature for some samplesin 85% H3PO4. Scan rate 20 mV/s. . . . . . . . . . . . . . . 125
A.1 Rietveld fitting for the X-Ray powder diffraction (XRD) datafor SiC-Si support. . . . . . . . . . . . . . . . . . . . . . . . . 186
B.1 SEM images on carbon tape support, observed from two dif-ferent detectors . . . . . . . . . . . . . . . . . . . . . . . . . . 192
B.2 SEM images on carbon support at two different voltages . . . 193
B.3 SEM images at low and high magnifications . . . . . . . . . . 194
B.4 SEM images at low voltage for different spot sizes . . . . . . 195
B.5 EDX analysis of the polished gold plate . . . . . . . . . . . . 197

xviii LIST OF FIGURES
List of Tables
2.1 Main components of scanning electron microscope and theirfunctions. . . . . . . . . . . . . . . . . . . . . . . . . . . . . . 36
2.2 Requisites for electrodes for technological applications . . . . 44
2.3 Factors of electrocatalysis at oxides . . . . . . . . . . . . . . . 45
4.1 Alloys chemical composition. . . . . . . . . . . . . . . . . . . 74
4.2 The comparison of corrosion currents (approximate CRs) ofdifferent materials at T=30, 80 and 120 C. . . . . . . . . . . 77
4.3 Measured corrosion potentials for forward and backward po-larisation. . . . . . . . . . . . . . . . . . . . . . . . . . . . . . 82
4.4 EDX data for the CVD-tantalum coated stainless steel sam-ple, in wt.%. . . . . . . . . . . . . . . . . . . . . . . . . . . . 82
4.5 The content of Ni and Ti in the tested alloys. . . . . . . . . . 82
4.6 EDX analysis data of AISI 321 before(a) and after(b) theelectrochemical tests. . . . . . . . . . . . . . . . . . . . . . . . 83
4.7 EDX analysis data of Inconel®625 before(a) and after(b) theelectrochemical tests. . . . . . . . . . . . . . . . . . . . . . . . 85
5.1 Nominal composition of the samples . . . . . . . . . . . . . . 93
5.2 Quantitative analysis of the support by Rietveld treatment ofthe XRD data. . . . . . . . . . . . . . . . . . . . . . . . . . . 99
5.3 Relative intensity of XRD peaks for different powders withdifferent composition. . . . . . . . . . . . . . . . . . . . . . . 103
xx LIST OF TABLES
5.4 Peak width and crystal size of selected peaks for the catalystand the support. . . . . . . . . . . . . . . . . . . . . . . . . . 103
5.5 BET area for all samples. . . . . . . . . . . . . . . . . . . . . 104
5.6 EDX data for SiC-Si/IrO2 sample (SiC-Si:IrO2 = 40:60). . . . 105
5.7 Comparison of properties of IrO2 and SiC-Si compound. . . . 127
B.1 X-ray line energies for C, Si and Ir . . . . . . . . . . . . . . . 193
B.2 EDX on carbon support . . . . . . . . . . . . . . . . . . . . . 194
B.3 EDX data analysis at low and high magnifications . . . . . . 195
B.4 EDX data at low voltage and different spot sizes . . . . . . . 196
B.5 EDX analysis of supported catalyst powder, dispersed in ethanoland applied on gold plate, 5 kV . . . . . . . . . . . . . . . . . 196

Chapter 1
Introduction
“Water, taken in moderation, cannot hurt anybody.”
(Mark Twain)
1.1 Hydrogen and modern society
Energy is a main aspect of modern life. Traditionally, the ever-increasingneed for mechanical work in industrialised societies has led to an intenseinvestment on energy-related research and development. In the last years,there has been an increasing focus on energy technologies. From energysources, going through transformation and distribution, to energy systemmanagement, the prominence of energy in modern society has been reflectedin its comprehensive flourishing.
However, in recent decades, the growing public awareness of the effects ofman on the environment through the different forms of pollution, ecosystemalteration, and lastly, the alteration of climate, have shown the need for adifferent model of interaction with natural systems, where conservation andsustainability are central concepts. In this aspect, much of the responsibilityfor the degradation of environment and human health is attributed to pol-lution sources coming from the energy sector. This way, exhaust emissionsfrom vehicles, as well as emissions from industries and power plants, con-tribute to most of the anthropogenic sources of greenhouse gases, CO2, NOx
and other substances. This state of things requires, thus, the developmentof new energy technologies at all levels.
2 Introduction
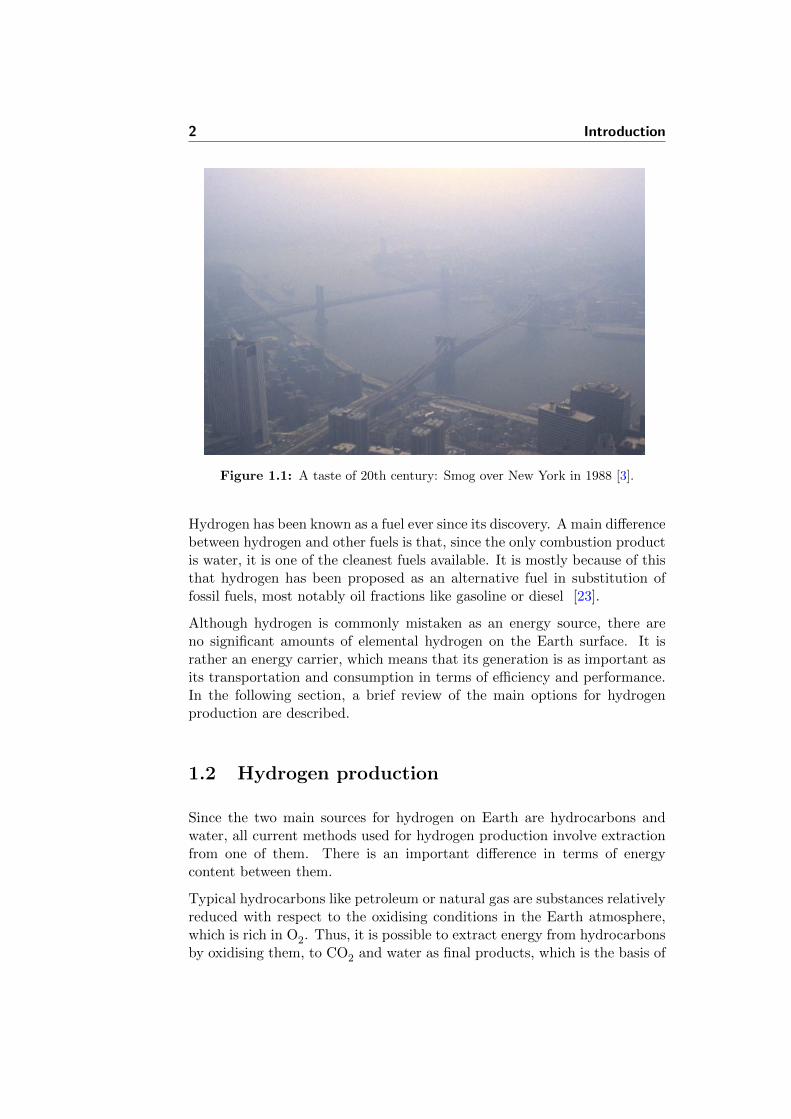
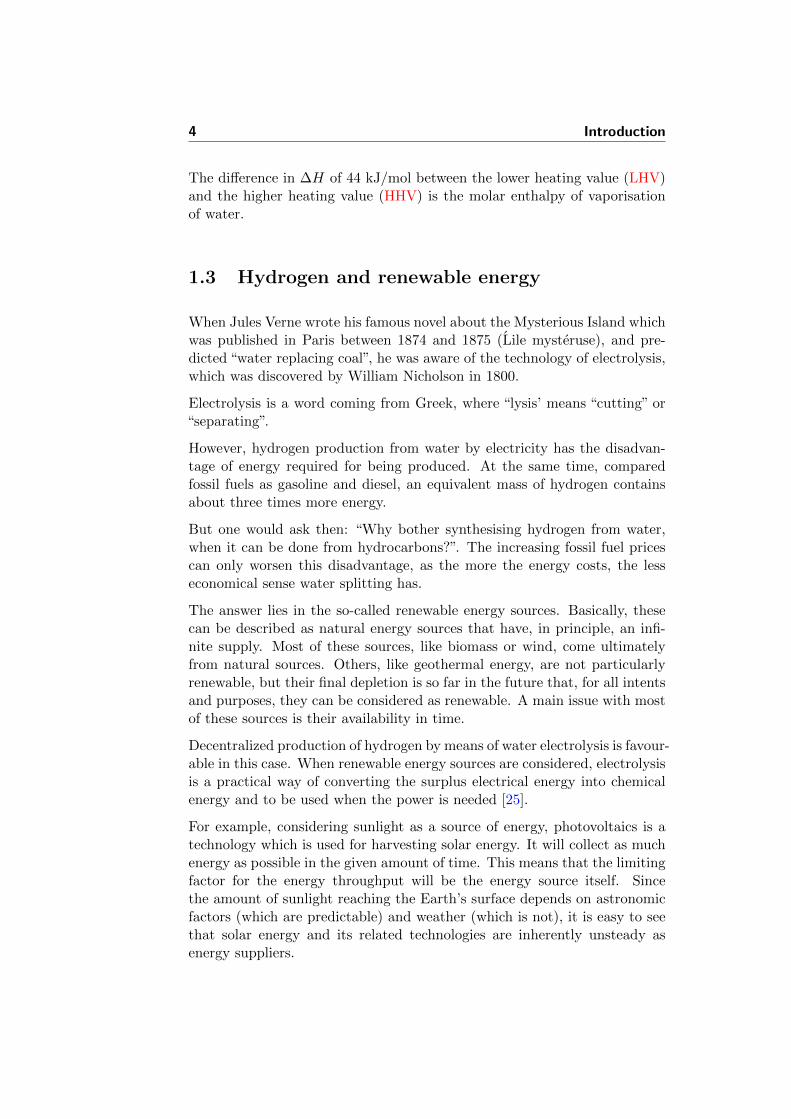
Figure 1.1: A taste of 20th century: Smog over New York in 1988 [3].
Hydrogen has been known as a fuel ever since its discovery. A main differencebetween hydrogen and other fuels is that, since the only combustion productis water, it is one of the cleanest fuels available. It is mostly because of thisthat hydrogen has been proposed as an alternative fuel in substitution offossil fuels, most notably oil fractions like gasoline or diesel [23].
Although hydrogen is commonly mistaken as an energy source, there areno significant amounts of elemental hydrogen on the Earth surface. It israther an energy carrier, which means that its generation is as important asits transportation and consumption in terms of efficiency and performance.In the following section, a brief review of the main options for hydrogenproduction are described.
1.2 Hydrogen production
Since the two main sources for hydrogen on Earth are hydrocarbons andwater, all current methods used for hydrogen production involve extractionfrom one of them. There is an important difference in terms of energycontent between them.
Typical hydrocarbons like petroleum or natural gas are substances relativelyreduced with respect to the oxidising conditions in the Earth atmosphere,which is rich in O2. Thus, it is possible to extract energy from hydrocarbonsby oxidising them, to CO2 and water as final products, which is the basis of
1.2 Hydrogen production 3
the use of fossil fuels as energy sources. The simplest hydrocarbon, methane,burns following the reaction:
CH4 + 2 O2 −→ 2 H2O + CO2, ∆H = −889 kJ/mol (1.1)
The general reaction for burning of hydrocarbons is:
CnH2n+3n+ 1
2O2 −→ (n+1)H2O + nCO2, ∆H<0 (1.2)
The main advantage of the use of hydrocarbons for hydrogen production isthat they do not need an external energy source. The reforming of naturalgas is a good example [24]:
CH4 + H2O −−−− CO + 3 H2, ∆H = 206 kJ/mol (1.3)
CH4 + 2 H2O −−−− CO2 + 4 H2, ∆H = 165 kJ/mol (1.4)
Even though these reactions are very endothermic, the process can be fu-elled with the combustion of more methane or other fuel, making thus thewhole process self-sustained in terms of energy. The absence of the externalenergy need makes this technology more competitive than the ones basedon hydrogen production from water.
Water is, on the contrary, a substance that cannot be further oxidised toextract energy from it. In order to obtain hydrogen from water, energy needsto be spent, according the equation 1.5:
H2O(g/l) −→ H2(g) +1
2O2(g), ∆H > 0 (1.5)
Energy needed to split water from liquid or gas phase is different [15]:
For water steam:
H2O(g) −→ H2(g) +1
2O2(g), ∆H = +242 k J/mol (LHV) (1.6)
For liquid water:
H2O(l) −→ H2(g) +1
2O2(g), ∆H = +286 k J/mol (HHV) (1.7)
4 Introduction
The difference in ∆H of 44 kJ/mol between the lower heating value (LHV)and the higher heating value (HHV) is the molar enthalpy of vaporisationof water.
1.3 Hydrogen and renewable energy
When Jules Verne wrote his famous novel about the Mysterious Island whichwas published in Paris between 1874 and 1875 (Lile mysteruse), and pre-dicted “water replacing coal”, he was aware of the technology of electrolysis,which was discovered by William Nicholson in 1800.
Electrolysis is a word coming from Greek, where “lysis’ means “cutting” or“separating”.
However, hydrogen production from water by electricity has the disadvan-tage of energy required for being produced. At the same time, comparedfossil fuels as gasoline and diesel, an equivalent mass of hydrogen containsabout three times more energy.
But one would ask then: “Why bother synthesising hydrogen from water,when it can be done from hydrocarbons?”. The increasing fossil fuel pricescan only worsen this disadvantage, as the more the energy costs, the lesseconomical sense water splitting has.
The answer lies in the so-called renewable energy sources. Basically, thesecan be described as natural energy sources that have, in principle, an infi-nite supply. Most of these sources, like biomass or wind, come ultimatelyfrom natural sources. Others, like geothermal energy, are not particularlyrenewable, but their final depletion is so far in the future that, for all intentsand purposes, they can be considered as renewable. A main issue with mostof these sources is their availability in time.
Decentralized production of hydrogen by means of water electrolysis is favour-able in this case. When renewable energy sources are considered, electrolysisis a practical way of converting the surplus electrical energy into chemicalenergy and to be used when the power is needed [25].
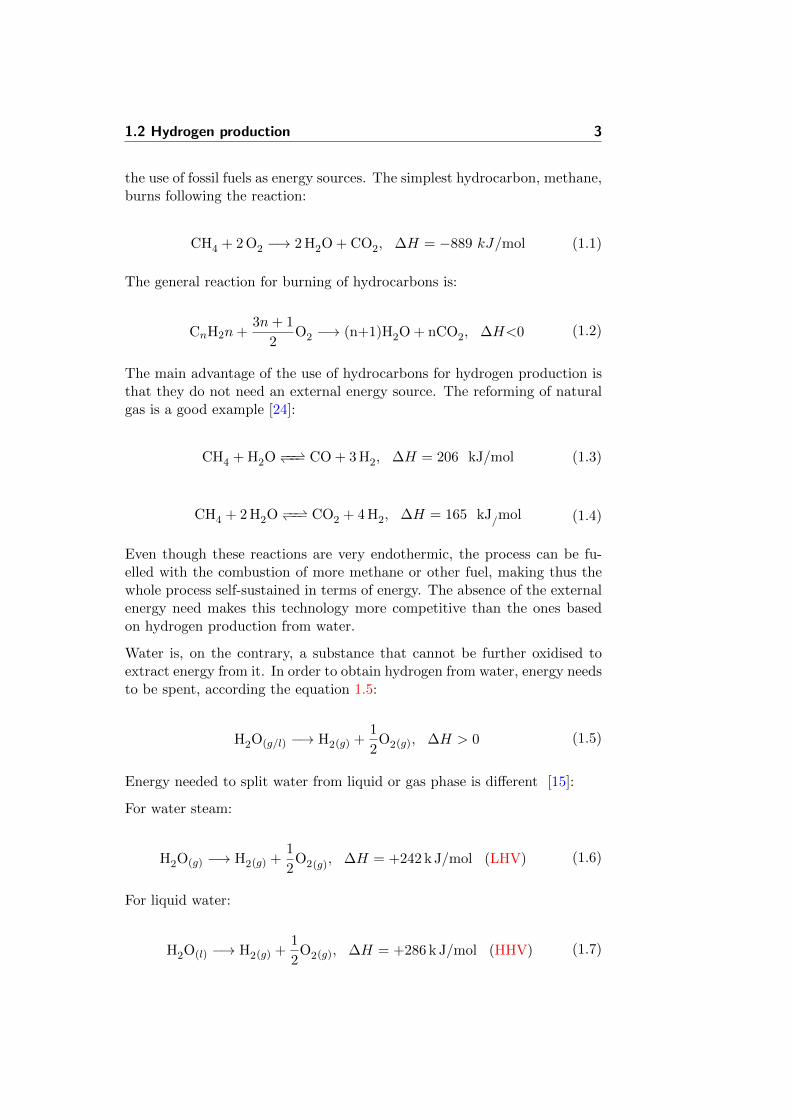
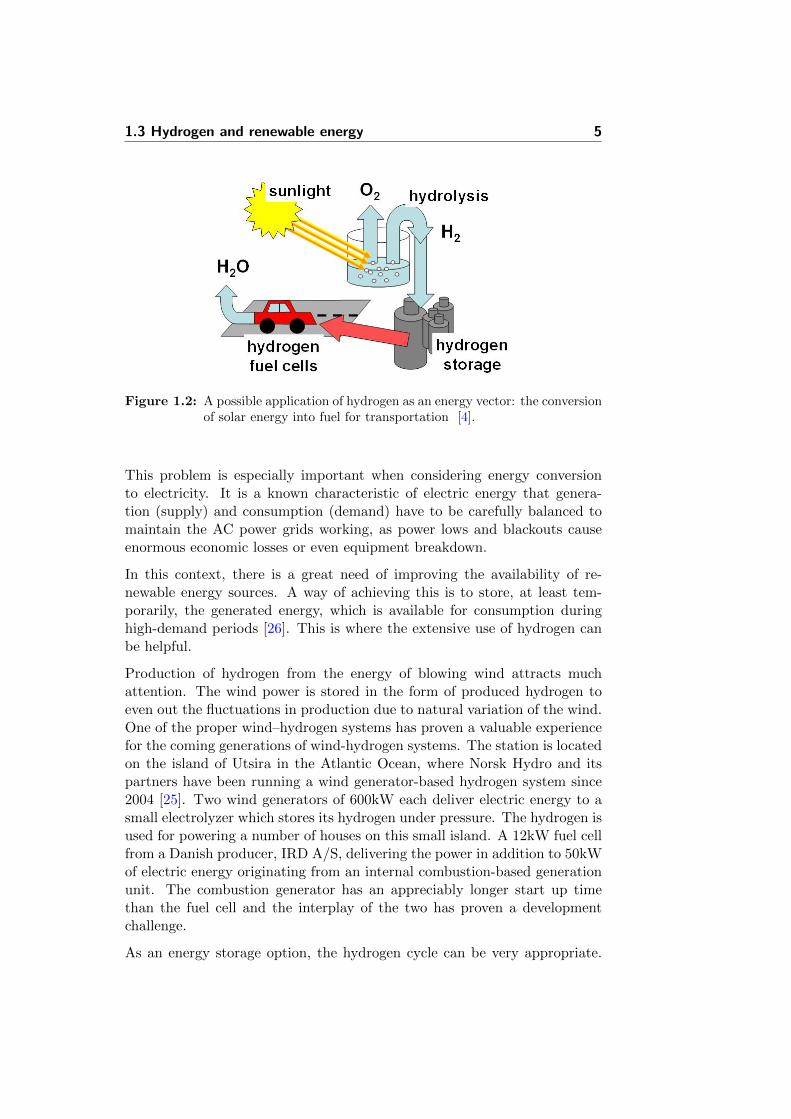
For example, considering sunlight as a source of energy, photovoltaics is atechnology which is used for harvesting solar energy. It will collect as muchenergy as possible in the given amount of time. This means that the limitingfactor for the energy throughput will be the energy source itself. Sincethe amount of sunlight reaching the Earth’s surface depends on astronomicfactors (which are predictable) and weather (which is not), it is easy to seethat solar energy and its related technologies are inherently unsteady asenergy suppliers.
1.3 Hydrogen and renewable energy 5
Figure 1.2: A possible application of hydrogen as an energy vector: the conversionof solar energy into fuel for transportation [4].
This problem is especially important when considering energy conversionto electricity. It is a known characteristic of electric energy that genera-tion (supply) and consumption (demand) have to be carefully balanced tomaintain the AC power grids working, as power lows and blackouts causeenormous economic losses or even equipment breakdown.
In this context, there is a great need of improving the availability of re-newable energy sources. A way of achieving this is to store, at least tem-porarily, the generated energy, which is available for consumption duringhigh-demand periods [26]. This is where the extensive use of hydrogen canbe helpful.
Production of hydrogen from the energy of blowing wind attracts muchattention. The wind power is stored in the form of produced hydrogen toeven out the fluctuations in production due to natural variation of the wind.One of the proper wind–hydrogen systems has proven a valuable experiencefor the coming generations of wind-hydrogen systems. The station is locatedon the island of Utsira in the Atlantic Ocean, where Norsk Hydro and itspartners have been running a wind generator-based hydrogen system since2004 [25]. Two wind generators of 600kW each deliver electric energy to asmall electrolyzer which stores its hydrogen under pressure. The hydrogen isused for powering a number of houses on this small island. A 12kW fuel cellfrom a Danish producer, IRD A/S, delivering the power in addition to 50kWof electric energy originating from an internal combustion-based generationunit. The combustion generator has an appreciably longer start up timethan the fuel cell and the interplay of the two has proven a developmentchallenge.
As an energy storage option, the hydrogen cycle can be very appropriate.
6 Introduction
Therefore, most of long term visions about the use of hydrogen as an energycarrier include electrolysis. It requires an inexpensive reactant, water, andelectricity to split it. From an environmental point of view, hydrogen has alsothe advantage of being a relatively clean energy carrier [23, 27]. The maindrawbacks of hydrogen as compared to similar technologies are the lowerround-trip efficiency, and the high dependency from electricity prices [28].
Polymer electrolyte membrane (PEM) water electrolysis systems offer sev-eral advantages over traditional technologies, including higher energy effi-ciency, higher production rates, and more compact design [29]. This methodof hydrogen production is envisioned in a future society where hydrogen asthe energy carrier is incorporated in an idealized “energy cycle”. In thiscycle, electricity from renewable energy sources is used to electrochemicallysplit water into hydrogen and oxygen [30].
This technology is environmentally friendly and usually possess more com-pact size characteristics and power cost. Besides the high purity of producedgases, there is an opportunity of obtaining compressed gases directly in theinstallation [31].
1.4 Targets of the project
1.4.1 Corrosion tests
The first part of the project has been focused on selection and developmentof construction materials for porous gas diffusion layers and bipolar plates forhigh temperature electrolyzer stack. Intended corrosion studies, evaluatingcorrosion stability of materials in phosphoric acid and temperatures higherthan 100 °C are scarce. The anodic part of the system was in the main focusin this work.
A series of austenitic steels (AISI 316L, AISI 321 and AISI 347) and Ni-based alloys (Hastelloy® C-276, Inconel® 625 and Incoloy® 825), as wellas titanium and tantalum, were tested. In order to characterise the sam-ples, anodic polarisation was performed on electrodes made of the selectedmaterials under experimental conditions, simulating those of an electrolysisstack.
It was found that among tested candidates, the only capable of high resis-tance under these conditions was actually the CVD-tantalum coated stain-less steel.
1.5 List of publications 7
1.4.2 Supported catalysts
Another part of the project involved developing and testing of a catalystsupport material for the oxygen evolution reaction (OER). The supportwas implemented in order to reduce high noble electrocatalyst loading.
Importance of use of a support for the catalyst and further research towardsthe development of more efficient and lasting oxygen evolution electrodes(OEEs) are discussed. Among promising candidates, a commercial SiC-Sicomposite material was finally selected and studied in this work.
One of the main goals was studying of influence of the selected support onthe electrochemical behaviour of active IrO2 catalyst. To accomplish this,supported catalysts with different compositions were prepared, in additionto pure samples of both IrO2 and SiC-Si.
The electrochemical characterisation of the electrodes was performed usingthe CV technique in experimental conditions similar to those found in hightemperature PEM electrolyzer cells (HTPEMECs). Physico-chemical char-acterisation of these materials was done by means of the X-Ray Diffraction,implementing the Scherrer equation for the crystal size calculations. BETsurface area experiments were done for estimating the specific surface areaof the materials, being an important factor in the electrode activity. Powderelectric conductivity measurements were also performed for all samples inorder to assess the effect of the support on conductivity of the electrodes.
1.5 List of publications
The research results have been reported in the following publications:
[32] A. Nikiforov, D. Aili, M.K. Hansen, I. Petrushina, E. Christensen,J.O. Jensen, Q. Li, and N.J. Bjerrum. Water electrolysis at elevatedtemperatures. In Hydrogen + Fuel Cells 2009 conference, posterpresentation, Vancouver, Canada, May 31st - June 3rd 2009.
[33] I.M. Petrushina, A.V. Nikiforov, and N.J. Bjerrum. Corrosion be-havior of highly austenitic stainless steels and ni-based alloys atelevated temperatures in concentrated phosphoric acid solutions.In ICHMS’2009, 11th International Confrence, abstract, oral pre-sentation, pages 162–163, Yalta-Crimia-Ukraine, August 25th-31st2009.
[34] N.J. Bjerrum, I.M. Petrushina, V. Bandur, and A.V. Nikiforov. Wa-ter electrolysis at elevated temperatures. In ICHMS’2009, 11th In-
8 Introduction
ternational Confrence, abstract, oral presentation, pages 842–843,Yalta-Crimia-Ukraine, August 25th-31st 2009.
[35] A.V. Nikiforov, I.M. Petrushina, E. Christensen, N.J. Bjerrum, andA.L. Tomas-Garcıa. Corrosion behaviour of construction materialsfor high temperature water electrolysers. In NMES’2010, 8th In-ternational Symposium, abstract, oral presentarion, pages 16–17,Shanghai, China, July 1-15th 2010.
[36] A.V. Nikiforov, I.M. Petrushina, E. Christensen, A. L. Tomas-Garcıa, and N.J Bjerrum. Corrosion behaviour of constructionmaterials for high temperature steam electrolysers. InternationalJournal of Hydrogen Energy, 36(1):111–119, January 2011. ISSN0360-3199. doi: 10.1016/j.ijhydene.2010.09.023.
[37] A.V. Nikiforov, I.M. Petrushina, E. Christensen, A.L. Tomas-Garcıa, and N.J. Bjerrum. Development of catalyst support foroxygen electrode for PEM steam electrolysers. In 2nd CARISMAinternational conference on progress in MEA materials for mediumand high temperature polymer electrolyte fuel cells, abstract, posterpresentation, page 69, La Grande Motte, France, September 19th-22nd 2010.
[38] A. V. Nikiforov, A. L. Tomas-Garcıa, I. M. Petrushina, E. Chris-tensen, and N. J. Bjerrum. Preparation and study of IrO2/SiC-Sisupported anode catalyst for high temperature PEM steam electrol-ysers. International Journal of Hydrogen Energy, 36(10):5797–5805,May 2011. ISSN 0360-3199. doi: 10.1016/j.ijhydene.2011.02.050.
[39] A. L. Tomas-Garcıa, A.V. Nikiforov, I.M. Petrushina, E. Chris-tensen, and N.J Bjerrum. SiC-Si as a support material for oxygenevolution electrode in PEM steam electrolysers. In Hydrogen + FuelCells 2011 conference, abstract contribution, Vancouver, Canada,May, 15th - 18th 2011.
[40] A. V. Nikiforov, A. L. Tomas-Garcıa, I. M. Petrushina, E. Chris-tensen, and N. J. Bjerrum. SiC-Si as a support material for oxygenevolution electrode in PEM steam electrolysers. In 9th EuropeanSymposium on Electrochemical Engineering (9th ESEE), abstract,oral presentation, page 83, Chania, Crete, Greece, June 19th - 23rd2011.
Chapter 2
Theory and Background
2.1 Principles of water electrolysis
The principles behind water electrolysis include the electrochemical splittingof water into hydrogen at the cathode and oxygen at the anode. From theenergy point of view it is a conversion of an electrical energy to chemicalenergy in the form of hydrogen. The overall chemical reaction of watersplitting process was presented in Section 1.2, equation 1.5.
Conventionally, 3 types of electrolyzers exist, defined by the type of elec-trolyte implemented. Those are alkaline, acidic, and solid oxide electrolyzercell (SOEC). Depending on the type of electrolyzer, different half-reactionstake place at anode and cathode compartments:
Alkaline:
cathode : 2 H2O + 2 e− → H2 + 2 OH− (2.1)
anode : 2 OH− → 1
2O2 + 2 H2O + 2 e− (2.2)
Acidic:
cathode : 2 H+ + 2 e− → H2 (2.3)
anode : H2O→ 1
2O2 + 2 H+ + 2 e− (2.4)
10 Theory and Background
SOEC:
cathode : H2O + 2 e− → H2 + O2− (2.5)
anode : O2− → 1
2O2 + 2 e− (2.6)
The main commercial electrolysis technology used nowadays is the alkalineprocess (equations 2.1, 2.2). The electrolyte is an aqueous alkaline solution,with nickel-based alloys as electrodes. The working temperature is usuallyaround 70-80 . This method has the advantage of long-term performanceand relatively low investment costs. On the other hand, it has the disadvan-tage of having high energy requirements, mainly because of high activationenergies. Another problem is that, being the electrolyte alkaline, the sys-tem needs to be CO2-free, in order to avoid the formation of carbonates inthe cell. Current research on alkaline electrolysis focuses on new electrodematerials, electrolyte additives and designs [41].
Being the only practical todays technology for producing hydrogen fromwater, the main advantage of electrolysis is the high gas purity achieved.However, the high production costs compared to hydrogen from fossil sourcesresults to only around 0.1% of worldwide hydrogen production coming fromwater electrolysis [42].
2.2 Thermodynamics and kinetics
2.2.1 Thermodynamics
Both thermodynamics and reaction kinetics should be considered when elec-trochemically splitting water into hydrogen and oxygen. The Gibbs free en-ergy (∆G) for the net reaction for producing hydrogen and oxygen by waterelectrolysis is given by:
∆G = µH2(g) +1
2µO2(g) − µH
2O(l) = ∆G0 +RTln(pH
2p
1
2O2 ) (2.7)
where µH2(g), µO2(g) and µH2O(l) are the chemical potentials of hydro-
gen, oxygen and water respectively, pH2
and pO2
are the partial pressuresof hydrogen and oxygen respectively and ∆G0 is the Gibbs free energy atstandard conditions (1 atm, 25 °C).
2.2 Thermodynamics and kinetics 11
The energy balance for the cell reaction may also be written, with the energyrequired to break and form molecular bonds and to bring the reactants totheir reference states being the enthalpy (∆H):
∆G = ∆H − T∆S (2.8)
giving (at standard conditions):
Utn = −∆H
nF(2.9)
where Utn is the thermoneutral potential difference. If Ecell > Utn, heat islost from the cell (the cell produces surplus heat). When the cell potentialEcell < Utn the cell absorbs heat from the environment, the produced Jouleheat does not meet the heat demand and the cell cools down if the heat isnot provided by other means.
Efficiencies for the overall reaction 1.5 can also be written with the thermalenergy efficiency defined as:
η∆H =Utn
Ecell× 100% (2.10)
The energy efficiency, based on Gibbs free energy is defined as:
η∆G =Eeq
Ecell× 100% (2.11)
In an electrochemical process the energy efficiency is better expressed byη∆G which represents the efficiency in terms of the available work.
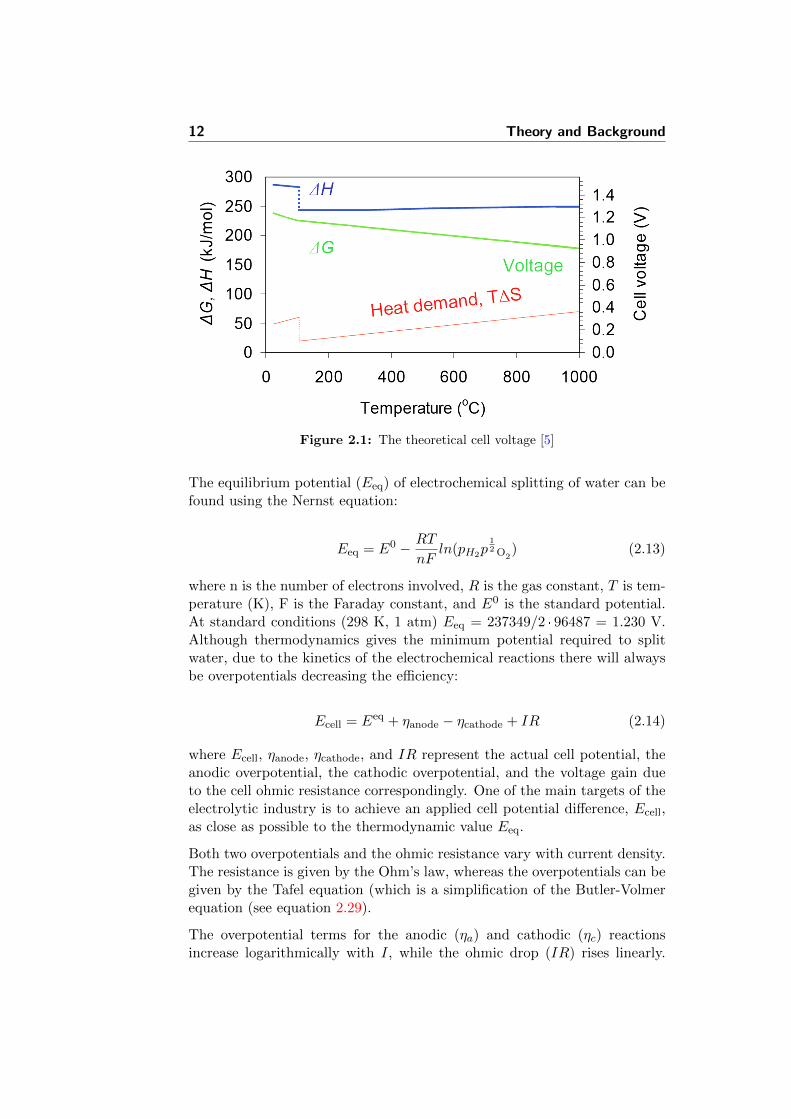
Since water electrolysis becomes increasingly heat consuming with tempera-ture (Figure 2.1), larger portion of the total energy demand can be providedas heat at elevated temperatures. This provides an opportunity to utilizethe Joule heat, that is inevitably produced due to the passage of electricalcurrent through the cell. In this way, the overall electricity consumptionand, thereby, the H2 production price can be reduced.
2.2.2 Kinetics
The equilibrium potential (Eeq) is the theoretical electromotive force (EMF),calculated for the net reaction from the equation 2.12:
Eeq = −∆G
nF(2.12)
12 Theory and Background
Figure 2.1: The theoretical cell voltage [5]
The equilibrium potential (Eeq) of electrochemical splitting of water can befound using the Nernst equation:
Eeq = E0 − RT
nFln(pH2p
12 O2
) (2.13)
where n is the number of electrons involved, R is the gas constant, T is tem-perature (K), F is the Faraday constant, and E0 is the standard potential.At standard conditions (298 K, 1 atm) Eeq = 237349/2 · 96487 = 1.230 V.Although thermodynamics gives the minimum potential required to splitwater, due to the kinetics of the electrochemical reactions there will alwaysbe overpotentials decreasing the efficiency:
Ecell = Eeq + ηanode − ηcathode + IR (2.14)
where Ecell, ηanode, ηcathode, and IR represent the actual cell potential, theanodic overpotential, the cathodic overpotential, and the voltage gain dueto the cell ohmic resistance correspondingly. One of the main targets of theelectrolytic industry is to achieve an applied cell potential difference, Ecell,as close as possible to the thermodynamic value Eeq.
Both two overpotentials and the ohmic resistance vary with current density.The resistance is given by the Ohm’s law, whereas the overpotentials can begiven by the Tafel equation (which is a simplification of the Butler-Volmerequation (see equation 2.29).
The overpotential terms for the anodic (ηa) and cathodic (ηc) reactionsincrease logarithmically with I, while the ohmic drop (IR) rises linearly.
2.2 Thermodynamics and kinetics 13
This means that ohmic problems become more and more important as theelectrolysis rate is increased.
Minimizing of ηa and ηc is a question of electrocatalysis and will be in detailsdiscussed in Section 2.6, while the ohmic drop is in principle a problemof cell engineering and electrolyte, although the two quantities are ofteninterrelated.
A general electrode reaction in an electrochemical cell can be simplified to asimple charge transfer reaction between an oxidized and a reduced species:
O + ne− R (2.15)
where O and R are oxidized and reduced species respectively and n accountsfor the number of electrons transferred per reaction. With no current ap-plied to the cell, potential of the electrode is given by the Nernst equation,introduced previously (2.13):
Eeq = E0 − RT
nFln
(CrCo
)(2.16)
If current is applied to the cell, the net current inet is expressed as a differencebetween cathodic and anodic currents:
inet = ia + ic (2.17)
where ic is cathodic current, which is negative and ia is the anodic currentwhich is positive. The forward reaction rate and the backward reaction ratefor the electrode reaction 2.15 are linked to the current at the electrodes.Furthermore it is assumed that the electrode reaction is a first order reactionand the rate constants are named in a similar way, i.e. kf and kb. Theconcentrations of oxidised and reduced species are functions of distance fromthe electrode (x) and the time (t). The currents at the electrode surfacesare then given by:
ic = −nFAkfCO(0, t) (2.18)
ia = nFAkbCR(0, t) (2.19)
where A is the surface area of the electrode. The net reaction rate is theforward reaction rate plus the reaction rate of the backward reaction. This
14 Theory and Background
results to the extended expression of the net current, which is given by:
inet = ia + ic = nFA(kbCR(0, t)− kfCO(0, t)) (2.20)
A general reference point for a potential at the electrode is E0′ . The potentialreference point is defined as the potential where the forward and backwardrate constants are equal. The cathodic and anodic activation energies aredefined as ∆G‡0c and ∆G‡0a. If the potential changes, so does the energyneeded to reside an electron on the electrode. By introducing the transfercoefficient, α, the Gibbs free energy of the electrodes equals:
∆G‡c = ∆G‡0c − αnF (E − E0′) (2.21)
∆G‡a = ∆G‡0a − (1− α)nF (E − E0′) (2.22)
The transfer coefficient can range from zero to unity. It can be used toexpress the rate constants in case it is assumed that the rate constants canbe described by the Arrhenius equation:
kf = EAfexp
(∆G‡cRT
)(2.23)
kb = EAbexp
(∆G‡aRT
)(2.24)
where EAfand EAb
are the activation energies for the forward and backwardreactions correspondingly. The Arrhenius expression and the equations for∆G‡0c and ∆G‡0a can be combined, giving:
kf = EAfexp
(∆G‡0cRT
)· exp
(−αnFRT
(E − E0′
))(2.25)
kb = EAbexp
(∆G‡0aRT
)· exp
((1− α)nF
RT
(E − E0′
))(2.26)
Assuming that a solution has the same concentration of oxidant and reac-tant. Then E = E0′ and the rate of the forward and the backward reactionare the same, kfCO = kbCR. Since the concentrations, the rate constantsare equal and it is shown that the reference point E0′ is the potential atwhich the rate constants have the same value.
2.2 Thermodynamics and kinetics 15
The entire first part of the equations can be considered as a rate constantat the reference potential E = E0′ and is called the standard rate constantk0.
kf = k0 · exp
(−αnFRT
(E − E0′
))(2.27)
kb = k0 · exp
((1− α)nF
RT
(E − E0′
))(2.28)
This hides the temperature dependence of k0. The values for the rate con-stants can now be inserted into the equation for the total current and thisgives the Butler-Volmer formulation of the electrode kinetics, which is animportant equation linking together electrode current and potential:
(2.29)
i = ia + ic
= nFAk0
(exp
((1− α)nF
RT
(E − E0′
))CR(0, t)
− exp(−αnFRT
(E − E0′
))CO(0, t)
)
Sometimes the Faraday’s constant, the ideal gas constant and the temper-ature is combined to a single symbol “f” hiding the other temperature de-pendence:
f =nF
RT(2.30)
The standard rate constant k0 is a simple measure of the kinetics in theredox reaction. High values of the k0 mean that the reaction reaches equi-librium fast. The reverse is true for low values of k0. The highest measuredvalues are 1-10 cm/s for very simple electron transfer reactions such as thereduction/oxidation of many aromatic compounds as it only requires elec-tron transfer and resolvation.
It is important to remember that the reaction rate constants kf and kb canhave relatively large values even though k0 is small if an extreme potentialrelative to E0′ is applied. The result is that the electrical energy is used toachieve the required activation energy.
When there is no net current at equilibrium there will still be a Faradaicactivity at the electrode, but the anodic and cathodic currents are equalin this case. It can be interpreted as an exchange current, which can be
16 Theory and Background
expressed in the terms of k0. It will be shown below with the Butler-Volmerequation. With no net current the Butler-Volmer formulation gives:
0 = nFAk0(exp((1− α)f(E − E0′))CR(0, t)− exp(−αf(E − E0′))CO(0, t))
⇔nFAk0exp(−αf(E − E0′))CO(0, t)
= nFAkexp((1− α)f(E − E0′))CR(0, t)
(2.31)
The concentration of oxidant and reactant at equilibrium is not a functionof distance hence the concentrations are equal in bulk solution and at thesurface. The equilibrium concentrations are called C∗0 and C∗R:
nFAk0exp(−αf(E − E0′))C∗0 = nFAkexp((1− α)f(E − E0′))C∗R (2.32)
Either side of this equation can be interpreted as the exchange current i0.If the left side of the equation is used then:
i0 = nFAk0C∗0exp(−αf(E − E0′)) (2.33)
The exchange current density (i0) is a material dependent value and is oftenused for comparison of the electrocatalytic activity of different catalysts.The exchange current density is a fundamental property of an electrode’sbehaviour and it can be defined as the rate of reaction at an equilibriumelectrode, expressed in terms of current density. A high exchange currentdensity means that the rate of reaction is fast and this means that thecatalyst is effective.
Instead of using the standard rate constant k0 as a reference, the value ofthe exchange current i0 can be used. The advantage of using the exchangecurrent is that the current can be described as a deviation from the equilib-rium potential which is called the overpotential (η). This eliminates the useof the formal potential E0′ .
Dividing by the expression for the exchange current and eliminating the for-mal potential E0′ , one of the approximations derives the so-called “current-overpotential” equation from the Butler-Volmer formulation [6]:
i = i0(e(1−α)fη − e−αfη) (2.34)
This approximation assumes that the solution is well stirred, or currents arekept so low that the surface concentrations do not differ appreciably from
2.2 Thermodynamics and kinetics 17
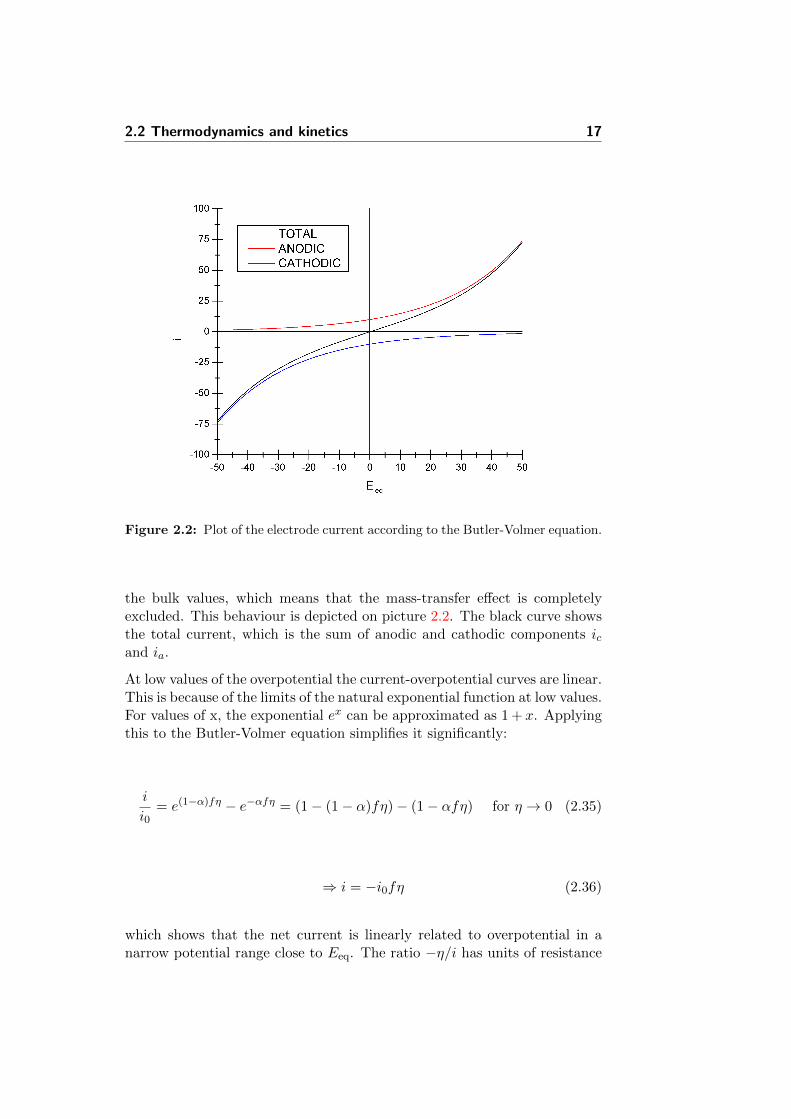
Figure 2.2: Plot of the electrode current according to the Butler-Volmer equation.
the bulk values, which means that the mass-transfer effect is completelyexcluded. This behaviour is depicted on picture 2.2. The black curve showsthe total current, which is the sum of anodic and cathodic components icand ia.
At low values of the overpotential the current-overpotential curves are linear.This is because of the limits of the natural exponential function at low values.For values of x, the exponential ex can be approximated as 1 + x. Applyingthis to the Butler-Volmer equation simplifies it significantly:
i
i0= e(1−α)fη − e−αfη = (1− (1− α)fη)− (1− αfη) for η → 0 (2.35)
⇒ i = −i0fη (2.36)
which shows that the net current is linearly related to overpotential in anarrow potential range close to Eeq. The ratio −η/i has units of resistance
18 Theory and Background
and is called the charge-transfer resistance and is given the symbol Rct:
Rct =RT
nFi0(2.37)
This parameter is the negative reciprocal slope of the current-overpotentialcurve where it passes through the origin (η=0, i=0) and serves as an indexfor kinetic facility and can be evaluated directly in some experiments.
For large values of overpotentials (either negative or positive) the first partof the Butler-Volmer equation can be neglected and simplifies to:
i
i0= e(1−α)fη − e−αfη = −e−αfη for η →∞ (2.38)
If instead the overpotential is isolated it gives:
i
i0= −e−αfη ⇔ −ln
(i
i0
)= −αfη ⇔
η =1
αfln
(i
i0
)⇔ η =
1
αf(lni− lni0)⇔
η =RT
nFα(lni− lni0) = α− (1− x)lni
(2.39)
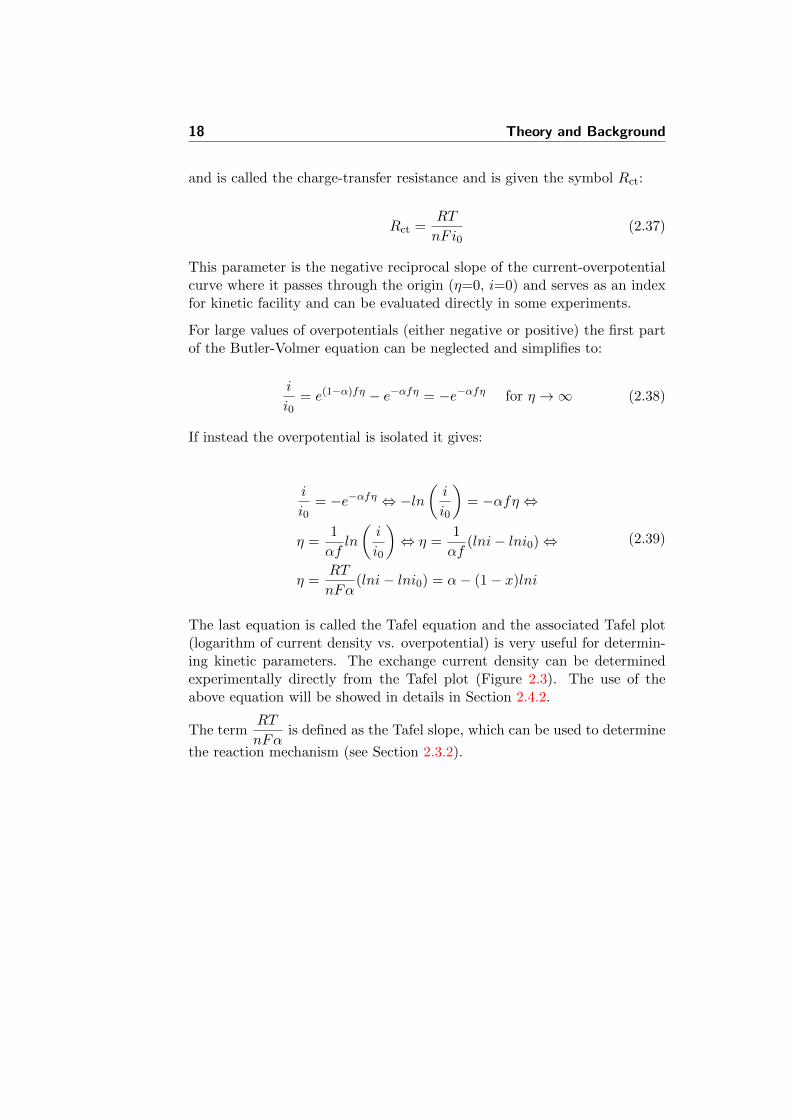
The last equation is called the Tafel equation and the associated Tafel plot(logarithm of current density vs. overpotential) is very useful for determin-ing kinetic parameters. The exchange current density can be determinedexperimentally directly from the Tafel plot (Figure 2.3). The use of theabove equation will be showed in details in Section 2.4.2.
The termRT
nFαis defined as the Tafel slope, which can be used to determine
the reaction mechanism (see Section 2.3.2).
2.3 Electrode reactions in PEM water electrolysis 19
Figure 2.3: Tafel behaviour at large η [6].
2.3 Electrode reactions in PEM water electrolysis
2.3.1 Hydrogen evolution reaction (HER)
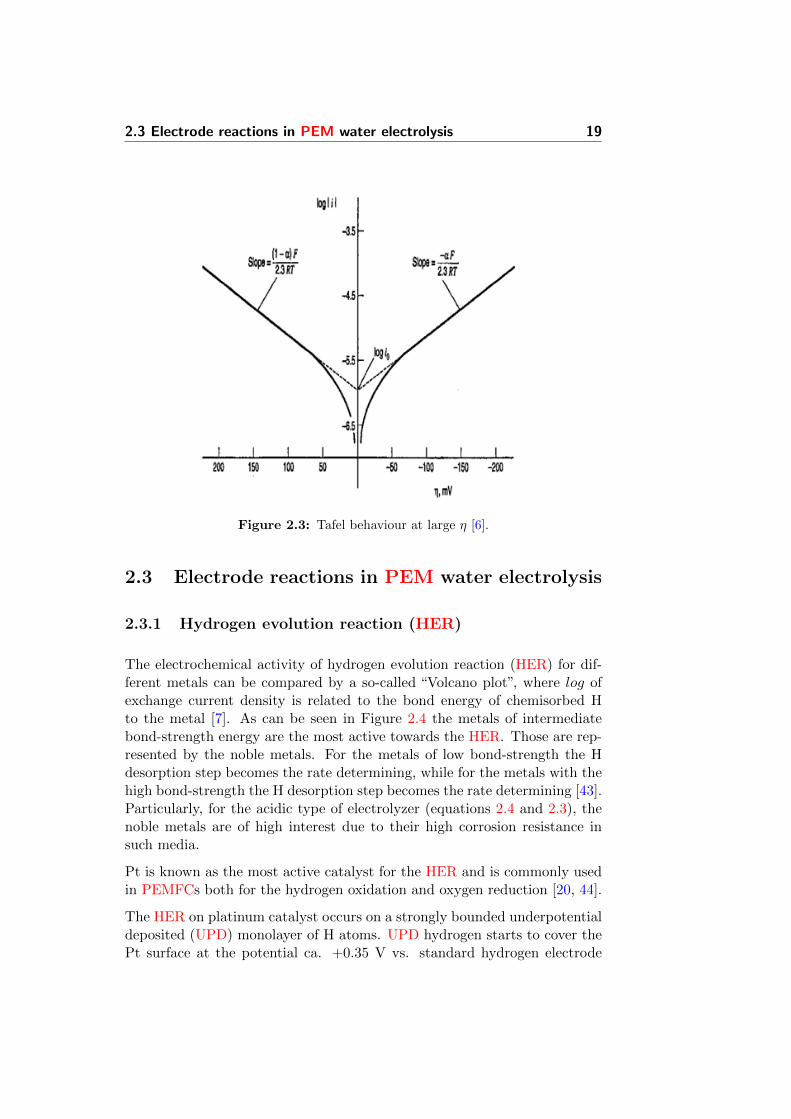
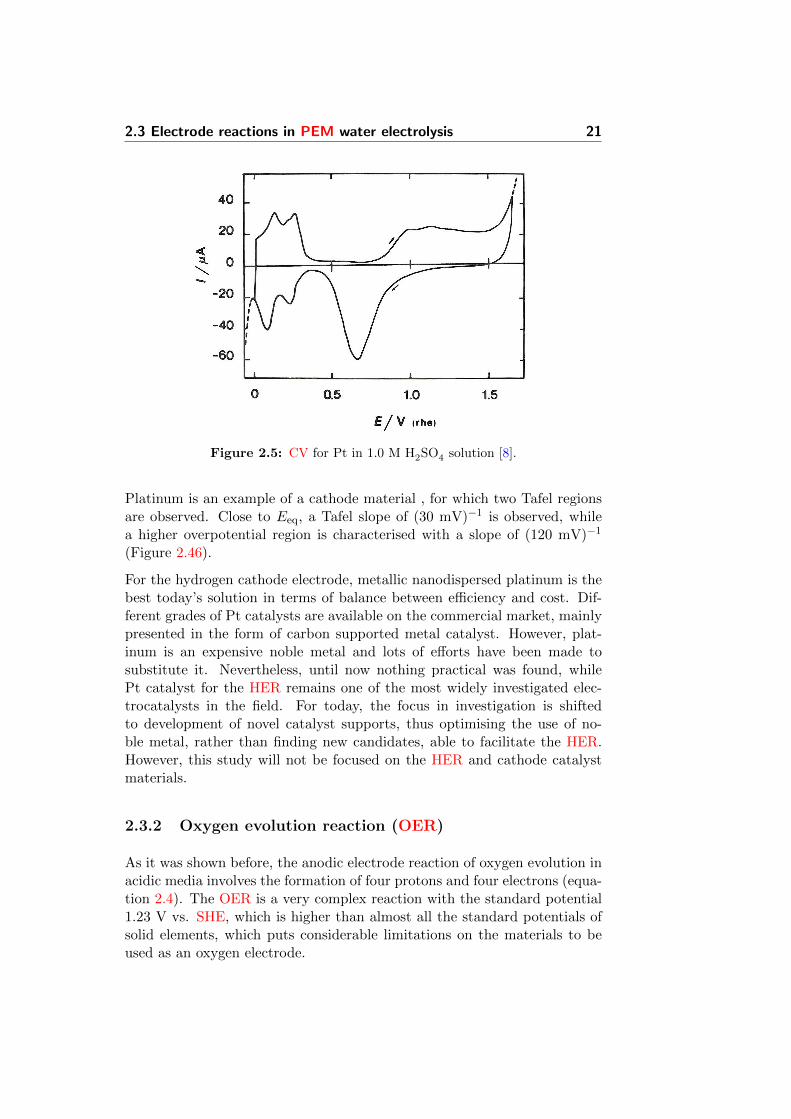
The electrochemical activity of hydrogen evolution reaction (HER) for dif-ferent metals can be compared by a so-called “Volcano plot”, where log ofexchange current density is related to the bond energy of chemisorbed Hto the metal [7]. As can be seen in Figure 2.4 the metals of intermediatebond-strength energy are the most active towards the HER. Those are rep-resented by the noble metals. For the metals of low bond-strength the Hdesorption step becomes the rate determining, while for the metals with thehigh bond-strength the H desorption step becomes the rate determining [43].Particularly, for the acidic type of electrolyzer (equations 2.4 and 2.3), thenoble metals are of high interest due to their high corrosion resistance insuch media.
Pt is known as the most active catalyst for the HER and is commonly usedin PEMFCs both for the hydrogen oxidation and oxygen reduction [20, 44].
The HER on platinum catalyst occurs on a strongly bounded underpotentialdeposited (UPD) monolayer of H atoms. UPD hydrogen starts to cover thePt surface at the potential ca. +0.35 V vs. standard hydrogen electrode
20 Theory and Background
Figure 2.4: Volcano plot of the HER for dirrerent metals [7].
(SHE) and at 0 V vs. SHE the Pt metal surface is fully covered with Hatoms [43].
Based on the thermodynamical considerations, it is not possible for UPD Hto form H2 when E ≥ 0 (in this condition the M-to-H bond energy is higher
than1
2H2 bond. A typical voltammogram of Pt in 1.0 M H2SO4 solution is
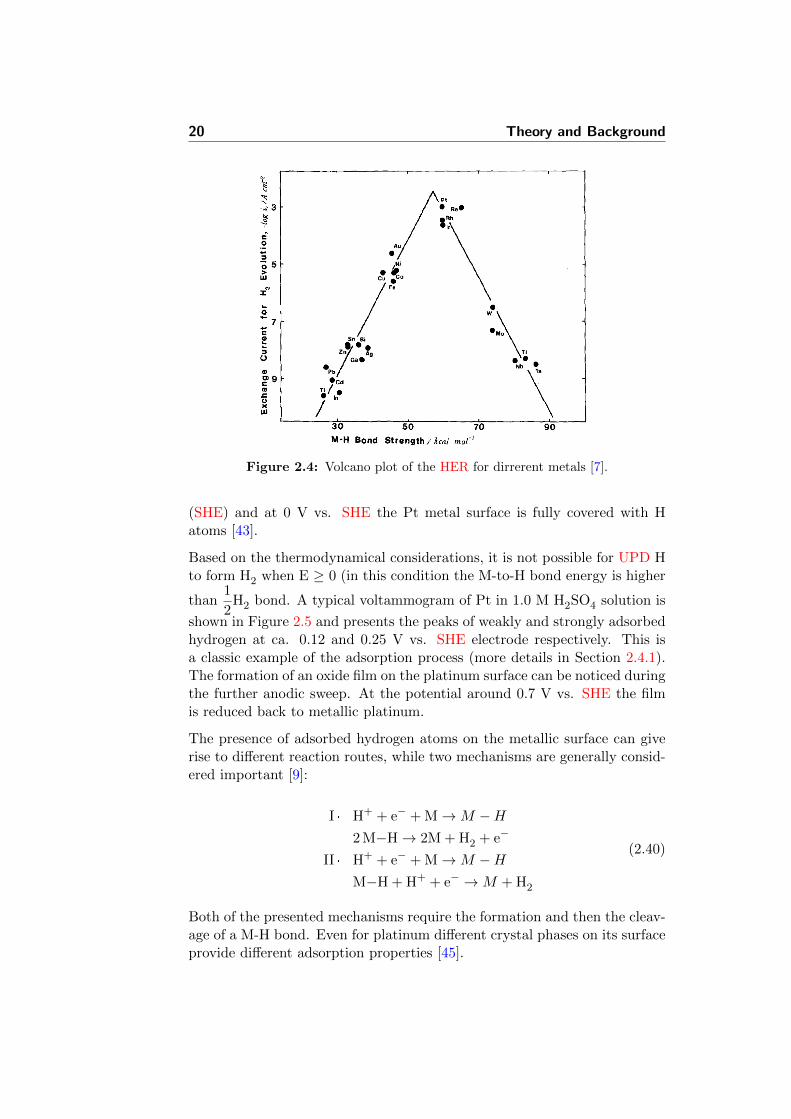
shown in Figure 2.5 and presents the peaks of weakly and strongly adsorbedhydrogen at ca. 0.12 and 0.25 V vs. SHE electrode respectively. This isa classic example of the adsorption process (more details in Section 2.4.1).The formation of an oxide film on the platinum surface can be noticed duringthe further anodic sweep. At the potential around 0.7 V vs. SHE the filmis reduced back to metallic platinum.
The presence of adsorbed hydrogen atoms on the metallic surface can giverise to different reaction routes, while two mechanisms are generally consid-ered important [9]:
I · H+ + e− + M→M −H2 M−H→ 2M + H2 + e−
II · H+ + e− + M→M −HM−H + H+ + e− →M + H2
(2.40)
Both of the presented mechanisms require the formation and then the cleav-age of a M-H bond. Even for platinum different crystal phases on its surfaceprovide different adsorption properties [45].
2.3 Electrode reactions in PEM water electrolysis 21
Figure 2.5: CV for Pt in 1.0 M H2SO4 solution [8].
Platinum is an example of a cathode material , for which two Tafel regionsare observed. Close to Eeq, a Tafel slope of (30 mV)−1 is observed, whilea higher overpotential region is characterised with a slope of (120 mV)−1
(Figure 2.46).
For the hydrogen cathode electrode, metallic nanodispersed platinum is thebest today’s solution in terms of balance between efficiency and cost. Dif-ferent grades of Pt catalysts are available on the commercial market, mainlypresented in the form of carbon supported metal catalyst. However, plat-inum is an expensive noble metal and lots of efforts have been made tosubstitute it. Nevertheless, until now nothing practical was found, whilePt catalyst for the HER remains one of the most widely investigated elec-trocatalysts in the field. For today, the focus in investigation is shiftedto development of novel catalyst supports, thus optimising the use of no-ble metal, rather than finding new candidates, able to facilitate the HER.However, this study will not be focused on the HER and cathode catalystmaterials.
2.3.2 Oxygen evolution reaction (OER)
As it was shown before, the anodic electrode reaction of oxygen evolution inacidic media involves the formation of four protons and four electrons (equa-tion 2.4). The OER is a very complex reaction with the standard potential1.23 V vs. SHE, which is higher than almost all the standard potentials ofsolid elements, which puts considerable limitations on the materials to beused as an oxygen electrode.
22 Theory and Background
Figure 2.6: A Tafel plot for a Pt cathode in 5M H2SO4 [9].
The OER involves complex pathways of high activation energy and highenergetic intermediates [46]. Oxygen species cover the metal surface byUPD by discharge of water before the liberation of O2. Since the M-Obond strength is always stronger than the O-O bond strength in the gaseousmolecule, the OER always takes place at oxide surface [47, 48]. This includesoxide phase formation on the metal surface by formation and breakage ofnew bonds between the oxygenated species and the surface metal ions duringthe anodic reaction [11]. Therefore, the OER catalysis is not a simple surfaceprocess, but also involves electrode material transformation processes.
A simplified mechanism with a bivalent oxide can be written [49]:
Electron transfer:
−M(OH) −−−− −M+(OH) + e− (2.41)
Chemical reaction in acidic electrolyte:
−M+(OH) + 2 H2O −−−− −M(OH)2 + H3O+ (2.42)
These electron transfer and chemical reaction are subsequently repeateduntil four adjacent hydroxyl groups can react:
4−M(OH)2−−−− 4−M(OH) + O
2+ 2 H2O (2.43)
2.3 Electrode reactions in PEM water electrolysis 23
Different Tafel plot slopes indicate other direct electron transfer reactions,e.g. a two-electron transfer:
−M(OH)2 +−M(OH) + H2O −−−− [−M(OH)]2O + H3O+ + e− (2.44)
Consequently the OER takes place from adjacent sites:
2 [−M(OH)]2O −−−− 4−M(OH) + O
2(2.45)
As it was previously mentioned in Section 2.2.2 (equation 2.39), the reactionmechanism and rate determining step can be determined from analysis ofthe Tafel slope.
The experimental values of measured Tafel slopes for the OER are generallyreported to be around 60 mV · dec−1 for the Ti/IrO2-based dimensionallystable anode (DSA) electrodes in 1 M HClO4 [10]. Another work reportedthe data for RuO2-IrO2 mixed oxide alloys prepared by radio frequency (RF)sputtering. The values were changing from 30 to 50 mV · dec−1 with growingRuO2 content in the mixture [50]. For the mixed IrO2-SnO2 electrodes thevalues were reported around 40 mV · dec−1 [51]. At the same time, theslope was around 55-60 mV · dec−1 for similar DSA electrodes [52]. Thesymmetry factors α and (1 − α), which are often assumed to be 0.5 wereshown by several authors to be different from this value [53, 54].
The kinetic parameters of the OER differ with material, electrolyte, pH,etc. The Tafel plot will reflect these differences presented by its slope value.The OER data for some oxide electrodes is presented in Figure 2.7 [10].However, there is always a problem of these results accurate reproducibilitydue to different physical properties of the active layer. Among them areroughness factor and porosity.
The complex combination of reactions involving surface species and materialtransformations, has lead to the formation of a Volcano plot (Figure 2.8).The figure shows the correlation of the electrocatalytic activity in termsof η, related to the enthalpy for the oxide formation from a lower to ahigher oxidation state (∆Ht ) [11]. As materials with intermediate valuesof ∆Ht , Ru and Ir are the most active catalysts towards the OER. Thiswas also confirmed by a number of publications [11, 55]. Materials whose∆Ht is high are too easily oxidised and therefore the intermediates bind toostrongly, while those with low ∆Ht are difficult to oxidise (e.g. PbO2) andtherefore the intermediates are absorbed too weakly [56]. Electrocatalyticactivity of electrodes towards the OER have been also correlated with theredox potential of the metal present in the active oxide phase [57]. Therefore,
24 Theory and Background
Figure 2.7: Schematic overpotential-logi curves for the OER on various oxidesfrom acid solutions [10].
the ability of the oxide to undergo solid state redox transitions is importantin respect to the materials electrocatalytic activity.
Since the OER is a complex system including the transfer of four electronsand four protons, it is in principle possible to propose a large number ofreaction mechanisms.
Bockris has described a method for evaluating kinetic expression of electrodereactions, where several intermediate steps are involved. This method wasapplied to study different paths of the OER and many different possiblepaths and rate expressions for the OER have been listed within this refer-ence. Among them, three common paths have been suggested to occur oniridium and ruthenium oxide coatings (equations 2.46,2.47,2.48). More de-tailed discussion on the oxygen evolution mechanism can be found in severalpublications [54, 56, 58–63].
The electochemical oxide path and the oxide path are both speculated tooccur on RuO2 and were proposed by J. Bockris in 1956 [53].
The Electrochemical Oxide path [53].
S + −−−− S−OH(ads) + H+ + e−
S−OH(ads) −−−− S−O + H+ + e−
2 S−O −→ 2 S + O2(g)
(2.46)
2.3 Electrode reactions in PEM water electrolysis 25
Figure 2.8: Electrocatalytic activity in O2 evolution at various oxide electrodesas a function of the enthalpy of the lower to higher oxide transition.() Alkaline and () acid solutions [11].
The oxide path.
S +H2O S −OH(ads) +H+ + e−
S −OH(ads) S −O + S +H2O + e−
2S −O → 2S +O2(g)
(2.47)
The Krasil’shikov path applies for both IrO2 and RuO2. It involves anegatively charged oxygen atom attached to the active site:
The Krasil’shchikov Path [64]
S +H2O S −OH(ads) +H+ + e−
S −OH(ads) S −O− +H+
S −O− S −O + e−
2S −O → 2S +O2(g)
(2.48)
where S is the active site.
In all proposed mechanisms the oxide surface is initially covered by a layerof OH-groups by discharge of water, which are further oxidized by ejectionof H+ and electrons along with an increase of the valence state of the metal
26 Theory and Background
ion. This creates an unstable higher valence oxide which decomposes withliberation oxygen gas and may require rearrangement of the surface. Thoseoxides which are hardy oxidized further adsorb the intermediate too weaklyand water discharge becomes the rate determining step. Oxides which areoxidized too easily absorb the intermediate too strongly and removal ofoxygenated species becomes a limiting step [11]. As the affinity towardsoxygenated species increase (increasing valence of the metal ion), the ratedetermining step moves further down the route and the Tafel slope decreasesaccordingly. Too high affinity towards oxygenated species will cause therelease of oxygen gas to become rate determining and a limiting currentdensity will be observed [65].
2.4 Electrochemical analysis techniques
2.4.1 Cyclic voltammetry
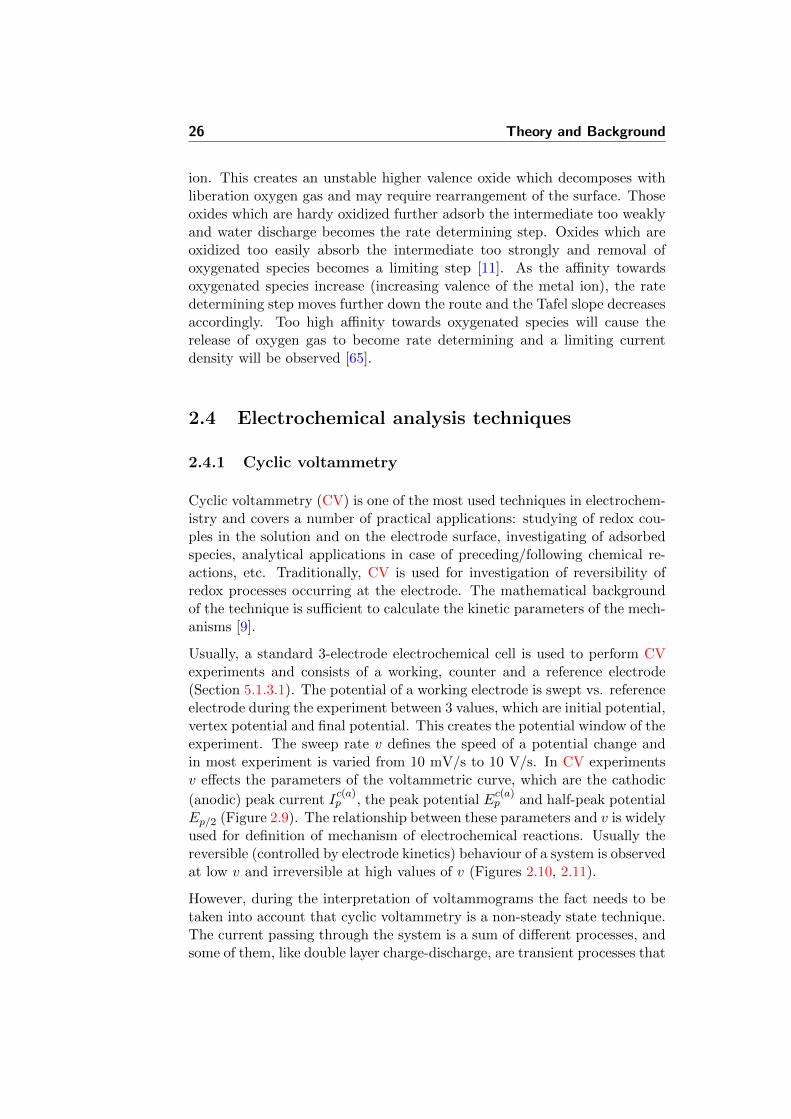
Cyclic voltammetry (CV) is one of the most used techniques in electrochem-istry and covers a number of practical applications: studying of redox cou-ples in the solution and on the electrode surface, investigating of adsorbedspecies, analytical applications in case of preceding/following chemical re-actions, etc. Traditionally, CV is used for investigation of reversibility ofredox processes occurring at the electrode. The mathematical backgroundof the technique is sufficient to calculate the kinetic parameters of the mech-anisms [9].
Usually, a standard 3-electrode electrochemical cell is used to perform CVexperiments and consists of a working, counter and a reference electrode(Section 5.1.3.1). The potential of a working electrode is swept vs. referenceelectrode during the experiment between 3 values, which are initial potential,vertex potential and final potential. This creates the potential window of theexperiment. The sweep rate v defines the speed of a potential change andin most experiment is varied from 10 mV/s to 10 V/s. In CV experimentsv effects the parameters of the voltammetric curve, which are the cathodic
(anodic) peak current Ic(a)p , the peak potential E
c(a)p and half-peak potential
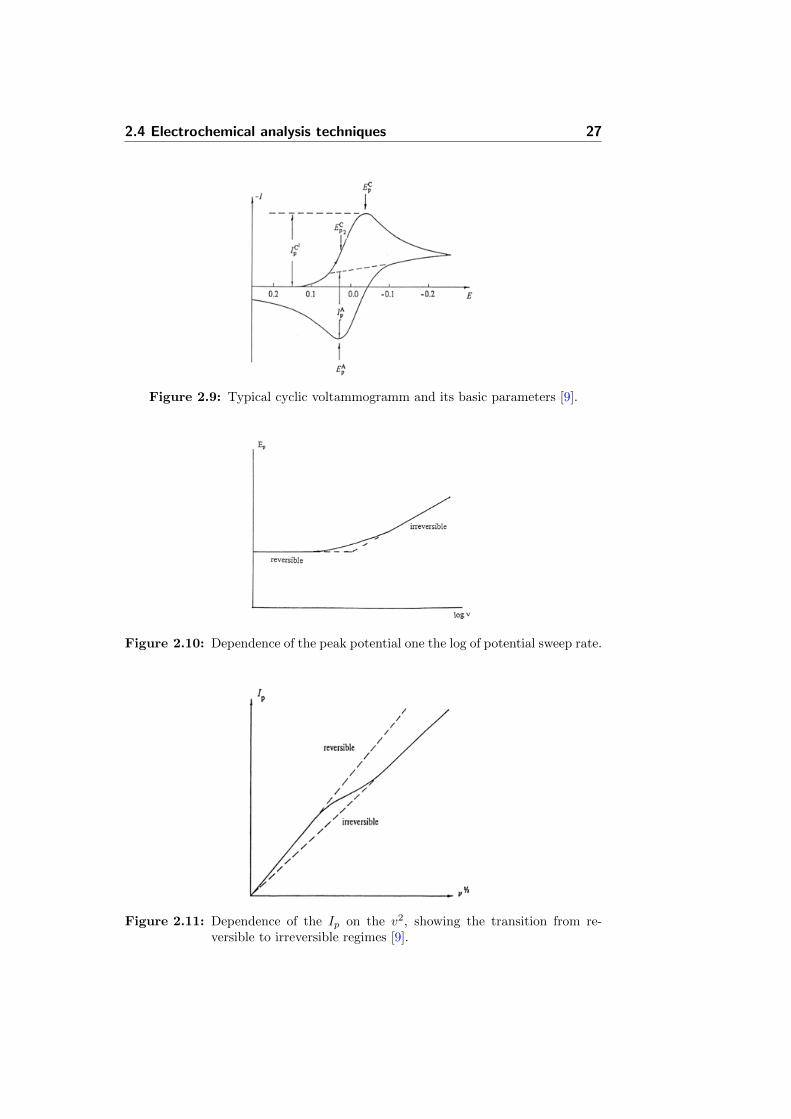
Ep/2 (Figure 2.9). The relationship between these parameters and v is widelyused for definition of mechanism of electrochemical reactions. Usually thereversible (controlled by electrode kinetics) behaviour of a system is observedat low v and irreversible at high values of v (Figures 2.10, 2.11).
However, during the interpretation of voltammograms the fact needs to betaken into account that cyclic voltammetry is a non-steady state technique.The current passing through the system is a sum of different processes, andsome of them, like double layer charge-discharge, are transient processes that
2.4 Electrochemical analysis techniques 27
Figure 2.9: Typical cyclic voltammogramm and its basic parameters [9].
Figure 2.10: Dependence of the peak potential one the log of potential sweep rate.
Figure 2.11: Dependence of the Ip on the v2, showing the transition from re-versible to irreversible regimes [9].
28 Theory and Background
Figure 2.12: A CV curve of the reversible electrochemical adsorbtion reaction [9].
make difficult a straightforward interpretation of the results.
The most applicable techniques in electrocatalysis are the measurement ofintegrated charge and capacitance.
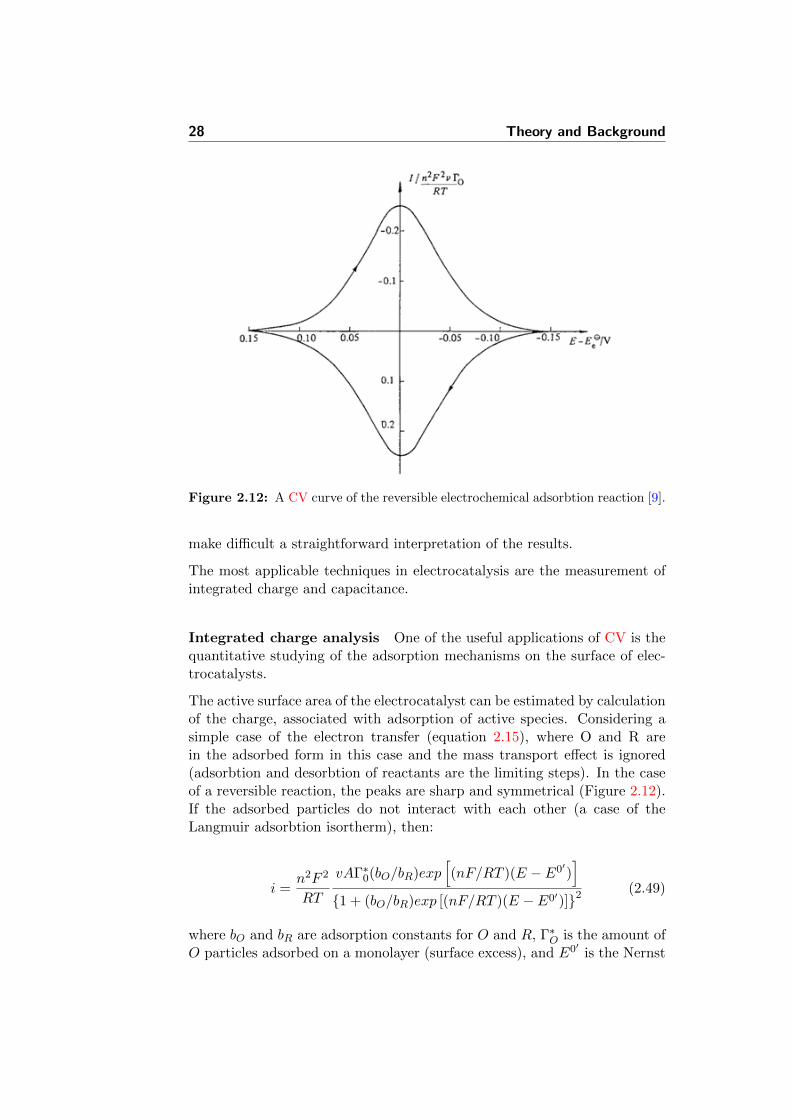
Integrated charge analysis One of the useful applications of CV is thequantitative studying of the adsorption mechanisms on the surface of elec-trocatalysts.
The active surface area of the electrocatalyst can be estimated by calculationof the charge, associated with adsorption of active species. Considering asimple case of the electron transfer (equation 2.15), where O and R arein the adsorbed form in this case and the mass transport effect is ignored(adsorbtion and desorbtion of reactants are the limiting steps). In the caseof a reversible reaction, the peaks are sharp and symmetrical (Figure 2.12).If the adsorbed particles do not interact with each other (a case of theLangmuir adsorbtion isortherm), then:
i =n2F 2
RT
vAΓ∗0(bO/bR)exp[(nF/RT )(E − E0′)
]1 + (bO/bR)exp [(nF/RT )(E − E0′)]2
(2.49)
where bO and bR are adsorption constants for O and R, Γ∗O is the amount ofO particles adsorbed on a monolayer (surface excess), and E0′ is the Nernst
2.4 Electrochemical analysis techniques 29
equilibrium potential of the redox couple O/R.
The peak current density is expressed by:
|ip|=n2F 2Γ0
4RTvA (2.50)
where
Γ0 = | QzF| (2.51)
The peak current in this case is proportional to the sweep rate, v, ratherthan to a square root of v. The peak current and the peak charge Q areproportional to the number of catalyst active sites. The charge of adsorbedspecies can be calculated using the area under polarisation curve:
Q =
∫I · dt
v =dV
dt
dt =1
v· dV
Q =
∫I ·
1
v· dV =
1
v·
∫I · dV
In this case Q should be independent of v.
Capacitance In case if current is proportional to the scan speed, the be-haviour of the electrode is capacitive. The total capacitance of an electrodecan be expressed:
C =Q
V=dQ
dVdQ = C · dV
I =dQ
dt= C ·
dV
dt= C · v
C =I
v
(2.52)
Considering a reversible process having the capacitance nature, no any peaksduring CV are observed.
30 Theory and Background
Considering the CV technique, at least two processes occur simultaneouslydue to the dynamic change of potential. The first is a reaction on the elec-trode surface, with kinetics described by the Butler-Volmer equation 2.29.Then, in parallel, the charge of an electrochemical capacitor formed by theinteraction of the planar electrode surface with the electrolyte. Since thepotential is continuously changing:
V (t) = V0 + v · t (2.53)
the corresponding capacitive current can be calculated as:
icap = C ·dV
dt= C · v (2.54)
This contribution can be important depending on the relative magnitudesof the reaction rate and the electrode capacitance. In order to minimize thecontribution of the capacitive current, pulse potential methods are normallyused. Instead of a linear potential ramp (linear sweep voltammetry), astaircase potential ramp can be applied (linear staircase voltammetry). Withthis method, the current is measured at the end of each potential step. Sincethe capacitive current decreases exponentially with time, its contribution tothe total current will be minimised.
2.4.2 Steady state polarisation and corrosion studies
Traditionally, the weight loss technique has been used to determine the cor-rosion rates of different materials [66–70]. It involves the periodic weight lossmeasurements after the defined time intervals having a sample immersed inan electrolyte. This technique is straightforward and does not require anyknowledge of corrosion reactions that are occurring, however, prolonged testperiods are needed (over 200h) for reasonable accuracy in this technique [71].
The electrochemical techniques potentially offer a faster way of determiningcorrosion rates, as nature of corrosion in electrolyte solutions is electrochem-ical. Therefore, generally considering corroding species of valence n, will givethe following equation:
M→Mn+ + ne− (2.55)
As it was earlier shown in Section 2.2.2, the Tafel equation 2.39 describesthe current density as a function of the electrode potential and can be usedfor the study of corrosion speed and mechanisms. The rate of the uniform
2.4 Electrochemical analysis techniques 31
Figure 2.13: Hypothetical cathodic and anodic polarization diagram [12].
corrosion can be calculated through the exchange current density value di-rectly to the mass loss rates or penetration rates (corrosion rate). It is madeby means of the Tafel extrapolations [12].
The overpotential η is plotted against the logi value through the Tafel plot(Figure 2.13). The linear approximations intersection of two branches of theplot defines the corrosion current (corrosion current density icorr), which isattributed to the main corrosion reaction taking place (equation 2.55). icorr
equals to i0 at Ecorr (equations 2.56-2.61). The values of the measuredexchange current will show the maximum possible rate of corrosion in theseconditions, as the effect of passivation is not taken into account.
32 Theory and Background
for E >> Ecor, i ' ia = i0 · exp
(1− α) ·n ·F
RT· (E − Ecor)
(2.56)
for E << Ecor, i ' ic = −i0 · exp
−α ·n ·FRT
· (E − Ecor)
(2.57)
ln ia = ln i0 +(1− α) ·n ·F
RT· (E − Ecor) (2.58)
ln−ic = ln i0 +−α ·n ·FRT
· (E − Ecor) (2.59)
ln ia = ln−ic → E = Ecor (2.60)
ia(Ecor) = i0 (2.61)
The corrosion potential (Ecorr) (Figure 2.13) is another key parameter whichgives an indication of how inclined to corrode an electrode material is, orwhat is the minimum potential at which it starts to undergo corrosion.
Another alternative is to use the so-called “Cyclic Tafel voltammetry” tech-nique [36, 72]. In this case after the forward polarisation, the scanningdirection is reversed and the corrosion potential and current are measuredfor the “passivated” material.
The corrosion current icorr is found from the slope of the anodic polarisationcurve, presented in the coordinates “electrode potential” vs. “log of thecurrent density”, as shown in Figure 2.13. The detailed ASTM techniquedescription can be found elsewhere [12].
The assumption needs to be taken that the current distributes uniformlyacross the area of the electrode while using this technique. In this case, thecurrent density equals:
icor =Icor
A(2.62)
where A is the exposed specimen area, cm2
Further, the Faraday’s Law is used for the calculation of the corrosion rate.For the penetration rate (corrosion rate (CR)) the derived from Faraday’sLaw equation is:
CR = K1icor
ρEW (2.63)
CR is given is mm/year
icor in µA/cm2
2.5 Physicochemical analysis techniques 33
K1 = 3.27 · 10−3, mm · g/µA · cm · year [73]
ρ is the density of material
EW is considered dimensionless in these calculations
2.5 Physicochemical analysis techniques
2.5.1 X-Ray powder diffraction (XRD)
XRD is one of the oldest and most important analytical techniques usedfor characterisation of catalysts. The technique allows to define differentcrystalline phases in the sample, as well as, to a certain extent, to calculatethe average crystalline size. The technique is based on the interaction ofgenerated X-rays with atoms in regular structures.
If one put a single crystal in X-Ray beam, it will be hard to find any diffrac-tion from it. Diffraction originates from the condition, where crystal has tobe placed in the beam so as to fulfil the Bragg condition for diffraction (theBragg’s law). Another approach is to investigate a powder, which virtuallyhas an infinite number of crystals. In this case, there will always be manycrystals in the right position for diffraction from any of the lattice planes,which is the simple condition for powder diffraction. It is essential usingthis method to have enough crystals to fulfil the condition of always hav-ing enough crystals in position for diffraction for each lattice plane. This iswhy it is also important when a sample needs to be studied with the X-RayDiffraction that a sample is grounded to a properly prepared fine powder(e.g. with mortar and pestle).
The Bragg’s law defines the diffraction angle dependance on the lattice spac-ing and the wavelength (equation 2.64):
nλ = 2d · sin θ (2.64)
where n is an integer number, λ is the wavelength of incoming X-rays, d isthe distance between crystal planes and θ is the diffraction angle betweenincoming X-ray and the lattice (Figure 2.14).
The interaction of an incoming front wave with each atom creates a sec-ondary wave; the interference between different waves creates a diffractionpattern. This effect will be stronger if the wavelength of the radiation is com-parable to the distance between elements of the crystal. Since these distancesare usually in the order of 1A, X-rays are used for crystallographic studies.The wavelength of Cu-Kα X-ray source, λ = 1.5405981 A). Wavelengths of
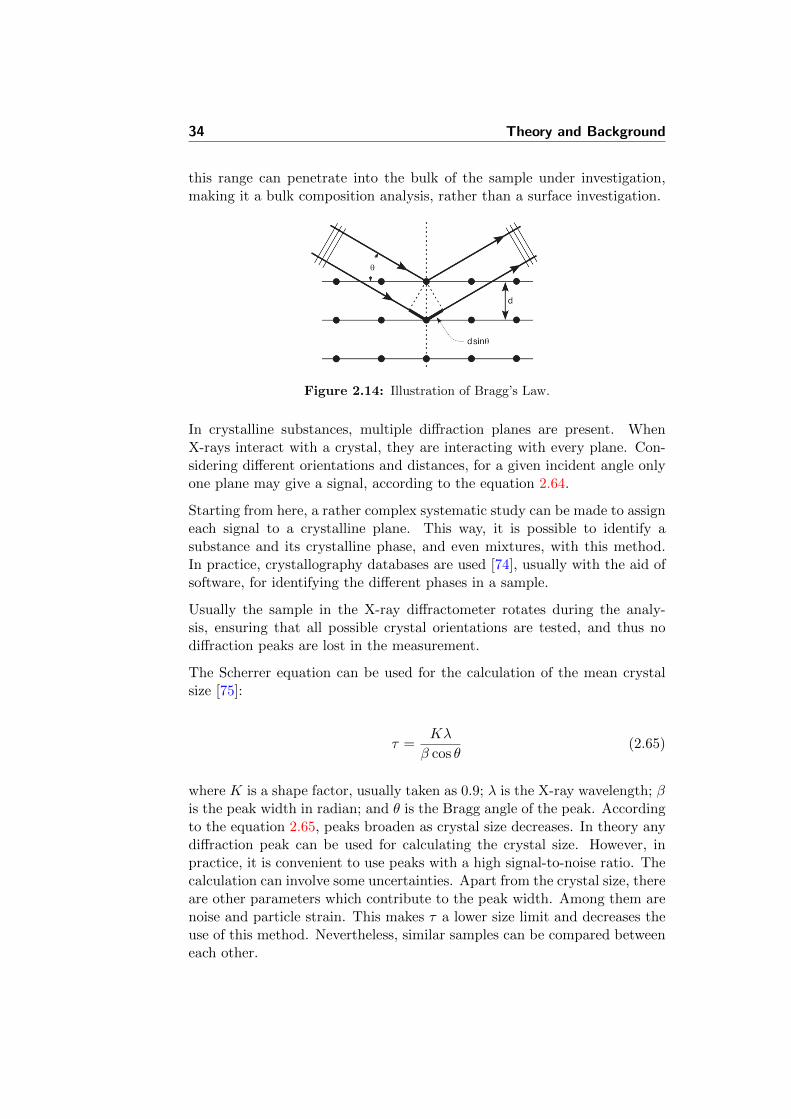
34 Theory and Background
this range can penetrate into the bulk of the sample under investigation,making it a bulk composition analysis, rather than a surface investigation.
Figure 2.14: Illustration of Bragg’s Law.
In crystalline substances, multiple diffraction planes are present. WhenX-rays interact with a crystal, they are interacting with every plane. Con-sidering different orientations and distances, for a given incident angle onlyone plane may give a signal, according to the equation 2.64.
Starting from here, a rather complex systematic study can be made to assigneach signal to a crystalline plane. This way, it is possible to identify asubstance and its crystalline phase, and even mixtures, with this method.In practice, crystallography databases are used [74], usually with the aid ofsoftware, for identifying the different phases in a sample.
Usually the sample in the X-ray diffractometer rotates during the analy-sis, ensuring that all possible crystal orientations are tested, and thus nodiffraction peaks are lost in the measurement.
The Scherrer equation can be used for the calculation of the mean crystalsize [75]:
τ =Kλ
β cos θ(2.65)
where K is a shape factor, usually taken as 0.9; λ is the X-ray wavelength; βis the peak width in radian; and θ is the Bragg angle of the peak. Accordingto the equation 2.65, peaks broaden as crystal size decreases. In theory anydiffraction peak can be used for calculating the crystal size. However, inpractice, it is convenient to use peaks with a high signal-to-noise ratio. Thecalculation can involve some uncertainties. Apart from the crystal size, thereare other parameters which contribute to the peak width. Among them arenoise and particle strain. This makes τ a lower size limit and decreases theuse of this method. Nevertheless, similar samples can be compared betweeneach other.
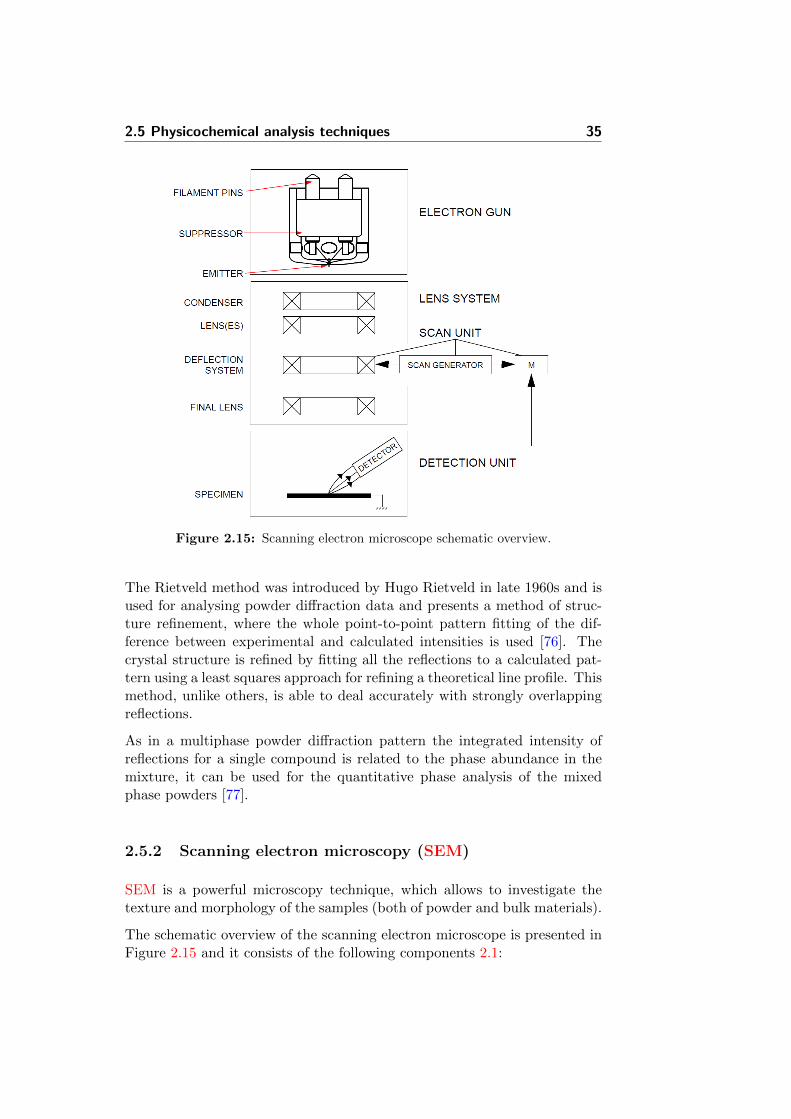
2.5 Physicochemical analysis techniques 35
Figure 2.15: Scanning electron microscope schematic overview.
The Rietveld method was introduced by Hugo Rietveld in late 1960s and isused for analysing powder diffraction data and presents a method of struc-ture refinement, where the whole point-to-point pattern fitting of the dif-ference between experimental and calculated intensities is used [76]. Thecrystal structure is refined by fitting all the reflections to a calculated pat-tern using a least squares approach for refining a theoretical line profile. Thismethod, unlike others, is able to deal accurately with strongly overlappingreflections.
As in a multiphase powder diffraction pattern the integrated intensity ofreflections for a single compound is related to the phase abundance in themixture, it can be used for the quantitative phase analysis of the mixedphase powders [77].
2.5.2 Scanning electron microscopy (SEM)
SEM is a powerful microscopy technique, which allows to investigate thetexture and morphology of the samples (both of powder and bulk materials).
The schematic overview of the scanning electron microscope is presented inFigure 2.15 and it consists of the following components 2.1:
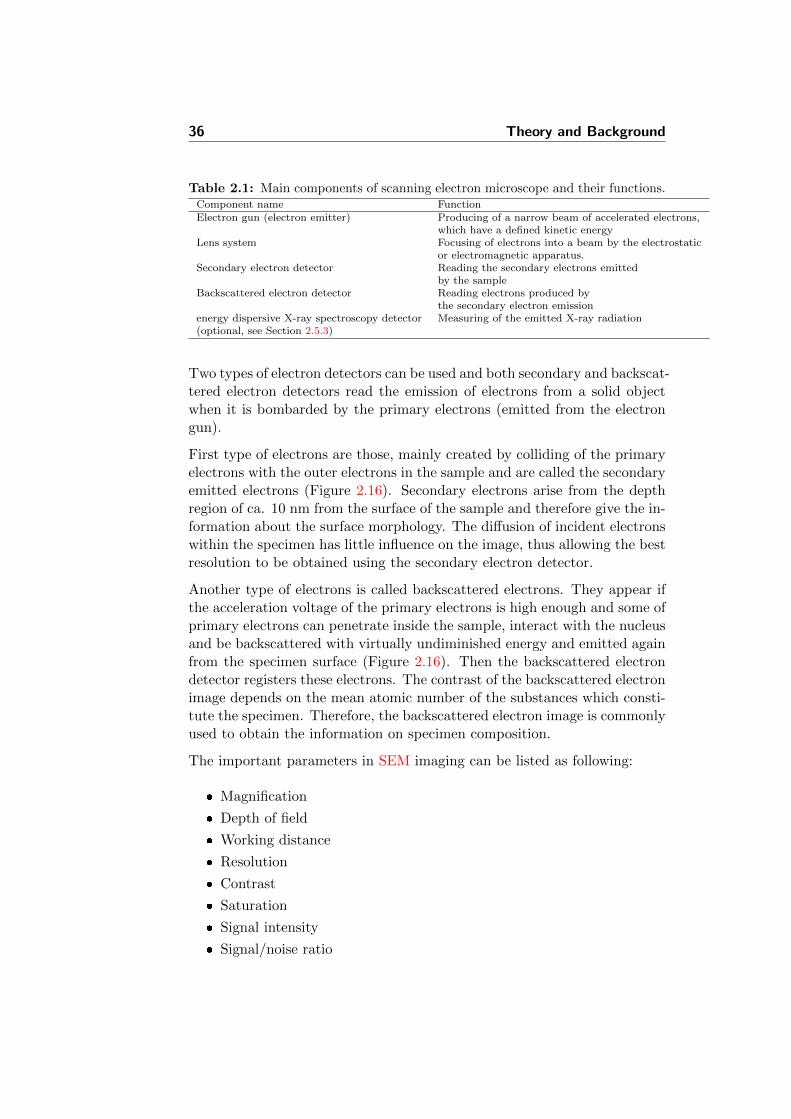
36 Theory and Background
Table 2.1: Main components of scanning electron microscope and their functions.Component name FunctionElectron gun (electron emitter) Producing of a narrow beam of accelerated electrons,
which have a defined kinetic energyLens system Focusing of electrons into a beam by the electrostatic
or electromagnetic apparatus.Secondary electron detector Reading the secondary electrons emitted
by the sampleBackscattered electron detector Reading electrons produced by
the secondary electron emissionenergy dispersive X-ray spectroscopy detector Measuring of the emitted X-ray radiation(optional, see Section 2.5.3)
Two types of electron detectors can be used and both secondary and backscat-tered electron detectors read the emission of electrons from a solid objectwhen it is bombarded by the primary electrons (emitted from the electrongun).
First type of electrons are those, mainly created by colliding of the primaryelectrons with the outer electrons in the sample and are called the secondaryemitted electrons (Figure 2.16). Secondary electrons arise from the depthregion of ca. 10 nm from the surface of the sample and therefore give the in-formation about the surface morphology. The diffusion of incident electronswithin the specimen has little influence on the image, thus allowing the bestresolution to be obtained using the secondary electron detector.
Another type of electrons is called backscattered electrons. They appear ifthe acceleration voltage of the primary electrons is high enough and some ofprimary electrons can penetrate inside the sample, interact with the nucleusand be backscattered with virtually undiminished energy and emitted againfrom the specimen surface (Figure 2.16). Then the backscattered electrondetector registers these electrons. The contrast of the backscattered electronimage depends on the mean atomic number of the substances which consti-tute the specimen. Therefore, the backscattered electron image is commonlyused to obtain the information on specimen composition.
The important parameters in SEM imaging can be listed as following:
Magnification
Depth of field
Working distance
Resolution
Contrast
Saturation
Signal intensity
Signal/noise ratio
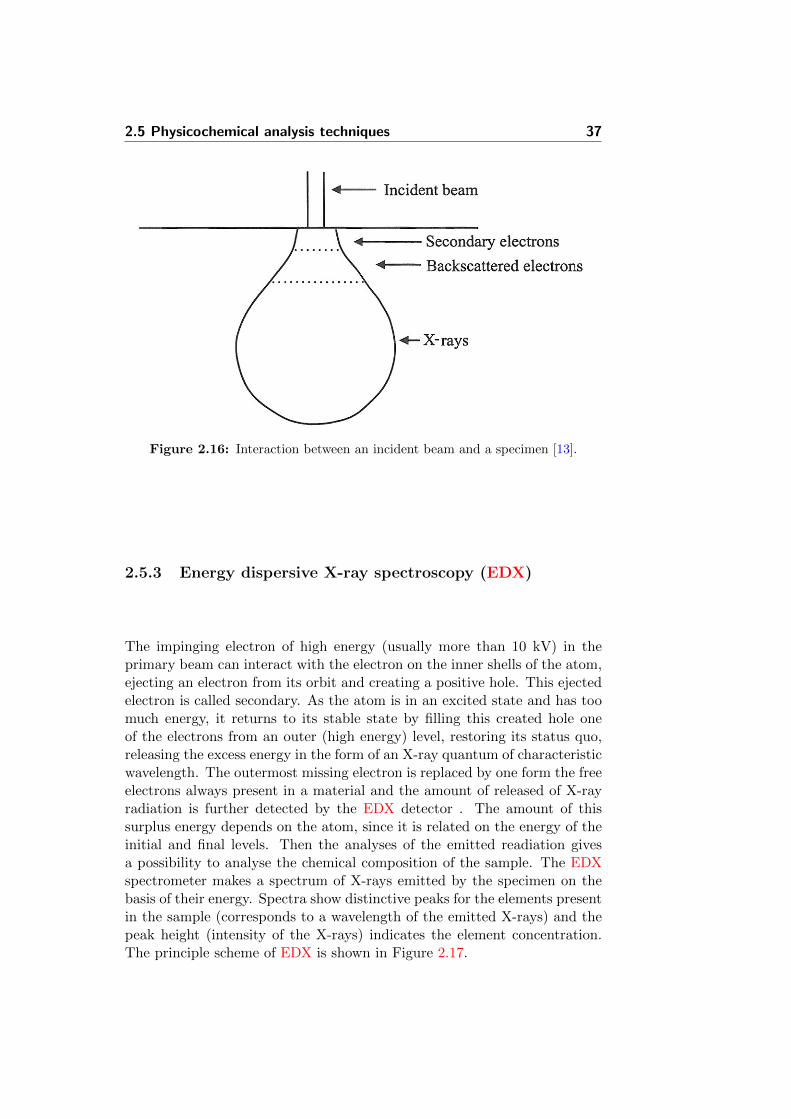
2.5 Physicochemical analysis techniques 37
Figure 2.16: Interaction between an incident beam and a specimen [13].
2.5.3 Energy dispersive X-ray spectroscopy (EDX)
The impinging electron of high energy (usually more than 10 kV) in theprimary beam can interact with the electron on the inner shells of the atom,ejecting an electron from its orbit and creating a positive hole. This ejectedelectron is called secondary. As the atom is in an excited state and has toomuch energy, it returns to its stable state by filling this created hole oneof the electrons from an outer (high energy) level, restoring its status quo,releasing the excess energy in the form of an X-ray quantum of characteristicwavelength. The outermost missing electron is replaced by one form the freeelectrons always present in a material and the amount of released of X-rayradiation is further detected by the EDX detector . The amount of thissurplus energy depends on the atom, since it is related on the energy of theinitial and final levels. Then the analyses of the emitted readiation givesa possibility to analyse the chemical composition of the sample. The EDXspectrometer makes a spectrum of X-rays emitted by the specimen on thebasis of their energy. Spectra show distinctive peaks for the elements presentin the sample (corresponds to a wavelength of the emitted X-rays) and thepeak height (intensity of the X-rays) indicates the element concentration.The principle scheme of EDX is shown in Figure 2.17.

38 Theory and Background
Figure 2.17: The principle scheme of EDX spectroscopy.
2.5.4 Sample preparation for scanning electron microscopy(SEM) and energy dispersive X-ray spectroscopy (EDX)for catalyst powder analysis.
The combination of SEM and EDX techniques is a very powerful micro-analysis instruments. Investigating the supported electrocatalysts it allowsto detect the sites of catalyst location on the support matrix, morphologyof the prepared powder and average particle size. This information is im-portant for the estimation of possible decrease of electrocatalyst particleagglomeration.
However, the importance of the sample preparation procedure in microscopyis hard to overestimate. It differs depending on the observation techniqueused. Moreover, various sample preparation methods can be used withinthe same technique, which often gives different results. One or few wouldusually be chosen, depending on the subject of interest for the sample underinvestigation. For studying of powder electrocatalysts, there are several pos-sibilities. One of the techniques is the same as in powder sample preparationfor X-ray fluorescence (XRF) analysis, where powder pellets compressed un-der high pressure are commonly used [78]. This technique involves a riskof significant grain reorientation during pressing, which can give a wrongimage on the original geometrical arrangement of the particles.
Another potential technique includes preparation of a ”catalyst ink” disper-sion on the metallic support plate. This method is commonly implementedto characterize the electrocatalytic activity of powders [55]. In this case,the dissolved polymer is used as a ”binding agent” for a nano-sized catalystparticles. The usage of this ”catalyst ink” suspension can disturb SEM in-vestigations. The polymer material can partially cover the active catalyst
2.5 Physicochemical analysis techniques 39
surface, which will lead to the charging artefacts. It happens if polymerparticles create a nonconductive surface layer on the powder. In this case,when it is illuminated with a negatively charged electron beam, the chargewould be accumulated on the surface, preventing the emission of electrons.
More appropriate appears a technique, where the catalyst powder is dis-persed in ethanol solution. Further, the prepared dispersion is applied onthe backing plate and sent for SEM or EDX investigations.
2.5.5 SediGraph particle size analysis
The SediGraph method of particle sizing has been used since 1967. Al-though, the are more “modern” methods available, the SediGraph methodstill remains viable and satisfy the needs of certain applications.
The principles of this method lie in particle sizing by measurement of set-tling (sedimentation) velocity and mass fraction determination by relativeabsorption of low-energy X-ray. National Institute of Standards and Tech-nology (NIST) in a guide to particle size characterisation defines the Sedi-Graph as a robust technique, providing rapid analyses and having the capa-bility to be used over a broad size range with minimal changes [79].
Sedimentation size analysis depends on the fact that the measured equilib-rium velocity of a particle through a viscous medium, resulting from theaction of the gravitation force, can be related to the size of the particle bythe Stoke’s law. For spherical particles, the Stoke’s law is expressed by:
D = Kv1/2 (2.66)
where D is the diameter of a spherical particle, v is its equilibrium sedimen-tation velocity and K is the constant of proportionality and accounts fordensity of the particle and physical properties of the liquid medium and isexpressed by:
K = [(18η)/(ρ− ρ0)g] (2.67)
where ρ is particle density. Liquid is characterised by its density ρ0, viscosityη. g is the gravitational acceleration.
Those equations apply rigorously provided that as the particle settles anddisplaces of the liquid, laminar flow around the particle is maintained. Thiscondition is satisfied while the particle Reynolds number is less than 0.3:
Dvρ0 < 0 3 (2.68)
40 Theory and Background
In practice, truly spherical particles are seldom encountered, and Stoke’s lawis not exact for any other shape. Since irregular shapes cannot in any casebe described by a single linear dimension, it is accepted practice to specifythe size of non-spherical particles in terms of the diameter of a sphere ofthe same material that should have the same material that would have thesame sedimentation velocity. Thus, for non-spherical particles, the terms“Stoke’s diameter” or “equivalent spherical diameter” are universally under-stood. The term equivalent spherical diameter (ESD) is some times used ina different context to mean the diameter of a sphere of the same materialthat would have the same mass as the particle in question. That is, theresults of measurements of particle dimensions from electron micrographsare frequently reduced to size distribution curves in terms of mass ESD. Ingeneral, the relationship between these two measures of size is given by theinequality:
Sedimentation ESD
Mass ESD≤ 1 (2.69)
The ratio expressed in the equation 2.69 is usually close to unity. Data con-cerning the sedimentation velocity of suspended particles may be obtainedin two ways:
1) By measuring the concentration of particle remaining in suspension asa function of time.
2) By measuring the quantity of sediment produced as a function of time.
The letter approach is less desirable mathematically because of the graphicaldifferentiation required to reduce the data to a size distribution curve.
Measurements based on the first approach are traditionally performed in thefollowing way: a dilute, deflocculated dispersion of the fine particle materialis stirred to render it homogeneous and then allowed to stand tranquillywhile undergoing sedimentation. Time is measured from the beginning ofthe settling period. By Stoke’s law, a particle of diameter D will settle adistance h in time t according to the expression:
D = K(h/t)1/2 (2.70)
where K is defined by equation 2.67. Consequently, after a given time t, allparticles larger than the corresponding diameter D1 will have fallen below agiven distance h from the surface of the suspension. If the initial (uniform)concentration of material was C0 (g/cm3) and the concentration after time
2.5 Physicochemical analysis techniques 41
t, at distance h is C1 (g/cm3), then P1, the weight percent of material finerthan D1, is given by:
P1 = 100(C1/C0) (2.71)
By obtaining values of C1 after various times, the corresponding values ofP1 and D1 may be calculated. Then the yield can be plotted in integral, orcumulative distribution of particle size in terms of Stoke’s ESD.
The SediGraph uses a finely collimated X-ray beam to measure particleconcentration in terms of the transmittance of the suspension relative to thesuspending liquid. The transmittance to X-ray is a function of the weightconcentration of suspended solids. Since X-ray beam can be made extremelysmall and because it does not disturb the suspension, it constitutes theideal measuring technique. If a sample container or cell of rectangular crosssection is irradiated from a direction perpendicular to one of its sides by acollimated X-ray beam, the fraction of the incident radiation transmitted bythe cell when filled with the suspension under study is given by
I/I0 = 1/exp[−(a1φ1 + asφs)L1 − acL2] (2.72)
where I and I0 are the transmitted and incident intensities, a1, as and ac arethe X-ray absorption coefficients of the liquid, the particulate solids, and thecell walls, respectively. φ1 and φs are the weight fractions of liquid and solidpresent in the suspension. L1 is the internal cell thickness in the direction ofirradiation and L2 is the total thickness of the cell walls. Incident intensity I0
is a measured baseline of a transmitted X-ray beam that has been projectedthrough the liquid medium prior to the introduction of the sample.
By using the relation φ1 = 1− φs and by defining a transmittance I as theratio of the transmission of the cell when filled with a sample dispersion toits transmission with pure suspending liquid, there is obtained:
T =1
exp[φs(as − a1)L1](2.73)
or
lnT = −Aφs (2.74)
where A is a constant for particular apparatus and suspension components.
By collimating the X-ray beam through horizontal slits with a vertical di-mension small compared to the sedimentation depth, h, the measured values
42 Theory and Background
of T can be used in calculating the particle size distribution:
P = 100(lnT1/lnT0) (2.75)
where T0 refers to the transmittance of the initial suspension.
2.5.6 Brunauer-Emmett-Teller (BET) surface area
The surface morphology as well as the specific surface area of an electrodeare related to its performance, as provide information about hypotheticalamount of active surface sites. The method of physical gas adsorption onthe surface of the solid sample can be used for calculation of different prop-erties. One of them, the specific surface area of the powder can be measuredby the nitrogen gas adsorption technique, known as BET and named afterBrunauer, Emmett and Teller who derived it. The BET method is basedon a physical adsorption model where the formation of multiple layers ofadsorbate can be formed. The formation depends on the partial pressures ofthe adsorbed gas and the properties of the sample. By selecting an adequaterange of data points from the adsorption isotherm, it is possible to calcu-late the surface area of the sample. The BET equation can be expressed asfollows:
1
V (P0/P )− 1=C − 1
Vm ·C
(P
P0
)+
1
Vm ·C(2.76)
where V is the volume of gas adsorbed at pressure P , Vm is the gas mono-layer adsorption capacity, P0 is the vapour pressure of the gas at the exper-iment temperature (saturated vapour pressure) and C is a BET constant,depending on gas type and temperature.
The monolayer capacity Vm is defined as the quantity of adsorbate requiredto cover the adsorbent with a monolayer. Usually a second layer may beforming before the monolayer is complete, but Vm is determined from theisotherm equations irrespective of this. It is done by plotting so-called ad-sorption isotherm in terms of the volume of gas adsorbed as function of theequilibrium pressure. A plot of P/V (P0−P ) against P/P0 yields a straightline having a slope (C − 1)/Vmc and an intersect 1/VmC.
When c >> 1, equation 2.76 takes the form:
(P0 − P )V = P0Vm (2.77)
Therefore, it may be assumed that for high c - values the BET plot passes
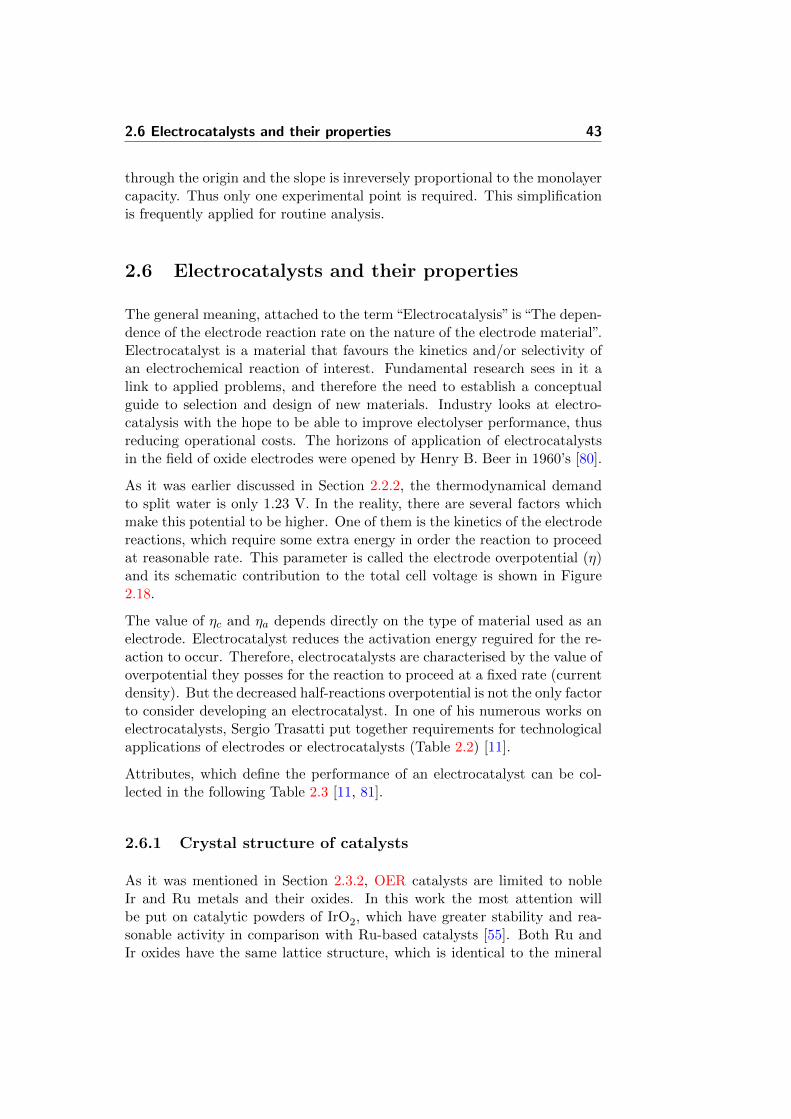
2.6 Electrocatalysts and their properties 43
through the origin and the slope is inreversely proportional to the monolayercapacity. Thus only one experimental point is required. This simplificationis frequently applied for routine analysis.
2.6 Electrocatalysts and their properties
The general meaning, attached to the term “Electrocatalysis” is “The depen-dence of the electrode reaction rate on the nature of the electrode material”.Electrocatalyst is a material that favours the kinetics and/or selectivity ofan electrochemical reaction of interest. Fundamental research sees in it alink to applied problems, and therefore the need to establish a conceptualguide to selection and design of new materials. Industry looks at electro-catalysis with the hope to be able to improve electolyser performance, thusreducing operational costs. The horizons of application of electrocatalystsin the field of oxide electrodes were opened by Henry B. Beer in 1960’s [80].
As it was earlier discussed in Section 2.2.2, the thermodynamical demandto split water is only 1.23 V. In the reality, there are several factors whichmake this potential to be higher. One of them is the kinetics of the electrodereactions, which require some extra energy in order the reaction to proceedat reasonable rate. This parameter is called the electrode overpotential (η)and its schematic contribution to the total cell voltage is shown in Figure2.18.
The value of ηc and ηa depends directly on the type of material used as anelectrode. Electrocatalyst reduces the activation energy reguired for the re-action to occur. Therefore, electrocatalysts are characterised by the value ofoverpotential they posses for the reaction to proceed at a fixed rate (currentdensity). But the decreased half-reactions overpotential is not the only factorto consider developing an electrocatalyst. In one of his numerous works onelectrocatalysts, Sergio Trasatti put together requirements for technologicalapplications of electrodes or electrocatalysts (Table 2.2) [11].
Attributes, which define the performance of an electrocatalyst can be col-lected in the following Table 2.3 [11, 81].
2.6.1 Crystal structure of catalysts
As it was mentioned in Section 2.3.2, OER catalysts are limited to nobleIr and Ru metals and their oxides. In this work the most attention willbe put on catalytic powders of IrO2, which have greater stability and rea-sonable activity in comparison with Ru-based catalysts [55]. Both Ru andIr oxides have the same lattice structure, which is identical to the mineral
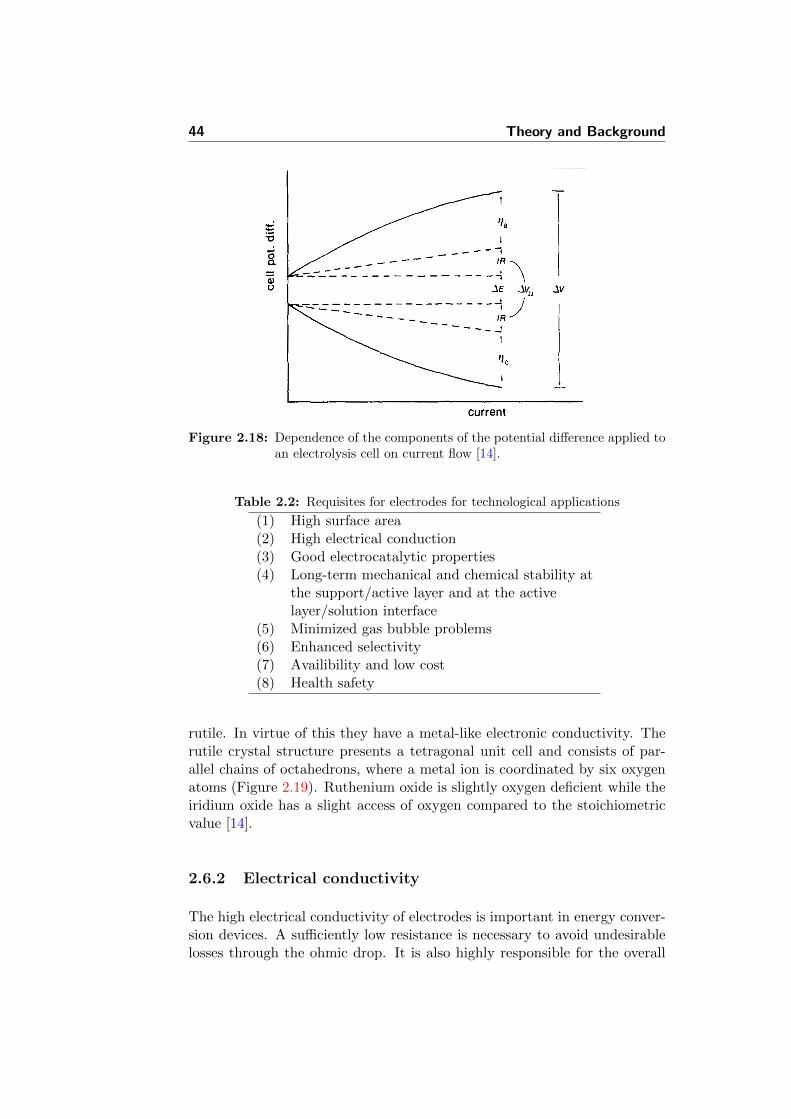
44 Theory and Background
Figure 2.18: Dependence of the components of the potential difference applied toan electrolysis cell on current flow [14].
Table 2.2: Requisites for electrodes for technological applications
(1) High surface area(2) High electrical conduction(3) Good electrocatalytic properties(4) Long-term mechanical and chemical stability at
the support/active layer and at the activelayer/solution interface
(5) Minimized gas bubble problems(6) Enhanced selectivity(7) Availibility and low cost(8) Health safety
rutile. In virtue of this they have a metal-like electronic conductivity. Therutile crystal structure presents a tetragonal unit cell and consists of par-allel chains of octahedrons, where a metal ion is coordinated by six oxygenatoms (Figure 2.19). Ruthenium oxide is slightly oxygen deficient while theiridium oxide has a slight access of oxygen compared to the stoichiometricvalue [14].
2.6.2 Electrical conductivity
The high electrical conductivity of electrodes is important in energy conver-sion devices. A sufficiently low resistance is necessary to avoid undesirablelosses through the ohmic drop. It is also highly responsible for the overall
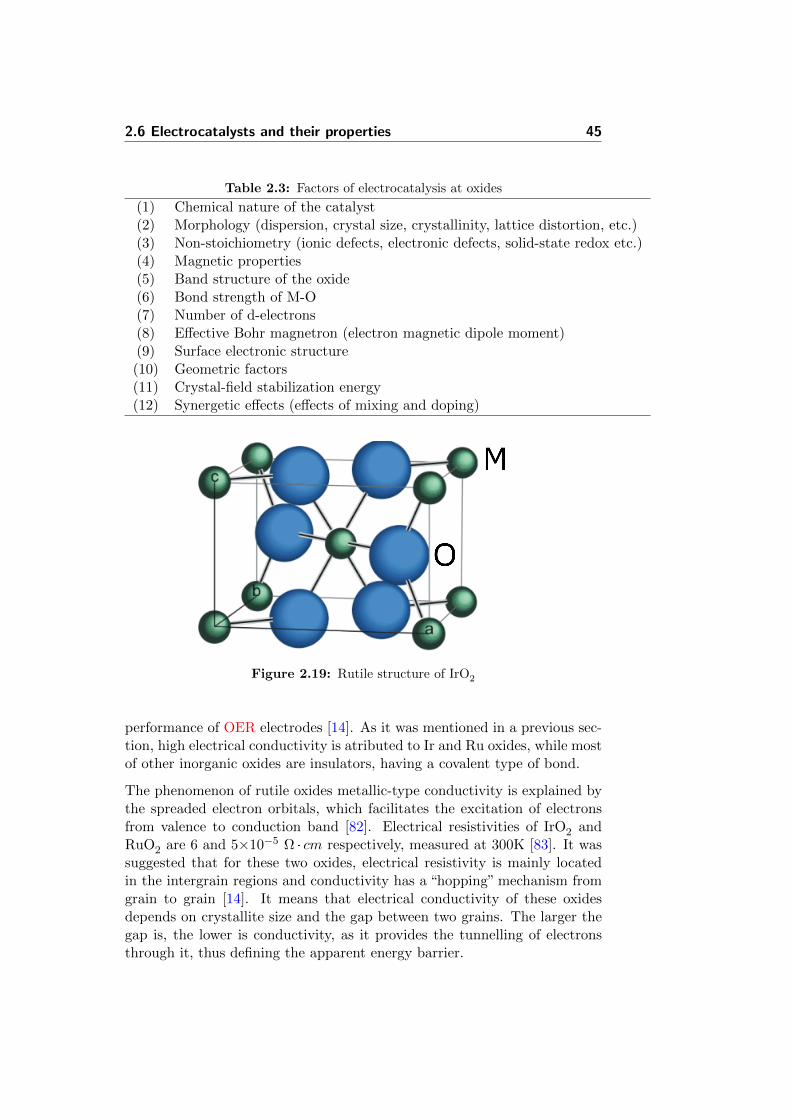
2.6 Electrocatalysts and their properties 45
Table 2.3: Factors of electrocatalysis at oxides
(1) Chemical nature of the catalyst(2) Morphology (dispersion, crystal size, crystallinity, lattice distortion, etc.)(3) Non-stoichiometry (ionic defects, electronic defects, solid-state redox etc.)(4) Magnetic properties(5) Band structure of the oxide(6) Bond strength of M-O(7) Number of d-electrons(8) Effective Bohr magnetron (electron magnetic dipole moment)(9) Surface electronic structure(10) Geometric factors(11) Crystal-field stabilization energy(12) Synergetic effects (effects of mixing and doping)
Figure 2.19: Rutile structure of IrO2
performance of OER electrodes [14]. As it was mentioned in a previous sec-tion, high electrical conductivity is atributed to Ir and Ru oxides, while mostof other inorganic oxides are insulators, having a covalent type of bond.
The phenomenon of rutile oxides metallic-type conductivity is explained bythe spreaded electron orbitals, which facilitates the excitation of electronsfrom valence to conduction band [82]. Electrical resistivities of IrO2 andRuO2 are 6 and 5×10⁻⁵ Ω · cm respectively, measured at 300K [83]. It wassuggested that for these two oxides, electrical resistivity is mainly locatedin the intergrain regions and conductivity has a “hopping” mechanism fromgrain to grain [14]. It means that electrical conductivity of these oxidesdepends on crystallite size and the gap between two grains. The larger thegap is, the lower is conductivity, as it provides the tunnelling of electronsthrough it, thus defining the apparent energy barrier.
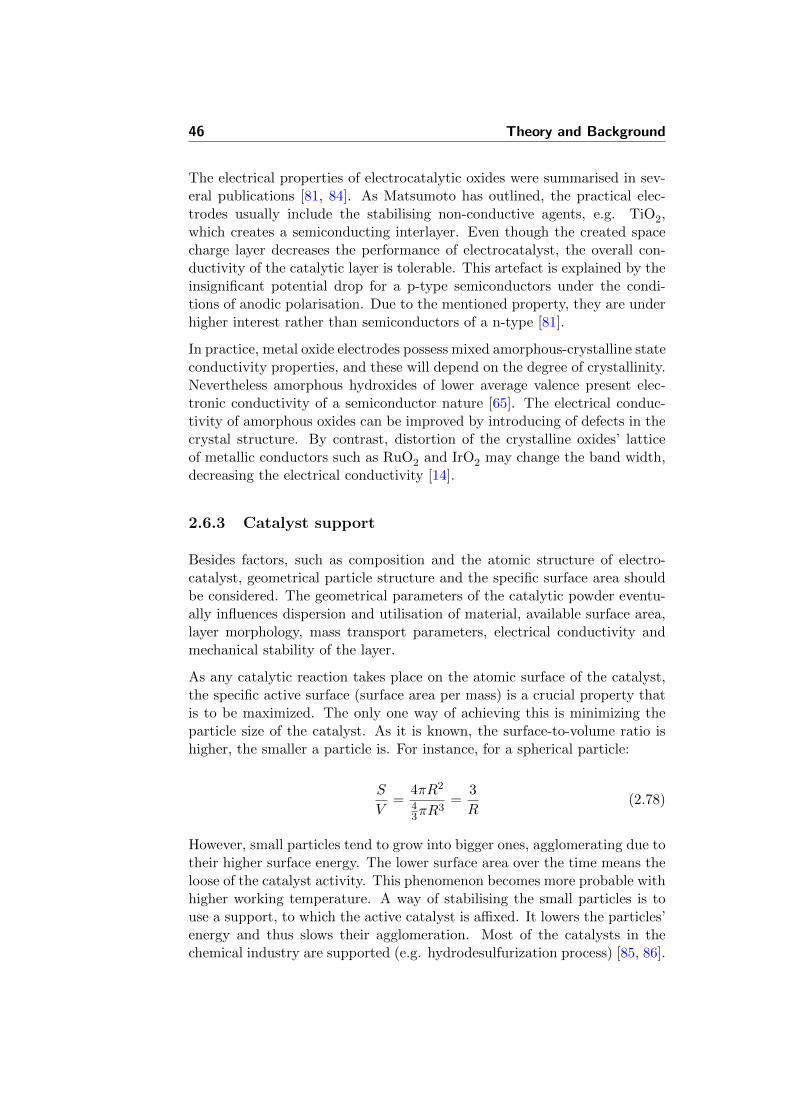
46 Theory and Background
The electrical properties of electrocatalytic oxides were summarised in sev-eral publications [81, 84]. As Matsumoto has outlined, the practical elec-trodes usually include the stabilising non-conductive agents, e.g. TiO2,which creates a semiconducting interlayer. Even though the created spacecharge layer decreases the performance of electrocatalyst, the overall con-ductivity of the catalytic layer is tolerable. This artefact is explained by theinsignificant potential drop for a p-type semiconductors under the condi-tions of anodic polarisation. Due to the mentioned property, they are underhigher interest rather than semiconductors of a n-type [81].
In practice, metal oxide electrodes possess mixed amorphous-crystalline stateconductivity properties, and these will depend on the degree of crystallinity.Nevertheless amorphous hydroxides of lower average valence present elec-tronic conductivity of a semiconductor nature [65]. The electrical conduc-tivity of amorphous oxides can be improved by introducing of defects in thecrystal structure. By contrast, distortion of the crystalline oxides’ latticeof metallic conductors such as RuO2 and IrO2 may change the band width,decreasing the electrical conductivity [14].
2.6.3 Catalyst support
Besides factors, such as composition and the atomic structure of electro-catalyst, geometrical particle structure and the specific surface area shouldbe considered. The geometrical parameters of the catalytic powder eventu-ally influences dispersion and utilisation of material, available surface area,layer morphology, mass transport parameters, electrical conductivity andmechanical stability of the layer.
As any catalytic reaction takes place on the atomic surface of the catalyst,the specific active surface (surface area per mass) is a crucial property thatis to be maximized. The only one way of achieving this is minimizing theparticle size of the catalyst. As it is known, the surface-to-volume ratio ishigher, the smaller a particle is. For instance, for a spherical particle:
S
V=
4πR2
43πR
3=
3
R(2.78)
However, small particles tend to grow into bigger ones, agglomerating due totheir higher surface energy. The lower surface area over the time means theloose of the catalyst activity. This phenomenon becomes more probable withhigher working temperature. A way of stabilising the small particles is touse a support, to which the active catalyst is affixed. It lowers the particles’energy and thus slows their agglomeration. Most of the catalysts in thechemical industry are supported (e.g. hydrodesulfurization process) [85, 86].
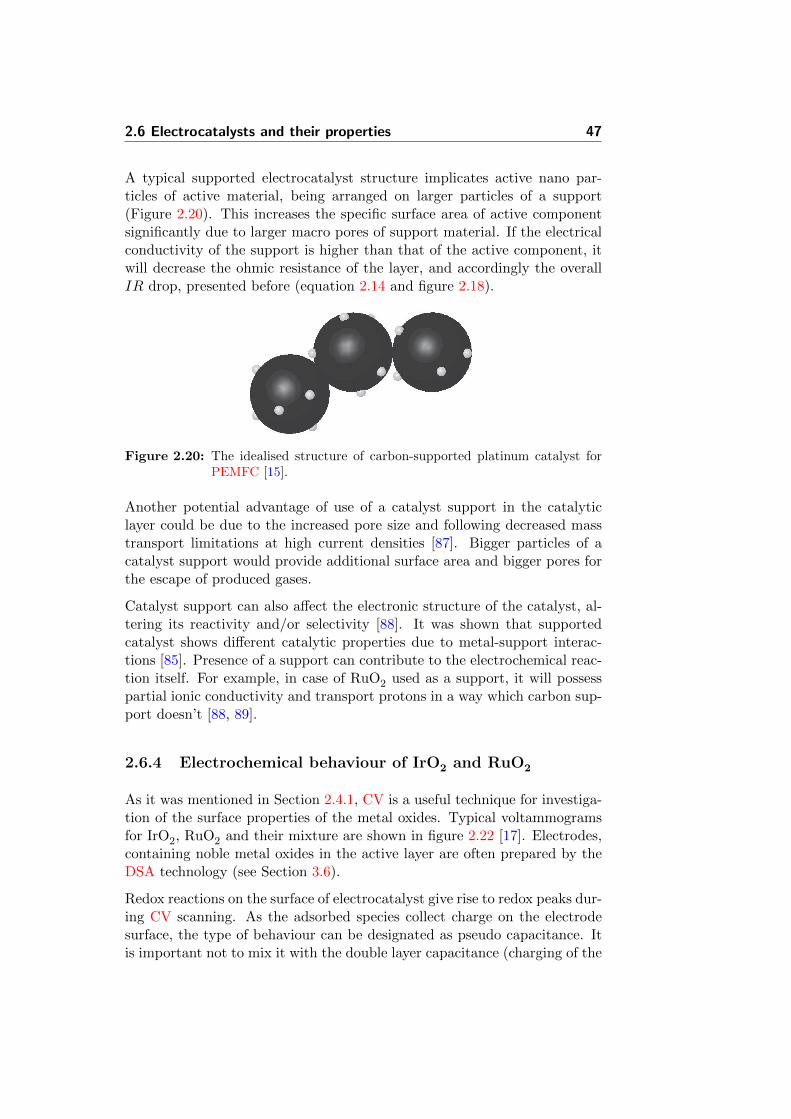
2.6 Electrocatalysts and their properties 47
A typical supported electrocatalyst structure implicates active nano par-ticles of active material, being arranged on larger particles of a support(Figure 2.20). This increases the specific surface area of active componentsignificantly due to larger macro pores of support material. If the electricalconductivity of the support is higher than that of the active component, itwill decrease the ohmic resistance of the layer, and accordingly the overallIR drop, presented before (equation 2.14 and figure 2.18).
Figure 2.20: The idealised structure of carbon-supported platinum catalyst forPEMFC [15].
Another potential advantage of use of a catalyst support in the catalyticlayer could be due to the increased pore size and following decreased masstransport limitations at high current densities [87]. Bigger particles of acatalyst support would provide additional surface area and bigger pores forthe escape of produced gases.
Catalyst support can also affect the electronic structure of the catalyst, al-tering its reactivity and/or selectivity [88]. It was shown that supportedcatalyst shows different catalytic properties due to metal-support interac-tions [85]. Presence of a support can contribute to the electrochemical reac-tion itself. For example, in case of RuO2 used as a support, it will possesspartial ionic conductivity and transport protons in a way which carbon sup-port doesn’t [88, 89].
2.6.4 Electrochemical behaviour of IrO2 and RuO2
As it was mentioned in Section 2.4.1, CV is a useful technique for investiga-tion of the surface properties of the metal oxides. Typical voltammogramsfor IrO2, RuO2 and their mixture are shown in figure 2.22 [17]. Electrodes,containing noble metal oxides in the active layer are often prepared by theDSA technology (see Section 3.6).
Redox reactions on the surface of electrocatalyst give rise to redox peaks dur-ing CV scanning. As the adsorbed species collect charge on the electrodesurface, the type of behaviour can be designated as pseudo capacitance. Itis important not to mix it with the double layer capacitance (charging of the
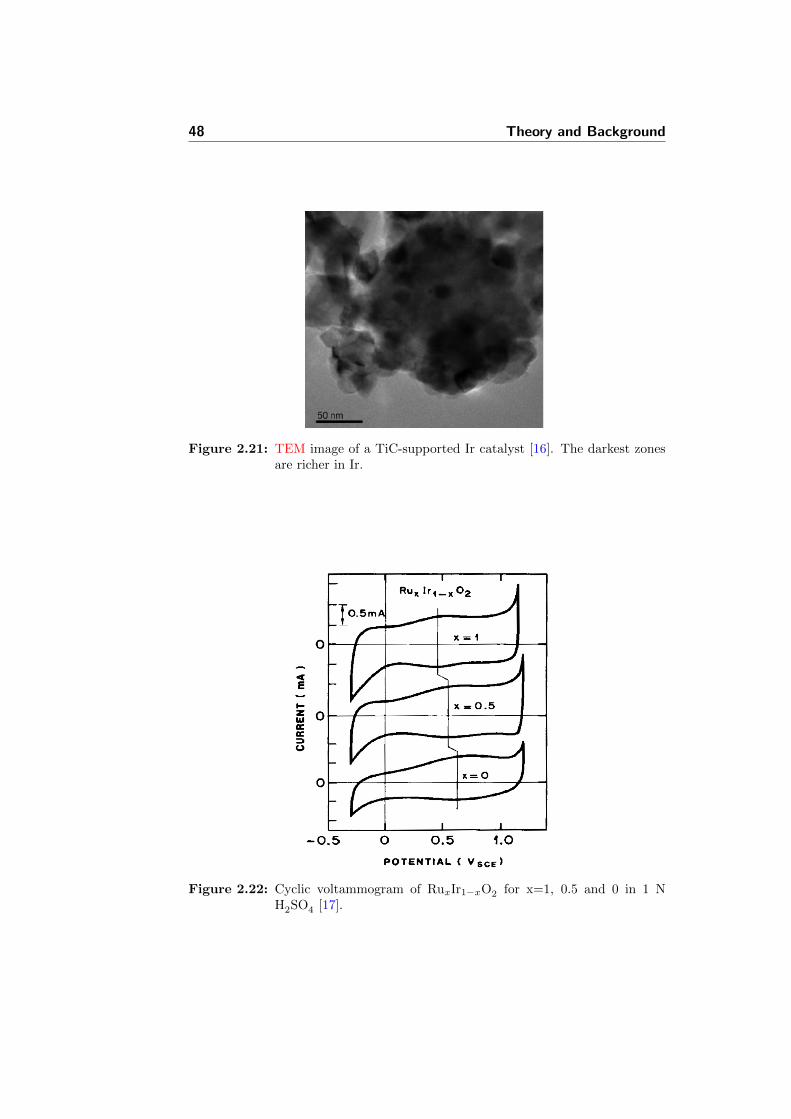
48 Theory and Background
Figure 2.21: TEM image of a TiC-supported Ir catalyst [16]. The darkest zonesare richer in Ir.
Figure 2.22: Cyclic voltammogram of RuxIr1−xO2 for x=1, 0.5 and 0 in 1 NH2SO4 [17].
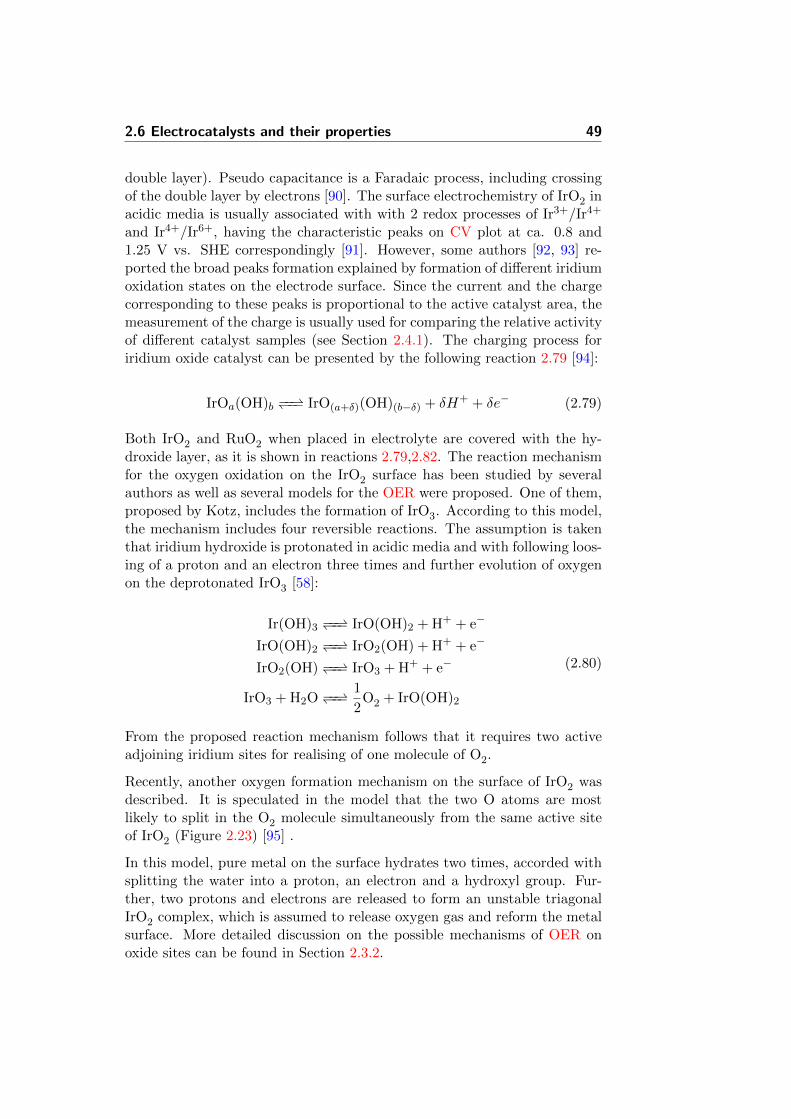
2.6 Electrocatalysts and their properties 49
double layer). Pseudo capacitance is a Faradaic process, including crossingof the double layer by electrons [90]. The surface electrochemistry of IrO2 inacidic media is usually associated with with 2 redox processes of Ir3+/Ir4+
and Ir4+/Ir6+, having the characteristic peaks on CV plot at ca. 0.8 and1.25 V vs. SHE correspondingly [91]. However, some authors [92, 93] re-ported the broad peaks formation explained by formation of different iridiumoxidation states on the electrode surface. Since the current and the chargecorresponding to these peaks is proportional to the active catalyst area, themeasurement of the charge is usually used for comparing the relative activityof different catalyst samples (see Section 2.4.1). The charging process foriridium oxide catalyst can be presented by the following reaction 2.79 [94]:
IrOa(OH)b −−−− IrO(a+δ)(OH)(b−δ) + δH+ + δe− (2.79)
Both IrO2 and RuO2 when placed in electrolyte are covered with the hy-droxide layer, as it is shown in reactions 2.79,2.82. The reaction mechanismfor the oxygen oxidation on the IrO2 surface has been studied by severalauthors as well as several models for the OER were proposed. One of them,proposed by Kotz, includes the formation of IrO3. According to this model,the mechanism includes four reversible reactions. The assumption is takenthat iridium hydroxide is protonated in acidic media and with following loos-ing of a proton and an electron three times and further evolution of oxygenon the deprotonated IrO3 [58]:
Ir(OH)3 −−−− IrO(OH)2 + H+ + e−
IrO(OH)2 −−−− IrO2(OH) + H+ + e−
IrO2(OH) −−−− IrO3 + H+ + e−
IrO3 + H2O −−−−1
2O2 + IrO(OH)2
(2.80)
From the proposed reaction mechanism follows that it requires two activeadjoining iridium sites for realising of one molecule of O2.
Recently, another oxygen formation mechanism on the surface of IrO2 wasdescribed. It is speculated in the model that the two O atoms are mostlikely to split in the O2 molecule simultaneously from the same active siteof IrO2 (Figure 2.23) [95] .
In this model, pure metal on the surface hydrates two times, accorded withsplitting the water into a proton, an electron and a hydroxyl group. Fur-ther, two protons and electrons are released to form an unstable triagonalIrO2 complex, which is assumed to release oxygen gas and reform the metalsurface. More detailed discussion on the possible mechanisms of OER onoxide sites can be found in Section 2.3.2.
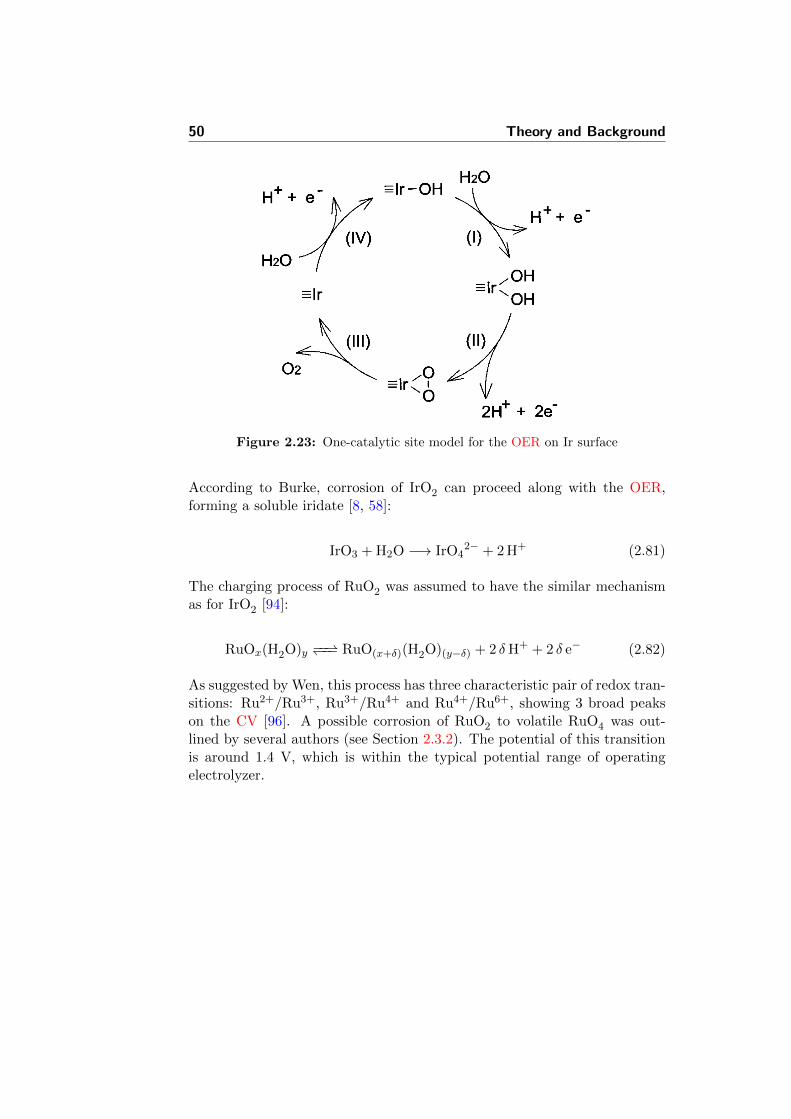
50 Theory and Background
Figure 2.23: One-catalytic site model for the OER on Ir surface
According to Burke, corrosion of IrO2 can proceed along with the OER,forming a soluble iridate [8, 58]:
IrO3 + H2O −→ IrO42− + 2 H+ (2.81)
The charging process of RuO2 was assumed to have the similar mechanismas for IrO2 [94]:
RuOx(H2O)y −−−− RuO(x+δ)(H2O)(y−δ) + 2 δH+ + 2 δ e− (2.82)
As suggested by Wen, this process has three characteristic pair of redox tran-sitions: Ru2+/Ru3+, Ru3+/Ru4+ and Ru4+/Ru6+, showing 3 broad peakson the CV [96]. A possible corrosion of RuO2 to volatile RuO4 was out-lined by several authors (see Section 2.3.2). The potential of this transitionis around 1.4 V, which is within the typical potential range of operatingelectrolyzer.
Chapter 3
High Temperature PEM WaterElectrolysis
3.1 Principles of PEM water electrolysis
As it was mentioned in Section 2.1, there are mainly 3 types of electrolyzers:alkaline, acidic and SOEC. This study will be concentrated on acidic elec-trolyzers, where reactions follow the described pathes (reactions 2.3, 2.4).
The efficiency of water splitting by electrolysis is rather low for conventionalelectrolyzers and there is hence a large potential for improvement. One ofthe potential advantages of PEM cells over more abundant alkaline elec-trolyzers is that they were shown to be reversible [97–99]. The type of anelectrochemical cell working both as a fuel cell and a water electrolyzer iscalled a unitized regenerative fuel cell (URFC) [100–103]. These devicesproduce hydrogen from water in the electrolysis mode, while electricity canbe inversely produced in the fuel cell mode. This mode of working is ben-eficial when the lack of electricity changes with the excess energy available(periods of low consumption) [104].
PEM water electrolysis technology is frequently presented in literature asa potentially very effective alternative to more conventional alkaline waterelectrolysis [105–107]. Among advantages are higher production rates andenergy efficiency [29]. In a future “hydrogen society” this method is envi-sioned as a part of the “energy cycle”, where hydrogen acts as an energycarrier. In this cycle, electricity from renewable energy sources is used inelectrolysis for electrochemical splitting of water [1]. A PEM electrolyzer
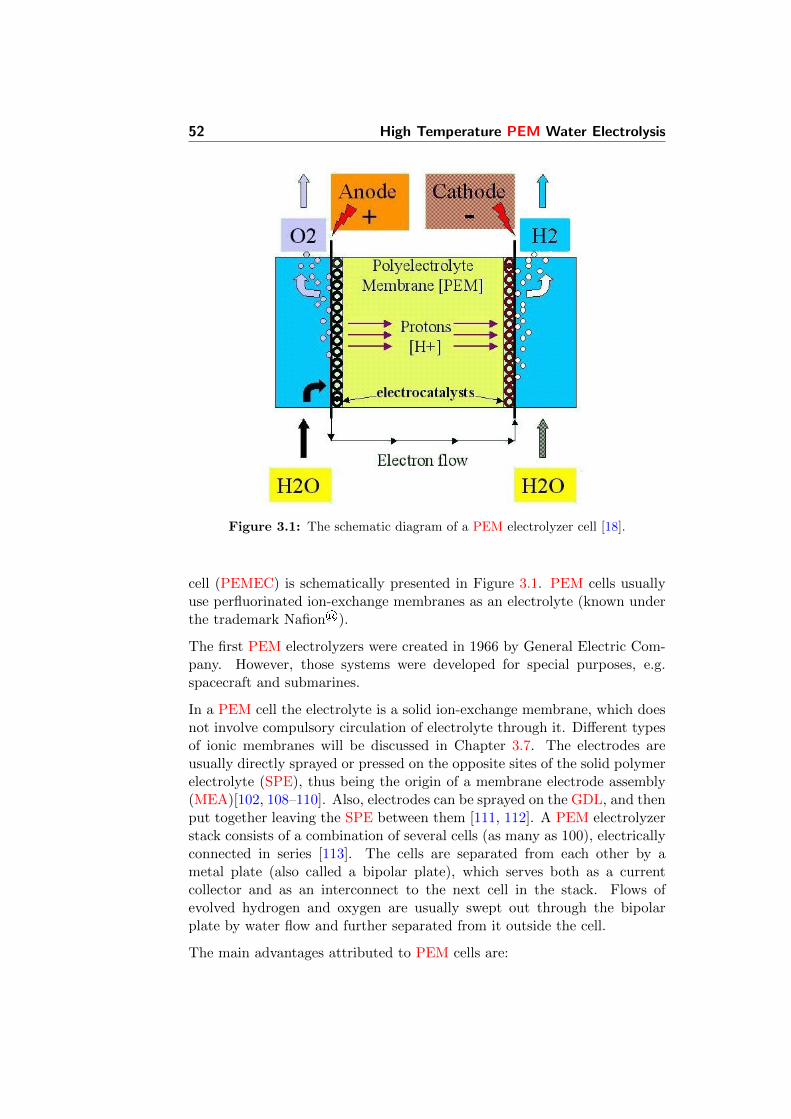
52 High Temperature PEM Water Electrolysis
Figure 3.1: The schematic diagram of a PEM electrolyzer cell [18].
cell (PEMEC) is schematically presented in Figure 3.1. PEM cells usuallyuse perfluorinated ion-exchange membranes as an electrolyte (known underthe trademark Nafion®).
The first PEM electrolyzers were created in 1966 by General Electric Com-pany. However, those systems were developed for special purposes, e.g.spacecraft and submarines.
In a PEM cell the electrolyte is a solid ion-exchange membrane, which doesnot involve compulsory circulation of electrolyte through it. Different typesof ionic membranes will be discussed in Chapter 3.7. The electrodes areusually directly sprayed or pressed on the opposite sites of the solid polymerelectrolyte (SPE), thus being the origin of a membrane electrode assembly(MEA)[102, 108–110]. Also, electrodes can be sprayed on the GDL, and thenput together leaving the SPE between them [111, 112]. A PEM electrolyzerstack consists of a combination of several cells (as many as 100), electricallyconnected in series [113]. The cells are separated from each other by ametal plate (also called a bipolar plate), which serves both as a currentcollector and as an interconnect to the next cell in the stack. Flows ofevolved hydrogen and oxygen are usually swept out through the bipolarplate by water flow and further separated from it outside the cell.
The main advantages attributed to PEM cells are:
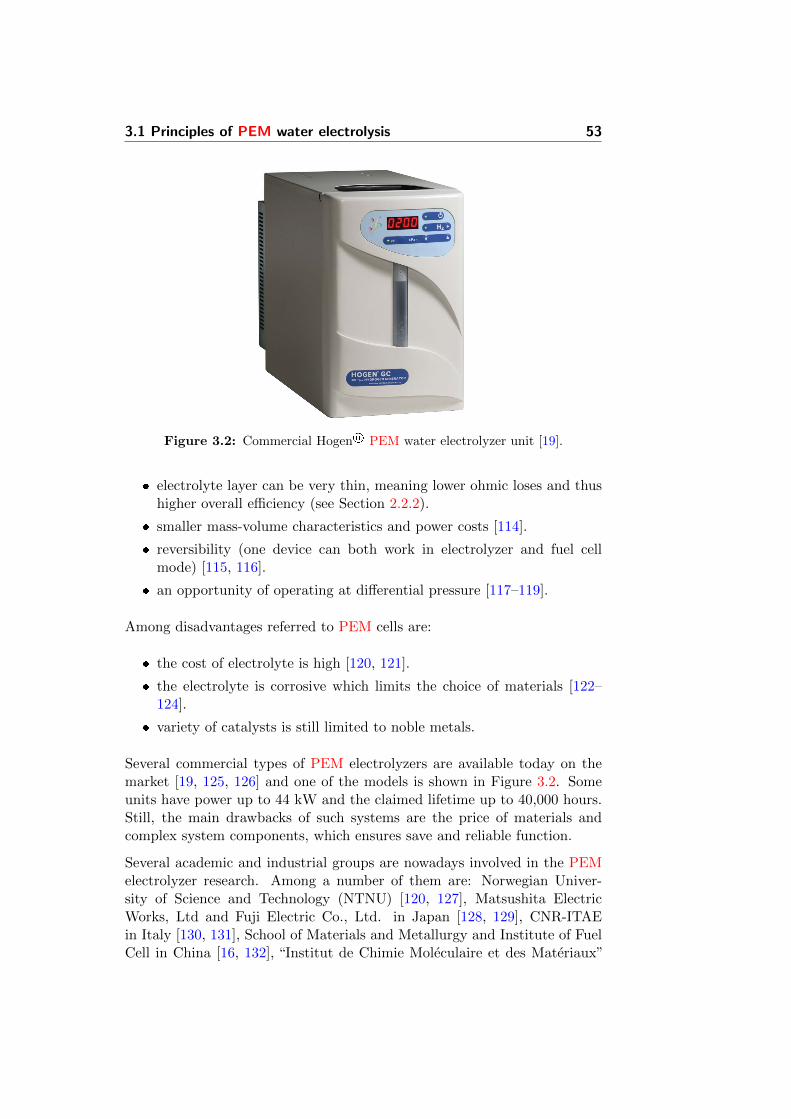
3.1 Principles of PEM water electrolysis 53
Figure 3.2: Commercial Hogen® PEM water electrolyzer unit [19].
electrolyte layer can be very thin, meaning lower ohmic loses and thushigher overall efficiency (see Section 2.2.2).
smaller mass-volume characteristics and power costs [114].
reversibility (one device can both work in electrolyzer and fuel cellmode) [115, 116].
an opportunity of operating at differential pressure [117–119].
Among disadvantages referred to PEM cells are:
the cost of electrolyte is high [120, 121].
the electrolyte is corrosive which limits the choice of materials [122–124].
variety of catalysts is still limited to noble metals.
Several commercial types of PEM electrolyzers are available today on themarket [19, 125, 126] and one of the models is shown in Figure 3.2. Someunits have power up to 44 kW and the claimed lifetime up to 40,000 hours.Still, the main drawbacks of such systems are the price of materials andcomplex system components, which ensures save and reliable function.
Several academic and industrial groups are nowadays involved in the PEMelectrolyzer research. Among a number of them are: Norwegian Univer-sity of Science and Technology (NTNU) [120, 127], Matsushita ElectricWorks, Ltd and Fuji Electric Co., Ltd. in Japan [128, 129], CNR-ITAEin Italy [130, 131], School of Materials and Metallurgy and Institute of FuelCell in China [16, 132], “Institut de Chimie Moleculaire et des Materiaux”
54 High Temperature PEM Water Electrolysis
in France [133, 134], Hydrogen Energy and Plasma Technology Institute,Russian Research Center “Kurchatov Institute” [31, 87], etc.
3.2 High temperature PEM electrolysis. Advan-tages and drawbacks
At temperatures above the boiling point of water, the energy efficiency ofwater splitting can be significantly improved because of decreased thermo-dynamic energy requirements, which is one of the major advantages of thesesystems. The equilibrium potential decreases with higher operating temper-atures (Section 2.2.1, Figure 2.1). Since the reaction of water splitting isnot spontaneous and the Gibbs free energy is positive, a positive change ofa factor T ·∆S in the equation 3.1 means less energy needs to be applied.As the reaction has a positive entropy, the equilibrium will be displaced to-wards the products for high temperatures. The term T ·∆S increases withincreasing temperature, thus increasing the contribution of thermal energyto the total needs for the water splitting reaction [135]. Therefore, the partof heat, which can be used for the reaction is higher, meaning that the pro-duction costs of hydrogen are decreased [136]. It was noticed much earlierthat econonomic reasons force to move towards high temperature electrolysis(120-150 °C) [47].
∆G = ∆H − T ·∆S
∆G = −nF∆E
∆S > 0→ dG
dT< 0
d∆E
dT= −d∆G
dT> 0
(3.1)
According to the Arrhenius’ equation 2.23, the kinetics of the electrodereactions is enhanced at elevated temperatures. It is associated with loweroverpotentials at the electrodes, giving higher efficiency for electrolysis.
Another positive opportunity provided while operating at temperatures above100 °C is that water is not in a liquid phase (at ambient pressure) and thisfact significantly simplifies water/gas management. In this case all the reac-tant/product flows are in a steam phase and the transport of them is easier,which provides simplified stack construction and operation [137].
The heat management is also easier for high temperature systems, as theheat flow out of the system is proportional to the temperature gradientbetween the cell and the ambient. This means that cooling is more effective
3.3 Construction materials for high temperature PEM water electrolysis(bipolar plates and current collectors) 55
in elevated-temperature systems, as there are less efficiency losses associatedwith the forced cooling of the cell [44].
Another benefit of high temperature systems is attributed to the decreasedsensibility of catalysts towards poisoning by adsorption of inhibiting agents.This effect is acknowledged to be a considerable advantage of high temper-ature PEM fuel cells (HTPEMFCs) [137]. The inhibition mechanism usu-ally involves chemisorption of species on the catalyst surface, covering andscreening it from interacting with the reactants. This adsorption is weakerat higher temperatures, giving higher tolerance to impurities [138].
However, with increasing temperature, the probability and rate of side pro-cesses, such as dissolution of the electrodes and components corrosion, ishigher. This decreases the lifetime of the whole system and increases de-mands to all materials used with respect to corrosion and thermal stabil-ity [106, 139]. The corrosion issue for construction materials in such cellswill be addressed in the following Section 3.3.
3.3 Construction materials for high temperaturePEM water electrolysis (bipolar plates and cur-rent collectors)
Elevated working temperatures involve increased demands for corrosion re-sistance of catalysts and current collectors, while the contact resistance inthe GDL should remain reasonable.
High temperature PEM cell cannot be build from the same materials as a cellworking below 100 °C. Among new materials to be developed are polymermembranes, as commercial Nafion® membranes lose their conductivity attemperature above 100 °C due to membrane dehydration [108]. This meansthat different membranes should be used for this temperature range. It willbe further discussed in Section 3.7. Elevated temperatures as well createmore severe corrosion media for other components in the cell.
The anodic compartment of electrolyzer is expected to have stronger corro-sive conditions than cathodic due to high positive polarization in combina-tion with presence of evolving oxygen. This will be even more severe whenthe temperature is elevated. It is therefore an important task to choose ma-terials which possess sufficient corrosion resistance. This demands furtherdevelopment of all materials from which electrolyzer cells are built.
One of the important components in PEM stack is a bipolar plate. Bipolarplate is a multifunctional and expensive part in a electrolysis stack as it col-lects and conduct current from cell to cell, permits an adequate gas flow, and
56 High Temperature PEM Water Electrolysis
the flow channels in the plate carry off produced gases, as well as providingmost of the mechanical strength of the stack. In a typical PEM electrolysisstack, bipolar plates comprise most of the mass, and almost all the volume.Usually they also facilitate heat management in the system. These complexrequirements make a task of finding proper materials difficult [140]. Thehighly oxidising acidic conditions in the oxygen electrode compartment posea serious challenge to the materials used in these systems [139].
The most crucial demands for bipolar plate materials are resistance tospalling, dimensional stability and resistance to corrosion in electrolyte me-dia under anodic/cathodic polarization. Numerous research projects havebeen devoted to bipolar plate materials in fuel cells [122–124, 141–145]. How-ever, the number of suitable materials for PEM electrolyzers is still limitedbecause of high requirements for corrosion resistance at the oxygen electrode,where high overpotentials are combined with low pH media of electrolyte.
In Nafion®-based systems, titanium is the most widely used bipolar platematerial, which is ideal in terms of corrosion resistance and conductiv-ity [102, 146–148]. Porous sintered titanium powder commonly serves asa GDL material [87, 149].
The conductivity of Nafion® membranes decreases dramatically at temper-atures above 100 °C (Section 3.7.3). Thus, PBI membranes doped withphosphoric acid are typically used in PEM fuel cells at elevated tempera-tures [148]. However, materials like steels corrode easily in phosphoric acidsolutions and therefore it is important to study other alloys and materi-als for current collectors [67, 150]. Tantalum and nickel alloys show bettercorrosion resistance than stainless steels partly due to higher corrosion po-tentials and partly due to the formation of passive oxide layers on the metalsurface [69, 151]. Titanium generally has rather limited resistance to phos-phoric acid [152]. Previous studies showed that titanium current collectorswould considerably suffer from corrosion at temperatures above 80 °C inconcentrated phosphoric acid environments [36, 153].
Different types of stainless steels can be used as bipolar plates, and they haveadvantages of being good heat and electricity conductors, can be machinedeasily (e.g. by stamping), are non-porous, and consequently very thin piecesare able to keep the reactant gases apart.
A possible alternative to stainless steel bipolar plates can be the use of nickel-based alloys [151]. Ni-based alloys are widely applied in process industry andenergy production in nuclear power plants. When compared to conventionalstainless steels, generally a higher degree of resistance against corrosion isobserved for these materials. This can be explained partly by more noblecorrosion potential of Ni and by different properties of the oxide films formedon Ni-based alloys [151]. Also, it has been proposed recently that nickel and
3.3 Construction materials for high temperature PEM water electrolysis(bipolar plates and current collectors) 57
stainless steel alloys can be used as a construction material in PEM waterelectolysers, but at temperatures no higher, than 100 °C [153].
In order to simulate corrosion conditions at the anodic compartment ofa PEM water electrolysis cell during half-cell experiments, it is necessaryto choose a proper electrolyte. Investigating systems including membranesbased on perfluorinated sulfonic acid, e.g. Nafion®, 0.5M sulphuric acidis commonly used as an electrolyte, simulating the electrolyzer cell condi-tions [55, 120]. Similarly, H3PO4 can be used to model systems based onmembranes doped with H3PO4. 85% solution of H3PO4 can be chosen tostudy the limiting case of corrosion, considering that in working electrolyzersystems the actual concentration of active acid at the electrode-electrolyte-water three-phase boundary would by much less than in this limiting case.
In a highly oxidizing media such as the anodic compartment of high tem-perature steam electrolysis stack, it is essential to characterize the effect ofdifferent parameters on the behaviour of the protective oxide films. To date,no works have been addressed to the study of Ni-based alloys for use asbipolar plates in high temperature PEM steam electrolyzers.
In this work, metal alloys, namely austenitic stainless steels AISI 316L,AISI 321, AISI 347 and Ni-based alloys Hastelloy®C-276, Inconel®625,Incoloy®825, as well as titanium and tantalum were tested in terms of cor-rosion resistance. Platinum and gold were also investigated for studying thepotential window of concentrated H3PO4. All samples were subjected toanodic polarisation in 85% phosphoric acid electrolyte solution at 120 C.The corrosion speed of metal alloys was investigated additionally for 30 Cand 80 C to show the influence of temperature on corrosion resistance.
3.3.1 Metal coatings and a CVD technique
As the requirements to construction materials are quite severe and the pricefor materials which fulfil these requirements tends to be rather high, one ofthe approaches can be use of a coating on the less expensive and availablematerial. If the technology is robust and affordable, the price of the ma-terials can be significantly reduced, as expensive material use is restrictedto the surface. Tantalum was shown to have superior resistance towardsacidic solutions [154]. This is attributed to the formation of a thin Ta2O5
passivating film. As the cost of this material is rather high, its use is oftenlimited to the coatings.
Cardarelli et. al showed that IrO2 electrodes, prepared on copper basematerial, which is coated with tantalum by molten salt electroplating presentmuch better corrosion stability than coatings, made on pure titanium [155].
58 High Temperature PEM Water Electrolysis
Chemical vapour deposition (CVD) process can be used for tantalum coat-ings preparation, where product is deposited on the surface of a substrateinside the reaction chamber. The most common process of chemical vapourdeposition (CVD) coating is hydrogen reduction of a metal chloride [156].
In this work a commercial CVD “Tantaline” coating on stainless steel AISI316L, provided by Tantaline A/S (Denmark) was tested for corrosion inHTPEMEC environment [157].
3.4 Oxygen evolution electrodes (OEEs)
Present research attention in the field of electrolysis is concentrated on ex-tending the lifetime, developing oxygen electrodes and stack design [134,136, 158, 159]. The oxygen electrode is one of the main contributors tothe loss of overall efficiency as it gives most of the activation losses due toslow kinetics of the OER. This problem arises from the complex mechanismof the oxygen/water reaction [100]. For a reaction involving 4 electrons peroxygen molecule, the activation energy is higher than that for hydrogen evo-lution. Several steps of this reaction are proposed, without agreement on amechanism (see Section 2.3.2).
As electrodes have to be able to withstand strong corrosive acidic and ox-idizing conditions at the anode compartment, noble metals and other sub-stances, like their oxides and alloys were chosen at the dawn of research inthis field as materials for the oxygen evolution electrodes [160]. The bestcatalyst seemed to be iridium-ruthenium metal based alloys [161]. On thecontrary, platinum was found to have relatively high overpotential towardsthe OER due to the formation of a poorly conductive oxide layer on thesurface of electrode. The electrical resistance of PtO2 is about 10 orders ofmagnitude higher, than that for IrO2 and RuO2 [160].
Despite of attempts to replace iridium and ruthenium by cheaper manganese-based compounds [162], present applicable OER electrocatalysts are mainlybased on iridium, ruthenium noble metals and their oxides [55].
As was shown in Figure 2.8 (Section 2.3.2), ruthenium oxide is known asthe most active catalyst towards the OER [11] and has been widely stud-ied [94, 163–167]. However, it is inclined to corrode. According to thermo-dynamical calculations, the oxidation of RuO2 to RuO4 occurs at potentialsmore positive than 1,387 V (vs. SHE) [168]. The proposed mechanism of cor-rosion can be found in Section 2.6.4. The instability of Ru-based anodes athigh overpotentials in acidic media has been proved by several studies. Themechanism of corrosion is explained by the conversion of RuO2 to soluble,non-conductive and volatile RuO4 [58, 169]. This compound was reported
3.4 Oxygen evolution electrodes (OEEs) 59
to have a boiling point of around 130 °C [170, 171]. It was confirmed exper-imentally that durability of ruthenium oxide anodes in the long-term test ispoor [110], which limits its practical use. Elevated temperatures will aggra-vate corrosion of RuO2, thus making impossible the use of Ru and its oxidesas catalysts for the OER in high temperature PEM steam electrolyzers.
Several studies were intended to improve the stability of RuO2 during anodicoxygen evolution by mixing it with IrO2. This causes a decrease in the cor-rosion rate of RuO2 depending on the IrO2 content in the mixture [17, 172].IrO2 appears to have greater stability and a reasonable activity comparedwith Ru-based electrocatalysts for such systems [55]. Apparently, IrO2 isthe most stable OER electrocatalyst for PEM water electrolyzers studieduntil now.
However, other works showed that a binary catalyst mix of IrO2 and RuO2
gives quite promising results [96, 173]. Moreover, Kotz confirmed that cat-alytic properties of binary Ru-Ir alloys depend on a shift in a redox potentialtowards the OER and surface segregation effects, not attributed to individ-ual compounds [50].
Unfortunately, high loadings of noble metals puts considerable commerciallimitations on a wider application of PEM electrolyzers and a significantreduction of loadings should be achieved [134].
One of the present trends in applied PEM electrolyzer research includesreplacement of materials containing precious metals with cheaper materi-als, based on non-precious metals. A great number of oxides have beeninvestigated [10]. But unfortunately, gained by several last decades experi-ence clearly shows, that still there are only few adequately active catalyststowards the OER, which are based on Ir, Ru and their oxides IrO2 andRuO2. Understanding this fact, it is safe to assume, that the serious atten-tion should be put in the possible reducing of the precious catalyst loading.It can be done be increasing the active surface area of the available nobleelectrocatalysts.
The reaction rate is proportional to the number of active sites on the cat-alyst surface, which indicates that the specific surface area of the catalystcontributes to its performance [174]. Thus increasing of the catalyst surfacearea is one of the ways to decrease the catalyst loading. This can be doneby two means.
The first includes doping of active oxides with other, more available ma-terials, such as SnO2, Sb2O3,TaOx,MoxOy, CeO2, etc [51, 120, 175–178].This approach involves introduction of a dopant precursor on the initialstage of catalyst synthesis and is mainly oriented towards increasing thespecific performance of the catalyst or improving its stability. Followingthis method, composite binary or even ternary catalytic oxides are usually
60 High Temperature PEM Water Electrolysis
obtained [95, 178].
Bertoncello et al. showed the possibility of preparing electrodeposited layerof composite RuO2 and PbO2 on the Ti support, presenting acceptable ac-tivity and long term performance stability [179].
Other approach involves maximizing of the activity of the catalyst by im-proving its texture and surface properties. It can be done by use of anadequate support material for the catalyst. The presence of a support canprevent particle agglomeration, thus improving the specific surface area ofthe electrode. This approach will be discussed in details in Section 2.6.3.
The OEE stability over time can be presented in the way, proposed byTrasatti [14]:
In Figure 2.18 it was shown the contributions of different components onthe overall overpotential of an electrolyzer cell (equation 3.2) [14]:
∆V = ∆E + ηa + ηc + ∆VΩ + ∆V(t) (3.2)
According this equation, the value ∆V will increase while operating thecell, as the term ∆V(t) is attributed to the “electrode stability over time”factor. ∆V can be related to the degradation of the outer surface of theelectrocatalyst and/or of the support/active layer interface in the case ofcoatings. However, electrode wear can happen without any changes in ∆Vuntil the whole catalyst is consumed. In such a case an increase of ∆V isobserved at the point of total electrode fail .
3.5 Preparation of powder electrocatalysts and filmsfor the OER
A PEM electrolyzer concept includes using of the active catalyst in the formof powder. Therefore, it is essential to review different methods of catalystpowder preparation. As it was outlined in Section 3.4, most of practicalelectrocatalysts for the OER are limited to iridium and ruthenium metalsand their oxides. This melals have similar properties and belong to thetransition metal group, thus most of the preparation methods of any of itcan be used for the synthesis of other.
3.5.1 Adams fusion technique
The Adams fusion method is based on an ion exchange reaction to obtain themetal oxide [180]. The starting compound is the complex H2IrCl6 · 4 H2O,
3.5 Preparation of powder electrocatalysts and films for the OER 61
which is dissolved in isopropanol and mixed with NaNO3, providing the sub-stitution of the chloride ligand by the nitrate ions according to the followingequation [181]:
H2IrCl6 + 6 NaNO3 → 6 NaCl + Ir(NO3)4 + 2 HNO3 (3.3)
The resulting solution is then heated until the solvent is evaporated. Theremaining solid, consisting on a mixture of NaCl and Ir(NO3)4, is heated upto 500 °C in a furnace in order to decompose the nitrate ion, according tothe following reaction:
Ir(NO3)4∆−→ IrO2 + 4 NO2↑ + O2↑ (3.4)
The final product is a mixture of IrO2 and NaCl. The oxide is thus purifiedby washing with water until the chloride concentration is lower than 40 ppm.
As it was mentioned before, RuO2 electrocatalyst can be prepared analogi-cally by this synthesis [167].
3.5.2 Polyol method
This method belongs to the “low temperature” methods of catalyst prepara-tion. Polyol method allows original synthesising of catalyst metal powders,while the metal oxide would be further formed directly at the anode in situelectrolysis (Section 2.3.2).
In this method a polyol such as ethylene glycol serves as a solvent andas a reducing agent. The glycol-metal precursor mixture is heated to refluxtemperature and metal particles are precipitated out of solution. The metal-glycol mixture is usually cooled to room temperature, washed several timesthrough centrifugation, filtered and then collected powder is dried in air.
The reducing temperature is usually around 100 °C. It was shown that irid-ium nanoparticles can be synthesized without any sintering during the pro-cess and the average size of particles can be lowered down to 3 nm [182].
Alternatively, a preparation of noble metal catalysts was reported at roomtemperature, using sodium borohydride or mixture of it with ethanol as areducing agent [55, 112, 183].
3.5.3 Modified polyol method (colloid method)
Nanopowders of iridium oxide or mixed oxide powders can be prepared byso-called ”Modified polyol method” [51, 181]. The precursor salt-ethylene
62 High Temperature PEM Water Electrolysis
glycol mixture is heated in the nitrogen protected atmosphere until the re-flux temperature and kept under stirring for 2 hours to form the colloid.This is followed by adjusting pH with alkaline solution (NaOH) and separa-tion of the colloid from glycol by centrifugation. The obtained colloid metalhydroxide is washed repeatedly in deionised water, dispersed in acetone anddried in air at 60 °C. Further the metal oxide is obtained via thermal treat-ment at 500 °C.
3.5.4 Catalyst film preparation methods
The sol-gel methods Method is based on dissolving a metal precursorin the form of acetylacetonates [CH3COCH−−C(O−)CH3]3M in the solutionof isopropanol and glacial acetic acid. The mixture is then exposed to ultra-sonic radiation to produce more stable sol. Then the sol-gel film is appliedon a base metal surface and dried on the furnace at temperature 400-600 °C.The procedure is repeated until the coating of desired amount of materialis deposited on the electrode, followed by the final heat-treatment [92, 184].This technique was reported to be used for synthesis of mixed oxides cata-lyst [172, 185].
Synthesis of metallic iridium catalyst through the sol-gel method is alsopossible by using iridium chloride as a precursor. In this case, methanolis used as a dispersion agent for the salt, followed by addition of the pre-cipitation agent (tetramethylammonium hydroxide) and stirring at 60 °C.After obtaining of precipitated Ir(OH)3, it is filtered, rinsed with methanoland dried at 60 °C. The obtained Ir(OH)3 powder is further reduced withhydrogen or argon stream at 600 °C [186].
Other techniques A number of other methods can be used for prepara-tion of noble oxide films on substrate metal, among them are electrodeposi-tion [60, 187, 188] or magnetron sputtering [121, 147].
3.6 DSA-type electrodes, their preparation andproperties
An abbreviation DSA stands for a dimensionally stable anode, which is thecurrent type of anode used in industrial production of chlorine and oxygenby electrolysis. It is essentially a sheet of titanium metal, coated with amixture of metal oxides. The electrode is called a “dimensionally stable” asthe coating has a very long service life time (several years) under conditionsof operating cell. This type of anode is a good contrast to traditionally used
3.6 DSA-type electrodes, their preparation and properties 63
carbon anodes for chlorine production, which are consumed considerablyduring the cell operation [189].
Even though dimensionally stable anodes can not be directly used in thePEM technology, the discovery of them by Henry B. Beer in the end of1960-s provoked something of a technological revolution in the large elec-trolytic industry. The invention revealed that the performance of anodesmade of thermally prepared noble metal oxides was better than of the corre-sponding noble metals. The use of these electrodes was described in severalpatents [80, 190, 191] and noble metal oxide electrocatalysts became estab-lished in many industrial electrochemical processes in the form of DSAs.
However, this fact was not instantly recorded by the open scientific literatureand the first concrete fundamental investigation on the topic appeared in theearly seventies when such electrodes had already accumulated long industrialuse. Since then, intensive research have been done on different metal oxidecoatings and preparation parameters of DSA electrodes [93, 192].
The technological impact of the so-called dimensionally stable anode basedon mixed oxides whose active component is mainly RuO2 has been decisive.Further developments are expected and pursued actively. Properties whoseimprovement is sought for are essentially electrical conduction, chemicalstability and electrocatalytic activity [10]. Chemical stability is an importantdemand as the electrocatalyst layer contains precious metals and besidesthe cost of the lost material, maintenance costs rise due to the need forelectrode replacement or re-coating. Also, the active coating layer shouldnot be passivated, providing the acceptable electronic conductivity.
Massive electrodes are not any longer common in modern technology: asa rule industrial electrodes are now made by the coating of a inert basematerial (usually titanium) with a relatively thick layer (few microns) ofthe active oxide coating. The active electrocatalytic component (more of-ten RuO2) is usually prepared by the thermal decomposition of a suitableprecursor (by pyrolysis). A stabilizing agent is often used along with theactive material, composing a mixed oxide in the active layer [61]. Amongmechanical stability promoters TiO2,TaO2, ZrO2, CeO2, SnO2 or Nb2O5
can be used [59, 193].
Even though ruthenium oxide is the most active oxide towards the OER [11],it suffer instability and therefore is usually stabilized with another oxide, e.g.IrO2 or SnO2 [50, 194, 195]. Stannic oxide easily adopts the rutile crystalstructure and therefore a solid solution, as ruthenium-tin oxide is commonlydescribed in the open literature [52, 196].
While electrodes based on RuO2 and TiO2 mixture are industrially used inchlorine-alkali cells [197], tantalum is a well-known addition to rutheniumoxide based electrodes [198]. IrO2–TaO2 oxide mixture have been suggested
64 High Temperature PEM Water Electrolysis
to be the most efficient electrocatalitic composition towards the OER inacidic electrolytes due to high activity and corrosion stability [199, 200].
As the substrate material affects properties of DSA-type oxide layers [201],is is important to choose optimal base metal. One of the demands to it isits cost as it should have reasonable price to make this material accessiblefor the mass-production. Titanium, having a low cost/performance ratio forthis application, is the most commonly used base material and is utilized foralmost all conventional DSAs [202].
A comprehensive study of electrodes with different base materials, coatedwith IrO2–RuO2–TaO2 was performed by Vercesi et al. [203]. Four metalsas titanium, zirconium, tantalum and niobium were tested along with 2alloys, e.g. “niobium-1% zirconium” and “tantalum-40% niobium”. Theresults showed that the most crucial step in preparation of the electrode,which later had great influence on the performance and service life, was thecoating layer thermal treatment procedure. While iridium and tantalumin the coating reacted with oxygen to form oxides, the base material itselfwas oxidised, and thus resulted in formation of an oxide layer between thebase material and the coating. This could lead to cracks in the coatingand building of an insulating layer between the active catalyst and the basematerial, which would greatly decrease the activity of the electrode.
The corrosion stability investigation of prepared DSAs included polarisationof the electrodes in sulphuric acid of various concentrations under 2V of an-odic overpotential (vs. SCE). Results showed that zirconium is not suitableas the base material, because its corrosion rate was a number of magnitudesgreater than that for other studied materials.
Preparation procedure influences greatly the final electrode performance,stability and service life. The traditional preparation method of DSAs in-cludes thermal decomposition (calcination) of a precursor salt (usually chlo-ride) to the corresponding oxide. The first step includes preparation of aprecursor salt solution. The corresponding metal salt is dissolved in alco-hol or water. If the DSA should consist of several oxide compounds in theactive layer, then solutions, containing corresponding metal salt precursorsare mixed to obtain the desired ratio. The prepared precursor solution isapplied on the base material and then fired at high temperature to form acompact metal oxide layer.
Use of different precursor solvents influences properties, such as wettabilityof the painting solution, which in turn varies the deposition yields. As well,solvent influences on the kinetics of thermal decomposition with furtherimpact on the electrocatalytic properties [204]. The discussion addressed tothe choice of an appropriate solvent was done by Comninellis at al. [205].As high volatility of alcohols can cause a partial evaporation of a precursor,
3.6 DSA-type electrodes, their preparation and properties 65
solvent influences the final deposition yield. It may result in overestimationof the amount of deposited material, as precursor is applied in the form ofa solution. The surface tension of the painting solution varies with differentsolvents and also influences the evaporation rate [205].
Before application of the precursor solution, the base material is pretreatedin order to provide better adherence with the active oxide layer. Typically,the procedure includes the following steps: sandblasting, ultrasonic cleaningand final etching in the concentrated acid solution [155, 193, 206].
The precursor solution is applied on the base material either by dipping,brushing, or spraying. The electrode is then heated in oven for severalminutes at low temperatures (60-100 °C) to evaporate the solvent, and thenbaked at high temperature for typically 5-10 minutes (at 300-500 °C). Theprocedure of treatment with precursor mixture is followed by drying andbaking and is repeated as many times as desired in order to obtain a coherentand contiguous layer. Eventually, electrode is calcined at high temperature,ranging typically from 300 to 550 °C during a couple of hours in order toget a compact metal oxide layer [91, 205].
The influence of calcination temperature on electrode properties was investi-gated by Ma et al. [167]. The increase of the temperature increased particlesize of RuO2. This resulted in higher electronic conductivity, but lower elec-trochemical active surface area, which is undesirable. Catalysis does nothappen on the plain surface of crystallite, but on the edges, where thereare clefts and spikes. Thus, it is important during preparation of the elec-trodes to find the optimal temperature for achieving a good balance betweencrystallite size and layer conductivity.
The composition of the mixed precursor salts may not always correspond tothe composition of the oxide coating layer. This is possible because of themetal salts, which are dissolved in e.g. alcohol, can evaporate during bakingand annealing at high temperatures, if the boiling point or/and decomposi-tion temperature are low enough [205]. It can be presented by taking intoaccount the rates of oxide formation (rf ) and evaporation/sublimation (re),which can be expressed as:
starting materialrf−→ oxide formation (3.5)
starting materialre−→ evaporation (3.6)
The rate of oxide formation is primarily dependent on the bond strength,concentrations and temperature. The rate of evaporation or sublimationdepends on the physical properties of the metal salt, e.g. melting, boilingpoints and also sublimation temperature. These two reaction rates compete
66 High Temperature PEM Water Electrolysis
with each other and when re predominates, most of the metal will be lostduring thermal decomposition [205].
There are essentially two crucial steps in the preparation of DSA electrodes.The first is drying of the precursor solution, which is a necessary step forevaporation of the solvent. Here a part of the material may evaporate ifits boiling point is too low. The second step is calcination, when the tem-perature is raised typically above 300 °C. In this state the two previouslydescribed reaction rates rf and re compete and thus influence the final com-position of the oxide layer. It has been shown that the catalytically activecompounds, such as IrO2 and RuO2, along with Ta2O5 can be depositedwith a yield close to 100 %, while losses of dispersants such as SnO2 werevery high. In fact, tin oxide layer formed by dissolving SnCl4 in 20 % HCland ethanol resulted in deposition yield of around 20 %, while when usingSnCl2 the deposition yields were around 60 %. This difference occurredbecause of different boiling points of the metal salt precursors, which are114 °C for SnCl4 and 652 °C for SnCl2. However, when preparing mixedoxides, such as SnO2−Sb2O5 from SnCl2 and SbCl5 precursors, the overalldeposition yield was only 35 %, which means the tremendously large looses.
Although very comprehensive studies of the structural and electrochemicalproperties of DSA oxides have been carried out, less is still known regard-ing the structure and electrocatalytic properties of oxide powders. This isprobably due to the fact that DSA electrodes are applied in real industrialprocesses compared with the same oxide compositions in powdered form.Therefore analysis of powder-based oxides gives an insight to the specificnature of noble metal oxides as electrocatalysts while providing a possibleuse in PEM water electrolysis applications. By using a multi-disciplined ap-proach to develop and characterize electrocatalysts, Marshall [120] achievedsignificant improvements in studying of performance and efficiency of PEMwater electrolysis cells.
3.7 Electrolytes for water electrolysis
Electrolyte is one of the main components of any type of electrolyzer. Theimportance of electrolyte is emphasized by the fact that the type of elec-trolyzer, as well as of fuel cell, is named after the type of electrolyte used.In the classical view it is traditionally a solution of acid, base or watersoluble salt in the water. When added, those dissociate into ions in thesolution, which increases conductivity of pure water. Other type of elec-trolytes are solid and can be based on a polymer (PEM) or a ceramicmembrane(SOFC/SOEC).
3.7 Electrolytes for water electrolysis 67
3.7.1 Alkaline electrolyte
This type of electrolyte is the most industrialised for today. The electrolyteis based on highly caustic potassium or sodium hydroxide (around 30 wt.%)aqueous solutions. The operating conditions are usually 70-90 °C and pres-sures from ambient up to 35 bar [41, 207]. The main disadvantages of asystem based on alkaline electrolytes are high energy consumption, frequentmaintenance and safety issues with the electrolyte [41]. The research in al-kaline water electrolysis is on the decline, more interest is put in improvingof the acidic water electrolysis. In industrial perspective the developmentof a cheap acidic water electrolyzer cell would be a great improvement tothe current alkaline electrolyzer cells. The reason is that with the acidicelectrolysis higher operating current densities and higher pressures can beachieved together with lower energy consumption and use of less voluminoussystems [149].
3.7.2 Solid oxide electrolyte
Use of ceramic membranes instead of polymer based membranes is also anoption. Ceramics are more stable at higher temperatures than polymers.However, increased electric resistance might be an issue for ceramics. Solidoxide cells use yttria or scandia-stabilised zirconia membranes as an O2−
ion conductor and can operate at temperatures around 800-1000 °C. In thetemperature interval between 600-800 °C a membrane consisting of LaGaO3
doped with small amounts of Sr and Mg can be used efficiently. Sr and Mgwill allow oxide ions to travel through the lattice structure, thus providingion flow through the membrane. A cheaper electrolyte might be based onCeO2. This ceramic is limited to temperatures less than 700 °C but thecheaper material is a major advantage [107]. Unfortunately, this technologyis still not satisfactory for industry with respect to materials and fabricationprocess [208].
3.7.3 Acidic electrolyte and polymer electrolyte membranes
The acidic water electrolysis traditionally uses sulphuric or phosphoric acidas they are stable within the potential window of water. The acid increasesthe conductivity of water through the donating protons.
The polymer electrolyte membrane (PEM) is a membrane which acts as aproton conductor in electrolyzer cell. Usually, the ionic membrane consistsof a solid polytetrafluoroethylene (PTFE) backbone, which is chemicallyaltered and contains sulfonic ionic functional groups thus the pendant sidechains terminated with −SO3−. The acid dissociates and release protons by
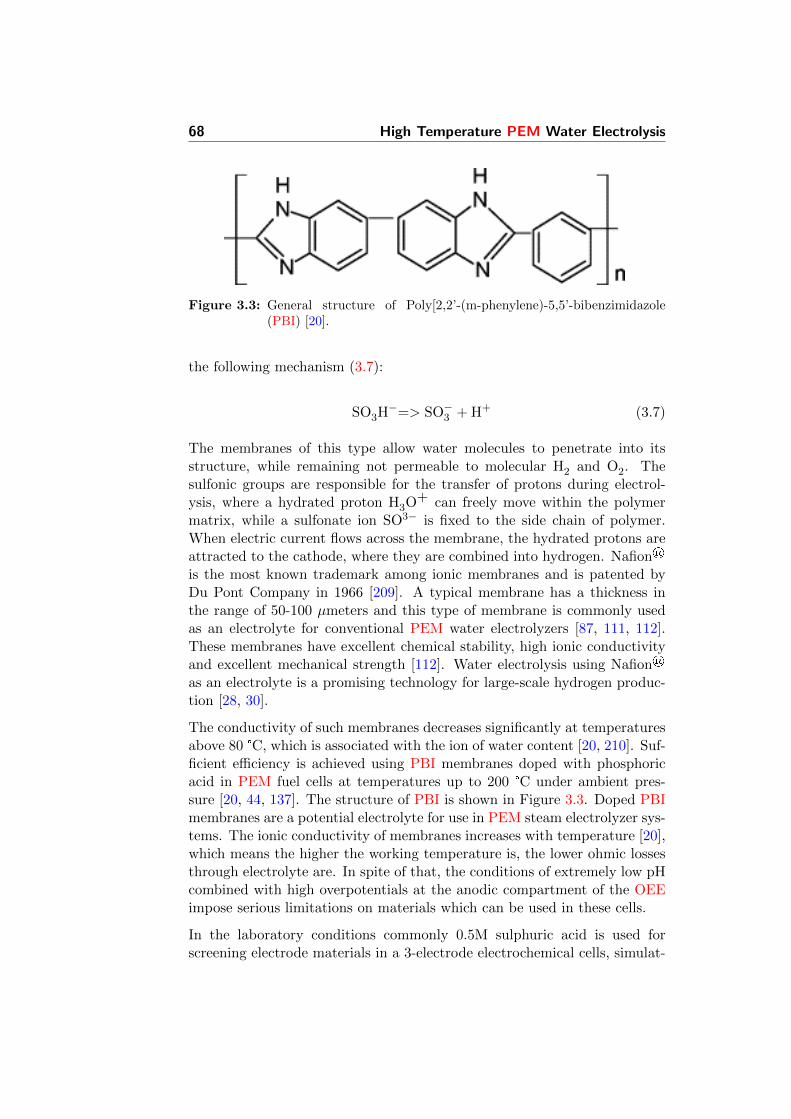
68 High Temperature PEM Water Electrolysis
Figure 3.3: General structure of Poly[2,2’-(m-phenylene)-5,5’-bibenzimidazole(PBI) [20].
the following mechanism (3.7):
SO3H−=> SO−3 + H+ (3.7)
The membranes of this type allow water molecules to penetrate into itsstructure, while remaining not permeable to molecular H2 and O2. Thesulfonic groups are responsible for the transfer of protons during electrol-ysis, where a hydrated proton H3O+ can freely move within the polymermatrix, while a sulfonate ion SO3− is fixed to the side chain of polymer.When electric current flows across the membrane, the hydrated protons areattracted to the cathode, where they are combined into hydrogen. Nafion®
is the most known trademark among ionic membranes and is patented byDu Pont Company in 1966 [209]. A typical membrane has a thickness inthe range of 50-100 µmeters and this type of membrane is commonly usedas an electrolyte for conventional PEM water electrolyzers [87, 111, 112].These membranes have excellent chemical stability, high ionic conductivityand excellent mechanical strength [112]. Water electrolysis using Nafion®
as an electrolyte is a promising technology for large-scale hydrogen produc-tion [28, 30].
The conductivity of such membranes decreases significantly at temperaturesabove 80 °C, which is associated with the ion of water content [20, 210]. Suf-ficient efficiency is achieved using PBI membranes doped with phosphoricacid in PEM fuel cells at temperatures up to 200 °C under ambient pres-sure [20, 44, 137]. The structure of PBI is shown in Figure 3.3. Doped PBImembranes are a potential electrolyte for use in PEM steam electrolyzer sys-tems. The ionic conductivity of membranes increases with temperature [20],which means the higher the working temperature is, the lower ohmic lossesthrough electrolyte are. In spite of that, the conditions of extremely low pHcombined with high overpotentials at the anodic compartment of the OEEimpose serious limitations on materials which can be used in these cells.
In the laboratory conditions commonly 0.5M sulphuric acid is used forscreening electrode materials in a 3-electrode electrochemical cells, simulat-

3.7 Electrolytes for water electrolysis 69
ing conditions of the Nafion®-based systems, which work at temperaturesbelow 100 °C [51, 120]. Since high temperature PEM cells are working attemperatures around 150 °C, H2SO4 cannot be used to simulate conditionsin the 3-electrode cell, even at high concentration. Instead, concentratedH3PO4 can ben used, which permits to work at temperatures as high as150-160 °C, depending on the composition [211].
However, it was noticed by Appleby and Van Drunen that the Tafel slopesfor noble electrocatalysts are significantly higher in concentrated phospho-ric acid than those for more diluted solutions, being the apparent cause ofadsorption of electrolyte on the electrode surface [212].
Other membranes have been investigated. The polymers which seem to beshowing potential besides PBI in high temperature water electrolysis arepolyether ketones, polyether sulfones and sulfonated polyphenyl quinoxa-lines (SPPQs). These polymers have high thermal stability and can with-stand temperatures up to 200 °C. A membrane consisting of sulfonatedpolyetheretherketone (SPEEK) has shown comparable performance withNafion® [213], but thermal stability and mechanical properties are not asgood [105].
Composites made of SPEEK and PBI have also been investigated. Theconclusion was that the proton conductivity of the composite membranesdepended on content of PBI and thermal stability of the SPEEK membranesis improved with the addition of PBI [214].
As it was fairly noticed by Miller in one of his latest publications, the costof Nafion®-based polymers calls for alternative membrane materials alongwith higher operating temperatures closer to 150 °C. These membranesare required to improve kinetics and obtain higher conversion efficienciesin solid polymer electrolyte (SPE) electrolyzers and new solid electrolytesare needed [134].
Effective and affordable membranes are very important for the commercial-isation of PEM water electrolyzers as it is both easier to manufacture andsafer as neither acid nor electrolyte are in liquid phase.
This study will not focus on the electrolyte development and solutions ofacid will be used in the experiments to simulate the conditions of PEMelectrolyzer cell.
70 High Temperature PEM Water Electrolysis
3.8 Catalyst supports in PEM systems and possi-bilities of use refractory ceramics
Design and synthesis of electrocatalysts with the“supported”structure couldgreatly improve utilisation of the expensive component, thus decreasing thenoble metal loading and, eventually, cost of the catalytic layer. Even struc-tures involving inert support materials could significantly develop morphol-ogy of electrocatalyst through geometrical interactions between active com-ponent and support (using of TiO2 in DSA electrodes is a classic example,found the industrial application).
Titanium-based supports with IrO2 as an active electrocatalyst have beeninvestigated for the OER [92, 100, 215]. However, the experiment conditionswere simulating those in low temperature PEM systems and were differentfrom conditions, found in high-temperature PEM cells.
Although Ti-based supports show good performance in Nafion®-based sys-tems [216], they most likely cannot be implemented in PBI-based mem-branes, using phosphoric acid as an electrolyte due to high rate of titaniumcorrosion at elevated temperatures in phosphoric acid [36, 153].
Advantages of a support use in the catalytic layer were discussed in Sec-tion 2.6.3. Among other parameters, support material can have influence onthe electronic structure of catalyst and enhance its activity. This effect isoften called the strong catalyst support interaction (SCSI) [88]. The inter-actions between Ebonex carbon support and Pt catalyst have been proposedto be due to the hypo-d-electron character interaction, changing the elec-tronic structure of catalyst. A synergetic effect was suggested to be dueto increase of 5d vacancy of Pt and decrease of Pt–Pt bond distances byinteraction with Ebonex carbon, which inhibits the chemisorption of OH.Regarding the oxygen reduction reaction (ORR), a shift of PtOH formationdue to this effect to more positive potentials facilitates the interaction of O2
with Pt and increases the catalyst activity [217, 218].
Hence, carbon is a widely used catalyst support material for PEM fuelcells [219]. On the other hand, one of the main reasons for fuel cell catalystdegradation is corrosion of its support, which occurs at potentials higherthan 0.207 V (vs. SHE) in oxidizing conditions [20, 220, 221]. In electroly-sis mode the corrosion speed of carbon would be much higher than in fuelcell mode due to higher anodic overpotentials of the OER [111]. The corro-sion media for carbon will be even more severe at elevated temperatures as120-200 °C [88]. Thus, carbon cannot be considered as a potential durablesupport for anode electrocatalyst in PEM electrolyzers and other materialswith considerably higher corrosion resistance need to be tested.
3.8 Catalyst supports in PEM systems and possibilities of use refractoryceramics 71
Presently, only few supports have been investigated for the oxygen evolutionelectrodes [222]. Main requirements to the OEE electrocatalyst supportare: reasonable conductivity, durability and corrosion stability. However, ifconductivity of a support is low and material has high porosity, considerableohmic drops will be measured in the active layer.
As discussed by S.Trasatti, a catalytic layer of 5 µm thickness with the re-sistivity of 10−2 Ω · cm will present resistance of 5 µΩ per unit apparentsurface area (1 cm2). Having a current flow of 1 A/cm2, the ohmic drop willonly be 5 µV. It means that for measuring a meaning ohmic drop of 5 mV,the resistivity of the catalytic layer should be in the order of 100 Ω · cm (1Ω ·m). A good example could be TiO2 + RuO2 mixtures in traditional DSAelectrodes. As TiO2 is a good insulator, the total conductivity of the layertakes place through RuO2 clusters, and it drops significantly with decreas-ing of RuO2 content. It happens due to the interruption in the conductivechains. That is the reason why the electrodes composition cannot be de-creased below 15-20 % of RuO2 [14]. This type of conduction mechanismis also attributed to ceramic resistors, where RuO2 is embedded in isolatingSiO2 [223, 224].
Therefore, some of the materials, which possess modest electric conductivitycan be used as an anode for acidic solutions [225]. In the mentioned study,p−Si with electrical resistance of 1-3 mΩ · cm was employed as a substratefor the active IrO2 and results showed that this material can be used forpreparation of DSA-type electrodes. Description of the DSAs and theirpreparation was given in Section 3.6
Indeed, the choice of materials in the area is highly limited, which is directlyconnected with increased cell voltages applied in the electrolyzer mode.
Referring to an another experience, gained during long years of industry andresearch of aluminium electrolysis, it was recognised that the search for inertanode materials is one of the most difficult challenges for modern materialsscience. It was also noticed, that it can well be that there is no material,that can meet the requirements of an industrial cell [226]. Later, Kvandeoutlined that large efforts have been done in the area, but none of them ledto any acceptable material. The work in this field may perhaps be describedas a long and mostly unfruitful struggle [227].
Only a dimensionally and chemically stable, as well as readily available andreasonably conductive material should be used for this application. Amongothers, ceramic materials are promising candidates. Previous works showedthat those have a potential application in the PEM fuel cell (PEMFC)systems [216]. Carbides present a class of high temperature stable refrac-tory materials, among them are boron [228], titanium [16] and silicon car-bide [229, 230].
72 High Temperature PEM Water Electrolysis
As it was outlined before, raw materials for preparation of inert anode or/andits support should be preferably cheap and readily available. Therefore, sil-icon carbide, a potential catalyst support for heterogeneous catalysis, canbe a promising candidate [86]. It is known as a hard, refractory and chem-ically inert material [231]. It has also notable corrosion resistance in acidicmedia [232].
Electronic conductivity of this material is quite poor, however doping withappropriate elements can significantly increase this property [233]. Highstability of silicon carbide in phosphoric acid solutions is a considerableadvantage of this material, giving a new horizon for its electrochemical ap-plications [71]. However, it was also proposed that free Si containing in SiCis mainly responsible for its corrosion [71].
Several studies reported successful use of silicon carbide as a catalyst sup-port for PEM fuel cells [229, 230]. However, at present there are almostno publications covering any catalyst support investigations for electrolyz-ers [222]. Indeed, this area of research is more challenging and the materialchoice is highly limited, which is directly connected with the increased cellvoltages applied in the electrolyzer mode.
In this work the importance of supported catalysts in the development ofmore efficient and lasting OEEs is expressed. Therefore, the main goal ofthis work is to study influence of the selected support on the electrochemicalbehaviour of IrO2 active catalyst. To fulfil this, a refractory silicon carbide-silicon material (free Si less than 22%) was used as a support material andsupported catalysts with different compositions were prepared and tested,along with pure IrO2 and SiC-Si sample powders.
The Adams fusion is known as an old and reproducible technique for synthe-sis of nano-sized catalyst particles (Section 3.5.1). As the last step of thisprocedure involves calcination of a precursor at rather high temperatures(350-500 C), a limited number of materials can withstand these conditionswithout being oxidised. SiC is a refractory material, withstanding these tem-peratures. Therefore, it was interesting to study its behaviour as a potentialOER catalyst support.
Chapter 4
Construction Materials forHigh Temperature PEM
Electrolyzers
Parts of this chapter has been published in the International Journal of Hy-drogen Energy 2011;36(1):111–119, as a “Corrosion behaviour of construc-tion materials for high temperature steam electrolyzers.” [36].
4.1 Experimental part
4.1.1 Materials and reactants
For preparation of the samples and the electrochemical experiments, thefollowing substances were used:
Demineralised water
H3PO4 85%, Sigma Aldrich, puriss. p.a. (analytical purity)
H2SO4 95-97%, Sigma Aldrich, puriss
Nafion® suspension, 5-6% in 50% propanol-water solution, by DuPont
Ta plate electrode, Good Fellow Cambridge Ltd.
Austenitic stainless steel plate (AISI 316L, AISI 321, AISI 347, an-nealed type of temper), by Good Fellow Cambridge Limited, England
and Ti foil, by Good Fellow Cambridge Limited (England)
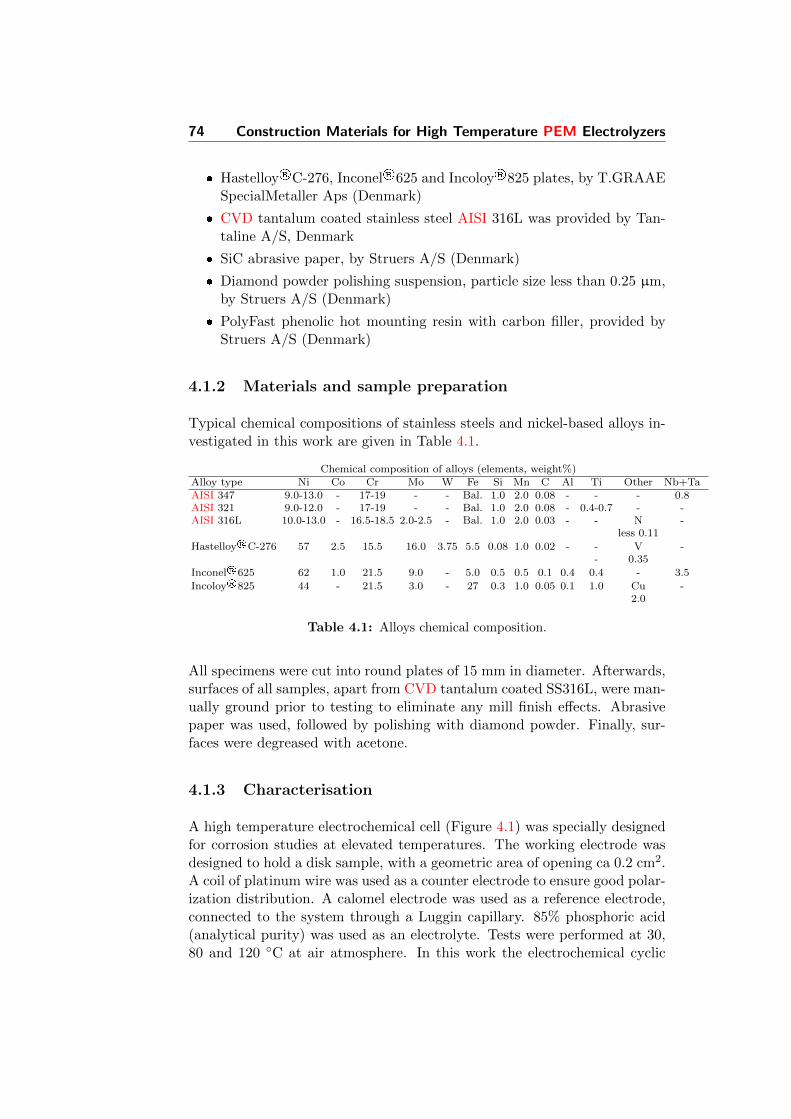
74 Construction Materials for High Temperature PEM Electrolyzers
Hastelloy®C-276, Inconel®625 and Incoloy®825 plates, by T.GRAAESpecialMetaller Aps (Denmark)
CVD tantalum coated stainless steel AISI 316L was provided by Tan-taline A/S, Denmark
SiC abrasive paper, by Struers A/S (Denmark)
Diamond powder polishing suspension, particle size less than 0.25 µm,by Struers A/S (Denmark)
PolyFast phenolic hot mounting resin with carbon filler, provided byStruers A/S (Denmark)
4.1.2 Materials and sample preparation
Typical chemical compositions of stainless steels and nickel-based alloys in-vestigated in this work are given in Table 4.1.
Chemical composition of alloys (elements, weight%)Alloy type Ni Co Cr Mo W Fe Si Mn C Al Ti Other Nb+TaAISI 347 9.0-13.0 - 17-19 - - Bal. 1.0 2.0 0.08 - - - 0.8AISI 321 9.0-12.0 - 17-19 - - Bal. 1.0 2.0 0.08 - 0.4-0.7 - -AISI 316L 10.0-13.0 - 16.5-18.5 2.0-2.5 - Bal. 1.0 2.0 0.03 - - N -
less 0.11
Hastelloy®C-276 57 2.5 15.5 16.0 3.75 5.5 0.08 1.0 0.02 - - V -- 0.35
Inconel®625 62 1.0 21.5 9.0 - 5.0 0.5 0.5 0.1 0.4 0.4 - 3.5
Incoloy®825 44 - 21.5 3.0 - 27 0.3 1.0 0.05 0.1 1.0 Cu -2.0
Table 4.1: Alloys chemical composition.
All specimens were cut into round plates of 15 mm in diameter. Afterwards,surfaces of all samples, apart from CVD tantalum coated SS316L, were man-ually ground prior to testing to eliminate any mill finish effects. Abrasivepaper was used, followed by polishing with diamond powder. Finally, sur-faces were degreased with acetone.
4.1.3 Characterisation
A high temperature electrochemical cell (Figure 4.1) was specially designedfor corrosion studies at elevated temperatures. The working electrode wasdesigned to hold a disk sample, with a geometric area of opening ca 0.2 cm2.A coil of platinum wire was used as a counter electrode to ensure good polar-ization distribution. A calomel electrode was used as a reference electrode,connected to the system through a Luggin capillary. 85% phosphoric acid(analytical purity) was used as an electrolyte. Tests were performed at 30,80 and 120 C at air atmosphere. In this work the electrochemical cyclic
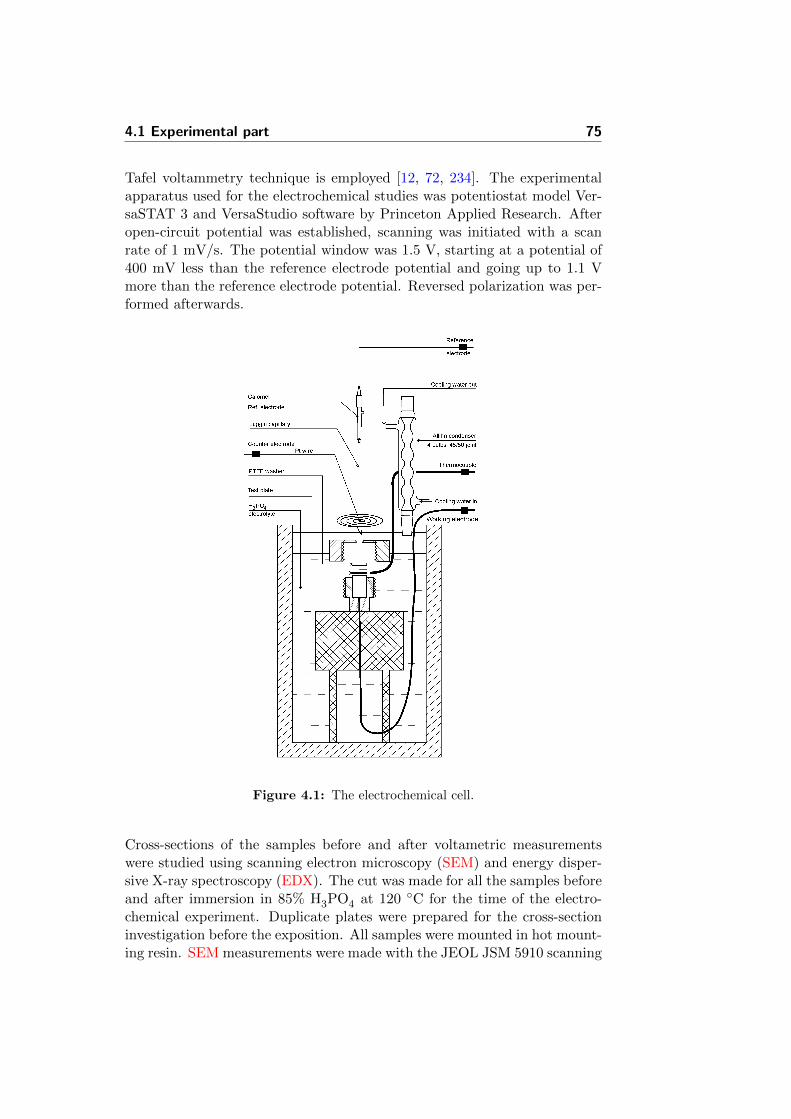
4.1 Experimental part 75
Tafel voltammetry technique is employed [12, 72, 234]. The experimentalapparatus used for the electrochemical studies was potentiostat model Ver-saSTAT 3 and VersaStudio software by Princeton Applied Research. Afteropen-circuit potential was established, scanning was initiated with a scanrate of 1 mV/s. The potential window was 1.5 V, starting at a potential of400 mV less than the reference electrode potential and going up to 1.1 Vmore than the reference electrode potential. Reversed polarization was per-formed afterwards.
Figure 4.1: The electrochemical cell.
Cross-sections of the samples before and after voltametric measurementswere studied using scanning electron microscopy (SEM) and energy disper-sive X-ray spectroscopy (EDX). The cut was made for all the samples beforeand after immersion in 85% H3PO4 at 120 C for the time of the electro-chemical experiment. Duplicate plates were prepared for the cross-sectioninvestigation before the exposition. All samples were mounted in hot mount-ing resin. SEM measurements were made with the JEOL JSM 5910 scanning

76 Construction Materials for High Temperature PEM Electrolyzers
electron microscope. The EDX-system used was INCA from Oxford Instru-ment (accelerating voltage 20.00 kV, working distance 10 mm).
4.2 Results and discussion
Figure 4.2 represents the polarisation curves for platinum and gold foil,which show the electrochemical stability window for these materials andelectrolyte in concentrated phosphoric acid at 120 C. It can be seen thatplatinum is a better catalyst for O2− oxidation then gold (Figure 4.2).
Figure 4.2: Potential window for Pt and Au in 85% H3PO4, 120 C, 1 mV/s (vs.SHE).
The method of corrossion rate calculation, described in Section 2.4.2 wasapplied to all experiments. Figures 4.3-4.8 present Tafel plots for the mate-rials tested, obtained at 80 C and 120 C. Anodic exchange current densityvalues were obtained from cyclic Tafel plots [12]. Corresponding corrosioncurrents and approximate corrosion rates were calculated as described inSection 2.4.2 and are presented in Table 4.2. Approximate CRs were calcu-lated in terms of penetration rate, using the Faraday’s Law [73].
For all studied materials there is a dramatic influence of temperature oncorrosion rate, which grows with increasing temperature.
It can be seen from cyclic Tafel behaviour, that for all of the studied alloys,corrosion is of a local type, i.e. pitting or intergranular (Figures 4.3-4.6).
The analysis of the shape of cyclic Tafel voltammograms can give usefulinformation about possible corrosion mechanisms [72]. Particularly, datarelated to pitting behaviour can be obtained using a method, proposed by
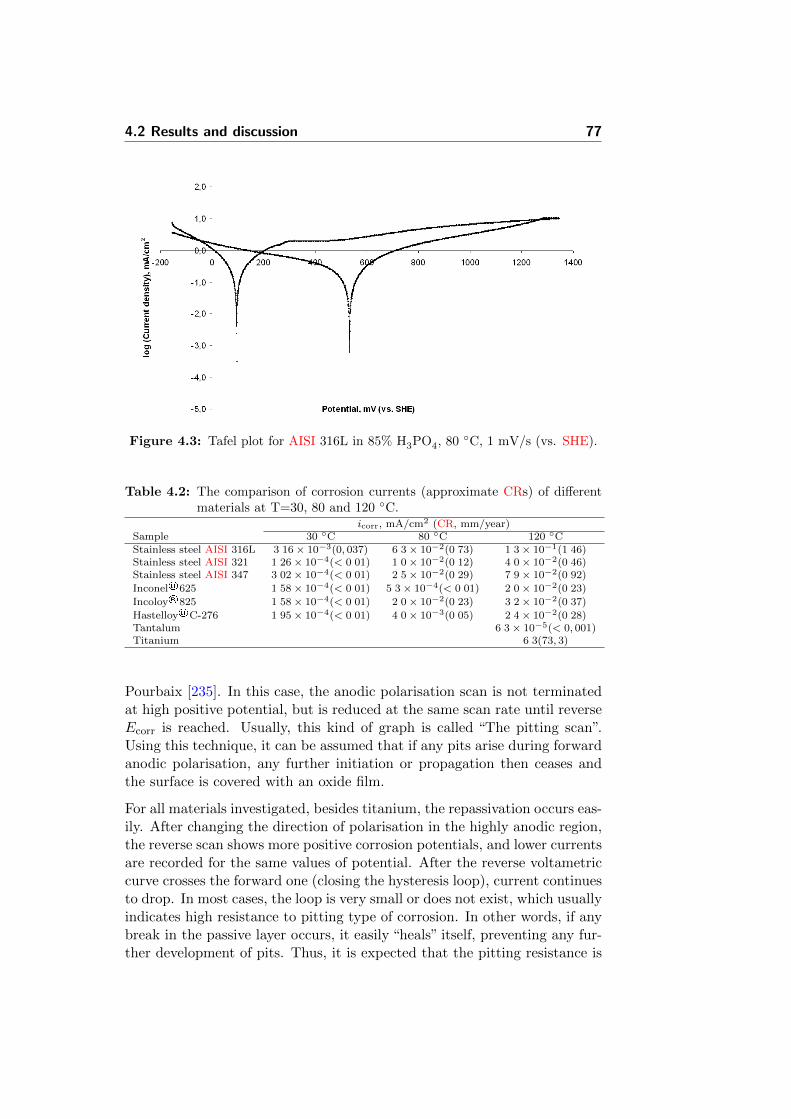
4.2 Results and discussion 77
Figure 4.3: Tafel plot for AISI 316L in 85% H3PO4, 80 C, 1 mV/s (vs. SHE).
Table 4.2: The comparison of corrosion currents (approximate CRs) of differentmaterials at T=30, 80 and 120 C.
icorr, mA/cm2 (CR, mm/year)Sample 30 C 80 C 120 CStainless steel AISI 316L 3 16× 10−3(0, 037) 6 3× 10⁻²(0 73) 1 3× 10⁻¹(1 46)Stainless steel AISI 321 1 26× 10−4(< 0 01) 1 0× 10−2(0 12) 4 0× 10−2(0 46)Stainless steel AISI 347 3 02× 10−4(< 0 01) 2 5× 10⁻²(0 29) 7 9× 10⁻²(0 92)
Inconel®625 1 58× 10−4(< 0 01) 5 3× 10⁻⁴(< 0 01) 2 0× 10−2(0 23)
Incoloy®825 1 58× 10−4(< 0 01) 2 0× 10−2(0 23) 3 2× 10⁻²(0 37)
Hastelloy®C-276 1 95× 10−4(< 0 01) 4 0× 10−3(0 05) 2 4× 10⁻²(0 28)Tantalum 6 3× 10⁻⁵(< 0, 001)Titanium 6 3(73, 3)
Pourbaix [235]. In this case, the anodic polarisation scan is not terminatedat high positive potential, but is reduced at the same scan rate until reverseEcorr is reached. Usually, this kind of graph is called “The pitting scan”.Using this technique, it can be assumed that if any pits arise during forwardanodic polarisation, any further initiation or propagation then ceases andthe surface is covered with an oxide film.
For all materials investigated, besides titanium, the repassivation occurs eas-ily. After changing the direction of polarisation in the highly anodic region,the reverse scan shows more positive corrosion potentials, and lower currentsare recorded for the same values of potential. After the reverse voltametriccurve crosses the forward one (closing the hysteresis loop), current continuesto drop. In most cases, the loop is very small or does not exist, which usuallyindicates high resistance to pitting type of corrosion. In other words, if anybreak in the passive layer occurs, it easily “heals” itself, preventing any fur-ther development of pits. Thus, it is expected that the pitting resistance is
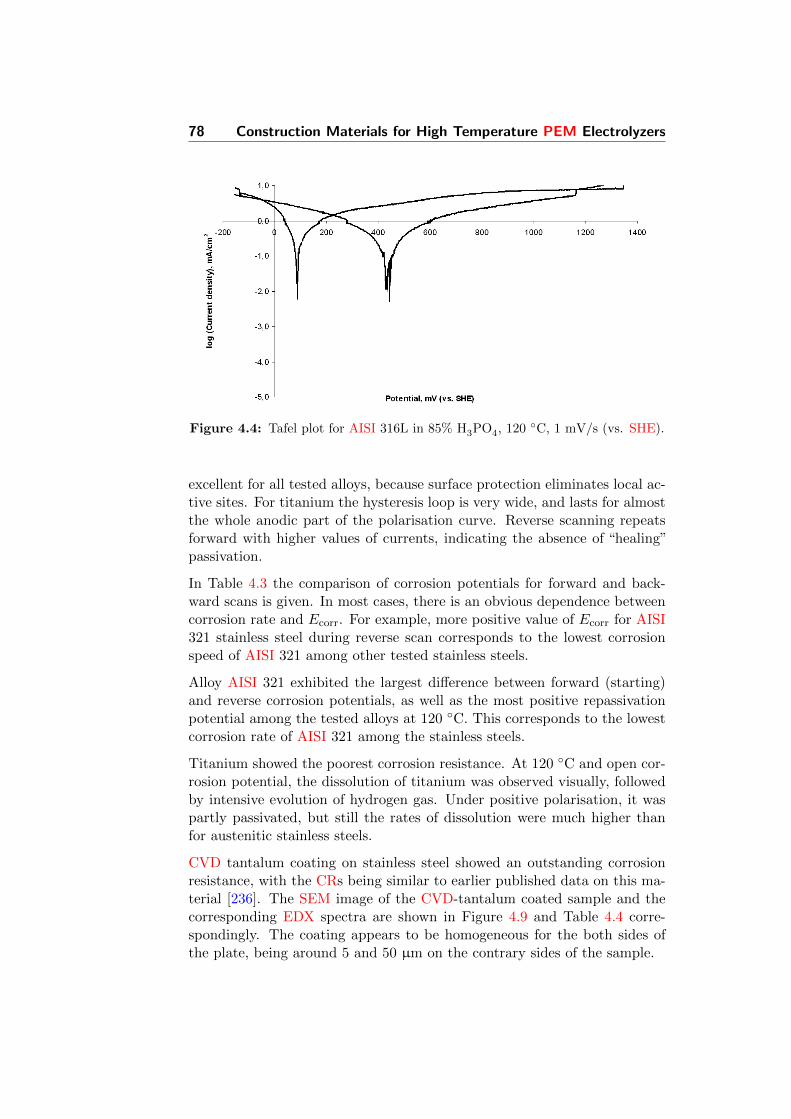
78 Construction Materials for High Temperature PEM Electrolyzers
Figure 4.4: Tafel plot for AISI 316L in 85% H3PO4, 120 C, 1 mV/s (vs. SHE).
excellent for all tested alloys, because surface protection eliminates local ac-tive sites. For titanium the hysteresis loop is very wide, and lasts for almostthe whole anodic part of the polarisation curve. Reverse scanning repeatsforward with higher values of currents, indicating the absence of “healing”passivation.
In Table 4.3 the comparison of corrosion potentials for forward and back-ward scans is given. In most cases, there is an obvious dependence betweencorrosion rate and Ecorr. For example, more positive value of Ecorr for AISI321 stainless steel during reverse scan corresponds to the lowest corrosionspeed of AISI 321 among other tested stainless steels.
Alloy AISI 321 exhibited the largest difference between forward (starting)and reverse corrosion potentials, as well as the most positive repassivationpotential among the tested alloys at 120 C. This corresponds to the lowestcorrosion rate of AISI 321 among the stainless steels.
Titanium showed the poorest corrosion resistance. At 120 C and open cor-rosion potential, the dissolution of titanium was observed visually, followedby intensive evolution of hydrogen gas. Under positive polarisation, it waspartly passivated, but still the rates of dissolution were much higher thanfor austenitic stainless steels.
CVD tantalum coating on stainless steel showed an outstanding corrosionresistance, with the CRs being similar to earlier published data on this ma-terial [236]. The SEM image of the CVD-tantalum coated sample and thecorresponding EDX spectra are shown in Figure 4.9 and Table 4.4 corre-spondingly. The coating appears to be homogeneous for the both sides ofthe plate, being around 5 and 50 µm on the contrary sides of the sample.
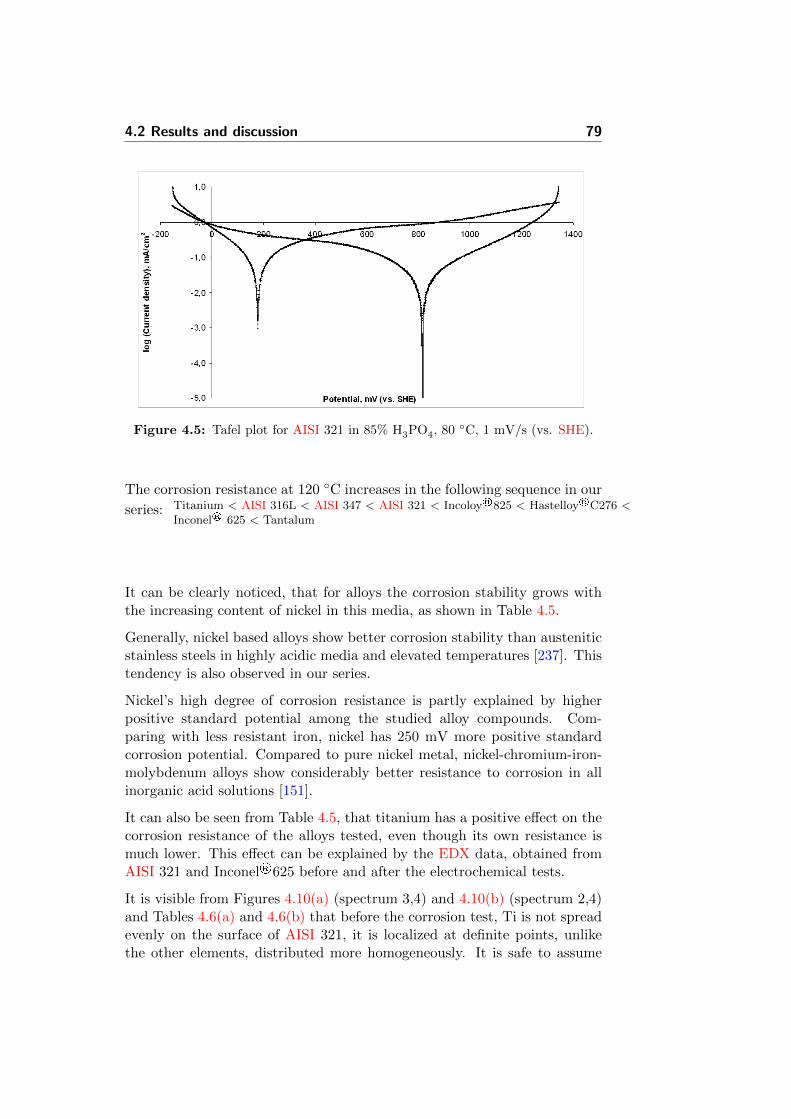
4.2 Results and discussion 79
Figure 4.5: Tafel plot for AISI 321 in 85% H3PO4, 80 C, 1 mV/s (vs. SHE).
The corrosion resistance at 120 C increases in the following sequence in our
series: Titanium < AISI 316L < AISI 347 < AISI 321 < Incoloy®825 < Hastelloy®C276 <Inconel® 625 < Tantalum
It can be clearly noticed, that for alloys the corrosion stability grows withthe increasing content of nickel in this media, as shown in Table 4.5.
Generally, nickel based alloys show better corrosion stability than austeniticstainless steels in highly acidic media and elevated temperatures [237]. Thistendency is also observed in our series.
Nickel’s high degree of corrosion resistance is partly explained by higherpositive standard potential among the studied alloy compounds. Com-paring with less resistant iron, nickel has 250 mV more positive standardcorrosion potential. Compared to pure nickel metal, nickel-chromium-iron-molybdenum alloys show considerably better resistance to corrosion in allinorganic acid solutions [151].
It can also be seen from Table 4.5, that titanium has a positive effect on thecorrosion resistance of the alloys tested, even though its own resistance ismuch lower. This effect can be explained by the EDX data, obtained fromAISI 321 and Inconel®625 before and after the electrochemical tests.
It is visible from Figures 4.10(a) (spectrum 3,4) and 4.10(b) (spectrum 2,4)and Tables 4.6(a) and 4.6(b) that before the corrosion test, Ti is not spreadevenly on the surface of AISI 321, it is localized at definite points, unlikethe other elements, distributed more homogeneously. It is safe to assume
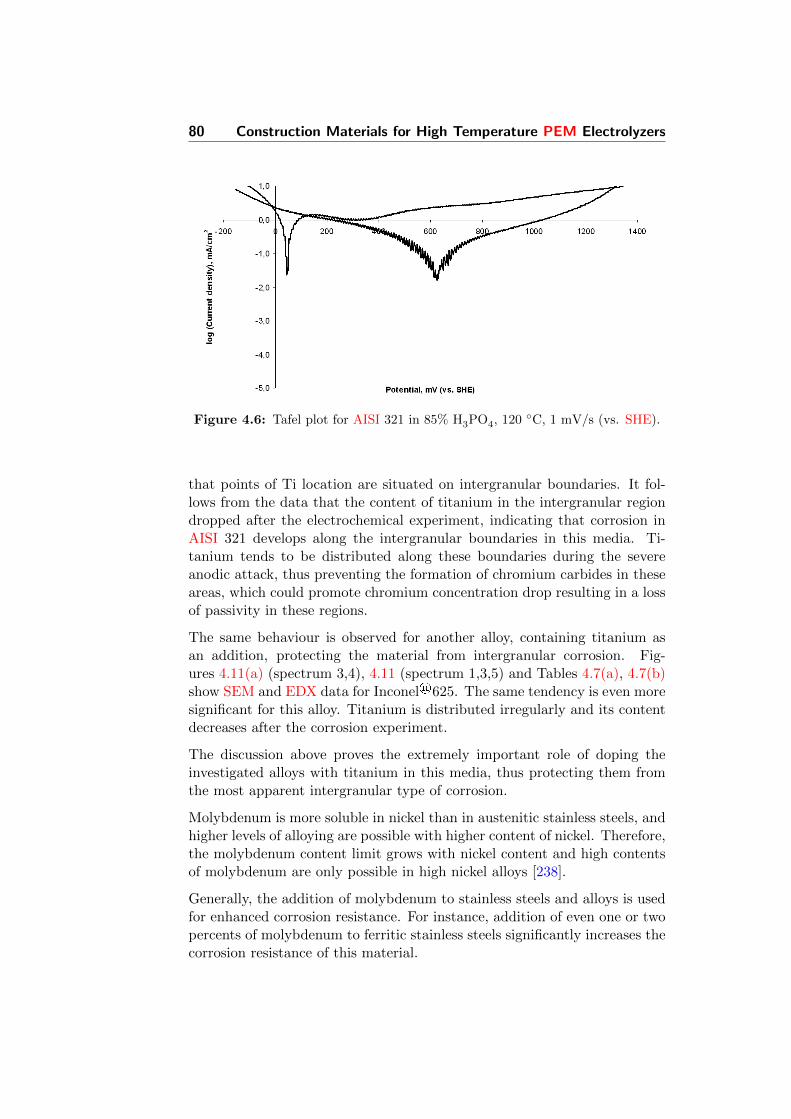
80 Construction Materials for High Temperature PEM Electrolyzers
Figure 4.6: Tafel plot for AISI 321 in 85% H3PO4, 120 C, 1 mV/s (vs. SHE).
that points of Ti location are situated on intergranular boundaries. It fol-lows from the data that the content of titanium in the intergranular regiondropped after the electrochemical experiment, indicating that corrosion inAISI 321 develops along the intergranular boundaries in this media. Ti-tanium tends to be distributed along these boundaries during the severeanodic attack, thus preventing the formation of chromium carbides in theseareas, which could promote chromium concentration drop resulting in a lossof passivity in these regions.
The same behaviour is observed for another alloy, containing titanium asan addition, protecting the material from intergranular corrosion. Fig-ures 4.11(a) (spectrum 3,4), 4.11 (spectrum 1,3,5) and Tables 4.7(a), 4.7(b)show SEM and EDX data for Inconel®625. The same tendency is even moresignificant for this alloy. Titanium is distributed irregularly and its contentdecreases after the corrosion experiment.
The discussion above proves the extremely important role of doping theinvestigated alloys with titanium in this media, thus protecting them fromthe most apparent intergranular type of corrosion.
Molybdenum is more soluble in nickel than in austenitic stainless steels, andhigher levels of alloying are possible with higher content of nickel. Therefore,the molybdenum content limit grows with nickel content and high contentsof molybdenum are only possible in high nickel alloys [238].
Generally, the addition of molybdenum to stainless steels and alloys is usedfor enhanced corrosion resistance. For instance, addition of even one or twopercents of molybdenum to ferritic stainless steels significantly increases thecorrosion resistance of this material.
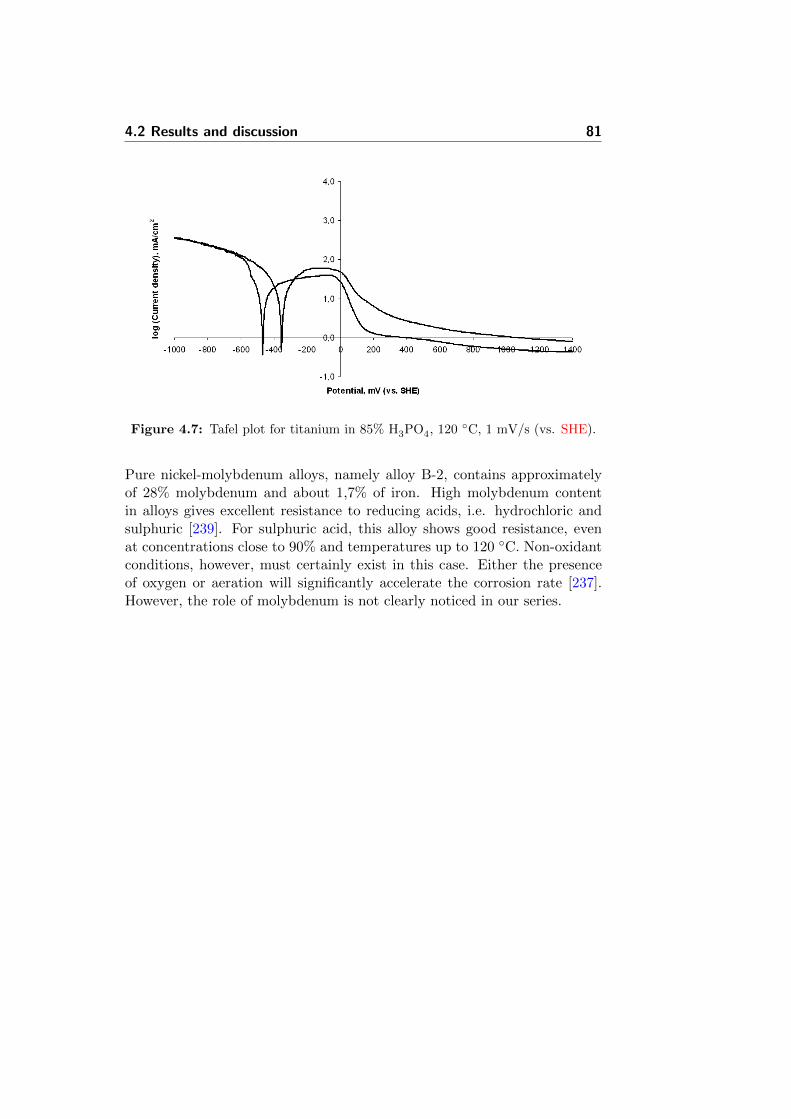
4.2 Results and discussion 81
Figure 4.7: Tafel plot for titanium in 85% H3PO4, 120 C, 1 mV/s (vs. SHE).
Pure nickel-molybdenum alloys, namely alloy B-2, contains approximatelyof 28% molybdenum and about 1,7% of iron. High molybdenum contentin alloys gives excellent resistance to reducing acids, i.e. hydrochloric andsulphuric [239]. For sulphuric acid, this alloy shows good resistance, evenat concentrations close to 90% and temperatures up to 120 C. Non-oxidantconditions, however, must certainly exist in this case. Either the presenceof oxygen or aeration will significantly accelerate the corrosion rate [237].However, the role of molybdenum is not clearly noticed in our series.
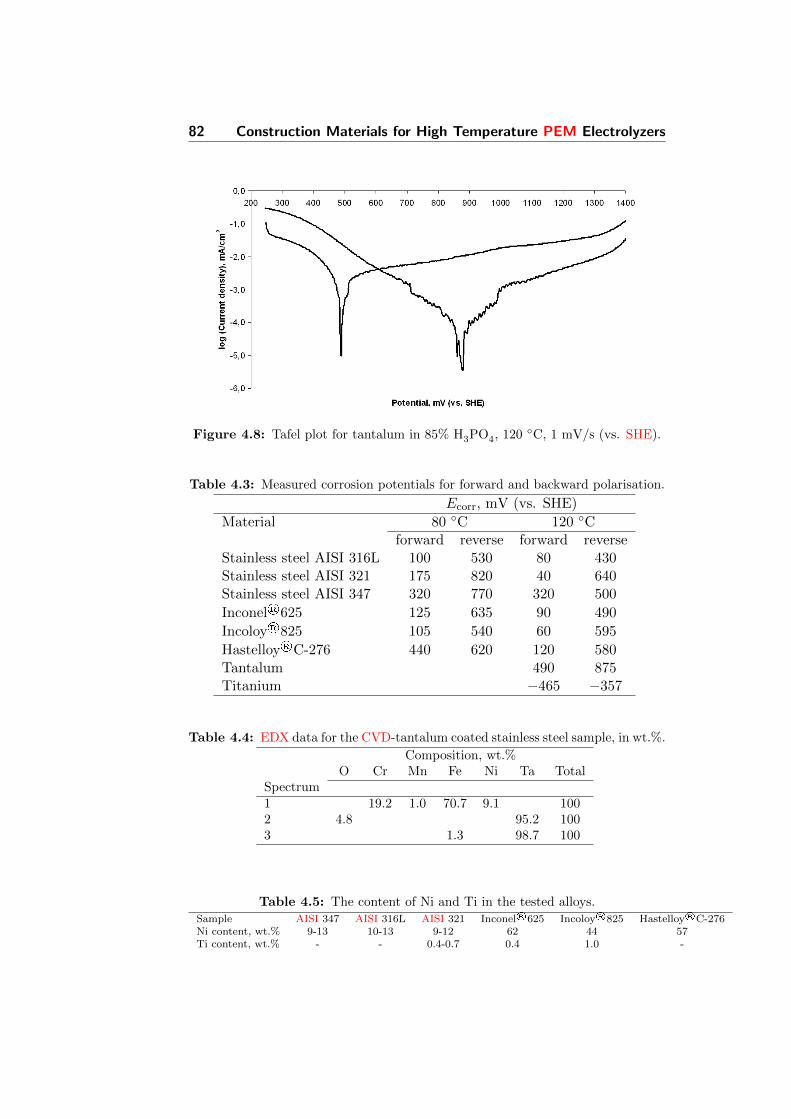
82 Construction Materials for High Temperature PEM Electrolyzers
Figure 4.8: Tafel plot for tantalum in 85% H3PO4, 120 C, 1 mV/s (vs. SHE).
Table 4.3: Measured corrosion potentials for forward and backward polarisation.
Ecorr, mV (vs. SHE)
Material 80 C 120 Cforward reverse forward reverse
Stainless steel AISI 316L 100 530 80 430Stainless steel AISI 321 175 820 40 640Stainless steel AISI 347 320 770 320 500
Inconel®625 125 635 90 490
Incoloy®825 105 540 60 595
Hastelloy®C-276 440 620 120 580Tantalum 490 875Titanium −465 −357
Table 4.4: EDX data for the CVD-tantalum coated stainless steel sample, in wt.%.
Composition, wt.%O Cr Mn Fe Ni Ta Total
Spectrum1 19.2 1.0 70.7 9.1 1002 4.8 95.2 1003 1.3 98.7 100
Table 4.5: The content of Ni and Ti in the tested alloys.Sample AISI 347 AISI 316L AISI 321 Inconel®625 Incoloy®825 Hastelloy®C-276Ni content, wt.% 9-13 10-13 9-12 62 44 57Ti content, wt.% - - 0.4-0.7 0.4 1.0 -
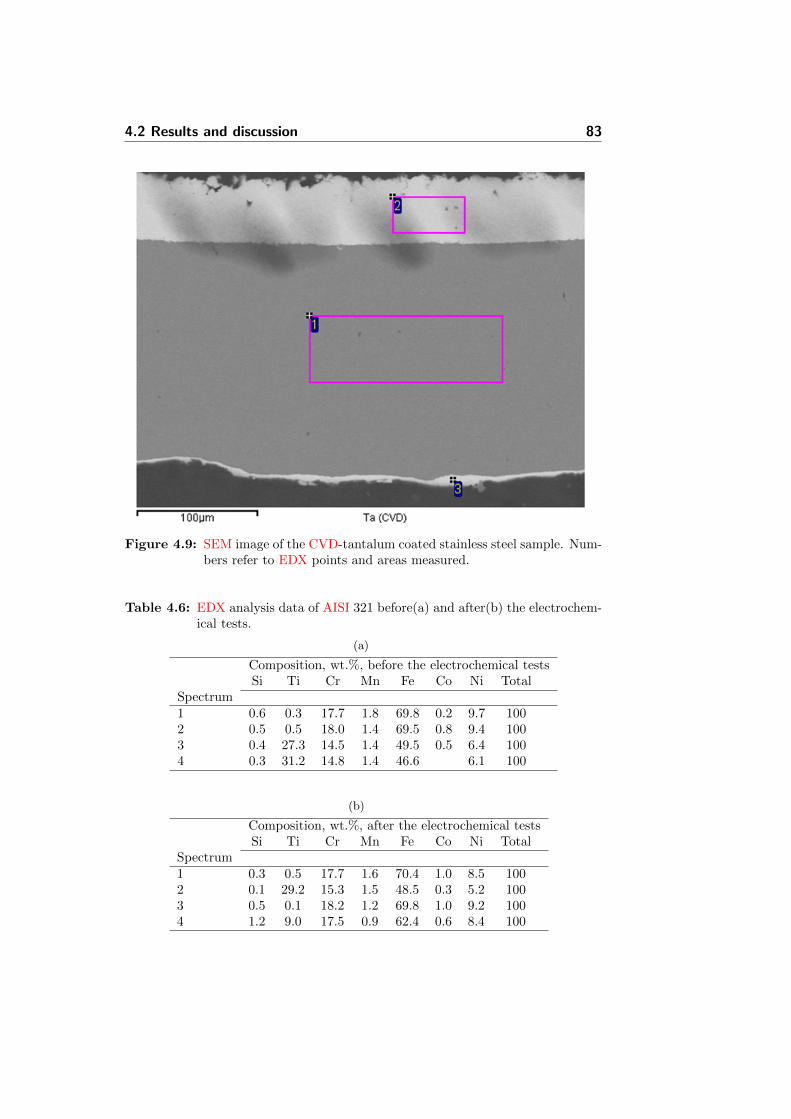
4.2 Results and discussion 83
Figure 4.9: SEM image of the CVD-tantalum coated stainless steel sample. Num-bers refer to EDX points and areas measured.
Table 4.6: EDX analysis data of AISI 321 before(a) and after(b) the electrochem-ical tests.
(a)
Composition, wt.%, before the electrochemical testsSi Ti Cr Mn Fe Co Ni Total
Spectrum1 0.6 0.3 17.7 1.8 69.8 0.2 9.7 1002 0.5 0.5 18.0 1.4 69.5 0.8 9.4 1003 0.4 27.3 14.5 1.4 49.5 0.5 6.4 1004 0.3 31.2 14.8 1.4 46.6 6.1 100
(b)
Composition, wt.%, after the electrochemical testsSi Ti Cr Mn Fe Co Ni Total
Spectrum1 0.3 0.5 17.7 1.6 70.4 1.0 8.5 1002 0.1 29.2 15.3 1.5 48.5 0.3 5.2 1003 0.5 0.1 18.2 1.2 69.8 1.0 9.2 1004 1.2 9.0 17.5 0.9 62.4 0.6 8.4 100
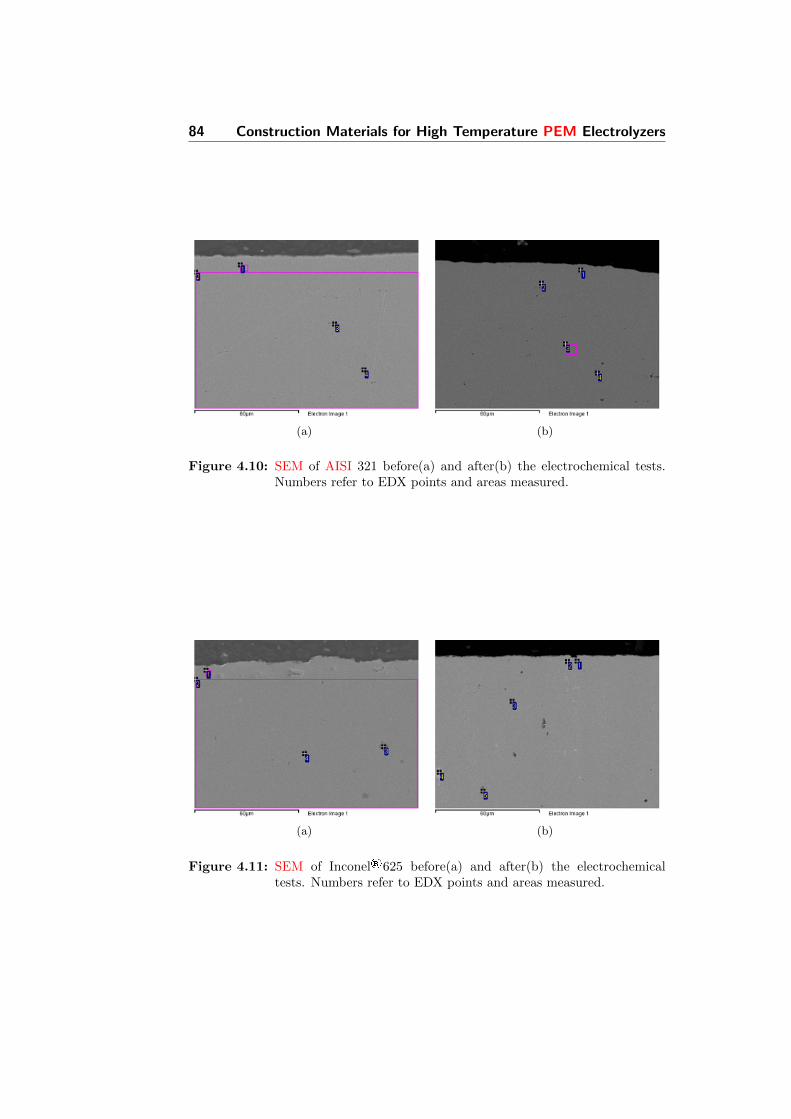
84 Construction Materials for High Temperature PEM Electrolyzers
(a) (b)
Figure 4.10: SEM of AISI 321 before(a) and after(b) the electrochemical tests.Numbers refer to EDX points and areas measured.
(a) (b)
Figure 4.11: SEM of Inconel®625 before(a) and after(b) the electrochemicaltests. Numbers refer to EDX points and areas measured.
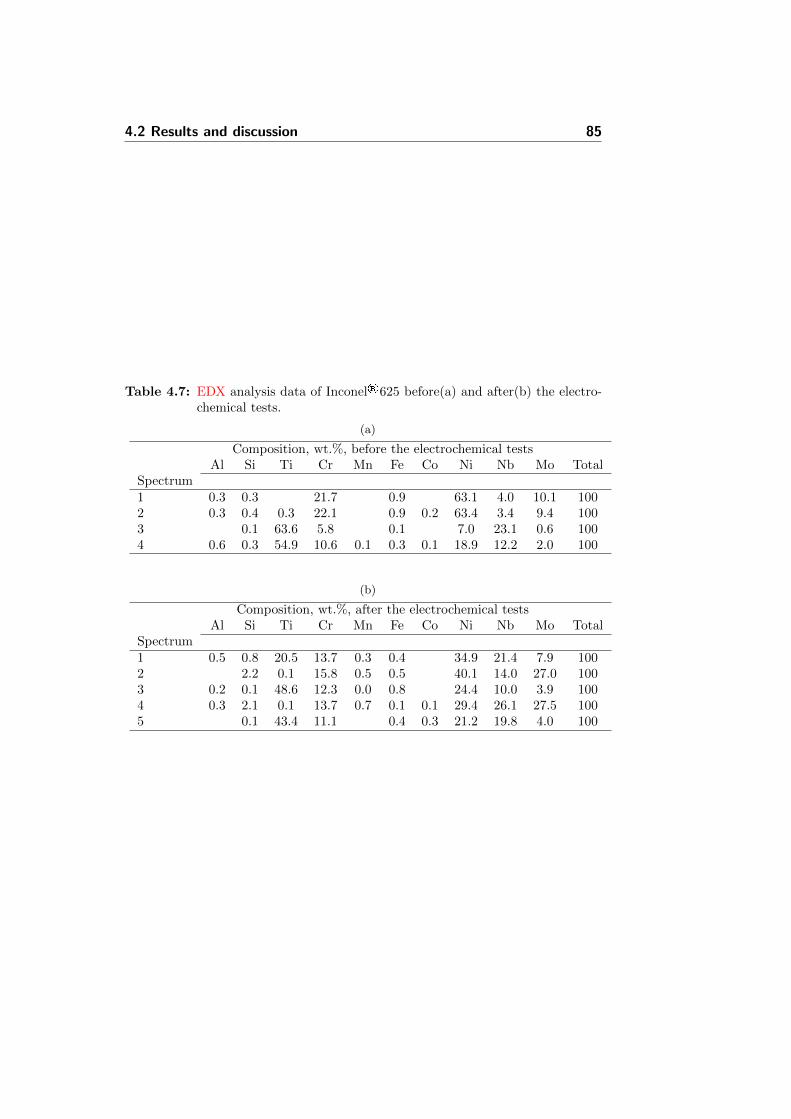
4.2 Results and discussion 85
Table 4.7: EDX analysis data of Inconel®625 before(a) and after(b) the electro-chemical tests.
(a)
Composition, wt.%, before the electrochemical testsAl Si Ti Cr Mn Fe Co Ni Nb Mo Total
Spectrum1 0.3 0.3 21.7 0.9 63.1 4.0 10.1 1002 0.3 0.4 0.3 22.1 0.9 0.2 63.4 3.4 9.4 1003 0.1 63.6 5.8 0.1 7.0 23.1 0.6 1004 0.6 0.3 54.9 10.6 0.1 0.3 0.1 18.9 12.2 2.0 100
(b)
Composition, wt.%, after the electrochemical testsAl Si Ti Cr Mn Fe Co Ni Nb Mo Total
Spectrum1 0.5 0.8 20.5 13.7 0.3 0.4 34.9 21.4 7.9 1002 2.2 0.1 15.8 0.5 0.5 40.1 14.0 27.0 1003 0.2 0.1 48.6 12.3 0.0 0.8 24.4 10.0 3.9 1004 0.3 2.1 0.1 13.7 0.7 0.1 0.1 29.4 26.1 27.5 1005 0.1 43.4 11.1 0.4 0.3 21.2 19.8 4.0 100
86 Construction Materials for High Temperature PEM Electrolyzers
4.3 Conclusions
It has been established that tantalum coated AISI 316L stainless steel andInconel® 625 are the most suitable materials for bipolar plate in high tem-perature steam electrolyzers with H3PO4 doped membranes. It has alsobeen found that small addition of titanium to the alloys increases the corro-sion stability in this media. Among austenitic stainless steels, AISI 321 hasthe lowest corrosion rate.
Anodic passivation with decreased rate of dissolution was observed from theTafel plots for all alloys and metals studied, indicating the formation of aprotective oxide layer. The best corrosion resistance was found for tanta-lum. The titanium content was found to be an important parameter in theperformance of the steels. The accumulation of titanium on the intergranu-lar boundaries was assumed to inhibit the growth of chromium carbides inthese regions, preventing intergranular corrosion of the samples. However,pure titanium showed the poorest resistance to corrosion, accompanied bythe lowest corrosion potentials in the series and highest corrosion currents.Therefore, these facts exclude it as a possible material for use in bipolarplates in high temperature PEM steam electrolyzers.
Chapter 5
Preparation and Study ofIrO2/SiC−Si Supported AnodeCatalyst for High Temperature
PEM Steam Electrolyzers
Parts of this chapter has been published in the International Journal ofHydrogen Energy 2011;36(10):5797–5805, as a “Preparation and study ofIrO2/Si-Si supported anode catalyst for high temperature PEM steam elec-trolyzers.” [38].
5.1 Experimental part
5.1.1 Materials and reactants
For preparation of the samples and the electrochemical experiments, thefollowing substances were used:
SiC-Si sintered composite plate (<22% free Si), supplied by the “StatePowder Metallurgy Plant”, Brovary, Ukraine
H2IrCl6 · 4 H2O, Alfa Aesar, 99 %
NaNO3, Sigma Aldrich, A.C.S. reagent
Isopropanol, Fluka Analytical, pure
88Preparation and Study of IrO2/SiC−Si Supported Anode Catalyst for
High Temperature PEM Steam Electrolyzers
Demineralised water
H3PO4 85%, Sigma Aldrich, puriss. p.a. (analytical purity)
Nafion® suspension, 5-6% in 50% propanol-water solution, by DuPont
Ta rod electrode, Good Fellow Cambridge Ltd.
Ag2SO4 99,9%, Chempur
5.1.2 SiC-Si/IrO2 powder catalyst preparation
Catalyst support powder was prepared according to the following procedure:the as-received plate was cut with a diamond saw into squared samples with1 cm side. The thickness of the plates was 2 mm. The prepared plates werecleaned in a ultrasonic bath, degreased with acetone, washed with deminer-alised water and finally dried at 80 °C. As it was described in Section 2.6.3,a support with a high specific area is needed in order to contribute to a gooddistribution of the active phase of the catalyst. Therefore, ball milling wasemployed for grinding the raw material. The ball milling ensures a moderateincrease of specific area by particle size reduction. The silicon carbide-siliconplates were milled in a planetary ball mill (Fritsch, Pulverisette 7). SinceSiC is a material with high hardness, a mill made of conventional steelscould not be used for this procedure. This is due to the relative softness ofsteel, and associated risk of contamination of the sample by self abrasion ofthe steel balls and a possible tribochemical reaction. Therefore, two 45 mlsteel vials, covered with tungsten carbide wear resistant lining were used.Milling was performed in a vial, which contained 6 WC balls, each 15 mmin diameter. The working vial contained 2 g of the starting material. Themill was operated at 730 r.p.m. from 5 to 35 minutes for different samples.
In order to deposit the active material directly on the support surface, irid-ium oxide was in-situ synthesised on the prepared SiC-Si support. As thesupport was added at the initial stage of the Adams fusion method, into theinitial solution of catalyst precursor (see Section 3.5.1), it was expected thatIrO2 would adhere to the surface of the support. In order to determine thedegree of chloride impurities in the final step of the synthesis, precipitationwith Ag2SO4 was used as a qualitative test. The equilibrium chloride con-centration is lower than the impurity degree required, thus ensuring that theoxide is pure enough. The iridium oxide content in the prepared catalystwas varied from 0 to 100 wt.% in steps of 10 wt.%. The calcinated productsappeared to be fine powders, changing colour from black to more greyishwith the increasing support content in composition.
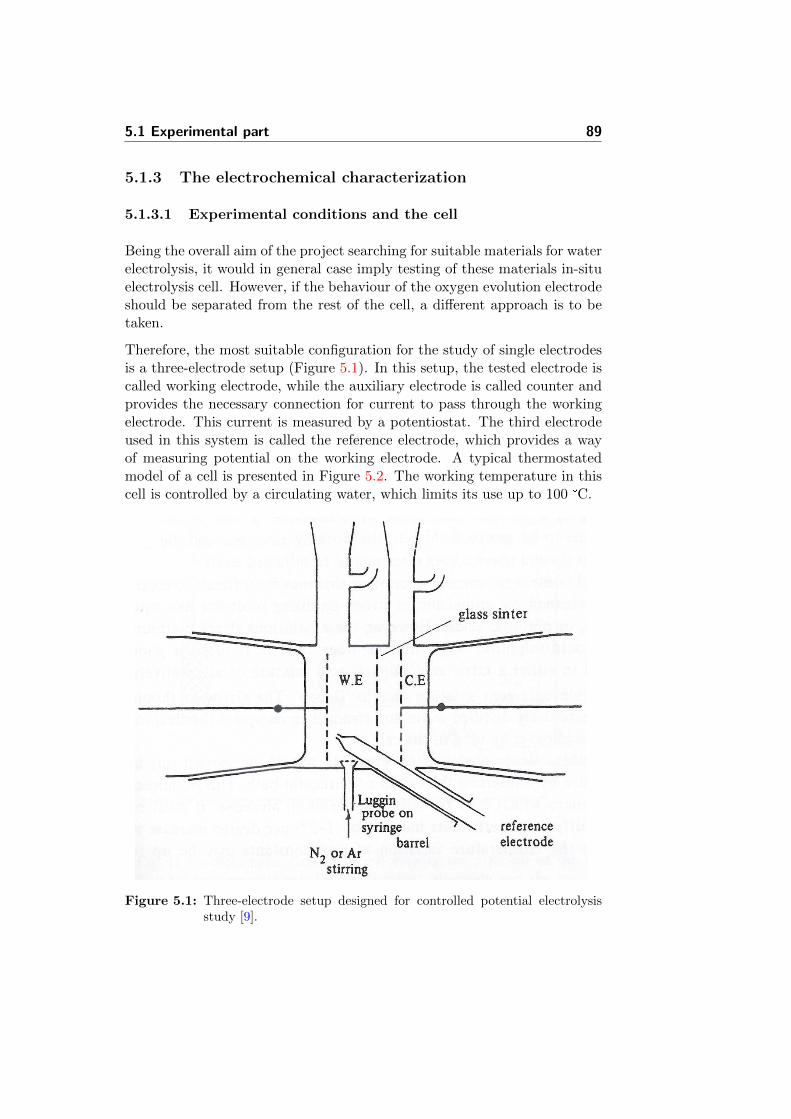
5.1 Experimental part 89
5.1.3 The electrochemical characterization
5.1.3.1 Experimental conditions and the cell
Being the overall aim of the project searching for suitable materials for waterelectrolysis, it would in general case imply testing of these materials in-situelectrolysis cell. However, if the behaviour of the oxygen evolution electrodeshould be separated from the rest of the cell, a different approach is to betaken.
Therefore, the most suitable configuration for the study of single electrodesis a three-electrode setup (Figure 5.1). In this setup, the tested electrode iscalled working electrode, while the auxiliary electrode is called counter andprovides the necessary connection for current to pass through the workingelectrode. This current is measured by a potentiostat. The third electrodeused in this system is called the reference electrode, which provides a wayof measuring potential on the working electrode. A typical thermostatedmodel of a cell is presented in Figure 5.2. The working temperature in thiscell is controlled by a circulating water, which limits its use up to 100 °C.
Figure 5.1: Three-electrode setup designed for controlled potential electrolysisstudy [9].
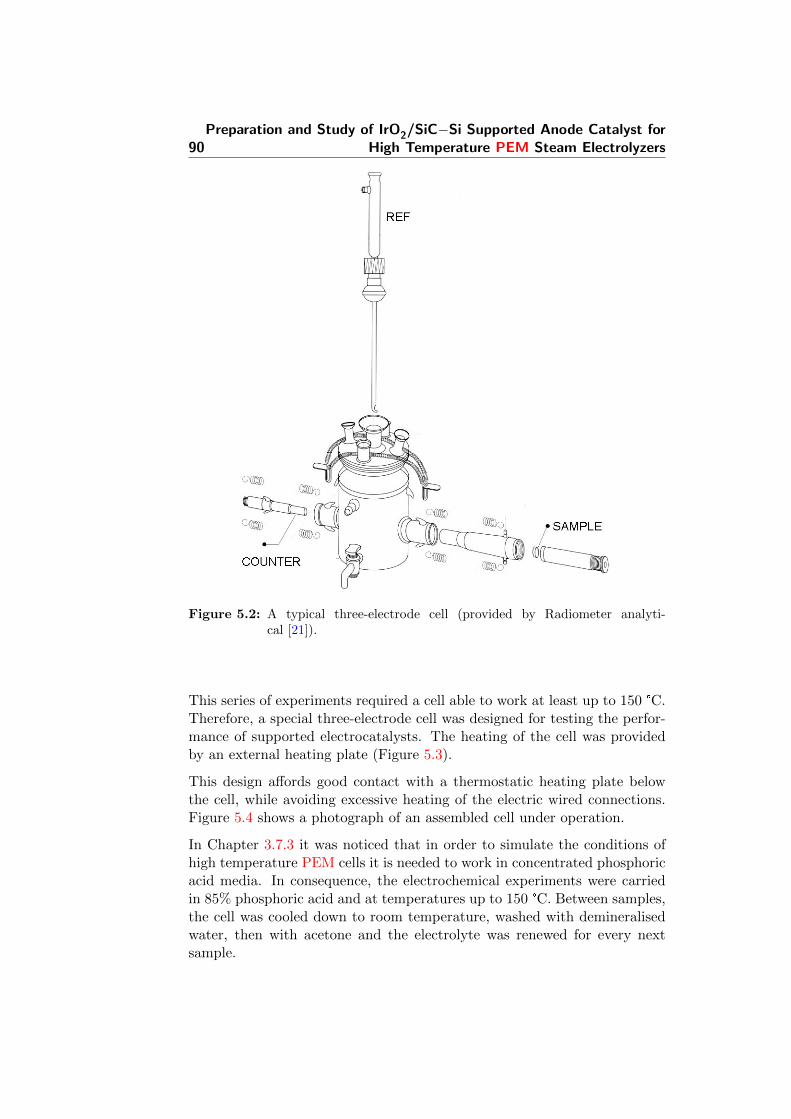
90Preparation and Study of IrO2/SiC−Si Supported Anode Catalyst for
High Temperature PEM Steam Electrolyzers
Figure 5.2: A typical three-electrode cell (provided by Radiometer analyti-cal [21]).
This series of experiments required a cell able to work at least up to 150 °C.Therefore, a special three-electrode cell was designed for testing the perfor-mance of supported electrocatalysts. The heating of the cell was providedby an external heating plate (Figure 5.3).
This design affords good contact with a thermostatic heating plate belowthe cell, while avoiding excessive heating of the electric wired connections.Figure 5.4 shows a photograph of an assembled cell under operation.
In Chapter 3.7.3 it was noticed that in order to simulate the conditions ofhigh temperature PEM cells it is needed to work in concentrated phosphoricacid media. In consequence, the electrochemical experiments were carriedin 85% phosphoric acid and at temperatures up to 150 °C. Between samples,the cell was cooled down to room temperature, washed with demineralisedwater, then with acetone and the electrolyte was renewed for every nextsample.
5.1 Experimental part 91
Cyclic voltammetry experiments were carried from room temperature (ca.23 °C) to 80 °C, 120 °C and 150 °C, with the experiments performed fromlower to higher temperatures. The temperature tolerance allowed duringthe experiments was ± 3 °C. Temperature was controlled by a k-type ther-mocouple, covered with Teflon® PTFE (by Omega Co.) and inserted intothe working cell.
5.1.3.2 Cyclic voltammetry experiments
For each temperature, a series of CV experiments at different scan rateswere carried out for all electrodes in the following sequence: 200, 100, 50,20, 10 mV/s.
In all experiments a commercial platinum plate as a counter electrode and aKCl-saturated standard calomel reference electrode (SCE), connected to thesystem through a Luggin capillary were employed, provided by RadiometerAnalytical SAS.
When studying the electrochemical behaviour of electrocatalysts, it is con-venient to ensure that the electrode has a certain stability during the ex-periments performed. In addition, because of bubble formation during theOER, the catalyst layer can get easily detached from the working electrode,spoiling the experiment. However, the focus of this work was to investigatethe support-catalyst interaction rather than to make a full characterizationof the electrode. For a comparison of the different samples, it is not neces-sary to test them in an electrolysis cell, being sufficient to measure a specificcatalyst activity at lower potentials [166, 195].
Therefore, the CV experiments were performed in the potential windowstarting at 0.0 V, going to the vertex potential of +1.2 V and reversing backto the initial value of 0.0 V (all potentials are vs. SCE). This allowed obser-vation of the reversible redox behaviour of IrO2 while avoiding formation ofsignificant amounts of oxygen which could detach the catalyst layer from theworking electrode. This permitted usage of the same sample for experimentsat elevated temperatures.
Because of the need to minimise the transient double layer capacitance con-tributions (see Section 2.4.1), cyclic staircase voltammetry technique waschosen for electrochemical evaluation of electrocatalyst. An open circuit of10 seconds was maintained between each experiment.
The experimental apparatus used for the electrochemical studies was a Ver-saSTAT 3 potentiostat and VersaStudio software by Princeton Applied Re-search.
92Preparation and Study of IrO2/SiC−Si Supported Anode Catalyst for
High Temperature PEM Steam Electrolyzers
5.1.3.3 Corrosion stability tests
For investigation of corrosion stability of the material, plates prepared asdescribed in Section 5.1.2 were used. The testing of the material was per-formed in a specially designed cell, presented in Section 4.1.3 [36].
5.1.3.4 Preparation of Nafion®-bonded electrodes for CV inves-tigation
In order to estimate the electrochemical performance of the prepared elec-trocatalyst powder, the following procedure was performed.
A tantalum cylinder, accurately embedded in a Teflon® PTFE body wasused as a working electrode (Figure 5.5). The diameter of the cylinder was7.5 mm which corresponded to the active surface area of 0.44 cm2. Tantalumwas chosen because of its superior corrosion resistance in hot phosphoric acidsolutions, while having necessary conductivity and mechanical strength [36,70].
However, the preliminary results showed that tantalum working electrodeis passivated in the anodic conditions present during the cyclic voltamme-try experiments. That led to difficulties of observing reasonable behaviourfor each next catalyst powder sample deposited. Therefore, its surface waspolished before every single experiment. Silicon carbide abrasive paper wasused, followed by polishing with polycrystalline diamond powder (StruersA/S (Denmark)) with a particle size less than 0.25 µm. Finally, the surfacewas degreased with acetone and rinsed with demineralised water. The cat-alyst suspensions were prepared by adding of a 1 mg portion of preparedpowder to 1 mL of demineralised water. The suspension was dispersed inan ultrasonic bath for 1 hour. Immediately after a 30 µL portion of thesuspension was applied on the surface of the working electrode, following bydrying of the catalyst layer under nitrogen protective atmosphere. A secondsuspension, consisting of 1% solution in water of 5 wt.% Nafion® was ap-plied on top of the catalyst layer and dried in the same manner. This wasdone for improving the cohesion of the deposited catalyst layer. Therefore,each electrode contained 30 µg of sample powder. All 11 test electrodes wereprepared in the same manner, using equal amount of applied sample, whileranging in its composition of active IrO2 from 0 to 100 wt.% with a step of10 wt.%.
The nominal composition of the prepared samples is shown in Table 5.1.
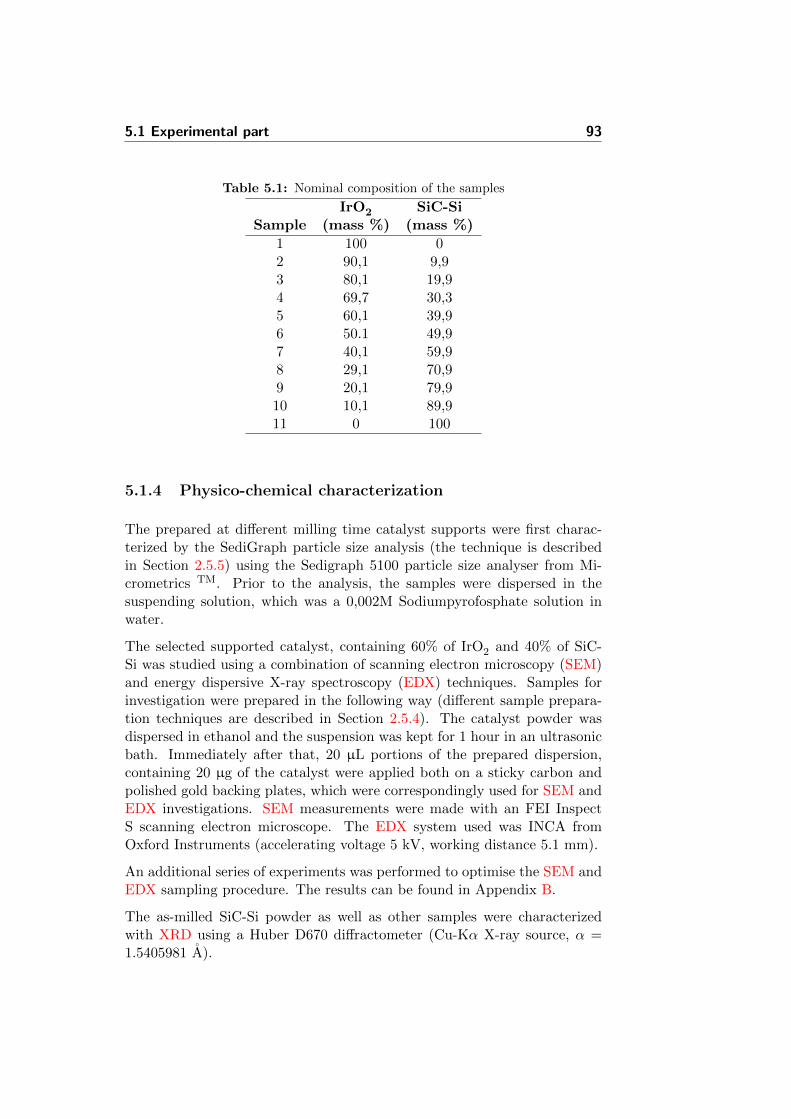
5.1 Experimental part 93
Table 5.1: Nominal composition of the samples
IrO2 SiC-SiSample (mass %) (mass %)
1 100 02 90,1 9,93 80,1 19,94 69,7 30,35 60,1 39,96 50.1 49,97 40,1 59,98 29,1 70,99 20,1 79,910 10,1 89,911 0 100
5.1.4 Physico-chemical characterization
The prepared at different milling time catalyst supports were first charac-terized by the SediGraph particle size analysis (the technique is describedin Section 2.5.5) using the Sedigraph 5100 particle size analyser from Mi-crometrics TM. Prior to the analysis, the samples were dispersed in thesuspending solution, which was a 0,002M Sodiumpyrofosphate solution inwater.
The selected supported catalyst, containing 60% of IrO2 and 40% of SiC-Si was studied using a combination of scanning electron microscopy (SEM)and energy dispersive X-ray spectroscopy (EDX) techniques. Samples forinvestigation were prepared in the following way (different sample prepara-tion techniques are described in Section 2.5.4). The catalyst powder wasdispersed in ethanol and the suspension was kept for 1 hour in an ultrasonicbath. Immediately after that, 20 µL portions of the prepared dispersion,containing 20 µg of the catalyst were applied both on a sticky carbon andpolished gold backing plates, which were correspondingly used for SEM andEDX investigations. SEM measurements were made with an FEI InspectS scanning electron microscope. The EDX system used was INCA fromOxford Instruments (accelerating voltage 5 kV, working distance 5.1 mm).
An additional series of experiments was performed to optimise the SEM andEDX sampling procedure. The results can be found in Appendix B.
The as-milled SiC-Si powder as well as other samples were characterizedwith XRD using a Huber D670 diffractometer (Cu-Kα X-ray source, α =1.5405981 A).
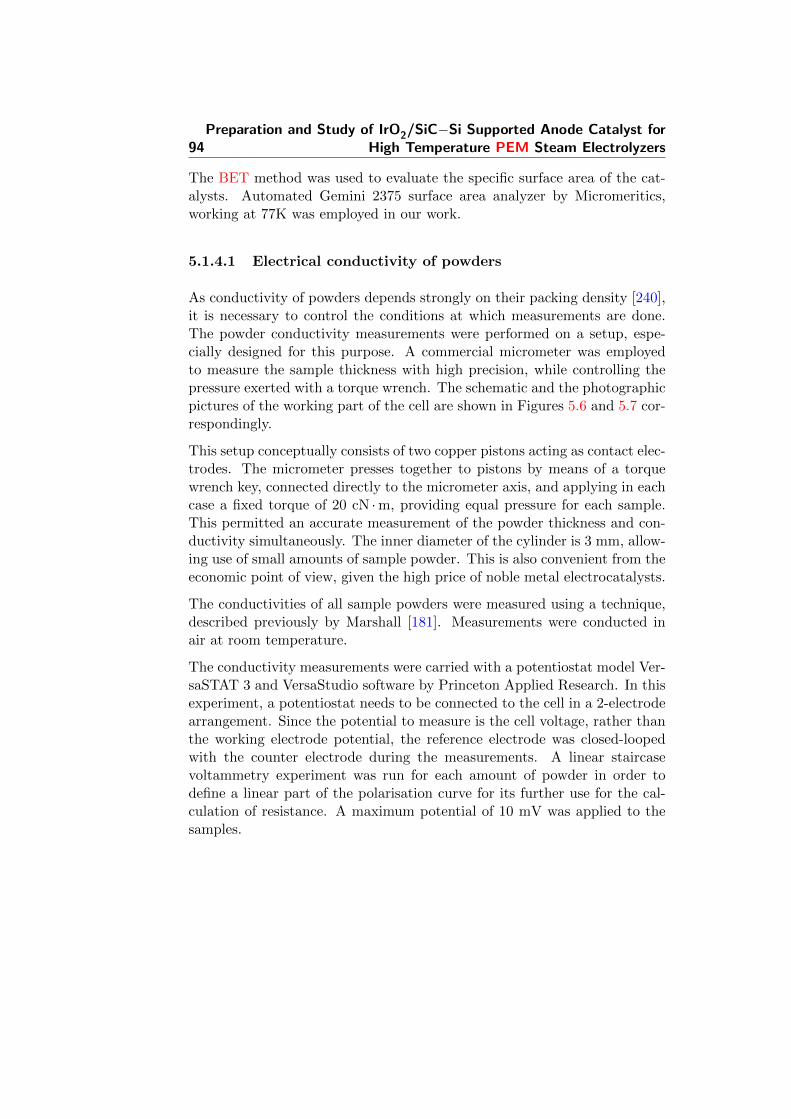
94Preparation and Study of IrO2/SiC−Si Supported Anode Catalyst for
High Temperature PEM Steam Electrolyzers
The BET method was used to evaluate the specific surface area of the cat-alysts. Automated Gemini 2375 surface area analyzer by Micromeritics,working at 77K was employed in our work.
5.1.4.1 Electrical conductivity of powders
As conductivity of powders depends strongly on their packing density [240],it is necessary to control the conditions at which measurements are done.The powder conductivity measurements were performed on a setup, espe-cially designed for this purpose. A commercial micrometer was employedto measure the sample thickness with high precision, while controlling thepressure exerted with a torque wrench. The schematic and the photographicpictures of the working part of the cell are shown in Figures 5.6 and 5.7 cor-respondingly.
This setup conceptually consists of two copper pistons acting as contact elec-trodes. The micrometer presses together to pistons by means of a torquewrench key, connected directly to the micrometer axis, and applying in eachcase a fixed torque of 20 cN ·m, providing equal pressure for each sample.This permitted an accurate measurement of the powder thickness and con-ductivity simultaneously. The inner diameter of the cylinder is 3 mm, allow-ing use of small amounts of sample powder. This is also convenient from theeconomic point of view, given the high price of noble metal electrocatalysts.
The conductivities of all sample powders were measured using a technique,described previously by Marshall [181]. Measurements were conducted inair at room temperature.
The conductivity measurements were carried with a potentiostat model Ver-saSTAT 3 and VersaStudio software by Princeton Applied Research. In thisexperiment, a potentiostat needs to be connected to the cell in a 2-electrodearrangement. Since the potential to measure is the cell voltage, rather thanthe working electrode potential, the reference electrode was closed-loopedwith the counter electrode during the measurements. A linear staircasevoltammetry experiment was run for each amount of powder in order todefine a linear part of the polarisation curve for its further use for the cal-culation of resistance. A maximum potential of 10 mV was applied to thesamples.
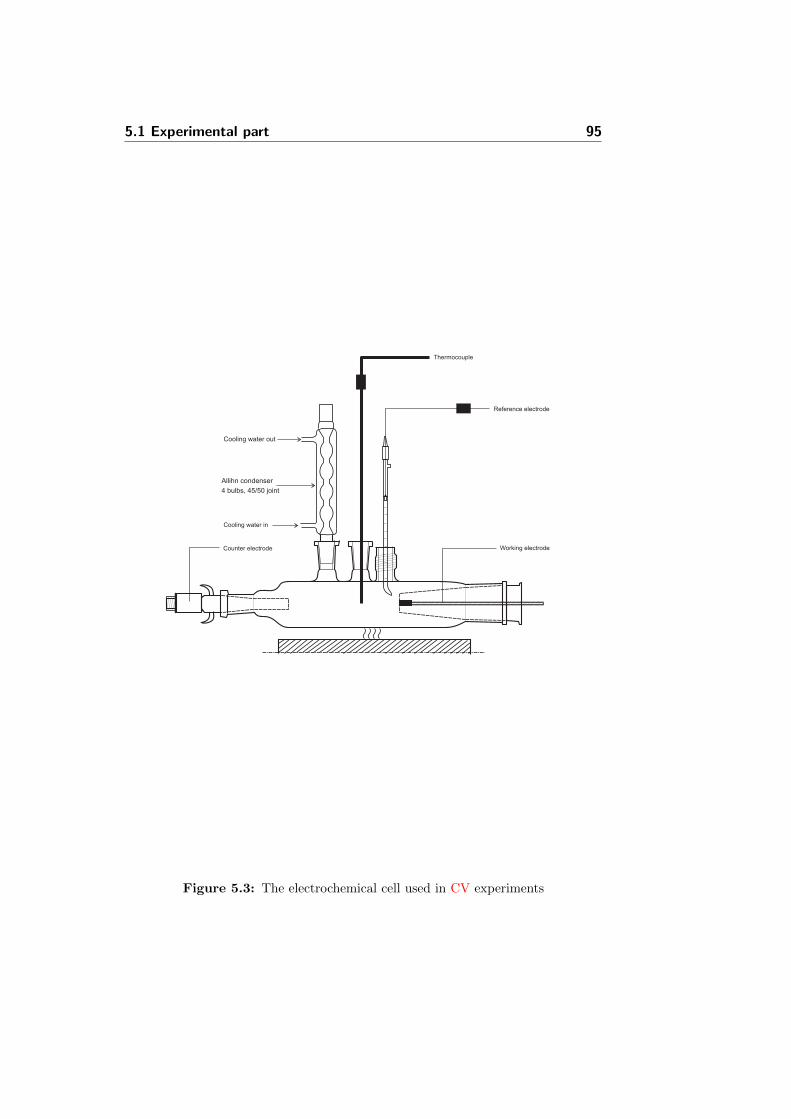
5.1 Experimental part 95
Working electrodeCounter electrode
Reference electrode
Thermocouple
Cooling water in
Allihn condenser
4 bulbs, 45/50 joint
Cooling water out
Figure 5.3: The electrochemical cell used in CV experiments
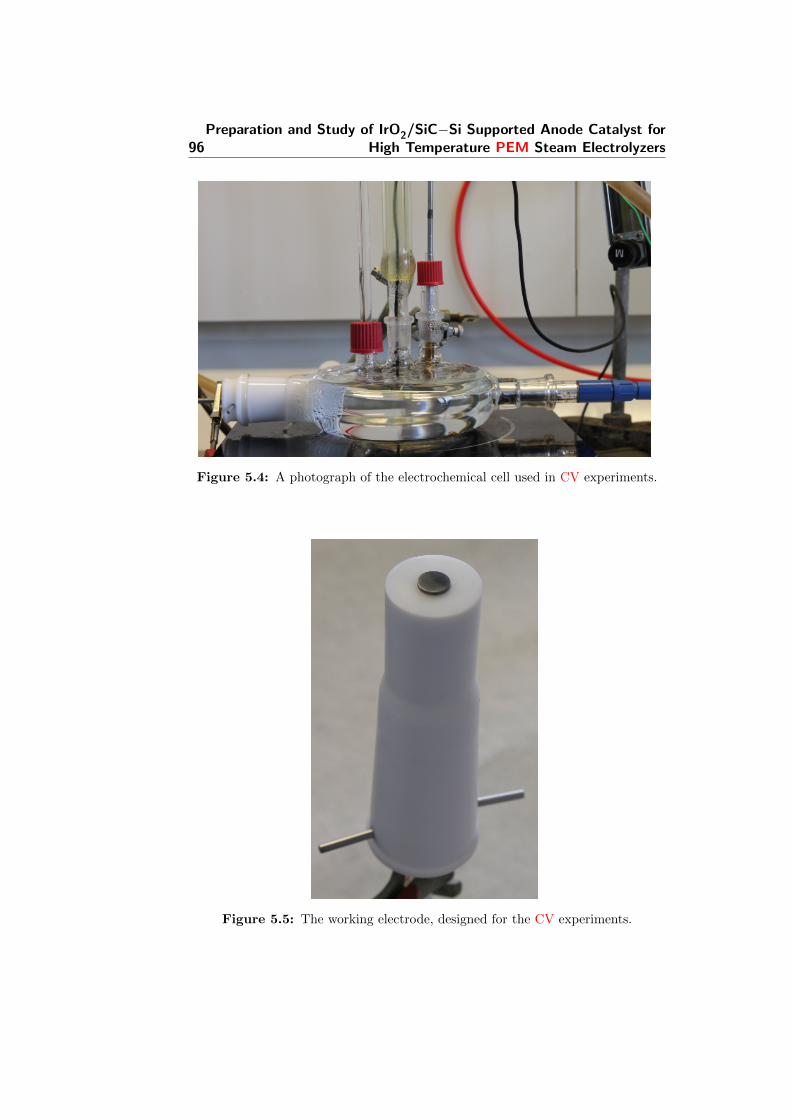
96Preparation and Study of IrO2/SiC−Si Supported Anode Catalyst for
High Temperature PEM Steam Electrolyzers
Figure 5.4: A photograph of the electrochemical cell used in CV experiments.
Figure 5.5: The working electrode, designed for the CV experiments.
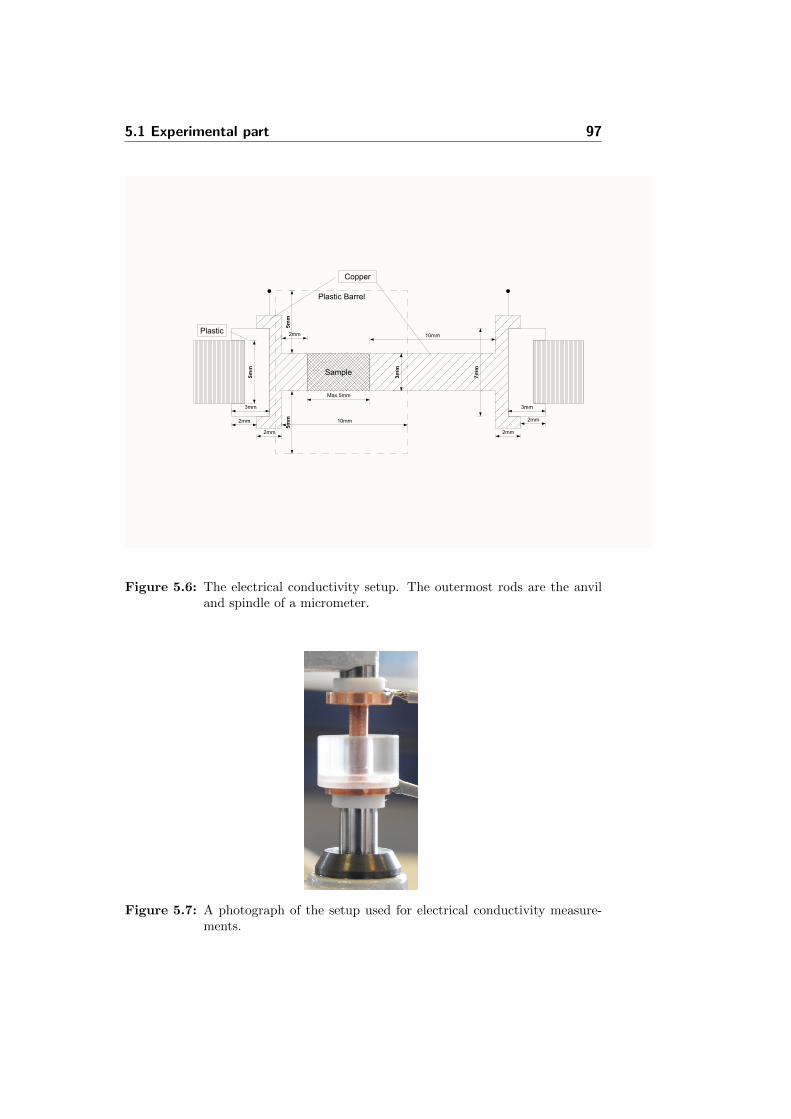
5.1 Experimental part 97
Plastic Barrel
Sample
Plastic
Max 5mm
10mm
7mm
10mm
3mm
5mm
Copper5mm
5mm
3mm
2mm
2mm
2mm
3mm
2mm
2mm
Figure 5.6: The electrical conductivity setup. The outermost rods are the anviland spindle of a micrometer.
Figure 5.7: A photograph of the setup used for electrical conductivity measure-ments.
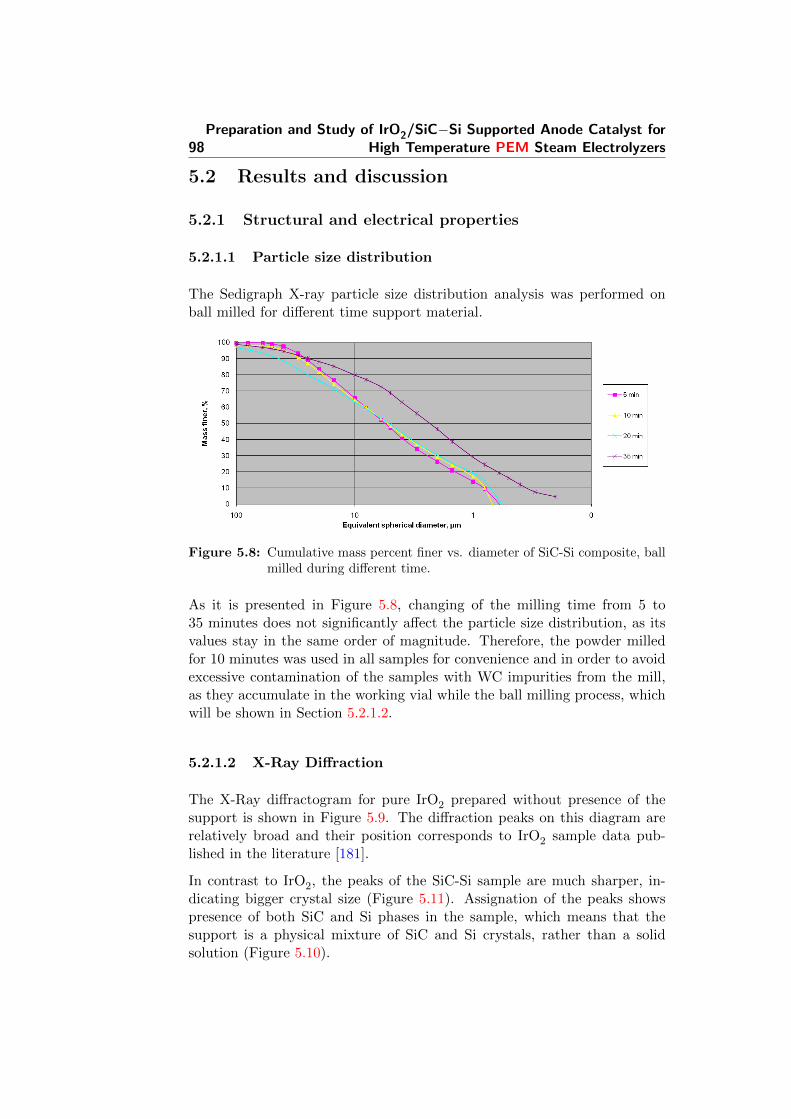
98Preparation and Study of IrO2/SiC−Si Supported Anode Catalyst for
High Temperature PEM Steam Electrolyzers
5.2 Results and discussion
5.2.1 Structural and electrical properties
5.2.1.1 Particle size distribution
The Sedigraph X-ray particle size distribution analysis was performed onball milled for different time support material.
Figure 5.8: Cumulative mass percent finer vs. diameter of SiC-Si composite, ballmilled during different time.
As it is presented in Figure 5.8, changing of the milling time from 5 to35 minutes does not significantly affect the particle size distribution, as itsvalues stay in the same order of magnitude. Therefore, the powder milledfor 10 minutes was used in all samples for convenience and in order to avoidexcessive contamination of the samples with WC impurities from the mill,as they accumulate in the working vial while the ball milling process, whichwill be shown in Section 5.2.1.2.
5.2.1.2 X-Ray Diffraction
The X-Ray diffractogram for pure IrO2 prepared without presence of thesupport is shown in Figure 5.9. The diffraction peaks on this diagram arerelatively broad and their position corresponds to IrO2 sample data pub-lished in the literature [181].
In contrast to IrO2, the peaks of the SiC-Si sample are much sharper, in-dicating bigger crystal size (Figure 5.11). Assignation of the peaks showspresence of both SiC and Si phases in the sample, which means that thesupport is a physical mixture of SiC and Si crystals, rather than a solidsolution (Figure 5.10).
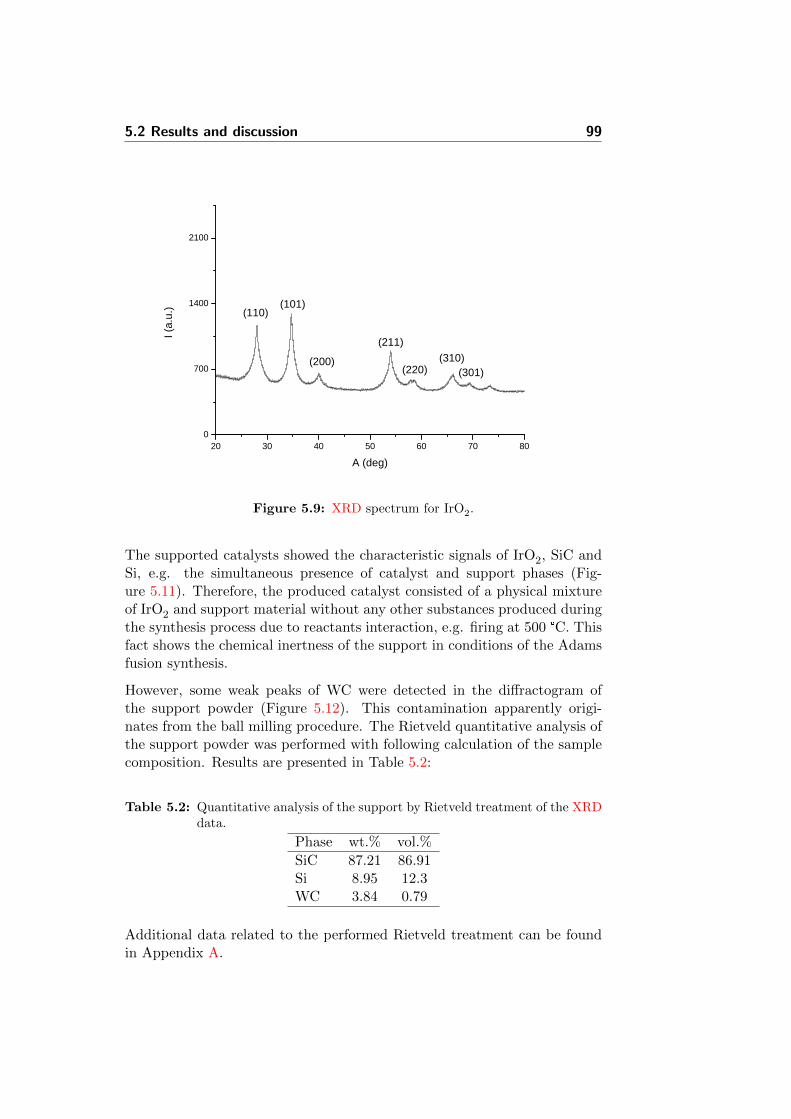
5.2 Results and discussion 99
2 0 3 0 4 0 5 0 6 0 7 0 8 00
7 0 0
1 4 0 0
2 1 0 0
( 3 0 1 )( 3 1 0 )
( 2 2 0 )
I (a.u.
)
A ( d e g )
( 1 1 0 ) ( 1 0 1 )
( 2 0 0 )( 2 1 1 )
Figure 5.9: XRD spectrum for IrO2.
The supported catalysts showed the characteristic signals of IrO2, SiC andSi, e.g. the simultaneous presence of catalyst and support phases (Fig-ure 5.11). Therefore, the produced catalyst consisted of a physical mixtureof IrO2 and support material without any other substances produced duringthe synthesis process due to reactants interaction, e.g. firing at 500 °C. Thisfact shows the chemical inertness of the support in conditions of the Adamsfusion synthesis.
However, some weak peaks of WC were detected in the diffractogram ofthe support powder (Figure 5.12). This contamination apparently origi-nates from the ball milling procedure. The Rietveld quantitative analysis ofthe support powder was performed with following calculation of the samplecomposition. Results are presented in Table 5.2:
Table 5.2: Quantitative analysis of the support by Rietveld treatment of the XRDdata.
Phase wt.% vol.%
SiC 87.21 86.91Si 8.95 12.3WC 3.84 0.79
Additional data related to the performed Rietveld treatment can be foundin Appendix A.
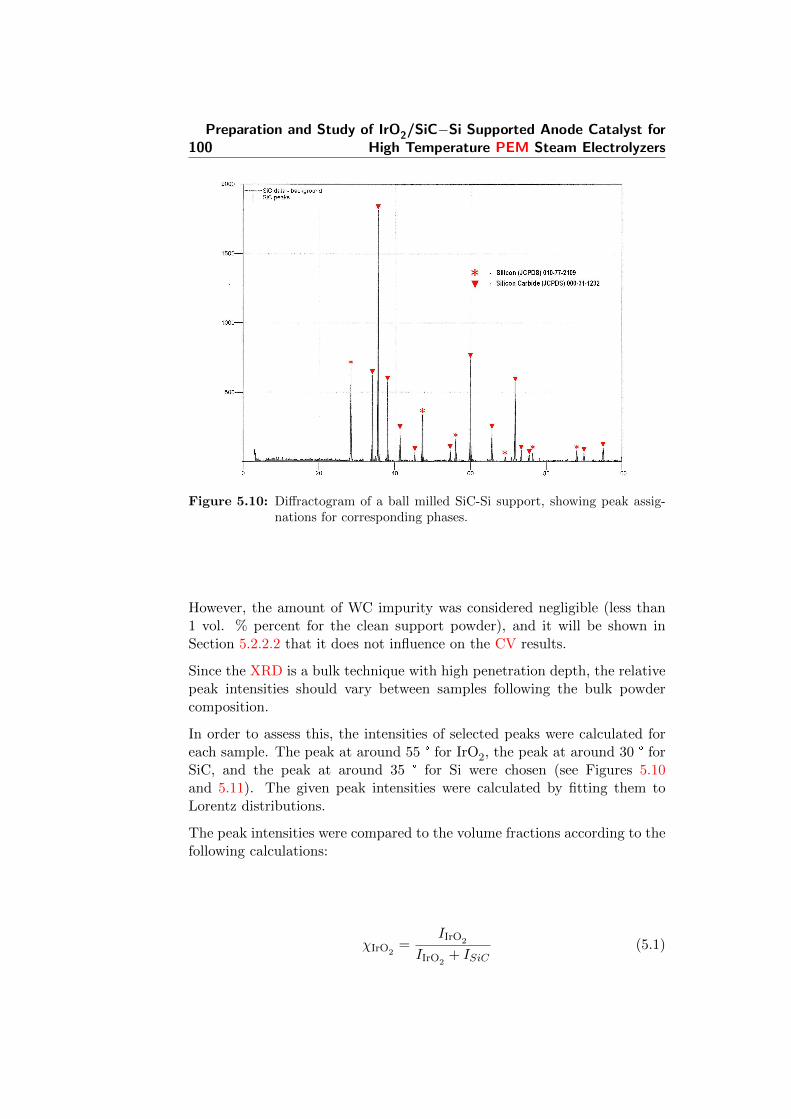
100Preparation and Study of IrO2/SiC−Si Supported Anode Catalyst for
High Temperature PEM Steam Electrolyzers
Figure 5.10: Diffractogram of a ball milled SiC-Si support, showing peak assig-nations for corresponding phases.
However, the amount of WC impurity was considered negligible (less than1 vol. % percent for the clean support powder), and it will be shown inSection 5.2.2.2 that it does not influence on the CV results.
Since the XRD is a bulk technique with high penetration depth, the relativepeak intensities should vary between samples following the bulk powdercomposition.
In order to assess this, the intensities of selected peaks were calculated foreach sample. The peak at around 55 ° for IrO2, the peak at around 30 ° forSiC, and the peak at around 35 ° for Si were chosen (see Figures 5.10and 5.11). The given peak intensities were calculated by fitting them toLorentz distributions.
The peak intensities were compared to the volume fractions according to thefollowing calculations:
χIrO2=
IIrO2
IIrO2+ ISiC
(5.1)
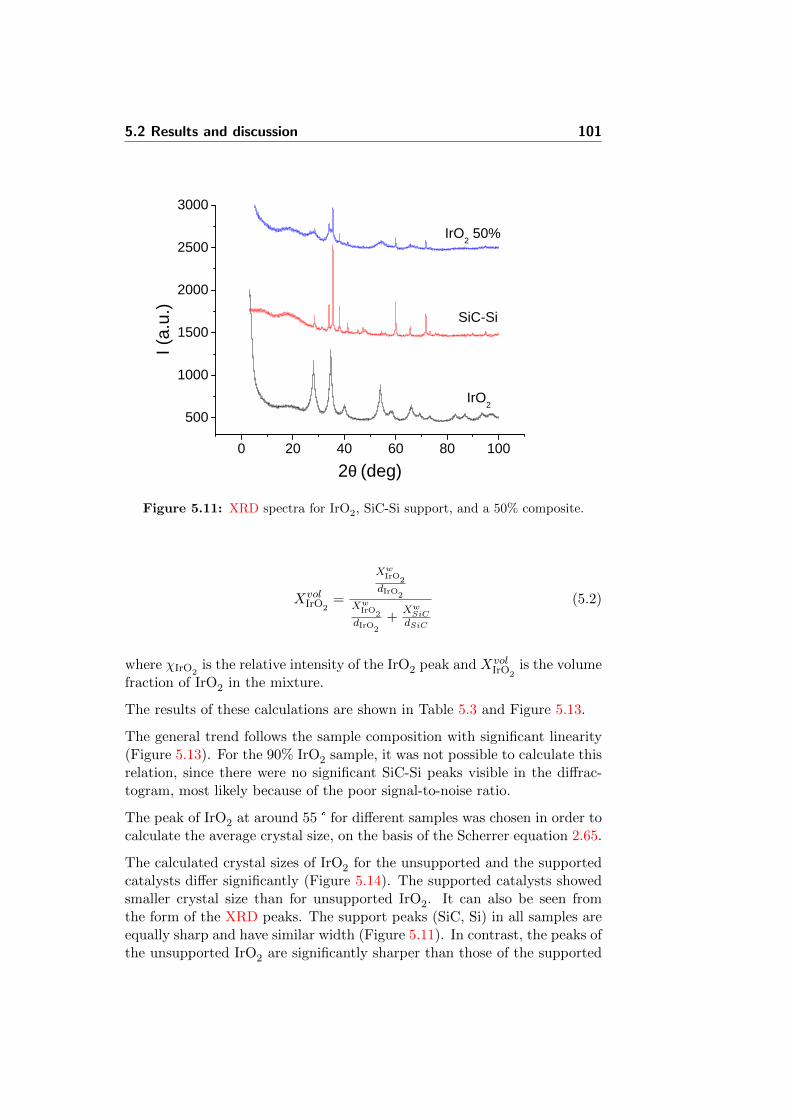
5.2 Results and discussion 101
0 2 0 4 0 6 0 8 0 1 0 05 0 0
1 0 0 0
1 5 0 0
2 0 0 0
2 5 0 0
3 0 0 0
I r O 2
S i C - S i
I (a.u.
)
2 θ ( d e g )
I r O 2 5 0 %
Figure 5.11: XRD spectra for IrO2, SiC-Si support, and a 50% composite.
XvolIrO2
=
XwIrO2
dIrO2
XwIrO2
dIrO2
+Xw
SiCdSiC
(5.2)
where χIrO2is the relative intensity of the IrO2 peak and Xvol
IrO2is the volume
fraction of IrO2 in the mixture.
The results of these calculations are shown in Table 5.3 and Figure 5.13.
The general trend follows the sample composition with significant linearity(Figure 5.13). For the 90% IrO2 sample, it was not possible to calculate thisrelation, since there were no significant SiC-Si peaks visible in the diffrac-togram, most likely because of the poor signal-to-noise ratio.
The peak of IrO2 at around 55 ° for different samples was chosen in order tocalculate the average crystal size, on the basis of the Scherrer equation 2.65.
The calculated crystal sizes of IrO2 for the unsupported and the supportedcatalysts differ significantly (Figure 5.14). The supported catalysts showedsmaller crystal size than for unsupported IrO2. It can also be seen fromthe form of the XRD peaks. The support peaks (SiC, Si) in all samples areequally sharp and have similar width (Figure 5.11). In contrast, the peaks ofthe unsupported IrO2 are significantly sharper than those of the supported
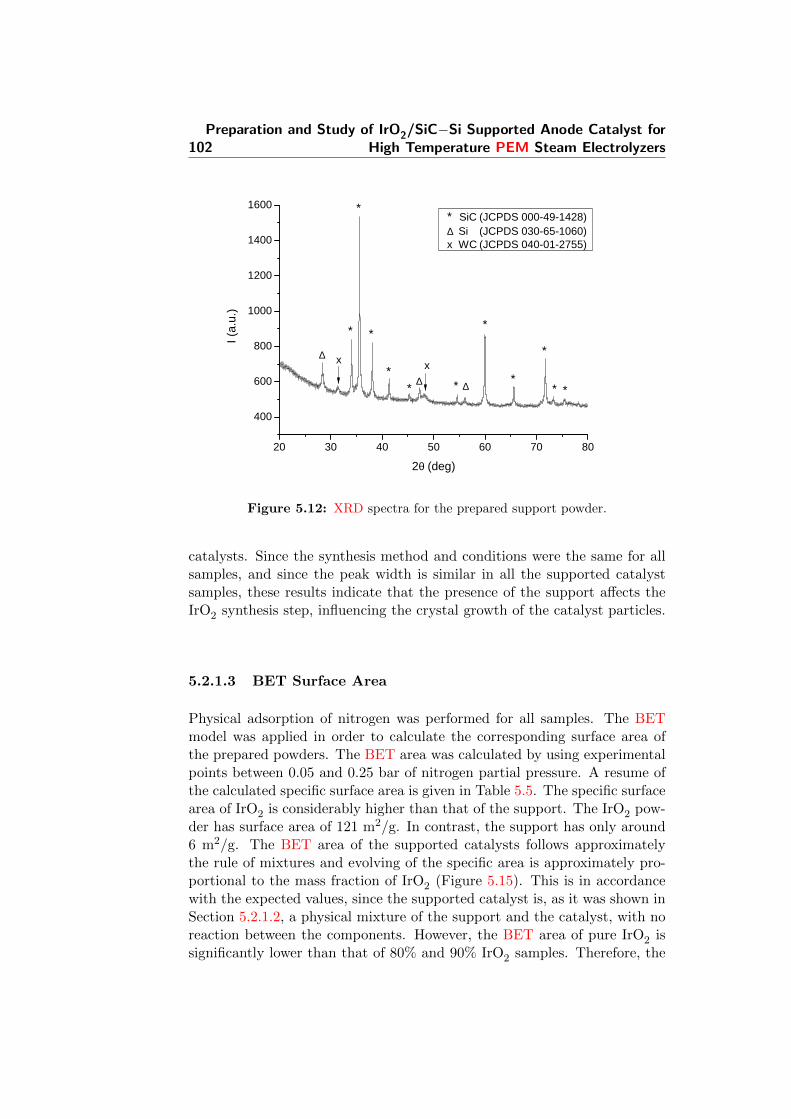
102Preparation and Study of IrO2/SiC−Si Supported Anode Catalyst for
High Temperature PEM Steam Electrolyzers
2 0 3 0 4 0 5 0 6 0 7 0 8 0
4 0 0
6 0 0
8 0 0
1 0 0 0
1 2 0 0
1 4 0 0
1 6 0 0
x∆∆
∆
**
*
*
*
**
*
*
**I (a
.u.)
2 θ ( d e g )
* S i C ( J C P D S 0 0 0 - 4 9 - 1 4 2 8 ) ∆ S i ( J C P D S 0 3 0 - 6 5 - 1 0 6 0 ) x W C ( J C P D S 0 4 0 - 0 1 - 2 7 5 5 )
x
Figure 5.12: XRD spectra for the prepared support powder.
catalysts. Since the synthesis method and conditions were the same for allsamples, and since the peak width is similar in all the supported catalystsamples, these results indicate that the presence of the support affects theIrO2 synthesis step, influencing the crystal growth of the catalyst particles.
5.2.1.3 BET Surface Area
Physical adsorption of nitrogen was performed for all samples. The BETmodel was applied in order to calculate the corresponding surface area ofthe prepared powders. The BET area was calculated by using experimentalpoints between 0.05 and 0.25 bar of nitrogen partial pressure. A resume ofthe calculated specific surface area is given in Table 5.5. The specific surfacearea of IrO2 is considerably higher than that of the support. The IrO2 pow-der has surface area of 121 m2/g. In contrast, the support has only around6 m2/g. The BET area of the supported catalysts follows approximatelythe rule of mixtures and evolving of the specific area is approximately pro-portional to the mass fraction of IrO2 (Figure 5.15). This is in accordancewith the expected values, since the supported catalyst is, as it was shown inSection 5.2.1.2, a physical mixture of the support and the catalyst, with noreaction between the components. However, the BET area of pure IrO2 issignificantly lower than that of 80% and 90% IrO2 samples. Therefore, the
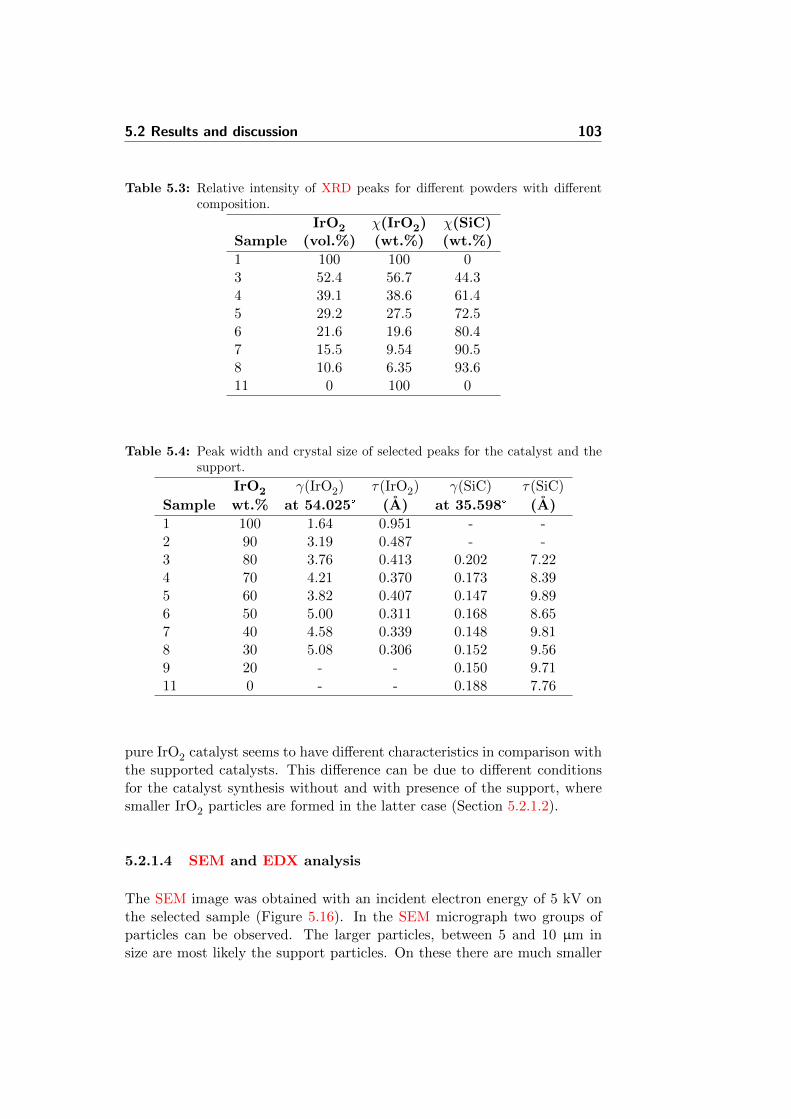
5.2 Results and discussion 103
Table 5.3: Relative intensity of XRD peaks for different powders with differentcomposition.
IrO2 χ(IrO2) χ(SiC)Sample (vol.%) (wt.%) (wt.%)
1 100 100 03 52.4 56.7 44.34 39.1 38.6 61.45 29.2 27.5 72.56 21.6 19.6 80.47 15.5 9.54 90.58 10.6 6.35 93.611 0 100 0
Table 5.4: Peak width and crystal size of selected peaks for the catalyst and thesupport.
IrO2 γ(IrO2) τ(IrO2) γ(SiC) τ(SiC)
Sample wt.% at 54.025° (A) at 35.598° (A)
1 100 1.64 0.951 - -2 90 3.19 0.487 - -3 80 3.76 0.413 0.202 7.224 70 4.21 0.370 0.173 8.395 60 3.82 0.407 0.147 9.896 50 5.00 0.311 0.168 8.657 40 4.58 0.339 0.148 9.818 30 5.08 0.306 0.152 9.569 20 - - 0.150 9.7111 0 - - 0.188 7.76
pure IrO2 catalyst seems to have different characteristics in comparison withthe supported catalysts. This difference can be due to different conditionsfor the catalyst synthesis without and with presence of the support, wheresmaller IrO2 particles are formed in the latter case (Section 5.2.1.2).
5.2.1.4 SEM and EDX analysis
The SEM image was obtained with an incident electron energy of 5 kV onthe selected sample (Figure 5.16). In the SEM micrograph two groups ofparticles can be observed. The larger particles, between 5 and 10 µm insize are most likely the support particles. On these there are much smaller
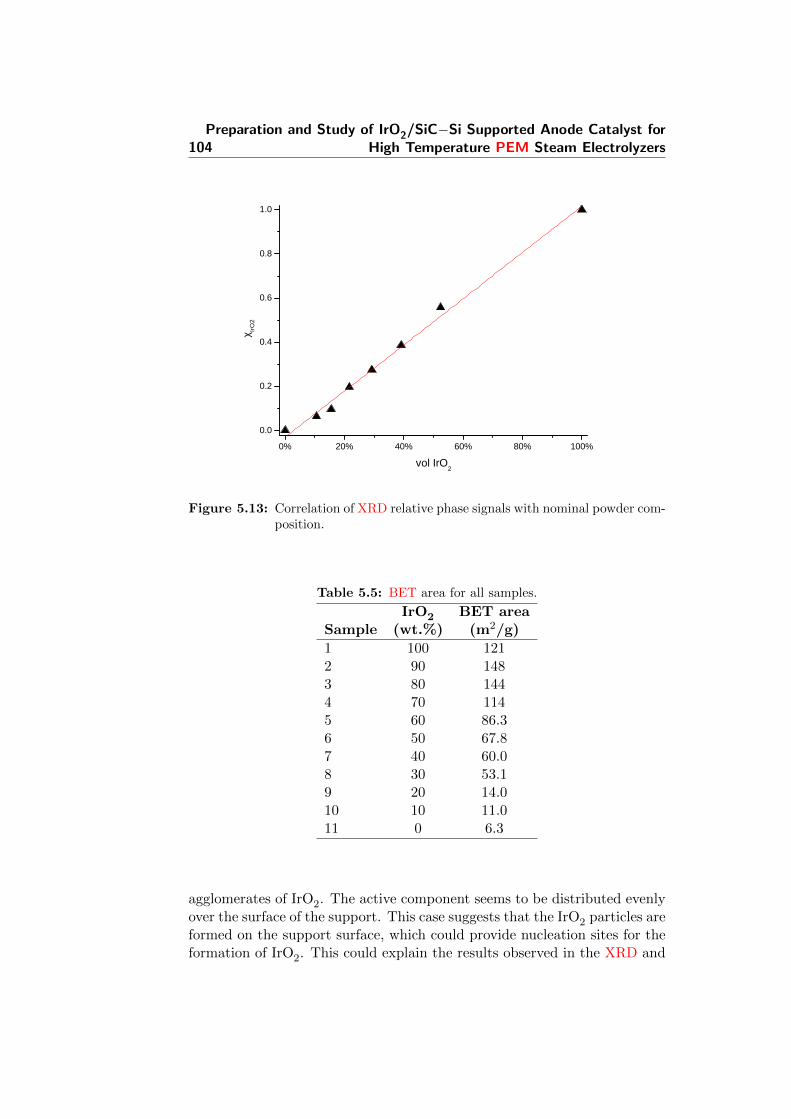
104Preparation and Study of IrO2/SiC−Si Supported Anode Catalyst for
High Temperature PEM Steam Electrolyzers
0 % 2 0 % 4 0 % 6 0 % 8 0 % 1 0 0 %0 . 0
0 . 2
0 . 4
0 . 6
0 . 8
1 . 0
χ IrO2
v o l I r O 2
Figure 5.13: Correlation of XRD relative phase signals with nominal powder com-position.
Table 5.5: BET area for all samples.
IrO2 BET areaSample (wt.%) (m2/g)
1 100 1212 90 1483 80 1444 70 1145 60 86.36 50 67.87 40 60.08 30 53.19 20 14.010 10 11.011 0 6.3
agglomerates of IrO2. The active component seems to be distributed evenlyover the surface of the support. This case suggests that the IrO2 particles areformed on the support surface, which could provide nucleation sites for theformation of IrO2. This could explain the results observed in the XRD and
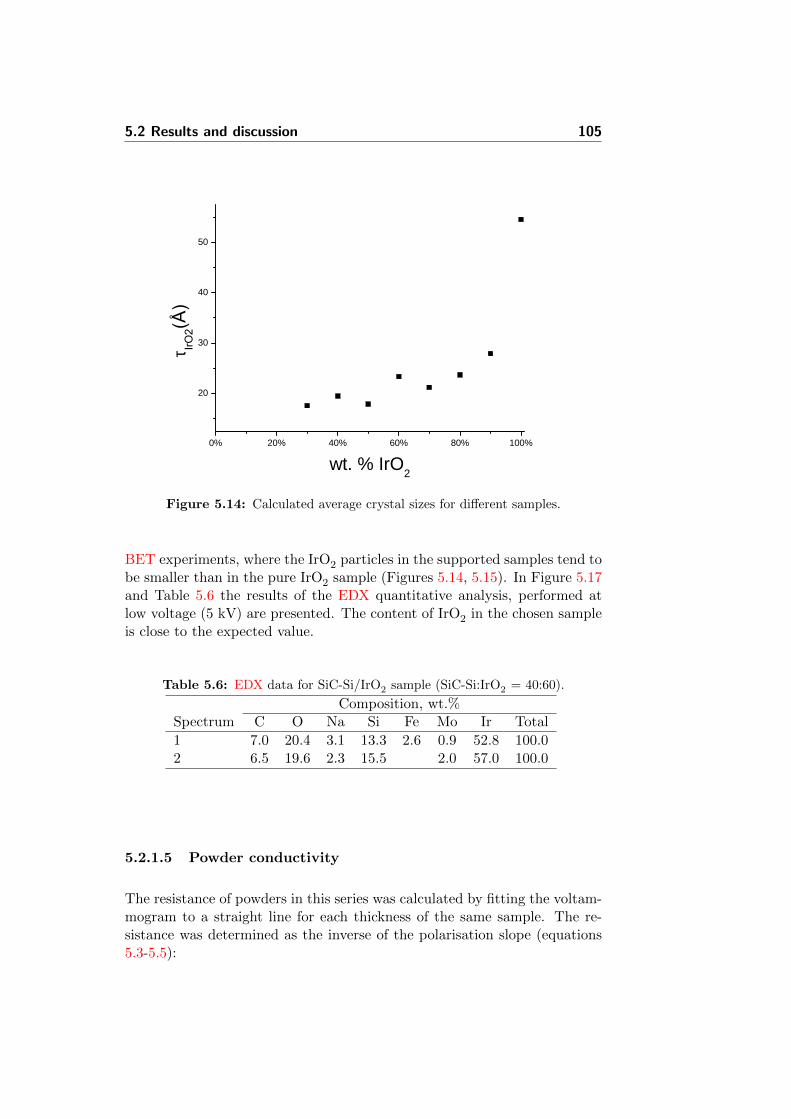
5.2 Results and discussion 105
0 % 2 0 % 4 0 % 6 0 % 8 0 % 1 0 0 %
2 0
3 0
4 0
5 0
τ
w t . % I r O 2
Figure 5.14: Calculated average crystal sizes for different samples.
BET experiments, where the IrO2 particles in the supported samples tend tobe smaller than in the pure IrO2 sample (Figures 5.14, 5.15). In Figure 5.17and Table 5.6 the results of the EDX quantitative analysis, performed atlow voltage (5 kV) are presented. The content of IrO2 in the chosen sampleis close to the expected value.
Table 5.6: EDX data for SiC-Si/IrO2 sample (SiC-Si:IrO2 = 40:60).
Composition, wt.%Spectrum C O Na Si Fe Mo Ir Total
1 7.0 20.4 3.1 13.3 2.6 0.9 52.8 100.02 6.5 19.6 2.3 15.5 2.0 57.0 100.0
5.2.1.5 Powder conductivity
The resistance of powders in this series was calculated by fitting the voltam-mogram to a straight line for each thickness of the same sample. The re-sistance was determined as the inverse of the polarisation slope (equations5.3-5.5):
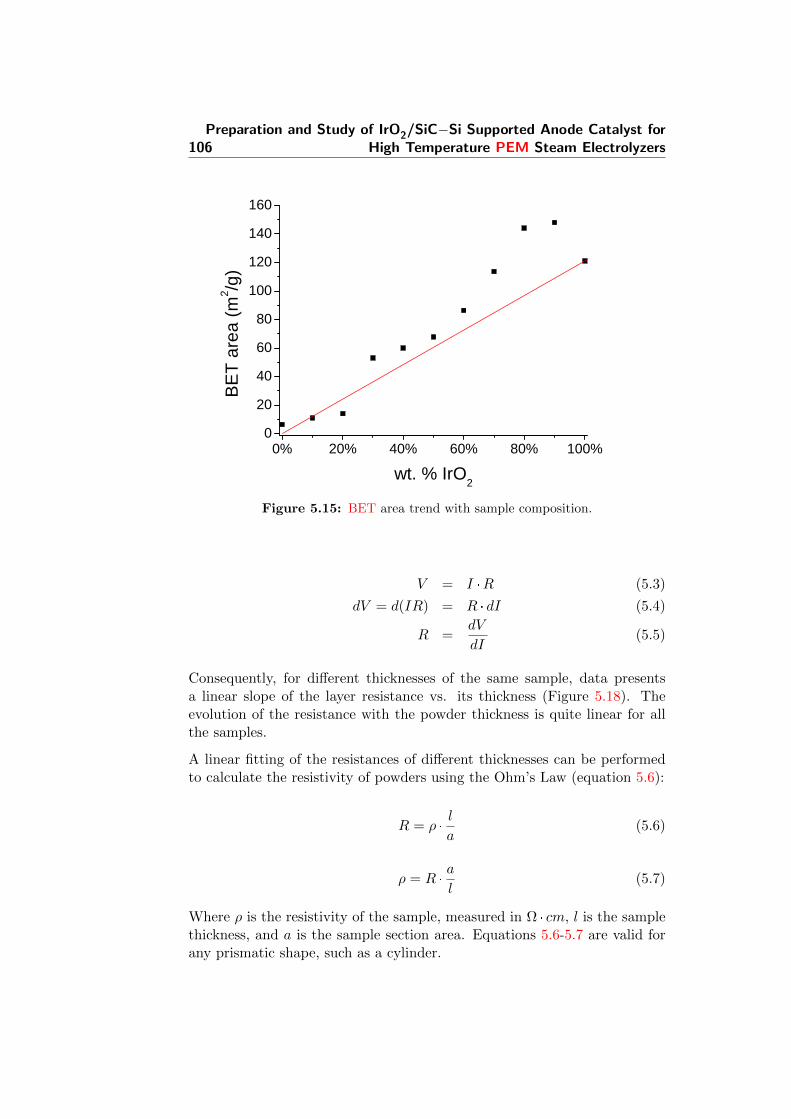
106Preparation and Study of IrO2/SiC−Si Supported Anode Catalyst for
High Temperature PEM Steam Electrolyzers
0 % 2 0 % 4 0 % 6 0 % 8 0 % 1 0 0 %0
2 04 06 08 0
1 0 01 2 01 4 01 6 0
BET a
rea (m
2 /g)
w t . % I r O 2Figure 5.15: BET area trend with sample composition.
V = I ·R (5.3)
dV = d(IR) = R · dI (5.4)
R =dV
dI(5.5)
Consequently, for different thicknesses of the same sample, data presentsa linear slope of the layer resistance vs. its thickness (Figure 5.18). Theevolution of the resistance with the powder thickness is quite linear for allthe samples.
A linear fitting of the resistances of different thicknesses can be performedto calculate the resistivity of powders using the Ohm’s Law (equation 5.6):
R = ρ ·l
a(5.6)
ρ = R ·a
l(5.7)
Where ρ is the resistivity of the sample, measured in Ω · cm, l is the samplethickness, and a is the sample section area. Equations 5.6-5.7 are valid forany prismatic shape, such as a cylinder.
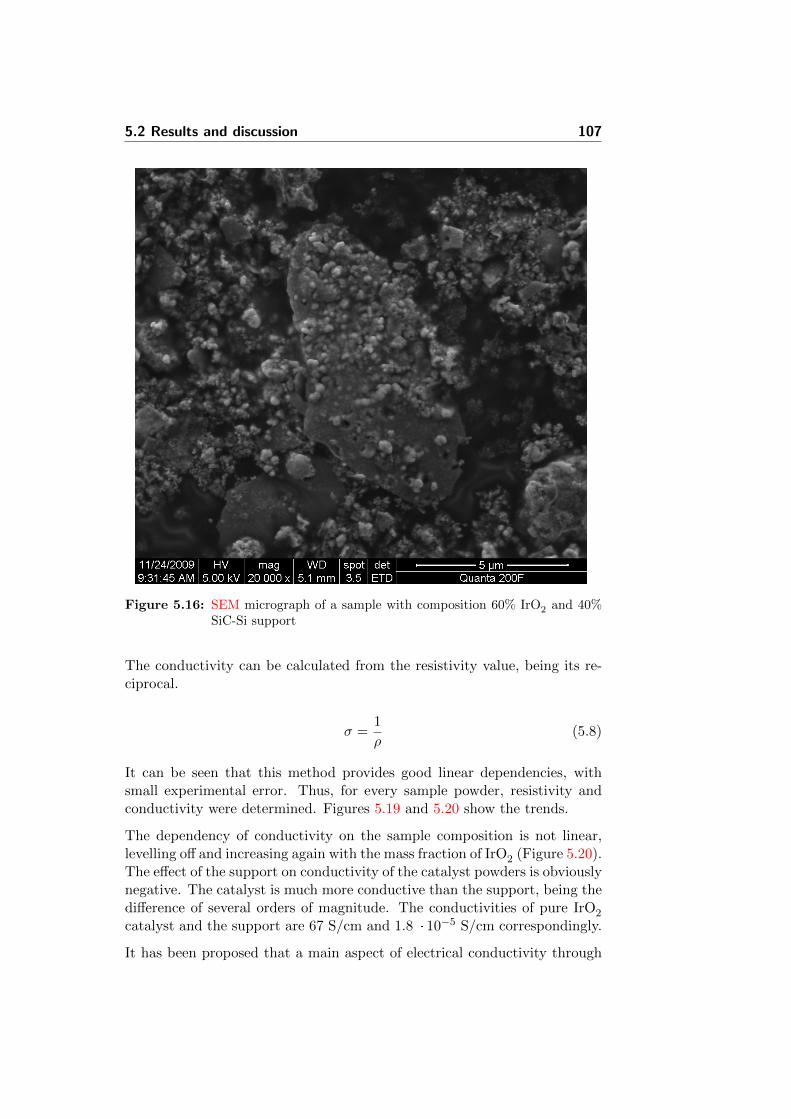
5.2 Results and discussion 107
Figure 5.16: SEM micrograph of a sample with composition 60% IrO2 and 40%SiC-Si support
The conductivity can be calculated from the resistivity value, being its re-ciprocal.
σ =1
ρ(5.8)
It can be seen that this method provides good linear dependencies, withsmall experimental error. Thus, for every sample powder, resistivity andconductivity were determined. Figures 5.19 and 5.20 show the trends.
The dependency of conductivity on the sample composition is not linear,levelling off and increasing again with the mass fraction of IrO2 (Figure 5.20).The effect of the support on conductivity of the catalyst powders is obviouslynegative. The catalyst is much more conductive than the support, being thedifference of several orders of magnitude. The conductivities of pure IrO2
catalyst and the support are 67 S/cm and 1.8 · 10−5 S/cm correspondingly.
It has been proposed that a main aspect of electrical conductivity through
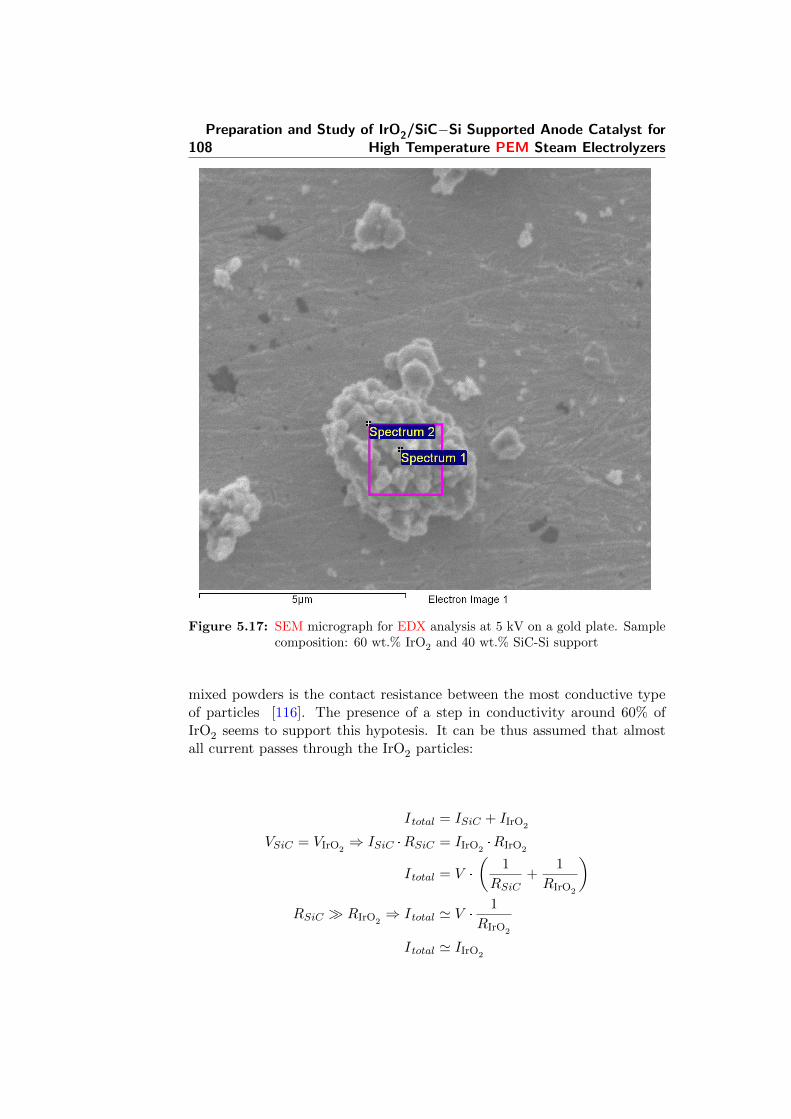
108Preparation and Study of IrO2/SiC−Si Supported Anode Catalyst for
High Temperature PEM Steam Electrolyzers
Figure 5.17: SEM micrograph for EDX analysis at 5 kV on a gold plate. Samplecomposition: 60 wt.% IrO2 and 40 wt.% SiC-Si support
mixed powders is the contact resistance between the most conductive typeof particles [116]. The presence of a step in conductivity around 60% ofIrO2 seems to support this hypotesis. It can be thus assumed that almostall current passes through the IrO2 particles:
Itotal = ISiC + IIrO2
VSiC = VIrO2⇒ ISiC ·RSiC = IIrO2
·RIrO2
Itotal = V ·
(1
RSiC+
1
RIrO2
)RSiC RIrO2
⇒ Itotal ' V ·1
RIrO2
Itotal ' IIrO2
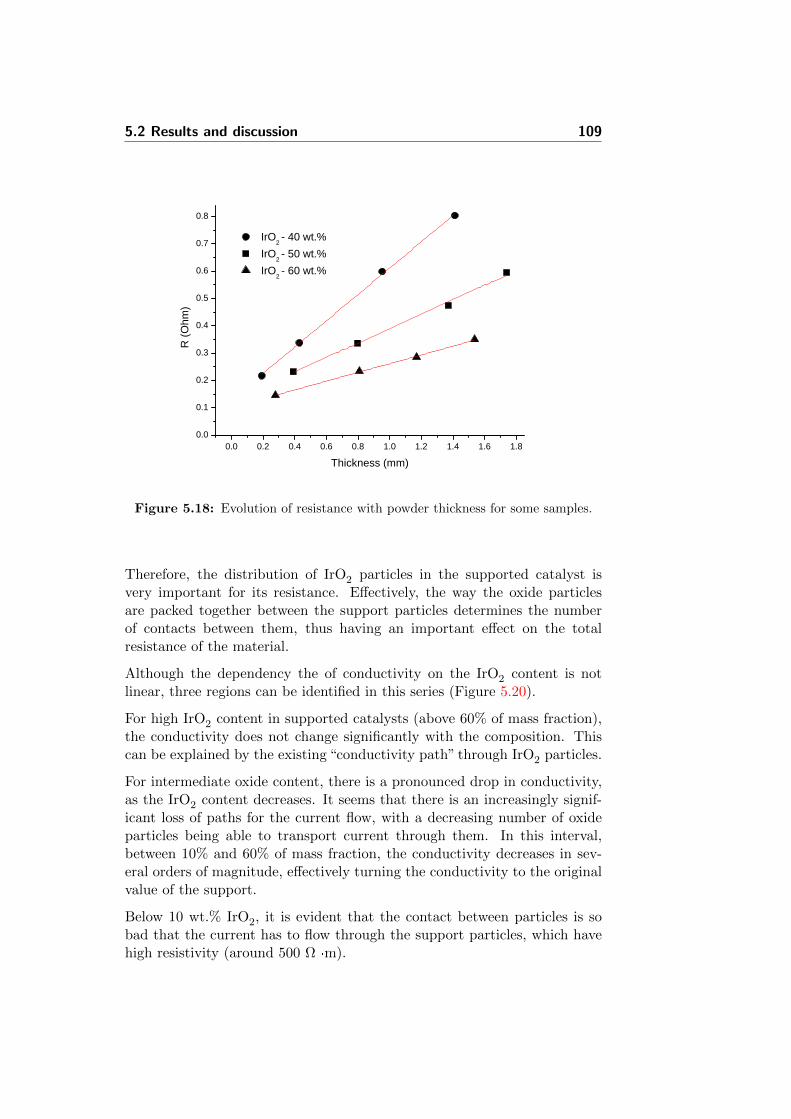
5.2 Results and discussion 109
0 . 0 0 . 2 0 . 4 0 . 6 0 . 8 1 . 0 1 . 2 1 . 4 1 . 6 1 . 80 . 0
0 . 1
0 . 2
0 . 3
0 . 4
0 . 5
0 . 6
0 . 7
0 . 8 I r O 2 - 4 0 w t . % I r O 2 - 5 0 w t . % I r O 2 - 6 0 w t . %
R (Oh
m)
T h i c k n e s s ( m m )
Figure 5.18: Evolution of resistance with powder thickness for some samples.
Therefore, the distribution of IrO2 particles in the supported catalyst isvery important for its resistance. Effectively, the way the oxide particlesare packed together between the support particles determines the numberof contacts between them, thus having an important effect on the totalresistance of the material.
Although the dependency the of conductivity on the IrO2 content is notlinear, three regions can be identified in this series (Figure 5.20).
For high IrO2 content in supported catalysts (above 60% of mass fraction),the conductivity does not change significantly with the composition. Thiscan be explained by the existing “conductivity path” through IrO2 particles.
For intermediate oxide content, there is a pronounced drop in conductivity,as the IrO2 content decreases. It seems that there is an increasingly signif-icant loss of paths for the current flow, with a decreasing number of oxideparticles being able to transport current through them. In this interval,between 10% and 60% of mass fraction, the conductivity decreases in sev-eral orders of magnitude, effectively turning the conductivity to the originalvalue of the support.
Below 10 wt.% IrO2, it is evident that the contact between particles is sobad that the current has to flow through the support particles, which havehigh resistivity (around 500 Ω ·m).
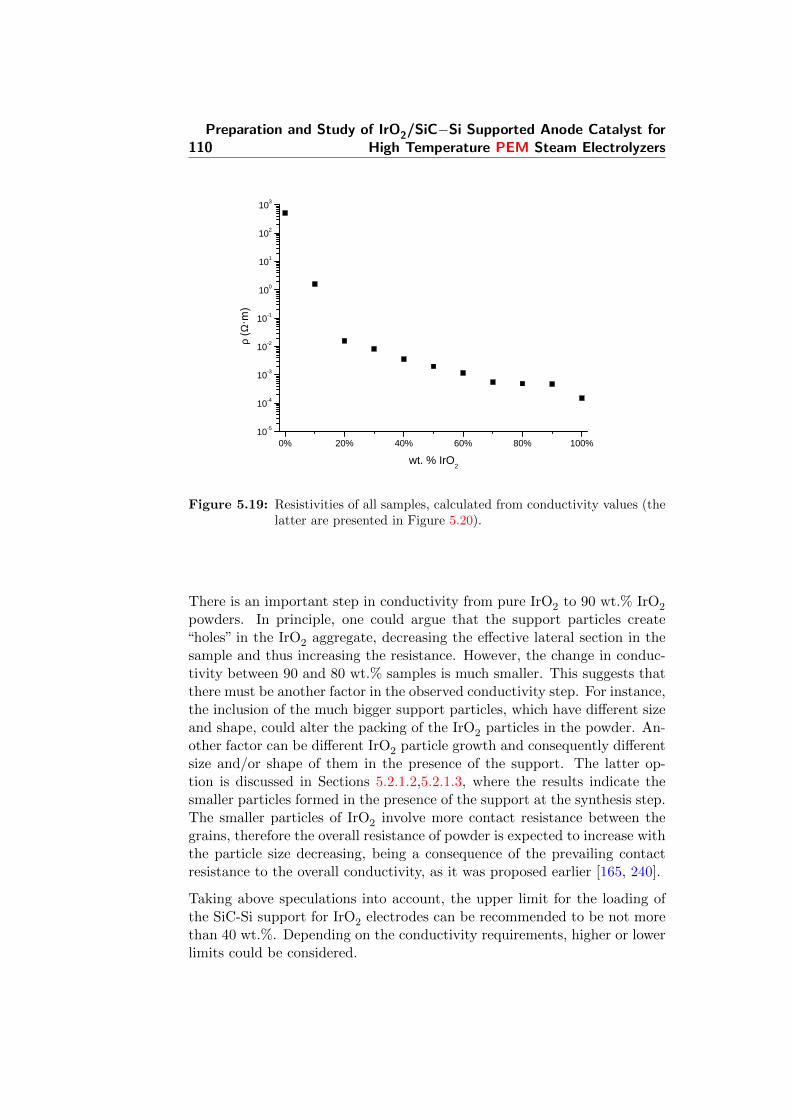
110Preparation and Study of IrO2/SiC−Si Supported Anode Catalyst for
High Temperature PEM Steam Electrolyzers
0 % 2 0 % 4 0 % 6 0 % 8 0 % 1 0 0 %1 0 - 5
1 0 - 4
1 0 - 3
1 0 - 2
1 0 - 1
1 0 0
1 0 1
1 0 2
1 0 3
ρΩ
w t . % I r O 2
Figure 5.19: Resistivities of all samples, calculated from conductivity values (thelatter are presented in Figure 5.20).
There is an important step in conductivity from pure IrO2 to 90 wt.% IrO2
powders. In principle, one could argue that the support particles create“holes” in the IrO2 aggregate, decreasing the effective lateral section in thesample and thus increasing the resistance. However, the change in conduc-tivity between 90 and 80 wt.% samples is much smaller. This suggests thatthere must be another factor in the observed conductivity step. For instance,the inclusion of the much bigger support particles, which have different sizeand shape, could alter the packing of the IrO2 particles in the powder. An-other factor can be different IrO2 particle growth and consequently differentsize and/or shape of them in the presence of the support. The latter op-tion is discussed in Sections 5.2.1.2,5.2.1.3, where the results indicate thesmaller particles formed in the presence of the support at the synthesis step.The smaller particles of IrO2 involve more contact resistance between thegrains, therefore the overall resistance of powder is expected to increase withthe particle size decreasing, being a consequence of the prevailing contactresistance to the overall conductivity, as it was proposed earlier [165, 240].
Taking above speculations into account, the upper limit for the loading ofthe SiC-Si support for IrO2 electrodes can be recommended to be not morethan 40 wt.%. Depending on the conductivity requirements, higher or lowerlimits could be considered.
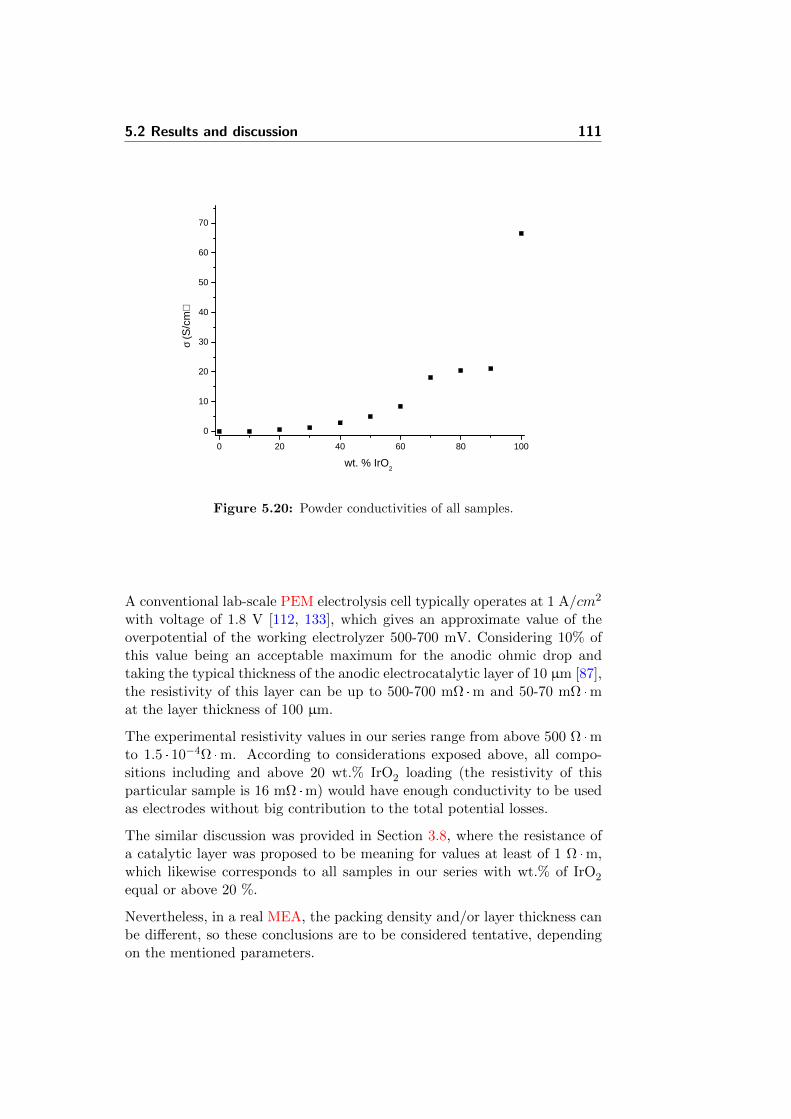
5.2 Results and discussion 111
0 2 0 4 0 6 0 8 0 1 0 00
1 0
2 0
3 0
4 0
5 0
6 0
7 0
σ (S/
cm)
w t . % I r O 2
Figure 5.20: Powder conductivities of all samples.
A conventional lab-scale PEM electrolysis cell typically operates at 1 A/cm2
with voltage of 1.8 V [112, 133], which gives an approximate value of theoverpotential of the working electrolyzer 500-700 mV. Considering 10% ofthis value being an acceptable maximum for the anodic ohmic drop andtaking the typical thickness of the anodic electrocatalytic layer of 10 µm [87],the resistivity of this layer can be up to 500-700 mΩ ·m and 50-70 mΩ ·mat the layer thickness of 100 µm.
The experimental resistivity values in our series range from above 500 Ω ·mto 1.5 · 10−4Ω ·m. According to considerations exposed above, all compo-sitions including and above 20 wt.% IrO2 loading (the resistivity of thisparticular sample is 16 mΩ ·m) would have enough conductivity to be usedas electrodes without big contribution to the total potential losses.
The similar discussion was provided in Section 3.8, where the resistance ofa catalytic layer was proposed to be meaning for values at least of 1 Ω ·m,which likewise corresponds to all samples in our series with wt.% of IrO2
equal or above 20 %.
Nevertheless, in a real MEA, the packing density and/or layer thickness canbe different, so these conclusions are to be considered tentative, dependingon the mentioned parameters.
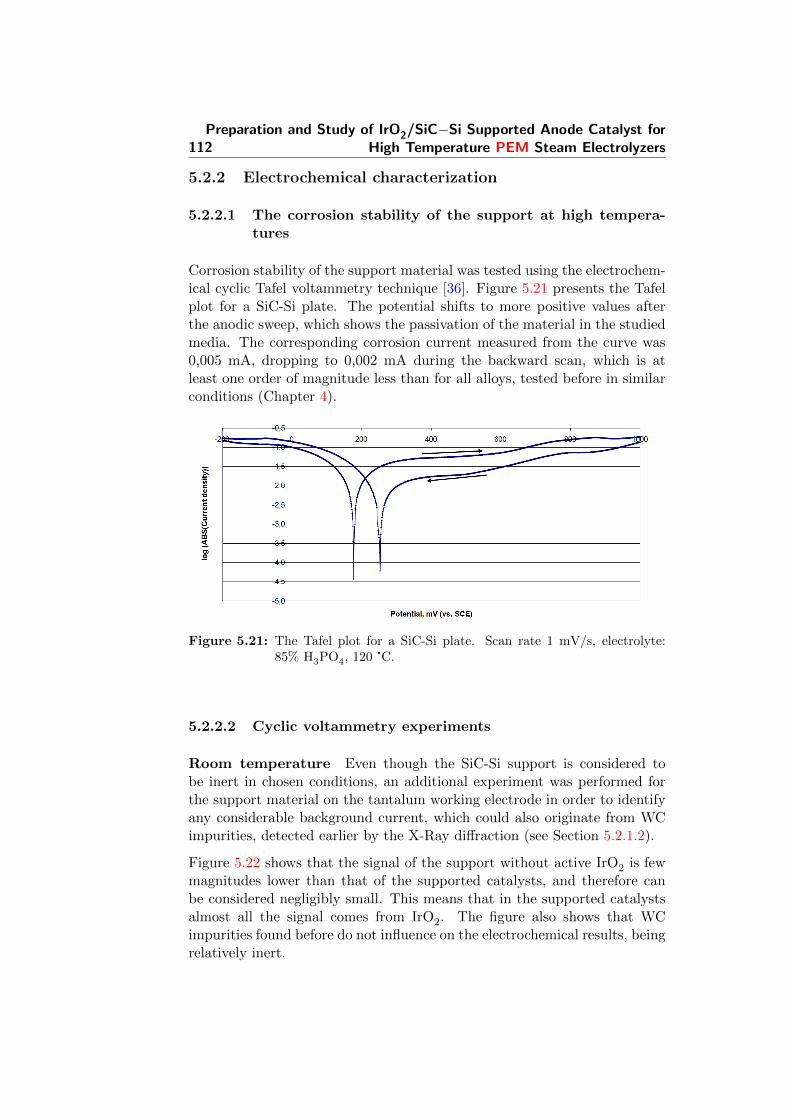
112Preparation and Study of IrO2/SiC−Si Supported Anode Catalyst for
High Temperature PEM Steam Electrolyzers
5.2.2 Electrochemical characterization
5.2.2.1 The corrosion stability of the support at high tempera-tures
Corrosion stability of the support material was tested using the electrochem-ical cyclic Tafel voltammetry technique [36]. Figure 5.21 presents the Tafelplot for a SiC-Si plate. The potential shifts to more positive values afterthe anodic sweep, which shows the passivation of the material in the studiedmedia. The corresponding corrosion current measured from the curve was0,005 mA, dropping to 0,002 mA during the backward scan, which is atleast one order of magnitude less than for all alloys, tested before in similarconditions (Chapter 4).
Figure 5.21: The Tafel plot for a SiC-Si plate. Scan rate 1 mV/s, electrolyte:85% H3PO4, 120 °C.
5.2.2.2 Cyclic voltammetry experiments
Room temperature Even though the SiC-Si support is considered tobe inert in chosen conditions, an additional experiment was performed forthe support material on the tantalum working electrode in order to identifyany considerable background current, which could also originate from WCimpurities, detected earlier by the X-Ray diffraction (see Section 5.2.1.2).
Figure 5.22 shows that the signal of the support without active IrO2 is fewmagnitudes lower than that of the supported catalysts, and therefore canbe considered negligibly small. This means that in the supported catalystsalmost all the signal comes from IrO2. The figure also shows that WCimpurities found before do not influence on the electrochemical results, beingrelatively inert.
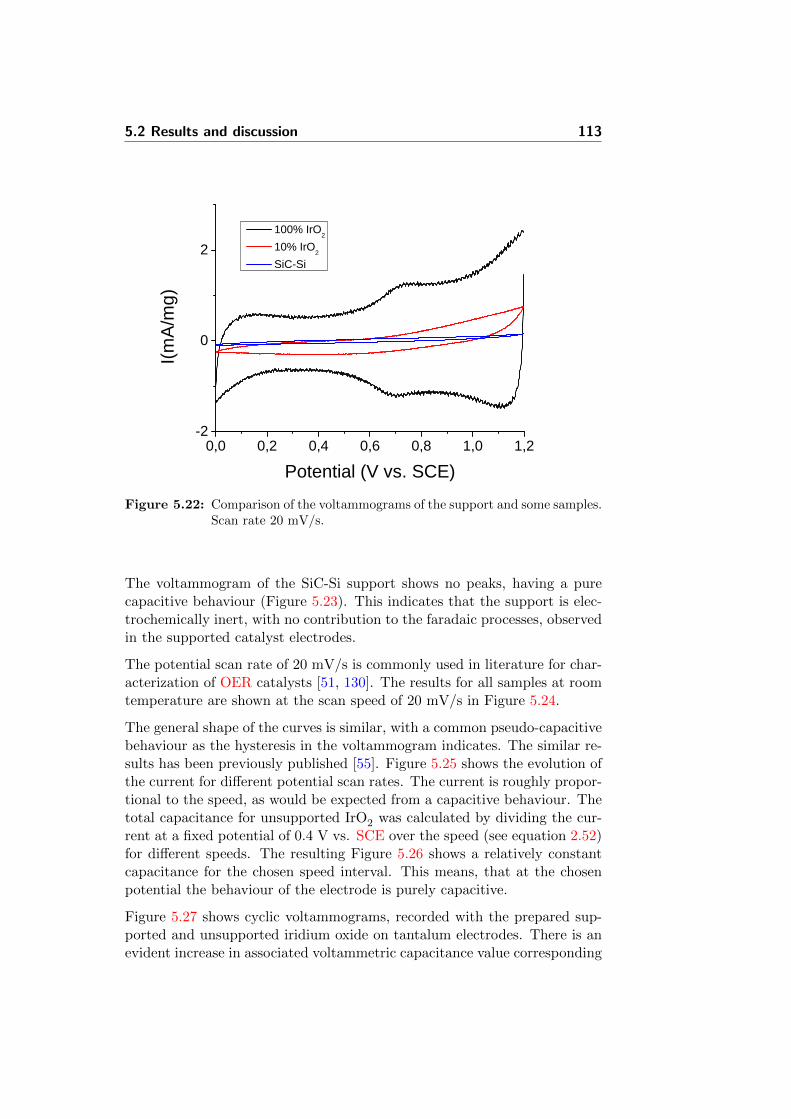
5.2 Results and discussion 113
0 , 0 0 , 2 0 , 4 0 , 6 0 , 8 1 , 0 1 , 2- 2
0
2
I(mA/m
g)
P o t e n t i a l ( V v s . S C E )
1 0 0 % I r O 2 1 0 % I r O 2 S i C - S i
Figure 5.22: Comparison of the voltammograms of the support and some samples.Scan rate 20 mV/s.
The voltammogram of the SiC-Si support shows no peaks, having a purecapacitive behaviour (Figure 5.23). This indicates that the support is elec-trochemically inert, with no contribution to the faradaic processes, observedin the supported catalyst electrodes.
The potential scan rate of 20 mV/s is commonly used in literature for char-acterization of OER catalysts [51, 130]. The results for all samples at roomtemperature are shown at the scan speed of 20 mV/s in Figure 5.24.
The general shape of the curves is similar, with a common pseudo-capacitivebehaviour as the hysteresis in the voltammogram indicates. The similar re-sults has been previously published [55]. Figure 5.25 shows the evolution ofthe current for different potential scan rates. The current is roughly propor-tional to the speed, as would be expected from a capacitive behaviour. Thetotal capacitance for unsupported IrO2 was calculated by dividing the cur-rent at a fixed potential of 0.4 V vs. SCE over the speed (see equation 2.52)for different speeds. The resulting Figure 5.26 shows a relatively constantcapacitance for the chosen speed interval. This means, that at the chosenpotential the behaviour of the electrode is purely capacitive.
Figure 5.27 shows cyclic voltammograms, recorded with the prepared sup-ported and unsupported iridium oxide on tantalum electrodes. There is anevident increase in associated voltammetric capacitance value corresponding
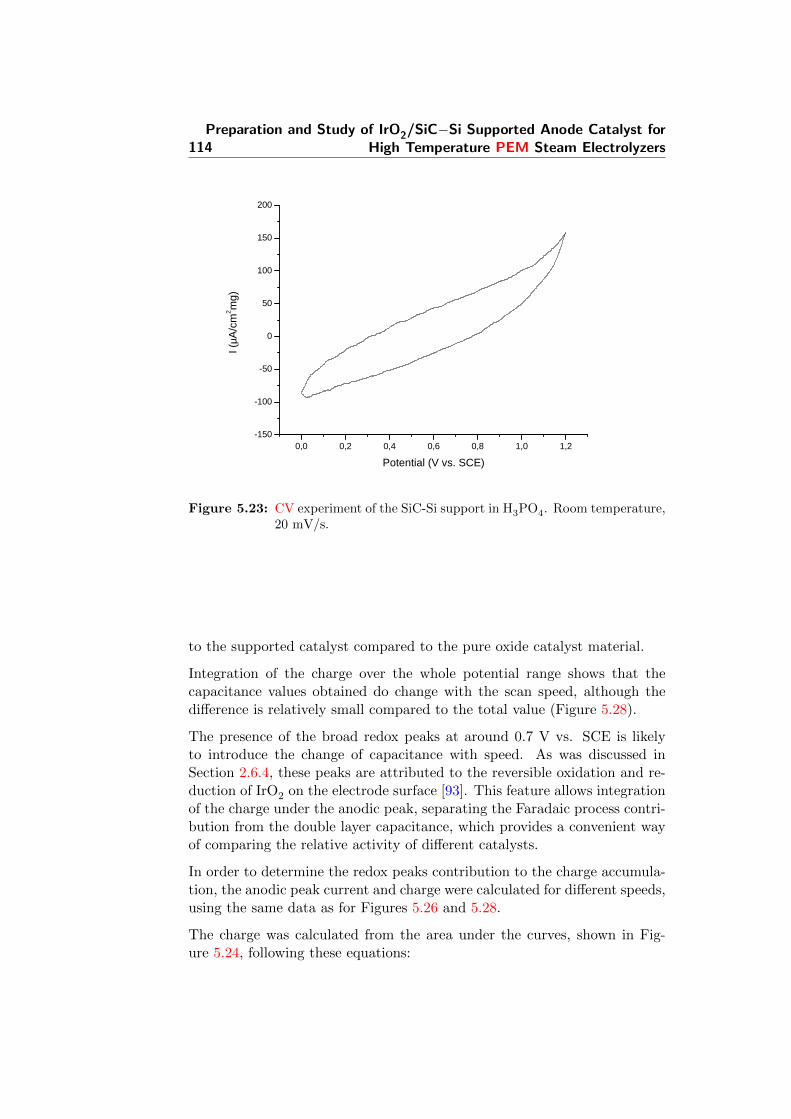
114Preparation and Study of IrO2/SiC−Si Supported Anode Catalyst for
High Temperature PEM Steam Electrolyzers
0 , 0 0 , 2 0 , 4 0 , 6 0 , 8 1 , 0 1 , 2- 1 5 0
- 1 0 0
- 5 0
0
5 0
1 0 0
1 5 0
2 0 0
I (µA/c
m2 mg)
P o t e n t i a l ( V v s . S C E )
Figure 5.23: CV experiment of the SiC-Si support in H3PO4. Room temperature,20 mV/s.
to the supported catalyst compared to the pure oxide catalyst material.
Integration of the charge over the whole potential range shows that thecapacitance values obtained do change with the scan speed, although thedifference is relatively small compared to the total value (Figure 5.28).
The presence of the broad redox peaks at around 0.7 V vs. SCE is likelyto introduce the change of capacitance with speed. As was discussed inSection 2.6.4, these peaks are attributed to the reversible oxidation and re-duction of IrO2 on the electrode surface [93]. This feature allows integrationof the charge under the anodic peak, separating the Faradaic process contri-bution from the double layer capacitance, which provides a convenient wayof comparing the relative activity of different catalysts.
In order to determine the redox peaks contribution to the charge accumula-tion, the anodic peak current and charge were calculated for different speeds,using the same data as for Figures 5.26 and 5.28.
The charge was calculated from the area under the curves, shown in Fig-ure 5.24, following these equations:
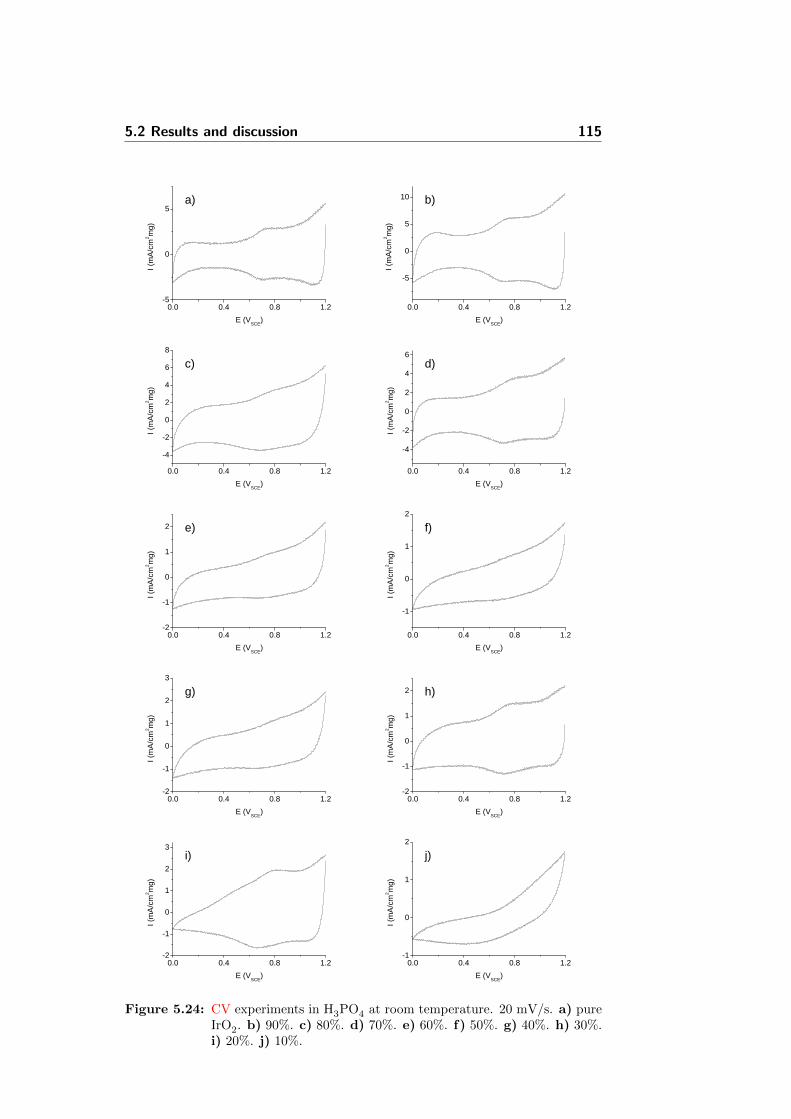
5.2 Results and discussion 115
0 . 0 0 . 4 0 . 8 1 . 2- 5
0
5
I (mA/c
m2 mg)
E ( V S C E )
a )
0 . 0 0 . 4 0 . 8 1 . 2
- 5
0
5
1 0
I (mA/c
m2 mg)
E ( V S C E )
b )
0 . 0 0 . 4 0 . 8 1 . 2- 4- 202468
I (mA/c
m2 mg)
E ( V S C E )
c )
0 . 0 0 . 4 0 . 8 1 . 2
- 4- 20246
I (mA/c
m2 mg)
E ( V S C E )
d )
0 . 0 0 . 4 0 . 8 1 . 2- 2
- 1
0
1
2
I (mA/c
m2 mg)
E ( V S C E )
e )
0 . 0 0 . 4 0 . 8 1 . 2
- 1
0
1
2
I (mA/c
m2 mg)
E ( V S C E )
f )
0 . 0 0 . 4 0 . 8 1 . 2- 2
- 1
0
1
2
3
I (mA/c
m2 mg)
E ( V S C E )
g )
0 . 0 0 . 4 0 . 8 1 . 2- 2
- 1
0
1
2
I (mA/c
m2 mg)
E ( V S C E )
h )
0 . 0 0 . 4 0 . 8 1 . 2- 2
- 1
0
1
2
3
I (mA/c
m2 mg)
E ( V S C E )
i )
0 . 0 0 . 4 0 . 8 1 . 2- 1
0
1
2
I (mA/c
m2 mg)
E ( V S C E )
j )
Figure 5.24: CV experiments in H3PO4 at room temperature. 20 mV/s. a) pureIrO2. b) 90%. c) 80%. d) 70%. e) 60%. f) 50%. g) 40%. h) 30%.i) 20%. j) 10%.
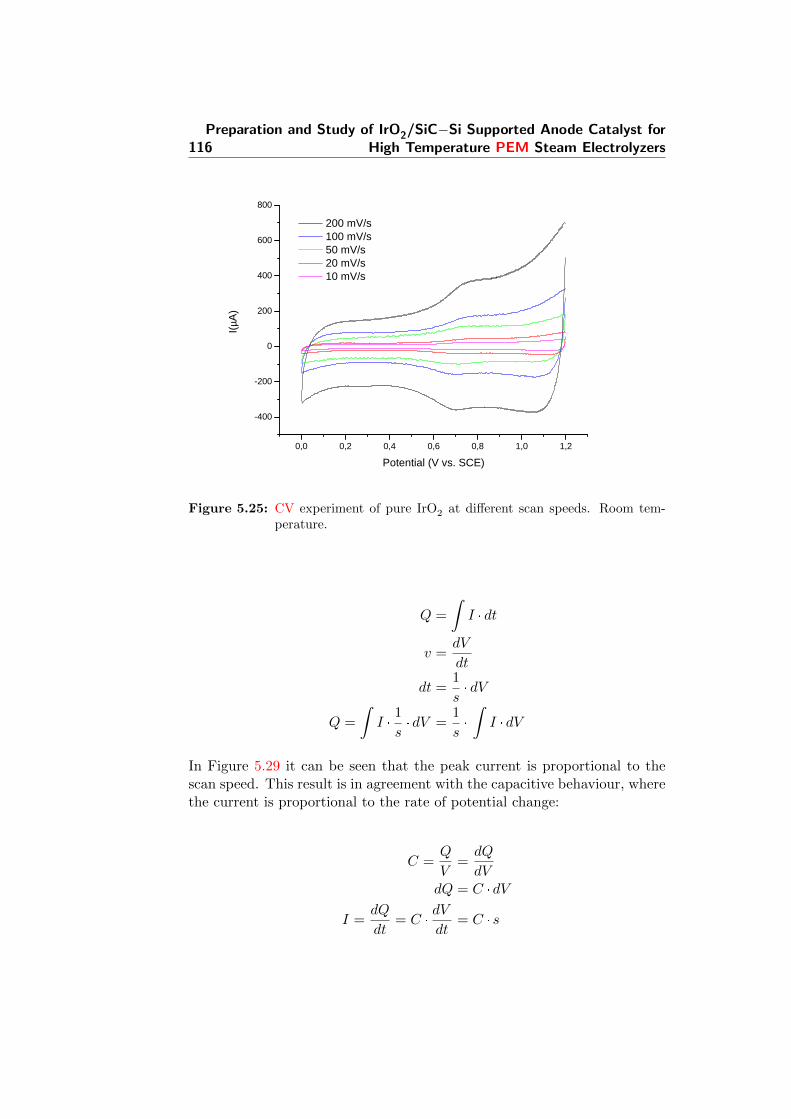
116Preparation and Study of IrO2/SiC−Si Supported Anode Catalyst for
High Temperature PEM Steam Electrolyzers
0 , 0 0 , 2 0 , 4 0 , 6 0 , 8 1 , 0 1 , 2
- 4 0 0
- 2 0 0
0
2 0 0
4 0 0
6 0 0
8 0 0 2 0 0 m V / s 1 0 0 m V / s 5 0 m V / s 2 0 m V / s 1 0 m V / s
I(µA)
P o t e n t i a l ( V v s . S C E )
Figure 5.25: CV experiment of pure IrO2 at different scan speeds. Room tem-perature.
Q =
∫I · dt
v =dV
dt
dt =1
s· dV
Q =
∫I ·
1
s· dV =
1
s·
∫I · dV
In Figure 5.29 it can be seen that the peak current is proportional to thescan speed. This result is in agreement with the capacitive behaviour, wherethe current is proportional to the rate of potential change:
C =Q
V=dQ
dVdQ = C · dV
I =dQ
dt= C ·
dV
dt= C · s
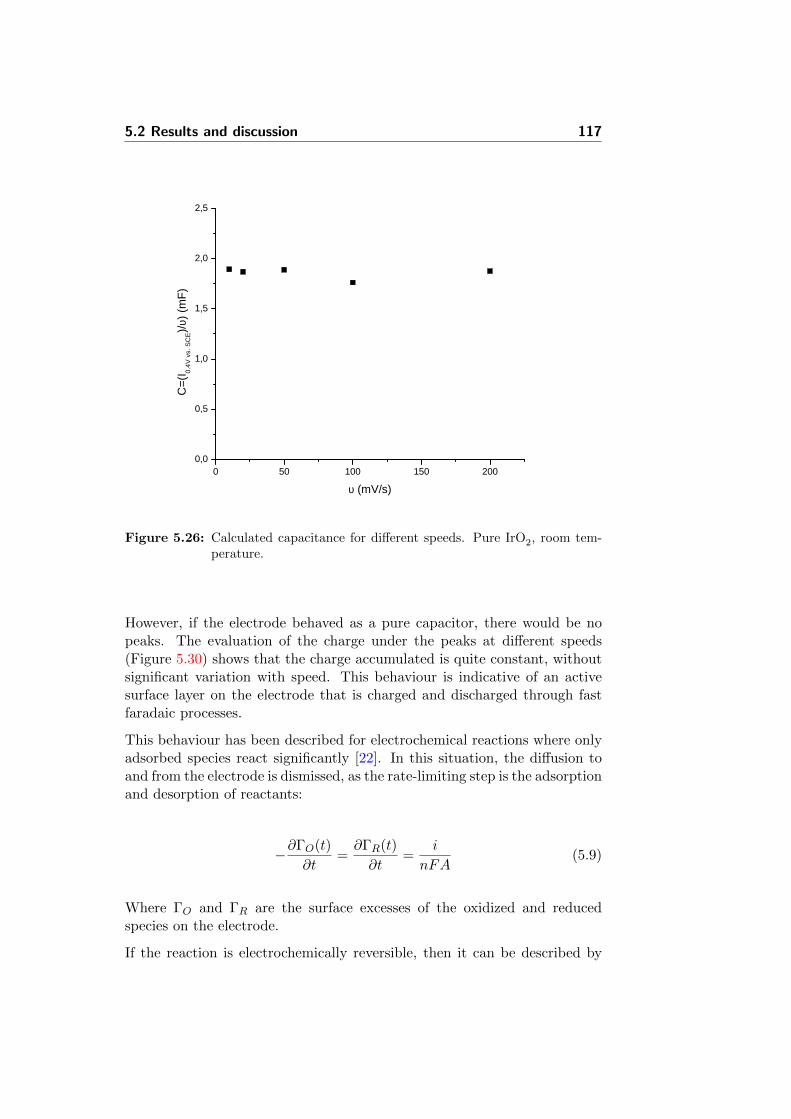
5.2 Results and discussion 117
0 5 0 1 0 0 1 5 0 2 0 00 , 0
0 , 5
1 , 0
1 , 5
2 , 0
2 , 5
C=(I 0.4
V vs.
SCE)/υ
) (mF)
υ ( m V / s )
Figure 5.26: Calculated capacitance for different speeds. Pure IrO2, room tem-perature.
However, if the electrode behaved as a pure capacitor, there would be nopeaks. The evaluation of the charge under the peaks at different speeds(Figure 5.30) shows that the charge accumulated is quite constant, withoutsignificant variation with speed. This behaviour is indicative of an activesurface layer on the electrode that is charged and discharged through fastfaradaic processes.
This behaviour has been described for electrochemical reactions where onlyadsorbed species react significantly [22]. In this situation, the diffusion toand from the electrode is dismissed, as the rate-limiting step is the adsorptionand desorption of reactants:
−∂ΓO(t)
∂t=∂ΓR(t)
∂t=
i
nFA(5.9)
Where ΓO and ΓR are the surface excesses of the oxidized and reducedspecies on the electrode.
If the reaction is electrochemically reversible, then it can be described by
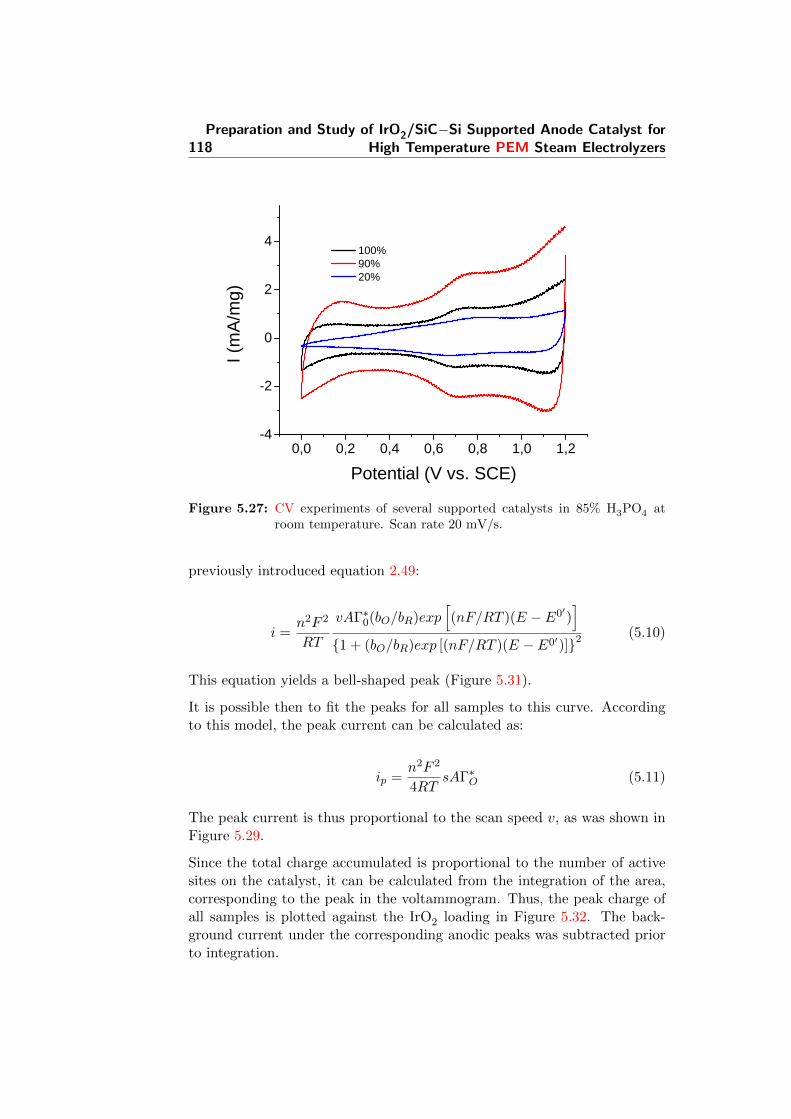
118Preparation and Study of IrO2/SiC−Si Supported Anode Catalyst for
High Temperature PEM Steam Electrolyzers
0 , 0 0 , 2 0 , 4 0 , 6 0 , 8 1 , 0 1 , 2- 4
- 2
0
2
4 1 0 0 % 9 0 % 2 0 %
I (mA/m
g)
P o t e n t i a l ( V v s . S C E )Figure 5.27: CV experiments of several supported catalysts in 85% H3PO4 at
room temperature. Scan rate 20 mV/s.
previously introduced equation 2.49:
i =n2F 2
RT
vAΓ∗0(bO/bR)exp[(nF/RT )(E − E0′)
]1 + (bO/bR)exp [(nF/RT )(E − E0′)]2
(5.10)
This equation yields a bell-shaped peak (Figure 5.31).
It is possible then to fit the peaks for all samples to this curve. Accordingto this model, the peak current can be calculated as:
ip =n2F 2
4RTsAΓ∗O (5.11)
The peak current is thus proportional to the scan speed v, as was shown inFigure 5.29.
Since the total charge accumulated is proportional to the number of activesites on the catalyst, it can be calculated from the integration of the area,corresponding to the peak in the voltammogram. Thus, the peak charge ofall samples is plotted against the IrO2 loading in Figure 5.32. The back-ground current under the corresponding anodic peaks was subtracted priorto integration.
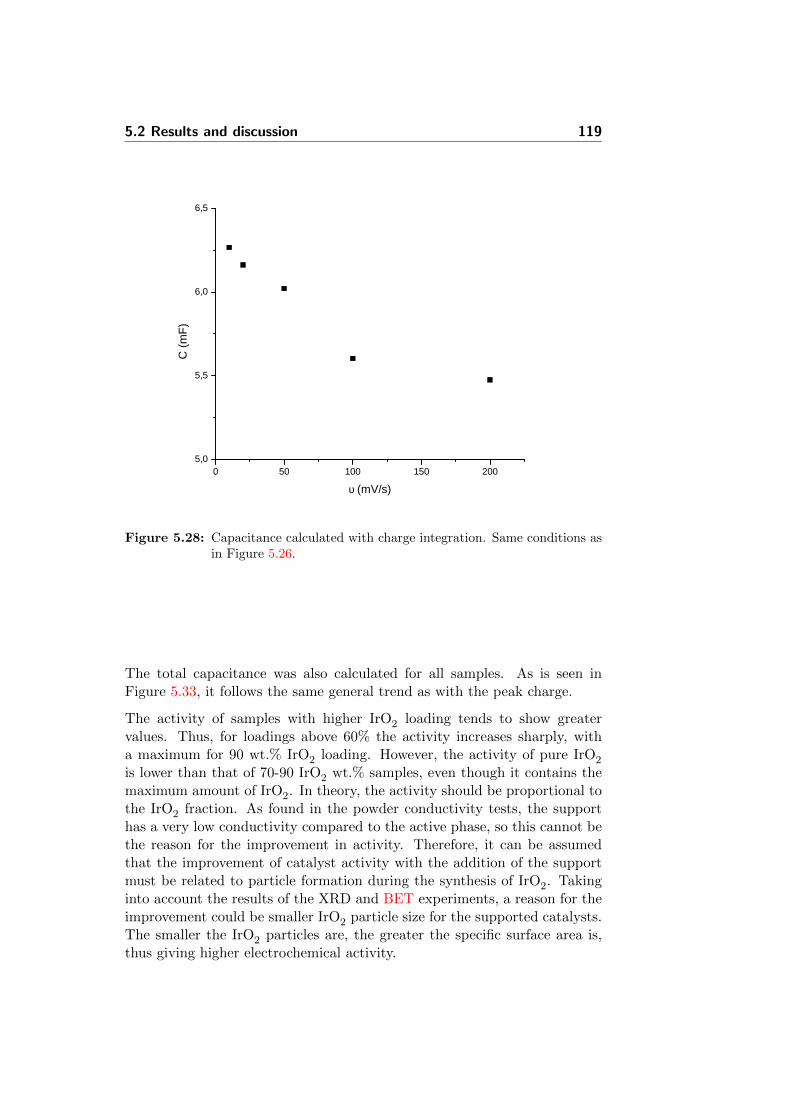
5.2 Results and discussion 119
0 5 0 1 0 0 1 5 0 2 0 05 , 0
5 , 5
6 , 0
6 , 5
C (mF
)
υ ( m V / s )
Figure 5.28: Capacitance calculated with charge integration. Same conditions asin Figure 5.26.
The total capacitance was also calculated for all samples. As is seen inFigure 5.33, it follows the same general trend as with the peak charge.
The activity of samples with higher IrO2 loading tends to show greatervalues. Thus, for loadings above 60% the activity increases sharply, witha maximum for 90 wt.% IrO2 loading. However, the activity of pure IrO2
is lower than that of 70-90 IrO2 wt.% samples, even though it contains themaximum amount of IrO2. In theory, the activity should be proportional tothe IrO2 fraction. As found in the powder conductivity tests, the supporthas a very low conductivity compared to the active phase, so this cannot bethe reason for the improvement in activity. Therefore, it can be assumedthat the improvement of catalyst activity with the addition of the supportmust be related to particle formation during the synthesis of IrO2. Takinginto account the results of the XRD and BET experiments, a reason for theimprovement could be smaller IrO2 particle size for the supported catalysts.The smaller the IrO2 particles are, the greater the specific surface area is,thus giving higher electrochemical activity.
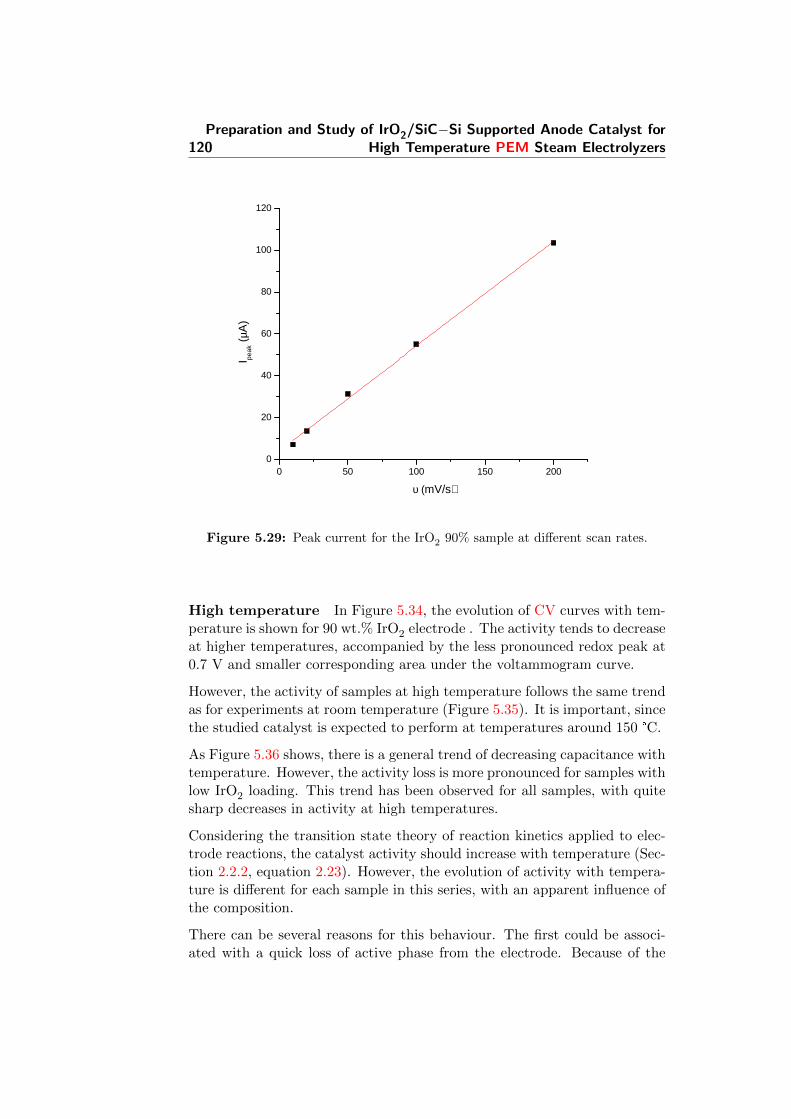
120Preparation and Study of IrO2/SiC−Si Supported Anode Catalyst for
High Temperature PEM Steam Electrolyzers
0 5 0 1 0 0 1 5 0 2 0 00
2 0
4 0
6 0
8 0
1 0 0
1 2 0
I peak
(µA)
υ (m V / s )
Figure 5.29: Peak current for the IrO2 90% sample at different scan rates.
High temperature In Figure 5.34, the evolution of CV curves with tem-perature is shown for 90 wt.% IrO2 electrode . The activity tends to decreaseat higher temperatures, accompanied by the less pronounced redox peak at0.7 V and smaller corresponding area under the voltammogram curve.
However, the activity of samples at high temperature follows the same trendas for experiments at room temperature (Figure 5.35). It is important, sincethe studied catalyst is expected to perform at temperatures around 150 °C.
As Figure 5.36 shows, there is a general trend of decreasing capacitance withtemperature. However, the activity loss is more pronounced for samples withlow IrO2 loading. This trend has been observed for all samples, with quitesharp decreases in activity at high temperatures.
Considering the transition state theory of reaction kinetics applied to elec-trode reactions, the catalyst activity should increase with temperature (Sec-tion 2.2.2, equation 2.23). However, the evolution of activity with tempera-ture is different for each sample in this series, with an apparent influence ofthe composition.
There can be several reasons for this behaviour. The first could be associ-ated with a quick loss of active phase from the electrode. Because of the
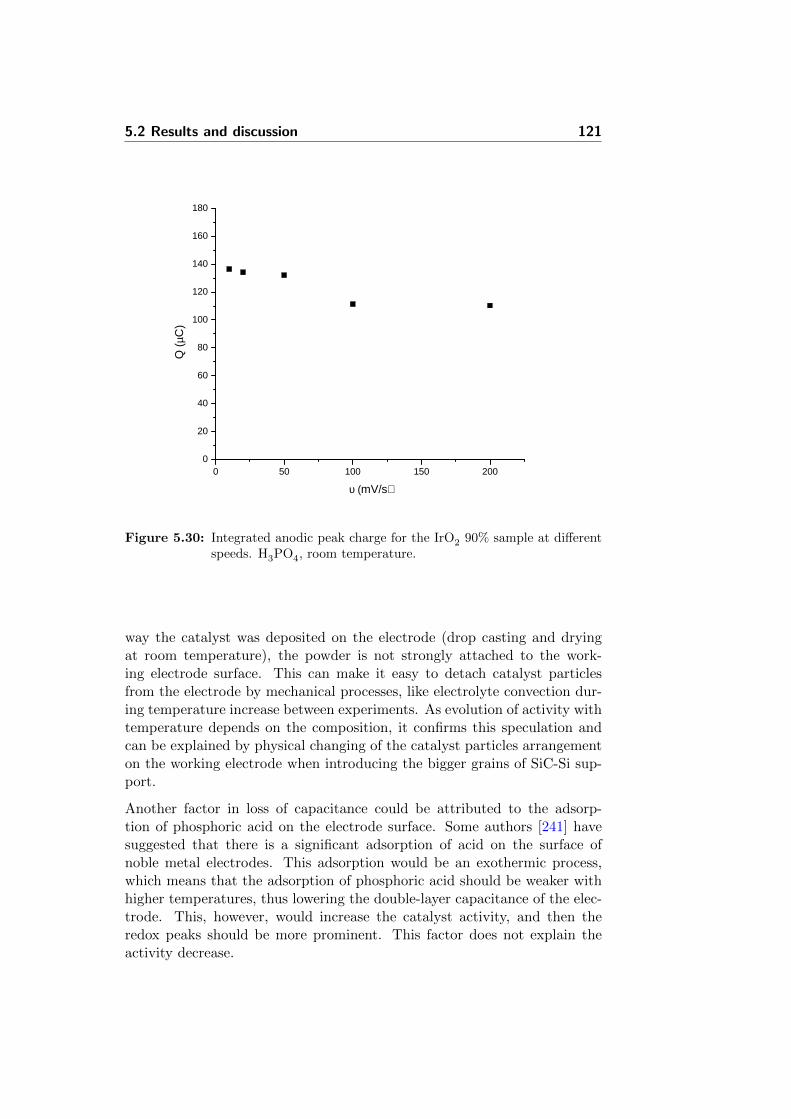
5.2 Results and discussion 121
0 5 0 1 0 0 1 5 0 2 0 00
2 0
4 0
6 0
8 0
1 0 0
1 2 0
1 4 0
1 6 0
1 8 0
Q (µC
)
υ (m V / s )
Figure 5.30: Integrated anodic peak charge for the IrO2 90% sample at differentspeeds. H3PO4, room temperature.
way the catalyst was deposited on the electrode (drop casting and dryingat room temperature), the powder is not strongly attached to the work-ing electrode surface. This can make it easy to detach catalyst particlesfrom the electrode by mechanical processes, like electrolyte convection dur-ing temperature increase between experiments. As evolution of activity withtemperature depends on the composition, it confirms this speculation andcan be explained by physical changing of the catalyst particles arrangementon the working electrode when introducing the bigger grains of SiC-Si sup-port.
Another factor in loss of capacitance could be attributed to the adsorp-tion of phosphoric acid on the electrode surface. Some authors [241] havesuggested that there is a significant adsorption of acid on the surface ofnoble metal electrodes. This adsorption would be an exothermic process,which means that the adsorption of phosphoric acid should be weaker withhigher temperatures, thus lowering the double-layer capacitance of the elec-trode. This, however, would increase the catalyst activity, and then theredox peaks should be more prominent. This factor does not explain theactivity decrease.
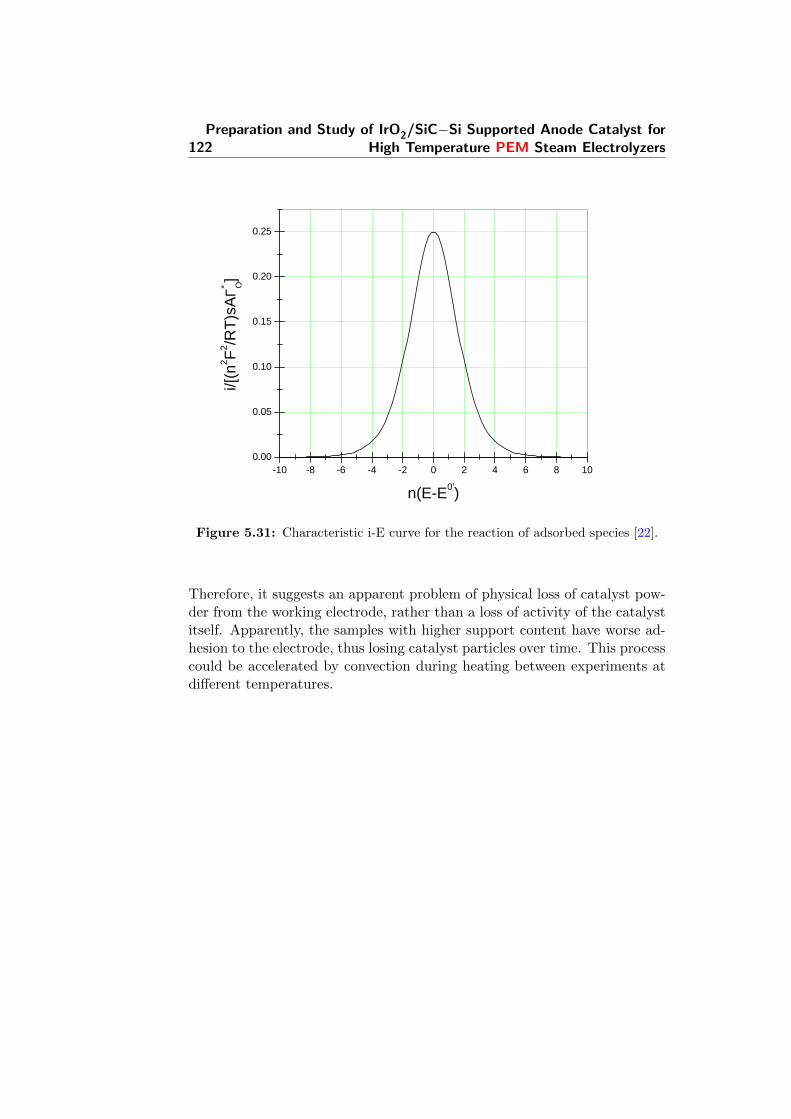
122Preparation and Study of IrO2/SiC−Si Supported Anode Catalyst for
High Temperature PEM Steam Electrolyzers
- 1 0 - 8 - 6 - 4 - 2 0 2 4 6 8 1 00 . 0 0
0 . 0 5
0 . 1 0
0 . 1 5
0 . 2 0
0 . 2 5i/[(
n2 F2 /RT)sA
Γ∗ Ο]
n ( E - E 0 ’ )Figure 5.31: Characteristic i-E curve for the reaction of adsorbed species [22].
Therefore, it suggests an apparent problem of physical loss of catalyst pow-der from the working electrode, rather than a loss of activity of the catalystitself. Apparently, the samples with higher support content have worse ad-hesion to the electrode, thus losing catalyst particles over time. This processcould be accelerated by convection during heating between experiments atdifferent temperatures.
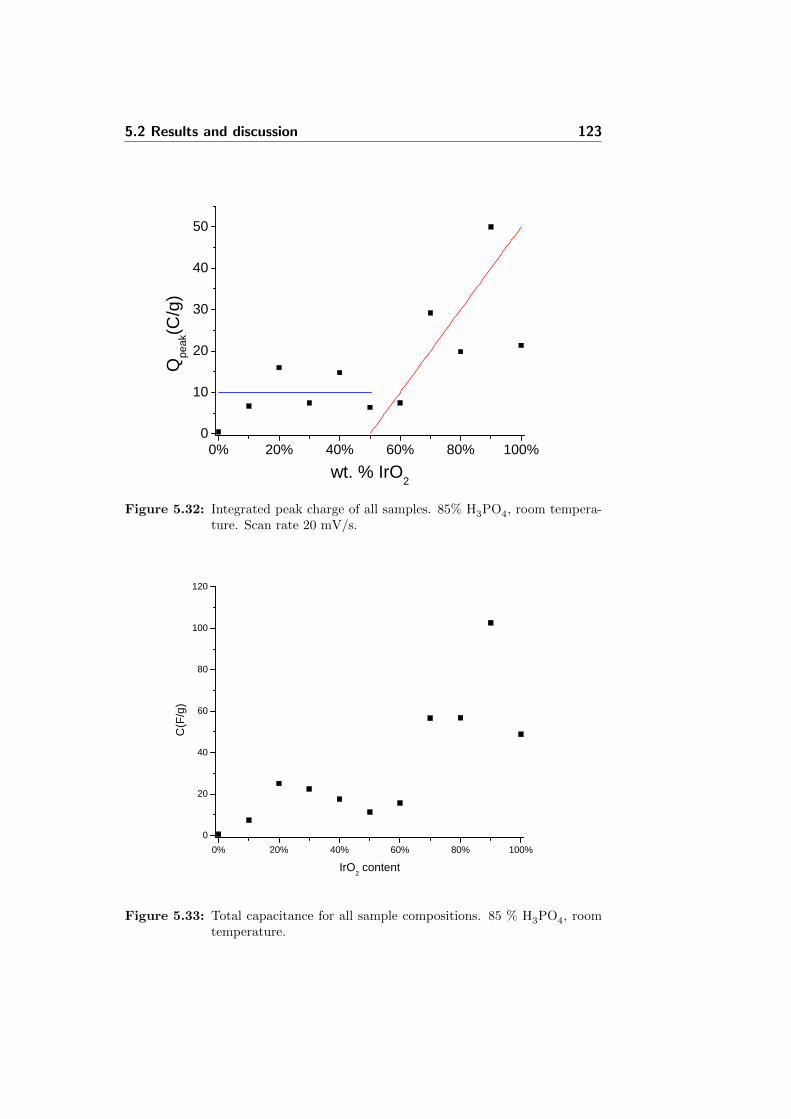
5.2 Results and discussion 123
0 % 2 0 % 4 0 % 6 0 % 8 0 % 1 0 0 %0
1 0
2 0
3 0
4 0
5 0
Q peak
(C/g)
w t . % I r O 2
Figure 5.32: Integrated peak charge of all samples. 85% H3PO4, room tempera-ture. Scan rate 20 mV/s.
0 % 2 0 % 4 0 % 6 0 % 8 0 % 1 0 0 %0
2 0
4 0
6 0
8 0
1 0 0
1 2 0
C(F/g
)
I r O 2 c o n t e n t
Figure 5.33: Total capacitance for all sample compositions. 85 % H3PO4, roomtemperature.
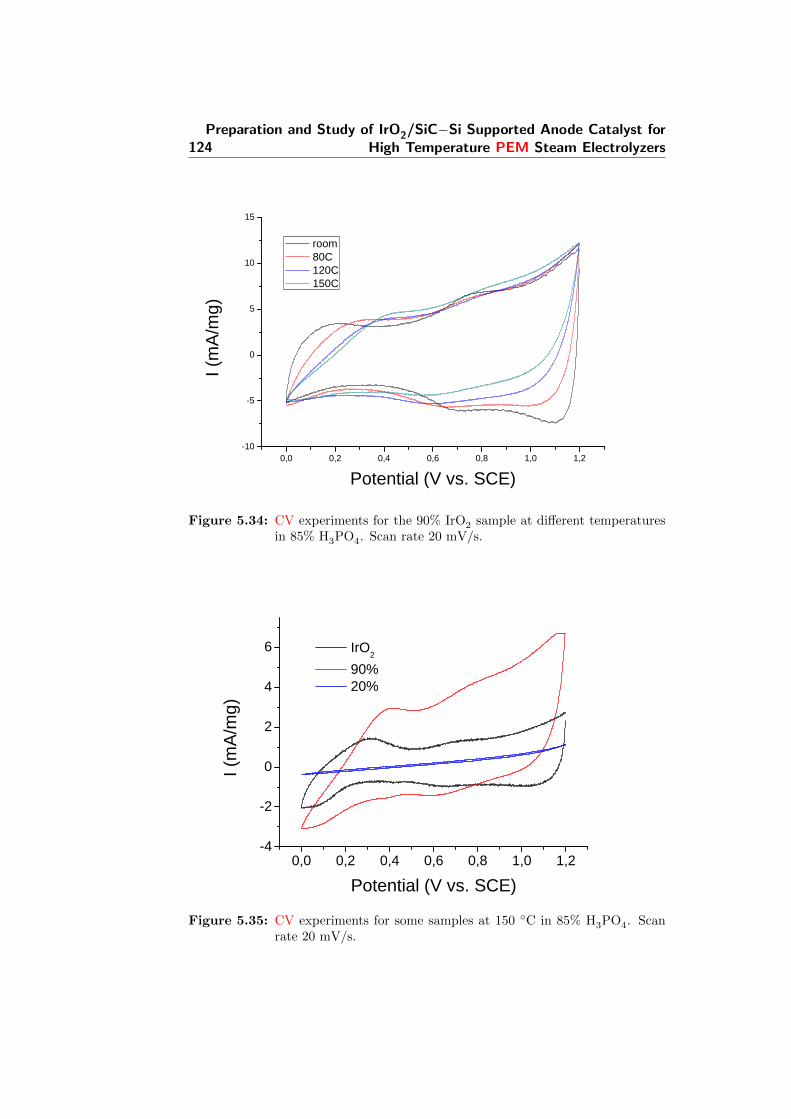
124Preparation and Study of IrO2/SiC−Si Supported Anode Catalyst for
High Temperature PEM Steam Electrolyzers
0 , 0 0 , 2 0 , 4 0 , 6 0 , 8 1 , 0 1 , 2- 1 0
- 5
0
5
1 0
1 5I (m
A/mg)
P o t e n t i a l ( V v s . S C E )
r o o m 8 0 C 1 2 0 C 1 5 0 C
Figure 5.34: CV experiments for the 90% IrO2 sample at different temperaturesin 85% H3PO4. Scan rate 20 mV/s.
0 , 0 0 , 2 0 , 4 0 , 6 0 , 8 1 , 0 1 , 2- 4
- 2
0
2
4
6 I r O 2 9 0 % 2 0 %
I (mA/m
g)
P o t e n t i a l ( V v s . S C E )Figure 5.35: CV experiments for some samples at 150 C in 85% H3PO4. Scan
rate 20 mV/s.
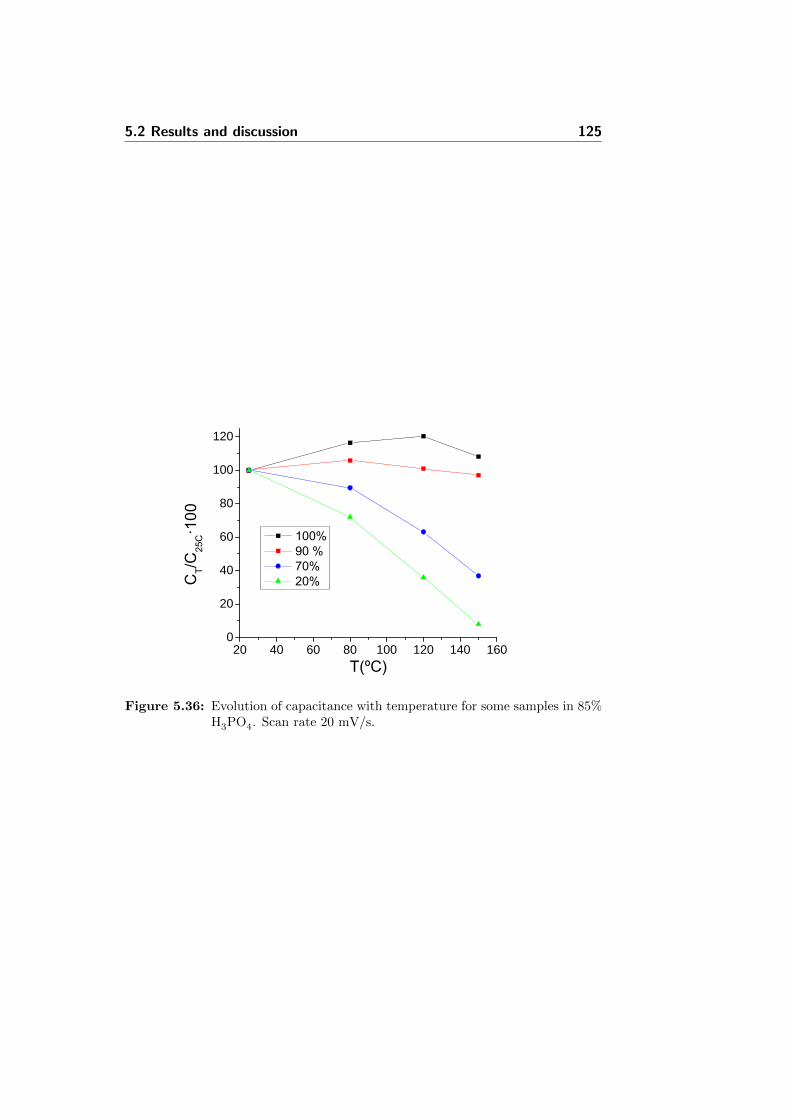
5.2 Results and discussion 125
2 0 4 0 6 0 8 0 1 0 0 1 2 0 1 4 0 1 6 00
2 0
4 0
6 0
8 0
1 0 0
1 2 0
Figure 5.36: Evolution of capacitance with temperature for some samples in 85%H3PO4. Scan rate 20 mV/s.
126Preparation and Study of IrO2/SiC−Si Supported Anode Catalyst for
High Temperature PEM Steam Electrolyzers
5.3 Conclusions
Catalysts composed of IrO2 on a SiC-Si support were prepared using theAdams fusion method. The bulk composition of the samples was successfullycontrolled, as shown in the XRD results.
The different techniques, employed for characterization of synthesized sam-ples provide interesting results which allow to assess the influence of theaddition of the support to the IrO2 catalyst from different perspectives.
It was shown in Section 5.2.1.2 that there is a very good correlation ofthe relative signals of IrO2 and SiC-Si with the nominal composition ofthe prepared powders. The average crystal size of IrO2, as calculated fromthe analysis of the peak width, is noticeably smaller in the presence of thesupport particles. On the other hand, the support material was not modifiedduring the preparation and no new phases formation were detected after thesynthesis of supported catalyst (Figure 5.12). This means that any sampleproperty directly related to its composition should follow the rule of mixturesand having the general agreement with equation 5.12:
SBETsample = XwSiC ·S
BETSiC +Xw
IrO2·SBETIrO2
(5.12)
where XwSiC and Xw
IrO2are the mass fractions of SiC and IrO2, respectively.
This was shown by the BET results, where the specific surface area of eachsample was approximately the result of weighting the contribution of specificsurface areas of the support and the active phase (Figure 5.15). The supportwas found to have a rather small specific surface area, of around 6 m2/g,while the active phase had 121 m2/g.
However, the supported catalysts showed higher specific area than expected,especially for samples with 70-90 wt.% of IrO2. The BET area for thesesamples is significantly higher than that of pure IrO2 powder. The differenceis explained neither by instrumental error, nor by a difference in composition,as has been shown. There must be other factor that is different for pureand supported IrO2. This was attributed to different conditions during thecatalyst synthesis, affecting the particle size.
The analysis of the XRD spectra and the evolution of the calculated crys-tal size with composition (Figure 5.14) confirms this speculation. Whilethe particles of the support show homogeneous crystal size, the parameterchanges for IrO2 particles, increasing gradually with the oxide loading (Ta-ble 5.4). There is a significant step between 90% and pure IrO2, with theparticle size being particularly big for the pure oxide. Therefore, presenceof the support apparently influences the crystal size.
5.3 Conclusions 127
Table 5.7 resumes the difference in properties between the support and theactive phase.
Table 5.7: Comparison of properties of IrO2 and SiC-Si compound.
Property IrO2 SiC-Si
Conductivity (S/cm) 66 2 · 10−5
BET area (m2/g) 120 5Particle size (µm) 0.3 5Capacitance (F/g) 49 1
It is evident that none of the mentioned above properties of the SiC-Sicomposite are superior to those of IrO2. It is especially noticeable that,even though the electric conductivity of the support is 6 orders of magnitudelower than that of IrO2, the introduction of 10% of essentially insulatingparticles actually improves the performance of the catalyst, and also itssurface texture.
The first phenomena that can affect the performance of the catalyst is themodified conditions during its synthesis. The IrO2 particles are formed froma crystallized precursor. Known factors that can affect particle growth aretemperature, ionic strength, saturation of the solution, etc. The presenceof the support particles can affect the nucleation and/or growth of the pre-cursor particles, for instance through the electrostatic interaction. Likewise,a support can provide a nucleation surface for the oxide and influence theparticle growth, as the electronic microscopy images suggest, with the IrO2
particles dispersed on the SiC-Si ones.
Another reason for the different performance could be different packing ofcatalyst particles during the electrode preparation procedure. The accessof the electrolyte to the catalyst surface is obviously very important forits activity. In an electrode composed of aggregated particles, the spacesbetween particles provide room for the access of the electrolyte and thusadequate transport of reactants and current. The distribution of the catalystparticles is thus one of the key factors for the electrode performance. It canbe affected by size and shape of the active phase particles, but also by thepresence of a support material. It is possible that the support particlesmodify the access of the electrolyte, by changing the amount, length ordiameter of the pores between particles.
The powder conductivity tests gave interesting results. The SiC-Si compos-ite support had conductivity of 5-6 orders of magnitude lower, than the IrO2
powder. This meant that the conductivity depended strongly on the IrO2
loading.
128Preparation and Study of IrO2/SiC−Si Supported Anode Catalyst for
High Temperature PEM Steam Electrolyzers
However, this relationship was not linear, having a significant step in conduc-tivity at middle loadings and following a model, where the contact betweenIrO2 particles plays a key role in the current conduction through the sample.The step in conductivity around 60% in mass fraction of IrO2 suggests theupper limit for the addition of a low-conducting support to the catalyst. Asignificant step in conductivity from the pure IrO2 powder to the 90% sam-ple was attributed to a difference in packing of the powder particles, withthe presence of the support, decreasing the number of contacts between IrO2
particles, which would be thus more loosely packed. However, a conduct-ing support is usually chosen in order to guarantee good electric contactbetween the catalyst particles and the current collector, as for instance thecarbon-supported Pt hydrogen electrode in PEMFCs. Therefore, in the caseof a support, having high electrical conductivity, this question may not beof immediate interest.
At the same time, following a provided in Section 5.2.1.5 discussion on thegeneral requirements for the catalytic layer maximum acceptable resistancevalue and its influence on the overall ohmic drop, all samples with a loadingof IrO2 20 wt.% and above inclusively have enough electronic conductivityfor the catalytic layer application without significant contribution to thepotential losses.
The CV experiments provided similar results. The behaviour of IrO2 at roomtemperature was found to be similar to previously published results, having apseudo-capacitive behaviour with broad redox peaks around 0.7 V vs. SCE.These peaks were attributed to the oxidation/reduction of adsorbed specieson the electrode. The specific activity of 70-90 wt.% samples was foundto be higher than that of pure unsupported catalyst. This was attributedto the improved surface properties of IrO2 in the presence of the support,rather than to better conductivity or surface area of the support itself, whichpossesses rather poor properties, compared to IrO2 (Table 5.7).
At high temperatures, all electrodes lost activity with respect to room tem-perature. This was contrary to the expected results, since the electrodekinetics should improve at elevated temperatures. The decreased activitywas attributed to the loss of the catalyst material from the working elec-trode, perhaps due to electrolyte convection and poor interaction with thefinely polished tantalum electrode surface. However, the activity trends withdifferent composition were found to be the same as for room temperature.
The physicochemical characterization of the supported catalysts showed pos-itive influence of the support in formation of IrO2 particles. Some of the sup-ported catalysts performed better than the pure catalyst, which suggests aninfluence of the support particles on the active phase through two possiblemechanisms. The first is where presence of the support affects the formationof the IrO2 particles with smaller particle sizes and thus higher surface area.

5.3 Conclusions 129
Second, when the IrO2 particle packing can be affected by the SiC-Si parti-cles, leaving more open spaces. This would explain both the lower electricconductivity of the supported catalysts with respect to the pure oxide, andhigher activity and specific surface area of some of the samples.
Based on the above results, the SiC-Si compound can be recommended asa potential candidate for a catalyst support for oxygen evolution electrodesin phosphoric acid doped membrane steam electrolyzers.

130Preparation and Study of IrO2/SiC−Si Supported Anode Catalyst for
High Temperature PEM Steam Electrolyzers

Chapter 6
Concluding Remarks,Perspectives and Further
Research
The corrosion stability of the chosen stainless steels and nickel-based alloysappeared to be insufficient for these materials to be used in HTPEMECs.However, CVD-tantalum coating showed outstanding stability in the se-lected media. Therefore, such coatings on the bipolar plates and gas diffu-sion layers are recommended for long term tests of working HTPEMECs.
Concerning materials for the oxygen evolution electrode, today, the oxygenevolution reaction catalysts are practically limited to only IrO2. Moreover,RuO2 appears to be unstable under the conditions of HTPEMEC. Alterna-tives must be found even if the working temperature of electrolyzers mightbe required to be higher for any valid non-noble catalyst material. There-fore, in this work a development towards oxygen evolution electrodes withlower active electrocatalyst loading was intended.
Even though the developed electrodes showed a promising activity, the longterm stability investigations still need to be developed and performed.
In this work a commercial SiC-Si material was used, with a free Si part ofca 20%. Such semi-conducting materials are known to be highly sensitiveeven to minor doping, which can enhance conductivity of the material sig-nificantly. It is therefore proposed in the future to make investigation onsynthesising SiC in the laboratory conditions with different portions of freesilicon.
132 Concluding Remarks, Perspectives and Further Research
Even though the used catalyst support was poorly conductive itself, its ad-dition to the active phase improved the specific activity of the catalyst. Themost interesting compositions appear to be those with high loading of IrO2.As discussed in Chapter 3.8, adequate supports should have good corro-sion and thermal resistance in phosphoric acid at high temperatures andoxidizing conditions. The SiC-Si was found to be inert through the wholetemperature range studied, which is a promising result regarding the possi-ble study of related materials, such as titanium carbide and silicon nitride.This also suggests that a wide range of refractory materials might be foundfor oxygen evolution reaction electrodes in future investigation.
The decrease of performance of the prepared electrodes (Chapter 5) at hightemperatures was attributed to the loss of the catalyst material from thesurface of the electrode, rather than the loss of performance of the catalystitself. Therefore, it is desirable to develop a conventional electrochemicalcharacterisation technique for fast screening of powder OER catalysts atelevated temperatures.
Taking into account the results, the next step would be testing of the devel-oped supported catalysts as anodes in assembled MEAs, and testing them incell stacks. MEA testing presents a reliable option for assessing the activityof the catalyst under real working conditions.

Chapter 7
Papers

134 Papers

Paper 1
Corrosion behaviour of constructionmaterials for high temperature steamelectrolysers
A.V. Nikiforov, I.M. Petrushina, E. Christensen, A. L. Tomas-Garcıa, N.JBjerrum.
International Journal of Hydrogen Energy, 36(1):111–119, January 2011

136 Papers
Corrosion behaviour of construction materials for hightemperature steam electrolysers
A.V. Nikiforov*, I.M. Petrushina, E. Christensen, A.L. Tomas-Garcıa, N.J. Bjerrum
Energy and Materials Science Group, Department of Chemistry, Technical University of Denmark, Kemitorvet 207,
DK-2800 Kgs. Lyngby, Denmark
a r t i c l e i n f o
Article history:
Received 14 July 2010
Received in revised form
6 September 2010
Accepted 8 September 2010
Keywords:
Water electrolysis
Polymer electrolyte membrane
(PEM)
Metallic bipolar plate
Phosphoric acid
Corrosion resistance
Polarisation
a b s t r a c t
Different types of commercially available stainless steels, Ni-based alloys aswell as titanium
and tantalumwere evaluated as possiblemetallic bipolar plates and constructionmaterials.
The corrosion resistance was measured under simulated conditions corresponding to the
conditions in high temperature proton exchange membrane (PEM) steam electrolysers.
Steady-state voltammetry was used in combination with scanning electronmicroscopy and
energy-dispersive X-ray spectroscopy to evaluate the stability of thementionedmaterials. It
was found that stainless steels were the least resistant to corrosion under strong anodic
polarisation. Among alloys, Ni-based showed the highest corrosion resistance in the simu-
lated PEM electrolyser medium. In particular, Inconel 625 was the most promising among
the tested corrosion-resistant alloys for the anodic compartment in high temperature steam
electrolysis. Tantalumshowed outstanding resistance to corrosion in selectedmedia. On the
contrary, passivation of titanium was weak, and the highest rate of corrosion among all
tested materials was observed for titanium at 120 C.
ª 2010 Professor T. Nejat Veziroglu. Published by Elsevier Ltd. All rights reserved.
1. Introduction
Most of long term visions about the use of hydrogen as an
energy carrier include electrolysis. Unfortunately, the effi-
ciency of water splitting by electrolysis is rather low for
conventional electrolysers and there is hence a large potential
for improvement.
Decentralized production of hydrogen by means of water
electrolysis is favourable in several ways. When renewable
energy sources (hydropower, windmills, solar cells, etc.) are
considered, electrolysis is a practical way of converting the
surplus electrical energy into chemical energy to be usedwhen
the power is needed [1]. One way of doing this is by using high
temperature water steam electrolysis (above 100 C).
PEM water electrolysis technology is frequently presented
in the literature as a potentially very effective alternative to
more conventional alkaline water electrolysis [2e4].
PEM water electrolysis systems offer several advantages
over traditional technologies, including higher energy effi-
ciency, higher production rates, and more compact design [5].
This method of hydrogen production is envisioned in a future
society where hydrogen as the energy carrier is incorporated
in an idealized “energy cycle”. In this cycle, electricity from
renewable energy sources is used to electrochemically split
water into hydrogen and oxygen [6].
This technology is environmentally friendly and usually
has a considerably smaller massevolume characteristic and
power cost. Besides the high purity of produced gases, there is
* Corresponding author.E-mail address: [email protected] (A.V. Nikiforov).
Avai lab le a t www.sc iencedi rec t .com
journa l homepage : www.e lsev ier . com/ loca te /he
i n t e r n a t i o n a l j o u rn a l o f h y d r o g e n en e r g y 3 6 ( 2 0 1 1 ) 1 1 1e1 1 9
0360-3199/$ e see front matter ª 2010 Professor T. Nejat Veziroglu. Published by Elsevier Ltd. All rights reserved.doi:10.1016/j.ijhydene.2010.09.023
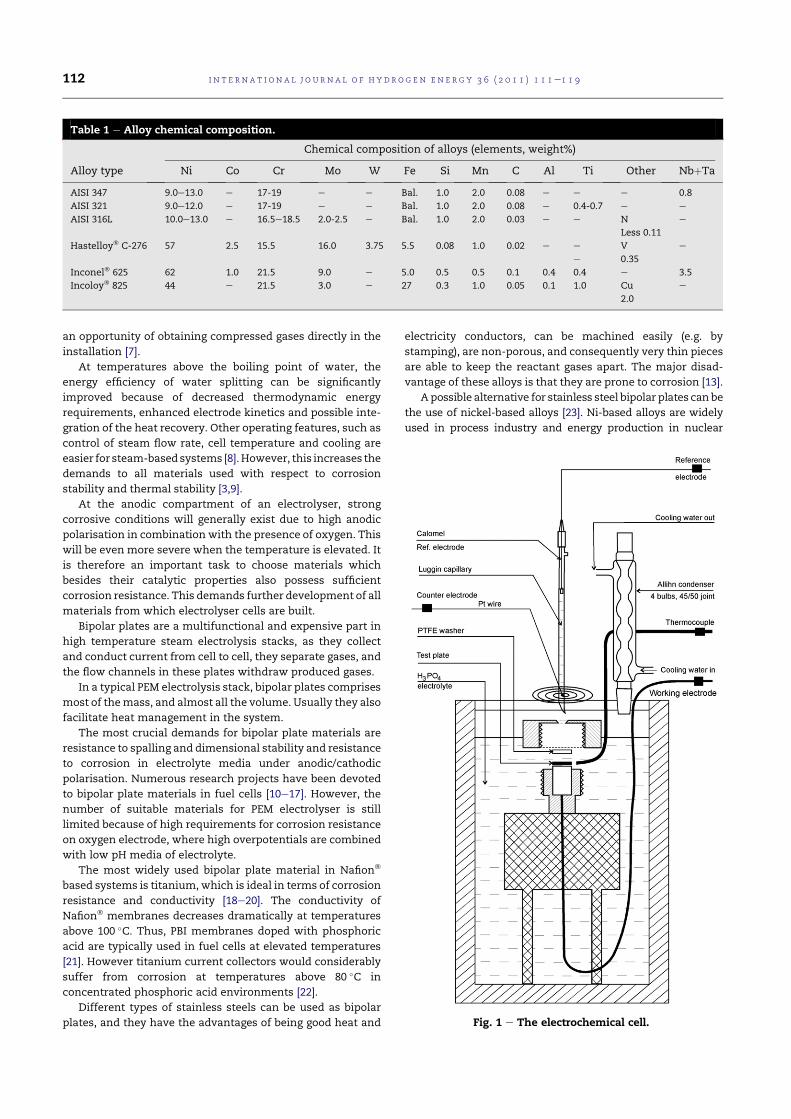
an opportunity of obtaining compressed gases directly in the
installation [7].
At temperatures above the boiling point of water, the
energy efficiency of water splitting can be significantly
improved because of decreased thermodynamic energy
requirements, enhanced electrode kinetics and possible inte-
gration of the heat recovery. Other operating features, such as
control of steam flow rate, cell temperature and cooling are
easier for steam-based systems [8].However, this increases the
demands to all materials used with respect to corrosion
stability and thermal stability [3,9].
At the anodic compartment of an electrolyser, strong
corrosive conditions will generally exist due to high anodic
polarisation in combination with the presence of oxygen. This
will be even more severe when the temperature is elevated. It
is therefore an important task to choose materials which
besides their catalytic properties also possess sufficient
corrosion resistance. This demands further development of all
materials from which electrolyser cells are built.
Bipolar plates are a multifunctional and expensive part in
high temperature steam electrolysis stacks, as they collect
and conduct current from cell to cell, they separate gases, and
the flow channels in these plates withdraw produced gases.
In a typical PEM electrolysis stack, bipolar plates comprises
most of themass, and almost all the volume. Usually they also
facilitate heat management in the system.
The most crucial demands for bipolar plate materials are
resistance to spalling and dimensional stability and resistance
to corrosion in electrolyte media under anodic/cathodic
polarisation. Numerous research projects have been devoted
to bipolar plate materials in fuel cells [10e17]. However, the
number of suitable materials for PEM electrolyser is still
limited because of high requirements for corrosion resistance
on oxygen electrode, where high overpotentials are combined
with low pH media of electrolyte.
The most widely used bipolar plate material in Nafion
based systems is titanium,which is ideal in terms of corrosion
resistance and conductivity [18e20]. The conductivity of
Nafion membranes decreases dramatically at temperatures
above 100 C. Thus, PBI membranes doped with phosphoric
acid are typically used in fuel cells at elevated temperatures
[21]. However titanium current collectors would considerably
suffer from corrosion at temperatures above 80 C in
concentrated phosphoric acid environments [22].
Different types of stainless steels can be used as bipolar
plates, and they have the advantages of being good heat and
electricity conductors, can be machined easily (e.g. by
stamping), are non-porous, and consequently very thin pieces
are able to keep the reactant gases apart. The major disad-
vantage of these alloys is that they are prone to corrosion [13].
A possible alternative for stainless steel bipolar plates can be
the use of nickel-based alloys [23]. Ni-based alloys are widely
used in process industry and energy production in nuclear
Table 1 e Alloy chemical composition.
Chemical composition of alloys (elements, weight%)
Alloy type Ni Co Cr Mo W Fe Si Mn C Al Ti Other NbþTa
AISI 347 9.0e13.0 e 17-19 e e Bal. 1.0 2.0 0.08 e e e 0.8
AISI 321 9.0e12.0 e 17-19 e e Bal. 1.0 2.0 0.08 e 0.4-0.7 e e
AISI 316L 10.0e13.0 e 16.5e18.5 2.0-2.5 e Bal. 1.0 2.0 0.03 e e N e
Less 0.11
Hastelloy C-276 57 2.5 15.5 16.0 3.75 5.5 0.08 1.0 0.02 e e V e
e 0.35
Inconel 625 62 1.0 21.5 9.0 e 5.0 0.5 0.5 0.1 0.4 0.4 e 3.5
Incoloy 825 44 e 21.5 3.0 e 27 0.3 1.0 0.05 0.1 1.0 Cu e
2.0
Fig. 1 e The electrochemical cell.
i n t e rn a t i o n a l j o u r n a l o f h y d r o g e n en e r g y 3 6 ( 2 0 1 1 ) 1 1 1e1 1 9112
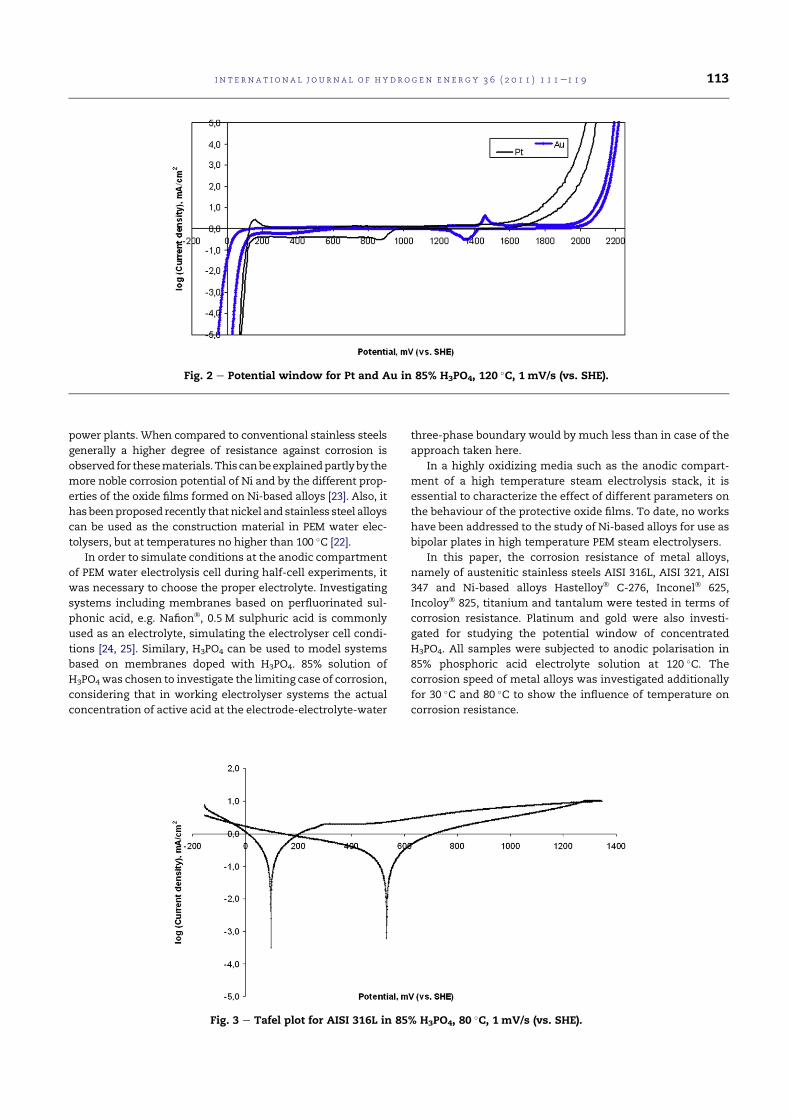
power plants. When compared to conventional stainless steels
generally a higher degree of resistance against corrosion is
observed for thesematerials. Thiscanbeexplainedpartlyby the
more noble corrosion potential of Ni and by the different prop-
erties of the oxide films formed on Ni-based alloys [23]. Also, it
has beenproposed recently that nickel and stainless steel alloys
can be used as the construction material in PEM water elec-
tolysers, but at temperatures no higher than 100 C [22].
In order to simulate conditions at the anodic compartment
of PEM water electrolysis cell during half-cell experiments, it
was necessary to choose the proper electrolyte. Investigating
systems including membranes based on perfluorinated sul-
phonic acid, e.g. Nafion, 0.5 M sulphuric acid is commonly
used as an electrolyte, simulating the electrolyser cell condi-
tions [24, 25]. Similary, H3PO4 can be used to model systems
based on membranes doped with H3PO4. 85% solution of
H3PO4was chosen to investigate the limiting case of corrosion,
considering that in working electrolyser systems the actual
concentration of active acid at the electrode-electrolyte-water
three-phase boundary would by much less than in case of the
approach taken here.
In a highly oxidizing media such as the anodic compart-
ment of a high temperature steam electrolysis stack, it is
essential to characterize the effect of different parameters on
the behaviour of the protective oxide films. To date, no works
have been addressed to the study of Ni-based alloys for use as
bipolar plates in high temperature PEM steam electrolysers.
In this paper, the corrosion resistance of metal alloys,
namely of austenitic stainless steels AISI 316L, AISI 321, AISI
347 and Ni-based alloys Hastelloy C-276, Inconel 625,
Incoloy 825, titanium and tantalum were tested in terms of
corrosion resistance. Platinum and gold were also investi-
gated for studying the potential window of concentrated
H3PO4. All samples were subjected to anodic polarisation in
85% phosphoric acid electrolyte solution at 120 C. The
corrosion speed of metal alloys was investigated additionally
for 30 C and 80 C to show the influence of temperature on
corrosion resistance.
Fig. 2 e Potential window for Pt and Au in 85% H3PO4, 120 C, 1 mV/s (vs. SHE).
Fig. 3 e Tafel plot for AISI 316L in 85% H3PO4, 80 C, 1 mV/s (vs. SHE).
i n t e r n a t i o n a l j o u rn a l o f h y d r o g e n en e r g y 3 6 ( 2 0 1 1 ) 1 1 1e1 1 9 113
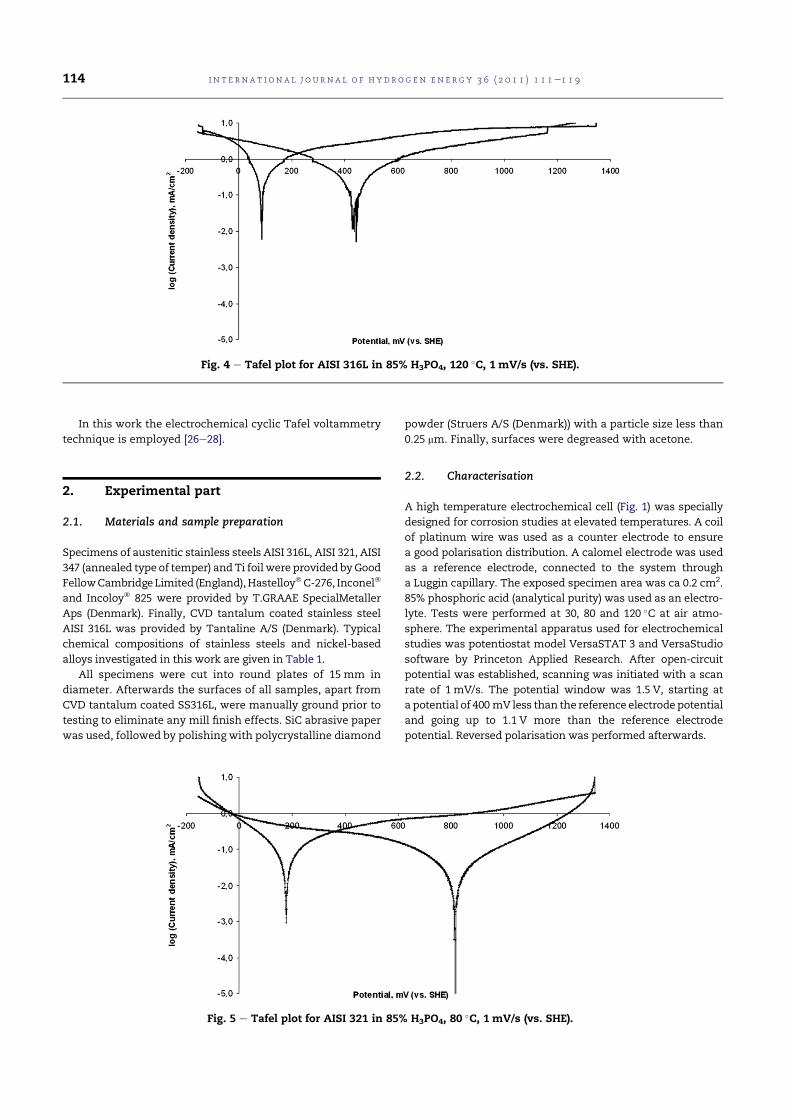
In this work the electrochemical cyclic Tafel voltammetry
technique is employed [26e28].
2. Experimental part
2.1. Materials and sample preparation
Specimens of austenitic stainless steels AISI 316L, AISI 321, AISI
347 (annealed type of temper) and Ti foil were provided byGood
FellowCambridge Limited (England),HastelloyC-276, Inconel
and Incoloy 825 were provided by T.GRAAE SpecialMetaller
Aps (Denmark). Finally, CVD tantalum coated stainless steel
AISI 316L was provided by Tantaline A/S (Denmark). Typical
chemical compositions of stainless steels and nickel-based
alloys investigated in this work are given in Table 1.
All specimens were cut into round plates of 15 mm in
diameter. Afterwards the surfaces of all samples, apart from
CVD tantalum coated SS316L, were manually ground prior to
testing to eliminate any mill finish effects. SiC abrasive paper
was used, followed by polishing with polycrystalline diamond
powder (Struers A/S (Denmark)) with a particle size less than
0.25 mm. Finally, surfaces were degreased with acetone.
2.2. Characterisation
A high temperature electrochemical cell (Fig. 1) was specially
designed for corrosion studies at elevated temperatures. A coil
of platinum wire was used as a counter electrode to ensure
a good polarisation distribution. A calomel electrode was used
as a reference electrode, connected to the system through
a Luggin capillary. The exposed specimen area was ca 0.2 cm2.
85% phosphoric acid (analytical purity) was used as an electro-
lyte. Tests were performed at 30, 80 and 120 C at air atmo-
sphere. The experimental apparatus used for electrochemical
studies was potentiostat model VersaSTAT 3 and VersaStudio
software by Princeton Applied Research. After open-circuit
potential was established, scanning was initiated with a scan
rate of 1 mV/s. The potential window was 1.5 V, starting at
a potential of 400 mV less than the reference electrode potential
and going up to 1.1 V more than the reference electrode
potential. Reversed polarisation was performed afterwards.
Fig. 4 e Tafel plot for AISI 316L in 85% H3PO4, 120 C, 1 mV/s (vs. SHE).
Fig. 5 e Tafel plot for AISI 321 in 85% H3PO4, 80 C, 1 mV/s (vs. SHE).
i n t e rn a t i o n a l j o u r n a l o f h y d r o g e n en e r g y 3 6 ( 2 0 1 1 ) 1 1 1e1 1 9114
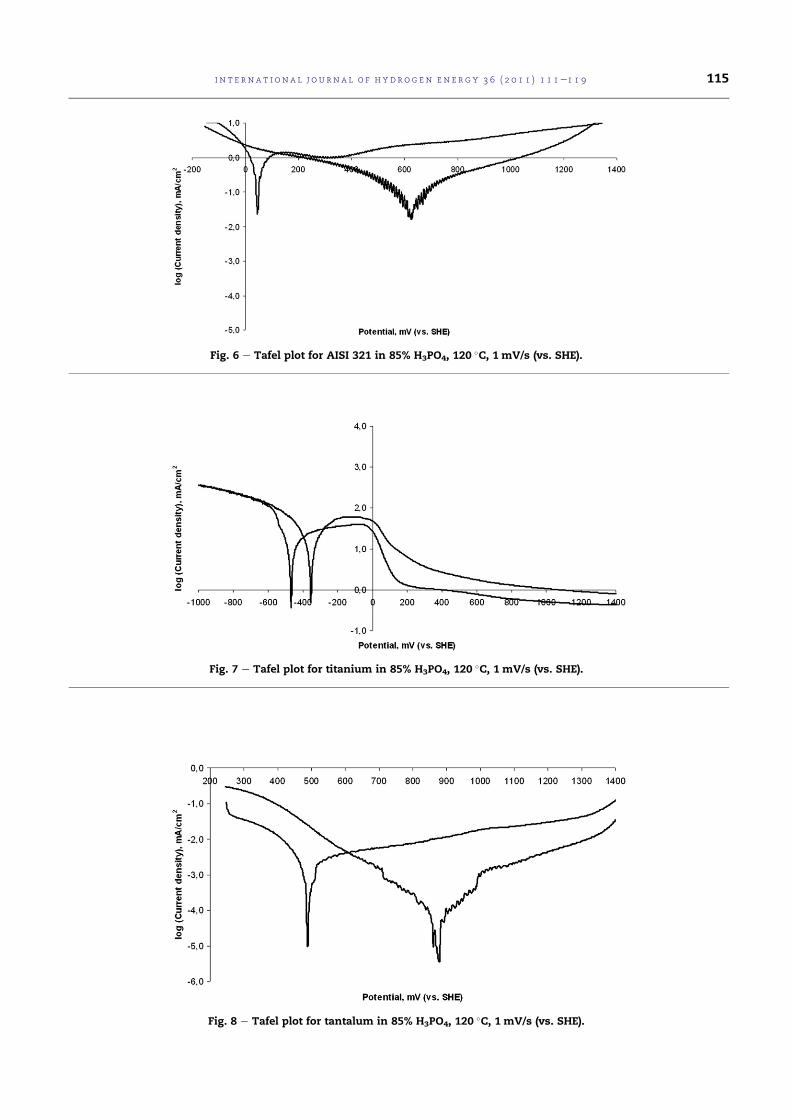
Fig. 6 e Tafel plot for AISI 321 in 85% H3PO4, 120 C, 1 mV/s (vs. SHE).
Fig. 7 e Tafel plot for titanium in 85% H3PO4, 120 C, 1 mV/s (vs. SHE).
Fig. 8 e Tafel plot for tantalum in 85% H3PO4, 120 C, 1 mV/s (vs. SHE).
i n t e r n a t i o n a l j o u rn a l o f h y d r o g e n en e r g y 3 6 ( 2 0 1 1 ) 1 1 1e1 1 9 115
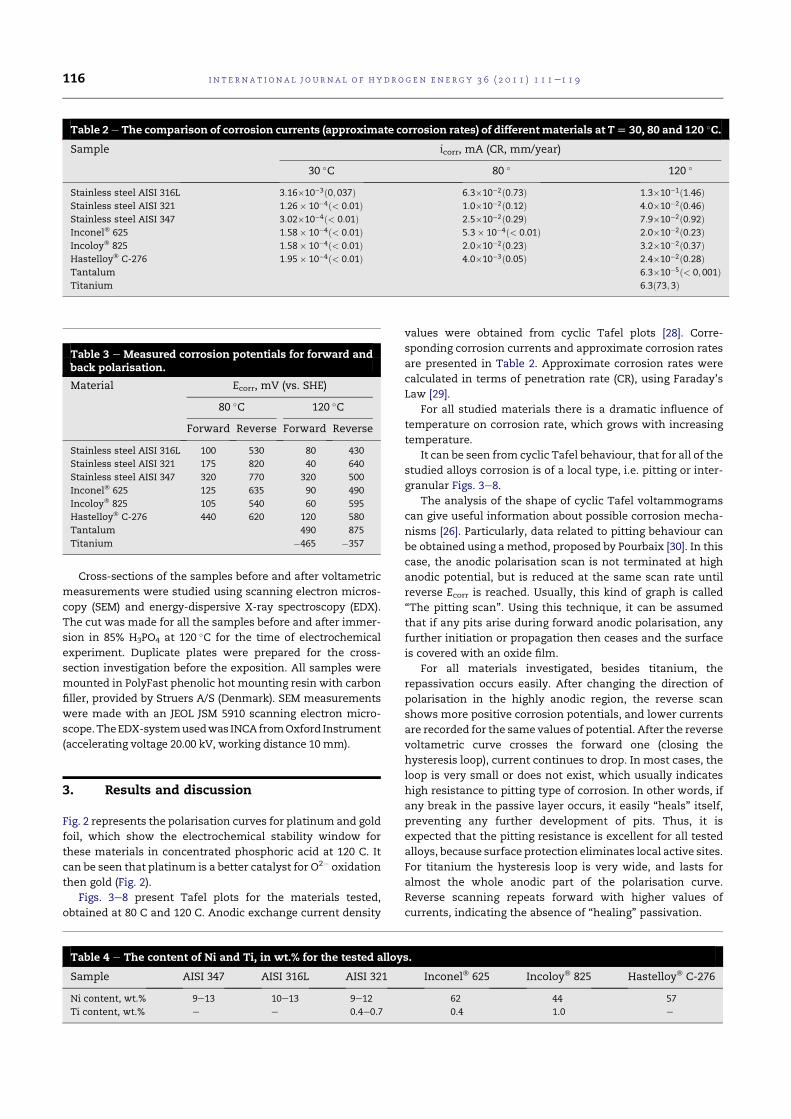
Cross-sections of the samples before and after voltametric
measurements were studied using scanning electron micros-
copy (SEM) and energy-dispersive X-ray spectroscopy (EDX).
The cut was made for all the samples before and after immer-
sion in 85% H3PO4 at 120 C for the time of electrochemical
experiment. Duplicate plates were prepared for the cross-
section investigation before the exposition. All samples were
mounted in PolyFast phenolic hot mounting resin with carbon
filler, provided by Struers A/S (Denmark). SEM measurements
were made with an JEOL JSM 5910 scanning electron micro-
scope.TheEDX-systemusedwas INCAfromOxford Instrument
(accelerating voltage 20.00 kV, working distance 10 mm).
3. Results and discussion
Fig. 2 represents the polarisation curves for platinum and gold
foil, which show the electrochemical stability window for
these materials in concentrated phosphoric acid at 120 C. It
can be seen that platinum is a better catalyst for O2 oxidation
then gold (Fig. 2).
Figs. 3e8 present Tafel plots for the materials tested,
obtained at 80 C and 120 C. Anodic exchange current density
values were obtained from cyclic Tafel plots [28]. Corre-
sponding corrosion currents and approximate corrosion rates
are presented in Table 2. Approximate corrosion rates were
calculated in terms of penetration rate (CR), using Faraday’s
Law [29].
For all studied materials there is a dramatic influence of
temperature on corrosion rate, which grows with increasing
temperature.
It can be seen from cyclic Tafel behaviour, that for all of the
studied alloys corrosion is of a local type, i.e. pitting or inter-
granular Figs. 3e8.
The analysis of the shape of cyclic Tafel voltammograms
can give useful information about possible corrosion mecha-
nisms [26]. Particularly, data related to pitting behaviour can
be obtained using a method, proposed by Pourbaix [30]. In this
case, the anodic polarisation scan is not terminated at high
anodic potential, but is reduced at the same scan rate until
reverse Ecorr is reached. Usually, this kind of graph is called
“The pitting scan”. Using this technique, it can be assumed
that if any pits arise during forward anodic polarisation, any
further initiation or propagation then ceases and the surface
is covered with an oxide film.
For all materials investigated, besides titanium, the
repassivation occurs easily. After changing the direction of
polarisation in the highly anodic region, the reverse scan
shows more positive corrosion potentials, and lower currents
are recorded for the same values of potential. After the reverse
voltametric curve crosses the forward one (closing the
hysteresis loop), current continues to drop. In most cases, the
loop is very small or does not exist, which usually indicates
high resistance to pitting type of corrosion. In other words, if
any break in the passive layer occurs, it easily “heals” itself,
preventing any further development of pits. Thus, it is
expected that the pitting resistance is excellent for all tested
alloys, because surface protection eliminates local active sites.
For titanium the hysteresis loop is very wide, and lasts for
almost the whole anodic part of the polarisation curve.
Reverse scanning repeats forward with higher values of
currents, indicating the absence of “healing” passivation.
Table 2 e The comparison of corrosion currents (approximate corrosion rates) of different materials at T[ 30, 80 and 120 C.
Sample icorr, mA (CR, mm/year)
30 C 80 120
Stainless steel AISI 316L 3:16103ð0; 037Þ 6:3102ð0:73Þ 1:3101ð1:46ÞStainless steel AISI 321 1:26 104ð< 0:01Þ 1:0102ð0:12Þ 4:0102ð0:46ÞStainless steel AISI 347 3:02104ð< 0:01Þ 2:5102ð0:29Þ 7:9102ð0:92ÞInconel 625 1:58 104ð< 0:01Þ 5:3 104ð< 0:01Þ 2:0102ð0:23ÞIncoloy 825 1:58 104ð< 0:01Þ 2:0102ð0:23Þ 3:2102ð0:37ÞHastelloy C-276 1:95 104ð< 0:01Þ 4:0103ð0:05Þ 2:4102ð0:28ÞTantalum 6:3105ð< 0; 001ÞTitanium 6:3ð73;3Þ
Table 3 e Measured corrosion potentials for forward andback polarisation.
Material Ecorr, mV (vs. SHE)
80 C 120 C
Forward Reverse Forward Reverse
Stainless steel AISI 316L 100 530 80 430
Stainless steel AISI 321 175 820 40 640
Stainless steel AISI 347 320 770 320 500
Inconel 625 125 635 90 490
Incoloy 825 105 540 60 595
Hastelloy C-276 440 620 120 580
Tantalum 490 875
Titanium 465 357
Table 4 e The content of Ni and Ti, in wt.% for the tested alloys.
Sample AISI 347 AISI 316L AISI 321 Inconel 625 Incoloy 825 Hastelloy C-276
Ni content, wt.% 9e13 10e13 9e12 62 44 57
Ti content, wt.% e e 0.4e0.7 0.4 1.0 e
i n t e rn a t i o n a l j o u r n a l o f h y d r o g e n en e r g y 3 6 ( 2 0 1 1 ) 1 1 1e1 1 9116
In Table 3 the comparison of corrosion potentials for
forward and back scans is given. In most cases, there is an
obvious dependence between corrosion rate and Ecorr. For
example, more positive value of Ecorr for AISI 321 stainless
steel during reverse scan corresponds to the lowest corrosion
speed of AISI 321 among other tested stainless steels.
Alloy AISI 321 exhibited the largest difference between
forward (starting) and reverse corrosion potentials, as well as
the most positive repassivation potential among the tested
alloys at 120 C. This corresponds to the lowest corrosion rate
of AISI 321 among the stainless steels.
Titanium showed the poorest corrosion resistance. At
120 C and open corrosion potential, the dissolution of tita-
nium was observed visually, followed by intensive evolution
of hydrogen gas. Under positive polarisation, it was partly
passivated, but still the rates of dissolution were much higher
than for austenitic stainless steels.
The corrosion resistance at 120 C increases in the
following sequence in our series:
Titanium<AISI 316L<AISI 347<AISI 321< Incoloy
825<Hastelloy c-276< Inconel 625<TantalumIt can be
clearly noticed, that for alloys the corrosion stability grows
with the increasing content of nickel in this media, as shown
in Table 4.
Generally, nickel-based alloys show better corrosion
stability than austenitic stainless steels in highly acidic media
and elevated temperatures [31]. This tendency is also
observed in our series.
Nickel’s high degree of corrosion resistance is partly
explained by the higher positive standard potential among the
studied alloy compounds. Comparing with less resistant iron,
nickel has 250mV more positive standard corrosion potential.
But compared to pure nickel metal, nickelechromiumeiron
emolybdenum alloys show considerably better resistance to
corrosion in all inorganic acid solutions [23].
It can also be seen fromTable 4, that titaniumhas a positive
effect on the corrosion resistance of the alloys tested. This
effect can be explained by the EDXdata, obtained fromAISI 321
and Inconel 625 before and after the electrochemical tests.
It is visible from Fig. 9 (spectrum 3,4) and (spectrum 2,4)
and Table 5a, b that before the corrosion test, Ti is not spread
evenly on the surface of AISI 321, it is localized at definite
points. It is safe to assume that these points are located on
intergranular boundaries. It follows from the data that the
content of titanium in the intergranular region dropped after
the electrochemical experiment, indicating that corrosion in
AISI 321 develops along the intergranular boundaries in this
media. Titanium tends to be distributed along these bound-
aries during the severe anodic attack, thus preventing the
formation of chromium carbides in these areas, which could
promote chromium concentration drop resulting in a loss of
passivity in these regions.
The same behaviour is observed for another alloy, con-
taining titanium as an addition, protecting the material from
intergranular corrosion. Fig. 10 (spectrum 3,4), (spectrum
1,3,5) and Table 6a, b show SEM and EDX data for Inconel
625. The same tendency is even more significant for this
alloy.
The discussion above proves the extremely important role
of doping the investigated alloys with titanium in this media,
Fig. 9 e SEM of AISI 321 before (a) and after (b) the electrochemical tests. Numbers refer to EDX points and areas measured.
Table 5e EDX analysis data of AISI 321 before (a) and after(b) the electrochemical tests.
(a)
Composition, wt.%, before the electrochemical tests
Spectrum Si Ti Cr Mn Fe Co Ni Total
1 0.6 0.3 17.7 1.8 69.8 0.2 9.7 100
2 0.5 0.5 18.0 1.4 69.5 0.8 9.4 100
3 0.4 27.3 14.5 1.4 49.5 0.5 6.4 100
4 0.3 31.2 14.8 1.4 46.6 6.1 100
(b)
Composition, wt.%, after the electrochemical tests
Spectrum Si Ti Cr Mn Fe Co Ni Total
1 0.3 0.5 17.7 1.6 70.4 1.0 8.5 100
2 0.1 29.2 15.3 1.5 48.5 0.3 5.2 100
3 0.5 0.1 18.2 1.2 69.8 1.0 9.2 100
4 1.2 9.0 17.5 0.9 62.4 0.6 8.4 100
i n t e r n a t i o n a l j o u rn a l o f h y d r o g e n en e r g y 3 6 ( 2 0 1 1 ) 1 1 1e1 1 9 117
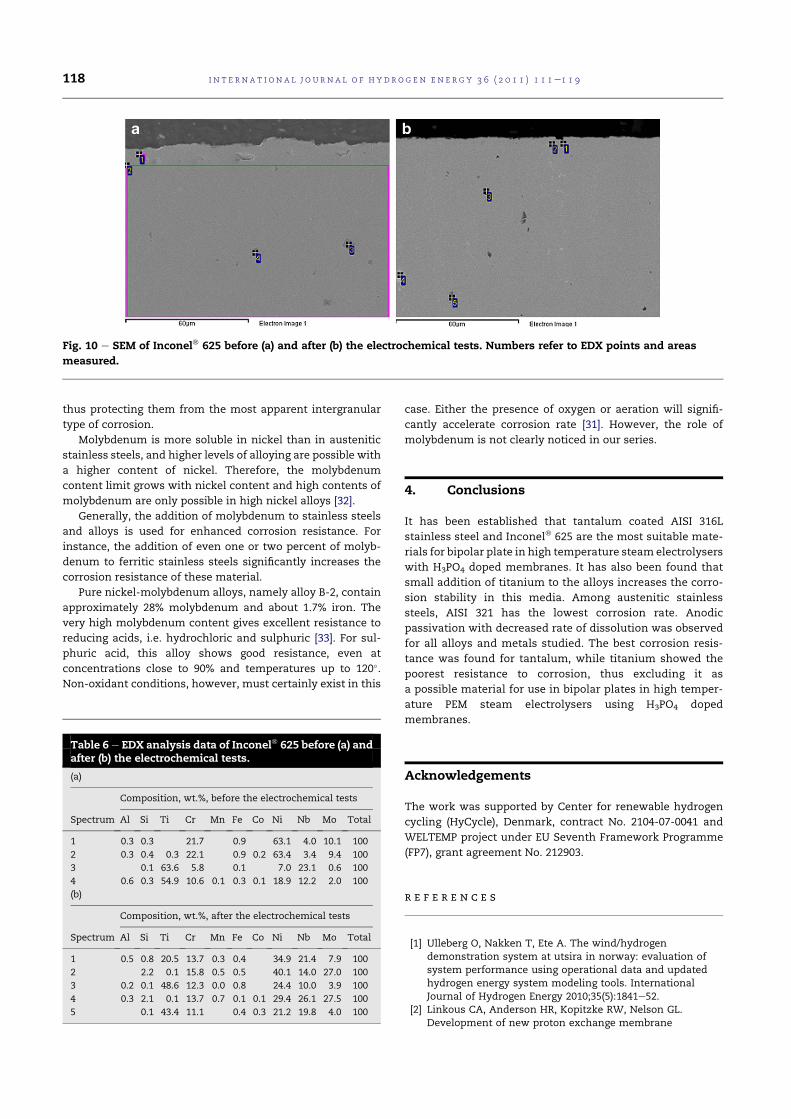
thus protecting them from the most apparent intergranular
type of corrosion.
Molybdenum is more soluble in nickel than in austenitic
stainless steels, and higher levels of alloying are possible with
a higher content of nickel. Therefore, the molybdenum
content limit grows with nickel content and high contents of
molybdenum are only possible in high nickel alloys [32].
Generally, the addition of molybdenum to stainless steels
and alloys is used for enhanced corrosion resistance. For
instance, the addition of even one or two percent of molyb-
denum to ferritic stainless steels significantly increases the
corrosion resistance of these material.
Pure nickel-molybdenum alloys, namely alloy B-2, contain
approximately 28% molybdenum and about 1.7% iron. The
very high molybdenum content gives excellent resistance to
reducing acids, i.e. hydrochloric and sulphuric [33]. For sul-
phuric acid, this alloy shows good resistance, even at
concentrations close to 90% and temperatures up to 120.Non-oxidant conditions, however, must certainly exist in this
case. Either the presence of oxygen or aeration will signifi-
cantly accelerate corrosion rate [31]. However, the role of
molybdenum is not clearly noticed in our series.
4. Conclusions
It has been established that tantalum coated AISI 316L
stainless steel and Inconel 625 are the most suitable mate-
rials for bipolar plate in high temperature steam electrolysers
with H3PO4 doped membranes. It has also been found that
small addition of titanium to the alloys increases the corro-
sion stability in this media. Among austenitic stainless
steels, AISI 321 has the lowest corrosion rate. Anodic
passivation with decreased rate of dissolution was observed
for all alloys and metals studied. The best corrosion resis-
tance was found for tantalum, while titanium showed the
poorest resistance to corrosion, thus excluding it as
a possible material for use in bipolar plates in high temper-
ature PEM steam electrolysers using H3PO4 doped
membranes.
Acknowledgements
The work was supported by Center for renewable hydrogen
cycling (HyCycle), Denmark, contract No. 2104-07-0041 and
WELTEMP project under EU Seventh Framework Programme
(FP7), grant agreement No. 212903.
r e f e r e n c e s
[1] Ulleberg O, Nakken T, Ete A. The wind/hydrogendemonstration system at utsira in norway: evaluation ofsystem performance using operational data and updatedhydrogen energy system modeling tools. InternationalJournal of Hydrogen Energy 2010;35(5):1841e52.
[2] Linkous CA, Anderson HR, Kopitzke RW, Nelson GL.Development of new proton exchange membrane
Fig. 10 e SEM of Inconel 625 before (a) and after (b) the electrochemical tests. Numbers refer to EDX points and areas
measured.
Table 6 e EDX analysis data of Inconel 625 before (a) andafter (b) the electrochemical tests.
(a)
Composition, wt.%, before the electrochemical tests
Spectrum Al Si Ti Cr Mn Fe Co Ni Nb Mo Total
1 0.3 0.3 21.7 0.9 63.1 4.0 10.1 100
2 0.3 0.4 0.3 22.1 0.9 0.2 63.4 3.4 9.4 100
3 0.1 63.6 5.8 0.1 7.0 23.1 0.6 100
4 0.6 0.3 54.9 10.6 0.1 0.3 0.1 18.9 12.2 2.0 100
(b)
Composition, wt.%, after the electrochemical tests
Spectrum Al Si Ti Cr Mn Fe Co Ni Nb Mo Total
1 0.5 0.8 20.5 13.7 0.3 0.4 34.9 21.4 7.9 100
2 2.2 0.1 15.8 0.5 0.5 40.1 14.0 27.0 100
3 0.2 0.1 48.6 12.3 0.0 0.8 24.4 10.0 3.9 100
4 0.3 2.1 0.1 13.7 0.7 0.1 0.1 29.4 26.1 27.5 100
5 0.1 43.4 11.1 0.4 0.3 21.2 19.8 4.0 100
i n t e rn a t i o n a l j o u r n a l o f h y d r o g e n en e r g y 3 6 ( 2 0 1 1 ) 1 1 1e1 1 9118
electrolytes for water electrolysis at higher temperatures.International Journal of Hydrogen Energy 1998;23(7):525e9.
[3] Linkous C. Development of solid polymer electrolytes forwater electrolysis at intermediate temperatures.International Journal of Hydrogen Energy 1993;18(8):641e6.
[4] Lessing PA. Materials for hydrogen generation via waterelectrolysis. Journal of Materials Science 2007;42(10):3477e87.
[5] Oberlin FMR. Status of the membral process for waterelectrolysis. In: Hydrogen energy progress VI, proceedings ofthe sixth world hydrogen energy conference. Oxford:Pergamon Press; 1986. p. 333e40.
[6] Barbir F. PEM electrolysis for production of hydrogen fromrenewable energy sources. Solar Energy 2005;78(5):661e9.
[7] Grigoriev S, Porembsky V, Fateev V. Pure hydrogenproduction by PEM electrolysis for hydrogen energy.International Journal of Hydrogen Energy 2006;31(2):171e5.
[8] Li Q, Jensen JO, Savinell RF, Bjerrum NJ. High temperatureproton exchange membranes based on polybenzimidazolesfor fuel cells. Progress in Polymer Science 2009;34(5):449e77.
[9] Dutta S. Technology assessment of advanced electrolytichydrogen production. International Journal of HydrogenEnergy 1990;15(6):379e86.
[10] Hermann A, Chaudhuri T, Spagnol P. Bipolar plates for PEMfuel cells: a review. International Journal of Hydrogen Energy2005;30(12):1297e302.
[11] TawfikH,HungY,MahajanD.Metal bipolar plates for PEM fuelcell-a review. Journal of Power Sources 2007;163(2):755e67.
[12] Hung Y, EL-Khatib KM, Tawfik H. Corrosion-resistantlightweight metallic bipolar plates for PEM fuel cells. Journalof Applied Electrochemistry 2005;35(5):445e7.
[13] Makkus RC, Janssen AH, de Bruijn FA, Mallant RK. Use ofstainless steel for cost competitive bipolar plates in the SPFC.Journal of Power Sources 2000;86(1e2):274e82.
[14] Antunes RA, Oliveira MCL, Ett G, Ett V. Corrosion of metalbipolar plates for PEM fuel cells: a review. InternationalJournal of Hydrogen Energy 2010;35(8):3632e47.
[15] Joseph S, McClure JC, Chianelli R, Pich P, Sebastian PJ.Conducting polymer-coated stainless steel bipolar plates forproton exchange membrane fuel cells (PEMFC). InternationalJournal of Hydrogen Energy 2005;30(12):1339e44.
[16] Tian RJ, Sun JC, Wang L. Plasma-nitrided austenitic stainlesssteel 316L as bipolar plate for PEMFC. International Journal ofHydrogen Energy 2006;31(13):1874e8.
[17] Wang Y, Northwood DO. An investigation of theelectrochemical properties of PVD TiN-coated SS410 insimulated PEM fuel cell environments. International Journalof Hydrogen Energy 2007;32(7):895e902.
[18] Di Blasi A, D’Urso C, Baglio V, Antonucci V, Arico’ AS,Ornelas R, et al. Preparation and evaluation of RuO2-IrO2,IrO2-Pt and IrO2-Ta2O5 catalysts for the oxygen evolutionreaction in an SPE electrolyzer. Journal of AppliedElectrochemistry 2009;39(2):191e6.
[19] Labou D, Slavcheva E, Schnakenberg U, Neophytides S.Performance of laboratory polymer electrolyte membranehydrogen generator with sputtered iridium oxide anode.Journal of Power Sources 2008;185(2):1073e8.
[20] Song SD, Zhang HM, Ma XP, Shao ZG, Zhang YN, Yi BL.Bifunctional oxygen electrode with corrosion-resistive gasdiffusion layer for unitized regenerative fuel cell.Electrochemistry Communications 2006;8(3):399e405.
[21] He R, Li Q, Xiao G, Bjerrum NJ. Proton conductivity ofphosphoric acid doped polybenzimidazole and itscomposites with inorganic proton conductors. Journal ofMembrane Science 2003;226(1e2):169e84.
[22] International patent application, 03.01.2008, wo 2008/002150a1, pct/no2007/000235 (03.01.2008).
[23] Rockel M. Corrosion behaviour of nickel alloys and high-alloystainless steel. Nickel alloys. New York: Marcel Dekker Inc;1998.
[24] Marshall A, Børresen B, Hagen G, Tsypkin M, Tunold R.Hydrogen production by advanced proton exchangemembrane (PEM) water electrolysers-reduced energyconsumption by improved electrocatalysis. Energy 2007;32:431e6.
[25] Song S, Zhang H, Ma X, Shao Z, Baker RT, Yi B.Electrochemical investigation of electrocatalysts for theoxygen evolution reaction in PEM water electrolyzers.International Journal of Hydrogen Energy 2008;33:4955e61.
[26] Trethewey KR, Chamberlain J. Corrosion. Longman Group UKLimited; 1988.
[27] Annual book of ASTM standarts 10.05, g5-94, p. 60e70.[28] Annual book of ASTM standarts 10.05, g3-89, p. 42e47.[29] Annual book of ASTM standarts 10.05, g 102-89 (reapproved
1999), p. 446e452.[30] Pourbaix M, Klimzack-Mathieiu L, Mertens C, Meunier J,
Vanleugenhaghe C, de Munck L, et al. Potentiokinetic andcorrosimetric investigations of the corrosion behaviour ofalloy steels. Corrosion Science 1963;3(4):239e59.
[31] Friend WZ. Corrosion of nickel and nickel-base alloys. NewYork/Chichester/Brisbane.Toronto: J Wiley&Sons; 1980.
[32] Bil’chugov YI, Makarova NL, Nazarov AA. On limit ofmolybdenum content of pitting-corrosion-resistantaustenitic steels. Protection of Metals 2001;37(6):597e601.
[33] Asphahani A, et al. United states patent 4846885 (1989).
i n t e r n a t i o n a l j o u rn a l o f h y d r o g e n en e r g y 3 6 ( 2 0 1 1 ) 1 1 1e1 1 9 119

146 Papers

Paper 2
Preparation and study of IrO2/SiC-Sisupported anode catalyst for hightemperature PEM steam electrolysers
A. V. Nikiforov, A. L. Tomas-Garcıa, I. M. Petrushina, E. Christensen,N. J. Bjerrum
International Journal of Hydrogen Energy, 36(10):5797–5805, May 2011

148 Papers

Preparation and study of IrO2/SiCeSi supported anode catalystfor high temperature PEM steam electrolysers
A.V. Nikiforov*, A.L. Tomas Garcıa, I.M. Petrushina, E. Christensen, N.J. Bjerrum
Energy and Materials Science Group, Department of Chemistry, Technical University of Denmark, Kemitorvet 207,
DK-2800 Kgs. Lyngby, Denmark
a r t i c l e i n f o
Article history:
Received 16 November 2010
Received in revised form
5 February 2011
Accepted 9 February 2011
Available online 12 March 2011
Keywords:
PEM water electrolysis
Catalyst support
Oxygen electrode
Corrosion resistance
Inert anode
a b s t r a c t
A novel catalyst material for oxygen evolution electrodes was prepared and characterised
by different techniques. IrO2 supported on a SiCeSi composite was synthesised by the
Adams fusion method. XRD and nitrogen adsorption experiments showed an influence of
the support on the surface properties of the IrO2 particles, affecting the IrO2 particle size.
The prepared catalysts were electrochemically characterised by cyclic voltammetry
experiments at 25,80,120 and 150 C. In accordance with the observed variation in particle
size, a support loading of up to 20% improved the activity of the catalyst. Powder
conductivity measurements were also performed, which showed the influence of the
support particles in the packing of IrO2 particles, perhaps favouring the formation of
channels and pores between particles, thus increasing the catalyst utilisation.
Copyright ª 2011, Hydrogen Energy Publications, LLC. Published by Elsevier Ltd. All rights
reserved.
1. Introduction
Some of the future aspirations of the “hydrogen energy cycle”
involve the splitting of water by means of electrolysis and
using the evolved hydrogen as a fuel. Oneway to do thiswould
be by using a proton exchange membrane (PEM) electrolyser
[1]. The electrolysis of steam instead of liquid water is
favourable in several ways. The thermodynamic demands are
lower at higher temperatures, waste heat can be utilised
(effective cooling due to temperature gradient) and water
management is simplified in such systems (avoiding two-
phase operation).
Elevatedworking temperatures involve increaseddemands
forcorrosionresistanceofcatalystsandconstructionmaterials
(bipolar plates and current collectors), while the contact
resistance in gas diffusion layer (GDL) should remain
reasonable.
For conventional PEM water electrolysers, Nafion is
commonly used as an electrolyte [2e4]. The conductivity of
such membranes decreases significantly at temperatures
above 80 C, which is associated with the reduction of water
content [5]. Sufficient efficiency is achieved using poly-
benzimidazole (PBI) membranes doped with phosphoric acid
in PEM fuel cells at temperatures up to 200 C under ambient
pressure [5,6]. Dopedmembranes are a potential electrolyte for
use in PEM steam electrolyser systems. Nevertheless, one of
themain problems in such systems still remains the extremely
low pH combined with elevated temperatures and high over-
potentials at the anodic compartment. These conditions
impose serious limitations on thematerialswhich can be used.
The applicable electrocatalysts for the oxygen evolution
reaction (OER) are still limited to Ir, Ru and their oxides [7]. The
anodes used in research and in industry are mostly based on
mixtures of an electrocatalyst and a stabilising agent, e.g.
* Corresponding author.E-mail address: [email protected] (A.V. Nikiforov).
Avai lab le a t www.sc iencedi rec t .com
journa l homepage : www.e lsev ier . com/ loca te /he
i n t e r n a t i o n a l j o u r n a l o f h y d r o g e n en e r g y 3 6 ( 2 0 1 1 ) 5 7 9 7e5 8 0 5
0360-3199/$ e see front matter Copyright ª 2011, Hydrogen Energy Publications, LLC. Published by Elsevier Ltd. All rights reserved.doi:10.1016/j.ijhydene.2011.02.050
TiO2. Such kinds of electrodes are known as dimensionally
stable anodes (DSA) and were first developed by Beer [8e10].
For Nafion based systems, porous Ti usually serves as an
anode bipolar plate and GDL material [4,11]. Unfortunately,
previous studies have shown that titanium can not be used in
systems that involve phosphoric acid containing electrolytes
[12,13].
Ruthenium oxide is known as the most active catalyst for
the OER. Nevertheless, according to thermodynamical
calculations, the oxidation of RuO2 to RuO4 occurs at poten-
tials more positive than 1.387 V (vs. SHE) [14]. The instability
of Ru-based anodes at high overpotentials in acidic condi-
tions has been proved by several studies. The mechanism of
corrosion is explained by the conversion of RuO2 to soluble,
non-conductive and volatile RuO4, with a boiling point of
130 C [15e17]. The facts mentioned above present Ru and
its oxides as unsuitable catalysts for the OER in high
temperature PEM steam electrolysers.
Several studies undertaken [18,19] devoted to improving
the stability of RuO2 during anodic oxygen evolution bymixing
the catalyst with IrO2. This causes a decrease in the corrosion
rate of RuO2 dependant on the IrO2 content in the mixture.
IrO2 appears to have greater stability and a reasonable activity
comparedwith Ru-based electrocatalysts for such systems [7].
Apparently, IrO2 is themost stable OER electrocatalyst for PEM
water electrolysers studied until now.
Unfortunately, high loadings of noble metals or their
oxides puts considerable commercial limitations on a wider
application of PEM electrolysers and a significant reduction of
such metal loadings should be achieved [20]. In search for an
electrode with lower loading requirement for the electro-
catalyst, two main strategies can be followed:
The first includes doping of active oxides with other, more
available materials, such as SnO2, SbO2, TaO2, MoxOy etc
[1,21e23]. This approach involves introduction of a dopant
precursor on the initial stage of catalyst synthesis. Following
this method, composite binary or ternary catalytic oxides are
usually obtained.
The second approach includes the use of a support mate-
rial which would improve the specific surface area of the
electrocatalyst and prevent particle agglomeration, thus
increasing the specific surface area of the electrode.
Ideally, rawmaterials for the preparation of inert anode or/
and its support should be cheap and readily available.
Carbon is a widely used catalyst support material for PBI
fuel cells. On the other hand, one of the main reasons for fuel
cell catalyst degradation is the corrosion of the carbon
support, which occurs at potentials higher than 0.207 V (vs.
SHE) [5,24]. In electrolysis mode the corrosion speed of carbon
would bemuch higher than in fuel cell mode due to the higher
anodic overpotentials of the OER. For this reason, carbon
cannot be considered as a potential durable support for anode
electrocatalyst in PEM electrolysers. The corrosion stability
and durability of the OER electrocatalyst support appears to be
one of the greatest challenges in the field.
In conclusion, only a dimensionally and chemically stable,
as well as readily available and reasonably conductive mate-
rial should be used for this application. Among others,
ceramic materials are potentially promising candidates [25].
However, most ceramics have relatively low electrical c
onductivity while it is considered to be of high importance for
the overall performance of electrodes. The value of the
acceptable electrical conductivity of catalytic layers is dis-
cussed elsewhere [26].
Nevertheless, some of the materials with low electrical
conductivity can be used as an anode for acidic systems [27].
In one study in particular, peSi was employed as a substrate
for thermal deposition of the active IrO2 and results showed
that this material can be used for the preparation of DSA-type
electrodes.
Silicon carbide, produced by the Acheson process is known
as a hard, refractory and chemically inert material [28]. Elec-
trical conductivity of this material is quite poor, however
doping with appropriate elements can significantly increase
this property [29]. Considering a possible electrochemical
application of silicon carbide, the main advantage among
others is its high stability in phosphoric acid solutions [30].
Several studies have been published, reporting the
successful use of silicon carbide as a catalyst support for PEM
fuel cells [31,32]. However, at present there are almost no
publications covering catalyst support investigations for elec-
trolysers [33]. Indeed, this area of research ismore challenging
and the material choice is highly limited, which is directly
connected with the increased cell voltages applied in the
electrolyser mode.
In this study a refractory silicon carbide-silicon material
(free Si less than 22%) was used as a support for the active OER
catalyst IrO2. The aim being to find a stable support and
introduce it to the active catalyst.
2. Experimental part
2.1. SiCeSi/IrO2 powder catalyst preparation
The sintered SiCeSi material was provided by the “State
Powder Metallurgy Plant”, Brovary, Ukraine. Catalyst support
powder was prepared according to the following procedure:
the as-received plate was cut with a diamond saw into
squared samples with 1 cm side. The thickness of the plates
was 2 mm. The prepared plates were cleaned in an ultrasonic
bath, degreased with acetone, washed with demineralised
water and finally dried at 80 C. The silicon carbide-silicon
plates weremilled in a planetary ball mill (Fritsch, Pulverisette
7). Since SiC is a material with high hardness, a mill made of
conventional steels could not be used for this procedure. This
is due to the relative softness of the steel, and associated risk
of contamination of the sample by self abrasion of the steel
balls and a possible tribochemical reaction. Therefore, two
45ml steel vials, covered with tungsten carbide wear resistant
lining were used. Milling was performed in the vial, which
contained 6 WC balls, each 15 mm in diameter. The working
vial contained 2 g of the starting material. The mill was
operated at 730 r.p.m. for 10 min.
The product of the milling was introduced at the initial
stage of the Adams fusion method of IrO2 synthesis [34]. The
iridium oxide content in the prepared catalyst was varied
from 0 to 100 wt.% in steps of 10 wt.%. As the support was
added to the initial solution of the catalyst precursor, it was
expected that the catalyst would adhere to the surface of the
i n t e rn a t i o n a l j o u r n a l o f h y d r o g e n en e r g y 3 6 ( 2 0 1 1 ) 5 7 9 7e5 8 0 55798
support. Chemical inertness during synthesis was confirmed
by XRD analysis. The calcinated products appeared to be fine
powders, changing colour from black to more greyish with
increasing content of silicon carbide in the composition.
2.2. The electrochemical characterisation
2.2.1. Corrosion stability testsFor investigation of the corrosion stability of material, plates
prepared as described in section 2.1 were used. The corrosion
stability test of the the material was performed in a specially
designed cell, used in our previous work [12].
2.2.2. Preparation of Nafion bonded electrodes for CVinvestigationIn order to estimate the electrochemical performance of the
prepared electrocatalyst powder, the following procedure was
performed.
A tantalum cylinder, accurately embedded in a Teflon
PTFEbodywasusedasaworkingelectrode.Thediameterof the
cylinder was 7.5 mmwhich corresponded to an active surface
area of 0.44 cm2. Tantalumwas chosen because of its superior
corrosion resistance in hot phosphoric acid solutions, while
having necessary conductivity and mechanical strength to
support the electrocatalyst [12,35]. Silicon carbide abrasive
paper was used for polishing, followed by polycrystalline dia-
mond powder (Struers A/S (Denmark)) with a particle size less
than 0.25 m. Finally, the surface was degreased with acetone
and rinsed with demineralised water. The catalyst suspen-
sions were prepared by adding of a 1 mg portion of prepared
powder to 1 mL of demineralised water. The suspension was
dispersed in an ultrasonic bath for 1 h. Immediately after
a 30 mL portion of the suspensionwas applied on the surface of
the working electrode, following by the drying of the catalyst
layer under nitrogen protective atmosphere. A second
suspension, consisting of a 1% solution inwater of commercial
5 wt.% Nafion (by DuPont) was applied on top of the catalyst
layer and dried in the samemanner. Therefore, each electrode
contained 30 mg of sample powder. All 11 test electrodes were
prepared in the same manner, using equal amount of applied
test powder, while ranging in its composition of active IrO2
from 0 to 100% with a step of 10%.
The performance investigations of the supported electro-
catalyst were conducted in a specially designed three-elec-
trode cell, which permitted use of the cell at temperatures up
to at least 200 C. The heating of the cell was provided by an
external heating plate (Fig. 1).
A commercial platinum counter electrode and a KCl-satu-
rated calomel reference electrode (SCE), connected to the
system through a Luggin capillary were provided by Radiom-
eter Analytical SAS.
The CV experiments were performed in the potential
window between 0 and 1.2 V against the SCE. This allowed the
observation of the reversible redox behaviour of IrO2 while
avoiding the formation of significant amounts of oxygen
which could detach the catalyst layer from the working elec-
trode. This permitted the use of the same sample for experi-
ments at elevated temperatures. As it is necessary to evaluate
the catalyst performance at the conditions close to those in
a PEM cell, in our work the 85% phosphoric acid (analytical
purity) was used as electrolyte. The range of temperatureswas
from room temperature (ca. 23 C) to 80 C, 120 C and 150 C,
with the experiments performed from lower to higher
temperatures. The temperature tolerance allowed during the
cyclic voltammetry experiments was 3 C. Temperature was
controlled by a k-type thermocouple, covered with Teflon
PTFE and inserted into the working cell (Omega Co.). For each
temperature, a series of scans at different speeds were carried
out in the following sequence: 200, 100, 50, 20, 10mV/s. The CV
scan started at 0.0 V, going to the vertex potential of þ1.2 V
and reversing back to the initial value of 0.0 V (all potentials vs.
SCE). An open circuit of 10 s was maintained between each
experiment. The experimental apparatus used for electro-
chemical studies was a VersaSTAT 3 potentiostat and Ver-
saStudio software by Princeton Applied Research.
2.3. Physico-chemical Characterisation
The prepared powder samples were studied using scanning
electron microscopy (SEM) and energy-dispersive X-ray spec-
troscopy (EDX). The catalyst powder was dispersed in ethanol
and the suspension was kept for 1 h in an ultrasonic bath.
20 mL portions of this solution, containing 20 mg of the catalyst
were afterwards applied to both a sticky carbon disk and
a polished gold holders, which were correspondingly used for
SEM and EDX investigations. SEM measurements were made
with an FEI Quanta 200F scanning electron microscope. The
EDX-system used was INCA from Oxford Instruments (accel-
erating voltage 5 kV, working distance 5.1 mm).
The as-milled SiCeSi powder as well as other samples were
characterisedwithX-raypowderdiffraction (XRD)usingaHuber
D670 diffractometer (Cu-K a x-ray source, a ¼ 1.5405981 A).
The BET method was used to evaluate the specific surface
area of the catalysts. Automated Gemini 2375 surface area
analyser by Micromeritics was used in our work.
3. Results and discussion
3.1. Structural and electrical properties
3.1.1. X-Ray diffractionThe X-Ray diffractogram for the IrO2 prepared without the
support is shown in Fig. 2. The supported catalysts showed the
characteristic signals of IrO2, SiC and Si (Fig. 3). However,
small peaks of WC were detected in the diffractogram of the
support powder (Fig. 4). This contamination originates from
the ball milling procedure. The produced catalyst consisted of
a physical mixture of IrO2 and support material with no any
other substances produced during the synthesis process, e.g.
firing at 500 C. As other components were not detected in
the samples (Fig. 3), the composite samples can be considered
as physical mixtures of IrO2 and support. The peak at around
55 and the width of IrO2 peaks for different samples were
chosen in order to calculate the average crystal size, on the
basis of the Scherrer equation [36]:
T ¼ Klbcosq
(1)
i n t e r n a t i o n a l j o u r n a l o f h y d r o g e n en e r g y 3 6 ( 2 0 1 1 ) 5 7 9 7e5 8 0 5 5799
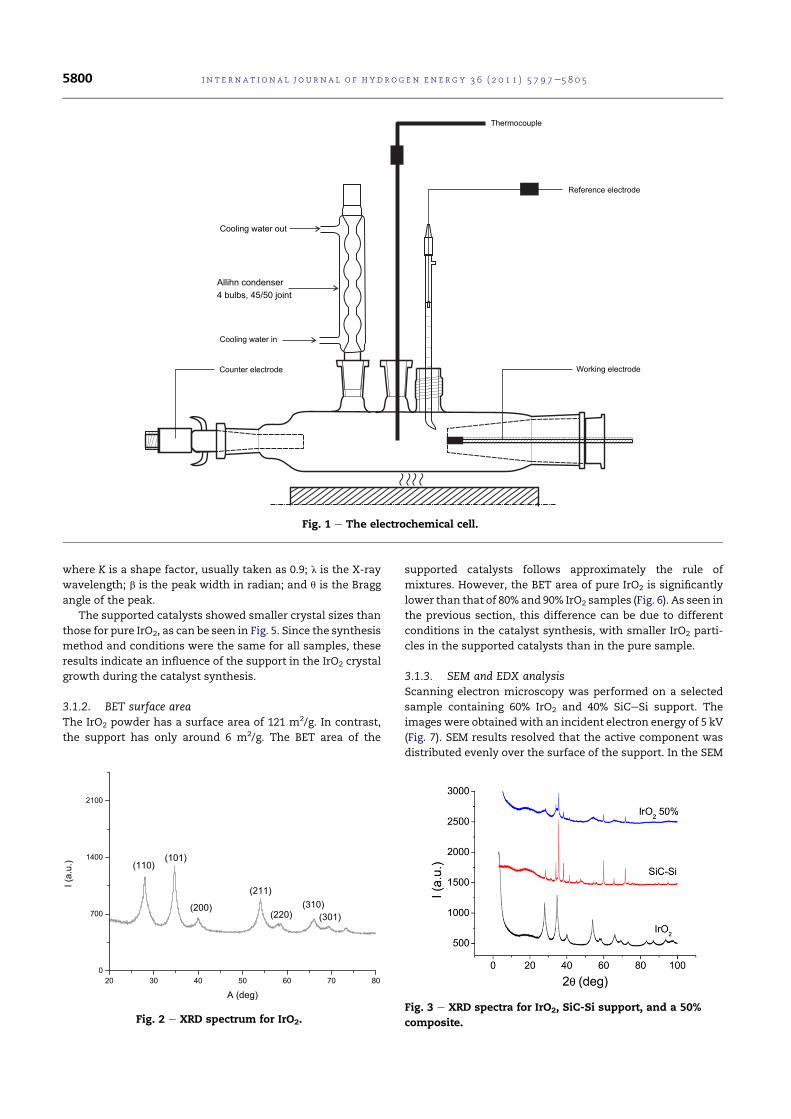
where K is a shape factor, usually taken as 0.9; l is the X-ray
wavelength; b is the peak width in radian; and q is the Bragg
angle of the peak.
The supported catalysts showed smaller crystal sizes than
those for pure IrO2, as can be seen in Fig. 5. Since the synthesis
method and conditions were the same for all samples, these
results indicate an influence of the support in the IrO2 crystal
growth during the catalyst synthesis.
3.1.2. BET surface areaThe IrO2 powder has a surface area of 121 m2/g. In contrast,
the support has only around 6 m2/g. The BET area of the
supported catalysts follows approximately the rule of
mixtures. However, the BET area of pure IrO2 is significantly
lower than that of 80% and 90% IrO2 samples (Fig. 6). As seen in
the previous section, this difference can be due to different
conditions in the catalyst synthesis, with smaller IrO2 parti-
cles in the supported catalysts than in the pure sample.
3.1.3. SEM and EDX analysisScanning electron microscopy was performed on a selected
sample containing 60% IrO2 and 40% SiCeSi support. The
images were obtainedwith an incident electron energy of 5 kV
(Fig. 7). SEM results resolved that the active component was
distributed evenly over the surface of the support. In the SEM
Working electrodeCounter electrode
Reference electrode
Thermocouple
Cooling water in
Allihn condenser4 bulbs, 45/50 joint
Cooling water out
Fig. 1 e The electrochemical cell.
20 30 40 50 60 70 800
700
1400
2100
(301)(310)
(220)
I(a.
u.)
A (deg)
(110)(101)
(200)
(211)
Fig. 2 e XRD spectrum for IrO2.Fig. 3 e XRD spectra for IrO2, SiC-Si support, and a 50%
composite.
i n t e rn a t i o n a l j o u r n a l o f h y d r o g e n en e r g y 3 6 ( 2 0 1 1 ) 5 7 9 7e5 8 0 55800
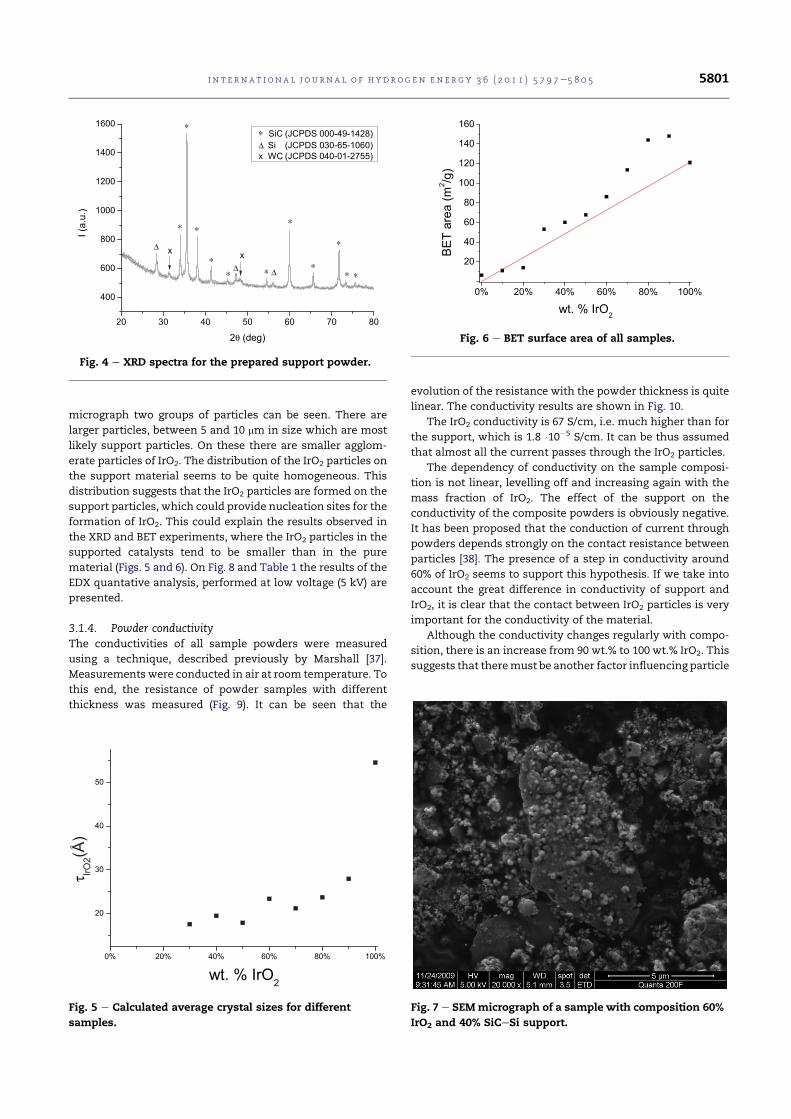
micrograph two groups of particles can be seen. There are
larger particles, between 5 and 10 mm in size which are most
likely support particles. On these there are smaller agglom-
erate particles of IrO2. The distribution of the IrO2 particles on
the support material seems to be quite homogeneous. This
distribution suggests that the IrO2 particles are formed on the
support particles, which could provide nucleation sites for the
formation of IrO2. This could explain the results observed in
the XRD and BET experiments, where the IrO2 particles in the
supported catalysts tend to be smaller than in the pure
material (Figs. 5 and 6). On Fig. 8 and Table 1 the results of the
EDX quantative analysis, performed at low voltage (5 kV) are
presented.
3.1.4. Powder conductivityThe conductivities of all sample powders were measured
using a technique, described previously by Marshall [37].
Measurements were conducted in air at room temperature. To
this end, the resistance of powder samples with different
thickness was measured (Fig. 9). It can be seen that the
evolution of the resistance with the powder thickness is quite
linear. The conductivity results are shown in Fig. 10.
The IrO2 conductivity is 67 S/cm, i.e. much higher than for
the support, which is 1.8 105 S/cm. It can be thus assumed
that almost all the current passes through the IrO2 particles.
The dependency of conductivity on the sample composi-
tion is not linear, levelling off and increasing again with the
mass fraction of IrO2. The effect of the support on the
conductivity of the composite powders is obviously negative.
It has been proposed that the conduction of current through
powders depends strongly on the contact resistance between
particles [38]. The presence of a step in conductivity around
60% of IrO2 seems to support this hypothesis. If we take into
account the great difference in conductivity of support and
IrO2, it is clear that the contact between IrO2 particles is very
important for the conductivity of the material.
Although the conductivity changes regularly with compo-
sition, there is an increase from 90 wt.% to 100 wt.% IrO2. This
suggests that theremust be another factor influencing particle
20 30 40 50 60 70 80
400
600
800
1000
1200
1400
1600
x
ΔΔ
Δ
∗∗
∗
∗
∗
∗∗∗
∗
∗∗
I(a.
u.)
2θ (deg)
∗ SiC (JCPDS 000-49-1428)Δ Si (JCPDS 030-65-1060)x WC (JCPDS 040-01-2755)
x
Fig. 4 e XRD spectra for the prepared support powder.
0% 20% 40% 60% 80% 100%
20
30
40
50
τ
wt. % IrO2
Fig. 5 e Calculated average crystal sizes for different
samples.
0% 20% 40% 60% 80% 100%
20
40
60
80
100
120
140
160
BET
area
(m2 /g
)
wt. % IrO2
Fig. 6 e BET surface area of all samples.
Fig. 7 e SEMmicrograph of a sample with composition 60%
IrO2 and 40% SiCeSi support.
i n t e r n a t i o n a l j o u r n a l o f h y d r o g e n en e r g y 3 6 ( 2 0 1 1 ) 5 7 9 7e5 8 0 5 5801
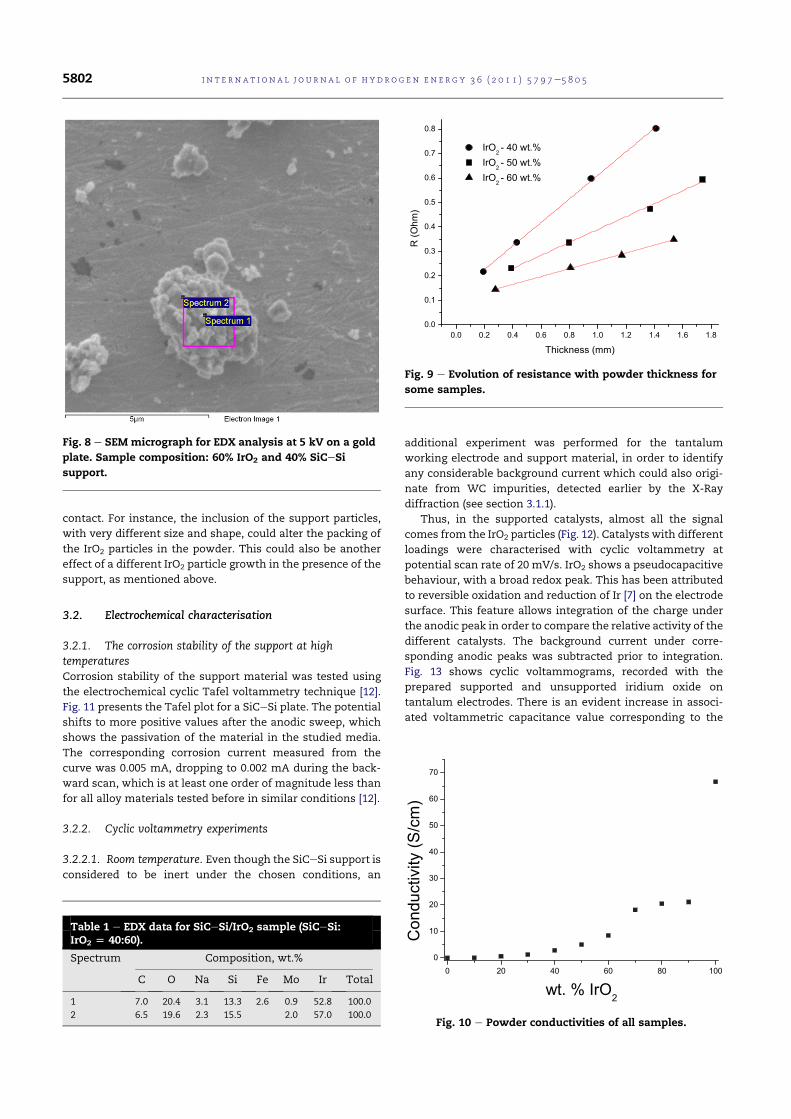
contact. For instance, the inclusion of the support particles,
with very different size and shape, could alter the packing of
the IrO2 particles in the powder. This could also be another
effect of a different IrO2 particle growth in the presence of the
support, as mentioned above.
3.2. Electrochemical characterisation
3.2.1. The corrosion stability of the support at hightemperaturesCorrosion stability of the support material was tested using
the electrochemical cyclic Tafel voltammetry technique [12].
Fig. 11 presents the Tafel plot for a SiCeSi plate. The potential
shifts to more positive values after the anodic sweep, which
shows the passivation of the material in the studied media.
The corresponding corrosion current measured from the
curve was 0.005 mA, dropping to 0.002 mA during the back-
ward scan, which is at least one order of magnitude less than
for all alloy materials tested before in similar conditions [12].
3.2.2. Cyclic voltammetry experiments
3.2.2.1. Room temperature. Even though the SiCeSi support is
considered to be inert under the chosen conditions, an
additional experiment was performed for the tantalum
working electrode and support material, in order to identify
any considerable background current which could also origi-
nate from WC impurities, detected earlier by the X-Ray
diffraction (see section 3.1.1).
Thus, in the supported catalysts, almost all the signal
comes from the IrO2 particles (Fig. 12). Catalysts with different
loadings were characterised with cyclic voltammetry at
potential scan rate of 20 mV/s. IrO2 shows a pseudocapacitive
behaviour, with a broad redox peak. This has been attributed
to reversible oxidation and reduction of Ir [7] on the electrode
surface. This feature allows integration of the charge under
the anodic peak in order to compare the relative activity of the
different catalysts. The background current under corre-
sponding anodic peaks was subtracted prior to integration.
Fig. 13 shows cyclic voltammograms, recorded with the
prepared supported and unsupported iridium oxide on
tantalum electrodes. There is an evident increase in associ-
ated voltammetric capacitance value corresponding to the
Fig. 8 e SEM micrograph for EDX analysis at 5 kV on a gold
plate. Sample composition: 60% IrO2 and 40% SiCeSi
support.
0.0 0.2 0.4 0.6 0.8 1.0 1.2 1.4 1.6 1.80.0
0.1
0.2
0.3
0.4
0.5
0.6
0.7
0.8
IrO2 - 40 wt.%IrO2 - 50 wt.%IrO2 - 60 wt.%
R(O
hm)
Thickness (mm)
Fig. 9 e Evolution of resistance with powder thickness for
some samples.
0 20 40 60 80 1000
10
20
30
40
50
60
70
Con
duct
ivity
(S/c
m)
wt. % IrO2
Fig. 10 e Powder conductivities of all samples.
Table 1 e EDX data for SiCeSi/IrO2 sample (SiCeSi:IrO2 [ 40:60).
Spectrum Composition, wt.%
C O Na Si Fe Mo Ir Total
1 7.0 20.4 3.1 13.3 2.6 0.9 52.8 100.0
2 6.5 19.6 2.3 15.5 2.0 57.0 100.0
i n t e rn a t i o n a l j o u r n a l o f h y d r o g e n en e r g y 3 6 ( 2 0 1 1 ) 5 7 9 7e5 8 0 55802
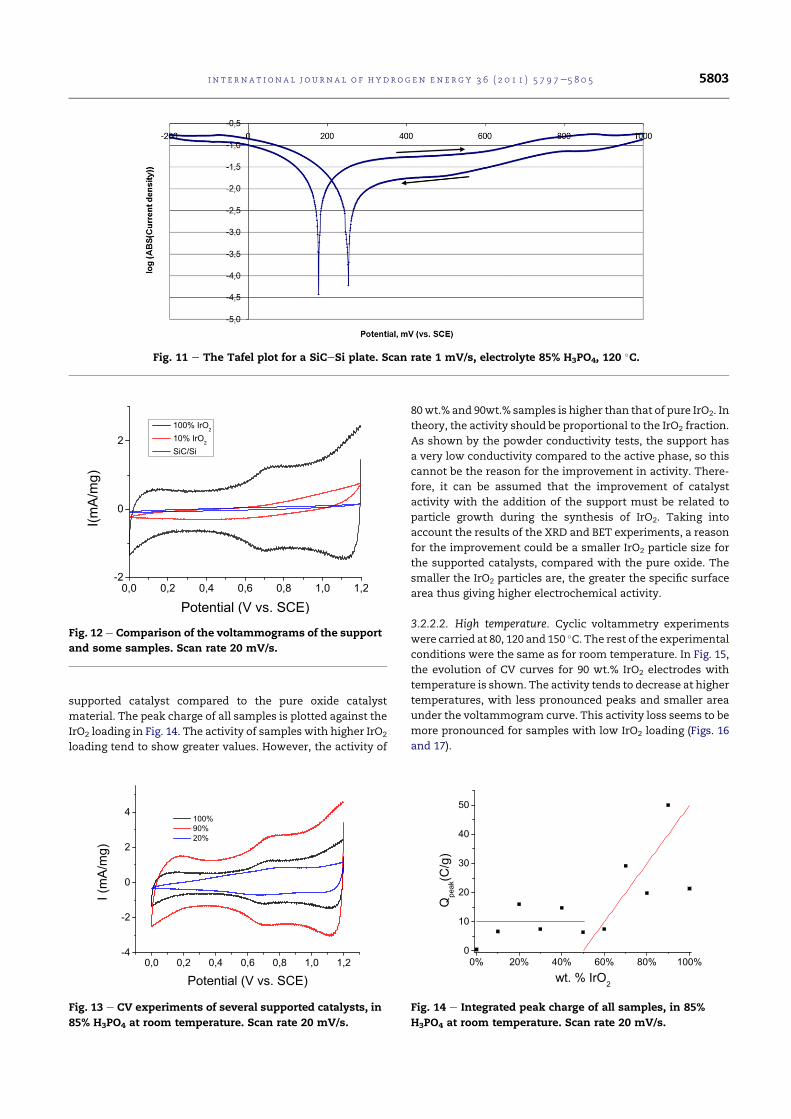
supported catalyst compared to the pure oxide catalyst
material. The peak charge of all samples is plotted against the
IrO2 loading in Fig. 14. The activity of samples with higher IrO2
loading tend to show greater values. However, the activity of
80wt.% and 90wt.% samples is higher than that of pure IrO2. In
theory, the activity should be proportional to the IrO2 fraction.
As shown by the powder conductivity tests, the support has
a very low conductivity compared to the active phase, so this
cannot be the reason for the improvement in activity. There-
fore, it can be assumed that the improvement of catalyst
activity with the addition of the support must be related to
particle growth during the synthesis of IrO2. Taking into
account the results of the XRD and BET experiments, a reason
for the improvement could be a smaller IrO2 particle size for
the supported catalysts, compared with the pure oxide. The
smaller the IrO2 particles are, the greater the specific surface
area thus giving higher electrochemical activity.
3.2.2.2. High temperature. Cyclic voltammetry experiments
were carried at 80, 120 and 150 C. The rest of the experimental
conditions were the same as for room temperature. In Fig. 15,
the evolution of CV curves for 90 wt.% IrO2 electrodes with
temperature is shown. The activity tends to decrease at higher
temperatures, with less pronounced peaks and smaller area
under the voltammogram curve. This activity loss seems to be
more pronounced for samples with low IrO2 loading (Figs. 16
and 17).
Fig. 11 e The Tafel plot for a SiCeSi plate. Scan rate 1 mV/s, electrolyte 85% H3PO4, 120 C.
Fig. 12 e Comparison of the voltammograms of the support
and some samples. Scan rate 20 mV/s.
0,0 0,2 0,4 0,6 0,8 1,0 1,2-4
-2
0
2
4 100% 90% 20%
I (m
A/m
g)
Potential (V vs. SCE)
Fig. 13 e CV experiments of several supported catalysts, in
85% H3PO4 at room temperature. Scan rate 20 mV/s.
0% 20% 40% 60% 80% 100%0
10
20
30
40
50
Qpe
ak(C
/g)
wt. % IrO2
Fig. 14 e Integrated peak charge of all samples, in 85%
H3PO4 at room temperature. Scan rate 20 mV/s.
i n t e r n a t i o n a l j o u r n a l o f h y d r o g e n en e r g y 3 6 ( 2 0 1 1 ) 5 7 9 7e5 8 0 5 5803
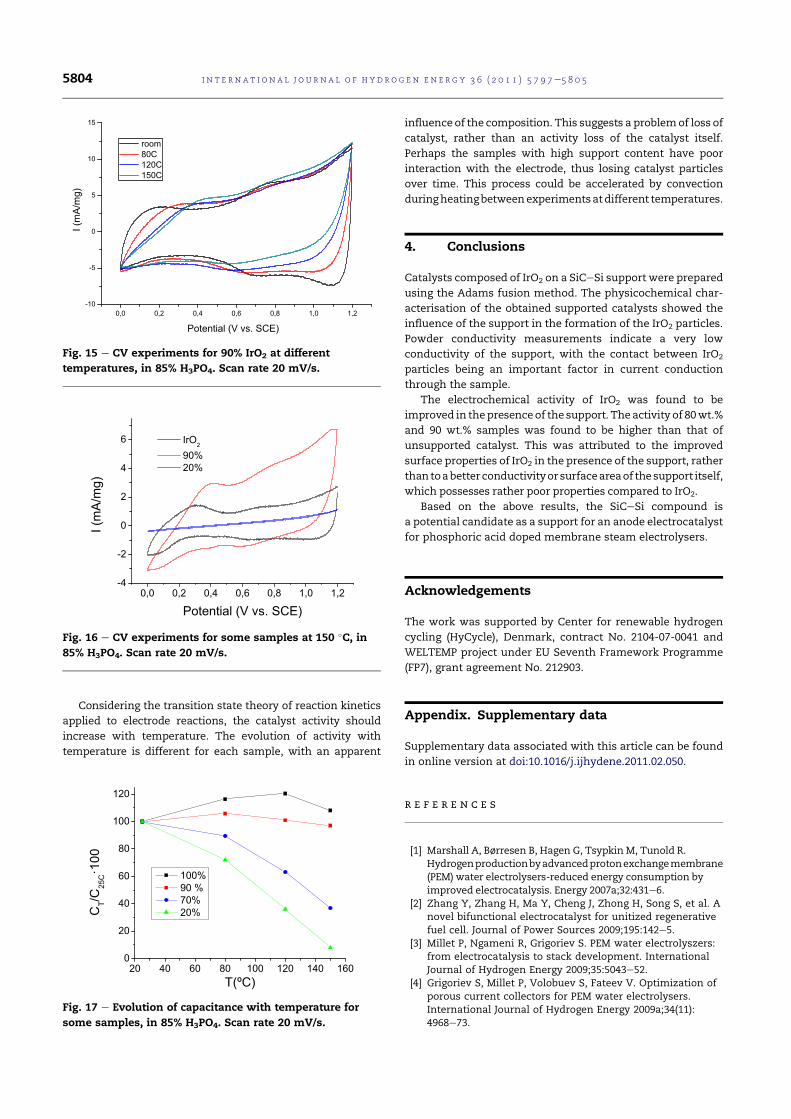
Considering the transition state theory of reaction kinetics
applied to electrode reactions, the catalyst activity should
increase with temperature. The evolution of activity with
temperature is different for each sample, with an apparent
influence of the composition. This suggests a problemof loss of
catalyst, rather than an activity loss of the catalyst itself.
Perhaps the samples with high support content have poor
interaction with the electrode, thus losing catalyst particles
over time. This process could be accelerated by convection
duringheatingbetweenexperimentsatdifferent temperatures.
4. Conclusions
Catalysts composed of IrO2 on a SiCeSi support were prepared
using the Adams fusion method. The physicochemical char-
acterisation of the obtained supported catalysts showed the
influence of the support in the formation of the IrO2 particles.
Powder conductivity measurements indicate a very low
conductivity of the support, with the contact between IrO2
particles being an important factor in current conduction
through the sample.
The electrochemical activity of IrO2 was found to be
improved in thepresenceof the support. The activity of 80wt.%
and 90 wt.% samples was found to be higher than that of
unsupported catalyst. This was attributed to the improved
surface properties of IrO2 in the presence of the support, rather
than toabetterconductivityorsurfaceareaof thesupport itself,
which possesses rather poor properties compared to IrO2.
Based on the above results, the SiCeSi compound is
a potential candidate as a support for an anode electrocatalyst
for phosphoric acid doped membrane steam electrolysers.
Acknowledgements
The work was supported by Center for renewable hydrogen
cycling (HyCycle), Denmark, contract No. 2104-07-0041 and
WELTEMP project under EU Seventh Framework Programme
(FP7), grant agreement No. 212903.
Appendix. Supplementary data
Supplementary data associated with this article can be found
in online version at doi:10.1016/j.ijhydene.2011.02.050.
r e f e r e n c e s
[1] Marshall A, Børresen B, Hagen G, Tsypkin M, Tunold R.Hydrogenproductionbyadvancedprotonexchangemembrane(PEM) water electrolysers-reduced energy consumption byimproved electrocatalysis. Energy 2007a;32:431e6.
[2] Zhang Y, Zhang H, Ma Y, Cheng J, Zhong H, Song S, et al. Anovel bifunctional electrocatalyst for unitized regenerativefuel cell. Journal of Power Sources 2009;195:142e5.
[3] Millet P, Ngameni R, Grigoriev S. PEM water electrolyszers:from electrocatalysis to stack development. InternationalJournal of Hydrogen Energy 2009;35:5043e52.
[4] Grigoriev S, Millet P, Volobuev S, Fateev V. Optimization ofporous current collectors for PEM water electrolysers.International Journal of Hydrogen Energy 2009a;34(11):4968e73.
0,0 0,2 0,4 0,6 0,8 1,0 1,2-10
-5
0
5
10
15
I (m
A/m
g)
Potential (V vs. SCE)
room 80C 120C 150C
Fig. 15 e CV experiments for 90% IrO2 at different
temperatures, in 85% H3PO4. Scan rate 20 mV/s.
0,0 0,2 0,4 0,6 0,8 1,0 1,2-4
-2
0
2
4
6 IrO2
90%20%
I(m
A/m
g)
Potential (V vs. SCE)
Fig. 16 e CV experiments for some samples at 150 C, in
85% H3PO4. Scan rate 20 mV/s.
20 40 60 80 100 120 140 1600
20
40
60
80
100
120
Fig. 17 e Evolution of capacitance with temperature for
some samples, in 85% H3PO4. Scan rate 20 mV/s.
i n t e rn a t i o n a l j o u r n a l o f h y d r o g e n en e r g y 3 6 ( 2 0 1 1 ) 5 7 9 7e5 8 0 55804
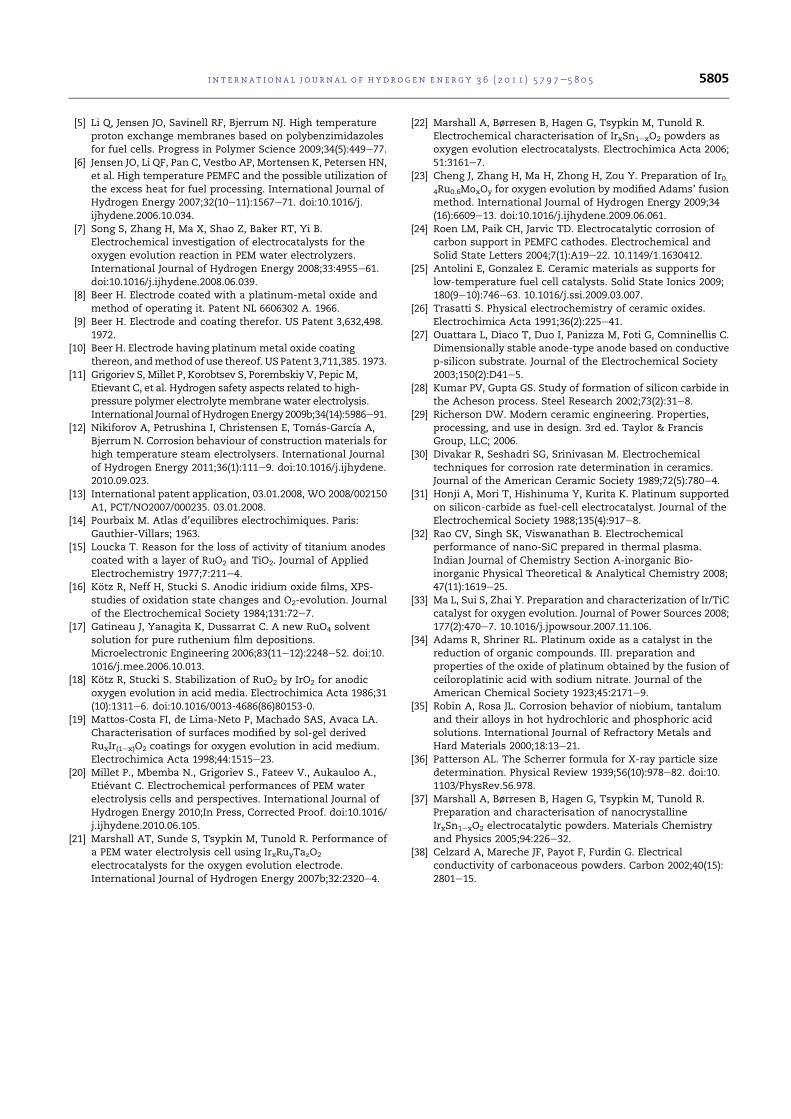
[5] Li Q, Jensen JO, Savinell RF, Bjerrum NJ. High temperatureproton exchange membranes based on polybenzimidazolesfor fuel cells. Progress in Polymer Science 2009;34(5):449e77.
[6] Jensen JO, Li QF, Pan C, Vestbo AP, Mortensen K, Petersen HN,et al. High temperature PEMFC and the possible utilization ofthe excess heat for fuel processing. International Journal ofHydrogen Energy 2007;32(10e11):1567e71. doi:10.1016/j.ijhydene.2006.10.034.
[7] Song S, Zhang H, Ma X, Shao Z, Baker RT, Yi B.Electrochemical investigation of electrocatalysts for theoxygen evolution reaction in PEM water electrolyzers.International Journal of Hydrogen Energy 2008;33:4955e61.doi:10.1016/j.ijhydene.2008.06.039.
[8] Beer H. Electrode coated with a platinum-metal oxide andmethod of operating it. Patent NL 6606302 A. 1966.
[9] Beer H. Electrode and coating therefor. US Patent 3,632,498.1972.
[10] Beer H. Electrode having platinum metal oxide coatingthereon, andmethod of use thereof. US Patent 3,711,385. 1973.
[11] Grigoriev S, Millet P, Korobtsev S, Porembskiy V, Pepic M,Etievant C, et al. Hydrogen safety aspects related to high-pressure polymer electrolytemembrane water electrolysis.International Journal ofHydrogenEnergy 2009b;34(14):5986e91.
[12] Nikiforov A, Petrushina I, Christensen E, Tomas-Garcıa A,Bjerrum N. Corrosion behaviour of construction materials forhigh temperature steam electrolysers. International Journalof Hydrogen Energy 2011;36(1):111e9. doi:10.1016/j.ijhydene.2010.09.023.
[13] International patent application, 03.01.2008, WO 2008/002150A1, PCT/NO2007/000235. 03.01.2008.
[14] Pourbaix M. Atlas d’equilibres electrochimiques. Paris:Gauthier-Villars; 1963.
[15] Loucka T. Reason for the loss of activity of titanium anodescoated with a layer of RuO2 and TiO2. Journal of AppliedElectrochemistry 1977;7:211e4.
[16] Kotz R, Neff H, Stucki S. Anodic iridium oxide films, XPS-studies of oxidation state changes and O2-evolution. Journalof the Electrochemical Society 1984;131:72e7.
[17] Gatineau J, Yanagita K, Dussarrat C. A new RuO4 solventsolution for pure ruthenium film depositions.Microelectronic Engineering 2006;83(11e12):2248e52. doi:10.1016/j.mee.2006.10.013.
[18] Kotz R, Stucki S. Stabilization of RuO2 by IrO2 for anodicoxygen evolution in acid media. Electrochimica Acta 1986;31(10):1311e6. doi:10.1016/0013-4686(86)80153-0.
[19] Mattos-Costa FI, de Lima-Neto P, Machado SAS, Avaca LA.Characterisation of surfaces modified by sol-gel derivedRuxIr(1ex)O2 coatings for oxygen evolution in acid medium.Electrochimica Acta 1998;44:1515e23.
[20] Millet P., Mbemba N., Grigoriev S., Fateev V., Aukauloo A.,Etievant C. Electrochemical performances of PEM waterelectrolysis cells and perspectives. International Journal ofHydrogen Energy 2010;In Press, Corrected Proof. doi:10.1016/j.ijhydene.2010.06.105.
[21] Marshall AT, Sunde S, Tsypkin M, Tunold R. Performance ofa PEM water electrolysis cell using IrxRuyTazO2
electrocatalysts for the oxygen evolution electrode.International Journal of Hydrogen Energy 2007b;32:2320e4.
[22] Marshall A, Børresen B, Hagen G, Tsypkin M, Tunold R.Electrochemical characterisation of IrxSn1exO2 powders asoxygen evolution electrocatalysts. Electrochimica Acta 2006;51:3161e7.
[23] Cheng J, Zhang H, Ma H, Zhong H, Zou Y. Preparation of Ir0.4Ru0.6MoxOy for oxygen evolution by modified Adams’ fusionmethod. International Journal of Hydrogen Energy 2009;34(16):6609e13. doi:10.1016/j.ijhydene.2009.06.061.
[24] Roen LM, Paik CH, Jarvic TD. Electrocatalytic corrosion ofcarbon support in PEMFC cathodes. Electrochemical andSolid State Letters 2004;7(1):A19e22. 10.1149/1.1630412.
[25] Antolini E, Gonzalez E. Ceramic materials as supports forlow-temperature fuel cell catalysts. Solid State Ionics 2009;180(9e10):746e63. 10.1016/j.ssi.2009.03.007.
[26] Trasatti S. Physical electrochemistry of ceramic oxides.Electrochimica Acta 1991;36(2):225e41.
[27] Ouattara L, Diaco T, Duo I, Panizza M, Foti G, Comninellis C.Dimensionally stable anode-type anode based on conductivep-silicon substrate. Journal of the Electrochemical Society2003;150(2):D41e5.
[28] Kumar PV, Gupta GS. Study of formation of silicon carbide inthe Acheson process. Steel Research 2002;73(2):31e8.
[29] Richerson DW. Modern ceramic engineering. Properties,processing, and use in design. 3rd ed. Taylor & FrancisGroup, LLC; 2006.
[30] Divakar R, Seshadri SG, Srinivasan M. Electrochemicaltechniques for corrosion rate determination in ceramics.Journal of the American Ceramic Society 1989;72(5):780e4.
[31] Honji A, Mori T, Hishinuma Y, Kurita K. Platinum supportedon silicon-carbide as fuel-cell electrocatalyst. Journal of theElectrochemical Society 1988;135(4):917e8.
[32] Rao CV, Singh SK, Viswanathan B. Electrochemicalperformance of nano-SiC prepared in thermal plasma.Indian Journal of Chemistry Section A-inorganic Bio-inorganic Physical Theoretical & Analytical Chemistry 2008;47(11):1619e25.
[33] Ma L, Sui S, Zhai Y. Preparation and characterization of Ir/TiCcatalyst for oxygen evolution. Journal of Power Sources 2008;177(2):470e7. 10.1016/j.jpowsour.2007.11.106.
[34] Adams R, Shriner RL. Platinum oxide as a catalyst in thereduction of organic compounds. III. preparation andproperties of the oxide of platinum obtained by the fusion ofceiloroplatinic acid with sodium nitrate. Journal of theAmerican Chemical Society 1923;45:2171e9.
[35] Robin A, Rosa JL. Corrosion behavior of niobium, tantalumand their alloys in hot hydrochloric and phosphoric acidsolutions. International Journal of Refractory Metals andHard Materials 2000;18:13e21.
[36] Patterson AL. The Scherrer formula for X-ray particle sizedetermination. Physical Review 1939;56(10):978e82. doi:10.1103/PhysRev.56.978.
[37] Marshall A, Børresen B, Hagen G, Tsypkin M, Tunold R.Preparation and characterisation of nanocrystallineIrxSn1exO2 electrocatalytic powders. Materials Chemistryand Physics 2005;94:226e32.
[38] Celzard A, Mareche JF, Payot F, Furdin G. Electricalconductivity of carbonaceous powders. Carbon 2002;40(15):2801e15.
i n t e r n a t i o n a l j o u r n a l o f h y d r o g e n en e r g y 3 6 ( 2 0 1 1 ) 5 7 9 7e5 8 0 5 5805

158 Papers

Bibliography
[1] http://hycycle.dk/. Hycycle. center for renewable hydrogen cycling,June 2009. URL http://hycycle.dk/.
[2] http://www.weltemp.eu/. Weltemp. URL http://www.weltemp.eu/.
[3] Smog over new york in 1988. source: Wikipedia.org. URL http://
en.wikipedia.org/wiki/File:SmogNY.jpg.
[4] http://nanopedia.case.edu/. Hydrogen fuel economy. URL http://
nanopedia.case.edu/NWPrint.php?page=nano.hydrogen.economy.
[5] J.O. Jensen, V. Bandur, N.J. Bjerrum, S.J. Højgaard, S.D. Ebbe-sen, and M. Mogensen. Pre-investigation of water electrolysis. Tech-nical report, 2008. URL http://130.226.56.153/rispubl/NEI/
NEI-DK-5057.pdf.
[6] Allen J. Bard and Faulkner Larry R. Electrochemical methods Funda-mentals and applications. John Wiley & Sons Inc, 2nd edition, 2001.
[7] Sergio Trasatti. Work function, electronegativity, and electrochemi-cal behaviour of metals: Iii. electrolytic hydrogen evolution in acidsolutions. Journal of Electroanalytical Chemistry and Interfacial Elec-trochemistry, 39(1):163 – 184, 1972. ISSN 0022-0728. doi: 10.1016/S0022-0728(72)80485-6.
[8] L.D. Burke. Oxide growth and oxygen evolution on noble metals, vol-ume Electrodes of conductive metallic oxides. Part A. Elsevier Sci-entific, 335 Jan van Galenstraat P.O. Box 211, 1000 AE Amsterdam,The Netherlands, 1980.
[9] D Pletcher, R. Greff, R. Peat, L. M. Peter, and J. Robinson. Instru-mental methods in electrochemistry. Horwood Publishing, 1985.

160 BIBLIOGRAPHY
[10] S. Trasatti. Electrodes of conductive metallic oxides. Studies in phys-ical and theoretical chemistry. Elsevier, 335 Jan van Galenstraat P.O.Box 211, 1000 AE Amsterdam, The Netherlands, 1980.
[11] S. Trasatti. Electrocatalysis in the anodic evolution of oxygen andchlorine. Electrochimica Acta, 29(11):1503–1512, 1984. ISSN 0013-4686. doi: 10.1016/0013-4686(84)85004-5.
[12] Annual book of astm standarts 10.05, g3-89, p. 42-47.
[13] Peter J. Goodhew, John Humphreys, and Richard Beanland. ElectronMicroscopy and analysis. Taylor & Francis, third edition, 2001.
[14] S. Trasatti. Physical electrochemistry of ceramic oxides. Electrochim-ica Acta, 36(2):225–241, 1991. ISSN 0013-4686. doi: 10.1016/0013-4686(91)85244-2.
[15] James Larminie and Andrew Dicks. Fuel Cell Systems Explained.John Wiley & Sons Ltd, England, second edition, 2003. URL http:
//www.knovel.com.globalproxy.cvt.dk/web/portal/browse/
display?_EXT_KNOVEL_DISPLAY_bookid=1109&VerticalID=0.
[16] Sheng Sui, Lirong Ma, and Yuchun Zhai. Investigation on the protonexchange membrane water electrolyzer using supported anode cata-lyst. Asia-Pacific Journal of Chemical Engineering, 4(1):8–11, 2009.ISSN 19322135. doi: 10.1002/apj.183.
[17] R. Kotz and S. Stucki. Stabilization of RuO2 by IrO2 for anodic oxygenevolution in acid media. Electrochimica Acta, 31(10):1311–1316, 1986.ISSN 0013-4686. doi: 10.1016/0013-4686(86)80153-0.
[18] Planetary engineering group earth. URL http://www.pege.org/.May 6, 2007.
[19] URL http://www.protonenergy.com.
[20] Qingfeng Li, Jens Oluf Jensen, Robert F. Savinell, and Niels J. Bjer-rum. High temperature proton exchange membranes based on poly-benzimidazoles for fuel cells. Progress in Polymer Science, 34(5):449–477, 2009. ISSN 00796700. doi: 10.1016/j.progpolymsci.2008.12.003.
[21] http://www.radiometer analytical.com/. URL http://www.
radiometer-analytical.com/.
[22] Allen J. Bard and Larry R. Faulkner. Electrochemical Methods. Fun-damentals and Applications. John Wiley & Sons Inc, 1980.
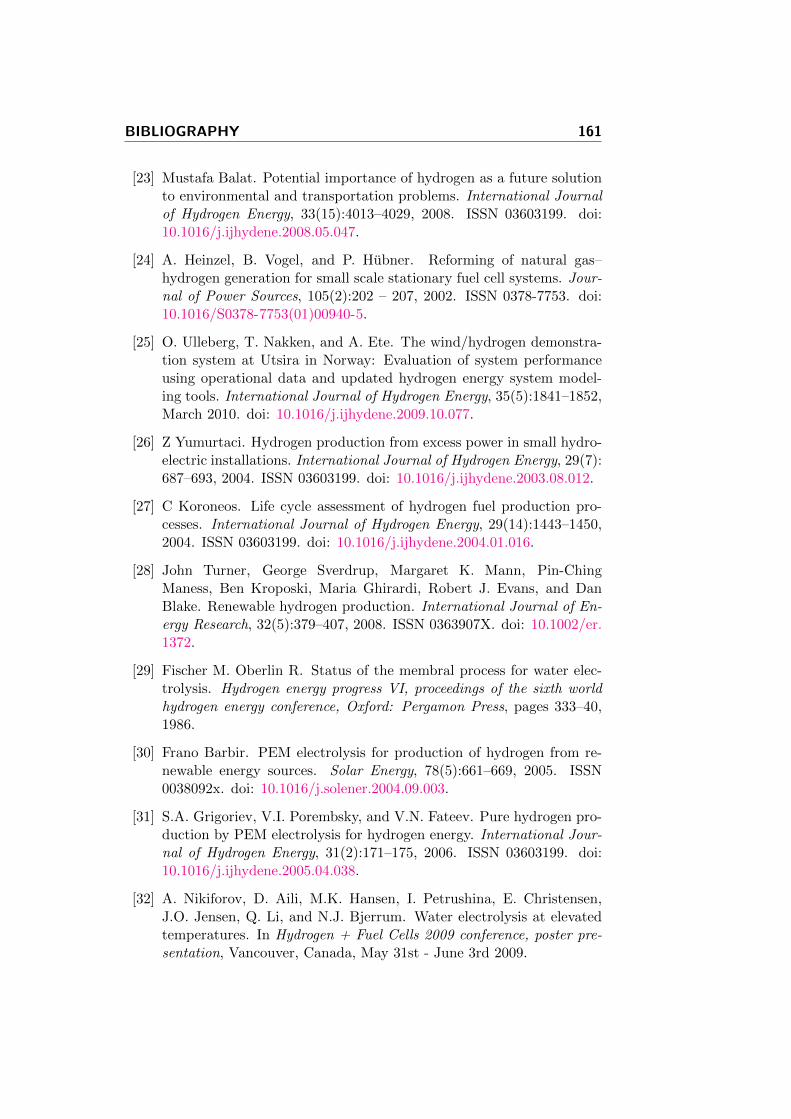
BIBLIOGRAPHY 161
[23] Mustafa Balat. Potential importance of hydrogen as a future solutionto environmental and transportation problems. International Journalof Hydrogen Energy, 33(15):4013–4029, 2008. ISSN 03603199. doi:10.1016/j.ijhydene.2008.05.047.
[24] A. Heinzel, B. Vogel, and P. Hubner. Reforming of natural gas–hydrogen generation for small scale stationary fuel cell systems. Jour-nal of Power Sources, 105(2):202 – 207, 2002. ISSN 0378-7753. doi:10.1016/S0378-7753(01)00940-5.
[25] O. Ulleberg, T. Nakken, and A. Ete. The wind/hydrogen demonstra-tion system at Utsira in Norway: Evaluation of system performanceusing operational data and updated hydrogen energy system model-ing tools. International Journal of Hydrogen Energy, 35(5):1841–1852,March 2010. doi: 10.1016/j.ijhydene.2009.10.077.
[26] Z Yumurtaci. Hydrogen production from excess power in small hydro-electric installations. International Journal of Hydrogen Energy, 29(7):687–693, 2004. ISSN 03603199. doi: 10.1016/j.ijhydene.2003.08.012.
[27] C Koroneos. Life cycle assessment of hydrogen fuel production pro-cesses. International Journal of Hydrogen Energy, 29(14):1443–1450,2004. ISSN 03603199. doi: 10.1016/j.ijhydene.2004.01.016.
[28] John Turner, George Sverdrup, Margaret K. Mann, Pin-ChingManess, Ben Kroposki, Maria Ghirardi, Robert J. Evans, and DanBlake. Renewable hydrogen production. International Journal of En-ergy Research, 32(5):379–407, 2008. ISSN 0363907X. doi: 10.1002/er.1372.
[29] Fischer M. Oberlin R. Status of the membral process for water elec-trolysis. Hydrogen energy progress VI, proceedings of the sixth worldhydrogen energy conference, Oxford: Pergamon Press, pages 333–40,1986.
[30] Frano Barbir. PEM electrolysis for production of hydrogen from re-newable energy sources. Solar Energy, 78(5):661–669, 2005. ISSN0038092x. doi: 10.1016/j.solener.2004.09.003.
[31] S.A. Grigoriev, V.I. Porembsky, and V.N. Fateev. Pure hydrogen pro-duction by PEM electrolysis for hydrogen energy. International Jour-nal of Hydrogen Energy, 31(2):171–175, 2006. ISSN 03603199. doi:10.1016/j.ijhydene.2005.04.038.
[32] A. Nikiforov, D. Aili, M.K. Hansen, I. Petrushina, E. Christensen,J.O. Jensen, Q. Li, and N.J. Bjerrum. Water electrolysis at elevatedtemperatures. In Hydrogen + Fuel Cells 2009 conference, poster pre-sentation, Vancouver, Canada, May 31st - June 3rd 2009.
162 BIBLIOGRAPHY
[33] I.M. Petrushina, A.V. Nikiforov, and N.J. Bjerrum. Corrosion be-havior of highly austenitic stainless steels and ni-based alloys at el-evated temperatures in concentrated phosphoric acid solutions. InICHMS’2009, 11th International Confrence, abstract, oral presenta-tion, pages 162–163, Yalta-Crimia-Ukraine, August 25th-31st 2009.
[34] N.J. Bjerrum, I.M. Petrushina, V. Bandur, and A.V. Nikiforov. Waterelectrolysis at elevated temperatures. In ICHMS’2009, 11th Interna-tional Confrence, abstract, oral presentation, pages 842–843, Yalta-Crimia-Ukraine, August 25th-31st 2009.
[35] A.V. Nikiforov, I.M. Petrushina, E. Christensen, N.J. Bjerrum, andA.L. Tomas-Garcıa. Corrosion behaviour of construction materials forhigh temperature water electrolysers. In NMES’2010, 8th Interna-tional Symposium, abstract, oral presentarion, pages 16–17, Shanghai,China, July 11-15th 2010.
[36] A.V. Nikiforov, I.M. Petrushina, E. Christensen, A. L. Tomas-Garcıa,and N.J Bjerrum. Corrosion behaviour of construction materials forhigh temperature steam electrolysers. International Journal of Hy-drogen Energy, 36(1):111–119, January 2011. ISSN 0360-3199. doi:10.1016/j.ijhydene.2010.09.023.
[37] A.V. Nikiforov, I.M. Petrushina, E. Christensen, A.L. Tomas-Garcıa,and N.J. Bjerrum. Development of catalyst support for oxygen elec-trode for PEM steam electrolysers. In 2nd CARISMA internationalconference on progress in MEA materials for medium and high tem-perature polymer electrolyte fuel cells, abstract, poster presentation,page 69, La Grande Motte, France, September 19th-22nd 2010.
[38] A. V. Nikiforov, A. L. Tomas-Garcıa, I. M. Petrushina, E. Christensen,and N. J. Bjerrum. Preparation and study of IrO2/SiC-Si supportedanode catalyst for high temperature PEM steam electrolysers. Inter-national Journal of Hydrogen Energy, 36(10):5797–5805, May 2011.ISSN 0360-3199. doi: 10.1016/j.ijhydene.2011.02.050.
[39] A. L. Tomas-Garcıa, A.V. Nikiforov, I.M. Petrushina, E. Christensen,and N.J Bjerrum. SiC-Si as a support material for oxygen evolu-tion electrode in PEM steam electrolysers. In Hydrogen + Fuel Cells2011 conference, abstract contribution, Vancouver, Canada, May, 15th- 18th 2011.
[40] A. V. Nikiforov, A. L. Tomas-Garcıa, I. M. Petrushina, E. Christensen,and N. J. Bjerrum. SiC-Si as a support material for oxygen evolutionelectrode in PEM steam electrolysers. In 9th European Symposium onElectrochemical Engineering (9th ESEE), abstract, oral presentation,page 83, Chania, Crete, Greece, June 19th - 23rd 2011.
BIBLIOGRAPHY 163
[41] Kai Zeng and Dongke Zhang. Recent progress in alkaline water elec-trolysis for hydrogen production and applications. Progress in Energyand Combustion Science, 36(3):307 – 326, 2010. ISSN 0360-1285. doi:10.1016/j.pecs.2009.11.002.
[42] Risø National Laboratory. Risøenergy report 3. hydro-gen and its competitors. Technical report, 2004. URLhttp://www.risoe.dtu.dk/Risoe_dk/Home/Knowledge_base/
publications/Reports/ris-r-1469.aspx.
[43] B. E. Conway and G. Jerkiewicz. Relation of energies and coverages ofunderpotential and overpotential deposited h at pt and other metals tothe [‘]volcano curve’ for cathodic h2 evolution kinetics. ElectrochimicaActa, 45(25-26):4075 – 4083, 2000. ISSN 0013-4686. doi: 10.1016/S0013-4686(00)00523-5.
[44] J. O. Jensen, Q. F. Li, C. Pan, A. P. Vestbo, K. Mortensen, H. N. Pe-tersen, C. L. Sorensen, T. N. Clausen, J. Schramm, and N. J. Bjerrum.High temperature PEMFC and the possible utilization of the excessheat for fuel processing. International Journal of Hydrogen Energy, 32(10-11):1567–1571, July 2007. doi: 10.1016/j.ijhydene.2006.10.034.
[45] Hideaki Kita, Shen Ye, Akiko Aramata, and Nagakazu Furuya. Ad-sorption of hydrogen on platinum single crystal electrodes in acid andalkali solutions. Journal of Electroanalytical Chemistry and Interfa-cial Electrochemistry, 295(1-2):317–331, 1990. ISSN 0022-0728. doi:10.1016/0022-0728(90)85025-Z.
[46] S. Trasatti. Electrochemical Hydrogen Technologies, chapter Electrodekinetics and electrocatalysis of hydrogen and oxygen electrode reac-tions. Elsevier, Amsterdam, 1990.
[47] S. Trasatti. Electrodes of conductive metallic oxides. Studies in phys-ical and theoretical chemistry. Elsevier, 335 Jan van Galenstraat P.O.Box 211, 1000 AE Amsterdam, The Netherlands, 1980.
[48] D.Ohms, V.Plzak, S.Trasatti, K.Wiesener, and H.Wendt. Electro-chemical hydrogen technologies. Elsivier Amsterdam, p.1, 1990.
[49] G. Sanddstede. Elektrochemische Stoffgewinnung-Grundlagenund Verfahrenstechnik, volume 125 of DECHEMA-Monographien.DECHEMA, Frankfurt am Main, 1992.
[50] R. Kotz and S. Stucki. Oxygen evolution and corrosion on ruthenium-iridium alloys. Journal of the Electrochemical Society, 132:103–107,1985. ISSN 00134651. doi: 10.1149/1.2113735.
164 BIBLIOGRAPHY
[51] A. Marshall, B. Børresen, G. Hagen, M. Tsypkin, and R. Tunold. Elec-trochemical characterisation of IrxSn1−xO2 powders as oxygen evolu-tion electrocatalysts. Electrochimica Acta, 51:3161–3167, 2006. ISSN00134686. doi: 10.1016/j.electacta.2005.09.004.
[52] C.P. De Pauli and S. Trasatti. Composite materials for electrocatal-ysis of o2 evolution: IrO2+SnO2 in acid solution. Journal of Elec-troanalytical Chemistry, 538-539:145–151, 2002. ISSN 1572-6657. doi:10.1016/S0022-0728(02)01055-0.
[53] J. O. Bockris. Kinetics of activation controlled consecutive electro-chemical reactions - anodic evolution of oxygen. Journal of ChemicalPhysics, 24(4):817–827, 1956. doi: 10.1063/1.1742616.
[54] B. E. Conway and M. Salomon. Electrochemical reaction orders: Ap-plications to the hydrogen- and oxygen-evolution reactions. Elec-trochimica Acta, 9(12):1599 – 1615, 1964. ISSN 0013-4686. doi:10.1016/0013-4686(64)80088-8.
[55] Shidong Song, Huamin Zhang, Xiaoping Ma, Zhigang Shao,Richard T. Baker, and Baolian Yi. Electrochemical investigation ofelectrocatalysts for the oxygen evolution reaction in PEM water elec-trolyzers. International Journal of Hydrogen Energy, 33:4955–4961,2008. ISSN 03603199. doi: 10.1016/j.ijhydene.2008.06.039.
[56] S. Trasatti. Electrochemical Hydrogen technologies, chapter The oxy-gen evolution reaction, pages 104–135. Elsevier, 1990.
[57] P. Rasiyah and A. C. C. Tseung. The role of the lower metal ox-ide/higher metal oxide couple in oxygen evolution reactions. Journalof The Electrochemical Society, 131(4):803–808, 1984. doi: 10.1149/1.2115703.
[58] R. Kotz, H. Neff, and S. Stucki. Anodic iridium oxide films, XPS-studies of oxidation state changes and O2-evolution. Journal of theElectrochemical Society, 131:72–77, 1984. ISSN 00134651. doi: 10.1149/1.2115548.
[59] V.A. Alves, L.A. da Silva, J.F.C. Boodts, and S. Trasatti. Kinetics andmechanism of oxygen evolution on IrO2-based electrodes containing tiand ce acidic solutions. Electrochimica Acta, 39(11-12):1585 – 1589,1994. ISSN 0013-4686. doi: 10.1016/0013-4686(94)85139-5.
[60] D. CUKMAN, M. VUKOVIC, and M. MILUN. Enhanced oxygen evo-lution on an electrodeposited ruthenium+iridium coating on titanium.Journal of Electroanalytical Chemistry, 389(1-2):209–213, June 1995.doi: 10.1016/0022-0728(95)03873-F.
BIBLIOGRAPHY 165
[61] S.Trasatti and G.Logi. Electrodes of Conductive Metallic Oxides PartB, chapter Oxygen and chlorine evolution reactions on conductivemetallic oxide anodes, page 521. Elsevier, 335 Jan van GalenstraatP.O. Box 211, 1000 AE Amsterdam, The Netherlands, 1980.
[62] A.C. Riddiford. Mechanisms for the evolution and ionization of oxy-gen at platinum electrodes. Electrochimica Acta, 4(2-4):170 – 178,1961. ISSN 0013-4686. doi: 10.1016/0013-4686(61)80015-7. An Inter-national Journal of Pure and Applied Electrochemistry published byPergamon Press Ltd. under the auspices of the International Commit-tee for Electrochemical Thermodynamics and Kinetics.
[63] A. Damjanovic, A. Dey, and J.O’M. Bockris. Kinetics of oxygen evo-lution and dissolution on platinum electrodes. Electrochimica Acta,11(7):791 – 814, 1966. ISSN 0013-4686. doi: 10.1016/0013-4686(66)87056-1.
[64] Krasil’shchikov. Zh. Fiz. Khim., 37:531, 1963.
[65] S. Gottesfeld and S. Srinivasan. Electrochemical and optical studiesof thick oxide layers on iridium and their electrocatalytic activities forthe oxygen evolution reaction. Journal of Electroanalytical Chemistryand Interfacial Electrochemistry, 86(1):89–104, 1978. ISSN 0022-0728.doi: 10.1016/S0022-0728(78)80358-1.
[66] Jian-shu Lu. Corrosion of titanium in phosphoric acid at 250 °C.Transactions of Nonferrous Metals Society of China, 19:552–556, 2009.ISSN 10036326. doi: 10.1016/S1003-6326(08)60311-8.
[67] M Benabdellah and B Hammouti. Corrosion behaviour of steel inconcentrated phosphoric acid solutions. Applied Surface Science, 252(5):1657–1661, 2005. ISSN 01694332. doi: 10.1016/j.apsusc.2005.03.191.
[68] T. A. Lukashenko and K. I. Tikhonov. Corrosion resistance of a seriesof group IV-VI transition metal carbides and nitrides in concentratedsolutions of sulfuric and phosphoric acids. Zhurnal Prikladnoi Khimii(Sankt-Peterburg), 71(12):2017–2020, 1998. ISSN 0044-4618.
[69] A Mitsuhashi, K Asami, A Kawashima, and K Hashimoto. Thecorrosion behavior of amorphous nickel base alloys in a hot concen-trated phosphoric acid. Corrosion Science, 27(9):957–970, 1987. ISSN0010938X. doi: 10.1016/0010-938X(87)90062-X.
[70] Alain Robin and Jorge Luiz Rosa. Corrosion behavior of niobium, tan-talum and their alloys in hot hydrochloric and phosphoric acid solu-tions. International Journal of Refractory Metals and Hard Materials,18:13–21, 2000. ISSN 02634368. doi: 10.1016/S0263-4368(99)00034-7.

166 BIBLIOGRAPHY
[71] Ramesh Divakar, Srinvasa G. Seshadri, and Makuteswara Srinivasan.Electrochemical techniques for corrosion rate determination in ceram-ics. Journal of the American Ceramic Society, 72(5):780–784, 1989.ISSN 00027820. doi: 10.1111/j.1151-2916.1989.tb06217.x.
[72] Kenneth R Trethewey and John Chamberlain. Corrosion. LongmanGroup UK Limited, 1988.
[73] Annual book of astm standarts 10.05, g 102-89 (reapproved 1999), p.446-452.
[74] www.crystallography.net. Crystallography open database. URL http:
//www.crystallography.net/.
[75] A. L. Patterson. The Scherrer formula for X-ray particle size deter-mination. Physical Review, 56(10):978–982, Nov 1939. doi: 10.1103/PhysRev.56.978.
[76] H. M. Rietveld. Line profiles of neutron powder-diffraction peaks forstructure refinement. Acta Crystallographica, 22(1):151–152, Jan 1967.doi: 10.1107/S0365110X67000234.
[77] H. P. Klug and L. E. Alexander. X-ray Diffraction Procedures for Poly-crystalline and Amorphous Materials. Wiley, New York, 2nd edition,1974.
[78] John S. Watson. Fast, simple method of powder pellet prepara-tion for x-ray fluorescence analysis. X-Ray Spectrometry, 25(4):173–174, 1996. doi: 10.1002/(SICI)1097-4539(199607)25:4<173::AID-XRS158>3.0.CO;2-Z.
[79] Ajit Jillavenkatesa, Stanley J. Dapkunas, and Lin-Sien H. Lum. Par-ticle size characterisation, January 2001. The National Institute ofStandards and Technology.
[80] H.B. Beer. Electrode coated with a platinum-metal oxide and methodof operating it. Patent NL 6606302 A, 1966.
[81] Y. Matsumoto and E. Sato. Electrocatalytic properties of transi-tion metal oxides for oxygen evolution reaction. Materials Chemistryand Physics, 14(5):397–426, 1986. ISSN 0254-0584. doi: 10.1016/0254-0584(86)90045-3.
[82] J. Honig. Electrodes of conductive metallic oxides, chapter Electronicband structure of oxides with metallic of semiconducting characteris-tics., pages 1–96. Elsevier s, 335 Jan van Galenstraat P.O. Box 211,1000 AE Amsterdam, The Netherlands, 1980.
BIBLIOGRAPHY 167
[83] Donald B. Rogers, Robert D. Shannon, Arthur W. Sleight, andJoseph L. Gillson. Crystal chemistry of metal dioxides with rutile-related structures. Inorganic Chemistry, 8(4):841–849, 1969. doi:10.1021/ic50074a029.
[84] S. Trasatti and G. Logi. Electrodes of conductive metallic oxides, chap-ter Properties of conductive transition metal oxides with rutile-typestructure., pages 301–358. Elsevier, 335 Jan van Galenstraat P.O. Box211, 1000 AE Amsterdam, The Netherlands, 1980.
[85] George Blyholder. Metal-support interaction: A theoretical approach.Journal of Molecular Catalysis A: Chemical, 119(1-3):11 – 17, 1997.ISSN 1381-1169. doi: 10.1016/S1381-1169(96)00465-7. InternationalConference on Theoretical Aspects of Heterogeneous Catalysis.
[86] M. J. Ledoux and C. Pham-Huu. Silicon carbide - a novel catalystsupport for heterogeneous catalysis. Cattech, 5(4):226–246, 2001. doi:10.1023/A:1014092930183.
[87] S.A. Grigoriev, P. Millet, S.A. Volobuev, and V.N. Fateev. Optimiza-tion of porous current collectors for PEM water electrolysers. Inter-national Journal of Hydrogen Energy, 34(11):4968–4973, 2009. ISSN03603199. doi: 10.1016/j.ijhydene.2008.11.056.
[88] O. E. Haas, S. T. Briskeby, O. E. Kongstein, M. Tsypkin, R. Tunold,and B. T. Borresen. Synthesis and characterisation of RuxTix−1O2 asa catalyst support for polymer electrolyte fuel cell. Journal of NewMaterials For Electrochemical Systems, 11(1):9–14, January 2008.
[89] K. E. Swider, C. I. Merzbacher, P. L. Hagans, and D. R. Rolison. Syn-thesis of ruthenium dioxide titanium dioxide aerogels: Redistributionof electrical properties on the nanoscale. Chemistry of Materials, 9(5):1248–1255, May 1997. doi: 10.1021/cm960622c.
[90] B.E. Conway. Electrochemical supercapacitors. Kluwer Academic, NewYork, USA, 1999.
[91] S. Ardizzone, A. Carugati, and S. Trasatti. Properties of thermallyprepared iridium dioxide electrodes. Journal of Electroanalitical chem-istry, 126:287–292, 1981. doi: 10.1016/S0022-0728(81)80437-8.
[92] A. Deoliveirasousa, M. Dasilva, S. Machado, L. Avaca, and P. De-limaneto. Influence of the preparation method on the morpho-logical and electrochemical properties of Ti/IrO2-coated electrodes.Electrochimica Acta, 45(27):4467–4473, 2000. ISSN 00134686. doi:10.1016/S0013-4686(00)00508-9.
168 BIBLIOGRAPHY
[93] L. A. Da Silva, V. A. Alves, S. Trasatti, and J. F. C. Boodts. Sur-face and electrocatalytic properties of ternary oxides Ir0.3Ti0.7−xPtxO2
oxygen evolution from acidic solution. Journal of Electroanalyti-cal Chemistry, 427:97–104, 1997. ISSN 00220728. doi: 10.1016/S0022-0728(97)83088-4.
[94] D. Michell, D.A.J. Rand, and R. Woods. A study of ruthenium elec-trodes by cyclic voltammetry and x-ray emission spectroscopy. Journalof Electroanalytical Chemistry and Interfacial Electrochemistry, 89(1):11 – 27, 1978. ISSN 0022-0728. doi: 10.1016/S0022-0728(78)80027-8.
[95] Guohua Chen, Xueming Chen, and Po Lock Yue. Electrochemicalbehavior of novel Ti/IrOx-Sb2O5-SnO2 anodes. The Journal of Phys-ical Chemistry B, 106(17):4364–4369, 2002. ISSN 1520-6106. doi:10.1021/jp013547o.
[96] Ten-Chin Wen and Chi-Chang Hu. Hydrogen and oxygen evolutionson Ru-Ir binary oxides. Journal of The Electrochemical Society, 139(8):2158–2163, 1992. doi: 10.1149/1.2221195.
[97] H. B. Suffredini, J. L. Cerne, F. C. Crnkovic, S. A. S. Machado, andL. A. Avaca. Recent developments in electrode materials for waterelectrolysis. International Journal of Hydrogen Energy, 25(5):415–423,May 2000. doi: 10.1016/S0360-3199(99)00049-X.
[98] Weikang Hu, Xuejun Cao, Fupeng Wang, and Yunshi Zhang. Anovel cathode for alkaline water electrolysis. International Journalof Hydrogen Energy, 22(6):621 – 623, 1997. ISSN 0360-3199. doi:10.1016/S0360-3199(96)00191-7.
[99] N. A. Abdel Ghany, N. Kumagai, S. Meguro, K. Asami, andK. Hashimoto. Oxygen evolution anodes composed of anodically de-posited mn-mo-fe oxides for seawater electrolysis. Electrochimica Acta,48(1):21 – 28, 2002. ISSN 0013-4686. doi: 10.1016/S0013-4686(02)00539-X.
[100] Guoying Chen, Simon R. Bare, and Thomas E. Mallouk. Developmentof supported bifunctional electrocatalysts for unitized regenerative fuelcells. Journal of The Electrochemical Society, 149(8):A1092–A1099,2002. ISSN 00134651. doi: 10.1149/1.1491237.
[101] H. Y. Jung, S. Park, P. Ganesan, and B. N. Popov. Electrochemi-cal studies of unsupported PtIr electrocatalyst as bifunctional oxygenelectrode in unitized regenerative fuel cell (urfc). Proton ExchangeMembrane Fuel Cells 8, Pts 1 and 2, 16(2):1117–1121, 2008. doi:10.1016/j.jpowsour.2009.02.060.
BIBLIOGRAPHY 169
[102] S. D. Song, H. M. Zhang, X. P. Ma, Z. G. Shao, Y. N. Zhang, and B. L.Yi. Bifunctional oxygen electrode with corrosion-resistive gas diffusionlayer for unitized regenerative fuel cell. Electrochemistry Communi-cations, 8(3):399–405, Mar 2006. ISSN 1388-2481. ElectrochemistryCommunications.
[103] Larry L. Swette, Anthony B. LaConti, and Stephen A. McCatty.Proton-exchange membrane regenerative fuel cells. Journal of PowerSources, 47(3):343–351, 1994. ISSN 03787753. doi: 10.1016/0378-7753(94)87013-6.
[104] Tsutomu Oi and Yoshinori Sakaki. Optimum hydrogen generationcapacity and current density of the pem-type water electrolyzer op-erated only during the off-peak period of electricity demand. Jour-nal of Power Sources, 129(2):229 – 237, 2004. ISSN 0378-7753. doi:10.1016/j.jpowsour.2003.11.050.
[105] C. A. Linkous, H. R. Anderson, R. W. Kopitzke, and G. L. Nel-son. Development of new proton exchange membrane electrolytesfor water electrolysis at higher temperatures. International Jour-nal of Hydrogen Energy, 23(7):525–529, 1998. ISSN 03603199. doi:10.1016/S0360-3199(97)00113-4.
[106] C.A. Linkous. Development of solid polymer electrolytes for waterelectrolysis at intermediate temperatures. International Journal ofHydrogen Energy, 18(8):641–646, 1993. ISSN 03603199. doi: 10.1016/0360-3199(93)90116-R.
[107] Paul A. Lessing. Materials for hydrogen generation via water elec-trolysis. Journal of Materials Science, 42(10):3477–3487, 2007. ISSN00222461. doi: 10.1007/s10853-006-0398-8.
[108] V. Antonucci, A. Di Blasi, V. Baglio, R. Ornelas, F. Matteucci,J. Ledesma-Garcia, L. G. Arriaga, and A. S. Arico. High temperatureoperation of a composite membrane-based solid polymer electrolytewater electrolyser. Electrochimica Acta, 53(24):7350–7356, October2008. doi: 10.1016/j.electacta.2008.04.009.
[109] F. Andolfatto, R. Durand, A. Michas, P. Millet, and P. Stevens. Solidpolymer electrolyte water electrolysis: electrocatalysis and long-termstability. International Journal of Hydrogen Energy, 19(5):421 – 427,1994. ISSN 0360-3199. doi: 10.1016/0360-3199(94)90018-3.
[110] Mikimasa Yamaguchi, Kayoko Okisawa, and Takahiro Nakanori. De-velopment of high performance solid polymer electrolyte water elec-trolyzer in WE-NET. Proceedings of the Intersociety Energy Conver-
170 BIBLIOGRAPHY
sion Engineering Conference, 3-4:1958–1961, 1997. ISSN 0146955x.doi: 10.1109/IECEC.1997.656726.
[111] Yining Zhang, Huamin Zhang, Yuanwei Ma, Jinbin Cheng, HexiangZhong, Shidong Song, and Haipeng Ma. A novel bifunctional electro-catalyst for unitized regenerative fuel cell. Journal of Power Sources,195:142–145, 2009. ISSN 03787753. doi: 10.1016/j.jpowsour.2009.07.018.
[112] P Millet, R Ngameni, and S.A. Grigoriev. PEM water electrolyszers:From electrocatalysis to stack development. International Journal ofHydrogen Energy, 35:5043 – 5052, 2009. doi: 10.1016/j.ijhydene.2009.09.015.
[113] James F. McElroy. Recent advances in SPE® water electrolyzer. Jour-nal of Power Sources, 47(3):369–375, 1994. ISSN 0378-7753. doi:10.1016/0378-7753(94)87015-2. Proceedings of the Fourth Space Elec-trochemical Research and Technology Conference.
[114] Fateev VN. Pahomov, VP. Electrolysis of water with solid polymerelectrolyte. Technical report, RRC “Kurchatov Institute”, 1990.
[115] J. Pettersson, B. Ramsey, and D. Harrison. A review of the lat-est developments in electrodes for unitised regenerative polymer elec-trolyte fuel cells. Journal of Power Sources, 157(1):28–34, 2006. ISSN03787753. doi: 10.1016/j.jpowsour.2006.01.059.
[116] T. Ioroi, N. Kitazawa, K. Yasuda, Y. Yamamoto, and H. Takenaka.Iro2-deposited pt electrocatalysts for unitized regenerative polymerelectrolyte fuel cells. Journal of Applied Electrochemistry, 31:1179–1183, 2001. ISSN 0021-891X. doi: 10.1023/A:1012755809488.
[117] Monjid Hamdan. Low cost, high pressure hydrogen generator, June2008. URL http://www.hydrogen.energy.gov/pdfs/review08/pd_
10_hamden.pdf.
[118] Cecelia Cropley and Timothy Norman. A low-cost high-pressure hy-drogen generator, April 2008. URL http://www.osti.gov/bridge/
servlets/purl/926321-lTUJnC/926321.pdf.
[119] Monjid Hamdan. PEM electrolyzer incorporating an advanced low-cost membrane, 2010. URL http://www.hydrogen.energy.gov/
pdfs/progress10/ii_e_2_hamdan.pdf.
[120] A Marshall, B Børresen, G Hagen, M Tsypkin, and R Tunold. Hydro-gen production by advanced proton exchange membrane (PEM) water
BIBLIOGRAPHY 171
electrolysers-reduced energy consumption by improved electrocataly-sis. Energy, 32:431–436, 2007. ISSN 03605442. doi: 10.1016/j.energy.2006.07.014.
[121] E. Slavcheva, I. Radev, S. Bliznakov, G. Topalov, P. Andreev, andE. Budevski. Sputtered iridium oxide films as electrocatalysts for watersplitting via PEM electrolysis. Electrochimica Acta, 52(12):3889–3894,March 2007. doi: 10.1016/j.electacta.2006.11.005.
[122] R. A. Antunes, M. C. L. Oliveira, G. Ett, and V. Ett. Corrosionof metal bipolar plates for PEM fuel cells: A review. InternationalJournal of Hydrogen Energy, 35(8):3632–3647, April 2010. doi: 10.1016/j.ijhydene.2010.01.059.
[123] H. Tawfik, Y. Hung, and D. Mahajan. Metal bipolar plates for PEMfuel cell-A review. Journal of Power Sources, 163(2):755–767, 2007.ISSN 03787753. doi: 10.1016/j.jpowsour.2006.09.088.
[124] Allen Hermann, Tapas Chaudhuri, and Priscila Spagnol. Bipo-lar plates for PEM fuel cells: A review. International Journal ofHydrogen Energy, 30(12):1297–1302, 2005. ISSN 03603199. doi:10.1016/j.ijhydene.2005.04.016.
[125] URL http://www.ginerinc.com/.
[126] URL http://www.hydrogenics.com/.
[127] Egil Rasten, Georg Hagen, and Reidar Tunold. Electrocatalysis inwater electrolysis with solid polymer electrolyte. Electrochimica Acta,48:3945–3952, 2003. ISSN 00134686. doi: 10.1016/j.electacta.2003.04.001.
[128] Y. Tanaka, S. Uchinashi, Y. Saihara, K. Kikuchi, T. Okaya, andZ. Ogumi. Dissolution of hydrogen and the ratio of the dissolved hy-drogen content to the produced hydrogen in electrolyzed water usingspe water electrolyzer. Electrochimica Acta, 48(27):4013–4019, 2003.doi: 10.1016/S0013-4686(03)00541-3.
[129] C. Mitsugi, A. Harumi, and F. Kenzo. WE-NET: Japanese hydrogenprogram. International Journal of Hydrogen Energy, 23(3):159–165,1998. doi: 10.1016/S0360-3199(97)00042-6.
[130] S. Siracusano, V. Baglio, C. D’Urso, V. Antonucci, and A.S. Arica.Preparation and characterization of titanium suboxides as conductivesupports of IrO2 electrocatalysts for application in spe electrolysers.Electrochimica Acta, 54(26):6292–6299, 2009. ISSN 00134686. doi:10.1016/j.electacta.2009.05.094.
172 BIBLIOGRAPHY
[131] S. Siracusano, V. Baglio, A. Di Blasi, N. Briguglio, A. Stassi, R. Or-nelas, E. Trifoni, V. Antonucci, and A.S. Arico. Electrochemical char-acterization of single cell and short stack PEM electrolyzers basedon a nanosized IrO2 anode electrocatalyst. International Journal ofHydrogen Energy, 35(11):5558 – 5568, 2010. ISSN 0360-3199. doi:10.1016/j.ijhydene.2010.03.102. 3rd Argentinean and 2nd Latin Amer-ican Congress inHydrogen and Sustainable Energy Sources, 3rd Argen-tinean and 2nd Latin American Congress in Hydrogen and SustainableEnergy Sources.
[132] Lirong Ma, Sheng Sui, and Yuchun Zhai. Investigations on high per-formance proton exchange membrane water electrolyzer. InternationalJournal of Hydrogen Energy, 34:678–684, 2009. ISSN 03603199. doi:10.1016/j.ijhydene.2008.11.022.
[133] Pierre Millet, Diana Dragoe, Serguey Grigoriev, Vladimir Fateev, andClaude Etievant. GenHyPEM: A research program on PEM water elec-trolysis supported by the european commission. International Journalof Hydrogen Energy, 34(11):4974–4982, 2009. ISSN 03603199. doi:10.1016/j.ijhydene.2008.11.114.
[134] P. Millet, N. Mbemba, S.A. Grigoriev, V.N. Fateev, A. Aukauloo,and C. Etievant. Electrochemical performances of PEM water elec-trolysis cells and perspectives. International Journal of HydrogenEnergy, In Press, Corrected Proof, 2010. ISSN 0360-3199. doi:10.1016/j.ijhydene.2010.06.105.
[135] Y Shin, W Park, J Chang, and J Park. Evaluation of the high temper-ature electrolysis of steam to produce hydrogen. International Journalof Hydrogen Energy, 32(10-11):1486–1491, 2007. ISSN 03603199. doi:10.1016/j.ijhydene.2006.10.028.
[136] M Ni, M Leung, and D Leung. Energy and exergy analysis of hydro-gen production by solid oxide steam electrolyzer plant. InternationalJournal of Hydrogen Energy, 32(18):4648–4660, 2007. ISSN 03603199.doi: 10.1016/j.ijhydene.2007.08.005.
[137] Q. F. Li, R. H. He, J. O. Jensen, and N. J. Bjerrum. Approaches andrecent development of polymer electrolyte membranes for fuel cellsoperating above 100 degrees C. Chemistry of Materials, 15(26):4896–4915, December 2003. doi: 10.1021/cm0310519.
[138] A. Daghetti, G. Lodi, and S. Trasatti. Interfacial properties ofoxides used as anodes in the electrochemical technology. Materi-als Chemistry and Physics, 8:1–90, 1983. ISSN 02540584. doi:10.1016/0254-0584(83)90020-2.
BIBLIOGRAPHY 173
[139] S. Dutta. Technology assessment of advanced electrolytic hydrogenproduction. International Journal of Hydrogen Energy, 15(6):379–386,1990. ISSN 03603199. doi: 10.1016/0360-3199(90)90194-4.
[140] Wolf Vielstich Carl W. Hamann, Andrew Hamnelt. Electrochemistry.Wiley-VHC, second edition, 1997.
[141] Yue Hung, K. M. EL-Khatib, and Hazem Tawfik. Corrosion-resistantlightweight metallic bipolar plates for PEM fuel cells. Journal ofApplied Electrochemistry, 35(5):445–447, 2005. ISSN 0021891x. doi:10.1007/s10800-004-8350-6.
[142] Robert C. Makkus, Arno H.H. Janssen, Frank A. de Bruijn, andRonald K.A.M. Mallant. Use of stainless steel for cost competitivebipolar plates in the SPFC. Journal of Power Sources, 86(1-2):274–282, 2000. ISSN 03787753. doi: 10.1016/S0378-7753(99)00460-7.
[143] S. Joseph, J. C. McClure, R. Chianelli, P. Pich, and P. J. Sebastian.Conducting polymer-coated stainless steel bipolar plates for protonexchange membrane fuel cells (PEMFC). International Journal ofHydrogen Energy, 30(12):1339–1344, September 2005. doi: 10.1016/j.ijhydene.2005.04.011.
[144] R. J. Tian, J. C. Sun, and L. Wang. Plasma-nitrided austeniticstainless steel 316L as bipolar plate for PEMFC. InternationalJournal of Hydrogen Energy, 31(13):1874–1878, October 2006. doi:10.1016/j.ijhydene.2006.03.003.
[145] Y. Wang and D. O. Northwood. An investigation of the electrochem-ical properties of PVD TiN-coated SS410 in simulated PEM fuel cellenvironments. International Journal of Hydrogen Energy, 32(7):895–902, May 2007. doi: 10.1016/j.ijhydene.2007.02.006.
[146] A. Di Blasi, C. D’Urso, V. Baglio, V. Antonucci, A. S. Arico’, R. Or-nelas, F. Matteucci, G. Orozco, D. Beltran, Y. Meas, and L. G. Ar-riaga. Preparation and evaluation of RuO2 -IrO2, IrO2-Pt and IrO2-Ta2O5 catalysts for the oxygen evolution reaction in an SPE elec-trolyzer. Journal of Applied Electrochemistry, 39(2):191–196, 2009.ISSN 0021891x. doi: 10.1007/s10800-008-9651-y.
[147] D. Labou, E. Slavcheva, U. Schnakenberg, and S. Neophytides. Perfor-mance of laboratory polymer electrolyte membrane hydrogen genera-tor with sputtered iridium oxide anode. Journal of Power Sources, 185(2):1073–1078, 2008. ISSN 03787753. doi: 10.1016/j.jpowsour.2008.08.013.

174 BIBLIOGRAPHY
[148] Ronghuan He, Qingfeng Li, Gang Xiao, and Niels J. Bjerrum. Protonconductivity of phosphoric acid doped polybenzimidazole and its com-posites with inorganic proton conductors. Journal of Membrane Sci-ence, 226(1-2):169–184, 2003. ISSN 03767388. doi: 10.1016/j.memsci.2003.09.002.
[149] S.A. Grigoriev, P. Millet, S.V. Korobtsev, V.I. Porembskiy, M. Pepic,C. Etievant, C. Puyenchet, and V.N. Fateev. Hydrogen safety aspectsrelated to high-pressure polymer electrolyte membrane water electrol-ysis. International Journal of Hydrogen Energy, 34(14):5986–5991,2009. ISSN 03603199. doi: 10.1016/j.ijhydene.2009.01.047.
[150] J. Onoro. Corrosion fatigue behaviour of 317LN austenitic stainlesssteel in phosphoric acid. International Journal of Pressure Vessels andPiping, 86(10):656–660, 2009. ISSN 03080161. doi: 10.1016/j.ijpvp.2009.06.001.
[151] M. Rockel. Corrosion behaviour of nickel alloys and high-alloy stainlesssteel. Nickel Alloys. Marcel Dekker Inc, New York, 1998.
[152] Gerhard I.Kreysa and Reiner Eckermann. DECHEMA corrosion hand-book: corrosive agents and their interaction with materials, volume12. Chlorinated hydrocarbons-chloroethanes, phosphoric acid. VCHVerlagsgesellschaft, Weinheim (Germany) and VCH Publishers, NewYork, NY (USA), 1993.
[153] International patent application, 03.01.2008, WO 2008/002150 A1,PCT/NO2007/000235, 03.01.2008.
[154] M. Keijzer, K. Hemmes, P. J. J. M. VanDerPut, J. H. W. DeWit, andJ. Schoonman. A search for suitable coating materials on separatorplates for molten carbonate fuel cells. Corrosion Science, 39(3):483–494, March 1997. doi: 10.1016/S0010-938X(96)00137-0.
[155] F. Cardarelli, P. Taxil, A. Savall, Ch. Comninellis, G. Manoli, andO. Leclerc. Preparation of oxygen evolving electrodes with long servicelife under extreme conditions. Journal of Applied Electrochemistry, 28(3):245–250, 1998. ISSN 0021891x. doi: 10.1023/A:1003251329958.
[156] M.Bengisu. Engineering Ceramics. Springer-Verlag Berlin Heidelberg2001, 1963.
[157] URL http://www.tantaline.com/.
[158] M Ni, M Leung, and D Leung. Technological development of hydro-gen production by solid oxide electrolyzer cell (SOEC). InternationalJournal of Hydrogen Energy, 33(9):2337–2354, 2008. ISSN 03603199.doi: 10.1016/j.ijhydene.2008.02.048.
BIBLIOGRAPHY 175
[159] Anne Hauch, Sune Dalgaard Ebbesen, Søren Højgaard Jensen, andMogens Mogensen. Highly efficient high temperature electrolysis.Journal of Materials Chemistry, 18(20):2331, 2008. ISSN 0959-9428.doi: 10.1039/b718822f.
[160] M. H. Miles, E. A. Klaus, B. P. Gunn, J. R. Locker, W. E. Ser-afin, and S. Srinivasan. The oxygen evolution reaction on plat-inum, iridium, ruthenium and their alloys at 80 °C in acid solutions.Electrochimica Acta, 23(6):521 – 526, 1978. ISSN 0013-4686. doi:10.1016/0013-4686(78)85030-0.
[161] R. Hutchings, K. Mueller, R. Koetz, and S. Stucki. Structural in-vestigation of stabilized oxygen evolution catalysts. Journal of Ma-terials Science, 19:3987–3994, 1984. ISSN 00222461. doi: 10.1007/BF00980762.
[162] T. Medhoui, E. Anxolabehere, and A. Aukauloo P. Millet P.Biomimetic approaches for the development of non-noble metal elec-trocatalysts. application to pem water electrolysis. In Proceedings ofthe 16th World Hydrogen Energy conference, number 390, pages 1–9,Lyon, 13–16, june 2006 .
[163] Chiaki Iwakura, Kazuhiro Hirao, and Hideo Tamura. Anodic evolutionof oxygen on ruthenium in acidic solutions. Electrochimica Acta, 22(4):329–334, 1977. ISSN 0013-4686. doi: 10.1016/0013-4686(77)85082-2.
[164] Ailton J. Terezo and Ernesto C. Pereira. Preparation and charac-terisation of Ti/RuO2 anodes obtained by sol-gel and conventionalroutes. Materials Letters, 53(4-5):339–345, 2002. ISSN 0167-577X.doi: 10.1016/S0167-577X(01)00504-3.
[165] G. Lodi, C. Deasmundis, S. Ardizzone, E. Sivieri, and S. Trasatti.Resistivity and temperature-coefficient of resistivity of ruthenium ox-ide layers influence of morphology. Surface Technology, 14(4):335–343,1981. ISSN 0376-4583. doi: 10.1016/0376-4583(81)90039-X.
[166] M. Vukovic. Oxygen evolution on an electrodeposited rutheniumelectrode in acid solution–the effect of thermal treatment. Elec-trochimica Acta, 34(2):287 – 291, 1989. ISSN 0013-4686. doi:10.1016/0013-4686(89)87099-9.
[167] Hongchao Ma, Changpeng Liu, Jianhui Liao, Yi Su, XingzhongXue, and Wei Xing. Study of ruthenium oxide catalyst for elec-trocatalytic performance in oxygen evolution. Journal of MolecularCatalysis A: Chemical, 247(1-2):7–13, 2006. ISSN 1381-1169. doi:10.1016/j.molcata.2005.11.013.
176 BIBLIOGRAPHY
[168] M.Pourbaix. Atlas d’equilibres electrochimiques. Gauthier-Villars,Paris, 1963.
[169] T. Loucka. The reason for the loss of activity of titanium anodes coatedwith a layer of RuO2 and TiO2. Journal of Applied Electrochemistry,7:211–214, 1977. ISSN 0021891x. doi: 10.1007/BF00618987.
[170] Y. Koda. Boiling points and ideal solutions of ruthenium and osmiumtetraoxides. Journal of the Chemical Society-chemical Communica-tions, (17):1347–1348, September 1986. doi: 10.1039/C39860001347.
[171] Julien Gatineau, Kazutaka Yanagita, and Christian Dussarrat. A newRuO4 solvent solution for pure ruthenium film depositions. Microelec-tronic Engineering, 83(11-12):2248 – 2252, 2006. ISSN 0167-9317. doi:10.1016/j.mee.2006.10.013.
[172] F. I. Mattos-Costa, P. de Lima-Neto, S. A. S. Machado, and L. A.Avaca. Characterisation of surfaces modified by sol-gel derivedRuxIr(1−x)O2 coatings for oxygen evolution in acid medium. Elec-trochimica Acta, 44:1515–1523, 1998. ISSN 00134686. doi: 10.1016/S0013-4686(98)00275-8.
[173] Y. Zhang, C. Wang, N. Wan, and Z. Mao. Deposited RuO2-IrO2/Ptelectrocatalyst for the regenerative fuel cell. International Journal ofHydrogen Energy, 32(3):400–404, 2007. ISSN 03603199. doi: 10.1016/j.ijhydene.2006.06.047.
[174] Gabriele Centi and Siglinda Perathoner. The role of nanostructurein improving the performance of electrodes for energy storage andconversion. European Journal of Inorganic Chemistry, 2009(26):3851–3878, 2009. ISSN 14341948. doi: 10.1002/ejic.200900275.
[175] A. Marshall, B. Børresen, G. Hagen, S. Sunde, M. Tsypkin, andR. Tunold. Iridium oxide-based nanocrystalline particles as oxygenevolution electrocatalysts. Russian Journal of Electrochemistry, 42:1134–1140, 2006. ISSN 10231935. doi: 10.1134/S1023193506100223.
[176] A. T. Marshall, S. Sunde, M. Tsypkin, and R. Tunold. Performanceof a PEM water electrolysis cell using IrxRuyTazO2 electrocatalystsfor the oxygen evolution electrode. International Journal of HydrogenEnergy, 32:2320–2324, 2007. ISSN 03603199. doi: 10.1016/j.ijhydene.2007.02.013.
[177] Aaron T. Marshall and Richard G. Haverkamp. Electrocatalyticactivity of IrO2–RuO2 supported on Sb-doped SnO2 nanoparticles.Electrochimica Acta, 55(6):1978–1984, 2010. ISSN 00134686. doi:10.1016/j.electacta.2009.11.018.
BIBLIOGRAPHY 177
[178] Jinbin Cheng, Huamin Zhang, Haipeng Ma, Hexiang Zhong, andYi Zou. Preparation of Ir0.4Ru0.6MoxOy for oxygen evolution by modi-fied Adams’ fusion method. International Journal of Hydrogen Energy,34(16):6609 – 6613, 2009. ISSN 0360-3199. doi: 10.1016/j.ijhydene.2009.06.061.
[179] R. Bertoncello. Preparation of anodes for oxygen evolution by elec-trodeposition of composite oxides of Pb and Ru on Ti. Journal ofElectroanalytical Chemistry, 492(2):145–149, 2000. ISSN 00220728.doi: 10.1016/S0022-0728(00)00300-4.
[180] R. Adams and R. L. Shriner. Platinum oxide as a catalyst in thereduction of organic compounds. III. Preparation and properties ofthe oxide of platinum obtained by the fusion of ceiloroplatinic acidwith sodium nitrate. Journal of the American Chemical Society, 45:2171–2179, Jul 1923. ISSN 0002-7863. doi: 10.1021/ja01662a022.
[181] A. Marshall, B. Børresen, G. Hagen, M. Tsypkin, and R. Tunold.Preparation and characterisation of nanocrystalline IrxSn1−xO2 elec-trocatalytic powders. Materials Chemistry and Physics, 94:226–232,2005. ISSN 02540584. doi: 10.1016/j.matchemphys.2005.04.039.
[182] F. Bonet, V. Delmas, S. Grugeon, R. Herrera Urbina, P. Y. Silvert, andK. Tekaia-Elhsissen. Synthesis of monodisperse Au, Pt, Pd, Ru and Irnanoparticles in ethylene glycol. Nanostructured Materials, 11:1277–1284, 1999. ISSN 09659773. doi: 10.1016/S0965-9773(99)00419-5.
[183] H. C. BROWN and C. A. BROWN. A new convenient technique forhydrogenation of unsaturated compounds. Journal of the AmericanChemical Society, 84(8):1495, 1962. doi: 10.1021/ja00867a036.
[184] Silvia Ardizzone, Giuseppe Cappelletti, Mariana Ionita, AlessandroMinguzzi, Sandra Rondinini, and Alberto Vertova. Low-temperaturesol-gel nanocrystalline tin oxide. Electrochimica Acta, 50:4419–4425,2005. ISSN 00134686. doi: 10.1016/j.electacta.2005.02.005.
[185] S. Ardizzone, C. L. Bianchi, L. Borgese, G. Cappelletti, C. Lo-catelli, A. Minguzzi, S. Rondinini, A. Vertova, P. C. Ricci, C. Can-nas, and A. Musinu. Physico-chemical characterization of IrO2-SnO2 sol-gel nanopowders for electrochemical applications. Journalof Applied Electrochemistry, 39(11):2093–2105, November 2009. doi:10.1007/s10800-009-9895-1.
[186] R. Cote, G. Lalande, D. Guay, J. P. Dodelet, and G. Denes. Iridiumand ruthenium based electrocatalysts for oxygen reduction in poly-mer electrolyte fuel cells. In 2nd International Symposium on NewMaterials for Fuel Cell and Modern Battery Systems, pages 743–755,
178 BIBLIOGRAPHY
MONTREAL CANADA, July 06–10 1997. Ecole Polytechnique Mon-treal.
[187] M Yagi, E Tomita, and T Kuwabara. Remarkably high activity ofelectrodeposited IrO2 film for electrocatalytic water oxidation. Journalof Electroanalytical Chemistry, 579(1):83–88, 2005. ISSN 00220728.doi: 10.1016/j.jelechem.2005.01.030.
[188] E. N. El Sawy and V. I. Birss. Nano-porous iridium and iridiumoxide thin films formed by high efficiency electrodeposition. Journal ofMaterials Chemistry, 19(43):8244–8252, 2009. doi: 10.1039/b914662h.
[189] Kim Kinoshita. Electrochemical uses of carbon. Electrochem-istry Encyclopedia. URL http://electrochem.cwru.edu/encycl/
art-c01-carbon.htm.
[190] H.B. Beer. Electrode and coating therefor. US Patent 3,632,498, 1972.
[191] H.B. Beer. Electrode having platinum metal oxide coating thereon,and method of use thereof. US Patent 3,711,385, 1973.
[192] F. Hine, M.Yasuda, and T.Yoshida. Studies on oxide-coated metalanodes for chlor-alkali cells. Journal of the Electrochemical Society,124(4):500–505, 1977. doi: 10.1149/1.2133337.
[193] X. M. Chen and G. H. Chen. Investigation of Ti/IrO2-Sb2O5-SnO2
electrodes for O2 evolution. Journal of the Electrochemical Society,152(7):J59–J64, 2005. doi: 10.1149/1.1922890.
[194] Chiaki Iwakura. Effect of active layer composition on the service lifeof (SnO2 and RuO2)-coated Ti electrodes in sulfuric acid solution.Journal of The Electrochemical Society, 132(10):2420, 1985. ISSN00134651. doi: 10.1149/1.2113590.
[195] R. S. Yeo, J.Orehotsky, W. Visscher, and S. Srinivasan. Ruthenium-based mixed oxides as electrocatalysts for oxygen evolution in acidelectrolytes. Journal of the Electrochemical Society, 128(9):1900–1904,1981. doi: 10.1149/1.2127761.
[196] E. N. Balko and P. H. Nguyen. Iridium-tin mixed oxide anode coatings.Journal of Applied Electrochemistry, 21:678–682, 1991. ISSN 0021-891X. doi: 10.1007/BF01034045.
[197] B. Correa-Lozano, Ch. Comninellis, and A. De Battisti. Service lifeof Ti/SnO2-Sb2O5 anodes. Journal of Applied Electrochemistry, 27:970–974, 1997. ISSN 0021-891X. doi: 10.1023/A:1018414005000.

BIBLIOGRAPHY 179
[198] Josimar Ribeiro and Adalgisa R. de Andrade. Investigation of theelectrical properties, charging process, and passivation of RuO2–Ta2O5
oxide films. Journal of Electroanalytical Chemistry, 592:153–162, 2006.ISSN 00220728. doi: 10.1016/j.jelechem.2006.05.004.
[199] Y. E. Roginskaya, O. V. Morozova, E.N. Loubnin, A.V. Popov, Y.I.Ulitina, V. V.Zhurov, S.A. Ivanov, and S. Trasatti. X-ray diffrac-tion, transmission electron-microscopy and x-ray photoelectron spec-troscopic characterization of IrO2+Ta2O5 films. Journal of the Chem-ical Society-faraday Transactions, 89(11):1707–1715, June 1993. doi:10.1039/FT9938901707.
[200] J Hu. Oxygen evolution reaction on IrO2-based DSA® type elec-trodes: kinetics analysis of tafel lines and EIS. International Jour-nal of Hydrogen Energy, 29(8):791–797, 2004. ISSN 03603199. doi:10.1016/j.ijhydene.2003.09.007.
[201] A De Battisti, R. Brina, G. Gavelli, A. Benedetti, and G. Fagher-azzi. Influence of the valve metal oxide on the properties of ruthe-nium based mixed oxide electrodes: Part I. Titanium supportedRuO2/Ta2O5 layers. Journal of Electroanalytical Chemistry and In-terfacial Electrochemistry, 200(1-2):93 – 104, 1986. ISSN 0022-0728.doi: 10.1016/0022-0728(86)90048-3.
[202] Ch. Comninellis and G. P. Vercesi. Characterization of DSA®-typeoxygen evolving electrodes: Choice of a coating. Journal of AppliedElectrochemistry, 21:136–142, 1991. ISSN 0021-891X. doi: 10.1007/BF01020219.
[203] G.P. Vercesi, J. Rolewicz, Ch. Comninellis, and J. Hinder. Char-acterization of DSA-type oxygen evolving electrodes. choice of basemetal. Thermochimica Acta, 176:31 – 47, 1991. ISSN 0040-6031. doi:10.1016/0040-6031(91)80257-J.
[204] C Angelinetta, S Trasatti, L Atanasoska, Z Minevski, and R Atana-soski. Effect of preparation on the surface and electrocatalytic prop-erties of RuO2 + IrO2 mixed oxide electrodes. Materials Chem-istry and Physics, 22:231–247, 1989. ISSN 02540584. doi: 10.1016/0254-0584(89)90039-4.
[205] C. Comninnellis and G.P. Vercesi. Problems in DSA coating depositionby thermal-decomposition. Journal of Applied Electrochemistry, 21(2):136–142, February 1991. doi: 10.1007/BF01464294.
[206] A. J. Terezo and E. C. Pereira. Preparation and characteriza-tion of Ti/RuO2-Nb2O5 electrodes obtained by polymeric precur-
180 BIBLIOGRAPHY
sor method. Electrochimica Acta, 44(25):4507–4513, 1999. doi:10.1016/S0013-4686(99)00182-6.
[207] Alfredo Ursua, Luis Marroyo, Eugenio Gubıa, Luis M. Gandıa, Pe-dro M. Dieguez, and Pablo Sanchis. Influence of the power supply onthe energy efficiency of an alkaline water electrolyser. InternationalJournal of Hydrogen Energy, 34(8):3221–3233, 2009. ISSN 0360-3199.doi: 10.1016/j.ijhydene.2009.02.017.
[208] J. D. Holladay, J. Hu, D. L. King, and Y. Wang. An overview ofhydrogen production technologies. Catalysis Today, 139(4):244–260,January 2009. doi: 10.1016/j.cattod.2008.08.039.
[209] D.J. Connolly, Longwood, and W.F. Gresham. Fluorocarbon vinylether polymers, 1966.
[210] L. G. Lage, P. G. Delgado, and Y. Kawano. Thermal stability anddecomposition of Nafion® membranes with different cations usinghigh-resolution thermogravimetry. Journal of Thermal Analysis andCalorimetry, 75(2):521–530, 2004. doi: 10.1023/B:JTAN.0000027142.21928.c7.
[211] Der-Tau Chin and Howard H. Chang. On the conductivity of phospho-ric acid electrolyte. Journal of Applied Electrochemistry, 19(1):95–99,1989. ISSN 0021-891X. doi: 10.1007/BF01039396.
[212] A. Appleby and C. Vandrunen. The oxygen evolution reaction onrhodium and iridium electrodes in 85% orthophosphoric acid. Journalof Electroanalytical Chemistry, 60(1):101–108, 1975. ISSN 00220728.doi: 10.1016/S0022-0728(75)80207-5.
[213] Guoqiang Wei, Li Xu, Chengde Huang, and Yuxin Wang. SPE waterelectrolysis with SPEEK/PES blend membrane. International Journalof Hydrogen Energy, 35(15):7778 – 7783, 2010. ISSN 0360-3199. doi:10.1016/j.ijhydene.2010.05.041. The 10th Chinese Hydrogen EnergyConference.
[214] Haiqiu Zhang, Xianfeng Li, Chengji Zhao, Tiezhu Fu, Yuhua Shi, andHui Na. Composite membranes based on highly sulfonated PEEKand PBI: Morphology characteristics and performance. Journal ofMembrane Science, 308(1-2):66–74, 2008. ISSN 0376-7388. doi: DOI:10.1016/j.memsci.2007.09.045.
[215] B. Li, A. Lin, and F. Gan. Preparation and electrocatalytic prop-erties of Ti/IrO2−Ta2O5 anodes for oxygen evolution. Transactionsof Nonferrous Metals Society of China, 16(5):1193–1199, 2006. ISSN10036326. doi: 10.1016/S1003-6326(06)60400-7.
BIBLIOGRAPHY 181
[216] E. Antolini and E.R. Gonzalez. Ceramic materials as supports forlow-temperature fuel cell catalysts. Solid State Ionics, 180(9-10):746– 763, 2009. ISSN 0167-2738. doi: 10.1016/j.ssi.2009.03.007.
[217] Milan M. Jaksic. Hypo-hyper-d-electronic interactive nature of syn-ergism in catalysis and electrocatalysis for hydrogen reactions. Elec-trochimica Acta, 45(25-26):4085 – 4099, 2000. ISSN 0013-4686. doi:10.1016/S0013-4686(00)00525-9.
[218] L. Vracar, N. Krstajic, V. Radmilovic, and M. Jaksic. Electrocatalysisby nanoparticles – oxygen reduction on Ebonex/Pt electrode. Journalof Electroanalytical Chemistry, 587(1):99–107, 2006. ISSN 00220728.doi: 10.1016/j.jelechem.2005.10.021.
[219] H. R. Colon-Mercado and B. N. Popov. Stability of platinum basedalloy cathode catalysts in PEM fuel cells. Journal of Power Sources,155(2):253–263, April 2006. doi: 10.1016/j.jpowsour.2005.05.011.
[220] L. M. Roen, C. H. Paik, and T. D. Jarvic. Electrocatalytic corrosion ofcarbon support in PEMFC cathodes. Electrochemical and Solid StateLetters, 7(1):A19–A22, January 2004. doi: 10.1149/1.1630412.
[221] Kazuaki Yasuda, Akira Taniguchi, Tomoki Akita, Tsutomu Ioroi, andZyun Siroma. Platinum dissolution and deposition in the polymer elec-trolyte membrane of a PEM fuel cell as studied by potential cycling.Physical Chemistry Chemical Physics, 8(6):746, 2006. ISSN 1463-9076.doi: 10.1039/b514342j.
[222] Lirong Ma, Sheng Sui, and Yuchun Zhai. Preparation and character-ization of Ir/TiC catalyst for oxygen evolution. Journal of PowerSources, 177(2):470–477, 2008. ISSN 03787753. doi: 10.1016/j.jpowsour.2007.11.106.
[223] N. C. Halder. Electron-tunneling and hopping possibilites in RuO2
thick-films. Electrocomponent Science and Technology, 11(1):21–34,1983. doi: 10.1155/APEC.11.21.
[224] A. Szpytma and A. Kusy. On the segregation of the conductive phasein RuO2-based thick resistive films. Thin Solid Films, 121(4):263–270,1984. doi: 10.1016/0040-6090(84)90054-3.
[225] L. Ouattara, T. Diaco, I. Duo, M. Panizza, G. Foti, and C. Comninel-lis. Dimensionally stable anode-type anode based on conductive p-silicon substrate. Journal of the Electrochemical Society, 150(2):D41–5, 2003. ISSN 00134651. doi: 10.1149/1.1537756.
182 BIBLIOGRAPHY
[226] Alan D. McLeod, Jean-Marc Lihrmann, John S. Haggerty, and Don-ald R. Sadoway. Selection and testing of inert anode materials for hallcells. Light Metals: Proceedings of Sessions, AIME Annual Meeting(Warrendale, Pennsylvania), pages 357–365, 1987. ISSN 0873390601.
[227] Halvor Kvande. Inert electrodes in aluminum electrolysis cells. LightMetals: Proceedings of Sessions, TMS Annual Meeting (Warrendale,Pennsylvania), pages 369–376, 1999. ISSN 10969586.
[228] W. T. Grubb and D. W. Mckee. Boron carbide, a new substrate forfuel cell electrocatalysts. Nature, 210(5032):192–194, 1966. ISSN 0028-0836. doi: 10.1038/210192b0.
[229] A. Honji, T. Mori, Y. Hishinuma, and K. Kurita. Platinum supportedon silicon-carbide as fuel-cell electrocatalysts. Journal of the Electro-chemical Society, 135(4):917–918, April 1988. doi: 10.1149/1.2095831.
[230] C. V. Rao, S. K. Singh, and B. Viswanathan. Electrochemical per-formance of nano-SiC prepared in thermal plasma. Indian Journal ofChemistry Section A-inorganic Bio-inorganic Physical Theoretical &Analytical Chemistry, 47(11):1619–1625, November 2008.
[231] P. V. Kumar and G. S. Gupta. Study of formation of silicon carbidein the Acheson process. Steel Research, 73(2):31–38, February 2002.
[232] J Riviere, J Delafond, P Misaelides, and F Noli. Corrosion protectionof an AISI 321 stainless steel by SiC coatings. Surface and CoatingsTechnology, 100-101:243–246, 1998. ISSN 02578972. doi: 10.1016/S0257-8972(97)00622-1.
[233] David W. Richerson. Modern ceramic engineering. Properties, process-ing, and use in design. Taylor & Francis Group, LLC, third edition,2006.
[234] Annual book of astm standarts 10.05, g5-94, p. 60-70.
[235] M. Pourbaix, L. Klimzack-Mathieiu, Ch. Mertens, J. Meunier, Cl.Vanleugenhaghe, L. de Munck, J. Laureys, L. Neelemans, andM. Warzee. Potentiokinetic and corrosimetric investigations of thecorrosion behaviour of alloy steels. Corrosion Science, 3(4):239–259,1963. ISSN 0010-938X. doi: 10.1016/S0010-938X(63)80030-X.
[236] M. Kouril, E. Christensen, S. Eriksen, and B. Gillesberg. Corrosionrate of construction materials in hot phosphoric acid with the contri-bution of anodic polarization. Materials and Corrosion, 2011. ISSN1521-4176. doi: 10.1002/maco.201006021.
BIBLIOGRAPHY 183
[237] W.Z.Friend. Corrosion of Nickel and Nickel-Base Alloys.J.Wiley&Sons, New York-Chichester-Brisbane-Toronto, 1980.
[238] Yu. I. Bil’chugov, N. L. Makarova, and A. A. Nazarov. On limit ofmolybdenum content of pitting-corrosion-resistant austenitic steels.Protection of Metals, 37(6):597–601, 2001. ISSN 00331732. doi:10.1023/A:1012879916686.
[239] Asphahani et. al. United states patent 4846885, 1989.
[240] A. Celzard, J. F. Mareche, F. Payot, and G. Furdin. Electrical con-ductivity of carbonaceous powders. Carbon, 40(15):2801–2815, 2002.doi: 10.1016/S0008-6223(02)00196-3.
[241] J. Kim, H. Kim, T. Lim, and H. Lee. Dependence of the performance ofa high-temperature polymer electrolyte fuel cell on phosphoric acid-doped polybenzimidazole ionomer content in cathode catalyst layer.Journal of Power Sources, 170(2):275–280, 2007. ISSN 03787753. doi:10.1016/j.jpowsour.2007.03.082.

184 BIBLIOGRAPHY
Appendix A
Rietveld Treatment of the XRDData for the SiC-Si Powder
Catalyst Support
The Rietveld refinement of the XRD data of the SiC-Si support is presentedin Figure A.1 and detailed parameters of the data treatment can be foundbelow:
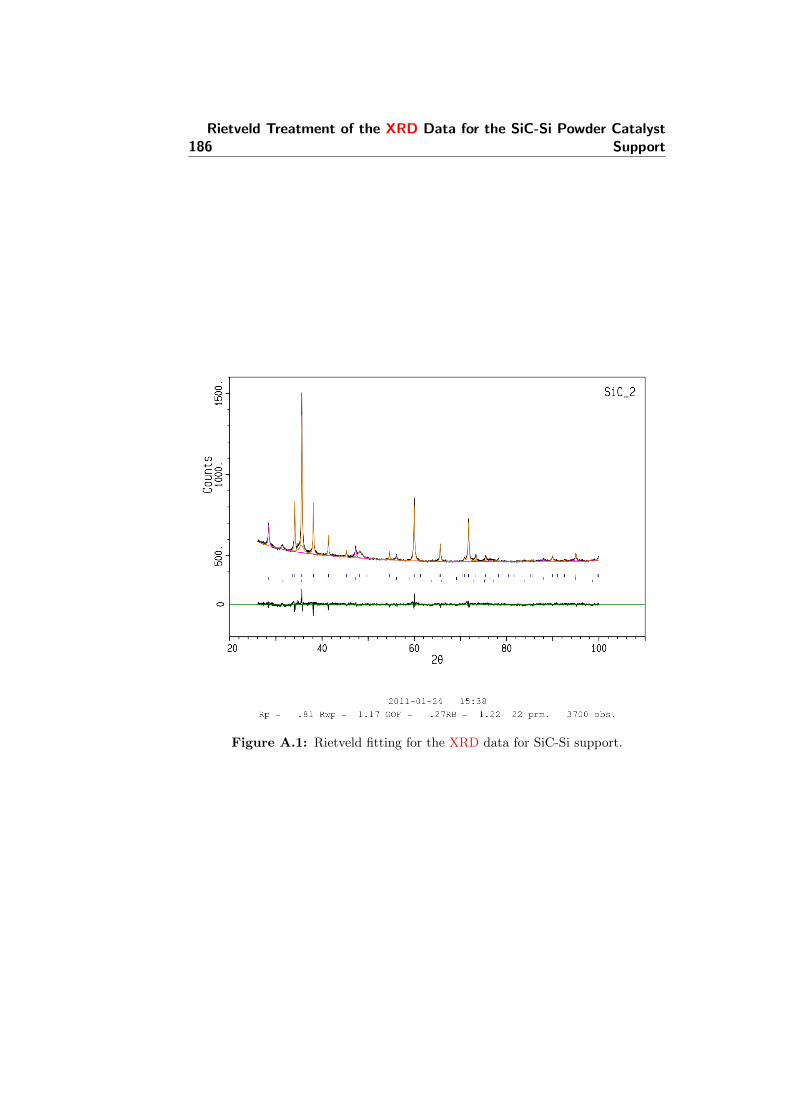
186Rietveld Treatment of the XRD Data for the SiC-Si Powder Catalyst
Support
Figure A.1: Rietveld fitting for the XRD data for SiC-Si support.
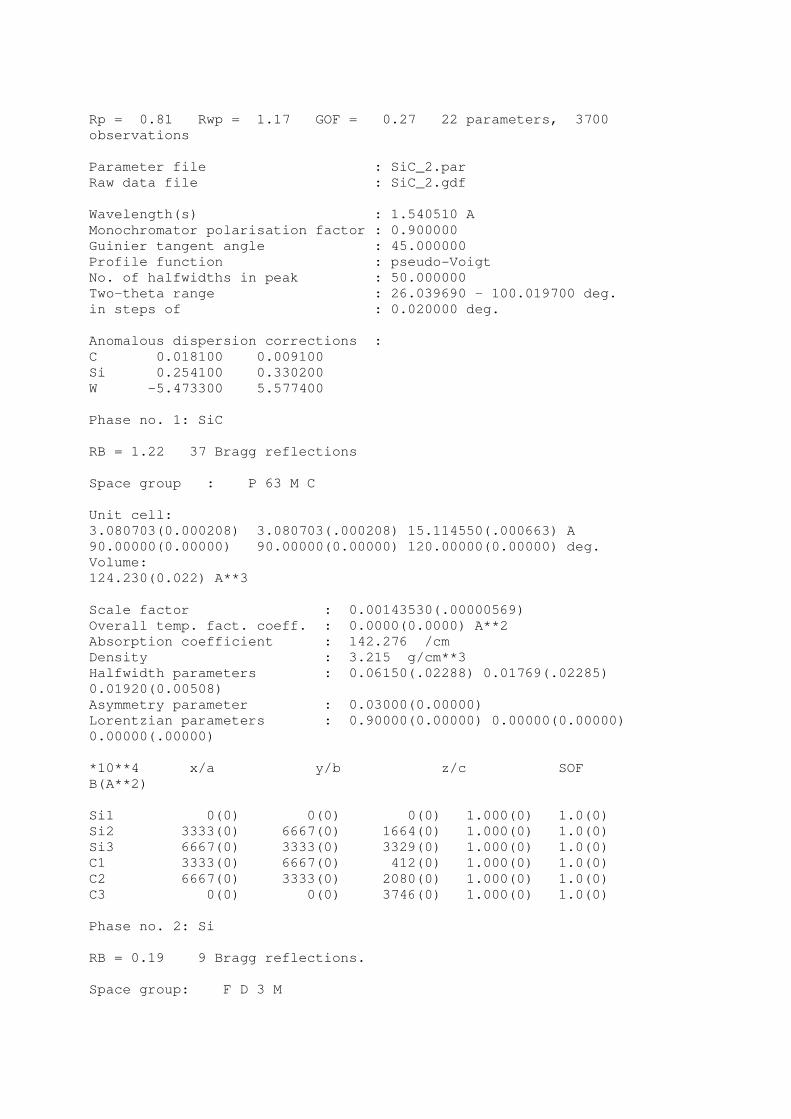
Rp = 0.81 Rwp = 1.17 GOF = 0.27 22 parameters, 3700
observations
Parameter file : SiC_2.par
Raw data file : SiC_2.gdf
Wavelength(s) : 1.540510 A
Monochromator polarisation factor : 0.900000
Guinier tangent angle : 45.000000
Profile function : pseudo-Voigt
No. of halfwidths in peak : 50.000000
Two-theta range : 26.039690 - 100.019700 deg.
in steps of : 0.020000 deg.
Anomalous dispersion corrections :
C 0.018100 0.009100
Si 0.254100 0.330200
W -5.473300 5.577400
Phase no. 1: SiC
RB = 1.22 37 Bragg reflections
Space group : P 63 M C
Unit cell:
3.080703(0.000208) 3.080703(.000208) 15.114550(.000663) A
90.00000(0.00000) 90.00000(0.00000) 120.00000(0.00000) deg.
Volume:
124.230(0.022) A**3
Scale factor : 0.00143530(.00000569)
Overall temp. fact. coeff. : 0.0000(0.0000) A**2
Absorption coefficient : 142.276 /cm
Density : 3.215 g/cm**3
Halfwidth parameters : 0.06150(.02288) 0.01769(.02285)
0.01920(0.00508)
Asymmetry parameter : 0.03000(0.00000)
Lorentzian parameters : 0.90000(0.00000) 0.00000(0.00000)
0.00000(.00000)
*10**4 x/a y/b z/c SOF
B(A**2)
Si1 0(0) 0(0) 0(0) 1.000(0) 1.0(0)
Si2 3333(0) 6667(0) 1664(0) 1.000(0) 1.0(0)
Si3 6667(0) 3333(0) 3329(0) 1.000(0) 1.0(0)
C1 3333(0) 6667(0) 412(0) 1.000(0) 1.0(0)
C2 6667(0) 3333(0) 2080(0) 1.000(0) 1.0(0)
C3 0(0) 0(0) 3746(0) 1.000(0) 1.0(0)
Phase no. 2: Si
RB = 0.19 9 Bragg reflections.
Space group: F D 3 M
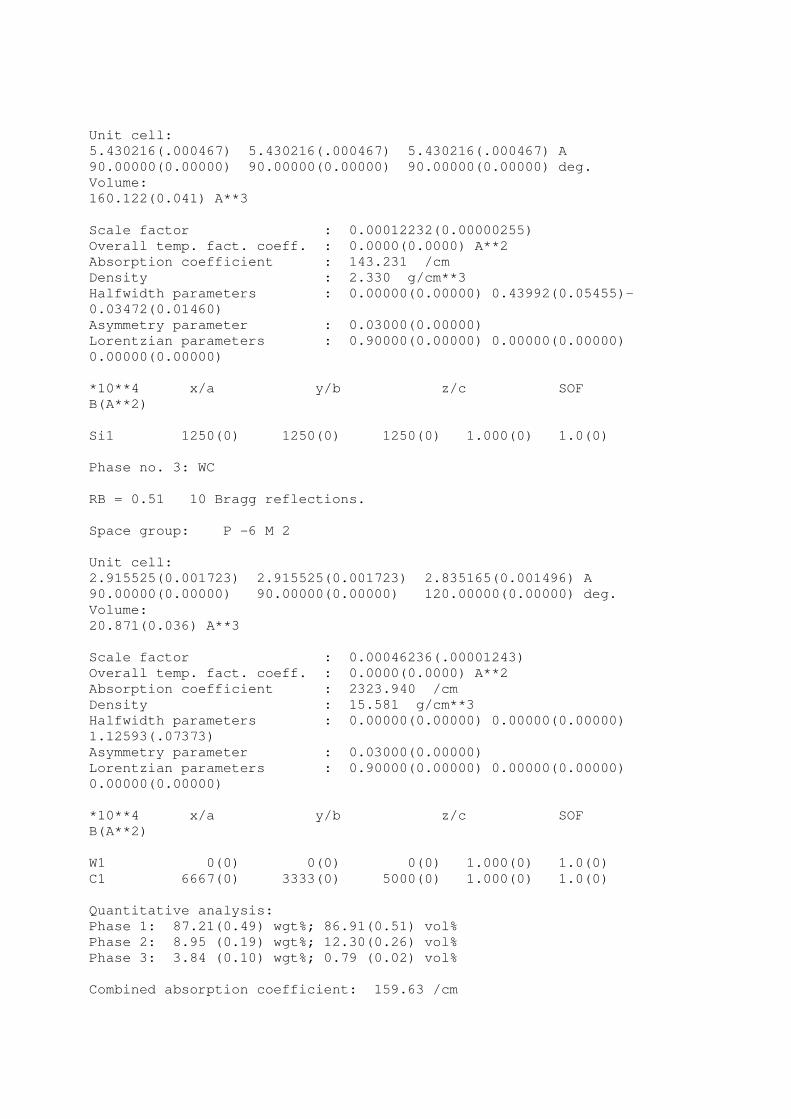
Unit cell:
5.430216(.000467) 5.430216(.000467) 5.430216(.000467) A
90.00000(0.00000) 90.00000(0.00000) 90.00000(0.00000) deg.
Volume:
160.122(0.041) A**3
Scale factor : 0.00012232(0.00000255)
Overall temp. fact. coeff. : 0.0000(0.0000) A**2
Absorption coefficient : 143.231 /cm
Density : 2.330 g/cm**3
Halfwidth parameters : 0.00000(0.00000) 0.43992(0.05455)-
0.03472(0.01460)
Asymmetry parameter : 0.03000(0.00000)
Lorentzian parameters : 0.90000(0.00000) 0.00000(0.00000)
0.00000(0.00000)
*10**4 x/a y/b z/c SOF
B(A**2)
Si1 1250(0) 1250(0) 1250(0) 1.000(0) 1.0(0)
Phase no. 3: WC
RB = 0.51 10 Bragg reflections.
Space group: P -6 M 2
Unit cell:
2.915525(0.001723) 2.915525(0.001723) 2.835165(0.001496) A
90.00000(0.00000) 90.00000(0.00000) 120.00000(0.00000) deg.
Volume:
20.871(0.036) A**3
Scale factor : 0.00046236(.00001243)
Overall temp. fact. coeff. : 0.0000(0.0000) A**2
Absorption coefficient : 2323.940 /cm
Density : 15.581 g/cm**3
Halfwidth parameters : 0.00000(0.00000) 0.00000(0.00000)
1.12593(.07373)
Asymmetry parameter : 0.03000(0.00000)
Lorentzian parameters : 0.90000(0.00000) 0.00000(0.00000)
0.00000(0.00000)
*10**4 x/a y/b z/c SOF
B(A**2)
W1 0(0) 0(0) 0(0) 1.000(0) 1.0(0)
C1 6667(0) 3333(0) 5000(0) 1.000(0) 1.0(0)
Quantitative analysis:
Phase 1: 87.21(0.49) wgt%; 86.91(0.51) vol%
Phase 2: 8.95 (0.19) wgt%; 12.30(0.26) vol%
Phase 3: 3.84 (0.10) wgt%; 0.79 (0.02) vol%
Combined absorption coefficient: 159.63 /cm

Two-theta zero: -0.0272(0.0015)
Background parameters (Chebyshev type i):
493(0) -46(0) 29(0) -11(0) 3(0)
-2(0) 2(0)

190Rietveld Treatment of the XRD Data for the SiC-Si Powder Catalyst
Support
Appendix B
Optimisation of the SEM andEDX Sampling for Supported
IrO2/SiC-Si Catalyst
An additional series of experiments was performed for optimisation the sam-pling of the selected powder catalyst, containing 60% of IrO2 and 40% ofSiC-Si. The main purpose of this series was to determine the effect of thebacking plate material on the EDX powder composition results.
B.1 Sample preparation
The samples for investigation were prepared in a way, described previouslyin Section 5.1.4 with the difference that bother carbon tape and gold backingplates were used for SEM and EDX investigations. All experiments in thisseries were made on a FEI Inspect S microscope. The EDX-system usedwas INCA from Oxford Instruments. The EDX quantitative analysis wasperformed at 5,15 and 20 kV voltages in order to define the difference incomposition data, depending on the penetration volume at different voltages.
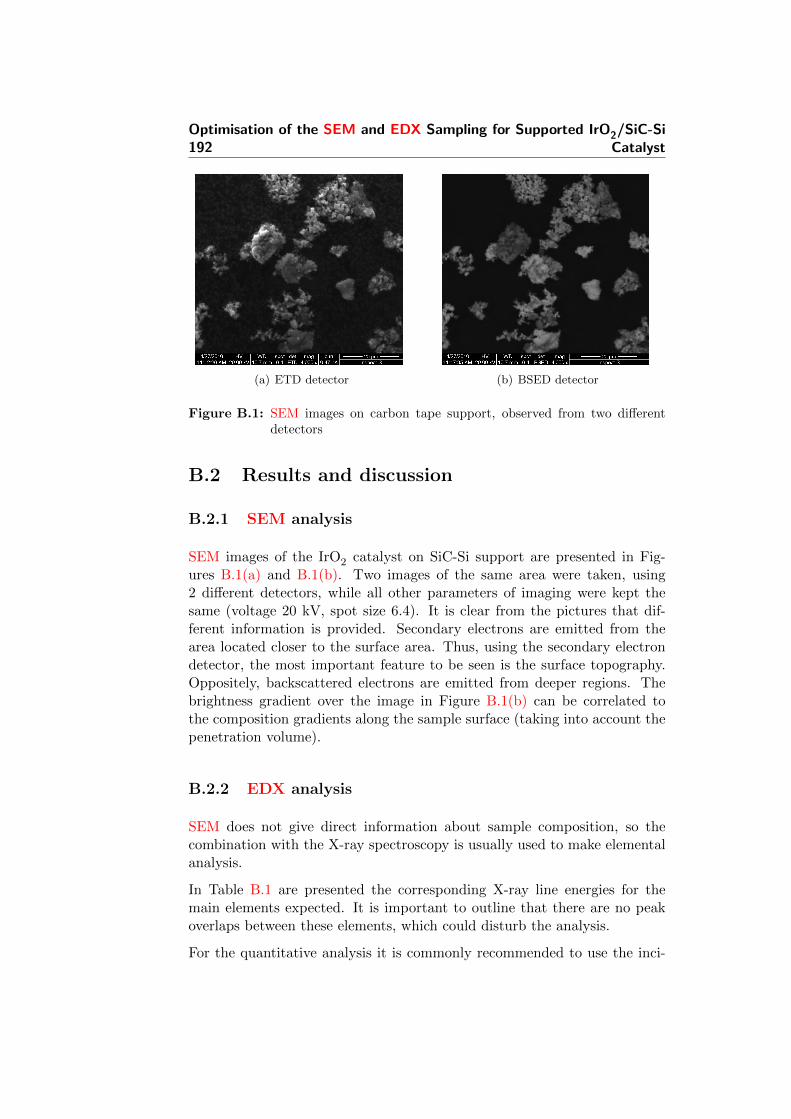
192Optimisation of the SEM and EDX Sampling for Supported IrO2/SiC-Si
Catalyst
(a) ETD detector (b) BSED detector
Figure B.1: SEM images on carbon tape support, observed from two differentdetectors
B.2 Results and discussion
B.2.1 SEM analysis
SEM images of the IrO2 catalyst on SiC-Si support are presented in Fig-ures B.1(a) and B.1(b). Two images of the same area were taken, using2 different detectors, while all other parameters of imaging were kept thesame (voltage 20 kV, spot size 6.4). It is clear from the pictures that dif-ferent information is provided. Secondary electrons are emitted from thearea located closer to the surface area. Thus, using the secondary electrondetector, the most important feature to be seen is the surface topography.Oppositely, backscattered electrons are emitted from deeper regions. Thebrightness gradient over the image in Figure B.1(b) can be correlated tothe composition gradients along the sample surface (taking into account thepenetration volume).
B.2.2 EDX analysis
SEM does not give direct information about sample composition, so thecombination with the X-ray spectroscopy is usually used to make elementalanalysis.
In Table B.1 are presented the corresponding X-ray line energies for themain elements expected. It is important to outline that there are no peakoverlaps between these elements, which could disturb the analysis.
For the quantitative analysis it is commonly recommended to use the inci-
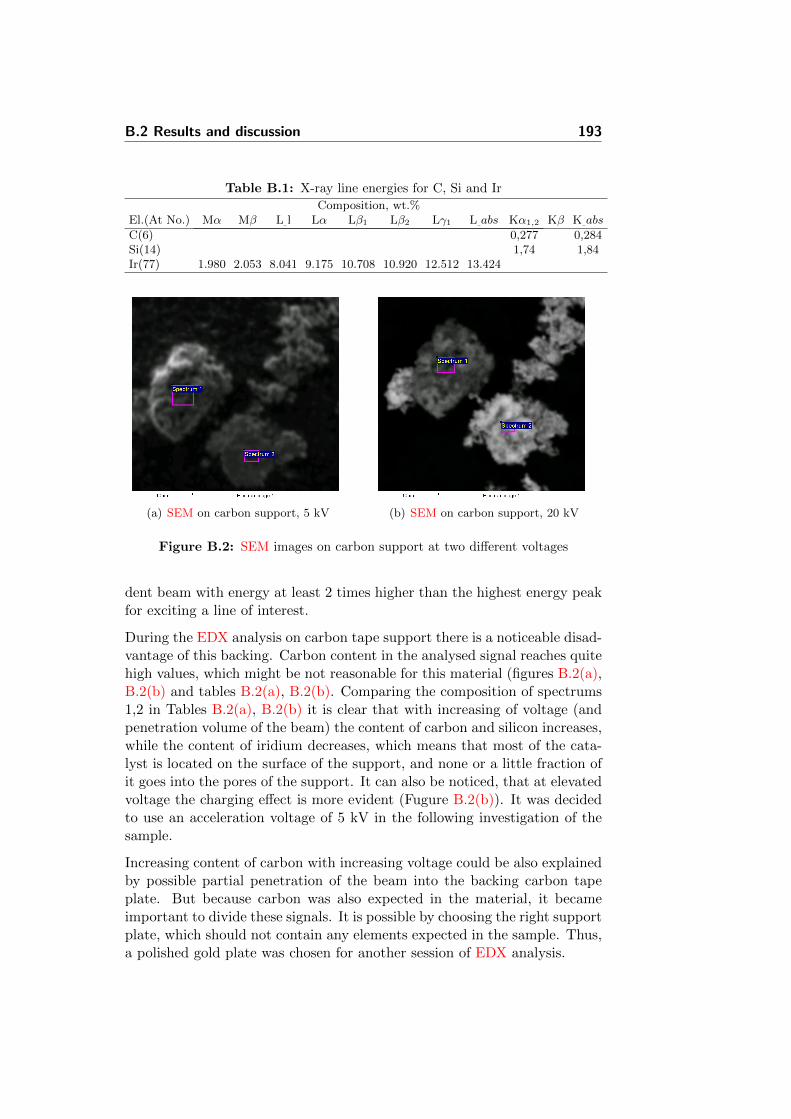
B.2 Results and discussion 193
Table B.1: X-ray line energies for C, Si and Ir
Composition, wt.%El.(At No.) Mα Mβ L l Lα Lβ1 Lβ2 Lγ1 L abs Kα1,2 Kβ K abs
C(6) 0,277 0,284Si(14) 1,74 1,84Ir(77) 1.980 2.053 8.041 9.175 10.708 10.920 12.512 13.424
(a) SEM on carbon support, 5 kV (b) SEM on carbon support, 20 kV
Figure B.2: SEM images on carbon support at two different voltages
dent beam with energy at least 2 times higher than the highest energy peakfor exciting a line of interest.
During the EDX analysis on carbon tape support there is a noticeable disad-vantage of this backing. Carbon content in the analysed signal reaches quitehigh values, which might be not reasonable for this material (figures B.2(a),B.2(b) and tables B.2(a), B.2(b). Comparing the composition of spectrums1,2 in Tables B.2(a), B.2(b) it is clear that with increasing of voltage (andpenetration volume of the beam) the content of carbon and silicon increases,while the content of iridium decreases, which means that most of the cata-lyst is located on the surface of the support, and none or a little fraction ofit goes into the pores of the support. It can also be noticed, that at elevatedvoltage the charging effect is more evident (Fugure B.2(b)). It was decidedto use an acceleration voltage of 5 kV in the following investigation of thesample.
Increasing content of carbon with increasing voltage could be also explainedby possible partial penetration of the beam into the backing carbon tapeplate. But because carbon was also expected in the material, it becameimportant to divide these signals. It is possible by choosing the right supportplate, which should not contain any elements expected in the sample. Thus,a polished gold plate was chosen for another session of EDX analysis.
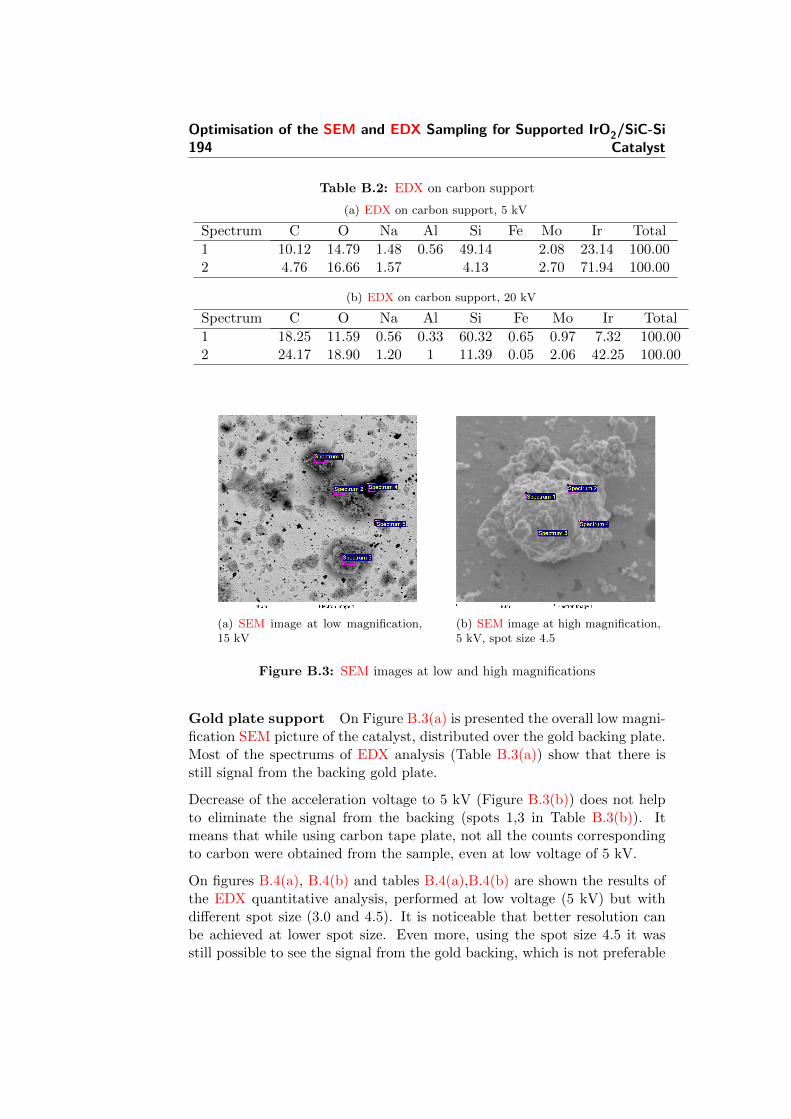
194Optimisation of the SEM and EDX Sampling for Supported IrO2/SiC-Si
Catalyst
Table B.2: EDX on carbon support
(a) EDX on carbon support, 5 kV
Spectrum C O Na Al Si Fe Mo Ir Total
1 10.12 14.79 1.48 0.56 49.14 2.08 23.14 100.002 4.76 16.66 1.57 4.13 2.70 71.94 100.00
(b) EDX on carbon support, 20 kV
Spectrum C O Na Al Si Fe Mo Ir Total
1 18.25 11.59 0.56 0.33 60.32 0.65 0.97 7.32 100.002 24.17 18.90 1.20 1 11.39 0.05 2.06 42.25 100.00
(a) SEM image at low magnification,15 kV
(b) SEM image at high magnification,5 kV, spot size 4.5
Figure B.3: SEM images at low and high magnifications
Gold plate support On Figure B.3(a) is presented the overall low magni-fication SEM picture of the catalyst, distributed over the gold backing plate.Most of the spectrums of EDX analysis (Table B.3(a)) show that there isstill signal from the backing gold plate.
Decrease of the acceleration voltage to 5 kV (Figure B.3(b)) does not helpto eliminate the signal from the backing (spots 1,3 in Table B.3(b)). Itmeans that while using carbon tape plate, not all the counts correspondingto carbon were obtained from the sample, even at low voltage of 5 kV.
On figures B.4(a), B.4(b) and tables B.4(a),B.4(b) are shown the results ofthe EDX quantitative analysis, performed at low voltage (5 kV) but withdifferent spot size (3.0 and 4.5). It is noticeable that better resolution canbe achieved at lower spot size. Even more, using the spot size 4.5 it wasstill possible to see the signal from the gold backing, which is not preferable
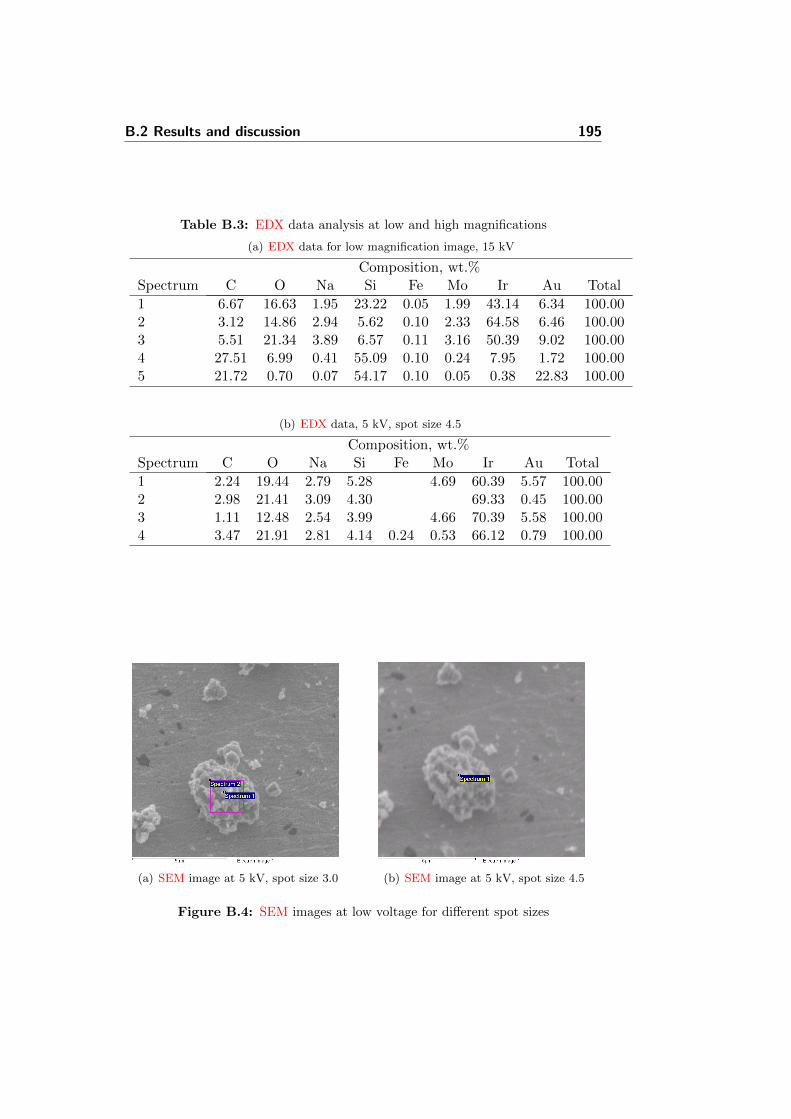
B.2 Results and discussion 195
Table B.3: EDX data analysis at low and high magnifications
(a) EDX data for low magnification image, 15 kV
Composition, wt.%Spectrum C O Na Si Fe Mo Ir Au Total
1 6.67 16.63 1.95 23.22 0.05 1.99 43.14 6.34 100.002 3.12 14.86 2.94 5.62 0.10 2.33 64.58 6.46 100.003 5.51 21.34 3.89 6.57 0.11 3.16 50.39 9.02 100.004 27.51 6.99 0.41 55.09 0.10 0.24 7.95 1.72 100.005 21.72 0.70 0.07 54.17 0.10 0.05 0.38 22.83 100.00
(b) EDX data, 5 kV, spot size 4.5
Composition, wt.%Spectrum C O Na Si Fe Mo Ir Au Total
1 2.24 19.44 2.79 5.28 4.69 60.39 5.57 100.002 2.98 21.41 3.09 4.30 69.33 0.45 100.003 1.11 12.48 2.54 3.99 4.66 70.39 5.58 100.004 3.47 21.91 2.81 4.14 0.24 0.53 66.12 0.79 100.00
(a) SEM image at 5 kV, spot size 3.0 (b) SEM image at 5 kV, spot size 4.5
Figure B.4: SEM images at low voltage for different spot sizes
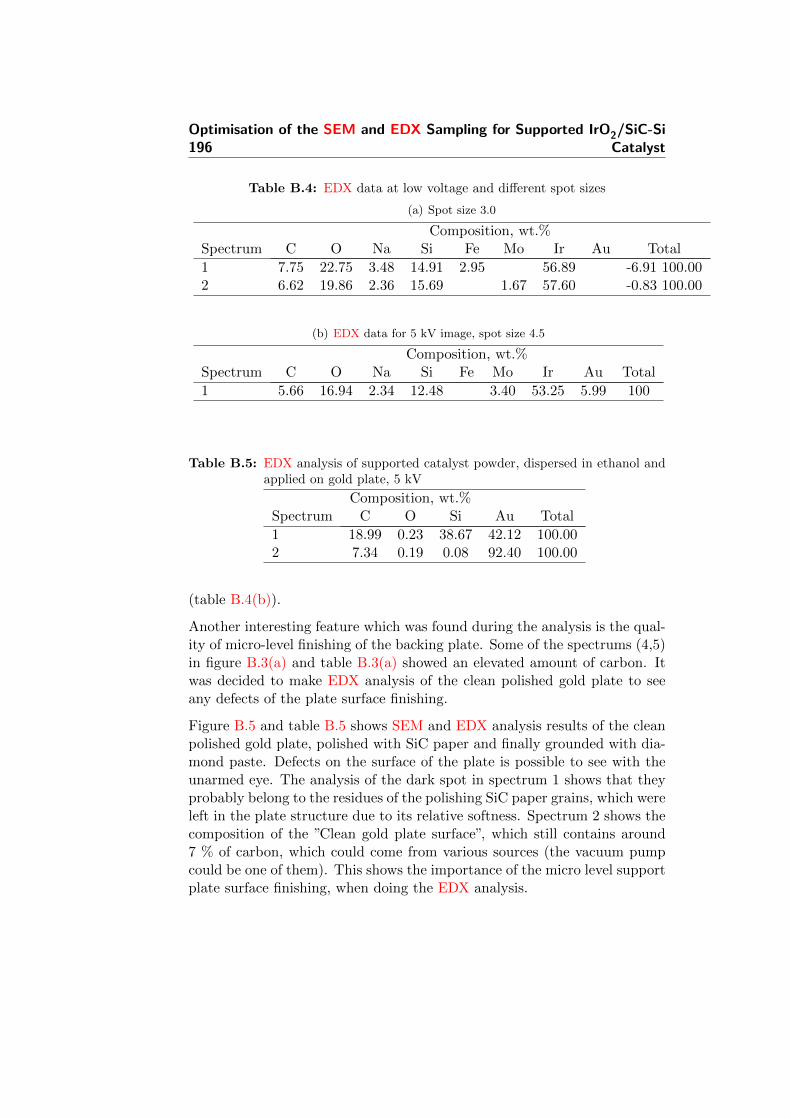
196Optimisation of the SEM and EDX Sampling for Supported IrO2/SiC-Si
Catalyst
Table B.4: EDX data at low voltage and different spot sizes
(a) Spot size 3.0
Composition, wt.%Spectrum C O Na Si Fe Mo Ir Au Total
1 7.75 22.75 3.48 14.91 2.95 56.89 -6.91 100.002 6.62 19.86 2.36 15.69 1.67 57.60 -0.83 100.00
(b) EDX data for 5 kV image, spot size 4.5
Composition, wt.%Spectrum C O Na Si Fe Mo Ir Au Total
1 5.66 16.94 2.34 12.48 3.40 53.25 5.99 100
Table B.5: EDX analysis of supported catalyst powder, dispersed in ethanol andapplied on gold plate, 5 kV
Composition, wt.%Spectrum C O Si Au Total
1 18.99 0.23 38.67 42.12 100.002 7.34 0.19 0.08 92.40 100.00
(table B.4(b)).
Another interesting feature which was found during the analysis is the qual-ity of micro-level finishing of the backing plate. Some of the spectrums (4,5)in figure B.3(a) and table B.3(a) showed an elevated amount of carbon. Itwas decided to make EDX analysis of the clean polished gold plate to seeany defects of the plate surface finishing.
Figure B.5 and table B.5 shows SEM and EDX analysis results of the cleanpolished gold plate, polished with SiC paper and finally grounded with dia-mond paste. Defects on the surface of the plate is possible to see with theunarmed eye. The analysis of the dark spot in spectrum 1 shows that theyprobably belong to the residues of the polishing SiC paper grains, which wereleft in the plate structure due to its relative softness. Spectrum 2 shows thecomposition of the ”Clean gold plate surface”, which still contains around7 % of carbon, which could come from various sources (the vacuum pumpcould be one of them). This shows the importance of the micro level supportplate surface finishing, when doing the EDX analysis.
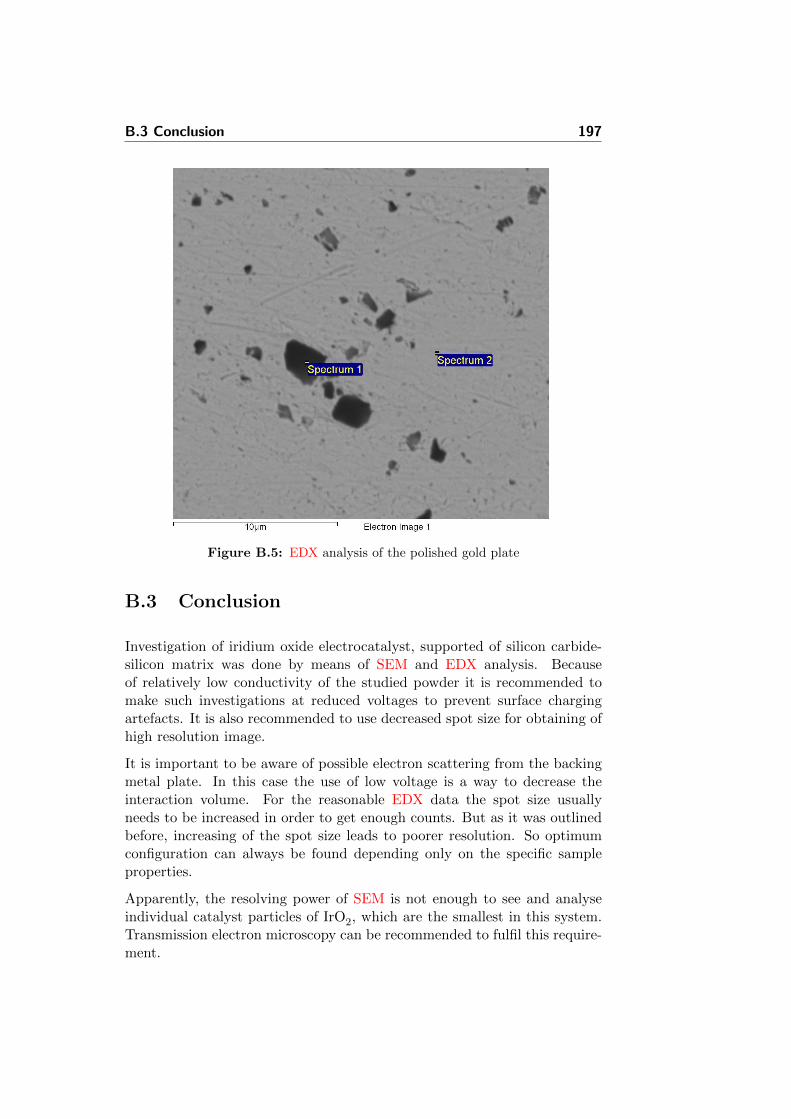
B.3 Conclusion 197
Figure B.5: EDX analysis of the polished gold plate
B.3 Conclusion
Investigation of iridium oxide electrocatalyst, supported of silicon carbide-silicon matrix was done by means of SEM and EDX analysis. Becauseof relatively low conductivity of the studied powder it is recommended tomake such investigations at reduced voltages to prevent surface chargingartefacts. It is also recommended to use decreased spot size for obtaining ofhigh resolution image.
It is important to be aware of possible electron scattering from the backingmetal plate. In this case the use of low voltage is a way to decrease theinteraction volume. For the reasonable EDX data the spot size usuallyneeds to be increased in order to get enough counts. But as it was outlinedbefore, increasing of the spot size leads to poorer resolution. So optimumconfiguration can always be found depending only on the specific sampleproperties.
Apparently, the resolving power of SEM is not enough to see and analyseindividual catalyst particles of IrO2, which are the smallest in this system.Transmission electron microscopy can be recommended to fulfil this require-ment.

198Optimisation of the SEM and EDX Sampling for Supported IrO2/SiC-Si
Catalyst
It was found that the catalyst is distributed evenly over its surface of thecatalyst support. In the case of using a gold plate as a sample holder, itwas found that the surface of it was not analytically clean and containedparticles of the grinding material, which apparently also had an influence onthe quality of the quantitative EDX analysis.


www.energi.kemi.dtu.dk
Department of ChemistryEnergy and Materials Science groupTechnical University of DenmarkKemitorvetBuilding 207DK-2800 Kgs. LyngbyDenmarkTel: (+45) 45 25 24 19Email: [email protected]