new biological targets for ckd- mbd: from the to the kdoqi · new kdigo target y4.1.1. in patients...
TRANSCRIPT

Guillaume JEAN, MD.Centre de Rein Artificiel, 42 avenue du 8 mai 1945,Tassin la Demi-Lune, France.
E-mail : [email protected]
New biological targets for CKDNew biological targets for CKD--MBD:MBD:From the to the From the to the KDOQI KDIGO

IntroductionIntroductionFrom 2003 to 2009 the recommendations were the Kidney Disease: Outcomes Quality Improvement (KDOQI) for mineral metabolism abnormalities.Biological targets and therapeutic strategies have been defined precisely and were used by nephrologists and in all clinical trials and observatories.In 2009, the new recommendations were released with the Kidney Disease: Improving Global Outcomes (KDIGO).

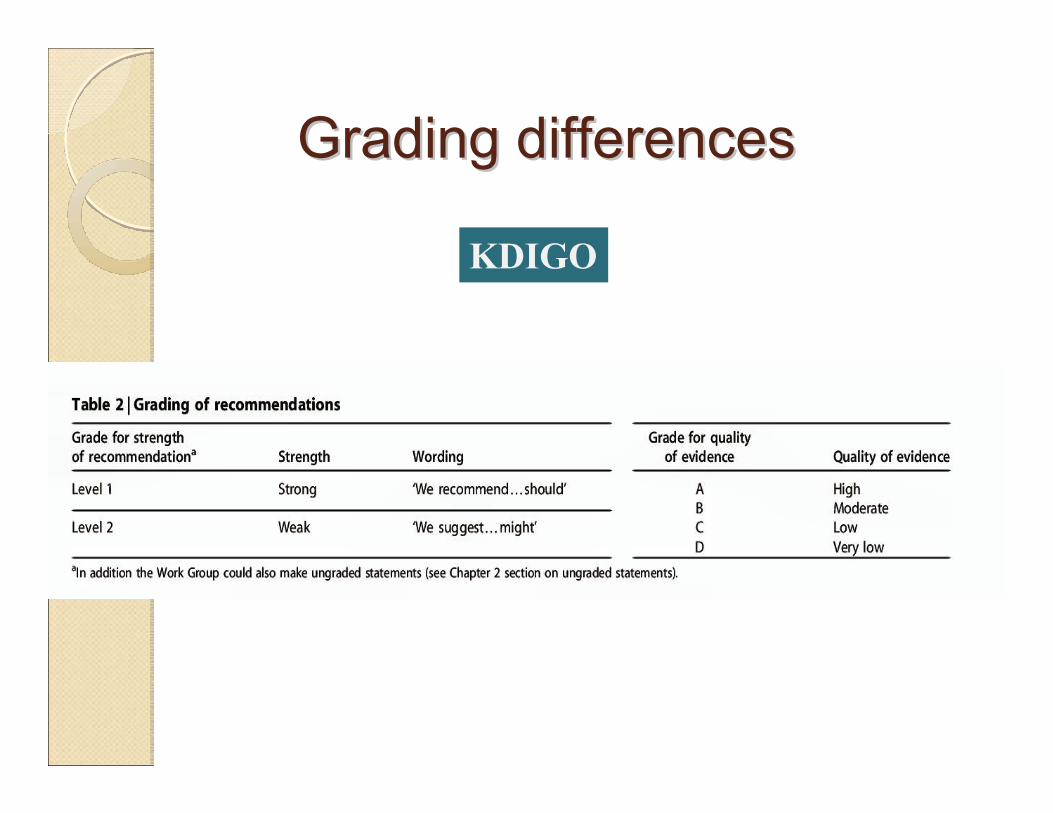
Grading differencesGrading differences
KDIGO

Highest quality● Randomized controlled trials● Matched controlled trials● Prospective nonrandomized/nonmatchedcontrolled trials● Retrospective nonrandomized/nonmatchedcontrolled trials
KDOQI
KDIGO
Grading evidenceGrading evidence
NEW TARGET FOR NEW TARGET FOR PHOSPHATAEMIAPHOSPHATAEMIA

New KDIGO targetNew KDIGO target4.1.1. In patients with CKD stages 3–5, we suggest maintaining serum phosphorus in the normal range (2C).In patients with CKD stage 5D, we suggest lowering elevated phosphorus levels toward the normal range (2C).
KDIGO
Normal values for phosphaetamia0,81 – 1,45 mmol/l (2,5 – 4,5 mg/dl)

Adapted from Block GA, et al. Am J Kidney Dis. 1998;31:607-617.
1.00
1.25
1.50
0.4 - 1.5 1.5 - 1.8 1.8 - 2.1 2.1 - 2.5 2.5 - 5.4
Phosphorémie (mmol/l)
Ris
que
Rel
atif
de M
orta
lité
(RR
)
+2 %
+18 %
+39 %
Phosphorémie
mmol/l
EVIDENCE ?EVIDENCE ?
KDOQI

Observational data in the USA Observational data in the USA
GA Block et al. J Am Soc Nephrol 2004,15:2208.
2,5 mmol/L
KDIGO
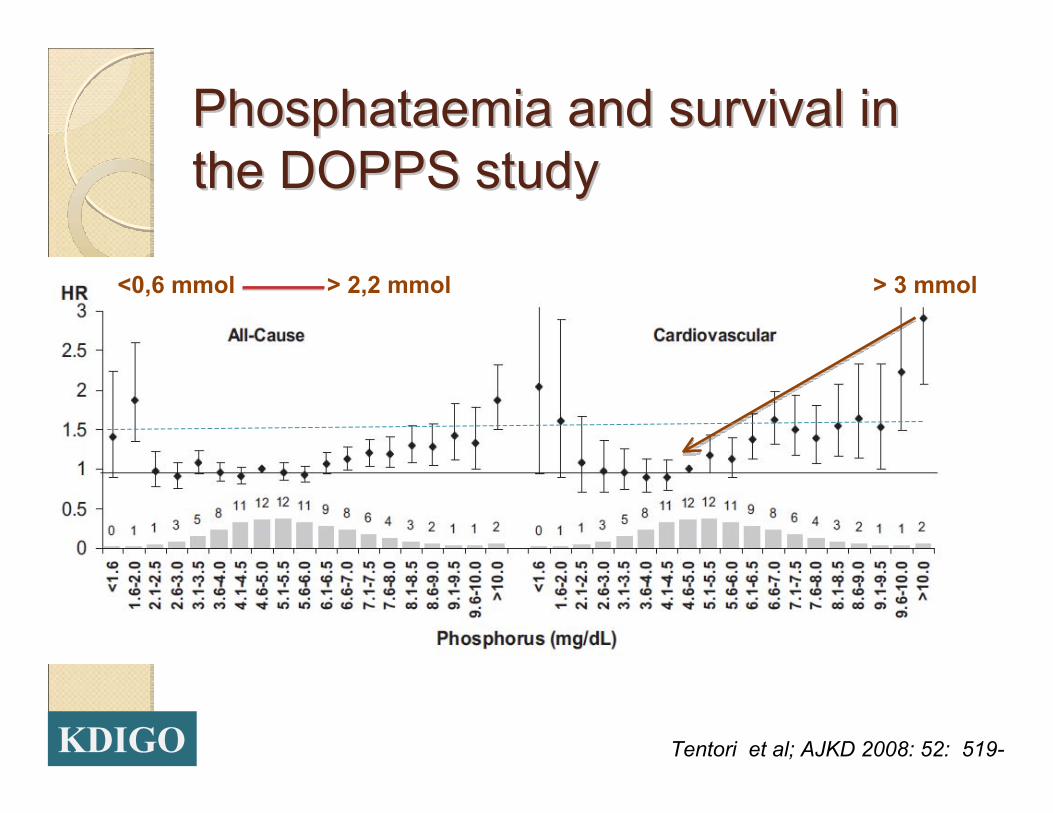
Phosphataemia and survival in Phosphataemia and survival in the DOPPS studythe DOPPS study
Tentori et al; AJKD 2008: 52: 519-
<0,6 mmol > 2,2 mmol > 3 mmol
KDIGO
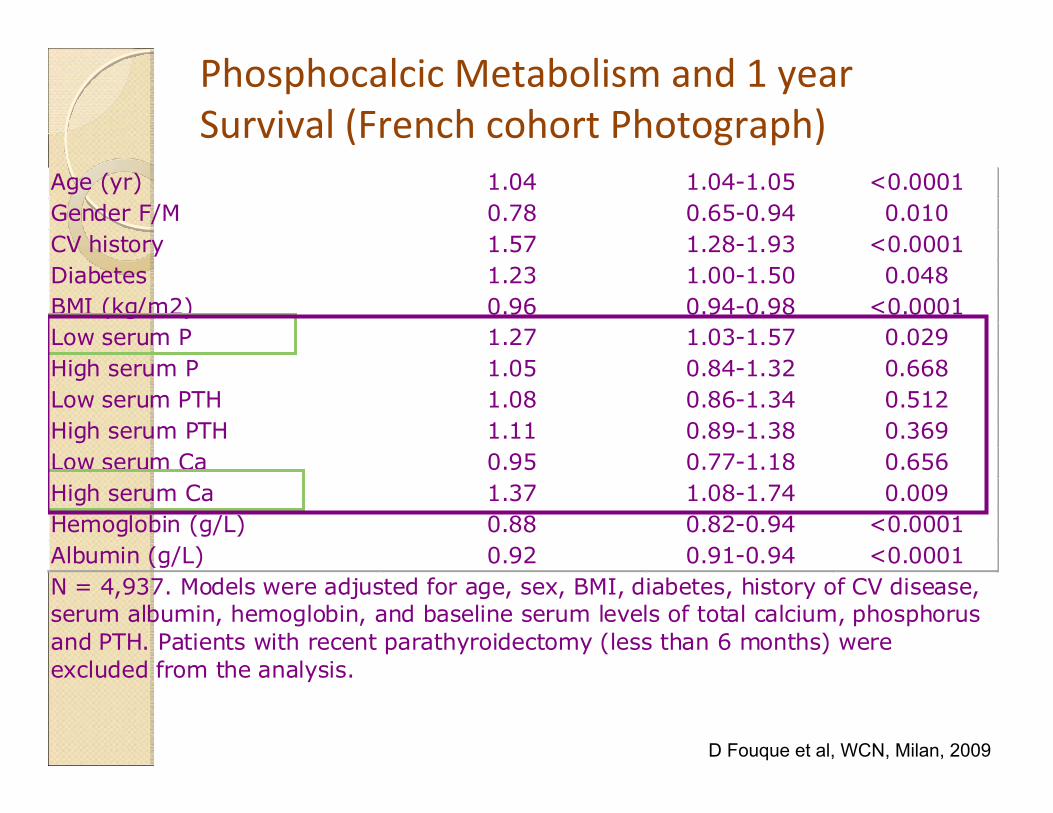
Phosphocalcic Metabolism and 1 year Survival (French cohort Photograph)
D Fouque et al, WCN, Milan, 2009
Age (yr) 1.04 1.04-1.05 <0.0001 Gender F/M 0.78 0.65-0.94 0.010 CV history 1.57 1.28-1.93 <0.0001 Diabetes 1.23 1.00-1.50 0.048 BMI (kg/m2) 0.96 0.94-0.98 <0.0001 Low serum P 1.27 1.03-1.57 0.029 High serum P 1.05 0.84-1.32 0.668 Low serum PTH 1.08 0.86-1.34 0.512 High serum PTH 1.11 0.89-1.38 0.369 Low serum Ca 0.95 0.77-1.18 0.656 High serum Ca 1.37 1.08-1.74 0.009 Hemoglobin (g/L) 0.88 0.82-0.94 <0.0001 Albumin (g/L) 0.92 0.91-0.94 <0.0001 N = 4,937. Models were adjusted for age, sex, BMI, diabetes, history of CV disease, serum albumin, hemoglobin, and baseline serum levels of total calcium, phosphorus and PTH. Patients with recent parathyroidectomy (less than 6 months) were excluded from the analysis.

Causes of hyperphosphataemia:Causes of hyperphosphataemia:
Excess protein intake (> 1,2 g/kg/j)
Excess phosphate intake (> 1000 mg/j)
Inadequate dialysis removal : time, frequency, efficiency
Inadequate phosphate binding: timing, dosage, side effects, compliance
Excess active vitamin D (+ adynamic bone disease)
Secondary hyperparathyroidismGA. Block et al, Am J Kidney Dis 2000,35:1226.
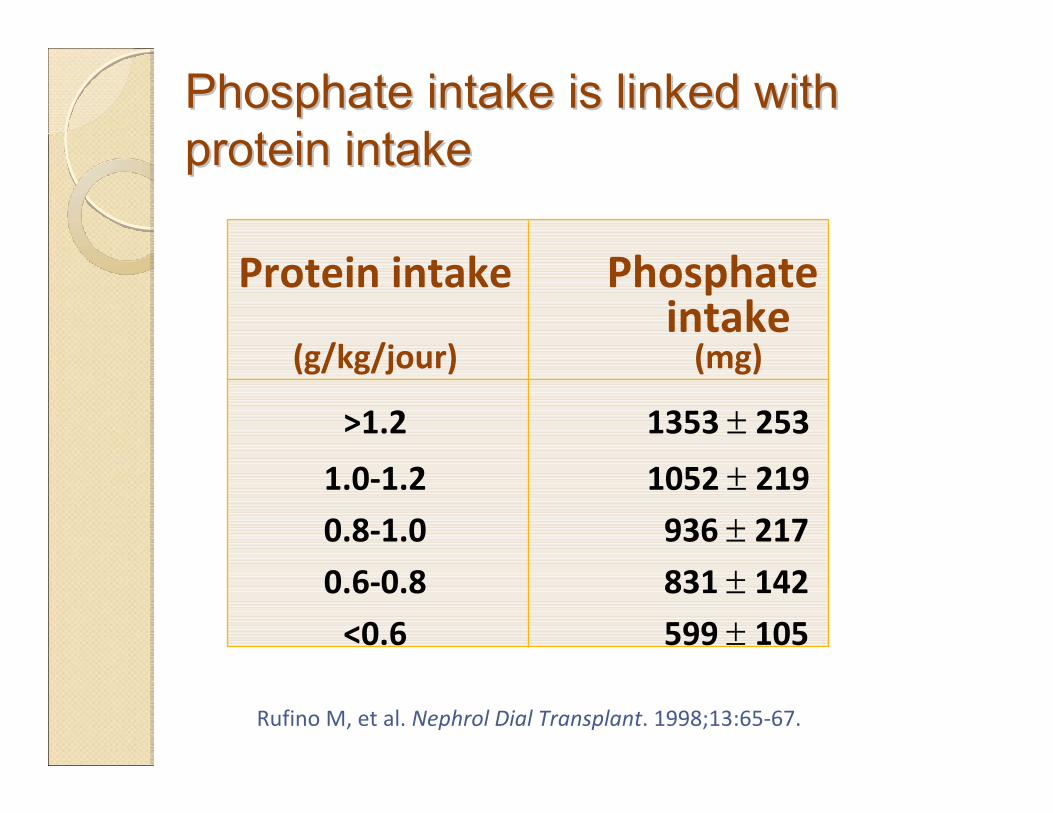
Phosphate intake is linked with Phosphate intake is linked with protein intakeprotein intake
Protein intake Phosphate intake
(g/kg/jour) (mg)
>1.2 1353 ± 253
1.0‐1.2 1052 ± 219
0.8‐1.0 936 ± 217
0.6‐0.8 831 ± 142
<0.6 599 ± 105
Rufino M, et al. Nephrol Dial Transplant. 1998;13:65‐67.

The amount of phosphorus removal The amount of phosphorus removal depends on clearance, frequency and depends on clearance, frequency and treatment time.treatment time.
Gotch et al;Blood Purif 2003, 21:51-57.

Achieving the old target Achieving the old target
0 1 2 3
60
50
40
30
20
10
0
Ph KDOQI
Rel
ativ
e fre
quen
cy (%
) 54%29%
16%
1,13 1,78 mmol/L
KDOQI
ARNOS Rhône-Alpes, D. Fouque et al, 2005
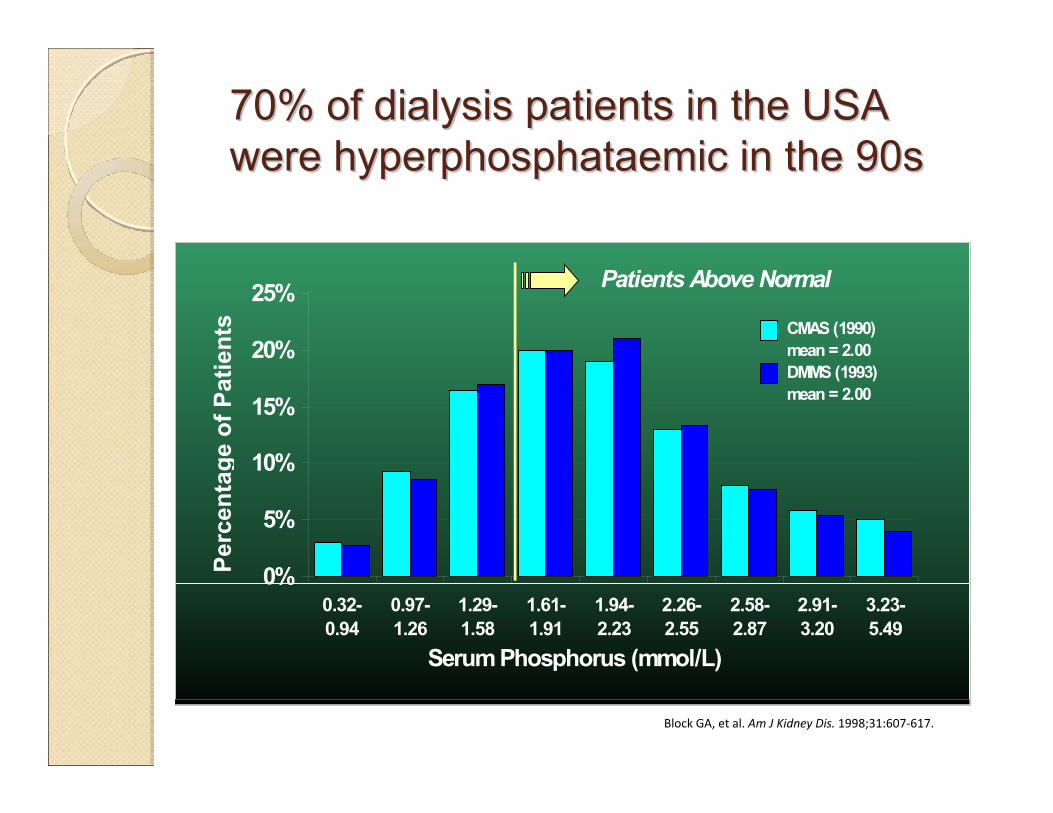
70% of dialysis patients in the USA 70% of dialysis patients in the USA were hyperphosphataemic in the 90swere hyperphosphataemic in the 90s
Block GA, et al. Am J Kidney Dis. 1998;31:607‐617.
0%
5%
10%
15%
20%
25%
0.32-0.94
0.97-1.26
1.29-1.58
1.61-1.91
1.94-2.23
2.26-2.55
2.58-2.87
2.91-3.20
3.23-5.49
CMAS (1990) mean = 2.00DMMS (1993) mean = 2.00
Serum Phosphorus (mmol/L)
Perc
enta
ge o
f Pat
ient
s
Patients Above Normal
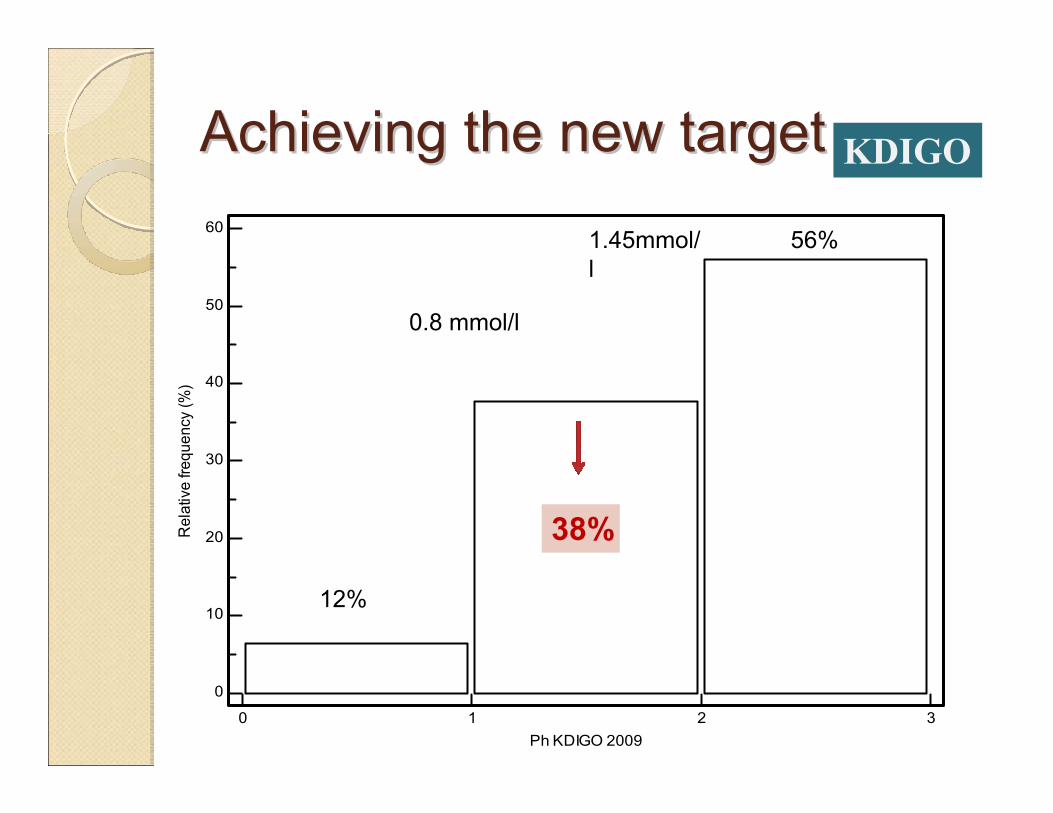
Achieving the new targetAchieving the new target
0 1 2 3
60
50
40
30
20
10
0
Ph KDIGO 2009
Rel
ativ
e fre
quen
cy (%
)
38%
56%
12%
0.8 mmol/l
1.45mmol/l
KDIGO
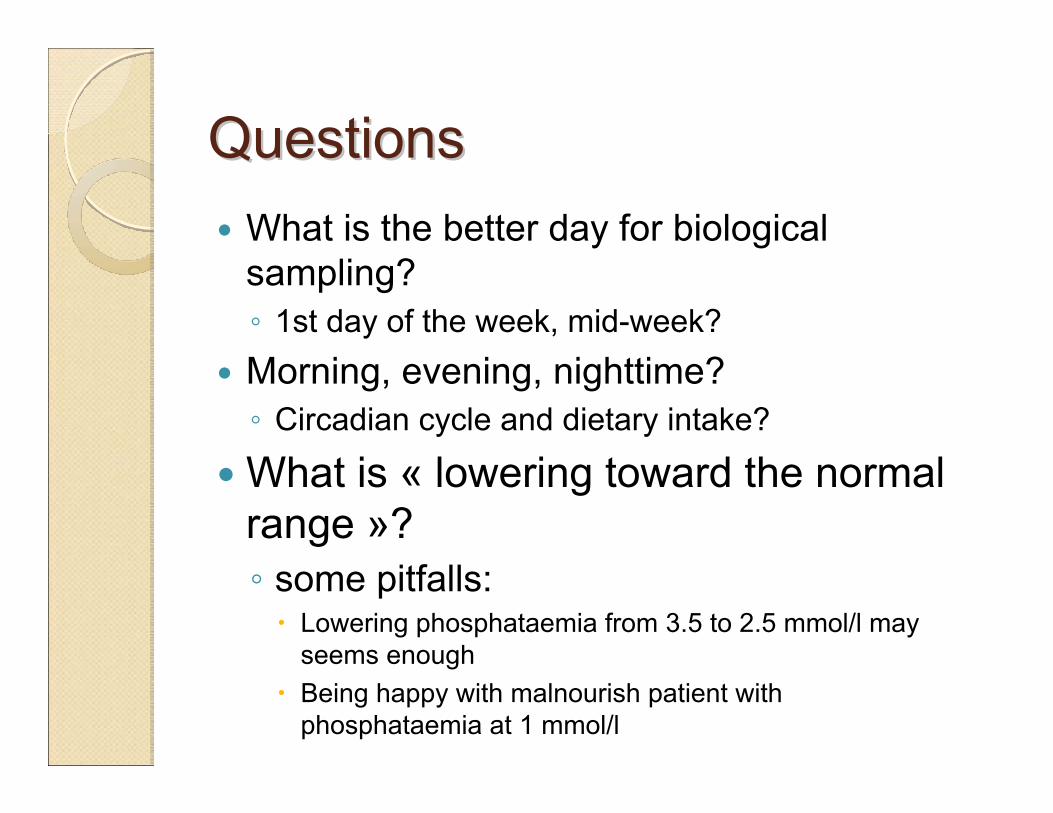
QuestionsQuestionsWhat is the better day for biological sampling?◦ 1st day of the week, mid-week?Morning, evening, nighttime?◦ Circadian cycle and dietary intake?
What is « lowering toward the normal range »? ◦ some pitfalls:
Lowering phosphataemia from 3.5 to 2.5 mmol/l may seems enoughBeing happy with malnourish patient with phosphataemia at 1 mmol/l

NormalNormal phosphataemiaphosphataemia??Case n°1 Case n°2 Case n°3
Phosphataemia mmol
1,1 1,1 1,1
Calcaemia mmol/l 2.45 2.45 2.45Albumin g/l 29 42 38PTH pg/ml 89 289 156B-ALP µg/l 8 18 13nPCR g/kg/j 0.7 1.5 1.2Kt/V 1.2 1.7 2.7 Session time 3 x 4h 3 x 4h 3 x 8 hCaco3 mg/j 0 4500 0Alfacalcidol µg/s 0 3 0BMI kg/m² 19 29 23Age years 82 49 65

Conclusion on phosphataemia Conclusion on phosphataemia targettarget
(Tend to)…normalizing phosphataemia would help (theoretically) in decreasing CV mortality (calcification), but this is not based on any data.Normalizing phosphataemia needs to:◦ Decrease protein intake◦ Increase phosphate binder dosage◦ Increase dialysis (time/frequency)◦ Increase medical cost, limited by compliance
Post-dialysis hypophosphataemia (< 0.5 mmol/l) may be harmful (neuromuscular, osteomalacia)

NEW PTH TARGETNEW PTH TARGET


High turnover for PTH 150-200 pg/ml

Low turnover for PTH < 60 pg/ml

PTHPTH and and « The optimal target level of PTHi in CKD is not know due to limitation of data available and the emerging consensus that those target levels may be lower than currently thought »“PTHi diagnose adynamic bone disease when < 60 pg/ml and high turnover bone disease when > 150-200 pg/ml”Eknoyan, AJKD 2003
KDOQI
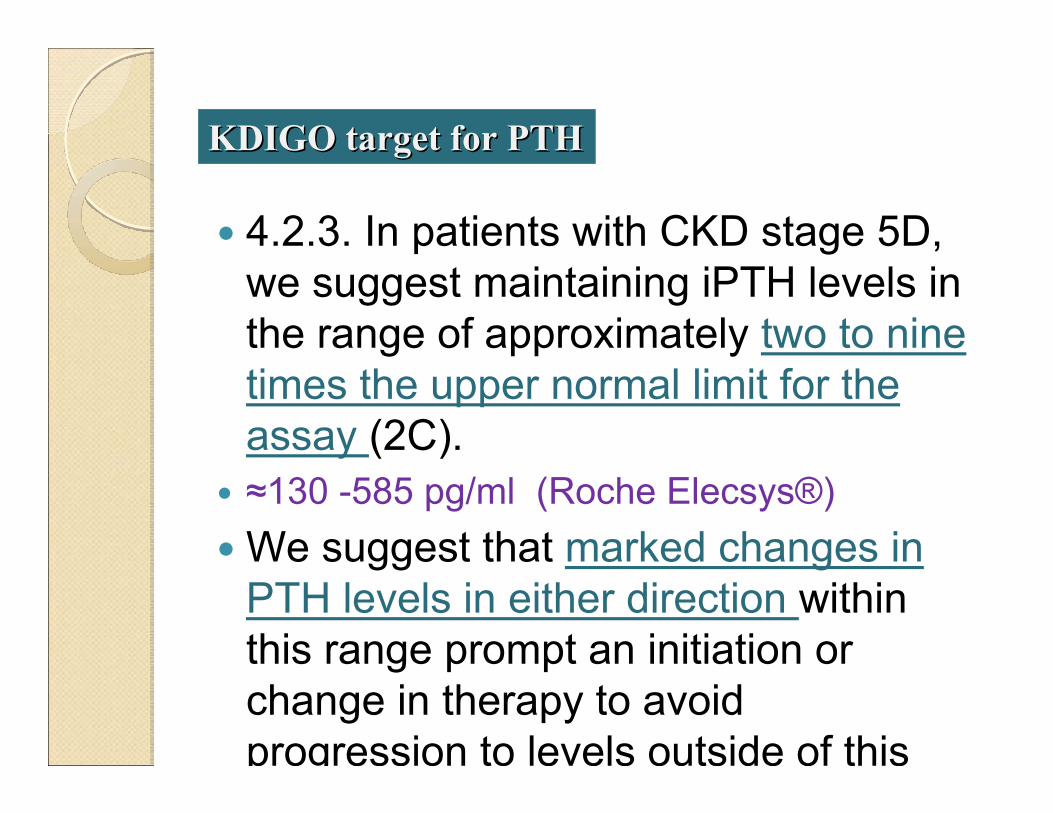
4.2.3. In patients with CKD stage 5D, we suggest maintaining iPTH levels in the range of approximately two to nine times the upper normal limit for the assay (2C).≈130 -585 pg/ml (Roche Elecsys®)We suggest that marked changes in PTH levels in either direction within this range prompt an initiation or change in therapy to avoid progression to levels outside of this
KDIGO target for PTHKDIGO target for PTH

KDIGO: relationship between PTH levels and KDIGO: relationship between PTH levels and the risk for fracturesthe risk for fractures

KDIGO: relationship between PTH levels, Bone KDIGO: relationship between PTH levels, Bone ALP and bone turnoverALP and bone turnover
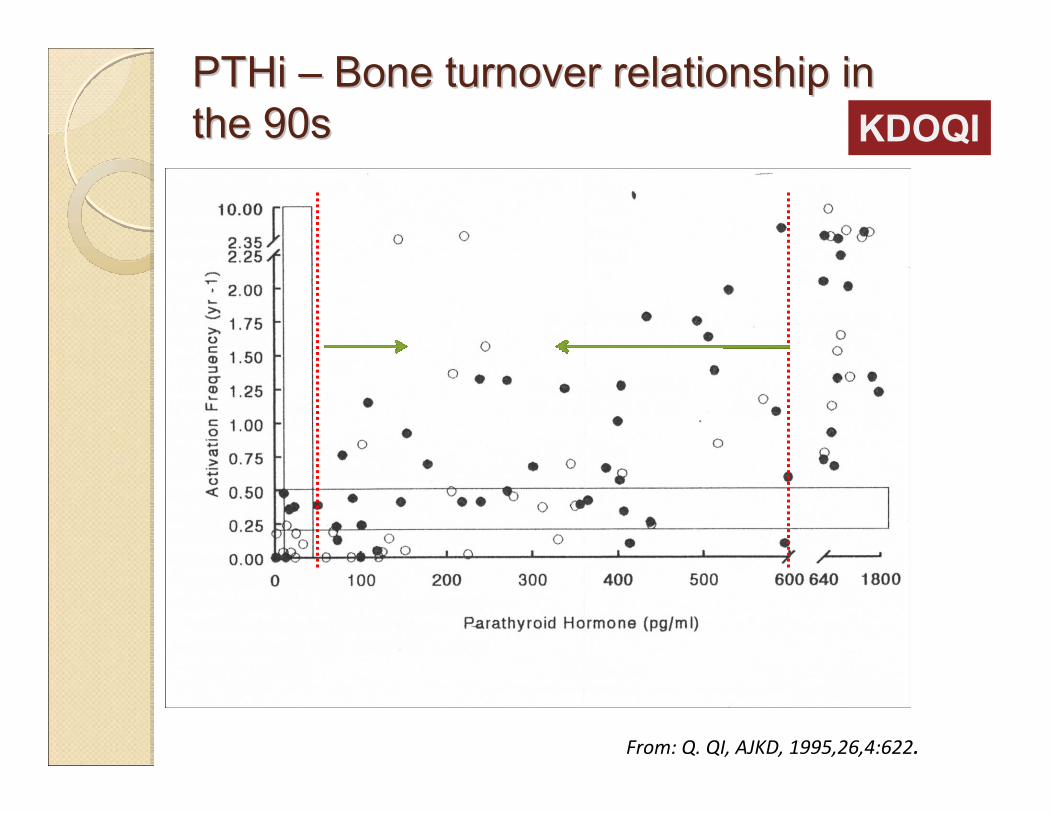
PTHi PTHi –– Bone turnover relationship in Bone turnover relationship in the 90sthe 90s
From: Q. QI, AJKD, 1995,26,4:622.
KDOQI
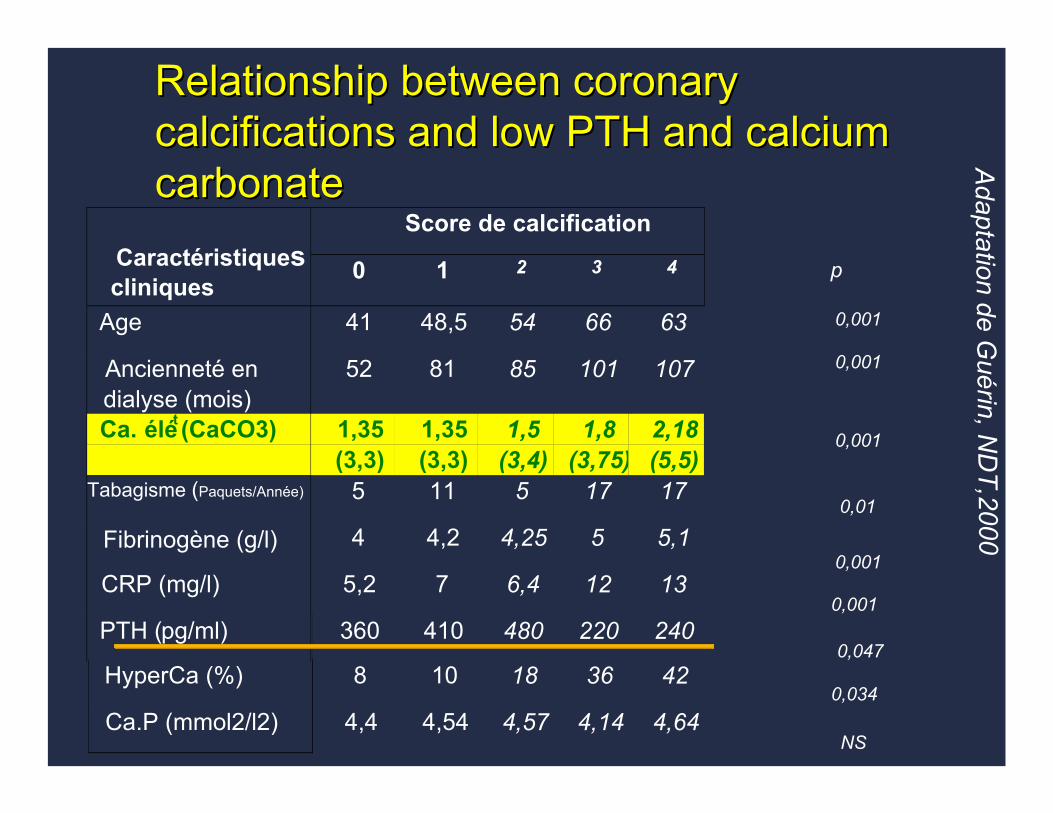
Relationship between coronary Relationship between coronary calcifications and low PTH and calcium calcifications and low PTH and calcium carbonatecarbonate
Score de calcificationCaractéristiquescliniques
0 1 2 3 4
Age 41 48,5 54 66 63
Ancienneté endialyse (mois)
52 81 85 101 107
Ca. élét (CaCO3) 1,35(3,3)
1,35(3,3)
1,5(3,4)
1,8(3,75)
2,18(5,5)
Tabagisme (Paquets/Année) 5 11 5 17 17
Fibrinogène (g/l) 4 4,2 4,25 5 5,1
CRP (mg/l) 5,2 7 6,4 12 13
PTH (pg/ml) 360 410 480 220 240
HyperCa (%) 8 10 18 36 42
Ca.P (mmol2/l2) 4,4 4,54 4,57 4,14 4,64
0,001
0,001
0,001
0,047
0,034
NS
0,001
0,001
0,01
p
Adaptation de G
uérin, ND
T,2000
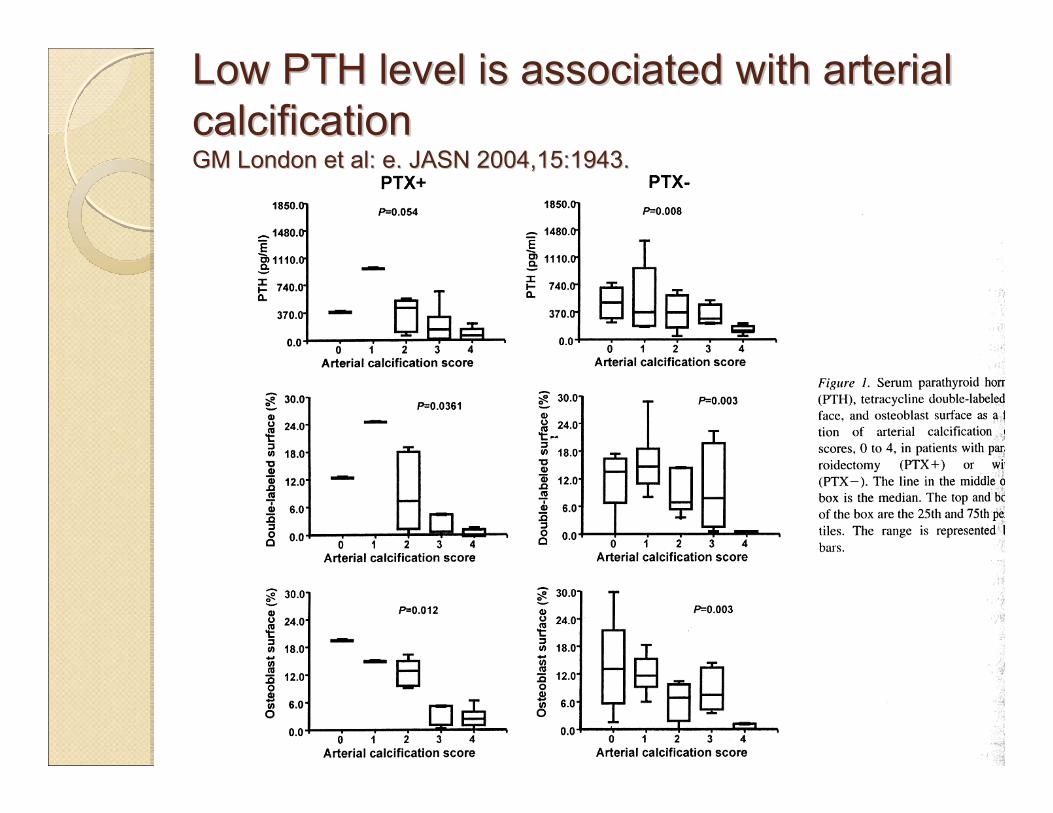
Low PTH level is associated with arterial Low PTH level is associated with arterial calcificationcalcificationGM London et al: e. JASN 2004,15:1943.GM London et al: e. JASN 2004,15:1943.

KDIGO: bone disease according to CKD KDIGO: bone disease according to CKD stage and treatment stage and treatment
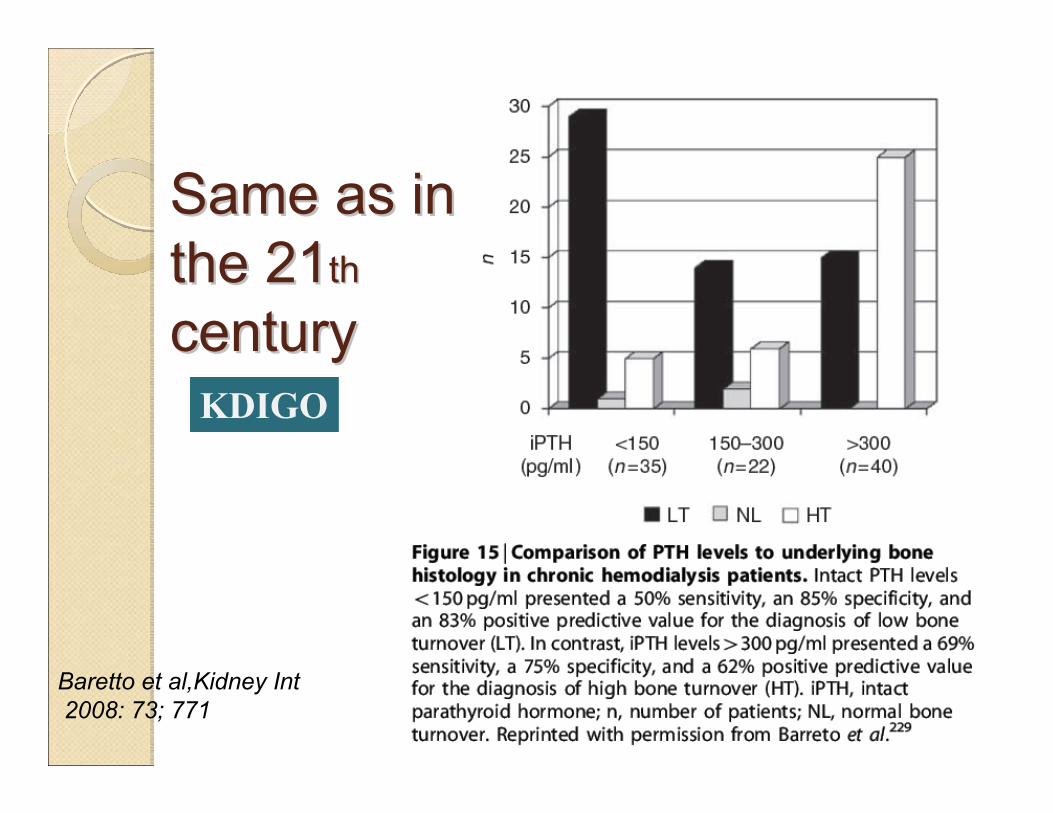
Same as in Same as in the 21the 21thth
centurycentury
Baretto et al,Kidney Int2008: 73; 771
KDIGO
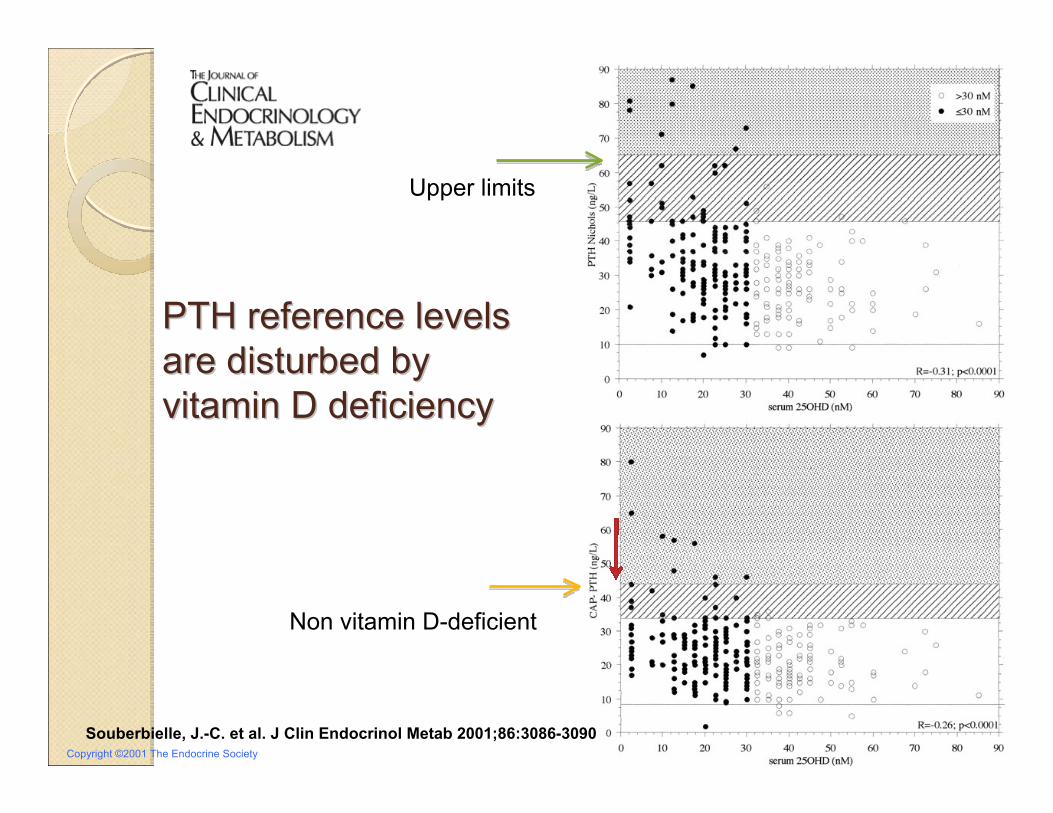
Copyright ©2001 The Endocrine Society
Souberbielle, J.-C. et al. J Clin Endocrinol Metab 2001;86:3086-3090
PTH reference levels PTH reference levels are disturbed by are disturbed by vitamin D deficiencyvitamin D deficiency
Upper limits
Non vitamin D-deficient

What is What is your PTH your PTH assay?assay?
Souberbielle JC, et al;Kidney Int2006;70:345-350
KDIGO

PTH level of 300 pg/ml can be PTH level of 300 pg/ml can be associated with different bone associated with different bone turnoverturnover
Calcaemia
mmol/l
Phosph
mmol/l
PTH
pg/ml
25(OH)D
nmol/l
B‐ALP
µg/l
Mild SHPT 2,15 1,7 300 12 27
Adynamic BD 2,5 1,4 300 28 7
Severe HPT 2,6 2 300 39 65

Case N° 1 T0 3 mths 6 mths Lowering BT
treatment
PTH pg/ml 878 478 300
Calcaemia mmol/l 2,36 2,45 2,5↓
Phosphataemia mmol/l 1,6 1,7 1,8
ALP total UI/ l 120 87 55
Case N° 2
PTH pg/ml 69 187 300
Calcaemia mmol/l 2,5 2,45 2,29↑
Phosphataemia mmol/l 1,9 1,7 1,5
ALP total UI/ l 20 78 159
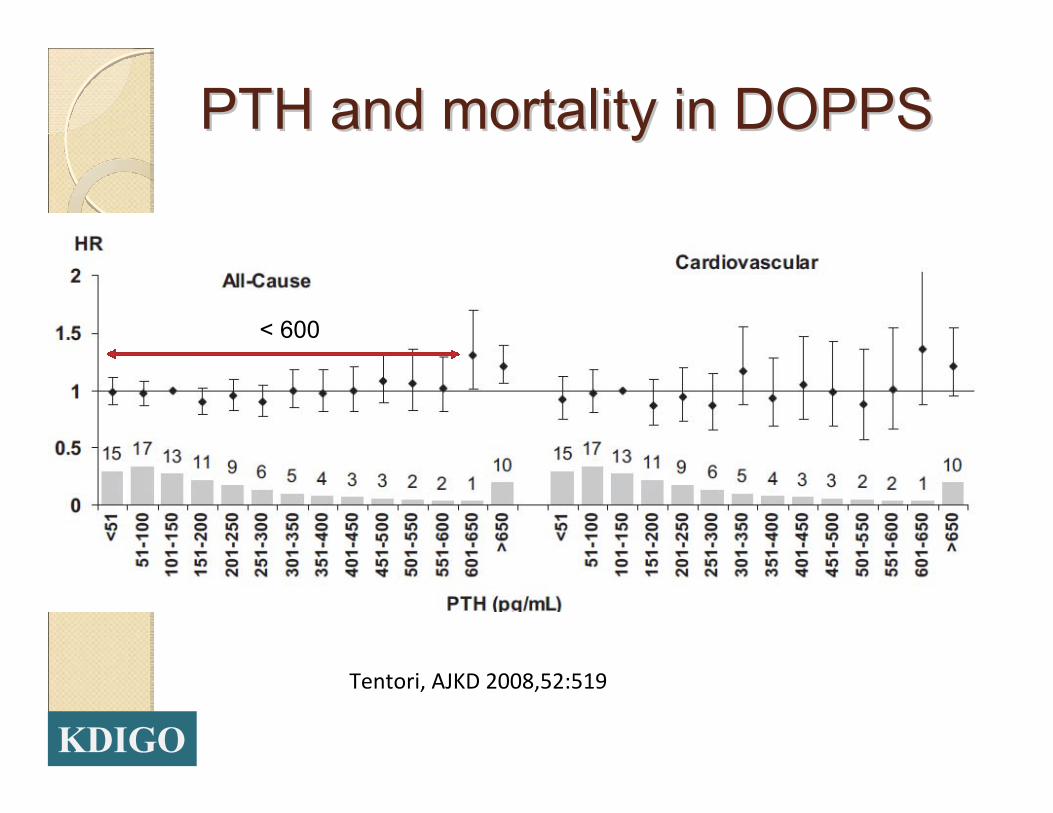
PTH and mortality in DOPPSPTH and mortality in DOPPS
Tentori, AJKD 2008,52:519
< 600
KDIGO

PTH and survival in the USAPTH and survival in the USAKalantar-Zadeh et al; Kidney Int 2006.70:771
200-400

Impact of the PTH target in a French Impact of the PTH target in a French populationpopulation
0 100 200 300 400 500 600 700 800 900 10001100 120013001400 15001600
30
25
20
15
10
5
0
PTH pg/ml
Rel
ativ
e fre
quen
cy (%
)
268 ± 293 pg/ml
50 %KDOQI 30% KDIGO
ARNOS Rhône-Alpes, D. Fouque et al, 2005
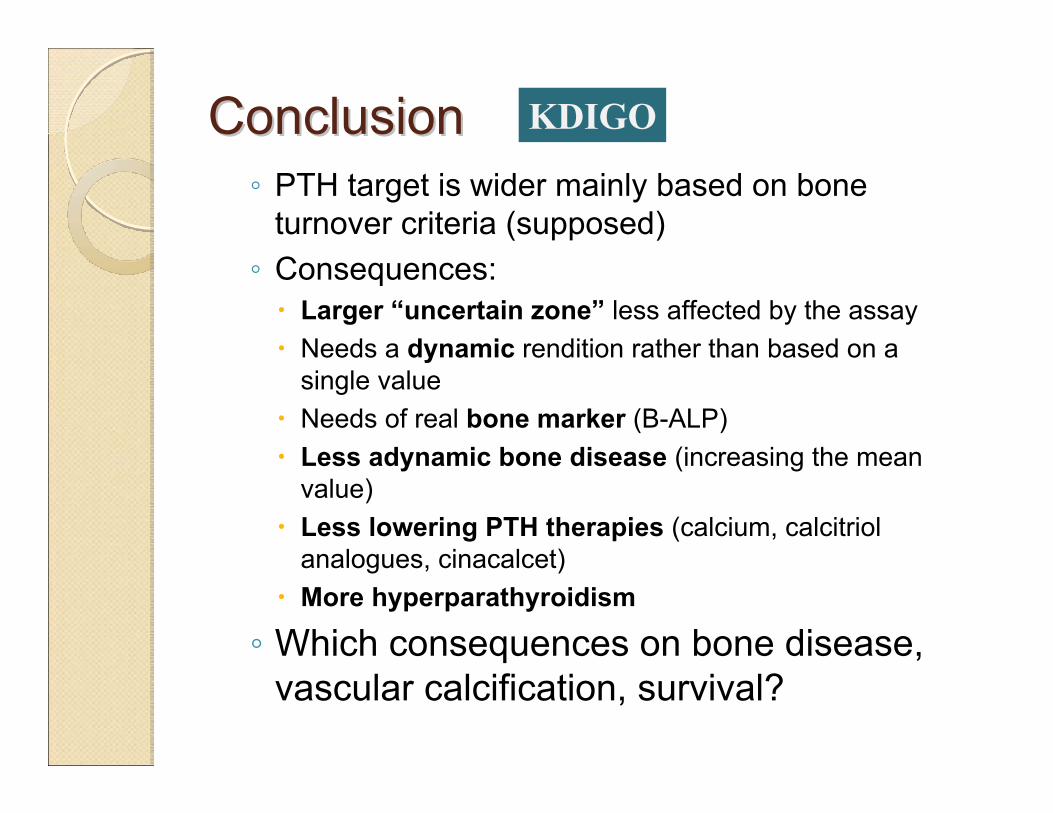
ConclusionConclusion◦ PTH target is wider mainly based on bone
turnover criteria (supposed)◦ Consequences:
Larger “uncertain zone” less affected by the assayNeeds a dynamic rendition rather than based on a single valueNeeds of real bone marker (B-ALP)Less adynamic bone disease (increasing the mean value)Less lowering PTH therapies (calcium, calcitriol analogues, cinacalcet)More hyperparathyroidism
◦ Which consequences on bone disease, vascular calcification, survival?
KDIGO

NEW CALCIUM TARGETNEW CALCIUM TARGET

Evolution of Evolution of recommendationsrecommendations
2003: Total corrected calcium must be maintained within the normal range for the laboratory (EVIDENCE) preferably toward the lower end (8.4 to 9.5 mg/dL [2.10 to 2.37 mmol/L]). (OPINION)
2009: In CKD stage 3-5D, we suggest maintaining serum calcium in the normal range (2D, very low evidence).
KDOQI
KDIGO
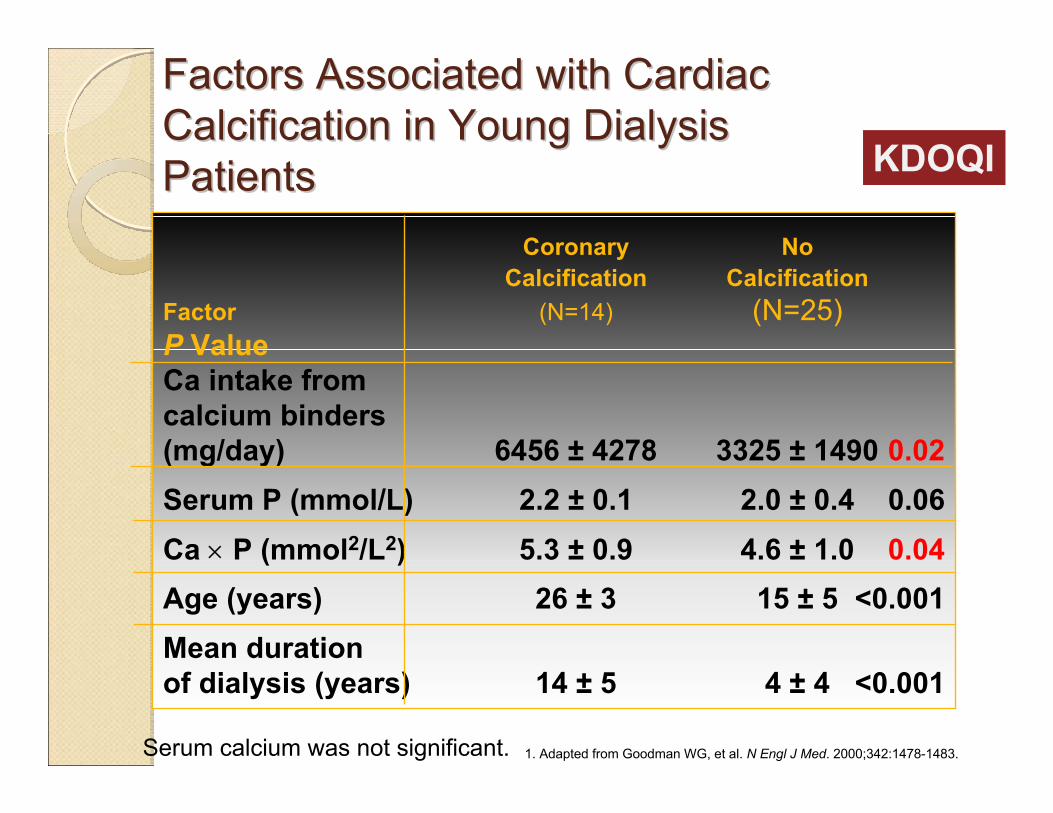
Factors Associated with Cardiac Factors Associated with Cardiac Calcification in Young Dialysis Calcification in Young Dialysis PatientsPatients
1. Adapted from Goodman WG, et al. N Engl J Med. 2000;342:1478-1483.
Coronary NoCalcification Calcification
Factor (N=14) (N=25)P ValueCa intake fromcalcium binders(mg/day) 6456 ± 4278 3325 ± 1490 0.02Serum P (mmol/L) 2.2 ± 0.1 2.0 ± 0.4 0.06Ca × P (mmol2/L2) 5.3 ± 0.9 4.6 ± 1.0 0.04Age (years) 26 ± 3 15 ± 5 <0.001Mean durationof dialysis (years) 14 ± 5 4 ± 4 <0.001
Serum calcium was not significant.
KDOQI
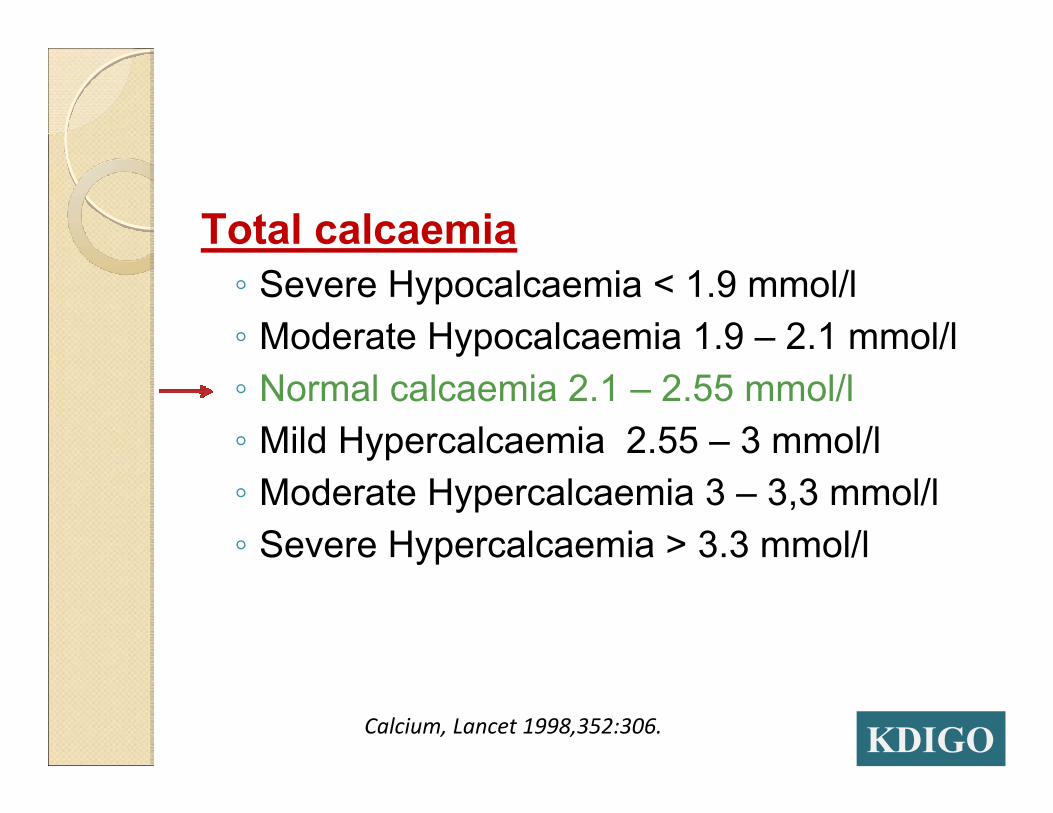
Total calcaemia◦ Severe Hypocalcaemia < 1.9 mmol/l◦ Moderate Hypocalcaemia 1.9 – 2.1 mmol/l◦ Normal calcaemia 2.1 – 2.55 mmol/l◦ Mild Hypercalcaemia 2.55 – 3 mmol/l◦ Moderate Hypercalcaemia 3 – 3,3 mmol/l◦ Severe Hypercalcaemia > 3.3 mmol/l
Calcium, Lancet 1998,352:306. KDIGO
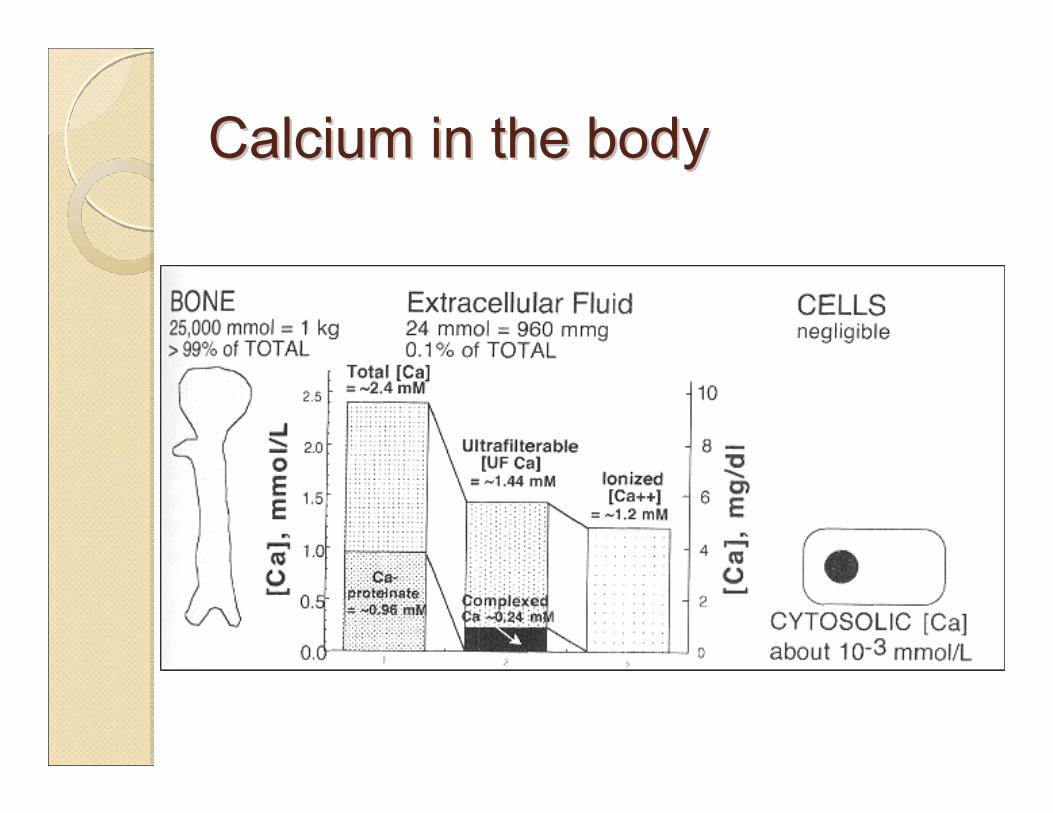
Calcium inCalcium in thethe bodybody
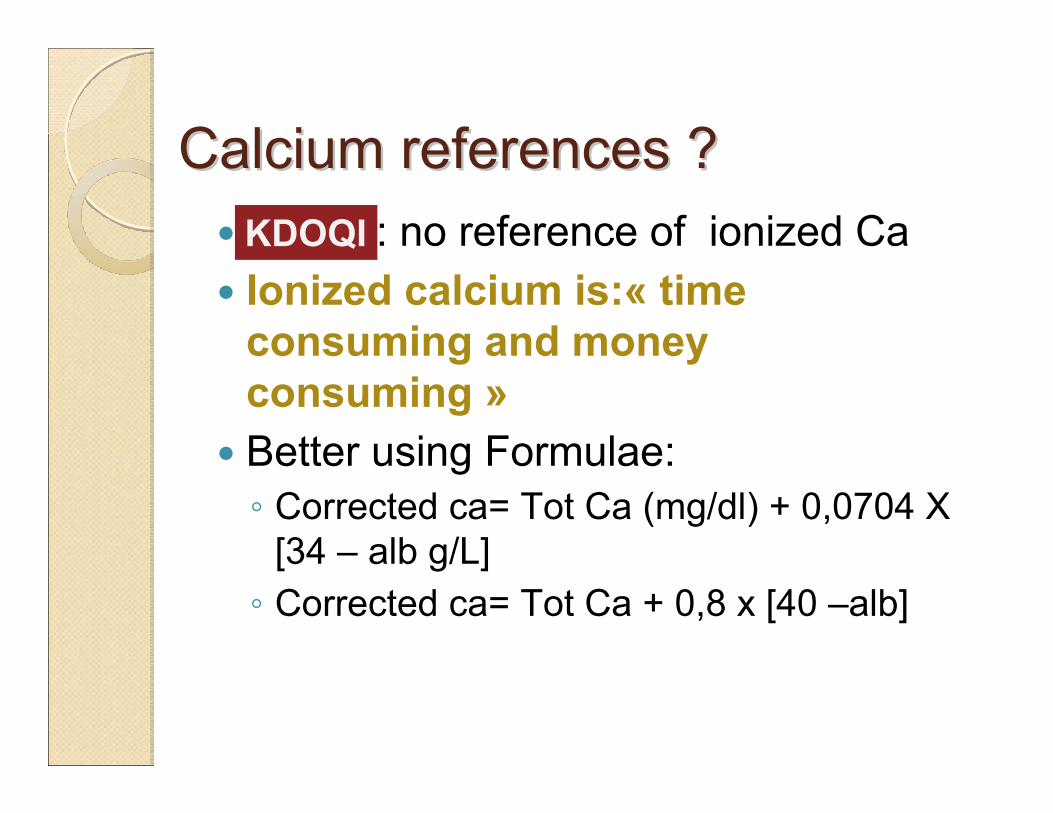
Calcium referencesCalcium references ??: no reference of ionized Ca
Ionized calcium is:« time consuming and money consuming »Better using Formulae: ◦ Corrected ca= Tot Ca (mg/dl) + 0,0704 X
[34 – alb g/L]◦ Corrected ca= Tot Ca + 0,8 x [40 –alb]
KDOQI

Gauci C, J Am Soc Nephrol 2008. 19; 1592
KDIGO
Unfortunately, recent data have shownthat it offers no superiority over total calcium alone and isless specific than ionized calcium measurements.
The Work Groupdid not recommend that corrected calcium measurements beabandoned at present.
Corrected calcium?Corrected calcium?

Relationship between PTH and iRelationship between PTH and i--calciumcalciumthe setthe set--point point
Adapted, with permission, from Malberti F et al. Nephrol Dial Transplant 1999;14:2398–406
110100908070605040302010
0
PTH
(%)
Ionized calcium
Normal subject
1.0 1.1 1.2 1.3 1.4 1.5 1.6
Moderate SHPT
Severe SHPT
Set point
0 4 4.4 4.8 5.2 5.6 6.0 6.4
mmol/L
mg/dL
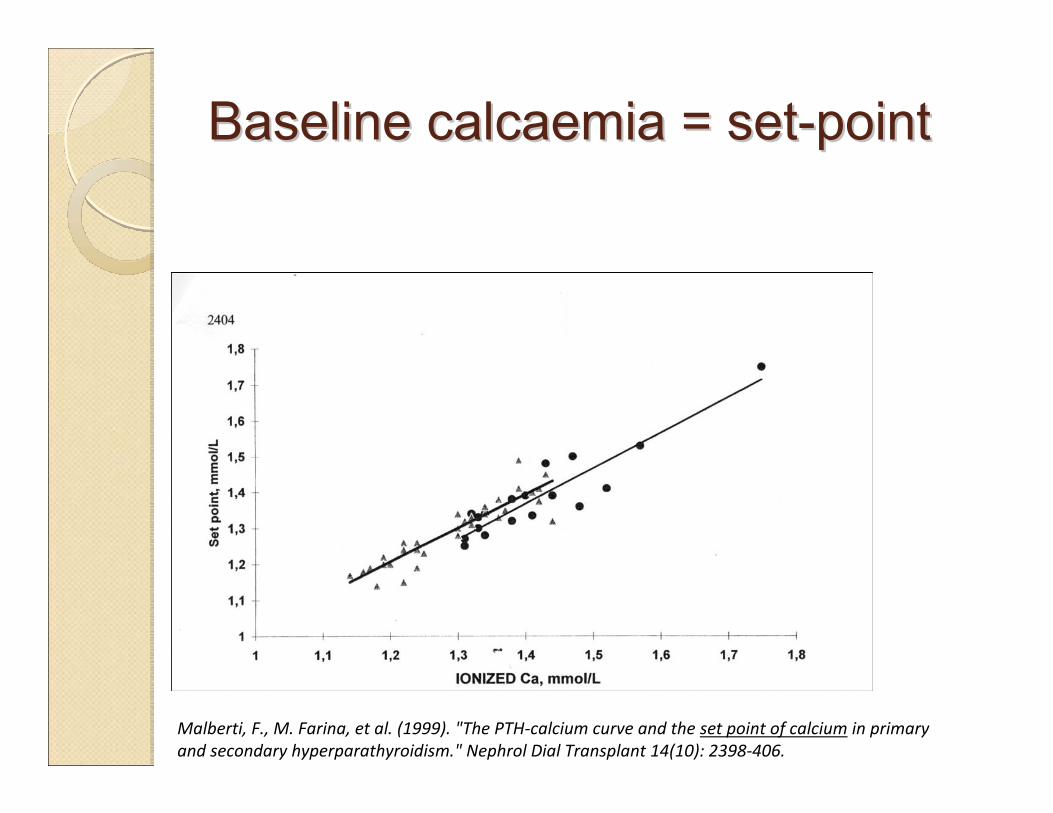
Baseline calcaemiaBaseline calcaemia = set= set--pointpoint
Malberti, F., M. Farina, et al. (1999). "The PTH‐calcium curve and the set point of calcium in primary and secondary hyperparathyroidism." Nephrol Dial Transplant 14(10): 2398‐406.

Survival and corrected calcaemiaSurvival and corrected calcaemiaGA Block et al, Mineral metabolism, mortality and morbidity in maintenancehemodialysis. J Am Soc Nephrol 2004,15:2208.
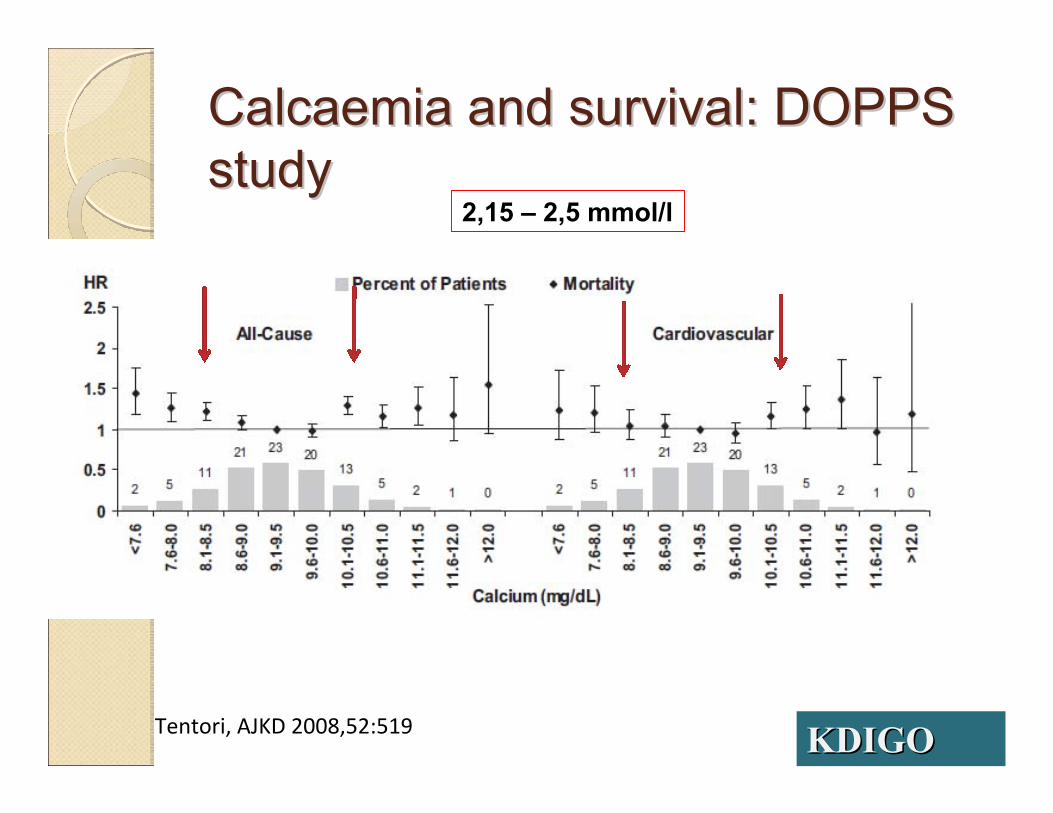
Calcaemia and survival: DOPPS Calcaemia and survival: DOPPS studystudy
Tentori, AJKD 2008,52:519
2,15 – 2,5 mmol/l
KDIGOKDIGO

0,5 0,8 1,0 1,3 1,5 1,8 2,0 2,2 2,5 2,7 3,0 3,2 3,5 3,7 4,0
50
40
30
20
10
0
Alb-corrected calc mmol/l
Rel
ativ
e fre
quen
cy (%
) 44% in the target2.1 – 2.37 mmol/L
KDOQI
ARNOS Rhône-Alpes, D. Fouque et al, 2005

0,3 0,5 0,8 1,0 1,2 1,4 1,7 1,9 2,1 2,4 2,6 2,8 3,0 3,3 3,5
50
40
30
20
10
0
Calc totale mmol/l
Rel
ativ
e fre
quen
cy (%
)
81% in the target2.1 – 2.55 mmol/l
KDIGOKDIGO
ARNOS Rhône-Alpes, D. Fouque et al, 2005
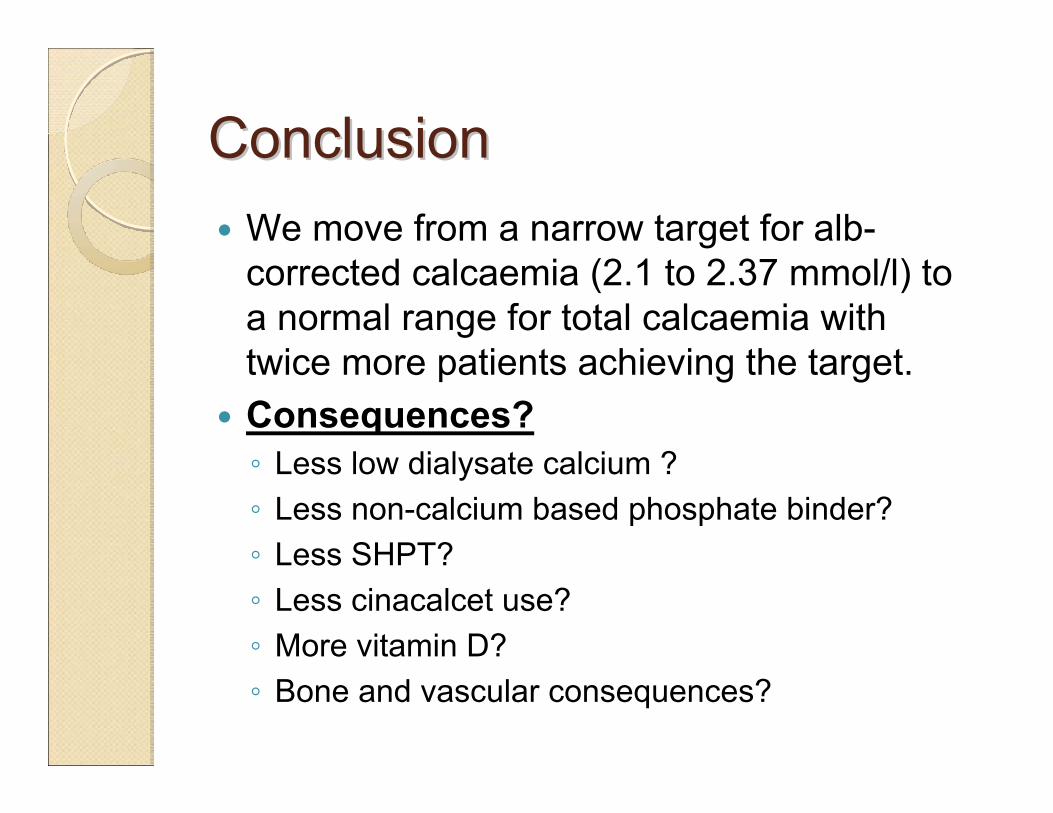
ConclusionConclusionWe move from a narrow target for alb-corrected calcaemia (2.1 to 2.37 mmol/l) to a normal range for total calcaemia with twice more patients achieving the target.Consequences?◦ Less low dialysate calcium ?◦ Less non-calcium based phosphate binder?◦ Less SHPT?◦ Less cinacalcet use?◦ More vitamin D?◦ Bone and vascular consequences?

T0 T3 T6 T9PTH pg/ml 250 390 250 170Alb-corrected calcaemia
2.5 2.45 2 2.25Total calcaemia mmol/l
2.45 2.4 1.9 2.15Phosphataemia mmol/l
1.8 2 1.7 1.7Ca dialysate mmol 1,5 1.25 1.25 1.5CacO3 g/day 2g 0 0 2 gSevelamer mg/day 0 2400 3200 0Cinacalcet mg/day 0 0 30 30Un-alpha µg/week 0 0 0 3
KDOQI strategy: a real pitfallKDOQI strategy: a real pitfall

T0 T3PTH pg/ml 250 220Corrected –calcaemia mmol/l
2,5 2,45
Total calcaemia 2,45 2,4Phosphataemia mmol/l
1,8 1,5
Ca dialysate 1,5 1,5CacO3 g/day 1.5 1.5Lanthanum g/d 0 1 gCinacalcet 0 0Un alpha 0 0Cholecalciferol 100 000
U/mths
With the KDIGOWith the KDIGO

MORE MORE RECOMMENDATIONSRECOMMENDATIONS

In patients with more advanced CKD (Stage 5) and in dialysis patients, it is not established that nutritional “replacement” with vitamin D (ergocalciferol or cholecalciferol) will be effective since the ability to generate adequate levels of 1,25(OH)2D3 is markedly reduced or is unlikely.
KDOQI: native vitamin DKDOQI: native vitamin D
3.1.3 In patients with CKD stages 3–5D, we suggest that 25(OH)D (calcidiol) levels might be measured, and repeated testing determined by baseline values and therapeutic interventions (2C). We suggest that vitamin D deficiency and insufficiency be corrected using treatment strategies recommended for the general population (2C).
KDIGO and native vitamin DKDIGO and native vitamin D
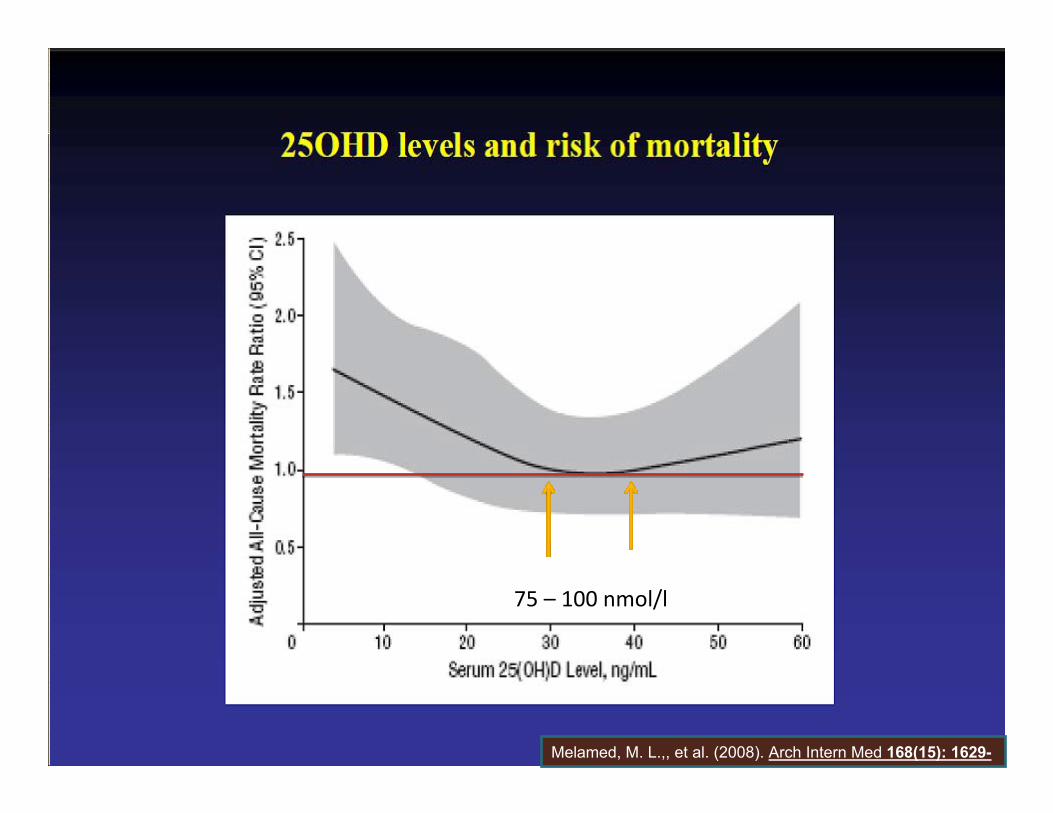
75 – 100 nmol/l
Melamed, M. L.,, et al. (2008). Arch Intern Med 168(15): 1629-
3.2.3. In patients with CKD stages 3–5D, we suggest that measurements of serum PTH or bone-specific alkaline phosphatase can be used to evaluate bone disease
KDIGO and bone markersKDIGO and bone markers
Ca x P productCa x P product3.1.5. In patients with CKD stages 3–5D, we suggest that individual values of serum calcium and phosphorus, evaluated together, be used to guide clinical practice rather than the mathematical construct of calcium-phosphorus product (CaxP) (2D).
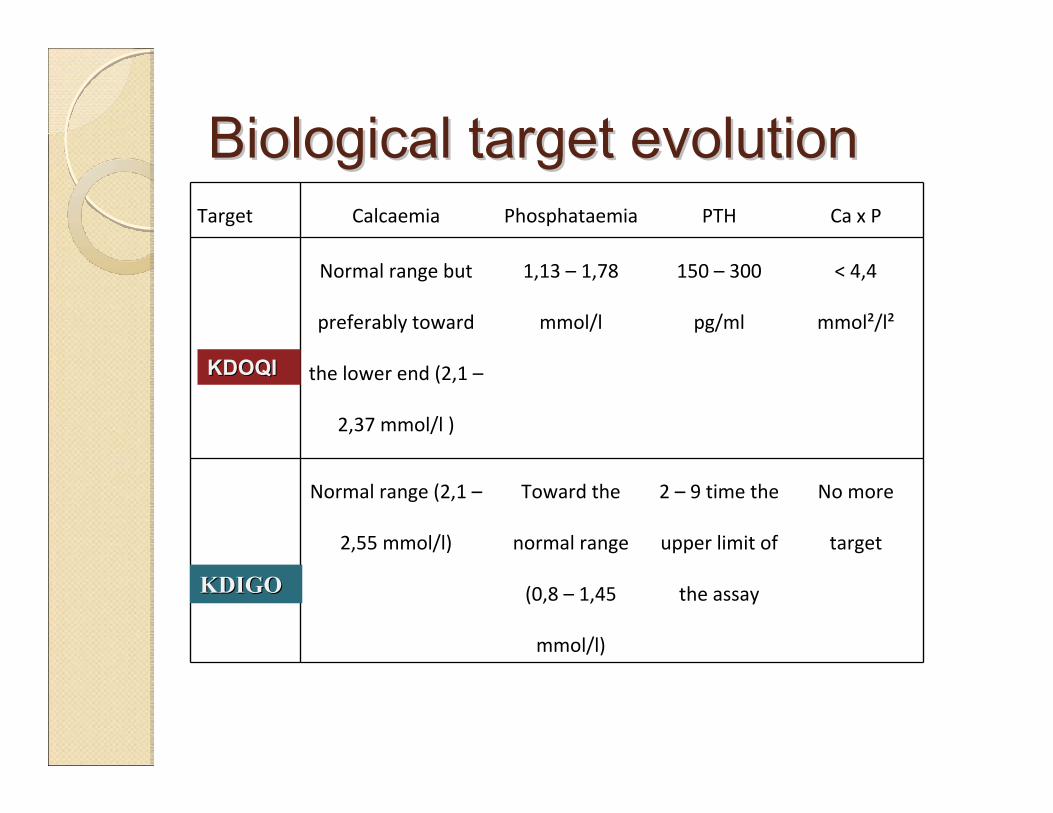
Biological target evolutionBiological target evolutionTarget Calcaemia Phosphataemia PTH Ca x P
Normal range but
preferably toward
the lower end (2,1 –
2,37 mmol/l )
1,13 – 1,78
mmol/l
150 – 300
pg/ml
< 4,4
mmol²/l²
Normal range (2,1 –
2,55 mmol/l)
Toward the
normal range
(0,8 – 1,45
mmol/l)
2 – 9 time the
upper limit of
the assay
No more
target
KDOQIKDOQI
KDIGOKDIGO
““Take home messageTake home message””The evidence level requirement has increased with the , but the level of evidence remains poor.However, most of the recommendations make sense and constitute an improvement of the , beyond the targets:
The idea of “dynamic” rather than “static”interpretationIndividualization rather than “one size fits all”A global approach not based on only one parameterTo prevent rather than to cure
KDIGOKDIGO
KDOQIKDOQI