new approaches to identification of sources of phenols in surface water bodies
TRANSCRIPT
ISSN 0012�5008, Doklady Chemistry, 2011, Vol. 441, Part 2, pp. 379–382. © Pleiades Publishing, Ltd., 2011.Original Russian Text © V.V. Sursyakova, L.G. Bondareva, G.V. Burmakina, A.I. Rubailo, 2011, published in Doklady Akademii Nauk, 2011, Vol. 441, No. 6, pp. 767–770.
379
Russia possesses a great hydroelectric potential andsimultaneously the world largest forest reserves. Dur�ing the construction of large hydroelectric power sta�tions in the forest�covered areas, forest clearance oftenproved to be economically impractical and largeamounts of wood were flooded [1]. There are about200 such hydroelectric power stations in Russia and inother former�USSR countries, the largest of thembeing located in the Angara–Yenisei region [2]. Com�pounds present in wood and the products of fungal andbacterial degradation of wood [3–6], which are oftentoxic, are extracted from the flooded wood into theriver water. Among the latter compounds, phenols areespecially hazardous; according to many�year obser�vations of the Agency on Hydrometeorology andEnvironmental Monitoring stations, phenols areamong the major pollutants present in the YeniseiRiver [7, 8]. The possible sources of phenols in thewood pulp are phenol compounds present both in freeand bound states and lignin, an irregular polymer withbranched macromolecules composed mainly of theresidues of substituted phenoloalcohols [9].
However, determination of compounds formedupon wood degradation under natural conditions hasnot been adequately addressed: they are either notdetermined or characterized by general parameters,such as phenol index, that do not depict the pollution.When the phenol index is lower than the maximumallowable concentration (MAC), the MACs for partic�ular phenols can still be exceeded, because the MACsof different phenols differ by several orders of magni�tude. In addition, para�substituted phenols make nocontribution to the phenol index.
The purpose of this work was to develop proceduresfor determination of individual phenols by high�per�formance liquid chromatography (HPLC) and capil�lary electrophoresis (CE) and to perform modelexperiments with water from the Yenisei River to esti�mate the possibility that particular phenols listed inthe Sanitary Regulations and Standards SanPiN2.1.4.1074�01 for potable water are extracted fromwood wastes.
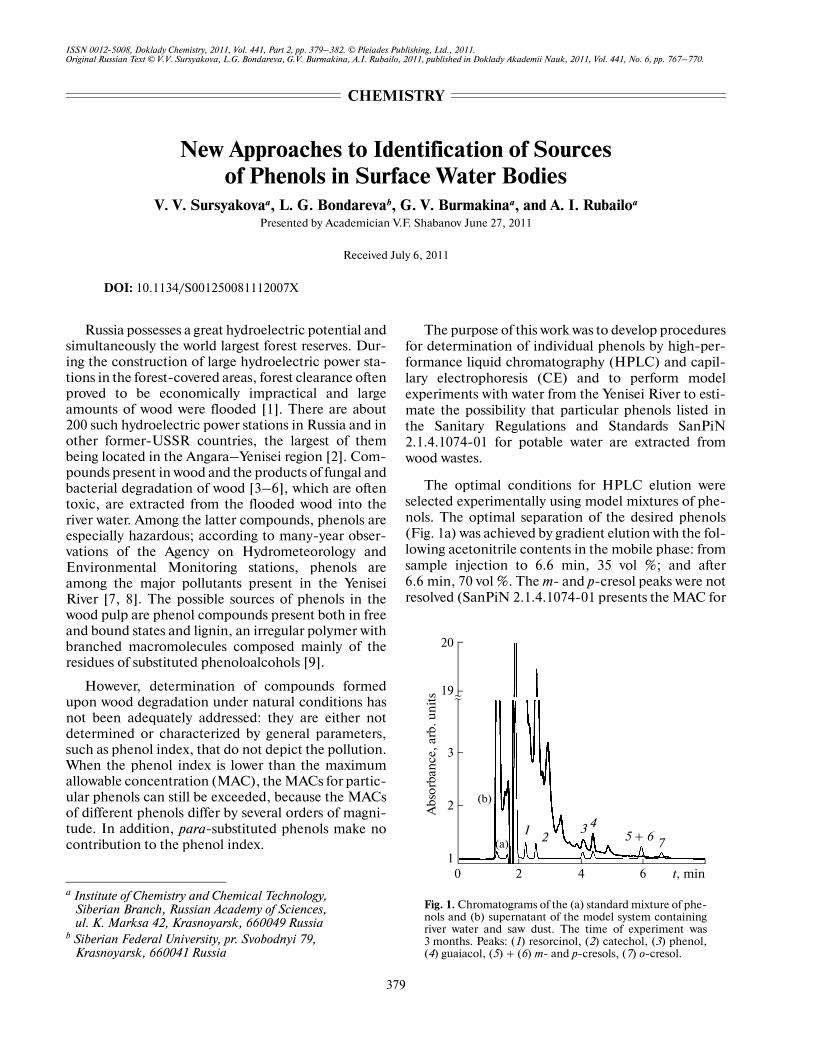
The optimal conditions for HPLC elution wereselected experimentally using model mixtures of phe�nols. The optimal separation of the desired phenols(Fig. 1a) was achieved by gradient elution with the fol�lowing acetonitrile contents in the mobile phase: fromsample injection to 6.6 min, 35 vol %; and after6.6 min, 70 vol %. The m� and p�cresol peaks were notresolved (SanPiN 2.1.4.1074�01 presents the MAC for
CHEMISTRY
New Approaches to Identification of Sources of Phenols in Surface Water Bodies
V. V. Sursyakovaa, L. G. Bondarevab, G. V. Burmakinaa, and A. I. Rubailoa
Presented by Academician V.F. Shabanov June 27, 2011
Received July 6, 2011
DOI: 10.1134/S001250081112007X
a Institute of Chemistry and Chemical Technology, Siberian Branch, Russian Academy of Sciences, ul. K. Marksa 42, Krasnoyarsk, 660049 Russia
b Siberian Federal University, pr. Svobodnyi 79, Krasnoyarsk, 660041 Russia
20
2
0 2 t, min
19
3
14 6
~~
(а)
(b)
12
3 45 + 6 7
Abs
orba
nce
, ar
b. u
nit
s
Fig. 1. Chromatograms of the (a) standard mixture of phe�nols and (b) supernatant of the model system containingriver water and saw dust. The time of experiment was3 months. Peaks: (1) resorcinol, (2) catechol, (3) phenol,(4) guaiacol, (5) + (6) m� and p�cresols, (7) o�cresol.

380
DOKLADY CHEMISTRY Vol. 441 Part 2 2011
SURSYAKOVA et al.
their sum). The linear range of quantifiable concentra�tions was 0.05 to 25 mg/L without preconcentration.
The known CE methods for determination of phe�nols listed in the SanPiN 2.1.4.1074�01 are based onnon�aqueous CE [10] or on the use of backgroundelectrolytes with complex composition [11] that con�tain organic solvents or electroosmotic flow (EOF)modifiers, i.e., compounds that can retard or reversethe EOF. The use of nonaqueous CE or complex back�ground electrolytes is not always justified; this extendsthe time of analysis, as such electrolytes often cannotbe stored requiring daily preparation. Therefore, herewe attempted to use phosphate buffer solutions with�out EOF modifiers as background electrolytes.
Phenols are weak acids; their CE separation asanions should be performed at pH values of the back�ground electrolyte 1 to 2 units higher than the pKa ofphenols. In this highly alkaline medium and at nega�tive voltage polarity, which is normally used to separateanions, determination of phenols is interfered with bythe system peaks formed at the outlet end of the capil�lary and carried by the EOF [12]. The use of hydrodi�namic pressure for suppressing EOF velocity [13] hasadverse influence on the resolution of electrophoreticpeaks. In view of the foregoing, the separation of phe�nols at positive voltage polarity in the pH range of 9 to12 was studied in more detail. The dependences of theelectrophoretic mobility vs. pH [14] were plotted foreach of the phenols. As a result, pH 11.1 was found tobe optimal for separation of all of the considered phe�nols (Fig. 2a). The linear range of quantifiable con�centrations was 0.5 to 25 mg/L without preconcentra�tion. The CE procedure for phenol determination is
somewhat less sensitive than the HPLC procedure butCE is more economic as regards the consumption ofexpendable materials. The use of liquid–liquid or solidpreconcentration with DIAPAK P cartridges followedby HPLC or CE analysis provides the possibility ofphenol determination at 0.5 MAC level (0.5 µg/L) orlower.
The developed procedures were used to analyze theaqueous extracts of coniferous wood (the Siberianlarch Larix sibirica) obtained in model experiments.Several model systems were prepared: saw dust–water,bark–water, saw dust–soil–water, bark–soil–water,and soil–water. As the control object, water of theYenisei River was chosen. The systems were placedinto 3 L closed glass vessels. The experiment lasted for6 months, the light and temperature conditions werenatural.
Figures 1b and 2b show exemplary chromatogramsand electropherograms of the aqueous extracts. Thephenol contents in extracts determined by HPLC aresummarized in the table. The quantitative and, insome cases, qualitative determination of phenols inthe resulting extracts by CE was difficult due to thepresence of large groups of unresolved peaks of uni�dentified compounds in the electropherograms. Ascan be seen from the table, the least number of com�pounds related to the class of phenols is formed in themodel system consisting of soil and river water; thiswas to be expected, as soil consists of structures mostresistant to biodegradation. Bark gives off more phe�nols than saw dust, which is apparently caused by thehigher content of lignin, which is ~40% in the barkand 26% in saw dust [15]. In model systems with soil,which contains microbes, dihydric phenols, resorcinoland catechol, and cresols were also formed apart fromphenol. Generally, comparison of the measured phe�nol concentrations in river water after 3 and 6 monthsof storage of fine�cut wood wastes in it leads to theconclusion that phenol formation (and subsequentdecay in river water) is a dynamic process that consid�erably depends on the presence of particular microbes.
Thus, procedures for determination of phenol andits derivatives by high performance liquid chromato�graphy and capillary electrophoresis were developed.Data on what particular phenols listed in SanPiN2.1.4.1074�01 for potable water can be formed upondegradation of soil and coniferous wood in river waterwere obtained for the first time. It was found that deg�radation of soil may produce phenol and degradationof wood wastes may give phenol and some its deriva�tives. According to investigations, the presence of soilin the model system changes the course of processesinvolved in the destruction and the concentrations ofthe phenols formed, apparently, as a result of vitalactivity of soil microbes.
40
10
5 t, min
30
20
010 15
(а)
(b)
12 3 4
57
6
54A
bsor
ban
ce,
arb.
un
its
Fig. 2. Electropherograms of the (a) standard mixture ofphenols and (b) supernatant of the model system contain�ing river water and saw dust. The time of experiment was3 months. Peaks: (1) p�cresol, (2) o�cresol, (3) m�cresol,(4) guaiacol, (5) phenol, (6) resorcinol, (7) catechol.

DOKLADY CHEMISTRY Vol. 441 Part 2 2011
NEW APPROACHES TO IDENTIFICATION OF SOURCES 381
EXPERIMENTAL
All measurements were taken with instruments ofthe Krasnoyarsk regional shared facility center, Sibe�rian Branch, Russian Academy of Sciences.
The chromatographic separation of standard sam�ples of phenols (Ekros, St. Petersburg, Russia) wasperformed on an Agilent HPLC 1200 Series high per�formance liquid chromatograph (Agilent Technolo�gies, USA) using a Zorbax eclipse XDB�C18 column,4.6 × 150 mm, 5 µm. The column was maintained at30°C. As the mobile phases, mixtures of aqueous ace�tic acid (pH 3.3–3.4) and acetonitrile (for gradientHPLC, Panreac, Spain) were used. Phenols wereidentified based on the retention times and the UVspectra.
The electrophoretic separation was carried outusing an Agilent 3DCE G1600A capillary electro�phoresis system with diode matrix detector (AgilentTechnologies, Germany). Unmodified fused silicacapillary with an inner diameter of 50 µm, total lengthof 80.5 cm, and an effective length of 72 cm was used.The capillary was maintained at 20°C. The voltage was+30 kV. As background electrolytes, 45 mM solutionsof K2HPO4 were used; their pH was brought to 9–12by adding 1 M KOH.
Model experiments were carried out with woodpulp wastes (saw dust and bark of Siberian larch (Larixsibirica)), water of the Yenisei River, and the agricul�tural soil collected near Krasnoyarsk. The wood pulpwastes were finely cut and dried to the air�dry state;
water of the Yenisei River was filtered through a “blueribbon” paper filter; the soil was pulped to a homoge�neous state with removal of large mineral or organicfragments.
ACKNOWLEDGMENTS
This work was supported by the RF Ministry ofEducation and Science (Federal Target Program“Cadres” (action 1.4) and Federal Target Program“Research and Development in the Priority Fields ofS&T Complex of Russia for 2007–2013” (State con�tract no. 16.512.11.2131)).
REFERENCES
1. Korpachev, V.P., Perezhilin, A.I., Andriyas, A.A., andRyabokon’, Yu.I., Zagryaznenie i zasorenie vodokhra�nilishch GES drevesno�kustarnikovoi rastitel’nost’yu,organicheskimi veshchestvami i vliyanie ikh na kachestvovody (Pollution and Littering of Storage Ponds withTrees and Shrubs and Organic Compounds and TheirEffect on the Water Quality), Moscow: Izd. RAE, 2010.
2. Bryukhanov, A.V., Ustoich. Lesopolz., 2009, no. 2,pp. 21–31.
3. Grushnikov, O.P. and Antropova, O.N., Usp. Khim.,1975, vol. 44, pp. 935–967.
4. Biochemistry of Microbial Degradation, Ratledge, C.,Ed., London: Kluwer, 1994, pp. 233–277.
5. Tanaka, H., Koike, K., Itakura, S., and Enoki, A.,Enzyme Microb. Technol., 2009, vol. 45, pp. 384–390.
6. Sanchez, C., Biotechnol. Adv., 2009, vol. 27, pp. 185–194.
Content of phenols in the supernatant liquid of the model systems determined by HPLC
Model system t, months*
Phenol concentration, mg/L
resorcinol catechol phenol guaiacol m�cresol + p�cresol o�cresol
Water 0 < (See **) < < < < <
Soil–water 3 < < 0.08 ± 0.01 < < <
6 < < Traces < < <
Saw dust–water 3 < < 0.94 ± 0.06 1.14 ± 0.07 < <
6 < < 0.28 ± 0.04 0.98 ± 0.04 < <
Soil–saw dust–water 3 < 3.7 ± 0.2 0.90 ± 0.06 < 5.6 ± 0.3 0.21 ± 0.03
6 < 9 ± 1 0.60 ± 0.04 2.1 ± 0.1 4.6 ± 0.3 <
Bark–water 3 < < 5.6 ± 0.3 3.7 ± 0.3 < <
6 2.3 ± 0.1 < 6.8 ± 0.5 < < <
Soil–bark–water 3 11.3 ± 0.7 2.4 ± 0.2 5.8 ± 0.4 < 6.3 ± 0.4 0.37 ± 0.07
6 1.9 ± 0.1 2.7 ± 0.2 4.9 ± 0.3 < 4.4 ± 0.3 <
MAC – 0.1 0.1 0.001 0.05 0.004 0.003
* t is the duration of keeping soil or wood wastes in river water.** Below the detection limit.

382
DOKLADY CHEMISTRY Vol. 441 Part 2 2011
SURSYAKOVA et al.
7. Obzor sostoyaniya i zagryazneniya okruzhayushcheisredy v Rossiiskoi Federatsii 2009 gg (Survey of the Stateof Pollution of the Environment in the Russian Feder�ation), Moscow: Rosgidromet, 2010.
8. Spitsyna, T.P., Khokhlova, A.I., and Stepen’, R.A.,Vestn. Kras. Gos. Univ., Estestv. Nauki, 2006, no. 5,pp. 120–126.
9. Fengel, D. and Wegener, G., Wood: Chemitry, Ultra�structure, Reactions, Berlin: W. de Gruyter, 1984. Tran�lated under the title Drevesina. Khimiya, ul’trastruktura,reaktsii, Moscow: Lesnaya Prom�st’, 1988.
10. Porrasa, S.P., Kuldvee, R., Palonen, S., and Riekko�la, M.�L., J. Chromatogr. A, 2003, vol. 990, pp. 35–44.
11. Masselter, S.M. and Zemann, A.J., Anal. Chem., 1995,vol. 67, pp. 1047–1053.
12. Sursyakova, V.V., Kalyakin, S.N., Burmakina, G.V.,and Rubaylo, A.I., Electrophoresis, 2011, vol. 32,pp. 210–217.
13. Kalyakin, S.N., Sursyakova, V.V., Burmakina, G.V.,and Rubailo, A.I., Zh. Anal. Khim., 2009, vol. 64, no. 4,pp. 415–420.
14. Sursyakova, V.V., Burmakina, G.V., and Rubailo, A.I.,Zh. Sib. Fed. Univ., Khim., 2010, vol. 3, no. 3, pp. 268–277.
15. Gvozdeva, E.N., Artem’eva, I.S., and Levanova, V.P.,Khim. Drev., 1979, no. 3, pp. 100–102.