new approaches to explore dark matter -...
TRANSCRIPT

New approaches to explore dark matter Fa Peng Huang
(CTPU-IBS)
The 8th KIAS workshop on particle physics and cosmology@KIAS, Seoul Oct.29, 2018

Outline➢Research Motivation ➢Phase transition gravitational wave (GW) in a nutshell ➢Probing dark matter (DM) blind spots by GW&Collider ➢Probing baryogenesis and DM simultaneously by GW&Collider ➢Probing other new physics (NP) by GW ➢Summary and outlook

Motivation
7
101 102 103
WIMP mass [GeV/c2]
10�47
10�46
10�45
10�44
10�43
WIM
P-nu
cleo
ns S
I[c
m2 ]
LUX (2017)PandaX-II (2017)
XENON1T (1 t⇥yr, this work)
101 102 103
WIMP mass [GeV/c2]
10�1
100
101
Nor
mal
ized
FIG. 5: 90% confidence level upper limit on �SI from thiswork (thick black line) with the 1� (green) and 2� (yel-low) sensitivity bands. Previous results from LUX [6] andPandaX-II [7] are shown for comparison. The inset showsthese limits and corresponding ±1� bands normalized to themedian of this work’s sensitivity band. The normalized me-dian of the PandaX-II sensitivity band is shown as a dottedline.
injecting an undisclosed number and class of events inorder to protect against fine-tuning of models or selec-tion conditions in the post-unblinding phase. After thepost-unblinding modifications described above, the num-ber of injected salt and their properties were revealed tobe two randomly selected 241AmBe events, which hadnot motivated any post-unblinding scrutiny. The num-ber of events in the NR reference region in Table I is con-sistent with background expectations. The profile likeli-hood analysis indicates no significant excesses in the 1.3 tfiducial mass at any WIMP mass, with a p-value for thebackground-only hypothesis of 0.28, 0.41, and 0.22 at6, 50, and 200 GeV/c2, respectively. Figure 5 shows theresulting 90% confidence level upper limit on �SI . The2� sensitivity band spans an order of magnitude, indi-cating the large random variation in upper limits due tostatistical fluctuations of the background (common to allrare-event searches). The sensitivity itself is una↵ectedby such fluctuations, and is thus the appropriate mea-sure of the capabilities of an experiment [44]. The insetin Fig. 5 shows that the median sensitivity of this searchis ⇠7.0 times better than previous experiments [6, 7] atWIMP masses > 50 GeV/c2.
In summary, we performed a DM search using an ex-posure of 278.8 days ⇥ 1.3 t = 1.0 t⇥yr, with an ERbackground rate of (82+5
�3 (sys) ± 3 (stat)) events/(t ⇥yr ⇥ keVee), the lowest ever achieved in a DM searchexperiment. We found no significant excess above back-ground and set an upper limit on the WIMP-nucleonspin-independent elastic scattering cross-section �SI at4.1⇥10�47 cm2 for a mass of 30 GeV/c2, the most strin-
gent limit to date for WIMP masses above 6 GeV/c2. Animminent detector upgrade, XENONnT, will increase thetarget mass to 5.9 t. The sensitivity will improve uponthis result by more than an order of magnitude.
We gratefully acknowledge support from the NationalScience Foundation, Swiss National Science Foundation,German Ministry for Education and Research, MaxPlanck Gesellschaft, Deutsche Forschungsgemeinschaft,Netherlands Organisation for Scientific Research (NWO),NLeSC, Weizmann Institute of Science, I-CORE, Pazy-Vatat, Initial Training Network Invisibles (Marie CurieActions, PITNGA-2011-289442), Fundacao para a Cien-cia e a Tecnologia, Region des Pays de la Loire, Knut andAlice Wallenberg Foundation, Kavli Foundation, and Is-tituto Nazionale di Fisica Nucleare. Data processing isperformed using infrastructures from the Open ScienceGrid and European Grid Initiative. We are grateful toLaboratori Nazionali del Gran Sasso for hosting and sup-porting the XENON project.
⇤ [email protected]† [email protected]‡ [email protected]§ Also at Albert Einstein Center for Fundamental Physics,University of Bern, Bern, Switzerland
¶ Also at Kobayashi-Maskawa Institute, Nagoya Univer-sity, Nagoya, Japan
⇤⇤ Also at Coimbra Polytechnic - ISEC, Coimbra, Portugal†† [email protected][1] G. Bertone, D. Hooper and J. Silk, Phys. Rep. 405, 279
(2005).[2] L. Roszkowski et al. Rep. Prog. Phys. 81, 066201 (2018).[3] T. Marrodan Undagoitia and L. Rauch, J. Phys. G 43,
no. 1, 013001 (2016)[4] L. E. Strigari, Phys. Rep. 531, 1 (2012).[5] E. Aprile et al. (XENON Collaboration), Phys. Rev.
Lett. 119, 181301 (2017).[6] D. S. Akerib et al. (LUX Collaboration), Phys. Rev. Lett.
118, 021303 (2016).[7] X. Cui et al. (PandaX-II Collaboration), Phys. Rev. Lett.
119, 181302 (2017).[8] E. Aprile et al. (XENON Collaboration), Eur. Phys. J.
C 77: 881 (2017).[9] E. Aprile et al. (XENON Collaboration), Eur. Phys. J.
C 75: 546 (2015).[10] P. Barrow et al. JINST 12, no. 01, P01024 (2017).[11] E. Aprile et al. (XENON Collaboration), JINST 9,
P11006 (2014).[12] P. Sorensen, K. Kamdin. JINST 13, P02032 (2018).[13] D. Furse et al.. New J. Phys. 19 053012 (2017)[14] E. Aprile et al. (XENON Collaboration), Phys. Rev. D
95, 072008 (2017).[15] R. F. Lang et al., Nucl. Inst. and Meth. A 879, 31 (2018).[16] B. Riedel et al. PEARC ’18, ISBN 978-1-4503-6446-1
(2018). doi:10.1145/3219104.3219155.[17] XENON Collaboration. (2018). The pax data processor
v6.8.0. Zenodo. http://doi.org/10.5281/zenodo.1195785[18] R. Saldanha et al., Nucl. Inst. and Meth. A 863, 35
Motivated by the absence of DM signal in DM direct detection experiments and NP signal at LHC, we study how to hear the echoes of the NP, especially the DM and baryogenesis by new approaches, such as the Laser Interferometer experiments (aLIGO, LISA 2034, Tianqin, Taiji…) and pulsar timing array experiments (SKA, FAST…).
Dark Matter Search Results from a One Tonne⇥Year Exposure of XENON1T
E. Aprile,1 J. Aalbers,2 F. Agostini,3 M. Alfonsi,4 L. Althueser,5 F. D. Amaro,6 M. Anthony,1 F. Arneodo,7
L. Baudis,8 B. Bauermeister,9 M. L. Benabderrahmane,7 T. Berger,10 P. A. Breur,2 A. Brown,2 A. Brown,8
E. Brown,10 S. Bruenner,11 G. Bruno,7 R. Budnik,12 C. Capelli,8 J. M. R. Cardoso,6 D. Cichon,11
D. Coderre,13, ⇤ A. P. Colijn,2 J. Conrad,9 J. P. Cussonneau,14 M. P. Decowski,2 P. de Perio,1, †
P. Di Gangi,3 A. Di Giovanni,7 S. Diglio,14 A. Elykov,13 G. Eurin,11 J. Fei,15 A. D. Ferella,9 A. Fieguth,5
W. Fulgione,16, 17 A. Gallo Rosso,16 M. Galloway,8 F. Gao,1, ‡ M. Garbini,3 C. Geis,4 L. Grandi,18
Z. Greene,1 H. Qiu,12 C. Hasterok,11 E. Hogenbirk,2 J. Howlett,1 R. Itay,12 F. Joerg,11 B. Kaminsky,13, §
S. Kazama,8, ¶ A. Kish,8 G. Koltman,12 H. Landsman,12 R. F. Lang,19 L. Levinson,12 Q. Lin,1 S. Lindemann,13
M. Lindner,11 F. Lombardi,15 J. A. M. Lopes,6, ⇤⇤ J. Mahlstedt,9 A. Manfredini,12 T. Marrodan Undagoitia,11
J. Masbou,14 D. Masson,19 M. Messina,7 K. Micheneau,14 K. Miller,18 A. Molinario,16 K. Mora,9 M. Murra,5
J. Naganoma,20 K. Ni,15 U. Oberlack,4 B. Pelssers,9 F. Piastra,8 J. Pienaar,18 V. Pizzella,11 G. Plante,1
R. Podviianiuk,16 N. Priel,12 D. Ramırez Garcıa,13 L. Rauch,11 S. Reichard,8 C. Reuter,19 B. Riedel,18 A. Rizzo,1
A. Rocchetti,13 N. Rupp,11 J. M. F. dos Santos,6 G. Sartorelli,3 M. Scheibelhut,4 S. Schindler,4 J. Schreiner,11
D. Schulte,5 M. Schumann,13 L. Scotto Lavina,21 M. Selvi,3 P. Shagin,20 E. Shockley,18 M. Silva,6
H. Simgen,11 D. Thers,14 F. Toschi,3, 13 G. Trinchero,17 C. Tunnell,18 N. Upole,18 M. Vargas,5 O. Wack,11
H. Wang,22 Z. Wang,16 Y. Wei,15 C. Weinheimer,5 C. Wittweg,5 J. Wulf,8 J. Ye,15 Y. Zhang,1 and T. Zhu1
(XENON Collaboration), ††
1Physics Department, Columbia University, New York, NY 10027, USA2Nikhef and the University of Amsterdam, Science Park, 1098XG Amsterdam, Netherlands
3Department of Physics and Astronomy, University of Bologna and INFN-Bologna, 40126 Bologna, Italy4Institut fur Physik & Exzellenzcluster PRISMA, Johannes Gutenberg-Universitat Mainz, 55099 Mainz, Germany
5Institut fur Kernphysik, Westfalische Wilhelms-Universitat Munster, 48149 Munster, Germany6LIBPhys, Department of Physics, University of Coimbra, 3004-516 Coimbra, Portugal
7New York University Abu Dhabi, Abu Dhabi, United Arab Emirates8Physik-Institut, University of Zurich, 8057 Zurich, Switzerland
9Oskar Klein Centre, Department of Physics, Stockholm University, AlbaNova, Stockholm SE-10691, Sweden10Department of Physics, Applied Physics and Astronomy, Rensselaer Polytechnic Institute, Troy, NY 12180, USA
11Max-Planck-Institut fur Kernphysik, 69117 Heidelberg, Germany12Department of Particle Physics and Astrophysics, Weizmann Institute of Science, Rehovot 7610001, Israel
13Physikalisches Institut, Universitat Freiburg, 79104 Freiburg, Germany14SUBATECH, IMT Atlantique, CNRS/IN2P3, Universite de Nantes, Nantes 44307, France
15Department of Physics, University of California, San Diego, CA 92093, USA16INFN-Laboratori Nazionali del Gran Sasso and Gran Sasso Science Institute, 67100 L’Aquila, Italy
17INFN-Torino and Osservatorio Astrofisico di Torino, 10125 Torino, Italy18Department of Physics & Kavli Institute for Cosmological Physics, University of Chicago, Chicago, IL 60637, USA
19Department of Physics and Astronomy, Purdue University, West Lafayette, IN 47907, USA20Department of Physics and Astronomy, Rice University, Houston, TX 77005, USA
21LPNHE, Universite Pierre et Marie Curie, Universite Paris Diderot, CNRS/IN2P3, Paris 75252, France22Physics & Astronomy Department, University of California, Los Angeles, CA 90095, USA
(Dated: June 1, 2018)
We report on a search for Weakly Interacting Massive Particles (WIMPs) using 278.8 days ofdata collected with the XENON1T experiment at LNGS. XENON1T utilizes a liquid xenon timeprojection chamber with a fiducial mass of (1.30 ± 0.01) t, resulting in a 1.0 t⇥yr exposure.The energy region of interest, [1.4, 10.6] keVee ([4.9, 40.9] keVnr), exhibits an ultra-low electronrecoil background rate of (82+5
�3 (sys)± 3 (stat)) events/(t⇥ yr⇥ keVee). No significant excess overbackground is found and a profile likelihood analysis parameterized in spatial and energy dimensionsexcludes new parameter space for the WIMP-nucleon spin-independent elastic scatter cross-sectionfor WIMP masses above 6 GeV/c2, with a minimum of 4.1 ⇥ 10�47 cm2 at 30 GeV/c2 and 90%confidence level.
PACS numbers: 95.35.+d, 14.80.Ly, 29.40.-n, 95.55.VjKeywords: Dark Matter, Direct Detection, Xenon
An abundance of astrophysical observations suggeststhe existence of a non-luminous, massive component ofthe universe called dark matter (DM) [1, 2]. The Weakly
Interacting Massive Particle (WIMP) is one of the mostpromising DM candidates, motivating numerous terres-trial and astronomical searches [3, 4]. The most suc-
arX
iv:1
805.
1256
2v1
[astr
o-ph
.CO
] 31
May
201
8

Motivation➢However, we are lucky since the observation of GW by
aLIGO has initiated a new era of exploring the nature of gravity, cosmology and the fundamental particle physics by GW.
➢Obvious shortcomings in our understanding of particle cosmology(such as the DM and the baryon asymmetry of the universe), and no evidence of NP at LHC may just point us towards new approaches, especially GW approach.
➢GW may be used to hear the echoes of DM, baryogenesis,
NP models, symmetry breaking patterns of the universe.
Hearing the signal of dark sectors with gravitational wave detectors J.Jaeckel, V. V. Khoze, M. Spannowsky, Phys.Rev. D94 (2016) no.10, 103519

phase transition GW in a nutshell
E. Witten, Phys. Rev. D 30, 272 (1984) C. J. Hogan, Phys. Lett. B 133, 172 (1983); M. Kamionkowski, A. Kosowsky and M. S. Turner, Phys. Rev. D 49, 2837 (1994)) EW phase transition GW becomes more interesting and realistic after the discovery of Higgs by LHC and GW by LIGO.
Strong First-order phase transition (FOPT) can drive the plasma of the early universe out of thermal equilibrium, and bubbles nucleate during it, which will produce GW.

➢Bubble collision: well-known source from 1983
➢Turbulence in the plasma fluid: a fraction of the bubble wall energy converted into turbulence.
➢Sound wave in the plasma fluid: after the collision a fraction of bubble wall energy converted into motion of the fluid (and is only later dissipated). New mechanism of GW:sound wave
Mark Hindmarsh, et al., PRL 112, 041301 (2014);
Mechanisms of GW during phase transition

To discuss the phase transition GW spectra in NP models, it is necessary to begin with the one-loop finite temperature effective potential:
During a FOPT, bubbles are nucleated with the following nucleation rate:
N.B. Daisy resummation is important for the validity of perturbative expansion to avoid IR divergence.

To obtain the bubble nucleation rate, the profile of the scalar field needs to be calculated by solving the following bounce equation using the overshooting/undershooting method:

Sound wave
Bubble collision
Turbulence

Inert Doublet Models
provide natural DM candidate
provide strong FOPT and phase transition GW
FPH, Jiang-hao Yu, arXiv: 1704.04201
Motivated by the absence of DM signal in DM direct detection (such as the LUX, PandaX-II, XENON1T), a generic classes of scalar DM models have been pushed to the blind spots where dark matter-Higgs coupling is very small. We use the complementary searches via phase transition GW and the future lepton collider signatures to un-blind the blind DM spots.
I. Probing DM blind spot by GW&collider

One-loop finite temperature effective potential
EW phase transition type in inert doublet model
The two-loop finite temperature effective potential slightly weaken the strength of the phase transition arXiv:1702.07479, arXiv:1811.00336,

DM and FOPT favor Higgs funnel region
N.B.: Even though the Higgs-DM coupling are pretty small constrained from DM direct detection, the strong FOPT can still be induced.
Higgs funnel region: the DM mass is about half of the Higgs mass
5
the barrier and hence produce strong FOPT. However,the cubic terms should be large enough to produce astrong FOPT. To avoid diluting the cubic contributionto the thermal barrier, the Higgs boson field independentterm needs to be very small [35, 65].
By calculations, we find that small DM direct detectionrate and a strong FOPT can be realized when we takethe blind spot region, in which �h�� = �345/2 approachesto zero 4. The DM model of IDM needs to satisfy therequired DM relic density observed from Planck: ⌦h2 =0.1184 ± 0.0012 [66]. This put very strict constraintson the IDM: the DM mass is determined to be m� >
540 GeV [43] except for the parameter region with largemass splitting between charged and neutral components.For the DM mass lower than mh/2, the Higgs invisibledecay puts very tight constraint on the parameter space.According to the latest study [48], there are two viablemass regions:
• near Higgs funnel region with large mass splitting be-tween charged and neutral components: m� around55 ⇠ 75 GeV with �345 < 0.04;
• heavy DM region: mH > 540 GeV with �345 in abroader range as m� gets heavier.
To keep the scalar non-decoupled from the thermal plasma,it is necessary to have light DM. The dominant DM anni-hilation channel will be �� ! WW
⇤, ZZ
⇤ with contact,t- and s-channels. We will focus on the DM mass around55 ⇠ 75 GeV, and the blind spot region with �345 ' 0.Combined the direct DM constraints, the DM relic den-sity, collider constraints [48] and the conditions for strongFOPT, this light mass region 55 ⇠ 75 GeV is favored. Thestrong FOPT can be produced if �3/2 and (�3+�4��5)/2are order 1, then detectable GW signals can be produced,while keep the coupling between Higgs boson and DMpair small enough to satisfy DM direct experiments andrelic density.Considering the above discussion, we take one set of
benchmark points �3 = 2.84726, �4 = �5 = �1.41463 andMD = 59.6 GeV. Then, the corresponding DM mass is64 GeV, the pseudo scalar mass and the charged scalarmass are both 299.6 GeV, �h�� = �345/2 = 0.009. In thismodel, the 299.6 GeV scalar boson can just make thermalcontributions to the FOPT and they would be decoupledfrom thermal plasma if their masses are larger than 300GeV [63]. And for this set of benchmark points, it issafe from reliability of perturbative analysis as discussedin Ref. [63]. Taking this set of benchmark points, therelic density, DM direct search, collider constraints anda strong FOPT can be satisfied simultaneously. Usingthe methods and formulae above, the phase transitionGW signal from the three souces is shown in Fig.1, which
4 �345 can be very small due to the cancellation between threecouplings �3, �4 and �5 while keeping �3 large enough to producea strong FOPT.
FIG. 1: The phase transition GW spectra h2⌦GW in the IDM.The colored regions represent the expected sensitivities ofGW interferometers U-DECIGO, DECIGO, BBO and LISA,respectively. The black line depicts the GW spectra in theIDM for the set of benchmark points, which also representsthe corresponding hZ cross section deviation at the 240 GeVCEPC and the corresponding DM coupling.
is just within the sensitivity of BBO and U-DICIGO.The colored regions represent the sensitivities of di↵erentGW experiments (DECIGO [67], LISA [68], BBO, and U-DECIGO [41]), and the black line corresponds to the GWsignals, which also means the hZ cross section (e++e
�!
h+Z) deviation from the SM in 240 GeV circular electron-positron collider (CEPC). At the 240 GeV CEPC [69]with an integrated luminosity of 10 ab�1, the precisionof �hZ could be about 0.4% [70]. And at the 240 GeVCEPC, the deviation of the hZ cross section �hZ ⌘
���SM�SM
at one-loop level [71] is about 1.67% [72, 73], which iswell within the sensitivity of CEPC. The internationallinear collider (ILC) [70] can also test this model. TheGW signal and the hZ cross section deviation at futurelepton collider can make a double test on the DM of IDMas shown in Fig. 1.
III. GRAVITATIONAL WAVES IN MIXED
DARK MATTERS
We have discussed FOPT and GWs if there is onlyone single multiplet scalar dark matter in the dark sector.Due to the tight correlation between strong FOPT andthe DM direct detection, only the IDM is viable for strongFOPT and detectable GWs. Based on the relic densityrequirement, the IDM has very limited viable parameterregion: m� ' 55 ⇠ 75 GeV, and the blind spot region�345 ' 0. In this section, we would like to extend thesingle DM multiplet models into the mixed scalar DMmodels.The mixed scalar DM scenario involves in several Z2-
odd scalar multiplets in the dark sector, which could bemixed. The simplest models involve in two dark mattermultiplets: the mixed singlet-doublet model (MSDM)

➢ GW and CEPC detectors can explore the blind spots of DM ➢ The study naturally bridges the particle physics at collider
with GW and DM.
Correlate DM, particle collider and GW signals
We also study the mixed inert singlet-doublet and mixed inert singlet-triplet model in arXiv: 1704.04201 FPH, Jiang-hao Yu Work in progress with Eibun Senaha to include the baryogenesis in minimal extended inert doublet model with dynamical CP violation source.
5
reads as
V � �T
12⇡
X
i=b
nb
⇣⇥m
2i(h, T )
⇤3/2�⇥m
2i(h)
⇤3/2⌘.
Here, the thermal field-dependent masses m2i(h, T ) ⌘
m2i(h) + ⇧i(h, T ), where ⇧i(h, T ) is the bosonic field
i’s self-energy in the IR limit. This cubic term is theunique source to produce a thermal barrier in the e↵ectivepotential, and in the Higgs sector extended models, thenew degree of freedoms in the inert scalar models increasethe barrier and hence produce strong FOPT. However,the cubic terms should be large enough to produce astrong FOPT. To avoid diluting the cubic contributionto the thermal barrier, the Higgs boson field independentterm needs to be very small [33, 62].
By calculations, we find that small DM direct detectionrate and a strong FOPT can be realized when we takethe blind spot region, in which �h�� = �345/2 approachesto zero 4. The DM model of IDM needs to satisfy therequired DM relic density observed from Planck: ⌦h2 =0.1184 ± 0.0012 [63]. This put very strict constraintson the IDM: the DM mass is determined to be m� >
540 GeV [40] except for the parameter region with largemass splitting between charged and neutral components.For the DM mass lower than mh/2, the Higgs invisibledecay puts very tight constraint on the parameter space.According to the latest study [45], there are two viablemass regions:
• near Higgs funnel region with large mass splitting be-tween charged and neutral components: m� around55 ⇠ 75 GeV with �345 < 0.04;
• heavy DM region: mH > 540 GeV with �345 in abroader range as m� gets heavier.
To keep the scalar non-decoupled from the thermal plasma,it is necessary to have light DM. The dominant DM anni-hilation channel will be �� ! WW
⇤, ZZ
⇤ with contact,t- and s-channels. We will focus on the DM mass around55 ⇠ 75 GeV, and the blind spot region with �345 ' 0.Combined the direct DM constraints, the DM relic den-sity, collider constraints [45] and the conditions for strongFOPT, this light mass region 55 ⇠ 75 GeV is favored. Thestrong FOPT can be produced if �3/2 and (�3+�4��5)/2are order 1, then detectable GW signals can be produced,while keep the coupling between Higgs boson and DMpair small enough to satisfy DM direct experiments andrelic density.Considering the above discussion, we take one set of
benchmark points �3 = 2.84726, �4 = �5 = �1.41293 andMD = 60.89 GeV. Then, the corresponding DM mass is66 GeV, the pseudo scalar mass and the charged scalar
4 �345 can be very small due to the cancellation between threecouplings �3, �4 and �5 while keeping �3 large enough to producea strong FOPT.
FIG. 1: The phase transition GW spectra h2⌦GW in the IDM.The colored regions represent the expected sensitivities ofGW interferometers U-DECIGO, DECIGO, BBO and eLISA,respectively. The black line depicts the GW spectra in theIDM for the set of benchmark points, which also representsthe corresponding hZ cross section deviation at the 240 GeVCEPC and the corresponding DM coupling.
mass are both 300 GeV, �h�� = �345/2 = 0.0107. In thismodel, the 300 GeV scalar boson can just make thermalcontributions to the FOPT and they would be decoupledfrom thermal plasma if their masses are larger than 300GeV [60]. And for this set of benchmark points, it issafe from reliability of perturbative analysis as discussedin Ref. [60]. Taking this set of benchmark points, therelic density, DM direct search, collider constraints and astrong FOPT can be satisfied simultaneously. Using themethods and formulae above, the phase transition GWsignal is shown in Fig.1, which is just within the sensitivityof BBO and U-DICIGO. The colored regions represent thesensitivities of di↵erent GW experiments (DECIGO [64],LISA [65], BBO, and U-DECIGO [38]), and the blackline corresponds to the GW signals, which also meansthe hZ cross section (e+ + e
�! h+ Z) deviation from
the SM in 240 GeV circular electron-positron collider(CEPC). At the 240 GeV CEPC [66] with an integratedluminosity of 10 ab�1, the precision of �hZ could be about0.4% [67]. And at the 240 GeV CEPC, the deviation ofthe hZ cross section �hZ ⌘
���SM�SM
at one-loop level [68] isabout 1.68% [69, 70], which is well within the sensitivityof CEPC. The international linear collider (ILC) [67] canalso test this model. The GW signal and the hZ crosssection deviation at future lepton collider can make adouble test on the DM of IDM as shown in Fig. 1.
III. GRAVITATIONAL WAVES IN MIXED
DARK MATTERS
We have discussed FOPT and GWs if there is onlyone single multiplet scalar dark matter in the dark sector.Due to the tight correlation between strong FOPT andthe DM direct detection, only the IDM is viable for strong
5
the barrier and hence produce strong FOPT. However,the cubic terms should be large enough to produce astrong FOPT. To avoid diluting the cubic contributionto the thermal barrier, the Higgs boson field independentterm needs to be very small [35, 65].
By calculations, we find that small DM direct detectionrate and a strong FOPT can be realized when we takethe blind spot region, in which �h�� = �345/2 approachesto zero 4. The DM model of IDM needs to satisfy therequired DM relic density observed from Planck: ⌦h2 =0.1184 ± 0.0012 [66]. This put very strict constraintson the IDM: the DM mass is determined to be m� >
540 GeV [43] except for the parameter region with largemass splitting between charged and neutral components.For the DM mass lower than mh/2, the Higgs invisibledecay puts very tight constraint on the parameter space.According to the latest study [48], there are two viablemass regions:
• near Higgs funnel region with large mass splitting be-tween charged and neutral components: m� around55 ⇠ 75 GeV with �345 < 0.04;
• heavy DM region: mH > 540 GeV with �345 in abroader range as m� gets heavier.
To keep the scalar non-decoupled from the thermal plasma,it is necessary to have light DM. The dominant DM anni-hilation channel will be �� ! WW
⇤, ZZ
⇤ with contact,t- and s-channels. We will focus on the DM mass around55 ⇠ 75 GeV, and the blind spot region with �345 ' 0.Combined the direct DM constraints, the DM relic den-sity, collider constraints [48] and the conditions for strongFOPT, this light mass region 55 ⇠ 75 GeV is favored. Thestrong FOPT can be produced if �3/2 and (�3+�4��5)/2are order 1, then detectable GW signals can be produced,while keep the coupling between Higgs boson and DMpair small enough to satisfy DM direct experiments andrelic density.Considering the above discussion, we take one set of
benchmark points �3 = 2.84726, �4 = �5 = �1.41463 andMD = 59.6 GeV. Then, the corresponding DM mass is64 GeV, the pseudo scalar mass and the charged scalarmass are both 299.6 GeV, �h�� = �345/2 = 0.009. In thismodel, the 299.6 GeV scalar boson can just make thermalcontributions to the FOPT and they would be decoupledfrom thermal plasma if their masses are larger than 300GeV [63]. And for this set of benchmark points, it issafe from reliability of perturbative analysis as discussedin Ref. [63]. Taking this set of benchmark points, therelic density, DM direct search, collider constraints anda strong FOPT can be satisfied simultaneously. Usingthe methods and formulae above, the phase transitionGW signal from the three souces is shown in Fig.1, which
4 �345 can be very small due to the cancellation between threecouplings �3, �4 and �5 while keeping �3 large enough to producea strong FOPT.
BBO
DECIGOLISA
U-DECIGO
δhZ=1.67% at 240 GeV CEPC
λhχχ =0.009
10-4 10-3 10-2 0.1 1 10 10010-22
10-19
10-16
10-13
f[Hz]
h2ΩGW
FIG. 1: The phase transition GW spectra h2⌦GW in the IDM.The colored regions represent the expected sensitivities ofGW interferometers U-DECIGO, DECIGO, BBO and LISA,respectively. The black line depicts the GW spectra in theIDM for the set of benchmark points, which also representsthe corresponding hZ cross section deviation at the 240 GeVCEPC and the corresponding DM coupling.
is just within the sensitivity of BBO and U-DICIGO.The colored regions represent the sensitivities of di↵erentGW experiments (DECIGO [67], LISA [68], BBO, and U-DECIGO [41]), and the black line corresponds to the GWsignals, which also means the hZ cross section (e++e
�!
h+Z) deviation from the SM in 240 GeV circular electron-positron collider (CEPC). At the 240 GeV CEPC [69]with an integrated luminosity of 10 ab�1, the precisionof �hZ could be about 0.4% [70]. And at the 240 GeVCEPC, the deviation of the hZ cross section �hZ ⌘
���SM�SM
at one-loop level [71] is about 1.67% [72, 73], which iswell within the sensitivity of CEPC. The internationallinear collider (ILC) [70] can also test this model. TheGW signal and the hZ cross section deviation at futurelepton collider can make a double test on the DM of IDMas shown in Fig. 1.
III. GRAVITATIONAL WAVES IN MIXED
DARK MATTERS
We have discussed FOPT and GWs if there is onlyone single multiplet scalar dark matter in the dark sector.Due to the tight correlation between strong FOPT andthe DM direct detection, only the IDM is viable for strongFOPT and detectable GWs. Based on the relic densityrequirement, the IDM has very limited viable parameterregion: m� ' 55 ⇠ 75 GeV, and the blind spot region�345 ' 0. In this section, we would like to extend thesingle DM multiplet models into the mixed scalar DMmodels.The mixed scalar DM scenario involves in several Z2-
odd scalar multiplets in the dark sector, which could bemixed. The simplest models involve in two dark mattermultiplets: the mixed singlet-doublet model (MSDM)

II. Probing DM and baryogenesis relaxed in phase transition by GW&Collider
The cosmic phase transition with Q-balls production can explain baryogenesis and DM simultaneously, where constraints on DM mass and reverse dilution are significantly relaxed. We study how to probe this scenario by GW signals and collider signals at QCD NLO. FPH, Chong Sheng Li, Phys.Rev. D96 (2017) no.9, 095028
Many mechanisms to simultaneously solve the baryogenesis and DM puzzles usually have two strong constraints. One is that the DM mass is usually several GeV, and the other constraint is that in the most cases the baryon asymmetry produced by heavy particles decays should not be washed out by inverse processes. In order to guarantee the efficiency production of BAU, we need to tune the reheating temperature carefully. B. Shuve, C. Tamarit, JHEP 1710 (2017) 122
In usual asymmetry dark matter models, nDM ⇠ nB , ⇢DM ⇡ 5⇢BmDM ⇡ 5mp ⇡ 5GeV
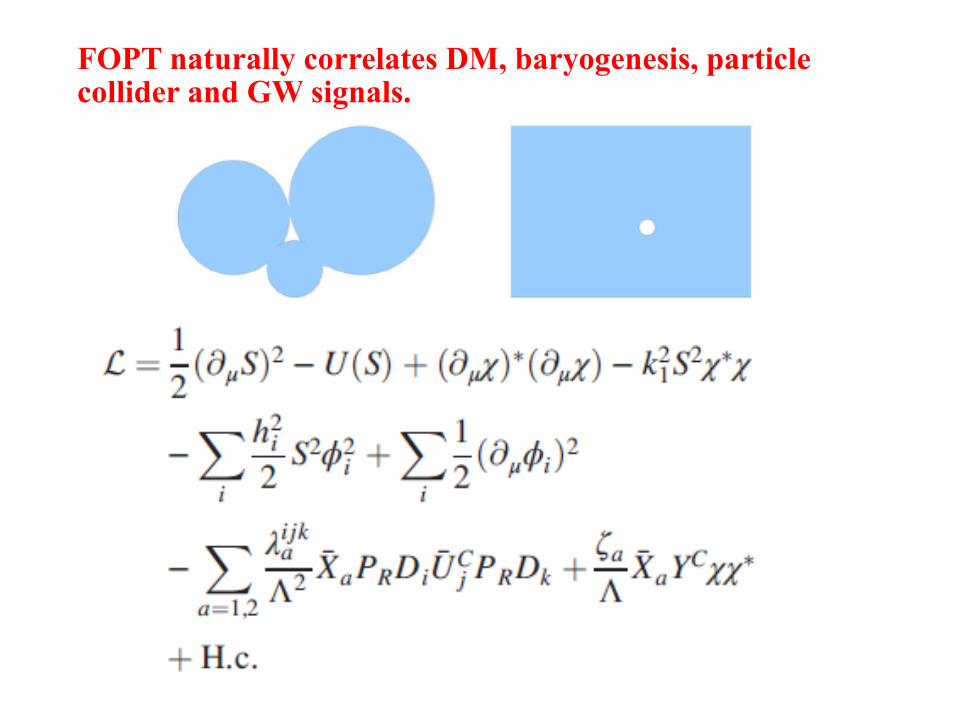
FOPT naturally correlates DM, baryogenesis, particle collider and GW signals.

with UðSÞ ¼ λSðS2 − σ2Þ2=4. And Xa represents heavyDirac fermionic mediators with several TeV mass, wherea ¼ 1, 2 and we assume mX2
> mX1. The couplings λijka
and ζa are complex numbers, which provide the CPviolation source. Xa connects the visible quarks sectorand the hidden sector. U and D represent the up-type quarkand down-type quark, respectively. The dimension-six
operator λijkaΛ2 XaPRDiUC
j PRDk plays important roles in thisscenario and appears in many baryogenesis mechanisms,such as the famous hylogenesis mechanism firstly proposedin Ref. [12]. Collider signals induced by this dimension-sixoperator have been studied at tree level using LHC Run-Idata in Ref. [11]. S is a real scalar field, which is the orderparameter field for the strong FOPT. And χ is a complexfield with a global Uð1Þ symmetry. ϕi is some unspecifiedreal scalar field, which helps to enhance the strength of thephase transition. The effective Lagrangian should berealized in some renormalizable UV-completed models,which are left for our future studies.At the very early Universe, the potential UðSÞ is
symmetric due to thermal effects. At this state, the S fieldhas no vacuum expectation value (VEV); thus the particlesχ, Y, and ϕi are massless at tree level. At a certain time, thenonthermal decays of X1 and X1 occur, which producebaryon asymmetry. The decay width of the dominantchannel for X1 at tree level X1 → Yχχ$ is
ΓðX1 → Yχχ$Þ ¼jζ1j2m3
X1
1024π3Λ2: ð2Þ
Another important decay channel is X1 → udd if only thefirst generation is considered as an example. Thus, thecorresponding decay width at tree level can be written as
ΓðX1 → uddÞ ¼3jλ1j2m5
X1
1024π3Λ4: ð3Þ
As shown in Fig. 1, the interference effects between thetwo-loop diagram and the tree-level diagram produce netbaryon asymmetry for per one ðX1; X1Þ pair decay, whichcan be quantified as
ε≡ 1
2ΓX1
ðΓðX1 → uddÞ − ΓðX1 → u d dÞÞ
∼ 10−5 ×Im½λ$1λ2ζ1ζ$2&
jζ1j2mX1
mX2
!mX1
Λ
"4
: ð4Þ
Essentially, we have ε ∝ Im½λ$1λ2ζ1ζ$2&, which represents thetree-loop interference effects [11,12]. Once the asymmetryfactor is obtained, the produced BAU can be expressedas ηB ≡nB=s ∼ ε=g$. To satisfy the observed BAUηB ≃ 10−10, ε ∼ 10−8 is needed for g$ ∼ 102. Then, theallowed parameter spaces can be obtained from Eq. (4) byrequiring ε ∼ 10−8 for a successful baryogenesis mecha-nism. The allowed parameter spaces for producing theobserved BAU are shown as the colorful surface in Fig. 2,where we have Λ > mX2
> mX1for the consistence of the
EFT. We can see that there are no strong constraints on theabsolute values of the model parameters as long as the threeratio values (Im½λ$1λ2ζ1ζ
$2&
jζ1j2;mX1mX2
;mX1Λ ) satisfy a certain relation
in Eq. (4).In this scenario, we have nχ ¼ nχ$ ¼ nY ¼ nB after the
decay of Xa particles from baryon number conservation.With the production of BAU, the DM candidate can also begiven. In most mechanisms (we take the hylogenesismechanism proposed in Ref. [12] as a typical example)
FIG. 1. Schematic Feynman diagrams for the production of BAU from the interference effects between tree-level diagram and the two-loop diagram.
FIG. 2. Parameter spaces for producing the observed BAU. Theparameter spaces on the colored surface are allowed.
FA PENG HUANG and CHONG SHENG LI PHYSICAL REVIEW D 96, 095028 (2017)
095028-2
N.B. : The real scalar S is the order-parameter field of the phase transition process.The complex scalar will be packed into the Q-balls.�

Step I: In the early universe, the potential is symmetric and S has no vacuum expectation value (VEV). We call it symmetry phase.Baryon asymmetry can be generated by heavy particle decay from the interference effects between the tree-level diagram and two-loop diagram:

The allowed parameter spaces for successful baryon asymmetry of the universe

Step II: After the needed baryon asymmetry is produced, a strong FOPT occurs when S acquires VEV(symmetry breaking phase). Then, obtains huge mass.
Q-ball DM
�
By assuming that the � particle mass in the broken phase is much larger than the critical
temperature, namely, m� = k1� � Tc, � particles get trapped in the remnants of the old
phase. Under the assumption m� = k1� � Tc, the � particle numbers entered into the
symmetry breaking phase are negligibly small due to the exponential suppression e�k1�/Tc .
And with the bubble expansion, they eventually shrink to very small size objects and become
the so-called Q-balls as DM candidates. As for the particle Y , it enters into the symmetry
breaking phase and remains massless. Thus, its contribution to the DM energy density is
negligibly and we leave the study on the its roles in the early universe for our future study.
Particles �i also obtain certain mass m� = hi�. By requiring the condition Tc & hi�,mS,
particles S and �i can make e�cient thermal contributions to the strong FOPT. More
explicitly, even when 3Tc > hi�,mS, they can still make some thermal contribution to the
FOPT. Thus, the fundamental requirement for this scenario can be written as
k1� � Tc & hi�,mS . (5)
Now, we begin the quantitative investigation from the conditions for a strong FOPT.
From Eq. (1), using the standard finite temperature quantum field theory [13], we can
obtain the following one-loop e↵ective potential at finite temperature
Ve↵(S, T ) ⇡(�µ
2
S+ c T
2)S2
2�
e T (S2)3/2
12⇡+
�S
4S4, (6)
where µ2
S= �S�
2 and m2
S= 2�S�
2. The parameter e quantifies the interactions between
the S field and the bosons which can make thermal contributions to the phase transition.
Here, the high temperature expansion approximation (namely, the thermal boson function
Jboson = �⇡4
45+ ⇡
2
12
m2
T 2 �⇡
6(m
2
T 2 )32 + ...) has been used to obtain the simple results in Eq. (6).
The thermal correction to the coupling �S is also omitted. Under these approximations, one
can get e sP
ih3
i+ (3�S)3/2 and c s �S/4 +
Pih2
i/12. To obtain a strong FOPT, one
needs �(Tc)/Tc & 1 as shown in Fig. 3; namely, one must have
�(Tc)
Tc
s e
6⇡�S
& 1, (7)
where
Tc s6⇡µS
p2�S
p�e2 + 72c⇡2�S
. (8)
The parameter spaces in the blue region of Fig. 3 are excluded by the condition of the strong
FOPT.
6
And with the bubble expansion, they eventually shrink to very small size objects and become the so-called Q-balls as DM candidates.
Here, we qualitatively show the physics process and will give the quantitative results later.
E. Krylov, A. Levin, V. Rubakov,Phys.Rev. D87 (2013) no.8, 083528

Step II: After the needed baryon asymmetry is produced, a strong FOPT occurs when S acquires VEV(symmetry breaking phase).
Q-ball DM
for explaining DM and BAU simultaneously, the DMmasses should be several GeV [11,12]. And the rescattereffects can wash out the generated baryon asymmetry in thedecays of the X1, X1 pair. To suppress this inverse process,additional strong constraints are needed, such as therequirements of tuning the reheating temperature [11,12].These two constraints can greatly suppress the allowedparameter spaces for successful baryogenesis and DM. Aphase transition mechanism [9] with Q-balls generation [5]is studied in this work to avoid these constraints, which arediscussed carefully in the following section.
III. STRONG FIRST-ORDER PHASETRANSITION AT TEV SCALE ANDGRAVITATIONAL WAVE SIGNALS
First, we qualitatively describe the scenario that thephase transition with Q-balls generation can relax the aboveconstraints. After the production of baryon asymmetryfrom heavy particle decay, we assume that a strong FOPToccurs at several TeV scale by the S field in Eq. (1). Thus,the S field acquires VEV, and the χ particle obtains largemass. By assuming that the χ particle mass in the brokenphase is much larger than the critical temperature, namely,mχ ¼ k1σ ≫ Tc, χ particles get trapped in the remnants ofthe old phase. Under the assumptionmχ ¼ k1σ ≫ Tc, the χparticle numbers entered into the symmetry breaking phaseare negligibly small due to the exponential suppressione−k1σ=Tc . And with the bubble expansion, they eventuallyshrink to very small size objects and become the so-calledQ-balls as DM candidates. As for the particle Y, it entersinto the symmetry breaking phase and remains massless.Thus, its contribution to the DM energy density is negli-gible and we leave the study of its roles in the earlyUniverse for our future study. Particles ϕi also obtaincertain mass mϕ ¼ hiσ. By requiring the conditionTc ≳ hiσ; mS, particles S and ϕi can make efficient thermalcontributions to the strong FOPT. More explicitly, evenwhen 3Tc > hiσ; mS, they can still make some thermalcontribution to the FOPT. Thus, the fundamental require-ment for this scenario can be written as
k1σ ≫ Tc ≳ hiσ; mS: ð5Þ
Now, we begin the quantitative investigation from theconditions for a strong FOPT. From Eq. (1), using thestandard finite temperature quantum field theory [13], wecan obtain the following one-loop effective potential atfinite temperature,
VeffðS; TÞ≈ð−μ2S þ cT2ÞS2
2−eTðS2Þ3=2
12πþ λS
4S4; ð6Þ
where μ2S ¼ λSσ2 and m2S ¼ 2λSσ2. The parameter e quan-
tifies the interactions between the S field and the bosons,
which can make thermal contributions to the phase tran-sition. Here, the high temperature expansion approximation(namely, the thermal boson function Jboson ¼ −π4
45þπ212
m2
T2 −π6 ð
m2
T2Þ32 þ…) has been used to obtain the simple
results in Eq. (6). The thermal correction to the coupling λSis also omitted. Under these approximations, one can gete∼
Pih
3i þ ð3λSÞ3=2 and c∼λS=4þ
Pih
2i =12. To obtain
a strong FOPT, one needs σðTcÞ=Tc ≳ 1 as shown in Fig. 3;namely, one must have
σðTcÞTc
∼e
6πλS≳ 1; ð7Þ
where
Tc ∼6πμS
ffiffiffiffiffiffiffi2λS
pffiffiffiffiffiffiffiffiffiffiffiffiffiffiffiffiffiffiffiffiffiffiffiffiffiffiffiffiffiffi−e2 þ 72cπ2λS
p : ð8Þ
The parameter spaces in the blue region of Fig. 3 areexcluded by the condition of the strong FOPT.At the end of the FOPT, the χ particles are packed into
the so-called Q-balls, which are compact nontopologicalsoliton objects that exist in some new physics modelspossessing a global symmetry. In this work, we consider theFriedberg-Lee-Sirlin-type Q-balls [6–8] and study whetherthis type of Q-ball can be given the observed DM density inthis scenario. Here, the Q-balls are generated because the χparticles just have global Uð1Þ symmetry1 χ → eiαχ. Thestable Q-ball is a spherical object, where S ¼ σ outside theQ-balls and S ¼ 0 inside the Q-balls, respectively. Toexplain the observed DM energy density, it needs to satisfythe condition
0 1 2 3 40.00
0.05
0.10
0.15
0.20
1
2
3
4
5
6
FIG. 3. Parameter spaces for producing a strong FOPT wherethe blue region is excluded.
1To avoid the domain wall problem, we assume the Z2symmetry is broken.
PROBING THE BARYOGENESIS AND DARK MATTER … PHYSICAL REVIEW D 96, 095028 (2017)
095028-3
ρDM ¼ mQnQ; ð9Þ
where the current DM mass density ρDM ≃1×10⁻⁶GeV·cm−3. To obtain the Q-ball mass mQ, itis necessary to minimize the following Q-ball energy2:
EðRÞ ¼ πQR
þ 4π3R3U0; ð10Þ
whereU0 ¼ λSσ4=4. And byminimizing Eq. (10), the Q-ballmass can be written as [5]
mQ ¼ 4ffiffiffi2
pπ
3Q3=4U1=4
0 : ð11Þ
The stability of the Q-balls needs mQ < Qk1σ. Since thenonthermal decays of the heavy particles give nχ ¼ nχ% ¼nB, one can see that
nQQs
¼ 2nBs
¼ 2ηB; ð12Þ
where ηB ∼ 10−10. From Eqs. (9) and (12), we obtain
QmQ
""""t0
¼ 2ηBs0ρDM
; ð13Þ
where the t0 and s0 represent the present value and the currententropy density s0 ≃ 3000 cm−3. Thus, it is necessary tocalculate the number density of Q-balls and the typical Q-ballcharge at T%, which can be obtained by estimating the volumeV% from which χ particles are collected into a single Q-ball.Based on the fact that the Q-ball volume is the same order asthe volume of the remnant of the symmetry unbroken phase,the radius R% of the remnant can be estimated by requiringR3%ΓðTÞ R%
vb∼ 1 for the bubble expansion with velocity vb [5].
In other words, R% ∼ ð vbΓðTÞÞ
14. Thus, the Q-ball volume is
approximatelyV% ¼ 4π3 R
3%, and the number density ofQ-balls
nQ ¼ V−1% at T% when the phase transition terminates. From
Eq. (11), we can calculate the Q-ball mass.To clearly see the constraints, we need to know the phase
transition dynamics from the previous results. It is neces-sary to start with the calculation of the bubble nucleationrate per unit volume Γ ¼ Γ0ðTÞe−SEðTÞ and Γ0ðTÞ ∝ T4
[14]. The Euclidean action SEðTÞ≃ S3ðTÞ=T [15,16], andthen Γ ¼ Γ0e−S3=T [14], where
S3ðTÞ ¼Z
d3x#1
2ð∇SÞ2 þ VeffðS; TÞ
$: ð14Þ
From Eq. (6), the analytic result of S3=T can be obtained[17,18] as
S3T
≈13.72 × 144π2
e2
%−μ2S þ cT2
2T2
&32
f#−μ2S þ cT2
2T2
144π2λSe2
$
ð15Þ
without assuming the thin wall approximation. Here,fðxÞ ¼ 1 þ x
4 ½1 þ2.41−x þ
0.26ð1−xÞ2'. And the FOPT termination
temperature is determined by
S3ðT%Þ=T% ¼ 4 lnðT%=100 GeVÞ þ 137; ð16Þ
which means the nucleation probability of one bubble perone horizon volume becomes order 1. This explains whywe can estimate the Q-ball volume V% when the phasetransition terminates in the above discussions.Combing the above results, the conditions for the
observed BAU and DM density give
ρ4DMv3=4b ¼ 73.5ð2ηBs0Þ3λSσ4Γ3=4: ð17Þ
This equation can give explicit constraints on the modelparameters, since ΓðT%Þ is determined by the phasetransition dynamics that can be calculated from the originalLagrangian. As for the bubble wall velocity vb, in principle,it is also depends on the phase transition dynamics.However, we just take vb ¼ 0.3 as the default bubble wallvelocity for simplicity. For Eq. (17) to satisfy the currentDM density, the BAU, and the condition for strong FOPT,the critical temperature Tc is numerically around severalTeV, or roughly 1 TeV < Tc < 20 TeV. And k1 is aboutOð4Þ from Eqs. (5) and (17). We list some benchmarkpoints in Table I.Here, there is a strong FOPT at several TeV scale, which
produces sizable phase transition GWs. We consider threephase transition GW sources: the well-known bubblecollisions [19], the turbulence in the fluid, where a certainfraction of the bubble wall energy is converted intoturbulence [20,21], and the new source of sound waves[22]. There are usually four parameters that determine thephase transition GW spectrum, namely, vb, λi, α, and
βH%.
The bubble wall velocity vb and the energy efficiency factorλi (i ¼ co, tu, sw) are not easy to be obtained directly fromthe Lagrangian, and we just choose some default value or
TABLE I. The benchmark sets after considering the combinedconstraints for producing the observed DM density and BAUwithvb ¼ 0.3.
Benchmark sets λS e c Tc [TeV] σTC
I 0.008 0.754 1 15.9 5II 0.0016 0.151 1 6.6 5
2Here, we omit the surface energy of the Q-balls since thesurface energy is much smaller compared to E(R) [9].
FA PENG HUANG and CHONG SHENG LI PHYSICAL REVIEW D 96, 095028 (2017)
095028-4

Step II: After the needed baryon asymmetry is produced, a strong FOPT occurs when S acquires VEV(symmetry breaking phase). Then, obtains huge mass.
Q-ball DM
�
To obtain the Q-ball mass mQ, it is necessary to minimize the following Q-ball energy
ρDM ¼ mQnQ; ð9Þ
where the current DM mass density ρDM ≃1×10⁻⁶GeV·cm−3. To obtain the Q-ball mass mQ, itis necessary to minimize the following Q-ball energy2:
EðRÞ ¼ πQR
þ 4π3R3U0; ð10Þ
whereU0 ¼ λSσ4=4. And byminimizing Eq. (10), the Q-ballmass can be written as [5]
mQ ¼ 4ffiffiffi2
pπ
3Q3=4U1=4
0 : ð11Þ
The stability of the Q-balls needs mQ < Qk1σ. Since thenonthermal decays of the heavy particles give nχ ¼ nχ% ¼nB, one can see that
nQQs
¼ 2nBs
¼ 2ηB; ð12Þ
where ηB ∼ 10−10. From Eqs. (9) and (12), we obtain
QmQ
""""t0
¼ 2ηBs0ρDM
; ð13Þ
where the t0 and s0 represent the present value and the currententropy density s0 ≃ 3000 cm−3. Thus, it is necessary tocalculate the number density of Q-balls and the typical Q-ballcharge at T%, which can be obtained by estimating the volumeV% from which χ particles are collected into a single Q-ball.Based on the fact that the Q-ball volume is the same order asthe volume of the remnant of the symmetry unbroken phase,the radius R% of the remnant can be estimated by requiringR3%ΓðTÞ R%
vb∼ 1 for the bubble expansion with velocity vb [5].
In other words, R% ∼ ð vbΓðTÞÞ
14. Thus, the Q-ball volume is
approximatelyV% ¼ 4π3 R
3%, and the number density ofQ-balls
nQ ¼ V−1% at T% when the phase transition terminates. From
Eq. (11), we can calculate the Q-ball mass.To clearly see the constraints, we need to know the phase
transition dynamics from the previous results. It is neces-sary to start with the calculation of the bubble nucleationrate per unit volume Γ ¼ Γ0ðTÞe−SEðTÞ and Γ0ðTÞ ∝ T4
[14]. The Euclidean action SEðTÞ≃ S3ðTÞ=T [15,16], andthen Γ ¼ Γ0e−S3=T [14], where
S3ðTÞ ¼Z
d3x#1
2ð∇SÞ2 þ VeffðS; TÞ
$: ð14Þ
From Eq. (6), the analytic result of S3=T can be obtained[17,18] as
S3T
≈13.72 × 144π2
e2
%−μ2S þ cT2
2T2
&32
f#−μ2S þ cT2
2T2
144π2λSe2
$
ð15Þ
without assuming the thin wall approximation. Here,fðxÞ ¼ 1 þ x
4 ½1 þ2.41−x þ
0.26ð1−xÞ2'. And the FOPT termination
temperature is determined by
S3ðT%Þ=T% ¼ 4 lnðT%=100 GeVÞ þ 137; ð16Þ
which means the nucleation probability of one bubble perone horizon volume becomes order 1. This explains whywe can estimate the Q-ball volume V% when the phasetransition terminates in the above discussions.Combing the above results, the conditions for the
observed BAU and DM density give
ρ4DMv3=4b ¼ 73.5ð2ηBs0Þ3λSσ4Γ3=4: ð17Þ
This equation can give explicit constraints on the modelparameters, since ΓðT%Þ is determined by the phasetransition dynamics that can be calculated from the originalLagrangian. As for the bubble wall velocity vb, in principle,it is also depends on the phase transition dynamics.However, we just take vb ¼ 0.3 as the default bubble wallvelocity for simplicity. For Eq. (17) to satisfy the currentDM density, the BAU, and the condition for strong FOPT,the critical temperature Tc is numerically around severalTeV, or roughly 1 TeV < Tc < 20 TeV. And k1 is aboutOð4Þ from Eqs. (5) and (17). We list some benchmarkpoints in Table I.Here, there is a strong FOPT at several TeV scale, which
produces sizable phase transition GWs. We consider threephase transition GW sources: the well-known bubblecollisions [19], the turbulence in the fluid, where a certainfraction of the bubble wall energy is converted intoturbulence [20,21], and the new source of sound waves[22]. There are usually four parameters that determine thephase transition GW spectrum, namely, vb, λi, α, and
βH%.
The bubble wall velocity vb and the energy efficiency factorλi (i ¼ co, tu, sw) are not easy to be obtained directly fromthe Lagrangian, and we just choose some default value or
TABLE I. The benchmark sets after considering the combinedconstraints for producing the observed DM density and BAUwithvb ¼ 0.3.
Benchmark sets λS e c Tc [TeV] σTC
I 0.008 0.754 1 15.9 5II 0.0016 0.151 1 6.6 5
2Here, we omit the surface energy of the Q-balls since thesurface energy is much smaller compared to E(R) [9].
FA PENG HUANG and CHONG SHENG LI PHYSICAL REVIEW D 96, 095028 (2017)
095028-4
/ Q3/4
Q-ball stability: mQ < Qm� !!!!

Step II: After the needed baryon asymmetry is produced, a strong FOPT occurs when S acquires VEV(symmetry breaking phase). Then, obtains huge mass.
Q-ball DM
�
Now, we begin the quantitative investigation from the conditions for a strong FOPT. Using the standard finite temperature quantum field theory, we can obtain the following one-loop effective potential at finite temperature
for explaining DM and BAU simultaneously, the DMmasses should be several GeV [11,12]. And the rescattereffects can wash out the generated baryon asymmetry in thedecays of the X1, X1 pair. To suppress this inverse process,additional strong constraints are needed, such as therequirements of tuning the reheating temperature [11,12].These two constraints can greatly suppress the allowedparameter spaces for successful baryogenesis and DM. Aphase transition mechanism [9] with Q-balls generation [5]is studied in this work to avoid these constraints, which arediscussed carefully in the following section.
III. STRONG FIRST-ORDER PHASETRANSITION AT TEV SCALE ANDGRAVITATIONAL WAVE SIGNALS
First, we qualitatively describe the scenario that thephase transition with Q-balls generation can relax the aboveconstraints. After the production of baryon asymmetryfrom heavy particle decay, we assume that a strong FOPToccurs at several TeV scale by the S field in Eq. (1). Thus,the S field acquires VEV, and the χ particle obtains largemass. By assuming that the χ particle mass in the brokenphase is much larger than the critical temperature, namely,mχ ¼ k1σ ≫ Tc, χ particles get trapped in the remnants ofthe old phase. Under the assumptionmχ ¼ k1σ ≫ Tc, the χparticle numbers entered into the symmetry breaking phaseare negligibly small due to the exponential suppressione−k1σ=Tc . And with the bubble expansion, they eventuallyshrink to very small size objects and become the so-calledQ-balls as DM candidates. As for the particle Y, it entersinto the symmetry breaking phase and remains massless.Thus, its contribution to the DM energy density is negli-gible and we leave the study of its roles in the earlyUniverse for our future study. Particles ϕi also obtaincertain mass mϕ ¼ hiσ. By requiring the conditionTc ≳ hiσ; mS, particles S and ϕi can make efficient thermalcontributions to the strong FOPT. More explicitly, evenwhen 3Tc > hiσ; mS, they can still make some thermalcontribution to the FOPT. Thus, the fundamental require-ment for this scenario can be written as
k1σ ≫ Tc ≳ hiσ; mS: ð5Þ
Now, we begin the quantitative investigation from theconditions for a strong FOPT. From Eq. (1), using thestandard finite temperature quantum field theory [13], wecan obtain the following one-loop effective potential atfinite temperature,
VeffðS; TÞ≈ð−μ2S þ cT2ÞS2
2−eTðS2Þ3=2
12πþ λS
4S4; ð6Þ
where μ2S ¼ λSσ2 and m2S ¼ 2λSσ2. The parameter e quan-
tifies the interactions between the S field and the bosons,
which can make thermal contributions to the phase tran-sition. Here, the high temperature expansion approximation(namely, the thermal boson function Jboson ¼ −π4
45þπ212
m2
T2 −π6 ð
m2
T2Þ32 þ…) has been used to obtain the simple
results in Eq. (6). The thermal correction to the coupling λSis also omitted. Under these approximations, one can gete∼
Pih
3i þ ð3λSÞ3=2 and c∼λS=4þ
Pih
2i =12. To obtain
a strong FOPT, one needs σðTcÞ=Tc ≳ 1 as shown in Fig. 3;namely, one must have
σðTcÞTc
∼e
6πλS≳ 1; ð7Þ
where
Tc ∼6πμS
ffiffiffiffiffiffiffi2λS
pffiffiffiffiffiffiffiffiffiffiffiffiffiffiffiffiffiffiffiffiffiffiffiffiffiffiffiffiffiffi−e2 þ 72cπ2λS
p : ð8Þ
The parameter spaces in the blue region of Fig. 3 areexcluded by the condition of the strong FOPT.At the end of the FOPT, the χ particles are packed into
the so-called Q-balls, which are compact nontopologicalsoliton objects that exist in some new physics modelspossessing a global symmetry. In this work, we consider theFriedberg-Lee-Sirlin-type Q-balls [6–8] and study whetherthis type of Q-ball can be given the observed DM density inthis scenario. Here, the Q-balls are generated because the χparticles just have global Uð1Þ symmetry1 χ → eiαχ. Thestable Q-ball is a spherical object, where S ¼ σ outside theQ-balls and S ¼ 0 inside the Q-balls, respectively. Toexplain the observed DM energy density, it needs to satisfythe condition
0 1 2 3 40.00
0.05
0.10
0.15
0.20
1
2
3
4
5
6
FIG. 3. Parameter spaces for producing a strong FOPT wherethe blue region is excluded.
1To avoid the domain wall problem, we assume the Z2symmetry is broken.
PROBING THE BARYOGENESIS AND DARK MATTER … PHYSICAL REVIEW D 96, 095028 (2017)
095028-3
By carefully study the phase transition dynamics, we can obtain the final volume of the Q-balls.

Final conditions to produce the observed baryon asymmetry and DM density: FPH, C.S. Li, Phys.Rev. D96 (2017) no.9, 09502
ρDM ¼ mQnQ; ð9Þ
where the current DM mass density ρDM ≃1×10⁻⁶GeV·cm−3. To obtain the Q-ball mass mQ, itis necessary to minimize the following Q-ball energy2:
EðRÞ ¼ πQR
þ 4π3R3U0; ð10Þ
whereU0 ¼ λSσ4=4. And byminimizing Eq. (10), the Q-ballmass can be written as [5]
mQ ¼ 4ffiffiffi2
pπ
3Q3=4U1=4
0 : ð11Þ
The stability of the Q-balls needs mQ < Qk1σ. Since thenonthermal decays of the heavy particles give nχ ¼ nχ% ¼nB, one can see that
nQQs
¼ 2nBs
¼ 2ηB; ð12Þ
where ηB ∼ 10−10. From Eqs. (9) and (12), we obtain
QmQ
""""t0
¼ 2ηBs0ρDM
; ð13Þ
where the t0 and s0 represent the present value and the currententropy density s0 ≃ 3000 cm−3. Thus, it is necessary tocalculate the number density of Q-balls and the typical Q-ballcharge at T%, which can be obtained by estimating the volumeV% from which χ particles are collected into a single Q-ball.Based on the fact that the Q-ball volume is the same order asthe volume of the remnant of the symmetry unbroken phase,the radius R% of the remnant can be estimated by requiringR3%ΓðTÞ R%
vb∼ 1 for the bubble expansion with velocity vb [5].
In other words, R% ∼ ð vbΓðTÞÞ
14. Thus, the Q-ball volume is
approximatelyV% ¼ 4π3 R
3%, and the number density ofQ-balls
nQ ¼ V−1% at T% when the phase transition terminates. From
Eq. (11), we can calculate the Q-ball mass.To clearly see the constraints, we need to know the phase
transition dynamics from the previous results. It is neces-sary to start with the calculation of the bubble nucleationrate per unit volume Γ ¼ Γ0ðTÞe−SEðTÞ and Γ0ðTÞ ∝ T4
[14]. The Euclidean action SEðTÞ≃ S3ðTÞ=T [15,16], andthen Γ ¼ Γ0e−S3=T [14], where
S3ðTÞ ¼Z
d3x#1
2ð∇SÞ2 þ VeffðS; TÞ
$: ð14Þ
From Eq. (6), the analytic result of S3=T can be obtained[17,18] as
S3T
≈13.72 × 144π2
e2
%−μ2S þ cT2
2T2
&32
f#−μ2S þ cT2
2T2
144π2λSe2
$
ð15Þ
without assuming the thin wall approximation. Here,fðxÞ ¼ 1 þ x
4 ½1 þ2.41−x þ
0.26ð1−xÞ2'. And the FOPT termination
temperature is determined by
S3ðT%Þ=T% ¼ 4 lnðT%=100 GeVÞ þ 137; ð16Þ
which means the nucleation probability of one bubble perone horizon volume becomes order 1. This explains whywe can estimate the Q-ball volume V% when the phasetransition terminates in the above discussions.Combing the above results, the conditions for the
observed BAU and DM density give
ρ4DMv3=4b ¼ 73.5ð2ηBs0Þ3λSσ4Γ3=4: ð17Þ
This equation can give explicit constraints on the modelparameters, since ΓðT%Þ is determined by the phasetransition dynamics that can be calculated from the originalLagrangian. As for the bubble wall velocity vb, in principle,it is also depends on the phase transition dynamics.However, we just take vb ¼ 0.3 as the default bubble wallvelocity for simplicity. For Eq. (17) to satisfy the currentDM density, the BAU, and the condition for strong FOPT,the critical temperature Tc is numerically around severalTeV, or roughly 1 TeV < Tc < 20 TeV. And k1 is aboutOð4Þ from Eqs. (5) and (17). We list some benchmarkpoints in Table I.Here, there is a strong FOPT at several TeV scale, which
produces sizable phase transition GWs. We consider threephase transition GW sources: the well-known bubblecollisions [19], the turbulence in the fluid, where a certainfraction of the bubble wall energy is converted intoturbulence [20,21], and the new source of sound waves[22]. There are usually four parameters that determine thephase transition GW spectrum, namely, vb, λi, α, and
βH%.
The bubble wall velocity vb and the energy efficiency factorλi (i ¼ co, tu, sw) are not easy to be obtained directly fromthe Lagrangian, and we just choose some default value or
TABLE I. The benchmark sets after considering the combinedconstraints for producing the observed DM density and BAUwithvb ¼ 0.3.
Benchmark sets λS e c Tc [TeV] σTC
I 0.008 0.754 1 15.9 5II 0.0016 0.151 1 6.6 5
2Here, we omit the surface energy of the Q-balls since thesurface energy is much smaller compared to E(R) [9].
FA PENG HUANG and CHONG SHENG LI PHYSICAL REVIEW D 96, 095028 (2017)
095028-4Extension work for the gauged Q-balls is working in progress with Prof. P. Ko

The predicted GW spectrum for benchmark points with vb = 0.3. Figure(a), (b), (c) represents the GW spectrum from bubble collision, sound waves and turbulence, respectively, which may be detected by future LIGO like experiments.

Collider phenomenology
There are many types of combinations for the up-type quark and down-type quark, which result in abundant collider phenomenology at the LHC.
The dominant decay channel behaves as the missing energy in the detector. So the interactions can be explored by performing mono-jet and mono-top analysis at the LHC.
Because the LHC is a proton-proton collider with high precision, the QCD NLO predictions for these processes are necessary in order to obtain reliable results.

QCD NLO prediction at the LHC
The Key point for QCD NLO calculation is Infrared divergence
Tricks for QCD NLO calculations: Two cutoff phase space slicing method (δs,δc) or dipole subtraction
We perform QCD the next-leading-order (NLO) predictions for these two cases and discuss the discovery potential at the LHC.

Mono-jet analysis at QCD NLO

Mono-top analysis at QCD NLO
FPH, C.S. Li, Phys.Rev. D96 (2017) no.9, 095028

Generally, FOPT may be induced in many other NP models, which may produce detectable GW. Examples: (1)Electroweak baryogenesis models (LISA): Exploring dynamical CP violation induced baryogenesis by gravitational waves and collidersFPH, Zhuoni Qian, Mengchao Zhang arXiv:1804.06813 Phys. Rev. D 98, 015014 (2018)
(2) Dark matter models with dark SU(N) sector (SKA): Gravitational Waves from a Dark Phase TransitionP. Schwaller Phys.Rev.Lett. 115 (2015) no.18, 181101See the various talks given by Tang Y., Fujikura K., Matsui T., Bian L
III. GW from other NP

Schematic phase transition GW spectra Probing the gauge symmetry breaking of the early universe and new physics by gravitational waves FPH, Xinmin Zhang, arXiv:1701.04338
SKA
LISA
BBO
aLIGOO5
aLIGO
Dark QCD100 MeV
Highscale10000 TeV
TeV scale10-10 10-8 10-6 10-4 0.01 1 100
10-14
10-12
10-10
10-8
10-6
10-4
f[Hz]
h2ΩGW

➢GW provides a novel way to explore DM, baryogenesis…(More and more relevant experiments, aLIGO, LISA, SKA, FAST, Tianqin, Taiji…)
➢GW becomes a new and realistic approach to explore the particle cosmology and fundamental physics.
Two examples: (1) Using aLIGO to probe extra dimension, H. Yu, B. Gu, FPH, Y. Wang, X. Meng, Y. Liu. JCAP 1702 (2017) no.02, 039 (2) Using SKA to detect axion cold dark matter, FPH, K. Kadota, T. Sekiguchi, H.Tashiro, Phys.Rev. D97 (2018) no.12, 123001 (See K. Kadota talk) ➢The correlation between GW and collider signals can
make a double test on DM, baryogenesis and other NP.
Summary and outlook