nevada 2020 annual benchmarking
TRANSCRIPT

RESEARCH AND ANALYSIS BUREAU
Nevada 2020 Annual Benchmarking Published on April 27, 2021
Each year, Nevada’s Current Employment Statistics (CES) and Local Area Unemployment Statistics (LAUS) programs undergo a revision process called “benchmarking.” This process involves updating employment and unemployment estimates by incorporating more complete information that has become available since the time of initial publication. For 2020, the benchmarking processes resulted in Nevada’s annual average unemployment rate estimate remaining unchanged at 12.8 percent, from the original estimate. CES benchmark revisions show that Nevada lost 165,000 jobs over the year (down from the original estimate of 96,900).
Jason Gortari, Economist and Dionny McDonnell, Economist
April 2021
Research and Analysis Bureau
Department of Employment, Training and Rehabilitation
1

Nevada’s Statewide CES Benchmark 2020 Nevada’s total non-farm employment numbers are estimated each month using a combination of historical data and a monthly survey of businesses conducted by the Bureau Labor of Statistics (BLS). These estimates are revised, or benchmarked, using more complete information at the beginning of each calendar year. During this process, the BLS adjusts the non-farm employment estimates using data from mandatory unemployment insurance (UI) reports submitted each quarter by nearly all employers in the State. Non-adjusted data is revised over a 21-month period; the 2020 benchmark realigned the estimates from April 2019 to December 2020. Next, the seasonal adjustment factors are modeled with this updated information, resulting in five years’ worth of revised seasonally adjusted data.
This year’s benchmark process resulted in a lower level of employment in Nevada than initially reported. Total nonfarm employment averaged 1,274,633 for the year, or 31,100 less jobs than initially estimated. Employment levels for 2019 were revised up by 3,550 jobs. Nevada’s employment declined by an annual average of 147,017 jobs over the year, a decrease of -10.3%. The private sector realized the largest reduction in employment with an annual average decrease of -10.3% jobs, while the government sector lost 5,667. Service-providing industries decreased by an annual average of 141,450 jobs, while goods-producing industries lost 5,567 jobs.
2

Nevada’s Metropolitan Statistical Areas (MSAs) Benchmark The Las Vegas region’s benchmark revealed the area’s economy lost more jobs than were initially estimated. The area saw an average of 909,100 jobs in 2020, which is 19,683 or 2.1% less than previously reported. Las Vegas saw employment decline by an average of 128,083 jobs, or -12.3%, over the course of the year. Goods-producing industries lost 4,100, while service providers declined by 123,983 jobs.
The benchmarking process resulted in a decrease in the estimated average employment level of the Reno-Sparks area in 2020. The region saw average employment of 235,092 for the year, or 250 less than initially estimated. Employment decreased by an annual average of 12,942, or -5.2%, from 2019. The service providing industries saw the largest decrease, with 11,867 jobs while the goods-producing industries decreased by 1,075 jobs.
Carson City’s benchmark process revealed the area’s economy averaged 29,492 jobs in 2020, or 175 more than previously reported. The area lost an annual average of 1,250 jobs over the year, a decrease of -4.0%. Goods-producing industries lost 250 jobs, while service providers decreased by 1,000.
3

Nevada’s Industry Super-sector Annual Average Benchmark Revisions (Unadjusted)
4
5

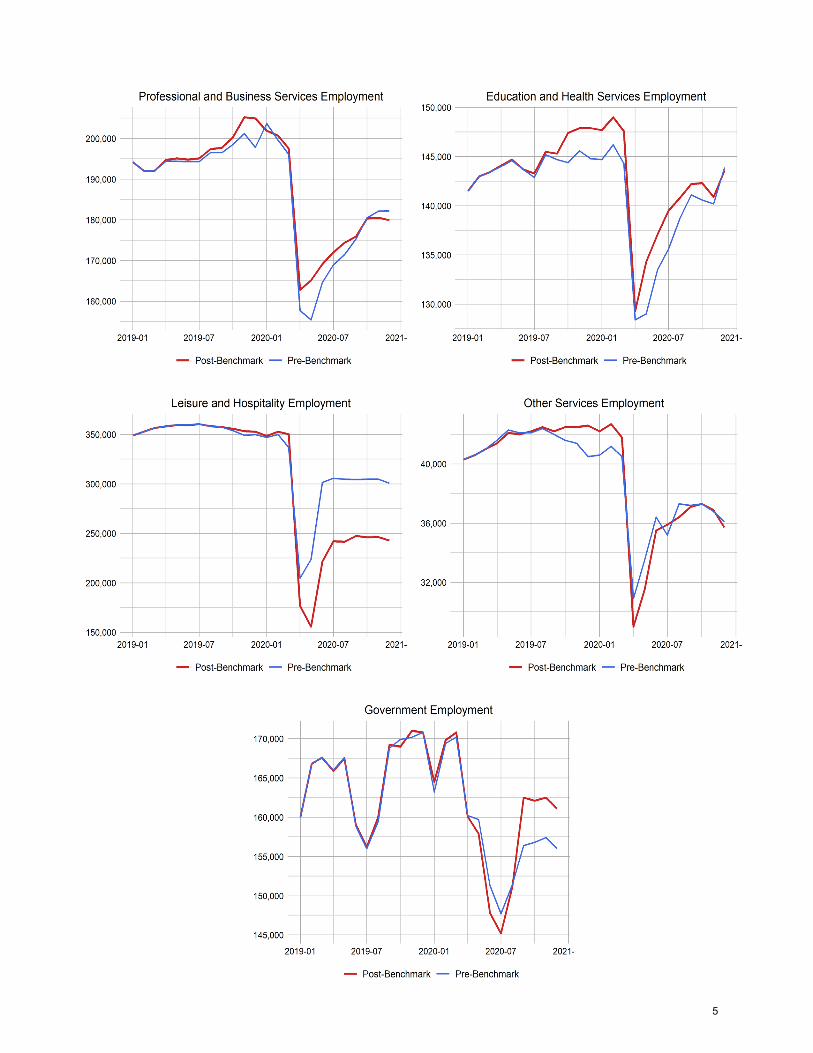
During the 2020 benchmark process, employment in the professional/business services industry was revised up by 1,875 jobs, or 1.1%.
The mining and logging sector was adjusted down by 575 jobs during the benchmark, or -3.7%.
The construction sector was revised down by 2,175 jobs during the benchmark, or -2.3%.
The manufacturing sector decreased during the benchmark, being revised down by 1,900 jobs, or -3.3%.
The trade/transportation/utilities sector was adjusted up by 13,800 jobs during the benchmark, or 5.7%. This is the largest upward revision of any sector on a nominal and percentage basis.
Estimates for the information sector saw a decrease. Information was revised down during the benchmark, with an overall decrease of 767 jobs, or -5.4%.
The financial activities sector decreased during the benchmark, being revised down by 2,050 jobs, or -3.0%.
Estimates for the education/health services industry increased average annual employment slightly during the benchmark, with an overall increase of 2,342 jobs, or 1.7%. However, December’s employment level decreased slightly, from what was originally reported prior to the benchmark.
Leisure/hospitality was revised down by 43,117 jobs or -14.4% of the total sector employment. This is the largest downward revision of any sector on a nominal and percentage basis.
Estimates for the other services sector realized a slight downward revision during the benchmark, with an overall decrease of 83 jobs, or -0.2%.
The government sector increased during the benchmark, being revised up by 1,308 jobs, or 0.8%.
6
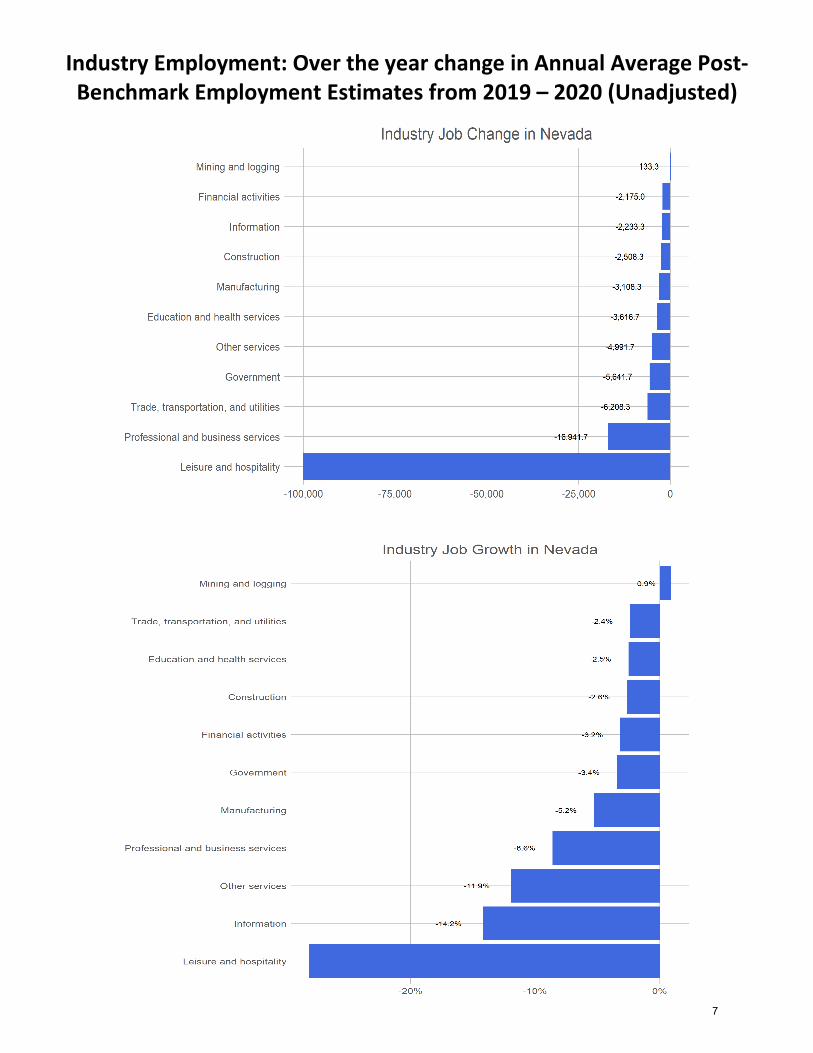
Industry Employment: Over the year change in Annual Average Post-Benchmark Employment Estimates from 2019 – 2020 (Unadjusted)
7

Industry Employment: Over the year change in Annual Average Post-Benchmark Employment Estimates from 2019 – 2020 (Adjusted)
Utilizing CES annual average employment estimates for 2019 post-benchmark year and 2020 post-benchmark year we calculate the over the year change by industry (seasonally - adjusted).
The construction sector saw the seventh largest number of jobs lost over the previous post-benchmark year on a nominal basis, declining by an average of 2,575 jobs. This corresponds to a -2.6% average annual decay rate.
Trade, transportation, and utilities, the State’s second-largest employer, saw the third-largest job loss, declining by an average of 6,142 to payrolls throughout the year from post-benchmark year 2019 to post-benchmark year 2020. Though the nominal change is large, it marks a decay rate of -2.4%, below the Statewide average of -10.3%.
The professional and business services sector follows with a decline of 16,767 jobs, or -8.5% percent. The sector saw the second-largest average number of jobs lost over the previous post-benchmark year.
Education and health services declined by an average of 3,475 jobs over the previous post-benchmark year, a decay rate of -2.4%. This puts the sector in sixth place in terms of largest nominal decline. This sector saw a sizable decline in the health care/social assistance sub-sector, which saw an average of 1,975 jobs lost in 2020 over post-benchmark year 2019.
The manufacturing sector realized the fifth fastest decay rate in the State, at -5.3%, and declined by an average of 3,108 jobs over the previous post-benchmark year. Durable goods declined by an average of 2,308 jobs, while non-durable goods declined by an average of 800.
The government sector declined by an average of 5,667 jobs in 2020 over post-benchmark year 2019, a declined by rate of -3.4%. The sector had the fourth-largest nominal decline of the eleven super-sectors. State government declined by an average of 1,142 jobs, while local government declined by an average of 5,750 and federal government added 1,225 jobs, respectively, in 2020 over the previous post-benchmark year.
Leisure and hospitality, the Silver State’s largest industry, declined by an average of 100,108 jobs in post-benchmark year 2020 over the previous post-benchmark year. Given the nature of the COVID-19 pandemic, this industry was hit hardest in the State and realized the largest reduction in employment on both a nominal and percentage basis. Leisure and hospitality had an average annual decay rate of -28.1%, the largest of the eleven sectors.
Financial activities declined by an average of 2,133 jobs, a decline of -3.1% in 2020 over the previous post-benchmark year. This nominal reduction in jobs makes the sector the second least affected of the eleven super-sectors in 2020. The finance and insurance sub-sector actually realized of growth, adding an average of 742 jobs.
Information declined by an average 2,225 jobs through the year over the previous post-benchmark year. This corresponds to a decay rate of -14.2%, the second highest.
Mining and logging added 117 jobs through the year in 2020over the previous post-benchmark year, a growth rate of 0.8%. This sector was the only sector to realize and increase of the eleven super-sectors.
8

Finally, other services declined by an average of 4,933 jobs or -11.8% in 2020 over the previous post-benchmark year. Other services realized the fifth-largest nominal decrease of the eleven sectors. The other services sector is comprised of services such as equipment/machinery repair, promoting/administering religious activities, grant making, advocacy, pet care services, and dating services, among other things not specifically defined elsewhere in the North American Industry Classification System.
9
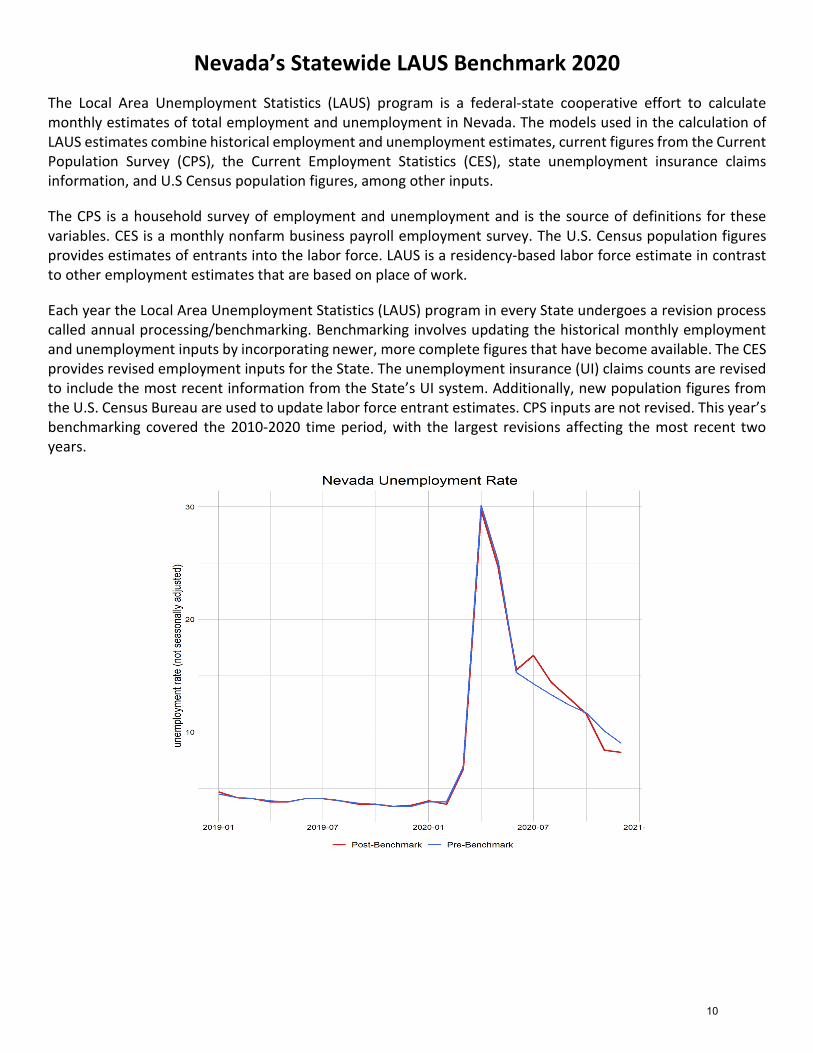
Nevada’s Statewide LAUS Benchmark 2020 The Local Area Unemployment Statistics (LAUS) program is a federal-state cooperative effort to calculate monthly estimates of total employment and unemployment in Nevada. The models used in the calculation of LAUS estimates combine historical employment and unemployment estimates, current figures from the Current Population Survey (CPS), the Current Employment Statistics (CES), state unemployment insurance claims information, and U.S Census population figures, among other inputs.
The CPS is a household survey of employment and unemployment and is the source of definitions for these variables. CES is a monthly nonfarm business payroll employment survey. The U.S. Census population figures provides estimates of entrants into the labor force. LAUS is a residency-based labor force estimate in contrast to other employment estimates that are based on place of work.
Each year the Local Area Unemployment Statistics (LAUS) program in every State undergoes a revision process called annual processing/benchmarking. Benchmarking involves updating the historical monthly employment and unemployment inputs by incorporating newer, more complete figures that have become available. The CES provides revised employment inputs for the State. The unemployment insurance (UI) claims counts are revised to include the most recent information from the State’s UI system. Additionally, new population figures from the U.S. Census Bureau are used to update labor force entrant estimates. CPS inputs are not revised. This year’s benchmarking covered the 2010-2020 time period, with the largest revisions affecting the most recent two years.
10
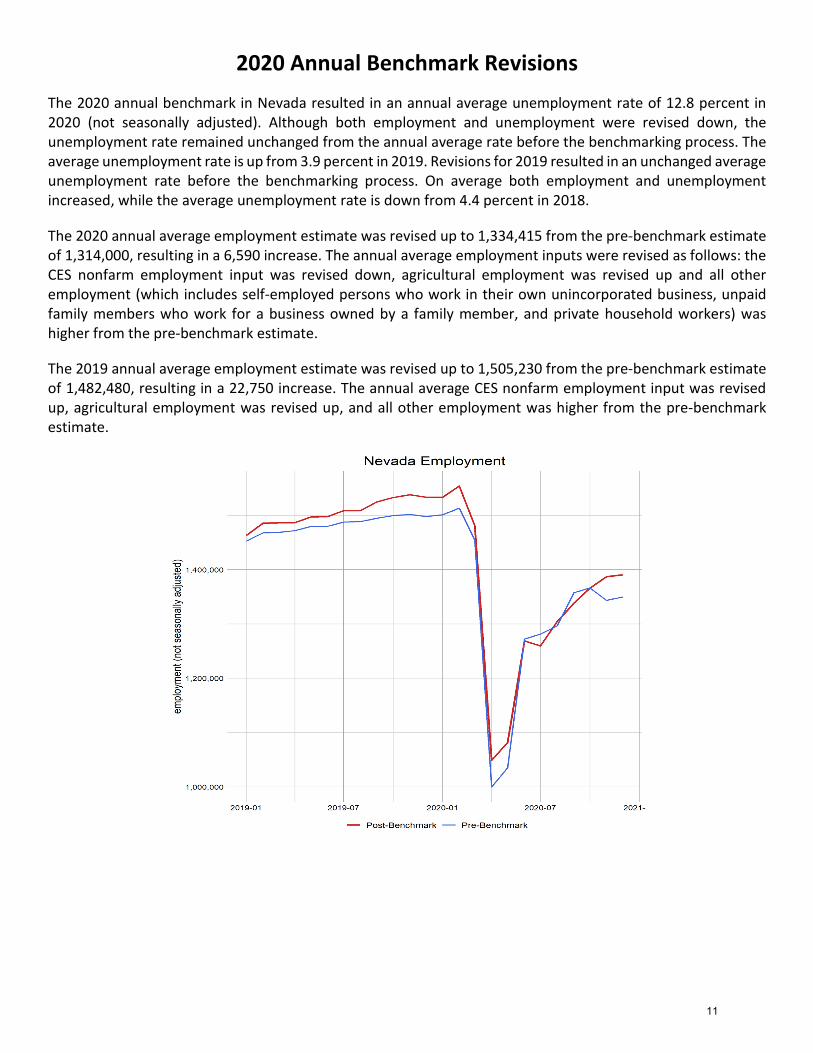
2020 Annual Benchmark Revisions The 2020 annual benchmark in Nevada resulted in an annual average unemployment rate of 12.8 percent in 2020 (not seasonally adjusted). Although both employment and unemployment were revised down, the unemployment rate remained unchanged from the annual average rate before the benchmarking process. The average unemployment rate is up from 3.9 percent in 2019. Revisions for 2019 resulted in an unchanged average unemployment rate before the benchmarking process. On average both employment and unemployment increased, while the average unemployment rate is down from 4.4 percent in 2018.
The 2020 annual average employment estimate was revised up to 1,334,415 from the pre-benchmark estimate of 1,314,000, resulting in a 6,590 increase. The annual average employment inputs were revised as follows: the CES nonfarm employment input was revised down, agricultural employment was revised up and all other employment (which includes self-employed persons who work in their own unincorporated business, unpaid family members who work for a business owned by a family member, and private household workers) was higher from the pre-benchmark estimate.
The 2019 annual average employment estimate was revised up to 1,505,230 from the pre-benchmark estimate of 1,482,480, resulting in a 22,750 increase. The annual average CES nonfarm employment input was revised up, agricultural employment was revised up, and all other employment was higher from the pre-benchmark estimate.
11
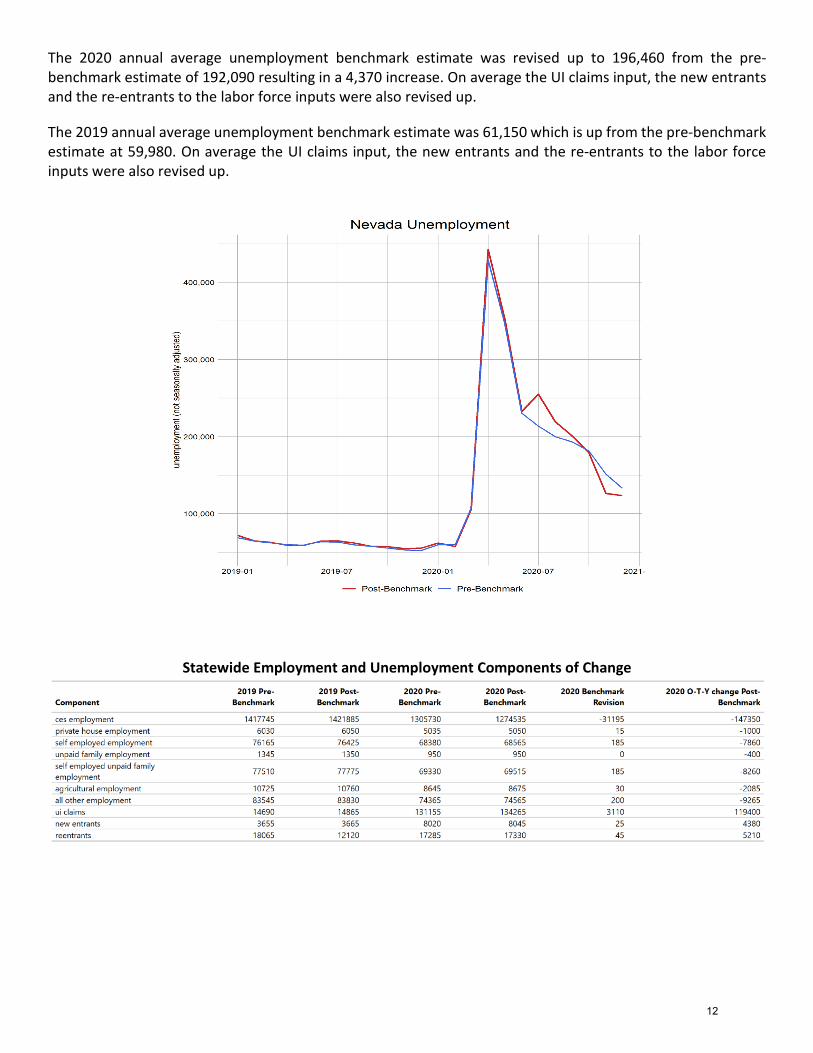
The 2020 annual average unemployment benchmark estimate was revised up to 196,460 from the pre-benchmark estimate of 192,090 resulting in a 4,370 increase. On average the UI claims input, the new entrants and the re-entrants to the labor force inputs were also revised up.
The 2019 annual average unemployment benchmark estimate was 61,150 which is up from the pre-benchmark estimate at 59,980. On average the UI claims input, the new entrants and the re-entrants to the labor force inputs were also revised up.
Statewide Employment and Unemployment Components of Change
12

Nevada Substate LAUS Benchmark 2020 After the Statewide 2020 annual processing/benchmark is completed, the Local Area Unemployment Statistics (LAUS) program makes routine revisions to figures for geographic areas below the state level. For Nevada sub-state areas (metropolitan areas, micropolitan areas, and counties), employment and unemployment estimates were revised back to 2010, with the largest revisions affecting the most recent two years. The areas below the state level are controlled to sum to the statewide employment and unemployment totals.
2020 Annual Sub-State Revisions
Metropolitan Areas
The metropolitan areas defined by the Office of Management and Budget (OMB) are “major” labor market areas (LMAs) for LAUS purposes. Metropolitan statistical areas have at least one urbanized area of 50,000 or more population, plus adjacent territory that has a high degree of social and economic integration with the urbanized area measured by commuting ties.
Las Vegas 2020 Revisions:
The 2020 annual benchmark revisions in the Las Vegas metropolitan area resulted in a 14.7 percent annual average unemployment rate in 2020 (not seasonally adjusted), which is slightly higher from the annual average estimate before the benchmark process when it was at 14.6 percent. The rate rose from 4.1 percent in 2019.
The 2020 employment levels were revised up by 11,550 people. The components of employment include non-agricultural employment, all other employment (includes self-employed persons who work for a business owned by a family member, and private household workers) and agricultural employment. In 2020, non-agricultural employment was lower and other employment was higher than originally estimated.
In 2020, unemployment levels were revised up by 3,600 people. The components of unemployment include unemployment insurance (UI) claims, unemployed exhaustees (those who have finished their UI benefits), re- entrants and new entrants to the labor force. In 2020, all components were higher than originally estimated. UI claims had the largest increase after revisions were made.
Las Vegas 2019 Revisions:
The 2019 annual average unemployment rate rose slightly from four percent to 4.1 percent in Las Vegas. Employment levels were 17,600 people higher than originally estimated. Both non-agricultural and all other employment were higher than originally estimated. Unemployment levels were higher than originally estimated by 915 people. UI claims, re-entrants and new entrants to the labor force all increased.
13

Figures below show the unemployment rate, employment levels, and unemployment levels for 2019 and 2020 before and after the benchmark process.
14
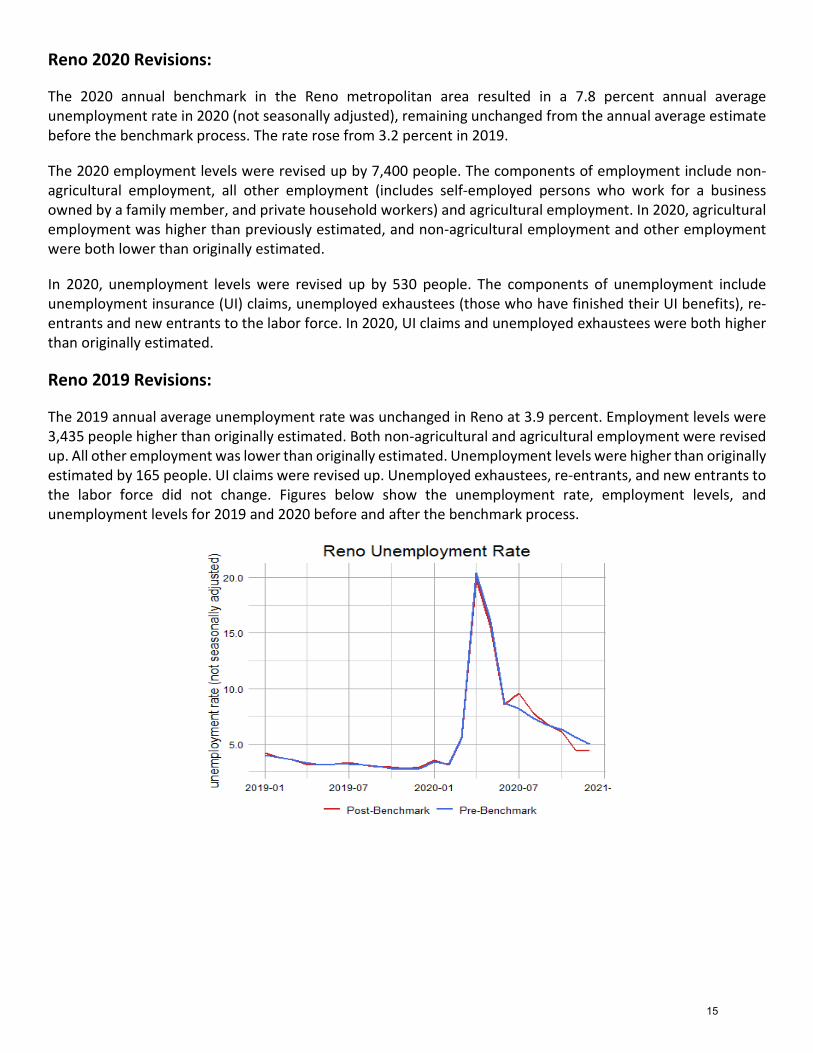
Reno 2020 Revisions:
The 2020 annual benchmark in the Reno metropolitan area resulted in a 7.8 percent annual average unemployment rate in 2020 (not seasonally adjusted), remaining unchanged from the annual average estimate before the benchmark process. The rate rose from 3.2 percent in 2019.
The 2020 employment levels were revised up by 7,400 people. The components of employment include non-agricultural employment, all other employment (includes self-employed persons who work for a business owned by a family member, and private household workers) and agricultural employment. In 2020, agricultural employment was higher than previously estimated, and non-agricultural employment and other employment were both lower than originally estimated.
In 2020, unemployment levels were revised up by 530 people. The components of unemployment include unemployment insurance (UI) claims, unemployed exhaustees (those who have finished their UI benefits), re-entrants and new entrants to the labor force. In 2020, UI claims and unemployed exhaustees were both higher than originally estimated.
Reno 2019 Revisions:
The 2019 annual average unemployment rate was unchanged in Reno at 3.9 percent. Employment levels were 3,435 people higher than originally estimated. Both non-agricultural and agricultural employment were revised up. All other employment was lower than originally estimated. Unemployment levels were higher than originally estimated by 165 people. UI claims were revised up. Unemployed exhaustees, re-entrants, and new entrants to the labor force did not change. Figures below show the unemployment rate, employment levels, and unemployment levels for 2019 and 2020 before and after the benchmark process.
15

Carson City 2020 Revisions: The 2020 annual benchmark revisions in the Carson City metropolitan area resulted in an 8.2 percent annual average unemployment rate in 2020 (not seasonally adjusted), remaining unchanged from the annual average estimate before the benchmark process. The rate rose from 3.9 percent in 2019. The 2020 employment levels were revised up by 670 people. The components of employment include non-agricultural employment, all other employment (includes self-employed persons who work for a business owned by a family member, and private household workers) and agricultural employment. In 2020, both non-agricultural employment and other employment were lower than originally estimated. In 2020, unemployment levels were revised up by 45 people. The components of unemployment include unemployment insurance (UI) claims, unemployed exhaustees (those who have finished their UI benefits), re-entrants and new entrants to the labor force. Both UI claims and unemployed exhaustees were higher than originally estimated in 2020. Carson City 2019 Revisions: The 2019 annual average unemployment rate was unchanged at 3.9 percent in Carson City. Employment levels were 310 people higher than originally estimated. Both non-agricultural and all other employment were lower than originally estimated. Unemployment levels were higher than originally estimated by 15 people. UI claims, unemployed exhaustees, re-entrants, and new entrants to the labor force were all unchanged. Figures below show the unemployment rate, employment levels, and unemployment levels for 2019 and 2020 before and after the benchmark process.
16

17
Micropolitan Areas
The micropolitan areas defined by the Office of Management and Budget (OMB) are also “major” labor market areas (LMAs) for LAUS purposes. Micropolitan statistical areas have at least one urban cluster of at least 10,000 but less than 50,000 population, plus adjacent territory that has a high degree of social and economic integration with the urban areas measured by commuting ties.
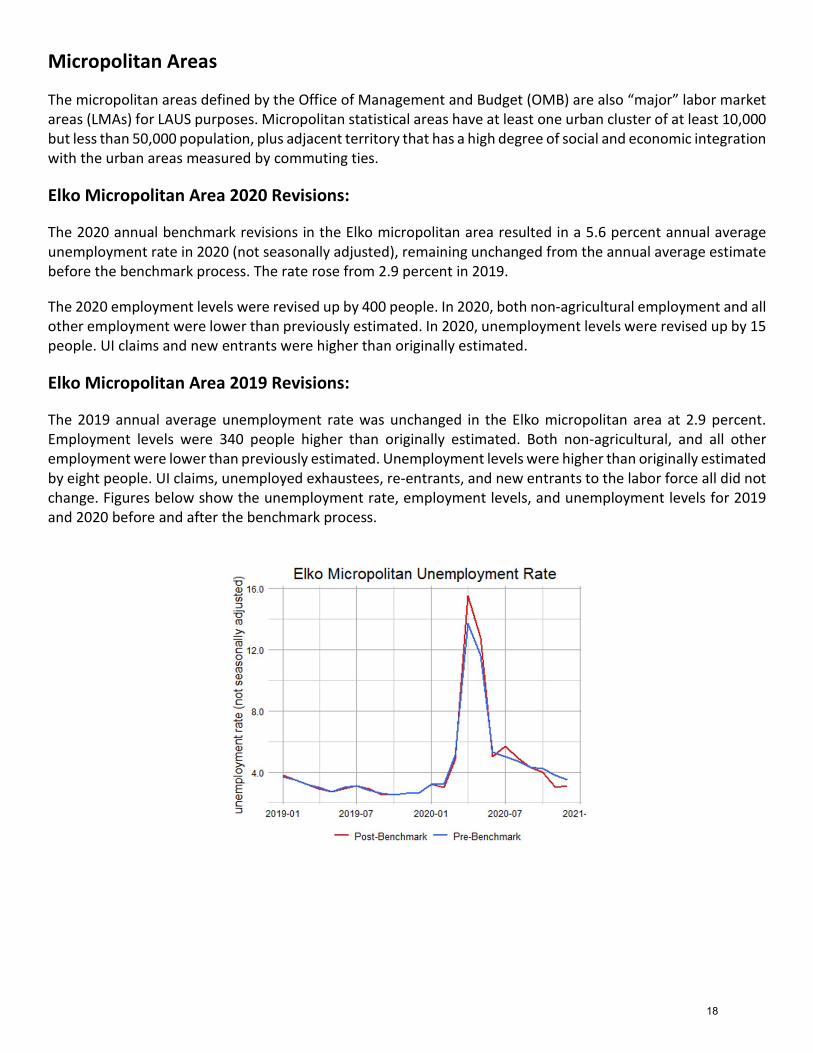
Elko Micropolitan Area 2020 Revisions:
The 2020 annual benchmark revisions in the Elko micropolitan area resulted in a 5.6 percent annual average unemployment rate in 2020 (not seasonally adjusted), remaining unchanged from the annual average estimate before the benchmark process. The rate rose from 2.9 percent in 2019.
The 2020 employment levels were revised up by 400 people. In 2020, both non-agricultural employment and all other employment were lower than previously estimated. In 2020, unemployment levels were revised up by 15 people. UI claims and new entrants were higher than originally estimated.
Elko Micropolitan Area 2019 Revisions:
The 2019 annual average unemployment rate was unchanged in the Elko micropolitan area at 2.9 percent. Employment levels were 340 people higher than originally estimated. Both non-agricultural, and all other employment were lower than previously estimated. Unemployment levels were higher than originally estimated by eight people. UI claims, unemployed exhaustees, re-entrants, and new entrants to the labor force all did not change. Figures below show the unemployment rate, employment levels, and unemployment levels for 2019 and 2020 before and after the benchmark process.
18

Fallon Micropolitan Area 2020 Revisions:
The 2020 annual benchmark revisions in the Fallon micropolitan area resulted in a 5.6 percent annual average unemployment rate in 2020 (not seasonally adjusted), remaining unchanged from the annual average estimate before the benchmark process. The rate rose from 3.5 percent in 2019.
The 2020 employment levels were revised up by 185 people. In 2020, both all other employment and agricultural employment were higher than originally estimated. Unemployment levels were revised up by 15 people. UI claims and unemployed exhaustees were both higher than their previous estimates.
Fallon Micropolitan Area 2019 Revisions:
The 2019 annual average unemployment rate was unchanged at 3.5 percent in the Fallon micropolitan area. Employment levels were 155 people higher than originally estimated. Non-agricultural, all other employment and agricultural employment were higher than originally estimated. Unemployment levels were revised up by six people. Re-entrants to the labor force were higher than previously estimated. Figures below show the unemployment rate, employment levels, and unemployment levels for 2019 and 2020 before and after the benchmark process.
19

Fernley Micropolitan Area 2020 Revisions:
The 2020 annual benchmark revisions in the Fernley micropolitan area resulted in an 8.5 percent annual average unemployment rate in 2020 (not seasonally adjusted), remaining unchanged from the annual average estimate before the benchmark process. The rate rose from 4.8 percent in 2019.
The 2020 employment levels were revised up by 300 people. In 2020, both all other employment and agricultural employment were higher than originally estimated. In 2020, unemployment levels were revised up by 40 people. UI claims and re-entrants to the labor force were both higher than their previous estimates.
Fernley Micropolitan Area 2019 Revisions:
The 2019 annual average unemployment rate was revised up to 4.8 percent from the previous estimate of 4.7 percent in Fernley micropolitan area. Employment levels were 85 people higher than originally estimated. Both all other employment and agricultural employment were higher than originally estimated. Unemployment levels were revised up by 30 people. Both UI claims and re-entrants to the labor force were higher than previously estimated. Figures below show the unemployment rate, employment levels, and unemployment levels for 2019 and 2020 before and after the benchmark process.
20
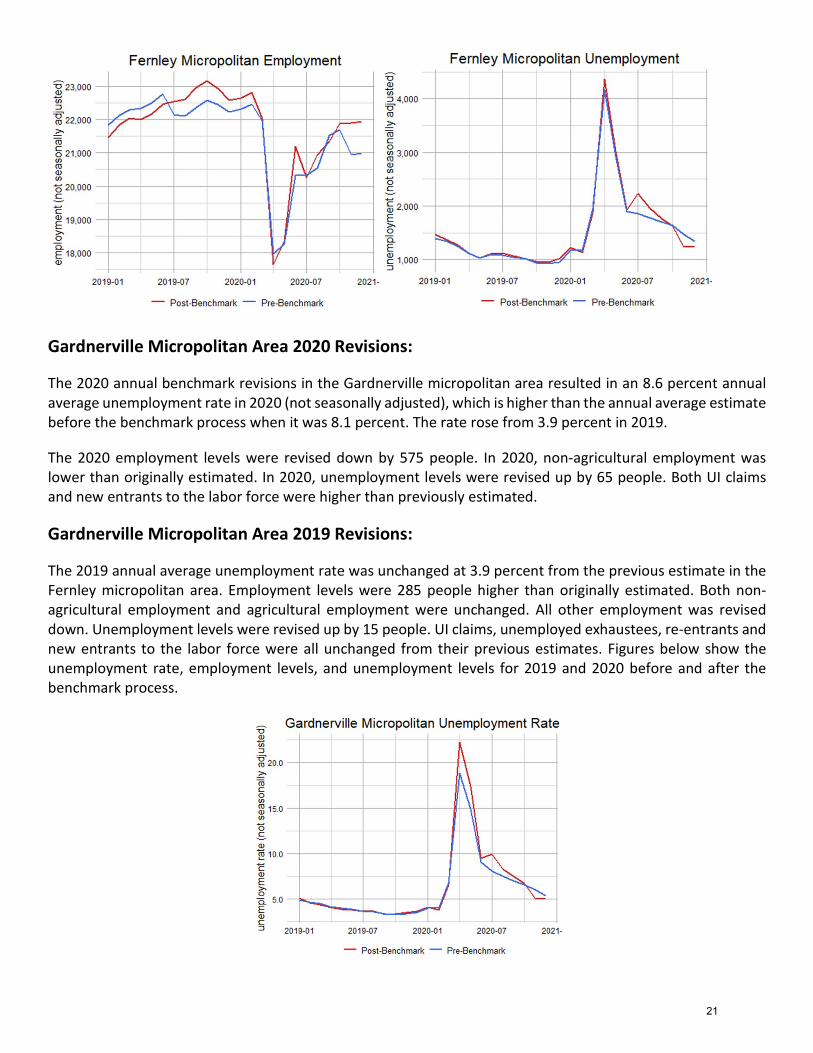
Gardnerville Micropolitan Area 2020 Revisions:
The 2020 annual benchmark revisions in the Gardnerville micropolitan area resulted in an 8.6 percent annual average unemployment rate in 2020 (not seasonally adjusted), which is higher than the annual average estimate before the benchmark process when it was 8.1 percent. The rate rose from 3.9 percent in 2019.
The 2020 employment levels were revised down by 575 people. In 2020, non-agricultural employment was lower than originally estimated. In 2020, unemployment levels were revised up by 65 people. Both UI claims and new entrants to the labor force were higher than previously estimated.
Gardnerville Micropolitan Area 2019 Revisions:
The 2019 annual average unemployment rate was unchanged at 3.9 percent from the previous estimate in the Fernley micropolitan area. Employment levels were 285 people higher than originally estimated. Both non-agricultural employment and agricultural employment were unchanged. All other employment was revised down. Unemployment levels were revised up by 15 people. UI claims, unemployed exhaustees, re-entrants and new entrants to the labor force were all unchanged from their previous estimates. Figures below show the unemployment rate, employment levels, and unemployment levels for 2019 and 2020 before and after the benchmark process.
21

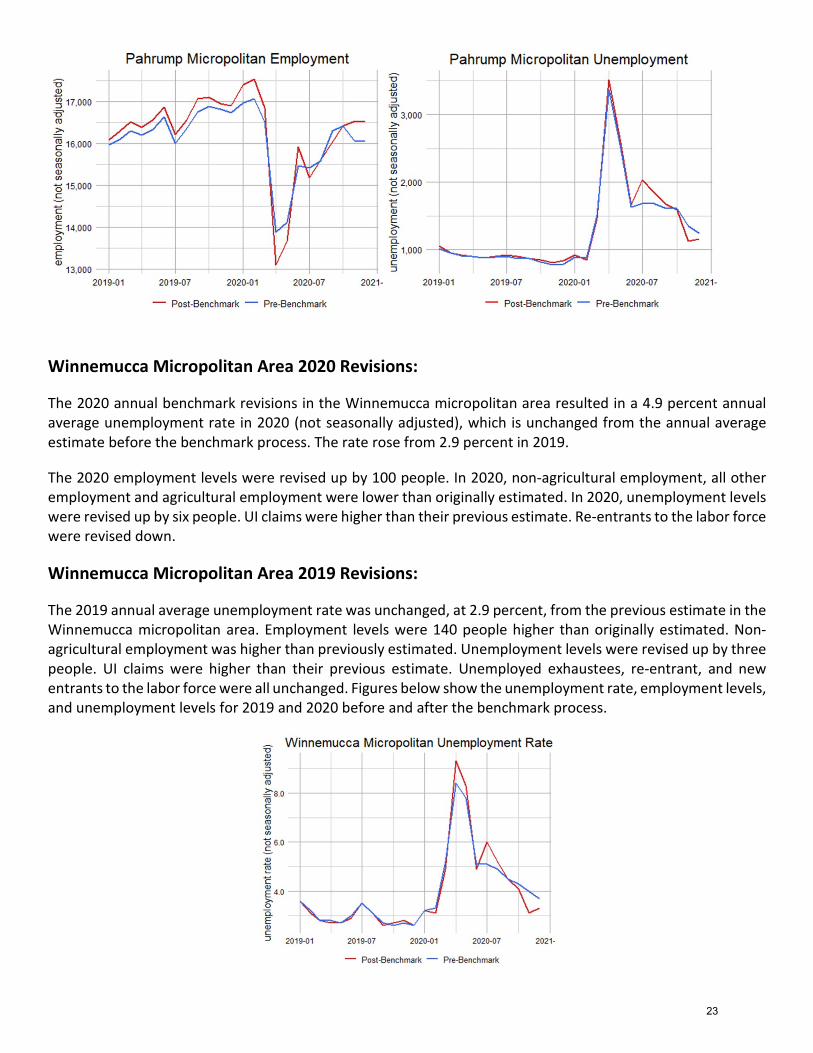
Pahrump Micropolitan Area 2020 Revisions:
The 2020 annual benchmark revisions in the Pahrump micropolitan area resulted in a 9.7 percent annual average unemployment rate in 2020 (not seasonally adjusted), which is higher than the annual average estimate before the benchmark process when it was 9.7 percent. The rate rose from 5.1 percent in 2019.
The 2020 employment levels were revised up by 75 people. In 2020, non-agricultural employment was lower than originally estimated. In 2020 unemployment levels were revised up by 40 people. UI claims and unemployed exhaustees were both higher than their previous estimates.
Pahrump Micropolitan Area 2019 Revisions:
The 2019 annual average unemployment rate in the Pahrump micropolitan area was 5.1 percent, unchanged from the previous estimate. Employment levels were 200 people higher than originally estimated. Non-agricultural employment and agricultural employment were both unchanged. All other employment and agricultural employment were revised up. Unemployment levels were revised up by 20 people. Re-entrants to the labor force were higher than their previous estimates. UI claims, unemployed exhaustees, and new entrants to the labor force did not change. Figures below show the unemployment rate, employment levels, and unemployment levels for 2019 and 2020 before and after the benchmark process.
22
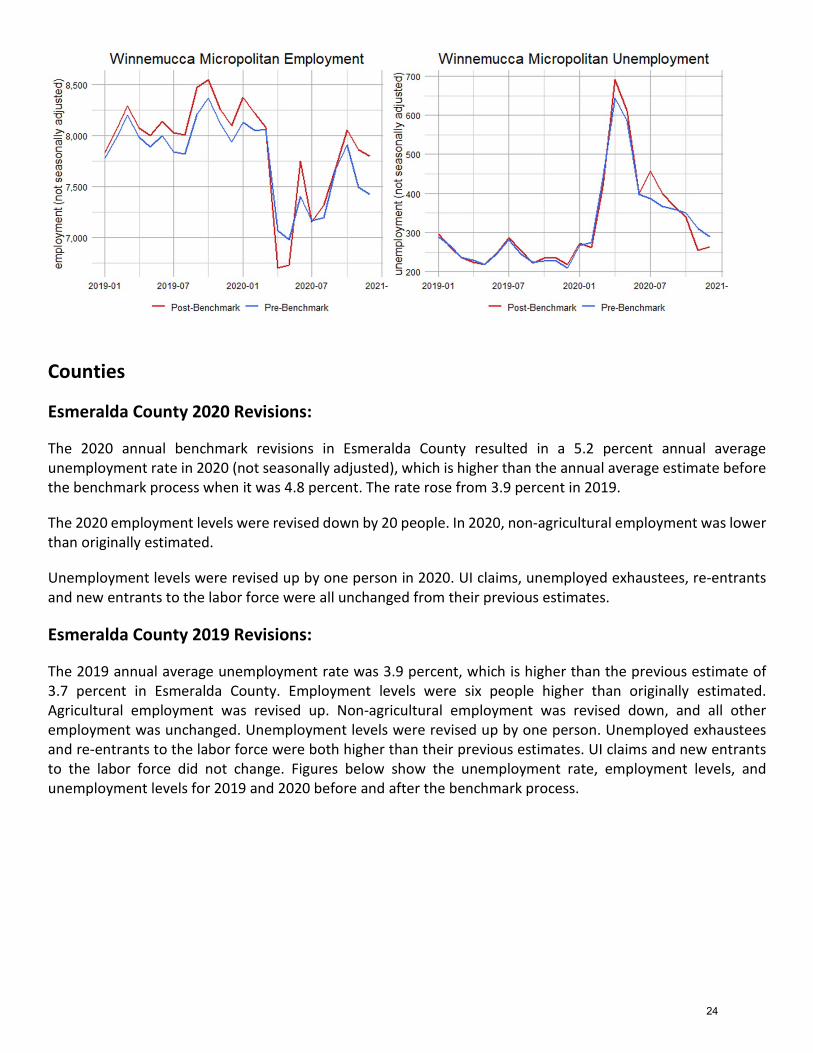
Winnemucca Micropolitan Area 2020 Revisions:
The 2020 annual benchmark revisions in the Winnemucca micropolitan area resulted in a 4.9 percent annual average unemployment rate in 2020 (not seasonally adjusted), which is unchanged from the annual average estimate before the benchmark process. The rate rose from 2.9 percent in 2019.
The 2020 employment levels were revised up by 100 people. In 2020, non-agricultural employment, all other employment and agricultural employment were lower than originally estimated. In 2020, unemployment levels were revised up by six people. UI claims were higher than their previous estimate. Re-entrants to the labor force were revised down.
Winnemucca Micropolitan Area 2019 Revisions:
The 2019 annual average unemployment rate was unchanged, at 2.9 percent, from the previous estimate in the Winnemucca micropolitan area. Employment levels were 140 people higher than originally estimated. Non-agricultural employment was higher than previously estimated. Unemployment levels were revised up by three people. UI claims were higher than their previous estimate. Unemployed exhaustees, re-entrant, and new entrants to the labor force were all unchanged. Figures below show the unemployment rate, employment levels, and unemployment levels for 2019 and 2020 before and after the benchmark process.
23
Counties
Esmeralda County 2020 Revisions:
The 2020 annual benchmark revisions in Esmeralda County resulted in a 5.2 percent annual average unemployment rate in 2020 (not seasonally adjusted), which is higher than the annual average estimate before the benchmark process when it was 4.8 percent. The rate rose from 3.9 percent in 2019.
The 2020 employment levels were revised down by 20 people. In 2020, non-agricultural employment was lower than originally estimated.
Unemployment levels were revised up by one person in 2020. UI claims, unemployed exhaustees, re-entrants and new entrants to the labor force were all unchanged from their previous estimates.
Esmeralda County 2019 Revisions:
The 2019 annual average unemployment rate was 3.9 percent, which is higher than the previous estimate of 3.7 percent in Esmeralda County. Employment levels were six people higher than originally estimated. Agricultural employment was revised up. Non-agricultural employment was revised down, and all other employment was unchanged. Unemployment levels were revised up by one person. Unemployed exhaustees and re-entrants to the labor force were both higher than their previous estimates. UI claims and new entrants to the labor force did not change. Figures below show the unemployment rate, employment levels, and unemployment levels for 2019 and 2020 before and after the benchmark process.
24

Lander County 2020 Revisions: The 2020 annual benchmark revisions in Lander County resulted in a 5.2 percent annual average unemployment rate in 2020 (not seasonally adjusted), which is unchanged from the annual average estimate before the benchmark process. The rate rose from 3.2 percent in 2019. The 2020 employment levels were revised up by 40 people. Non-agricultural employment and all other employment were lower than originally estimated in 2020. Agricultural employment was unchanged. In 2020, unemployment levels were revised up by two people. In 2020, unemployed exhaustees were revised up. Re-entrants to the labor force were revised down. UI claims and new entrants to the labor force were both unchanged from their previous estimates.
25

Lander County 2019 Revisions:
The 2019 annual average unemployment rate was 3.2 percent, which is unchanged from the previous estimate in Lander County. Employment levels were 40 people higher than originally estimated. Non-agricultural employment was revised up. Both all other employment and agricultural employment were revised down. Unemployment levels were revised up by one person. UI claims, unemployed exhaustees, re-entrants and new entrants to the labor force did not change. Figures below show the unemployment rate, employment levels, and unemployment levels for 2019 and 2020 before and after the benchmark process.
26

Lincoln County 2020 Revisions:
The 2020 annual benchmark revisions in Lincoln County resulted in a 5.1 percent annual average unemployment rate in 2020 (not seasonally adjusted), which is unchanged from the annual average estimate before the benchmark process. The rate rose from four percent in 2019.
The 2020 employment levels were unchanged. Both all other employment and agricultural employment were unchanged. Non-agricultural employment was revised down.
In 2020, unemployment levels were also unchanged. UI claims, re-entrants and new entrants to the labor force were also all unchanged from their previous estimates. Unemployed exhaustees were revised up.
Lincoln County 2019 Revisions:
The 2019 annual average unemployment rate in Lincoln County was four percent, which is unchanged from the previous estimate. Employment levels were five people higher than originally estimated. Non-agricultural employment, all other employment and agricultural employment were revised down. Unemployment levels were unchanged. UI claims, unemployed exhaustees, re-entrants and new entrants to the labor force did not change. Figures below show the unemployment rate, employment levels, and unemployment levels for 2019 and 2020 before and after the benchmark process.
27

Mineral County 2020 Revisions:
The 2020 annual benchmark revisions in Mineral County resulted in a 5.6 percent annual average unemployment rate in 2020 (not seasonally adjusted), which is lower than the annual average estimate before the benchmark process when it was 5.9 percent. The rate rose from four percent in 2019.
The 2020 employment levels were revised up by 110 people. Non-agricultural employment was revised up, all other employment was revised down, and agricultural employment was unchanged.
In 2020 unemployment levels were unchanged. UI claims, unemployed exhaustees, and re-entrants to the labor force were all unchanged from their previous estimates. New entrants were revised up.
Mineral County 2019 Revisions:
The 2019 annual average unemployment rate was four percent in Mineral County, which is unchanged from the previous estimate. Employment levels were four people higher than originally estimated. Non-agricultural employment was revised up. All other employment and agricultural employment were unchanged. Unemployment levels were unchanged. UI claims, unemployed exhaustees, and re-entrants to the labor force did not change. New entrants were revised down. Figures below show the unemployment rate, employment levels, and unemployment levels for 2019 and 2020 before and after the benchmark process.
28

Pershing County 2020 Revisions:
The 2020 annual benchmark revisions in Pershing County resulted in a 4.9 percent annual average unemployment rate in 2020 (not seasonally adjusted), which is lower than the annual average estimate before the benchmark process when it was five percent. The rate rose from four percent in 2019.
The 2020 employment was revised up by 95 people. Non-agricultural employment was revised up. All other employment was unchanged, and agricultural employment was revised down.
In 2020, unemployment levels were also revised up by one person. UI claims, unemployed exhaustees, re-entrants to the labor force were all unchanged from their previous estimates. New entrants were revised down.
Pershing County 2019 Revisions:
The 2019 annual average unemployment rate was four percent which is unchanged from the previous estimate in Pershing County. Employment levels were 45 people higher than originally estimated. Non-agricultural employment was revised up. All other employment and agricultural employment were unchanged. Unemployment levels were revised up by one person. UI claims, unemployed exhaustees, and re-entrants to the labor force did not change. New entrants were revised down. Figures below show the unemployment rate, employment levels, and unemployment levels for 2019 and 2020 before and after the benchmark process.
29

White Pine County 2020 Revisions:
The 2020 annual benchmark revisions in White Pine County resulted in a 4.2 percent annual average unemployment rate in 2020 (not seasonally adjusted), which is unchanged from the annual average estimate before the benchmark process. The rate rose from three percent in 2019.
The 2020 employment levels were revised up by 90 people. Non-agricultural employment was revised down. All other employment and agricultural employment were both unchanged.
In 2020, unemployment levels were revised up by three people. UI claims were revised up in 2020. Unemployed exhaustees, re-entrants and new entrants to the labor force were all unchanged from their previous estimates.
White Pine County 2019 Revisions:
The 2019 annual average unemployment rate was three percent which is unchanged from the previous estimate in White Pine County. Employment levels were 55 people higher than originally estimated. Non-agricultural employment, all other employment and agricultural employment were all unchanged. Unemployment levels were revised up by three people. UI claims, unemployed exhaustees, re-entrants and new entrants to the labor force did not change. Figures below show the unemployment rate, employment levels, and unemployment levels for 2019 and 2020 before and after the benchmark process.
30

Elko County 2020 Revisions:
The 2020 annual benchmark revisions in Elko County resulted in a 5.7 percent annual average unemployment rate in 2020 (not seasonally adjusted), which is unchanged from the annual average estimate before the benchmark process. The rate rose from three percent in 2019.
The 2020 employment levels were revised up by 375 people. Non-agricultural employment, all other employment and agricultural employment were all revised down.
In 2020 unemployment levels were also revised up by 15 people. UI claims and unemployed exhaustees were revised up in 2020. Re-entrants to the labor force were revised down. New entrants to the labor force were unchanged from the previous estimate.
Elko County 2019 Revisions:
The 2019 annual average unemployment rate was three percent which is unchanged from the previous estimate in Elko County. Employment levels were 320 people higher than originally estimated. Non-agricultural employment, all other employment and agricultural employment were revised down. Unemployment levels were revised up by seven people. UI claims, re-entrants and new entrants to the labor force did not change. Unemployed exhaustees were revised down. Figures below show the unemployment rate, employment levels, and unemployment levels for 2019 and 2020 before and after the benchmark process.
31

Eureka County 2020 Revisions:
The 2020 annual benchmark revisions in Eureka County resulted in a 3.5 percent annual average unemployment rate in 2020 (not seasonally adjusted), which is unchanged from the annual average estimate before the benchmark process. The rate rose from 2.3 percent in 2019.
The 2020 employment levels were revised up by 25 people. Non-agricultural employment was revised down. All other employment and agricultural employment were both unchanged.
In 2020, unemployment levels were also revised up by one person. UI claims, unemployed exhaustees, re-entrants and new entrants to the labor force were all unchanged from their previous estimates.
Eureka County 2019 Revisions:
The 2019 annual average unemployment rate was 2.3 percent in Eureka County, which is lower from the previous estimate of 2.4 percent. Employment levels were 20 people higher than originally estimated. Non-agricultural employment was revised up. All other employment and agricultural employment were both unchanged. Unemployment levels were unchanged from the previous estimate. UI claims and new entrants to the labor force were revised down. Unemployed exhaustees and re-entrants to the labor force did not change. Figures below show the unemployment rate, employment levels, and unemployment levels for 2019 and 2020 before and after the benchmark process.
32
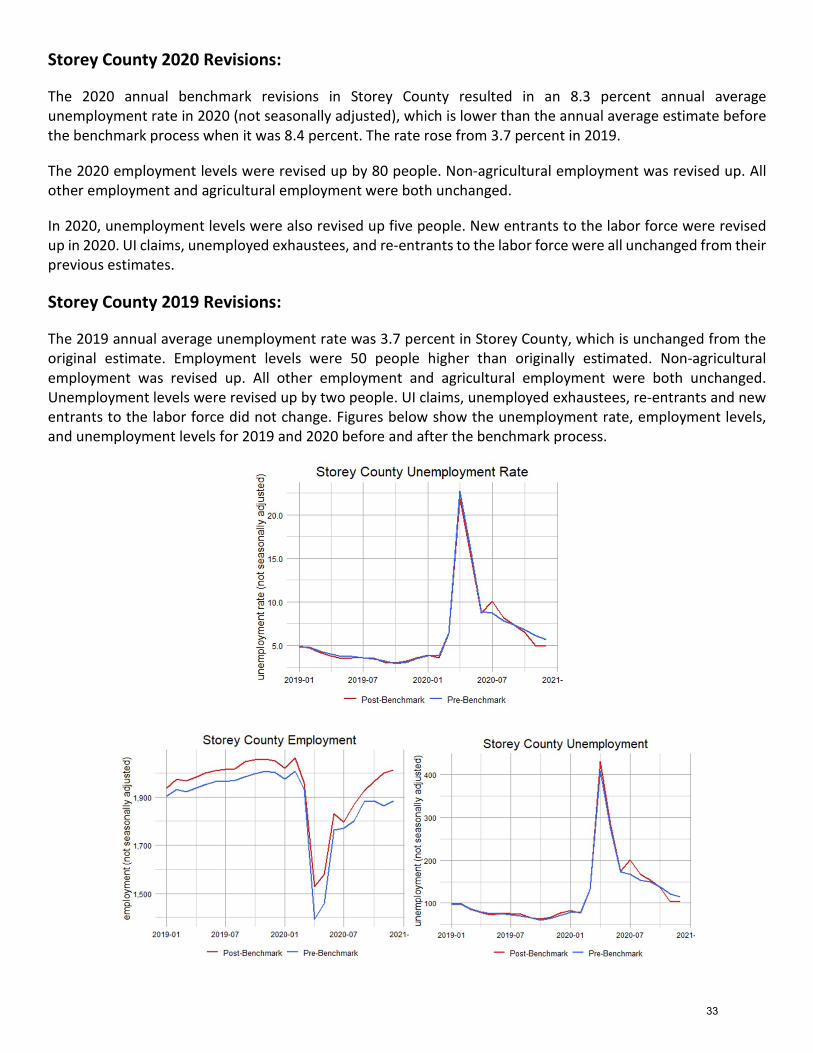
Storey County 2020 Revisions:
The 2020 annual benchmark revisions in Storey County resulted in an 8.3 percent annual average unemployment rate in 2020 (not seasonally adjusted), which is lower than the annual average estimate before the benchmark process when it was 8.4 percent. The rate rose from 3.7 percent in 2019.
The 2020 employment levels were revised up by 80 people. Non-agricultural employment was revised up. All other employment and agricultural employment were both unchanged.
In 2020, unemployment levels were also revised up five people. New entrants to the labor force were revised up in 2020. UI claims, unemployed exhaustees, and re-entrants to the labor force were all unchanged from their previous estimates.
Storey County 2019 Revisions:
The 2019 annual average unemployment rate was 3.7 percent in Storey County, which is unchanged from the original estimate. Employment levels were 50 people higher than originally estimated. Non-agricultural employment was revised up. All other employment and agricultural employment were both unchanged. Unemployment levels were revised up by two people. UI claims, unemployed exhaustees, re-entrants and new entrants to the labor force did not change. Figures below show the unemployment rate, employment levels, and unemployment levels for 2019 and 2020 before and after the benchmark process.
33

Washoe County 2020 Revisions:
The 2020 annual benchmark revisions in Washoe County resulted in a 7.8 percent annual average unemployment rate in 2020 (not seasonally adjusted), which is unchanged from the annual average estimate before the benchmark process. The rate rose from 3.2 percent in 2019.
The 2020 employment levels were revised up by 7,320 people. Agricultural employment was revised up. Non-agricultural employment and all other employment were both revised down.
In 2020, unemployment levels were also revised up 525 people. UI claims, unemployed exhaustees, and new entrants to the labor force in 2020 were all higher than their previous estimates. Re-entrants to the labor force were unchanged.
Washoe County 2019 Revisions:
The 2019 annual average unemployment rate was 3.2 percent in Washoe County, which is unchanged from the original estimate. Employment levels were 3,385 people higher than originally estimated. Non-agricultural employment and agricultural employment were both revised up. All other employment was revised down. Unemployment levels were revised up by 165 people. UI claims were revised up. Unemployed exhaustees were revised down. Re-entrants and new entrants to the labor force did not change. Figures below show the unemployment rate, employment levels, and unemployment levels for 2019 and 2020 before and after the benchmark process.
34

End Notes
Special thanks to all the R and RStudio developers that built the packages to make this possible. Packages used in this report include tidyverse, viridis, ggthemes, scales, data.table, RcppRoll, plotly, patchwork, reshape2, knitr, ggforce, DT, and gt. This workforce product was funded by a grant awarded by the U.S. Department of Labor’s Employment and Training Administration. The product was created by the recipient and does not necessarily reflect the official position of the U.S. Department of Labor. The U.S. Department of Labor makes no guarantees, warranties, or assurances of any kind, express or implied, with respect to such information, including any information on linked sites and including, but not limited to, accuracy of the information or its completeness, timeliness, usefulness, adequacy, continued availability, or ownership. This product is copyrighted by the institution that created it. Internal use by an organization and/or personal use by an individual for non-commercial purposes is permissible. All other uses require the prior authorization of the copyright owner.
35