neutral polymer slow mode and its rheological correlate
TRANSCRIPT

Neutral Polymer Slow Mode and Its Rheological Correlate
ROBERT O’CONNELL, HELEN HANSON, GEORGE D. J. PHILLIES
Department of Physics and Associated Biochemistry Faculty, Worcester Polytechnic Institute, Worcester,Massachusetts 01609
Received 14 June 2004; revised 22 September 2004; accepted 14 October 2004DOI: 10.1002/polb.20329Published online in Wiley InterScience (www.interscience.wiley.com).
ABSTRACT: Quasi-elastic light scattering spectroscopy intensity–intensity autocorrela-tion functions [S(k,t)] and static light scattering intensities of 1 MDa hydroxypropyl-cellulose in aqueous solutions were measured. With increasing polymer concentration,over a narrow concentration range, S(k,t) gained a slow relaxation. The transitionconcentration for the appearance of the slow mode (ct) was also the transition concen-tration for the solution-like/melt-like rheological transition (c�) at which the solutionshear viscosity [�p(c)] passed over from a stretched exponential to a power-law concen-tration dependence. To a good approximation, we found ct[�] � c�[�] � 4, [�] being theintrinsic viscosity. The appearance of the slow mode did not change the light scatteringintensity (I): from a concentration lower than ct to a concentration greater than ct, I/cfell uniformly with increasing concentration. The slow mode thus did not arise from theformation of compact aggregates of polymer chains. If the polymer slow mode arosefrom long-lived structures that were not concentration fluctuations, the structuresinvolved much of the dissolved polymer. At 25 °C, the mean relaxation rate of the slowmode approximately matched the relaxation rate for the diffusion of 0.2-�m-diameteroptical probes observed with the same scattering vector. © 2004 Wiley Periodicals, Inc. JPolym Sci Part B: Polym Phys 43: 323–333, 2005Keywords: diffusion; dynamic light scattering; light scattering; polymer slow mode;rheology
INTRODUCTION
This article demonstrates a novel and hithertounremarked correlation between two phenomenaobserved in polymer solutions: the polymer slowmode found in some quasi-elastic light scatteringspectroscopy (QELSS) spectra and the solution-like/melt-like viscosity transition found in somerheological data. We studied aqueous solutions ofhydroxypropylcellulose (HPC); these solutionshad both features. We also report the relativelight scattering intensities of our HPC/watersolutions.
HPC is a �-1,4-linked propyl-substituted neu-tral polysaccharide. Its chains are relatively stiff,with a persistence length of approximately100 Å.1–3 Aqueous HPC has a liquid–liquid crys-tal phase transition, but only at concentrationsfar above those studied here. HPC/water has pre-viously been studied with a variety of experimen-tal techniques, including rheometry,4,5 fluores-cence recovery after photobleaching,4 and optical-probe diffusion.6–12
Rheological measurements of HPC/water werereported by Bu and Russo4 and Phillies and Quin-lan.5 Bu and Russo obtained shear viscosities of60 kDa, 300 kDa, and 1 MDa HPC with a BohlinCS cone-and-plate rheometer at shear rates of2–40 Hz for 4.53 and 10.7 g/L solutions. Shearthinning was negligible under their conditions,
Correspondence to: G. D. J. Phillies (E-mail: [email protected])Journal of Polymer Science: Part B: Polymer Physics, Vol. 43, 323–333 (2005)© 2004 Wiley Periodicals, Inc.
323

which spanned much of the concentration rangeof interest here. Phillies and Quinlan used capil-lary viscometry to measure the solution viscosity[�p(c)] of 300 kDa, 1.0 MDa, and 1.15 MDa HPCsamples for viscosities up to 3 � 105 cP. At thelargest viscosities studied, the viscometer flowtimes were several hours. Phillies and Quinlanfound that HPC/water has a sharp transition inits viscometric behavior. Below the transitionconcentration for the solution-like/melt-like rheo-logical transition (c�), the solution viscosity (�p)depends on the polymer concentration (c) as astretched exponential:
�p�c� � �0 exp� � �c�� (1)
For c � c�, the concentration dependence is apower law:
�p�c� � �� cx (2)
where �0, when used as a fitting parameter, isvery nearly the solvent viscosity � is a scalingprefactor, � and x are scaling exponents, and �� isthe nominal viscosity at a nominal unit concen-tration. Reference 5 terms the c � c� and c � c�
concentration regimes solution-like and melt-like,respectively, these cognomens being chosen toavoid reference to particular models for polymerdynamics. The transition between the solution-like and melt-like regimes is sharp, with no indi-cation in the viscosity data of a transition zoneseparating the two regimes. Phillies and Quinlanfound from numerical differentiation that thetransition is analytic: the first derivative d log(�p)/d log c is continuous at c�.
Is the transition in the concentration depen-dence of �p(c) at c� real, or is it a result of thefitting process? A variety of observations suggestthat the transition is real. The bilogarithmic de-rivative d log[�p(c)]/d log c (where [�] is the in-trinsic viscosity) changes dramatically at c�; for c� c�, the derivative rises sharply with increasingc, but for c � c�, it is nearly constant. When themeasured �p(c) value is fit jointly to eqs 1 and 2and the assumed crossover concentration is var-ied, the mean-square fractional error in the fitincreases sharply as soon as c� is moved from itsoptimum value.
The reality of the solution-like/melt-like tran-sition is also supported by optical-probe diffusionmeasurements. In an optical-probe study, onetakes a complex fluid, adds to it small numbers of
strongly scattering or otherwise traceable probeparticles, and uses QELSS or another techniqueto measure the diffusion of the probes through thefluid. The dynamics of the fluid are then inferredfrom the dynamics of the probe particles. Theoptical-probe method was first demonstrated byHallett and Gray13 and Turner and Hallett14
nearly 3 decades ago.6 Turner and Hallet’s exper-iments are the diffusive analogues of earlier ultra-centrifuge studies by Laurent et al.15
QELSS can be used to determine a diffusioncoefficient (D) of the spheres. The application ofthe Stokes–Einstein equation to optical-probedata allows one to calculate from D a nominalmicroscopic viscosity (��):
D �kBT
6��R (3)
where kB is Boltzmann’s constant, T is the abso-lute temperature, and R is an independentlyknown sphere radius. �� does not always matchthe macroscopic viscosity (�), even if the probeparticles are large. � and �� may differ by ordersof magnitude. Historically, � and �� were com-pared to determine if optical-probe diffusion sim-ply responded to � of the solution or if novelinformation on polymer dynamics was givenby ��.
One might suppose that � and �� could differvia an experimental artifact appearing because �is in most cases measured at a non-zero shearthat artifactually perturbs � away from the zero-shear limit. However, most polymer solutionsshow shear thinning. If measurements of � hadbeen in error, � would have been too small, and so� � �� would have been found. The experimentalfinding is usually � � �� or � � �� (sometimes � ��), and this rejects any hypothesis that � � ��
arises from the non-zero-shear rate of classicalviscometers.
Optical-probe methods were applied to HPC/wa-ter systems by Brown and Rymden,7 Yang andJamieson,8 Russo and coworkers,9,10 and Streletzkyand Phillies.11,12,16–18 Brown and Rymden7 foundthat 720-Å spheres diffuse through solutions of800 kDa HPC more rapidly than expected from �p.Yang and Jamieson8 reported that non-Stokes–Ein-stein behavior was molecular-weight-dependent,being small in solutions of 110 or 140 kDa HPC butlarger (up to threefold deviations from Stokes–Ein-stein expectations) in solutions of 450 or 850 kDaHPC, even with 175-nm probe spheres. Mustafa
324 O’CONNELL, HANSON, AND PHILLIES

and Russo19 found that spectra of spherical probesin solutions of 1 MDa HPC were bimodal except atvery small values of c. Both modes are diffusive (linewidths are linear in q2, q being the scattering vectorin the experiment). For 907-Å-radius probes, theslow-mode relaxation rate corresponds to theStokes–Einstein diffusion coefficient. Streletzkyand Phillies11,12,16–18 studied probe diffusion inaqueous 1 MDa HPC with optical probes with radiiof 70–2270 Å and at HPC concentrations rangingfrom dilute to nearly 4c�. Their QELSS field corre-lation functions were bimodal:
g�1��k,t� � As exp(st�s) � Ab exp(bt �b) (4)
where subscripts s and b refer to the sharp andbroad modes, As and Ab are mode amplitudes, sand b are relaxation pseudorates, and �s and �bare stretching exponents. Spectra depend on theprobe size. For example, for large probes [R �radius of gyration (Rg)], the sharp mode is a pureexponential (�s 1). For small (R � Rg) probes, �sdeclines from 1.0 at a low value of c to about 0.8 atc�. The transition from small-probe behavior tolarge-probe behavior is quite sharp. The proberadius that divides small and large probes ap-proximately equals the HPC Rg. Streletzky andPhillies17 studied the solution-like/melt-like tran-sition with large probes. For large probes, at c�,there were marked changes in the concentrationdependences of spectral parameters. For exam-ple, at c�, �b changed from falling markedly withincreasing c to increasing with increasing c.Streletzky and Phillies concluded that the spec-tral changes implied that the solution-like/melt-like hydrodynamic transition was a real physicaleffect.
Bu and Russo4 reported fluorescence photo-bleaching recovery determinations of the diffu-sion of labeled dextrans and rigid particlesthrough solutions of 60 kDa, 300 kDa, and 1 MDaHPC. Probe radii ranged over 5–551 Å. For smallerprobes, the probe diffusion coefficient dependedonly weakly on c; for large probes, the probe dif-fusion coefficient depended much more stronglyon c. The crossover from small-probe behavior tolarge-probe behavior occurred at the approxi-mately the same probe size, regardless of c, con-trary to any expectation that a relevant solutionlength scale would be concentration-dependent.In nondilute polymer solutions, even their largestprobes diffused two or three times as quickly asexpected from �p.
These studies of optical-probe and tracer diffu-sion in HPC solutions are here complemented bya systematic study of probe-free aqueous HPCsolutions. We report here on QELSS spectra andstatic light scattering of aqueous HPC solutions.
EXPERIMENTAL
Light scattering spectra were obtained with astandard light scattering spectrometer train; theilluminating light was the 5145-Å line of a 3WLexel or a 4W Spectraphysics argon-ion laser op-erating at a relatively low power. A beam splitteron the incident laser beam and the use of twocomplete optical trains permitted the simulta-neous study of the spectra of two solutions. Fo-cused laser beams were used to illuminate clear,plastic fluorometer cells (four sides clear), whichwere mounted for temperature regulation in mas-sive copper blocks through which water waspassed from a thermostated (ThermoNeslab) cir-culating bath. Light scattered through 90° wasisolated by a pair of adjustable irises and wasallowed to fall on an RCA 7265 photomultipliertube. After preamplification and pulse shaping,photopulses were transferred seriatim to an ALV9000 exponential-sampling digital correlator. TheALV 9000 made a fully efficient determination ofthe true intensity–intensity autocorrelation func-tion [S(k,t)]:
S�k,t� � �0
T
I���I�� � t� d� (5)
S(k,t) is reported with various normalization fac-tors applied. Here k is the scattering vector, t isthe delay time, T is the duration of the experi-ment, and I(�) is the count of photons receivedduring period �t centered on the clocktime (�).The shortest t values used here were determinedby photomultiplier-tube after-pulsing effects. Tobe conservative, we excluded data referring to t� 2 �s. To reduce the number of channels, weincreased �t in proportion to t so that the chan-nels covered similar fractional intervals (� t/t).
We made relative static scattering measure-ments at fixed angles by preparing a set of samplecells including all solutions to be studied, allow-ing them to stand for at least 1 day after filtering,and making as swiftly as possible 30-S measure-ments of the scattered photon counting rate from
NEUTRAL POLYMER SLOW MODE 325
each sample, while leaving the laser power, irissettings, and photomultiplier voltage unchanged.To confirm that the optical train, light source, anddetectors had no secular drifts, we alternated be-tween new samples and a given baseline sample.For each sample, the light scattering intensities,plotted against time, were flat, with no sign of thespiking associated with dust contamination. Asample cell containing water/Triton X-100 but nopolymer was used to determine the backgroundcount rate due to window flare, stray light, andother factors. The background count was sub-tracted from the other measured photocount ratesbefore further analysis was made.
HPC (Scientific Polymer Products), with anominal molecular weight of 1 MDa, was takenfrom the same sample used in previous studies.The solvent was water that had been purified,deionized, and rendered dust-free by serial pas-sage through Milli-RO and Milli-Q (Millipore) pu-rification units. Sample cells were cleaned withdust-free (0.22-�m filter) and deionized water andthen were dried with dust-free (0.22-�m filter)nitrogen. To prepare solutions for measurement,we first prepared stock solutions, which werestirred very slowly for days to effect a completepolymer dissolution. We then made the samplesby mixing the stock solution with the solvent andstirring slowly for at least 24 h. The samples wereclarified by being passed through microporouspolycarbonate filters into the precleaned samplecells, which were promptly closed, and then in allcases were allowed to stand for at least a day.Below 5 g/L, the samples for light scattering spec-tra could be passed through 0.2-�m filters. Athigher polymer concentrations, passing samplesthrough 0.2-�m polycarbonate became challeng-ing, and it was necessary to use 1.2-�m filters;back-checking confirmed that low-concentrationsamples passed through 1.2-�m filters had thesame spectra as samples at the same concentra-tion passed through 0.2-�m filters. Static lightscattering samples were all passed through1.2-�m filters.
The fundamental constraint on analyzingQELSS spectra is that S(k,t) can always be rep-resented accurately with a modest number of pa-rameters. Only a limited amount of informationcan be obtained from the analysis of a singleQELSS spectrum. It might be tempting to sup-pose that because an arbitrary physical S(k,t) canwritten as a continuous sum, �0
d�A(�) exp(�t),of decaying exponentials, an inverse Laplacetransform can obtain from S(k,t) the distribution
A(�) of exponentials with the relaxation rate �.This supposition is incorrect because inverseLaplace transforms are ill-posed. A direct analy-sis21 of synthetic spectra with realistic A(�) val-ues and signal-to-noise ratios of 1 � 103 or greatershow that QELSS spectra are completely charac-terized within experimental error by universalanalytical forms having typically five or six pa-rameters. It follows from fundamental informa-tion and theoretical considerations that no othervalid analysis of the same S(k,t) can obtain sub-stantially more than five or six independent pa-rameters. When the range of relaxation times isgreatly increased, a few additional parameterscan be determined.
For this article, spectral parameters were ob-tained with nonlinear least-square methodsbased on the simplex approach. Individual spec-tra were fit to sums of two or three Williams–Watts relaxation modes (stretched exponentialsin time):
S�k,t� � A� �i1
N
Ai exp� � it�i��2
� B (6)
where A is the overall amplitude; B is the base-line; Ai (¥i1
N Ai 1) is the fractional-mode am-plitude; and i and �i are the characteristic decayrate and stretching exponent for the ith Williams–Watts mode, respectively. Alternative param-eterizations20 of the same modes {exp[(t/�i)
�i]}are possible but contain no new information. Ourspectral fitting software has been modestly im-proved because these data were used in ref. 22, sothe parameters here differ modestly from the pre-liminary usage there.
RESULTS
Figure 1 shows the relative total scattering inten-sity (I) of our solutions, with the background sub-tracted, plotted as the normalized intensity (I/c).The 3 g/L sample was used as the reference sam-ple; multiple points at 3 g/L show the scatter inrepeated measurements of the scattering inten-sity on a single sample. I/c falls slowly with in-creasing c. There are no singular features at anyparticular value of c.
Figure 2 shows representative spectra of HPC/water solutions containing 1, 3, 5, 6, 7, 9, and12 g/L HPC. These spectra have been rescaled
326 O’CONNELL, HANSON, AND PHILLIES

and shifted vertically so that the short-time limitsand long-time limits are all the same and are allclear of the figure box. Spectra of the 1, 3, and5 g/L solutions all have a single apparent relax-ation, the half-way decay occurring near 1 mS.The 7, 9, and 12 g/L solutions show two apparentrelaxation modes, one at times of approximately100 �S and the other extending to times greaterthan or equal to 0.01–0.1 S. The 6 g/L spectrumshows a transitional form: it relaxes at muchlonger times (out to 10 mS) than spectra of theless concentrated solutions, but to the eye multi-ple modes are not apparent.
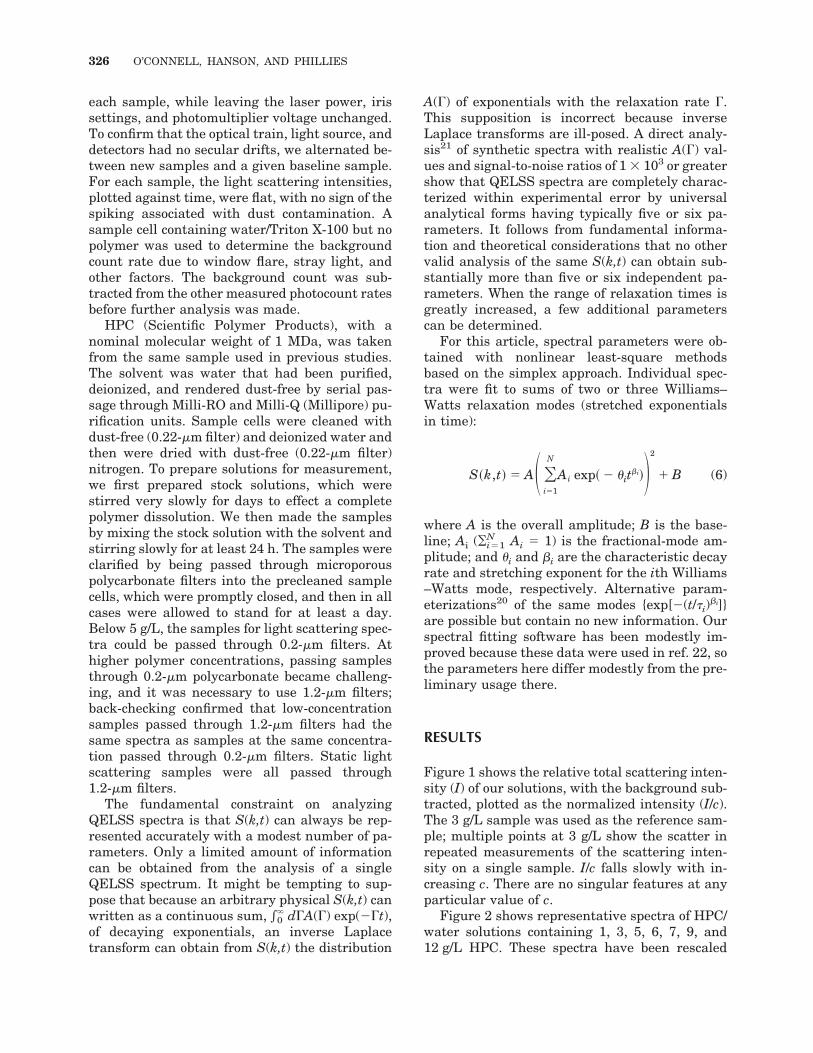
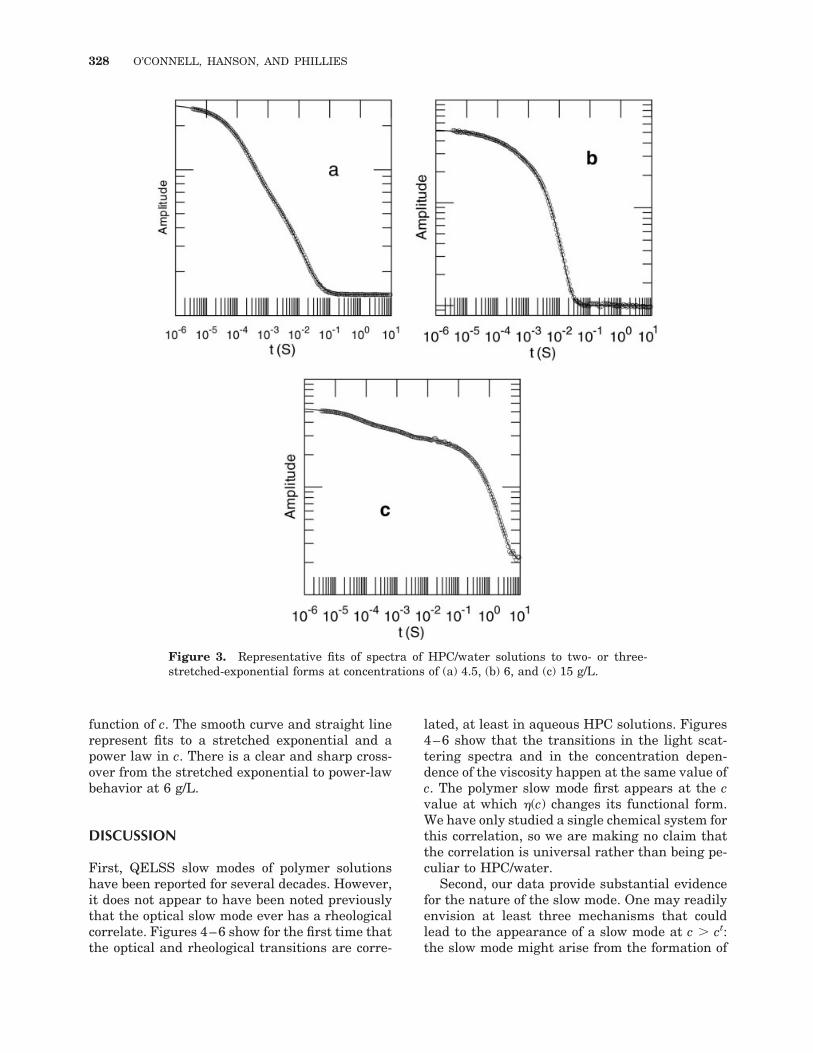
A quantitative analysis of the HPC spectra wasundertaken via the fitting of all the spectra tosums of two- or three-stretched-exponential re-laxations. Representative fits appear in Figure 3.Below 6 g/L HPC, the apparently unimodal spec-tra require a sum of two stretched exponentialsfor an accurate fit. Above 6 g/L HPC, a thirdstretched exponential is required to describe theslowest relaxation. For each relaxation, a meanrelaxation rate (���) was obtained:
��� � ��0
exp� � t�� dt�1
(7)
Unlike , the mean relaxation rate has conven-tional dimensions, that is, 1/time. The averagingin eq 7 over all times permits certain sorts of
correlated noise to cancel between and �. MeanD values can be obtained via D ���/q2.
Figure 4 shows the fractional amplitudes of theslow and fast modes. The fractional intensity ofthe intermediate mode, not shown for clarity, issimilar to the fractional intensity of the fastmode. Below c�, the fast and intermediate modeseach have roughly half of the total amplitude.Above c�, the slow mode has half or more of thetotal amplitude, increasing with increasing c,whereas the fast- and intermediate-mode ampli-tudes share evenly the remainder of the ampli-tude.
Figure 5 shows D ��� for all three modes asfunctions of c. The fast mode has D increasingfrom 4 � 108 to nearly 4 � 107 cm2/s as c isincreased. The slow mode, seen only above c�, hasD falling from 1 � 1010 to 4 � 1012 cm2/s as cincreases from 6 to 15 g/L. Over the full concen-tration range, D of the intermediate mode in-creases from 3 � 109 to nearly 1 � 108 cm2/s.However, just below c�, D of the intermediatemode falls, as would be expected if the interme-diate mode were preparing to bifurcate into dis-tinct slow and intermediate modes that could notyet be resolved with our instrumentation, or if theslow mode had a low-concentration precursor thatcould not be adequately resolved from the inter-mediate mode.
Figure 6 shows the viscosity of these solutions,as determined by Phillies and Quinlan,5 as a
Figure 2. Representative spectra of aqueous HPCsolutions: low-concentration spectra at (E) 1, (F) 3, and(�) 5 g/L, a transitional spectrum at (■) 6 g/L HPC, anda slow mode, appearing for c � 6 g/L HPC, at (‚) 7,(Œ) 9, and 12 g/L.
Figure 1. I/c for aqueous HPC solutions in arbitraryunits versus c.
NEUTRAL POLYMER SLOW MODE 327
function of c. The smooth curve and straight linerepresent fits to a stretched exponential and apower law in c. There is a clear and sharp cross-over from the stretched exponential to power-lawbehavior at 6 g/L.
DISCUSSION
First, QELSS slow modes of polymer solutionshave been reported for several decades. However,it does not appear to have been noted previouslythat the optical slow mode ever has a rheologicalcorrelate. Figures 4–6 show for the first time thatthe optical and rheological transitions are corre-
lated, at least in aqueous HPC solutions. Figures4–6 show that the transitions in the light scat-tering spectra and in the concentration depen-dence of the viscosity happen at the same value ofc. The polymer slow mode first appears at the cvalue at which �(c) changes its functional form.We have only studied a single chemical system forthis correlation, so we are making no claim thatthe correlation is universal rather than being pe-culiar to HPC/water.
Second, our data provide substantial evidencefor the nature of the slow mode. One may readilyenvision at least three mechanisms that couldlead to the appearance of a slow mode at c � ct:the slow mode might arise from the formation of
Figure 3. Representative fits of spectra of HPC/water solutions to two- or three-stretched-exponential forms at concentrations of (a) 4.5, (b) 6, and (c) 15 g/L.
328 O’CONNELL, HANSON, AND PHILLIES

aggregates, it might correspond to an additionalhydrodynamic mode, or it might arise from theappearance of locally vitrified regions of a solu-
tion of entirely uniform concentration. We do notclaim that this list of explanations is exhaustive.We are not proposing detailed physical modelsshowing how aggregates, hydrodynamic modes,or vitrified regions might arise. We are listingalternatives because a series of very different un-derlying processes could perhaps lead to an ob-served slow mode.
How do we differentiate between aggregates,modes, and vitrified regions? First, by aggregate, weenvision a small region of an elevated polymer con-centration surrounded by a solution of a lower poly-mer concentration. As a physical analogy, note mi-celle formation: if the concentration of an amphi-phile in solution is increased, at some concentrationthe amphiphile forms small aggregates (micelles) ofhigh local concentration, surrounded by solution re-gions with lower amphiphile concentrations. Theseaggregates are real physical clusters: because theirinternal concentration differs from the concentra-tion of the solution as a whole, they are usuallyeffective scatterers of light. Because they are largerthan their component molecules, they are reason-ably expected to diffuse more slowly than individualmolecules. Second, by hydrodynamic mode, we en-vision that the dynamic equations for this systemmight produce an extra relaxation mode, analo-gously to the Mountain line23 or the extra line pre-dicted for chemically reacting binary fluids.24 Theadditional mode corresponds to the presence of anunspecified additional, slowly relaxing variable,
Figure 6. (�) Low-shear viscosity (�p) of HPC/water(data taken from ref. 5) as a function of c and (—) fits toa stretched exponential in c (for c � c�) and to a powerlaw in c (for c � c�).
Figure 4. Fractional amplitudes of (‹,�) fast and (F)slow spectral modes as functions of c. Open symbols aretwo-stretched-exponential fits, and filled symbols arethree-stretched-exponential fits. The intermediate-mode amplitude has very nearly the same concentra-tion dependence as the fast-mode amplitude, so forclarity the measured intermediate-mode amplitudeshave been omitted.
Figure 5. D values corresponding to (‹,�) fast,(�,�) intermediate, and (F) slow spectral modes asfunctions of c. The open symbols are two-stretched-exponential fits, and the filled symbols are three-stretched-exponential fits.
NEUTRAL POLYMER SLOW MODE 329

such as a viscoelastic stress density or local spher-ical harmonic component of the concentration. How-ever, most polymer solutions are viscoelastic, butonly some polymer solutions exhibit a slow mode, soviscoelasticity does not by itself appear to explainthe slow mode. Finally, by vitrified region, we envi-sion local domains whose local concentration is verynearly that of the solution as a whole, but withinwhich polymer chains move very slowly with re-spect to one another. The slow dynamics could arisefrom a particular local arrangement of chains suchthat the relative motion of the chains is unusuallyimpeded, so that a group of chains tend to movevery much as a unit, even though they have notformed a concentrated lump in solution. Becausethey are regions of peculiar dynamics, but not re-gions having atypical static properties, vitrified do-mains would not scatter light particularly in-tensely, while still substantially retarding chain dy-namics.
The concentration dependence of the total scat-tering intensity (Fig. 1) serves to reject the notionthat the slow mode is created by small numbers ofintensely scattering aggregates. Figure 4 showsthat the slow mode, when present, contributeshalf of the field correlation function. If the slowmode corresponded to new scattering intensitydue to aggregates, appearing in addition to thescattering already present because of unaggre-gated chains, when the aggregates formed, thefield correlation function would nearly double inamplitude. Correspondingly, I/c would be expect-ed to increase nearly fourfold. In contrast to thisexpectation, Figure 1 shows that I/c falls slowlywith increasing c. There is no anomalous increasein I/c near or above ct. We conclude that the poly-mer slow mode is not due to a process that createslocal, long-lived regions of high (or, in principle,low) polymer concentration.
It might be possible to form very large aggre-gates whose scattering is entirely concentrated atvery low scattering angles. The scattering fromsuch aggregates would not contribute to the staticlight scattering intensity at the angle that westudied, so the formation of such aggregateswould leave no signature in Figure 1. However,the slow mode of the QELSS spectrum arises fromprecisely the same photons that create the staticscattering. If hypothetical large aggregates do notcontribute at our scattering angle to the staticscattering intensity, then by exactly the sametoken the aggregates would not contribute to thelight scattering spectra. In some other systems,simultaneous increases in the scattering inten-
sity with slow-mode appearance have been seen.Balloge and Tirrell25 found anomalously largescattering for poly(methyl methacrylate) solu-tions that had a slow mode, whereas solutionswith no slow mode showed no anomalous increasein the scattering intensity.
The literature tends to reject an interpretationthat the slow mode arises from viscoelastic cou-pling. Large-molecular-weight concentrated poly-mer solutions are uniformly viscoelastic, butmany polymer solutions do not have a slow mode.Also, Sun and Wang26 found that 27 wt %16.7 kDa polystyrene/diethylphthalate had alarger concentration slow mode, even though itsmolecular weight and concentration were far toosmall for entanglement-based viscoelasticity.Furthermore, Polverari and van de Ven27 showedthat passage through a gel permeation chroma-tography (GPC) column of a poly(ethylene oxide)(PEO)/water solution showing a slow mode sepa-rates the solution into two fractions, one contain-ing unaggregated single chains and the other con-taining large aggregates. The relative scatteringintensities of the two fractions approximatelymatch the relative scattering intensities associ-ated with the fast and slow modes. A GPC columncan no more fractionate a liquid into components,showing either viscoelastic or diffusive modes,than it can fractionate a liquid into two compo-nents, one having only the central Rayleigh modeand the other having only the Brillouin side-bands. However, PEO solutions can be fraction-ated into components that have only a singlemode. The GPC data, therefore, suggest thatPEO/water actually forms equilibrium, spatiallyextended structures that lead to slow modes inthis system.
Our data are, however, consistent with modelsin which the polymer solutions contain largenumbers of small vitrified regions, the regionsbeing zones with slow internal dynamics. If thevitrified regions have the same average polymerconcentration as the overall solution, they wouldnot appreciably augment the static scattering in-tensity, and this is consistent with our experi-ments. To account for about half of the total spec-tral amplitude, the vitrified regions would need toinclude a substantial fraction, perhaps half, of thechains in solution. Spatially extensive, very long-lived regions could be fractionated with GPCequipment, as observed for PEO/water. Withtime, these fractions should re-equilibrate into amixture of vitrified regions and unaggregated sin-gle chains, as actually observed by Polverari and
330 O’CONNELL, HANSON, AND PHILLIES

van de Ven27 in PEO solutions. A solution par-tially filled with vitrified regions could have flowproperties similar to those of an ice slush in icewater; that is, flow could lead to jamming andelevated viscosity above a concentration thresh-old, in agreement with the observed rheologicaltransition at c�.
Third, if the slow mode were to arise fromlong-lived vitrified regions performing center-of-mass diffusion, the size of the regions could beestimated from their diffusion rate. A complica-tion arises because the medium is a nondilutepolymer solution. In nondilute high-polymer solu-tions, the Stokes–Einstein equation, �p, and theparticle radius do not predict D, even for largeparticles.28 Contrariwise, D does not always leadvia the Stokes–Einstein equation to the proberadius.
We therefore inferred an apparent size for theregions by adding to the solutions carboxylate-modified polystyrene latex spheres of known size,measuring D of the probes, and using D values ofthe probes as a calibrating standard to correlateD and R, as we have done previously.29 The re-gions were then taken to have the size of probesthat diffused at the same rate as the regions. Thecalibration is only approximate: the hypothesizedvitrified regions may well be nonspherical, flexi-ble, or porous, but the probes are spherical, rigid,and nonporous. Furthermore, the spheres are di-lute, but the structures may be nondilute.
Figure 7 presents relaxation rates (���) for thepolymer slow mode and for several optical probesversus T/�s. Large filled circles represent the slowmode of HPC at various temperatures and at 6and 15 g/L. Large open circles represent 189-nm-diameter spheres at (from bottom to top) 15, 6,and 5 g/L; the cross represents 87-nm spheres in6 g/L HPC. ��� is highly sensitive to the proberadius. The twofold decrease in the probe radiusfrom 189 to 87 nm leads at a fixed value of c to asixfold increase in the relaxation rate. In both 6and 15 g/L HPC, the ��� value of the slow modeand the 189-nm spheres are approximately thesame, which implies that the transient structuresare modestly less than 0.2 �m across.
Yang and Jamieson8 previously used static andquasi-elastic light scattering to study HPCs withweight-average molecular weights greater thanor equal to 110 kDa and less than or equal to850 kDa. The extrapolation of their data to the1.0 MDa molecular weight studied here implies30
Rg � 105 nm and mean hydrodynamic radius�Rh
1�1 � 55 nm. If the slow mode arose from
transient structures, those structures have diam-eters similar to or perhaps twice the diameter ofan HPC molecule.
In some glass models,31 the transient struc-tures responsible for glass formation are an orderof magnitude larger than the component atoms.Here the structure is only a few times the size ofits component molecules. Why are the structureshere so small? We propose that the structureshere can be small because polymer coils interpen-etrate. The volume required to hold a particularnumber (N) of polymer coils is less, with respect tothe size of a single coil, than the size of a corre-sponding N-atom atomic glass cluster, with re-spect to the size of a single atom.
In the transition regime, the cluster size de-pends on the temperature. The dependence ismade apparent by a comparison with the temper-ature dependence of ��� for spherical probes. InFigure 7, the small open circles and trianglesrepresent ��� for 189-nm spheres in 6 and 15 g/LHPC, respectively, at a range in T. Differencesbetween the small and large open circles showpractical limits on sample preparation and mea-surement accuracy. Between 10 and 36 °C, ��� ofthe probes increases perhaps fourfold. Over this
Figure 7. Spectral relaxation rates for the HPC/water slow mode and for polystyrene spheres, in HPC/water at various temperatures and polymer concentra-tions, plotted against T/�s (�s is the viscosity of waterat T; the data cover 283 T 309 K). The small circlesand triangles represent ��s� of 189-nm spheres in 6 and10 g/L HPC; the filled large circles represent ��� of theslow mode of HPC in 6 and 15 g/L HPC; the open largecircles represent 189-nm spheres at 5, 6, and 15 g/L;and the cross represents 87-nm spheres in 6 g/L HPC.
NEUTRAL POLYMER SLOW MODE 331

temperature range, the ratio T/�s increases onlytwofold. However, Phillies et al.32 measured �p at10 and 39 °C and found with increasing T thatT/�p increased roughly fivefold for 6 g/L HPC androughly fourfold for 15 g/L HPC. The temperaturedependence of the sphere relaxation rate thusapproximately tracks the temperature depen-dence of �p.
Between 10 and 36 °C, ��� of the polymer slowmode of 15 g/L HPC also increases fourfold; in15 g/L HPC, the cluster size is temperature-inde-pendent. However, in 6 g/L HPC, when T in-creases from 10 to 36 °C ��� of the polymer slowmode increases 12-fold, and this is consistentwith structures that shrink with increasing T.How extensive is the shrinkage? Beyond the in-crease in ��� of the slow mode due to the change inT/�p, ��� at 6 g/L increases by an additional factorof three. From this, a twofold reduction in thesphere radius causes a sixfold increase in ���, sothe excess threefold increase in ��� suggests thatbetween 10 and 36 °C the transient structures in6 g/L HPC shrink by perhaps 50%. Because theclusters involve a substantial fraction of the ma-terial in the system, and the cluster size is mark-edly sensitive to temperature, it appears plausi-ble that in solutions with concentrations near6 g/L there may be an appreciable calorimetricsignature associated with the transient regions.
It is perhaps noteworthy that above ct the clus-ter size does not increase greatly with increasingconcentration. In HPC/water, we appear to see alarge concentration of nongrowing structures thatappear at a rheological transition. At 6 and 15 g/LHPC, the estimated structure size remains about0.2 �m. Concentration-driven structure forma-tion with a firm upper limit on the structure sizeis a characteristic feature of Kivelson and Tar-jus’s model31 of glasses, in which the glass tran-sition is caused by growth-frustrated equilibriumclusters.
We do not claim that our image of local vitrifi-cation is original. Long-lived structures that arenot regions of unusually high concentration ap-pear in several theoretical models31,33 for glasses.Alternatively, our observation of transient vitri-fied regions could be a physical manifestation ofthe entanglements sometimes hypothesized to beresponsible for polymer dynamics in nondilutesolutions. That is, although entanglements areoften drawn as a pair of local tightly intertwinedpolymer chains, little in the orthodox model ofchain entanglement precludes the entanglementfrom being a mean-field representation of a spa-
tially extended region, a region such as the locallyvitrified domains that we appear to have observed.
Finally, the behavior that we have describedfor HPC solutions cannot be a general behaviorfor all polymer solutions. As shown by Ballogeand Tirrell,25 although some poly(methyl methac-rylate)/methyl methacrylate solutions show aslow mode, other poly(methyl methacrylate) sam-ples in the same solvent prepared in the samelaboratory under the same protocols show no slowmode. Furthermore, although HPC/water consis-tently shows a viscometric solution-like/melt-liketransition, in solutions of other polymers, the vis-cometric solution-like/melt-like transition mayoccur at a much larger concentration (c�[�] 35or 140) or may not occur at all. If the polymer slowmode corresponded to entanglement formation,which we have not claimed, then questions wouldarise about the universal importance of entangle-ment formation for the dynamics of polymers innondilute solutions.
The partial support of the National Science Foundation(NSF DMR9985782) is gratefully acknowledged. Theauthors thank an anonymous correspondent for sug-gesting that we try measuring the static scatteringintensity at various concentrations.
REFERENCES AND NOTES
1. Swenson, H. A.; Schmitt, C. A.; Thomson, N. S. JPolym Sci Part C: Polym Symp 1965, 11, 243.
2. Kamide, K.; Saito, M.; Suzuki, H. Makromol ChemRapid Commun 1983, 4, 33.
3. Aharoni, S. M. Macromolecules 1983, 16, 1722.4. Bu, Z.; Russo, P. S. Macromolecules 1994, 27, 1187.5. Phillies, G. D. J.; Quinlan, C. A. Macromolecules
1995, 28, 160.6. Phillies, G. D. J.; Streletzky, K. A. Rec Res Dev
Phys Chem 2001, 5, 269.7. Brown, W.; Rymden, R. Macromolecules 1986, 19,
2942.8. Yang, T.; Jamieson, A. M. J Colloid Interface Sci
1988, 126, 220.9. Russo, P. S.; Mustafa, M.; Cao, T.; Stephen, L. K. J
Colloid Interface Sci 1988, 122, 120.10. Mustafa, M. B.; Tipton, D. L.; Barkley, M. D.;
Russo, P. S. Macromolecules 1993, 26, 370.11. Streletzky, K.; Phillies, G. D. J. J Chem Phys 1998,
108, 2975.12. Streletzky, K.; Phillies, G. D. J. J Phys Chem B
1999, 103, 1811.13. Hallett, F. R.; Gray, A. L. Biochim Biophys Acta
1974, 343, 648.14. Turner, D. N.; Hallet, F. R. Biochim Biophys Acta
1976, 451, 305.
332 O’CONNELL, HANSON, AND PHILLIES

15. Laurent, T. C.; Bjork, I.; Pietruskiewicz, A.; Pers-son, H. Biochim Biophys Acta 1963, 78, 351.
16. Streletzky, K.; Phillies, G. D. J. J Polym Sci: PartB: Polym Phys 1998, 36, 3087.
17. Streletzky, K.; Phillies, G. D. J. Macromolecules1999, 32, 145.
18. Streletzky, K.; Phillies, G. D. J. In Scattering fromPolymers; Hsiao, B. S., Ed.; ACS Symposium Series739; American Chemical Society: Washington, DC,2000; pp 297–316.
19. Mustafa, M.; Russo, P. S. J Colloid Interface Sci1989, 129, 240.
20. Ngai, K. L.; Phillies, G. D. J. J Chem Phys 1996,105, 8385.
21. Phillies, G. D. J. J Chem Phys 1988, 89, 91.22. Phillies, G. D. J.; O’Connell, R.; Whitford, P.;
Streletzky, K. A. J Chem Phys 2003, 119, 9903.23. Mountain, R. D.; Deutch, J. M. J Chem Phys 1976,
50, 1103.
24. Phillies, G. D. J.; Kivelson, D. Mol Phys 1979, 38,1393.
25. Balloge, S.; Tirrell, M. Macromolecules 1985, 18, 819.26. Sun, Z.; Wang, C. H. Macromolecules 1994, 27,
5667.27. Polverari, M.; van de Ven, T. G. M. J Phys Chem
1996, 100, 13687.28. Lin, T.-H.; Phillies, G. D. J. J Colloid Interface Sci
1984, 100, 82.29. Ullmann, G.; Phillies, G. D. J. Macromolecules
1983, 16, 1947.30. Streletzky, K. A. Ph.D. Thesis, Worcester Polytech-
nic Institute, 1998.31. Kivelson, D.; Tarjus, G. J Chem Phys 1998, 109,
5481.32. Phillies, G. D. J.; Richardson, C.; Quinlan, C. A.;
Ren, S. Z. Macromolecules 1993, 26, 6849.33. Johnson, G. J.; Mel’cuk, A. I.; Gould, H.; Klein, W.;
Mountain, R. D. Phys Rev E 1998, 57, 5707.
NEUTRAL POLYMER SLOW MODE 333