neurological recovery after ischemic stroke cells promote
TRANSCRIPT

Page 1/30
Extracellular Vesicles from Adipose-derived StemCells Promote Microglia M2 Polarization andNeurological Recovery after Ischemic StrokeXiaowen Hu
Shanghai Jiao Tong UniversityJiaji Pan
Shanghai Jiao Tong UniversityYongfang Li
Shanghai Jiao Tong UniversityYixu Jiang
Shanghai Jiao Tong UniversityHaoran Zheng
Shanghai Jiao Tong UniversityRubing Shi
Shanghai Jiao Tong UniversityQi Zhang
Shanghai Jiao Tong UniversityChang Liu
Shanghai Jiao Tong UniversityHengli Tian
Shanghai Jiao Tong UniversityZhijun Zhang
Shanghai Jiao Tong UniversityYaohui Tang
Shanghai Jiao Tong UniversityGuo-Yuan Yang
Shanghai Jiao Tong UniversityYongting Wang ( [email protected] )
Sixth People's Hospital, Shanghai Jiao Tong University https://orcid.org/0000-0003-3105-9307
Research
Keywords: adipose-derived stem cell, cerebral ischemia, extracellular vesicles, microglial polarization,miRNAs

Page 2/30
Posted Date: June 1st, 2021
DOI: https://doi.org/10.21203/rs.3.rs-545423/v1
License: This work is licensed under a Creative Commons Attribution 4.0 International License. Read Full License

Page 3/30
AbstractBackground: Adipose-derived stem cells (ADSCs) and their extracellular vesicles (EVs) have therapeuticpotential in ischemic brain injury, but the underlying mechanism is poorly understood. The current studyaimed to explore the contribution of miRNAs in ADSC-EVs to the treatment of cerebral ischemia.
Methods: After the intravenous injection of ADSC-EVs, therapeutic e�cacy was evaluated byneurobehavioral tests and brain atrophy volume. The polarization of microglia was assessed byimmunostaining and qPCR. We further performed miRNA sequencing of ADSC-EVs and analyzed therelationship between the upregulated miRNAs in ADSC-EVs and microglial polarization-related proteinsusing Ingenuity Pathway Analysis (IPA).
Results: The results showed that ADSC-EVs reduced brain atrophy volume, improved neuromotor andcognitive functions after mouse ischemic stroke. The loss of oligodendrocytes was attenuated afterADSC-EVs injection. The number of blood vessels, as well as newly proliferated endothelial cells in theperi-ischemia area were higher in the ADSC-EVs treated group than that in the PBS group. In addition,ADSC-EVs regulated the polarization of microglia, resulting in increased repair-promoting M2 phenotypeand decreased pro-in�ammatory M1 phenotype. Finally, STAT1 and PTEN were highlighted as twodownstream targets of up-regulated miRNAs in ADSC-EVs among 85 microglia/macrophage polarizationrelated proteins by IPA. The inhibition of STAT1 and PTEN by ADSC-EVs were con�rmed in culturedmicroglia.
Conclusions: In summary, ADSC-EVs reduced ischemic brain injury, which was associated with theregulation of microglial polarization. miRNAs in ADSC-EVs contributed to their function in regulatingmicroglial polarization by targeting PTEN and STAT1.
BackgroundStroke is the second leading cause of death and the major cause of disability worldwide. About 80% ofstroke cases are ischemic stroke characterized by thromboembolic occlusion of the cerebral artery [1, 2].Current clinical therapeutic approaches mainly focus on removing the blockage by thrombolysis orthrombectomy [3, 4]. However, these treatments usually have a narrow therapeutic window [3]. Therefore,new therapeutic strategy with wider treatment window is needed.
Microglia are main immune cells in the brain and play a critical role in modulating the microenvironmentof the central nervous system (CNS). Microglia are activated in response to ischemic stroke [5]. In theearly phase of acute brain ischemia, an anti-in�ammatory M2 microglia phenotype increases from 1 to 3days and peaks by 3 to 5 days post the ischemic brain injury. In the same phase, a pro-in�ammatory M1microglia phenotype gradually increases over time from day 3 onward and maintain elevated for at least14 days after ischemic stroke [6]. It has been well documented that M1 microglia secrets various pro-in�ammatory cytokines, such as interleukin-1β (IL-1β), interleukin-23 (IL-23), tumor necrosis factor-α(TNF-α), and inducible nitric oxide synthase (iNOS), thus aggravates the neurological de�cits [7, 8]. The

Page 4/30
activation of A1 reactive astrocytes is closely related to the release of IL-1α, TNF-α and C1q by classicalactivated microglia. A1 astrocytes further release in�ammatory factors and destroy adjacent neurons andoligodendrocytes [9]. In contrast, M2 microglia promote repair and anti-in�ammatory reactions [10, 11].Previous studies have demonstrated that M2 microglia derived exosomes can reduce apoptosis ofneurons and glial scar formation after cerebral ischemia [12, 13]. Arg-1 high-expressing M2 microgliapromote the proliferation and differentiation of oligodendrocyte progenitor cells (OPCs) [9]. In summary,the dynamic polarization of microglia and their interaction with neurons, astrocytes, andoligodendrocytes play important roles in the pathological process of cerebral ischemia. Sifting microglialpolarization to M2 phenotype has been proposed to be a new therapeutic strategy for cerebral ischemia[14, 15].
Previous studies have demonstrated that the administration of mesenchymal stem cells (MSCs) and theirderived extracellular vesicles (EVs) can substantially improve the neurological de�cits after ischemicstroke [16, 17]. Compared to other sources, adipose-derived stem cells (ADSCs) have the advantages ofbeing abundant and easy to obtain [18]. Since their discovery in 2001, the therapeutic potential of ADSCshas been explored in wound healing, multiple sclerosis and various ischemic diseases. For ischemicstroke, ADSCs have been indicated to be bene�cial by reducing apoptosis, the release of in�ammatoryfactors, glial scar formation, white matter injury and promoting angiogenesis, the migration anddifferentiation of endogenous neural stem cells, synaptic remodeling [19–23]. However, the survival rateof ADSCs after transplantation is very low, so it is inferred that ADSCs achieve these therapeutic effectsmainly through paracrine mechanisms [21, 23].
EVs are important carriers that facilitate the cell-cell communication. They contain a large number ofbiologically functional proteins and miRNA molecules [24]. Administration of ADSC-EVs can not onlyachieve comparable therapeutic effect of ADSCs, but also avoid the risks and shortcomings of stem celltransplantation such as concerns of tumorgenicity. Several studies have shown that ADSCs and theirderived cell-free conditioned medium, extractions or EVs can promote M2 polarization of macrophage [25,26]. It has been reported that ADSCs or ADSC-EVs transplantation improved myocardial injury bypromoting M2 polarization of macrophages in myocardial ischemia models [27, 28]. In obese mice,ADSCs up-regulate the expression of Arg-1 by carrying active STAT3 to induce the anti-in�ammatory M2phenotype of macrophages, thereby reducing in�ammation and promoting metabolic homeostasis [29].However, the effects of ADSC-EVs on microglial polarization in the brain have not been demonstrated. Inthe present study, we aim to investigate whether ADSC-EVs regulate the polarization of microglia andcontribute to neurological recovery after ischemic stroke. Among different cargos contained in the EVs,miRNAs are the most explored and have been shown to be involved in many physiological andpathological processes [30]. Therefore, we hypothesize that ADSC-EVs exerts regulatory functions at leastin part by delivering miRNAs to recipient cells.
Methods
Isolation and characterization of ADSCs

Page 5/30
ADSCs were isolated from the inguinal subcutaneous adipose tissue of 6-week-old male ICR mice. Thedissected adipose tissue was digested with 0.1% type II collagenase (Sigma-Aldrich, Saint Louis, MO) at37℃ for 30 minutes under 20 rpm shaking conditions. Enzymatic activity was neutralized with an equalvolume of low glucose Dulbecco’s modi�ed Eagle medium (L-DMEM, HyClone, Logan, UT) containing10% fetal bovine serum (Gibco, Carlsbad, CA). After �ltration through a 70 μm �lter and centrifugation at300 g for 5 minutes, cells were resuspended and seeded in complete medium at 37°C with 5% carbondioxide and saturated humidity. The complete medium was composed of L-DMEM with 10% FBS and 1%penicillin/streptomycin (Invitrogen, Carlsbad, CA) and replaced every 2 or 3 days. Cells were harvestedwith 0.25% trypsin-EDTA, and all experiments were performed using cells between passage 2 and 5.Surface markers of ADSCs were validated by �ow cytometry (Accuri C6, BD, Franklin Lakes, NJ). Brie�y,the single-cell suspension was washed twice with PBS containing 0.5% BSA and then incubated in darkfor 30 min at 4 °C with each of the following antibodies directed against murine antigens: anti-CD29-PE(Cat#562801, BD), anti- CD34-Alexa Flour 647(Cat#560233, BD), anti-CD44-APC (Cat#561862, BD), andanti-CD45-PerCP (Cat#561047, BD). Cell suspension without antibodies was used as control.
EVs isolation, identi�cation and labelingEVs were puri�ed from ADSCs supernatant by ultracentrifugation following a published protocol [31]. Thesupernatant was collected after 48 hours of culture and passed through a 0.22 μm �lter beforeultracentrifugation. The size distribution of ADSC-EVs was evaluated by nanoparticle tracking analysis(NTA, Brookhaven, New York, NY). Transmission electron microscopy (TEM, Thermo Scienti�c, Waltham,MA) was used to identify the morphological characteristics of ADSC-EVs. ADSCs lysate and ADSC-EVswere analyzed for the expression of exosomal markers by Western blot with the following antibodies:anti-CD63 (Santa Cruz Biotechnology, Santa Cruz, CA), tumor susceptibility gene 101 (TSG101, Abcam,Cambridge, UK) and β-actin (Abcam). Labeling of ADSC-EVs was performed with PKH26 red �uorescentcell linker kit (Sigma-Aldrich) according to the manufacturer’s instructions.
The mice model of transient middle cerebral arteryocclusion (tMCAO)Adult male ICR mice (25-30 g) were anesthetized with 1.5–2% iso�urane and 30%/70% oxygen/nitrousoxide. tMCAO was performed as previously described [32, 33]. Brie�y, the left common carotid artery,internal carotid artery and external carotid artery were separated and ligated temporarily. An incision wasmade between the two ligations on external carotid artery. Then a 6-0 nylon suture coated with silica gelwas inserted through the incision into the ipsilateral middle cerebral artery. A laser Doppler �owmetry(Moor Instruments, Devon, UK) was used to determine the successful occlusion of middle cerebral arteryby monitoring the decrease of surface cerebral blood �ow (CBF) to 10% of its baseline. Reperfusion wasperformed by withdrawing the suture 1.5 hours after the occlusion and the reperfusion was con�rmed bythe recovery of surface CBF to 70% of baseline.

Page 6/30
ADSC-EVs administrationAfter tMCAO, animals were randomly divided into the PBS group and ADSC-EV group (n=14). Animals inthe ADSC-EV group received daily injections of ADSC-EVs through tail vein during 1-7 days after tMCAO(100 μg ADSC-EVs in 200 μl PBS per day); while animals in the PBS group were injected with 200 μl PBSper day. In the sham group (n=8), an identical surgical procedure was performed without ligation of anyarteries. To verify the uptake of ADSC-EVs by brain microglia in vivo, PKH-26 labeled ADSC-EVs (100 μg)were intravenously injected to the mouse at 1 day after tMCAO. Mice were sacri�ced 1 hour after theinjection, and then Iba1 immunostaining was performed.
Neurobehavioral testsThe modi�ed neurological severity score (mNSS) was used to evaluate the neurobehavioral function ofthe animals at 1 to 14 days after tMCAO. Before surgery, the animals were subjected to a 3 days trainingon the rotarod. Then, rotarod baseline data was collected before surgery. After surgery, rotarod test wascarried out at 3, 7, and 14 days after tMCAO. Hanging wire test was performed at 14 days after tMCAO[34]. Mice were subjected to a 180 second hanging on a suspended wire. One point was subtracted fromthe initial score of 10 for each fall during the test. The average score of each group was presented as aKaplan-Meier-like curve. Step through test and T-maze were used to detect spatial working memory andcognition function at 14 days after tMCAO. In T-maze spontaneous alternation experiment, normal micetended to choose different goal arms every time, while neurologically impaired mice presented loweralternation rate in 10 trials. In the step through test, the training was performed using the smart cagesystem where electrical stimulation was delivered when the animal entered the dark zone. After 24 hours,mice were placed back to the smart cage again and their continuous moving trace within 10 minuteswere recorded. The total time spent in the dark zone and entries from light zone to dark zone werecalculated. Mice with impaired memories showed the inclination to enter and stay in the dark zone.
Atrophy volume assessmentAfter transcardial perfusion with PBS and 4% paraformaldehyde (PFA, Sinopharm Chemical Reagent,Shanghai, China), the mouse brain was removed and placed in 4% PFA overnight before transferred into30% sucrose for cryoprotection. A series of 30-μm-thick brain sections were collected, among which 7sections spaced 300 μm apart were stained with cresyl violet solution. Atrophy area (ΔSn) wasdetermined by calculating the staining area loss in the ipsilateral compared to contralateral hemispheresin ImageJ. The brain atrophy volume was calculated using the following formula: V = Σ h/3[ΔSn+(ΔSn*ΔSn+1)1/2+ΔSn+1], h represented the distance between the two adjacent brain sections.
Immuno�uorescence staining

Page 7/30
The brain sections were successively treated with 0.1% TritonX-100 for 15 min, 10% BSA for 1 hour atroom temperature, and then incubated overnight at 4℃ with the following antibodies: anti-CD16/32(BD)/anti-Iba1 (WAKO, Osaka, Japan), anti-Arg-1 (Santa cruz)/ anti-Iba1 (WAKO), anti-MBP (Abcam), anti-CD31 (R&D), anti-CD31 (R&D)/anti-Ki67 (Abcam). After washing with PBS for 3 times, the sections wereincubated with different �uorophores-conjugated secondary antibodies (Invitrogen) for 1 hour at roomtemperature. After washing with PBS for 3 times, the brain sections were mounted with DAPI-containingantifade mounting medium (Invitrogen). Three brain sections from each mouse were imaged using aFV10i confocal microscope (Olympus, Tokyo, Japan). All settings were kept constant during pictureacquisition. The mean �uorescence integrated intensities and mean area were calculated by setting theaccordingly scale bar in Image J.
RNA extraction and real-time PCRTotal RNA from ADSCs was extracted using TRIzol reagent (Invitrogen) according to the manufacturer’sprotocol. miRNA-containing total RNA extraction was conducted by miRNeasy serum/plasma advancedkit (QIAGEN, Hilden, Germany) according to the manufacturer’s protocol. cDNA synthesis and real timePCR of miRNA were performed by miRcute plus miRNA cDNA synthesis kit and miRcute plus miRNAqPCR kit (SYBR Green, Tiangen Biotech, Beijing, China). The expression of mRNA or miRNA was tested bya fast real-time PCR system (7900 HT, ABI, Foster City, CA). U6 or GPADH were used as miRNA or mRNAendogenous control, respectively. The relative expression was normalized to that in the control group. Thesequences of the primers used in this study were listed in Table 1.

Page 8/30
Table 1
Primers for mRNA Real-Time Polymerase Chain Reaction
Gene Primer
GAPDH forward 5'-AGGTCGGTGTGAACGGATTTG-3'
reverse 5'-TGTAGACCATGTAGTTGAGGTCA-3'
Arg-1 forward 5'-GTGAAGAACCCACGGTCTGT-3'
reverse 5'-GCCAGAGATGCTTCCAACTG-3'
CD16 forward 5'-TTTGGACACCCAGATGTTTCAG-3'
reverse 5'-GTCTTCCTTGAGCACCTGGATC-3'
IL-1β forward 5'-CCAGCTTCAAATCTCACAGCAG-3'
reverse 5'-CTTCTTTGGGTATTGCTTGGGATC-3'
TNF-α forward 5'-CCCTCACACTCAGATCATCTTCT-3'
reverse 5'-GCTACGACGTGGGCTACAG-3'
iNOS forward 5'-CAAGCACCTTGGAAGAGGAG-3'
reverse 5'-AAGGCCAAACACAGCATACC-3'
PTEN forward 5'-TGGATTCGACTTAGACTTGACCT-3'
reverse 5'-GCGGTGTCATAATGTCTCTCAG-3'
STAT1 forward 5'-GGAAGGGGCCATCACATTCA-3'
reverse 5'-TGTAGGGCTCAACAGCATGG-3'
Western blot analysisThe concentrations of protein samples were determined by BCA protein assay (Pierce, Rockford, IL). Theprimary antibodies were anti-CD63 (SC-15363, 1:1000, Santa Cruz), anti-TSG101 (Ab83, 1:500, Abcam),anti β-actin (Proteintech 66009, 1:2000, Wuhan, China).
Culture of primary microgliaMixed glial cultures were prepared from cerebral cortices of 1‐day‐old SD rats according to the previousmethod [35]. After 0.25% trypsin digestion for 10 minutes, cortical cells were plated in DMEM with 10%FBS and 1% penicillin/streptomycin and cultured at 37°C in 5% CO2 incubator with saturated humidity.

Page 9/30
Medium was changed every 3 days. Ten days after plating, we separated microglia from mixed glia cellsby shaking at 200 rpm, 37°C for 30 minutes. Then the microglia were seeded in DMEM with 10% FBS at adensity of 300,000 cells/ml.
In vitro cellular uptake of ADSC-EVs and microglialpolarization studiesPKH-26 labeled ADSC-EVs were co-incubated with primary microglia for 6 hours, and then Iba1immuno�uorescence staining were performed to verify the cellular uptake of ADSC-EVs by culturedmicroglia in vitro. ADSC-EVs treatment of primary microglia was performed under normal culture,lipopolysaccharides (LPS) induction, and oxygen-glucose deprivation (OGD) injury conditions. Undernormal condition, M1 and M2 marker of microglia were detected 24 hours after ADSC-EVs administration(0, 20, 40 μg/ml). For LPS induction, primary microglia were subjected to 50 ng/ml LPS for 6 hours afterADSC-EVs pretreatment (0, 20, 40 μg/ml) for 24 hours. The expression of Arg-1, CD16, IL1β, TNF-α andiNOS in microglia were detected by qPCR. After 1 hour of OGD, primary microglia were subjected tonormal oxygen level and treated with ADSC-EVs (0, 20, 40 μg/ml) for 24 hours. The expression of Arg-1and CD16 in microglia was detected by qPCR.
miRNA sequencing and IPA analysisThe miRNA sequencing of ADSC-EVs was performed using �broblast-EVs as a control (Novelbio,Shanghai, China). DESeq2 algorithm was applied to �lter the differentially expressed genes [36]. p-valueand FDR analysis were subjected to the following criteria: fold change>1.5 or < 0.667, and p value<0.05,FDR<0.05. The heat-map was plotted using MeV software. The scale represented signal intensity of log2(TPM) values. The relationships between up-regulated miRNAs and microglial polarization-relatedproteins were detected by IPA analysis with selecting miRecord, Tarbase, TargetScan in miroRNA-mRNAinteractions and miRBase in additional sources. The sequences of the primers used in this study werelisted in Table 2.

Page 10/30
Table 2
Primers for miRNA Real-Time Polymerase Chain Reaction
miRNA Primer
mmu-miR-93-3p CCACTGCTGAGCTAGCACTTCCCG
mmu-miR-106b-5p CGCGCTAAAGTGCTGACAGTGCAGAT
mmu-miR-128-3p CGCCGTCACAGTGAACCGGTCTCTTT
mmu-miR-144-3p GCGGCGCGCGTACAGTATAGATGATG
mmu-miR-146a-5p GCGCGTGAGAACTGAATTCCATGGGT
mmu-miR-200a-3p GCCGCGCTAACACTGTCTGGTAACGAT
mmu-miR-200b-3p GCCGCGCGTAATACTGCCTGGTAATGA
mmu-miR-200c-3p GCGCGTAATACTGCCGGGTAATGATGG
mmu-miR-223-3p GCGCGCTGTCAGTTTGTCAAATACCCC
mmu-miR-345-5p CGCTGACCCCTAGTCCAGTGCTT
mmu-miR-363-3p CGCGCGAATTGCACGGTATCCATCTGT
mmu-miR-376a-3p GCCGCGATCGTAGAGGAAAATCCACGT
mmu-miR-429-3p GCGCGCTAATACTGTCTGGTAATGCCG
mmu-miR-451a GCGCGCGAAACCGTTACCATTACTGA
miRNA mimic infection of BV2 microgliaBV2 microglia were transfected with 100 nM negative control, or 100 nM miR-93-3p mimics, miR-128-3pmimics, miR-144-3p mimics, miR-146a-5p mimics, miR-223-3p mimics, miR-106b-5p mimics, miR-200a-3p mimics, miR-200b-3p mimics, or miR-363-3p mimics, separately. Twenty-four hours after transfection,the expression of STAT1 and PTEN were detected by qPCR using GAPDH as the internal standard. Thesequences of the primers used in this study were listed in Supplementary Table 1.
Statistical analysisAll data were presented as means±standard error of mean (SEM). Two-tailed t-test was used to comparethe means of two groups. One-way ANOVA analysis with Turkey multiple-comparisons posttest was used
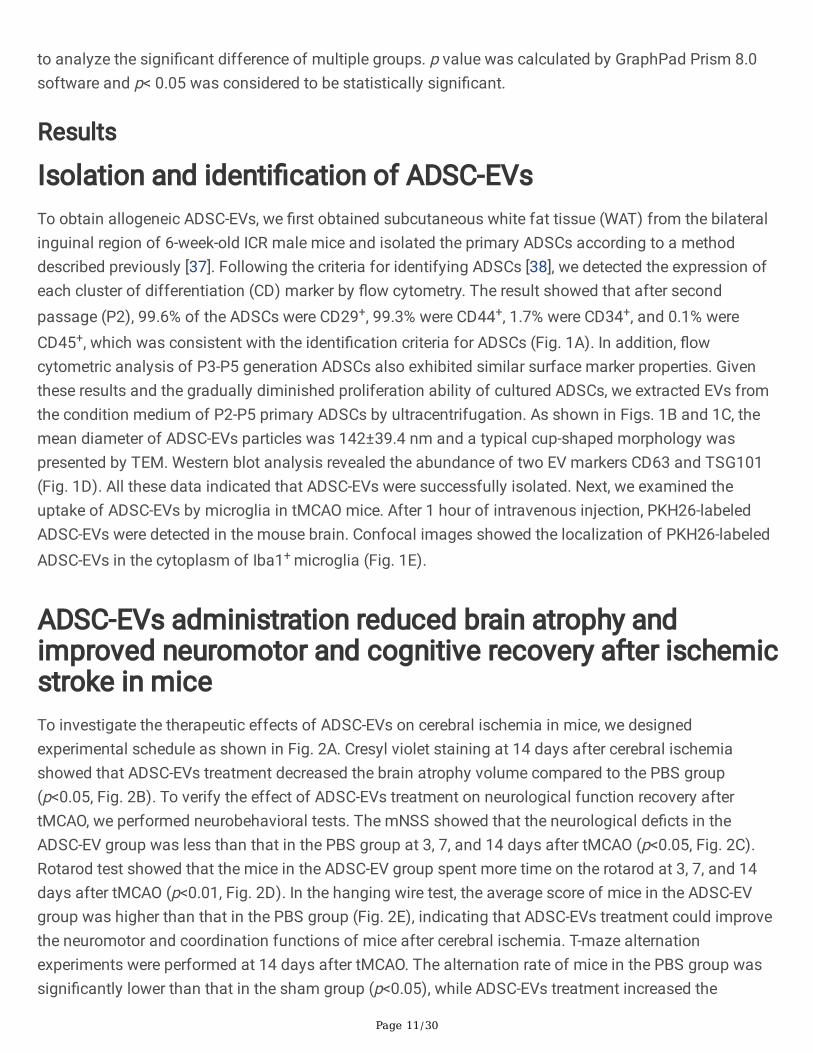
Page 11/30
to analyze the signi�cant difference of multiple groups. p value was calculated by GraphPad Prism 8.0software and p< 0.05 was considered to be statistically signi�cant.
Results
Isolation and identi�cation of ADSC-EVsTo obtain allogeneic ADSC-EVs, we �rst obtained subcutaneous white fat tissue (WAT) from the bilateralinguinal region of 6-week-old ICR male mice and isolated the primary ADSCs according to a methoddescribed previously [37]. Following the criteria for identifying ADSCs [38], we detected the expression ofeach cluster of differentiation (CD) marker by �ow cytometry. The result showed that after secondpassage (P2), 99.6% of the ADSCs were CD29+, 99.3% were CD44+, 1.7% were CD34+, and 0.1% wereCD45+, which was consistent with the identi�cation criteria for ADSCs (Fig. 1A). In addition, �owcytometric analysis of P3-P5 generation ADSCs also exhibited similar surface marker properties. Giventhese results and the gradually diminished proliferation ability of cultured ADSCs, we extracted EVs fromthe condition medium of P2-P5 primary ADSCs by ultracentrifugation. As shown in Figs. 1B and 1C, themean diameter of ADSC-EVs particles was 142±39.4 nm and a typical cup-shaped morphology waspresented by TEM. Western blot analysis revealed the abundance of two EV markers CD63 and TSG101(Fig. 1D). All these data indicated that ADSC-EVs were successfully isolated. Next, we examined theuptake of ADSC-EVs by microglia in tMCAO mice. After 1 hour of intravenous injection, PKH26-labeledADSC-EVs were detected in the mouse brain. Confocal images showed the localization of PKH26-labeledADSC-EVs in the cytoplasm of Iba1+ microglia (Fig. 1E).
ADSC-EVs administration reduced brain atrophy andimproved neuromotor and cognitive recovery after ischemicstroke in miceTo investigate the therapeutic effects of ADSC-EVs on cerebral ischemia in mice, we designedexperimental schedule as shown in Fig. 2A. Cresyl violet staining at 14 days after cerebral ischemiashowed that ADSC-EVs treatment decreased the brain atrophy volume compared to the PBS group(p<0.05, Fig. 2B). To verify the effect of ADSC-EVs treatment on neurological function recovery aftertMCAO, we performed neurobehavioral tests. The mNSS showed that the neurological de�cts in theADSC-EV group was less than that in the PBS group at 3, 7, and 14 days after tMCAO (p<0.05, Fig. 2C).Rotarod test showed that the mice in the ADSC-EV group spent more time on the rotarod at 3, 7, and 14days after tMCAO (p<0.01, Fig. 2D). In the hanging wire test, the average score of mice in the ADSC-EVgroup was higher than that in the PBS group (Fig. 2E), indicating that ADSC-EVs treatment could improvethe neuromotor and coordination functions of mice after cerebral ischemia. T-maze alternationexperiments were performed at 14 days after tMCAO. The alternation rate of mice in the PBS group wassigni�cantly lower than that in the sham group (p<0.05), while ADSC-EVs treatment increased the

Page 12/30
alternation rate compared to the PBS group (p<0.05, Fig. 2F). The moving traces of mice in step throughtest were recorded using a smart cage system at 14 days after tMCAO. The time spent in dark zone andthe number of entering to the dark area were increased after cerebral ischemic injury compared to thesham group (p<0.05), while ADSCs reduced both the time spent and the number of entering into the darkarea compared to the PBS group (p<0.01, Fig. 2G). The results of T-maze and Step through tests indicatedthat ADSC-EVs treatment improved cognitive functions of mice after cerebral ischemia.
ADSC-EVs protected against white matter injury aftermouse cerebral ischemiaTo explore the effect of ADSC-EVs treatment on white matter injury after ischemic stroke in mice, weperformed immuno�uorescence staining of myelin marker MBP at 14 days after tMCAO. Whole brainimages and the enlarged images in the striatum showed the MBP intensity and distribution (Fig. 3A).Quantitative analysis showed that the �uorescence intensity and area in the ipsilateral striatum iscomparable to the contralateral striatum in the sham group. MPB �uorescence intensity and areadropped in the ipsilateral hemisphere after tMCAO when treated only with PBS. The ratio of MBP�uorescence intensity and area in the ipsilateral striatum to the contralateral striatum was signi�cantlyhigher in the ADSC-EV group than the PBS group (p<0.01, Figs. 3B, 3C), indicating that ADSC-EVstreatment reduced white matter damage after tMCAO in mice.
ADSC-EVs promoted angiogenesis after mouse cerebralischemiaTo assess the effect of ADSC-EVs treatment on angiogenesis in mice after cerebral ischemia, we usedCD31 immuno�uorescence staining to detect the �uorescence intensity and number of microvessels inthe peripheral region of cerebral ischemia at 14 days after tMCAO (Fig. 3D). The average �uorescenceintensity of CD31 and the number of microvessels in the ADSC-EV group was higher than the PBS group(p<0.01, Figs. 3E, 3F). The number of newly proliferated endothelial cells in the ipsilateral hemisphere at14 days after tMCAO was further detected by CD31/Ki67 double staining (Fig. 3G). The enlarged imageshowed the co-localization of CD31 and Ki67 (Fig. 3H). The statistical results showed that the number ofnewly proliferated endothelial cells in the ipsilateral hemisphere was higher in the ADSC-EV group thanthat in the PBS group (p<0.01, Fig. 3I).
ADSC-EVs reversed LPS or OGD induced M1 polarization ofcultured microgliaTo further deconvolute the impact of ADSC-EVs on microglia, primary microglia isolated from newbornSD rats was treated with PBS, PKH-26 labeled ADSC-EVs, or unlabeled ADSC-EVs for 6 hours (Fig. 4A).

Page 13/30
The 3D confocal image showed that ADSC-EVs were localized to the cytoplasm of Iba1+ microglia invitro. We next treated the primary microglia with 0, 20, or 40 μg/ml ADSC-EVs for 24 hours. qPCR revealedthat ADSC-EVs did not affect the expression of M1 marker CD16, IL-1β, and TNF-α; while they up-regulated the expression of M2 marker Arg-1 in a dose-dependent manner (Fig. 4B).
It is well known that LPS induced M1 polarization of microglia [39]. OGD, a common method used tosimulate ischemic stroke in vitro, is also known to induce microglia M1 polarization [40]. Therefore, weexamined the effects of ADSC-EVs on primary microglial polarization under LPS or OGD conditions. Theresults showed that ADSC-EVs pretreatment inhibited the LPS-induced up-regulation of CD16 andin�ammatory factors Il-1β, TNF-α and iNOS, while increased the expression of Arg-1 in a dose-dependentmanner (Figs. 4C, 4E). Under OGD condition, ADSC-EVs post-treatment also reduced the up-regulation ofCD16 and increased the expression of Arg-1 with a dose-dependent manner (Fig. 4D).
ADSC-EVs shifted microglial polarization to M2 phenotypein tMCAO miceWe showed that intravenously injected ADSC-EVs could be taken up by microglia after tMCAO (Fig. 1E).To detect whether ADSC-EVs could regulate the polarization of microglia after ischemic stroke, weperformed CD16/Iba1 and Arg-1/Iba1 double-staining to detect M1 phenotype and M2 phenotypemicroglia, respectively (Figs. 5A, 5D). Enlarged views of a single microglia showed the co-localization ofIba1 with CD16 or Arg-1 (Figs. 5B, 5E). The statistical results showed that the ratio of CD16+/Iba1+ cellsover Iba1+ cells at 7 days and 14 days after tMCAO was signi�cantly lower in the ADSC-EV groupcompared to the PBS group (p<0.001) (Fig. 5C). In contrast, the ratio of Arg-1+/Iba1+ cells over Iba1+ cellswas higher in the ADSC-EV group than that in the PBS group at both 7 and 14 days after tMCAO (p<0.01,Fig. 5F).
miRNA sequencing of ADSC-EVsIn previous studies, �broblast-EVs were used as the control of ADSC-EVs [41]. To compare the differencebetween �broblast-EVs and ADSC-EVs in regulating the polarization of microglia, different doses of�broblast-EVs or ADSC-EVs were used to treat primary microglia cultured in vitro. The results of qPCRrevealed that ADSC-EVs up-regulated Arg-1 expression compared to the same dose of �broblast-EVs (Fig.6A). The heat map of miRNA sequencing showed the differentially expressed miRNA pro�les between�broblast-EVs and ADSC-EVs (Fig. 6B). The volcano map showed that ADSC-EVs has 164 up-regulatedmiRNAs and 120 down-regulated miRNAs compared to the �broblast-EVs (Fig. 6C). We further screenedthe miRNAs as followings: �rst, the miRNA should account for at least 0.01% of the total miRNApopulation in abundance; second, the miRNA should have a conserved counterpart in human. Using thesecriteria, we identi�ed 14 up-regulated miRNAs in ADSC-EVs (Fig. 6D). Results of qPCR veri�ed that the
Page 14/30
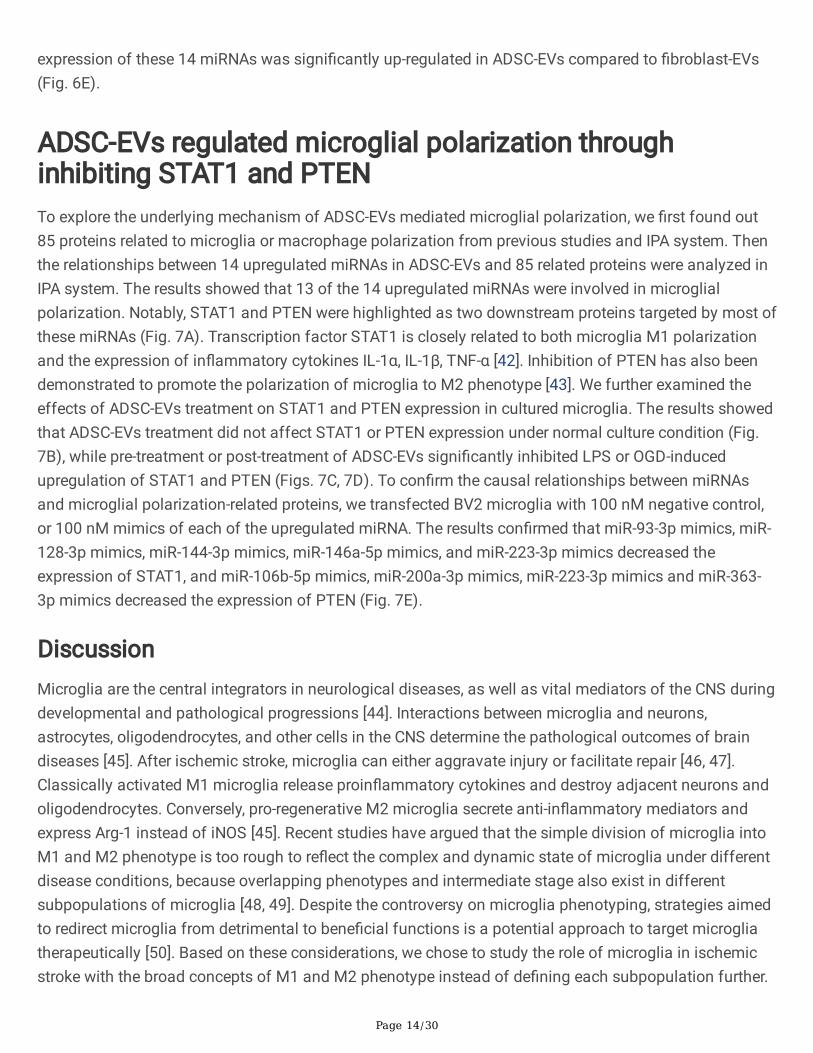
expression of these 14 miRNAs was signi�cantly up-regulated in ADSC-EVs compared to �broblast-EVs(Fig. 6E).
ADSC-EVs regulated microglial polarization throughinhibiting STAT1 and PTENTo explore the underlying mechanism of ADSC-EVs mediated microglial polarization, we �rst found out85 proteins related to microglia or macrophage polarization from previous studies and IPA system. Thenthe relationships between 14 upregulated miRNAs in ADSC-EVs and 85 related proteins were analyzed inIPA system. The results showed that 13 of the 14 upregulated miRNAs were involved in microglialpolarization. Notably, STAT1 and PTEN were highlighted as two downstream proteins targeted by most ofthese miRNAs (Fig. 7A). Transcription factor STAT1 is closely related to both microglia M1 polarizationand the expression of in�ammatory cytokines IL-1α, IL-1β, TNF-α [42]. Inhibition of PTEN has also beendemonstrated to promote the polarization of microglia to M2 phenotype [43]. We further examined theeffects of ADSC-EVs treatment on STAT1 and PTEN expression in cultured microglia. The results showedthat ADSC-EVs treatment did not affect STAT1 or PTEN expression under normal culture condition (Fig.7B), while pre-treatment or post-treatment of ADSC-EVs signi�cantly inhibited LPS or OGD-inducedupregulation of STAT1 and PTEN (Figs. 7C, 7D). To con�rm the causal relationships between miRNAsand microglial polarization-related proteins, we transfected BV2 microglia with 100 nM negative control,or 100 nM mimics of each of the upregulated miRNA. The results con�rmed that miR-93-3p mimics, miR-128-3p mimics, miR-144-3p mimics, miR-146a-5p mimics, and miR-223-3p mimics decreased theexpression of STAT1, and miR-106b-5p mimics, miR-200a-3p mimics, miR-223-3p mimics and miR-363-3p mimics decreased the expression of PTEN (Fig. 7E).
DiscussionMicroglia are the central integrators in neurological diseases, as well as vital mediators of the CNS duringdevelopmental and pathological progressions [44]. Interactions between microglia and neurons,astrocytes, oligodendrocytes, and other cells in the CNS determine the pathological outcomes of braindiseases [45]. After ischemic stroke, microglia can either aggravate injury or facilitate repair [46, 47].Classically activated M1 microglia release proin�ammatory cytokines and destroy adjacent neurons andoligodendrocytes. Conversely, pro-regenerative M2 microglia secrete anti-in�ammatory mediators andexpress Arg-1 instead of iNOS [45]. Recent studies have argued that the simple division of microglia intoM1 and M2 phenotype is too rough to re�ect the complex and dynamic state of microglia under differentdisease conditions, because overlapping phenotypes and intermediate stage also exist in differentsubpopulations of microglia [48, 49]. Despite the controversy on microglia phenotyping, strategies aimedto redirect microglia from detrimental to bene�cial functions is a potential approach to target microgliatherapeutically [50]. Based on these considerations, we chose to study the role of microglia in ischemicstroke with the broad concepts of M1 and M2 phenotype instead of de�ning each subpopulation further.
Page 15/30
ADSCs have been considered as the optimal source of MSCs with tremendous potential in the treatmentof cerebral ischemia. Adipose stem cells and their derived derivatives have been demonstrated to beeffective in regulating macrophage polarization [25, 51]. The activation of microglia is similar to those ofperipheral macrophages after ischemic stroke. In this study, we investigate whether the polarization ofmicroglia was regulated by ADSC-EVs after tMCAO. Our results indicate that ADSC-EVs up-regulate Arg-1expression and inhibit CD16 expression both in vivo after tMCAO and in vitro under LPS/OGD condition.As aforementioned, the shifting of microglial polarization could be bene�cial to various cell types in theCNS under stress. Here, we detect an increase in angiogenesis and a decrease in MBP loss at 14 daysafter cerebral ischemia in the ADSC-EVs treated group compared to the PBS control. It is well establishedthat M2 microglia promote angiogenesis [52, 53]. For instance, culture supernatant of M2 microgliapromotes angiogenesis in vitro in human brain microvassal endothelial cells (HBMECs) [50]. M2microglia also protect against white manner injury and drive oligodendrocyte differentiation during CNSremyelination [11, 54]. These evidences suggest that the increased angiogenesis and decreaseddemyelination are at least partially associated to the shifted microglial polarization by ADSC-EVs. Theimprovement of neurological recovery and substantial reduction of brain atrophy after ischemic strokecould be attributed to the bene�cial interactions between M2 microglia and different cell types in the CNS.It should be noted that Iba1+ cells in the ischemic brain represent both microglia and macrophages. Wedo not aim to distinguish between the local microglia and circulating macrophages in�ltrated to theinjured brain in this study. Apart from that, systematically administrated ADSC-EVs could also be takenup by other cells beside microglia and improve the cerebral ischemic injury subsequently. Since thecontribution of other cell types could not be excluded here, such as neurons, astrocytes, OPC, or peripheralimmune cells, we concluded that ADSC-EVs exert therapeutic function after cerebral ischemia partlythrough direct delivery cargos to microglia and regulating their polarization.
Under normal condition, ADSC-EVs do not affect the baseline expression of M1 microglia marker andin�ammatory cytokines. In contrast, under LPS/OGD stress, ADSC-EVs inhibit the M1 microglialpolarization and the expression of pro-in�ammatory cytokines IL-1β, TNF-α and iNOS. Meanwhile, Arg-1expression is up-regulated by ADSC-EVs in a dose-dependent manner. These results suggest that thecontents in ADSC-EVs contribute to the promotion of microglia M2 polarization.
miRNAs are main functional cargos in EVs and have been demonstrated to participate in variousphysiological and pathological processes [55]. In this study, we perform miRNA sequencing of ADSC-EVsusing �broblast-EVs as a control and identi�ed 284 differentially expressed miRNAs, of which 164 are up-regulated in ADSC-EVs. Fibroblast have regularly been used as the control cell for MSCs in previousstudies [56], and �broblast-EVs have been used as the control for ADSC-EVs [41]. The results of IPAanalysis highlight STAT1 and PTEN as two downstream proteins targeted by most up-regulated miRNAsin ADSC-EVs. It is predicted that 13 among the 14 up-regulated miRNAs could negatively regulate one ormore proteins related to microglial polarization. Among these 13 miRNAs, miR-93-3p, miR-128-3p, miR-144-3p, miR-146a-5p, and miR-223-3p negatively regulate STAT1, and miR-106b-5p, miR-200a-3p, miR-200b-3p, miR-223-3p, and miR-363-3p negatively regulate PTEN. STAT1 is a transcription factor that

Page 16/30
plays a critical role in microglia pro-in�ammatory pathway and closely related to the expression of pro-in�ammatory cytokines such as IL-1α, IL-1β, TNF-α [57, 58]. STAT1 and NFκB are main respondingtranscription factors in both LPS and IFNγ mediated in�ammatory signaling in microglia [39, 59]. SOCS1and SOCS3 recruited by IL-10 suppress the JAK/STAT-1 signaling to inhibit pro-in�ammatory polarization[58]. Inhibiting STAT1 activation and up-regulation can reduce the M1 microglia/macrophage polarization[42, 60]. PTEN convert PIP3, the substrate of Akt activation, to PIP2. Thus, inhibition of PTEN results inactivation of Akt, which can further shift microglia from the detrimental M1 phenotype toward theprotective M2 phenotype and thereby exert the protection of neighboring oligodendrocytes [43]. PTENknockout promotes M2 microglial polarization and inhibit the pro-in�ammatory response after ischemicbrain injury [61]. These results indicate that both STAT1 and PTEN are involved in the regulation ofmicroglial polarization and inhibition of STAT1 or PTEN contribute to increase M2 phenotype anddecrease M1 phenotype of microglia. Further study con�rms that ADSC-EVs could inhibit the up-regulation of STAT1 and PTEN in primary microglia under LPS/OGD conditions. In addition, mimics ofthese miRNAs decrease the expression level of STAT1 or PTEN after transfected into BV2 microglia,except for miR-200b-3p mimics. This result is not surprising given the low score of binding sites betweenSTAT1 and miR-200b-3p predicted by TargetScan. Therefore, we speculate that ADSC-EVs exert aregulatory function on microglial polarization by direct delivery of miRNA cargos to recipient microglia.
ConclusionCollectively, the present study has investigated the e�cacy of ADSC-EVs in treating ischemic brain injuryusing a mouse model and explored the mechanisms by which ADSC-EVs exert their function. Our resultsdemonstrated that ADSC-EVs promoted M2 polarization of microglia both in vivo and in vitro. In addition,we identi�ed STAT1 and PTEN as two downstream targets of upregulated miRNAs in ADSC-EVs andcon�rmed their inhibition by ADSC-EVs in cultured microglia. These results supported that ADSC-EVsregulated microglial polarization through directly delivering miRNAs and inhibiting the expression ofSTAT1 and PTEN.
AbbreviationsADSC: adipose-derived stem cells; Arg-1: arginase-1; CD16: cluster of differentiation marker 16; CBF:cerebral blood �ow; CNS: central nervous system; EV: extracellular vesicles; F-EV: �broblast derivedextracellular vesicles; HBMECs: human brain microvassal endothelial cells; IL-1β: interleukin-1β; iNOS:inducible nitric oxide synthase; IPA: ingenuity pathway analysis; LPS: lipopolysaccharides; MBP:myelinbasicprotein; miRNA: microRNA; mNSS: modi�ed neurological severity score; MSCs: mesenchymalstem cells; NC: negative control; NTA: nanoparticle tracking analysis; OGD: oxygen-glucose deprivation;OPC: oligodendrocyte progenitor cells; PTEN: phosphatase and tensin homolog deleted on chromosometen; STAT1: signal transducers and activators of transcription 1; TEM: transmission electron microscope;tMCAO: transient middle cerebral artery occlusion; TNF-α: tumor necrosis factor α; TSG101: tumorsusceptibility gene 101; WAT: white fat tissue

Page 17/30
Declarations
Ethics approval and consent to participateAll cell and animal experimental designation were based on animal research: reporting invivo experiments (ARRIVE) guidelines, which ensured that the data from animal experiments could befully evaluated and utilized. All animals were handled according to a protocol approved by theInstitutional Animal Care and Use Committee (IACUC) of Shanghai Jiao Tong University, Shanghai, China.
Consent for publicationNot applicable.
Availability of data and materialThe datasets supporting the conclusions of this article are included within the article.
AcknowledgementsNot applicable.
Authors’ contributionsYW and GYY conceived the project, designed the experiments, and revised the manuscript. YT, ZZ and HLadvised on experimental design and data analysis. XH designed and performed the experiments,analyzed the data, and drafted the manuscript and �gures. HZ, YL, RS and QZ participated in ADSC andprimary microglia isolation. JP helped in IPA analysis. YJ contributed to western blot. CL helped samplecollection.
FundingThis study was supported by National Natural Science Foundation of China (NSFC) projects 81870921(YW), 81771251 (GYY), 81801170 (YT), 82071284 (YT), 81771244 (ZZ), and 81974179 (ZZ); NationalKey R&D Program of China #2016YFC1300602 (GYY) and #2019YFA0112000 (YT), the Scienti�cResearch and Innovation Program of Shanghai Education Commission 2019-01-07-00-02-E00064 (GYY),and K. C. Wong Education Foundation (GYY).
Competing interests

Page 18/30
The authors declare that they have no competing interest
References1. Feigin VL, Lawes CM, Bennett DA, Barker-Collo SL, Parag V. Worldwide stroke incidence and early
case fatality reported in 56 population-based studies: a systematic review. Lancet Neurol.2009;8:355–69.
2. Go AS, Mozaffarian D, Roger VL, Benjamin EJ, Berry JD, Blaha MJ, et al. Executive summary: heartdisease and stroke statistics–2014 update: a report from the American Heart Association.Circulation. 2014;129:399–410.
3. Emberson J, Lees KR, Lyden P, Blackwell L, Albers G, Bluhmki E, et al. Effect of treatment delay, age,and stroke severity on the effects of intravenous thrombolysis with alteplase for acute ischaemicstroke: a meta-analysis of individual patient data from randomised trials. Lancet. 2014;384:1929–35.
4. Powers WJ, Derdeyn CP, Biller J, Coffey CS, Hoh BL, Jauch EC, et al. 2015 American HeartAssociation/American Stroke Association Focused Update of the 2013 Guidelines for the EarlyManagement of Patients With Acute Ischemic Stroke Regarding Endovascular Treatment: AGuideline for Healthcare Professionals From the American Heart Association/American StrokeAssociation. Stroke. 2015;46:3020–35.
5. Ma Y, Wang J, Wang Y, Yang GY. The biphasic function of microglia in ischemic stroke. Progress inneurobiology. 2017;157:247–72.
�. Hu X, Li P, Guo Y, Wang H, Leak RK, Chen S, et al. Microglia/macrophage polarization dynamicsreveal novel mechanism of injury expansion after focal cerebral ischemia. Stroke. 2012;43:3063–70.
7. Zhao SC, Ma LS, Chu ZH, Xu H, Wu WQ, Liu F. Regulation of microglial activation in stroke. Actapharmacologica Sinica. 2017;38:445–58.
�. Chen AQ, Fang Z, Chen XL, Yang S, Zhou YF, Mao L, et al. Microglia-derived TNF-α mediatesendothelial necroptosis aggravating blood brain-barrier disruption after ischemic stroke. Cell deathdisease. 2019;10:487.
9. Li Q, Barres BA. Microglia and macrophages in brain homeostasis and disease. Nature reviewsImmunology. 2018;18:225–42.
10. Cherry JD, Olschowka JA, O'Banion MK. Neuroin�ammation and M2 microglia: the good, the bad,and the in�amed. J Neuroin�amm. 2014;11:98.
11. Miron VE, Boyd A, Zhao JW, Yuen TJ, Ruckh JM, Shadrach JL, et al. M2 microglia and macrophagesdrive oligodendrocyte differentiation during CNS remyelination. Nature neuroscience. 2013;16:1211–8.
12. Song Y, Li Z, He T, Qu M, Jiang L, Li W, et al. M2 microglia-derived exosomes protect the mouse brainfrom ischemia-reperfusion injury via exosomal miR-124. Theranostics. 2019;9:2910–23.
Page 19/30
13. Li Z, Song Y, He T, Wen R, Li Y, Chen T, et al. M2 microglial small extracellular vesicles reduce glialscar formation via the miR-124/STAT3 pathway after ischemic stroke in mice. Theranostics.2021;11:1232–48.
14. Wang J, Xing H, Wan L, Jiang X, Wang C, Wu Y. Treatment targets for M2 microglia polarization inischemic stroke. Biomed Pharmacotherapy. 2018;105:518–25.
15. Rawlinson C, Jenkins S, Thei L, Dallas ML, Chen R. Post-Ischaemic Immunological Response in theBrain: Targeting Microglia in Ischaemic Stroke Therapy. Brain sciences. 2020;10:159.
1�. Parekkadan B, Milwid JM. Mesenchymal stem cells as therapeutics. Annu Rev Biomed Eng.2010;12:87–117.
17. Stonesifer C, Corey S, Ghanekar S, Diamandis Z, Acosta SA, Borlongan CV. Stem cell therapy forabrogating stroke-induced neuroin�ammation and relevant secondary cell death mechanisms.Progress in neurobiology. 2017;158:94–131.
1�. Bacakova L, Zarubova J, Travnickova M, Musilkova J, Pajorova J, Slepicka P, et al. Stem cells: theirsource, potency and use in regenerative therapies with focus on adipose-derived stem cells - a review.Biotechnology advances. 2018;36:1111–26.
19. Ishizaka S, Horie N, Satoh K, Fukuda Y, Nishida N, Nagata I. Intra-arterial cell transplantation providestiming-dependent cell distribution and functional recovery after stroke. Stroke. 2013;44:720–6.
20. Jiang W, Liang G, Li X, Li Z, Gao X, Feng S, et al. Intracarotid transplantation of autologous adipose-derived mesenchymal stem cells signi�cantly improves neurological de�cits in rats after MCAo.Journal of materials science Materials in medicine. 2014;25:1357–66.
21. Oh SH, Choi C, Chang DJ, Shin DA, Lee N, Jeon I, et al. Early neuroprotective effect with lack of long-term cell replacement effect on experimental stroke after intra-arterial transplantation of adipose-derived mesenchymal stromal cells. Cytotherapy. 2015;17:1090–103.
22. Otero-Ortega L, Gutiérrez-Fernández M, Ramos-Cejudo J, Rodríguez-Frutos B, Fuentes B, Sobrino T, etal. White matter injury restoration after stem cell administration in subcortical ischemic stroke. StemCell Res Ther. 2015;6:121.
23. Chi L, Huang Y, Mao Y, Wu K, Zhang L, Nan G. Tail Vein Infusion of Adipose-Derived MesenchymalStem Cell Alleviated In�ammatory Response and Improved Blood Brain Barrier Condition bySuppressing Endoplasmic Reticulum Stress in a Middle Cerebral Artery Occlusion Rat Model. Medicalscience monitor: international medical journal of experimental clinical research. 2018;24:3946–57.
24. Doyle LM, Wang MZ. Overview of Extracellular Vesicles, Their Origin, Composition, Purpose, andMethods for Exosome Isolation and Analysis. Cells. 2019;8(7):727.
25. Heo JS, Choi Y, Kim HO. Adipose-Derived Mesenchymal Stem Cells Promote M2 MacrophagePhenotype through Exosomes. Stem cells international. 2019;2019:7921760.
2�. Zhu D, Johnson TK, Wang Y, Thomas M, Huynh K, Yang Q, et al. Macrophage M2 polarizationinduced by exosomes from adipose-derived stem cells contributes to the exosomal proangiogeniceffect on mouse ischemic hindlimb. Stem Cell Res Ther. 2020;11:162.

Page 20/30
27. Deng S, Zhou X, Ge Z, Song Y, Wang H, Liu X, et al. Exosomes from adipose-derived mesenchymalstem cells ameliorate cardiac damage after myocardial infarction by activating S1P/SK1/S1PR1signaling and promoting macrophage M2 polarization. Int J Biochem Cell Biol. 2019;114:105564.
2�. Lee TM, Harn HJ, Chiou TW, Chuang MH, Chen CH, Chuang CH, et al. Preconditioned adipose-derivedstem cells ameliorate cardiac �brosis by regulating macrophage polarization in infarcted rat heartsthrough the PI3K/STAT3 pathway. Lab Invest. 2019;99:634–47.
29. Zhao H, Shang Q, Pan Z, Bai Y, Li Z, Zhang H, et al. Exosomes From Adipose-Derived Stem CellsAttenuate Adipose In�ammation and Obesity Through Polarizing M2 Macrophages and Beiging inWhite Adipose Tissue. Diabetes 2018;67:235 – 47.
30. Ratajczak MZ, Ratajczak J. Horizontal transfer of RNA and proteins between cells by extracellularmicrovesicles: 14 years later. Clinical translational medicine. 2016;5:7.
31. Momen-Heravi F, Balaj L, Alian S, Mantel PY, Halleck AE, Trachtenberg AJ, et al. Current methods forthe isolation of extracellular vesicles. Biological chemistry. 2013;394:1253–62.
32. Li W, He T, Jiang L, Shi R, Song Y, Mamtilahun M, et al. Fingolimod Inhibits In�ammation butExacerbates Brain Edema in the Acute Phases of Cerebral Ischemia in Diabetic Mice. Front NeuroSci.2020;14:842.
33. Pan J, Qu M, Li Y, Wang L, Zhang L, Wang Y, et al. MicroRNA-126-3p/-5p Overexpression AttenuatesBlood-Brain Barrier Disruption in a Mouse Model of Middle Cerebral Artery Occlusion. Stroke2020;51:619 – 27.
34. Putten. Mv. The use of hanging wire tests to monitor muscle strength and condition over time. 2016.
35. Giulian D, Baker TJ. Characterization of ameboid microglia isolated from developing mammalianbrain. The Journal of neuroscience: the o�cial journal of the Society for Neuroscience.1986;6:2163–78.
3�. Love MI, Huber W, Anders S. Moderated estimation of fold change and dispersion for RNA-seq datawith DESeq2. Genome biology. 2014;15:550.
37. Bunnell BA, Flaat M, Gagliardi C, Patel B, Ripoll C. Adipose-derived stem cells: isolation, expansionand differentiation. Methods. 2008;45:115–20.
3�. Kern S, Eichler H, Stoeve J, Klüter H, Bieback K. Comparative analysis of mesenchymal stem cellsfrom bone marrow, umbilical cord blood, or adipose tissue. Stem Cells. 2006;24:1294–301.
39. Orihuela R, McPherson CA, Harry GJ. Microglial M1/M2 polarization and metabolic states. Br JPharmacol. 2016;173:649–65.
40. Ji J, Wang J, Yang J, Wang XP, Huang JJ, Xue TF, et al. The Intra-nuclear SphK2-S1P Axis FacilitatesM1-to-M2 Shift of Microglia via Suppressing HDAC1-Mediated KLF4 Deacetylation. Frontiers inimmunology. 2019;10:1241.
41. Takahara K, Ii M, Inamoto T, Nakagawa T, Ibuki N, Yoshikawa Y, et al. microRNA-145 Mediates theInhibitory Effect of Adipose Tissue-Derived Stromal Cells on Prostate Cancer. Stem Cells Dev.2016;25:1290–8.

Page 21/30
42. Fan H, Tang HB, Shan LQ, Liu SC, Huang DG, Chen X, et al. Quercetin prevents necroptosis ofoligodendrocytes by inhibiting macrophages/microglia polarization to M1 phenotype after spinalcord injury in rats. J Neuroin�amm. 2019;16:206.
43. Wang G, Shi Y, Jiang X, Leak RK, Hu X, Wu Y, et al. HDAC inhibition prevents white matter injury bymodulating microglia/macrophage polarization through the GSK3β/PTEN/Akt axis. Proc Natl AcadSci USA. 2015;112:2853–8.
44. Wright-Jin EC, Gutmann DH. Microglia as Dynamic Cellular Mediators of Brain Function. Trends MolMed. 2019;25:967–79.
45. Fumagalli M, Lombardi M, Gressens P, Verderio C. How to reprogram microglia toward bene�cialfunctions. Glia. 2018;66:2531–49.
4�. Qin C, Zhou LQ, Ma XT, Hu ZW, Yang S, Chen M, et al. Dual Functions of Microglia in Ischemic Stroke.Neurosci Bull. 2019;35:921–33.
47. Xu S, Lu J, Shao A, Zhang JH, Zhang J. Glial Cells: Role of the Immune Response in Ischemic Stroke.Frontiers in immunology. 2020;11:294.
4�. Zhou T, Huang Z, Sun X, Zhu X, Zhou L, Li M, et al. Microglia Polarization with M1/M2 PhenotypeChanges in rd1 Mouse Model of Retinal Degeneration. Front Neuroanat. 2017;11:77.
49. Prinz M, Jung S, Priller J. Microglia Biology: One Century of Evolving Concepts. Cell. 2019;179:292–311.
50. Hu X, Leak RK, Shi Y, Suenaga J, Gao Y, Zheng P, et al. Microglial and macrophage polarization—newprospects for brain repair. Nature reviews Neurology. 2015;11:56–64.
51. Yu S, Cheng Y, Zhang L, Yin Y, Xue J, Li B, et al. Treatment with adipose tissue-derived mesenchymalstem cells exerts anti-diabetic effects, improves long-term complications, and attenuatesin�ammation in type 2 diabetic rats. Stem Cell Res Ther. 2019;10:333.
52. Jin Q, Cheng J, Liu Y, Wu J, Wang X, Wei S, et al. Improvement of functional recovery by chronicmetformin treatment is associated with enhanced alternative activation of microglia/macrophagesand increased angiogenesis and neurogenesis following experimental stroke. Brain Behav Immun.2014;40:131–42.
53. Lei X, Chen X, Quan Y, Tao Y, Li J. Targeting. CYP2J2 to Enhance the Anti-Glioma E�cacy ofCannabinoid Receptor 2 Stimulation by Inhibiting the Pro-Angiogenesis Function of M2 Microglia.Frontiers in oncology. 2020;10:574277.
54. Qin C, Fan WH, Liu Q, Shang K, Murugan M, Wu LJ, et al. Fingolimod Protects Against Ischemic WhiteMatter Damage by Modulating Microglia Toward M2 Polarization via STAT3 Pathway. Stroke.2017;48:3336–46.
55. Iranifar E, Seresht BM, Momeni F, Fadaei E, Mehr MH, Ebrahimi Z, et al. Exosomes and microRNAs:New potential therapeutic candidates in Alzheimer disease therapy. Journal of cellular physiology.2019;234:2296–305.
5�. Jeon D, Chu K, Lee ST, Jung KH, Ban JJ, Park DK, et al. Neuroprotective effect of a cell-free extractderived from human adipose stem cells in experimental stroke models. Neurobiol Dis. 2013;54:414–

Page 22/30
20.
57. Butturini E, Boriero D, Carcereri de Prati A, Mariotto S. STAT1 drives M1 microglia activation andneuroin�ammation under hypoxia. Arch Biochem Biophys. 2019;669:22–30.
5�. Jin X, Liu MY, Zhang DF, Zhong X, Du K, Qian P, et al. Natural products as a potential modulator ofmicroglial polarization in neurodegenerative diseases. Pharmacological research. 2019;145:104253.
59. Chen S, Ye J, Chen X, Shi J, Wu W, Lin W, et al. Valproic acid attenuates traumatic spinal cord injury-induced in�ammation via STAT1 and NF-κB pathway dependent of HDAC3. J Neuroin�amm.2018;15:150.
�0. Yao A, Liu F, Chen K, Tang L, Liu L, Zhang K, et al. Programmed death 1 de�ciency induces thepolarization of macrophages/microglia to the M1 phenotype after spinal cord injury in mice.Neurotherapeutics: the journal of the American Society for Experimental NeuroTherapeutics.2014;11:636–50.
�1. Cheng J, Tang JC, Pan MX, Chen SF, Zhao D, Zhang Y, et al. l-lysine confers neuroprotection bysuppressing in�ammatory response via microRNA-575/PTEN signaling after mouse intracerebralhemorrhage injury. Exp Neurol. 2020;327:113214.
Figures
Figure 1
Characterization of ADSCs and ADSC-derived EVs. A) Flow cytometric analysis of ADSCs surfacemarkers CD29 and CD44, and negative markers CD34 and CD45. B) Size distribution of ADSC-EVsmeasured by NTA. C) Representative TEM image of ADSC-EVs. Scale bar=500 nm. The enlarged picture

Page 23/30
showed the clear structure of ADSC-EVs. Scale bar=100 nm. D) Expressions of the EV markers CD63,TSG101, and β-actin con�rmed by Western blot. ADSC-EVs lysate was loaded into the left lane andADSCs lysate was loaded into the right lane. E) Immuno�uorescence imaging showed the uptake ofADSC-EVs by microglia in vivo. PKH26 labeled ADSC-EVs (Red) were intravenously injected to the mouseat 24 hours after tMCAO. The uptake of ADSC-EVs by microglia was detected 1 hour after theadministration. Scale bar=10 μm. White arrows indicated PKH26 labeled ADSC-EVs taken up bymicroglia.
Figure 2
ADSC-EVs reduced brain atrophy volume and promoted neural functional recovery. A) Experimentalschedule. ADSC-EVs injection was performed daily during 1-7 days after tMCAO. B) Representativephotomicrographs of coronal sections stained with cresyl violet and quanti�cation of brain atrophy. Thewhite dotted line showed the mirror image of the contralateral hemisphere. n=7. C) The results of mNSSevaluation before tMCAO and 1, 3, 7, and 14 days after the operation. n=10. D) Rotarod test beforetMCAO and 3, 7, and 14 days after the operation. n=10. E) Average fall score of mice during a 180-sechanging wire test at 14 days after tMCAO. n=10. F) T-maze test showed the ratio of spontaneousalternation at 14 days after tMCAO. n=4 in the sham group, n=10 in the PBS and ADSC-EVs groups. G)Representative moving trace of mice recorded in step through test at 14 days after tMCAO. Bar graphs atthe bottom showed the quanti�ed total time spent in the dark zone and the number of dark zone entries

Page 24/30
of each mouse. n=4 in the sham group, n=8 in the PBS and ADSC-EVs groups. Data were presented asmean±SEM, *p<0.05, **p<0.01, and ***p<0.001, ns = not signi�cant.
Figure 3
ADSC-EVs attenuated white matter injury and promoted angiogenesis in tMCAO mice. A)Immuno�uorescence staining of MBP at 14 days after tMCAO in the PBS and ADSC-EVs groups. Scalebar=1000 μm. The enlarged pictures of white square revealed MBP staining in the striatum of theipsilateral and the contralateral hemisphere. Scale bar=200 μm. B) Quantitative analyses of the ratio ofmean MBP area in ipsilateral to contralateral striatum. C) Quantitative analyses of the ratio of mean MBP

Page 25/30
intensity in ipsilateral to contralateral striatum. n = 4 per group. D) Immuno�uorescence staining ofCD31+ microvessels in the ipsilateral hemisphere after tMCAO in the PBS and ADSC-EVs groups. Whitestar indicated the core area of infarction and the white dashed line represented the boundary between theischemic core area and peripheral area. Scale bar=50 μm. E) Mean integrated density of CD31+microvessels in the perifocal region at 14 days after tMCAO. F) Quanti�cations of CD31+ microvesselsnumbers in the perifocal region at 14 days after tMCAO. n = 4 per group. G) Immuno�uorescence stainingof Ki67+/CD31+ newly proliferated endothelial cells in the ipsilateral hemisphere after tMCAO in the PBSand ADSC-EVs groups. White arrows indicated Ki67+/CD31+ cells. Scale bar=20 μm. H) The enlargedpicture showed the Ki67+/CD31+ cells. I) Quanti�cations of Ki67+/CD31+ cell numbers in the perifocalregion at 14 days after tMCAO. n = 4 per group. Scale bar=20 μm. Data were mean±SEM, ∗p< 0.05, ∗∗p<0.01, ∗∗∗p< 0.001.

Page 26/30
Figure 4
ADSC-EVs shifted microglia polarization to M2 phenotype under LPS or OGD induction. A) PKH-26labeled ADSC-EVs (Red) were taken up by Iba1+ primary microglia (Green). PKH-26 labeled ADSC-EVswere incubated with primary microglia for 6 hours. Scale bar=25 μm. White arrows indicated PKH26labeled ADSC-EVs taken up by cultured microglia. B) Twenty-four hours after co-incubation with 0, 20, or40 μg/ml ADSC-EVs, the expression of Arg-1 and proin�ammatory marker CD16, IL1-β, TNF-α in primary

Page 27/30
microglia were detected by qPCR. n=2. C) Twenty-four hours after 0, 20, or 40 μg/ml ADSC-EVspretreatment, primary microglia were subjected to 50 ng/ml LPS for 6 hours. Then the expression of Arg-1and CD16 were detected by qPCR. n=3 per group. D) After 1 hour of OGD, primary microglia weresubjected to normoxia and glucose synchronously post-treated with 0, 20, or 40 μg/ml ADSC-EVs for 24hours. Then the expression of Arg-1 and CD16 were detected by qPCR. n=6 per group. E) The expressionof in�ammatory factors (IL1β, TNF-α and iNOS) under LPS induction were detected by qPCR. n=3 pergroup. The data were the mean±SEM, ∗p< 0.05 , ∗∗p< 0.01 , ∗∗∗p< 0.001.
Figure 5
ADSC-EVs shifted the M1/M2 polarization of microglia towards M2 phenotype after tMCAO. A) ADSC-EVsadministration reduced the ratio of M1 microglia at 7 days and 14 days after tMCAO. White arrowsindicated CD16+/Iba1+ cells. B) Zoom in-picture of a single microglia in M1 phenotype. C) Quanti�cation

Page 28/30
graph showed the ratio of CD16+/Iba1+ cells to total Iba1+ cells. D) ADSC-EVs administration increasedthe ratio of M2 microglia at 7 days and 14 days after tMCAO. White arrows indicated Arg-1+/Iba1+ cells.E) Zoom in-picture of a single microglia in M2 phenotype. F) Quanti�cation graph showed the ratio ofArg-1+/Iba1+ cells to total Iba1+ cells. n=4 per group. Scale bar=50 μm. Data were mean±SEM, ∗p< 0.05,∗∗p< 0.01, ∗∗∗p< 0.001.
Figure 6
qPCR veri�ed 14 upregulated miRNAs in ADSC-EVs. A) Twenty-four hours after co-cultivation with�broblast-EVs or ADSC-EVs, Arg-1 expression in microglia were detected by qPCR. ADSC-EVs weresuperior than �broblast-EVs in promoting Arg-1 expression. B) Heat map showed differently expressedmiRNA in ADSC-EVs compared to �broblast-EVs. C) Volcano plot revealed 164 upregulated miRNAs and120 down-regulated miRNAs in ADSC-EVs compared to �broblast-EVs. D) 14 up-regulated miRNAs wereselected according to abundance more than 0.01% and conservation in human. E) qPCR veri�ed 14 up-regulated miRNAs. n=3 per group. Data were mean±SEM ∗p< 0.05 , ∗∗p< 0.01 , ∗∗∗p< 0.001.

Page 29/30
Figure 7
ADSC-EVs inhibited LPS or OGD induced up-regulation of STAT1 and PTEN. A) The relationship between14 up-regulated miRNAs and proteins related to microglia polarization were analyzed by IPA, and STAT1and PTEN were highlighted as the targets of these miRNAs. B) qPCR revealed that ADSC-EVsadministration did not signi�cantly change STAT1 and PTEN expression in primary microglia undernormal condition. C) ADSC-EVs pretreatment attenuated LPS induced up-regulation of STAT1 and PTEN.

Page 30/30
D) ADSC-EVs post-treatment signi�cantly dampened the OGD-induced upregulation of STAT1 and PTEN.E) qPCR con�rmed that STAT1 expression was down-regulated after the transfection of miR-93-3pmimics, miR-128-3p mimics, miR-144-3p mimics, miR-146a-5p mimics, and miR-223-3p mimicscompared with the negative control in BV2 microglia. The expression of PTEN was down-regulated afterthe transfection of miR-106b-5p mimics, miR-200a-3p mimics, miR-223-3p mimics, and miR-363-3pmimics. n=3 per group. Data were mean±SEM of three independent experiments, ∗p< 0.05 , ∗∗p< 0.01 ,∗∗∗p< 0.001.