neural systems & behavior systems & behavior 2014 integrative molecular neuroethology module...
TRANSCRIPT

1
Neural Systems & Behavior
Laboratory Experiments for the
Integrative Molecular Neuroscience Module
Neural Systems & Behavior 2014 Integrative Molecular Neuroethology Module
ii
Laboratory Experiments for the
Integrative Molecular Neuroscience Module
Version 1.1
Neural Systems & Behavior Course
Marine Biological Laboratory
Cycle 3: July 7, 2014 – July 19, 2014
Module Instructors:
Dr. Suzy C.P. Renn
Dr. Hans A. Hofmann
Rayna M. Harris
Chelsea A. Weitekamp
Course Directors:
Dr. Hans A. Hofmann
Dr. André A. Fenton
Copyright 2014 by Neural Systems & Behavior
See http://www.mbl.edu/nsb/ for the latest version of this manual.
The procedures described herein were optimized in the Hofmann Laboratory at The
University of Texas at Austin.
Promega kindly gave permission to the use of its education resources as described in
this manual.

Neural Systems & Behavior 2014 Integrative Molecular Neuroethology Module
iii
Table of Contents
Instructor Information .............................................................................................................. iv
Module Objective ........................................................................................................................ v
Chapter 1: Gene Identification .................................................................................................. 1
Chapter 2: Tissue Processing for Gene Expression Profiling ............................................... 5
Chapter 3: RNA Isolation ......................................................................................................... 10
Chapter 4: Nucleic Acid Quantification ................................................................................ 14
Chapter 5: Reverse Transcription ........................................................................................... 17
Chapter 6: Quantitative Real-time PCR (qPCR) .................................................................. 20
Chapter 7: Immunohistochemistry ........................................................................................ 27
Chapter 8: Other Molecular Protocols ................................................................................... 34
Chapter 9: The Laboratory Notebook ................................................................................... 39
Laboratory Notebook Pages .............................................................................................. I-XXI
Appendix: Hyperlinks for QR codes ................................................................................ XXII
Acknowledgements ............................................................................................................. XXIII

Neural Systems & Behavior 2014 Integrative Molecular Neuroethology Module
iv
Instructor Information
Module Leader: Dr. Suzy C.P. Renn is in the Biology Department at Reed College in Portland
Oregon. She aims to understand the genomic basis of behavior from an evolutionary perspective
through the synthesis of comparative genomics with functional studies in behavior, physiology, and
ecology. By understanding the molecular basis of species-specific, and context-specific behaviors, she
aims to determine if similar behaviors result from conserved, or converged processes of evolution.
She previously worked with Hans Hofmann to pioneer the field of behavioral genomics and
continues to pioneer genomic approaches to address questions that cross species boundaries.
Contact: [email protected]
Module Faculty: Dr. Hans A. Hofmann is in the department Integrative Biology at The University of
Texas at Austin and a Fellow at UT’s Institute for Cellular and Molecular Biology. He completed his
doctoral thesis at the Max Planck Institute in Seewiesen under the guidance of Franz Huber. He was a
postdoctoral fellow at Stanford University, a Grass Fellow at the Marine Biological Laboratory in
Woods Hole, and a Bauer Genome Fellow at Harvard University, where he pioneered the new field
of behavioral genomics. Hofmann was the co-initiator of the cichlid genomic consortium, which
successfully completed the sequencing of five cichlid genomes. He has also been honored with the
2009 College of Natural Sciences Teaching Award for his commitment to undergraduate education at
UT Austin. In March 2012 he was appointed as the Director of UT's Center for Computational Biology
and Bioinformatics. In 2013, Hofmann was selected as new Co-Director of the Neural Systems &
Behavior summer course at the Marine Biological Laboratory in Woods Hole (MA) where he is
enhancing and extending graduate and post-doctoral training in systems neuroscience and
Neuroethology.
Contact: [email protected]
Teaching Assistant and Course Developer: Rayna M. Harris received her B.S in Biochemistry from
The University of Texas at Austin and is now working towards a PhD in Cellular and Molecular
Biology. Rayna is a student in the laboratory of Hans Hofmann where she is examining the
neurogenomic mechanisms that regulate behavioral plasticity. Her research aims to understand how
social behaviors are modulated by social networks, neural networks, and molecular networks. Ever
since Hans was appointed Co-Director of NS&B, Rayna has been working to develop and teach
molecular exercises that enhance and extend the study of neurophysiology and behavior in the
various vertebrate and invertebrate model systems offered in the NS&B course.
Contact: [email protected]
Teaching Assistant: Chelsea A. Weitekamp is a PhD student in Ecology, Evolution & Behavior in the
laboratory of Hans Hofmann. Her interests are in understanding the neural, hormonal, and molecular
mechanisms underlying cooperative behavior across species.
Contact: [email protected]

Neural Systems & Behavior 2014 Integrative Molecular Neuroethology Module
v
Module Objective
Across animals, there is remarkable diversity of behavior both within and between species. Modern
molecular and genomic approaches have made it possible to identify the neuromolecular
underpinnings of such complex behavioral phenotypes. By examining species with plastic behavioral
phenotypes we have begun to understand the dynamic and flexible nature of neural transcriptomes
and have identified gene modules associated with variation in social and reproductive behaviors.
These same techniques can be applied across diverse species to identify conserved molecular
mechanisms that regulate behavior and their evolution.
The overall objective of the Integrative Molecular Neuroethology Module is to equip students with a
comprehensive understanding of the relationships between molecular activity in the nervous system
and complex behavior. A series of lectures will introduce students to the theory and practice of
“neuro-molecular-ethology” as well as current research focused on social behavior in the Renn and
Hofmann labs.
We will teach molecular techniques to complement the electrophysiological characterization of
identified cells in the leech, stomatogastric ganglion, and electric fish. The techniques include RNA
isolation, cDNA synthesis, quantitative real time PCR, bioinformatic approaches, brightfield &
fluorescent immunohistochemistry, stereology, and statistical analyses using R. Knowledge and
technical skills gained in this modules will be widely applicable to research in other model and non-
model organisms allowing students to ask questions on multiple levels of biological organization.

Neural Systems & Behavior 2014 Integrative Molecular Neuroethology Module
1
Chapter 1
Gene Identification
The NCBI Database ............................................................... 2
Blast: Finding Homologous Genes or Proteins ................ 3
Clustal Omega: Sequence Alignment ................................. 3
Exercise in Multiple Sequence Alignment ......................... 4

Neural Systems & Behavior 2014 Integrative Molecular Neuroethology Module
2
Astatotilapia
burtoni mc4r
cDNA sequence
The molecular dogma is that DNA is transcribed into RNA which is translated into protein. The
codon table describes which triplet nucleotides are translated in which amino acids. The coding
region of RNA begins with an AUG and
ends with a UAA, UAG, or GUA. RNA is
highly unstable, so molecular biologists
often use reverse transcription to make
complementary DNA (cDNA), which is
much more stable and thus easier to work
with than RNA. The National Center for
Biotechnology Information (NCBI) provides
free access to biomedical and genomic
information. (Ensemble, UCSD Genome
Browsers, and various species specific
resources provide genomic resources as
well.) Let's look at one particular gene.
The NCBI Database
The National Center for Biotechnology Information (NCBI) advances science
and health by providing access to biomedical and genomic information. One of
the most useful features is the nucleotide database, which you can search to find
published gene sequences. One example is:
Astatotilapia burtoni melanocortin receptor 4 (mc4r) cDNA sequence Accession
number : NM_001287403.1
Gene: 1-1648. Coding region: 127-1110
CGTTGTCCTCCAGATAATGAGGATGATCCAAAGCCACACACACTGAGACTTTAAAACGGACAACATAGCTGGACACTTAACA
ACGGAGAAATAACCCAAGGAGAAGGGAATTTAAAAGAAGCCATTATGAATGCCACAGAATACCATGGACTGATCCAAGGCT
ACCACAACAGAAGCCAAACCTCAGGCAATTTGCCATTTAACAAAGACTTATCAGGAGAGGAAAAAGACTCATCTTCTGGATG
TTATGAGCAGCTGCTTATTTCCACTGAGGTTTTCCTGACTCTGGGCATCATCAGTTTGCTGGAGAACATCCTGGTTGTTGCTGCT
ATAATCAAAAACAAGAACCTTCATTCACCTATGTACTTTTTCATCTGTAGCCTTGCAGTTGCTGACATGCTCGTCAGTGTCTCTA
ATGCCTCAGAGACTATTGTTATAGCACTCATCAATGGAGGCAGCCTGACCATTCCTGTCACACTGATTAAAAGCATGGACAAT
GTGTTTGACTCTATGATCTGTAGCTCTCTGTTGGCATCCATCTGCAGTTTGCTAGCAATCGCCATCGACCGCTATATCACCATCT
TCTATGCCCTGCGATACCACAACATTGTCACCCTGCGTCGTGCAATGCTGGTCATCAGCAGCATCTGGACGTGCTGCACCATTT
CCGGCATCTTGTTCATCATCTACTCGGAAAGCACCACTGTACTCATCTGCCTCATCACCATGTTCTTCACCATGCTGGTGCTCAT
GGCATCACTCTACGTCCACATGTTCCTGTTGGCTCGCCTGCACATGAAGCGGATCGCAGCCCTACCGGGCAACGCTCCCATCC
AGCAGCGTGCCAACATGAAGGGGGCCATCACCCTCACCATTCTCCTTGGGGTATTTGTGGTATGCTGGGCGCCCTTTTTCCTCC
ACCTCATCCTTATGATCAGCTGCCCCAGGAACCCCTACTGCACCTGCTTCATGTCCCATTTCAACATGTACCTCATCCTCATCAT
GTGCAACTCTGTCATTGACCCCATCATCTATGCTTTTCGCAGCCAAGAGATGAGAAAAACCTTCAAAGAGATTTTCTGCTGCTC
GCATGCTCTGCTGTATGTGTGAGCTGCCTGTAAAGGGTCCGCTGTGAACCCACAGCCTGCAATTTAAATCGAAACCTGGCCAA
CATGGACTCTGAGAGTATGATATCTCACATGTTGCCGGTAAATGATTTATTTGGGCACCCATCTTTGGTTTCAGGTTGCTGAAGA
GGTAGGTTTACAAACATCTTGTAATATAGCACATTGCTCTTCA

Neural Systems & Behavior 2014 Integrative Molecular Neuroethology Module
3
Clustal Omega
Blastn mc4r
BLAST: Finding Homologous Genes or Proteins by Sequence Alignment
The Basic Local Alignment Search Tool (BLAST) finds regions of local similarity between sequences.
The program compares nucleotide or protein sequences to sequence databases and calculates the
statistical significance of matches. BLAST can be used to infer functional and
evolutionary relationships between sequences as well as help identify members
of gene families. There are multiple ways to use the blast program.
Blastn: search nucleotide database with nucleotide sequence
Blastp: search protein database with protein sequence
Blastx: search protein database with nucleotide sequence
Scan the QR Code to Blast the A. burtoni mc4r sequences against the nucleotide
database (blastn) to identify mc4r genes in other species
Clustal Omega: Sequence Identification
Clustal Omega is a multiple sequence alignment program for proteins. It produces biologically
meaningful multiple sequence alignments of divergent sequences. Evolutionary relationships can be
seen by viewing cladograms or phylograms.
To create an alignment, paste the amino acid preceded in .fasta format (description preceded by an
“>” and followed by a hard return, underscores used to separate words).
>fish_mc4r
MNATEYHGLIQGYHNRSQTSGNLPFNKDLSGEEKDSSSGCYEQLLISTEVFLTLGIISLL
>rat_mc4r
MNSTHHHGMYTSLHLWNRSSHGLHGNASESLGKGHSDGGCYEQLFVSPEVFVTLGVISLL
>bird_mc4r
MNSTQPHGMHTSLHSWNRSGHGLPTNVSESPAKGYSDGGCYEQLFVSPEVFVTLGVISLL
>cow_mc4r
MNSTQPLGMHTSLHSWNRSAHGMPTNVSESLAKGYSDGGCYEQLFVSPEVFVTLGVISLL
Example: Clustal output
Fish_mc4r MNATEYHGLIQGYHNRSQTSGNLPFNKDLSGEEKDSSSGCYEQLLISTEVFLTLGIISLL
rat_mc4r MNSTHHHGMYTSLHLWNRSSHGLHGNASESLGKGHSDGGCYEQLFVSPEVFVTLGVISLL
bird_mc4r MNSTQPHGMHTSLHSWNRSGHGLPTNVSESPAKGYSDGGCYEQLFVSPEVFVTLGVISLL
cow_mc4r MNSTQPLGMHTSLHSWNRSAHGMPTNVSESLAKGYSDGGCYEQLFVSPEVFVTLGVISLL
**:*. *: . * .::. : * . * : *..******::* ***:***:****
* indicates positions which have an identical residues.
: indicates conservation between groups of strongly similar properties (i.e. all acidic residues)
. indicates conservation between groups of weakly similar properties (i.e. all polar, but some more
than others)

Neural Systems & Behavior 2014 Integrative Molecular Neuroethology Module
4
Exercise in Multiple Sequence Alignment:
For this exercise, students will learn how to search NCBI database for a sequence of interest and use
Clustal Omega to create a multiple alignment to identify highly similar regions.
1. Think of a gene you are interested in.
2. Search for that gene in the NCBI “nucleotide” or “protein” database using the full name or
abbreviation.
3. Click search to view the results.
4. Over on the left, click “TREE view” to view all the taxonomic groups who have a record for
that gene. Click on a group to narrow your results. OR, add “AND species name” in the
search bar.
5. Select five entries and copy the .fasta sequence in a text editor. (Note: it is very important to
keep track of the accession number for future analyses and publication.)
6. Paste your sequences into Clustal omega and view the output.
7. Identify conserved regions of your sequence.
8. Note: since fasta sequences being with the accession number and end with the species and
gene name, you may want to format the header (i.e. change
“>gi|565671712|ref|NM_001287403.1| Haplochromis burtoni melanocortin 4 receptor (mc4r),
mRNA” to “>Aburtoni_mc4r.”

Neural Systems & Behavior 2014 Integrative Molecular Neuroethology Module
5
Chapter 2
Tissue Processing
Recording sample collection information .......................... 6
Storage of single neurons and ganglia for qPCR .............. 7
Storage of electric fish brains for qPCR .............................. 7
Storage of electric fish brains for IHC ................................ 7
Storage of electric organs for qPCR .................................... 7
Storage of mouse slices for qPCR ....................................... 7
Storage of mouse tissue punches for qPCR ....................... 7
Sectioning ............................................................................... 8
Tissue punching ................................................................... 9

Neural Systems & Behavior 2014 Integrative Molecular Neuroethology Module
6
Recording Sample Collection Information
In this module, we will be working with biological samples collected during the previous cycles.
Essentially, this is collaborative research because you will likely be working with samples collected
by your peers rather than by yourself. Therefore, students in the previous cycles were instructed to
keep detailed notes regarding sample collection and storage.
Paper data sheets such as this one were used to record sample information and have now been
transferred to an electronic file on the server in Y:\NSB_2014\3_Int Mol Neuro\Sample Information.
Refer to these data sheets to identify the tissues to be processed.
Please use this sheet to record sample information. Handle tubes with gloves. Obtain tube from
4C fridge and keep tube on ice while working. Record sample information on the side of the tube
and on this sheet. Store sample in the appropriate location and record the location.
Tube # Description Collector(s) Date Location
Record the following information:
1. Using a sharpie, label the side of a collection tube with the following:
a. description of the neuron or ganglion
b. your name(s) or initials
c. today’s date
d. Transfer the isolated tissue to a tube.
2. In your notebook, record the following:
a. tube name
b. description of the sample
c. today’s date
3. On the data sheet on the freezer, record the following:
a. description of the tissue
b. your name(s) or initials(s)
c. today’s date

Neural Systems & Behavior 2014 Integrative Molecular Neuroethology Module
7
Storage of Single Neurons and Ganglia for qPCR
Single neurons and ganglia isolated for gene expression profiling have been stored in 200 μL 1-
Thioglycerol/Homogenization Solution from the Maxwell® 16 LEV simplyRNA Tissue Kit (Promega)
and stored in a -80C freezer. When ready to process, these tissues should be placed on ice for use.
Storage of Electric Fish Brains for qPCR
We will use a technique called “tissue punching” to micro-dissect specific brain regions of interest
from weekly electric fish. Brains dissected for this purpose were frozen in O.C.T. mounting medium
and stored at -80C. If these brains have been sectioned, they will be stored in slide boxes in the -80C.
Storage of Electric Fish Brains for Immunohistochemistry
Brains processed for immunohistochemistry were fixed, cryoprotected, embedded, and stored at
-80C. If these brains have been sectioned, they will be stored in slide boxes in the -80C. See Chapter
7 for details on sample processing.
Storage of Electric Fish Electric Organs for qPCR
Electric organs were dissected and placed in RNALater® (Life Technologies) solution and stored at
4C overnight than transferred to -20C for long-term storage.
Storage of Mouse Brain Slices for qPCR
The mouse brain was dissected and slices on a vibratome at 350 μM. Sagittal slices were placed in
RNALater® (Life Technologies) solution and stored at 4C overnight than transferred to -20C for
long-term storage.
Storage of Mouse Brain Slices for qPCR
The mouse brain was dissected and sliced on a vibratome at 350 μM. The sagittal slices were then
transferred to a cutting mat and placed under a dissecting scope. Brain regions of interest were
punched and placed in 200 μL 1-Thioglycerol/Homogenization Solution from the Maxwell® 16 LEV
simplyRNA Tissue Kit. The tissue was homogenized with a pestle and stored at -80°C.

Neural Systems & Behavior 2014 Integrative Molecular Neuroethology Module
8
Sectioning
Set-up
1. Make sure cryostat is on and cold (~ –20°C). Place tissue to be sectioned in
chamber to bring it to temperature (tissue stored at –80°C should be in the
chamber for at least 30 minutes prior to sectioning). Also place specimen
disk (chuck), brushes, forceps, slide cases, etc. in the chamber. If you are not
using a disposable blade, also put the microtome knife in place. Leave slides
at room temperature (at least until you have mounted and dried all of the
desired sections on them).
2. Mount your tissue. First, place the specimen disk on the platform inside the chamber and apply a
generous circle of O.C.T. compound (or other freezing mounting medium). Place tissue specimen
in medium and freeze completely. You may add additional mounting medium around tissue for
added security. Wait at least 15 minutes for O.C.T to completely freeze.
3. Using a pencil, clearly label your slides. It is useful to mark your starting location on the slide.
4. Once specimen is securely embedded in frozen medium, place the specimen disk in the specimen
head, orient your tissue as desired, and tighten the knob to secure. To adjust the plane of your
specimen, release the lever and use the knobs behind the head to make the needed adjustments.
Note: For your safety, keep the microtome knife guarded at all times while you are working in the
chamber!
Trimming
1. Begin by putting the specimen head in “home” position (all the way back). Use the stage forward
button to bring your specimen very close to the knife.
2. When you are ready to begin trimming your tissue, press the trim/section button or change
thickness to 60 um.
3. Use any of the motorized sectioning buttons and footswitch, or the manual hand wheel to trim
your tissue until you near the place where you will begin to collect tissue sections. As you are
trimming, you may need to make further adjustments to the plane of your tissue.
4. When you are near the place you will collect tissue sections, turn the trim function off by pressing
the trim function button once and/or change setting to your desired thickness.
5. Before collecting tissue sections, put the anti-roll plate in place and practice a few sections so that
you can make the proper adjustments for smooth tissue sections. If sections are curling, turn the
knob of the anti-roll plate clockwise. If sections are shredding, turn the knob counter-clockwise.
Usually, only minute adjustments to the anti-roll plate are necessary to make a difference in tissue
section quality.
Collecting Tissue Specimens
When you have made all of the necessary adjustments and are at the place where you wish to begin
collecting tissue sections: slice a section, carefully lift the anti-roll plate away, use a brush to position
your section, and carefully collect the section on a room temperature slide within the region that will
be covered by the coverslip. For immunohistochemistry, be sure to allow all sections to dry at room
temperature before storing your slides in the freezer. For tissue punching, proceed immediately.
Video: Using the
Cryostat

Neural Systems & Behavior 2014 Integrative Molecular Neuroethology Module
9
Tissue Punching
1. Rapidly dissect the brain.
2. Embed the brain.
a. Obtain a tube or cryomold of appropriate size for your tissue.
b. Fill tubes ¾ of the way with O.C.T. compound. Using the spinal cord to grip the brain,
place it into the O.C.T. compound. Straighten out as much as possible. Mark the dorsal
midline with a marker.
c. Place on dry ice until frozen then store upright in the -80˚C.
3. Prepare the cryostat
a. RNase Zap interior of cryostat, blade, punch tool, tweezers, and anything else that may
come in contact with the frozen tissue.
b. Acclimate the brains in the cryostat at -20°C for 30 min.
4. Remove brain from tube and mount on chuck with O.C.T. compound. Add an additional line
of O.C.T compound to the side of the frozen block of O.C.T, compound, so that the orientation
of the slices will be clear after cutting.
5. Slices will be cut at 300 µm. Since our cryostat only cuts up to 60 µm, do 4 partial turns then
cut on the 5th turn. A partial turn is done by turning the handle clockwise until the bottom of
the tissue is at the blade, then a counterclockwise turn to restart.
6. Arrange sections in order on the stage in the cryostat.
7. Chill the end of the punch tool on dry ice before using and between each section, which
prevents the tissue from thawing and sticking to the punch.
8. Press firmly with the punch tool over the desired brain region. Record punch tool size.
9. Very quickly deposit the punch in your buffer of choice for DNA or RNA isolation. Wipe the
punch tool with RNase Zap before collecting the next punch.
Neural Systems & Behavior 2014 Integrative Molecular Neuroethology Module
10
Chapter 3
RNA Isolation
Comparison of methods ..................................................... 11
Column-based RNA extraction ......................................... 12
Automated RNA extraction .............................................. 13

Neural Systems & Behavior 2014 Integrative Molecular Neuroethology Module
11
ReliaPrep™
RNA Tissue
Miniprep
System
Maxwell® 16
LEV
simplyRNA
Tissue Kit
Gene expression is the most fundamental level at which the genotype gives rise to the phenotype.
Obtaining high-quality RNA is the first, and often the most critical, step in performing many
molecular techniques such as reverse transcription followed by quantitative real-time PCR,
transcriptome analysis using next-generation sequencing, and microarray analysis. To generate the
most sensitive and biologically relevant results, the RNA isolation procedure must include some
important steps before, during, and after the actual RNA purification. RNA is less stable than DNA
and proteins and is subject RNA-ases, enzymes that degrade RNA. For short-term storage, RNase-
free H2O (with 0.1 mM EDTA) or TE buffer (10 mM Tris, 1mM EDTA) may be used. RNA is generally
stable at -80°C for up to a year without degradation. With good technique, RNA is not difficult to
work with. Surfaces tools, tubes and equipment must be kept RNase free, reagents kept on ice, clean
gloves warn at all times and barrier filter tips are often used for extra precaution.
COMPARISON OF METHODS
COLUMN-BASED RNA EXTRACTION
The ReliaPrep™ RNA Tissue Miniprep System (Promega) provides a fast and
simple technique for preparing purified and intact total RNA from animal tissue in
as little as 30 minutes. The system incorporates a DNase treatment step to reduce
genomic DNA contamination. Column based approaches such as the ReliaPrep™
RNA Tissue Miniprep Systems are affordable and require only a centrifuge for use.
For the complete ReliaPrep™ RNA Tissue Miniprep System protocol, scan the QR
code to the right. On the following pages you will find an abbreviated version of
the protocol that you can print and paste in your notebook each time you do an
isolation.
AUTOMATED RNA EXTRACTION
The Maxwell® 16 System (Promega) allows rapid isolation of RNA with very few
pipetting steps, but this requires investment in the instrument. The Maxwell® 16
LEV simplyRNA Tissue Kit is a medium throughput automated technique for
RNA extraction. For the complete Maxwell® 16 Tissue LEV Total RNA Purification
Kit protocol, scan the QR code to the right. You will find an abbreviated version in
the following pages.
TRIZOL
TRIzol is a chemical solution used in RNA/DNA/protein extraction (hence the “tri” in the name). This
method uses a guanidinium thiocyanate-phenol-chloroform extraction, and is similar to the method
of DNA extraction taught in most introductory biology labs.
In this module, you will perform exercises with the column based approach, but you will use the
Maxwell® 16 system for your independent projects.

Neural Systems & Behavior 2014 Integrative Molecular Neuroethology Module
12
ReliaPrepTM RNA Tissue Miniprep System
1. Determine the number of samples to be processed. N=_________
2. Place sample in RNALater® on ice
3. Thaw DNase I on ice.
4. Obtain the following: two 1.5 mL tube, one minicolumn, two collection tubes, one elution
tube, and one 0.5 μL Axygen tube.
5. Label the top and side of each tube with sample name (or code for each sample). Additionally,
label the elution tube with today’s date and your initials
6. Prepare DNase I Incubation Mix by combining the following in the order listed.
DO NOT VORTEX. Mix by gently pipetting up and down 3-4 times.
7. Verify that 1-Thioglycerol has been added to the
LBA Buffer (stored at 4C)
8. Add 250 μL LBA with 1-Thioglyercol to a 1.5 tube
(one tube per sample)
9. Using forceps, transfer a mouse hippocampal
slice to tube with buffer.
10. Homogenize with a pestle. Then pipette up and down 7-10 times with P200 to shear DNA.
11. Centrifuge 3 minutes at 14,000g. Then transfer the supernatant to a new 1.5 mL tube.
12. Add 85 μL100% Isopropanol to each sample. Vortex 5 seconds.
13. Transfer sample to a minicolumn in a collection tube. Centrifuge at 12-14,000g for 1 min. Discard
the liquid in the collection tube by first removing the minicolumn. Replace minicolumn.
14. Add 500 μL RNA Wash Solution to the minicolumn. Centrifuge at 12-14,000g for 1 min. Discard
the liquid in the collection tube by first removing the minicolumn. Replace column.
15. Apply 30 μL DNase 1 Incubation Mix directly to minicolumn. Incubate 15 min at room temp.
16. Add 200 μL Column Wash Solution to minicolumn. Centrifuge at 12-14,000g for 15 sec.
17. Add 500 μL RNA Wash Solution to column. Centrifuge at 12-14,000g for 30 sec. Discard the
liquid in the collection tube by first removing the minicolumn.
18. Transfer minicolumn to a new collection tube. Add 300 μL RNA Wash Solution to minicolumn.
Centrifuge at 14,000g for 2 min.
19. Transfer minicolumn to an elution tube. Add 15 μL Nuclease Free Water. Place the tube in the
centrifuge with the elution tube cap facing to the outside. Centrifuge at 12-14,000g for 1 min.
20. Discard Minicolumn tube.
21. Transfer 2 μL RNA to an Axygen tube for quantitation with the Quantus Fluorometer.
22. Store RNA at -80C.
DNase 1 Incubation Mix
Solution Vol (μL) Vol * N
Yellow Core Buffer 24
MnCl2, 0.09M 3
DNase 1 3

Neural Systems & Behavior 2014 Integrative Molecular Neuroethology Module
13
Maxwell® 16 LEV simplyRNA Tissue Kit Protocol
Setup
1. Remove samples from -80°C. Thaw tissue lysate in 200μLof 1-Thioglycerol/Homogenization
Solution on ice to avoid RNA degradation.
2. Thaw blue DNase I solution on ice. Do not vortex. Gently mix once thawed.
3. To maintain an RNase-free environment during processing, change gloves before handling
cartridges, LEV Plungers and Elution Tubes.
4. Label 0.5 mL Elution Tubes from the kit with sample names and date.
5. Place labeled 0.5ml Elution Tubes in the front of the Maxwell® 16 LEV Cartridge Rack. Leave
the cap open. Turn the cap out or in, but not sideways.
6. Add 30-50 μL of Nuclease-Free Water to the bottom of each Elution Tube. Record volume____
7. LEV cartridges in the Maxwell® 16 LEV Cartridge Rack with the label side facing away from
the Elution Tubes. Press down on the cartridge to snap into position.
8. Carefully peel back the seal on the cartridge.
9. Add 5µL of blue DNase I to well 4 (yellow reagent). Well 4 appears green after addition.
10. Place the LEV plunger in well #8 of the cartridge (the well closest to the Elution Tube).
11. Add 200µL of Lysis Buffer to each sample.
12. Vortex vigorously for 15 sec then place on ice.
13. Pipette the 400 μL of lysates into well #1 of the cartridge.
Instrument run
1. Select “Run” on the Menu screen
2. Press the Run/Stop button to select the “Simply RNA” method and select okay.
3. Open the door when prompted. Press the Run/Stop button to extend the platform.
4. Load the Cartridge Rack with the Elution Tubes closest to the door.
5. Press the Run/Stop button. The platform will retract. Close the door.
6. The Maxwell® 16 Instrument will immediately begin the purification run. The screen will
display the steps performed and the approximate time remaining in the run.
7. Wait 58 min.
8. Follow the on-screen instructions at the end of the method to open door. Verify that the
plungers are located in well #8 of the cartridge at the end of the run. If the plungers are not
removed from the magnetic plunger bar, push them down by hand to remove them.
9. Press the Run/Stop button to extend the platform out of the instrument
10. Remove the Cartridge Rack from the instrument.
11. Remove Elution Tubes containing total RNA, and close the tubes. Place on ice.
12. If paramagnetic particles are present in the elution tubes, centrifuge at 10,000 × g for 2 minutes.
13. Proceed immediately to reverse transcription or store RNA at -80°C.

Neural Systems & Behavior 2014 Integrative Molecular Neuroethology Module
14
Chapter 4
Nucleic Acid Quantification
Methods for Quantification ............................................... 15
Quantus™ Fluorometer Protocol ...................................... 15
RNA Quantification Exercise ............................................ 16
RNA Degradation Exercise ................................................ 16

Neural Systems & Behavior 2014 Integrative Molecular Neuroethology Module
15
Video: Quantus™
Fluorometer
Sample
Quantification
Methods for Nucleic Acid Quantification
DNA and RNA quantification is an important and necessary step prior to most downstream analysis
methods. The traditional method for assessing RNA concentration and purity is UV spectroscopy.
The absorbance of a diluted RNA sample is measured at 260 and 280 nm. Certain fluorescent dyes
exhibit a large fluorescence enhancement when bound to either dsDNA, ssDNA, or RNA. To
accurately quantitate DNA or RNA, unknowns are plotted against a standard curve produced with a
sample of known concentration. The Agilent® 2100 Bioanalyzer™ instrument uses a combination of
microfluidics, capillary electrophoresis, and fluorescent dye that binds to nucleic acid to evaluate
both RNA concentration and integrity.
In this course, we will use the Quantus™ Fluorometer (Promega) with dsDNA-, ssDNA-, and RNA-
specific fluorescent dyes to quantify nucleic acids.
Quantus™ Fluorometer Protocol
Watch the Quantus™ Fluorometer Sample Quantification video for detailed instructions on how to
operate the instrument. The instrument has already been calibrated, so you do not need to prepare
the standard for use when measuring your samples.
PROTOCOL
1. Thaw QuantiFluor® dye at room temperature, protected from light.
2. Calculating the volume of working dye solution needed
# samples _______ x 110 μL = ___________
3. Dilute the QuantiFluor® dye 1:1000 (i.e 2 μL dye + 1998 μL 1X TE
buffer)
4. Add 1 μL of sample from each well (1-8) to a 0.5 mL Axygen tube.
5. Add 99 μL 1X TE buffer to each sample.
6. Add 100 μL dye working solution to each tube. Vortex. Wait 5 min.
7. Quantify each sample using the Quantus™ Fluorometer.

Neural Systems & Behavior 2014 Integrative Molecular Neuroethology Module
16
RNA Quantification Exercise
In this exercise, students will practice serial dilutions RNA quantification.
1. Place RNA sample provided by your TA on ice.
2. In your notebook, record information about this sample.
3. Add 25 μL water two all 8 wells of a PCR strip.
4. Add 25 μL RNA sample to well 1. Vortex.
5. Take 25 μL from well 1 and add to well 2. Vortex.
6. Repeat step 4 for wells 2-7.
7. Optional: Discard 25 μL from well 7 to give an equal volume in all tubes.
8. Well 8 is you blank (0 μg RNA).
9. Use the protocol on the previous page to quantify the RNA concentration in each sample.
10. Save the data in Y:\NSB_2014\3_Int Mol Neuro\Quantus Data. Name the file “Quantus Data.
“Date”.” Initials”. “short description”
11. Calculate the standard deviation from the expected and actual RNA concentration.
RNA Degradation Exercise
This exercise will allow you to see firsthand how quickly RNA can degrade at room temperature.
1. Place one tube of RNA on ice and another on your bench top.
2. Wait 1 hour (i.e. go have lunch or dinner)
3. Upon returning, thaw a 3rd sample on ice.
4. Run RNA sample on a gel to examine the size of RNA fragments in all three samples sample.
Quantify the samples using the QuantusTM Fluorometer.
Schematic for Preparing a 2-fold Serial Dilution.

Neural Systems & Behavior 2014 Integrative Molecular Neuroethology Module
17
Chapter 5
Reverse Transcription
Overview .............................................................................. 18
GoTaq® 2-Step RT qPCR System Protocol ...................... 19

Neural Systems & Behavior 2014 Integrative Molecular Neuroethology Module
18
Video:
GoScript™
Reverse
Transcription
(RT) System
GoScript™ RT
System Protocol
Overview
Transcription is the process of creating RNA from a DNA template, but reverse transcription (also
known as cDNA synthesis) is to the process of creating single stranded DNA from a RNA template.
Reverse transcription reactions require a reverse transcriptase enzyme, primers,
buffers. Inclusion of a ribonuclease inhibitor in this reaction helps to protect the
RNA template from degradation.
The primers most often used are:
oligo(dT), which binds to the polyA tail of mRNA
random hexamers, which bind randomly through the transcriptome
gene specific primers, which are complementary to specific genes
In this course, we will use the Promega GoScript™ Reverse Transcription
System (Promega). The GoScript™ Reverse Transcription System is a convenient
kit that includes a reverse transcriptase and an optimized set of reagents for
efficient synthesis of first-strand cDNA optimized in preparation for PCR
amplification. This can be used to reverse transcribe RNA templates starting with
either total RNA or poly(A)+ mRNA.
To watch a video of how to conduct reverse transcription with GoScript™, click
on the QR code to the right. The full protocol can be access with the QR code, but
an abbreviated version is included on the following page.
Controls: Always include a negative control of “no RT” from your cDNA synthesis reaction for each
primer set to control for genomic DNA or other sources of contamination.
Note: Reverse transcription followed by quantitative PCR (RT-qPCR) can be performed in one or two
steps. In this course, we will only use the 2 step approach, which allows for a more flexible workflow.
In two-step RT-qPCR using GoTaq® qPCR Master Mix (Promega), cDNA samples generated with the
GoScript™ Reverse Transcription System can be added directly to the qPCR reaction, up to 20% v/v.
Depending on the concentration of your cDNA, you may want to dilute you template before running
qPCR.
DNA
RNA
Protein
Reverse
transcription
Transcription
Translation

Neural Systems & Behavior 2014 Integrative Molecular Neuroethology Module
19
GoTaq® 2-Step RT qPCR System
1. Thaw buffers, salts, and nucleotide primers and mixes (but NOT the RNasin® or GoScript™) from
the GoTaq® 2-Step RT qPCR System at room temperature. Vortex and centrifuge. Confirm that
no salt precipitates are present.
2. Calculate the number of RNA samples to be reverse transcribed. N = ______
3. Obtain samples from the -80C and place on ice.
4. Obtain enough PCR tubes for N+1 rxns = _______. Label side with sample name/number
5. Prepare Primer Master mix, with 10% extra (x1.1).
6. Pipette 2 μL Primer Master into each PCR tube.
7. Add 9.5 μL RNA sample to PCR tube. (Or, add
volume containing 2 μg RNA then add water to bring
volume added to 8 uL).
8. Add 8 μL RNA (can be a pool of RNA or from a single sample) to PCR tube for the noRT control
sample
9. Vortex and centrifuge briefly. Place RNA back on ice.
10. Denature the RNA at 70°C for 5 minutes then chill at 4°C for 5 minutes using the thermal cycler
program “Denature”. Place RNA back on ice.
11. NOTE: Do NOT vortex enzymes or they
can become inactivated. Mix by
inverting the tube 3 times to mix and
centrifuge briefly before use. Place on
ice. Place Eppendorf tubes needed for
making master mixes on ice before
adding components.
12. Prepare the GoScript™ Reaction Mix on
ice for the samples (with 10 % excess)
and a No-RT rxn. On ice, add all
reagents in the order listed. Mix by
inversion. Centrifuge briefly.
13. Add 8.5 μL of GoScript Reaction Mix to each RNA sample.
14. Add 8.5 μL NoRT to NoRT PCR tube.
15. Synthesize cDNA with GoScript™ Reverse Transcriptase using the thermal cycler program
“synthesis” which is programed for the following: 25°C for 5 min, 42°C for 60 min, 70°C for 15
min, and 4°C for infinity.
16. Label a 0.5 or 1.5 mL tube with the sample name/number AND the date for storing the sample.
17. When the thermal cycling is complete, place samples on ice.
18. Proceed immediately to qPCR or store samples at -20°C.
Primer Master μL per
rxn
(N+1) x 1.1
Oligo(dT)15
primer
1
random primers 1
GoScript™ Reaction Mix 1 rxn
(μL)
N x 1.1 NoRT
Nuclease-Free Water
0 1.0
GoScript™ 5X Reaction
Buffer
4 4
MgCl2 2 2
PCR Nucleotide Mix, 10mM 1 1
RNasin® Ribonuclease
Inhibitor
0.5 0.5
GoScriptTM Reverse
Transcriptase
1 0

Neural Systems & Behavior 2014 Integrative Molecular Neuroethology Module
20
Chapter 6
Quantitative PCR (qPCR)
Overview .............................................................................. 20
Making a primer dilutions ................................................. 21
Primer design ...................................................................... 22
Making a standard curve ................................................... 23
Plate Layouts ....................................................................... 23
Dye based detection ............................................................ 24
Probe based detection ......................................................... 25
Data analysis ........................................................................ 26

Neural Systems & Behavior 2014 Integrative Molecular Neuroethology Module
21
GoTaq®
qPCR Master
Mix
GoTaq®
Probe qPCR
Master Mix
Overview
Quantitative PCR (qPCR) is a technique used to amplify and quantify specific DNA molecules. In
order to amplify small amounts of DNA, one needs a gene-specific primer pair,
deoxyribonucleotides, a suitable buffer solution, and a thermo-stable DNA polymerase, and
fluorophores. Amplified DNA fragments are detected using either dye-based approaches (such as
SYBR green) or probe-based approaches (such as TaqMan).
COMPARISON OF DETECTION METHODS
Dye-based Detection
SYBR green, a commonly used fluorescent dye, binds to dsDNA. dsDNA quantification is monitored
by measuring an increase in fluorescence throughout the cycle. Since SYBR binds all dsDNA in the
sample, it is important to analyze the melting curve to check for the presence of multiple products
(including primer dimers and non-specific amplification).
Probe-based Detection
Probe-based approaches use forward and reverse primers, as well as a probe. TaqMan probes
(hydrolysis probes) have a fluor on one end of the probe, and a quencher molecule on the other end
of the probe. When the probe is intact, the fluor is quenched due to its close proximity to the
quencher molecule, but during strand replication, the bound probe is displaced and degraded; once
the probe is degraded, the quencher and fluor are no longer tied together in close proximity, so the
fluor is no longer quenched. Thus, more amplification gives rise to less quenching and a stronger
fluorescent signal. With this approach, a melting curve is not possible.
GoTaq® qPCR Master Mix and GoTaq® Probe qPCR Master Mix (Promega) are
provided as a simple-to-use, stabilized 2X master mixes that include all
components for quantitative PCR except sample DNA, primers and water. qPCR
experiments are typically run in 384 or 96 well plates. We will use 96 well plates.
Important Controls
Always include a negative control, “no DNA template” for each primer set on each
plate to control for non-specific binding. Always include a negative control of “no
RT” from your cDNA synthesis reaction for each primer set to control for genomic
DNA or other sources of contamination.
Quantification Instruments
At MBL, Applied Biosystems has generously loaned two StepOnePlusTM Real Time
PCR instruments, which are located on the 3rd floor in Loeb 326. Please refer to the
manuals in the lab for instructions on operation the instrument and the software.
Life Technologies “Real-time PCR handbook” describes qPCR experimental design
and troubleshooting, including optimization of reaction conditions, consistency in
technique, and tips for avoiding contamination. Copies of this are available in the lab.

Neural Systems & Behavior 2014 Integrative Molecular Neuroethology Module
22
Primer Design for qPCR
Note: these guidelines were used when designing primers used in this course
1. Identify exon-exon boundaries using BLAT
2. Go to an online primer design website such as Primer3, Primer3Plus, or IDT PrimerQuest
3. Paste nucleotide sequence where indicated
4. Mark the exon-exon boundary so that primer pairs will span this junction
5. Provide a name indicating species
6. Select the output to give a forward and reverse primer
7. Select the following primer specifications
a. GC content of primers: 50-60%
b. Select a melting temperature: 60 – 63 (with no more than 1C difference).
c. Select min primer length 18, max length 24, optimal length 20
d. pair separated by an exon-exon boundary (reduces, or at least detects genomic
background)
e. amplicon should be about 100 bp, usually 60-150 bp
f. min length: 18, max length 24 (best: 20 nt) (not different by more than 3 bp)
g. max 3' self-complementary: 1 bp
h. max poly-x: 3
8. Once you have the output, select pairs that are:
a. towards 3' end of gene (often more specific) or in UTR
9. Paste the output primer sequences with all the relevant info (Tm, length, etc.) for all the primer
pairs listed into an excel spreadsheet.
10. Save on the NS&B shared folder, adding your initials to the file name.
Making primers solutions for dye-based PCR:
Synthesized primers are delivered as lyophilized powders. To use these primers, one first must make
a stock primer solution (100 μM) that can be stored in freezer (in a separate box away from sources of
genomic DNA or cDNA contamination) for many years. Two use primers in PCR, however, one must
make working primer solutions (10 μM).
1. Record the manufacturer’s primer information in your notebook (e.g. Tm, sequence).
2. Spin down primer stocks.
3. To create a stock solution of the primer (100 μM), multiple # of nmols of primer by 10. Add
that volume of water or 1X TE buffer. Vortex and spin.
4. Label the top of each stock primer solution with a shorthand name and the concentration.
5. Obtain a clean 1.5 mL tube to make a working 10 μM primer solution. Label with name and
conc. (10 μM)
6. Add 225 μL water to each 1.5 mL tube.
7. Transfer 25 μL of 100 μM stock primer solution to labeled tube with water.
8. Store stock primer solution at -20°C and working primer solution at 4°C.

Neural Systems & Behavior 2014 Integrative Molecular Neuroethology Module
23
Making A Standard Curve
Creating a standard curve is necessary for calculating the concentration of each sample without
respect to a control sample. This will also tell us important information about the efficiency (a topic
we will cover during data analysis) of our qPCR reactions, an important piece of information needed
for accurate DNA quantification.
1. Synthesize a large amount of cDNA from tissue representative of your samples.
2. Pool your cDNA. This is your 1:1 dilution, or your most concentrated standard
3. Calculate the number of genes you will be measuring. Multiply the number by three to
determine the minimum volume of each standard you need (since each is run in triplicate).
Since you will need to test your standard curve and maybe rerun some samples, multiply that
number by three to estimate the volume needed.
4. Create a 10 point two-fold dilution series of cDNA from your species. (Refer to page 16 for an
example of making 1:2 dilution series).
5. Test the efficiency of your standard curve by running a qPCR experiment in the “Standard
Curve” method.
Store your samples at 4C for short term use. Note: Storage of diluted samples long-term is
not recommended. Nucleic acids can adsorb to the sides of the tubes they’re being stored in,
which can have a profound impact on the concentration of the very dilute sample. If you’re
going to store serially-diluted samples, using low-adsorption tubes is highly recommended.
qPCR Plate Layouts
Use the StepOnePlusTM software to design your plate layout. Below is an example plate layout for
quantifying gene expression of one gene in twenty samples with ten standards, including both a
NoRT and no template (H20) controls. Note that all reactions are run in triplicate.
If you make an pipetting errors, record those in your notebook and make the change in your save
experimental setup before staring the run.
1 2 3 4 5 6 7 8 9 10 11 12
A 1 2 3 4
B 5 6 7 8
C 9 10 11 12
D 13 14 15 16
E 17 18 19 20
F NoRT Std 1 Std 2 Std 3
G Std 4 Std 5 Std 6 Std 7
H Std 8 Std 9 Std 10 H20

Neural Systems & Behavior 2014 Integrative Molecular Neuroethology Module
24
Video: qPCR
experiment setup
Protocol: Dye-Based Quantitative Real-time PCR (qPCR)
1. Determine number of samples (including negative controls) N=_____
2. Design plate layout to include a standard curve, NoRT and NO template control all run in
triplicate.
3. Thaw the GoTaq® qPCR Master Mix on ice. Vortex and spin. Place on ice.
4. Thaw CXR at room temperature. Vortex, spin, and place on ice.
5. Calculate the volume of each master mix ingredient needed by multiplying the volume listed in
the table by N and 1.1 (to give 10% extra)
6. Prepare enough qPCR Reaction Mix for each gene on ice. Vortex briefly and spin.
7. Obtain a 96 well optically clear plate designed for qPCR
8. Using a multichannel pipette, add 7 μL PCR Reaction Mix to the appropriate wells.
9. Obtain your cDNA for the 4C, vortex, spin, and place on ice.
10. Using a single channel pipette, add 3 μL cDNA sample or control to the appropriate wells.
11. Seal the plate with optically clear adhesive film. Spin at 1000 rpm for 1 min.
12. Execute the “fast” thermal cycling reaction in the Applied Biosystems StepOnePlus instrument.
1x 95°C 2 min (denature)
37x 95°C 3 sec (denature)
60°C 30 sec (anneal and extend)
1x 60-95°C dissociation
qPCR Reaction Mix 1 rxn ( uL) x N x 1.1 (uL)
2X GoTaq® qPCR Master Mix 5
Nuclease-Free Water 1.3
CXR Reference Dye 0.1
Forward primer, 10μM 0.3
Reverse primer, 10μM 0.3

Neural Systems & Behavior 2014 Integrative Molecular Neuroethology Module
25
Protocol: Probe-Based Quantitative Real-time PCR (qPCR)
1. Determine number of samples (including negative controls) N=_____
2. Design plate layout to include a standard curve, NoRT and NO template control all run in
triplicate.
3. Thaw the GoTaq® Probe qPCR Master Mix on ice. Vortex and spin. Place on ice.
4. CXR Note: Check the top of the GoTaq® Probe qPCR Master Mix tube for a black dot, which
indicates that 17μLCXR Reference Dye has been added. If there is no dot, thaw CXR at room
temperature and add 17μLCXR to the 1mL tube of GoTaq® Probe qPCR Master Mix. Vortex, spin,
and mark the tube with a dot to indicate that CXR was added
5. Calculate the volume of each master mix ingredient needed by multiplying the volume listed in
the table by N and 1.1 (to give 10% extra)
Probe Reaction Mix 1 rxn (uL) x N x 1.1 Final Conc.
2x GoTaq Probe qPCR
master mix
5.0 1x
Water 1.5
20X TaqMan Assay 0.5 900nM/900nM/250nM
6. Prepare enough Probe Reaction Mix for each gene. Vortex briefly and spin.
7. Obtain a 96 well optically clear plate designed for qPCR
8. Using a multichannel pipette, add 7 μL Probe Reaction Mix to the appropriate wells.
9. Obtain your cDNA for the 4C, vortex, spin, and place on ice.
10. Using a single channel pipette, add 3 μL cDNA sample or control to the appropriate wells.
11. Seal the plate with optically clear adhesive film. Spin at 1000 rpm for 1 min.
12. Execute the “fast” thermal cycling reaction in the Applied Biosystems StepOnePlus instrument.
1x 95°C 2 min (denature)
37x 95°C 3 sec (denature)
60°C 30 sec (anneal and extend)

Neural Systems & Behavior 2014 Integrative Molecular Neuroethology Module
26
Data Analysis
After running a qPCR experiment, you must determine the concentration of your candidate genes in
each sample. One of the most popular methods is the Delta Delta Ct method, which involves
normalization to a reference or control gene and a reference sample. Two methods that do not
require normalization to a control gene are the normalization by RNA or cDNA quantity and
MCMC.qpcr. We will briefly describe those here, but we will use the latter two in this course.
DELTA DELTA CT METHOD
This method involves comparing the Ct values of the samples of interest with a control sample. The
Ct values of both the control and the samples of interest are normalized to an appropriate
endogenous housekeeping gene. The name comes from the math:
[delta][delta]Ct = [delta]Ctsample - [delta]Ctreference
Here, “[delta] Ctsample” is the Ct value for any sample normalized to the endogenous housekeeping
gene and “[delta] Ctreference” is the Ct value for the control also normalized to the endogenous
housekeeping gene. For the [delta][delta]Ct calculation to be valid, the amplification efficiencies of
the target and the endogenous reference must be approximately equal. If a housekeeping gene cannot
be found whose primer amplification efficiency is similar to the target, other methods are preferred.
NORMALIZATION BY RNA OR cDNA INPUT QUANTITY The use of control genes is not always recommended. In those cases, the user can quantify the cDNA
input and either use the same concentration of cDNA for every reaction or the user can divide the
relative concentration of the sample (calculated from a standard curve) by the sample concentration.
MCMC.qPCR
MCMC.qPCR is an R package for analyzing raw qPCR data (represented as
molecule counts) using generalized linear mixed models under Poisson-
lognormal error. This method can incorporate prior knowledge about the
expected degree of control gene stability can be directly incorporated into the
model, but the model can also be run in the absence of control genes. Scan the
QR code to the right to read the 2013 PLOS ONE manuscript “No Control Genes
Required: Bayesian Analysis of qRT-PCR Data” by Matz, Wright, and Scott.
In order to use this method, we will first teach you the basics of R, the free software environment for
statistical computing and graphics. One of R's strengths is the ease with which well-designed
publication-quality plots can be produced, including mathematical symbols and formulae where
needed. R is highly extensible through the use of user-submitted packages for specific functions or
specific areas of study.
MV Matz et al.
2013 PLOS ONE
Neural Systems & Behavior 2014 Integrative Molecular Neuroethology Module
27
Chapter 7
Immunohistochemistry
Tissue processing ................................................................ 28
Antibodies ............................................................................ 29
Immunohistochemistry Solutions ..................................... 30
Brightfield ........................................................................... 31
Fluorescent .......................................................................... 32
Microscopy ........................................................................... 33
Stereology ............................................................................. 34
For sectioning protocol, see Chapter 2, page 8

Neural Systems & Behavior 2014 Integrative Molecular Neuroethology Module
28
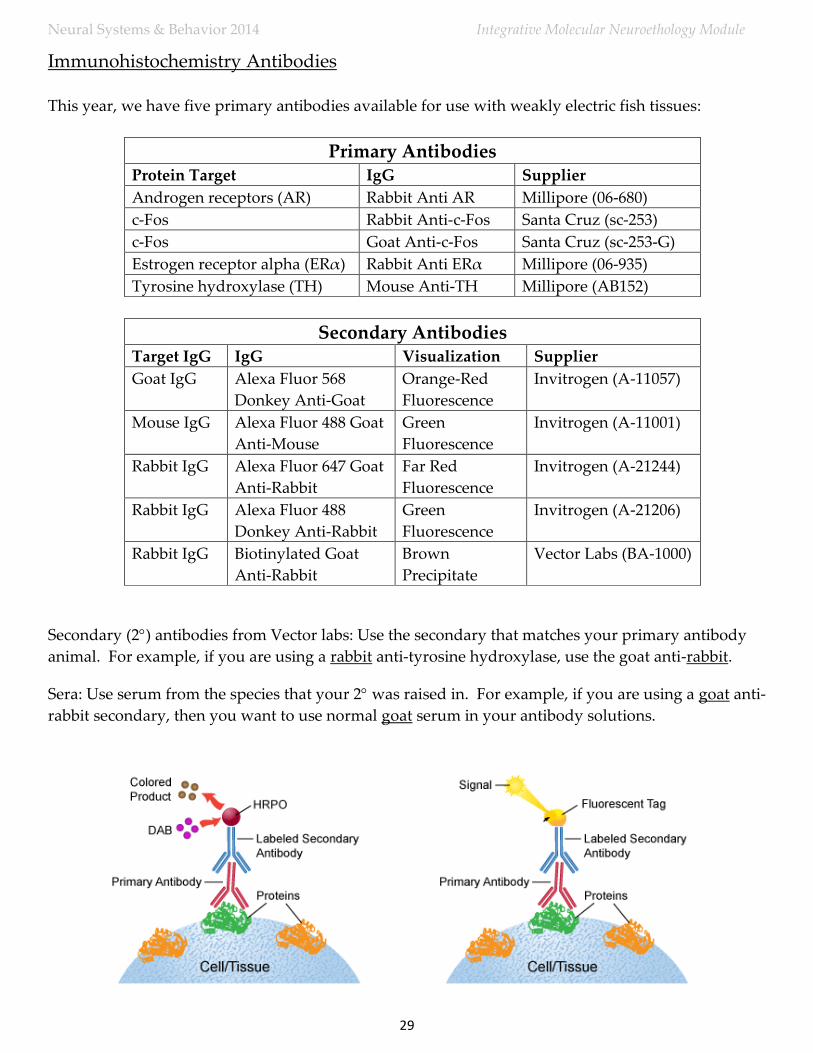
Immunohistochemistry is a technique used to detect proteins in cells of a tissue using primary (1)
antibodies specific to proteins of interest and secondary (2) antibodies specific to the primary
antibody. Visualizing an antibody-protein interaction can be accomplished in a number of ways. One
of the most common techniques for visualization is the use of an antibody that is conjugated to an
enzyme, such as peroxidase, that can catalyze a color-producing reaction that can be visualized with
a light microscope. Alternatively, the 2antibody can also be tagged to a fluorophore that can be
visualized with a fluorescent microscope.
Tissue Processing
Overview
When performing an immunohistochemistry experiment, the tissue must be fixed most commonly
with 4% paraformaldehyde (PFA) to maintain cell morphology and tissue architecture. Next, the
tissue is cryoprotected in a sucrose solution to protect it from freezing damage. The tissue can then be
embedded in a mounting medium (O.C.T) and sectioned. Sections can be made on a variety of
instruments, most commonly a microtome or cryostat, and are sliced at a range of 4-40 μm.
Protocol
1. Obtain cold, fresh 4% paraformaldehyde (PFA) from the fridge.
2. Dissect tissue.
3. Fix. Place whole brain in cold 4% paraformaldehyde and store at 4C overnight (~16-24 hours
post-harvest).
4. Cryoprotect.
a. Carefully pour out PFA into hazardous waste container.
b. Add cold 1X PBS (fill vial half way) to the vial with the brain and wait 5 min.
c. Carefully pour off 1X PBS and repeat step b two more times (for a total of 3 washes).
d. Pour in cold 30% sucrose solution.
e. Store at 4C overnight (or until tissue no longer floats).
5. Embed.
a. Obtain a tube or cryomold of appropriate size for your tissue.
b. Fill tubes ¾ of the way with O.C.T. compound. Using the spinal cord to grip the brain,
place it into the O.C.T. compound. Straighten out as much as possible. Mark the dorsal
midline with a marker.
c. Place on dry ice until frozen then store upright in the -80˚C.
6. Section the brain according to the protocol in Chapter 2 on page 8.
Neural Systems & Behavior 2014 Integrative Molecular Neuroethology Module
29
Immunohistochemistry Antibodies
This year, we have five primary antibodies available for use with weakly electric fish tissues:
Primary Antibodies Protein Target IgG Supplier
Androgen receptors (AR) Rabbit Anti AR Millipore (06-680)
c-Fos Rabbit Anti-c-Fos Santa Cruz (sc-253)
c-Fos Goat Anti-c-Fos Santa Cruz (sc-253-G)
Estrogen receptor alpha (ERα) Rabbit Anti ERα Millipore (06-935)
Tyrosine hydroxylase (TH) Mouse Anti-TH Millipore (AB152)
Secondary Antibodies Target IgG IgG Visualization Supplier
Goat IgG Alexa Fluor 568
Donkey Anti-Goat
Orange-Red
Fluorescence
Invitrogen (A-11057)
Mouse IgG Alexa Fluor 488 Goat
Anti-Mouse
Green
Fluorescence
Invitrogen (A-11001)
Rabbit IgG Alexa Fluor 647 Goat
Anti-Rabbit
Far Red
Fluorescence
Invitrogen (A-21244)
Rabbit IgG Alexa Fluor 488
Donkey Anti-Rabbit
Green
Fluorescence
Invitrogen (A-21206)
Rabbit IgG Biotinylated Goat
Anti-Rabbit
Brown
Precipitate
Vector Labs (BA-1000)
Secondary (2) antibodies from Vector labs: Use the secondary that matches your primary antibody
animal. For example, if you are using a rabbit anti-tyrosine hydroxylase, use the goat anti-rabbit.
Sera: Use serum from the species that your 2 was raised in. For example, if you are using a goat anti-
rabbit secondary, then you want to use normal goat serum in your antibody solutions.

Neural Systems & Behavior 2014 Integrative Molecular Neuroethology Module
30
Immunohistochemistry Solutions
Label all solutions with name, date, and your initials.
1. 10X Phosphate Buffered Saline PBS. Prep time ~5 min.
a. Dissolve 1 tablet in 200 mL Ultrapure water.
b. Store at room temperature
2. 1X PBS. Prep time ~5 min.
a. In small bottles, add 50mL 10X PBS and 450 ml Ultrapure water.
b. Store at 4˚C.
3. 2X PBS. Prep time ~5 min.
a. In small bottles, add 100mL 10X PBS and 400 ml Ultrapure water.
b. Store at room temperature
4. Paraformaldehyde (PFA). Prep time ~2 hours
a. In a small flask, add 20mL Ultrapure water, 5μL10N NaOH, and 1.6 grams PFA
b. Cover the mouth with Parafilm, then heat and stir at 60˚C for 1 hour (or until PFA is
completely dissolved).
c. Cool the solution to room temperature
d. Add 20mL of 2X PBS
e. Adjust pH to 7.2-7.4. Label vial flask with pH and today’s date
f. Store at 4˚C for up to 24 hours. Unused PFA can be stored at -20°C.
5. 30% sucrose. Prep time ~5 min.
a. In a flask, add 30g sucrose to 100 mL 1X PBS
b. Stir until dissolved.
c. Filter via vacuum filtration.
d. Store at 4˚C
6. Citric Acid. Prep time ~5 min.
a. 1.92g citric acid (anhydrous)
b. 950mL nanopure water
c. Adjust pH to 6.0 with 2.6mL 10N NaOH.
d. Add water to 1L.
e. Add 0.5mL Tween20

Neural Systems & Behavior 2014 Integrative Molecular Neuroethology Module
31
Brightfield Immunohistochemistry
Day 1 IHC:
1. Thaw slides at low temp on warmer for 3-4 hours
2. Pap pen perimeter of slides
3. Fix slides in chilled PFA for 10 min
4. Wash 2x in 1X PBS for 5 min each
5. Add 300 μL quenching solution to each slide –
incubate 20 min at room temperature
6. Wash 2x in 1X PBS bath for 5 min each
7. Antigen retrieval: Boil citric acid in microwave, add to slides in bath chamber and incubate 2
min. Repeat with fresh citric acid for 5 min. Repeat again for 5 min.
8. Wash 2x in 1X PBS bath for 5 min each (make blocking solution during second wash)
9. In hybridization chamber, add 300 μL blocking solution to each slide – incubate 1 hour at
room temperature (make 1˚Ab when 10 min remaining)
10. Add 300 μL1˚Ab solution to each slide (on top of blocking solution) – incubate overnight at
room temperature in hybridization chamber
Blocking Solution 1˚Ab no 1˚Ab ctl
Final Vol. per
slide
Vol. for
___ slides
Final Vol. per
slide
Vol. for
___ slides
Vol. for
___ slides
1˚Ab - - 0.6 µL
(1:500)
-
Normal Goat
Serum
5% 15 µL 2% 6 µL
TritonX-100 0.3% 0.9 µL 0.3% 0.9 µL
1X PBS to vol 284.1 µL to vol 292.5 µL
Final
Volume
300 µL 300 µL
Day 2 IHC:
1. Wash 2x in 1X PBS for 10 min each
2. Add 300 μL2˚Ab solution to each slide – incubate
2 hours at RT (make ABC when 20-30 min left)
3. Wash 2x in 1X PBS for 10 min each
4. ABC: 300uL/slide – 1hr incubation at RT
5. Wash 2x in 1X PBS for 10 min each
6. Apply DAB substrate: 500uL/slide – 2-3min RT
7. Rinse in H2O. Ethanol dehydrate and coverslip
ABC:
2.5mL of 1X PBS
1 drop reagent A
1 drop reagent B
DAB:
2.5mL H2O
1 drop buffer
2 drops DAB
1 drop H2O2
Caution with DAB – anything that touches DAB MUST be neutralized with bleach before it goes down the sink
Quench Master
Mix
Final
Conc.
Vol. per
slide
Vol.
per __
slides
30% H2O2 10% 30 µL
TritonX 0.3% 0.9 µL
1X PBS to vol 269.1 µL
Final Volume 300 µL
2˚Ab
Final Vol./
slide
Vol.___
slides
2˚Ab 1:200 1.5 µL
Serum 2% 6 µL
TritonX-100 0.3% 0.9 µL
1X PBS to vol 290.1 µL
Final Volume 300 µL

Neural Systems & Behavior 2014 Integrative Molecular Neuroethology Module
32
Fluorescent Immunohistochemistry Day 1
1. Thaw slides on warmer 3-4 hours
2. Pap pen the perimeter of the slides
3. Fix in chilled 4% PFA at RT for 10m
4. Wash 2x in 1X PBS at RT for 5m
5. Add 300 μL quenching solution to each
slide – incubate at RT for 20m (Optional step for fluorescent staining)
6. Wash 2x in 1X PBS bath at RT for 5m
7. Antigen Retrieval: Boil citric acid in microwave (microwave 25-50mL more than you need, boil
75mL for Coplin jars holding <10 slides, and 550mL for a large 50 slide chamber). Add to slides
and incubate 2m. Repeat with fresh citric acid for 5m. Repeat again for 5m.
8. Wash 2x in 1XPBS at RT for 5m [make blocking solution during 2nd wash]
9. Blocking: 300uL/slide – 1 hr. at RT [make 1˚Ab when 10m left]
10. 1˚Ab: 300uL/slide – overnight at RT in hybridization chamber
Blocking Solution 1˚Ab no 1˚Ab ctl
Final Vol. per
slide
Vol. for
___ slides
Final Vol. per
slide
Vol. for
___ slides
Vol. for
___ slides
1˚Ab - - 0.6 µL
(1:500)
-
Serum 5% 15 µL 2% 6 µL
TritonX-100 0.3% 0.9 µL 0.3% 0.9 µL
1X PBS to vol 284.1 µL to vol 292.5 µL
Final
Volume
300 µL 300 µL
Day 2
1. Wash 2x in 1XPBS at RT for 10m
Everything below must be done in the DARK!
2. 2˚Ab: 300uL/slide at. RT for 2 hr
3. Wash 2x in 1XPBS at RT for 10m
4. Rinse in H2O. Coverslip in DAPI hardset.
5. Allow to dry, then store at 4°C in light-tight box.
Quench Master
Mix
Final
Conc.
Vol. per
slide
Total vol.
needed
30% H2O2 10% 30 µL
TritonX 0.3% 0.9 µL
1X PBS to vol 269.1 µL
Final Volume 300 µL
2˚Ab – Prepare in the dark
Final Vol. per
slide
Vol.
for ___
slides
2˚Ab_______ 1:200 1.5 µL
2˚Ab _______ 1:200 1.5 µL
Serum 2% 6 µL
TritonX-100 0.3% 0.9 µL
1X PBS to vol 290.1 µL
Final Volume 300 µL

Neural Systems & Behavior 2014 Integrative Molecular Neuroethology Module
33
Microscopy
Microscopes have greatly enabled our ability to visualize neural structures
and to better understand brain function. In this module, you will be using
brightfield and fluorescent microscopy to quantify the number of cells
expression a given protein.
The Introductory Biology Lab at The University of Austin has developed a
number of video tutorials that teach the basics of microscopes. Please view
these videos as a refresher for proper microscope techniques.
Stereology
Stereology comprises a number of practical techniques for extracting quantitative information about a
three-dimensional material from measurements made on two-dimensional planar sections of the
material. Stereology methods utilize random, systematic sampling to provide unbiased and
quantitative data. It is an important and efficient tool in many applications of microscopy
The Stereo Investigator system for stereology gives the user accurate, unbiased
estimates of the number, length, area, and volume of cells or biological
structures in a tissue specimen. It is a key research tool that has helped lead
advances in numerous areas of neuroscience. We will be using Stereo
Investigator in this module. Scan the QR code to access the Stereo Investigator
website.
Video: Fluorescent
microscopy
Stereo Investigator

Neural Systems & Behavior 2014 Integrative Molecular Neuroethology Module
34
Chapter 8
Other Molecular Protocols
DNA Isolation ...................................................................... 35
Endpoint PCR ...................................................................... 36
Exercise: Optimizing Thermal Cycler Settings ............... 37
Exercise: Determine Best Primer Concentration ............. 38

Neural Systems & Behavior 2014 Integrative Molecular Neuroethology Module
35
Wizard®
Genomic DNA
Purification Kit
Protocol
Maxwell® 16
Tissue DNA
Purification Kit
DNA Isolation
DNA isolation is the process of purifying DNA from a biological sample. DNA isolating procedures
include steps for cell lysis; removal of lipids, protein, and RNA removal; and elution into an aqueous
solution. In the course, students will become familiar with column based and automated extraction
approaches.
COLUMN-BASED RNA EXTRACTION
The Wizard® Genomic DNA Purification Kit (Promega) provides a simple, solution-
based method for isolation of DNA from white blood cells, tissue culture cells,
animal tissue, plant tissue, yeast and Gram-positive and Gram-negative bacteria.
DNA purified with this system is suitable for a variety of applications, including
amplification, digestion with restriction endonucleases and membrane
hybridizations.
For the complete Wizard® Genomic DNA Purification Kit Protocol, scan the QR code to the right.
AUTOMATED DNA EXTRACTION
The Maxwell® 16 Tissue DNA Purification Kit (Promega) is used with the
Maxwell® 16 Instrument to provide an easy method for efficient, automated
purification of genomic DNA from up to 50mg of tissue samples. The Maxwell®
16 Instrument is supplied with preprogrammed purification procedures and is
designed for use with the predispensed reagent cartridges, maximizing simplicity
and convenience. The instrument can process up to 16 samples in 45 minutes. The
purified DNA can be used directly in a variety of downstream applications
including PCR, restriction enzyme digestion and agarose gel electrophoresis. The
plunger action of the Maxwell® 16 Instrument grinds solid tissue samples directly
in lysis buffer in the prefilled reagent cartridge. Integrated tissue grinding replaces the time and
labor-intensive use of proteases or manual tissue grinding.
For the complete Maxwell® 16 Tissue DNA Purification Kit protocol, scan the QR code to the right.

Neural Systems & Behavior 2014 Integrative Molecular Neuroethology Module
36
Endpoint PCR
The polymerase chain reaction (PCR) is a biochemical technology in molecular biology used to
amplify a single or a few copies of a piece of DNA across several orders of magnitude, generating
thousands to millions of copies of a particular DNA sequence. In order to conduct PCR, one must
first design primers that are specific to the gene of interest. Then, you prepare a solution of
polymerase, primers, cDNA template, dNTPs, salts, and buffers. This reaction is placed in a thermal
cycler for multiple rounds of denaturing, annealing, and extending the DNA. Products are then
visualized using gel electrophoresis.
PRIMER DESIGN FOR ENDPOINT PCR
We demonstrate the basics of primer design using the leech vasopressin-like (aka hirudotocin) gene
>Hirudo_medicinalis_vasopressin_like_FP628609.1
CCAAATAACTAAGATTTGATAGCTAAAAGATCAGACGTATAGCCGTTTCTACTGACCAAAGTAACAAAATGCGTGTGACCAGCCTTTTCTTGCT
CAACAGTTTGTGCTTGATGGCAGTGTCCGTGTTTGTCGCTGAAGCCTGCTTCATCAGAAATTGTCCTCTTGGTGGAAAGAAAAGGTCCCTTGTCG
AGTACTTTACCAGTGGACCACGTAGGTGCCCTTCCTGTAGCCTCGAACTGTCAGGCGAACGTCTGACGGGAACATGCGTCTCGGCTGAGTTGTG
TTGCCATGGAAATCATGGATGCTTCTCAGACAGAGAAATAACCAGTTCTTGTCGGAGCGAGAACCTCATTTCAACTCCGTGCTTCGTGAAAGGA
AAGACGTGCGGCAGCAACGGATCTGGAATTTGCGTGACCAGAGGAGTTTGTTGCGAGGACGAAGGATCTTGTCGTCTGGATGGAGATTGCTCT
CACCAATGAACTCGGAAATCTTTGTGGACGAACTTACTGCGAATTTTTCTCAAACCCGAAATTATATTATATTTTCCATCCGACTTTTACTATCA
ATAAAATGTTTACTTTTACTATCAATAAACA
1. Go to an online primer design website such as Primer3, Primer3Plus, or IDT PrimerQuest
2. Paste nucleotide sequence where indicated
3. Provide a name indicating species (i.e. Hm) and gene (i.e. hirudotocin)
4. Select the output to give a forward and reverse primer
5. Select GC content of primers: 40-60%
6. Select a melting temperature: 60 - 63
7. Select min primer length 18, max length 24, optimal length 20
8. View primer details
9. Copy the primer sequences with all the relevant info (Tm, length, etc.) for all the primer pairs
listed into a word document.
10. Choose two sets of forward and reverse primers (1F, 1R, 2F, 2R) for purchases
a. Pick an “outer” pair that is close to the 5’ and 3’ UTR
b. Pick an “inner” pair that sits inside the outer pair.
11. Paste the primer sequences next to the primer name below as indicated below.
12. Save as on the NS&B shared folder, adding your initials to the file name.
Hm hirudotocin 1F AGCCGTTTCTACTGACCAAAG
Start 41 Stop 62 Length 21 Tm 62 GC% 47.6
Hm hirudotocin 1R CAATCTCCATCCAGACGACAAG
Start 445 Stop 467 Length 22 Tm 62 GC% 50
Hm hirudotocin 2F CTCAACAGTTTGTGCTTGATGG
Start 93 Stop 115 Length 22 Tm 62 GC% 45.5
Hm hirudotocin 2R TCCTCTGGTCACGCAAATTC
Start 403 Stop 423 Length 20 Tm 62 GC% 50
Neural Systems & Behavior 2014 Integrative Molecular Neuroethology Module
37
GoTaq®
Green PCR
Master Mix
Protocol
REACTION SETUP FOR ENDPOINT PCR
GoTaq® Green Master Mix (Promega) is a premixed ready-to-use solution containing bacterially
derived Taq DNA polymerase, dNTPs, MgCl2 and reaction buffers at optimal concentrations for
efficient amplification of DNA templates by PCR. GoTaq® Green Master Mix contains two dyes (blue
and yellow) that allow monitoring of progress during electrophoresis. Reactions
assembled with GoTaq® Green Master Mix have sufficient density for direct
loading onto agarose gels.
For the complete GoTaq® Green Master Mix Protocol, click the QR code.
USING THE THERMAL CYCLER FOR ENDPOINT PCR
PCR stands for Polymerase Chain Reaction. The process centers around heating
DNA to a temperature where the double strands will break apart or denature (95C), cooling the
DNA to a temperature where the primers can anneal or base pair (typically 50-60C), and heating to a
temperature where the polymerase can copy the strand bound to the primer (72C). This procedure
of heating and cooling is repeated many times (typically 25-37 cycles) to allow for logarithmic
amplification of target DNA fragments. It is called “endpoint PCR” because the PCR productive is
quantified at the end of all cycles.

Neural Systems & Behavior 2014 Integrative Molecular Neuroethology Module
38
Exercise for Optimizing Thermal Cycler Settings
Optimizing the annealing temperature is an important step for ensuring a successful PCR reaction.
This should be done on primers you design and on primers you obtain from the literature or a
colleague. This is most efficiently done on a thermal cycler that allows a gradient across the block.
1. Calculated Tm ____
2. Set the thermal cycler to run 7 different annealing temperatures: +0C +2C, +4C, +6C, -2C, -
4C, -6C
3. Prepare 14 reactions using the exact same master mix ingredients.
4. Set the thermal cycler to run only 20-30 cycles so that amplification reactions do not saturate.
5. Set the extension time to be 1 min per 1kb
6. Use band brightness on the gel to select optimal temperature for single band product
7. Confirm optimization using 1 degree steps around determined “optimal”
Exercise: Determine Best Primer Concentration
For your PCR reaction, you want to use the lowest concentration of primer that yields maximal
product. A final concentration of 200 nM per primer is effective for most reactions, but optimal
results may require a titration of primer concentrations between 100 and 500 nM. To determine this
optimal concentration, you can run multiple PCR reactions holding all ingredients constant but
varying primer concentration (and subsequently water volume).
1. Set up endpoint PCR reaction using GoTaq® Green PCR Master Mix with following final
concentrations of the forward and reverse primer (always keep concentration of forward and
reverse equal): 100nM, 200nM, 300nM, 400nM , 500nM.
2. Prepare a negative control that has primers but no DNA template.
3. Run your reaction in the thermal cycler using the anneal temperature identified early in the
course or specified by the teacher.
4. Use band brightness on the gel to select the optimally bright band at the lowest primer
concentration.

Neural Systems & Behavior 2014 Integrative Molecular Neuroethology Module
39
Chapter 9
Integrative Molecular
Neuroethology Laboratory
Notebook
Guidelines for Keeping a Lab Notebook ......................... 40
Special Project Information ................................................ 42
Table of Contents ................................................................ 43
Notebook Pages ............................................................... I-XX

Neural Systems & Behavior 2014 Integrative Molecular Neuroethology Module
40
Guidelines for Keeping a Laboratory Notebook
The skill of writing the Laboratory Notebook is a vital part of industrial and academic research. It is a
difficult but important part of science. It is required by law to establish intellectual and patent rights.
The lab notebook is the property of the lab, not the property of the person doing the work. The
objective of a laboratory notebook is to:
record what, why, how (step by step), and where something was done
allow someone else to recreate your work process.
Laboratory notebooks should be hardback bound books with numbered pages, and the writing must
be done in durable ink. Do not erase. Do not tear out pages. Do not doodle in your lab notebook.
ORGANIZING YOUR NOTEBOOK
On the first page, describe your project and state the hypothesis. Later, summarize your results
and conclusions
Keep a table of contents. Every page should be accounted for in the table of contents.
Include the date (YYY/MM/DD) on every page!
Write the title of your experiment on every page (a one word nickname is sufficient
Write the protocol you are using at the top of the page (i.e. Maxwell® RNA Isolation)
THE PROTOCOL
This is a detailed description of your research plan. It is written before you start into your lab work.
This plan is based upon reading the lab handout before coming to lab. This is the part of the account
that tells what you think you are going to do.
Use simple, direct statements or a numbered list of instructions describing the protocol.
Account for solutions etc. that need to be prepared.
Safety! Make note of any chemicals or practices that may be dangerous proper handling.
THE DAILY EXECUTION
This is the part of the account that tells what you actually did that was a modification on the written
protocol, and includes any mistakes, missed steps, pipetting errors etc.
Identify precisely what equipment was used.
Describe or diagram settings, adjustments or calibrations
Record changes in incubation times if you deviate from the protocol
Record lot#, expiration dates, identifying characteristics of organisms, etc…
Record what parts of the experiment you do and what parts someone else does.
OBSERVATIONS AND DATA
Record honestly and completely, without bias.
Record as you go along, in the notebook, in ink, immediately.
Do not trust valuable information or data to memory, even for a minute
Do not use odd scraps of paper or the edge of your lab coat to record data, or make
calculations. Only if your data is in a notebook will it be available for future analysis. Use
good penmanship. Take care with numbers.
Never over-write, always cross out mistakes with a single line and re-write the correct data.

Neural Systems & Behavior 2014 Integrative Molecular Neuroethology Module
41
If errors are found, or notes are added at a future date, indicate the date that change is made.
When data are recorded directly into a computer, note the name and location of the file.
When data are recorded in another notebook, indicate the location of those data.
GRAPHS
Do not underestimate the value of even a hand drawn graph to summarize data.
Each graph should have the title and labeled axes, with units.
Each graph should indicate the data that are included in the graph.
Any graphs produced on a computer should be attached to the notebook. The name and
location of the computer file must be recorded in the lab notebook.
PRIMERS
Keep track of all primers used in your experiments. You WILL need this for publication! Record the
purpose of each primer (isolation, qPCR), the sequence, the concentration used, and whether or not it
worked. Be sure to highlight in some way the primers that were successful.
CONCLUSION
Write any calculations out clearly, showing all the steps and units.
Record which statistical tests were applied to the data, stating which factors were analyzed.
Record what computer program was used for the statistical analysis as well as the name of any
computer files generated in the process.
Briefly state your results.
Briefly, interpret your results in relation to your hypothesis.
If results were not as expected, explain how were they different, and propose an explanation
for why they are different?
State your conclusions clearly.
Include brief suggestions for improvement in experimental design.
Include brief suggestions for future experiments.
Record any ideas you have, however brief - if you don't write them down, you'll forget them,
and no one will know you had them.

Neural Systems & Behavior 2014 Integrative Molecular Neuroethology Module
42
Special Project Information
Project title:
Project hypothesis:
Project summary:
Project conclusions:
Collaborators:

Neural Systems & Behavior 2014 Integrative Molecular Neuroethology Module
43
Table of Contents
Page Date Description
I
II
III
IV
V
VI
VII
VII
IX
X
XI
XII
XIII
XIV
XV
XVI
XVII
XVIII
XIX
XX
XXI

Neural Systems & Behavior 2014 Integrative Molecular Neuroethology Module
I
Date: ________________ Description:_______________________________________________________
Samples stored in: _____________________________ Reagents stored in: _________________________
Data saved as: _________________________________ Stored in: __________________________________

Neural Systems & Behavior 2014 Integrative Molecular Neuroethology Module
II
Date: ________________ Description:_______________________________________________________
Samples stored in: _____________________________ Reagents stored in: _________________________
Data saved as: _________________________________ Stored in: __________________________________

Neural Systems & Behavior 2014 Integrative Molecular Neuroethology Module
III
Date: ________________ Description:_______________________________________________________
Samples stored in: _____________________________ Reagents stored in: _________________________
Data saved as: _________________________________ Stored in: _________________________________

Neural Systems & Behavior 2014 Integrative Molecular Neuroethology Module
IV
Date: ________________ Description:_______________________________________________________
Samples stored in: _____________________________ Reagents stored in: _________________________
Data saved as: _________________________________ Stored in: __________________________________

Neural Systems & Behavior 2014 Integrative Molecular Neuroethology Module
V
Date: ________________ Description:_______________________________________________________
Samples stored in: _____________________________ Reagents stored in: _________________________
Data saved as: _________________________________ Stored in: __________________________________

Neural Systems & Behavior 2014 Integrative Molecular Neuroethology Module
VI
Date: ________________ Description:_______________________________________________________
Samples stored in: _____________________________ Reagents stored in: _________________________
Data saved as: _________________________________ Stored in: __________________________________

Neural Systems & Behavior 2014 Integrative Molecular Neuroethology Module
VII
Date: ________________ Description:_______________________________________________________
Samples stored in: _____________________________ Reagents stored in: _________________________
Data saved as: _________________________________ Stored in: __________________________________

Neural Systems & Behavior 2014 Integrative Molecular Neuroethology Module
VIII
Date: ________________ Description:_______________________________________________________
Samples stored in: _____________________________ Reagents stored in: _________________________
Data saved as: _________________________________ Stored in: __________________________________

Neural Systems & Behavior 2014 Integrative Molecular Neuroethology Module
IX
Date: ________________ Description:_______________________________________________________
Samples stored in: _____________________________ Reagents stored in: _________________________
Data saved as: _________________________________ Stored in: __________________________________

Neural Systems & Behavior 2014 Integrative Molecular Neuroethology Module
X
Date: ________________ Description:_______________________________________________________
Samples stored in: _____________________________ Reagents stored in: _________________________
Data saved as: _________________________________ Stored in: __________________________________

Neural Systems & Behavior 2014 Integrative Molecular Neuroethology Module
XI
Date: ________________ Description:_______________________________________________________
Samples stored in: _____________________________ Reagents stored in: _________________________
Data saved as: _________________________________ Stored in: __________________________________

Neural Systems & Behavior 2014 Integrative Molecular Neuroethology Module
XII
Date: ________________ Description:_______________________________________________________
Samples stored in: _____________________________ Reagents stored in: _________________________
Data saved as: _________________________________ Stored in: __________________________________

Neural Systems & Behavior 2014 Integrative Molecular Neuroethology Module
XIII
Date: ________________ Description:_______________________________________________________
Samples stored in: _____________________________ Reagents stored in: _________________________
Data saved as: _________________________________ Stored in: __________________________________

Neural Systems & Behavior 2014 Integrative Molecular Neuroethology Module
XIV
Date: ________________ Description:_______________________________________________________
Samples stored in: _____________________________ Reagents stored in: _________________________
Data saved as: _________________________________ Stored in: __________________________________

Neural Systems & Behavior 2014 Integrative Molecular Neuroethology Module
XV
Date: ________________ Description:_______________________________________________________
Samples stored in: _____________________________ Reagents stored in: _________________________
Data saved as: _________________________________ Stored in: __________________________________

Neural Systems & Behavior 2014 Integrative Molecular Neuroethology Module
XVI
Date: ________________ Description:_______________________________________________________
Samples stored in: _____________________________ Reagents stored in: _________________________
Data saved as: _________________________________ Stored in: __________________________________

Neural Systems & Behavior 2014 Integrative Molecular Neuroethology Module
XVII
Date: ________________ Description:_______________________________________________________
Samples stored in: _____________________________ Reagents stored in: _________________________
Data saved as: _________________________________ Stored in: __________________________________

Neural Systems & Behavior 2014 Integrative Molecular Neuroethology Module
XVIII
Date: ________________ Description:_______________________________________________________
Samples stored in: _____________________________ Reagents stored in: _________________________
Data saved as: _________________________________ Stored in: __________________________________
Neural Systems & Behavior 2014 Integrative Molecular Neuroethology Module
XIX
Date: ________________ Description:_______________________________________________________
Samples stored in: _____________________________ Reagents stored in: _________________________
Data saved as: _________________________________ Stored in: _________________________________

Neural Systems & Behavior 2014 Integrative Molecular Neuroethology Module
XX
Date: ________________ Description:_______________________________________________________
Samples stored in: _____________________________ Reagents stored in: _________________________
Data saved as: _________________________________ Stored in: __________________________________

Neural Systems & Behavior 2014 Integrative Molecular Neuroethology Module
XXI
Date: ________________ Description:_______________________________________________________
Samples stored in: _____________________________ Reagents stored in: _________________________
Data saved as: _________________________________ Stored in: __________________________________

Neural Systems & Behavior 2014 Integrative Molecular Neuroethology Module
XXII
Appendix: Hyperlinks for QR Codes
Page 2. Astatotilapia burtoni mc4r cDNA sequence: http://www.ncbi.nlm.nih.gov/nuccore/NM_001287403.1
Page 3. Clustal Omega: http://www.ebi.ac.uk/Tools/msa/clustalo/
Page 8. Video: Using the cryostat: https://www.youtube.com/watch?v=d43LFVV3h6w
Page 11. ReliaPrepTM RNA Tissue Miniprep System: https://www.promega.com/resources/protocols/technical-
manuals/101/reliaprep-rna-tissue-miniprep-system-protocol/
Page 11. Maxwell® 16 Tissue LEV Total simplyRNA Purification Tissue Kit:
https://www.promega.com/products/dna-and-rna-purification/rna-purification/maxwell-16-system-
rna-purification-kits/maxwell-16-lev-simplyrna-purification-kits/
Page 15. Video: Quantus™ Fluorometer Sample Quantification:
http://www.promega.com/resources/multimedia/instruments/quantus-fluorometer-sample-
measurement/
Page 18. Video GoScript™ Reverse Transcription:
https://www.promega.com/resources/multimedia/pcr/goscript-reverse-transcription-system-video/
Page 18. GoScript™ RT System Protocol: https://www.promega.com/products/pcr/rt-pcr/goscript-reverse-
transcription-system/
Page 21. GoTaq® qPCR Master: https://www.promega.com/products/pcr/qpcr-and-rt-qpcr/gotaq-real-time-
qpcr-and-rt_qpcr-systems/
Page 21. GoTaq® Probe qPCR Master Mix: https://www.promega.com/products/pcr/qpcr-and-rt-qpcr/gotaq-
probe-qpcr-master-mix/
Page 24. Video: qPCR experiment setup: http://www.promega.com/resources/multimedia/pcr/gotaq-qpcr-
master-mix-video/
Page 26. MV Matz et al. 2013 PLOS ONE:
http://www.plosone.org/article/info%3Adoi%2F10.1371%2Fjournal.pone.0071448
Page 33. Video: Fluorescent microscopy: http://www.youtube.com/watch?v=fZn6FkixiHI
Page 33. Stereo Investigator: http://www.mbfbioscience.com/stereo-investigator
Page 35. Wizard® Genomic DNA Purification Kit Protocol:
https://www.promega.com/resources/protocols/technical-manuals/0/wizard-genomic-dna-
purification-kit-protocol/
Page 35. Maxwell® 16 Tissue DNA Purification Kit: https://www.promega.com/products/dna-and-rna-
purification/genomic-dna-purification-kits/maxwell-16-system-dna-purification-kits/maxwell-16-
tissue-dna-purification-kit/
Page 37. GoTaq® Green PCR Master Mix: https://www.promega.com/resources/protocols/product-
information-sheets/g/gotaq-green-master-mix-m712-protocol/
Page XXIII. Feedback Survey: http://tiny.cc/c91vhx

Neural Systems & Behavior 2014 Integrative Molecular Neuroethology Module
Feedback
Survey
Acknowledgements
We are happy and grateful to acknowledge the generous financial support for NS&B which comes
this year from a National Institute of Mental Health (NIMH) training grant, as well as grants from the
Grass Foundation and the Howard Hughes Medical Institute (HHMI).
Promega generously donated reagents and equipment for our use in 2013 and 2014; without their
continuing commitment to enhancing education at MBL, we would not have been able to carry out
such a diversity of molecular experiments. Jackson Labs generously donated mice for use in Cycle 4.
Most of the equipment (much of it state-of-the-art!) has been loaned to the course by the
manufacturers, which are too numerous to acknowledge.
We also want to acknowledge all the NS&B management, faculty members, teaching
assistants, and course assistants who made this module possible.
We hope that this manual will help neuroethologists to integrate these established
molecular methods into their own research programs. If you used any of the
resources provide herein, we would appreciate your feedback regarding its quality
and utility. Please visit http://tiny.cc/c91vhx to complete a short survey and leave
your specific comments. Your feedback is much appreciated.