neural methods in process monitoring, visualization and early
TRANSCRIPT

9HSTFMG*afhdgb+
ISBN 978-952-60-5736-1 ISBN 978-952-60-5737-8 (pdf) ISSN-L 1799-4896 ISSN 1799-4896 ISSN 1799-490X (pdf) Aalto University Department of Information and Computer Science www.aalto.fi
BUSINESS + ECONOMY ART + DESIGN + ARCHITECTURE SCIENCE + TECHNOLOGY CROSSOVER DOCTORAL DISSERTATIONS
Aalto-S
T 7/2
014
The fault dynamics and dependencies of power plant elements and variables have been inspected to open the way for modelling and creating useful statistics to detect process faults. We have succeeded in the use of data mining to learn from industrial process and to find out dependencies between variables by Principal Component Analysis (PCA) and Self-Organizing Map (SOM) methods. Compared to traditional methods used in the control rooms the used methodologies have many advantages in the information process. The combination of data analysis and decision making has turned out to be a useful approach.
Department of Information and Computer Science
Neural methods in process monitoring, visualization and early fault detection Miki Sirola
TECHNICAL REPORT SCIENCE + TECHNOLOGY

Aalto University publication series SCIENCE + TECHNOLOGY 7/2014
Neural methods in process monitoring, visualization and early fault detection
Miki Sirola
Aalto University School of Science Department of Information and Computer Science

Aalto University publication series SCIENCE + TECHNOLOGY 7/2014 © Miki Sirola ISBN 978-952-60-5736-1 ISBN 978-952-60-5737-8 (pdf) ISSN-L 1799-4896 ISSN 1799-4896 (printed) ISSN 1799-490X (pdf) http://urn.fi/URN:ISBN:978-952-60-5737-8 Unigrafia Oy Helsinki 2014 Finland

Abstract Aalto University, P.O. Box 11000, FI-00076 Aalto www.aalto.fi
Author Miki Sirola Name of the publication Neural methods in process monitoring, visualization and early fault detection Publisher School of Science Unit Department of Information and Computer Science
Series Aalto University publication series SCIENCE + TECHNOLOGY 7/2014
Field of research
Abstract This technical report is based on five our recent articles:”Self-organizing map based
visualization techniques and their assessment”, ”Combining neural methods and knowledge-based methods in accident management”, ”Abnormal process state detection by cluster center point monitoring in BWR nuclear power plant”, “Generated control limits as a basis of operator-friendly process monitoring”, and “Modelling power output at nuclear power plant by neural networks”. Neural methods are applied in process monitoring, visualization and early fault detection. We introduce decision support schemes based on Self-Organizing Map (SOM) combined with other methods. Visualizations based on various data-analysis methods are developed in large Finnish research project many Universities and industrial partners participating. In our subproject the industrial partner providing data into our practical examples is Teollisuuden Voima Oy, Olkiluoto Nuclear power plant. Measurement of the information value is one challenging issue. On long run our research has moved from Accident Management to more Failure Management. One interesting case example introduced is detecting pressure drift of the boiling water reactor by multivariate methods including innovative visualizations. We also present two different neural network approaches for industrial process signal forecasting. Preprosessing suitable input signals and delay analysis are important phases in modelling. Optimized number of delayed input signals and neurons in hidden-layer are found to make a possible prediction of an idle power process signal. Algorithms on input selection and finding the optimal model for one-step-ahead prediction are developed. We introduce a method to detect abnormal process state based on cluster center point monitoring in time. Typical statistical features are extracted, mapped to n-dimensional space, and clustered online for every step. The process signals in the constant time window are classified into two clusters by the K-means method. In addition to monitoring features of the process signals, signal trends and alarm lists, a tool is got that helps in early detection of the pre-stage of a process fault. We also introduce data generated control limits, where alarm balance feature clarifies the monitoring. This helps in early and accurate fault detection.
Keywords
ISBN (printed) 978-952-60-5736-1 ISBN (pdf) 978-952-60-5737-8
ISSN-L 1799-4896 ISSN (printed) 1799-4896 ISSN (pdf) 1799-490X
Location of publisher Helsinki Location of printing Helsinki Year 2014
Pages 20 urn http://urn.fi/URN:ISBN:978-952-60-5737-8


5
Contents
Abstract 3
Contents 5
Introduction 7
Decision making with data analysis 8
Self-organizing map based visualization techniques 8
Neural methods and knowledge-based methods in accident management 10
Abnormal process state detection by cluster centre point monitoring 12
Generated control limits in process monitoring 14
Modelling power output by neural networks 16
Summary 18
References 19

6

7
Introduction
This technical report is a summary of nuclear power related studies of our research group after two TEKES projects (NoTeS and NoTeS2). The latter project ended in early 2009. The studies done in NoTeS and NoTeS2 projects are summarized in a technical report [1]. Our industrial partner Teollisuuden Voima Oy (TVO Olkiluoto) in the earlier MASI program has provided the data also for these later studies. Early fault detection has been one important focus of these studies.
The topics in this report include visualization techniques and their assessment, accident management, process monitoring, modelling and abnormal process state detection. Both neural methods and knowledge-based methods are used. Self-Organizing Map (SOM) is one technique that has been utilized especially in visualization. Modelling power output, generating control limits and using cluster centre point monitoring are focused on. One goal has been to generate operator-friendly techniques to achieve better decision making.
In this report each of these five studies are shortly presented and summarized. Five scientific articles have been published, and a doctor’s thesis [2].

8
Decision making with data analysis
In our research we have combined data analysis and decision making. We have developed tools to help the operators and the experts to understand better various phenomena in the process. Prototyping is also one research methodology used.
The five following case studies enlighten the problem from different perspectives. Each case study gives their unique contribution to the whole toolset. Visualization is one important aspect, but the model output can be other too. The modernization projects in nuclear power plants have introduced e.g. wide monitoring screens.
Early fault detection is an important issue paid special attention to. The data for all these case studies is from TVO Olkiluoto nuclear power plant. Part of our methods requires education or training for the operators.
Self-organizing map based visualization techniques
Self-Organizing Map (SOM) [3] is an effective method in neural computing for the analysis and visualization of multidimensional data. Originally the SOM was not designed for changing time. The SOM is able to analyze ideally only static data sets. Still many attempts to use SOM method in the analysis of dynamic data have been done [1], for instance for time-related problems in modelling and monitoring [4].
Figure 1. U-matrix, component plain SOM maps, and labels in the reheater section.
9
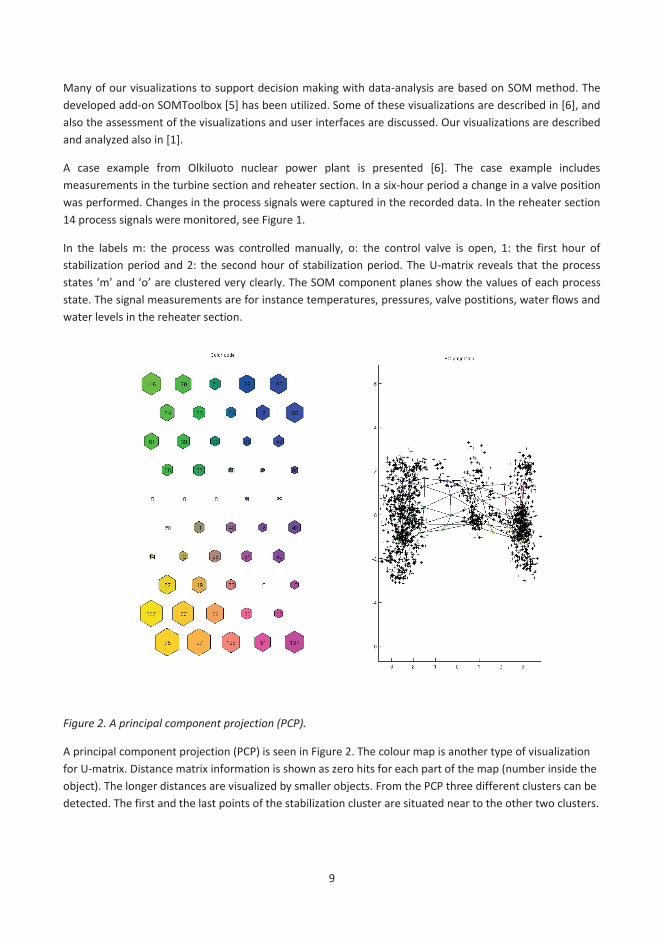
Many of our visualizations to support decision making with data-analysis are based on SOM method. The developed add-on SOMToolbox [5] has been utilized. Some of these visualizations are described in [6], and also the assessment of the visualizations and user interfaces are discussed. Our visualizations are described and analyzed also in [1].
A case example from Olkiluoto nuclear power plant is presented [6]. The case example includes measurements in the turbine section and reheater section. In a six-hour period a change in a valve position was performed. Changes in the process signals were captured in the recorded data. In the reheater section 14 process signals were monitored, see Figure 1.
In the labels m: the process was controlled manually, o: the control valve is open, 1: the first hour of stabilization period and 2: the second hour of stabilization period. The U-matrix reveals that the process states ‘m’ and ‘o’ are clustered very clearly. The SOM component planes show the values of each process state. The signal measurements are for instance temperatures, pressures, valve postitions, water flows and water levels in the reheater section.
Figure 2. A principal component projection (PCP).
A principal component projection (PCP) is seen in Figure 2. The colour map is another type of visualization for U-matrix. Distance matrix information is shown as zero hits for each part of the map (number inside the object). The longer distances are visualized by smaller objects. From the PCP three different clusters can be detected. The first and the last points of the stabilization cluster are situated near to the other two clusters.

10
In the U-matrix visualization in Figure 1 three different clusters can be seen: process was controlled manually, the stabilization period, and the control valve is open. The component planes show the limits for current process signal values. More exact analysis of the case example is in [6].
Neural methods and knowledge-based methods in accident management
Accident management became a popular research branch as a follow-up to some serious accidents such as Three Mile Island accident in 1979, Bhopal in 1984 and Chernobyl in 1986. The interest grew also into the severe accident management [7]. Human factors, human reliability and man-machine interface technology became major focus areas [8]. The Fukushima accident in 2011 has made this topic again of current interest.
Figure 3. Variable correlations.
Computerized decision support systems have been one attempt to solve accident management problems [9]. In our studies first knowledge-based approach was used, and later it was combined with neural methods. Examples of these results are for instance in [1]. Self-organizing map method was used in a combination with a selection of other methods in early fault detection.
Detecting pressure drift on the boiling water reactor by multivariate methods is described in detail in [10]. With multivariate methods the process is modelled offline, and research results are used to understand the process dynamics. A large amount of high-dimensional data is monitored by the univariate control charts.
11
Redundant and in some cases correlating signal measurements are compared with each other to detect deviation and a need for calibration.
Continuous online validation provides the most expedient status identification. The principal component regression (PCR) and the partial last square (PLS) techniques are used to indicate calibration status. PCR is a regression analysis that uses principal component analysis (PCA) in estimating regression coefficients [11]. PLS is a statistical model and belong to the family of bilinear factor models.
The calibrations status is measured as index value: a correlation between predicted and measured values. The accepted difference between index and calibration value is set to 5%, while a bigger difference is considered significant. The model is updated after each transmitter calibration. The dataset is from Finnish Olkiluoto nuclear power plant (in the year 2009).
In Figure 3 the target variable 211K122 (reactor pressure) is modelled by correlating variables. Variable code names are shown in y-axis and variable codes on x-axis. Colour coding in the figure (z-axis) is correlation. For example, the reactor pressure has the largest negative correlation with the variable 421K831 (Matlab variable index 443) and the largest positive correlation with the variable 211K112.
In Figure 3 on the y-axis are the variable names, and on the x-axis the corresponding Matlab variable indexes (variable codes). As the variable has always strongest correlation with itself, the corresponding variable name of each variable index is on the diagonal. The colourings of the variable values are in the right side of the Figure 3.
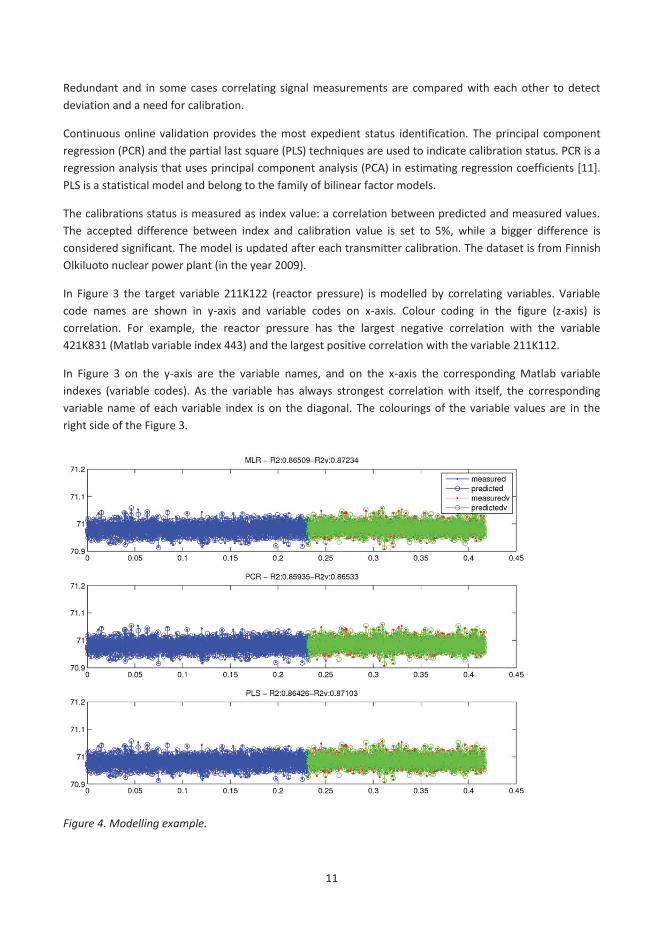
Figure 4. Modelling example.

12
In Figure 4 a modelling example is seen. In this case all the multivariate methods indicate that process variable is in good calibration. Correlation between model and measured values is even better before than after calibration. The x-axis is time in days and the y-axis is interpretative variable 211K122 (reactor pressure). Calibration limits (5%) are in this case MLR: 0.8218, PCR: 0.8164, PLS: 0.821.
In Figure 4 the parameters are the explanation stage of the teaching set (R2) and the explanation stage of the test set (Rv2). Explanation stage is a related concept to correlation (here both are the highest possible value 1). The blue curve presents the teaching set and the green curve the test set.
The principal component analysis (PCA) is a useful tool for finding relevant variables for the system and the model. It is a linear transformation to a lower-dimensional coordinate system while retaining as much as possible of the variation. In PCR the components are used as dependent model variables. In PLS a small number of latent variables are used between input and output. The goal is to maximize covariance between dependability and interpretability.
Abnormal process state detection by cluster centre point monitoring
A method is developed to detect abnormal process state [12]. The method is based on cluster center point monitoring in time and the application is demonstrated with data from Olkiluoto nuclear power plant. Typical statistical features are extracted, mapped into n-dimensional space, and clustered online for every time step. The process signals in a constant time window are classified into two clusters by the K-means method.
Using cluster center point time series monitoring faults in the process are seen by first glance or automatically by notification in the alarm list. Monitoring features of the process signals, in addition to signal trends and alarm lists, the operator gets a tool to help in early detection of pre-stages of a process fault.
Figure 5. Time series for three preprocessed process signals.
13
In Figure 5 the time series for three preprosessed process signals are seen. The zero value is the global minimum, stored value of the signal in the database, for the signal and 1 is the maximum. Most of the variables are near the global maximum in the normal operation depending on the variable.
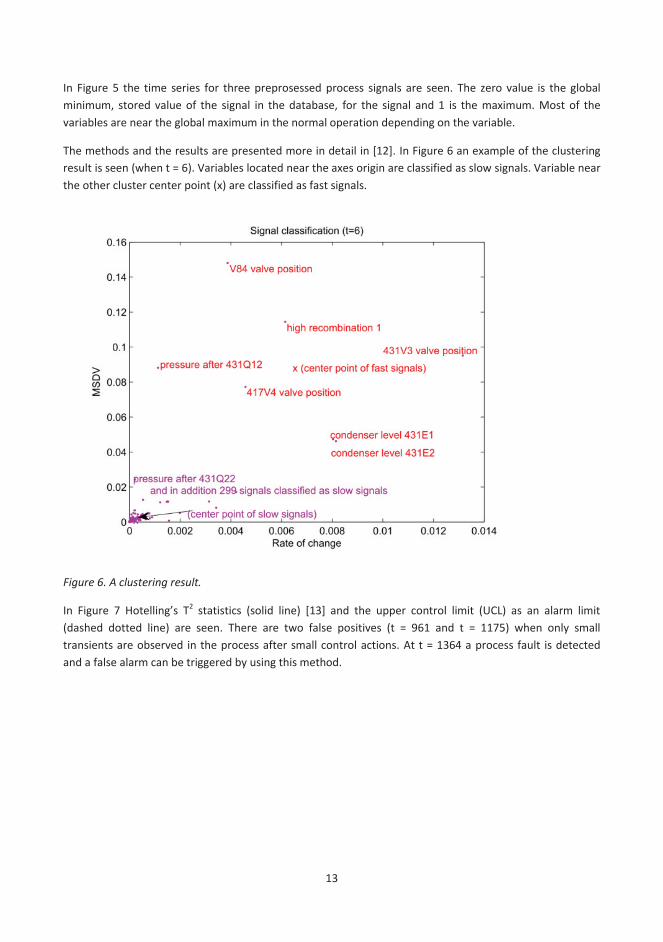
The methods and the results are presented more in detail in [12]. In Figure 6 an example of the clustering result is seen (when t = 6). Variables located near the axes origin are classified as slow signals. Variable near the other cluster center point (x) are classified as fast signals.
Figure 6. A clustering result.
In Figure 7 Hotelling’s T2 statistics (solid line) [13] and the upper control limit (UCL) as an alarm limit (dashed dotted line) are seen. There are two false positives (t = 961 and t = 1175) when only small transients are observed in the process after small control actions. At t = 1364 a process fault is detected and a false alarm can be triggered by using this method.

14
Figure 7. Hotelling’s T2 statistics.
Generated control limits in process monitoring
Early and accurate fault detection is a major challenge in safety of industrial plants. Fault detection and diagnosis are able to minimize downtime, increase the safety and reduce manufacturing costs. Industrial plants are becoming more instrumented including more and more high-dimensional data.
An approach based on data-generated control limits is suggested to detect faults or pre-stage of abnormal event in the process [14]. Alarm balance feature was developed to get clearer monitoring at the nuclear power plant. The final decision of the process state is up to operators. Real and simulator data are available from Olkiluoto nuclear power plant in Finland. The main methods and results are described in detail in [14]. Related ideas are studied for instance in [15] and [16].
Figure 8. Visualization of alarms in the control room.

15
A part of process dynamics notifications as a classical visualization of alarms in the control room are shown in Figure 8. For each alarm the following information is shown: date and time, time stamp (hour), variable number and name, alarm type, subarea at the nuclear power plant (NPP), magnitude in round brackets and signal unit in square brackets. Magnitudes of abnormal values are shown in different colours in the list and by type notation LOLO (under lower limit) and HI (over higher limit). It is relational exceeding of the alarm limit in this application.
In Figure 9 time series for watering temperature and corresponding alarm limits are seen. Lower control limit (LCL) exceeds (LO) at t = 1160, t = 1244, t= 1245 and t = 1246. In Figure 10 time stamps of signals limits exceeds on a part of process chart. Alarms at certain times can be localized easily.
Figure 9. Time series for watering temperature and corresponding alarm limits.
Figure 10. Partial process chart.
16
Modelling power output by neural networks
Two different neural network (NN) approaches are proposed for industrial process signal forecasting [17]. Real data from boiling water reactor type nuclear power reactors in Olkiluoto Finland is used. Neural networks are used widely in time series prediction, but not in such applications as nuclear power plants (NPP).
Preprosessing, suitable input signals and delay analysis are important phases in modelling. Optimized number of delayed input signals and neurons in hidden-layer are found to make possible prediction of idle power process signal. Algorithms on input signal selection and finding the optimal model for one-step-ahead prediction are mainly concentrated on.
Feed-forward back-propagation (FF) [18] and Elman neural network (ENN) [19] with different parameters are used for modelling the system. The main goal is not the analysis of the recorded events, but to develop monitoring and forecasting methods by given data.
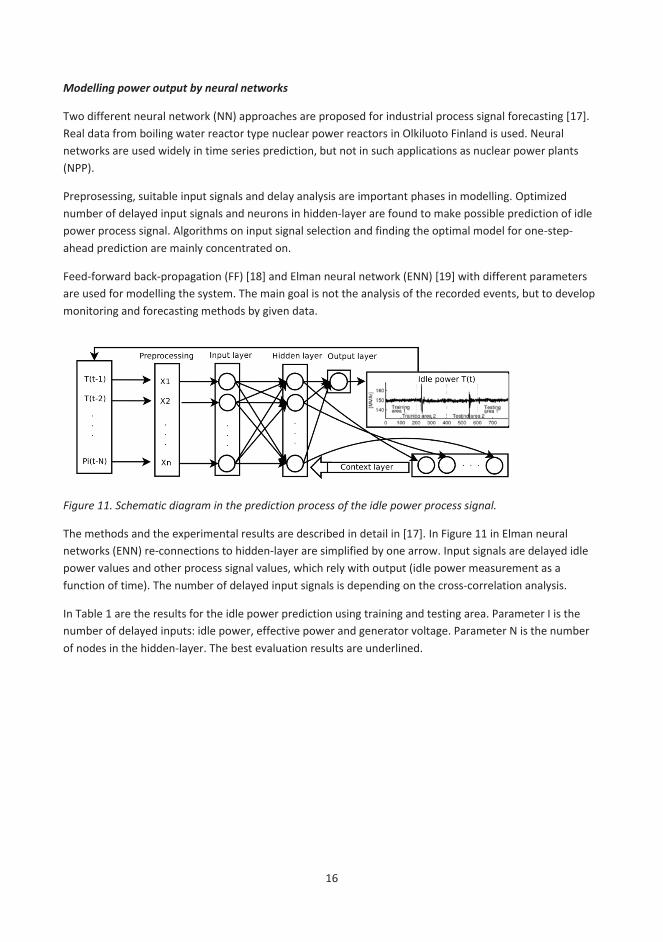
Figure 11. Schematic diagram in the prediction process of the idle power process signal.
The methods and the experimental results are described in detail in [17]. In Figure 11 in Elman neural networks (ENN) re-connections to hidden-layer are simplified by one arrow. Input signals are delayed idle power values and other process signal values, which rely with output (idle power measurement as a function of time). The number of delayed input signals is depending on the cross-correlation analysis.
In Table 1 are the results for the idle power prediction using training and testing area. Parameter I is the number of delayed inputs: idle power, effective power and generator voltage. Parameter N is the number of nodes in the hidden-layer. The best evaluation results are underlined.

17
Table 1. Results of the idle power prediction.
In Table 1 MSE is mean squared error, MNSE is normalized mean square error, and MAE is median of absolute error. FF is feed-forward back propagation and ENN is Elman neural networks.

18
Summary
This report summarizes our research group’s nuclear power related studies after two TEKES projects: NoTeS and NoTeS2 in MASI research program. Our industrial partner Teollisuuden Voima Oy (TVO Olkiluoto) has provided the data for these studies. We have got both design based events data from the plant and simulator data from the training simulator.
Five different studies are described in detail: Self-organizing map based visualization techniques, neural methods and knowledge-based methods in accident management, abnormal process state detection by cluster centre point monitoring, generated control limits in process monitoring, and modelling power output by neural networks. Failure management has been handled mostly with Principal Component Analysis (PCA) and Self-Organizing Map (SOM) methods. Visualization is in an important role in these studies, and the key goal is to help the operators and experts in their decision making.
The fault dynamics and dependencies of power plant elements and variables have been inspected to open the way for modelling and creating useful statistics to detect process faults. We have succeeded in the use of data mining to learn from industrial process and to find out dependencies between variables by Principal Component Analysis (PCA) and Self-Organizing Map (SOM) methods. Compared to traditional methods used in the control rooms the used methodologies have many advantages in the information process. The combination of data analysis and decision making has turned out to be a useful approach.
19
References
[1] Sirola, Miki; Talonen, Jaakko; Parviainen, Jukka; Lampi, Golan. Decision support with data-analysis methods in a nuclear power plant. TKK Reports in Information and Computer Science (TKK-ICS-R29). Espoo, 2010. 23 p.
[2] Talonen, Jaakko. Advances in Methods of Anomaly Detection and Visualization of Multivariate Data. Doctor’s thesis, Aalto university in Finland, 2014.
[3] Kohonen, Teuvo. The self-organizing map. Springer, 1995.
[4] Barreto, G.; Araujo, A.; Ritter, H. Time in self-organizing maps: an overview of models. International Journal of Computer Research, 2001.
[5] Vesanto, Juha; Himberg Johan; Alhoniemi Esa; Parhankangas Juha. Self-organizing map in Matlab: the SOM Toolbox. Proceedings of Matlab-DSP conference, 1999.
[6] Sirola, Miki; Talonen, Jaakko. Self-organizing map based visualization techniques and their assessment. International Journal of Computing, Vol. 11, Issue 2, pp. 96 – 103, 2012.
[7] Kastenberg, W. E. Uncertainties and severe accident management. Transactions of the American Nuclear Society, Vol. 63, pp. 266 - 267, 1991.
[8] Salvendy, G. Handbook of human factors. John Wiley & Sons, New York, 1986.
[9] Sirola, Miki. Computerized decision support systems in failure and maintenance management of safety critical processes. VTT Publications 397. Espoo, VTT, 1999. 123 p. + app. 24 p.
[10] Sirola, Miki; Talonen, Jaakko. Combining neural methods and knowledge-based methods in accident management. Review Article: Advances in Artificial Neural Systems, Volume 2012, Article ID 534683, 6 pages, doi:10.1155/2012/534683, Hindawi Publishing Corporation, 2012.
[11] Hair, J.; Anderson, R.; Tatham, R.; Black, W. Multivariate data analysis. Prentice Hall, 5th edition, 1998.
[12] Talonen, Jaakko; Sirola, Miki. Abnormal process state detection by cluster center point monitoring in BWR nuclear power plant. International Conference on Data Mining (DMIN 09). Las Vegas, USA, 13 - 16 July 2009.
[13] Tong, L. I.; Wang, C. H.; Huang, C. L. Monitoring defects in IC fabrication using a Hotelling T2 control chart. Semiconductor Manufacturing, IEEE Transactions, Vol. 18, Issue 1, pp.140-147, 2005.
[14] Talonen, Jaakko; Sirola, Miki. Generated control limits as a basis of operator-friendly process monitoring. IEEE International Workshop on Intelligent Data Acquisition and Advanced Computing Systems: Technology and Applications (IDAACS 2009). Rende, Italy, 21 - 23 September 2009.
[15] Øwre, F.; Kvalem, J.; Karlsson, T.; Nihlwing, C. A new integrated BWR supervision and control system. Human Factors and Power Plants, 2002.
[16] Larsson, J. E. Simple methods for alarm sanitation. Proceedings of the IFAC Symposium on Artificial Intelligence in Real-Time Control, Budapest, 2000.

20
[17] Talonen, Jaakko; Sirola, Miki; Augilius, Eimontas. Modelling power output at nuclear power plant by neural networks. International Conference on Artificial Neural Networks (ICANN 2010). Thessaloniki, Greece, 15 - 18 September 2010.
[18] Haykin, S. Neural networks: a comprehensive foundation. Prentice Hall PTR, 1994.
[19] Ding, S.; Jia, W.; Su, C.; Xu, X.; Zhang, L. PCA-based Elman neural network algorithm. Advances in Computation and Intelligence, pp. 315-321, 2008.


9HSTFMG*afhdgb+
ISBN 978-952-60-5736-1 ISBN 978-952-60-5737-8 (pdf) ISSN-L 1799-4896 ISSN 1799-4896 ISSN 1799-490X (pdf) Aalto University Department of Information and Computer Science www.aalto.fi
BUSINESS + ECONOMY ART + DESIGN + ARCHITECTURE SCIENCE + TECHNOLOGY CROSSOVER DOCTORAL DISSERTATIONS
Aalto-S
T 7/2
014
The fault dynamics and dependencies of power plant elements and variables have been inspected to open the way for modelling and creating useful statistics to detect process faults. We have succeeded in the use of data mining to learn from industrial process and to find out dependencies between variables by Principal Component Analysis (PCA) and Self-Organizing Map (SOM) methods. Compared to traditional methods used in the control rooms the used methodologies have many advantages in the information process. The combination of data analysis and decision making has turned out to be a useful approach.
Department of Information and Computer Science
Neural methods in process monitoring, visualization and early fault detection Miki Sirola
TECHNICAL REPORT SCIENCE + TECHNOLOGY