neural basis of cognitive control over movement inhibition
TRANSCRIPT

Article
Neural Basis of Cognitive
Control over MovementInhibition: Human fMRI and PrimateElectrophysiology EvidenceHighlights
d A context-dependent stop-signal task with human fMRI and
primate neurophysiology
d Task design, data types, and analysis methods enable
dissociation of system components
d Multiple distinct parts of rVLPFC and interactions with other
brain areas required
d Context-based attention, interpretation, monitoring, but not
direct response control
Xu et al., 2017, Neuron 96, 1447–1458December 20, 2017 ª 2017 Elsevier Inc.https://doi.org/10.1016/j.neuron.2017.11.010
Authors
Kitty Z. Xu, Brian A. Anderson,
Erik E. Emeric, Anthony W. Sali,
Veit Stuphorn, Steven Yantis,
Susan M. Courtney
[email protected] (K.Z.X.),[email protected] (B.A.A.),[email protected] (E.E.E.),[email protected] (A.W.S.),[email protected] (V.S.),[email protected] (S.M.C.)
In Brief
Xu et al. present a rare combination of
complementary evidence from human
fMRI and primate neurophysiology,
demonstrating that response inhibition is
not directly accomplished by the rVLPFC,
but instead requires multiple, distinct
rVLPFC networks involving attention and
contextual stimulus interpretation.
Neuron
Article
Neural Basis of Cognitive Controlover Movement Inhibition: Human fMRIand Primate Electrophysiology EvidenceKitty Z. Xu,1,2,* Brian A. Anderson,1,3,* Erik E. Emeric,4,* Anthony W. Sali,1,5,* Veit Stuphorn,4,* Steven Yantis,1,7
and Susan M. Courtney1,4,6,8,*1Department of Psychological & Brain Sciences, Johns Hopkins University, Baltimore, MD 21218, USA2Pinterest, Inc., San Francisco, CA 94701, USA3Department of Psychology, Texas A&M University, College Station, TX 77843, USA4Department of Neuroscience, Johns Hopkins School of Medicine, Baltimore, MD 21205, USA5Center for Cognitive Neuroscience, Duke University, Durham, NC 27708, USA6F.M. Kirby Research Center for Functional Brain Imaging, Kennedy Krieger Institute, Baltimore, MD 21205, USA7This author is deceased8Lead Contact
*Correspondence: [email protected] (K.Z.X.), [email protected] (B.A.A.), [email protected] (E.E.E.), anthony.sali@duke.
edu (A.W.S.), [email protected] (V.S.), [email protected] (S.M.C.)https://doi.org/10.1016/j.neuron.2017.11.010
SUMMARY
Executive control involves the ability to flexibly inhibitor change an action when it is contextually inappro-priate. Using the complimentary techniques of hu-man fMRI and monkey electrophysiology in acontext-dependent stop signal task, we found afunctional double dissociation between the rightventrolateral prefrontal cortex (rVLPFC) and thebi-lateral frontal eye field (FEF). Different regions ofrVLPFC were associated with context-based signalmeaning versus intention to inhibit a response, whileFEF activity corresponded to success or failure of theresponse inhibition regardless of the stimulusresponse mapping or the context. These resultswere validated by electrophysiological recordingsin rVLPFC and FEF from one monkey. Inhibition of aplanned behavior is therefore likely not governed bya single brain system as had been previously pro-posed, but instead depends on two distinct neuralprocesses involving different sub-regions of therVLPFC and their interactions with other motor-related brain regions.
INTRODUCTION
A critical function of executive control is the ability to flexibly
inhibit or change a plan of action when it is contextually inappro-
priate. Human lesion and functional neuroimaging studies have
used a simple Stop Signal Task (SST) to demonstrate that the
right ventrolateral prefrontal cortex (rVLPFC) is critical for stop-
ping action. However, the specific function of rVLPFC activity
in stopping is debated. While some argue for a direct role of
rVLPFC in response inhibition (Aron et al., 2003), others have
Neu
argued for a role of this region in either guiding attention to
external events relevant to the task goal (Sharp et al., 2010; Cor-
betta and Shulman, 2002), or in encoding behaviorally relevant
task rules (Koechlin et al., 2003). It is also possible that sub-re-
gions of rVLPFC are responsible for each of the aforementioned
functionalities, giving rise to its heterogeneous roles in cognitive
control of movement inhibition (Levy and Wagner, 2011). For
example, a more dorsal and posterior region, in or near the infe-
rior frontal junction may have more stimulus processing and
attention functions, while more ventral and anterior rVLPFC
may be more directly involved in inhibiting or changing behav-
ioral responses (Chikazoe et al., 2009; Verbruggen et al., 2010;
Sebastian et al., 2016).
In a standard SST, participants execute a simple movement
(e.g., saccade or button press) following an imperative go signal
and have to cancel the planned movement when they receive an
infrequent but highly salient stop signal. While the SST examines
motor interactions between go and stop processes (Logan et al.,
1984), it is also a cognitively demanding task that involves both
attention and conflict resolution. The abrupt onset of a salient
stimulus can result in a delayed response time even when that
stimulus is irrelevant, an effect known as ‘‘attentional capture’’
(Yantis and Jonides, 1990; Yantis, 1993), and generally involves
activation of brain regions implicated in attentional control (Se-
rences et al., 2004, 2005). Furthermore, the anticipation of the
possible appearance of the stop signal introduces a high degree
of conflict and uncertainty—participants cannot know when the
stop signal will be presented and whether they will be able to
successfully stop (Botvinick et al., 2001, 2004). Taking these
features into account, it can be difficult to separate out specific
neural signals related to the cognitive demands involved in per-
forming the SST from the neural signals related to motoric inhib-
itory control. A variant of the conventional SST utilizing so-called
‘‘continue’’ trials has been used to address these concerns
(Sharp et al., 2010). The overall structure of the continue variant
of the SST (or continue SST) is the same as the conventional
SST, except that the continue signal instructs participants to
ron 96, 1447–1458, December 20, 2017 ª 2017 Elsevier Inc. 1447
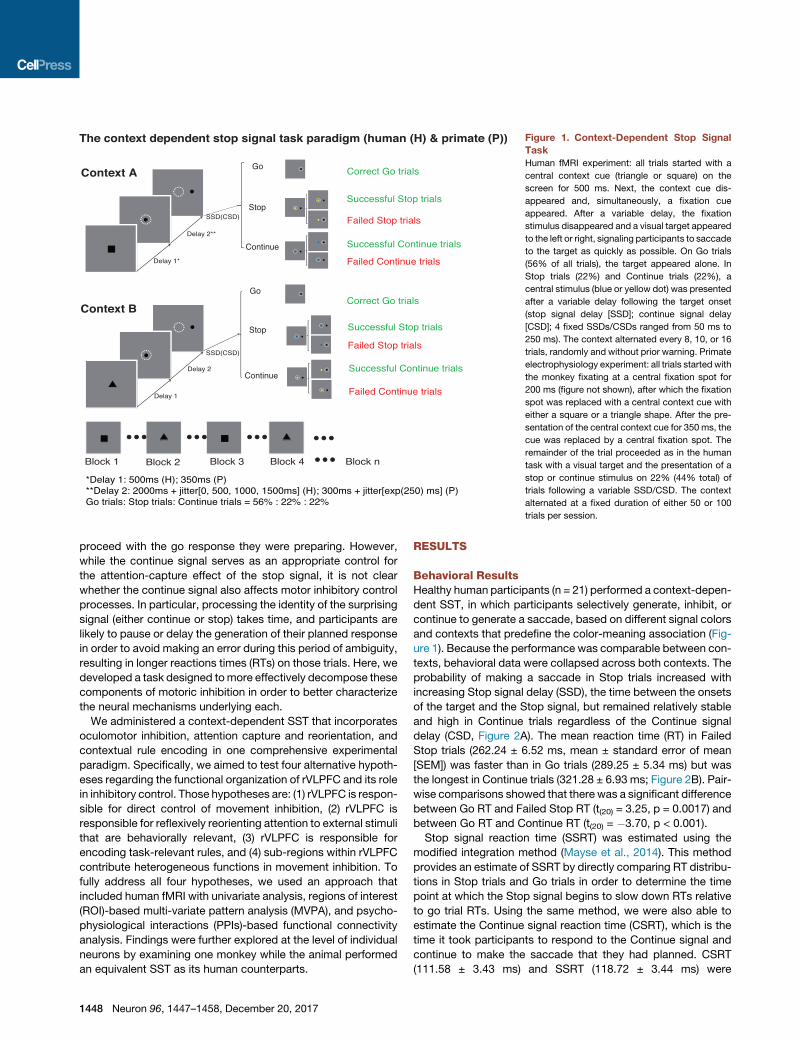
Figure 1. Context-Dependent Stop Signal
Task
Human fMRI experiment: all trials started with a
central context cue (triangle or square) on the
screen for 500 ms. Next, the context cue dis-
appeared and, simultaneously, a fixation cue
appeared. After a variable delay, the fixation
stimulus disappeared and a visual target appeared
to the left or right, signaling participants to saccade
to the target as quickly as possible. On Go trials
(56% of all trials), the target appeared alone. In
Stop trials (22%) and Continue trials (22%), a
central stimulus (blue or yellow dot) was presented
after a variable delay following the target onset
(stop signal delay [SSD]; continue signal delay
[CSD]; 4 fixed SSDs/CSDs ranged from 50 ms to
250 ms). The context alternated every 8, 10, or 16
trials, randomly and without prior warning. Primate
electrophysiology experiment: all trials started with
the monkey fixating at a central fixation spot for
200 ms (figure not shown), after which the fixation
spot was replaced with a central context cue with
either a square or a triangle shape. After the pre-
sentation of the central context cue for 350 ms, the
cue was replaced by a central fixation spot. The
remainder of the trial proceeded as in the human
task with a visual target and the presentation of a
stop or continue stimulus on 22% (44% total) of
trials following a variable SSD/CSD. The context
alternated at a fixed duration of either 50 or 100
trials per session.
proceed with the go response they were preparing. However,
while the continue signal serves as an appropriate control for
the attention-capture effect of the stop signal, it is not clear
whether the continue signal also affects motor inhibitory control
processes. In particular, processing the identity of the surprising
signal (either continue or stop) takes time, and participants are
likely to pause or delay the generation of their planned response
in order to avoid making an error during this period of ambiguity,
resulting in longer reactions times (RTs) on those trials. Here, we
developed a task designed tomore effectively decompose these
components of motoric inhibition in order to better characterize
the neural mechanisms underlying each.
We administered a context-dependent SST that incorporates
oculomotor inhibition, attention capture and reorientation, and
contextual rule encoding in one comprehensive experimental
paradigm. Specifically, we aimed to test four alternative hypoth-
eses regarding the functional organization of rVLPFC and its role
in inhibitory control. Those hypotheses are: (1) rVLPFC is respon-
sible for direct control of movement inhibition, (2) rVLPFC is
responsible for reflexively reorienting attention to external stimuli
that are behaviorally relevant, (3) rVLPFC is responsible for
encoding task-relevant rules, and (4) sub-regions within rVLPFC
contribute heterogeneous functions in movement inhibition. To
fully address all four hypotheses, we used an approach that
included human fMRI with univariate analysis, regions of interest
(ROI)-based multi-variate pattern analysis (MVPA), and psycho-
physiological interactions (PPIs)-based functional connectivity
analysis. Findings were further explored at the level of individual
neurons by examining one monkey while the animal performed
an equivalent SST as its human counterparts.
1448 Neuron 96, 1447–1458, December 20, 2017
RESULTS
Behavioral ResultsHealthy human participants (n = 21) performed a context-depen-
dent SST, in which participants selectively generate, inhibit, or
continue to generate a saccade, based on different signal colors
and contexts that predefine the color-meaning association (Fig-
ure 1). Because the performance was comparable between con-
texts, behavioral data were collapsed across both contexts. The
probability of making a saccade in Stop trials increased with
increasing Stop signal delay (SSD), the time between the onsets
of the target and the Stop signal, but remained relatively stable
and high in Continue trials regardless of the Continue signal
delay (CSD, Figure 2A). The mean reaction time (RT) in Failed
Stop trials (262.24 ± 6.52 ms, mean ± standard error of mean
[SEM]) was faster than in Go trials (289.25 ± 5.34 ms) but was
the longest in Continue trials (321.28 ± 6.93 ms; Figure 2B). Pair-
wise comparisons showed that there was a significant difference
between Go RT and Failed Stop RT (t(20) = 3.25, p = 0.0017) and
between Go RT and Continue RT (t(20) = �3.70, p < 0.001).
Stop signal reaction time (SSRT) was estimated using the
modified integration method (Mayse et al., 2014). This method
provides an estimate of SSRT by directly comparing RT distribu-
tions in Stop trials and Go trials in order to determine the time
point at which the Stop signal begins to slow down RTs relative
to go trial RTs. Using the same method, we were also able to
estimate the Continue signal reaction time (CSRT), which is the
time it took participants to respond to the Continue signal and
continue to make the saccade that they had planned. CSRT
(111.58 ± 3.43 ms) and SSRT (118.72 ± 3.44 ms) were

A B C Figure 2. Behavioral Results for the
Context-Dependent SST
(A) Inhibition function and Continue function for
one exemplar behavioral session, with the proba-
bility that the participant generated a saccade as a
function of the SSD/CSD. The black circles show
raw inhibition function, and the black line shows
Weibull-fitted inhibition function. The black di-
amonds show raw Continue function.
(B) Mean reaction time across all participants in Go
(gray), Failed Stop (black), and Continue (white)
trials.
(C) Mean Stop signal reaction time (SSRT, black)
and Continue signal reaction time (CSRT, white).
Error bars indicate SEM.
statistically indistinguishable (t(20) = �0.62, p = 0.55; Figure 2C).
These results suggest that the Continue signal and the Stop
signal required a similar amount of time for visual processing
and indistinguishably affected behavior.
fMRI ResultsUsing both voxelwise activationmagnitude contrasts andMVPA,
we attempted to identify whether any regions within the rVLPFC
had activations that were consistent with any of the previously
proposed functions of the rVLPFC.
Ventral rVLPFC Represents the Need to Stop
If rVLPFC is responsible for directly controlling movement inhi-
bition, then greater BOLD activity in this area should be
observed during successful stopping (SS) compared with
when an eye movement was generated (e.g., either Go trials
or Failed Stop [FS]). However, in contrast to these predictions,
the ventral rVLPFC demonstrated elevated activity for both SS
and FS trials when compared with Go trials (Figures 3B and
3C; Tables S1 and S2). Furthermore, MVPA was unable to reli-
ably classify the pattern of BOLD activation between SS and FS
trials in this region (accuracy = 53% ± 5%, t(20) = 0.71, p = 0.49;
darker gray bar for ventral rVLPFC in Figure 4). This suggests a
role for this region of rVLPFC in representing the intention to
stop, or in sending a response inhibition signal to FEF. The
ventral rVLPFC could also be registering the presence of the
Stop signal in order to monitor whether the response plan
was cancelled appropriately. This region of rVLPFC, however,
does not seem to be directly responsible for the actual inhibition
of the movement.
Dorsal rVLPFC Represents a Behavioral Saliency Signal
One possible interpretation of the prior analysis of stop signal-
related activity in the vLPFC, the magnitude of which was not
related to whether inhibition was successful or unsuccessful
(i.e., SS versus FS), would be that this activation reflects the pro-
cessing of a salient signal (regardless of whether it was a stop or
continue signal). If this interpretation were true, then the
Continue signal should also elicit increased BOLD activation
compared to Go trials, similar to that elicited by Stop trials. We
further compared the BOLD activity in Continue trials versus
Go trials in the same area of rVLPFC that demonstrated elevated
activity for both SS and FS trials and observed no differential
activation (Figures 3B and 3C; Table S1 and S2). This suggests
that this particular region of rVLPFC specifically represented
the presence of the Stop signal.
However, other sub-regions within rVLPFC might be involved
in the detection of a salient, behaviorally relevant event regard-
less of its specific meaning. In this case, greater BOLD activity
in this area should be observed during both Stop and Continue
trials compared to Go trials, with the Stop and Continue signals
eliciting a comparable magnitude of BOLD activation because
they share identical sensory properties. Figure 3D (Tables S3
and S4) shows a part of rVLPFC that demonstrated elevated
activity for Stop trials compared with Go trials, as well as
elevated activity for Continue trials compared with Go trials.
Furthermore, there was no activation magnitude difference
between Stop and Continue trials (Figure 3E; Table S3 and
S4), and MVPA was unable to classify SS versus FS in this
region (accuracy = 53% ± 7%, t(20) = 0.47, p = 0.64; darker
gray bar for dorsal rVLPFC in Figure 4). Interestingly, the part
of rVLPFC that showed elevated activity for both Stop and
Continue trials was centered around the dorsal part of rVLPFC,
distinct from the more ventral part of rVLPFC that showed
elevated activity uniquely to Stop trials (Figure 3A). To further
confirm that the activation patterns for Stop and Continue trials
were different for these two regions of rVLPFC, we tested for a
region by trial type interaction. A repeated-measures 2 3 2
ANOVA showed no main effect of region but did show a main
effect of trial type and, importantly, a significant interaction
effect (p < 0.05). We also tested whether the difference between
the Stop and Continue activations was significantly different
across the two regions using a paired t test, which was signifi-
cant at p < 0.01.
Dorsal rVLPFC Represents Task Context
The mapping of color to response in the task was variable, such
that each color signal served as the Continue signal or the Stop
signal on different trials, depending on context. If rVLPFC is
responsible for encoding context-based, task-relevant rules,
then patterns of activation for Stop and Continue trials should
be different, independent of the color of the signals. To test
whether this region of activation in dorsal rVLFPC is responsible
for simply detecting potentially relevant stimuli or actually codes
the relevant rules for interpreting those stimuli, we performed an
MVPA analysis. We were able to robustly classify the differential
patterns of BOLD activation for the context-specific meaning of
the signal (Stop versus Continue, accuracy = 70% ± 5%,
t(20) = 4.09, p < 0.001; light gray bar for dorsal rVLPFC in Fig-
ure 4A) but not the color of the signal (blue versus yellow, accu-
racy = 51% ± 4%, t(20) = 0.15, p = 0.88).
Neuron 96, 1447–1458, December 20, 2017 1449

A
B
D E
C
Figure 3. Human fMRI-GLM Results
(A) Areas showing greater activation (warm color) for Stop trials compared with Go trials. Red and blue circles denote the dorsal and ventral portions of the
rVLPFC, respectively.
(B) Areas showing greater activation (warm colors) for Successful Stop(SS), Failed Stop(FS), and Continue trials compared with Go trials. Red circle denotes the
ventral part of the rVLPFC. This region did not show greater activation for Continue trials compared to Go trials or for SS versus FS (third panel).
(C) Beta weights for Go trials (green), SS (red), FS(dark red), and Continue (blue).
(D) BOLD activation for Stop > Go, Continue > Go, and Stop > Continue. Red circle denotes the dorsal part of rVLPFC that showed elevated activity for both Stop
and Continue trials.
(E) Beta weights for Go trials (green), Stop trials (red), and Continue trials (blue). The mean activations for Stop and Continue trials were statistically indistin-
guishable.
FEF represents Motor Output
In both dorsal and ventral regions of rVLPFC, MVPA was unable
to reliably classify the pattern of BOLD activation between SS
and FS trials. One possible interpretation of the results could
be that the MVPA of the stop outcome was insensitive; thus,
we sought to further validate the classification methods by
applying the same MVPA to bilateral frontal eye field (FEF), an
area known to play an important role in controlling oculomotor
movement (Goldberg and Bushnell, 1981; Curtis et al., 2005;
Hanes et al., 1998). We found that MVPA was able to reliably
classify SS versus FS (i.e., the stop outcome) in this region
(accuracy = 65% ± 5%, t(20) = 2.71, p = 0.013; darker gray bar
for FEF in Figure 4), but not themeaning of the signal (accuracy =
57%± 5%, t(20) = 1.39, p = 0.18; light gray bar for FEF in Figure 4)
or the color of the signal (accuracy = 50% ± 4%, t(20) = 0.08,
p = 0.94).
1450 Neuron 96, 1447–1458, December 20, 2017
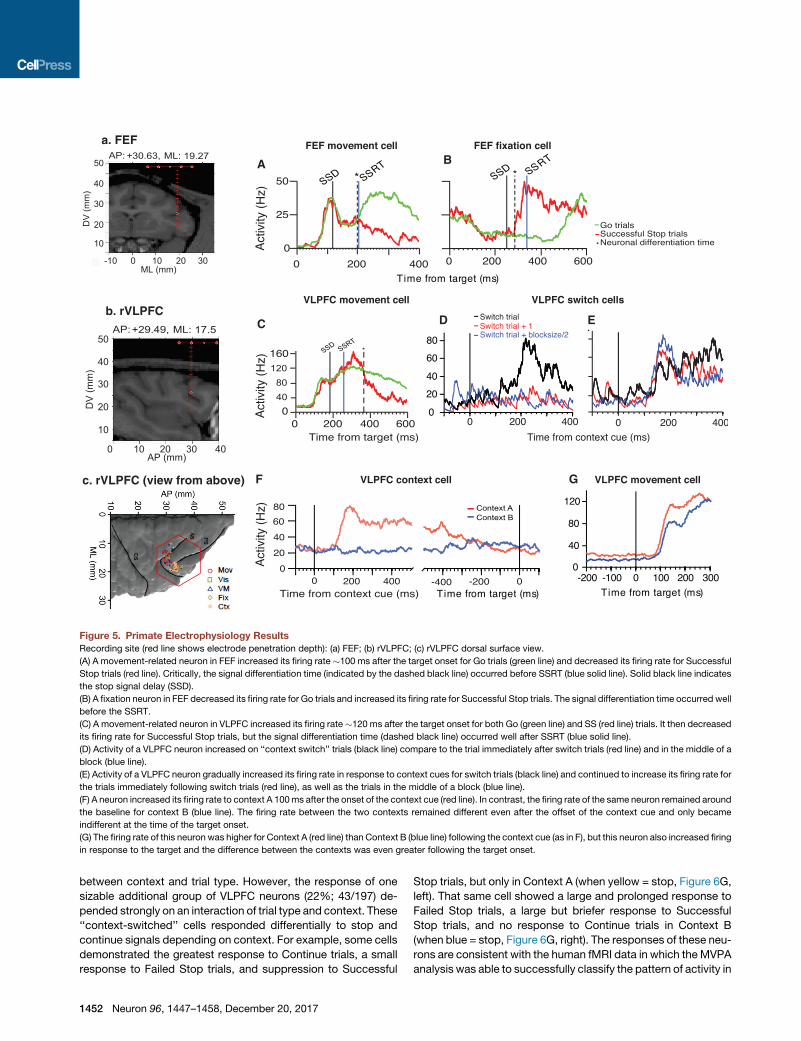
Primate Electrophysiological ResultsWe sought to further validate human fMRI findings by comparing
the results from recording single neuron activity in rVLPFC and
FEF in one macaque monkey while the animal performed a
variant of the same context-based SST as in the human neuroi-
maging experiment (Figure 1). The primate demonstrated
behavior that was similar to the human’s: the Failed Stop trials
yielded the shortest reaction times, and the reaction times in
Continue trials were longer than in the Go trials (Figure S1). Our
recording data (Figures S3–S5 showing the recording site) sug-
gested that neurons in area 45 and 44 in the right hemisphere,
a primate homolog of human rVLPFC (Petrides and Pandya
2009; Levy andWagner, 2011), encode context information (Fig-
ures 5D–5G, 5b) and monitor trial type and response (Figure 5C,
5b). On the other hand, FEF neurons encode for movement-
related activities, but not the meaning of the signal (Figures 5A

Figure 4. MVPA Classification Results
Bar graphs showing accuracies for two classification types (meaning of the
signal [Continue versus Stop, light gray bar] and stop outcome [Failed Stop
versus Successful Stop, darker gray bar]) across three brain regions (dorsal
rVLPFC, ventral rVLPFC, and bilateral FEF). Error bar indicates SEM. Classi-
fication of Continue versus Stop in the ventral rVLPFC was not attempted
because there was no significant activation in this region for Continue trials.
and 5B, 5a; Table S8 for a complete breakdown all of neuron
types and counts).
FEF movement-related neurons (see Table S8) increased their
firing rate when a saccade was generated (Go trials) and
decreased their firing rate when a saccade was successfully in-
hibited (SS trials). Critically, the signal differentiation occurred
before the SSRT (Figure 5A). In contrast, FEF fixation neurons
decreased their firing rates for Go trials and increased their firing
rates for SS trials. Again, the signal differentiation time occurred
well before the SSRT, sufficient to effectively exert inhibitory
control (Figure 5B). These results replicate previous findings
(Hanes and Schall, 1996; Hanes et al., 1998). However, FEF neu-
rons did not encode context-dependent information. The infor-
mation contained within FEF neurons was thus consistent with
the MVPA analyses of human fMRI data in this region, and the
timing of these signals was shown to be sufficient to realize
inhibition.
We found that some neurons in areas 44/45 preferentially
increased their firing rate to a particular context. Figure 5F shows
an example of a context-specific neuron that increased its firing
rate to context A (red line), but not for context B (blue line). The
firing rate between the two contexts remained different even af-
ter the offset of the context cue and only became equivalent at
the time of the target onset. In other cases, the firing rate for
the two contexts remained different long after the offset of the
context cue, and even after the onset of the target, suggesting
a strong preference for one context over the other (Figure 5G).
These context-dependent modulations could either represent a
high-level state signal or the specific behavioral rules that were
associated with a particular sensory cue during this state.
Thus, this neural phenomenon might represent a homolog of
the task-context encoding BOLD signal shown in the human
fMRI data in the dorsal rVLPFC where we found responses
reflecting the context-specific meaning of the signal but not
the color of the signal.
In addition, we also found area 45 neurons that increased
their firing rate on switch trials, when a new context replaced
the old context (Figure 5D). These neurons increased their
firing rate after the onset of a new context cue on switch trials
(black line in Figure 5D), but not for trials immediately after
switch trials (red line) and in the middle of a block (blue line).
We also found a second group of neurons in area 45 that
increased firing rate gradually following a context switch
(Figure 5E). These neurons increased their firing rate for switch
trials (black line in Figure 5E) and continued to increase their
firing rate for the trials immediately following switch trials
(red line), as well as the trials in the middle of a block (blue
line). These neurons indicate that this cortical area is
not only responsible for encoding the currently active task
set, but also controls which of multiple possible ones is
selected.
Despite this strong selectivity for context, very few rVLPFC
neurons encoded movement execution or inhibition. Among
those that showed movement-related activities, the signal
differentiation time for Go trials versus SS trials occurred after
the SSRT. These rVLPFC movement-related neurons were,
therefore, unable to exert inhibitory control in time to be consid-
ered causally related to the inhibition or initiation of the
movement (Figures 5C and S3; see STAR Methods).
Many VLPFC neurons (60%; 197/326 cells) were systemati-
cally modulated following stop and continue signals and the
behavioral response to the signal. Using a two-factor ANOVA,
we distinguished seven basic response types.
The most common group was the ‘‘classifier’’ cells (24%;
48/197). These cells are differentially active for all three trial
types. They come in two forms. One group (83%; 40/48) is
most active for Failed Stop Trials, intermediately active for
Continue Trials, and least active for Successful Stop Trials
(Figure 6A, left). The other group (17%; 8/48) shows the inverse
pattern (Figure 6A, right). The second-most-common group
were the ‘‘move’’ cells (14%; 28/197) that were strongly active
when the monkey made an eye movement (Failed Stop and
Continue Trials), but not when the monkey suppressed the
saccade on Successful Stop Trials (Figure 6B). The third-
most-common group were the ‘‘error’’ cells (12%; 24/197)
that responded only when the monkey made an erroneous
saccade on Failed Stop Trials (Figure 6C). These cells were
very similar to neurons described previously in SEF and ACC
(Stuphorn et al., 2000; Ito et al., 2003). The fourth-most-com-
mon group were ‘‘stop signal’’ cells (6%; 11/197). These cells
were only active when the monkey canceled the saccade but
were too late to be responsible for the response inhibition (Fig-
ure 6D). In addition, we found two more groups in very small
numbers (each 2%: 4/197). One group are the ‘‘attention’’
cells, which are active for all Stop and Continue Signals, inde-
pendent of context (Figure 6E). They could reflect the detec-
tion of an unexpected, rare, behaviorally significant event
that redirects attention. The other group are the ‘‘reward
expectation’’ cells that are selectively active when the monkey
produces the correct response and can expect reward
(Figure 6F).
All of the previously described groups of neuronswere charac-
terized by a specific response to the three different trial types.
Context had no effect on the vast majority of these neurons
(185/197). A few showed an additive effect of context (18/197),
but none of these neurons demonstrated an interactive effect
Neuron 96, 1447–1458, December 20, 2017 1451
A
D EC
F
B
G
a. FEF
b. rVLPFC
c. rVLPFC (view from above)
Figure 5. Primate Electrophysiology Results
Recording site (red line shows electrode penetration depth): (a) FEF; (b) rVLPFC; (c) rVLPFC dorsal surface view.
(A) A movement-related neuron in FEF increased its firing rate �100 ms after the target onset for Go trials (green line) and decreased its firing rate for Successful
Stop trials (red line). Critically, the signal differentiation time (indicated by the dashed black line) occurred before SSRT (blue solid line). Solid black line indicates
the stop signal delay (SSD).
(B) A fixation neuron in FEF decreased its firing rate for Go trials and increased its firing rate for Successful Stop trials. The signal differentiation time occurred well
before the SSRT.
(C) A movement-related neuron in VLPFC increased its firing rate�120 ms after the target onset for both Go (green line) and SS (red line) trials. It then decreased
its firing rate for Successful Stop trials, but the signal differentiation time (dashed black line) occurred well after SSRT (blue solid line).
(D) Activity of a VLPFC neuron increased on ‘‘context switch’’ trials (black line) compare to the trial immediately after switch trials (red line) and in the middle of a
block (blue line).
(E) Activity of a VLPFC neuron gradually increased its firing rate in response to context cues for switch trials (black line) and continued to increase its firing rate for
the trials immediately following switch trials (red line), as well as the trials in the middle of a block (blue line).
(F) A neuron increased its firing rate to context A 100ms after the onset of the context cue (red line). In contrast, the firing rate of the same neuron remained around
the baseline for context B (blue line). The firing rate between the two contexts remained different even after the offset of the context cue and only became
indifferent at the time of the target onset.
(G) The firing rate of this neuron was higher for Context A (red line) than Context B (blue line) following the context cue (as in F), but this neuron also increased firing
in response to the target and the difference between the contexts was even greater following the target onset.
between context and trial type. However, the response of one
sizable additional group of VLPFC neurons (22%; 43/197) de-
pended strongly on an interaction of trial type and context. These
‘‘context-switched’’ cells responded differentially to stop and
continue signals depending on context. For example, some cells
demonstrated the greatest response to Continue trials, a small
response to Failed Stop trials, and suppression to Successful
1452 Neuron 96, 1447–1458, December 20, 2017
Stop trials, but only in Context A (when yellow = stop, Figure 6G,
left). That same cell showed a large and prolonged response to
Failed Stop trials, a large but briefer response to Successful
Stop trials, and no response to Continue trials in Context B
(when blue = stop, Figure 6G, right). The responses of these neu-
rons are consistent with the human fMRI data in which the MVPA
analysis was able to successfully classify the pattern of activity in

A B
C D E
F G
Figure 6. Neuronal Responses to Stop and
Continue Signals
The activity of exemplary VLPFC neurons illus-
trating the seven response patterns to Stop and
Continue signals. Each panel shows the activity of
an individual neuron following Successful Stop
signal trials (solid bold line), Failed Stop signal trials
(dotted bold line), and following Continue signals
(fine line). All histograms are aligned on Stop/
Continue signal onset.
(A) Activity of a ‘‘classifier’’ cell that shows a dif-
ferential activity for all three trial types. Classifier
cells come in two forms. One group (shown in the
left panel) is most active for Failed Stop Trials,
intermediately active for Continue Trials, and least
active for Successful Stop. The other group
(indicated in the right panel) shows the inverse
pattern.
(B) Activity of a ‘‘move’’ cell that is most active,
when the monkey generates a saccade.
(C) Activity of an ‘‘error’’ cell that is most active
when the monkey generates an erroneous
saccade despite the presence of a stop signal.
(D) Activity of a ‘‘stop signal’’ cell that is most
active, when the monkey successfully cancels the
saccade in the presence of a stop signal.
(E) Activity of an ‘‘attention’’ cell that responds
equally to all unexpected Stop or Continue signals.
(F) Activity of a ‘‘reward expectation’’ cell that
responds whenever the monkey responds suc-
cessfully to an unexpected event and can expect
reward.
(G) Activity of a ‘‘context-switched’’ cell that re-
sponds differently to stop and continue signals
depending on context. The two different panels
show the response pattern of the same cell during
context A (left, yellow = stop) and B (right,
blue = stop).
dorsal rVLPFC, according to the meaning but not the color of the
stimuli, indicating multiplexed coding of color and context.
Importantly, all of these responses appeared well after the
SSRT/CSRT elapsed (average SSRT/CSRT: 80 ± 11 ms
after stop signal onset; average neuronal response onset:
225 ± 98 ms after stop signal onset) and therefore could not
cause the behavioral response to the stop or continue signals.
These results, therefore, suggest that these rVLPFC move-
ment-related neurons may have been monitoring movement
rather than executing inhibitory control prior to the movement
(Stuphorn et al., 2000; Ito et al., 2003).
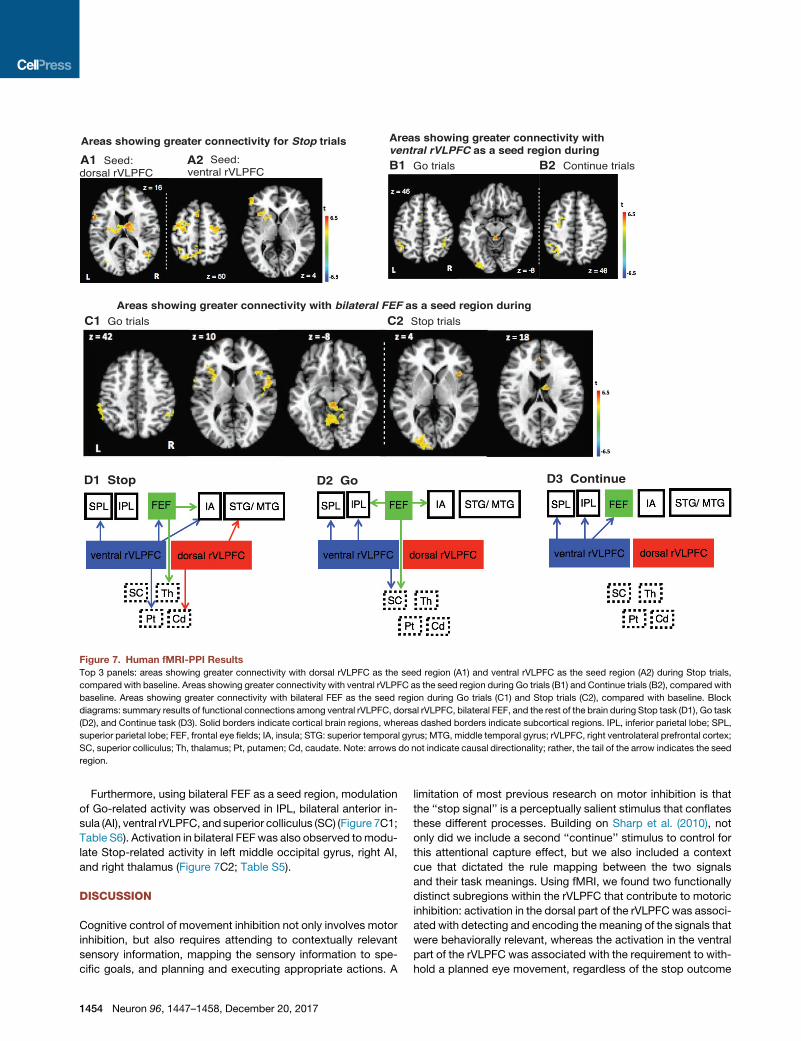
Functional Interactions Between human rVLPFC and
Other Regions Involved in Movement Control
A PPI-based analysis tests the hypothesis that activity in one
brain region can be explained by an interaction between the
presence of a cognitive process (i.e., psychological effect, the
experimental task manipulation) and activity in another part of
the brain (i.e., physiological effect; McLaren et al., 2012; Cisler
et al., 2013). In the current study, we applied a PPI analysis to
test the task-dependent functional connectivity (FC) among
ventral rVLPFC, dorsal rVLPFC, and FEF during Go, Stop, and
Continue trials and further explore the possible influence these
regions may also have on other parts of the brain that were not
defined a priori.
We found that using the dorsal part of rVLPFC as a seed region
modulating Stop-related activity, significant task-dependent FC
was observed in caudate and middle temporal gyrus (MTG; Fig-
ure 7A1; see Table S5 for a complete list of areas). In contrast,
using the ventral part of rVLPFC as a seed region modulating
Stop-related activity, significant task-dependent FC was
observed with bilateral frontal eye field (FEF), left superior parie-
tal lobule (SPL), and left putamen (Figure 7A2; Table S5).
In contrast, activity in the ventral part of rVLPFC significantly
modulated Go-related activity in inferior parietal lobule (IPL),
superior parietal lobe (SPL), and superior colliculus (SC) (Fig-
ure 7B1; see Table S6 for a complete list of areas). Activation
in the ventral part of rVLPFC also was observed to modulate
Continue-related activity in FEF, IPL, and SPL (Figure 7B2;
see Table S7 for a complete list of areas). No significant
modulation was observed when using the dorsal part of right
VLPFC as the seed region for the Go- or Continue-related
activity.
Neuron 96, 1447–1458, December 20, 2017 1453
A1 A2 B1 B2
C1 C2
D1 Stop D3 ContinueD2 Go
Figure 7. Human fMRI-PPI Results
Top 3 panels: areas showing greater connectivity with dorsal rVLPFC as the seed region (A1) and ventral rVLPFC as the seed region (A2) during Stop trials,
compared with baseline. Areas showing greater connectivity with ventral rVLPFC as the seed region during Go trials (B1) and Continue trials (B2), compared with
baseline. Areas showing greater connectivity with bilateral FEF as the seed region during Go trials (C1) and Stop trials (C2), compared with baseline. Block
diagrams: summary results of functional connections among ventral rVLPFC, dorsal rVLPFC, bilateral FEF, and the rest of the brain during Stop task (D1), Go task
(D2), and Continue task (D3). Solid borders indicate cortical brain regions, whereas dashed borders indicate subcortical regions. IPL, inferior parietal lobe; SPL,
superior parietal lobe; FEF, frontal eye fields; IA, insula; STG: superior temporal gyrus; MTG, middle temporal gyrus; rVLPFC, right ventrolateral prefrontal cortex;
SC, superior colliculus; Th, thalamus; Pt, putamen; Cd, caudate. Note: arrows do not indicate causal directionality; rather, the tail of the arrow indicates the seed
region.
Furthermore, using bilateral FEF as a seed region, modulation
of Go-related activity was observed in IPL, bilateral anterior in-
sula (AI), ventral rVLPFC, and superior colliculus (SC) (Figure 7C1;
Table S6). Activation in bilateral FEFwas also observed tomodu-
late Stop-related activity in left middle occipital gyrus, right AI,
and right thalamus (Figure 7C2; Table S5).
DISCUSSION
Cognitive control of movement inhibition not only involves motor
inhibition, but also requires attending to contextually relevant
sensory information, mapping the sensory information to spe-
cific goals, and planning and executing appropriate actions. A
1454 Neuron 96, 1447–1458, December 20, 2017
limitation of most previous research on motor inhibition is that
the ‘‘stop signal’’ is a perceptually salient stimulus that conflates
these different processes. Building on Sharp et al. (2010), not
only did we include a second ‘‘continue’’ stimulus to control for
this attentional capture effect, but we also included a context
cue that dictated the rule mapping between the two signals
and their task meanings. Using fMRI, we found two functionally
distinct subregions within the rVLPFC that contribute to motoric
inhibition: activation in the dorsal part of the rVLPFC was associ-
ated with detecting and encoding the meaning of the signals that
were behaviorally relevant, whereas the activation in the ventral
part of the rVLPFC was associated with the requirement to with-
hold a planned eye movement, regardless of the stop outcome

(see also Erika-Florence et al., 2014). The dorsal rVLPFC in our
human study roughly corresponds to BA 45B and 44, whereas
the ventral part of rVLPFC roughly corresponds to BA 45A and
47 (Levy and Wagner, 2011).
Furthermore, we found that the frontal eye field (FEF), an ocu-
lomotor area controlling eye movements, encoded information
regarding motor output but not the meaning of the signals or
the appropriate intended behavior separate from behavioral
outcome. These results replicate and extend a previous study
using a different type of saccadic control task (Thakkar et al.,
2014). That study also found a functional distinction between
the FEF and the rVLPFC, with the FEF playing a more direct
role inmotor control and the rVLPFC demonstratingmore activa-
tion related to inhibition, redirection, and/or attention capture.
The current study design enabled a more thorough characteriza-
tion of these functional distinctions. Unlike the previous study,
the current study did not indicate a role for SEF in either the
fMRI activation magnitude or connectivity results. This is likely
due to the greater working memory demands of our context-
dependent stop signal task. Previous research has shown a
distinction between pre-SMA activation in a (manual) simple
Go-NoGo task but DLPFC activation in a more working memory
demanding Go-NoGo task (Mostofsky et al., 2003).
Primate electrophysiological recordings further validated our
human fMRI results by showing that FEF neurons carried activity
sufficient to control whether or not an eye movement was
executed or inhibited, but not the meaning of the signals. On
the other hand, neurons in area 44/45 in the right hemisphere
encoded context information by either selectively increasing
their firing rate to a particular context or by increasing their firing
rate at the time of context switching.
This failure to identify ‘‘inhibition-related’’ activity may seem to
be at odds with findings in previous monkey studies (Sakagami
et al., 2001) that have been argued to be a homolog of an inhibi-
tion-specific inferior frontal cortex region (IFC) (Aron et al., 2014).
However, these previous findings inmonkey PFC did not support
unequivocally a causal role of VLPFC in response inhibition.
Most studies use a go/no-go task, in which three cognitive func-
tions were confounded: the representation of the task rules,
detection of response cues, and control of behavior (preparation
or suppression of actions). It is therefore not possible to deter-
mine which specific functional signals were encoded by the
neuronal activity (Sakagami et al., 2001). The same is true for
another study that is often cited as evidence for a role of prefron-
tal cortex in inhibition, because the experimental design
confounds inhibition and spatial working memory. In contrast,
our experimental design explicitly distinguishes these different
processes. In addition, most of these recording and stimulation
studies were performed in and around the principal sulcus, but
not in the area that is likely the homolog of the human IFC. The
only other study in VLPFC (area 45) shows neuronal activity
that distinguishes go from no-go cues but no activity during
the actual execution of the go or no-go response (Sakagami
et al., 2001). These results support our conclusion that VLPFC
encodes context-dependent stimulus-response associations
but is not directly responsible for inhibiting behavioral responses.
Lastly, we do find clear inhibition-related signals, but they are
located in FEF, not VLPFC.
In this context, it is an important question whether we re-
corded in the section of the primate prefrontal cortex that is
the homolog of human rVLPFC. Our own fMRI study agrees
with a recent a meta-analysis that indicates a spatially extensive
right VLPFC response during response inhibition, which included
portions of both pars opercularis (BA 44) and pars triangularis
(BA 45) (Levy and Wagner, 2011). Cytoarchitectonic studies in
macaque monkeys show a dysgranular cortical area that ex-
hibits the characteristics of area 44 of the human brain (Petrides
and Pandya, 2002, 2009; Petrides et al., 2012; Petrides, 2005).
This monkey homolog of BA 44 lies anterior to ventral area 6
and is buried mostly in the most ventral part of the posterior
bank and in the fundus of the inferior branch of the arcuate sul-
cus. Immediately rostral to this area, starting in the anterior
bank of the inferior branch of the arcuate sulcus, there is another
cortical area that exhibits the characteristics of area 45 of the
human brain. We recorded in the anterior bank and the fundus
of the arcuate sulcus (see Figures S3–S5), which represent the
monkey homolog of BA 45 and partially of BA 44, corresponding
to the brain region that is most likely similar to the human VLPFC
region active during response inhibition. In this region, we found
a large number of neurons in the monkey that were active during
the stop signal task and would have resulted in a strong BOLD
response.
Thus, both the primate electrophysiology and human fMRI
data indicate that the rVLPFC codes for contextual information.
The monkey context coding in rVLPFC was evident through
both selective neural responses time locked to the context cue
(which was not evident in the human BOLD fMRI activity) and
in interactions between context and trial-type selective re-
sponses. In the human data, context coding was demonstrated
via the context effect on the pattern of BOLD fMRI activity in
response to the continue signals. The particular stimulus that
indicated that a participant was to continue making the planned
saccade was different in one context versus the other. Thus, in
both the human and monkey data, rVLPFC contextual informa-
tion appears to be multiplexed with stimulus information in order
to convey stimulus meaning. The differences between monkey
and human context-related activity modulations might be due
to differences in recording technique. The neurons in the human
rVLPFC may also respond differentially to the context cues, thus
coding context independent of the stop and continue stimuli, but
the BOLD fMRI signalsmay not have been strong enough or spe-
cific enough to detect these responses. Alternatively, there may
be species differences. In addition, it is not clear whether the re-
gion in the monkey VLPFC from which we collected data in the
current study corresponds to the dorsal or the ventral portion
of the human VLPFC, or from both, since the border between
these functionally distinct regions appears to be within area 45.
PPI analysis of human fMRI data demonstrated that dorsal
rVLPFC modulated areas of the brain that are known to be part
of the ‘‘attention-breaker’’ network (Corbetta and Shulman,
2002) during Stop trials, whereas ventral rVLPFC modulated
areas of the brain, including FEF, that are known to be part of
the goal-directed attention network and oculomotor control
system (Corbetta and Shulman, 2002). Together these results
suggest that the rVLPFC supports heterogeneous cognitive
functions through interacting with multiple distributed networks
Neuron 96, 1447–1458, December 20, 2017 1455

in the control of movement inhibition, while actual stopping is
realized by the motor system through interactions with rVLPFC.
This distinction between different rVLPFC regions based on
functional connectivity is consistent with a previous study
demonstrating distinct VLPFC regions based on anatomical con-
nectivity in monkeys (Gerbella et al., 2010).
To control for the attentional capture effect of the Stop signal,
Sharp et al. (2010) introduced Continue signal trials into the con-
ventional SST and found that right inferior frontal gyrus (rIFG),
which is equivalent to part of the rVLPFC, was active for both
Stop and Continue signals, but pre-SMA was more active for
Stop trials compared to Continue trials. The authors concluded
that pre-SMA is associated with response inhibition, whereas
rIFG is associated with attentional capture. Pre-SMA is respon-
sible for controlling skeletomotor movement, whereas FEF is
responsible for controlling eye movement. In agreement with
this difference in cortical areas activated across the two studies,
the Sharp et al. (2010) task involved finger button press
responses while ours involved saccadic eye movements. In
this regard, our BOLD activation results in FEF and rVLPFC com-
plement the findings from the Sharp et al. (2010) study.
Importantly, our study also extended Sharp et al. (2010) by
introducing a third level of control, the context manipulation,
such that the meaning of a salient color stimulus was indicated
by a context cue at the beginning of the trial. We found that
not only was the BOLD response in dorsal rVLPFC associated
with both signals’ presence, but it also encoded the meaning
of the signal. Thus, our findings suggest that rVLPFC encodes
abstract information regarding the meaning of a particular stim-
ulus in a given context, rather than simply sensory information
per se.
We speculate that instead of directly exerting control over mo-
tor inhibition, the ventral part of rVLPFC is responsible for regis-
tering the intention to stop, or updating the action plan, given the
current context and stimulus. Our results were not in complete
agreement with Levy andWagner’s meta-analysis for the relative
spatial locations among rVLPFC subregions. Our results identi-
fied two, rather than three, subregions along the dorsal-ventral
axis, with dorsal rVLPFC supporting attentional orienting and
task rule encoding, and ventral rVLPFC supporting stopping.
This difference between the two studies could be attributed to
the fact that in Levy and Wagner (2011)’s meta-analysis, the
authors included Posner Cueing and Oddball tasks that particu-
larly manipulated response uncertainty independent of response
inhibition. Moreover, the large volume of studies that were
included in the analysis increased the likelihood of identifying
more regions showing task-related activation. Nevertheless,
both studies support the argument that sub-regions within
rVLPFC contribute heterogeneous functions in cognitive control
of movement inhibition. These subdivisions within rVLPFC may
need to be further delineated for eye versus hand movement
inhibition as indicated in a previous study directly comparing
the two (Leung and Cai, 2007).
One possible explanation for the above chance classification
for Continue and Stop signals in dorsal rVLPFC might be that
the results were driven by the differential feedback that partici-
pants received during the experiment. The mean accuracy for
the Stop trials was around 50% due to task manipulation, and
1456 Neuron 96, 1447–1458, December 20, 2017
the average accuracy for the Continue trials was above 90%.
However, if the classification results were driven by the feedback
alone, then one should, by definition, be able to classify
Successful Stop (SS) trials versus Failed Stop (FS) trials in this re-
gion as well. MVPA performance on classifying stop outcome in
dorsal (also in ventral) rVLPFC was at chance level, which ruled
out an explanation due solely to feedback processing. Further-
more, we used the frontal eye field (FEF) to benchmark the find-
ings in rVLPFC. Our MVPA results suggested that FEF contains
information regarding the stop outcome, but not the meaning
of the signal. These results were consistent with existing knowl-
edge on FEF’s role in oculomotor control (Schiller et al., 1987;
Bruce and Goldberg, 1985; Hanes et al., 1998; Schall and
Thompson, 1999).
Corbetta and Shulman (2002) argued for two different atten-
tional networks with one that involves preparing and applying
goal-directed or ‘‘top-down’’ control of stimulus and response
selection, and another that involves detecting behaviorally rele-
vant stimuli with high saliency and especially when they appear
unexpectedly. The authors termed this latter network the
‘‘circuit-breaking’’ network. The top-down control network
includes part of the intraparietal sulcus (IPS) and superior frontal
cortex, including the frontal eye field (FEF); the ‘‘circuit-breaking’’
network is mostly lateralized to the right hemisphere, which in-
cludes temporoparietal junction (TPJ) and the ventral frontal cor-
tex (VFC), together forming the right ventral frontoparietal
network (Corbetta and Shulman, 2002). Our PPI results showed
that FEF and SPL were recruited through connection with ventral
rVLPFC during Go and Stop tasks to exert control of eye move-
ments—either to initiate or inhibit a saccade. In addition, dorsal
rVLPFC was functionally connected with superior temporal
gyrus (STG) and MTG during Stop trials, presumably because
the Stop signal was behaviorally relevant, with a high visual sa-
liency and appeared unexpectedly. In this sense, the dorsal
rVLPFC, STG, and MTG served as a ventral attentional circuit-
breaker to interrupt goal-directed attentional control during
stopping.
Erika-Florence et al. (2014) found that rVLPFC subregions
were not functionally unique in their sensitivities to inhibitory con-
trol but instead formed distributed networks that were active
when infrequent stimuli appeared, regardless of whether inhibi-
tory control was needed, or whenever novel stimuli appeared
that led to new response adjustment as opposed to predictable
or routine responses. The authors thus concluded that there is
no specific module in the prefrontal cortex that is dedicated to
inhibitory control, but rather, response inhibition is an emergent
property of a distributed network in the brain that instantiates
cognitive control (Erika-Florence et al., 2014). A similar conclu-
sion was drawn by Verbruggen et al. (2010), who found that
transcranial magnetic stimulation to a ventral portion of rVLPFC
disrupted both stopping behavior and dual-task performance.
There is evidence in our study that further supports these inter-
pretations of the role of rVLPFC in inhibitory control. We found
that ventral rVLPFC was functionally connected with the puta-
men while the dorsal rVLPFC was functionally connected with
the caudate during stop-related processes, suggesting a poten-
tial cognitive versus motor functional dissociation. Second,
ventral rVLPFC is connected with SCduringGo trials, suggesting

a role in reflexive, expectedmotor execution, not just in inhibitory
motor control. Furthermore, ventral rVLPFC modulated FEF
activity not only during Stop trials but also during Continue trials.
These results support the idea that ventral and dorsal rVLPFC
are functionally distinct parts of a set of distributed networks
that broadly underlies cognitive control, rather than response
inhibition specifically.
In conclusion, our findings indicate multiple brain areas
involved in multiple complex and task-dependent circuits, all of
which contribute to context-dependent and stimulus-selective
control of behavior. Within this complex network, the role of
VLPFC seems to be the encoding of context-specific task rules
and the detection or monitoring of the need for response inhibi-
tion, but not its initiation or instantiation.
STAR+METHODS
Detailed methods are provided in the online version of this paper
and include the following:
d KEY RESOURCES TABLE
d CONTACT FOR REAGENT AND RESOURCE SHARING
d EXPERIMENTAL MODEL AND SUBJECT DETAILS
B Human fMRI experiment
B Primate electrophysiology experiment
d METHOD DETAILS
B Human fMRI experiment
B Primate electrophysiology experiment
d QUANTIFICATION AND STATISTICAL ANALYSIS
B Human fMRI experiment
B Primate electrophysiology experiment
d DATA AND SOFTWARE AVAILABILITY
SUPPLEMENTAL INFORMATION
Supplemental Information includes five figures and eight tables and can be
found with this article online at https://doi.org/10.1016/j.neuron.2017.11.010.
AUTHOR CONTRIBUTIONS
K.Z.X. helped design the experiments, collected fMRI and electrophysiological
data, analyzed data, and wrote the manuscript. B.A.A. and A.W.S. helped with
fMRI data analysis and editing the manuscript. V.S. helped design the exper-
iments. E.E.E. and V.S. helped with electrophysiology data collection and anal-
ysis and with editing the manuscript. S.Y. helped design the experiments and
with fMRI data collection. S.M.C. helpedwith fMRI data analysis, interpretation
and comparison across human and monkey experiments, and editing the
manuscript.
ACKNOWLEDGMENTS
The authors thank the entire staff of the F.M. Kirby Research Center for Func-
tional Brain Imaging where the fMRI data were collected. This work was sup-
ported by grants from the National Institute in Drug Abuse R01-DA013165 to
S.Y. and S.M.C., from the National Institute of Neurological Disorders and
Stroke (NINDS) R01NS086104, and the National Institute on Drug Abuse
(NIDA) RO1DA040990 to V.S.
Received: March 18, 2017
Revised: July 21, 2017
Accepted: November 8, 2017
Published: December 7, 2017
REFERENCES
Aron, A.R., Fletcher, P.C., Bullmore, E.T., Sahakian, B.J., and Robbins, T.W.
(2003). Stop-signal inhibition disrupted by damage to right inferior frontal gyrus
in humans. Nat. Neurosci. 6, 115–116.
Aron, A.R., Robbins, T.W., and Poldrack, R.A. (2014). Right inferior frontal cor-
tex: addressing the rebuttals. Front. Hum. Neurosci 8, 905.
Asaad,W.F., and Eskandar, E.N. (2008). A flexible software tool for temporally-
precise behavioral control in Matlab. J. Neurosci. Methods 174, 245–258.
Botvinick, M.M., Braver, T.S., Barch, D.M., Carter, C.S., and Cohen, J.D.
(2001). Conflict monitoring and cognitive control. Psychol. Rev. 108, 624–652.
Botvinick, M.M., Cohen, J.D., and Carter, C.S. (2004). Conflict monitoring and
anterior cingulate cortex: an update. Trends Cogn. Sci. 8, 539–546.
Bradley, A., Skottun, B.C., Ohzawa, I., Sclar, G., and Freeman, R.D. (1987).
Visual orientation and spatial frequency discrimination: a comparison of single
neurons and behavior. J. Neurophysiol. 57, 755–772.
Britten, K.H., Shadlen, M.N., Newsome, W.T., and Movshon, J.A. (1992). The
analysis of visual motion: a comparison of neuronal and psychophysical per-
formance. J. Neurosci. 12, 4745–4765.
Brown, J.W., Hanes, D.P., Schall, J.D., and Stuphorn, V. (2008). Relation of
frontal eye field activity to saccade initiation during a countermanding task.
Exp. Brain Res. 190, 135–151.
Bruce, C.J., andGoldberg,M.E. (1985). Primate frontal eye fields. I. Single neu-
rons discharging before saccades. J. Neurophysiol. 53, 603–635.
Chang, C.C., and Lin, C.J. (2001). LIBSVM: A Library for Support Vector
Machines (Online). http://www.csie.ntu.edu.tw/_cjlin/libsvm.
Chikazoe, J., Jimura, K., Asari, T., Yamashita, K., Morimoto, H., Hirose, S.,
Miyashita, Y., and Konishi, S. (2009). Functional dissociation in right inferior
frontal cortex during performance of go/no-go task. Cereb. Cortex 19,
146–152.
Cisler, J.M., Bush, K., and Steele, J.S. (2013). A comparison of statistical
methods for detecting context-modulated functional connectivity in fMRI.
NeuroImage 84, 1042–1052.
Connolly, J.D., Goodale, M.A., Goltz, H.C., and Munoz, D.P. (2005). fMRI acti-
vation in the human frontal eye field is correlated with saccadic reaction time.
J. Neurophysiol. 94, 605–611.
Corbetta, M., and Shulman, G.L. (2002). Control of goal-directed and stimulus-
driven attention in the brain. Nat. Rev. Neurosci. 3, 201–215.
Courtney, S.M., Ungerleider, L.G., Keil, K., and Haxby, J.V. (1996). Object and
spatial visual working memory activate separate neural systems in human cor-
tex. Cereb. Cortex 6, 39–49.
Cox, R.W. (1996). AFNI: software for analysis and visualization of functional
magnetic resonance neuroimages. Comput. Biomed. Res. 29, 162–173.
Curtis, C.E., Cole, M.W., Rao, V.Y., and D’Esposito, M. (2005). Canceling
planned action: an FMRI study of countermanding saccades. Cereb. Cortex
15, 1281–1289.
Egan, J.P. (1975). Signal Detection Theory and ROC Analysis
(Academic Press).
Erika-Florence, M., Leech, R., and Hampshire, A. (2014). A functional network
perspective on response inhibition and attentional control. Nat. Commun.
5, 4073.
Gerbella, M., Belmalih, A., Borra, E., Rozzi, S., and Luppino, G. (2010). Cortical
connections of the macaque caudal ventrolateral prefrontal areas 45A and
45B. Cereb. Cortex 20, 141–168.
Goldberg, M.E., and Bushnell, M.C. (1981). Behavioral enhancement of visual
responses in monkey cerebral cortex. II. Modulation in frontal eye fields spe-
cifically related to saccades. J. Neurophysiol. 46, 773–787.
Green, D.M., and Swets, J.A. (1966). Signal Detection Theory and
Psychophysics, Volume 1 (New York Press), p. 521.
Guido, W., Lu, S.M., Vaughan, J.W., Godwin, D.W., and Sherman, S.M. (1995).
Receiver operating characteristic (ROC) analysis of neurons in the cat’s lateral
Neuron 96, 1447–1458, December 20, 2017 1457
geniculate nucleus during tonic and burst response mode. Vis. Neurosci. 12,
723–741.
Hanes, D.P., and Schall, J.D. (1996). Neural control of voluntary movement
initiation. Science 274, 427–430.
Hanes, D.P., Patterson, W.F., 2nd, and Schall, J.D. (1998). Role of frontal eye
fields in countermanding saccades: visual, movement, and fixation activity.
J. Neurophysiol. 79, 817–834.
Hanke, M., Halchenko, Y.O., Sederberg, P.B., Hanson, S.J., Haxby, J.V., and
Pollmann, S. (2009). PyMVPA: A python toolbox for multivariate pattern anal-
ysis of fMRI data. Neuroinformatics 7, 37–53.
Ito, S., Stuphorn, V., Brown, J.W., and Schall, J.D. (2003). Performance moni-
toring by the anterior cingulate cortex during saccade countermanding.
Science 302, 120–122.
Jenkinson, M., Beckmann, C.F., Behrens, T.E., Woolrich, M.W., and Smith,
S.M. (2012). FSL. Neuroimage 62, 782–790.
Koechlin, E., Ody, C., and Kouneiher, F. (2003). The architecture of cognitive
control in the human prefrontal cortex. Science 302, 1181–1185.
Leung, H.C., and Cai, W. (2007). Common and differential ventrolateral pre-
frontal activity during inhibition of hand and eye movements. J. Neurosci. 27,
9893–9900.
Levy, B.J., and Wagner, A.D. (2011). Cognitive control and right ventrolateral
prefrontal cortex: reflexive reorienting, motor inhibition, and action updating.
Ann. N Y Acad. Sci. 1224, 40–62.
Logan, G.D., Cowan, W.B., and Davis, K.A. (1984). On the ability to inhibit sim-
ple and choice reaction time responses: a model and a method. J. Exp.
Psychol. Hum. Percept. Perform. 10, 276–291.
Macmillan, N.A., and Creelman, C.D. (2004). Detection Theory: A User’s Guide
(Psychology Press).
Mayse, J.D., Nelson, G.M., Park, P., Gallagher, M., and Lin, S.-C. (2014).
Proactive and reactive inhibitory control in rats. Front. Neurosci. 8, 104.
McLaren, D.G., Ries, M.L., Xu, G., and Johnson, S.C. (2012). A generalized
form of context-dependent psychophysiological interactions (gPPI): a com-
parison to standard approaches. Neuroimage 61, 1277–1286.
Mostofsky, S.H., Schafer, J.G., Abrams, M.T., Goldberg, M.C., Flower, A.A.,
Boyce, A., Courtney, S.M., Calhoun, V.D., Kraut, M.A., Denckla, M.B., and
Pekar, J.J. (2003). fMRI evidence that the neural basis of response inhibition
is task-dependent. Brain Res. Cogn. Brain Res. 17, 419–430.
Norman, K.A., Polyn, S.M., Detre, G.J., and Haxby, J.V. (2006). Beyond mind-
reading: multi-voxel pattern analysis of fMRI data. Trends Cogn. Sci. 10,
424–430.
Pare, M., and Hanes, D.P. (2003). Controlled movement processing: superior
colliculus activity associated with countermanded saccades. J. Neurosci. 23,
6480–9.
Petrides, M. (2005). Lateral prefrontal cortex: architectonic and functional
organization. Philos. Trans. R. Soc. Lond. B Biol. Sci. 360, 781–795.
Petrides,M., and Pandya, D.N. (2002). Comparative cytoarchitectonic analysis
of the human and the macaque ventrolateral prefrontal cortex and corticocort-
ical connection patterns in the monkey. Eur. J. Neurosci. 16, 291–310.
Petrides,M., and Pandya, D.N. (2009). Distinct parietal and temporal pathways
to the homologues of Broca’s area in the monkey. PLoS Biol. 7, e1000170.
Petrides, M., Tomaiuolo, F., Yeterian, E.H., and Pandya, D.N. (2012). The pre-
frontal cortex: comparative architectonic organization in the human and the
macaque monkey brains. Cortex 48, 46–57.
1458 Neuron 96, 1447–1458, December 20, 2017
Sakagami, M., Tsutsui, K., Lauwereyns, J., Koizumi, M., Kobayashi, S., and
Hikosaka, O. (2001). A code for behavioral inhibition on the basis of color,
but not motion, in ventrolateral prefrontal cortex of macaque monkey.
J. Neurosci. 21, 4801–4808.
Sayer, R.J., Friedlander, M.J., and Redman, S.J. (1990). The time course and
amplitude of EPSPs evoked at synapses between pairs of CA3/CA1 neurons in
the hippocampal slice. J. Neurosci. 10, 826–836.
Schall, J.D., and Thompson, K.G. (1999). Neural selection and control of visu-
ally guided eye movements. Annu. Rev. Neurosci. 22, 241–259.
Schiller, P.H., Sandell, J.H., and Maunsell, J.H. (1987). The effect of frontal eye
field and superior colliculus lesions on saccadic latencies in the rhesus mon-
key. J. Neurophysiol. 57, 1033–1049.
Sebastian, A., Jung, P., Neuhoff, J., Wibral, M., Fox, P.T., Lieb, K., Fries, P.,
Eickhoff, S.B., T€uscher, O., and Mobascher, A. (2016). Dissociable attentional
and inhibitory networks of dorsal and ventral areas of the right inferior frontal
cortex: a combined task-specific and coordinate-based meta-analytic fMRI
study. Brain Struct. Funct. 221, 1635–1651.
Serences, J.T., Schwarzbach, J., Courtney, S.M., Golay, X., and Yantis, S.
(2004). Control of object-based attention in human cortex. Cereb. Cortex 14,
1346–1357.
Serences, J.T., Shomstein, S., Leber, A.B., Golay, X., Egeth, H.E., and Yantis,
S. (2005). Coordination of voluntary and stimulus-driven attentional control in
human cortex. Psychol. Sci. 16, 114–122.
Sharp, D.J., Bonnelle, V., De Boissezon, X., Beckmann, C.F., James, S.G.,
Patel, M.C., and Mehta, M.A. (2010). Distinct frontal systems for response in-
hibition, attentional capture, and error processing. Proc. Natl. Acad. Sci. USA
107, 6106–6111.
Stuphorn, V., Taylor, T.L., and Schall, J.D. (2000). Performance monitoring by
the supplementary eye field. Nature 408, 857–860.
Talairach, J., and Tournoux, P. (1988). Co-planar Stereotaxic Atlas of the
Human Brain (Thieme Medical Publishers).
Thakkar, K.N., van den Heiligenberg, F.M., Kahn, R.S., and Neggers, S.F.
(2014). Frontal-subcortical circuits involved in reactive control and monitoring
of gaze. J. Neurosci. 34, 8918–8929.
Tolhurst, D.J., Movshon, J.A., and Dean, A.F. (1983). The statistical reliability of
signals in single neurons in cat and monkey visual cortex. Vision Res. 23,
775–785.
Verbruggen, F., Aron, A.R., Stevens, M.A., and Chambers, C.D. (2010). Theta
burst stimulation dissociates attention and action updating in human inferior
frontal cortex. Proc. Natl. Acad. Sci. USA 107, 13966–13971.
Vogels, R., and Orban, G.A. (1990). How well do response changes of striate
neurons signal differences in orientation: a study in the discriminating monkey.
J. Neurosci. 10, 3543–3558.
Xu, K.Z. (2016). Neural basis of cognitive control of movement inhibition.
Dissertation (Johns Hopkins University). http://jhir.library.jhu.edu/handle/
1774.2/40270.
Yantis, S. (1993). Stimulus-driven attentional capture and attentional control
settings. J. Exp. Psychol. Hum. Percept. Perform. 19, 676–681.
Yantis, S., and Jonides, J. (1990). Abrupt visual onsets and selective attention:
voluntary versus automatic allocation. J. Exp. Psychol. Hum. Percept.
Perform. 16, 121–134.
Zohary, E., Hillman, P., and Hochstein, S. (1990). Time course of perceptual
discrimination and single neuron reliability. Biol. Cybern. 62, 475–486.
STAR+METHODS
KEY RESOURCES TABLE
REAGENT or RESOURCE SOURCE IDENTIFIER
Deposited Data
Raw data human fMRI data: Susan Courtney ([email protected]).
monkey electrophysiological data: Veit Stuphorn ([email protected])
N/A
Experimental Models: Organisms/Strains
Maccaca mulatta Johns Hopkins University N/A
Software and Algorithms
Modified integration method for
estimating SSRT/CSRT
This paper; Mayse et al., 2014 N/A
CONTACT FOR REAGENT AND RESOURCE SHARING
As Lead Contact, Susan Courtney is responsible for all reagent and resource requests. Please contact Susan Courtney at courtney@
jhu.edu with requests and inquiries.
EXPERIMENTAL MODEL AND SUBJECT DETAILS
Human fMRI experimentParticipants
21 participants (7M, 14 F, mean age of 22 (range, 18-30 years)) were recruited from the Johns Hopkins community. All were screened
for normal or corrected-to-normal visual acuity and color vision. Written, informed consent was obtained from all participants, and all
of the experimental procedures were approved by the Institutional Review Boards of the Johns Hopkins University and the Johns
Hopkins Medical Institutions.
Procedure
All participants completed either 4 or 5, 1.5-hour behavioral training sessions and one 1.75-hour fMRI scanning session with a
context-dependent stop signal task, in exchange for monetary compensation. All participants’ last two behavioral training sessions
met a priori criteria for them to be qualified for the fMRI scanning session. The criteria were set such that the average performance
accuracy was no less than 40% for Stop trials and 80% for Continue trials. This was to ensure that participants were performing Stop
and Continue tasks as instructed.
Primate electrophysiology experimentWe acquired single unit activity from 55 neurons in frontal eye field (FEF) and 326 neurons in area 45, which is located anterior to the
inferior spur of the arcuate sulcus in macaque monkeys (Table S8). Evidence from comparative neuroanatomical studies suggests
that area 45 is the macaque homolog of the human VLPFC (Petrides and Pandya, 2009).
METHOD DETAILS
Human fMRI experimentApparatus and stimuli
A Mac computer (Apple, Cupertino, California, USA) equipped with MATLAB software (https://www.mathworks.com/) and
PsychToolbox-3 extensions (http://psychtoolbox.org/) was used to present the stimuli. During the behavioral training sessions,
participants viewed an Asus LED HD monitor (60 Hz refresh rate), from a distance of �56 cm in a dimly lit room. Eye positions
were sampled from the right eye and recorded with an infrared corneal reflection system, EyeLink 1000 (SR Research, Mississauga,
Ontario, Canada) at a sampling rate of 500 Hz. During the fMRI scanning sessions, eye position was sampled from the right eye and
recorded with an infrared corneal reflection system, EyeLink 1000 Plus (SR Research, Mississauga, Ontario, Canada), located at the
back of the bore of the scanner, at a sampling rate of 500Hz. All stimuli were displayed on a back-projected screen located in the bore
of the scanner, which participants viewed through a mirror attached to the head coil. For both behavioral training and fMRI scanning
sessions, five-point calibrations were performed at the beginning of the session and between each run. Saccadic eye movements
Neuron 96, 1447–1458.e1–e6, December 20, 2017 e1

were detected online using the EyeLink built-in algorithm in order to give participants performance feedback during the experiment.
A valid saccade was further admitted to the behavioral analysis offline if it started from the central fixation window (3� x 3�, visualangle) and ended in the peripheral target window (3� x 3�).
Stimuli included a shape context cue, a central fixation point, a target, a colored stop signal, and a colored continue signal. All
stimuli were 1� x 1� in size, and were presented against a gray background. The target stimuli were presented at an eccentricity
of 10� horizontally from the fixation point, either to the left or to the right.
Procedure
Each participant received 3 types of trials: Go trials, Stop trials, and Continue trials, presented in a pseudo-randomized order (Fig-
ure 1). All trials started when participants acquired central fixation at a context cue. The shape of the context cue (square or triangle)
indicated the rule mapping on that trial, and was visible for 500 ms before it was replaced by a central fixation point. After a random
delay (2000ms + jitter; jitter varied from 0 to 1500ms, incrementing by 500ms) the fixation point was then extinguished and, simul-
taneously, a peripheral target appeared. On Go trials, the target appeared alone and a trial was considered correct if participants
generated a single saccade to the target (+/� 2.5� offset) within the 500ms maximum response time window and maintained their
gaze at the target for an additional 200ms. On Stop and Continue trials, a central stimulus (blue or yellow dot) was presented after
a variable delay (stop signal delay, SSD, for Stop trials, and continue signal delay, CSD, for Continue trials) following the target onset.
On Stop trials, the trial was correct if participants maintained fixation for 400ms after the stop signal was presented, indicating that
they had canceled the preparation of their planned saccade. On Continue trials, the trial was correct if participants successfully
generated a saccade to the target, despite the presentation of a continue signal. Four fixed SSDs were selected empirically based
on each individual’s performance during the behavioral training sessions such that at the shortest SSD, participants generally
inhibited the movement in > 75% of the Stop trials and at the longest delay, participants inhibited the movement in < 25% of the
Stop trials, and most of the data points were centered around the two SSDs in which the participants inhibited the movement on
�50% of the Stop trials. The SSDs ranged between 50 ms to 250 ms. The same delays were used for Continue trials for the
same participant and were referred to as continue signal delays (CSDs). In one context, a yellow dot cued the participants to cancel
the saccade (Stop trials) while a blue dot cued the participants to ignore it and make a saccade to the peripheral target (Continue
trials). In the other context, the rule was reversed. Three inter-trial intervals (ITIs), 2 s, 4 s, and 6 s, were used and were pseudo-
randomly determined resulting in 60%, 30%, and 10% of trials, respectively. The context alternated every 8, 10 or 16 trials, randomly
and without prior warning. The first trial following the context alternation was termed a ‘‘switch’’ trial.
fMRI Data Collection
MR images were acquired with a Phillips Intera 3T scanner at the Kirby Center for Functional Brain Imaging at the Kennedy Krieger
Institute in Baltimore, MD. For each participant, a high-resolution anatomical scan was acquired with an MPRAGE T1-weighted
sequence with an isotropic voxel size of 1 mm [repetition time (TR) = 8.1 ms; echo time (TE) = 3.7 ms, flip angle = 8�, 150 axial slices,
0 mm gap, SENSE factor = 2]. Whole-brain, T2*-weighted echo-planar images were acquired with a 32-channel SENSE headcoil in
36 transverse, sequential slices [TR = 2000ms, TE = 30 ms; flip angle = 70�, acquisition matric = 76 x76, field of
view = 192.00mm x 171.79mm x 107.50mm; slice thickness 2.5 mm, gap = 0.5 mm; SENSE factor = 2], yielding voxels that were
2.5mm isotropic.
Each EPI scan began with 4 dummy pulses in order to allow magnetization to reach steady-state. We acquired 234 volumes for
each of the 6 experimental runs such that each lasted approximate 7.8 minutes.
Preprocessing of the data was carried out in AFNI (Cox, 1996) with the exception of removing the skull from the anatomical scan,
which was carried out using fsl_anat (Jenkinson et al., 2012). We applied AFNI’s nonlinear warping (3dQWarp) to morph each
participant’s anatomical scan into Talairach stereotaxic space (Talairach and Tournoux, 1988) according to the Colin 27 template.
All functional images were first corrected for slice time acquisition. Next, we corrected for participant motion and registered each
image to the corresponding normalized anatomical image. The functional runs were resampled to an isotropic resolution of 2mm
during coregistration. Lastly, we performed spatial smoothing with a kernel of 4 mm full width half maximum and normalized the
BOLD response in each voxel to the voxel’s average MR signal magnitude across the six experimental runs.
Primate electrophysiology experimentSubject and general task set-up
One rhesus macaque monkey was trained to perform a visually guided saccade task and a context-dependent SST by operant
conditioning with positive reinforcement. All animal care and experimental procedures were approved by The Johns Hopkins Univer-
sity Animal Care and Use Committee. Monkeylogic software (http://www.brown.edu/Research/monkeylogic/) (Asaad and Eskandar,
2008) was used to control task events, stimuli and rewards, and to monitor and store behavioral events. During the experimental
sessions, the monkey was seated in a primate chair, with its head restrained, facing a video monitor. Eye positions were monitored
and recorded with an infrared corneal reflection system, EyeLink 1000 (SR Research) at a sampling rate of 1000 Hz. Eye movements
were detected offline using a computer algorithm that searched first for significantly elevated velocity (30�/s). Saccade initiation and
termination then were defined as the beginning and end of the monotonic change in eye position lasting 15 ms before and after the
high-velocity gaze shift. A valid saccade was further admitted to the behavioral analysis if it started from the central fixation window
(2.5�x 2.5�) and ended in the peripheral target window (2.5�x 2.5�). Visual inspection was also applied to ensure the accuracy of
saccade detection.
e2 Neuron 96, 1447–1458.e1–e6, December 20, 2017
Behavioral task
The context-dependent SST was run after a neuron’s response field was successfully mapped out by the visually guided saccade
task. The context-dependent SST was very similar to the one used in the human fMRI study, except that a trial started with the mon-
key acquiring central fixation on a white dot, which was then replaced by a shaped context cue. The timing of the stimuli onset was
adjusted for the electrophysiology experiment as well (Figure 1). Five fixed Stop signal delays (SSD) ranging from 100ms to 300ms,
with a 50ms increment, were used such that at the shortest Stop signal delay, monkeys generally inhibited the movement in > 75%of
the Stop trials and at the longest delay, monkeys inhibited themovement in < 25%of the Stop trials, andmost of the data points were
centered around the SSD in which themonkey inhibited the movement in 50%of the Stop trials. The Continue signal delay (CSD) had
the identical timing as the SSD. The monkey generally inhibited the movement in < 5% of the Continue trials, for all CSD.
The context-based stop signal task was run in a block fashion. Within each block, only one type of context cue, either a square-
shaped cue or a triangle-shaped cue, was shown to themonkey. Each block contained either 50 or 100 trials, and alternated between
square-cue block and triangle-cue block such that the two types of blocks were counterbalanced. The first trial of a new block was
coined a ‘‘switch’’ trial.
Cortical localization
We used T1 and T2 magnetic resonance images (MRIs) obtained for the monkey (3.0 T) to determine the location of the area 45 and
FEF. Anatomically, area 45 is located in themidline, 12mmanterior to the inferior spur of the arcuate sulcus, extending to the principle
sulcus. FEF is located in the fundus of the arcuate sulcus, more posterior and medial relative to area 45.
Single-unit recording
After training, we surgically placed a recording chamber centered over area 45 and FEF on the right hemisphere of the animal. Single
units were recorded using tungsten microelectrodes (2–4 MU) that were under the control of a microdrive. Electrodes were inserted
through a guide tube positioned and lowered to just above the surface of the dura mater. Electrophysiological data were collected
using the TDT system (Tucker & Davis) at a sampling rate of 1-kHz. Action potentials were amplified, filtered, and discriminated
conventionally with a time-amplitude window discriminator. Spikes were isolated online if the amplitude of the action potential
was sufficiently above background to reliably trigger the time-amplitude window discriminator, the waveform of the action potential
was invariant throughout experimental recording, and the isolation could be sustained for sufficient period of recording. The identi-
fication and isolation of individual spikes was reevaluated and corrected offline using three-dimensional PCA and visual inspection of
selected waveforms (Offline Sorter Program, Plexon .Inc) to ensure only single units were included in subsequent data analysis.
QUANTIFICATION AND STATISTICAL ANALYSIS
Human fMRI experimentBehavioral Data and Estimation of SSRT/CSRT
All behavioral data were analyzed using custom-written MATLAB (https://www.mathworks.com) scripts. Reaction times (RTs) were
calculated as the time between go signal onset and the initiation of a saccade, and were expressed as mean ± 1 s.e.m. Inhibition
functions were constructed by fitting aWeibull function to the relationship between the stop signal delay and the proportion of Failed
Stop trials over all Stop trials (i.e., the probability of generating a saccade over all Stop trials).
To estimate SSRT and CSRT we used the modified integration method. This method has been described in detail previously and
this description is summarized here (Mayse et al., 2014). This method is computationally similar to the integration method, in which
SSRT is determined by finding the point on the Go RT distribution at which the area-under-the-curve equals the proportion of Failed
Stop trials for a given SSD, then aligning this point to the stop signal by subtracting SSD from Go RT. SSRT is then determined by
averaging these SSRTs across all SSDs. Themodified integration method allows for estimation of SSRT and CSRT by comparing the
signal distribution (either continue or stop) to a yoked go trial RT distribution (the go RT distribution aligned to the stop signal). See
Figure S2. See also Xu (2016). This methodwas implemented in the following steps: First, we drew n (where n is the number of stop or
continue trials) random samples without replacement from the number of Go trials in a session. These RTs were aligned to the stop
signal by subtracting from this sampling distribution the actual nSSDs or CSDs. Separate, yokedGoRT distributionswere created for
estimation of SSRT and CSRT. Second, this sampling and aligning procedure was repeated 10,000 times to construct a 99.9%
(0.05%–99.95%) confidence interval (CI) of the yoked Go RT distribution. Third, we determined the first time point in the sorted
Stop or Continue trial RT distribution that fell outside the 99.9% CI (this time point was calculated as the first time point at which
at least 0.15n consecutive stop or continue trials were greater than the upper bound of the 99.9%CI to protect against false positives
in noisy cumulative RT distributions). This time point is not SSRT or CSRT (which is a point on the Stop or Continue trial RT distribu-
tion, not the 99.9% CI) but was used as a conservative cutoff to separate fast and slow continue trials (Mayse et al., 2014). Finally,
using this cutoff value, we were able to find the proportion of failed stop or fast continue trials. We then estimated SSRT (CSRT) by
finding the latency relative to the Stop (Continue) signal at which the density of the cumulative distribution of Stop-aligned Stop trial
(Continue-aligned Continue trial) RTs was equal to the proportion of Failed Stop (Fast Continue) trials. It has been previously demon-
strated that SSRTs derived using this method are indistinguishable from SSRTs derived using the integration or median methods
(Mayse et al., 2014).
Neuron 96, 1447–1458.e1–e6, December 20, 2017 e3

fMRI Univariate analysis
We used a voxelwise general linear model for testing the main effect of motor inhibition and/or reflexive reorienting attention to
external events. Task-dependent changes in BOLD signal weremodeled to test whether elevatedBOLD activity in rVLPFCwas corre-
lated with motor inhibition and/or with reflexive reorienting of attention to external events, using separate regressors representing
each possible combination of the two signal colors (blue or yellow) and five trial outcomes (Correct Go, Successful Stop, Failed
Stop, Slow Continue, and Fast Continue). Each regressor was time-locked to the target onset. In addition, six head-motion param-
eters were included in the model as regressors-of-non-interest. All regressors were convolved with a canonical hemodynamic
response function (HRF) using a double gamma function. Contrasts of interest were created for each participant to identify voxels
exhibiting greater BOLD responses on: 1) Successful Stop (SS) trials compared with Go trials, 2) Failed Stop (FS) trials compared
with Go trials, 3) SS trials compared with FS trials, 4) Stop (SS +FS) trials compared with Go trials, regardless of the outcome of
the stopping, 5) Continue trials compared with Go trials, and 6) Stop trials compared with Continue trials. All contrasts created at
the participant-level were entered into a group-level random-effect analysis using a one-sample t test against a contrast value of
zero at each voxel. The statistical maps were thresholded using a voxel-level threshold of p < 0.01, corrected for multiple compar-
isons at a cluster-level of p < 0.05 (family-wise error correction). All whole-brain group-level results were corrected for multiple com-
parisons by running 10,000 Monte Carlo simulations in 3dClustSim to determine the probability of obtaining a cluster of significant
activity of a certain size given the spatial smoothness of the data.
Defining Regions of Interest for testing motor inhibition
We first used the Stop > Go contrast in the group-level GLM analysis to identify right lateral prefrontal regions that showed significant
activation. Next, we manually created an anatomical ‘‘mask’’ for right inferior frontal gyrus (rIFG) using AFNI built-in N27 brain Atlas.
(AFNI atlas uses IFG to designate VLPFC). Regions of interest (ROI) were defined as the overlapping area between the functionally
defined lateral prefrontal regions and the anatomical mask of rIFG. We extracted the beta weights of the ROI, averaged across all
voxels in the ROI, for each participant for the following three regressors/contrasts: 1) Go trials - baseline, 2) SS - Go trials,
3) FS - Go trials. Positive value indicates greater BOLD activity.
Defining Regions of Interest for testing reflexive reorientation of attention to external events
We first used the Signal (Stop + Continue) > Go contrast in the group-level GLM analysis to identify lateral prefrontal regions that
showed significant activation. Next, we used the same anatomical ‘‘mask’’ for right inferior frontal gyrus (rIFG) that was described
above. The region of interest (ROI) was defined as the overlapping area between the functionally defined lateral prefrontal region
and the anatomical mask of rIFG.We extracted the beta weights of the ROI, averaged across all voxels in the ROI, for each participant
for the following three regressor/contrasts: 1) Go trials alone, 2) Stop - Go trials, and 3) Continue - Go trials. Positive value indicates
greater BOLD activity.
Defining FEF
Weused frontal eye fields (FEF) as an ‘‘area of reference’’ to assess the validity of the pattern classificationmethod and to benchmark
its result with the results found in rVLPFC, since it is well-established that the activation in FEF is associated with oculomotor control
(Schiller et al., 1987; Goldberg and Bushnell, 1981; Hanes and Schall, 1996; Connolly et al., 2005; Curtis et al., 2005). FEF was initially
identified functionally by selecting voxel clusters from both left and right hemispheres that showed significant activation using the Go
– baseline > 0 contrast from the group-level GLM analysis. Second, among the functionally defined regions, only areas that were
anterior to the precentral sulcus, and lateral to the superior frontal sulcus were further included in the data analysis (Courtney
et al., 1996).
Multi-voxel pattern classification analysis (MVPA)
MVPA (Norman et al., 2006) was performed using a linear support vector machine (LinearCSVMC) from LIBSVM library (Chang and
Lin, 2001) implemented within the PyMVPA software package (Hanke et al., 2009). Preprocessing was the same as described above
in theGLManalysis. To reduce the problem related to BOLD signals overlapping across temporally adjacent events, a univariate GLM
analysis was conducted to derive trial-type-specific beta estimates for each run, representing each possible combination of the two
colors (blue and yellow) and three trial types (Go, Stop, and Continue trials). In addition, six head-motion parameters were included in
the model as regressors-of-no-interest. Trials were modeled as events time-locked to the onset of the target with a double-gamma
function and were convolved with a canonical HRF. Error Go and Continue trials were excluded from analyses.
To test signal meaning encoding, the context rule was defined as themapping between themeaning of the signal and the color. For
each participant, beta values pertaining to each combination of color andmeaning were estimated, within each run, yielding four beta
maps per run (i.e., ‘‘blue Continue,’’ ‘‘blue Stop,’’ ‘‘yellow Continue,’’ and ‘‘yellow Stop’’). Overall, the GLM analysis yielded 24 (4 beta
maps/run x 6 runs) betamaps for each participant. We then pooled all 21 participants’ classification accuracy values and tested them
against the chance performance value of 0.5 (because the signal-response mapping meaning was either correctly or incorrectly in-
terpreted by the participant’s classifier), at the level of p < 0.05 (two-tailed).
A different univariate GLM analysis was conducted to derive stop-outcome-specific beta estimates for each run, representing
Failed Stop and Successful Stop outcomes. In addition, six head-motion parameters were included in the model as regressors-
of-non-interest. Trials were modeled as events time-locked to the onset of the target with a double-gamma function and were
convolved with a canonical HRF. For each participant, beta values pertaining to both trial outcomes were estimated within each
run, yielding two beta maps per run. Overall, the GLM analysis yielded 12 (2 3 6 runs) beta maps.
e4 Neuron 96, 1447–1458.e1–e6, December 20, 2017

Task-dependent Functional Connectivity
A generalized form of context-dependent psychophysiological interactions (gPPI) method (McLaren et al., 2012; Cisler et al., 2013)
was used with implementations in AFNI. The three seed regions were the ventral rVLPFC, dorsal rVLPFC and bilateral FEF, which
were defined at the group-level analysis and transformed back to individual space using 3dNwarpApply in AFNI. For each seed,
changes in BOLD signal were modeled to test the effect of modulation in other parts of the brain by the seed region during Go,
Stop, and Continue trials.
For each run, the average time series of the voxels in a seed regionwas extracted, and a deconvolution processwas run on the time
series to remove the signal component that had previously been modeled with a canonical hemodynamic response function (HRF).
The remaining residual signals were considered the neuronal responses at the seed region and were convolved with the condition
timing profile for each task, i.e., Go, Stop, and Continue trials, respectively, to generate three PPI-regressors per run. Next, the three
PPI-regressors were concatenated across all six runs respectively. In addition to the three PPI-regressors, three regressors of trial
types (Go, Stop, and Continue), the seed region itself, and six head-motion parameters were included in the model. All 13 regressors
were convolved with the canonical HRF using a double gamma function. The general linear model (GLM) was estimated for each
participant separately using AFNI’s 3dDeconvolve function, and a Talairach transformation was applied for each participant to
combine the resulting statistical maps across the 21 participants for group-level analysis. All contrasts created at the participant-level
were entered into a group-level random-effects analysis using a one-sample t test against a contrast value of zero at each voxel. The
statistical maps were thresholded using a voxel-level threshold of p < 0.01, corrected for multiple comparisons at a cluster-level of
p < 0.05 (family-wise error correction), based on a Monte Carlo simulation with 10,000 iterations run via the AFNI software package,
using a smoothing kernel of 4 mm on the task-related mask.
Primate electrophysiology experimentSpike density functions
To represent neural activity as a continuous function, we calculated spike density functions by convolving the peri-stimulus time
histogram with a growth-decay exponential function that resembled a postsynaptic potential (Hanes et al., 1998). Each spike there-
fore exerts influence only forward in time. The equation describes rate (R) as a function of time (t): R(t) = (1 - exp(-t/tg))*exp(-t/td),
where tg is the time constant for the growth phase of the potential and td is the time constant for the decay phase. Based on phys-
iological data from excitatory synapses, we used 1 ms for the value of tg and 20 ms for the value of td (Sayer et al., 1990).
Behavioral data analysis
We termed five trial types to characterize the possible behavioral results: Go trials, in which themonkey successfully made a saccade
to the periphery target; Successful Stop trials, in which the monkey successfully withheld its gaze at the central fixation; Failed Stop
trials, in which the monkey failed to hold central fixation and generated a saccade to the target instead; Continue trials, in which the
monkey successfully ignored the continue signal, and generated a saccade to the target; and Error Continue trials, in which the mon-
key failed to generate a saccade to the target and held its gaze at central fixation instead. Inhibition function and stop signal reaction
time (SSRT) were calculated using a similar method as in the human fMRI study.
Characterization of neuronal activity dynamics
See Table S8.
For a neuron to sufficiently control a saccade initiation or inhibition, two criteria must be fulfilled. First, the neuron must discharge
differently when a saccade is initiated versus when a saccade is withheld. Second, this activity differentiation must occur within the
SSRT for it to control the saccade initiation/inhibition in time. If the activity differentiates after the SSRT, it is too late to influence the
saccade initiation/inhibition. Both criteria are fulfilled by movement-related neurons in the FEF and superior colliculus (SC) (Brown
et al., 2008; Hanes et al., 1998; Pare and Hanes, 2003).
The activity when amovement is cancelled can be compared with the activity when amovement is produced, but would have been
cancelled if the stop signal had been presented. This comparison consists of Successful Stop trials and Go trials with reaction times
greater than the stop signal reaction time added to the stop signal delay (latency-matched trials). The rationale is that the saccades,
generated with slow reaction times (i.e., reaction times exceeding the SSRT + SSD) in Go trials, are those slow saccades that could
have afforded enough time for the STOP process to finish before the GO process, and on which the planned movement therefore
would have been cancelled had there been a stop signal presented.
We compared the spike rate in Successful Stop trials and latency-matched Go trials for movements inside and outside of the
response fields as a function of time from target presentation. This was done to provide a complementary estimate of whether
and when neural activity distinguished saccade inhibition from saccade initiation. To perform this time-course analysis, we sub-
tracted the average spike density function for Successful Stop trials from the average spike density function for latency-matched
Go trials. This subtraction was performed for cells with visually evoked activity and for cells with movement-related activity. Because
of their opposite sign of modulation, for cells with fixation-related activity, we subtracted the average spike density function for
latency-matched Go trials from the average spike density function during cancelled Stop trials. The resulting spike density functions
will be referred to as differential spike density functions. The time at which significant differential activity began during Successful
Stop and latency-matched Go trials was defined as the instant when the differential spike density function exceeded by 2 SD the
mean difference in activity during the 500-ms interval before target presentation, provided the difference reached 3SD and
remained > 2 SD threshold for 50ms. The time interval between the defined onset of differential activity and the SSRT then was
Neuron 96, 1447–1458.e1–e6, December 20, 2017 e5

determined. If the timewhen the differential activity arosewas earlier than or equal to the SSRT, we regarded this as positive evidence
for a cancellation signal.
Identification of context related neuronal activity
We used a method adopted from signal detection theory (Green and Swets, 1966) to determine when the activity evoked by a stim-
ulus in one context could be distinguished from the activity evoked by the same stimulus in another context. To do this, we compared
the distribution of discharge rates during the 100 ms interval following each behavioral event (e.g., context cue, target, stop signal,
reward).
At each time interval, the separation of the two distributions of activity obtained when a trial occurred during context A versus when
a trial occurred during context Bwas quantified by calculating receiver operating characteristic (ROC) curves (Egan, 1975; Green and
Swets, 1966; Macmillan and Creelman, 2004). This method has previously been used to analyze the ability of single neurons to
discriminate stimulus features (e.g., Bradley et al., 1987; Britten et al., 1992; Guido et al., 1995; Tolhurst et al., 1983; Vogels andOrban
1990; Zohary et al., 1990). Significant differences in activity between contexts were determined by plotting ROCcurves for the activity
distribution in the 100 ms interval following each behavioral event. Each neuron with a time epoch where the area under the ROC
curve exceeded 0.75 was defined as having significant context related modulation.
Classification of Stop and Continue Responses
We analyzed the pattern of neuronal activity following stop and continue signals using a 2-factor ANOVA. One factor was trial type
(cancelled stop signal trial, non-cancelled stop signal trial, continue trial), the other context (A or B), and their interaction. We distin-
guished between correct and erroneous stop signal trials and continue trials. Since themonkey almost always correctly responded to
continue signals by generating a saccade, we did not analyze erroneous continue trials.We conducted this ANOVA on activity in each
of 14 non-overlapping 50 ms time bins that covered the time period from 200ms before signal onset until 400 ms past signal onset. If
one of the factors had a significant effect in two consecutive time bins (p < 0.0025), we conducted post hoc comparisons of the
neuronal activity in these bins sorted by the relevant factor.
Break down of neuronal profile in rVLPFC (right area 44/45)
A total number of 326 rVLPFC neurons were recorded and 313 (96%) showed task related activity. Of the 313 neurons, 37 (11.8%)
neurons were with saccade related activity, 15 with visual related activity (4.8%), 48 (15.3%) with visual-movement related activity
and 196 (62.6%) with context-related activity. From the 85 movement related neurons (combing both visual and visual-movement
neurons), there were 557 stop signal delays with sufficient trials to measure cancellation time. Of these there were 365 stop signal
delays where there was no significant difference in firing rate when comparing latency matched Go trials to SS trials. Of the 192
stop signal delays where there was a significant difference in firing rate when comparing latency matched Go trials to SS trials,
167 of those significant differences in firing rate occurredwell after the SSRT had elapsed (80.32 ± 10.94ms). The distribution of these
cancellation times relative to the SS was significantly greater than 0 (t(191) = 10.17, p = 1.09e-19).
DATA AND SOFTWARE AVAILABILITY
All data are freely available upon request. For human fMRI data contact Susan Courtney ([email protected]). For monkey electro-
physiological data contact Veit Stuphorn ([email protected]).
e6 Neuron 96, 1447–1458.e1–e6, December 20, 2017