networks, maps, relations (humanities hackathon 2012, day 4)
TRANSCRIPT

Networks, Maps, Relations
(Humanities Hackathon 2012, Day 4)
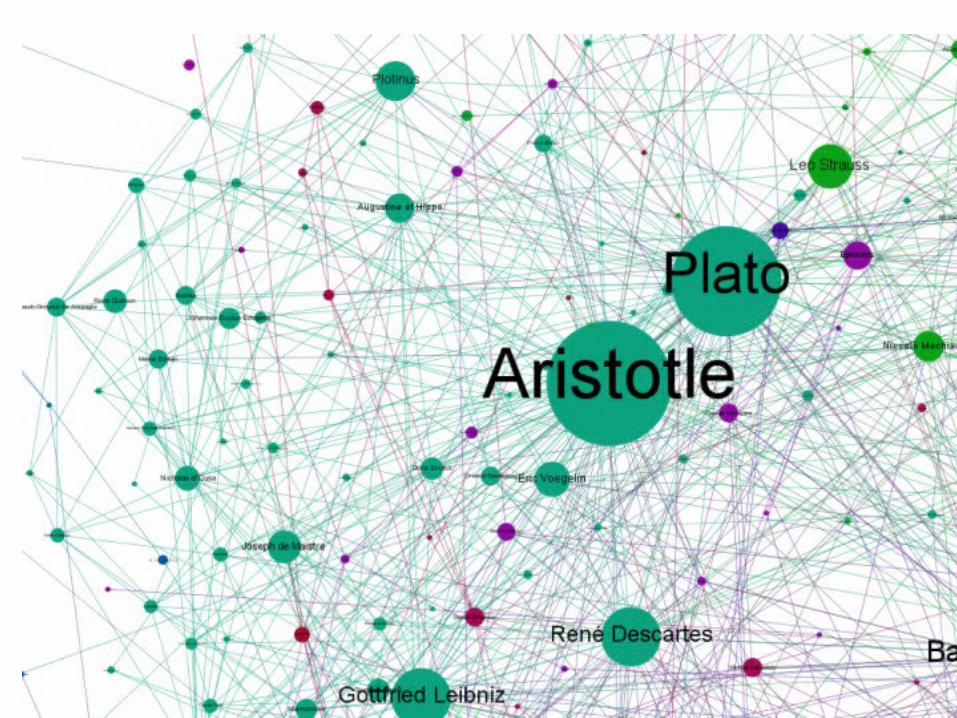

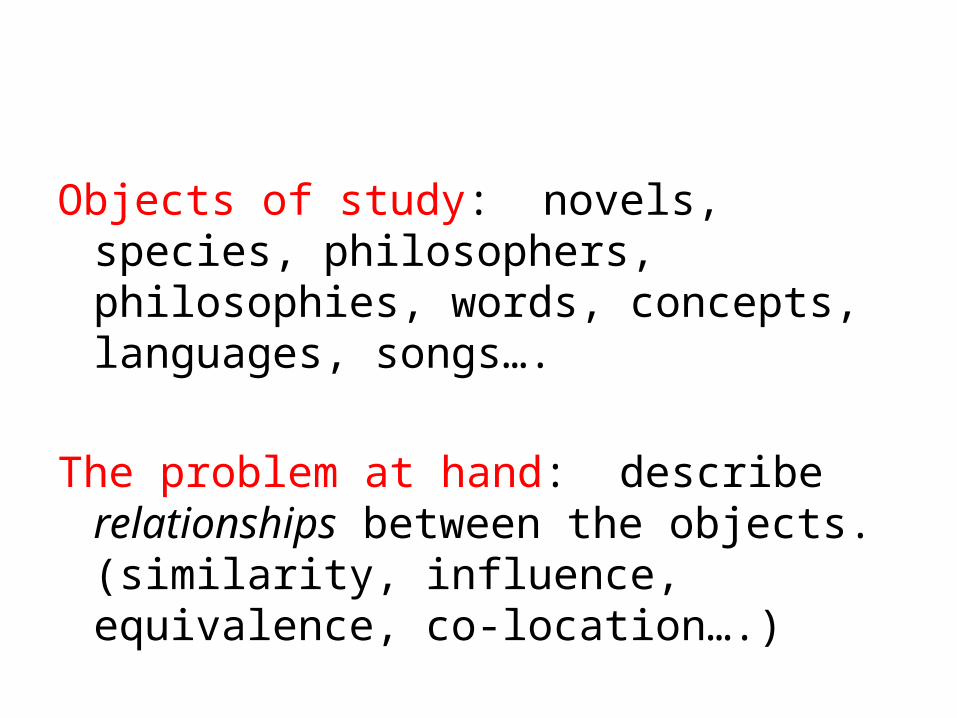
Objects of study: novels, species, philosophers, philosophies, words, concepts, languages, songs….
The problem at hand: describe relationships between the objects. (similarity, influence, equivalence, co-location….)

Graphs
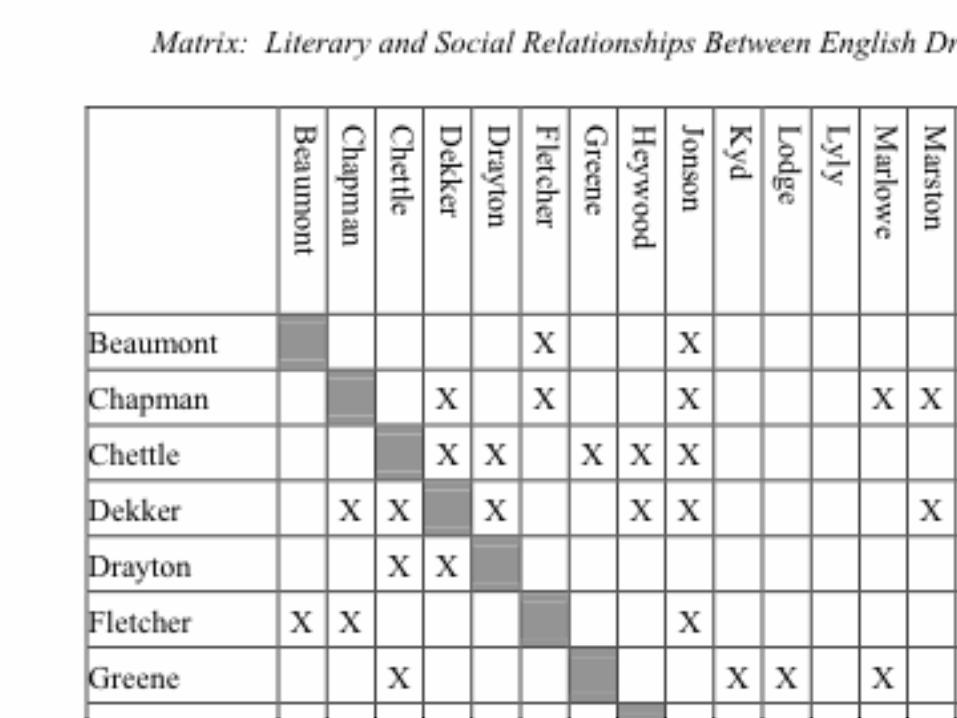
• Simplest case: relations between pairs of objects.
• BINARY: objects are either related or they’re not (no attempt to measure extent or other qualities)

(D.P. Hayes, Social Network Theory and the Claim that Shakespeare of Stratford…)


How I made this graph (not recommended)
• adj <- array(c(0,0,0,0,0,1,0,0,1,0,0,0,0,0,0,0,0,0,0,0,0,0,0,1,0,1,0,0,1,0,0,0,1,1,0,0,0,0,0,0,0,0,0,1,1,0,1,1,1,0,0,0,0,0,0,1,0,0,0,1,0,1,1,0,1,0,0,1,1,0,0,0,0,1,1,1,0,0,1,1,0,0,1,1,0,0,0,0,0,0,0,0,0,0,1,1,0,0,1,0,1,1,0,0,0,0,0,0,1,0,0,0,0,0,1,0,0,0,0,1,0,0,1,0,0,0,0,0,0,1,1,0,1,0,0,0,1,1,0,1,0,0,1,1,0,0,0,0,0,1,0,0,0,0,0,1,0,0,1,1,1,1,1,1,0,1,0,0,0,0,0,0,0,1,1,0,0,0,0,0,0,0,0,0,0,0,1,1,0,0,0,0,1,0,0,0,0,0,0,0,0,0,0,0,0,0,1,0,0,0,0,0,0,0,0,0,1,1,0,1,0,0,0,0,0,0,0,0,0,0,0,0,0,0,0,0,1,0,0,0,0,1,0,0,0,0,0,0,0,1,0,0,0,0,0,0,1,1,0,0,0,1,0,1,0,0,0,0,1,0,0,0,0,0,0,0,0,0,0,0,0,0,0,1,1,1,0,0,1,0,0,0,0,0,0,1,0,0,1,1,0,0,1,1,1,0,0,1,0,0,0,0,0,0,1,0,0,0,1,1,0,0,0,0,0,0,1,0,0,0,0,1,1,0,0,0,0,0,0,0,0,0,0,0,0,0,1,0,0,0,1,0,1,0,0,0,1,0,0,1,0,0,0,1,1,0,0,1,0,0,0,0,0,1,1,0,0,0,0,0,0,0,1,1,0,1,1,1,0,0,1,0,0,0,1,1,0,1,0,0),c(20,20))
• >PL = graph.adjacency(adj,mode="undirected")
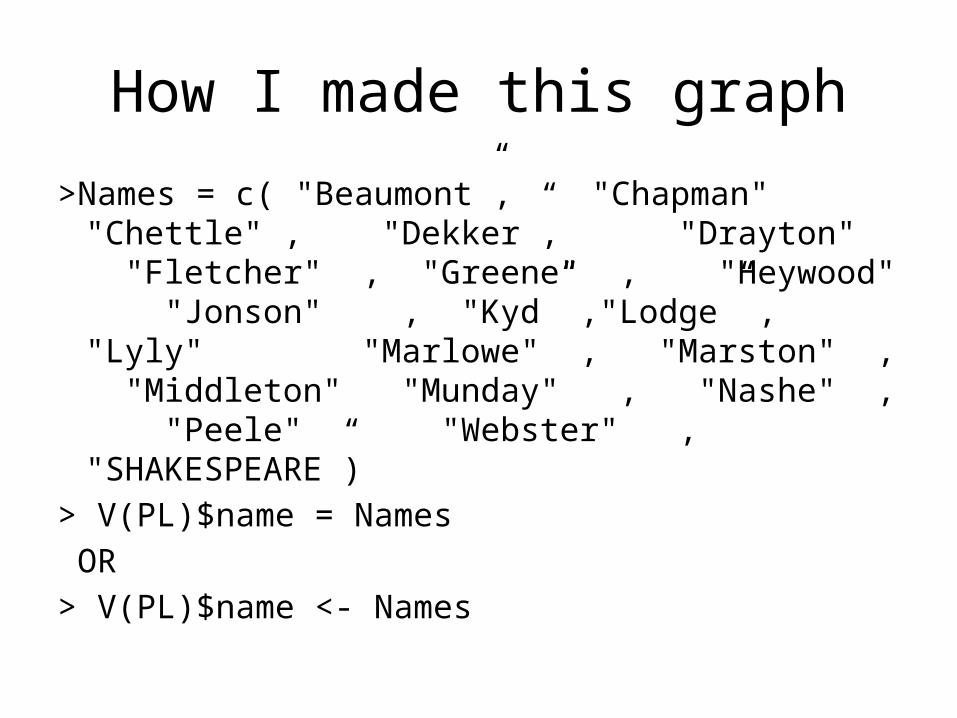
How I made this graph
>Names = c( "Beaumont”, "Chapman" "Chettle" , "Dekker”, "Drayton" "Fletcher" , "Greene" , "Heywood" "Jonson" , "Kyd” ,"Lodge” , "Lyly" "Marlowe" , "Marston" , "Middleton" "Munday" , "Nashe" , "Peele" "Webster" , "SHAKESPEARE”)
> V(PL)$name = Names OR> V(PL)$name <- Names

Graphs
A graph (or network) consists of:
• A set of vertices (or nodes)• A set of edges of the form (v,w) where v and w
are vertices.• Two vertices are adjacent if they are joined by
an edge.

Directed graphs
Undirected graphs model symmetric relations: A is connected to B means B is connected to A.
(similarity, overlap, blood relation…)
Directed graphs (or digraphs) model non-symmetric relations:
(biological descent, Internet links, phone calls…)

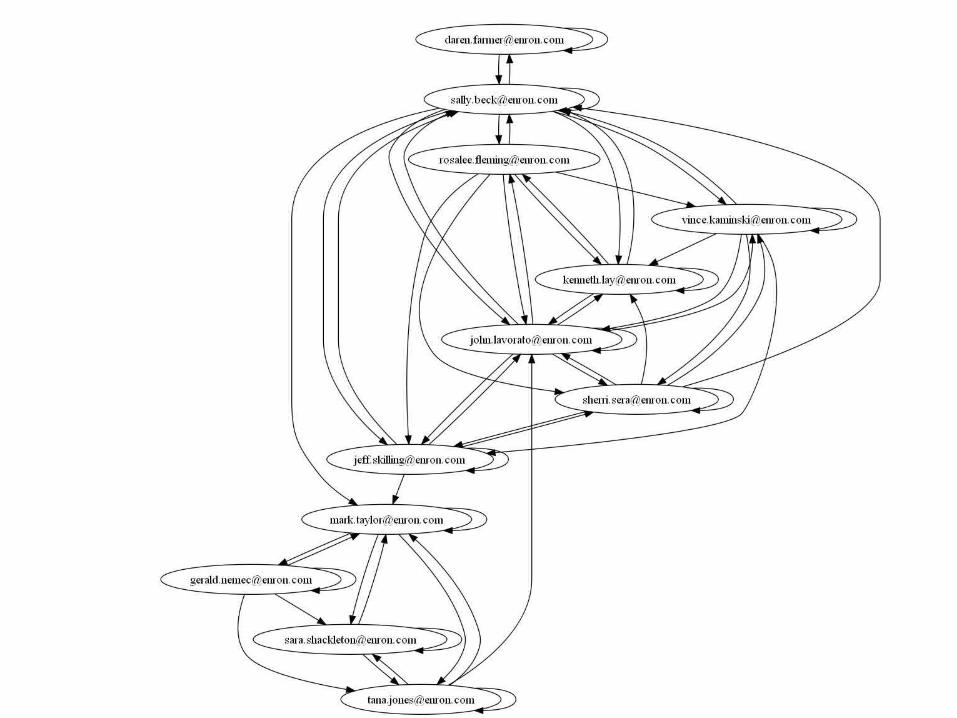
Weighted graphs
In a weighted graph, edges are assigned numbers – typically measuring the strength of a relation, not just whether it is there or not.
(e.g. edge from v to w records number of e-mails from v to w, not just existence of e-mail from v to w.)

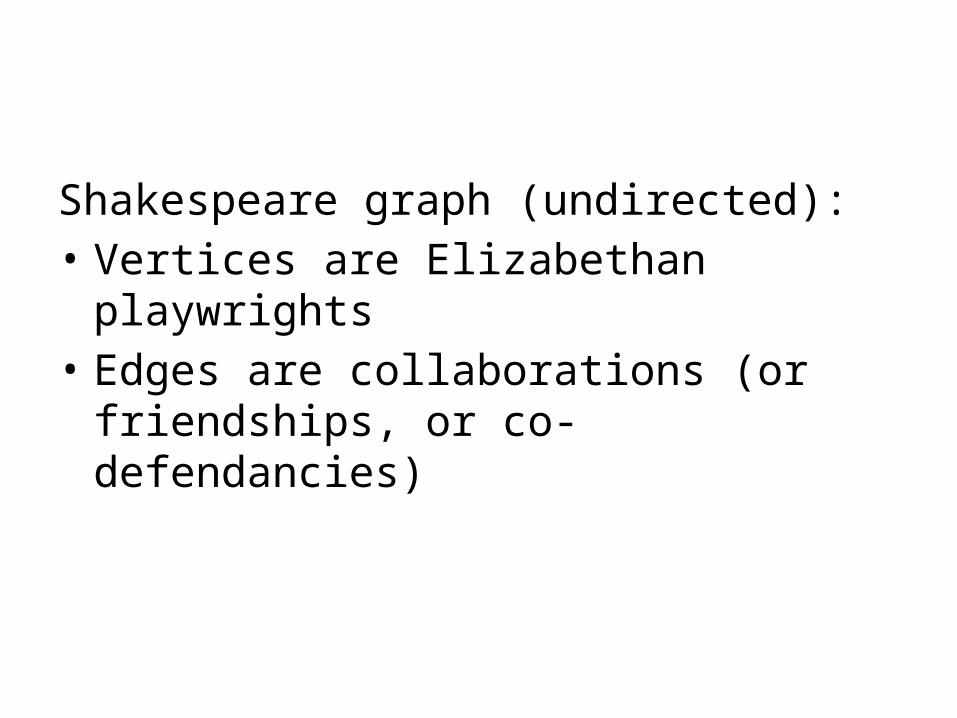
Shakespeare graph (undirected):• Vertices are Elizabethan playwrights• Edges are collaborations (or friendships, or co-
defendancies)
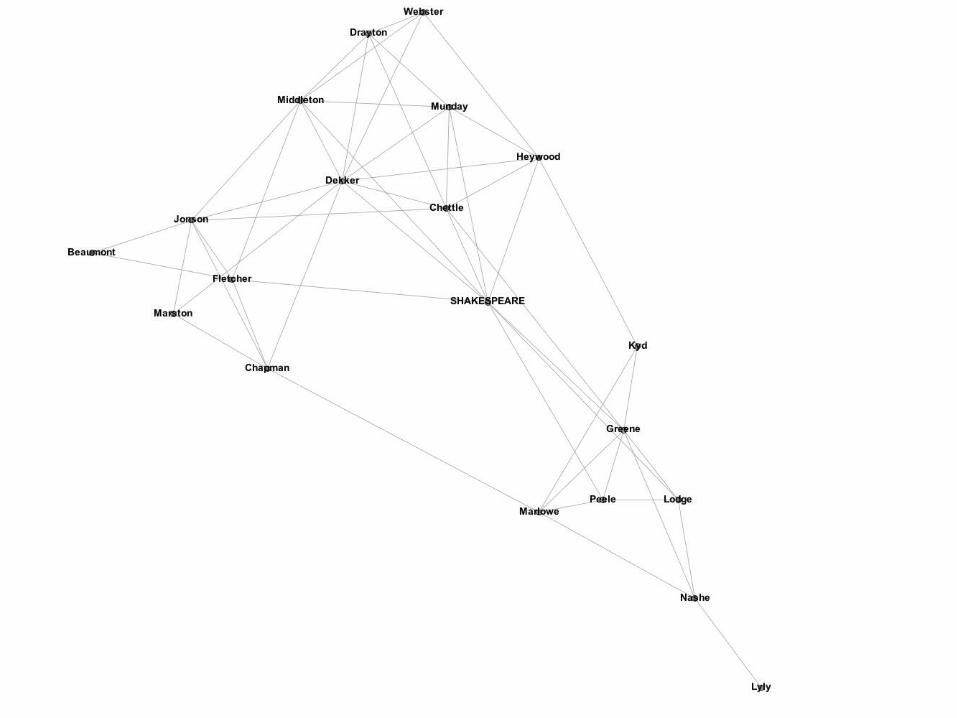


MORAL: A picture of a graph is not a graph. The graph is the list of adjacencies, nothing more.

ASIDE: why do this?
Oversimplification, BUTAll statements about books are
oversimplifications, e.g. “Raymond Carver wrote Cathedral”
Our goal is “distant reading”

Basic notions
• The degree (or valence) of a vertex is the number of edges attached to it. Loose measure of “importance”
> degree(PL) Beaumont Chapman Chettle Dekker Drayton Fletcher 2 5 7 10 5
5
…Webster SHAKESPEARE
4 9
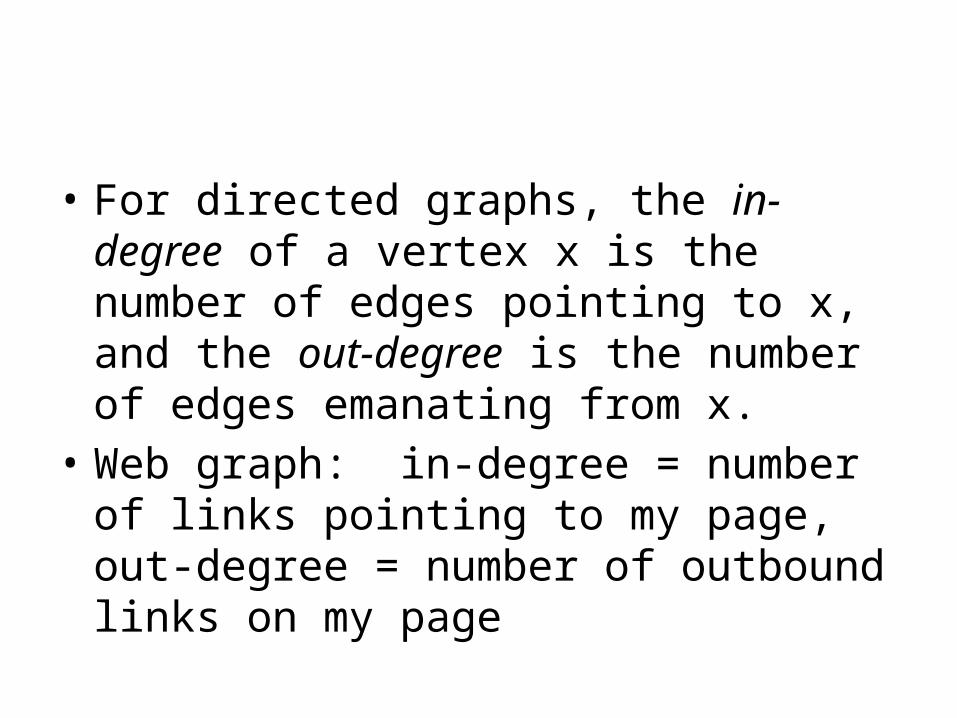
• For directed graphs, the in-degree of a vertex x is the number of edges pointing to x, and the out-degree is the number of edges emanating from x.
• Web graph: in-degree = number of links pointing to my page, out-degree = number of outbound links on my page
Basic notions
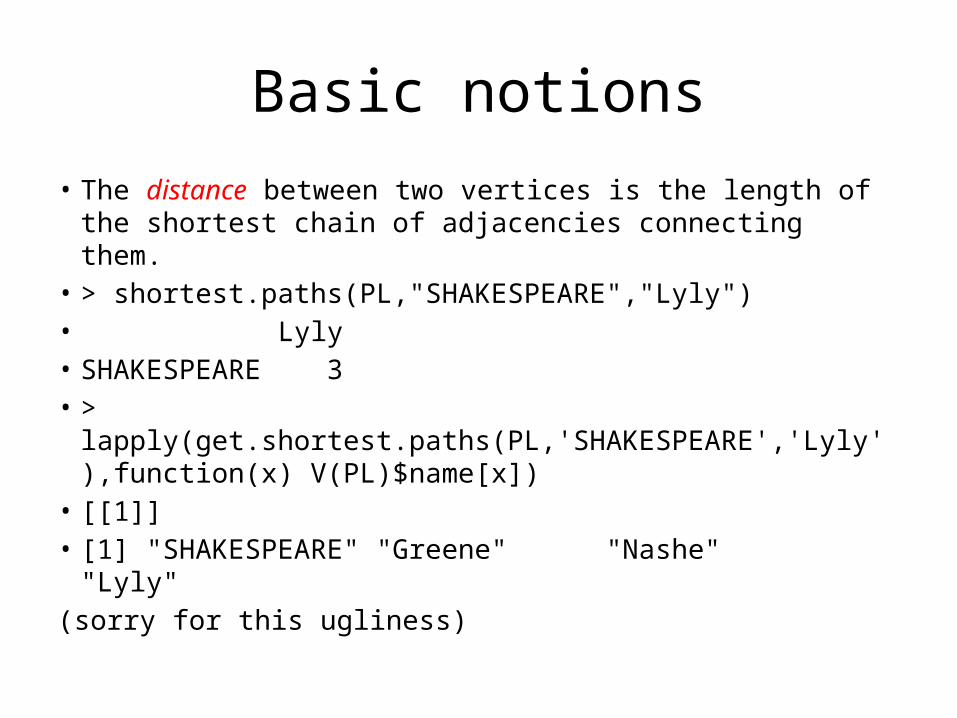
• The distance between two vertices is the length of the shortest chain of adjacencies connecting them.
• > shortest.paths(PL,"SHAKESPEARE","Lyly")• Lyly• SHAKESPEARE 3• >
lapply(get.shortest.paths(PL,'SHAKESPEARE','Lyly'),function(x) V(PL)$name[x])
• [[1]]• [1] "SHAKESPEARE" "Greene" "Nashe" "Lyly" (sorry for this ugliness)

Basic notions
• The diameter of a graph is the greatest distance between any two vertices.
• > diameter(PL)• [1] 5• > farthest.nodes(PL)• [1] 1 12 5• > shortest.paths(PL,1,12)• Lyly• Beaumont 5

Complete graphs
• Every vertex adjacent to every other5 vertices10 edges
Complete graphs
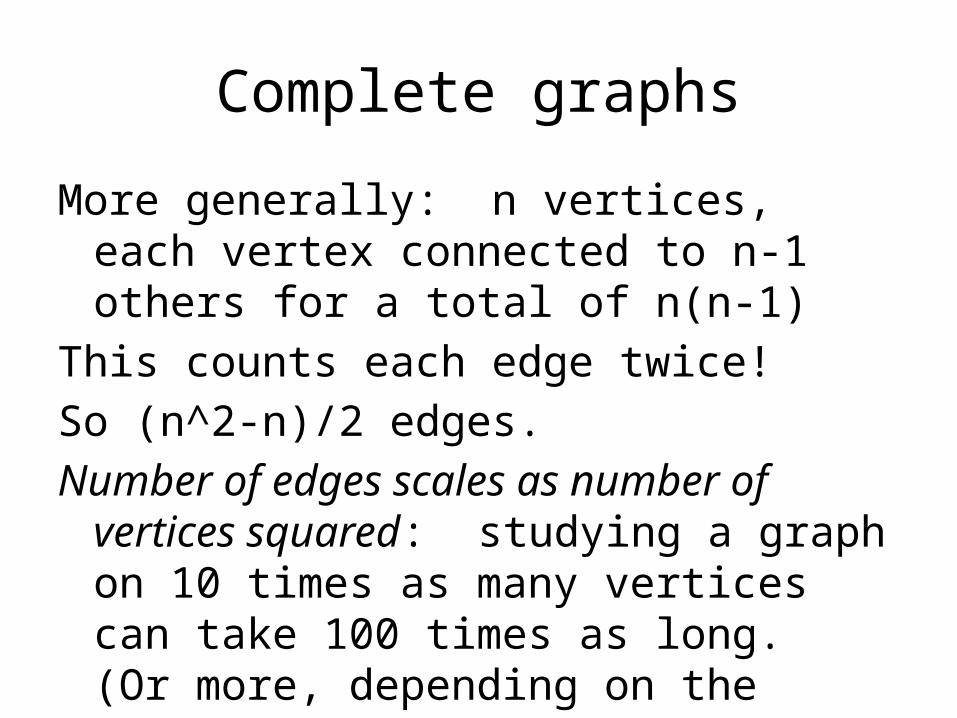
More generally: n vertices, each vertex connected to n-1 others for a total of n(n-1)
This counts each edge twice!So (n^2-n)/2 edges.Number of edges scales as number of vertices
squared: studying a graph on 10 times as many vertices can take 100 times as long. (Or more, depending on the question asked…)

Trees
A tree is a graph in which every two vertices are joined by one, but only one, path. Equivalently: no cycles.


Communities
• A clique is a set of vertices which are all mutually adjacent.
(So: any pair of adjacent vertices is a clique of size 2, any “triangle” is a clique of size 3…)
• e.g Shakespeare, Dekker, Chettle.• > largest.cliques(PL)• [[1]]• [1] 4 3 16 8 20
(Dekker,Chettle,Munday,Heywood,Shakespeare)


Communities
A graph is connected if any vertex can be reached from any other by a chain of adjacencies. Every graph breaks up into connected pieces called connected components.

A geometry of their own
“Really, universally, relations stop nowhere, and the exquisite problem of the artist is eternally but to draw, by a geometry of his own, the circle within which they shall happily appear to do so.” (Henry James, preface to Roderick Hudson)
How to draw this circle?

Clustering
Connected component: a set of vertices which has no connection to the remainder of the graph.
Cluster: a set of vertices which has relatively few connections to the rest of the graph.
(Note that this isn’t a definition…) Many ways to cluster, no “right way”
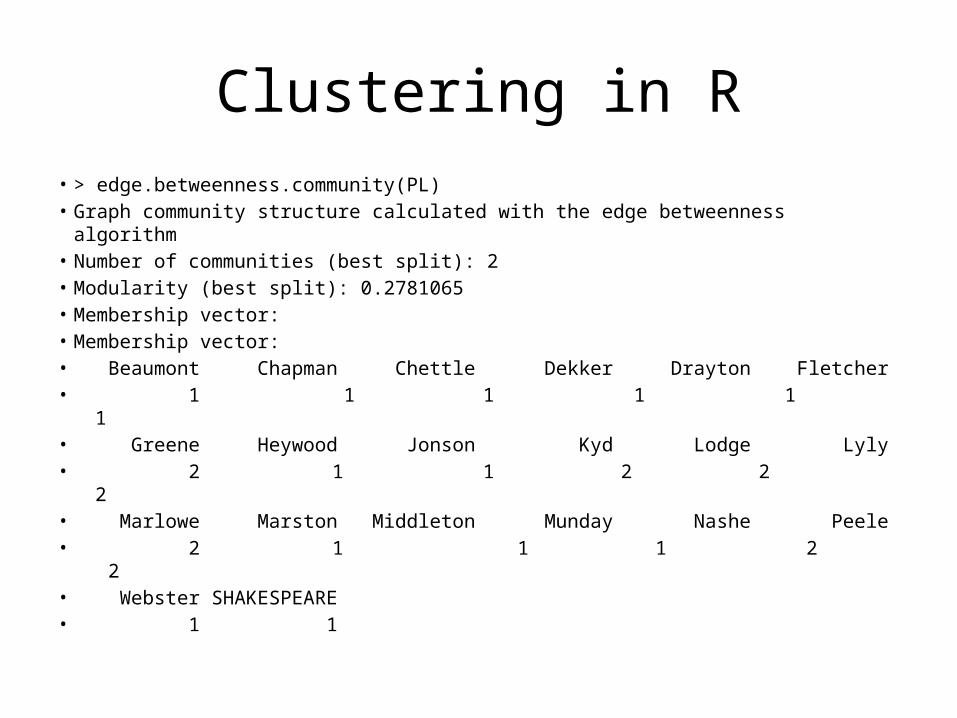
Clustering in R• > edge.betweenness.community(PL)• Graph community structure calculated with the edge betweenness algorithm• Number of communities (best split): 2 • Modularity (best split): 0.2781065 • Membership vector:• Membership vector:• Beaumont Chapman Chettle Dekker Drayton Fletcher • 1 1 1 1 1 1 • Greene Heywood Jonson Kyd Lodge Lyly • 2 1 1 2 2 2 • Marlowe Marston Middleton Munday Nashe Peele • 2 1 1 1 2 2 • Webster SHAKESPEARE • 1 1

How the clusters look

“The University Wits were a group of late 16th century English playwrights who were educated at the universities (Oxford or Cambridge) and who became playwrights and popular secular writers. Prominent members of this group were Christopher Marlowe, Robert Greene, and Thomas Nashe from Cambridge, and John Lyly, Thomas Lodge, George Peele from Oxford.” (Wikipedia)
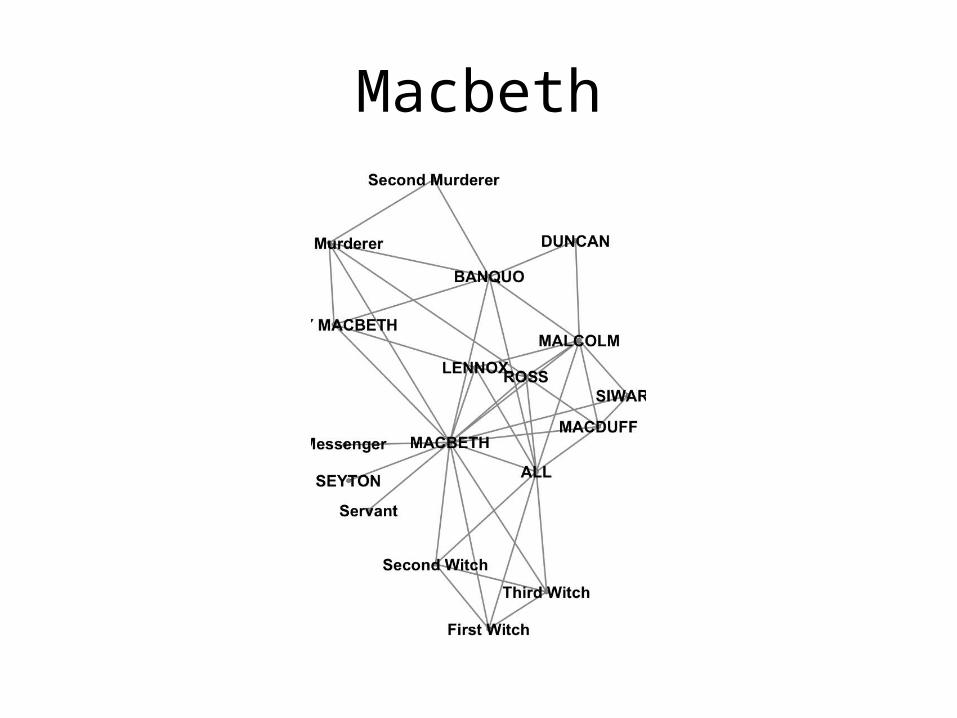
Macbeth

Clusters of characters in Macbeth> edge.betweenness.community(Macbeth)Graph community structure calculated with the edge betweenness algorithmNumber of communities (best split): 10 Modularity (best split): 0.06733369 Membership vector: MACBETH LADY MACBETH MACDUFF MALCOLM 1 2 1 1 ROSS BANQUO First Witch LENNOX 1 3 4 1 First Murderer DUNCAN Second Witch Third Witch 2 5 4 4 ALL SIWARD Messenger Second Murderer 1 6 7 8 Servant SEYTON 9 10

Breakpoint
When can networks tell us things we don’t already know?

200 names
Vertices: 200 baby names for boys popular in 2011.
For each name, record popularity in WI, TX, PA, CA, MA, GA, OH, MO, FL, CO, NY, IL
Edges: Two names are adjacent if their popularity distribution across states are “very similar”

200 names
• >lapply(largest.cliques(MaleNames), function(x) V(MaleNames)$name[ x ])
[[1]][1] "Jacob" "Anthony" "Dylan" "Matthew"
"Brian" (popular in NY,CA,MA, less so in CO,MO,GA)
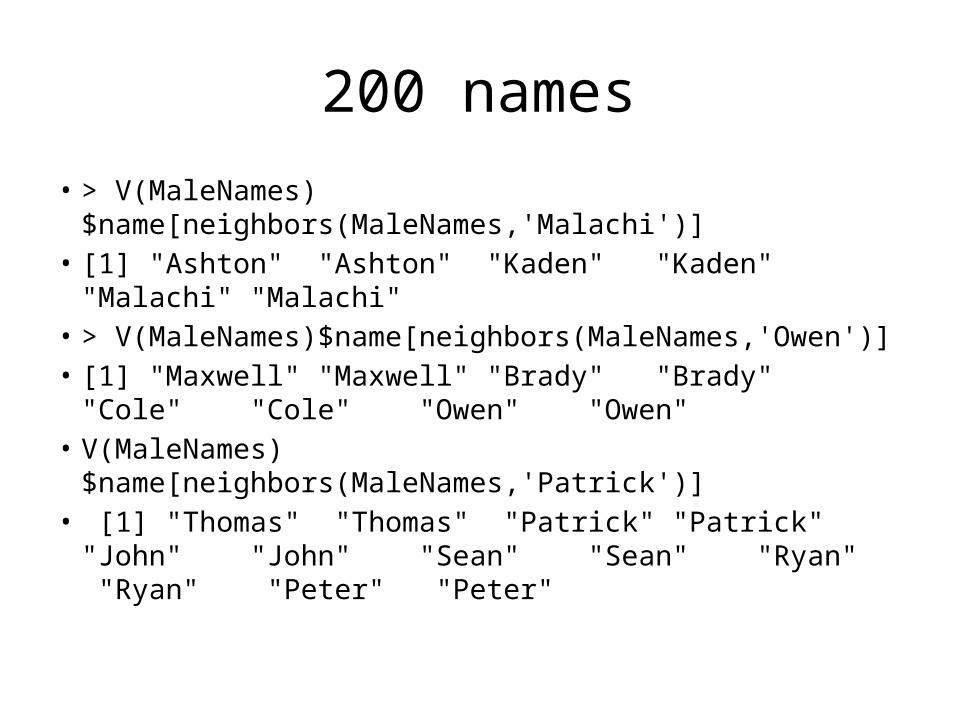
200 names
• > V(MaleNames)$name[neighbors(MaleNames,'Malachi')]• [1] "Ashton" "Ashton" "Kaden" "Kaden" "Malachi"
"Malachi"• > V(MaleNames)$name[neighbors(MaleNames,'Owen')]• [1] "Maxwell" "Maxwell" "Brady" "Brady" "Cole" "Cole"
"Owen" "Owen" • V(MaleNames)$name[neighbors(MaleNames,'Patrick')]• [1] "Thomas" "Thomas" "Patrick" "Patrick" "John"
"John" "Sean" "Sean" "Ryan" "Ryan" "Peter" "Peter"


edge.betweenness.communities finds groups of girls’ names like
• Alaina, Maci, Mackenzie, Lillian, Addison, Alivia
• Piper, Harper, Brooklyn, Brooklynn• Aubrey, Zoey, Autumn, Ellie• Lucy, Josephine, Elise, Clara, Eleanor

Density
How likely are two things to be related?The density of a graph is the probability that two random
elements are related: i.e.[total number of edges]/[total number of pairs of vertices]>graph.density(MaleNames)[1] 0.1084846> graph.density(FemaleNames)[1] 0.09950159>graph.density(Macbeth)[1] 0.2810458

Transitivity
• A relation is transitive if “A related to B” and “B related to C” implies “A related to C.”
Transitive: “Is descended from,” “born in same city as”
Non-transitive: “is friends with”, “lived at some point in same city as”

How transitive is a graph?
Some relations are transitive, others are not. But we don’t have to stop at “yes” or “no”.
How frequently are two friends of yours friends with each other?
• Always• Never• Something in between

How transitive is a graph?
Transitivity (or “clustering coefficient”) gives the probability that two random neighbors of the same vertex are neighbors to each other.
> transitivity(MaleNames)[1] 0.4972335> transitivity(FemaleNames)[1] 0.4546713> transitivity(Macbeth)[1] 0.4545455

How transitive is a graph?
In both name cases, two random neighbors have about a 50% chance of being connected (while two random vertices have about a 10% chance of being connected.) Quite transitive!
Facebook thinks the same is true for “friends” (and makes this so by thinking so!)
Stub: incompletely specified networks
Standard problem: incomplete data. Did X and Y collaborate? Lack of an edge might mean “we know they didn’t” or “we don’t know that they did.”
One idea: use network structure – if graph is highly transitive, and X and Y have many common collaborators, this is evidence that X and Y collaborated.

Metrics, clustering, trees
Suppose given: a set of objects (e.g. novels) and for each pair of objects a degree of dissimilarity (a number)
(survey data, lexical similarity, voting similarity…)
This data (subject to “triangle inequality”) is called a metric on the set of objects.

Metrics, clustering, trees
Can we associate each object with a point on the plane so that the distances between points correspond to the dissimilarities between objects?

Metrics, clustering, trees
Distance From City Distance To City Distance (km)Newark Jersey City 8.02Paterson Elizabeth 28.3Toms River Edison 65.4Trenton Camden 45.55Clifton Cherry Hill 126.24Passaic East Orange 11.84Union City North Bergen 2.92Irvington Bayonne 12.38South VinelandWayne 176.47Union Vineland 149.49New BrunswickBloomfield42.14Perth Amboy East Brunswick 15.46West Orange Plainfield 23.19West New York Hackensack 11.18Sayreville Junction Lakewood 41.97Atlantic City Sayreville 121.87Teaneck Linden 36.19……
Metrics, clustering, trees
Doesn’t always work: 4 objects, each pair at distance 1.
Multidimensional scaling: embeds objects in the plane (or higher-dimensional space) while approximately realizing desired distances.
(e.g. Rosenberg, Nelson, Vivekananthan (1968)


Hierarchical clustering
A clustering of a set is a partition into categories.A hierarchical clustering is when we partition
the categories into subcategories, subcategories into subsubcategories….
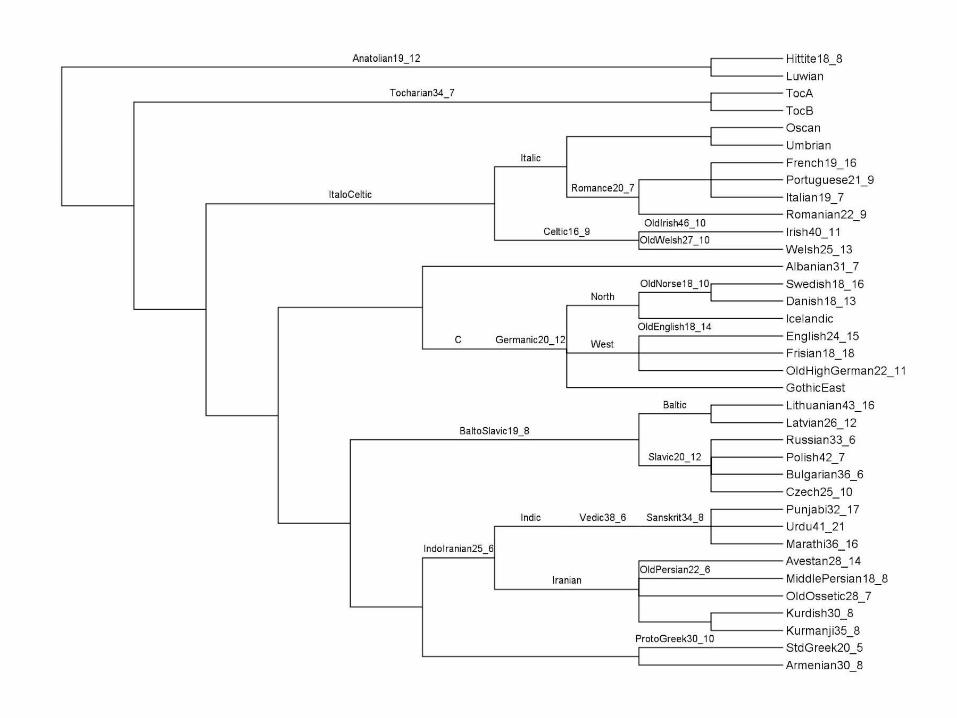
A hierarchical clustering on a set of objects is the same as a tree whose leaves are the objects!
Agglomerative clustering, etc. – find hierarchical clustering that best respects measured dissimilarities (analogue of MDS)
• Desideratum: objects that are very dissimilar should not be in the same subsubsubsubcategory (or: their distance in the tree should be large)

LET US HACK!