network viz - 1 - clement levallois · “network visualizations” ... netdraw pajek vosviewer...
TRANSCRIPT
24‐May‐13
1
“NETWORK VISUALIZATIONS”When do they make sense? Where to start?
Clement Levallois,Erasmus University RotterdamEhumanities group, Royal Netherlands Academy of Arts and Sciences (KNAW)
#cbs2013, May 24 2013
Bio notes
• Phd in History of economics
• Practice of digital methods of research since 2008
• Member of the Gephi Consortium, certified Gephi trainer.
• digital humanities, network analysis, natural language processing, data visualization, information retrieval, web applications …

24‐May‐13
2
Workshop
1. See your datasets differently
2. Insights to be gained
3. How to work with connected data
4. Good practices and red flags
5. Demo – in 10 minutes from Excel to a online viz
A note on the terminology
X Y
A “node”(also called a vertex, plural vertices).
An “edge”(or a tie, or a link…)
A directed network(the direction of the relation matters)
An undirected network(the direction of the relation does not matter)
A weighted network(the edges have a “strength” represented by a numerical value)
3
Y was born in …Y’s marital status is …Y’s latitude is …Y’s longitude is …
Nodes attributes(NB: edges can have attributes too!)
24‐May‐13
3
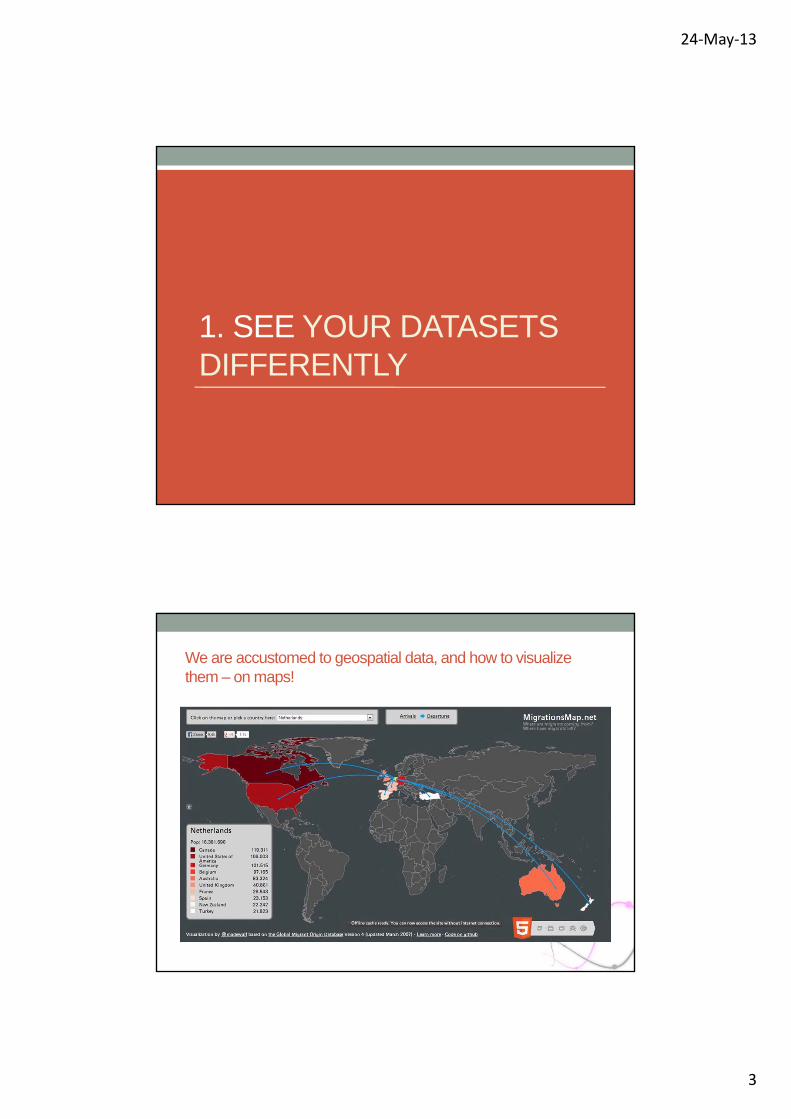
1. SEE YOUR DATASETS DIFFERENTLY
We are accustomed to geospatial data, and how to visualize them – on maps!
24‐May‐13
4
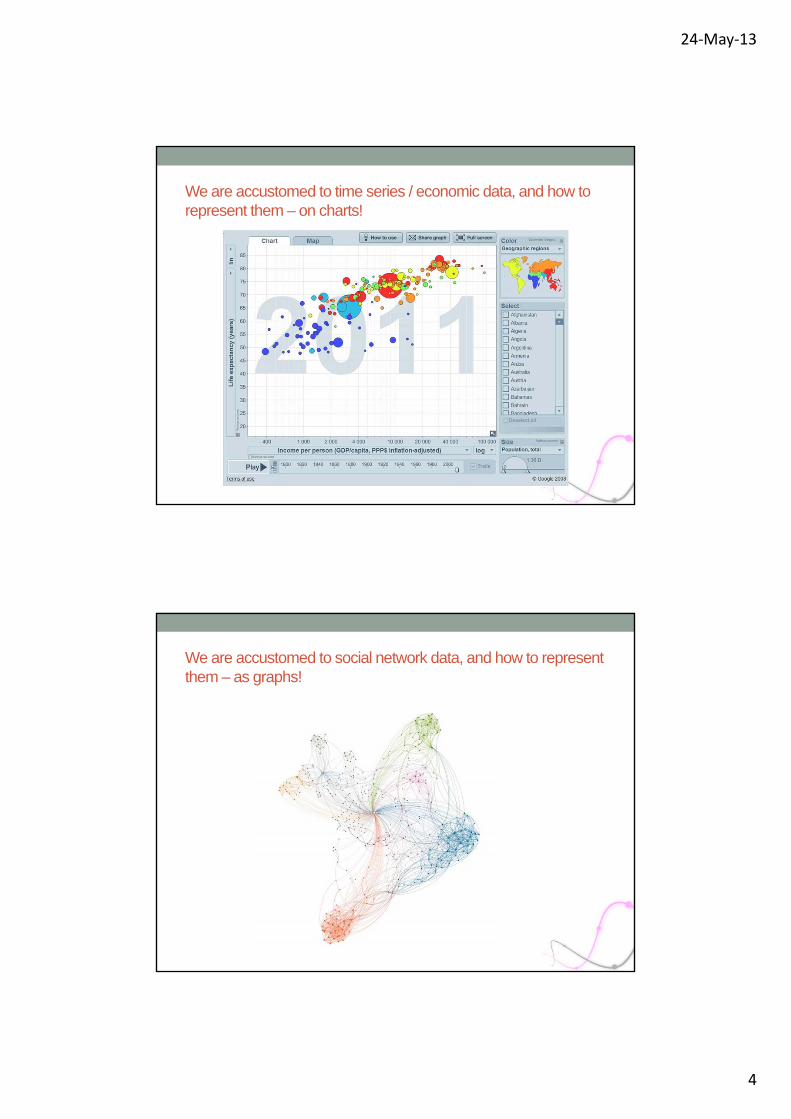
We are accustomed to time series / economic data, and how to represent them – on charts!
We are accustomed to social network data, and how to represent them – as graphs!

24‐May‐13
5
second example of a social network representation that makes intuitive sense.
Network data visualization does not stop at social networks
… or server logs.
When any form of bond exists between observations, these observations can be analyzed from the point of view of forming a network.
We have been so much trained to look at observations as independent entities, to be analyzed through aggregation…
… that we have lost sight that many datasets are actually rich of connections between individual data points, worth exploring.

24‐May‐13
6
Co-occurrences (Muesli ingredients)
credits:moritz.stefaner.eu – MüsliIngredient Network
Co-occurrences (all ingredients)
Map of flavors
2 flavors are connected
If they frequently appear in common recipes.

24‐May‐13
7
Co-occurrences (concepts)
Co-locationMap of product categories
2 products are connected
If they are frequently exported
by the same countries
24‐May‐13
8
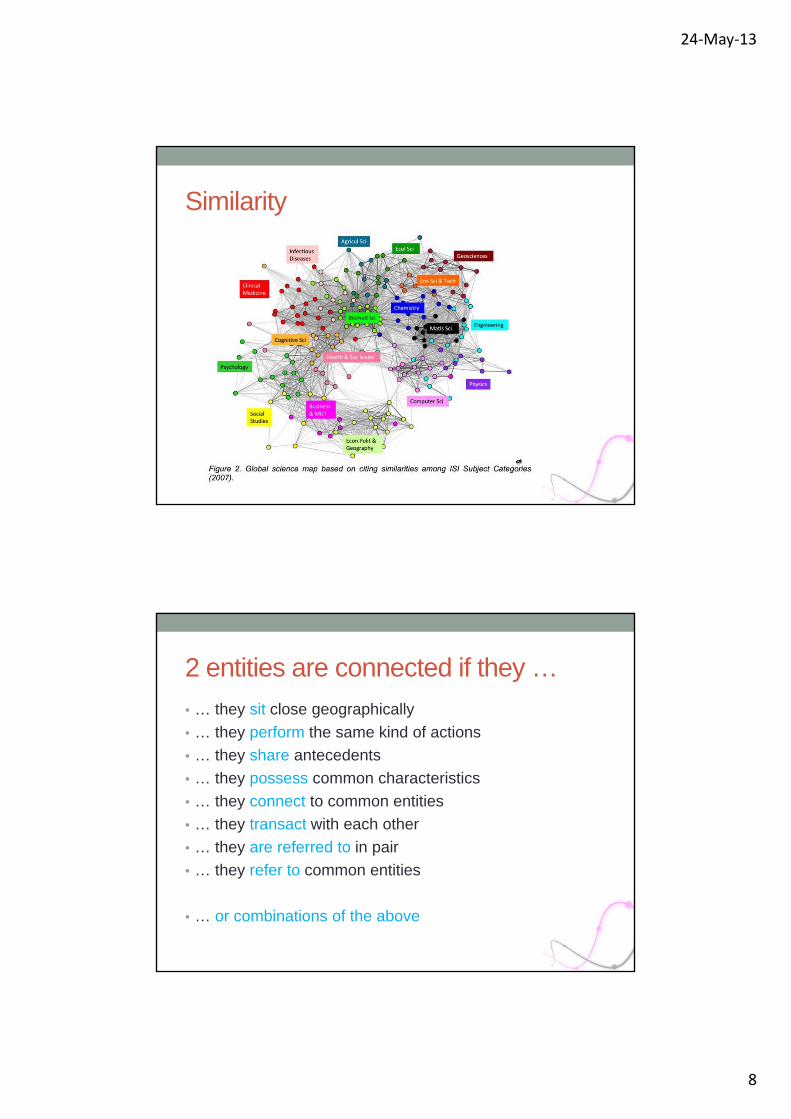
Similarity
2 entities are connected if they …
• … they sit close geographically
• … they perform the same kind of actions
• … they share antecedents
• … they possess common characteristics
• … they connect to common entities
• … they transact with each other
• … they are referred to in pair
• … they refer to common entities
• … or combinations of the above
24‐May‐13
9
2. INSIGHTS TO BE GAINED
1. Community detection
• A community / cluster is a group of nodes more densely connected with each other than with the rest of the network.
• How to define “more densely connected”, and how to calculate it efficiently, is research in progress.
• Two options:- Disjoint communities
- Overlapping communities
=> Research on disjoint communities is currently more advanced.

24‐May‐13
10
2. Sense of evolution, dynamics
• “Dynamics” in networks covers:
• Topology• Creation and deletion of nodes and edges
• Attributes• Change in the values of the quantitative and qualitative attributes of
nodes and edges
• Network analysis is focusing on the topology
• Network visualization (with Gephi) accommodates both.
24‐May‐13
11

24‐May‐13
12
3. Overlay analysis
Social network of scientists
Colored by they research interests.
Colored by they geographical location
4. “The picture-examining eye is the best finder we have of the wholly unanticipated.”
• Exploratory analysis:
Visualizing the network stimulates the process of forming hypotheses.
• Needs confirmatory analysis at a later stage:
Either with network statistics, or with “traditional” forms of statistics / numerical analysis.
24‐May‐13
13
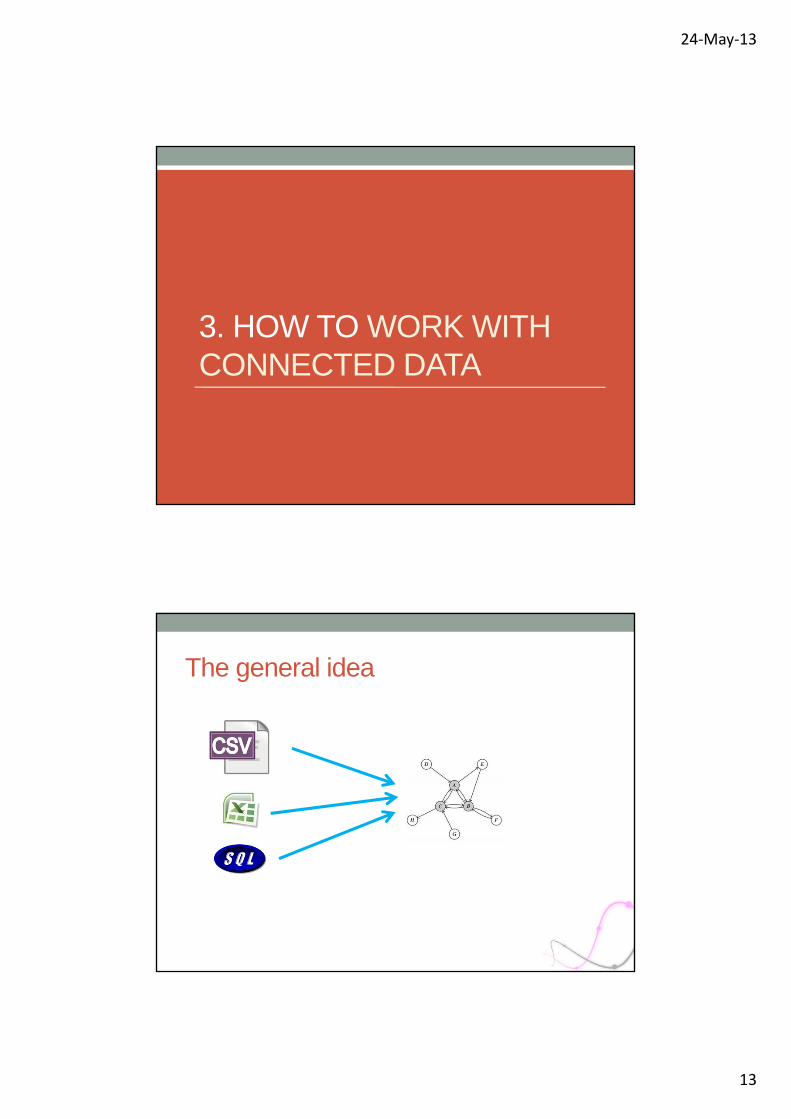
3. HOW TO WORK WITH CONNECTED DATA
The general idea

24‐May‐13
14
The stepsYOU START WITH
List / table of “observations”
1. Extract connected entities (a network!)
2. Format this network in a conventional standard
3. Display the network with a software package / in the
browser
Not many solutions!
Many solutions
Many solutions
Extract connections through similarities
GazeSimple program that creates networks from similarities
(available from www.clementlevallois.net)
John
Lili
Anna
1
24‐May‐13
15
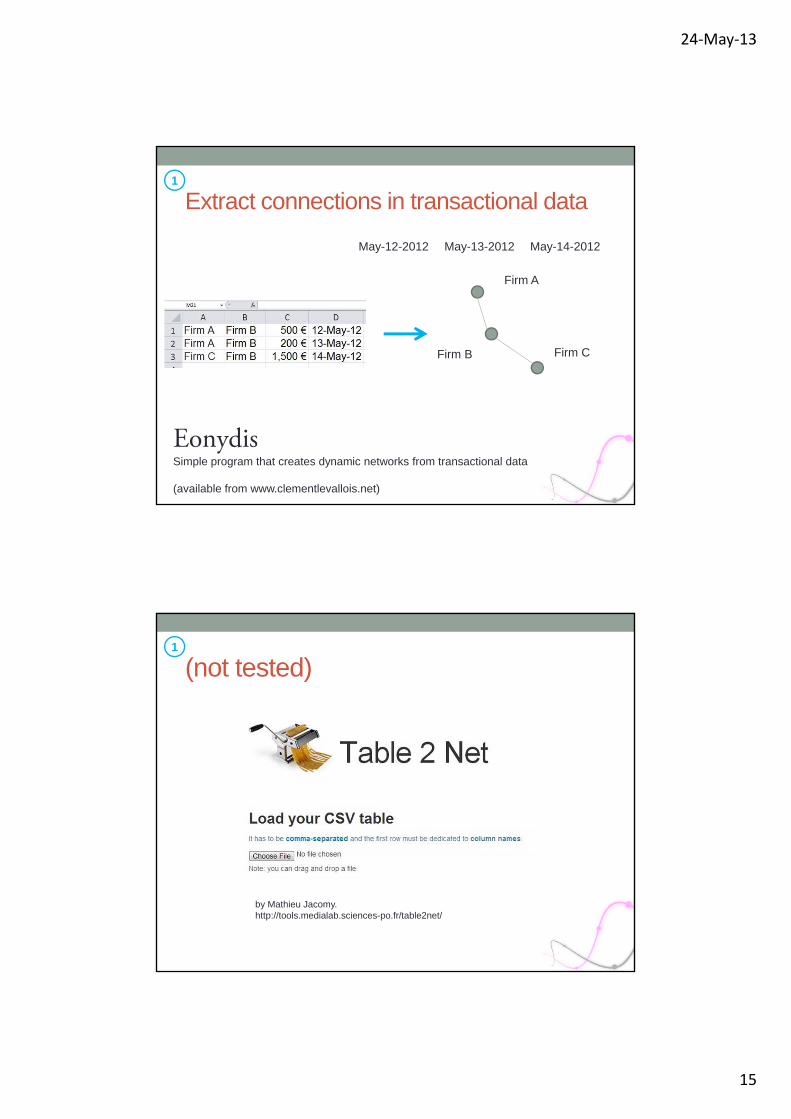
Extract connections in transactional data
Firm A
Firm B Firm C
EonydisSimple program that creates dynamic networks from transactional data
(available from www.clementlevallois.net)
May-12-2012 May-13-2012 May-14-2012
1
(not tested)1
by Mathieu Jacomy.http://tools.medialab.sciences-po.fr/table2net/

24‐May‐13
16
Format the network in a standard2
• A simple list of edges in a csv file is enough:
A,B
B,C
C,A
….
• Programming packaging for richer network formats (that include attributes for nodes and edges, and dynamics)
R, Python, Java…
Display the network3
in an Internet browser
More than 150 nodes?
vivagraph.js sigma.js, d3.js, gexf.js, jit.js, arbor.js, …
with a desktop software
GephiNodeXL
CytoscapeTulip
GuessNetdraw
PajekVosviewer
VisoneTableau
programmingpackages
PythonJava
R…
yes no

24‐May‐13
17
In an Internet browser
More than 150 nodes?
vivagraph.js sigma.js, d3.js, gexf.js, jit.js, arbor.js, …
desktop software,free and open source
GephiNodeXL
(also widely used)Netdraw
Pajek
(for semantic networks and heat-map style)
Vosviewer
(more experimental)Visone
programmingpackages
PythonJava
R…
yes no
GOOD PRACTICES AND RED FLAGS4 pieces of advice

24‐May‐13
18
this is *visual* analytics - making a network readable is not a sin
1
- add labels, captions
- curved versus straight edges
- color codes
this is not infographics – data are sacred
- size and position of nodes and edges are determined by a computational procedure
- choices in this domain depend on design (viz should be readable, engaging and insightful) but not at the expense of methodological soundness.
Same network, different centralities
Ref: http://en.wikipedia.org/wiki/File:Centrality.svg
A: degree centrality = local connectivity=> nodes having many edges are central
B: closeness centrality = “geographic” middle=> nodes that are close to all other nodes are central
C: betweenness centrality = connectivity=> nodes that lay on many shortest paths are central(a shortest path is the quickest way to go from one node to another)
D: Eigenvector centrality = authority=> nodes that are connected to highly ranked nodes are central (recursive approach).
Legend:
- centrality +
2

24‐May‐13
19
Directed, undirected, weighted networks: it matters!3
G E
DF
Legend:
- centrality +
A
CB
GE
DFA
CB
1: directed network
2: same network, but undirected
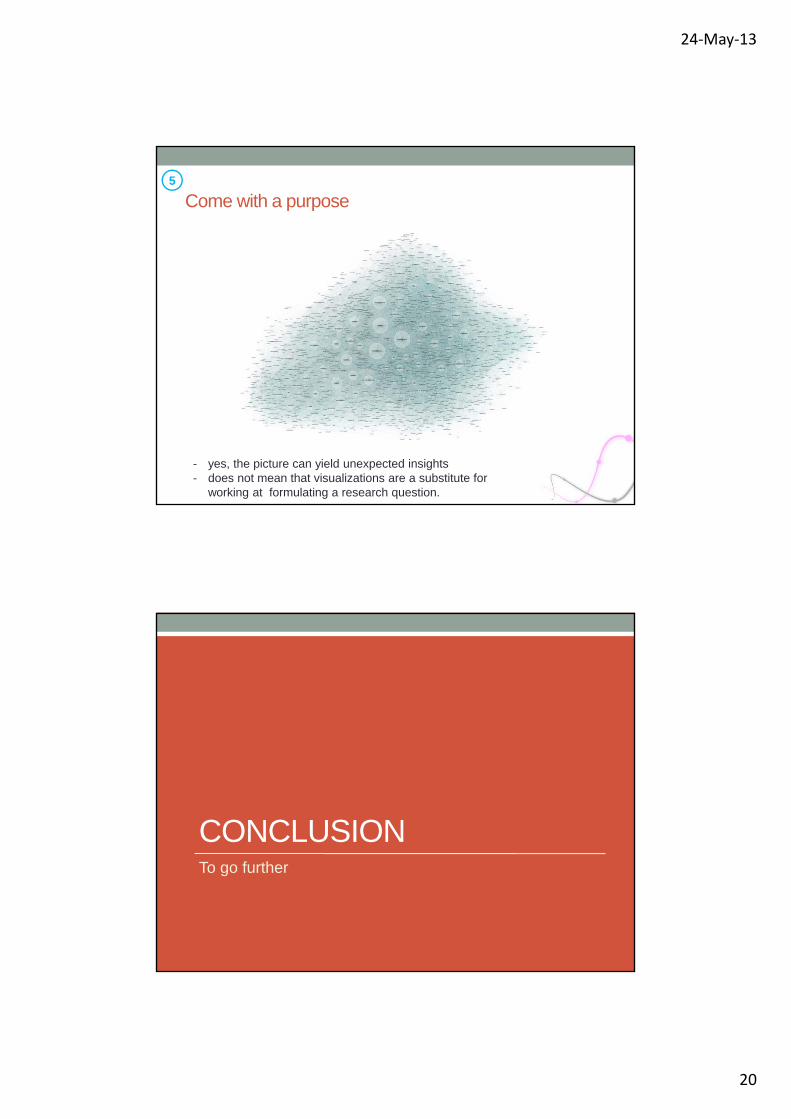
The problem of hairballs- when networks fail to reveal structure
4
24‐May‐13
20
Come with a purpose5
- yes, the picture can yield unexpected insights- does not mean that visualizations are a substitute for
working at formulating a research question.
CONCLUSIONTo go further
24‐May‐13
21
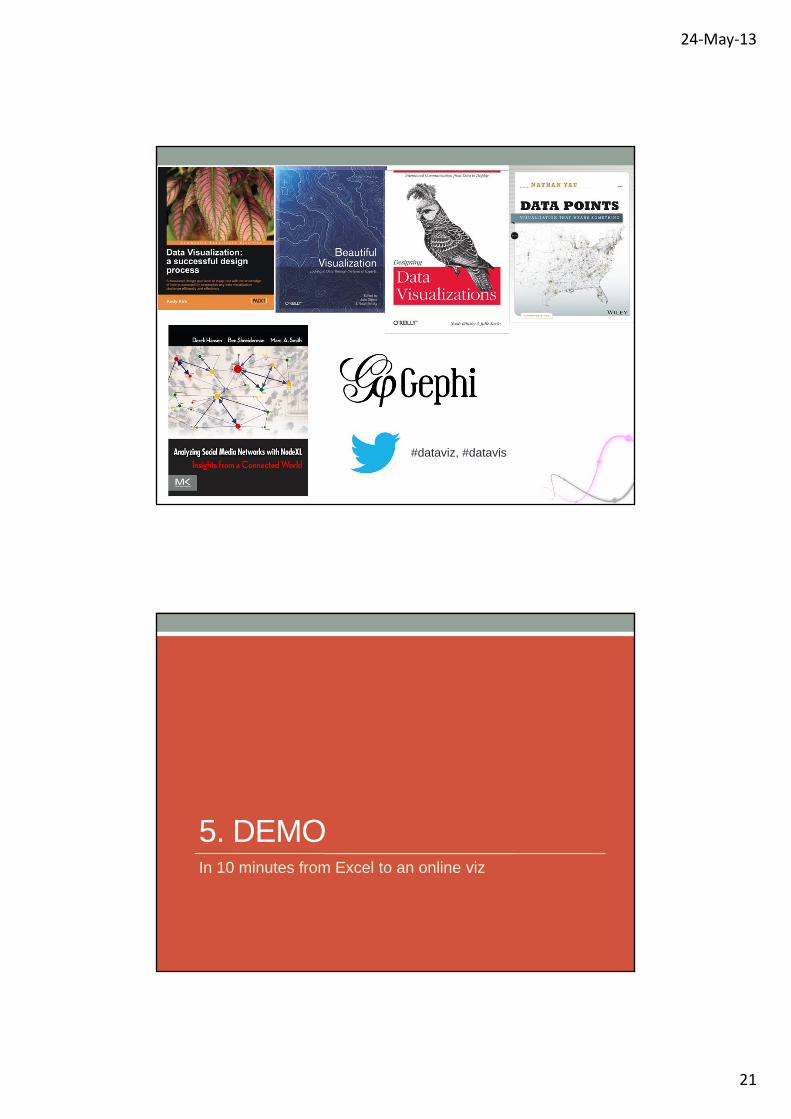
#dataviz, #datavis
5. DEMOIn 10 minutes from Excel to an online viz
24‐May‐13
22
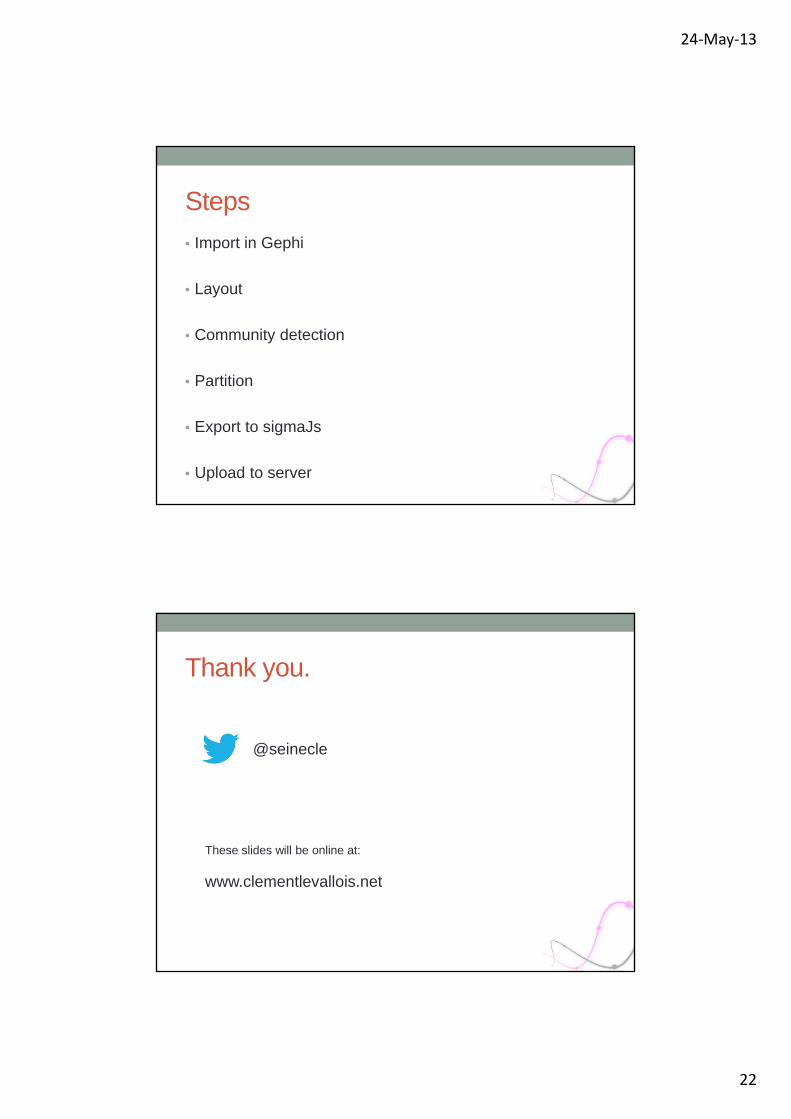
• Import in Gephi
• Layout
• Community detection
• Partition
• Export to sigmaJs
• Upload to server
Steps
Thank you.
@seinecle
These slides will be online at:
www.clementlevallois.net
24‐May‐13
23
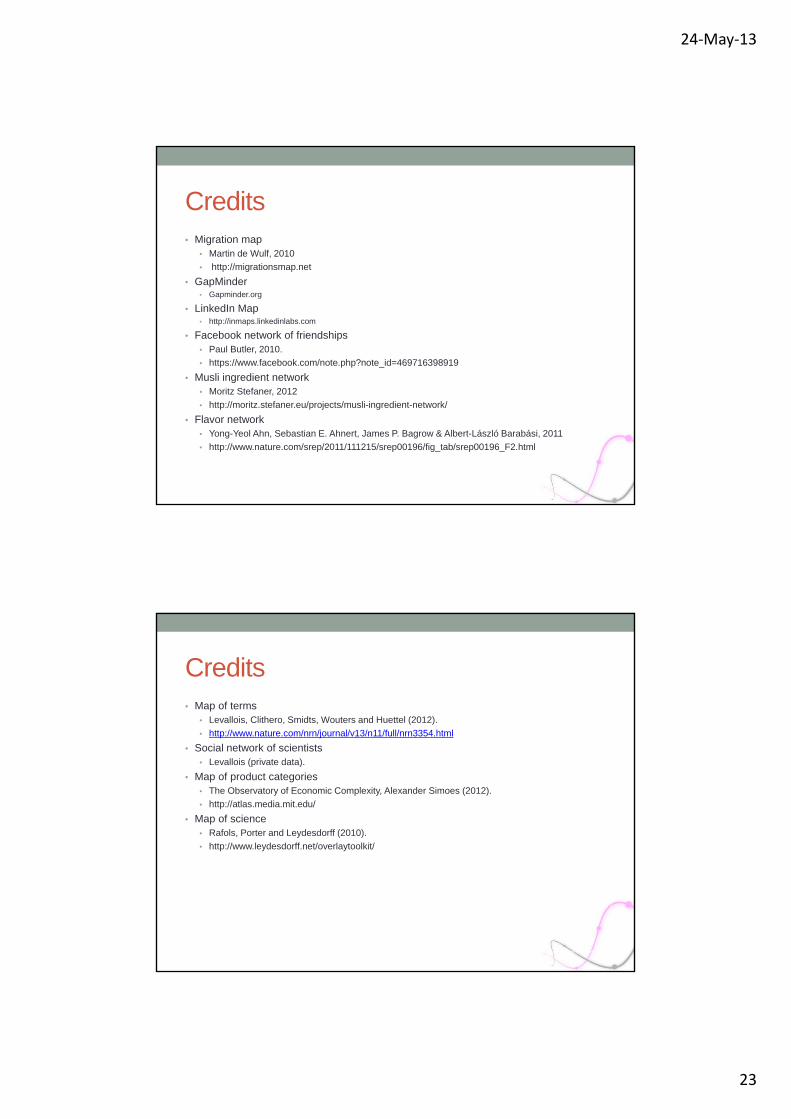
Credits• Migration map
• Martin de Wulf, 2010
• http://migrationsmap.net
• GapMinder• Gapminder.org
• LinkedIn Map• http://inmaps.linkedinlabs.com
• Facebook network of friendships• Paul Butler, 2010.
• https://www.facebook.com/note.php?note_id=469716398919
• Musli ingredient network• Moritz Stefaner, 2012
• http://moritz.stefaner.eu/projects/musli-ingredient-network/
• Flavor network• Yong-Yeol Ahn, Sebastian E. Ahnert, James P. Bagrow & Albert-László Barabási, 2011
• http://www.nature.com/srep/2011/111215/srep00196/fig_tab/srep00196_F2.html
Credits• Map of terms
• Levallois, Clithero, Smidts, Wouters and Huettel (2012).
• http://www.nature.com/nrn/journal/v13/n11/full/nrn3354.html
• Social network of scientists• Levallois (private data).
• Map of product categories• The Observatory of Economic Complexity, Alexander Simoes (2012).
• http://atlas.media.mit.edu/
• Map of science• Rafols, Porter and Leydesdorff (2010).
• http://www.leydesdorff.net/overlaytoolkit/