network evolution (28.11.5 - 60 min.)
DESCRIPTION
Network Evolution (28.11.5 - 60 min.). Networks in Cellular Biology A. Metabolic Pathways B. Regulatory Networks C. Signaling Pathways D. Protein Interaction Networks - PIN E. Other Networks The Internet Statistics of Networks Comparing Networks Network Matching - PowerPoint PPT PresentationTRANSCRIPT
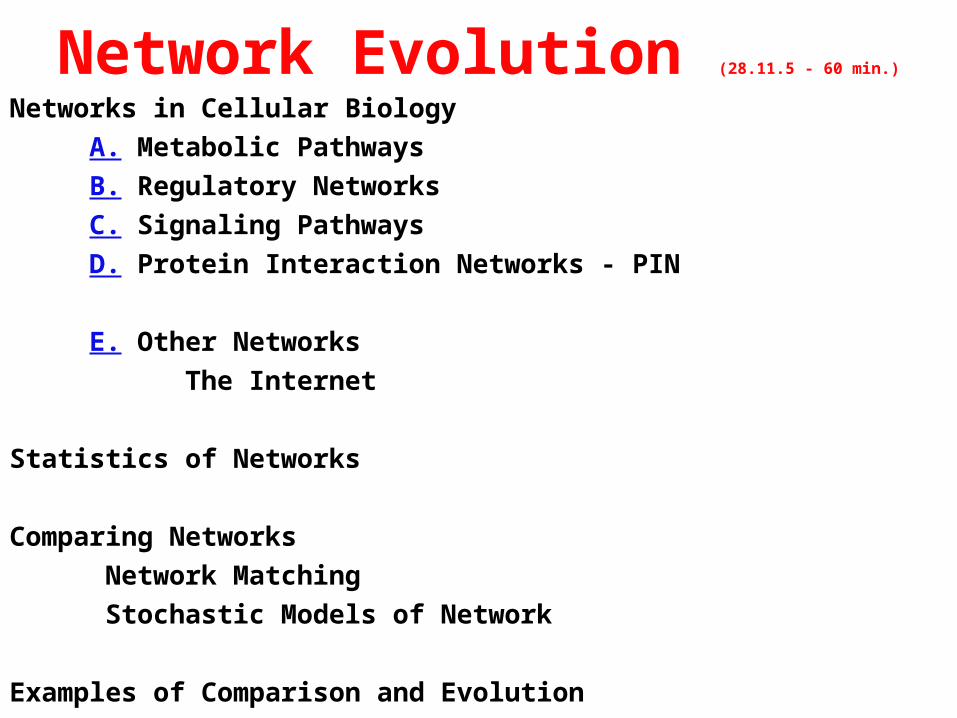
Network Evolution (28.11.5 - 60 min.)
Networks in Cellular Biology
A. Metabolic Pathways
B. Regulatory Networks
C. Signaling Pathways
D. Protein Interaction Networks - PIN
E. Other Networks
The Internet
Statistics of Networks
Comparing Networks
Network Matching
Stochastic Models of Network
Examples of Comparison and Evolution
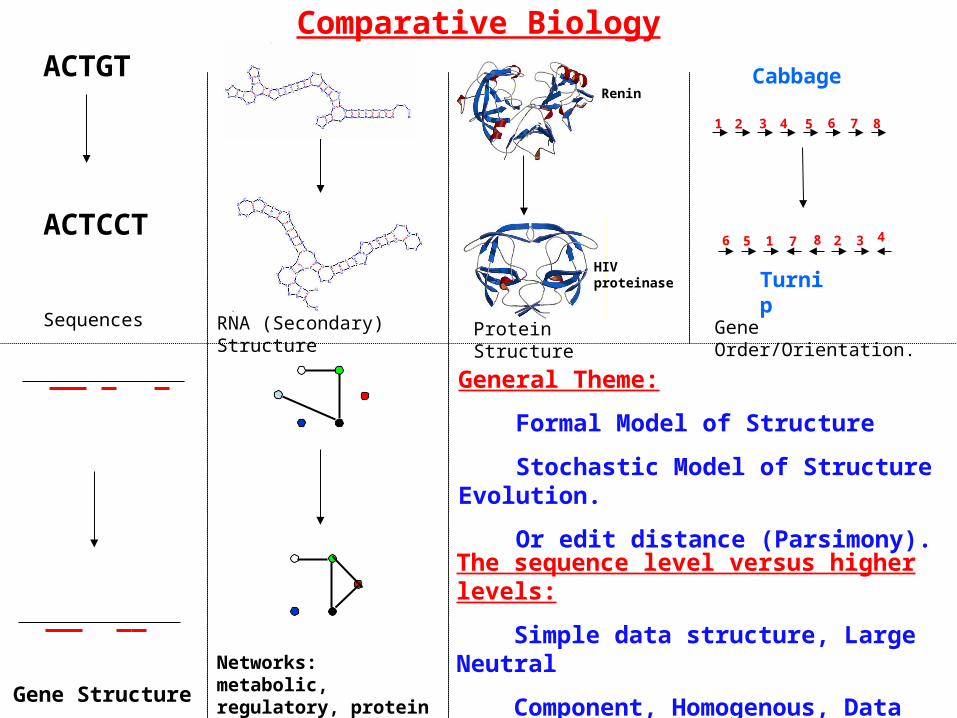
Comparative Biology
RNA (Secondary) StructureSequences
ACTGT
ACTCCT
Protein Structure
87654321
4
Cabbage
Turnip
75 31 86 2
Gene Order/Orientation.
Gene Structure
Networks: metabolic, regulatory, protein interaction,..
General Theme:
Formal Model of Structure
Stochastic Model of Structure Evolution.
Or edit distance (Parsimony).
Renin
HIV proteinase
The sequence level versus higher levels:
Simple data structure, Large Neutral
Component, Homogenous, Data rich
The Golden Age of Bioinformatics
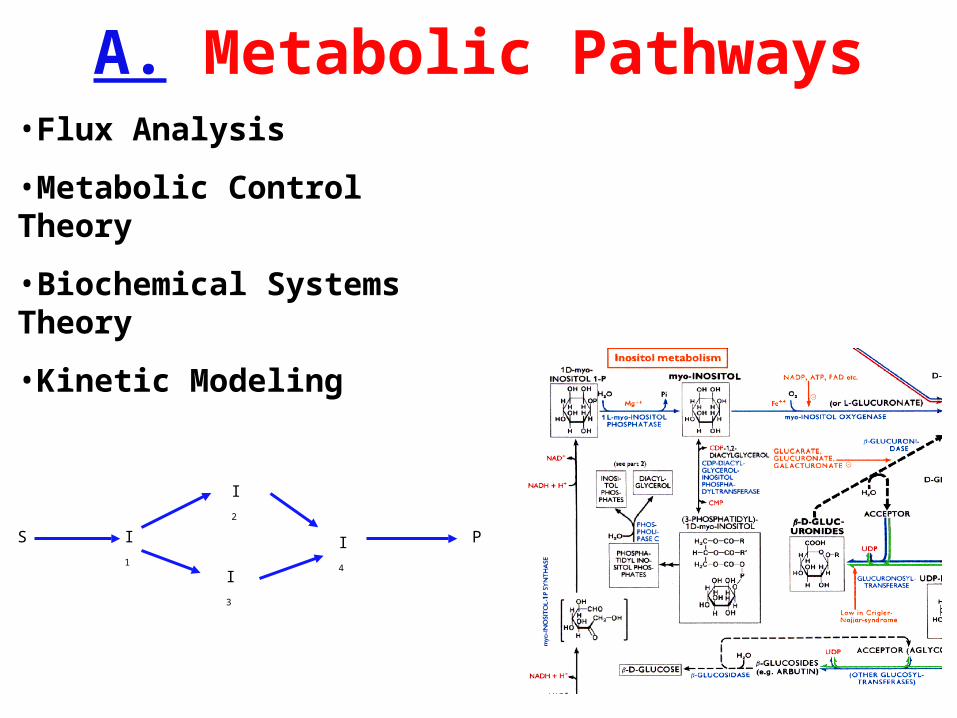
A. Metabolic Pathways
S P
I2
I4
I3
I1
•Flux Analysis
•Metabolic Control Theory
•Biochemical Systems Theory
•Kinetic Modeling
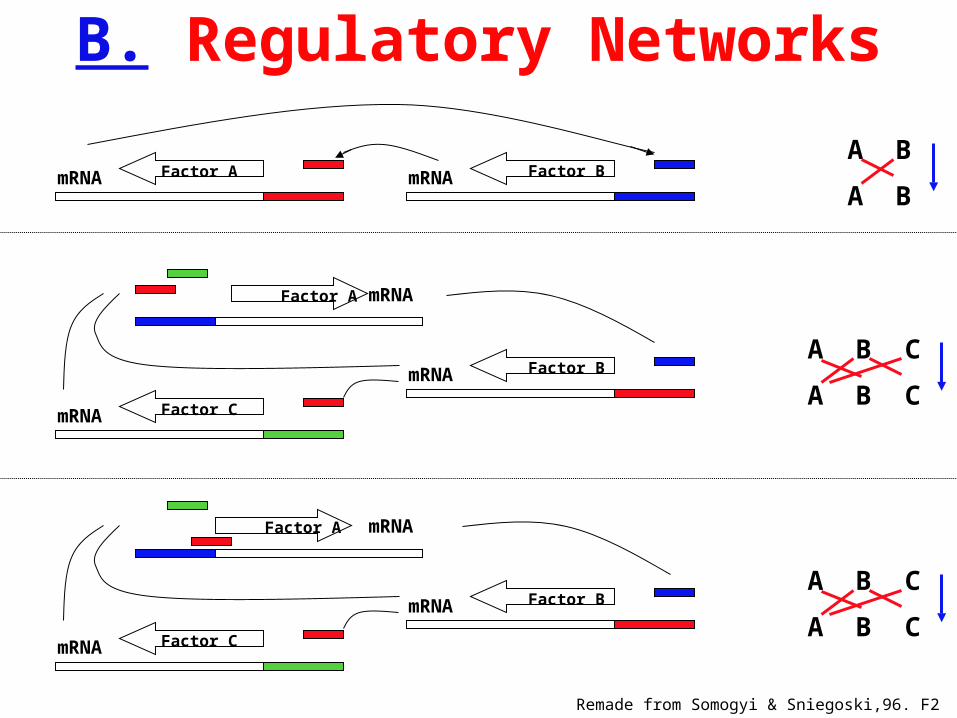
Remade from Somogyi & Sniegoski,96. F2
A B
A B
A B
A B
C
C
mRNA mRNAFactor A Factor B
mRNA
mRNA
Factor C
Factor B
mRNAFactor A
A B
A B
C
CmRNA
mRNA
Factor C
Factor B
mRNAFactor A
B. Regulatory Networks
Remade from Somogyi & Sniegoski,96. F4
A B
A B
C
C
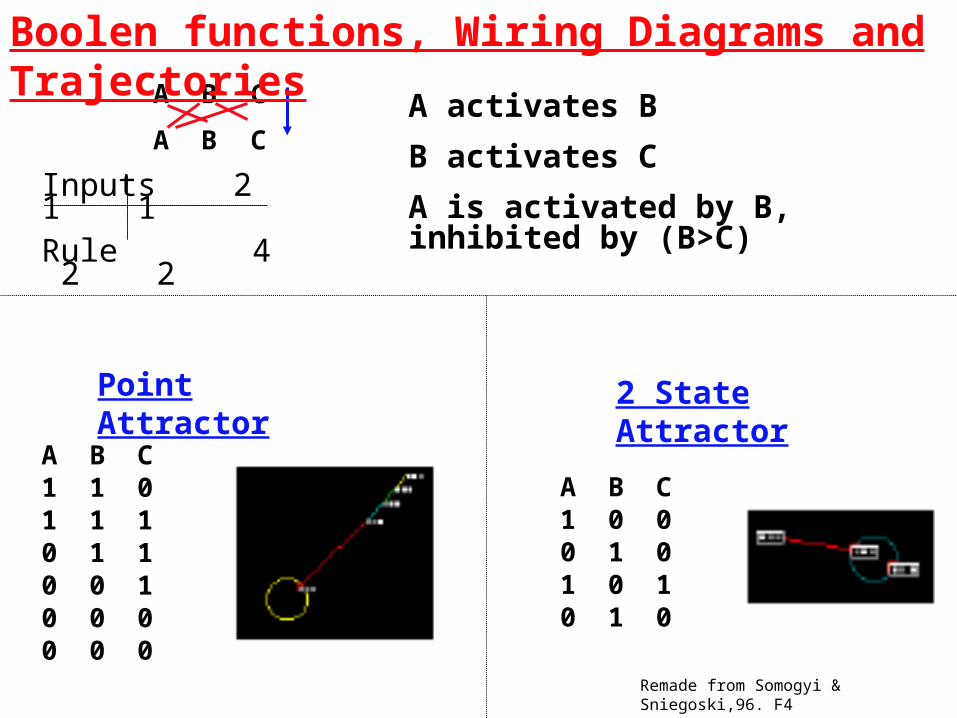
Boolen functions, Wiring Diagrams and Trajectories
Inputs 2 1 1Rule 4 2 2
A activates B
B activates C
A is activated by B, inhibited by (B>C)
Point Attractor 2 State Attractor
A B C1 1 01 1 10 1 10 0 10 0 00 0 0
A B C1 0 00 1 01 0 10 1 0
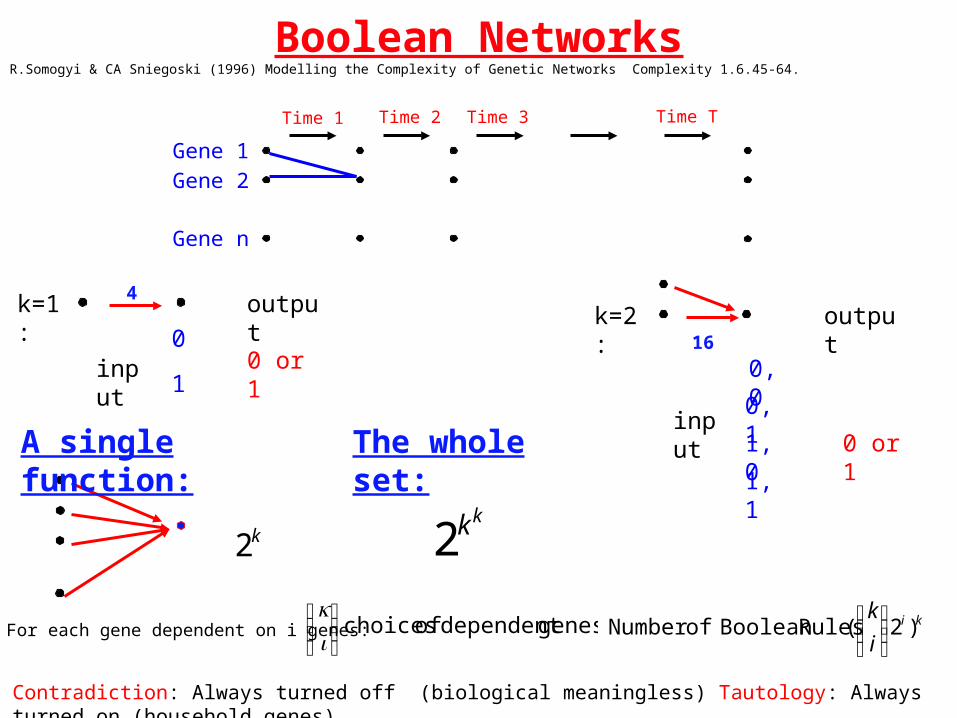
For each gene dependent on i genes: genes.dependent of choices ⎟⎟⎠
⎞⎜⎜⎝
⎛ik
k=1:
input
output
0
10 or 1
Contradiction: Always turned off (biological meaningless) Tautology: Always turned on (household genes)
k=2:
input
output
0,0
0,1
1,0
1,1
0 or 1
kk2
4
16
ki
i
k)2 ( Rules BooleanofNumber ⎟⎟
⎠
⎞⎜⎜⎝
⎛
A single function:
k2
The whole set:
Gene 2
Gene n
Gene 1
Time 1 Time 2 Time 3 Time T
Boolean NetworksR.Somogyi & CA Sniegoski (1996) Modelling the Complexity of Genetic Networks Complexity 1.6.45-64.
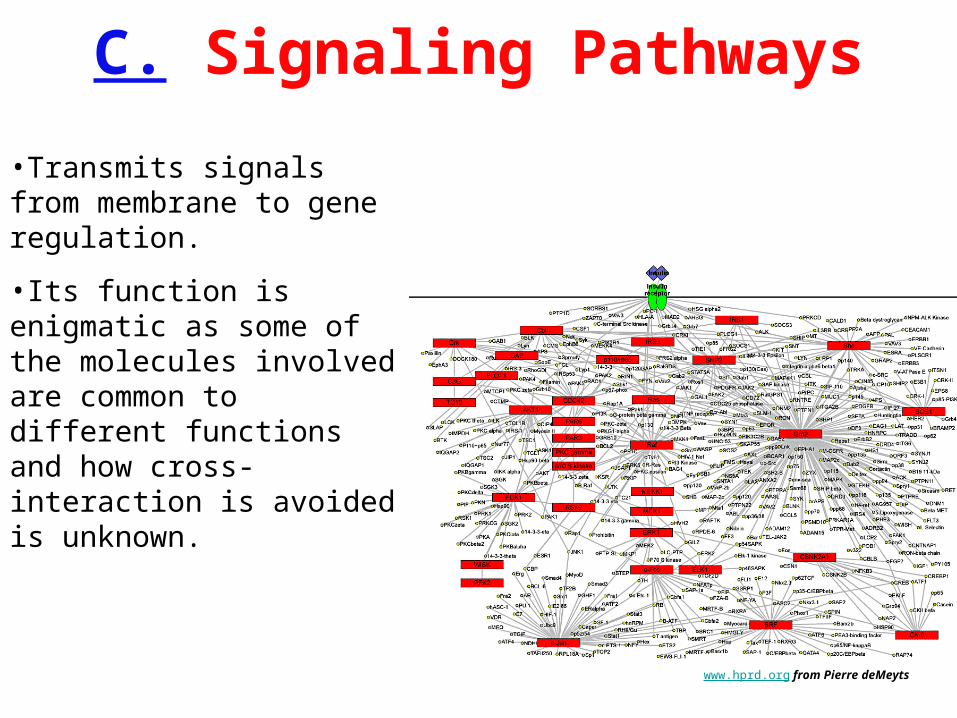
C. Signaling Pathways
www.hprd.org from Pierre deMeyts
•Transmits signals from membrane to gene regulation.
•Its function is enigmatic as some of the molecules involved are common to different functions and how cross-interaction is avoided is unknown.
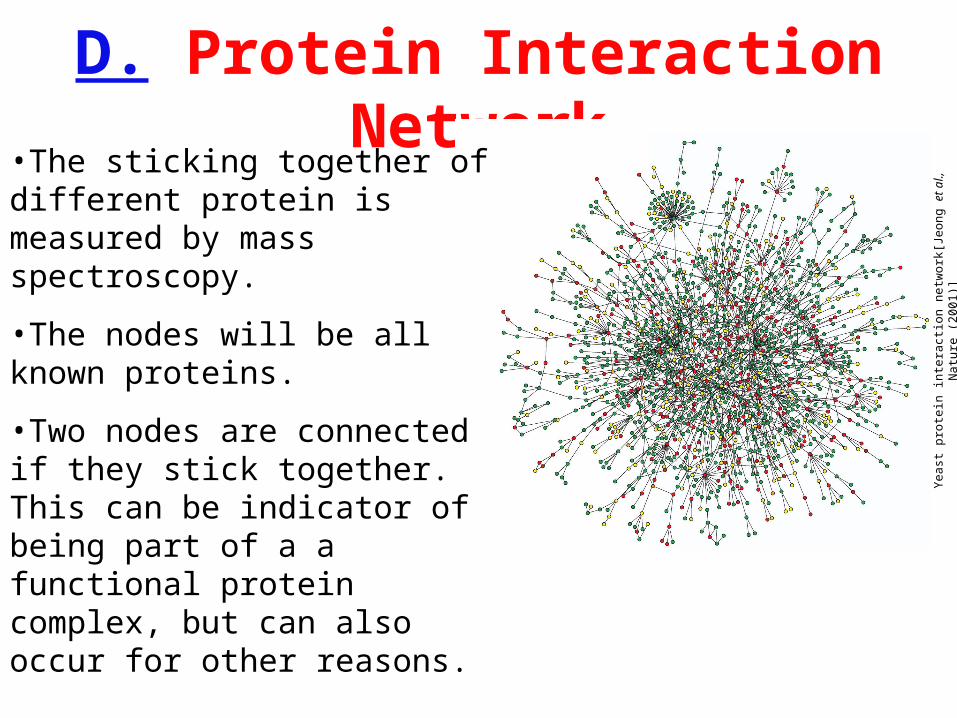
D. Protein Interaction Network
Yea
st p
rote
in in
tera
ctio
n n
etw
ork
[Je
on
g e
t al
., N
atu
re (
20
01
)]•The sticking together of different protein is measured by mass spectroscopy.
•The nodes will be all known proteins.
•Two nodes are connected if they stick together. This can be indicator of being part of a a functional protein complex, but can also occur for other reasons.
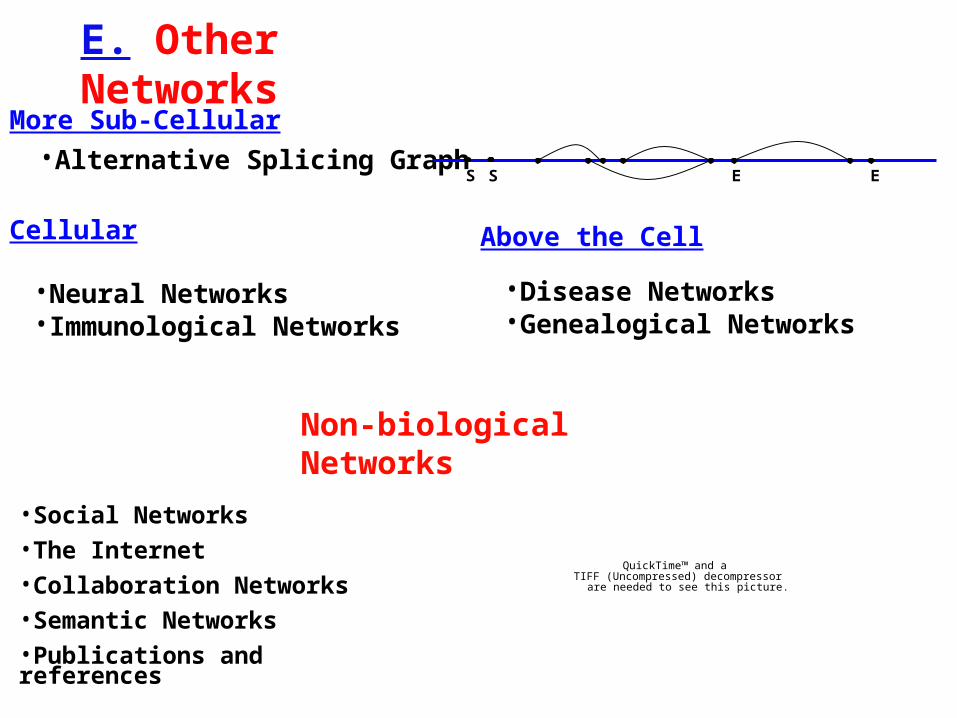
E. Other Networks
QuickTime™ and aTIFF (Uncompressed) decompressor
are needed to see this picture.
•Neural Networks•Immunological Networks
Cellular
•Disease Networks•Genealogical Networks
Above the Cell
Non-biological Networks
•Social Networks•The Internet•Collaboration Networks•Semantic Networks•Publications and references
•Alternative Splicing Graph
More Sub-Cellular
EES S
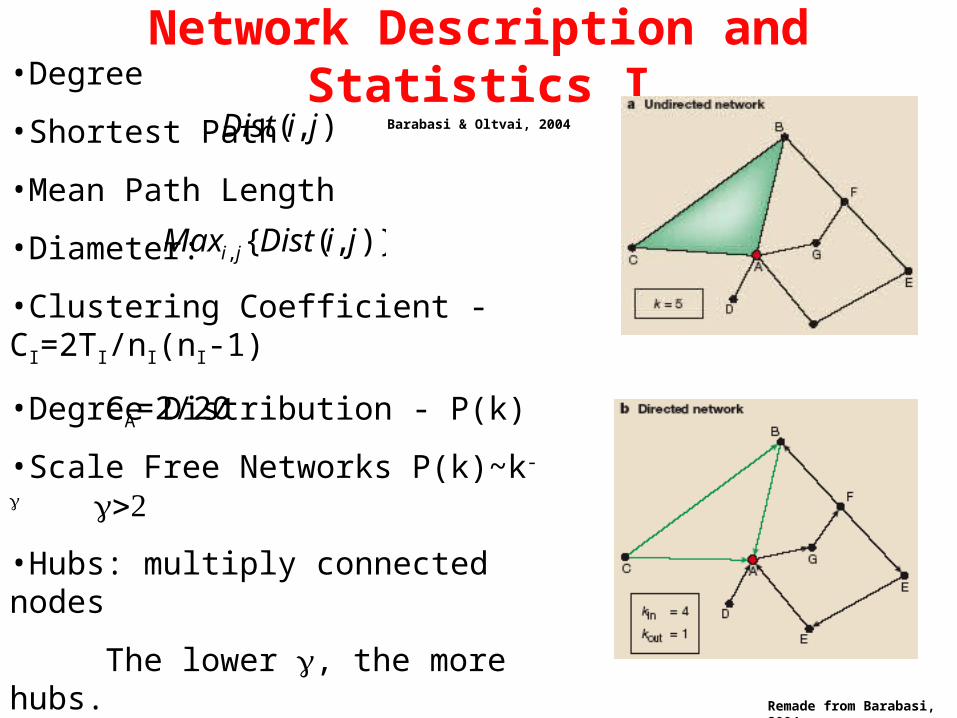
Network Description and Statistics IBarabasi & Oltvai, 2004
Remade from Barabasi, 2004
•Degree
•Shortest Path
•Mean Path Length
•Diameter:
•Clustering Coefficient - CI=2TI/nI(nI-1)
CA=2/20•Degree Distribution - P(k)
•Scale Free Networks P(k)~k-
•Hubs: multiply connected nodes
The lower , the more hubs.
Small World Property:
Graph connected and path lengths small
€
Maxi, j{Dist(i, j)}€
Dist(i, j)
€
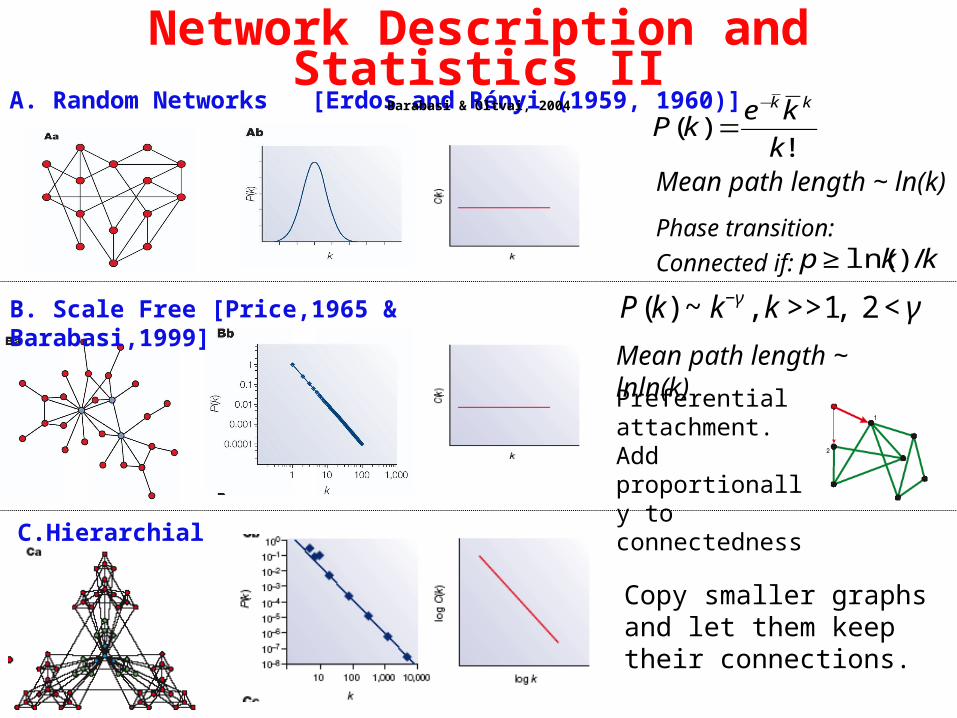
P(k) ~ k−γ , k >>1, 2 < γ
!)(
k
kekP
kk−
=A. Random Networks [Erdos and Rényi (1959, 1960)]
B. Scale Free [Price,1965 & Barabasi,1999]
C.Hierarchial
Network Description and Statistics IIBarabasi & Oltvai, 2004
Mean path length ~ ln(k)
Phase transition:
Connected if:
€
p ≥ ln(k) /k
Preferential attachment. Add proportionally to connectedness
Mean path length ~ lnln(k)
Copy smaller graphs and let them keep their connections.
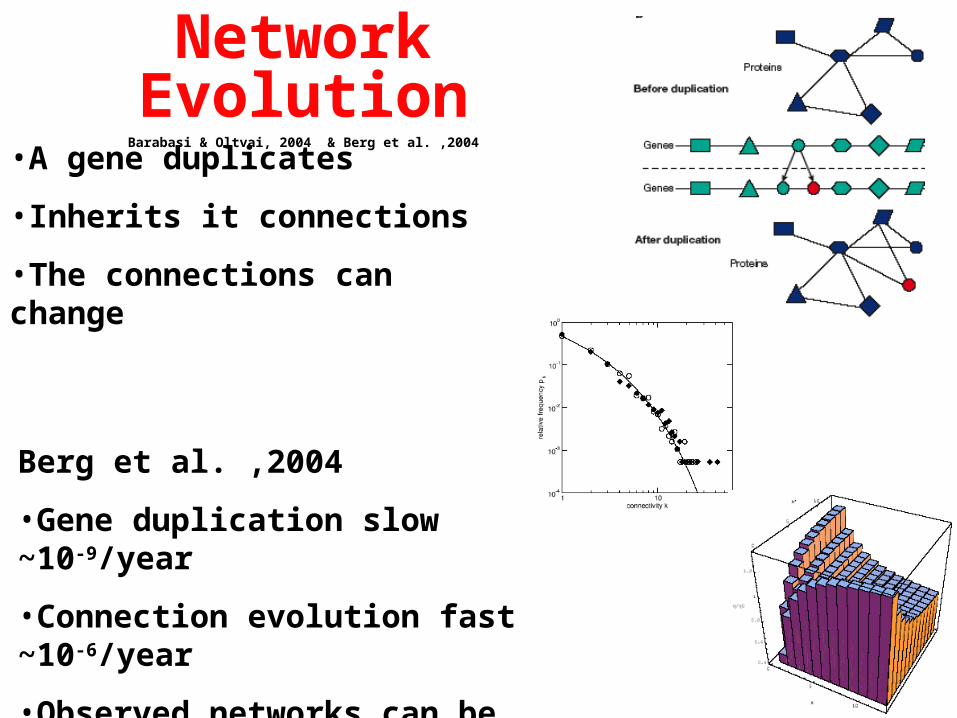
Network EvolutionBarabasi & Oltvai, 2004 & Berg et al. ,2004
•A gene duplicates
•Inherits it connections
•The connections can change
Berg et al. ,2004
•Gene duplication slow ~10-9/year
•Connection evolution fast ~10-6/year
•Observed networks can be modeled as if node number was fixed.
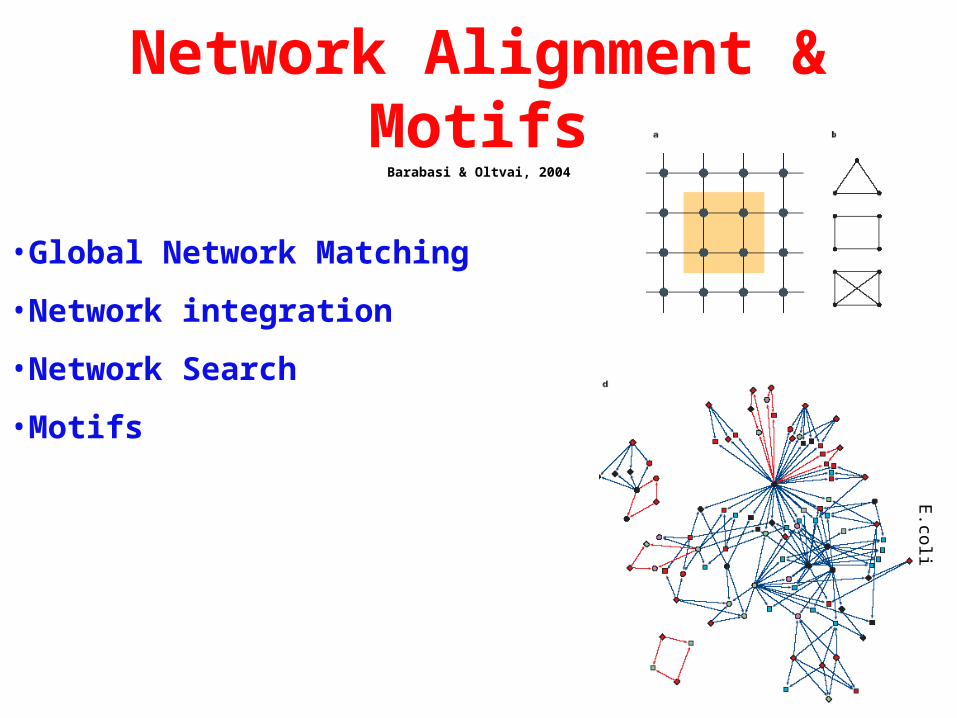
Network Alignment & MotifsBarabasi & Oltvai, 2004
•Global Network Matching
•Network integration
•Network Search
•Motifs
E.coli
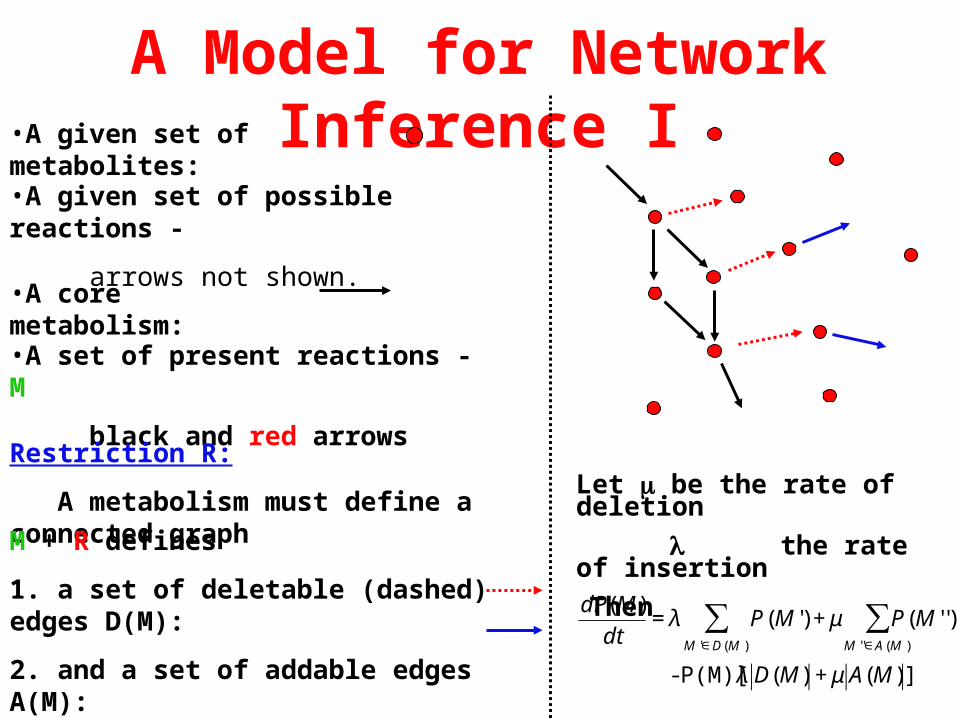
A Model for Network Inference I•A given set of metabolites:
•A core metabolism:
•A given set of possible reactions -
arrows not shown.
•A set of present reactions - M
black and red arrows
Restriction R:
A metabolism must define a connected graph
M + R defines
1. a set of deletable (dashed) edges D(M):
2. and a set of addable edges A(M):
Let be the rate of deletion the rate of insertionThen
€
dP(M)
dt= λ P(M ') + μ P(M ' ')
M ''∈A (M )
∑M '∈D(M )
∑
- P(M)[λ D(M) + μ A(M) ]
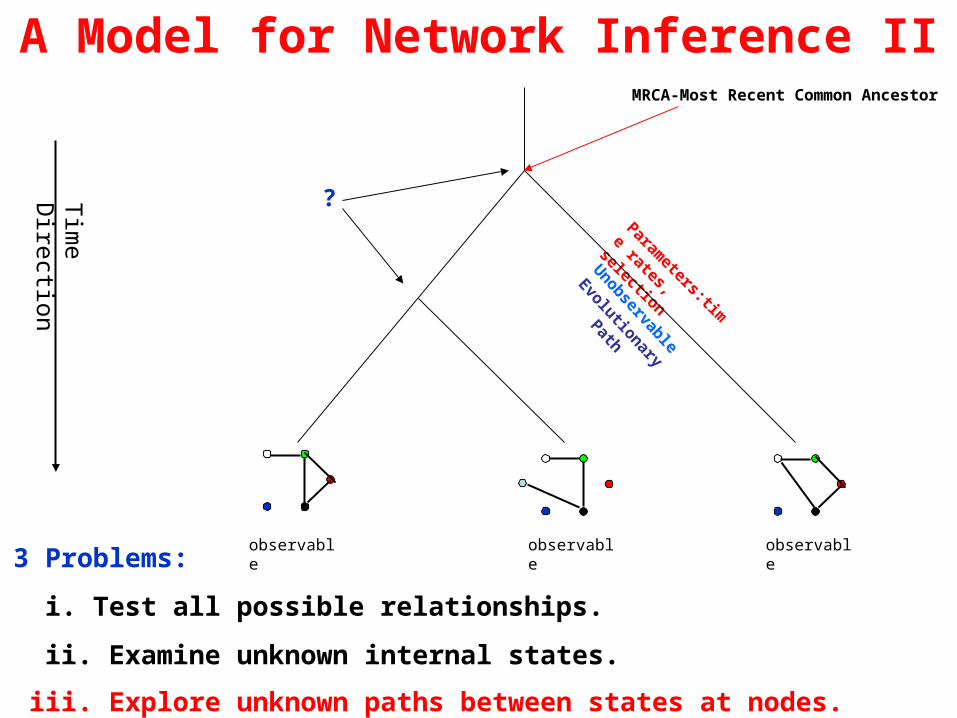
A Model for Network Inference II
observable observable
Parameters:tim
e
rates, selection
Unobservable
Evolutionary Path
observable
MRCA-Most Recent Common Ancestor
?
3 Problems:
i. Test all possible relationships.
ii. Examine unknown internal states.
iii. Explore unknown paths between states at nodes.
Tim
e Direction
Recommended Literature A.Cornish-Bowden (1995) Fundamentals of Enzyme Kinetics Portland Press
David Fell (1997) Understanding the Control of Metabolism. Portland Press.
Gottschalk (1987) Bacterial Metabolism (2nd edition) Springer
R. Heinrich & S.Schuster (1996) The Regulation of Cellular Systems. Chapman and Hall.
Gerhard Michal (ed.) (1999) Biochemical Pathways. Wiley
Savageau, M.(1976.) Biochemical Systems Theory. Addison-Wesley.
Stephanopoulos, G. et al. (1999) Metabolic Engineering. Academic Press.
Dandekar, T. et al. (1999) Pathway Alignment: application to the comparative analysis of glycolytic enzymes. J. Biochem. 343.115-124.
JS Edwards et al (2001) In silico predictions of E.coli metabolic capabilities are consistent with experimental data. Nature Biotechnoology 19.Feb. 125-130.
Karp, P (2001) Pathway Databases: A Case Study in Computational Symbolic Theories. Science 293.2040-
Schuster, S et al. (1999) Detection of elementary flux modes in biochemical networks. TIBTech vol 17.53-59.
Schilling, C., D.Letscher and B.O.Palsson. (2000) J. Theor.Biol.203.229-248. “Theory for the Systemic Definition of Metabolic Pathways from a Pathway-Oriented Perspective.”
Schilling, C and B.O.Palsson. (2000) J. Theor.Biol.203.249-283. “Assessment of the Metabolic Capabilities of Haemophilus influenzae Rd. through a Genome-scale Pathway Analysis.”
Schuster, S et al. (1999) Detection of elementary flux modes in biochemical networks. TIBTech vol 17.53-59.
P.D’haeseleer, Liang & Somogyi (2000) Genetic network inference: from co expression clustering to reverse engineering. Bioinformatics 16.8.707-726
T.Akutsu, Miyano & Kuhara (2000) Inferring qualitative relations in genetic networks and metabolic pathways. Bioinformatics 16.8.727-734.
Liang & Somogyi (1998) Genetic network inference: from co-expression clustering to reverse engineering. PSB
T.Akutsu, Miyano & Kuhara (1999) Identification of genetic networks from a small number of gene expression patterns under the boolean network model. PSB 4.17-28