network calculations ct5550 - tu delft ocw
TRANSCRIPT

February 15, 2008
Pumping stations and water transport
Network calculationsct5550

February 15, 2008 2
Introduction
• Pipe networks are complicated systems• Analysing networks needs computer simulation• Two types of modelling:
• Sewerage or urban drainage models: open channel flow and transition periods
• Drinking water: pressurised pipe

February 15, 2008 3
From reality to calculation
(3 systematic errors)
Real world Mathematical descriptionTime/space continuum
Computer programRecurrence relationsDiscretised time and
space
simplificationD
iscretisation
Algorithm
3 sy
stem
atic
al e
rror
s

February 15, 2008 4
Drinking water modelling: filled pipe, basic equations
unknown oneith equation w One Re32,01
3log21
Colebrook- White
0826,02
bachDarcy Weis
25
2
12
•
⎥⎦
⎤⎢⎣
⎡+−=
•
==−=Δ
•
λλ
λλ
Dk
QDL
gv
DLHHH
N
February 15, 2008 5
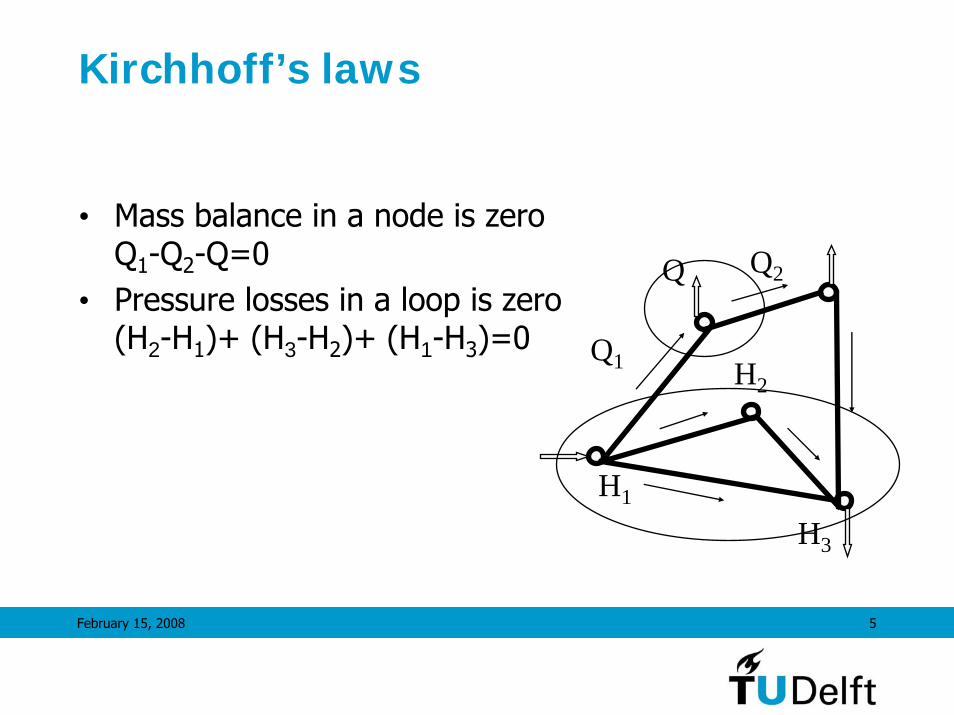
Kirchhoff’s laws
• Mass balance in a node is zeroQ1-Q2-Q=0
• Pressure losses in a loop is zero(H2-H1)+ (H3-H2)+ (H1-H3)=0 Q1
Q2Q
H1
H2
H3

February 15, 2008 6
Set of equations
• Consider a network with N nodes and X pipes• Q2
x = f(ΔHn) = f(Hn – H(n-1))• X equations with N unknown• N node-equations (ΣQx=0)
with n (Hn) unknown• Reduced to a set of N equations with N unknown• Complication: non-linear relation between
Q and H
February 15, 2008 7
Solving methods
• Hardy-Cross: pressure equalisation method• Assume pressures in all nodes• Take one node and adjust pressure until mass
balance equals zero (Kirchhoff’s first law)• Take next node and adjust pressure until….• Repeat until Δp < threshold
• Can be done manually• First computerised calculations
February 15, 2008 8
Solving methods
• Hardy-Cross: volume flow equalisation method• Assume pressures in all nodes• Take one loop and adjust volume flows with ΔQ
until sum of pressure losses equals zero (Kirchhoff’s second law)
• Take next loop and…..• Calculate pressures and repeat flow adjustments
until ΔQ < threshold• Computerised calculations

February 15, 2008 9
Solving methods: Linear programming
• Linearisation: Q2
x = f(ΔHn) => Q*x*Qx=R(H2- H1)
• With an estimation of Q the equations become linear and can be solved with matrices (n*n symmetric matrix)
• Iteratively the solution is found• Estimated Q*
x is corrected with calculated Qx, and so on
• Only possible with computers: memory is no longer a limitation

February 15, 2008 10
Accuracy of the calculation
• Lots of data necessary to calculate the pressures and volume flows
• 10% error in diameter gives 40% error in pressure drop
H
QLDH
Δ=Δ
=Δ
62,01,1
1:Herror
0826,0
5
2
5
λ

February 15, 2008 11
Accuracy of the calculation
• 10% error in volume flow gives 20% error in pressure drop
HDL QH
Δ=Δ
=Δ
21,11,1:Herror
0826,0
2
25
λ

February 15, 2008 12
Accuracy of the calculation
• 10% error in length gives 10% error in pressure drop
H
QDLH
ΔΔ
=Δ
1,1:Herror
0826,0 25
λ
February 15, 2008 13
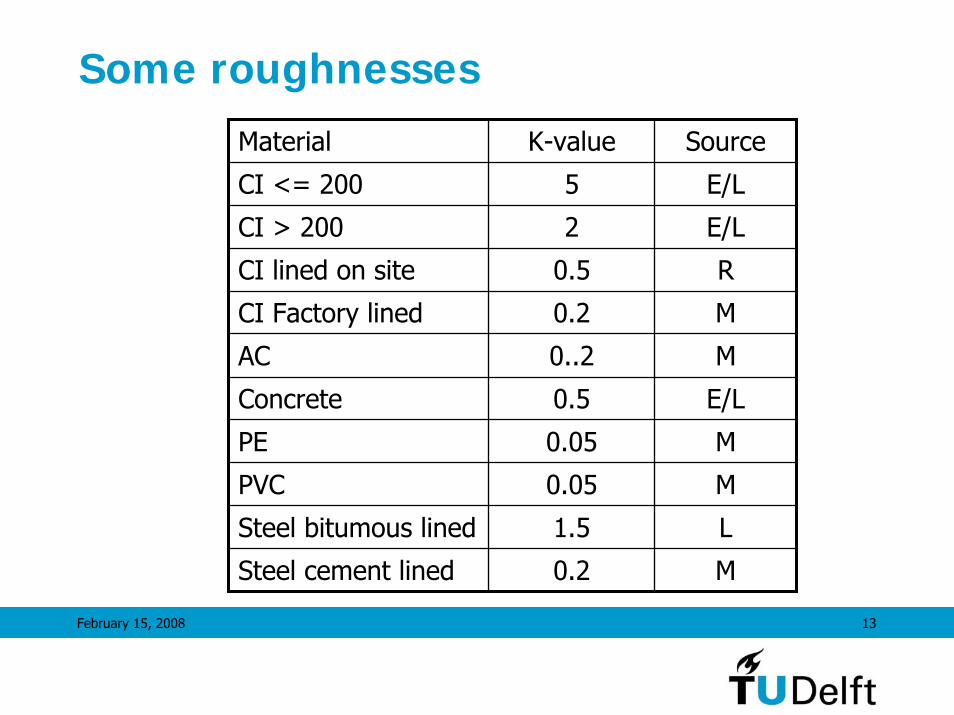
Some roughnessesMaterial K-value Source
CI <= 200 5 E/L
CI > 200 2 E/L
CI lined on site 0.5 R
CI Factory lined 0.2 M
AC 0..2 M
Concrete 0.5 E/L
PE 0.05 M
PVC 0.05 M
Steel bitumous lined 1.5 L
Steel cement lined 0.2 M

February 15, 2008 14
Different resistance formulas
Name Res coef (a) Exp (b)
Darcy Weisbach 2
Hazen-Williams 1,85
Chezy-Manning 2
QQaH b 1−⋅=Δ
52
8gDL
πλ
87,485,1
610*79,2DC
L−
33,5
2710*97,7D
Ln−

February 15, 2008 15
Boundaries
• Nodes• Demand (positive is demand)• Supply (negative is supply)• Fixed pressure head
• Pipes• Resistance• Special resistance : pump• Different types of valves (check valve, PRV, PSV,
PBV, FCV, TCV
February 15, 2008 16
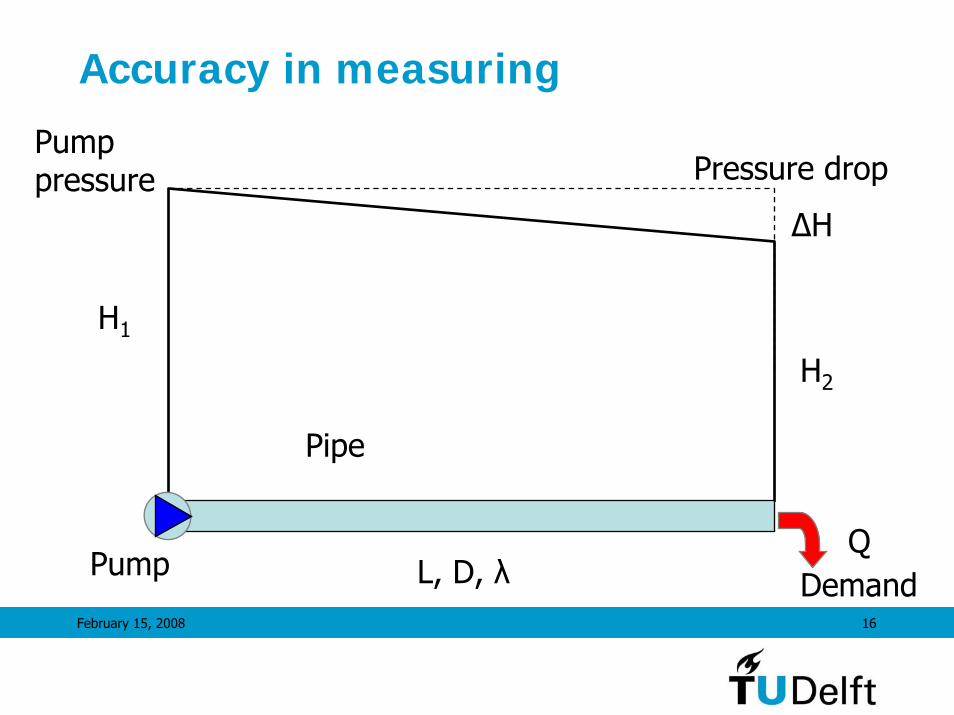
Accuracy in measuring
Pump pressure
H1
H2
ΔH
QL, D, λPump
Pipe
Pressure drop
Demand

February 15, 2008 17
Water quality calculations
• Mass balance
• Solved for known boundary conditions
( )ijij
ij
ij
ijij cxc
AQ
tc
Θ+∂∂
=∂
∂
( )∑
∑+
+=
ksiki
kikikiki
ij QQ
MtLcQtc
),(,0

February 15, 2008 18
Water quality algorithm
Original mass
After reaction
Transport to a node
Transport through a pipe
Transport from a node

February 15, 2008 19
Reaction model examples
0
2
4
6
8
10
0 1 2 3 4 5 6 7 8 9 10 11 12 13 14 15 16 17 18 19 20 21 22 23
Tijd (uren)
Ct = C0e KtCt = C0e -Kt
Ct = C0
February 15, 2008 20
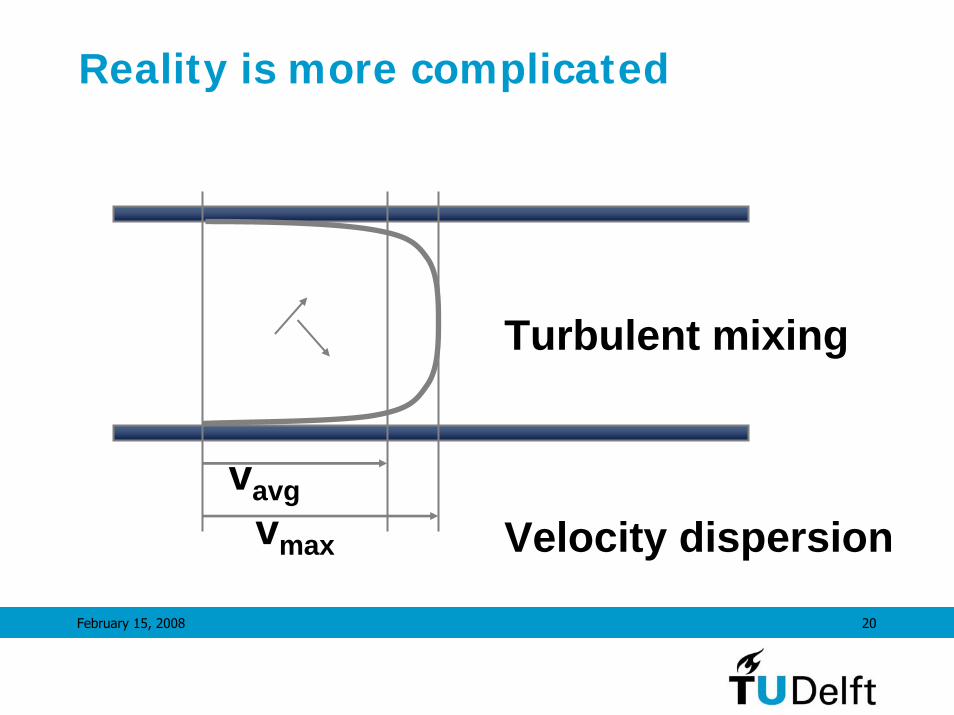
Reality is more complicated
Turbulent mixing
vavgvmax Velocity dispersion

February 15, 2008 21
But also encouraging
Totaal aantal deeltjes PS UF en transportleiding
0
50
100
150
200
di wo do vr
deel
tjes
> 2
m/m
l
PS UF
Transport leiding

February 15, 2008 22
To read some more
• Appendix E Aleid manual (blackboard)• Lewis Rossman EPA
February 15, 2008 23
Open channel flow/urban drainage
• De Saint Venant equations are translated into finite difference equations
• Time dependency is most important difference with surcharged pipes

February 15, 2008 24
Processes in urban drainage modelling
• The hydraulic process, modelled in a numerical model• Geometrical description: model of pipes and joints, ect• Hydraulic load under dry weather and storm conditions

February 15, 2008 25
Components in urban drainage modelling

February 15, 2008 26
Loads urban drainage
• Dry Weather Flow (DWF)• Domestic wastewater• Industrial wastewater• Drain water due to leakage
• Data for domestic wastewater has conformity with drinking water supply
• Drain water can be up to 50%!

February 15, 2008 27
Loads urban drainage
• Storm conditions• Wetting of dry surface• Infiltration• Storage in local surface depressions• Evaporation• Overland flow

February 15, 2008 28
Loads urban drainage, storm conditions
Run-off model
Nett rain
overland flow
infiltration
evaporation
Storage onsurface
rainfall
Inflow in sewer system
seweroverflow
towards pumping station
storage insewer system

February 15, 2008 29
Storage on local surface
Relation between terrain slope and surface storage, according to Kidd(1978)
0
0,5
1
1,5
2
2,5
0 0,5 1 1,5 2 2,5 3 3,5 4
terrain slope (%)
surf
ace
stora
ge (m
m)

February 15, 2008 30
Evaporation and infiltration
• Evaporation dependent on various factors(temperature, wind speed, colour of surface, etc)
• Practical approach:• Neglect during individual storms or give a constant
value• Infiltration dependent on various factors
(saturation, groundwater level, surface, etc)
• Practical approach:• Constant rate model

February 15, 2008 31
Run-off
• Run-off occurs when ‘all is saturated’• Several models available (annex to lecture notes, see
also Thesis Clemens)• Practical approach: Simple models with the smallest
number of parameters

February 15, 2008 32
Performance run-off models
0,000
0,005
0,010
0,015
0,020
0,025
0,030
0,035
0,040
0,045
0 0,5 1 1,5 2 2,5 3 3,5 4 4,5 5
time (h)
flow
(m³/s
)
Horton: V = 248.0 m³Green Ampt: V = 248.9 m³variable PR: V = 243.7 m³SCS: V = 243.1 m³

February 15, 2008 33
Build up of a network model
• Simulation of flow and pressure• Risk management:
• Reliability assesment at calamities and plannedactivities
• Operation:• Design major structure• Balancing production• Water quality and cleaning

February 15, 2008 34
Model build up town Utrecht
• Determine area boundaries and level of schematisation• Water balance and pipe model • Demand allocation and modulation• Modelling supply and installation controls• Model verification• Report and knowledge transfer

February 15, 2008 35
Service areas

February 15, 2008 36
Gebied 3 Vechtstreek en plassengebied
132 133 138 063 139 307 137 124
003
PSGR
012
PSBI
010
PSBE
071
PSSD
041
011
Gebied 4 Gooi en Eemlandgebied
Gebied 15 Amersfoort
en omgeving
192
232WTSD
042
219WTOV
220WTPH
218WTHE
141
140
129
127
Gebied 7w Kromme Rijn
West
Gebied 4a Soestduinen en
Soesterberg
115
143142
136
114
038
PSTU008
808
Voorzieningsgebied Hydron Zuid-Holland
Gebied 1 Noordwestelijk weidegebied
Gebied 6 Utrecht en omgeving
Gebied 20a Leidsche Rijn
West
121
020
PSLR
Gebied 20b Leidsche Rijn
Oost
119 104
Gebied 11 Nieuwegein
198Gebied 12 IJsselstein
Gebied 2 Zuidwestelijk weidegebied
103
LRKA232
Gebied 5 Zeist en
Driebergen
120
135
128
122
180
126
Gebied 3 Vechtstreek en plassengebied
132132 133133 138138 063063 139139 307307 137137 124124
003
PSGR
003003
PSGR
012
PSBI
012012
PSBI
010
PSBE
010010
PSBE
071
PSSD
041
011
071
PSSD
071071
PSSD
041
011
041041
011011
Gebied 4 Gooi en Eemlandgebied
Gebied 15 Amersfoort
en omgeving
192192
232WTSD
232WTSDWTSD
042042042
219WTOV
219WTOVWTOV
220WTPH
220WTPHWTPH
218WTHE
218WTHEWTHE
141141
140140
129129
127127
Gebied 7w Kromme Rijn
West
Gebied 4a Soestduinen en
Soesterberg
115115
143143142142
136136
114114
038
PSTU008
808
038
PSTU008
038038
PSTU008
808808
Voorzieningsgebied Hydron Zuid-Holland
Gebied 1 Noordwestelijk weidegebied
Gebied 6 Utrecht en omgeving
Gebied 20a Leidsche Rijn
West
121121
020
PSLR
020020
PSLR
Gebied 20b Leidsche Rijn
Oost
119119 104104
Gebied 11 Nieuwegein
198198Gebied 12 IJsselstein
Gebied 2 Zuidwestelijk weidegebied
103103
LRKA232
LRKA232
LRKA232
Gebied 5 Zeist en
Driebergen
120120
135135
128128
122122
180180
126126
Schematisation model area
•Sub areas•Pumping stations•Reservoirs•Connection points

February 15, 2008 37
Water balance 2001 (in)
Productie 2001
totaal 29,2 Mm3/j
Soestduinen
Bilthoven
Beerschoten
Tull en 't Waal
Groenekan
9,8
1,3
4,7
7,4
6,0

February 15, 2008 38
Water balance 2001 (uit)
Levering 2001
total 29,2 Mm3/j
demand
Connection points
Leakage
0,8
26,0
2,3
February 15, 2008 39
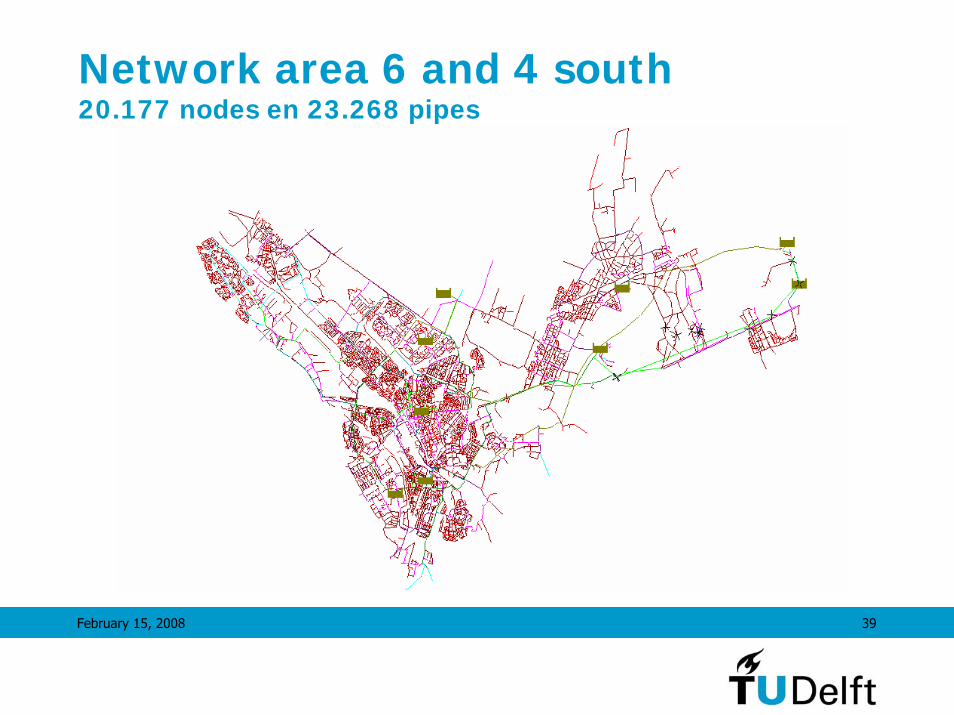
Network area 6 and 4 south20.177 nodes en 23.268 pipes

February 15, 2008 40
Industrial Nieuwegein 2001 (source: VIS)
perceelnr postcode huisnr verbr_code verbr_vis2 klantnaam straat164939 3435CM 1 3 91827 ST Antonius Ziekenhuis Koekoekslaan160625 3432GN 1 3 55562 NV Sportinr. Nieuwegein Merweplein
1006917 3439LC 100 3 25649 Pen.Inr.UT locatie N'gein De Liesbosch149835 3432NZ 11 3 22135 Henkel Ecolab BV Brugwal160715 3433PE 5 3 21249 Kiwa NV Groningenhaven149842 3439MN 14 3 18171 Fom Instituut Rijnhuizen Edisonbaan171597 3437JG 1 3 15760 Stg Portaal Utrecht Colijnpark171602 3439LB 6 3 15361 Transportbeton Pioneer V. De Liesbosch170092 3437PD 77 3 13784 St.Altrecht FCI cred.adm. Rembrandthage165127 3435SB 2 3 13102 BV Expl Maats Poort v Nge Buizerdlaan170218 3439NT 80 3 12801 PTT Post BV / Fin.Adm. Grote Wade150723 3431SH 91 3 12514 Mitros Wonen Nijpelsplantsoen150724 3431SM 181 3 12306 Mitros Wonen Nijpelsplantsoen150725 3431ST 271 3 11636 Mitros Wonen Nijpelsplantsoen
1010856 3437JV 1 3 11420 SPF Beheer BV p/a WPM. Winkelcentrum Galecop150722 3431SB 1 3 11135 Mitros Wonen Nijpelsplantsoen
Kiwa ‘used’ in 2001 2,4 m3/uur on avarage
(365 dagen/jaar; 24 hour/day) circa € 100/werkdag

February 15, 2008 41
Drinking water supply Kiwa
• 21249 m3/year• Industrial/office: 50 weeks of 5 days, 10 hours per
day, 140 persons• Avarage hourly consumption 60 litre per person• Avarage houshold consumption
130 lpppd

February 15, 2008 42
per supply category
< 300 m3/y
300-10.000 m3/y
> 10.000 m3/y
14,6 Mm3/y(135.036)
7,5 Mm3/y(7.083)
4,0 Mm3/y(166)
total 26,0 Mm3/y
circa 142.000 connections
Supply in 2001 (VIS)

February 15, 2008 43
Supply in 2001 per grid 500 x 500 m20 0 0 0 0 0 0 0 0 0 0 0 0 0 0 0 0 0 0 0 0 0 0 0 0 0 0 0 0 0 0 0 0 0 0 0 0 0
0 0 0 0 0 0 0 0 0 0 0 0 0 0 0 0 0 0 0 0 0 0 0 0 0 0 0 0 0 3554 3554 0 0 0 0 0 0 0
0 0 0 0 0 0 0 0 0 0 0 0 0 0 0 0 0 0 0 0 0 0 0 0 0 0 0 0 0 3554 0 0 0 0 0 0 0 0
0 0 0 0 0 0 0 0 0 0 0 0 0 0 0 0 0 0 0 0 0 0 0 0 0 0 0 0 0 0 0 0 0 0 0 0 0 0
0 0 0 0 0 0 0 0 0 0 0 0 0 0 0 0 0 0 0 0 0 0 0 0 0 0 0 0 0 1454 0 0 4111 2084 0 0 0 0
0 0 0 0 0 0 0 0 0 0 0 0 0 0 0 0 0 0 0 0 0 0 0 0 0 0 0 2907 1454 1454 643 2027 2084 0 0 0 0 0
0 0 0 0 0 0 0 0 0 0 0 0 0 0 0 0 0 0 0 0 0 0 0 0 0 0 0 2168 1591 1454 322 5379 0 0 0 0 0 0
0 0 0 3580 2326 1768 0 0 0 0 0 0 0 0 0 0 0 0 0 0 0 0 0 0 0 0 0 2168 15751 0 3182 3870 3498 0 0 0 0 0
0 1310 3008 0 11585 70675 26295 0 3565 0 0 0 0 0 0 0 0 0 0 0 0 0 0 0 0 0 0 475 1534 4392 32061 0 30585 0 0 0 0 0
16677 109585 75008 1824 6689 102572 84039 15942 6365 0 5131 0 0 0 0 0 0 0 0 0 0 0 0 0 0 0 0 9086 27825 15420 13931 8342 53674 1266 644 0 0 0
0 108350 103308 77417 22313 94218 39289 39483 742 978 10493 0 0 0 0 0 0 0 0 0 2048 0 0 0 0 0 2715 4702 30618 31463 26869 14928 175343 26834 4300 0 0 0
0 34192 122117 84091 138542 27473 71758 72053 6821 1384 0 12514 10778 0 0 0 0 0 0 0 3126 0 0 0 0 0 18380 10257 27716 33320 42560 30143 23796 16662 8099 925 0 0
0 0 76395 99774 86597 58366 14647 2252 78 9903 0 12928 4384 4585 10593 0 0 0 2507 0 5033 2289 0 0 0 60926 122764 65358 77078 42740 45442 11801 8709 6153 3467 0 0 0
0 0 6943 25806 83450 109150 14444 98575 3313 11018 6099 35325 61601 112715 102176 11071 2162 3590 2507 13137 13657 21550 0 0 8939 120435 65961 51723 37410 43140 0 4394 4499 17413 28177 0 0 0
0 0 0 10888 45719 21164 41695 9468 7856 51300 24156 2151 73009 89772 131998 104077 57117 1267 0 7784 10751 9052 15155 0 63220 95857 119891 31979 0 0 0 0 14943 17739 14093 599 0 0
0 0 0 0 0 17092 16565 10443 17854 20741 101436 120271 116963 92241 142947 208528 87819 143966 16479 4060 0 0 0 9632 61395 43010 3777 0 0 0 0 0 11801 24454 13673 25679 50558 138
0 0 0 0 0 0 12766 4745 29047 2208 27573 157089 154577 113257 47203 84737 109695 93656 48723 54207 35545 1324 0 20045 94197 68796 7623 615 0 0 0 0 14892 9986 15641 4137 0 0
0 0 0 0 0 0 0 2518 7353 20168 7936 72180 163992 104375 115659 74399 102141 100168 99635 85166 12440 2965 5702 58314 94882 73259 2680 0 0 827 0 0 11158 1835 0 0 0 0
0 0 0 0 0 0 0 0 2518 115647 44849 19494 115840 188392 103419 118338 145306 91224 101207 20363 3797 0 0 34988 45849 26303 23176 1924 1426 0 0 0 0 0 0 0 0 0
0 0 0 0 0 0 0 0 0 21179 24533 46709 4404 73085 162891 150901 196265 120014 173739 83073 18129 10476 4587 0 0 12100 0 0 0 0 0 0 0 0 0 0 0 0
0 0 0 0 0 0 0 0 0 0 27130 104392 147594 175102 104032 273452 245723 191281 142769 33305 62566 1201 0 0 2380 1221 0 0 0 0 0 0 0 0 0 0 0 0
0 0 0 0 0 0 0 0 0 0 21589 101361 94590 171741 219375 219492 219274 113705 142222 107939 55109 27469 17070 2256 9808 1832 1365 0 0 0 0 0
0 0 0 0 0 0 0 0 0 0 2562 119554 54827 87130 67507 81443 182527 102272 133238 133443 70482 48105 57387 166818 363419 0 0 0 0 0 0 0
0 0 0 0 0 0 0 0 0 0 0 98648 133760 32965 8217 102812 126021 140152 142118 98440 20150 23378 11818 605 59343 0 0 0 0 0 0 0
0 0 0 0 0 0 0 0 0 0 0 140582 158135 96525 35343 163744 91963 86622 57870 19106 8653 0 0 0 652 0 0 0 0 0 0 0
0 0 0 0 0 0 0 0 0 0 0 7252 148696 98888 43644 151377 127457 101852 11322 0 2356 0 0 0 0 0 0 0 0 0 0 0
0 0 0 0 0 0 0 0 0 0 0 0 57310 139533 53893 81287 138104 71637 114549 34073 4470 2655 0 0 0 0 0 0 0 0 0 0
0 0 0 0 0 0 0 0 0 0 0 0 0 44766 42220 62143 118630 63408 130282 41567 23134 0 0 0 0 0 0 0 0 0 0 0
0 0 0 0 0 0 0 0 0 0 0 0 0 383 25193 15921 32997 47770 116357 16606 5724 0 0 0 0 0 0 0 0 0 0 0
0 0 0 0 0 0 0 0 0 0 0 0 0 0 9261 48800 3065 0 0 0 0 0 0 0 0 0 0 0 0 0 0 0
0 0 0 0 0 0 0 0 0 0 0 0 0 0 4566 33506 3482 0 0 0 0 0 0 0 0 0 0 0 0 0 0 0
0 0 0 0 0 0 0 0 0 0 0 0 0 0 0 1365 2351 0 0 0 0 0 0 0 0 0 0 0 0 0 0 0
0 0 0 0 0 0 0 0 0 0 0 0 0 0 0 0 5695 0 0 0 0 0 0 0 0 0 0 0 0 0 0 0
0 0 0 0 0 0 0 0 0 0 0 0 813 0 0 0 0 0 0 0 0 0 0 0 0 0 0 0 0 0 0 0 0 0 0 0 0 0
30-100
>100
x 1000 m3/j
0-3
3-10
10-30

February 15, 2008 44
Water balance 26 March 2002Productie en berging
26 maart 2002
-2000
0
2000
4000
6000
8000
10000
0 2 4 6 8 10 12 14 16 18 20 22 0
Volumestroom (m3/u) Beerschoten
Soestduinen
Groenekan
Tull en 't Waal
Bilthoven
Kanaleneiland en WT's