network-based design for systems learning in classrooms
TRANSCRIPT

Computer-HubNet Guide:A GUIDE TO COMPUTER-BASED
PARTICIPATORY SIMULATIONS1 ACTIVITIESNetwork-Based Design for Systems Learning in Classrooms
DRAFTJanuary 13, 2004
REVISIONJanuary 20, 2005
Uri Wilensky& Walter M. Stroup
withDor Abrahamson, Matthew Berland, Kate Braden, Brent Collins,
Sarah Davis, Matt Goto, Ed Hazzard, Matt Hellige,Andy Hurford, Jayun Kim, Geoff Mathews, Meera Pradhan,
Al Schademan, and Seth Tisue
We gratefully acknowledge the ongoing support of theNational Science Foundation and Texas Instruments
in developing these technologies and activities.
These activities and associated models and materials were created as part of two NSF sponsored projects:
INTEGRATED SIMULATION AND MODELING ENVIRONMENT (NSF ROLE #0126227) and PARTICIPATORYSIMULATIONS: NETWORK-BASED DESIGN FOR SYSTEMS LEARNING IN CLASSROOMS. (NSF REC#9814682)
Copyright 1999 by Uri Wilensky & Walter Stroup. Updated 2001, 2002, 2003, 2004. All rights reserved.
Permission to use, modify or redistribute these materials, including the models, activities and documents is herebygranted, provided that both of the following requirements are followed:
a. this copyright notice is included.b. this model will not be redistributed for profit without permission from the copyright holders.
Contact the copyright holders for appropriate licenses for redistribution for profit.
IntroductionSome Top Level TipsDiseaseGridlockPollingS.A.M.P.L.E.R.
IntroductionWelcome to the future classroom - a classroom rich in networked information technology. This document is intended to serve as anintroduction and guide for teachers to the use of the HubNet technology in the classroom. The HubNet technology is the result of anongoing effort to design, from the ground up, activities and technologies for group learning situations. In particular, HubNet has beendesigned to enable classroom "participatory simulations" in which all class members are actively engaged in learning activities mediated

through technology.
The HubNet design marks a radical departure from a simple repackaging of business-oriented computing solutions for use in schools.Business technologies are typically designed for an individual user working in relative isolation. School technologies, in sharp contrast,should be designed for group use with learners working together in highly interactive ways.
You are about to work with our attempt to embody this functional ideal in a practical way. The activities presented in this book can be usedin your classrooms today to address meaningful curricular objectives. They are intended to illustrate how a range of challenging curriculartopics - from understanding functions to making sense of the logistics curve, from understanding the spread of a disease in a population tothe optimizing of traffic flow through a city grid, and much, much more - can be approached in engaging and intellectually compelling newways using participatory simulations. All of the activities have been tested and refined from substantial work in middle schools and highschools from a range of settings (including classes in mathematics, general science, social, urban and environmental studies) in the UnitedStates.
What is a Participatory Simulation?
Middle school students interacting using HubNet in a disease participatory simulation learning about the dynamics of the spread of disease (above) and aspects of theemergent logistics (epidemic) curve (below).
Students engaged in participatory simulations act out the roles of individual elements in a system. Through their actions the behavior of thesystem as a whole emerges. This emergent behavior of the system and its relation to individual students' actions and strategies thenbecomes the object of class discussion and analysis.
What is HubNet?HubNet is the name we have given to a new architecture designed to give students the experience of participating as elements in asimulation of a complex dynamic system. HubNet hardware includes an up- front computer (the "hub") capable of addressing a network ofnodes (currently, networked computers or TI-83+ calculators) and a display capability (e.g. computer projection system) enabling an entireclass to view the simulation. HubNet enables many users at the "nodes" to control the behavior of individual objects or agents and to viewthe aggregated results on a joint display. Currently, there are two distinct types of HubNet, one we affectionately call Computer HubNetand the other which we affectionately call Calculator HubNet. Computer HubNet uses networked computers as nodes and CalculatorHubNet uses TI-83+ calculators as the nodes. The HubNet architecture can support other devices as nodes and in the future, we maysupport other devices. HubNet is designed with the default assumption that the nodes have significant resident functionality (at least that ofa programmable graphing calculator). The network layer implements flexible communication protocols that include the ability to upload anddownload data sets, upload and download programs (e.g., applets), monitor key- presses at the node level, support real-time interaction asin network computer games, and form collaborative groups of various sizes (e.g., peer to peer, small groups, and whole-class modes).
What is NetLogo?Although NetLogo can trace its roots back to the programming language LISP and also to a version of LISP used in super-computingcalled *LISP (pronounced "star-LISP"), the easiest way of thinking of NetLogo is as a special version of the language LOGO. Logo, as youmay know, is a language that enables a user (often a young child) to control a graphical turtle by either typing individual commands like"forward 50," or by writing procedures that do a series of commands. By having a turtle put its pen down, go forward 50 steps, turn right 90

degrees and then go forward 20 steps you can get something like the inverted "L" shown on the left below. Learners can construct modelsof a wide range of physical and mathematical phenomena using this turtle-controlling language.
In NetLogo the user can create tens, hundreds or even thousands of turtles. If the same commands as those given above for the upside-down"L" are now used in NetLogo, we end up with something like what is shown in the middle image above. Each of the turtles does thesecommands "for itself" and the wagon wheel image results. (Note that each of the turtles started with a distinct initial orientation (aka"heading") so they wouldn't just be stacked up on top of each other). Like Logo, but in a much more powerful way due to the ability tocontrol multiple turtles, NetLogo can model a wide range of physical, mathematical and even social behaviors.
Up until this point, both Logo and NetLogo are thought of as working within a single "box" or running on a single computer. Everythingthat happens on the screen happens because of commands that happened within that box (e.g. forward 50). In computer speak, the "state" ofthe turtles is determined completely by either the Logo or NetLogo code, depending on which you are working with.
When NetLogo is hooked up to a network however, some of that control can now come from "outside the box" or outside the single stand-alone computer. In the HubNet system, that outside input can come from other devices connected to the network. Each device can controlan individual turtle. If all the participants controlling a turtle with their devices put their pens down, and use the arrow keys to wanderaround, we might end up with an image like the one on the right of the above image. Each user is making his or her own decisions abouthow to move, and this input is being used by NetLogo to create the group result. The state of the turtles is now determined by acombination of input from the devices, and NetLogo is then doing something with this input. To help keep this use of NetLogo somewhatdistinct from the "in the box" use, we speak of the "out of the box" programming as "scripting" and the former "in the box" programmingas "modeling."
In addition to having turtles that move over the surface of the screen and interact with each other, NetLogo also has a grid of programmable"patches" that the turtles can walk over and interact with. Patches can be though of as little cells or rectangles that make up the backgroundof the NetLogo world. Patches can also interact with each other and with turtles. Finally, NetLogo has an "observer" level that can look atwhat's happening for the whole model and do things like count the number of turtles that are green or the number of patches that are yellow.
The following image shows how NetLogo can work either as a stand-alone modeling language or as a scripting language for creatingparticipatory simulations.
Has Full capability of Agent-Based ParallelModeling Language
Breeds (e.g. wolf and sheep - supports any grouping/topology)
Agents (and patches) know how to interactCan identify (e.g. follow, count, average) any individual or groupFull graphing, analysis, sorting, etc.All with minimal, extensible code(AND YES, it does [has LISP roots])
For both the stand-alone ("in the box") model on the left and the possible network activity on the right (the participatory simulation), therabbits and wolves are two kinds of "turtles." They are programmed to interact differently when a rabbit bumps into a wolf as opposed towhen a rabbit bumps into another rabbit. The rabbits and wolves are what are called "breeds" of turtles. In these examples, the grid ofpatches is used to model grass. The patches - the simulated grass - interact with rabbits differently than they do with wolves. Rabbits can eatthe grass, turning it brown. Over time the grass will become green again. A major difference between the stand-alone model on the left andthe participatory simulation on the right is related to control. In the stand-alone model illustrated on the left, the rabbits and wolves wanderrandomly around the screen and this random movement is completely controlled by the NetLogo language. In the participatory simulationillustrated on the right, each individual student uses the HubNet client to control either a rabbit or a wolf in the participatory simulation.The rules for interaction remain the same (so if a rabbit runs into a wolf, the rabbit dies and the wolf gets more energy). Either the stand-alone model (left) or the participatory simulation (right) can simulate a simple predator-prey ecology.
Both NetLogo modeling and doing participatory simulations with HubNet enable new powerful classroom activities and learning. In thisguide, we will focus on the HubNet technology and participatory simulation activities. An advantage of using participatory simulations isthat students identify strongly with their roles and, from working together in this embodied way, begin to feel a need to create certain kindsof mathematical or scientific ideas. Closely related to this increasing articulateness is the development of a much deeper and moremeaningful understanding of mathematical and scientific ideas. Participatory simulations scaffold deeper engagement with, andunderstanding of, challenging curricular topics for a wide range of students. Students will develop a significant set of insights from workingwith participatory simulations. For participatory simulations to work up to their potential however, we have to be ready to supportdiscussion and focused interactivity in our classrooms. The best way to begin to get a feel for how this can work is for us all to jump intogether to try out for ourselves what this next generation form of classroom learning is like. Enjoy!
Some Top Level TipsStart with Something Physical or a Meaningful ExampleFrom motion detectors to rolling dice, from building walls of delta- blocks to working with motion detectors, we have found it is importantto begin with some kind of hands-on activity or meaningful example as part of working with a HubNet mediated participatory simulation.HubNet- based learning is an important kind of hands-on, minds-on learning that integrates well with other forms of hands-on, minds-onactivities.
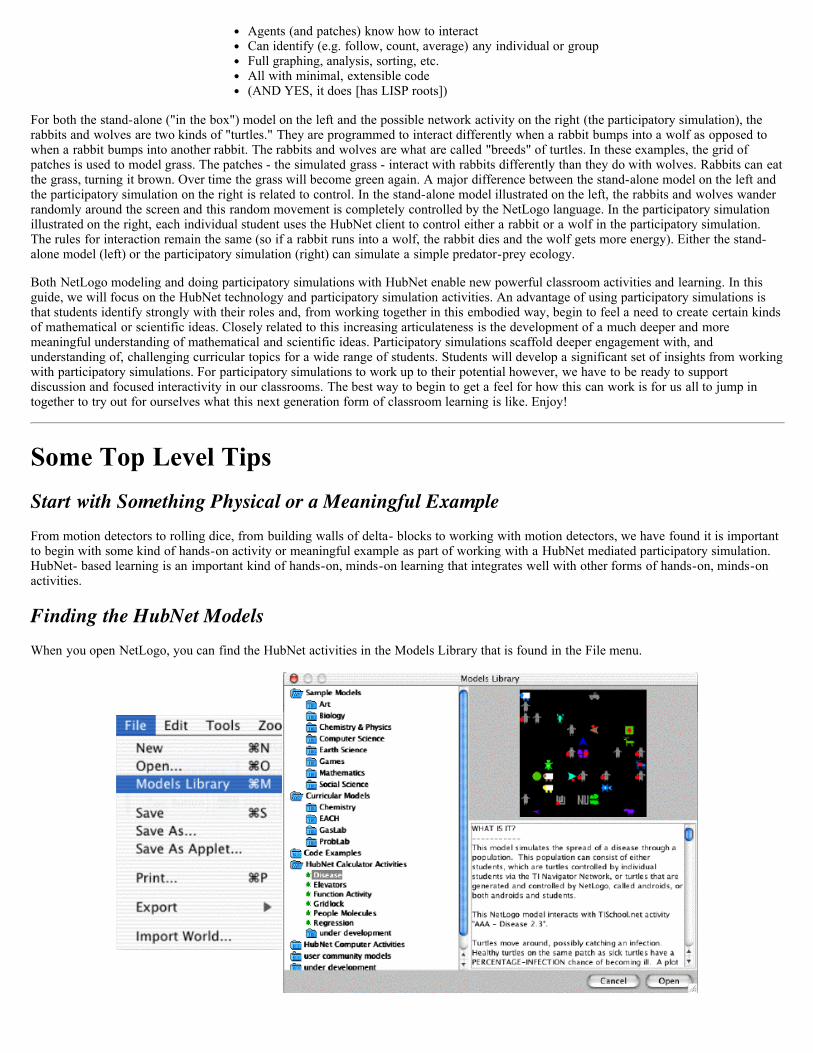
Finding the HubNet ModelsWhen you open NetLogo, you can find the HubNet activities in the Models Library that is found in the File menu.

A description of the HubNet activity (or of any of the stand-alone models also found in the library) appears when you click on the title.Double-click to open this activity. Since there are currently two different types of HubNet implemented, be sure to open the folder thatrefers to the type of HubNet that you wish to run. For instance, if you wish to use Computer HubNet, be sure to open the HubNet ComputerActivities.
Where Can I Get NetLogo?NetLogo can be downloaded for free from http://ccl.northwestern.edu/netlogo/.
QuickStart InstructionsTo help you get started and run an activity, we have included QuickStart instructions at the top of every HubNet model.
Click the Next or Back button to change the instructions.
Information TabAdditional information for each HubNet activity (and also for each model in the library) can be found by clicking on the Information Tab.There is a standardized format for the content of this tab so you can become increasingly adept at finding what you need as you move frommodel to model.
Setup and Re-RunEach HubNet activity has at least two buttons.
Setup is what you use when you start a new class or switch activities. Of the two it is the "stronger" command and almost always isaccompanied by students having to login (or re-login if you switch activities). Re-Run, in contrast, is what you push after you've done anactivity once and you just want to repeat the activity without requiring the students to login again. You will probably use this button morethan once in a class whereas Setup is something you are likely to use at most only once (assuming you don't switch activities).
Projection NeedsTo make what's happening in the NetLogo program visible you will need a computer projection system for your "up-front" computer.
Starting a Computer HubNet Activity

Opening a Computer HubNet model will cause NetLogo to start a server which will allow people to join the activity. A dialog will promptyou to enter a unique name that will help participants identify the activity you are running. This name will appear if the server is discoveredon the clients. While this is not necessary, entering a name is recommended since it can help reduce confusion over which activityparticipants should enter. You should then follow the instructions for the particular model found in the QuickStart Instructions monitor.Most models will require you to press a forever button, often called GO. You, as the leader, should notify everyone that they may join.
For them to join, you should give them the IP address for the computer that is running NetLogo. The IP address of the server can be foundin the HubNet Control Center, which can be opened by choosing the HubNet Control Center option in NetLogo's Tools menu. Every userwill have to enter this IP address to be able to enter the activity. On some systems, the HubNet Client will automatically detect all theComputer HubNet activities currently being run. On these systems, instead of typing in the IP address, everyone can select the activity froma list. Each item in the list should contain the unique name you entered in the dialog when you first opened the HubNet model followed bythe name of the activity followed by the IP address of the computer running NetLogo.
Every participant will also have to enter a unique user name. (If a participant types in a user name that someone else is already using, theywill be asked to choose a different name.)
HubNet Control CenterOne feature of Computer HubNet is the HubNet Control Center. You can open this using the HubNet Control Center option in the ToolsMenu when a Computer HubNet Activity is open and the server is running. The Control Center shows you useful information, such as theIP address of the computer, who is logged in, etc. It also allows you to disconnect clients from the activity and send out messages for all theclients to read.
In addition to these features, the HubNet Control Center allows you to control whether debugging output is on or off. Debugging output isuseful when creating your own HubNet activity or to keep track of which participant sent what data when. Any output is sent to the log.txtfile on Windows machines, or the Console to Macs. The Control Center also allows you to control whether updates to the NetLogoGraphics Window are sent to the clients. This is useful if there are a lot of updates or if you just don't wish the clients to see what ishappening on the NetLogo Graphics Window.
Opening ClientsTo open, a client simply go to the location that NetLogo is installed on your computer. There will be an application called HubNet Clientfollowed by the version of NetLogo. To run the HubNet Client application, simply double click it.
Logging into ClientsAfter you have opened the client, you will be prompted with a dialog asking for the server's IP address. NetLogo will try to send out thatinformation to the clients automatically. If your system supports this feature, you will see an activity name followed by an IP address in thepull-down menu. Choose the activity that the group is going to be doing and which is running on the computer acting as the HubNet server.This will cause the IP address to appear in the text entry field. Alternately, if your system does not support this feature, the leader will tellyou the IP address to type into this field. Once you are done typing or choosing it, you then will have to enter a User Name. Please enterone. The leader will give directions on how to choose one. If no one else is using the one you enter, NetLogo will send you the clientinterface and you can start playing. If you didn't choose a unique User Name, your client application will display a message indicating this.
Changing the Size of the Graphics WindowSome of the activities require you to be able to change the size of the NetLogo Graphics Window (the place where the turtles movearound). This might happen because you want to change the dimensions of the space or because you want to make more (or less) room forthe number of students you have.
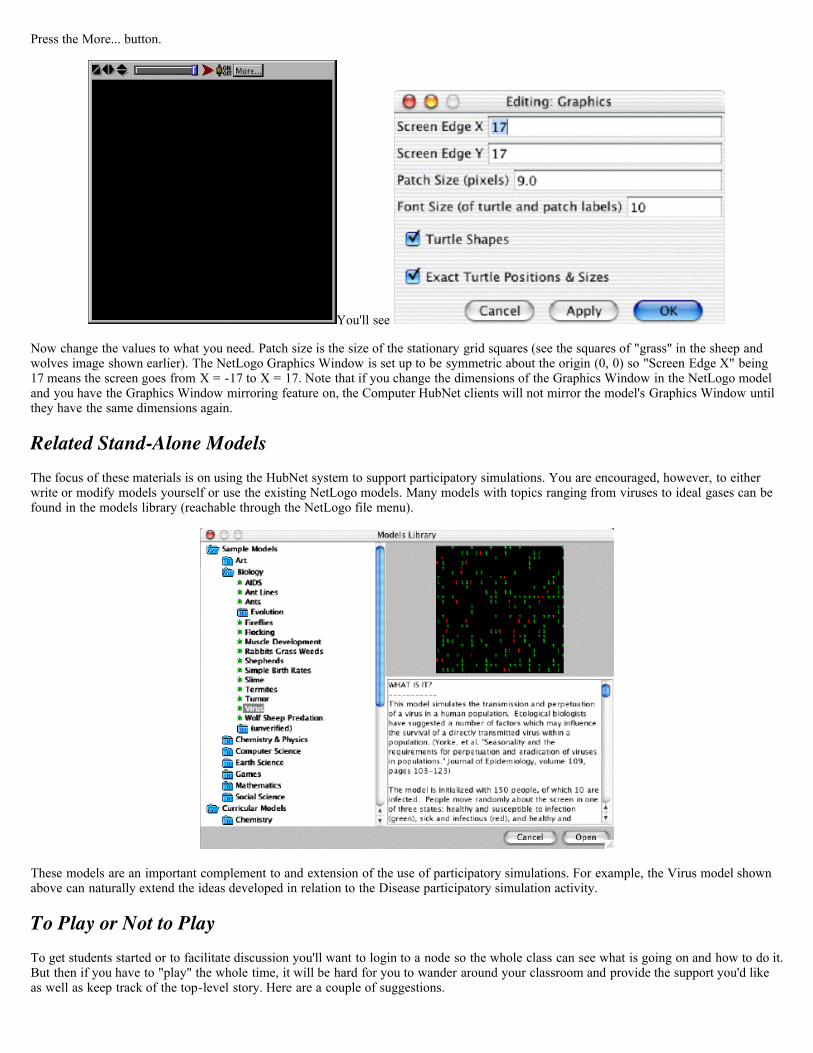
Press the More... button.
You'll see
Now change the values to what you need. Patch size is the size of the stationary grid squares (see the squares of "grass" in the sheep andwolves image shown earlier). The NetLogo Graphics Window is set up to be symmetric about the origin (0, 0) so "Screen Edge X" being17 means the screen goes from X = -17 to X = 17. Note that if you change the dimensions of the Graphics Window in the NetLogo modeland you have the Graphics Window mirroring feature on, the Computer HubNet clients will not mirror the model's Graphics Window untilthey have the same dimensions again.
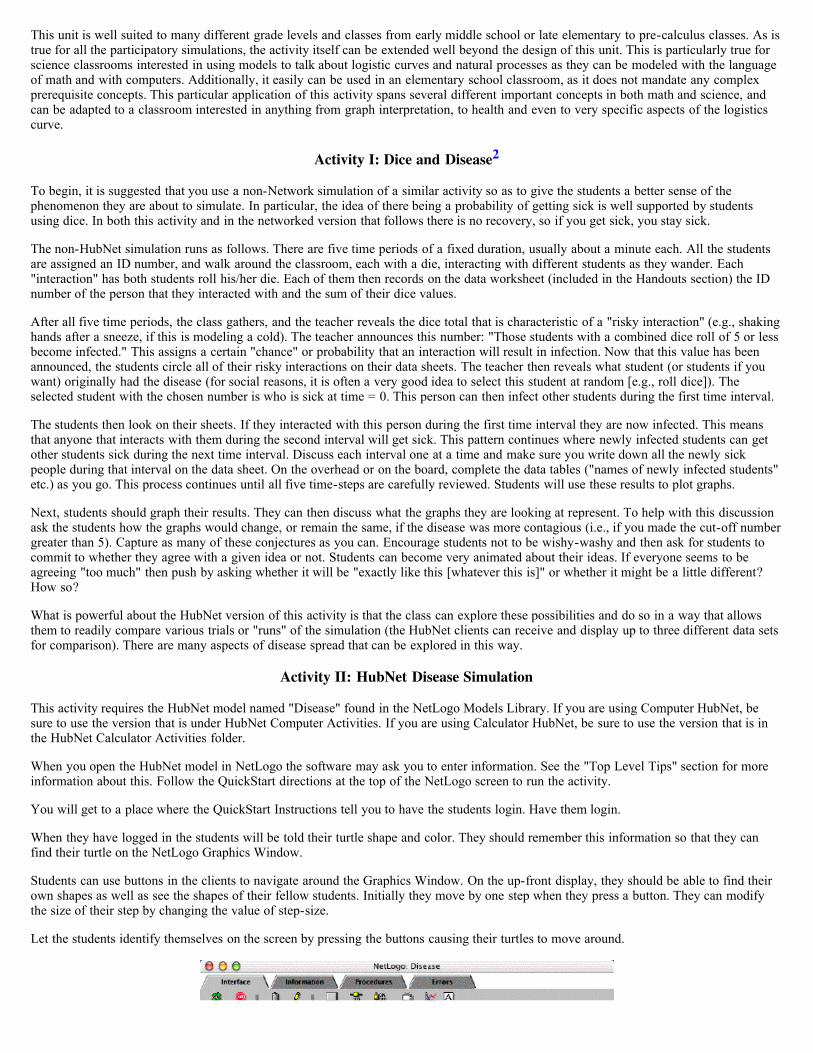
Related Stand-Alone ModelsThe focus of these materials is on using the HubNet system to support participatory simulations. You are encouraged, however, to eitherwrite or modify models yourself or use the existing NetLogo models. Many models with topics ranging from viruses to ideal gases can befound in the models library (reachable through the NetLogo file menu).
These models are an important complement to and extension of the use of participatory simulations. For example, the Virus model shownabove can naturally extend the ideas developed in relation to the Disease participatory simulation activity.
To Play or Not to PlayTo get students started or to facilitate discussion you'll want to login to a node so the whole class can see what is going on and how to do it.But then if you have to "play" the whole time, it will be hard for you to wander around your classroom and provide the support you'd likeas well as keep track of the top-level story. Here are a couple of suggestions.

Walk the students through logging in by opening a client on the computer that is running NetLogo. Before you actually enter the simulationthough, decide if you want somebody to use the up-front computer as a client or not. If you enter, someone (perhaps a student) will have toplay along using that client. However, if someone does use the computer running NetLogo as a client, then you will not always be able tosee the NetLogo program. We suggest that you don't run a client on the same computer that is running NetLogo.
Alternately, you could temporarily connect the computer projector to a computer that one of the students is going to login on. Onceeveryone is logged in, you can switch the projector back to the up-front computer so that everyone can see the NetLogo program.
Using/Extending/Authoring NetLogo Models and ActivitiesFollowing up on the idea of possibly changing the way a simulation works, a key feature of the NetLogo environment (unlike "closed"simulations like SimCityTM) is that you have complete access to the code that makes the simulation or model work. This can allow you toactually see and better understand what's going on, change the code to explore new possibilities, or even get ideas for building new modelsor simulations. After becoming familiar with running a particular activity, you may wish to have the class look at the code that makes itwork. Clicking on the Procedures tab allows you to see the NetLogo code that the model runs. Usually, the stand-alone models are lesscomplicated than the HubNet activities. Consequently, you may want to look at some of the stand-alone models first as these will not haveextra code for communicating with the network.
The code is designed to be relatively easy to understand (drawing on the lessons learned from the Logo programming language) and isintended to capitalize directly on the students' first-person reasoning and experience. An introductory challenge can include having thestudents read through the code and try to come up with a flow chart of how the program behaves; this will familiarize them with both thecode and the logic behind our models. As is true will all NetLogo models or simulations, start by looking for the GO procedure in theProcedures Tab as this reveals the "top level" story of the simulation. The code is extensively commented (comments are the programmer'snotes to you about what the code is doing). And of course, we very much encourage you to reach in and change the code to explore how itworks or build new possibilities. Further information on NetLogo is available at http://ccl.northwestern.edu/netlogo/.
DiseaseSubject AreasMathematics, Science, Health, and Social Sciences
TopicsDisease Propagation
Abstract/SummaryIn these two activities, students are members of a population in which a disease is spreading. The goal is to understand how the logisticscurve emerges in relation to the dynamics of the spread of a simulated disease.
In a non-network based simulation, students literally walk around shaking hands and using dice to determine whether they have "risky"interactions. They then manually build graphs showing the number of students who get infected in each time period and use these to buildgraphs showing the total number sick at a time. This introduction prepares them to dive into the real-time HubNet simulation.
As the students participate in the real-time simulation, NetLogo creates a graph showing the number of people sick at each tick of thesimulation's clock. This activity serves as a springboard to discussing modeling the spread of disease and to constructing models in general.Drawing from your students' experiences with the non-networked simulation, encourage them to think about how the simulation works andwhat strategies they might use to avoid catching the disease. The students and you can change attributes of the simulation (e.g., the sliderspercent infection and/or initial number sick, step size, amount of space to more in, add in androids [that might be thought of as being likemosquitoes carrying a disease], and so on), try to predict what effects these changes will have and then see how well these predictions fitwith what actually happens.
PrerequisitesAddition, Some graph interpretation
Teacher Notes/Procedures
This unit is well suited to many different grade levels and classes from early middle school or late elementary to pre-calculus classes. As istrue for all the participatory simulations, the activity itself can be extended well beyond the design of this unit. This is particularly true forscience classrooms interested in using models to talk about logistic curves and natural processes as they can be modeled with the languageof math and with computers. Additionally, it easily can be used in an elementary school classroom, as it does not mandate any complexprerequisite concepts. This particular application of this activity spans several different important concepts in both math and science, andcan be adapted to a classroom interested in anything from graph interpretation, to health and even to very specific aspects of the logisticscurve.
Activity I: Dice and Disease2
To begin, it is suggested that you use a non-Network simulation of a similar activity so as to give the students a better sense of thephenomenon they are about to simulate. In particular, the idea of there being a probability of getting sick is well supported by studentsusing dice. In both this activity and in the networked version that follows there is no recovery, so if you get sick, you stay sick.
The non-HubNet simulation runs as follows. There are five time periods of a fixed duration, usually about a minute each. All the studentsare assigned an ID number, and walk around the classroom, each with a die, interacting with different students as they wander. Each"interaction" has both students roll his/her die. Each of them then records on the data worksheet (included in the Handouts section) the IDnumber of the person that they interacted with and the sum of their dice values.
After all five time periods, the class gathers, and the teacher reveals the dice total that is characteristic of a "risky interaction" (e.g., shakinghands after a sneeze, if this is modeling a cold). The teacher announces this number: "Those students with a combined dice roll of 5 or lessbecome infected." This assigns a certain "chance" or probability that an interaction will result in infection. Now that this value has beenannounced, the students circle all of their risky interactions on their data sheets. The teacher then reveals what student (or students if youwant) originally had the disease (for social reasons, it is often a very good idea to select this student at random [e.g., roll dice]). Theselected student with the chosen number is who is sick at time = 0. This person can then infect other students during the first time interval.
The students then look on their sheets. If they interacted with this person during the first time interval they are now infected. This meansthat anyone that interacts with them during the second interval will get sick. This pattern continues where newly infected students can getother students sick during the next time interval. Discuss each interval one at a time and make sure you write down all the newly sickpeople during that interval on the data sheet. On the overhead or on the board, complete the data tables ("names of newly infected students"etc.) as you go. This process continues until all five time-steps are carefully reviewed. Students will use these results to plot graphs.
Next, students should graph their results. They can then discuss what the graphs they are looking at represent. To help with this discussionask the students how the graphs would change, or remain the same, if the disease was more contagious (i.e., if you made the cut-off numbergreater than 5). Capture as many of these conjectures as you can. Encourage students not to be wishy-washy and then ask for students tocommit to whether they agree with a given idea or not. Students can become very animated about their ideas. If everyone seems to beagreeing "too much" then push by asking whether it will be "exactly like this [whatever this is]" or whether it might be a little different?How so?
What is powerful about the HubNet version of this activity is that the class can explore these possibilities and do so in a way that allowsthem to readily compare various trials or "runs" of the simulation (the HubNet clients can receive and display up to three different data setsfor comparison). There are many aspects of disease spread that can be explored in this way.
Activity II: HubNet Disease Simulation
This activity requires the HubNet model named "Disease" found in the NetLogo Models Library. If you are using Computer HubNet, besure to use the version that is under HubNet Computer Activities. If you are using Calculator HubNet, be sure to use the version that is inthe HubNet Calculator Activities folder.
When you open the HubNet model in NetLogo the software may ask you to enter information. See the "Top Level Tips" section for moreinformation about this. Follow the QuickStart directions at the top of the NetLogo screen to run the activity.
You will get to a place where the QuickStart Instructions tell you to have the students login. Have them login.
When they have logged in the students will be told their turtle shape and color. They should remember this information so that they canfind their turtle on the NetLogo Graphics Window.
Students can use buttons in the clients to navigate around the Graphics Window. On the up-front display, they should be able to find theirown shapes as well as see the shapes of their fellow students. Initially they move by one step when they press a button. They can modifythe size of their step by changing the value of step-size.
Let the students identify themselves on the screen by pressing the buttons causing their turtles to move around.

Each of the clients show the turtle's location. As a quick check of how everything is working, including students' ability to find and movetheir icons, we often have them move their points until the y value equals the x value. You should see a line form on the screen as thestudents move their turtles (and this hints at the kinds of things we do in Calculator HubNet Function Activity). If you have the students dothis quick check, be sure to have them move apart before you get someone sick (it's not a good idea to start off near or even "on top" ofpeople if someone is about to catch a cold).
Once they have become comfortable with the interface, make someone sick by clicking on the "INFECT" button on the NetLogo interface.The initial-number-sick slider is set to "1" so one person will get sick. In the beginning, leave the "SHOW-ILL?" switch on, so the studentscan see who is infected. To show who is sick, a red ball becomes part of the icon.
The clients can also let students know that they are sick. Students can try to maintain their health as long as they can. As the activitycontinues draw attention to the "Number Sick" graph (shown below) especially as new students get sick.
Note that every time we have run this activity, including with all sorts of adults, the sick people end up chasing the well people. So if youhave middle schoolers and they do this, be assured this is not an age-specific trait (and it does lead to an animated engagement with theactivity).
Getting Simulation Data into the Clients and Discussion
For any of the sequence of simulations, it is possible to send the data out to the clients for students to analyze on their own or in smallgroups. How this works is NetLogo sends any data that is plotted to a plot on the clients. If multiple sets of data are available, then the

information should be plotted in NetLogo using different plot-pens.
For discussion ask the students, what is this graph measuring?
When are people getting sick the fastest (often students will struggle with whether it is when the graph is highest or "steepest")? When isthe disease slowing down its spread and why? When is it speeding up or spreading faster and faster? When are the most people sick? Tryand draw attention to the shape of the graph and the overall story it seems to tell (without necessarily saying anything, one way or another,about the "logistics curve"). Also have students articulate their strategies for staying well (e.g., you might see some students along theedges, moving with large steps).
Then the question can become how might the graph (or values) be different if the activity was run again with some key parameter changed?We are about to run it again with the students not being able to see who is sick. But you can also explore what would happen if the percentinfection was higher, or there were more (or fewer) people in the class, or if there were more people sick at the beginning, or if everyoneonly took big steps or small steps, or even introduce androids (which might be thought of as something like mosquitoes carrying a disease)and ask how that might change things. You can then re-run with the parameters changed and see how the students' predictions bear out.We have even found it can be worthwhile running the simulation several times with nothing changed to see which patterns "stay the same."This can also be done more quickly later with just androids, as sometimes students may not be as engaged by running an activity again thesame way (note that "in reality," for reasons having both to do with chance and with the student strategies evolving, the graphs for identicalsettings can be quite different ... but almost always with the same overall shape ... hmmm ... maybe there is something really powerful andgeneral about this logistics curve business after all...). Be open to following student- generated conjectures and possibilities.
Re-Running the Activity
Running the activity a second time with the same group is as easy as stopping the GO button, pressing the RE-RUN button, and followingany directions that are in the QuickStart Instructions. However, if you wish to change some of the settings, such as keeping old plot data orchanging the plot pen that is used to plot the data with, you should be sure to follow any QuickStart Instructions before pressing RE-RUN.Some suggestions as to different settings might be to make it so that nobody or perhaps just the individual knows if he or she is sick, orchanging the chance of being infected. Before rerunning the simulation, push the students to articulate what might be different this timeand why. Questions like "Will it happen faster or slower?", "Will everyone still get sick?", "Will the graph be stretched or shrunk, or will itbe a different shape?", "How might your strategies have to change?" should get a heated exchange going. Again, if you need to getstudents more into committing to different possible stances, you can ask whether things will be "exactly the same". Remember to ask WHYthey think things will be different. As they run through the simulation, they will start to hypothesize as to who is infected and who is not.
Once the simulation is completed discuss the results, especially in relation to the conjectures students presented earlier. Also explore theirstrategies for avoiding getting sick, and if you chose to make it so that nobody knew who was sick, how they might go about figuring outwho it was that was sick at the beginning. Discuss how this might be done for a "real" disease.
In comparing runs, ask students whether, with real diseases, you can always see who is sick. Are there diseases where someone might besick and not know themselves? You could even discuss the different ways diseases might manifest themselves (e.g., incubation periods,carriers, etc.). Another discussion might be about what makes a really "bad" disease versus a less bad disease. Obviously, a disease beingfatal is really "bad" but there is much, much more to it than that. See if you can push students to talk about what kind of role these otherfactors could have. You might get to this point by asking, "So what would happen in our simulation if the second you got a disease youdied, would everyone be likely to catch this kind of disease?" A small modification to the code would allow you to explore this possibilityand related ones (allowing people to transmit the disease for some number of "ticks" of the simulation clock before expiring).
Time ConsiderationsAt least 3 days for the main unit; additional time may be required for NetLogo extensions.
Curriculum StandardsAccording to the National Council of Teachers of Mathematics, students should learn to:

Create and use representations to organize, record and communicate mathematical ideasSelect, apply and translate among mathematical representations to solve problemsUse representations to model and interpret physical, social and mathematical phenomenaUse mathematical models to represent and understand quantitative relationshipsAnalyze change in various contextsOrganize and consolidate their mathematical thinking through communicationCommunicate their mathematical thinking coherently and clearly to peers, teachers, and othersMake decisions about units and scalesAnalyze and evaluate the mathematical thinking and strategies of othersMake and investigate mathematical conjecturesDevelop and evaluate mathematical arguments and proofsUse the language of mathematics to express mathematical ideas preciselyIdentify trends of bivariate data, and find functions that transform the data so that it can be modeled.Understand and apply basic concepts of probabilityDescribe events as likely or unlikelyDiscuss the degree of likelihood using words such as certain, equally likely and impossibleUnderstand that the measure of the likelihood of an event can be described by a number between zero and oneApply appropriate techniques, tools and formulas to determine measurements.
Curriculum ObjectivesThrough conversation and responses, students can describe the reasoning behind their predictions, and evaluate others' strategies formeeting challenges.Through this activity, students can apply concepts of probability to a real-world situation.Students can analyze different representations of data and compare different forms of measurement.Through the activity, students can also begin to model and interpret physical phenomena in the language of mathematics.
Support Resources in NetLogoAs with every other HubNet Activity, the Disease model includes a set of QuickStart Instructions that detail how to setup and run theactivity. In addition, there is information regarding the how to use the model and the clients in the Information Tab.
Equipment/Materials NeededNetLogo SoftwareDice (one for each student)Projection SystemPersonal computerNetLogo model: Disease.nlogoStudent worksheets
KeywordsProbabilityModelingLogistic CurveExponential GrowthRate of ChangeDerivative
Disease Handouts
GridlockSubject AreaMathematics, Science, Social Sciences

TopicsEmergence, Modeling, Optimization, and Measurement
Abstract/SummaryStudents control traffic lights in a city. They can either manually switch their lights from red to green and back again, or set a phase fortheir light - set the time in the cycle when their light switches. The scenario used to introduce this activity to students is that with electionsjust a year away, the class has been commissioned by the Mayor of the City of Gridlock to help improve the traffic problem in her city.Goals for this activity include having the students develop strategies for improving traffic flow and, closely related, developing "metrics" ormeasurements for traffic so as to support their claims for having improved traffic. Part of establishing a metric depends upon deciding whataspects of the driving experience might matter the most to drivers (e.g., speed?, cars stopped?, wait time?), understanding how the metricsmight be related or distinct (e.g., how is the number of cars stopped related to average speed?), creating metrics that may or may not beindependent of the number of cars, and deciding which one or ones to include in a report to the mayor. This project engages many ideasrelated to how global patterns - for example, traffic flow - may be the result of lots of local interactions and strategies. From a curricularpoint of view, this activity has more of a problem solving or project- based structure to it than some of the other activities. Many specificcontent areas and mathematical ideas are engaged, but they are not organized in a traditional linear curricular sequence. Both problemsolving and project-based approaches are strongly supported in national standards documents in both science and mathematics and in manystate and local curricular guidelines. This activity also can be well integrated with social studies topics and raises many science, technologyand society (STS) issues.
PrerequisitesArithmetic, Familiarity with traffic flow
Teacher Notes/ProceduresThis activity requires the HubNet model named Gridlock found in the NetLogo Models Library. If you are using Computer HubNet, be sureto use the version that is under HubNet Computer Activities. If you are using Calculator HubNet, be sure to use the version that is in theHubNet Calculator Activities folder.
When you open the HubNet model in NetLogo the software may ask you to enter information. See the "Top Level Tips" section for moreinformation about this. Follow the QuickStart directions at the top of the NetLogo screen to run the activity. The QuickStart Instructionstake you carefully through each step that needs to be taken to run a round of the Gridlock activity, so rather than repeat these in detail we'lljust focus on the top level "chunks" of this sequence and some of the learning and teaching possibilities that arise.
Setup the Grid
Unlike all the other activities where you need not plan ahead much for how many students log in (where, generally, the rule is the more themerrier), in this activity you need to have an intersection for each student to control. This means the traffic grid needs to have enoughintersections and these need to be arranged in a two-dimensional, rectangular pattern. 30 students is easier to accommodate (e.g., using a 5x 6 grid) than either 29 or 31. To accommodate these more difficult numbers you have some options (in descending order of what we'vefound to be preferable, but you should do what works best for you):
1. create more intersections than necessary and have some of them controlled by the computer (intersections which aren't controlled bystudents are automatically controlled by the computer)
2. have a few students pair up3. have some students control more than one intersection.
Once you've decided on the dimensions of the grid you'll use the sliders in the model to set these dimensions. Next you'll decide how manycars to include using a slider, and you'll have to decide if you want to run in manual or automatic mode. Manual mode allows students tochange their lights when they want, automatic allows them to set at which time on a modular clock their light switches. We recommendstarting with manual mode. After running the activity while only viewing the data from the Stopped Cars plot, we recommend turning on adifferent metric or even all three metrics (by setting display-which- metric to 4) for display in NetLogo. You can decide which of the threemetrics to send back to the clients. Unlike the Disease activity where each dataset is associated with different runs, in Gridlock the data forall three metrics is collected during a single run. Note that the vertical scale is distinct from metric to metric and the scaling of the axes willbe very different.
Now press SETUP. Remember SETUP is a "powerful" button, requires students to login, and is typically used at most only once in a classperiod. RE-RUN is used to repeat the activity, doesn't require login, and may be used many times during a class period (assuming you keepthe size of the grid the same).

Initial Student Login
After the setup you will be prompted to press the INITIAL LOGIN button and then have students login. As they do, their user-ids willappear next to unique intersections in the simulated traffic grid.
When students are told their intersection they are told using the first quadrant Cartesian coordinates. The traffic light in the lower left handcorner is (0,0), the one above it is (0,1), and the one to the right of it is (1,0). Some teachers have preferred to let the students figure outhow this system works, but generally we have tended to tell students that the first number is how many "over" starting from zero and thesecond number is how many "up" starting from zero. They should see their user-id at this intersection. As further confirmation, if you aresetup to use the manual mode, they can try changing their light by pressing the associated button on the client. This should change the stateof their light and they should note how the red and green squares, representing the lights in the respective directions, exchange locations.This is what allows cars to pass in one direction and not in the other.
Letting the Traffic Go
Once everyone has logged on and found their intersections, press the INITIAL LOGIN button again to turn it off. You can choose todiscuss the different graphical metrics before the students start, but we recommend (pretty strongly, since students will be antsy to assumecontrol of the network) that you wait until after things have run for a while to discuss them. And then we recommend starting a discussiononly after you have pressed the GO button again (to turn it off) to stop the traffic flow. While students will become very animated incontrolling the traffic, you can encourage them at least a little bit to "notice the graphs" as they are playing.
Remind the students that they are suppose to be improving traffic flow, and press the GO button to let them have at it for a while longer.
At first students will be very focused on their own intersections, then they will tend to become aware of how their intersections areimpacted by the ones around them (such that you'll hear them "encouraging" their peers [e.g., "Hey, number 3 turn your light faster!"]) andthey might even begin to develop local strategies that they'll work to articulate. As this is going on, you might report a top-levelcharacterization of how they are doing ... "Ooh, things are getting better (worse) ... whatever you all are doing is starting to payoff (or not)."
Depending on how in-control you feel, you might want to have the last 10 - 20 seconds of the first run be with the students not controllingtheir traffic lights. Obviously this will suddenly make the traffic much worse (we expect!) but the contrast will be useful in helping tounderstand the relationships between the metrics and what it is they measure. Then press the GO button again to stop the flow of traffic.
Discussion of Strategies
A place to start the discussion is to ask students what strategies they used in controlling their traffic light. Some of the strategies we'veheard include:
Turning green in the direction that there are the most stopped cars (we call this the "traffic cop" strategy because it is the one policeofficers use when directing traffic)Turn green in the direction the most cars are coming fromFollow the light before my intersection (usually students mean vertically)

Just alternate (sometimes with a counted interval [hinting at what the auto? yes mode is about], sometimes not)
You can also ask if these are strategies that everyone might do (almost all of them are). Also ask if there are other strategies that might betried as a group. Two of the most common are:
"Synch the lights" where one turns green, then another, then another. This is a strategy they may have experienced in some cities.Lots of interesting conversation can happen about how to implement this and whether "synch"-ing one direction (e.g., downward)will synch in the other (to the right).In a variation of the second strategy above, by anticipating stop the fewest cars.Push the students to see if they can generalize some of their earlier strategies.
Discussion of Metrics
It is important that the discussions and analyses of results not always be "centralized." One of the distinctive features of the HubNet designis that it puts powerful functionality in every student's hands so that each of them can become more facile and nuanced in using thisfunctionality to make sense of complex phenomena. If you have not already sent the clients the plot data, please be sure to do so now.
All three plots are now on the clients. We have found it valuable to have students work in groups of three at this point. All the graphs havethe same horizontal time scale and this axis has the same interpretation for all three (the number of "ticks" of the simulation clock from thebeginning of the simulation [actually it is sampled, but the sampling is identical]). Ask the groups of students to compare the graphs and seehow they might be related. The three metrics are:
Stopped Cars (1)Average Speed of Cars (2)Average Wait Time of Cars (3)
If they think an increase in one quantity should be related to an increase or decrease in another quantity, they should be able to find thisrelation in the graphs at a given region of time. Note, too, that two of these quantities are "averages" and one is just a count (Stopped Cars).How might this difference show up in the data? Finally, each group should start to think about which data set is most useful as a metric forthe quality of traffic flow. Why? If they think more than one is needed, which ones and why?
Repeating the Simulation
Now that you have discussed possible strategies and metrics, you can rerun the simulation any number of times. Press the RE-RUN buttonto clear out the plots. Choose which metrics you want visible on the upfront screen by changing the value of the display-which-metricslider (if you've decided on one you can choose that one, otherwise number "4" will give you all three metrics at the same time).
If you've decided on a strategy, make sure everyone understands it. As it may be easier to make comparisons if you do nearly the sameamount of time for each strategy (and the sampling that is happening will be less likely to cause confusion), decide and announce inadvance how long you are going to let the simulation go. If the strategy requires some coordination, have the students work this out inadvance. If someone is, for example, to "count to ten" make sure someone is appointed. It is preferable if a student is in these specialtyroles. So if you do have an extra student, let him or her take up this role. Now press GO and let the students implement the strategy.
Now comes the challenge of comparing complex data sets. Let groups of students brainstorm different ways of comparing them.
You can structure this analysis in lots of different ways. The analysis can, easily, take a whole period if done thoroughly. At some pointstudents should present their analyses to the class. The purpose of the presentation is to make a recommendation to the Mayor and be ableto defend this recommendation. Both the teacher and their peers can evaluate groups on how well they achieve this.
Extensions and Other Things to Try
Try changing the speed limit for the cars. How does this affect the overall efficiency of the traffic flow? Are fewer cars stopping for lesstime? Is the average speed of the cars higher or lower than before?
Try changing the number of cars on the roads. Does this affect the efficiency of the traffic flow?
How about changing the speed of the simulation? Does this affect the efficiency of the traffic flow?
Using HubNet, try running this simulation with AUTO? being true and AUTO? being false. Is it harder to make the traffic move well usingone scheme or the other? Why?
Using HubNet, try running this simulation with AUTO? being true. Try to find a way of setting the phases of the traffic lights so that theaverage speed of the cars is the highest. Now try to minimize the number of stopped cars. Now try to decrease the average wait time of thecars. Is there any correlation between these different metrics?

Time Considerations2 to 4 days
Curriculum StandardsFrom the NCTM standards:
Data Analysis and ProbabilityFormulate questions that can be addressed with data and collect, organize, and display relevant data to answer them
Problem Solvingsolve problems that arise in mathematics and in other contextsapply and adapt a variety of appropriate strategies to solve problems
Connectionsrecognize and use connections among mathematical ideasunderstand how mathematical ideas interconnect and build on one another to produce a coherent wholerecognize and apply mathematics in contexts outside of mathematics
Representationuse representations to model and interpret physical, social, and mathematical phenomena
Curriculum ObjectivesAs the students decide upon various metrics, they form connections between the model and the mathematics they decide to use. They willalso try several strategies, and have the opportunity to tie together many ideas from mathematics and social analyses of behavior andpreference.
Support Resources in NetLogoAs with every other HubNet Activity, the Gridlock model includes a set of QuickStart Instructions that detail how to setup and run theactivity. In addition, there is information regarding the how to use the model and the clients in the Information Tab.
Equipment/Materials NeededNetLogo SoftwareNetLogo model: Gridlock.nlogoPersonal computerProjection System (for computer)
KeywordsModelEmergenceTrafficMeasurementMetricPhaseAverage
PollingSubject AreaMathematics, Science, Social Sciences
TopicsMeasurement, Testing, and Probability

Abstract/SummaryPolling is a tool in which students can respond anonymously to multiple-choice questions posed by the teacher. The results are structured ina meaningful manner by showing a histogram of the responses in a plot. Some statistical information, such as the average and mode, arecalculated to help the class make sense of the meaning of the students' responses. This activity can be used in any subject for whichmultiple-choice questions can be framed.
Polling can be used as a tool to assess student work through automatic generation of plots and visualization tools. Polling can also be usedas a quick way to gauge student opinion on a topic. Furthermore, Polling can be used as an introduction to probability and statistics throughuse of histograms.
PrerequisitesNone
Teacher Notes/ProceduresThis activity requires the HubNet model named Polling found in the NetLogo Models Library under HubNet Computer Activities.
When you open the HubNet model in NetLogo the software may ask you to enter information. See the "Top Level Tips" section for moreinformation about this. Follow the QuickStart directions at the top of the NetLogo screen to run the activity. The QuickStart instructionstake you carefully through each step needed to run a round of the Polling activity, so rather than repeat these in detail we'll just focus on thetop level "chunks" of this sequence and some of the learning and teaching possibilities that arise.
Setup the Questions
It's often good practice to gauge student opinion during class. By using the Polling activity, you can visualize students' responses to yourmultiple choice questions. You might consider entering the questions before the students arrive so that the activity goes most smoothly.
Some suggestions for coming up with questions for the students for each of the different aspects of Polling: Start general with your multiplechoice questions and plan toward complexity. Focus on general understanding of the material by testing specific knowledge. Opinion pollscan be used to determine a course of action for class. To introduce probability and statistics, a set of questions could arise by highlightingthe different statistical information: mode, mean, and median. Activities might involve determining what forms of data generate differentgraphs and averages. For all sets of questions, it is necessary to remember that each question must be answerable in terms of numbers from0 to 9, since the provided client slider can choose only from those values.
Students Answer Questions
When you are ready for the students to respond to the questions, ask them to log into the HubNet Client to do so. The questions will appearin a monitor on the client for the students to read. You have the option of allowing students to be able to enter their response multiple times,allowing them to change it, or restrict them to entering it just once, committing to their initial response. It is also possible to control whetherthe data is shown during the collection times so that the students aren't influenced by others' choices. When the class is finished respondingto the question, you can proceed to the next question. You can decide at any point to return to some other previous question, either to lookat the answers students gave, or to allow them to resubmit answers.
Analyze Answers
After getting the answers from the students for one or more of the questions, it is a good idea to go over the submitted results as seen in theplot and the monitors.
If you are using Polling as a quizzing tool, here are some suggestions in how to analyze the data. Did everybody get the correct answers?Perhaps there were a few groups of answers. This might indicate some different understandings of the material.
If you are trying to use Polling as an opinion poll, you may want to consider the following possibilities. It is clear enough what to make ofit if everybody agrees on a course of action or opinion. Still, maybe you should play devil's advocate and take a position contrary to thepopular response. However, what about if the class has an 80 - 20 split? Or a 25 - 25 - 50 split? Try to have the students articulate why oneopinion or course of action might be better than another. Be sure to have them try to keep their opinions based in facts and not purely onwhims or popularity. After discussing, try polling again. Did the percentage change? If so, why? What made one group's argumentpersuasive?
While you are analyzing the data from the answers, you may wish to use this as an opportunity to introduce some basic concepts ofprobability and statistics to the students. For example, you could ask the students to calculate the average, or the standard deviation of theanswers and explain what these calculated values mean in the context of the plotted data. You could also ask them to determine what

percentage of the class chose one answer over another. These tasks can be especially important if you are using Polling as an opinion poll.Which group is bigger? What happens if there are more than 2 groups? How does that affect the mode and median?
Repeating the Activity
There are a couple different ways of repeating the activity. You can reuse the same questions with the same group of students, collectingnew answers the second time. In the quizzing context, you could think of this as a pre-test of the material before you cover it and then apost- test afterwards. This can help you see how effective your presentation of the topic was for this group. Or as described above, youcould also think of this as an opinion poll that has been discussed. Did opinions change after the discussion?
You can also use the same questions with a different class. This prevents you from having to type in the same questions multiple times. It ispossible to add questions at any time. Finally, you can clear the questions entirely and come up with a new set of questions for the samegroup of students. All of these options can be useful in the classroom.
Time ConsiderationsLess than 1 day
Curriculum StandardsFits into a variety of activities.
Curriculum ObjectivesWhile this is mainly a tool to be used for doing either a visualization of responses to material or for general-purpose opinion polls, it canalso be used as an introduction to probability.
Support Resources in NetLogoAs with every other HubNet Activity, the Polling model includes a set of QuickStart Instructions that detail how to setup and run theactivity. In addition, there is information regarding the how to use the model and the clients in the Information Tab.
Equipment/Materials NeededNetLogo SoftwareNetLogo model: Polling.nlogoPersonal computerProjection System (for computer)
KeywordsMeasurementAverage
S.A.M.P.L.E.R.(Statistics As Multi-Participant Learning-Environment Resource)
Subject AreasMathematics (Statistics, Probability, Combinatorics)
TopicsStrategies for guessing and calculating spatial proportion, calculating range and mean, histograms, distribution, variability, samples andsampling, group dynamics (effect of social interaction on decision making), the Law of Large Numbers, and randomness
Abstract/Summary

Students use their individual computers to take samples from a population, analyze these samples, and input their guesses as to the metricsof the population, as based on their sampling and analysis. The population is a large square "mosaic" of green and blue tiles (NetLogopatches) and students take samples to evaluate the percentage of green in the population (or, the population’s greenness). Students' input --their guesses of the population greenness -- is pooled and displayed as a histogram. If enough students are participating, then even thoughmany of the guesses may be off, this histogram average will be quite precise, showing the need for collaboration, pooling resources, andstrength in diversity of opinions. Initially, students watch and discuss ideas about an overhead projection of the population that is uncovered so you see all the green and bluetiles. Without computers, students initiate and discuss strategies for evaluating or indexing the greenness of the population, each studentguesses the greenness, and students initiate and discuss methods for determining a class guess (e.g., the average). The teacher demonstratessampling, and then all students get to sample on their own screens their own chosen samples from a new population. Students may chooseto work alone, in pairs, or in groups. In between rounds, the teacher leads conversations about sampling strategies. Students receive alimited sampling "allowance" (how many patches of the population they may reveal). An optional feature of S.A.M.P.L.E.R. gives studentsfeedback on how well they are guessing the correct value by deducting points from students for being off the mark. So it is worthwhile forstudents to pool information in order to succeed as a group, but some students may wish not to do so in order to get ahead of the group.Thus, S.A.M.P.L.E.R. uses the normal classroom group dynamics in order both to learn about statistics and to address issues ofcollaboration.
PrerequisitesMultiplicative concepts (multiplication, division, fractions, proportion, percentage).Basic graph interpretation.
Teacher Notes/ProceduresWhereas late elementary school students will find S.A.M.P.L.E.R. interesting and will benefit from it, this activity is best suited for middle-and high-school students, because more of them will be able to apply their mathematical skills in ways that will inform their samplingstrategies. Also, S.A.M.P.L.E.R. -- like other HubNet activities -- welcomes diverse types of reasoning: Students who have strong commonsense, but do not usually stand out as exceptional in their mathematical skills, will be able to participate and contribute their own strengths,such as visual-spatial, analytical, and metaphoric reasoning, as well as imaginative story telling. Finally, as other activities, S.A.M.P.L.E.R.is a basis for many offshoot activities, in topics of combinatorics and probability, some of which we describe below (seehttp://ccl.northwestern.edu/curriculum/ProbLab/).

Introduction
1. Be sure to set all student screens to at least 1024*768 pixels, else their S.A.M.P.L.E.R. client interface may not fit.2. Students are not yet logged on. Press REVEAL POP. to show a population of 50% green, with ABANORMALITY set to 0. You
may wish to zoom in once or twice so that students focus on the graphics window and do not see the slider above it. Ask studentsto describe what they see and what they think this activity might be about. Take 10 different ideas and write them on the board,but elaborate more on some of the ideas that seem useful for later discussions. Students' ideas may be fanciful and/or humorous,and students should feel relaxed and proud of their ideas, since there is no "correct" answer.
3. It may be worthwhile to settle on names for the colors. For instance, if the majority of the class wants to call the darker color"purple" (and not “blue”) you can go along with that suggestion.
4. Ask students somehow to guess or estimate "how green this is, on a scale of 0 to 100," or "what percent green this is." Everyoneguesses and writes down their answer on paper. Also, ask them how one could go about measuring this greenness: for instance,what computer features could help us. Reveal the answer with the ORGANIZE? switch set to "On" and show students how to readthis display using the percentage slider above it. Toggle between ORGANIZE? "On" and "Off" (show these displays alternately,using the ORGANIZE? switch and the REVEAL POP. button) and discuss the transformation between these two displays. Askstudents for metaphors to make sense of this transformation, that is, for good ways to think about, or describe, what they areseeing. (If students do not understand the task, suggest that the green and blue are each being pulled by "color magnets.") Ask thestudents each to note how well they had guessed. Ask your students what they guessed, e.g., "Who guessed 30? Who guessed 31?Who guessed 32? ," etc. and see if there are more hands in a cluster around the correct answer. That is, as the number you call outgets closer to the correct answer, it may be that more students will raise their hands, but once you pass the correct answer less andless hands will be raised. (Alternatively, you can read out the numbers and have each student clap their hand, instead of raisingtheir hand.) Ask students if they noticed a cluster of guesses around the true percentage. Write all of the students' guesses on theboard. Ask students if it would be worthwhile to consider all of these class guesses, and, if so, then what would be a good way ofdisplaying and processing all of these guesses. Write ideas on the board. If students say we should only consider the "correct"answers or those very near to the correct answer, then remind them that before we had exposed the correct answer, on a previousrun, nobody knew what the correct answer was; so, we need to come up with a strategy that will work even when we don't knowthe true answer.
5. Switch RANDOM-RERUN? to "On," and press RERUN to create a new population with random percentage green. Note that youyourself do not know the correct answer now, so your guess is as good as anyone's... Let the students know that you do not knowthe answer -- that you are just like them now because the computer is generating a random number. This time, after students haveall said out loud their guesses and you've written them on the board, you should also elicit individual student guessing strategiesand write them on the board, e.g., "Why do you say it's 70%? Why not 60 or 80%? What are you doing to get to these answers?"Make sure all students are stating the percentage green, and not blue, (though some students may guess for blue but then subtractfrom 100% and state the difference as the percentage green). Ask students if guessing is the best way of going about determiningthe greenness of the population, and whether they have suggestions for improving this activity so as to achieve higher precision.When eliciting their ideas, you can also raise issues of efficiency: for instance, to count all of the tiny squares may beunreasonably time consuming.
6. Discuss percentage with your students. Some students may be able to state that the population is, for instance, 70% green, but atthe same time they will not understand that this number means that 70% comes from the quotient of green tiles and all tiles. It maybe easier to communicate this idea when the population is revealed with ORGANIZE? set to "On."
7. Some of your students may be always choosing "round" numbers. Ask them why they are doing so - do the results prove thatchoosing such round numbers is a good strategy? In addition to this being an interesting conversation, it may help in that you willreceive less clusters around certain numbers - we don't want that, if we can help it, because it may confuse students later whenthey are building a histogram (they will get curves with many bumps).
8. RERUN again with RANDOM-RERUN? switched to "On" and again elicit everyone's answers. Ask students how they feel abouttheir own guesses and about those offered by other students: Are individual students finding that they are systematically under-estimating or over-estimating? Are they changing their minds about the greenness once they hear their friends' guesses? Generallyspeaking, is it a good idea to peep at a friend's guess and guess the same? Is it better to know other students' guesses beforecommitting yourself to your own guess? How could we find out, as a community of mathematicians, what is better - to guess,then discuss, or to discuss and then guess? When you guess, are you thinking just about the greenness, or are you also wonderinghow your friends may be guessing? It might happen that some students get swayed by the guesses of other students, especially bydominant students. Such a swaying will cause the guesses to be near each other, but overall the class‚s guess will not necessarilybe more accurate.
9. Repeat without discussion (the "guess-then-discuss" strategy) - students write and hide their results. Now reveal an organizedpopulation. Let students evaluate how well they did individually, and discuss with students how they feel: Did this strategy helpthem do better? Did it help the class do better as a whole? How can we know? (Can we base our decision on just one trial?)

10. Some students probably will have spoken about how sharing guesses affects individuals, such as themselves. This means that theclass is working as a group -- that the decision-making is collaborative. What would it mean to have a "group guess?" Howshould we process individual guesses to get a "group guess?" (Discuss strategies, introduce the idea of average, and explore waysof computing average.) Have volunteer students compute the average of students' guesses in the last round (they can usecalculators or the calculator application in their computer) and compare the average to the revealed answer. Ask how well theclass did as a whole. Ask students how they feel about their own and others' guesses. What is better for the class - that moststudents guess spot on or not?; any useful patterns? [we're getting at the ideas that we need a range of opinions to balance oneanother, and that this balance calls for roughly the same on both sides of the true answer, even though perhaps not even onestudent got that true answer; for every over-guess by x there is an under-guess by x.] Explore how comfortable students are withthe idea of averaging. A provocative, and perhaps intentionally confusing, question is whether we should give more weight toanswers that are closer to the truth. Of course, if we calculated blindly we couldn't know in advance which answer was truer, couldwe? Also, perhaps students will suggest that instead of calculating the average, we could simply choose the answer that moststudents suggested (mode instead of mean). Would that work? How safe is that? This is getting at the idea of variance in thedistribution: It could be that students' guesses cluster around the correct answer even without there being more than a singlestudent per guess (giving a histogram that is "flat" but denser in the middle). We would have to look at intervals of 5 or 10 to get abell-shaped curve. For instance, if the answer is 70%, perhaps a third of the class will guess between 65 and 75 but no twostudents will guess the same percentage. B y adjusting the CLUSTER-GUESSES slider above the histogram and pressing thePLOT GUESSES button, you can bunch up the guesses and get a bell-shaped histogram or curve.
11. If your class has never used a histogram before, you will, at some point, want to build one on the board. This will help yourstudents to interpret the S.A.M.P.L.E.R. histogram graph later. Also, it will allow you to speak of distribution shapes and features,such as a "humped" or "bell-shaped" histogram or curve.
12. In a large enough class, most students should avail from adopting the group guess because for most students the group averageguess is closer to the true percentage than their own guess is. Yet, these students may feel uncomfortable with going with thegroup guess, since they are admitting in advance their insecurity in their individual guess. This seems to be a paradox: how can Ibe confident of my own guess and yet elect to go with the group guess? (Granted, some students will not be confident in theirown guess, either.)
13. Locate students whose individual guesses were better than the class average. How do these students feel about the class guess? Dothey expect invariably to do better than their peers? Do they think that group guessing is a good idea? Discuss this with the class:How should these students feel? Is it possible, in principle, that everyone will avail of a group guess? How would a distributionhave to look in order for that to occur? [Answer: the closer the class mean is to the true percentage -- that is, the better the classdid as a whole -- the less students are damaged by the averaging strategy.] (If there are consistently-good guessers, perhaps youcan put a spin on the "damage" they incur by going with the group guess by telling these students that they were the best guessers,and therefore now it is their responsibility to share their strategy with the other students.)

Students Log On
Reminder: Make sure you have initially set the ALLOW-STUDENT-SAMPLING? switch to "Off." We will first replicate with thecomputer the class guessing you did before and only later go into sampling. In sampling, we will also attend to additional features:students' sampling allowance and $$ remaining. 14. Logging on: make sure students practice using the mouse, sliders, and buttons. You can use the %-TARGET-COLOR slider on
the server screen to demonstrate how to set the slider on a guess.15. Repeat original activity. This time, students enter their guesses by setting their guess slider, pressing the INPUT-GUESS button,
and seeing that they get a feedback message ("Thank you. Your input is: XX"). Spend plenty of time on the histogram:
15A. Explaining the meaning of the axes: this is easier if it happens that at least two students have the same guess because then atleast one of the bars will be taller than the other bars. (On repeated guessing rounds, you can increase the value of theCLUSTER-GUESSES slider. Place the cursor on the server histogram and see that you get the x and y values of each locationon the Cartesian plane. This can help students understand the structure of the histogram.
15B. Locating individual students on the screen and establishing the range of the cumulative event (lowest and highest guesses);Who guessed lowest? Who guessed highest? Who guessed furthest from the average? Be sensitive that some students whoguessed “way off” may not wish to expose themselves.
15C. Appreciating the distribution. Is there a "cluster" in the middle? Is it sparser on the extremities? What does this mean? Howshould we call this kind of distribution? If it happens often enough, perhaps we'll call it "normal?"...
15D. Suggest the idea of balance across the average. See if you can match students who over- and under-guessed. For instance, ifthe average is 75, then Maggie, who guessed 70, is matched with Bobbie, who guessed 80, etc. It's perhaps like the game Tugof War, with Maggie and Bobbie each pulling from different sides. Is that that best metaphor? (No, because in Tug of War, thelength of string is not critical). Are there other ideas, names, or patterns students can contribute?
16. Taking samples electronically will first be demonstrated by the teacher by pressing the SAMPLE button and then clicking on thescreen (see next bullet). However, students might stumble upon sampling even before you or they have actually taken an electronicsample, in order to explain their ideas, as follows. The entire mosaic is too large for making conclusive observations that gobeyond vague estimation. Students may have the sense that we can infer about the whole by conducting a careful measurement ofa single area. This brings up the question of which area we should focus on (it may be that many students will choose the center ofthe screen as most representative -- you can then ask them what they would do if they had more than one sampling opportunity).Students will search and argue over an area that is representative of the whole and you should ask them to explain in what sensethat "sample is a good example" -- why they chose that area. Note that you can begin from a revealed population, observe it, havestudents input their guesses and discuss the group's guess, and only then hide this population again by moving into the samplingmode and taking a sample.
17. Sampling: Reveal a random population and ask students if they know what "sample" means, what the SAMPLE button might do,and how this is connected to what we've been doing up to now. Write students' ideas on the board. Now press the SAMPLEbutton, set the SAMPLE-BLOCK-SIDE slider value, set the KEEP-SAMPLES? switch to "On," and show students that you areabout to take a sample from the population. Tell them that the population will vanish, except for an area around the cursor. Theycan think of a sample as a window onto a concealed population. (As usual, you should elicit their ideas, too.) A sample is a bit ofthe population that we examine to make inferences about the entire population. The colors of tiles do not change just because yousample them; the colors of the tiles in a sample are the same as the colors of those tiles in the revealed population. Take severalsamples and encourage students to see that if you take enough of them, you will have exposed the entire population. This is

important because in following activities, students will not see the entire population, and they must experience the uncertainty thatthis limited access creates.
18. Raise the value of the ABNORMALITY slider to a number greater than 0. Take a new population, reveal it, determine itsgreenness value, and then take a medium-sized sample out of it. Try to choose a sample that deviates from the populationgreenness. Ask students how this can be, seeing as the sample is an area of out the population. This is essentially a discussion ofsample-mean distribution (or density of greenness distribution). Challenge students to assess what could be the fewest and thegreatest number of green tiles per sample of this size.
19. [Tangent class-work and/or home-work] Students may be noticing that different patterns arise in the various samples the class hasbeen taking. Have the students investigate the combinatorial possibilities of a certain size sample. For instance, ask students tothink about 3-by-3 samples and to determine all the different outcomes of such a sample and draw them on graph paper. Becauseeach tile/patch can be either green or blue, there are 2^9 different combinations. That's 512. Let your students discover, on theirown, that there are many such possibilities. We want students to form some system for ensuring they have covered all options ontheir own. Because there are so many possible combinations, you have two options at this point:
19A. Students distribute the work systematically. For instance, 25 students would then each have to draw just over under 20 patternseach, and then the class can paste all these on a poster. Students may discover that some generic patterns can be rotated 90,180, and 270 degrees to form different patterns; also, they may discover that there is a connection between number of greentiles and number of different patterns, i.e. the binomial distribution of such a sample space. That is, there is an equal number ofways to arrange 1 or 8 green squares in a 3-by-3 array and an equal number of ways to organize 2 or 7, but the number ofways to organize 2 or 7 is greater than the number of ways to organize 1 or 8. The students can attempt to form a histogramrepresenting this.If this task is too challenging or unmanageable, you can reduce the SAMPLE-BLOCK-SIDE to 2, so the sample size willreduce to 2-by-2. For 4 tiles there are 2^4 combinations. It would be wonderful if students discover the 'power-of-2' rule (2^x)for calculating the number of different patterns in a block of x tiles. You can decide whether it seems reasonable to pushstudents towards this. You could ask them to begin from 1 tile, 2 tiles, 3 tiles, etc., and to create a function table with columnslabeled "number of tiles" and "number of combinations/patterns."
19B. An advanced task is to approximate which patterns are more typical of given populations. In other words, you are asking yourstudents to investigate whether or not the distribution they determined for the sample space is valid in a specific population,where you can consider both the overall percentage green in the population and the type of distribution pattern (the degree of"abnormality"). Note that in a population, of say 33% green, there will be many more occurrences of patterns with three greenpatches than with five, even though in the sample space of all 512 blocks the reverse is true.
20. Ask students to think of populations that would be difficult to work with, and ask them about sampling strategies that couldrespond to these difficulties they have posed. Sampling strategies must address at least four factors: (1) size of samples; (2)location of samples; (3) number of samples; and (4) time expended on sampling and analysis. These factors are related: forinstance, if your overall sampling allowance is limited then you can either take many-small or few-larger samples.
21. RERUN with the ABNORMALITY slider set to maximum. Set KEEP- SAMPLES? to "On." Take 3 or more samples, until youget high variability of the samples. Ask students how this could be and what would be good sampling strategies given thisvariability: Tell students you cannot take more samples, perhaps due to limited resources. Should you, in principle, concentrate allsamples in one spot to uncover a big segment, or should you distribute the samples all over the population? Does it matter?
22. RERUN with a %-TARGET-COLOR slider set at 77% green and ABNORMALITY set to 0. Take repeated samples of size 3-by-3 and don't keep the samples. Ask the class what they are seeing. Are they noticing a pattern? Students may attempt to use simplestrategies to express the fact that, on average, these samples have 2 blue patches. Help your students mathematize their perceptualintuitions: write the outcomes on the board and compute the average.
23. Discuss sampling strategies: What would students do if you allowed them: (a) a single sample; (b) 10 samples; (c) 25 samples? Seeif students suggest that the size of the samples plays a role in their decision-making. If not, then you should introduce this idea andask them how, if at all, it affects their choice of strategy. What if you allowed them a total of 100 exposed tiles and allowed themto choose how many samples to take? Call students up to the board to draw diagrams of the mosaic: They should make an outlineof the hidden mosaic, and then draw inside of the outline the location of their samples. Guide a debate over different strategies fordistributing samples across the hidden mosaic. Should the samples be near to each other?; far from each other? Should they beevenly AND orderly distributed over the screen, or should they be scattered according to some other plan? In this discussion,make sure that you get students to share their assumptions about how the green/blue tiles are distributed, since these assumptionsare probably guiding students in forming strategies for distributing samples. You may want to have this activity before studentssee the "clumpy" (non-randomly distributed) populations. That way, you could see if students anticipate such populations. Also,once you do show them clumpy populations, they may be more engaged and surprised, having had this discussion of samplingstrategies. As homework, you can ask students to draw diagrams of their sampling strategies and explain them.
24. Towards students’ individual sampling, you should help them understand the various features of their interface (which is differentfrom the S.A.M.P.L.E.R. model interface). You can do that by creating a student interface on your own screen, in the followingway: opening and logging into a HubNet Client on the computer that is running NetLogo. Once this client interface opens on yourscreen and the overhead projection, you can point to the various sliders and monitors and explain them. To input student guesses,each student press COLLECT DATA. Students should each use their slider to indicate their guess, and then they should press onINPUT GUESS. Then you press PLOT GUESSES to histogram student guesses. They will receive a feedback message.
25. Show a clumpy population, input class guesses and histogram them. Now, hide the population. Discuss with students where to putten 3-by-3 samples, letting 10 students each choose one location. Discuss ways of compiling the samples into a mean. One way isto calculate the greenness in each sample, then average these values. Another -- probably easier way -- is to add up all the greenand divide by total exposed tiles (90 tiles). Perhaps a student will suggest taking 1 sample more, to have 99 tiles in total (which isnearly 100). Once students have found the average, compare this to the class guess. Repeat this activity and discuss with students

what is better - guessing or sampling? When is this true? [a single student cannot rely too much on guessing because large (social)numbers are necessary to achieve a good mean]
26. Take a biggish sample (perhaps 7 by 7) from a hidden clumpy population and give students 10 seconds to input their guesses.Process and plot data, discuss histogram. Make sure that KEEP- SAMPLES? is set to "On." Press MORE DATA. Take anothersample and repeat guessing and plotting. Now you have 2 means and, in between them, their respective grand mean (the mean-of-means). Discuss this. Ask students what will happen to the mean-of-means if you repeat this action. Keep repeating this process.What will probably happen is that eventually the mean-of-means will not jump around that much -- it will "settle down," gettingcloser and closer to the true %-TARGET-COLOR. This is because as you sample more and more -- and assuming that theaggregate guess is not too far off -- you cover more and more grounds of the population and so students' collective guessesapproximate the true answer.
27. Optional tangent: Ask students what each green square is “worth” -- is it 1%? [No, there are 3721 squares, so we need about 37squares to make up 1%]
28. Some students may be confused as to "where" the 100 tiles are. That is, they might confuse between the overall number of tiles inthe population and the '100' denominator of the percentage (x/100). Remind your students that a percentage is just another fraction-- for instance, 50% is just 1/2 -- and that we use it for convenience, as in comparisons.
Student Individual Sampling
{Now students sample individually and, perhaps, in collaborations, so we must introduce and discuss the “sampling allowance” and the “$$remaining,” features. These features of the activity have interface elements on the students’ screens. Note that though this section, below, isbrief, running it in class might take up the majority of unit. It is also an opportunity to revisit all of the content that has been introducedearlier. Also, because students will now be working in groups, you will have opportunities to move among and support students.}
1. Random rerun with high abnormality and do not reveal the population. Let students take samples individually and input theirguesses once they have exhausted their sampling allowance (or earlier, if they so wish, but in any case you cannot have a fewstudents hold up the entire class so you'll need to say "ok, you have 2 minutes left"). Negotiate with students whether you shouldreplenish their sampling allowance and to how much. If they ask for very high sampling allowance, the class will have to discussthe fact that we are simulating sampling and that therefore we must create constraints. Suggest that instead of replenishing,students could input their data and later take more samples. Students may object that by doing so they are not going to guess,individually, as well as they would otherwise, and other students may say that this doesn't matter if you choose to go with thegroup (so you'll need to discuss this important feature of the activity – see the GO-WITH-GROUP-GUESS? switch on students’interface).
2. An advanced feature on the S.A.M.P.L.E.R. interface is the MARGIN-OF-ERROR slider that is useful for the $$ game. Bydefault, it is set to 0. That means that there is no margin -- if your guess is a single % off then you get $1 off, and if it is 2% offyou get $2 off, etc. The MARGIN-OF-ERROR is the tolerance of the guessing game. If the MARGIN-OF-ERROR slider is set to1 then you may be 1% off and not be penalized. The maximum current setting of this slider is 10. That means that guesses within10% either above or below the true answer are acceptable. Some students may wish to utilize this slider, but others --possibly thegood estimators -- may object that they may lose their advantage over other students this way. The class should discuss andnegotiate the setting of this slider, and whether this is a competition or a collaboration.
3. The students may ask, "Where do the dollars go?" (the dollars that they lose) Tell students that we had a student called Liza whowas not clear on who gets these dollars. She thought that the dollars go to individuals in the game. You must clarify that thedollars go to the "House" (as in casinos). At the same time, we can learn from students new ideas for modifying the design.Perhaps Liza's idea is better. How would we distribute students lost dollars?
General Remarks
· Students should not be obliged to wait too long before they actually interact with their interface, because they get impatient. Wehave found it most efficient to have students' computers fully on but to have them log in only once you are ready.
· Make sure students are guessing for green and not for the other color. In particular, you must remind them this when the populationis of a high greenness, because the human eye naturally focuses on what is in the foreground and not on what is in thebackground.
· Make sure the student-guesses histogram is, at least initially, set to the minimal interval. Whereas, when working with smallgroups, you may wish to increase the interval so as to get some grouping, this impairs students' initial ability to locate"themselves" on the plot.
· General remark on vocabulary: Students may have individual names for the mathematical objects. For example, they may want tocall a sample a "box." You should accept these words because they help the students each make sense of what they are seeingaccording to their own understanding. At the same time, you should introduce the mathematical language. You could use 'box'once, then 'sample' another time, or even say 'sample-box.' That way, students will learn to associate between what they know andwhat they are learning. Also, they will feel proud that the class is using their own suggested words. This helps them to own orappropriate the new material. Finally, you want the class to create distinctive words for the Graphics Window, the population, thesamples, and individual patches. It is unhelpful if students call all of these "boxes."
· Note how the average of two samples (of the same or different size) works: If in Sample #1 there are 5/9 target-color and inSample #2 there are 3/9 then the average is 4/9. This may appear as "adding fractions the wrong way" if it is shown as: 5/9 + 3/9 =8/18 = 4/9. It is worthwhile to discuss what is "correct" and what is "incorrect" about this way of thinking about and computing

averages. When you have two part-to-whole relations you can find total parts and total wholes and divide them to find the totalpart-to-whole. In a way, pooling two or more part-to-whole relations is like a "batting average," which is the quotient ofaccumulated totals-runs and accumulated at-bats that are updated all the time.
Time ConsiderationsS.A.M.P.L.E.R. can run up to 5 double periods, depending on the age and level of your class. It could run over less lessons, but thenperhaps you will not have as many opportunities both to reach all students and to connect the activity to students' growing understanding ofmultiplicative structures. The more classroom discussion you have the better, but then you want more time in order to use the many featuresof this part-sims.
Curriculum StandardsAccording to the National Council of Teachers of Mathematics, 6-8- grade students should learn to:
· formulate questions, design studies, and collect data about a characteristic shared by two populations or different characteristicswithin one population
· select, create, and use appropriate graphical representations of data, including histograms, box plots, and scatterplots.· use observations about differences between two or more samples to make conjectures about the populations from which the
samples were taken· use conjectures to formulate new questions and plan new studies to answer them· use proportionality and a basic understanding of probability to make and test conjectures about the results of experiments and
simulations· work flexibly with fractions, decimals, and percents to solve problems· understand and use ratios and proportions to represent quantitative relationships· select appropriate methods and tools for computing with fractions and decimals from among mental computation, estimation,
calculators or computers, and paper and pencil, depending on the situation, and apply the selected methods· develop and use strategies to estimate the results of rational- number computations and judge the reasonableness of the results· develop, analyze, and explain methods for solving problems involving proportions, such as scaling and finding equivalent ratios.· create and use representations to organize, record and communicate mathematical ideas· model and solve contextualized problems using various representations, such as graphs, tables, and equations· build new mathematical knowledge through problem solving· solve problems that arise in mathematics and in other contexts· apply and adapt a variety of appropriate strategies to solve problems· monitor and reflect on the process of mathematical problem solving· organize and consolidate their mathematical thinking through communication· communicate their mathematical thinking coherently and clearly to peers, teachers, and others· analyze and evaluate the mathematical thinking and strategies of others· use the language of mathematics to express mathematical ideas precisely· recognize and use connections among mathematical ideas· understand how mathematical ideas interconnect and build on one another to produce a coherent whole· recognize and apply mathematics in contexts outside of mathematics· select, apply, and translate among mathematical representations to solve problems· use representations to model and interpret physical, social, and mathematical phenomena.· select, apply and translate among mathematical representations to solve problems· use representations to model and interpret physical, social and mathematical phenomena· use mathematical models to represent and understand quantitative relationships· make decisions about units and scales· analyze and evaluate the mathematical thinking and strategies of others· make and investigate mathematical conjectures· develop and evaluate mathematical arguments and proofs· use the language of mathematics to express mathematical ideas precisely· understand and apply basic concepts of probability· describe events as likely or unlikely· discuss the degree of likelihood using words such as certain, equally likely and impossible· understand that the measure of the likelihood of an event can be described by a number between zero and one· apply appropriate techniques, tools and formulas to determine measurements.
Curriculum Objectives· Revisit and consolidate understanding of and connections between various multiplicative concepts such as multiplication, division,

fractions, ratio, proportion, and percentage within a novel setting· Experience the meaning of histograms and in particular form episode-based understanding of central-tendency indices, such as
range, mean, and distribution variability· Encounter the mathematics of statistics-sampling and computations-as useful tools for inference under conditions of uncertainty
and limited resources
Support Resources in NetLogoAs with every other HubNet Activity, the S.A.M.P.L.E.R. model includes a set of QuickStart Instructions that detail how to setup and runthe activity. In addition, there is information regarding the how to use the model and the clients in the Information Tab.
Equipment, Materials Needed· NetLogo Software· Projection System· Personal computer· NetLogo model: SAMPLER.nlogo· Have a pointer ready (a stick or long ruler will do) so that students who are leading the class discussion can point to objects on the
classroom overhead screen without obstructing other students' view· For the introduction, provide graphing paper and pens (blue, green) for students to draw, calculate, and write out their guesses --
the squares in graphing paper resemble the square patches or tiles in the population· A blackboard or whiteboard will be useful for capturing students' ideas and for supporting them in calculating averages and in
understanding the histogram
Related Standalone ModelsNetLogo offers a range of models in the domain of probability. Some of them are in the ProbLab suite of models.
Keywords· Statistics· Probability· Sample· Mean· Distribution· Group dynamics
References1. The Participatory Simulations project is a collaboration between Northwestern University and the University of Texas at Austin.
PI: Uri WilenskyCo-PI: Walter Stroup
2. This activity was adapted from: Stor, M. & Briggs, W. (1998). Dice and disease in the classroom. The Mathematics Teacher, v. 91,no. 6. pp 464-468.