netherlands - ozone.unep.org
TRANSCRIPT

172
NETHERLANDS
Observations at KNMI in De Bilt, Netherlands, (52.10N, 5.18E)
Brewer MKIII Spectrophotometer: Total ozone, continuous observations since 1994. Data deposited at WO3UDC. Near-real-time data “WMO Ozone Mapping Centre” and WO3UDC UV scans, about once per hour since 1994. Data deposited at EDUCE database Aerosol optical depth (experimental product)
Research and applications Validation of ozonesonde and satellite observations Radiative transfer model studies UV exposure estimations by RIVM Calibration of UV-index forecasts Algorithm development for global UV index forecast
OzonesondesProfiles of ozone, temperature, humidity and wind, typically up to ~30 km. Approx. weekly balloon releases since 1992. Intensified releases during MATCH campaigns. Extra releases for ENVISAT / AURA validation. Data deposited at WO3UDC. Data deposited near-real-time at NILU database.
Research and applications: Stratosphere/troposphere exchange Validation of satellite observations (GOME and SCIAMACHY) Development of GOME/SCIAMACHY ozone profile retrieval. Near-real-time data “WMO Ozone Mapping Centre” and WO3UDC
Observations at the Suriname Meteorological Service (MDS) in Parmaribo, Suriname, (5.81N, 55.21W).
Brewer MKIII Spectrophotometer: Continuous total ozone and UV scans, plus Umkehr at dusk and dawn: since April 1999.Data deposited at NDSC, WO3UDC databases Near-real-time data “WMO Ozone Mapping Centre” and WO3UDC
Research and applications Validation of ozonesonde and satellite observations Radiative transfer model studies Calibration of UV-index forecasts Algorithm development for global UV index forecast
Ozonesondes:Profiles of ozone, temperature, humidity and wind, typically up to ~30 km. Weekly balloon releases since September 1999. Data deposited at SHADOZ (Southern Hemisphere Additional Ozone Sondes) and NDSC databases Data deposited near-real-time at NILU database.

173
Research and applications: Atmospheric transport, dynamics and chemistry in the Tropics Stratosphere/troposphere and inter hemispheric exchange Validation of satellite observations (GOME and SCIAMACHY) Development of GOME/SCIAMACHY total ozone and ozone profile retrieval. Algorithm development for global UV index forecast
Projects relating to satellite observations
The EU/ESA project “PROMOTE” (PROtocol MOnitoring for the GMES Service Element) http://www.gse-promote.org/
o Coordinator of the project o Service provider for Ozone o Service provider for Ultra-violet radiation o Service provider for Air quality o Service provider for Climate Change
The ESA project TEMIS (Tropospheric Emission Monitoring Internet Service) (http://www.temis.nl/)
o Coordinator of the project o Ozone: Tropospheric and Stratospheric o Nitrogen dioxide: Tropospheric and Stratospheric o Ultra-violet radiation: UV-index and dose o Ozone profile (under development) o Aerosol absorbing index (under development)
ENVISAT validation o Coordinator of the project o Validation of various ENVISAT products
Preparation of future satellite missions: o Preparation for operational missions: GOME-2 (Ozone SAF) and Sentinels 4/5
(GMES)o KNMI is leading the TRAQ (TRopospheric and Air Quality) proposal in response to
ESA Call for next Earth Explorer Missions of 15 March 2005. Collaboration between KNMI, CNRS/CNES/LMPAA, and SRON.
o Participate in designing future ESA atmospheric chemistry research missions: GeoTROPE, and PREMIER.
o CAMEO (Composition of the Atmosphere from Mid-Earth Orbit): A mission concept submitted in response to the 27 January 2005 request for information by the U.S. National Research Council Decadal Study on Earth Science and Applications from Space. Collaboration between NASA-JPL, KNMI, SRON and University of Edinburgh
o Potential contribution to ESA sentinels 4 and 5 for monitoring atmospheric chemistry (CAPACITY project)
Ozone Monitoring Instrument (OMI)
KNMI is the principal investigator institute of the Ozone Monitoring Instrument (OMI) and responsible for operating and the in-flight calibration of the instrument and together with NASA and FMI for delivering data products (algorithm development & data processing) and performing their validation.
OMI contributions: - Monitoring of the ozone layer: Continues the TOMS, SBUV and GOME ozone column and
profile data. In addition OMI will continue the GOME column measurements of BrO, OClO and NO2
- Air quality: Observe tropospheric pollution and its precursors due to biomass burning, industrial and traffic emissions such as NO2, aerosols, SO2, formaldehyde and ozone. The

174
small pixel size (13 km x 24 km at nadir) is the highest spatial resolution ever achieved from space for these trace gas measurements and increases sensitivity in the troposphere
- Climate change: Continues the TOMS, SBUV and GOME total ozone record. Provide a record of tropospheric ozone and UV absorbing aerosols
OMI measurements: - OMI data products are: Total column amounts of ozone, NO2, BrO, OClO, SO2,
formaldehyde, tropospheric column amounts of ozone and NO2; profile information for ozone; aerosol optical depth, aerosol single scattering albedo and in addition surface UV-B radiation, cloud top pressure and cloud coverage
- OMI was launched in July 2004 and will operate till 2009/2010 - First OMI total ozone data for the long term arctic ozone trend was delivered for the
IPCC/TEAP Special Report: Safeguarding the ozone layer and the global climate system: Issues related to the hydrofluorocarbons and perfluorocarbons, Summary for Policy Makers, WMO/UNEP, 2005
- The OMI total ozone column was publicly released in May 2005 - Most OMI products will be publicly released mid 2006 - Most OMI products are available with daily global coverage with a (nadir) footprint of 13
km x 24 km - The total ozone, NO2, and volcanic SO2 column and tropospheric NO2 column will be
delivered within 3 hours of observations with global coverage as of early 2006 for use in numerical weather forecast and air quality models as well as volcanic warnings applications for air craft traffic
Modelling
Chemistry-transport modelling: Tropospheric ozone budget. Effects of aviation AerosolsLightning and surface NOx Stratospheric ozone Methane
Dynamics:Stratosphere/troposphere coupling Age of stratospheric air Antarctic sudden stratospheric warming Stratosphere as predictor of the troposphere Tropical tropopause layer
Validation:Ozone soundings in De Bilt and Paramaribo Participation in ENVISAT validation
Assimilation of ground-based and satellite observations:
EU project GOA: data assimilation of GOME ozone and GOME NO2.TEMIS: Tropospheric Emission Monitoring Internet service, http://www.temis.nlEU-project ASSET: Assimilation of Envisat data, see http://darc.nerc.ac.uk/asset/
Contribution to Assessment reports:
IPCC Assessment – Fourth Assessment Report (4AR) WMO/UNEP Ozone Assessment Report 2002 European report on ozone- climate interactions (2003).
175
NEW ZEALAND
OBSERVATIONAL ACTIVITIES
In New Zealand, most ozone and UV related research is undertaken by the National Institute of Water and Atmospheric Research (NIWA), a Crown Research Institute (CRI), at research centres at Lauder and Wellington. The site at Lauder is the southern hemisphere mid-latitude charter site in the Network for Detection of Stratospheric Change (NDSC). Several other CRIs have programmes to monitor changes in biologically damaging UV radiation (e.g., Industrial Research, LandCare, AgResearch), some of which are conducted in collaboration with NIWA. The Physics and Astronomy Department at the University of Canterbury also contributes to ozone related research while the Department of Preventive and Social Medicine at the University of Otago researches epidemiological aspects of excess UV radiation exposure. This research is funded primarily through the Foundation for Research Science and Technology (FRST), but with considerable funding coming from international contracts and also from commercial activities such as providing research products and instrument development.
Column measurements of ozone and other gases/variables relevant to ozone loss
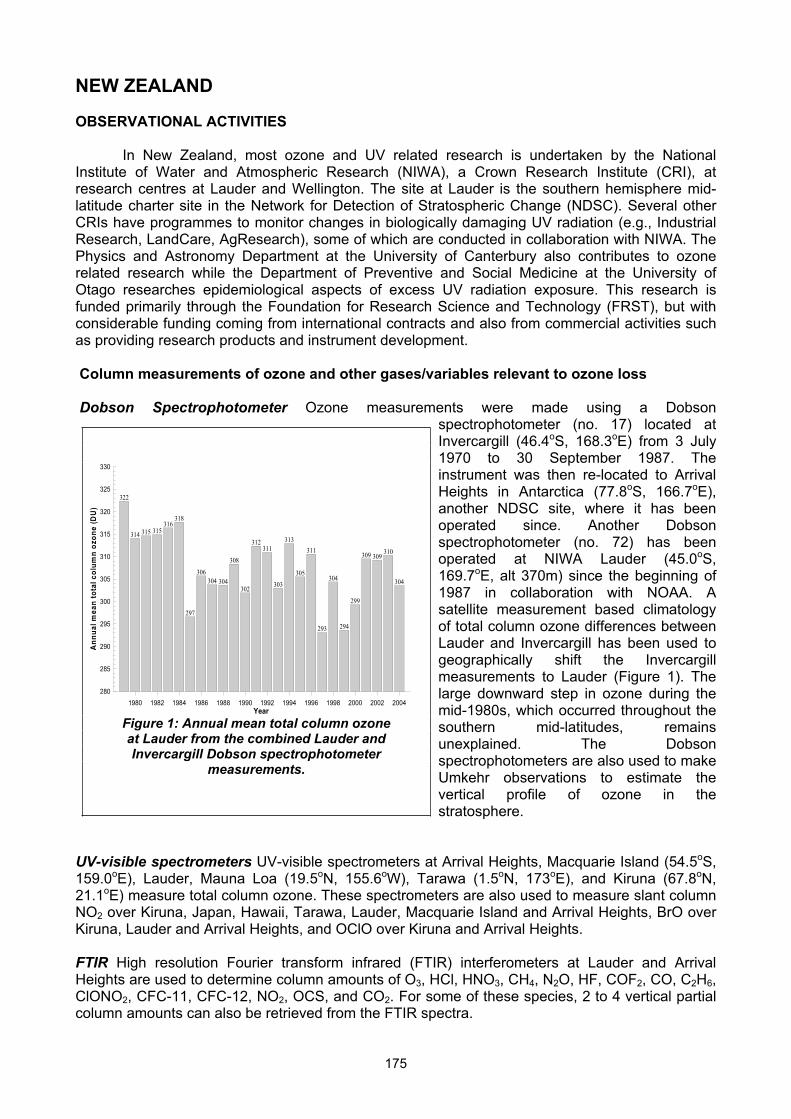
Dobson Spectrophotometer Ozone measurements were made using a Dobson spectrophotometer (no. 17) located at Invercargill (46.4oS, 168.3oE) from 3 July 1970 to 30 September 1987. The instrument was then re-located to Arrival Heights in Antarctica (77.8oS, 166.7oE),another NDSC site, where it has been operated since. Another Dobson spectrophotometer (no. 72) has been operated at NIWA Lauder (45.0oS,169.7oE, alt 370m) since the beginning of 1987 in collaboration with NOAA. A satellite measurement based climatology of total column ozone differences between Lauder and Invercargill has been used to geographically shift the Invercargill measurements to Lauder (Figure 1). The large downward step in ozone during the mid-1980s, which occurred throughout the southern mid-latitudes, remains unexplained. The Dobson spectrophotometers are also used to make Umkehr observations to estimate the vertical profile of ozone in the stratosphere.
UV-visible spectrometers UV-visible spectrometers at Arrival Heights, Macquarie Island (54.5oS,159.0oE), Lauder, Mauna Loa (19.5oN, 155.6oW), Tarawa (1.5oN, 173oE), and Kiruna (67.8oN, 21.1oE) measure total column ozone. These spectrometers are also used to measure slant column NO2 over Kiruna, Japan, Hawaii, Tarawa, Lauder, Macquarie Island and Arrival Heights, BrO over Kiruna, Lauder and Arrival Heights, and OClO over Kiruna and Arrival Heights.
FTIR High resolution Fourier transform infrared (FTIR) interferometers at Lauder and Arrival Heights are used to determine column amounts of O3, HCl, HNO3, CH4, N2O, HF, COF2, CO, C2H6,ClONO2, CFC-11, CFC-12, NO2, OCS, and CO2. For some of these species, 2 to 4 vertical partial column amounts can also be retrieved from the FTIR spectra.
1980 1982 1984 1986 1988 1990 1992 1994 1996 1998 2000 2002 2004Year
280
285
290
295
300
305
310
315
320
325
330
An
nu
al
me
an
to
tal
co
lum
n o
zo
ne
(D
U)
322
314 315 315316
318
297
306
304 304
308
302
312311
303
313
305
311
293
304
294
299
309 309310
304
Figure 1: Annual mean total column ozone at Lauder from the combined Lauder and Invercargill Dobson spectrophotometer
measurements.

176
Profile measurements of ozone and other gases/variables relevant to ozone loss
Ozonesondes Vertical ozone profiles over Lauder have been measured weekly since August 1986 using ECC ozonesondes. Until 1996 flights were made twice weekly during the last four months of the year, a time when remnants of the Antarctic ozone hole may be advected over New Zealand. The flights are made to an average altitude of 33 km. A summary of the data from these flights is presented in Figure 2.
Microwave radiometer A microwave radiometer has been used to make daily measurements of ozone profiles at Lauder since November 1992 over the altitude range 20-70 km. A second instrument is used to make water vapour profile measurements in the upper stratosphere and lower mesosphere. A microwave radiometer is also operated at Arrival Heights for monitoring the ClO vertical profile.
Ozone lidar In collaboration with RIVM, The Netherlands, vertical ozone profiles measurements have been made using a UV DIAL system since November 1994 over the altitude range 8-50 km.
Frost point hygrometer flights In a new collaborative effort with NOAA/CMDL, frost point hygrometer flights have been made from Lauder every second week since August 2004 to measure stratospheric water vapour. The programme is co-funded by the NOAA GCOS office.
Surface ozone measurements
Surface ozone measurements have been continuously monitored at Lauder since December 2003. Measurements are made with a TEI in-situ spectrophotometer. Similar measurements have been made at Arrival Heights since December 1996. These measurements were made with a Dasibi in-situ spectrophotometer until it was replaced with a TEI monitor in December 2003.
UV measurements
Spectroradiometers Since late 1990, surface spectral UV irradiance has been measured routinely at Lauder. Scans are made at 5 degree steps in solar zenith angle, and at 15 minute intervals over the midday period. The spectral resolution is 0.6-0.8 nm, and data cover the range 285 to 450 nm in 0.2 nm steps. Similar spectral measurements have been undertaken in collaboration with NOAA/CMDL at two sites in the USA (Mauna Loa Observatory, Hawaii, and Boulder, Colorado); with the Australian Bureau of Meteorology at three sites in Australia (Melbourne, Alice Springs and Darwin); and with the University of Tokyo at one site in Japan using weatherproof, temperature-controlled spectrometers. In addition to the measurements of spectral irradiance, measurements of actinic fluxes, more relevant for atmospheric chemistry, are now available from Lauder and Tokyo.
Broadband measurements The spectral measurements are complemented by a wide range of broadband measurements and by all-sky images taken at 1 minute intervals to quantify the effect of cloud distribution and type on UV radiation. Broadband instruments which measure integrated
1986 1988 1990 1992 1994 1996 1998 2000 2002 2004
Year
-15
-10
-5
0
5
10-15
-10
-5
0
5
10-15
-10
-5
0
5
10
Ozo
ne
(D
U)
-15
-10
-5
0
5
10
158 - 100 hPa
100 - 63 hPa
63 - 40 hPa
40 - 25 hPa
Figure 2: Deseasonalized monthly mean ozone partial columns from the ozonesonde ozone
profiles measure at Lauder, New Zealand.

177
UV with a response close to the erythemal action spectrum, are operated by NIWA at several sites in New Zealand (Invercargill, Lauder, Leigh, Paraparaumu, Christchurch) and in the Pacific (Cook Islands – Rarotonga and, Fiji). Because of mismatch between instrument sensitivity and erythemal response, corrections which depend on solar elevation and ozone are applied to these broadband instruments.
Dosimeter badges for measuring personal exposures of UV have been developed in collaboration with the University of Canterbury. Similar sensors have been used in UV displays which have been deployed in public places and outdoor sporting events.
Narrowband filter instruments Since late 2002, the US Department of Agriculture have been undertaking complementary measurements of UV radiation at Lauder using multi-filter rotating shadow band radiometers. This pro-vides a direct linkage between the UV climatologies of New Zealand and the USA.
Calibration activities
The Lauder Dobson spectrophotometer was last calibrated in a Dobson intercomparison at Lauder in November and December 2001, which included the world standard instrument no. 83. The next intercomparison will occur in January 2006 in Melbourne. The Arrival Heights Dobson spectrophotometer was intercompared against the world standard in Melbourne in early 2004.
An intercomparison of vertical ozone and temperature profile measurements, the TOPAL (Temperature and Ozone Profiler Assessment at Lauder) campaign, was conducted from 8-20 April 2002 and included measurements from ozonesondes, the RIVM ozone lidar, a NASA/GSFC ozone lidar and the microwave radiometer.
The NIWA UV spectrometers represent the state-of-the-art, and have participated with distinction at an international intercomparison campaign in the USA, and have been used to certify instruments for acceptance by the Network for Detection of Stratospheric Change. During a measurement campaign at Lauder, the NIWA spectrometers were cross calibrated against a European reference instrument that measured spectral radiances as well as irradiances.
RESULTS FROM OBSERVATIONS AND ANALYSIS
The NIWA assimilated total column ozone data base
The NIWA assimilated total column ozone data base combines satellite-based measurements of total column ozone from 4 Total Ozone Mapping Spectrometer (TOMS) instruments, 4 Solar Backscatter Ultra-Violet (SBUV) instruments, and three different retrievals from the Global Ozone Monitoring Experiment (GOME), and compares these against ground-based measurements made by the global network of Dobson spectrometers to create a homogeneous data base that combines the advantages of global satellite measurements with the advantages of the stability of ground-based measurements. This data base was used extensively in the WMO/UNEP ozone assessment in 2002 and is planned for use in the next ozone assessment in 2006. The use of this data base to track the long-term evolution of the Antarctic ozone hole is shown in Figure 3.
Analysis of UV measurements
Data from NIWA UV spectrometers have been used to identify problems with satellite-derived UV and have led to improvements in retrieval algorithms. Studies have quantified the effects of clouds on UV at Lauder and at sites in Antarctica. A detailed intercomparison between calculated and measured UV for clear skies at several sites has identified deficiencies in the aerosol parameters which are used as inputs to the model. The same analysis quantified errors due to a recently-discovered temperature-dependence in PTFE, which is the material used in the diffusers of the spectrometers. Instruments and retrieval algorithms have now been improved to

178
properly take these into account. Studies have identified the importance of the altitude distribution of ozone and temperature in modulating UV radiation received at the surface. We have also shown that while UV intensities are relatively high in the New Zealand summer, they are relatively low in the New Zealand winter, and this has serious implications for human health (contributing to skin damage in summer, and vitamin-d deficiency in winter). A study has quantified the increased UV exposure experienced during skiing.
Trend analysis Regression analysis models have been
developed to quantify trends in ozone and the trace gases affecting ozone.
Detection of the peak in stratospheric chlorine loading
Measurements of HCl and ClONO2 at Lauder can be used to monitor stratospheric chlorine loading, which appears to have reached a peak in the mid-1990s but not to have significantly decreased since then.
THEORY, MODELLING, AND OTHER RESEARCH
The Dilution Effect
The effect on mid-latitude ozone of the mixing of ozone depleted air from within the Antarctic vortex over southern mid-latitudes following the breakup of the vortex has been quantified for 1998, 1999, and 2000 by calculating the trajectories of ensembles of ozone-depleted air parcels. The results suggest that dilution of the ozone hole is the major source of summertime southern mid-latitude ozone loss, amounting to as much as 4-5% of the total ozone even after allowing for photochemical recovery. This is the first time the large-scale dilution has been quantified. This work was done in collaboration with the University of Canterbury.
Chemistry-climate modelling
Since 2001 NIWA has been operating a coupled chemistry-climate model (CCM) to investigate the feedbacks of stratospheric change on climate change, and the effects of climate change on the ozone layer. This work has been undertaken in close collaboration with the UK Met Office and with the NOAA Geophysical Fluid Dynamics Laboratory. The Unified Model with Eulerian Transport And Chemistry (UMETRAC) is run on NIWA’s cray T3E supercomputer. This modelling programme will contribute to the SPARC (Stratospheric Processes And their Role in Climate) initiated activity to conduct an internationally coordinated validation of CCMs.
Use of satellite data
Data from satellite programmes of the USA, European and Japanese space agencies have been used in ozone and UV related research in New Zealand. In turn we have contributed to a number of satellite measurement validation activities. Total column ozone measurements from a variety of instruments have been used to generate an assimilated total column ozone data base (see Section 2.1). Ozone profile measurements from the SAGE II, POAM II and POAM III instruments have been used to diagnose ozone loss rates over Antarctica.
1978 1980 1982 1984 1986 1988 1990 1992 1994 1996 1998 2000 2002 2004Year
0
2
4
6
8
10
12
14
16
18
20
Vo
rtex p
eri
od
(19 J
uly
- 1
Decem
ber)
avera
ge
daily o
zo
ne d
efi
cit
over
An
tarc
tica (
millio
n t
on
s)
2.0
2.5
3.0
3.5
Eff
ecti
ve E
qu
ivale
nt
Str
ato
sp
heri
c C
hlo
rin
e (
pp
b)
Figure 3: Daily ozone mass deficit (the mass of ozone required to restore ozone levels to 220 DU over Antarctica) averaged over the Antarctic vortex period (thin line with symbols plotted against left axis) together with effective equivalent stratospheric chlorine (thick line plotted against right axis).

179
UV effect studies
Scientists from NIWA and the University of Otago have been working in close collaboration to understand the factors affecting excess UV exposure in New Zealand schoolchildren. Over the summer of 2004/2005 UV exposure of 491 school children at 28 schools over 14 one-week periods were measured and combined with data from activity diaries maintained by the children and data from questionnaires to create a data base that can be used to answer many questions related to UV exposure of school children. For each participating child, the UV exposure over a one week period was logged using electronic UV monitors specifically developed for this project. The monitors were programmed to log UV exposure at 8-second intervals throughout the day. The resultant data base is now been analyzed to quantify the most important factors affecting UV exposure in schoolchildren. This work was co-funded by NIWA and the Cancer Society of New Zealand.
DISSEMINATION OF RESULTS
Data reporting
Measurements from the following sites are regularly submitted to the NDSC data base: From Lauder: ozonesonde and lidar ozone profiles, Dobson spectrophotometer O3, NO2 columns, UV weighted irradiances (Erythema, UVA, UVB), vertical columns of HCl and HNO3; from Arrival Heights: vertical columns of HCl and HNO3, Dobson spectrophotometer O3, NO2 columns; from Kiruna: NO2 columns; from Moshiri (Japan): NO2 columns; from Boulder (USA): UV weighted irradiances (Erythema, UVA, UVB); from Mauna Loa Observatory (Hawaii): NO2 columns, UV weighted irradiances (Erythema, UVA, UVB); from Macquarie Island (Australia): NO2 columns.
Measurements from the following sites are regularly submitted the WOUDC data base: From Lauder: Ozonesonde ozone profiles; from Arrival Heights: Dobson spectrophotometer O3.
Aerosol Measurements from Lauder are regularly submitted to the BSRN data base.
Information to the public
Data from NIWA's broadband instruments and radiative transfer calculations are used to provide the public with information on UV radiation levels via the Internet. Data are also provided to the public via the Cancer Society of New Zealand’s web pages, and via contracts with New Zealand Met Service.
FUTURE PLANS
The International Polar Year (IPY)
New Zealand researchers are included on a number of IPY proposals, including proposals on air-ice chemical interactions (AICE) and ultraviolet radiation in polar environments. The eventual extent of New Zealand participation in these programmes will depend on how much IPY targeted funding will be made available through New Zealand funding agencies.
NEEDS AND RECOMMENDATIONS
The following needs and recommendations require attention:
The contribution of very short-lived compounds to stratospheric species abundances, and in particular BrO, needs to be better quantified. The inability of state-of-the-art atmospheric chemistry models to reproduce the inter-hemispheric differences in the response of ozone to the Mt. Pinatubo volcanic eruption suggests that our knowledge of the aerosol chemistry driving ozone changes is incomplete.

180
We need better quantification of how management of banks of ozone depleting substances may affect the recovery of the global ozone layer. In depth assessment of when and where the ozone layer is likely to recover is required. Is any observation of the onset of recovery observed to date consistent with our best understanding of atmospheric chemistry and dynamics? The importance of attribution in the analysis of ozone recovery must be stressed. The effects of stratospheric change on surface climate change, and the mechanisms involved, need to be better quantified. In particular forcing of the southern annular mode through Antarctic ozone depletion, and its effect on southern middle and high latitude surface climate, needs to be better understood. A better understanding of the drivers of southern hemisphere mid-latitude ozone changes is required. Current models are unable to reproduce changes in southern mid-latitude ozone observed over the past 25 years. We need to confirm that ground- and satellite-based measurements of bromine and chlorine containing compounds are in agreement and that the stratospheric loading of these trace gases is consistent with our understanding of their surface source emissions. Working with health sciences to improve our understanding of both the positive and negative effects of UV exposure.
RELEVANT SCIENTIFIC PAPERS
A list of selected key scientific papers from New Zealand ozone and UV research over the past 3 years, is provided below:
Ajtic, J., B.J. Connor, B.N. Lawrence, G.E. Bodeker, K.W. Hoppel, J.E. Rosenfield, and D.N. Heuff, Dilution of the Antarctic ozone hole into southern midlatitudes, 1998–2000, Journal of Geophysical Research, 109, D17107, doi:10.1029/2003JD004500, 2004.
Allen, M., R. McKenzie, Enhanced UV exposure on a ski-field compared with exposures at sea level. Photochemical & Photobiological Sciences, 4(5): 429-437, 2005.
Bodeker, G.E., H. Struthers, and B.J. Connor, Dynamical containment of Antarctic ozone depletion, Geophysical Research Letters, 29 (7), 10.1029/2001GL014206, 2002.
Brinksma, E.J., J. Ajtic, J.B. Bergwerff, G.E. Bodeker, I.S. Boyd, J.F. de Haan, W. Hogervorst, J.W. Hovenier, and D.P.J. Swart, Five years of observations of ozone profiles over Lauder, New Zealand, Journal of Geophysical Research, 107 (D14), 10.1029/2001JD000737, 2002.
Huck, P.E., A.J. McDonald, G.E. Bodeker, and H. Struthers, Interannual variability in Antarctic ozone depletion controlled by planetary waves and polar temperature, Geophysical Research Letters, 32, L13819, doi:10.1029/2005GL022943, 2005.
Liley, J.B., D. Baumgardner, Y. Kondo, K. Kita, D.R. Blake, M. Koike, T. Machida, N. Takegawa, S. Kawakami, T. Shirai, and T. Ogawa, Black carbon in aerosol during BIBLE B, Journal of Geophysical Research, 108 (D3), 8399, doi:10.1029/2001JD000845, 2003.
McKenzie, R.L., P.V. Johnston, A. Hofzumahaus, A. Kraus, S. Madronich, C. Cantrell, J. Calvert, and R. Shetter, Relationship between photolysis frequencies derived from spectroscopic measurements of actinic fluxes and irradiances during the IPMMI campaign, Journal of Geophysical Research, 107 (D5), 10.1029/2001JD000601, 2002.
McKenzie, R.L., D. Smale, G.E. Bodeker, and H. Claude, Ozone profile differences between Europe and New Zealand: Effects on surface UV irradiance and its estimation from satellite sensors, Journal of Geophysical Research, 108 (D6), 4179, doi:10.1029/2002JD002770, 2003.
McKenzie, R.L., D. Smale, and M. Kotkamp, Relationship between UVB and erythemally weighted radiation, Photochemical & Photobiological Sciences, 3, 252-256, 2003.
McKenzie, R.L., J. Badosa, M. Kotkamp, and P.V. Johnston, Effects of the temperature dependence in PTFE diffusers on observed UV irradiances, Geophysical Research Letters, 32, L06808, doi:10.1029/2004GL022268, 2005.
Nichol, S.E., G. Pfister, G.E. Bodeker, R.L. McKenzie, S.W. Wood, and G. Bernhard, Moderation of cloud reduction of UV in the Antarctic due to high surface albedo, Journal of Applied Meteorology, 42, 1174-1183, 2003.

181
Pfister, G., R.L. McKenzie, J.B. Liley, A. Thomas, B.W. Forgan, and C.N. Long, Cloud Coverage Based on All-Sky Imaging and Its Impact on Surface Solar Irradiance, Journal of the Atmospheric Sciences, 42, 1421-1434, 2003.
Schofield, R., K. Kreher, B.J. Connor, P.V. Johnston, A. Thomas, D. Shooter, M.P. Chipperfield, C.D. Rodgers, and G.H. Mount, Retrieved tropospheric and stratospheric BrO columns over Lauder, New Zealand, Journal of Geophysical Research, 109, D14304, doi:10.1029/2003JD004463, 2004.
Struthers, H., K. Kreher, J. Austin, R. Schofield, G.E. Bodeker, P.V. Johnston, H. Shiona, and A. Thomas, Past and future simulations of NO2 from a coupled chemistry-climate model in comparison with observations, Atmospheric Chemistry and Physics, 4, 2227–2239, 2004.
Wood, S.W., G.E. Bodeker, I.S. Boyd, N.B. Jones, B.J. Connor, P.V. Johnston, W.A. Matthews, S.E. Nichol, F.J. Murcray, H. Nakajima, and Y. Sasano, Validation of version 5.20 ILAS HNO3,CH4 ,N2O, O3, and NO2 using ground-based measurements at Arrival Heights and Kiruna, Journal of Geophysical Research, 107 (D24), 8208, doi:10.1029/2001JD000581, 2002.
Wood, S.W., R.L. Batchelor, A. Goldman, C.P. Rinsland, B.J. Connor, F.J. Murcray, T.M. Stephen, and D.N. Heuff, Ground-based nitric acid measurements at Arrival Heights, Antarctica, using solar and lunar Fourier transform infrared observations, Journal of Geophysical Research, 109, D18307, doi:10.1029/2004JD004665, 2004.
****

182
NIGERIA
INTRODUCTION
Environmental problems emanating from ozone depletion and other sources have always been of great concern to the government and people of Nigeria. As the regional and global atmospheric pollution problems continue to assume a wider dimension, putting a high population at risk and seriously threatening the ecosystems, various programmes have been embarked upon in Nigeria to address these problems. Succeeding governments have implemented existing policies on environmental issues and formulated new ones in line with global programmes designed for the achievement of a friendly and sustainable environment. This commitment to environmental issues by the government led to the signing and ratification of the Montreal Protocol on substances that deplete the ozone layer by Nigeria on the 31st of October, 1988.
Monitoring and research on ozone, UV radiation and related atmospheric constituents are carried out by different institutions in Nigeria. The aim is to support government policies on environment and thereby contribute positively to the implementation of the Vienna Convention for the protection of the ozone layer and its Montreal Protocol, as well as the United Nations Conference on Environment and Development in 1992 which emphasized the need for global understanding and proposed corrective actions in several areas of global environmental change, among them the effects from changes in the ozone layer. The increasing involvement of these institutions has greatly enhanced the development of the national programme on ozone monitoring and research in Nigeria.
MONITORING OF GAW PARAMETERS:
The monitoring of total column ozone and other atmospheric constituents under the auspices of Global Atmosphere Watch (GAW) programme of WMO started in Nigeria in 1993 with the establishment of a GAW station each in Lagos (Latitude06o36’N; Longitude 03o26’E; Elevation 10m) and Oshogbo (Lat.07o 47’N; Long.04o 29’E; Elevation 304.5m) by the Nigerian Meteorological Agency (NIMET) which was then known as Department of Meteorological Services in the Ministry of Aviation.
Total Column Ozone
The GAW station in Lagos measures total column ozone and it is the only such station in Nigeria. Subject to the state of the atmosphere, daily routine measurements up to a maximum of ten observations are made with the Dobson spectrophotometer #5703 (Shimatzu type). Total ozone measurements are archived in the database of NIMET in Lagos.
Other GAW and Related Parameters
When the Oshogbo GAW station was established in 1993, a number of parameters were being measured as shown in table 1. However, due to factors which include non-regular calibration of the instruments, non availability of spare parts and essential consumables, some of these parameters are not being measured currently. Efforts are being made to resuscitate the station for effective operation under the expansion of GAW programme by NIMET.

183
It is expected that in the near future the range of UV index measurements across the country would be evaluated and that could form a basis for developing a programme on early warning system for the general public on UV-B exposures in Nigeria.
Air Quality/Air Pollution Monitoring:
A number of institutions are engaged in the monitoring and research needed to improve the understanding of ozone issue and other trace gases in Nigeria. For instance, the Obafemi Awolowo University (OAU) set up an automatic air quality monitoring station in Lagos in 1991. The station measures trace gases mixing values including surface ozone at 10 metres height. Also, the Atmospheric Research and Information Analysis Laboratory (ARIAL) of the Centre for Energy and Development of the same university has recently engaged in the assessment of available satellite data for stratospheric and tropospheric ozone over Nigeria. This is intended to be used to provide the trends and spatial resolutions forecast of these parameters over Nigeria. NIMET collaborates with OAU and some other institutions on issues relating to the protection of the ozone layer, impact of UV-B on human health and the environment in general.
Calibration/Intercomparison
Our Dobson spectrophotometer is calibrated (mercury lamp and standard lamp tests) every month and the calibration data are documented. The instrument has also successfully participated in two international intercomparions organized by WMO for all the Dobson instruments operated in Africa. These took place in Pretoria, South Africa in 2000 and Dahab in Egypt in 2004.
Table 1: Parameters measured at GAW station, Oshogbo.
Parameter Instrument Surface Ozone UV-Photometric Ozone Analyzer Aerosols Improved module aerosol sampler UV_BRadiation
Kipp & Zonen Pyranometer
Total Radiation LI-COR Silicon Pyranometer DiffuseRadiation
Kipp & Zonen Pyranometer
Incident Radiation
Kipp & Zonen Pyranometer
Net Radiation PH Schenk Net Radiation Sensor Atm. Turbidity Mainz 11 Noll Sun Photometer Precipitation Sample
Aerochem Metric ppt. collector
UV Measurements:
Apart from the GAW stationsin Lagos and Oshogbo,NIMET has commencedmeasurements of surface UV-B and Solar radiation atseveral locations in Nigeria.The automatic weatherstations that measure theseparameters and somemeteorological variables wereset up as part of theimplementation of theAgency’s programme onstudies relating to the effectsof UV-B on human health andthe ecosystems. The UV ismeasured with siliconphotodiode sensor.

184
TRENDS IN TOTAL OZONE AND SURFACE OZONE Figure 1: shows trend in total ozone in Lagos from 1993 – 2004, while Figures 2-5 show surface ozone on selected days at Oshogbo.
Fig. 4: Surface Ozone at Oshogbo on Nov 5/6
1999
01020304050607080
60
0
81
5
1030
1245
1500
1715
1930
2145
10
0
31
5
53
0
Time (GMT)
Su
rf.
Ozo
ne (
pp
b)
Fig. 1: Total Ozone in Lagos (1993 - 2004)
235
240
245
250
255
260
265
19
93
19
94
19
95
19
96
19
97
19
98
19
99
20
00
20
01
20
02
20
03
20
04
Year
To
tal
Oz
on
e (
DU
)
Fig. 2: Surface Ozone at Oshogbo on Dec 23/24
1993
0
20
40
60
80
100
60
0
81
5
10
30
12
45
15
00
17
15
19
30
21
45
10
0
31
5
53
0
Time (GMT)
Su
rf.
Ozo
ne
(p
pb
)
Fig.5: Surface Ozone at Oshogbo on
Oct.10/11,2000
0
10
20
30
40
50
60
70
80
60
0
80
0
10
00
12
00
14
00
16
00
18
00
20
00
22
00
10
0
30
0
50
0
Time: GMT
Su
rf. O
zon
e (
pp
b)
Fig 3: Surface Ozone at Oshogbo on Feb.
15/16, 1994
01020304050607080
60
0
81
5
10
30
12
45
15
00
17
15
19
30
21
45
10
0
31
5
53
0
Time (GMT)
Su
rf.
Ozo
ne
(p
pb
)
ONGOING STUDIES AND RESEARCH INTERESTS
Total column ozone and UV-B radiationobservations by NIMET are not yet sufficientfor comprehensive studies. However, anumber of studies are being carried out usingavailable data. These include:
Diurnal variation of total ozone inLagosRelationship between total ozone and some meteorological variables inLagosSeasonal variation of total ozone overequatorial belt Influence of stratospheric ozone onlocal weather UV-B trends in Nigeria UV-B daily forecast in Nigeria Effects of UV-B on human health andecosystems.
Recent Papers
Various investigations are at different stages.However, some presentations have beenmade at conferences, symposia, seminars andworkshops in recent times. They include:

185
Measurement and variation of total ozone in Lagos, Proc.,12th and 13th Departmental Symposia, 1997, pp.40-49 Scientific assessment of total column ozone over Lagos, Nigeria, Proc., Int’l Conf. on Sustain Africa, 1995, Vol 4, pp26-29Meteorology and Air Pollution Monitoring in Nigeria, Presentation, Conf. on Air Quality Monitoring and Management, 2002.
DISSEMINATION OF RESULTS
Submission of data to WOUDC
Total ozone data measured in Lagos are transmitted monthly to the World Ozone and Ultra-Violet Data Centre (WOUDC) in Toronto, Canada. As at the time of preparation of this report, the latest total ozone data from Nigeria in WOUDC are for the month of June, 2005.
Public Awareness Campaign on Ozone Issue:
In Nigeria, priority attention is given to public awareness campaign on the consequences of a depleted ozone layer. Various activities are regularly organized by NIMET to sensitize the general public on the need to protect the ozone layer. Since 1997, NIMET has been observing the International Day for the Preservation of the Ozone Layer on the 16th of September each year. Activities during such occasions in the past included press release by the Director-General/Chief Executive Officer of NIMET on the state of ozone in Nigeria and the Global Update of the Ozone Layer, public lectures on ozone in relation to the health, socio-economic and industrial sectors, poster sessions on ozone issue, quiz competitions among secondary school students on ozone and the environment, etc. Policy makers, industrialists, scientists, students, the press and the grassroots are usually involved in activities. Indeed the awareness programme is yielding the desired results in Nigeria. The series of lectures on ozone day in the past will be published and made available to the public during this year’s ozone day observation. Titles of past public lectures on ozone day are stated below:
Can man rebuild the ozone layer he destroyed in order to save the earth?, 1999 Osaghaede, S.E.Public awareness on ozone issue for the benefit of man, 2000, Osaghaede, S.E. and Muyiolu, S.K. The ozone issue and socio-economic life: the past, present and future, 2001, Nnodu, I.D. Is ozone monitoring and research beneficial to man?, 2003, Obioh, I.B. Extending lives of humans, animals and plants through ozone monitoring, 2004, Abu, A.
IMPLEMENTATION OF THE MONTREAL PROTOCOL
It is pertinent to state here that since Nigeria signed and ratified the Montreal Protocol on substances that deplete the ozone layer, the government has taken a number of actions towards the protection of the ozone layer and the environment in general. Some of these actions include:
Control of environmentally harmful substances such as CFCs and Halons known to deplete the ozone layer In the refrigeration and air-conditioning sectors, old technologies are being replaced with state-of-the-art ozone-friendly alternatives as part of efforts to implement the phase-out of Ozone Depleting Substances (ODS). Banning of importation of used refrigerators and freezers.

186
FUTURE MONITORING AND RESEARCH PLANS:
There is a deliberate plan by the government of Nigeria to continue to encourage and carry out monitoring and research that will improve the understanding of ozone issue and thereby contribute positively to the regional and global efforts towards the protection of the ozone layer and sustainability of the environment. The Nigerian Meteorological Agency is spearheading this course and with adequate funding by local and international organizations, the agency will vigorously pursue the following programmes:
Continuation of Total Ozone and UV-B radiation measurements. Increase in network of GAW stations for the monitoring of total ozone, surface ozone, greenhouse gases, UV-B radiation, solar radiation, acid rain, etc. Measurement of ozone profile with Dobson spectrophotometer and other methods. Daily UV-B radiation forecast for Nigeria. Effects of increased UV-B on human and animal health, as well as the ecosystems. Continuation of awareness campaign on ozone and related issues. Increased collaboration with local and international organizations on ozone and related issues.
NEEDS AND RECOMMENDATIONS
In order to facilitate the ongoing and planned ozone, UV radiation monitoring and research programmes in Nigeria, assistance will be needed in the following areas:
Expansion of total column ozone measurements. This will involve among other things, acquisition of Brewer spectrophotometer and other modern instruments. Acquisition of instruments for ozone profile measurement. Expansion of our UV-B and solar radiation monitoring network. Regular calibration of instruments especially in the developing countries to ensure high quality data for research and other purposes. Training of personnel to enhance professional competence in monitoring, data processing and research especially in the developing countries. Provision of spare parts and essential consumables.
****

187
NORWAY
Ozone monitoring and related research in Norway involves several institutions and there is no distinct separation between research and development, monitoring and quality control. The following significant research and monitoring activities have been carried out in Norway since 2002.
OBSERVATIONAL ACTIVITIES
The Norwegian Pollution Control Authority established the programme “Monitoring of the atmospheric ozone layer” in 1990, which at that time only included measurements of total ozone. The Norwegian UV network was established in 1994/95 and consists of eight 5-channel GUV instruments located at sites between 58 N and 79 N. In addition the observational activities include ozone lidar and ozonesonde measurements. Table 1 gives an overview of the location of the various stations, the type of measurements, and the institutions responsible for the daily operation of the instruments at the different sites.
Table 1: Overview of the locations and institutes involved in ozone and UV monitoring activities in Norway
Ozone profiles Station UV
Total ozone Lidar Sondes
Institute
Landvik, Grimstad, 58oN x Norwegian Radiation Protection Authority Blindern, Oslo , 60oN x x University of Oslo/ Norwegian Institute for Air Research Østerås, Bærum, 60oN x Norwegian Radiation Protection Authority Bergen, 60oN x Norwegian Radiation Protection Authority Kise, Mjøsa, 60oN x Norwegian Radiation Protection Authority Trondheim, 63oN x Norwegian Radiation Protection Authority Ørlandet, 63oN x Norwegian Institute for Air Research Andøya, 69oN x x x Norwegian Institute for Air Research /Andøya Rocket Range/ FFI* Ny-Ålesund, 79oN x x Norwegian Institute for Air Research * Norwegian Defence Research Establishment
Column measurements of ozone and other gases relevant to ozone loss
Total ozone measurements using the Dobson spectrophotometer were performed on a regular basis in Oslo from 1978 to 1998 and in Tromsø from 1985 to 1999. Brewer measurements were started up in Tromsø in 1994, but after the termination of ozone-related observations at the Auroral Observatory in Tromsø in 1999 the instrument was moved to Andøya, 130 km southwest of Tromsø. Daily total ozone values for Oslo and Andøya are now based on measurements with Brewer spectrometers. The ozone values are based on direct-sun measurements, when available. However, on overcast days and days where the solar zenith angle is large the ozone values are based on the global irradiance method. As the Arctic Lidar Observatory for Middle Atmosphere Research (ALOMAR), which has replaced Tromsø as the North Norwegian ozone and UV monitoring site, is located north of the polar circle (69.3 N, 16.0 E, http://alomar.rocketrange.no/),there are no measurements of total ozone for about 100 days due to the polar night.
The Norwegian Institute for Air Research (NILU) is also operating instruments capable of monitoring ozone relevant traces gases at two sites. At ALOMAR two UV/VIS DOAS instruments (SYMOCS) are measuring total columns of ozone, NO2, BrO and OClO since the late 1990s. Additionally, there is a DOAS instrument (type SAOZ) at Ny-Ålesund, measuring total columns of ozone and NO2 since 1991. The NO2 and ozone measurements at ALOMAR fulfil the requirements of the Network for the Detection of Stratospheric Change (NDSC) and formal approval is expected in autumn 2005. The SAOZ measurements contribute to the NDSC.
Profile measurements of ozone and other parameters relevant to ozone loss
Norway operates one ozone lidar, which is located at the ALOMAR facility at Andøya. Together with the Norwegian Defence Research Establishment and the Andøya Rocket Range, NILU has operated the ozone lidar continuously since January 1995. Since 1997 the instrument

188
has been approved as a complementary site of the NDSC, and data are submitted to the NDSC database. The ozone lidar has also been used to measure polar stratospheric clouds and stratospheric temperature profiles. The lidar is run on a routine basis during clear sky situations providing ozone profiles in the height range 8 to 50 km. The latest measured raw data profiles and the latest analysed ozone data are available at http://alomar.rocketrange.no/alomar-lidar.html.
NILU has operated an ozonesonde station at Ørlandet (63.4oN, 9.2oE) since 1994 and is nominally launching between 1 and 4 sondes per month, depending on the time of the year. These measurements have traditionally been used for national monitoring purposes. In addition, NILU has participated in a number of experimental (match) campaigns where several stations launch sondes in a coordinated pattern to probe the same air masses several times. This is used to estimate ozone loss as a function of time and sun-lit hours. Finally, the ozone vertical profile soundings have extensively been used for validation of satellite instruments, especially on the ERS-2 and Envisat platforms.
UV measurements
Narrowband filter instruments
The instruments in the Norwegian UV network are designed to measure UV irradiances in 4 channels. Using a technique developed by Dahlback (1996)1, we are able to derive from the raw data total ozone abundance, cloud cover information, complete spectra from 290 to 400 nm, and biologically weighted UV doses for any action spectrum in the UV.
In November 2004, NILU installed a NILU-UV radiometer at the new Norwegian research station, Troll, in Antarctica. The instrument was brought back to Norway in March 2005 to participate in the intercomparison of multiband filter radiometers (MBFR) at NILU (the FARIN campaign described in section 5). The NILU-UV instrument will be reinstalled at the Troll station in November 2005 and will be calibrated every year against a travelling standard. The NILU-UV measurements at the Troll station will be traceable to the Norwegian UV network through yearly calibration of the reference instrument at the Norwegian Radiation Protection Authority.
Spectroradiometers
Spectral UV irradiances (both direct and global scans) are measured daily with Brewer instruments at Department of Physics, University of Oslo and at ALOMAR.
There have also been campaigns with global spectral measurements in the wavelength range from 290-450 and collection of data from periods in 2001, 2002, and 2003. In 2005 there were campaigns with direct and diffuse spectral measurements
Calibration activities
The Brewer instruments
The Brewer instrument at the University of Oslo has been in operation since summer 1990, while Brewer operations in North Norway started in 1994. The International Ozone Services, Canada, calibrates the Brewer instruments in Oslo and Andøya on a yearly basis, and the instrument are regularly calibrated against standard lamps in order to check their stability. The calibrations show that the Brewer instruments have been stable during the 11 years of observations. The total ozone measurements from the Oslo Brewer instrument agree well with the Dobson measurements.
1 Dahlback, A. (1996) Appl. Opt., Vol. 35., No.33, 6514-6521.

189
The GUV instruments
The Norwegian FARIN project, described in section 5, included a major international UV instrument intercomparison. All in all 51 UV radiometers from various nations participated, among them 39 multiband filter radiometers (MBFR’s). The instruments were also characterized on site. Beside measurements of spectral responses, measurements against QTH lamps and of the cosine responses were done for a selection of instruments. The data are available on the ftp server zardoz.nilu.no at NILU. The directories are /nadir/projects/other/farin/rawdata and /nadir/projects/other/farin/processed.
RESULTS FROM OBSERVATIONS AND ANALYSIS
Ozone observations in Oslo
In order to look at possible ozone reductions and trends for the period 1979 to 2004 in Oslo we have employed the total ozone values from 1979 to 1998 from the Dobson instrument, whereas for the period 1999 to 2004 the Brewer measurements have been used. The results of the trend analysis are summarized in Table 1. For spring months a significant negative trend of –0.35% per year is observed. For the winter, summer and fall months no
significant trends are detected. When all months are included a significant negative trend of –0.17% per year is observed. The analysis of the data shows that the low ozone values in the 1990’s contribute strongly to the observed negative trends in total ozone. For 2004 the yearly mean ozone value was 0.4% higher than the long-term yearly mean.
Ozone observations at Andøya
As mentioned, ozone measurements in North-Norway were performed in Tromsø until 1999 and at ALOMAR/Andøya from 2000. Correlation studies have shown that the ozone climatology is very similar at the two locations so that the two datasets are considered as equivalent representing one site. For the time period 1979 – 1994 total
ozone values from the satellite instrument TOMS (Total ozone Mapping Spectrometer) were used because of insufficient calibration of the Tromsø Dobson instrument before 1991 and low data coverage (after 1990, there is a good agreement between TOMS and Tromsø Dobson and Brewer measurements). The result of the trend analysis is summarized in Table 2. No significant trends were observed for Andøya for this time period. The missing trend in spring is mainly caused by several warm winters since 1998 with very high total ozone, compensating the significant negative trend before 1998.
In recent years, the historical total ozone series from Tromsø (Fery spectrograph: 1935-1939, Dobson #14: 1939-1972, 1985-1999) and Svalbard (1950-1962) have been re-analyzed, homogenized, and evaluated by multi-linear regression methods (Hansen and Svenøe, 20052).The analysis, based on a combination with TOMS data, revealed a strong influence of the local stratospheric temperature at the 30 mbar level and a composite influence of climate tele-
2 Hansen, G., and T. Svenøe, (2005) J. Geophys. Res., 110, no. D10, D10103,doi: 10.1029/2004JD005387
Table 1: Percentage changes in total ozone per year for Oslo for the period 1.1.1979 to 31.12.2004. The
numbers in parenthesis gives the uncertainty (1
Time period Trend (% per year)
Winter: December – February -0.11 (0.11) Spring: March – May -0.35 (0.11) Summer: June - August -0.02 (0.06) Fall: September - November -0.10 (0.06) Annual -0.17 (0.05)
Table 2: Percentage changes in total ozone per year for Andøya/Tromsø for the period 1979 to 2004. The
numbers in parenthesis gives the uncertainty (1 ).
Time period Trend (% per year)
Spring: March – May -0.13 (0.12) Summer: June - August -0.00 (0.05) Annual (March-September) -0.08 (0.06)

190
connection patterns. Variations in the recent decades are best explained if the linear trend since 1978 is modified, such that in years with a weak polar stratospheric vortex the trend is set to zero.
A preliminary analysis of the Svalbard data reveals similarities with the Tromsø results but also some surprising differences, like the importance of the QBO and the solar cycle in summer.
Measurements with the ALOMAR ozone lidar were used, in combination with leading chemical transport models, to quantify Arctic ozone loss during several winters in the late 1990s (Hansen et al., 1997 3; Hansen and Chipperfield, 19994). They were also used to study other properties of the Arctic ozone layer, like laminae and summer variability (e.g., Orsolini et al., 19975; Orsolini et al., 20036) and properties of polar stratospheric clouds (PSCs) were investigated for the winters 1995/96 and 1996/97 (Hansen and Hoppe, 19977; Deshler et al., 20008).
UV observations
Annual UV doses for the period 1995 - 2004 are shown in Table 3 for the three GUV instruments located at Oslo, Andøya and Ny-Ålesund. For periods with missing data we have estimated the daily UV doses by using a radiative transfer model, FastRt, http://nadir.nilu.no/~olaeng/fastrt/fastrt.html. The time series are still considered to be too short for trend analysis.
THEORY, MODELLING, AND OTHER RESEARCH
University of Oslo
Department of Geosciences The model primarily used for studying the stratospheric ozone layer is called Oslo CTM2 and it is a global three-dimensional chemical transport model covering the troposphere and stratosphere. The model can be run in different horizontal and vertical resolution and can be forced by either IFS or ERA-40 data. Two comprehensive and well-tested chemistry schemes are included in the model, one for the troposphere (up to the level of 150 ppbv ozone) and one for the stratosphere. An extensive heterogeneous chemistry has been included. Photo dissociation coefficients are calculated on-line. Emissions of source gases are also included. The Oslo CTM2 model is used in various experiments to look at the chemical changes in ozone. Past time slice runs have used emissions from the Edgar Hyde database to look at the chemical changes up to present. IPCC SRES scenarios have been used for calculating chemical changes in future ozone. Because of large uncertainties in future emissions in the source gases, several time slice runs with different scenarios have been performed. A specific run to look at changes in stratospheric ozone from 1990 through 2000 have been performed, and compared with observations.
3 Hansen, G., M. Chipperfield, T. Svenøe, A. Dahlback, and U-P. Hoppe, (1997) Geophys. Res. Lett., 24, 799-802 4 Hansen, G. and M. Chipperfield,(1999) J. Geophys. Res., 104, 1837-1845 5 Orsolini, Y.J., G. Hansen, U.-P. Hoppe, G.M. Manney, and K.H. Fricke, (1997) Q.J.R. Meteorol. Soc., 123, 785-800 6 Orsolini, Y.J., H. Eskes, G. Hansen, U.P. Hoppe, A. Kylling, E. Kyro, J. Notholt, A. R. Van Der and P. Von Der Gathen, (2003) Q. J. R.
Meteorol. Soc., 129, part B, 3265-3275 7 Orsolini, Y.J., G. Hansen, U.-P. Hoppe, G.M. Manney, and K.H. Fricke, (1997) Q.J.R. Meteorol. Soc., 123, 785-8008 Deshler, T., B. Nardi, A. Adriani, F. Cairo, G. Hansen, F. Fierli, A. Hauchecorne and L. Pulvirenti, (2002) J. Geophys. Res., 105, 3943-3953
Table 3: Annual integrated UV doses (kJ/m2) at the three stations
during the period 1995 - 2004.
Year Oslo Andøya Tromsø* Ny-Ålesund
1995 387.6 1996 387.4 253.6 218.5 1997 415.0 267.0 206.5 1998 321.5 248.4 217.7 1999 370.5 228.0 186.1 2000 363.0 239.7 231.0 2001 371.0 237.0 208.6 2002 382.5 260.0 201.8
2003 373.2 243.4 No
measurements 2004 373.2 243.7 190.5
*The GUV instrument at Andøya was operating at Tromsø in the period 1996 – 1999

191
Department of Physics: Daily integrated erythemal UV doses are calculated based on a radiative transfer model and measurements with available TOMS satellite instruments. Cloud optical depths used in the model are derived from reflectivity data from the same TOMS instruments. The calculated UV doses are used in UV effect studies (skin cancer and Vitamin D production in humans).
The Norwegian University of Science and Technology (NTNU)
NTNU has performed underwater measurements of UV in 2003 and 2005 in the Kara Sea, as well as Trondheimsfjorden as a part of the project MAREAS, see section 5.
Norwegian Institute for Air Research (NILU)
At NILU, a main focus is to understand the dynamical contribution to the variability in column ozone with a focus on the northern hemisphere mid and high latitudes. Leading modes of climate variability have been shown to induce a strong signature on the trend and year-to-year variability in ozone. These modes include planetary-scale components of the atmospheric circulation (the North Atlantic Oscillation, the Aleutian-Icelandic Seesaw) (Orsolini, 20049) but also more regional patterns, e.g. those associated with blocking phenomena (Orsolini and Doblas-Reyes, 200310).
Another topic is the study of dynamically induced low-ozone episodes (LOE). We explained occurrences of summertime LOEs over the northern high latitudes, and Scandinavia in particular, and looked at their impact on the UV erythemal dose at the ground (Orsolini et al., 200311). An intense LOE occurred over Scandinavia during the European Heat Wave of the summer 2003 (Orsolini and Nikulin, 200512).
We have studied the changes in atmospheric composition (HNO3, NOX), and ozone depletion occurring in the aftermath of the exceptional autumn 2003 solar storms (Orsolini et al., 200513). A highly anomalous layer enriched in nitric acid was observed in the upper stratosphere following the storms, and then slowly descended throughout the winter. Simultaneous observations of NO2, including the nighttime polar stratosphere, revealed strongly enriched NOX layers following the storms. The formation mechanism for the nitric acid layer does not seem to involve polar stratospheric clouds or aerosols, but rather, is likely to involve heterogeneous chemistry on water ion clusters, a relatively new and unknown topic. In Randall et al. (200514), a multi-satellite intercomparison (POAM, SAGE, MIPAS, OSIRIS) revealed a highly anomalous atmospheric composition in the spring 2004, with unprecedented ozone depletion and NOx enrichment. It remains to be determined how the unusual meteorological conditions, and possibly, the solar storms in autumn, combined to give rise to this anomalous chemical composition.
Further, the ozone data from Tromsø have been used to establish a multi-decadal UV climatology at a nearby site (Skrova, Lofoten) with meteorological information (Engelsen et al., 200415). For the same area, UV maps have been derived for the period 1984-2002, based on various satellite observation data (Meerkötter et al., 200316). In the frame of the EU project UVAC, it was found that there is a positive correlation between maximum daily doses around 1 May and
9 Orsolini, Y. J., (2004) J. Meteor. Soc. of Japan, 82, vol. 3, 941-948. 10 Orsolini, Y. J. and F.J. Doblas-Reyes. (2003) Q. J. of the Royal Meteorol. Soc., 129, 3251-3263, 2003. 11 Orsolini, Y.J., H. Eskes, G. Hansen, U-P. Hoppe, A. Kylling, E. Kyro, J. Notholt, R. Van der A. P. Von der Gathen, (2003) Q. J. R.
Meteorol. Soc., 129, 3265-3276. 12 Orsolini, Y. J. and G. Nikulin, (2005) in press, Q. J. of the Royal Meteorol. Soc. 13 Orsolini, Y. J., G.L. Manney, M. Santee and C.E. Randall, (2005) Geophys, Res. Lett., Vol. 32, No. 12, L12S01,
10.1029/2004GL021588. 14 Randall, C.E., V.L. Harvey, G.L. Manney, Y. J. Orsolini, M. Codrescu, C. Sioris, S. Brohede and C. Haley, L.L. Gordley, J.M. Zawodny
and J.M. Russell III, (2005) Geophys. Res. Lett., 32, No. 5, L05802, doi:10.1029/2004GL022003. 15 Engelsen, O., G. Hansen, and T. Svenøe. (2004), Geophys. Res. Lett., 31, L12103, doi:10.1029/2003GL019241 16 Meerkötter, R., J. Verdebout, L. Bugliaro, K. Edvardsen, G. Hansen (2003), Geophys. Res. Lett., 30, 18, 1956, doi:
10.1029/2003GL017850

192
cod recruitment, in contradiction to the work hypothesis assuming a negative influence of UV on cod eggs and larvae.
NILU, in collaboration with the Institute for Community Medicine at the University of Tromsø, pursue research on the relationship between UV exposure, diet and vitamin D status in humans. The project applies UV simulations based on meteorological modelling data, UV measurements, questionnaire forms from cohort investigations, and blood sample analyses.
DISSEMINATION OF RESULTS
Data reporting: Ozone
Total ozone measurements from the Dobson spectrophotometer in Oslo have been re-evaluated and published (Svendby and Dahlback 200217). The complete set of revised Dobson total ozone values from Oslo is available at The World Ozone Data Centre (WOUDC) http://www.msc-smc.ec.gc.ca/woudc/. There are established daily routines submitting ozone data from the University of Oslo to WOUDC. The re-analysed total ozone data for Tromsø will be submitted to the WOUDC database in the near future.
At the joint ECMWF/WMO expert meeting on realtime exchange of ground based ozone measurements, held at ECMWF in 1996, the requirements for ozone data for Numerical Weather Prediction (NWP) in realtime were outlined. ECMWF had developed the operational data assimilation system to include ozone retrieval from SBUV and GOME, and requires independent high quality profile data from ground-based systems. For daily validation, monitoring and troubleshooting, it was found that ozone measurements should be available at the centre within 12–24 hours after the sounding.
NILU has collected ozone measurements from Arctic balloon flights through the Nadir database since 1988. Files are transferred and stored in the NASA-AMES 2160 format, and an automatic script has been set up to convert incoming data into the CREX format that is used at ECMWF. This script also performs a series of data quality checks, and can do simple corrections on erroneous input files.
Data reporting: UV
NILU has submitted spectral UV measurements from Norway to the European UV database (EUVDB). In the framework of the EU project EDUCE, described in section 5, NILU has developed quality assurance software for spectral UV measurements. The QA software is applied automatically to all UV data submitted to EUVDB.
17 Svendby, T.M. and Dahlback, A. (2002), J. of Geophys. Res., 107, 4369. doi: 10.1029/200JD002260.
Figure 1: Location of ozonesonde stations that were part of the THESEO/THESEO 2000
campaigns.

193
Information to the public
OzoneDaily total ozone values for Oslo are available at http://www.fys.uio.no/plasma/ozone/. The
latest measured raw data profiles and the latest analysed ozone data from the ALOMAR Observatory at Andøya are available at http://alomar.rocketrange.no/alomar-lidar.html.
UV NILU has developed a web portal for dissemination of air quality data including UV forecasts for Norway, www.luftkvalitet.info/uv. The content of the UV web pages are:
UV forecast for three days for Norway and some common destinations for Norwegian touristsThe UV forecast is given for clear-sky, partly cloudy and cloudy conditions Measured UV doses and total ozone values measured at the Norwegian stations Facts on UV radiation and the ozone layer
In addition the public may receive UV forecasts for user-selected locations by means of SMS or e-mail. The web application has been developed by NILU in co-operation with the Norwegian Radiation Protection Authority, Storm Weather Center, the Norwegian Pollution Control Authority and the Norwegian Meteorological Institute. During 2005/2006 the UV forecast model would be improved as well as the web-application.
Finally, UV indices and cloud effects measured by a GUV-instrument at the Department of Physics, University of Oslo, are presented and updated every 30 min at: http://www.fys.uio.no/plasma/ozone/.
Relevant scientific papers The ozone and UV measurements performed in Norway give rise to research in
collaboration with national and international partners. The reference list below gives an impression of the international collaboration and ongoing research in the Norwegian ozone and UV scientific community since 2002.
Arola, A., Kalliskota, S., den Outer, P.N., Edvardsen, K., Hansen, G., Koskela, T., Martin, T.J., Matthijsen, J., Meerkoetter, R., Peeters, P., Seckmeyer, G., Simon, P.C., Slaper, H., Talaas, P. and Verdebout, J. (2002) Assessment of four methods to estimate surface UV radiation using satellite data, by comparison with ground measurements from four stations in Europe. J. Geophys. Res., 107 (D16), 4333, doi:10.1029/2001JD000462.
Bais, A.F., Gardiner, B.G., Slaper, H., Blumthaler, M., Bernhard, G., McKenzie, R., Webb, A.R., Seckmeyer, G., Kjeldstad, B., Koskela, T., Kirsch, P.J., Gröbner, J., Kerr, J.B., Kazadzis, S., Leszczynski, K., Wardle, D., Brogniez, C., Josefsson, W., Gillotay, D., Reinen, H., Weihs, P., Svenoe, T., Eriksen, P., Kuik, F. and Redondas, A. (2001) SUSPEN intercomparison of ultraviolet spectroradiometers. J. Geophys. Res., 106 (D12), 12509-12525, doi: 10.1029/2000JD900561.
Braathen, G.O., Godin-Beekmann, S., Keckhut, P., McGee, T.J., Gross, M.R., Vialle, C. and Hauchecorne, A. (2004) Intercomparison of stratospheric ozone and temperature measurements at the Observatoire de Haute Provence during the OTOIC NDSC validation campaign from 11 July 1997. Atmos. Chem. Phys. Discuss., 5, 5303-5344.
http://www.copernicus.org/EGU/acp/acpd/4/5303/acpd-4-5303.pdf.
Brunner, D., Staehelin, J., Rogers, H.L., Köhler, M.O., Pyle, J.A., Hauglustaine, D.A., Jourdain, L., Berntsen, T.K., Gauss, M., Isaksen, I.S.A., Meijer, E., van Velthoven, P., Pitari, G., Mancini, E., Grewe, V. and Sausen, R. (2005) An evaluation of the performance of chemistry transport models - Part 2: Detailed comparison with two selected campaigns. Atmos. Chem. Phys., 1, 107-129. http://www.copernicus.org/EGU/acp/acp/5/107/acp-5-107.pdf
Brunner, D., Staehelin, J., Rogers, H.L., Köhler, M.O., Pyle, J.A., Hauglustaine, D.A., Jourdain, L., Berntsen, T.K., Gauss, M., Isaksen, I.S.A., Meijer, E., van Velthoven, P., Pitari, G., Mancini, E., Grewe, V. and Sausen, R. (2003) An evaluation of the performance of chemistry transport models by comparison

194
with research aircraft observations. Part 1: Concepts and overall model performance. Atmos. Chem. Phys., 4,1609-1631. http://www.copernicus.org/EGU/acp/acp/3/1589/acp-3-1589.pdf
Brustad, M., Alsaker, E., Engelsen, O., Aksnes, L. and Lund, E. (2004) Vitamin D status in middle-aged women at 65-71 degrees north in relation to dietary intake and exposure to ultraviolet radiation. Public Health Nutr., 2, 327-335, doi:101029/2002JD003325.
Brönnimann, S., Luterbacher, J., Staehelin, J., Svendby, T.M., Hansen, G. and Svenøe, T. (2004) Extreme climate of the global troposphere and stratosphere in the 1940-42 related to El Nino. Nature, 7011, 971-974.
Christensen, T., Knudsen, B.M., Streibel, M., Andersen, S.B., Benesova, A., Braathen, G., Claude, H., Davies, J., De Backer, H., Dier, H., Dorokhov, V., Gerding, M., Gil, M., Henchoz, B., Kelder, H., Kivi, R., Kyrö, E., Litynska, Z., Moore, D., Peters, G., Skrivankova, P., Stübi, R., Turunen, T., Vaughan, G., Viatte, P., Vik, A.F., von der Gathen, P. and Zaitcev, I. (2005) Vortex-averaged Arctic ozone depletion in the winter 2002/2003. Atmos. Chem. Phys., 1, 131-138. http://www.copernicus.org/EGU/acp/acp/5/131/acp-5-131.pdf.
Dahlback, A., Eide, H., Høiskar, B.A.K., Olsen, R.O., Schmidlin, F.J., Tsay, S-C. and Stamnes, K. (2005) Comparison of data for ozone amount and ultraviolet doses obtained from simultaneous measurements with various standard ultraviolet instruments. Opt. Eng., 4, 041010.
Engelsen, O., Brustad, M., Aksnes, L. and Lund, E. (2005) Daily Duration of Vitamin D Synthesis in Human Skin with Relation to Latitude, Total Ozone, Altitude, Ground Cover, Aerosols and Cloud Thickness. Accepted for publication in "Photochemistry and Photobiology", 2005. Published online 4 June 2005. doi: 10.1562/2004-11-19-RN-375
Engelsen, O., Hansen, G. and Svenøe, T. (2004) Long-term (1936–2003) ultraviolet and photosynthetically active radiation doses at a north Norwegian location in spring on the basis of total ozone and cloud cover. Geophys. Res. Lett., 31, L12103, doi:10.1029/2003GL019241.
Engelsen, O. and Kylling, A. (2005) Fast simulation tool for ultraviolet radiation at the earth’s surface. Opt. Eng., 4, 041012.
Gauss M., Isaksen, I.S.A., Wong, S. and Wang, W.-C. (2003) Impact of H2O emissions from cryoplanes and kerosene aircraft on the atmosphere, J. Geophys. Res., 108 (D10), 4304, doi:10.1029/2002JD002623.
Gauss, M., Myhre, G., Pitari, G., Prather, M.J., Isaksen, I.S.A., Berntsen, T.K., Brasseur, G.P., Dentener, F.J., Derwent, R.G., Hauglustaine, D.A., Horowitz, L.W., Jacob, D.J., Johnson, M., Law, K.S., Mickley, L.J., Müller, J.-F., Plantevin, P.-H., Pyle, J.A., Rogers, H.L., Stevenson, D.S., Sundet, J.K., van Weele, M. and Wild, O. (2003) Radiative forcing in the 21st century due to ozone changes in the troposphere and the lower stratosphere. J. Geophys. Res., 108 (D9), 4292, doi:10.1029/2002JD002624
Goutail, F., Pommereau, J.-P., Lefèvre, F., Van Roozendael, M., Andersen, S.B., Kåstad Høiskar, B.-A., Dorokhov, V., Kyrö, E., Chipperfield, M.P. and Feng, W. (2004) Early unusual ozone loss during the Arctic winter 2002/2003 compared to other winters. Atmos. Chem. Phys. Discuss., 5, 5019-5044. http://www.copernicus.org/EGU/acp/acpd/4/5019/acpd-4-5019.pdf
Hansen, G. and Svenøe, T. (2005) Multi-linear regression analysis of the 65-year Tromsø total ozone series. J. Geophys. Res., 110 (D10), D10103, doi:10.1029/2004JD005387.
Høiskar, B.A.K., Haugen, R., Danielsen, T., Kylling, A., Edvardsen, K., Dahlback, A., Johnsen, B., Blumthaler, M. and Schreder, J. (2003) Multichannel moderate-bandwidth filter instrument for measurement of the ozone-column amount, cloud transmittance, and ultraviolet dose rates. Appl. Opt., 18, 3472-3479.
Keckhut, P., McDermid, S., Swart, D., McGee, T., Godin-Beekmann, S., Adriani, A., Barnes, J., Baray, J.-L., Bencherif, H., Claude, H., di Sarra, A.G., Fiocco, G., Hansen, G., Hauchecorne, A., Leblanc, T., Lee, C.H., Pal, S., Megie, G., Nakane, H., Neuber, R., Steinbrecht, W. and Thayer, J. (2004) Review of ozone and temperature lidar validations performed within the framework of the Network for the Detection of Stratospheric Change. J. Environ. Monit., 9, 721-733.
Kjeldstad, B., Frette, Ø., Erga, S.R., Browmann, H.I., Kuhn, P., Davis, R., Miller, W. and Stamnes, J.J. (2003) UV (280-400 nm) optical properties in a Norwegian fjord system and an intercomparison of underwater radiometers. Mar. Ecol. Prog. Ser., vol. 256, 1-11.
Kjeldstad, B. and Thorseth, T.M. (2003) Ground-based ultraviolet radiation – measurements in Trondheim. In: Proceedings of SPIE, Ultraviolet ground- and space-based measurements, models and effects III. Ed. by: J.R. Slusser et al., vol. 5156, San Diego, USA, pp. 101-108.

195
Kylling, A., Webb, A.R., Kift, R., Gobbi, G.P., Ammannato, L., Barnaba, F., Bais, A., Kazadzis, S., Wendisch, M., Jäkel, E., Schmidt, S., Kniffka, A., Thiel, S., Junkermann, W., Blumthaler, M., Silbernagl, R., Schallhart, B., Schmitt, R., Kjeldstad, B., Thorseth, T.M., Scheirer, R. and Mayer, B. (2005) Spectral actinic flux in the lower troposphere: measurement and 1-D simulations for cloudless, broken cloud and overcast situations. Atmos. Chem. Phys., 2, 1421-1467. URL: http://www.copernicus.org/EGU/acp/acp/5/1975/acp-5-1975.pdf
Larsen, N., Knudsen, B.M., Gauss, M. and Pitari, G. (2002) Aircraft induced effects on Arctic polar stratospheric cloud formation. Meteorol. Zeit., 3, 207-214.
Moan, J.E., Porojnicu, A.C., Robsahm, T.E., Dahlback, A., Juzeniene, A., Tretli, S. and Grant, W. (2005) Solar radiation, vitamin D and survival rate of colon cancer in Norway. J. Photochem. Photobiol. B, Biol. 3, 189-193.
Orsolini, Y. J. (2004) Seesaw Ozone Fluctuations between the North Pacific and Atlantic in Late Winter, J. Meteor. Soc. Japan, 3, 941-948.
Orsolini, Y. J. and Doblas-Reyes, F.J. (2003) Ozone signatures of climate patterns over the Euro-Atlantic sector in the spring, Quart. J. Roy. Met. Soc., 595, 3251-3263.
Orsolini, Y.J., Eskes, H., Hansen, G., Hoppe, U.P., Kylling, A., Kyro, E., Notholt, J., Van Der A., R. and Von Der Gathen, P. (2003) Summertime low-ozone episodes at northern high latitudes. Quart. J. Roy. Meteorol. Soc., 595, 3265-3275.
Orsolini, Y.J., Manney, G.L., Santee, M.L. and Randall, C.E. (2005) An upper stratospheric layer of enhanced HNO3 following exceptional solar storms. Geophys. Res. Lett., 32, L12S01, doi:10.1029/2004GL021588.
Orsolini, Y.J. and Nikulin, G.,(2005) A low-ozone episode during the European heat wave of August 2003. In press, Quart. J. Roy. Met. Soc.
Randall, C.E., Harvey V.L., Manney G.L., Orsolini Y. J., Codrescu M., Sioris C., Brohede S., Haley C., Gordley L.L., Zawodny J.M., and J.M. Russell (2005) III, Stratospheric effects of energetic particle precipitation in 2003-2004, Geophys. Res. Lett., 32, No. 5, L05802, doi:10.1029/2004GL022003.
Robsahm, T.E., Tretli, S., Dahlback, A. and Moan, J.E. (2004) Vitamin D-3 from sunlight may improve the prognosis of breast-, colon- and prostate cancer (Norway). Cancer Causes Control, 2, 149-158
Stebel, K., Blum, U., Fricke, K.-H., Kirkwood, S., Mitchell, N. J. and Osepian, A. (2004) Joint radar/lidar observations of possible aerosol layers in the winter mesosphere. J. Atmos. Solar Terrest. Phys., 11, 957-970.
Svendby, T.M. and Dahlback, A. (2004) Statistical analysis of total ozone measurements in Oslo, Norway, 1978-1998. J. of Geophys. Res.; 109, D16107, doi:10.1029/2004JD004679.
Svendby, T.M. and Dahlback, A. (2002) Twenty years of of revised Dobson total ozone measurements in Oslo, Norway. J. of Geophys. Res., 107 (D19), 4369, doi:10.1029/2002JD002260.
Tørnkvist, K.K., Arlander, D.W. and Sinnhuber, B.-M. (2002) Ground-based UV measurements of BrO and OClO over Ny-Ålesund during winter 1996 and 1997 and Andøya during winter 1998/99. J. Atmos. Chem., 2, 75-106.
Vandaele, A. C., Fayt, C., Hendrick, F., Hermans, C., Humbled, F., Van Roozendael, M., Gil, M., Navarro, M., Puentedura, O., Yela, M., Braathen, G., Stebel, K., Tørnkvist, K., Johnston, P., Kreher, K., Goutail, F., Mieville, A., Pommereau, J.-P., Khaikine, S., Richter, A., Oetjen, H., Wittrock, F., Bugarski, S., Frieß, U., Pfeilsticker, K., Sinreich, R., Wagner, T., Corlett, G. and Leigh, R. (2005) An intercomparison campaign of ground-based UV-visible measurements of NO2, BrO, and AClO slant columns: Methods of analysis and results for NO2. J. Geophys. Res., 110, D08305, doi:10.1029/2004JD005423.
PROJECTS AND COLLABORATION
Norwegian institutions and scientists are participating in numerous international and national projects. The following gives an overview of the most important projects related to ozone and UV research in Norway.

196
International projects
CANDIDOZ Chemical and Dynamical Influences on Decadal Ozone Change (2002-2005) This EU project aims to identify the earliest signs of ozone recovery. Long-term mid-latitude and polar ozone data sets and global meteorological data are used to assess the roles of chemistry and transport on ozone changes in the Northern Hemisphere stratosphere. Multi-decadal total ozone measurement series are used to empirically investigate the role of dynamical processes on ozone variability. Chemical transport models are used to assess the relative roles of chemistry and transport on ozone changes. CANDIDOZ also considers the possible consequences of climate-ozone interaction. Web-site: http://fmiarc.fmi.fi/candidoz/
EDUCE European Database for UV Climatology and Evaluation (2000-2003) is a scientific EU research project designed to investigate the ultraviolet (UV) radiation climate in Europe. Web-site: http://www.muk.uni-hannover.de/~martin/
HIBISCUS Impact of tropical convection on the upper troposphere and lower stratosphere (UTLS) at global scale (2002-2005). The main objective of this EU-project is to study dynamical, microphysical, radiative and chemical aspects of the UT/LS related to deep convection in the tropics. Web-site: http://www.aero.jussieu.fr/projet/HIBISCUS/en/many/index.html
INSPECTRO Influence of clouds on the spectral actinic flux in the lower troposphere (2002-2005). The overall objective of this EU project is the characterisation of the UV radiation field in the cloudy atmosphere. The objective will be achieved through a combination of theoretical and experimental approaches. Web-site: http://imk-ifu.fzk.de/inspectro/
NDSC: The Network for the Detection of Stratospheric Change is a set of high-quality remote-sounding research stations for observing and understanding the physical and chemical state of the stratosphere. Ozone and key ozone-related chemical compounds and parameters are targeted for measurement. The NDSC is a major component of the international middle atmosphere research effort and has been endorsed by national and international scientific agencies, including the International Ozone Commission, the United Nations Environment Programme, and the World Meteorological Organization. Web-site: http://www.ndsc.ncep.noaa.gov/
OUILT: Quantification and Interpretation of Long-Term UV-VIS Observations of the Stratosphere (2001-2004). The general aim of the EU project was to use the existing ground-based, satellite and balloon-borne UV-visible data as well as 3D atmospheric modelling tools for quantifying ozone loss in the past, to monitor its development in the present and to investigate its relation to active halogen and nitrogen species. Web-site http://nadir.nilu.no/quilt/index.php
SCENIC: Scenario and aircraft emission and impact studies on chemistry and climate(2002-2005) The aim of the EU project SCENIC was to study the atmospheric impact of possible future fleets of supersonic aircraft using state-of-the-art atmospheric models and realistic supersonic fleet scenarios. Web-site: http://www-scenic.ch.cam.ac.uk/
SCOUT-O3: Stratospheric-Climate Links with Emphasis on the Upper Troposphere and Lower Stratosphere (2004-2008). This is an integrated project funded by EU. The central aim of the project is to provide scientific knowledge for global assessments on ozone depletion and climate change for the Montreal and Kyoto Protocols. The SCOUT-O3 project aims to provide new knowledge for EU and national governments, which could be used to develop the European position for sustainable development. SCOUT-O3 involves the research efforts of 59 partners with more than 100 scientific groups; and takes full advantage of new and existing research facilities developed at a national level. Web-site: http://www.ozone-sec.ch.cam.ac.uk/scout_o3/
SOLICE: Solar Impacts on Climate and the Environment (2000-2003) One of the main objectives of the EU project SOLICE was to assess the impact of the solar variability on stratospheric ozone, radiative forcing on climate and surface UV.

197
Web-site: http://www.imperial.ac.uk/research/spat/research/SOLICE/
UVAC: The Influence of UVR and Climate Conditions on Fish Stocks: A Case Study of the Northeast Arctic Cod (1999-2003) In the frame of this EU project UV climatology were established based on ground-based and satellite measurements of total ozone and cloud coverage. These were combined with marine-biological data sets and field surveys in order to find a possible impact of UV radiation and other climate parameters on the recruitment of Northeast Arctic cod and major elements of its food chain like Calanus finmarchicus. Web-site: http://www.nfh.uit.no/prosjektvis.aspx?id=90
VINTERSOL: Validation of INTERnational Satellites and study of Ozone Loss (2002-2004) was a major European field campaign studying stratospheric ozone loss. VINTERSOL was the fourth major European project of its kind, succeeding EASOE (European Arctic Stratospheric Ozone Experiment), SESAME (Second European Stratospheric Arctic and Mid-latitude Experiment) and THESEO (Third European Stratospheric Experiment on Ozone). VINTERSOL-related projects are EUPLEX, HIBISCUS, MAPSCORE, QUOBI, UFTIR, CANDIDOZ, GOA and TOPOZ III. Web-site: http://www.ozone-sec.ch.cam.ac.uk/VINTERSOL/
National projects
AerOzClim: Aerosols, Ozone and Climate (2003-2006). This project is financed through Norwegian Research Council. The main objective of AerOzClim is to improve our understanding of aerosol- climate and ozone-climate interactions, by developing and applying global models in combination with analysis of data, to study processes involved, and to provide improved parameterisations for climate models. Web-site: http://www.geo.uio.no/forskning/atmosfare/prosjekter/AEROZCLIM/
COZUV: Coordinated Ozone and UV project (1999-2002). The main objective for the COZUV project was to investigate the stratospheric ozone layer in the Northern Hemisphere with various instrumental techniques and to develop and use a three-dimensional chemical transport model. Web-site: http://www.nilu.no/projects/cozuv/
FARIN: Factors Controlling UV radiation in Norway (2002-2006). The Norwegian Research Council funds the project. The main objective of the project is to quantify the various factors controlling UV radiation in Norway, including clouds, ozone, surface albedo, aerosols, latitude, and geometry of exposed surface including a comprehensive instrument comparison with spectral and broad band meters included in the project. The project applies both UV measurements (incl. the Norwegian GUV network) and radiative transfer modelling. Web-site: http://www.nilu.no/farin/
LLAE Light and Life in African Environments (2002-2006). In this project a network of NILU-UV instruments has been established in the African tropical belt: Serrekunda (Gambia), Kampala (Uganda), and Dar-es-Salaam (Tanzania). Further, 3 instruments are located in Kilimanjaro (Tanzania) at 1800 m, 3700 m and 5700 m. Total ozone columns, UV-doses and cloud effects are derived from the measurements at all sites. The project is funded by Norwegian Council for Higher Education’s Programme for Development Research and Education.
MAREAS Material fluxes from the Russian Rivers Ob and Yenisey: Interactions with climate and effects on Arctic Seas (2003-2006) The main objectives of the project are to improve flux assessments of DOC, nutrients and contaminants from the Ob and Yenisey rivers in Russia and to study the hydro-optical properties of the Kara Sea. The linkage between DOC, UV light regimes, primary production and contaminant will also be elucidated.
UTLS-Air: Chemistry in the upper troposphere and lower stratosphere - impact of aircraft emissions (2003-2006). The overall scientific aim of this project is to improve our understanding of the processes controlling the chemistry in the upper troposphere-lower stratospheric region with a

198
special focus on aircraft impact. The present and future impact of aircraft will be studied. Web-site: http://folk.uio.no/asovde/utls-air/home.html
FUTURE PLANS
A short description of the forthcoming plans are summarised below.
Department of Geosciences, University of Oslo plans to study the solar – stratospheric relations as a part of more general studies of stratospheric ozone in IPY (International Polar Year) activities. NILU has deployed a NILU-UV instrument at the Norwegian Antarctic Troll Station (71º S). Analysis, development, and applications to effect studies are forthcoming. Further efforts will be put into the re-evaluation of the Svalbard total ozone data 1950-1962; especially measurements in the ZC mode are not finished yet. More recent data from this site are stored in the WOUDC database (since 1984), but a comparison with TOMS and SAOZ measurements shows significant offsets. Therefore, these data should be quality-assessed. The historical Tromsø data before 1950 contain many days where a profile analysis using the Umkehr method may be applicable. The period is very interesting as there were several winters with frequent PSC displays and low ozone values in late winter. However, for such a study funding has to be secured first; it is not achievable in the frame of ongoing monitoring. There have also been made efforts to move the Tromsø Dobson instrument, which has not been operated since autumn 1999, to a new site (Bahir Dar, Ethiopia, 10ºN), but so far all applications to fund this transfer have been rejected.
NEEDS AND RECOMMENDATIONS
At present, ozone monitoring has a very weak financial basis in Norway. In order to secure a continuous operation of both total ozone monitors and profiling instruments, predictable multi-annual funding schedules should be established in order to free operations from additional funding pathways, e.g. satellite validation projects and short-time research projects. There is a certain need of stable long-term economic support to be able to run instruments properly and continuously since this often is not a part of a research project. The re-evaluation of the historical ozone series has very clearly revealed the importance of observational continuity to establish high-quality long-term data sets, which are essential for climatologically studies in a wider sense.
We also recommend an even closer international collaboration on UV radiation, particularly with respect to quality assurance of measurements, databases and forecasting. Our suggestion is that this collaboration should be supported financially, e.g. through UN.
****

199
PANAMA
OBSERVATIONAL ACTIVITIES
Column measurements of ozone and other gases/variables relevant to ozone loss.
The Laboratory of Atmospheric Physics of the University of Panama has been monitoring total ozone column since 1998. Total ozone column is measured with portable multifilter sunphotometers , model Microtops II, manufactured by Solar Light Co. This kind of ozone meter has five channels and measures beam UV-B radiation at the spectral lines of 305 nm, 312 nm, 320 nm and beam infrared radiation at the spectral lines of 940 nm and 1020 nm. Total ozone column is proportional to the ratio between irradiances corresponding to two UV-B wavelengths. A Radiometric and Meteorological Monitoring Network has been established in the cities of Panama, David and Santiago. At the three monitoring sites, the total ozone column shows an annual seasonal behaviour with a minimum value during January (230 DU) and a maximum value during August (280 DU).
Table N° 1 shows the total ozone column monthly mean values at the Republic of Panama.
Table N° 1
Total Ozone Column Monthly Mean Values
January 231 February 235
March 241 April 247 May 255 June 263 July 273
August 275 September 266
October 254 November 244 December 236
Figure N° 1 shows the seasonal behaviour of the ozone column in Panama City, from February 1998 to December 2001.
Figure 1: Total Ozone Column Seasonal Behaviour.

200
The fitting equation corresponding to the continuous curve is as follows:
Profile measurements of ozone and other gases/variables relevant to ozone loss
Actually, the Laboratory of Atmospheric Physics is not working on the profile measurements of ozone or other gases relevant to ozone loss.
UV measurements
At the three sites of the National Radiometric and Meteorological Network, Ultraviolet B radiation is measured in a continuous way, by means of broad band UV-B meters, model 501 UV-Biometers, manufactured by Solar Light Co. At sites 1 (Panama City) and 2 (David City), global solar radiation and other atmospheric parameters are being measured. Global solar radiation is measured by means of Pyranometers Eppley, model PSP and Pyranometers Kipp and Zonen. For the monitoring of the rest of atmospheric parameters, Campbell meteorological stations has been installed at sites 1 and 2. At site N° 3 (Santiago City), only UV-B radiation is measured up to now. We are planning to install another Campbell meteorological station at site N°3 on October 2005. The three monitoring sites with their respective coordinates are as follows:
Table N° 2
National Radiometric Network
Site Location Latitude Longitude Elevation 1 Main Campus of the
University of Panama
8° 59’ N 79° 32’ W 50 msnmm
2 David City 8° 24’ N 82° 25’ W 27 msnmm 3 Santiago City 8° 6’ N 80° 25’ W 140 msnmm
At site N° 1, the monitoring process was initiated on July 1997. At site N° 2, the monitoring process was initiated on December 2001. At site N° 3, the monitoring process was initiated on March 2002. Radiometers and other sensors store data every five minutes, in a continuous way. Data from the three monitoring sites are downloaded from the Laboratory of Atmospheric Physics (Main Campus) through INTERNET by means of a software called PC ANYWHERE. Raw data is then processed, using statistical and graphical software.
Actually, the Radiometric Network administered by the Laboratory of Atmospheric Physics covers one site at the central part (Santiago City) of the Republic of Panama and two sites at the Pacific coastline (Panama City and David City). Up to now, the Laboratory of Atmospheric Physics has no monitoring site at the Caribbean coastline.
Calibration activities
All radiometers and other sensors are calibrated each year. Calibrations have been performed by Solar Light Co and by the Solar Radiation Observatory, at the UNAM, Mexico.
RESULTS FROM OBSERVATION AND ANALYSIS
Table N° 3 shows the evolution of annual total dose in Med registered at the three monitoring sites (Panama City, David City and Santiago City). The station at Panama City has more stored data than the other two, because it is the first Network Site established.
353
225230252 n
dsenOZONE

201
Table N° 3
Annual Total Dose (MED)
Years Panama City David City Santiago City
1998 5907
1999 5697
2000 7363
2001 6510
2002 7011 6972
2003 6232 7458 4466
2004 6193 7170 5813
The analysis of the time series for Site N° 1 (Panama City) shows that the highest annual total dose corresponds to year 2000 (7363 MED) whereas the lowest annual total dose corresponds to year 1999 (5697 MED). A high anti-correlation between UV-B dose and cloud cover has been observed. During year 2000, a decrease in cloud cover for Central America was observed. Even during that year, there was a drought all over Central America. A probable cause of this phenomenon is the fact that “The Bermudas” anticyclone was strengthened during several months of 2000. As a consequence of the significant decrease in cloud cover during year 2000, the annual total dose increased with respect to the mean value of annual total dose, which corresponds to the period from 1998 to 2004. During year 1999, a significant increase in cloud cover was observed. Cloudiness was higher during 1999, compared with the other years of the time series. As a consequence of this fact, the annual total dose registered during 1999 was the lowest of the time series.
In Figure 2, the mean monthly dose (mean values has been evaluated for the period from 1997 to 2005) behaviour for Site N° 1 is observed.
Figure 2: mean monthly values at Site N° 1.
In Figure N° 3, the mean monthly dose (mean values has been evaluated for the period from 2002 to 2005) behaviour for Site N° 2 is observed.

202
Figure N° 3: mean monthly values at Site N° 2.
At both monitoring sites (Panama City and David City), UV-B mean monthly dose shows a similar behaviour, with a maximum during the dry season (highest levels are registered on March) and a secondary maximum on September-October, during the rainy season. Concerning Site N° 3 (Santiago City), there is not, yet, enough data in order to establish the mean monthly dose behaviour.
Figure 4 shows a contour map of the Monthly Mean Maximum Irradiance vs Local Hour at Site N° 1, for the entire year since 1998 to 2004.
Figure 4: monthly mean max. irradiance behaviour at Site N° 1.

203
In Figure 5 and Figure 6, the inter comparative UV-B doses for the three monitoring sites, during 2003 and 2004, respectively, are shown.
Figure 5: Stations inter comparative doses (2003).
Figure 6: Stations inter comparative doses (2004).
Although Panama and David Stations belong to the same climatic zone (Awi zone, according to Köeppen classification), UV-B doses and Indexes are higher at David City due to the proximity of the mountain chain of the central part of the country. This mountain chain acts as a barrier for low cloudiness which is frequently transported by winds proceeding from the Caribbean Sea. Due to this fact, cloud cover over David City tends to be lesser than over Panama City during the morning. Cloud cover at David City increases after local noon due to convection processes which intensify when the Inter Tropical Convergence Zone is passing over the Republic of Panama.
The average total ozone column is 252 DU. The minimum value (231 DU) is registered during the month of January. The maximum value (nearly 280 DU) is registered during the month of August. Nevertheless, these values lie within the variability margin correspondent to the Panama City latitude. The analysis of the evolution of the total ozone column measured by the Laboratory of Atmospheric Physics of the University of Panama indicates that there is no statistically significant depletion of total ozone column at the latitudes corresponding to the Republic of Panama.

204
THEORY, MODELLING, AND OTHER RESEARCH
In order to forecast UV Indexes at different regions of the Republic of Panama, the Laboratory of Atmospheric Physics of the University of Panama, is working with the Tropospheric Ultraviolet-Visible Radiation Model (TUV Model) developed by Dr Sasha Madronich at NCAR. This model, which runs in Fortran 77, has a main programme, approximately 50 subroutines, external functions and nearly 300 data files. With TUV Programme, which is based on “two streams” model, UV irradiance and UV irradiation could be forecasted under cloudless condition as well as under overcast condition.
Cloudiness is the factor which contributes in a more significant way to the spatial and temporal variability of UV irradiance. Theoretically, it is possible to use Transfer Radiative Models in order to asses the transmittance through clouds. The information required to accomplish this assessment is cloud optical depth. However, partial cloudiness is too difficult to model due to the enormous variability of cloud morphologies and multiple heights of clouds bases. Due to this fact, to asses the attenuation on UV-B irradiance caused by partial cloudiness, the Laboratory of Atmospheric Physics of the University of Panama has developed an empirical or parametric model which simplifies this assessment under partial cloudiness condition. This empirical model was presented by the Laboratory of Atmospheric Physics during the Fifth Ozone Research Managers Meeting, celebrated at Geneva on March 2002.
DISSEMINATION OF RESULTS
Data reporting
Actually, the Laboratory of Atmospheric Physics of the Republic of Panama is submitting UV-B data to the RAYENARI Server which is managed by the Solar Radiation Observatory of the Mexican Autonomous National University.
Information to the public
UV Indexes are forecasted daily by the researchers of the Laboratory of Atmospheric Physics. This information is deployed at the Laboratory Web Site (www.igc.up.ac.pa/labfisat/lab220.htm) as well as by some local TV channels. Several educational campaigns have been accomplished in collaboration with the Ozone Unit of the Health Ministry of the Republic of Panama.
Relevant scientific papers
Determinación de los coeficientes de regresión del modelo de Angström-Page para la Provincia de Panamá; Revista Tecnociencias, Vol.1, N° 1, mayo de 1997. Resumen preliminar del monitoreo de la radiación UV-B en la Ciudad de Panamá; Revista Científica Tecnociencias, Vol.1, N° 2, septiembre de 1997. Descripción preliminar de la radiación UV-B y del nivel de la columna de ozono estratosférico en la Ciudad de Panamá; Revista Geofísica, IPGH, N° 54, 2001. Datos meteorológicos en la cuenca hidrográfica del Canal de Panamá durante el siglo XIX y su aplicabilidad a la variabilidad climática y al cambio climático; Revista Tecnociencias, Vol. 3, N° 2, 2001. Estudio climatológico de los niveles de radiación UV-B, columna de ozono total y cobertura nubosa en Panamá; Revista Scientia, Vol. 17, N° 1, 2002.
PROJECTS AND COLLABORATION
The Laboratory of Atmospheric Physics of the University of Panama has received a proposal from GKSS Coastal Research Institute, to collaborate in the Research Project that this Institute develops at “Las Minas Bay”, located at the Caribbean coastline of the Republic of Panama. A formal project with objectives, goals and instrumentation required has been presented to GKSS Coastal Research Institute.

205
FUTURE PLANS
The Laboratory of Atmospheric Physics of the Republic of Panama is projecting to incorporate, into the actual Research Project, the monitoring process of UV-B radiation, global radiation and other meteorological parameters at the Caribbean coastline of the Republic of Panama. In order to characterize the radiometric and meteorological behavior at the Caribbean coastline, two stations must be deployed over this seaboard. It is recommended that the station N° 4 of the Radiometric Network be installed at Las Minas Bay and that station N° 5 be installed in the University of Panama Regional Centre located at “Bocas del Toro”.
NEEDS AND RECOMMENDATIONS
It is important to strengthen the Regional Radiometric Networks and increase the capacity-building for ozone and UV-B measuring stations in developing countries. In order to accomplish this goal, we recommend to look for funding support for those Research Institutions of developing countries that are working on the monitoring of UV-B radiation and ozone, as well as in data analysis and modelling process.
It is urgent to design some procedure which decreases the costs of calibration processes of broadband meters, narrowband filter instruments, ozone meters and other sensors for those Research Institutions of developing countries which are working on this issue. Collaboration of Research Institutions of developed countries, is necessary, in order to facilitate the calibration process for those Research Institutions of developing countries.
****

206
PARAGUAY
Ozono Superficial y UV-B Total.
Estación San Lorenzo.LIAPA-FaCEN.
5 de Agosto 2001
0
200
400
600
800
1000
1200
1400
1600
1800
2000
15
11
5
21
5
31
5
41
5
51
5
61
5
71
5
81
5
91
5
10
15
11
15
12
15
13
15
14
15
15
15
16
15
17
15
18
15
19
15
20
15
21
15
22
15
23
15
Horas UTC
Ra
dia
ció
n U
V-B
To
tal
( m
W/m
2)
0,00
5,00
10,00
15,00
20,00
25,00
30,00
35,00
40,00
45,00
Ozo
no
Su
pe
rfic
ial
(pp
bv
)
UV-B Total Ozono Superficial
UV-B, radiation
In the Figure of above appears the daily behaviour of total UV-B measured in day of clear sky in the station that has the Faculty of Exact and Natural Sciences in the University Campus of San Lorenzo.
The maximum value is of the order of 1800 mW/m2, and is had around the 12:00 hs local.
The instrument is a Piranómetro UV, YES Model UV-B 1, which also measures the biological effectiveness of solar radiation UVB. First calibration was made in the Meteorological Service of Canada (1996). One second calibration in situ was made by investigators of the Meteorological Service of Spain in 1997.
The Solar Radiation (average every 15 minutes) measured with a LiCor, for the month of January of the year 1999 was between 1,185 and 43 W/m2, that the values of the radiation are high.
Surface Ozone
The Surface Ozone is measurement with a TECO, Model 49/49-PS, for the same period the maximum value is almost 40 ppbv. In the same one it is observed that also superficial ozone is had at night. This can be due to enriched movement shift of air with ozone that lowers from superior levels of the atmosphere due to the thermal contraction of the air. In the table are the values average of superficial ozone, and the dates in which were surpassed the norms.

207
Days Average value in 8 hs (ppbv) Average value in 10 hs (ppbv)
31-ago 89 85
01-sep 78 73
02-sep 86 81
03-sep 74 69
Episode of the year 1999. Measured in station FaCEN - LIAPA.
Stratospheric Ozone
Stratospheric ozone on Paraguay is controlled from the data of the TOMS, down are the means values on Filadelfia, Pedro Juan Caballero, Pozo Colorado, San Pedro, Asunción, Pilar, Encarnacion, important localities by its geographic position and greater human population.
Filadelfia is to the west of Loma Plata, 25 km. San Pedro this to 100 km to the northwest of San Estanislao.

208
1 2 3 4 5 6 7 8 9 10 11 12
Meses
1996
1997
1998
1999
2000
2001
2002
2003
2004
2005A
ño
s
245 250 255 260 265 270 275 280 285 290 295 300UD
Promedios Mensuales de Ozono Estratosférico sobre Filadelfia.Datos del TOMS. Periodo 1996 - 2005

209
1 2 3 4 5 6 7 8 9 10 11 12
Meses
1996
1997
1998
1999
2000
2001
2002
2003
2004
2005
Añ
os
245 250 255 260 265 270 275 280 285 290 295 300UD
Promedios Mensuales de Ozono Estratosférico sobre Pedro Juan Caballero.Datos del TOMS. Periodo 1996 - 2005
1 2 3 4 5 6 7 8 9 10 11 12
Meses
1996
1997
1998
1999
2000
2001
2002
2003
2004
2005
Años
245 250 255 260 265 270 275 280 285 290 295 300UD
Promedios Mensuales de Ozono Estratosférico sobre Pozo Colorado.Datos del TOMS. Periodo 1996 - 2005

210
1 2 3 4 5 6 7 8 9 10 11 12
Meses
1996
1997
1998
1999
2000
2001
2002
2003
2004
2005A
ño
s
245 250 255 260 265 270 275 280 285 290 295 300UD
Promedios Mensuales de Ozono Estratosférico sobre San Pedro.Datos del TOMS. Periodo 1996 - 2005
1 2 3 4 5 6 7 8 9 10 11 12
Meses
1996
1997
1998
1999
2000
2001
2002
2003
2004
2005
Añ
os
245 250 255 260 265 270 275 280 285 290 295 300UD
Promedios Mensuales de Ozono Estratosférico sobre Asunción.Datos del TOMS. Periodo 1996 - 2005

211
1 2 3 4 5 6 7 8 9 10 11 12
Meses
1996
1997
1998
1999
2000
2001
2002
2003
2004
2005
Añ
os
245 250 255 260 265 270 275 280 285 290 295 300UD
Promedios Mensuales de Ozono Estratosférico sobre Pilar.Datos del TOMS. Periodo 1996 - 2005

212
1 2 3 4 5 6 7 8 9 10 11 12
Meses
1996
1997
1998
1999
2000
2001
2002
2003
2004
2005A
ño
s
245 250 255 260 265 270 275 280 285 290 295 300UD
Promedios Mensuales de Ozono Estratosférico sobre Encarnación.Datos del TOMS. Periodo 1996 - 2005
In all the analyzed stations they are almost observed the same behaviour of monthly distribution during the period from study 1996 - 2005.
Encarnacion Pilar Asunción San
PedroPozo
ColoradoPedro J.
Caballero FiladelfiaMax
Maximorum
Max 299 301 299 294 293 292 290 301
Min 246 246 246 244 245 244 241 241
Promedio 270 269 268 267 266 265 264 267
In the period of study, the values of ozone never were below the 240 UD, which is that never was reached the condition of "ozone hole".
In the Chaco region (Pozo Colorado and Filadelfia) is observed that the variability is small, however in Pedro Juan Caballero is observed greater variability of ozone, is necessary to remember that in Pedro Juan Caballero region the florets is much more exuberant that in the Chaco.

213
Some works
1) IRRADIANCIA ERITEMICA E INDICE DE RIESGO SOLAR EN ASUNCION, PARAGUAY EN EL PERIODO 1997-1999
R. D. Piacentini1-2 *, M. I. Micheletti1-3, D. N. Lazarte1 y G. Coronel4
Instituto de Física Rosario (CONICET-UNRosario), 27 de Febrero 210 bis, 2000 Rosario,
Argentina
1 Facultad de Ciencias Exactas, Ingeniería y Agrimensura, UNRosario 2 Facultad de Ciencias Bioquímicas y Farmacéuticas, UNRosario
3 Facultad de Ciencias, Universidad Nacional de Asunción, San Lorenzo, Paraguay
Resume:
We analyze solar irradiance in the UV range (290 nm-400 nm) registered with a
biómetro having a filter that reproduce the erythemal (alarm of the skin) action spectral. Data
were obtained in Asunción, Paraguay between 1997 and 1999, in the months with large
aerosols content due to biomass burning. We compare the solar erythemal irradiance,
transformed in the solar risk UV index, with results of the solution of the atmospheric
radiativa transfer equation, employing the Madronich code. The most important geophysical
variable, ozone, is obtained through measurements made with the instrument TOMS (Total
Ozone Mapping Spectrometer)/NASA on board of Earth Probe satellite. We employed the
method of variable identification in order to determine the aerosol optical depth. In this way
we calculate the time variation of UV index, in particular during the biomass burning event
that is particularly important in the Chaco and Amazonia regions during August-September of
each year. We compare this index with the corresponding one forecasted by CONAE
(Comisión Nacional de Actividades Espaciales/Argentina) for the region, giving in general a
rather good agreement, except for the days of high aerosol optical depth due to the intense
biomass burning.
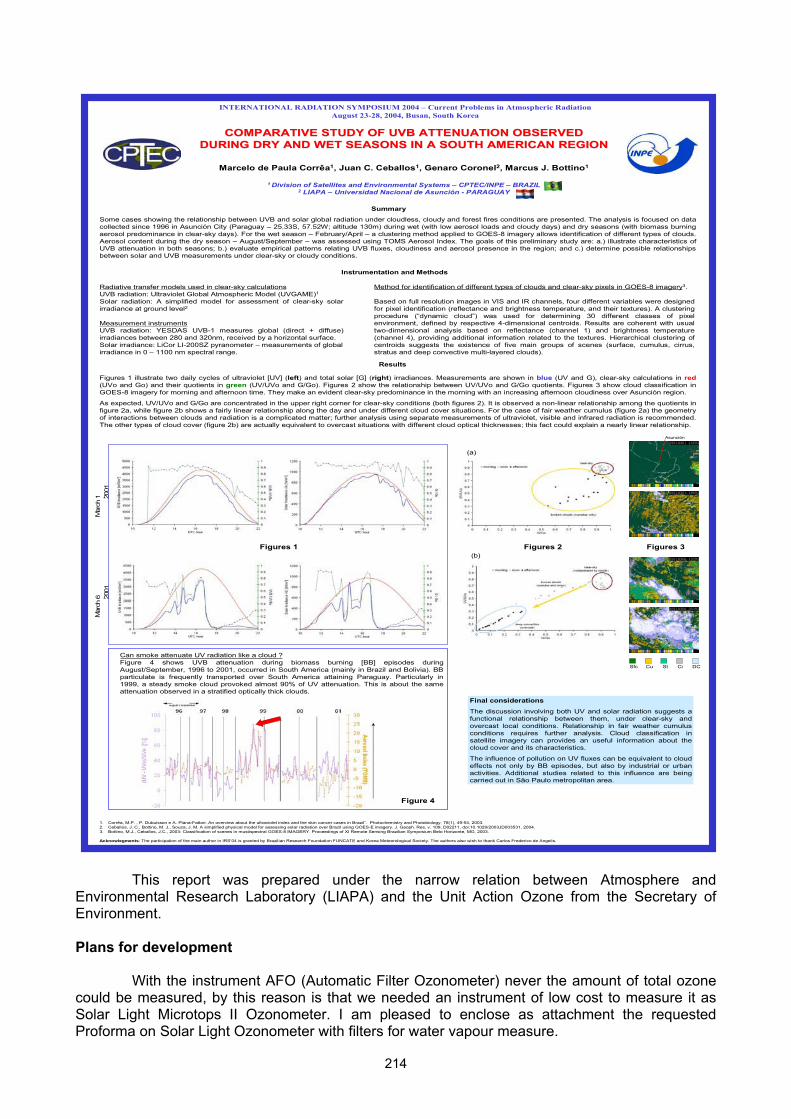
214
COMPARATIVE STUDY OF UVB ATTENUATION OBSERVED COMPARATIVE STUDY OF UVB ATTENUATION OBSERVED
DURING DRY AND WET SEASONS IN A SOUTH AMERICAN REGIONDURING DRY AND WET SEASONS IN A SOUTH AMERICAN REGION
Marcelo de Paula Corrêa1, Juan C. Ceballos1, Genaro Coronel2, Marcus J. Bottino1
1 Division of Satellites and Environmental Systems – CPTEC/INPE – BRAZIL2 LIAPA – Universidad Nacional de Asunción - PARAGUAY
1. Corrêa, M.P. , P. Dubuisson e A. Plana-Fattori. An overview about the ultraviolet index and the skin cancer cases in Brazil”. Photochemistry and Photobiology, 78(1), 49-54, 2003.2. Ceballos, J. C., Bottino, M. J., Souza, J. M. A simplified physical model for assessing solar radiation over Brazil using GOES-E imagery. J. Geoph. Res, v. 109, D02211, doi:10.1029/2003JD003531, 2004.3. Bottino, M.J., Ceballos, J.C., 2003: Classification of scenes in mustispectral GOES-8 IMAGERY. Proceedings of XI Remote Sensing Brazilian Symposium Belo Horizonte, MG, 2003.
Acknowlegments: The participation of the main author in IRS’04 is granted by Brazilian Research Foundation FUNCATE and Korea Meteorological Society. The authors also wish to thank Carlos Frederico de Angelis.
Method for identification of different types of clouds and clear-sky pixels in GOES-8 imagery3.
Based on full resolution images in VIS and IR channels, four different variables were designed for pixel identification (reflectance and brightness temperature, and their textures). A clustering procedure (“dynamic cloud”) was used for determining 30 different classes of pixel environment, defined by respective 4-dimensional centroids. Results are coherent with usual two-dimensional analysis based on reflectance (channel 1) and brightness temperature (channel 4), providing additional information related to the textures. Hierarchical clustering of centroids suggests the existence of five main groups of scenes (surface, cumulus, cirrus, stratus and deep convective multi-layered clouds).
Radiative transfer models used in clear-sky calculationsUVB radiation: Ultraviolet Global Atmospheric Model (UVGAME)1
Solar radiation: A simplified model for assessment of clear-sky solar irradiance at ground level2
Measurement instrumentsUVB radiation: YESDAS UVB-1 measures global (direct + diffuse) irradiances between 280 and 320nm, received by a horizontal surface.Solar irradiance: LiCor LI-200SZ pyranometer – measurements of global irradiance in 0 – 1100 nm spectral range.
Some cases showing the relationship between UVB and solar global radiation under cloudless, cloudy and forest fires conditions are presented. The analysis is focused on data collected since 1996 in Asunción City (Paraguay – 25.33S, 57.52W; altitude 130m) during wet (with low aerosol loads and cloudy days) and dry seasons (with biomass burning aerosol predominance in clear-sky days). For the wet season – February/April – a clustering method applied to GOES-8 imagery allows identification of different types of clouds. Aerosol content during the dry season – August/September – was assessed using TOMS Aerosol Index. The goals of this preliminary study are: a.) illustrate characteristics of UVB attenuation in both seasons; b.) evaluate empirical patterns relating UVB fluxes, cloudiness and aerosol presence in the region; and c.) determine possible relationships between solar and UVB measurements under clear-sky or cloudy conditions.
Summary
Instrumentation and Methods
Results
INTERNATIONAL RADIATION SYMPOSIUM 2004 – Current Problems in Atmospheric Radiation
August 23-28, 2004, Busan, South Korea
Figures 1 illustrate two daily cycles of ultraviolet [UV] (left) and total solar [G] (right) irradiances. Measurements are shown in blue (UV and G), clear-sky calculations in red
(UVo and Go) and their quotients in green (UV/UVo and G/Go). Figures 2 show the relationship between UV/UVo and G/Go quotients. Figures 3 show cloud classification in GOES-8 imagery for morning and afternoon time. They make an evident clear-sky predominance in the morning with an increasing afternoon cloudiness over Asunción region.
As expected, UV/UVo and G/Go are concentrated in the upper right corner for clear-sky conditions (both figures 2). It is observed a non-linear relationship among the quotients in figure 2a, while figure 2b shows a fairly linear relationship along the day and under different cloud cover situations. For the case of fair weather cumulus (figure 2a) the geometry of interactions between clouds and radiation is a complicated matter; further analysis using separate measurements of ultraviolet, visible and infrared radiation is recommended. The other types of cloud cover (figure 2b) are actually equivalent to overcast situations with different cloud optical thicknesses; this fact could explain a nearly linear relationship.
Can smoke attenuate UV radiation like a cloud ?Figure 4 shows UVB attenuation during biomass burning [BB] episodes during August/September, 1996 to 2001, occurred in South America (mainly in Brazil and Bolivia). BB particulate is frequently transported over South America attaining Paraguay. Particularly in 1999, a steady smoke cloud provoked almost 90% of UV attenuation. This is about the same attenuation observed in a stratified optically thick clouds.
Final considerations
The discussion involving both UV and solar radiation suggests a functional relationship between them, under clear-sky and overcast local conditions. Relationship in fair weather cumulus conditions requires further analysis. Cloud classification in satellite imagery can provides an useful information about the cloud cover and its characteristics.
The influence of pollution on UV fluxes can be equivalent to cloud effects not only by BB episodes, but also by industrial or urbanactivities. Additional studies related to this influence are being carried out in São Paulo metropolitan area.
Marc
h1 , 2001
Marc
h6 , 2001
Sfc Cu St Ci DC
Asunción
Figures 1 Figures 2 Figures 3
(a)
(b)
Figure 4
This report was prepared under the narrow relation between Atmosphere and Environmental Research Laboratory (LIAPA) and the Unit Action Ozone from the Secretary of Environment.
Plans for development
With the instrument AFO (Automatic Filter Ozonometer) never the amount of total ozone could be measured, by this reason is that we needed an instrument of low cost to measure it as Solar Light Microtops II Ozonometer. I am pleased to enclose as attachment the requested Proforma on Solar Light Ozonometer with filters for water vapour measure.

215
PHILIPPINES
OBSERVATIONAL ACTIVITIES
Column measurements of ozone
On-going Monitoring Activities
In the Philippines, regular monitoring of total ozone and UV-B is conducted by the PAGASA using the Brewer Ozone Spectrophotometer and Dobson Spectrophotometer. Ozone monitoring activities are located at the PAGASA Science Garden Complex in Quezon City (14.6500 ºN, 121.0500 ºE).
Daily measurements of total ozone in the Philippines are being carried out at the local ozone-observing network since late 1970’s. Monitoring of atmospheric ozone and related parameters (e.g. UV solar radiation) are performed as a contribution of PAGASA to the Global Atmosphere Watch Programme (GAW) of the World Meteorological Organization (WMO).
An automated Brewer spectrophotometer (# 127) measures both direct sun and zenith sky measurements several times per day. The Brewer instrument is calibrated with respect to the travelling standard #017 of the Atmospheric Environment of Canada (AES). The Brewer instruments are programmed to make total ozone measurements on the sun and/ on the zenith sky. The Brewers also make Umkehr measurements of the ozone vertical profile and spectral scans of the horizontal UV irradiance. Measurements using Brewer Spectrophotometer started in late 90’s.
Profile measurements of ozone and other gases/variables relevant to ozone loss
At present PAGASA do not have ozonezondes and ozone lidar to make measurements of the ozone profile.
UV Measurements
At the moment we do not have broadband measurements or narrowband filter measurements for UV-radiation monitoring. Such kind of regular measurements are very essential to be developed in our country, but again there is a shortage of funds. What we have right now is a Brewer spectrophotometer which measures UV radiation on a daily basis.
Calibration Reports
Dobson #52
An expert from Japan Meteorological Agency QA/SAC, Koji Miyagawa, made the first field survey in the Philippine Atmospheric, Geophysical and Astronomical Services Administration (PAGASA), Philippines in March 22-31, 2004 to evaluate, repair and calibrate the Dobson Spectrophotometer (D052). Before the arrival of the expert, Dobson 052 has stopped its operation in preparation for the site transfer. During the instrument check-up the cobalt filter was broken but was repaired with glue and is being reused at present. A defective 470k resistor was replaced. The observers were briefed with the observation method and proper instrument maintenance. A computer software for the total ozone data management was provided and personnel involve in ozone observations were trained regarding its usage. The instrument is now operational in the new site.

216
M o n th ly M e a n O z o n e C o n c e n t r a t io n
2 0 0
2 1 0
2 2 0
2 3 0
2 4 0
2 5 0
2 6 0
2 7 0
2 8 0
2 9 0
3 0 0
M o n th /Y e a r
To
tal
Ozo
ne (
mil
li-a
tmo
-cm
)
Brewer #127
Int’l Ozone Services (IOS) completed the calibration and service of Philippines Brewer #127 during period March 16-20, 2005. This project was to be supported by the World Meteorological Organization (WMO). The instrument has been out of service for the past 5 years due to azimuth tracker power supply failure. The standard lamp (SL) ratios had increased from values of 2160/4420 to 2340/4835 and sensitivity had dropped by ~40%. This large change normally means the PMT filter is deteriorating and probably will need to be replaced soon to stabilize the instrument. The ETC constants were adjusted to values 3580 / 4415 to get best agreement to #017. In the table and graph below are the direct sun daily means and results of #127 and #017 using final constants. Two Sun Scan (SC) test results showed that cal step of 295 was still proper.
UV Calibration:
The UV calibration was checked and the final response file (uvr07705.127) is recommended for future use. The initial UV calibration (uvr07605x.127) showed that the sensitivity had decreased ~40% and due to low counting rates.
RESULTS FROM OBSERVATIONS AND ANALYSIS
Research activities mainly focus on statistical analysis. Trend analysis using ozone data from 1979-2002 (Figure 1) shows that there is no statistically significant trend in the yearly data. As shown in Figure 2, there is a seasonal variation in ozone concentration. Ozone values are high during summer (April-September) and tend to decrease during fall- winter (November-February). There are some data gaps and this can be attributed to instrument malfunction from November ’89 to Jun’90 and June’95 to April ’96 . Other data gaps are caused when the instrument was sent to Melbourne, Australia for general repair and participated in the intercomparison held every four years. The last intercomparison was held in Tsukuba, Japan in 1996.
Figure 1: Monthly Mean Ozone Concentration (1979-2002).

217
2 0 0
2 1 0
2 2 0
2 3 0
2 4 0
2 5 0
2 6 0
2 7 0
2 8 0
2 9 0
jfm79
am
j
jas
ond
jfm84
am
j
jas
ond
jfm89
am
j
jas
ond
jfm94
am
j
jas
ond
jfm99
am
j
jas
ond
Q u a r t e r l y S e a s o n
Figure 2: Seasonal Ozone Concentration (1979-2002).
THEORY, MODELLING AND OTHER RESEARCH
Ozone research activities mainly focus on statistical analyses (trends). The trends of both total ozone amounts are studied regularly.
DISSEMINATION OF RESULTS
Data Reporting
All data are being sent to the WMO World Ozone and UV Data Center operated by the Canadian AES in Toronto.
PROJECTS AND COLLABORATION
PAGASA is an active member of the Technical Working Group for the Phase-out of Ozone Depleting Substances (ODS) in the Philippines. PAGASA participates actively in the evaluation of policies and in designing strategies that are needed in order to phaseout the use of ozone depleting substances in the country. At present the Philippines has made considerable progress in phasing-out CFC’s especially in mobile airconditioning, fire fighting, refrigeration, foam as well as in the solvents industry. As early as in late 90’s most of these CFC’s were already phaseout in the country.
FUTURE ACTIVITIES
Investigating the causes of high and low concentrations of ozone by correlation analysis with meteorological factors and other pollutantsDevelopment of UV-B index programme Establish Broadband radiometers for additional UV monitoring stations Comparison of observations using Dobson and Brewer Spectrophotometer.
NEEDS AND RECOMMENDATIONS:
Operation of the Brewer spectrophotometer in the Philippines remains a big challenge especially for PAGASA with limited resources. Replacement of parts are very expensive. Without the support of WMO and the help of Mr Ken Lamb of the International Ozone Services we cannot sustain the regular maintenance and calibration of instruments. In order to maintain ozone monitoring activities in the Philippines we need the following:

218
Technical and financial assistance for the regular calibration of Brewer and Dobson spectrophotometer. Another calibration of the Brewer Spectrophotometer should be planned in 2006 and that a new filter be installed at that time to stabilize the instrument. There is also an urgent need for Dobson intercomparison with the standard Dobson #116.
Further training of technical personnel in the maintenance of instruments.
Services of experts to carryout calibration services are very important to ensure continuity of ozone observations especially for Brewer instruments. Support of WMO in order to sustain the regular maintenance and calibration of instruments is very essential.
****

219
POLAND
The ozone and UV-B monitoring and research activities, carried on in two INSTITUTES, are supported by: CHIEF INSPECTORATE FOR ENVIRONMENTAL PROTECTION; NATIONAL FUND FOR ENVIRONMENTAL PROTECTION AND WATER MANAGEMENT; MINISTRY OF THE ENVIRONMENT.
INSTITUTE OF METEOROLOGY AND WATER MANAGEMENT
Monitoring
The ozone soundings have been performed at Legionowo (52.40N, 20.97E) upper-air station since 1979. Up to May 1993 the OSE ozone sensor with the METEORIT/MARZ radiosounding system was used. Since June 1993 the ECC ozone sensor with OMEGA (since 1997 LORAN) DigiCora/RS80 radiosounding system has been in use. The ozone soundings are launched regularly on each Wednesday. The data are submitted to the WMO Ozone Data Centre regularly on monthly schedule. The Legionowo ozone profiles were used in the validation procedures of ozone profiles derived from satellite projects: GOME, POAM III, ILAS. Since 1993, on the base of the NOAA/TOVS satellite data, total ozone maps over Poland and surroundings have operationally been performed at a satellite receiving station in Krakow.In July 1993 broadband UV Biometers model SL 501 vers. 3, have been installed at three stations in Poland: Leba (54.75N, 17.53E), Baltic Coast, Legionowo (52.40N, 20.97E), Centre of Poland, and in Tatra Mountains: Kasprowy Wierch 1989m (49.32N, 19.98E), operated until 1996, in 1995 a Biometer was installed at Zakopane 857m (49.30N, 19,97E). The reference UV Biometer model SL 501 for the IMWM network takes part in the intercomparison campaigns (Helsinki in 1995, Thessaloniki in 1999, Ispra in 2004). In 2000 two NILU-UV spectral filter instruments were installed at Legionowo, measuring the UV-B, UV-A, total ozone and optical depth. Since 2001 the NILU-UV spectral filter instrument has been regularly (yearly), calibrated at NRPA, Norway. Surface ozone measurements with Monitor Labs. ML9810 started in 1995 at 3 stations: Leba (54.75N, 17.53E) Baltic Coast, Jarczew (51.81N, 21.98E) Centre of Poland, Sniezka (50.73N, 15.73E) Sudety Mountains.
Research
Ozone and UV research activities are carried on in the Centre of Aerology in Legionowo in co-operation with the Satellite Research Department in Krakow. The Centre of Aerology participates since 1994 in the European Stratospheric ozone campaigns: SESAME, THESEO and O3-LOSS in the Match programme (evaluation of ozone chemical destruction in Polar Vortex). At Legionowo, during the winter/spring months, ozone soundings are performed more frequently, two or three times weekly, according to expected ozone deficiencies over Poland.
Since 2005 IMWM has been participating in the ENVISAT/SCIAMACHY atmospheric profiles validation programme. At the days, when the ENVISAT satellite orbit passes over Poland, additional ozone soundings are performed.
The results are submitted operationally to the Data Base at NILU (Norway). The ozone research studies focus continuously on the long term changes (trends) in ozone profile in connection with the temperature profile changes and on the case studies of dramatic stratospheric ozone deficiencies, observed with growing frequency during the last years in winter/spring months. These cases are connected either with the excursions of Polar Vortex into the midlatitudes, either with European ozone "mini-holes". The dynamical background of appearance of these cases over Poland is studied.

220
During the last years, the ozone and UV research activities were directed mainly on UV forecasting. For that reason, several studies have been performed on: short term day to day changes of total ozone; the relation of total ozone to atmospheric characteristics (tropopause, geopotential heights, etc.); validation of total ozone derived from NOAA/TOVS satellite with dobson total ozone; elaboration of a method of one-day total ozone forecast; radiative transfer modelling and adaptation of libRadtran model to local conditions; sensitivity of UVR on ozone profile, clouds and albedo. In the years 1996-2000 IMWM participated in the UVRAPPF EC project and in the COST-713 Action - UV forecasting.On the base of these research experiences a method of UV Index forecast for Poland has been worked out and implemented operationally.In the years 2002-2004 IMWM participated in the EDUCE EC project and since 2004 has been participating in the COST 726 Action.
Public information
Since 1999 the UV Index forecast for Poland has been available from May to August on www.imgw.pl. One of the key tasks of COST-713 Action - UV forecasting was the development of efficient methods for dissemination of the UV Index forecasts and for warning the public against the possible detrimental health effects. A booklet "UV Index for the Public" was prepared (with Polish participation) and published in 2000 (EC publications). In 2001 a Polish version of the booklet, "Indeks UV a cz owiek", was prepared and published by the IMWM, sponsored by the Chief Inspection for Environmental Protection.
POLISH ACADEMY OF SCIENCES - INSTITUTE OF GEOPHYSICS
Monitoring
Measurements are carried out at the Belsk Observatory (51° 50' N. 20° 47'E). Since 1963 total ozone measurements and Umkehr series have been performed by means
of the Dobson spectrophotometer. In 1991 Brewer spectrophotometer was installed. Total ozone and Umkehr profile series have been re-evaluated in 1983 and 1987 respectively. The Dobson and Brewer spectrophotometers are regularly calibrated. The recent calibration of the Dobson instrument took place in 2005 at Hohenpeissenberg, and Brewer instrument was calibrated against Brewer#17 maintained by International Ozone Corporation in 2005 at Hradec Kralove.
The ozone data are regularly submitted to the WMO Data Centre in Toronto. The mean daily values of total ozone are also submitted operationally to the Laboratory of Atmospheric Physics, Aristotle University of Thessaloniki, Greece, and to the World Ozone and UV Data Centre in Toronto.
Systematic measurements of ground level ultraviolet solar radiation (UV-B) with the Robertson-Berger meter have been carried out since 1975. In 1992 UV Biometer SL501A was installed. Spectral distribution of UV radiation has also been monitored with the co-located Brewer spectrophotometer.
The surface ozone measurements with Monitor Labs, ML8810 meter started in 1991, and since 1992 NOx measurements have been performed with Monitor Labs, (ML8841) meter.
Research
The ozone research activities mainly focus on statistical analyses (trends) on local and global scale, and methodology of ozone measurements. The changes in the ozone layer over middle altitudes are examined in connection with changes in the dynamic factors characterising the atmospheric circulation in the troposphere, the lowermost stratosphere, and the stratospheric overworld. The problem of the gradual recovery of the ozone layer in the atmosphere is alsoinvestigated. The study is focused on the role played by the dynamical factors in ozone variability,

221
because natural dynamical processes in the Earth’s atmosphere can perturb the recovery of the ozone layer.
Factors influencing the UV radiation (ozone content, aerosol, cloudiness) are studied, with particular emphasis on the response of UV radiation to forcing factors, at various time scales. The Belsk UV data series is the longest time series of UV measurements in Europe and similarly to ozone series is a subject of intensive study. In the studies of the UV-B variability advanced statistical methods such as wavelet decomposition and multivariate adaptive regression spline are used.
Future plans of ozone and UV activities in Poland
Participation in the COST 726 Action. Participation in validation of OMI instrument on board of Aura satellite. Participation in the ENVISAT/SCIAMACHY ozone profile validation programme. Implementation of an operational monitoring of UV Index from the IMWM network on the web-page.Implementation of the DigiCora III/RS92 system to ozone soundings. Participation in preparation of the Scientific Assessment of the Ozone Depletion 2006.
****
222
RUSSIAN FEDERATION
OBSERVATIONAL ACTIVITIES
The routine observations of atmospheric ozone include total ozone measurements, vertical profile and surface ozone observations.
Column measurements of ozone and other gases variables relevant to ozone loss.
Daily measurements of column ozone are made by ozone network of Roshydromet service using filter instruments M-124 and by Roshydromet and RAS reference ozone points using Dobson, Brewer and SAOZ instruments. Network included 32 stations on the territory of the former USSR and is technically and methodically, including metrology, maintained by the Voeikov Main Geophysical Observatory (MGO). Observational data from the stations are transmitted to the Central Aerological Observatory (CAO). The CAO archives, accomplishes quality assurance of the data, analyze and monitoring daily ozone fields. The data are also transmitted to the MGO where experts responsible for the status of the network’s instruments analyze them. In routine manner the ozone data are transmitted to the WMO World Ozone and UV Centre in the Environment Service of Canada. Quarterly report “Ozone amount over Russia and the neighbouring territories” are regularly published in the journal “Meteorology and Hydrology”. Roshydromet publishes the status of the ozone layer in the annual edition of the “Overview of the environment pollution in the Russian Federation”.
Profile measurements of ozone and other gases variables relevant to ozone loss.
Ozone profile measurements are made daily since May 2002 by CAO using space observing system Meteor-3M/SAGE III in the frame of US-Russian cooperation, by CAO using balloon ozone sounding during the winter and spring periods at the Yakutsk and Salekhard (67N, 67E) stations, by Lebedev Physics Institute of Russian academy of Science (LPI RAS) at Moscow and Institute of Applied Optics RAS using microwave (142.2 GHz) radiometers. Institute of Optics of Atmosphere (IOA) RAS conducted the regular observations of ozone, nitrogen dioxide and aerosol profiles using lidar.
To processed Meteor-3M/SAGE III raw data CAO developed the algorithm that provide atmospheric transmission profiles for all 86 SAGE III spectral channels and then vertical profiles of ozone in the region 10-80 km, nitrogen dioxide and aerosol extinction in the region 10-40 km /Yu.A. Borisov et al., 2005/.
UV measurements
The Lomonosov Moscow state University made monitoring of the surface UV radiation using the UVB-1 radiometer since 1999. The Brewer instruments located at the Yakutsk station and Obninsk were calibrated to measure the spectral distribution of the surface UV radiation. NPO “Typhoon” (Obninsk) uses Brewer instrument for regular monitoring of UV radiation.
Calibration activities
The Dobson instrument # 107are calibrated with 4 years period, the last one was in June 2003. Calibration is conducted in the European regional centre of the calibration of Dobson's instruments, located in Hohenpeissenberg, Germany. The three Brewer instrument were calibrated by IOS Canada in 2003 and there is a grant from Ministry of education, science and technology of Russian Federation to realize calibration of four instruments on August 2005.

223
Ozone measurements in troposphere
The regular measurements of surface ozone continue at The Kislovodsk, Moscow, Dolgoprudny, Lovozero, Tomsk and Mondu stations. The most prolonged measurements are taken at the mountain scientific station Kislovodsk (2070 m above sea level) from March 1989. This station has noticeable position in the system of the global monitoring of surface ozone – it is located in the region with the steady climate (Elansky N.F., 2004, Tarasova A.O. et al. 2003). At the station are fixed some prolonged anomalies of the content of ozone, contrasted on the sign to the anomalies, which were being observed at the Alpine stations. This is forces to assume that long-term changes in ozone are closely related with the variability of large-scale circulation (Elansky at al., 2002).
The institute of physics of the atmosphere, the German Max Planck institute of chemistry and CMDL NOAA continued a series of experiments TROIKA. The railroad carriage-laboratory, that is equipped with the automated complex equipment, provides in the Russian territory measurements of surface ozone, reactive gases, greenhouse gases, ozone depleting and other volatile compounds; ; concentration and the microphysical and chemical properties of aerosol; temperature profile in layer 0-600 m, meteorological parameters, solar radiation and also remote measurements of nitrogen dioxide and ozone profiles in the stratosphere.
RESULTS FROM OBSEVATION AND ANALYSIS
Column ozone
The detailed analysis of global changes in the ozone layer was conducted, in essence, according to the data of TOMS instrument. During the period of 1979 – 2002 the reduction in the average annual value of total ozone in the region extratropical latitudes with an average speed of about 2% per annum is noted. In the northern hemisphere an increase in frequency and amplitude of the negative anomalies of the total ozone in the period 1987-1997 occurred. During this period in the high latitudes of the northern hemisphere the total ozone deficiency amounted to 40%, the duration of anomalies reached to 2 months, while into 1995 and 1997 anomalies were extended almost to half of the territory of Russia. During the last ten years practically everywhere, with exception of the high latitudes of the southern hemisphere, the slow growth of total ozone occurs to the values, close to typical ones for the middle of 1970. The process of an increase of ozone in the northern hemisphere and on the territory of Russia appeared, in particular, in the significant decrease of the basic negative ozone anomaly of the hemisphere – of "spring Yakut" which approximated to Antarctic ozone hole according to such indices as area, duration and the deficiency of ozone, in the separate years.
The mean-zonal sliding trends of total ozone were determined according to the TOMS data in the period from November 1978 through December 2003 (Fig.1).

224
Figure 1: The time dependence of the mean-zonal (on the 5-degree latitudinal belts) sliding trends of total ozone (in the percentages in 10 years) during the 11-year period according to the TOMS data in the period from November 1978 through December 2003. Years on the horizontal axis correspond to
mean value of the 11-year period, vertical axis – latitude /Zvyagintsev A.M. et al, 2002a/.
Ozone profile
The processed Meteor-3M/SAGE III data registered powerful polar stratosphere clouds in the period from the end of December 2004 through February 2005 in the zone of 65-75 degrees of north latitude. Maximum optical cloud thickness was located at heights of approximately 20 km and was observed at temperatures below – 80°C. Under these conditions the extinction of semi-transparent stratosphere clouds exceeded the background values of the aerosol extinction for two orders. The presence of clouds was accompanied by the significant decrease of ozone concentration (Yu. Borisov, Central Aerological Observatory).
Figure 2: Extinction of the aerosol at the height of 20 km for 385nm and 1550nm wavelength. Meteor-3M/SAGE III January-February 2005, 65-75 N.
The analysis of long-term changes in the ozone vertical distribution by balloon sounding stations (Resolute, Cherchil, Edmonton, Goose Bay, Hohenpeissenberg, Payerne, Sapporo, Boulder, Tateno, Kagoshima, Hilo - for all period of measurements no less than 15 years) and

225
temperature profile for the period from 1970 to 2002 was made. The method of 11-years sliding trend calculation was used. The strongest decrease of the ozone partial pressure in the North hemisphere was detected in the region directly above the tropopause in the lower stratosphere during the period from the end of the late seventies to the early ninetieth last century. The decrease of the ozone partial pressure exactly in this region of heights caused the main contribution to total ozone decrease in the North hemisphere. The correlation between ozone amount and the tropopause height indicates on the relationship between long-term changes of the ozone layer and climate change/Zvyagintsev et al. 2005a/.
The analysis of data of balloon ozone sounding at Yakutsk and Salekhard stations made it possible to obtain the estimation of the chemical destruction of stratospheric ozone in the winter Arctic circumpolar vortex /Tsvetkova N.D., 2002,.2004/. So in 2005 was fixed the record value of the chemical destruction of ozone in the stratosphere, which reached 116 Dobson units in total ozone value.
Measurements conducted by IOA RAS during 1999-2002 in the conditions of the long-term background state of the atmosphere were used for the improving the models of the ozone and aerosol vertical distributions.
Ozone in the troposphere
The effect of the long-range transport of ozone and its predecessors to the content of ozone at the Lovozero and Kislovodsk background stations is estimated. The influence was discovered of anthropogenic pollution from Central Europe and Western Europe on both stations and influence of the ejections of the mineral aerosol of North Africa to the content of ozone at the Kislovodsk mountain station.
According to the results of the analysis of surface ozone in the territories of Russia and Europe the conclusion is made that the changeability of ozone in Russia is defined by the same factors as in Europe, but the influence of meteorological conditions in Russia is more strong because of the smaller level of pollution /Zvyagintsev A.M. et al, 2002/.
The analysis is carried out of the worldwide network observations of surface ozone and vertical distribution of ozone in the troposphere during the recent several decades. The conclusion is made that the interpretation of the long-term changes of the ozone in the troposphere must carry out together with changes in the meteorological parameters, first of all in temperature /Zvyagintsev A.M. et al, 2005b/.
THEORY, MODELLING AND OTHER RESERCH
MGO developed the 3D transport-photochemical model of the stratosphere. The ozonosphere changes caused by Montreal Protocol realization were estimated The model calculations demonstrate that during period of 1992-2002 the ozone layer evolution depends of the current meteorological situation for the most part and only 1-2% was caused by implementation of the Montreal Protocol /Egorova T.A. et al., 2003/.
The estimations of the ozone decreasing during spring 1993-1996 and 2002 over the Antarctic are conducted. For calculation the assimilated meteorological reanalyzed UKMO data were utilizes. Successful description of the heterogeneous photochemical processes allow to achieve a good agreement with the results of observations made at the Syowa (Japan), Marambio (Argentina) and Amoodsen-Scott stations and also render the unique behaviour of the ozone hole in 2002 /Ozolin Yu.E. et al., 2003/.
At the Novosibirsk State University the calculation of natural and anthropogenic factors to long-term changes in the ozone layer in the last decades of the 20th century is studied using a numerical two-dimensional ozonosphere model with self-consistent calculation of photochemical, radiative, dynamic, and microphysical processes. Changes in the ozone layer calculated from data

226
in anthropogenic pollution, 11-year solar UV flux variations, and volcanic eruption agree quite well with the global ozone trends observed in the last 25 years of the 20th century (Demidov I.G. et al., 2005).
Studies are carried out on the development of the methods of processing and analysis of data of IR- sounder IASI of high spectral resolution. This instrument is intended to launch on the future European meteorological satellite. The method of evaluating the vertical distribution of ozone according to information IASI is proposed (Uspensky A.B. et al., 2003)
Within the framework of project TRIDES it is shown that the predecessors of the toxic chlororganic connections, which are formed with the participation of ozone, are not only the anthropogenic pollution, but also the products of the vital activity of the halo-bacteria, that live in salt waters of Caspian and Aral Seas and lakes of Central Asia /L. Weissflog et al., 2005/.
The estimation was carried out of the emission of ozone depleting substances in the territory of Russia according to observations of the TROIKA experiment. It is shown that the emissions of such substances are small, with exception of Freon -12 /D.F. Hurst et al.,2004/.
DISSEMINATION OF RESULTS
Data reporting
The M-124 network observations of the total ozone are daily transmitted to the WOUDC. The results of observations by Dobson instrument #107 (Dolgopruny) and by Brewer (Yakutsk) instrument are monthly transferred in WOUDC. Total ozone data base of Brewer observation at the Kislivodsk station was transferred in WOUDC. Observational data of SAOZ instrument located at the Salekhard are transferred once a week to the French centre of SAOZ data collection. Data of balloon ozone sounding at the Salekhard and Yakutsk stations during the winter-spring period of 2003, 2004 and 2005 are represented into the NILU data base.
Information to the public
A technology for UV forecasting on the Russian territory was developed. The technology utilizes the M-124 network observations, satellite (METEOSAT) cloud cover and surface albedo data to retrieve current and forecast the next day UV-B surface radiation. Technology is used irregularly, only in the case of the strong negative anomalies of total ozone.
Relevant scientific papers
Egorova T.A., Rozanov E.V., Zubov V.A., Karol I.L. Model for ozone trend investigations: brief description and validation //Proceedings of the RAS. Atmospheric and Oceanic Physics, 2003, V39 Suppl.3, P.310-326 (In Russian).
Ozolin Yu.E., Karol I.L., Kiselev A.A., Zubov V.A. Trajectory modeling of transport and photochemistry of the air masses in the Antarctic stratospheric polar vortex// Proceedings of the RAS. Atmospheric and Oceanic Physics, 2003, V39 Suppl.4, P.492-504 (In Russian).
Demidov I.G., Zadorozhny A.M. Contribution of Natural and Antropogenic Factors to Long –Term Changes in the Earth’s Ozone layer zt the End of the 20th Century// Proceedings of the RAS. Atmospheric and Oceanic Physics, 2005, V41 Suppl.1, P.51-65 (In Russian).
Zvyagintsev A.M., Kruchenitsky G.M., Chernikov A.A. Changes of the vertical ozone distributions in the stratosphere and there correlation with tropopause height changes// Proceedings of the RAS. Atmospheric and Oceanic Physics, 2005a, V41 Suppl.4, P.1-10 (In Russian).
Tsvetkova N.D., H.Nakane, Luk’yanov A.N., Yusjkov V.A., Dorokhov V.M., Zaitsev L.G., and Sitnikova V.I. Estimation of the winter-spring rates of ozone depletion within the Stratospheric Arctic Cyclone in Siberia in 1995-200 from balloon measurements// Proceedings of the RAS. Atmospheric and Oceanic Physics, 2002, V38 Suppl.2, P.211-219 (In Russian).

227
Tsvetkova N.D., H.Nakane, Yusjkov V.A., Luk’yanov A.N., Dorokhov. Estimation of the contribution of the chemical destruction of ozone to its total amount in Arctic polar vortex in the winter- spring period of 2000//Meteorogy and hydrology, 2004, No 10, P.56-63 (In Russian).
Borisov Yu.A., Bankova T.V., Ivanovsky A.I., Chayanova E.A., Glazkov V.N. METEOR-3M/SAGE III: Algorithm, Results & Validation//Proceeding of the 31 International Symposium on remote Sensing of Environment, St. Petersburg, 2005.
Elansky N.F. Atmospheric ozone studies in Russia in 1999-2002// Proceedings of the RAS. Atmospheric and Oceanic Physics, 2004, V40 Suppl.4, P.567-576 (In Russian).
Tarasova O.A., Elansky N.F., Kuznetsov G.I., Kuznetsova I.N., Senic I.A. Impact of air transport on seasonal variations and trends of surface ozone at Kislovodsk high mountain station // J. Atm. Chem. 2003, Vol. 45, P.245-259.
Uspensky A.B., Romanov C.V., Trotsenko A.N. Simulation of remote measurements of the vertical distribution of ozone in the atmosphere according to the data of the satellite IR sounder of highly spectral resolution. Exploration of the Earth from space, 2003, Vol.1, P.49-57 (In Russian).
Zvyagintsev A.M., Kuznetsova I.N. Changeability of surface ozone in the environments of Moscow: the results of ten-year regular observations // Proceedings of the RAS. Atmospheric and Oceanic Physics, 2002, V38 Suppl.4, P.486-495 (In Russian).
Zvyagintsev A.M., Kruchenitsky G.M., Chernikov A.A. Long-term changes in the content of ozone in the troposphere //Proceedings of the RAS. Atmospheric and Oceanic Physics, 2005b, V41 Suppl.1, P.47-58 (In Russian).
L. Weissflog, C.A. Lange, A. Phenningsdorff, K.Kotte, N. Elansky, L. Licitzyna, E. Putz, G. Krueger,Sediments of salt lakes as a new source of volatile highly chlorinated C1/C2 hydrocarbons //J.Geoph. Res.Lett. Vol. 32. L01401, 2005.
D.F. Hurst, P.A. Romashkin, J.W. Elkins, E.A. Oberlander, N.F. Elansky, I. B. Belikov, I.G. Grandberg, G.S. Golitsyn, A.M. Grisko, C.A.M. Brenninkmeijer and P.J. Cruzen. Emissions of ozone-depleting substances in Russia during 2001 //J.G.Res.V.109, D14303, 2004.
PROJECTS AND COLLABORATION
US-Russian Meteor-3M/SAGE III project. European project QUOBI. European project SCOUT-03. TRIDES Project.
Agreement between Roshydromet and Finnish Meteorological Institute (item 2. Stratospheric ozone and UV radiation measurements)
FUTURE PLANS
To continue monitoring the total ozone and vertical distribution of ozone with the use of ground-based, balloon and satellite observation facilities.
To develop together with the Belarus' country satellite spectrophotometer SFM -2M intended for the measurements of the vertical profile of ozone in the upper troposphere, the stratosphere and the mesosphere.
In order to equip ozone network stations with the instruments of contemporary level, MGO developed and prepared the experimental sample of ozone UV- spectrometer for measuring the column ozone, the spectral composition of the UV radiation, the optical density of aerosol, etc. Spectrometer is developed on basis of diffraction grating and CCD and it separates the spectrum of radiation in the range 230-420 nm with the 0.9 nm resolution.
****

228
SLOVAKIA
Atmospheric ozone and UV-B monitoring is mainly conducted by the Slovak Hydrometeorological Institute (SHMI). Research is mostly carried out by the Geophysical Institute of the Slovak Academy of Sciences (GISAS).
OBSERVATIONAL ACTIVITIES
Column measurements of ozone
Total column ozone measurements have been performed by the Centre of Aerology and Ozone Measurements (CAOM) of SHMI since August 1993. The Global Ozone Observing System (GOOS) station No. 331 is situated at Poprad-Ganovce (49.03N, 20.32E, 706 m altitude). The Brewer ozone spectrophotometer MKIV No.097 is used for routine measurements. Poprad-Ganovce is Global Atmosphere Watch (GAW) regional station for total column ozone monitoring.
Ground level ozone is monitored at about 20 stations. Activities have been outlined in the Report of the Fifth Meeting of the Ozone Research Managers and will not be discussed in this report.
Profile measurements
Umkehr vertical ozone profiles are measured with the Brewer spectrophotometer by proper weather conditions in the morning.
UV measurements
Broadband measurements
At present the Slovak UV-B network consists of five stations. Four of them are equipped with SOLAR Light 501 UV Biometers. Three stations belong to SHMI (Kosice, 48.70N, 21.27E, 230 m altitude, in operation since 1997, Bratislava 48.17N, 17.12E, 287 m altitude, since 1998, Poprad-Ganovce, since 1999) and one station situated in mountains belongs to GISAS (Skalnate Pleso, 49.20N, 20.23E, 1778 m altitude, since 2001). GISAS also measures the global ultraviolet radiation with Eppley UV-radiometer model TUVR for the wavelength range 290-385 nm located at Stara Lesna (49.15N, 20.29E, 808 m altitude, in operation since 2002).
Narrowband filter instruments
No UV narrowband instruments are installed at SHMI and GISAS stations.
Spectroradiometers
Spectral measurements of the solar UV-B radiation (in the region 290-325 nm at 0.5 nm increments) have been performed with the Brewer spectrophotometer at Poprad-Ganovce since August 1993. Observations are scheduled at regular time intervals. Poprad-Ganovce is GAW regional station for spectral UV-B monitoring.
Calibration activities
The Brewer No.097 is regularly calibrated against World Travelling Standard Brewer No.017 every two years. Since the last Meeting of the Ozone Research Managers the instrument has taken part in two international comparisons and calibrations (Warsaw 2003, Hradec Kralove 2005).

229
The CAOM maintains the SL 501 UV Biometer designated as the national reference instrument. The instrument was compared with the Czech reference UV Biometer during the Brewer calibration campaign in Hradec Kralove in May 2005. In June all network UV Biometers in Slovakia were calibrated with the reference instrument.
UV-B data series from Bratislava (1997-2004) and Poprad-Ganovce (1999-2004) have been recalculated according to calibration results.
RESULTS FROM OBSERVATIONS AND ANALYSIS
Figure 1 shows monthly means of total column ozone, UV-B dose and sunshine duration at Poprad-Ganovce. Small negative trend in total column ozone and positive trends in UV-B dose and sunshine duration have been observed during the period 1995-2004.
THEORY, MODELLING AND OTHER RESEARCH
The effect of total ozone change on the biologically effective UV radiation has been studied using total ozone and spectral UV radiation measurements of the Brewer instrument and broadband UV-Biometer measurements at Poprad-Ganovce. The clear-sky morning UV-B irradiances (recalculated to mean Sun – Earth distance) were interpolated to fixed solar zenith angle (SZA). The obtained values of radiation amplification factor (RAF) were compared with that ones calculated from total ultraviolet visible radiation model (TUV model, Madronich, 1993). Good agreement between the RAF obtained from measurements and the RAF calculated by TUV model was achieved for large SZA 50˚ and 60˚.
Atmospheric aerosol change effect on the biologically effective UV radiation was studied using aerosol optical depth (AOD) for radiation at wavelength 320.1 nm (AOD320). AOD320 was calculated by Langley plot method from direct monochromatic solar irradiance observed by Brewer spectrophotometer during the period 1993-2002.
Fig. 1 Total Column Ozone, UV-B Dose and Sunshine Duration at Poprad-Ganovce 1995-2004
y = 0.1697x + 156.17
y = -0.0154x + 327.25
y = 0.0208x + 42.726
0
50
100
150
200
250
300
350
400
450
1995 1995 1996 1997 1998 1999 2000 2000 2001 2002 2003 2004
Year
UV
Do
se [
(J/m
**2)/
1000]
To
tal O
zo
ne [
D.U
.]
-200
-100
0
100
200
300
400
500
600
700
Su
ns
hin
e D
ura
tio
n [
ho
ur]
Ozone UV-B Dose S.D. Linear (S.D.) Linear (Ozone) Linear (UV-B Dose)
1995 1996 1997 1998 1999 2000 2001 2002 2003 2004

230
Sensitivity of the biologically effective radiation to the surface albedo change was determined using comparison between clear-sky UV-B irradiances observed under condition with continuous snow cover and without any snow cover at selected localities – Poprad-Ganovce (valley position), Stará Lesná (foothill of the High Tatras mountain) and Skalnaté Pleso (mountain conditions). UV-B data were recalculated to fixed total ozone content (300 DU) and to mean Sun – Earth distance.
Effect of altitude on the UV-B radiation has been investigated using comparison between UV Biometer data obtained at localities with significantly different altitude and relatively small horizontal distance.
Cloud effect on the UV-B radiation was studied using Brewer spectrophotometer measurements and cloud characteristics saved in Brewer commentary files.
A present research is oriented on determination of relations between solar UV-B radiation and meteorological and radiative proxies to model UV-B radiation in the past (COST-726 project).
DISSEMINATION OF RESULTS
Data reporting
The Brewer data are submitted to the World Ozone and Ultraviolet Data Centre (WOUDC) in Toronto every month. Total ozone and UV-spectral raw data are monthly submitted to Brewer Data Management System (BDMS) in Toronto to process and submit it to WOUDC. Since winter 1993 the station participate in WMO GAW Northern Hemisphere Ozone Mapping Experiment by daily submitting of total ozone data to Ozone Mapping Centres.
Information to the public
The report on present state of ozone layer and intensity of solar damaging UV radiation (Erythema effect) for sunny day is sent to Slovak Press Agency twice a day. It is regularly utilized by television, broadcast and newspapers.
CAOM Poprad-Ganovce also has been preparing short report on the total ozone amount and recommended maximal sunburn time. This report is propagated by mobile telephone service.
SHMI provides regular total column ozone and UV Index (March-September) forecast. It is propagated by SHMI Web site.
Ministry of Environment and SHMI have equipped big cities with electronic billboards. Both total and surface ozone data are included into presented information.
The analyze of total ozone, surface ozone and solar UV radiation is regularly included in the annual publication: "Air Pollution in the Slovak Republic".
Relevant scientific papers Please see references.
PROJECTS AND COLLABORATION
SHMI participate in international ozone and UV projects mainly by regular submitting of the good quality ozone and UV-B data to the WOUDC.
At national level the task: "UV Biometer calibration methodology and UV-B observation series reconstruction" is solved at SHMI and the project: "Effect of atmospheric boundary layer on radiative fluxes and heat balance of Earth’s surface" has been solved at GISAS.
231
Both projects are included into COST action 726: "Long term changes and climatology of UV radiation over Europe"
FUTURE PLANS
Improvement of the UV Index forecast involving atmospheric aerosol effect on the UV-B irradiance variability. It needs precise measurements of aerosol optical depth in the UV range of the solar spectrum.
Determination of relations between UV-B radiation and meteorological (cloudiness, aerosol content, snow cover) and radiative (total solar radiation, sunshine duration) proxies to asses UV-B irradiance at different places in Slovakia at present and in the past
Participation in international calibration of broadband instruments planned for 2006 in frame of COST action 726.
Looking for a relevant partner to study some aspects of the damaging solar UV radiation impact on human health.
NEEDS AND RECOMMENDATIONS
Regular international comparison of broadband UV radiometers is extremely needed to keep the homogeneous scale.
References
Pribullová, A., 2002: Spectral UV aerosol optical thickness determined from the Poprad-Gánovce Brewer spectrophotometer observations. Contributions to Geophysics and Geodesy, 32/3, 291-307.
Pribullová, A., 2004: Solar UV-B radiation in the High Tatras Mountains, Proceedings of the XX Quadrennial ozone symposium, Ed. Ch. Zerefos, 1 - 8 June 2004, Kos, Greece, 2004, 1140-1141.
Pribullová, A., Štefánik, J., 2004: Effect of snow cover, altitude and clouds on the solar ultraviolet radiation, Proceedings of the International bioclimatological workshop - Climate change - weather extremes, organisms and ecosystems, Ed. B. Šiška, 23 -26 August 2004, Vini ky, 2004, CD ISBN 80-8069-402-8.
Pribullová, A., Chmelík, M., 2005: Effect of altitude and surface albedo variability on global UV-B and total radiation under clear-sky condition. Contributions to Geophysics and Geodesy, 35/3, in press
****

232
SOUTH AFRICA
INTRODUCTION AND OBSERVATIONAL ACTIVITIES
The South African Weather Service (SAWS), an agency of the Government Department of Environmental Affairs and Tourism, is the national focal point of ozone monitoring and research activities in South Africa. These activities are greatly enhanced by collaboration with a few centers involved but mainly the Universities.
The ozone monitoring and research activities are conducted within the context of the World Meteorological Organizations (WMO) Global Atmosphere Watch (GAW) programme. The Global Atmosphere Watch component of the South African Weather Service (SAWS), as part of its Public Good Service, are conducting certain specialized atmosphere monitoring and research services for the Department of Environmental and Tourism Affairs (DEAT), in order for the Department to fulfill its national, regional and international obligations. The Department has the responsibility for implementing the Montreal Protocol and facilitates the coordination role with industry. South Africa is dealing effectively with its commitments under the Protocol.
The depletion of the stratospheric ozone layer, increases in troposphere ozone, higher levels of acidity in rain, rising carbon dioxide and methane concentrations, and changes in the radiative balance of the earth-atmosphere energy system - all reflects the increasing influence of human activity on the global atmosphere, the life-support system of planet Earth. Environmental issues and policy matters have to play a pivotal role in meeting the developing needs and challenges of the people in a new democratic South African Society. Clauses in protecting and respecting the environment in a sustainable context, is embedded in the South African Constitution.
Worldwide it is proven that sustained systematic observation only survives under the auspice and responsibility of a Government. More and more of these specialized environmental monitoring activities are shifted towards the responsibilities of National Meteorological Services. This is undoubtedly a core service resulting from international agreements undertaken by government of the Republic of South Africa.
Figure 1: Regional Networks.
CAPE POINT, GLOBAL GAW STATION – TRACE GASES IRENE AND SPRINGBOK – OZONE DOBSON # 89 AND # 132 (IRENE SHADOZ SITE) DE AAR - BSRN STATION - SOLAR RADIATION NATIONAL UV-B REAL TIME MONITORING NETWORK

233
Column measurements of ozone and other atmospheric variables
The first South African column ozone measurements were made during 1964 until 1972 with Dobson #089 operating from Pretoria. Reinstating South Africa’s commitment to the Vienna Convention, the Weather Service now operates two Dobson ozone spectrophotometers, #089 at Irene near Pretoria (25.9 S, 28.2 E) since 1989, and #132 at Springbok (29.7 S, 17.9 E) since 1995. Both these instruments have been regularly calibrated with reference to the world standard.
A WMO/GAW International Comparison of Dobson Spectrophotometers (SAWB2000IC) was organized by the World Meteorological Organization and the South African Weather Service in close cooperation with the USA National Oceanic and Atmosphere Administration’s Climate monitoring and Diagnostics Laboratory (NOAA/CMDL). This first Africa, WMO Region-I Intercomparison event was conducted in Pretoria from 18 March – 10 April 2000. In addition the Czech Republic Hydro meteorological institute continued to provide expert assistance to southern African training of Dobson operators.
The South African Dobson observation programme includes daily total ozone measurements (mostly high quality direct sun observations), and weekday Umkehr observations during sunrise. On average 500 total ozone readings per month are collected, and weather permitting between 10 and 15 Umkehr measurements. Final Umkehr results are still hampered by the inadequate knowledge that exists within our institution and collaboration partners are seeked for assistance.
Since November 1998, the Weather Service has been fortunate to reinstate its ECC RSG80-15GE Ozonesonde sounding programme, which operated during the period 1990 until 1993. Weekly ozonesonde soundings are conducted. This data is shared with the Southern Hemisphere Additional OZonesondes (SHADOZ - http://croc.gsfc.nasa.gov/shadoz/ ) programme from NASA, USA, which also is submitted to WOUDC. Since 2000, the Irene ozonesonde station was officially accepted into the SHADOZ network. The Irene Ozone Launching programme also now forms part of the AURA validation of OMI/TES and data after each launch is submitted in near real time.
Surface ozone measurements are undertaken at Cape Point since 1982. Our programme has also extended surface ozone measurements to the South African National Antarctic Expedition Base (SANAE IV) in Antarctica since December 2003. The SAOZ instrument which operated at SANAE during early 1990’s, has be refurbished at LSCE, CRNS, France and it is expected to be re-instated at SANAE in December 2005.
Other gases and profile measurements
The pristine location of Cape Point (34.3S, 18.5E) enables measurements to be made in air that has passed over the vast clean Southern Ocean. Such long-term observations are representative of background conditions, making it possible to detect changes in the atmospheres composition. The Cape Point GAW Laboratory is also scientifically twinned with a research partner, namely the Fraunhofer Institute for Atmospheric Environmental Research (IFU) in Garmisch, Germany, now IMK-IFU (Forschungszentrum Karlsruhe).
Measurements include a wide range of parameters namely: - surface O3, gases which lead to stratospheric ozone depletion such as: CFCl3, CCI2F2, CCI2F-CClF2, CH3CCl3, CCl4 and N2O, greenhouse gases in the troposphere such as CO, CO2, and CH4. UV-A and UV-B and global radiation (total and diffuse) are also measured as well as the normal surface meteorological parameters. Radon measurements to assist with the classification of air masses arriving at Cape Point, have been successfully established over the last five years. Regular scientific audits from EMPA, Switzerland for surface O3, CO and CH4 have been successfully conducted over the past seven years. Last year, the WCC-N2O (IMK-IFU and Umweltbundesamt) conducted and audit for N2O at Cape Point.

234
Ultraviolet-B measurements
Since January 1994 the Weather Service has maintained a routine programme for monitoring erythemally weighted UV-B radiation at Cape Town (34.0S, 18.6E), Durban (30.0S, 31.0E) and Pretoria (25.7S, 28.2E), De Aar (30.7S, 24.0E) and Port Elizabeth (33.9S, 25.5E). The equipment used in this network is the Solar Light Model 501 Robertson-Berger UV-Biometer. The programme was motivated by and in collaboration with the School of Pharmacy at the MedicalUniversity of Southern Africa (MEDUNSA), near Pretoria.
Since December 2001, the UV-Biometers are directly linked on the Services wide area network, and available in real-time on the SAWS WWW-site. UV-B forecasts are also issued for the Cape Town, Durban and Pretoria-Johannesburg metropolitan areas since 1 December 1997. The main purpose of the UV-Biometer network is to make the public aware of the hazards of excessive exposure to biologically active UV-B radiation, and it contributes to the schools awareness programmes for education. Regular enquiries from scholars are dealt with to satisfy their need to acquire more ozone and ultraviolet radiation knowledge. Two UV-B narrow-band (~306nm) Kipp & Zonen sensors are located at the two Dobson sites to investigate possible trend correlation between ultraviolet radiation and total ozone. Great strides have been made to develop our own numerical weather predictions outputs for UV indices. Celebrations around 16 September, each year, usually focuses to create public awareness. Once a year on this day it is also dedicated to the hard working ozone observers and technicians gathering the measurements.
Figure 1: SAWS Numerical Product Developed for UV Index forecasting with cloud cover.
Calibration activities and data submissions
All primary ozone and trace gas data are submitted regularly to WMO recognized World Data centers. Dobson column ozone is submitted to WOUDC, Toronto, Canada. Since the inception of the Dobson Programmes these instruments have been internationally calibrated through inter-calibration campaigns as supported by WMO. The next all-African Dobson calibration is scheduled to take place in South Africa during 2008, currently recognized as an unofficial Regional African Calibration Centre.
Regular scientific audits from EMPA, Switzerland for surface O3, CO and CH4 have been successfully conducted over the past seven years. Last year, the WCC-N2O (IMK-IFU and Umweltbundesamt) conducted and audit for N2O at Cape Point. Next laboratory calibrations are scheduled for September 2006. The regular scientific audit from EMPA, Switzerland, continues to

235
reveal very successfully surface ozone calibrations at the Cape Point Laboratory, which also in future will serve as calibration facility for regional instruments.
RESULTS FROM DATA OBSERVATIONS
Figure 2: Only Column Total Ozone are displayed.
COLLABORATION - NATIONAL AND INTERNATIONAL
Ozone and related research are conducted sporadically within the country, mostly at a few academic institutions such as the University of Kwazulu Natal in Durban, the University of Cape Town and the University of the Witwatersrand in Johannesburg. Research interest of the effects of ultraviolet radiation amongst the medical and environmental sectors has also become more pronounced.
South African, Prof Roseanne Diab from the University of Kwazulu Natal and Mr G Coetzee of SAWS are both members of the International Ozone Commission http://ioc.atmos.uiuc.edu/ Mr G Coetzee is also a member of the established WMO-Ad Hoc committee on Dobson Operations. Prof. Roseanne Diab has been participating in many international ozone assessments, and has also been actively involved in strengthening ozone research/collaboration efforts throughout Africa. During early 2004 a very successful “African” ozone workshop was also conducted in Durban. Mr E-G Brunke of the Cape Point GAW laboratory is a member of the WMO SAG GHG.
South Africa must also acknowledge its many international collaborators with specific references to international programmes and Institutions such as:
• SHADOZ/NASA/GSFC/USA • USA NOAA CMDL • WMO - World Meteorological Organisation • WOUDC and ARQP, Toronto, Canada • GAWTEC http://www.schneefernerhaus.de/e-gawtec.htm , Germany • GAWSIS http://www.empa.ch/gaw/gawsis/ and IMK-IFU Garmisch, Germany • LSCE, CNRS and DEBITS, Paris and Toulouse, France • EML, New York, USA • NORWEGIAN – SOUTH AFRICAN BILATERAL COOPERATION • THE CZECH NHMS

236
FUTURE PLANS AND RECOMMENDATIONS
In collaboration with various research institutes we still would like to improve the general circulation models for ozone and UV-B predictions. This will increase our understanding and ability to render a more efficient public service. The Weather Service is continuing with efforts to ensure real-time data availability on the SAWS WWW- site at http://www.weathersa.co.za
The installation of spare Dobson spectrophotometers and other instruments on “permanent lease” from more Europe partners will be established to complement the Southern African and surrounding Oceans observing platforms. In December 2005, the SAOZ instrument which has been refurbished at LSCE will once again operate at the South African National Antarctic Base, SANAE IV and form part of the global network of SAOZ instruments.
Further strengthening our collaboration in the Southern African regional context to enhance monitoring and research effort such as with the establishment of the Dobson #15 at Maun, Botswana in 2004. This is where EU Partners and resources can play a significant role to assist in partnerships and collaborated projects.
The International Polar Year (IPY) also provides ample opportunity for the extension of collaboration and monitoring networks in the southern Oceans and Antarctica. Plans are being develop to enhance RSA ozone and trace gas measurement activities, to the South African National Antarctic Base at SANAE. These could also include the enhancement at the monitoring stations at Gough (40S, 10W) and Marion (47S, 37E) islands where permanent South African Weather Stations are operating.
Enhancing ozone and trace gas activities on the African continent, remains a great need and a great challenge. Many countries have expressed their willingness to participate and to become more actively involved in sustaining measurement programme in some form. The challenge, we as scientific community thus faces, is how to assist those who also needs further investment, capacity and encouragement to secure and enhance the global network. Under the auspice of the WMO GCOS programme more opportunities can also include ozone and meteorological related observation.
The small South African ozone community on this front is also committed to collaboration in our region to enhance future ozone monitoring and related parameters research activities. With this we draw inspiration from the New Partnership for Africa’s Development (NEPAD) plan.
RELEVANT RESEARCH PAPERS (co -authored)
Schmalwieser Alois W.; Schauberger Günther; Weihs Philipp; Stubi Rene; Janouch Michal; Coetzee Gerrie J. R.; Simic Stana, Preprocessing of total ozone content as an input parameter to UV Index forecast calculations, J. Geophys. Res. Vol. 108 No. D6, 2003
Brunke E-G. and Allen R.J. (1985). Measurement of atmospheric ozone and other oxidants at three localities in the Cape Peninsula, South Africa. S. A. J. of Science 81, 678-681.
Scheel, H-E., Sladkovic, R., Brunke, E-G. and Seiler, W. (1994). Measurements of lower tropospheric ozone at mid-latitudes of the Northern and Southern Hemisphere. Proceedings of the Quadrennial Ozone Symposium: June 4-13, 1992, Charlottesville, USA.
Combrink, J., Diab, R.D., Sokolic, F. and Brunke, E-G. (1995). Relationship between surface, free tropospheric and total column ozone at two contrasting locations in South Africa. J.of Atmos. Env. 29, 6, 685-692.
Oltmans, S.J., Lefohn, A.S., Scheel, H.E., Harris, J.M., Levy II, H., Galbally, I.E., Brunke, E-G., Meyer, C.P., Lathrop, J.A., Johnson, B.J., Shadwick, D.S., Cuevas, E., Schmidlin, F.J., Tarasick, D.W., Claude, H., Kerr, J.B., Uchino, O. (1998). Trends of ozone in the troposphere. Geophys. Res. Lett. 25, 2, 139
A. M. Thompson, J. C. Witte, M. T. Freiman, N. A. Phahlane, G. J. R. Coetzee, Lusaka, Zambia, during SAFARI-2000: Convergence of Local and Imported Ozone Pollution, Geophys. Res. Lett., 29, 1976, doi: 10.129/2002GL015399, 2002.

237
The 1998-2000 SHADOZ ( Southern Hemisphere Additional Ozonesondes ) tropical ozone Climate. 2 Stratospheric and tropospheric Ozone Variability and the Zonal Wave –One Authors, A M Thomson, Samuel J Oltmans, Francis J Schmidlin, Jennfer A Logan, Masatorno Fijtwara, Volker W J H Kirchoff, Franciose Posny, Gert, J R Coetzee, Bruno Hoegger, Shuji Kwakamii and Toshihiro Ogawa.
Department of Environmental Affairs and Tourism. Environmental Indicators for the National State of the Environment Reporting, South Africa 2002, and 2005 DEAT, Private bag X447, Pretoria, 0001. This contains Ozone and UV-B and other Cape Point GAW SAWS data sets. http://www.environment.gov.za
Thompson, A.M., J.C. Witte, S.J. Oltmans, F.J. Schmidlin, J.A. Logan, M. Fujiwara, V.W.J.H. Kirchhoff, F. Posny, G.J.R. Coetzee, B. Hoegger, S. Kawakami, T. Ogawa, J.P.F. Fortuin and H. Kelder, 2002. The 1998-2000 SHADOZ (Southern Hemisphere Additional Ozonesondes) tropical ozone climatology. 2. Stratospheric and troposheric and tropospheric ozone variability and the zonal wave-one. Accepted by J. Geophys. Res.
Thompson, A. M., R. D. Diab, G. E. Bodecker, M. Zunckel, G. J. R. Coetzee, C. B. Archer, D. P. McNamara, K. E. Pickering, J. B. Combrink, J. Fishman, and D. Nganga, Ozone over southern Africa during SAFARI-92/TRACE A, J. Geophys. Res., 101, 23,793-23,808, 1996
Diab, R. D., A. M. Thompson. M. Zunckel, G. J. R. Coetzee, J. Combrink, G. E. Bodeker, J, Fishman, F Sokolic, D. P. McNamara, C. B. Archer, and D. Nganga, 1996. Vertical ozone distribution over southern Africa and adjacent oceans during SAFARI-92. Journal of Geophysical Research 101 (19): 23,823.
Thompson, A. M., R. D. Diab, G. E. Bodeker, M. Zunckel, G. J. R. Coetzee, C. B. Archer, D. P. McNamara, K E. Picketing, J. Combrink, J. Fishman, and D. Nganga, 1996. Ozone over southern Africa during SAFARI-92/TRACE A. Journal of Geophysical Research 101 (19):23,793
2004 TROPOSPHERIC OZONE CLIMATOLOGY OVER IRENE, SOUTH AFRICA FROM 1990-1994 AND 1998-2001 R. D. Diab1, K. Mari1, L. Ramsay1, A. M. Thompson2 and G. Coetzee3 1School of Life and Environmental Sciences, University of KwaZulu-Natal, Durban 4041, South Africa, 2NASA/GSFC,Greenbelt, Maryland, USA , 3South African Weather Service, Pretoria, South Africa JOURNAL OF GEOPHYSICAL RESEARCH, VOL. 109, D20301, doi:10.1029/2004JD004793, 2004
131. Thompson, A. M., R. D. Diab, G. E. Bodecker, M. Zunckel, G. J. R. Coetzee, C. B. Archer, D. P. McNamara, K. E. Pickering, J. B. Combrink, J. Fishman, and D. Nganga, Ozone over southern Africa during SAFARI-92/TRACE A, J. Geophys. Res., 101, 23,793-23,808, 1996.
Thompson A M, Witte J C, Freiman M T, Phahlane N A and Coetzee G J R ‘ Lusaka, Zambia, during SAFARI 2000: Convergence of local and imported ozone pollution’, Geophysical Research Letters, 29 (20): pp 37-1-37-4, 2002.
Further Contact Information
Mr G J R Coetzee Manager: Trace gas Research and Atmosphere Change Monitoring (TRACM) South African Weather Service Private Bag X097, Pretoria, 0001, South Africa Fax: +27 12 323 4518 Tel: +27 12 309 3052, Email: [email protected]
****

238
SPAIN
OBSERVATIONAL ACTIVITIES
Continuous ozone, UV radiation and related atmospheric compounds monitoring and research is mainly conducted by the Instituto Nacional de Meteorología (INM) and the Instituto Nacional de Técnica Aeroespacial (INTA). The Departments of Physics and Meteorology of several Spanish universities do research on ozone and UV. Most of the national actions are financed by the National R+D Plan of the Ministry of Education and Science
Column measurements of ozone and other gases/variables relevant to ozone loss
The longest total ozone record in Spain (since 1980) has been obtained with the Dobson spectrophotometer #120 installed at "El Arenosillo" station (Huelva) and operated by INTA. This instrument has been used in a number of intercomparisons at Davos and is in operation at present. The latest calibration was held at Hohenpeissenberg in July 2003.
Brewer spectrophotometer national network
INM operates a national Brewer spectrophotometer network (Figure 1 and Table 1), partially financed by the National R+D Plan of the former Ministry of Science and Technology. The Brewer at the “El Arenosillo” station, financed by the Andalusian Regional Government, is managed by INTA. This network provides total ozone and spectral UV that is real-time monitored through the INM’s intranet.
Figure 1: National UV broadband radiometer and spectrophotometer network.
Since November 1999 the Brewer network has performed a common measurement schedule (ozone and spectral UV) on a daily basis. This information is stored and validated in the centralized INM database.

239
The Network for the Detection of Stratospheric Change (NDSC) Programme at the Izaña Observatory
Since 2000/2001 the Izaña Observatory has participated in the NDSC network as a complementary station in the following four programmes:
Total ozone with a double Brewer spectrophotometer managed by INM. ECC ozonesonde programme operated by INM. UV-VIS: A photodiode array Spectrograph from INTA has been running at Izaña since December 1998. This instrument is able to measure total columns of O3 , NO2 and H2O.Retrievals of Iodine monoxide (IO) are being explored to detect whether or not this radical is in measurable magnitudes in the atmosphere outside of the boundary layer. A new UV photodiode array spectrograph from INTA was installed at the Izaña Observatory in November 2001 to expand the capabilities of the previous ones to BrO. Bromine has 50 times more Ozone Depletion Potential (ODP) than Chlorine and its concentration in the atmosphere is still increasing due to Methyl Bromide (CH3Br) and Halon emissions.A UV-VIS (DOAS) spectrometer instrument (EVA) from INTA for measuring total column NO2 and O3 has been operating at Izaña Observatory since 1993. FTIR: since February 1999 a ground-based FTIR (Fourier Transform InfraRed) spectrometer (Bruker IFS 120 M) is operated at the Izaña Observatory by the Institut für Meteorologie und Klimaforschung (IMK) (Forschungszentrum Karlsruhe, Germany). Besides zenith column amounts (ZCA) of trace gases such as O3, H2O, HDO, N2O, CH4,HF, HCl, ClONO2, NO, NO2, and HNO3, profiles of gases with narrow absorption lines such as O3, NO, HCl and HF can be retrieved. In March 2005 a new FTIR spectrometer has been installed at Izaña Observatory.
Table 1: National Brewer Spectrophotometer network.
Station Location Instrument Institution Since Last calibration A Coruña 43ºN 8ºW Brewer MK-IV
#151INM Oct 1998 September 2003
Zaragoza 42ºN 1ºW Brewer MK-IV #166
INM Nov 1998 (#033) Nov 1999 (#166)
September 2003
Madrid 40ºN 4ºW Brewer MK-IV #70
INM 1988 (#033) May 1992 (#070)
September 2003
Murcia 38ºN 1ºW Brewer MK-IV #117
INM May 1995 September 2003
El Arenosillo 37ºN 6.44ºW Brewer MK-III #150
INTA June 1997 September 2003
Izaña 28ºN 16ºW 2400 m a.s.l.
Brewer MK-III #157Brewer MK-III # 183 Brewer MK-III # 185
INM
INM
INM
May 1992 (#033) July 1998 (#157) August 1995
March 2005
September 2004
September 2004
---
Santa Cruz Tenerife
28ºN 16ºW Sea level
Brewer MK-II #033
INM Oct 2000 September 2004
The Antarctic UV-VIS network
In the framework of several projects financed in previous convocations of the National R+D Plan of the Ministry of Science and Technology, three UV-VIS spectrometers (EVA) designed and developed at INTA to measure column NO2 and O3 were installed at the permanent Argentinean bases of Belgrano (77º 52' S 34º37' W), Marambio (64º 14' S 56º37' W) and Ushuaia (54º 48' S 68º19' W), respectively, in 1994. The selected stations are scientifically interesting for the study of polar atmosphere as the southernmost, which is Belgrano, is mostly located inside the vortex, Marambio on the edge, and Ushuaia right outside the vortex. A new UV photodiode array

240
spectrograph from INTA has been installed in October 2002 in Marambio (Antarctica) to retrieve zenith column amounts of BrO, OClO.
The main objective of this network is to provide both long term and near real-time observations of column O3 and NO2, in order to characterize the polar vortex. A description of the network, including instruments and stations, as well as the results of this network can be found at http://www.inm.es/mar
INTA’s station at Keflavik (Iceland)
A long-term ozonesounding programme between INTA and IMO (Icelandic Meteorological Office) is running at the subArctic station of Keflavik (Iceland, 64ºN, 22ºW). Activities devoted to monitoring the ozone layer in the region of influence of the stratospheric polar vortex started in 1991 within the First Coordinated European Experiment for Ozone depletion Studies (EASOE). Since then and to date, ozonesondes have been launched during winter through a number of European projects (SESAME, OSDOC, THESEO,QUOBI, SCOUT-O3) and will continue in the near future.
Profile measurements of ozone and other gases/variables relevant to ozone loss
The ECC ozonesonde programme was initiated in November 1992 as part of the GAW programme at Izaña Observatory. The ozonesoundings are launched from Santa Cruz de Tenerife station (36 m.a.s.l.), at a distance of 28 Km from the Izaña Observatory, on a weekly basis and without any interruption since 1992. During intensive campaigns more than twenty sondes per month are launched. This is a NDSC programme. Continuous total ozone monitoring since May 1991, including two Umkehr profiles per day (since January 1992) is performed using Brewer spectrophotometers at Izaña Observatory (see Table 1).
ECC ozonesondes have been launched on a weekly basis at Madrid by INM since 1992, although with some interruption periods. INTA operates an ozonesounding facility at the El Arenosillo station with sporadic launches. Intensive campaigns, most of them financed by European projects, are frequently carried out at the El Arenosillo station.
A long-term ozonesounding programme between INTA and DNA/IAA (Argentina) has been running at the Belgrano station (Argentina, 78ºS, 35ºW) since 1999. Since then and to date ozonesondes have been launched through a number of Spanish (MAR and “Caracterización del vórtice Antártico y transporte meridional a partir de observaciones remotas de trazadores estratosféricos”) and European projects (QUOBI).
INTA and INM have participated in previous years, and participate nowadays, through the mentioned ozonesounding stations, at Keflavik, Madrid and Tenerife in the Match Experiment coordinated by the AWI (Alfred Wegener Institute, Germany). This experiment was carried out in connection with the European projects (EASOE, SESAME (OSDOC), THESEO (O3-LOSS), EUROSOLVE). Sondes were both European and nationally financed.
UV measurements
Broadband measurements
A national UVB broadband network of 17 Yes-pyranometers (Figure 1), managed by INM, has been fully operational since July 1999. This network has been partially financed by the National R+D Plan.
The group of photobiology and algae biotechnology of the Ecology Department at Malaga University manages the “UVIFAN” UV network, based on broadband Eldonet (European Light Dosimeter Network) radiometers, in the Andalusia region. This network has been financed by the

241
EC FEDER 1FD97-0824 Project. Detailed information of this network can be found at http://uvifan.scai.uma.es/
INTA is collaborating with the Institute of Aerospace Medicine from DLR on solar UV dosimetry by biological sensors (biofilms @). The collaboration covers the measurement campaigns at different locations in Spanish and German territory and the improvement of data analysis (image treatments, unattended exposure devices, etc).
Narrowband filter instruments
Three multi-channel narrow-band radiometers (NILU-UV6) were installed by INM in the UV-VIS Antarctic stations (see section 1.1.3) in 1999, thanks to the existent agreements of scientific collaboration between INTA, INM, Dirección Nacional del Antártico (DNA/IAA) and Centro Austral de Investigaciones Científicas (CADIC, Argentina). A fourth NILUT-UV-6 runs on a continuous basis at the GAW Izaña Observatory. The NILU-UV6 instruments measure global radiation at five UV channels and PAR. A radiative transfer model is used to calculate the total ozone content, cloud transmittance and the biologically effective UV doses. These instruments are part of the Spanish Antarctic network that has been coordinated in the framework of the joint INTA-INM’s “MAR” (Measurement of Antarctic Radiance for monitoring the ozone layer; REN2000-0245-C02-01) and on-going EGEO (“Estudio de la GEnesis del agujero de Ozono y sus implicaciones sobre la radiación UV”; Reference CGL2004-05419-C02-02ANT, financed both by the R+D National Programme.
The Finnish Meteorological Institute (FMI) is in charge of the NILU radiometers’ quality assurance system performing intercomparisons twice a year with a travelling reference NILU.
The main objective of this network is to provide both long term and near real-time observations of column O3 and UV radiation in order to characterize the polar vortex.
Spectroradiometers
UV scans every 20 minutes have been obtained at the Izaña GAW Observatory from the Brewer spectrophotometers since May 1991.
A double spectroradiometer Bentham DM-150, installed in March 1999 at the GAW Izaña Observatory, provides global and diffused UV radiation scans every 15 minutes. This is one of the national UV reference instrument. Since June 2005 is also obtained direct sun UV scans. The Department of the Fundamental Physics of La Laguna University, in collaboration with INM, operates a double Bentham DM-150 spectroradiometer at the Izaña Observatory headquarters (SCO; sea level) in Tenerife. A comparison of the UV and visible spectra obtained from this spectroradiometer with those obtained at the Izaña Observatory (2400 m a.s.l.) have been used to study the connection between UV radiation and radiative properties of the atmospheric aerosols and clouds.
Episodic UV spectra are obtained by the Universities of Barcelona (Bentham DM-300), Valencia (Optronics and LICOR), Valladolid (LICOR) and la Laguna (Bentham and Optronics). Most of the measurements are used in investigations concerning the relationship between aerosol optical depth and spectral UV radiation.
Calibration activities
The WMO/GAW Regional Brewer Calibration Centre for RA-VI region (RBCC-E)
In November 2003 the WMO/GAW Regional Brewer Calibration Centre for RA-VI region (RBCC-E) was established at Izaña Observatory (IZO) at Tenerife (Canary Islands). The project is also intended to contribute to the GAW Programme in the RA-VI Region as a part of the closer co-

242
operation between WMO and the European Commission being stated in the Memorandum of Understanding signed by WMO and EC in December 2003.
IZO is located in subtropical region (28ºN) on the top of Izaña Mountain (2370 m.a.s.l.) with pristine skies and low ozone variability. This location allows routine absolute calibrations of the references in similar conditions to the Mauna Loa Observatory (MLO) site.
The RBCC-E reference is based on three double Mark-III Brewer spectroradiometers (the IZO triad): a Regional Primary Reference (B157), a Regional Secondary Reference (B185) and a Regional Travelling Reference (B183). The IZO triad is regularly sun calibrated by means of Langley method and by external lamps. The travelling reference ensures reference transference to the WMO-Region VI Brewer network.
Though B157, B183 and B185 are routinely calibrated by Langley plots method, these absolute calibrations are not used for definition of a new calibration scale. The MSC triad is respected as the official reference of the GAW Brewer international scale. The establishment of the IZO triad allows the implementation of a self-sufficient European Brewer calibration system that respects the world scale but works as independent GAW infrastructure. The IZO triad is linked to the world reference MSC triad with yearly calibrations towards the Canadian travelling reference B017. Systematic extraterrestrial constants (ETC) have been obtained by Langley method with B157 from 1998 to 2002. A comparison against ETCs transferred by travelling B017 shows an agreement within 1% in this period. This excellent result means, first of all, that IZO is an excellent site to assure independent absolute sun calibration for the Brewer network, and secondly that the process based on ETC transfer from MSC triad to the world Brewer network through the travelling reference B017, is very accurate.
The function of RBCC-E also allows development and testing of new measurement techniques for the ground Brewer network like zenith, polarimetric, UV or aerosol optical depth measurements at IZO. A dark room and an electronic workshop are available at IZO for accurate fittings and indoors calibration and maintenance of the triad instruments.
Total ozone calibrations
The Brewers (#033 and #157) at the Izaña Observatory have been intercompared with the international travelling reference Brewer#17 every year since 1991. The Brewer#17 is routinely calibrated against the World triad (Meteorological Service of Canada). Other Brewers of the network are intercompared and calibrated every two years. Last three intercomparisons were held at the El Arenosillo station in September 1999, September 2001 and September 2003 (see Table 1).
Spectral UV calibrations
Spectral UV Quality Control (QC) consists of 50W lamp tests at each station performed every 2 weeks. Spectral UV Quality Assurance (QA) is carried out every year using a portable 1000W lamp calibration system designed by Int'l Ozone Services Inc. (IOS, Canada). Primary standard lamps (NIST traceable) are located at the optical lab of the Izaña Observatory. Before and after the national calibration trip 1000W secondary standard lamps are calibrated against the primary ones.
UV Broadband instrument calibrations
A primary reference UV pyranometer, located at the Izaña Observatory, and a secondary portable reference UV pyranometer are kept just for the broadband UV network tests. The primary reference instrument participated in a broadband UV detector intercomparison organised by the LAP (Laboratory of Atmospheric Physics) of the Aristotle University of Thessaloniki (Greece) in September 1999. This intercomparison, carried out within the scope of the COST 713 action on "UV-B forecasting", hosted a total of 33 UV broadband detectors from 14 countries.
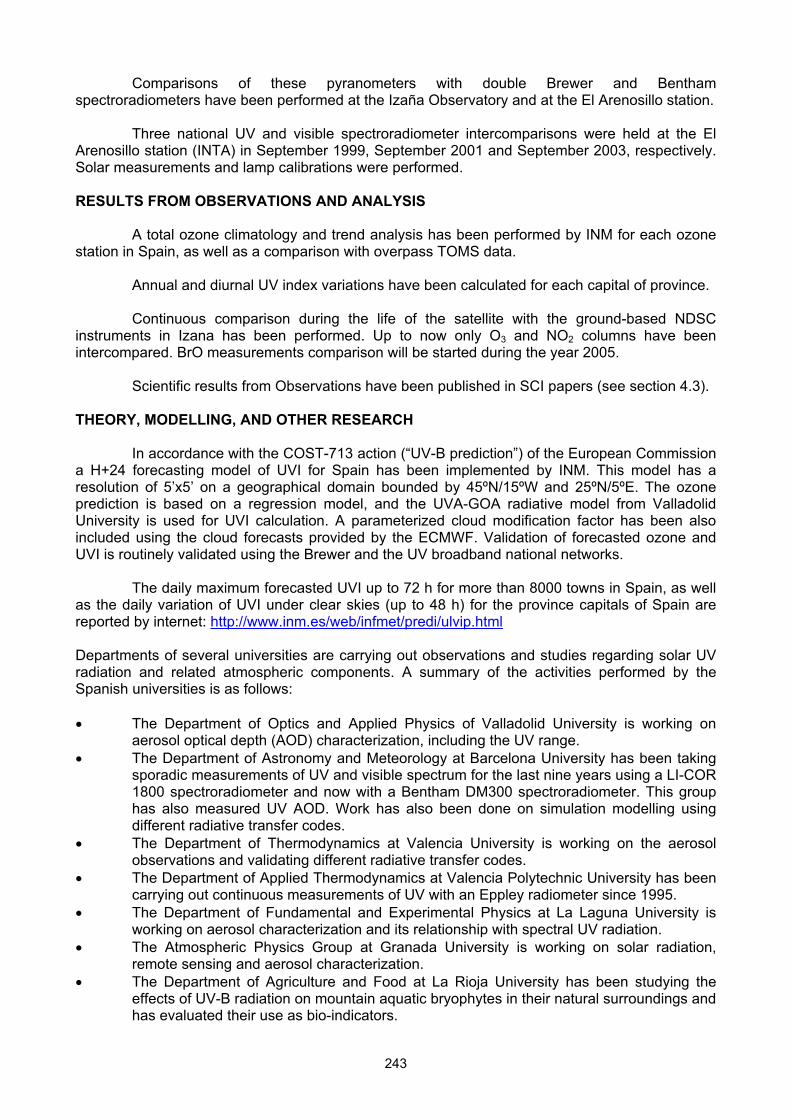
243
Comparisons of these pyranometers with double Brewer and Bentham spectroradiometers have been performed at the Izaña Observatory and at the El Arenosillo station.
Three national UV and visible spectroradiometer intercomparisons were held at the El Arenosillo station (INTA) in September 1999, September 2001 and September 2003, respectively. Solar measurements and lamp calibrations were performed.
RESULTS FROM OBSERVATIONS AND ANALYSIS
A total ozone climatology and trend analysis has been performed by INM for each ozone station in Spain, as well as a comparison with overpass TOMS data.
Annual and diurnal UV index variations have been calculated for each capital of province.
Continuous comparison during the life of the satellite with the ground-based NDSC instruments in Izana has been performed. Up to now only O3 and NO2 columns have been intercompared. BrO measurements comparison will be started during the year 2005.
Scientific results from Observations have been published in SCI papers (see section 4.3).
THEORY, MODELLING, AND OTHER RESEARCH
In accordance with the COST-713 action (“UV-B prediction”) of the European Commission a H+24 forecasting model of UVI for Spain has been implemented by INM. This model has a resolution of 5’x5’ on a geographical domain bounded by 45ºN/15ºW and 25ºN/5ºE. The ozone prediction is based on a regression model, and the UVA-GOA radiative model from Valladolid University is used for UVI calculation. A parameterized cloud modification factor has been also included using the cloud forecasts provided by the ECMWF. Validation of forecasted ozone and UVI is routinely validated using the Brewer and the UV broadband national networks.
The daily maximum forecasted UVI up to 72 h for more than 8000 towns in Spain, as well as the daily variation of UVI under clear skies (up to 48 h) for the province capitals of Spain are reported by internet: http://www.inm.es/web/infmet/predi/ulvip.html
Departments of several universities are carrying out observations and studies regarding solar UV radiation and related atmospheric components. A summary of the activities performed by the Spanish universities is as follows:
The Department of Optics and Applied Physics of Valladolid University is working on aerosol optical depth (AOD) characterization, including the UV range. The Department of Astronomy and Meteorology at Barcelona University has been taking sporadic measurements of UV and visible spectrum for the last nine years using a LI-COR 1800 spectroradiometer and now with a Bentham DM300 spectroradiometer. This group has also measured UV AOD. Work has also been done on simulation modelling using different radiative transfer codes. The Department of Thermodynamics at Valencia University is working on the aerosol observations and validating different radiative transfer codes. The Department of Applied Thermodynamics at Valencia Polytechnic University has been carrying out continuous measurements of UV with an Eppley radiometer since 1995. The Department of Fundamental and Experimental Physics at La Laguna University is working on aerosol characterization and its relationship with spectral UV radiation. The Atmospheric Physics Group at Granada University is working on solar radiation, remote sensing and aerosol characterization. The Department of Agriculture and Food at La Rioja University has been studying the effects of UV-B radiation on mountain aquatic bryophytes in their natural surroundings and has evaluated their use as bio-indicators.

244
DISSEMINATION OF RESULTS
Data reporting
The web-based “Iberonesia” data managing interface (www.iberonesia.com) provides near-real time ozone and UV information of the eight instruments of the national Brewer spectrophotometer network. Three Brewers from Portugal and one from Casablanca (Morocco) have been incorporated into this network. The information is stored and validated automatically.
Total ozone daily means are submitted on a daily basis daily to the WMO Northern Hemisphere Daily Ozone Mapping Centre run by the Laboratory of Atmospheric Physics at the Aristotle University of Thessaloniki (Greece) and to the WOUDC.
Evaluated and refined total ozone data from Madrid, Murcia, El Arenosillo, Santa Cruz de Tenerife and Izaña stations are periodically submitted to the WOUDC database.
Concerning global UV, data from each station is submitted daily to the INM’s central database. The UV index (UVI) is disseminated by Internet (www.inm.es/web/infmet/tobsr/ulvio/PRIMERA.html). Ozone soundings form Keflavik/Iceland are posted in real time in the joined IMO-INTA web page: http://grenjandi.vedur.is:8080/ozone/.Information of the ozone&UV Antarctic project, including total column NO2 for the three stations and ozone vertical profiles over Belgrano station are disseminated through www.inm.es/mar .
Table 2: Data reporting for total ozone (Revised on July 25, 2005).
Brewer Station
Institution Earliest data / Last updated WOUDC
Earliest data / Last updated NDSC
A Coruña INM No data Not NDSC station Zaragoza INM No data Not NDSC station Madrid INM 1992-01-01 / 2002-08-15 Not NDSC station Murcia INM 1995-04-01 / 2005-04-18 Not NDSC station El Arenosillo INTA 1976-01-13 / 2005-05-02 Not NDSC station Izaña INM 1991-04-01 / 2003-08-12 1991-05-01/ 2004-08-01 Santa Cruz Tenerife
INM 1996-01-03 / 2003-06-09 Not NDSC station
Table 3: Data reporting for ECC ozonesonde (Revised on July 25, 2005).
Ozonesonde Station
Institution Earliest data / Last updated WOUDC
Earliest data / Last updated NDSC
Earliest data/ Last Updated NILU
Madrid INM No Data Not NDSC Santa Cruz Tenerife
INM 1996-01-03 / 2003-06-09 1996-01-03 / 2004-08-28
Belgrano II INTA Not NDSC 1999-03.01/ 2005-06-01
Keflavik INTA Not NDSC 1991-11-01/ 2005-03-30
Table 4: Data reporting for UV-VIS and FTIR programmes (Revised on July 25, 2005).
Station Institution Earliest data/ Last updated NDSC. Also at ENVISAT CAL/VAL database
Izaña (UV-VIS) INTA-INM 2000-01-01 / 2005-06-01 Izaña (FTIR) Institut für Meteorologie und Klimaforschung
(IMK; Forschungszentrum Karlsruhe, Germany) and INM
1999-02-01 / 2002-12-31

245
Information to the public
Ozone data over Antarctica are sent to the WMO in almost real time as contribution to the reports on the evolution of the Ozone hole. The daily maximum forecasted UVI up to 72 h for more than 8000 towns in Spain, as well as the daily variation of UVI under clear skies (up to 48 h) for the province capitals of Spain are reported by internet: http://www.inm.es/web/infmet/predi/ulvip.html.
As part of the activities performed by Spain in the framework of the COST 713 Action “UVB forecasting”, a “UV-Index for the Public” booklet (in Spanish) has been adapted and expanded with some examples for the Canary Islands region by INM. A printed version of this booklet has been published in collaboration with the Dermatology Department at La Laguna University Hospital of Tenerife (HUC) and the pharmaceutical associations of the Canary Islands.
A second printed booklet entitled “Indice UV para la población” was published in June 2002 by the Health Ministry and the Environment Ministry. The booklet can be seen as a web page at www.inm.es/uvi.
Relevant scientific papers (since 2000)
Bais, A.F., B.G. Gardiner, H. Slaper, M. Blumthaler, G. Bernhard, , R. McKenzie, A.R. Webb, G. Seckmeyer, B. Kjeldstad, T. Koskela, P.J. Kirsch, J. Gröbner, J.B. Kerr, S. Kazadzis, K. Leszczynski, D. Wardle, W. Josefsson, C. Brogniez, D. Gillotay, H. Reinen, P. Weihs, T. Svenoe, P. Eriksen, F. Kuik, A. Redondas (2001), SUSPEN intercomparion of ultraviolet spectroradiometers, J. Geophys. Res., 106, D12, 12509-12525.
Bhosale, C.S., G.S. Meena, A.L. Londhe, D. B. Jadhav, O. Puentedura and M. Gil (2004), Variations of O3,NO2, and O4 densities in association with NAO indices during winter/spring of 1993/94 and 1994/95 at sub-Arctic station, Indian J. of Radio&Space Phys., V33, 104-114.
Blumenstock, T., A. Griesfeller, F. Hase, M. Scheneider, M. Gil, J.R. Moreta, U. Raffalski, U. Friess, G. Schwartz and E. Cuevas (2003), Validation of MIPAS and SCIAMACHY data by ground-based spectroscopy at Kiruna, Sweden and Izaña, Tenerife Island (AO-191) First ENVISAT Validation Workshop, ESA/ESRIN, Italy, 9-13 Dec. 2002, ESA SP-531.
Blumenstock, T., S. Mikuteit, A. Griesfeller, F. Hase, G. Kopp, I. Kramer, M. Schneider, H. Fischer, M. Gil, J. R. Moreta, M. Navarro Coma, U. Raffalski, E. Cuevas, B. Dix & G. Schwarz, Validation of MIPAS and SCIAMACHY Data by Ground-based Spectroscopy at Kiruna, Sweden, and Izana, Tenerife island (aoid-191), Proceedings of the Second Workshop on the Atmospheric Chemistry Validation on ENVISAT (ACVE-2), 3-7 May, 2004.ESA-ERINS, Frascati, Italy, 2004.
Braathen, G., M. Mueller, B.M. Sinnhuber, M. Chipperfield, P. von der Gathen, E. Kyro, I.E. Mikkelsen, V. Dorokhov, H. Fast and C. Parrondo (2003), Quantifying the chemical ozone loss in the polar vortex during the fifteen years from 1988-89 to 2002-2003, EGS-AGU-EUG Joint Assembly, (Nice, France, 6-11 April, 2003).
Carreño, V., E. Cuevas, and A. Redondas, and V. Cachorro, The INM’s Ultraviolet Index forecasting model for Spain, Sixth European Symposium on Stratospheric Ozone, Göteborg, Sweden, September 2 - 6, 2002.
Carreño, V., A. Redondas, and E. Cuevas, Validation and new parametrisations in the INM’s Ultraviolet Index forecasting model for Spain, Sixth European Symposium on Stratospheric Ozone, Göteborg, Sweden, September 2 - 6, 2002.
De Backer, H., K. Peter, A. Bais, X. de Cabo, T. Frei, D. Gillotay, Ch. Haite, A. Heikkilä, A. Kazantzidis, T. Koskela, E. Kyrö, B. Lapeta, J. Lorente, K. Masson, B. Mayer, H. Plets, A. Redondas, A. Renaud, G. Schauberger, A. Schmalwiesser, H. Schwander, K. Vanicek, Karl (2001), Comparison of measured and modelled UV indices for the assessment of health Risks, Meteorological Applications vol 8(3), 267-277.
Cuevas, E., M. Gil, J. Rodríguez, M. Navarro, and P. Hoinka (2001), Sea-land total ozone differences from TOMS: The GHOST effect, J. Geophys. Res., Vol. 106, D21, p.p. 27745-27755.
Díaz, J.P., F.J. Expósito, C.J. Torres, V. Carreño, A. Redondas (2000), Simulations of the mineral dust effect on the UV radiation levels, J. of Geophys. Res., 105, D4, 4979-4992.

246
Díaz, J. P., F. Expósito, C.J. Torres, F. Herrera, J.M. Prospero, M.C. Romero (2001), Radiative properties of aerosols in Saharan dust outbreaks using ground-based and satellite data: Applications to radiative forcing, J. Geophys. Res. Vol. 106 , No. D16 , p. 18,403.
Gil, M., O. Puentedura, M. Yela, E. Cuevas (2000): Observations of NO2 and O3 columns by visible spectroscopy during the eclipse of February 26, 1998, J. Geophys. Res., Vol. 105 , No. D3, p. 3583.
Gil, M., O. Puentedura and M. Yela (2002), Measurements of the BrO column at the Northern Subtropics, Sixth European Symposium on Stratospheric Ozone (Göteborg, Sweden, 2 - 6 September, 2002).
Gil, M., C. Parrondo, M. Navarro, E. Cuevas, A. Redondas, J.L. Camacho, A. Labajo, D. S. Balis, C. S. Zerefos, Extreme Low Ozone events during the 2003/2004 winter, Proceedings of the Quadrennial Ozone Symposium, IOC, EC, 1-8 June 2004, Kos (EL), IOC, IAMAS (Publs.) – ORA/PRO 302.
Gil, M., M. Yela, M. Navarro, and E. Cuevas, NO2 diurnal variability at Izaña Observatory, Proceedings of the Quadriennial Ozone Symposium, IOC, EC, 1-8 June 2004, Kos (EL), IOC, IAMAS (Publs.) – POS/PRO 384.
Gómez, I, A. Labajo and J.L. Camacho (2005), “Analysis of stratospheric ozone over Iberian Peninsula”. EGU General Assembly,Vienna, 24-29 April 2005.
Gröbner, J., Vergaz, R., Cachorro, V.E., Henriques, D.V., Lamb, K., Redondas, A., Vilaplana, J.M. y D. Rembges, (2001), Intercomparison of aerosol optical depth measurements in the UVB using Brewer spectrophotometers and a Li-Cor spectrophotometer. Geophysical Research Letters, Vol. 28, 9, 1691-1694.
Hase, F., T. Blumenstock, M. Höpfner, M. Schneider, A. Zimmermann, D. Yashcov, E. Cuevas, and Y. Kondo, Trace Gas Profiles from Ground Based FTIR Observations: Estimation of Error Budget, NDSC 2001 Symposium, Arcachon, France, 24-27 September, 2001.
Horvath, H., Alados-Arboledas, L., Olmo, F.J., Jovanovic, O, Gangl,M., Kaller, W., S., Sánchez, C., Saurzopf, H. y Seidl, S. 2002. Optical Characteristics of the Aerosol in Austria and Spain and its effect on radiative forcing. Journal of Geophysical Research, 107 D 19 DOI: 10.1029/2001JD001472.
INM, The First Iberian UV-Visible instruments intercomparison: Final Report, Edited by A. Labajo, E. Cuevas and B. de la Morena, ISBN: 84-8320-274-3, 114 pp, Ministerio de Medio Ambiente, January 2004.
Kentarchos, A., G.J. Roelofs, J. Lelieveld, E. Cuevas (2000): On the origin of elevated surface ozone concentrations at Izana Observatory during the last days of March 1996: a model study, Geophys. Res. Lett., Vol. 27, 22, 3699-3702.
Lait, L.R:., P.A. Newman, M. Schoeberl, T. Mcgee, L. Twigg, E. Browell, R. Bevilacqua, S. B., Andersen, H. de Backer, A. Benesova, P. Skrivankova, J. Davies, H. Claude, E. Kyro, R. Kivi, M. Gil, M. Gerding, L. Zenobia, D. Moore, G. Braathen, V. Dorokhov and I. Zaitcev (2004), Non-coincident inter-instrument comparison of ozone measurements using quasi-conservative coordinates, Atmospheric Chemistry and Physics 4, 2345-2352.
Lakkala, K., A. Redondas, T. Koskela, P. Taalas, C. Torres, E. Cuevas, G. Deferrari (2002), Quality assurance of a solar UV network in the Antarctic. 27th General Assembly of the European Geophysical Society, Nice, France, 21-26 April, 2002.
Lambert, J-C, J. Granville, M. Allart, T. Blumenstock, T. Coosemans, M. de Maziere, U. Friess, M. Gil, F. Goutail, D.V. Ivonov, I. Kostadinov, E. Kyro, A. Petritoli, A. Piters, A. Richter, H.K. Roscoe, H. Schets, J. D. Shanklin, V. T. Soebijanta, T. Suortti, M. van Roozendael and C. Varotsos (2003), Ground-Based Intercomparison of early Sciamachy O3 and NO2 columns First ENVISAT Validation Workshop, ESA/ESRIN, Italy, 9-13 Dec. 2002, ESA SP-531.
Lambert, J.-C., J. Granville, T. Blumenstock, F. Boersma, A. Bracher, M. De Mazière, P. Demoulin, I. De Smedt, H. Eskes, M. Gil, F. Goutail, F. Hendrick, D. V. Ionov, P. V. Johnston, I. Kostadinov, K. Kreher, E. Kyrö, R. Martin, A. Meier, M. Navarro-Comas, A. Petritoli, J-P. Pommereau, A. Richter, H. K. Roscoe, C. Sioris, R. Sussmann, M. Van Roozendael, T. Wagner, and S. Wood (2004), Geophysical validation of SCIAMACHY NO2 vertical columns: overview of early 2004 results, ESA SP531, 2004.
Martínez-Lozano, J.A., M.J. Marín, F. Tena, M. P. Utrillas, L. Sánchez-Munisoguren, C. González-Frías, E. Cuevas, A. Redondas, J. Lorente, X. De Cabo, V. Cachorro, R. Vergaz, A. De Frutos, J.P. Díaz, F. Expósito, B. De la Morena, and J. M. Vilaplana (2002), UV Index Experimental values During the Years 2000 and 2001 from the Spanish Broad Band UV-B Radiometric Network, Photochemistry and Photobiology, 76(2), 181-187.
Martínez-Lozano, J.A., Utrillas, M.P., Pedrós, R., Tena, F., Díaz, J.P., Expósito, F.J., Lorente, J., de Cabo, X., Cachorro, V., Vergaz, R. and V. Carreño (2002): Intercomparison of spectroradiometers for global and direct solar irradiance in the visible range. Journal of Atmospheric and Oceanic Technology (in press).

247
Masson, K., T. Koskela, P. Taalas, E. Cuevas, D. M. de la Cruz, A. Redondas (2000), Solar UV network in Antarctica. 25th General Assembly of the European Geophysical Society, Nica, France, 25-29 April, 2000.
Meijer, Y.J., D.P.J. Swart, R. Koelemeijer, M. Allaart, S. Andersen, G. Bodeker, I. Boyd, G. Braathen, Y. Calisesi, H. Claude, V. Dorokhov, P. Von der Gateen, M. Gil, S. Godin.-Beekmann, F. Goutail, G. Hansen, A. Karpetchko, P. Keckhut, H. Kelder, B. Kois, R. Koopman, J-.C. Lambert, T. Leblanc, I.S: McDermid, S. Pal, U. Raffalski, H. Schets, R. Stubi, T. Suortti, G. Visconti and M. Yela (2004), Pole-to-pole validation of Envisat GOMOS ozone profiles using data from ground-based and balloon sonde measurements, J. Geophys. Res., 109, D23305, doi: 10.1029/2004JD004834.
Meinander, O., K. Lakkala, A. Redondas, C. Torres, E. Cuevas, G. Deferrari, T. Koskela and P. Taalas, Travelling reference NILU-UV at the Antarctic region: solar UV comparisons at Ushuaia and Marambio in 2002, Proceedings EGS-AGU-EUG Joint Assembly, Nice, France, 6 - 11 April, 2003.
Meinander, O., Koskela, T., Lakkala, K., Redondas, A., Torres, C., Cuevas, E., Deferrari, G., Gröbner, J. (2004), Antactic NILU-UV Network Linked to QASUME and NSF Irradiance Scales, Proceedings of the Quadriennial Ozone Symposium, IOC, EC, 1-8 June 2004, Kos (EL), IOC, IAMAS (Publs.) - ORA/PRO 65061.
Oltmans S., A. Lefohn, J. Harris, H.-E. Scheel, E. Brunke, H. Claude, D. Tarasick, I. Galbally, G. Bodeker, E. Cuevas, P. Simmonds, T. Fujimoto, K. Anlauf, S. Nichol, J. Davies, K. Hayden, K. Akagi, B. Johnson, C. Meyer, F. Schmidlin, D. Shadwick (2005), Trends in Tropospheric Ozone, Proceedings of the Quadriennial Ozone Symposium, IOC, EC, 1-8 June 2004, Kos (EL), IOC, IAMAS (Publs.) – POS/PRO 339.
Parrondo, C., M. Yela, J. Araujo, M. Chipperfield, M. Gil. Ozone loss rates in the lower stratosphere over Belgrano, Antarctica (78ºS, 35ºW) from 1999-2001 as obtained by ozonesondes: comparison with the SLIMCAT model.Air Pollution Report 79, EUR 20650, pp 353-357, 2002
Parrondo, C., M. Yela, J. Araujo, M. Chipperfield, M. Gil (2002), Ozone loss rates in the lower stratosphere over Belgrano, Antarctica (78ºS, 35º W) from 1999-2001 as obtained by ozonesondes: comparison with the SLIMCAT model Sixth European Symposium on Stratospheric Ozone (Göteborg, Sweden, 2 - 6 September, 2002).
Parrondo M.C., M.Yela, M. Gil and J. Araujo (2004), Fast increase in ozone during the 2002 major warming as observed by ozonesondes located at the vortex splitting point, Proceedings of the Quadriennial Ozone Symposium, IOC, EC, 1-8 June 2004, Kos (EL), IOC, IAMAS (Publs.) – POS/PRO 133.
Puentedura, O, M. Gil, M. Navarro, F.Hendrick, M, Chipperfield, and E. Cuevas, An estimation of the Bromine Monoxide content in the free troposphere of north subtropical regions, Proceedings IAMAS 2005, August 2-11, 2005, Beijing, China.
Randall, C.E:, D. W. Rusch, R.M. Bevilaqua, K.W. Hoppel, J.D. Lumpe, E. Shettle, E. Thompson, L. Deaver, J. Zawodny, E. Kyro, B. Johnson, H. Kelder, V.M. Dorokhov, P. von der Gathen, G. Koning-Langlo and M. Gil (2003), Validation of POAM III Ozone: Comparisons with Ozonesonde and satellite data, J. Geophys. Res. 108 (D12) 4367, doi:10.1029/2002JD002944.
Redondas, A. (2002), The Regional Calibration Center for Brewers Region VI (Europe), 7th Biennial WMO/GAW Brewer Users Group Meeting, Toronto, Canada, September 2002.
Redondas, A., E. Cuevas, and A. Labajo, Management and QA/QC of the Spanish Brewer spectrophotometer Network, Sixth European Symposium on Stratospheric Ozone, Göteborg, Sweden, September 2 - 6, 2002.
Redondas, A. (2003), The GAW- Regional Brewer Calibration System- EUROPE, Brewer meeting, Mazagón-Huelva, Spain, 2003.
Redondas, A. (2005), Spanish, Portuguese and Moroccan Brewer spectrometer network Management and QA/QC, 9th Biennial WMO/GAW Brewer Users Group meeting, April 31-May 2, 2005, Amsterdam. Holland.
Redondas, A. (2005), Spanish Regional Brewer Calibration Center- First calibration campaign, 9th Biennial WMO/GAW Brewer Users Group meeting, April 31-May 2, 2005, Amsterdam. Holland.
Roscoe, H.K., S.R. Colwell, J.D. Shanklin, J.A. Karhu, P. Taalas, M. Gil, M. Yela, S. Rodriguez, C. Rafanelli, H. Cazeneuve, C.A. Villanueva, M. Ginsburg, S.B. Diaz, R.L. de Zafra, G. Muscari, G. Redaelli, R. Dragan (2005), Ground-based and balloon-borne measurements in Antarctic regions in support of APE-GAIA, Advances of Space Research, In press.
Rex, M., R. J. Salawich, N. R. P. Harris, P. von der Gathen, G. O. Braathen, A. Schulz, H. Deckelmann, M. Chipperfield, B.-M. Sinnhuber, E. Reimer, R. Alfier, R. Bevilacqua, K. Hoppel, M. Fromm, J. Lumpe, H. Küllmann, A. Kleinböhl, H. Bremer, M. von König, K. Künzi, D. Toohey, H. Vömel, E. Richard, K. Aikin, H. Jost, J. B. Greenblatt, M. Loewenstein, J. R. Podolske, C. R. Webster, G. J. Flesch, D. C. Scott, R.

248
L. Herman, J. W. Elkins, E. A. Ray, F. L. Moore, D. F. Hurst, P. Romashkin, G. C. Toon, B. Sen, J. J. Margitan, P. Wennberg, R. Neuber, M. Allart, B. R. Bojkov, H. Claude, J. Davies, W. Davies, H. De Backer, H. Dier, V. Dorokhov, H. Fast, Y. Kondo, E. Kyrö, Z. Litynska, I. S. Mikkelsen, M. J. Molyneux, E. Moran, T. Nagai, H. Nakane, C. Parrondo, F. Ravegnani, P. Skrivankova, P. Viatte, and V. Yushkov (2002), Chemical depletion of Arctic ozone in winter 1999/2000, J. Geophys. Res., 10.1029/2001JD000533.
Schneider, M., T. Blumenstock, M. Chipperfield, F. Hase, W. Kouker, T. Reddmann, R. Ruhnke, E. Cuevas, and H. Fischer (2004), Subtropical trace gas profiles determined by ground-based FTIR spectroscopy at Izaña (28ºN, 16ºW): Five year record, error analysis, and comparison with 3D-CTMs, Atmos. Chem. Phys..
Schneider, M., T. Blumenstock, F. Hase, M. Höpfner, E. Cuevas, A. Redondas, and J. Sancho, Ozone Profiles and Total Column Amounts derived at Izaña, Tenerife Island, from FTIR Solar Absorption Spectra, and its Validation by an Intercomparison to ECC-sonde and Brewer Spectrometer Measurements, J. of Quatitative Spectroscopy & Radiative Transfer, 91, 245-274, Elsevier, 2005.
Schneider, M., T. Blumenstock, F. Hase, M. Höpfner, E. Cuevas, A. Redondas, J. M. Sancho, Ozone Profiles and Total Column Amounts derived at Izaña, Tenerife Island, from FTIR Solar Absorption Spectra, and its Validation by an Intercomparison to ECC-Sonde and Brewer Spectrometer Measurements, JQSRT-Elsevier, in Press.
Streibel, M., P. von der Gathen, M. Rex, H. Deckelmann, N.R.P. Harris, G.O. Braathen , M.P. Chipperfield, G. Millard, E. Reimer, R.Alfier, M. Allaart, S.B. Andersen, J. Araujo, D. Balis, O. Billett, C. Cambridge, H. Claude, S.R., Colwell, J. Davies, H. De Backer, T.Deshler, H. Dier, V. Dorokhov, J.Easson, H. Fast, M. Gerding, M. Ginzburg, S. Godin Beekmann, B.Johnson, J.A. Karhu, A.Klekociuk, E. Kyrö , Z. Litynska, D. Moore, E., Moran, T. Nagai , H. Nakane, C. Parrondo, F. Ravegnani, H.K. Roscoe, K. Sato, J.D.,Shanklin, P. Skrivankova, O.-P. Tripathi, C. Varotsos, C. Vialle, P. Viatte, T. Yamanouchi, M. Yela, N.Yoshizawa, V. Yushkov (2003), C.S. Zerefos, Ozone Loss Rates over the Arctic and Antarctic Measured with the Match Approach, VINTERSOL/SOLVE II Meeting,Orlando, USA, October, 2003.
Torres, C., A. Redondas, E. Cuevas, K. Lakkala, P. Taalas, M. Yela, H. Ochoa, and G. Deferrari (2002), "Correction and validation of total ozone data series from an Antarctic multichannel filter radiometer solar UV network", 27th General Assembly of the European Geophysical Society (Nice- France), 21 - 26 April, 2002.
Torres, C., A. Redondas, E. Cuevas, J.P. Díaz, K. Lakkala, P. Taalas, M. Yela, H. Ochoa, G. Deferrari (2002),Relationship between total ozone and UV dose rate provided by the NILU-UV6 Multichannel Radiometer Network at the Antarctic region. Sixth European Symposium on Stratospheric Ozone, Göteborg, Sweden, 2-6 September, 2002.
Vandaele 2003 Vandaele, A-C, C. Fayt, F. Hendrick, C. Hermans, F. Humbled, M. Van Roozendael, M. Gil, M. Navarro, O. Puentedura, M. Yela, G. Braathen, K. Stebel, K. Tornkvist, P. Johnston, K. Kreher, F. Goutail, A. Mieville, J-P Pommereau, S. Khaikine, A. Richter, H. Oetjen, F. Wittrock, S. Bugarski, U. Friess, K. Pfeilsticker, R. Sinreich, T. Wagner, G. Corlett and R. Leigh (2003), A NDSC Intercomparison exercise: NO2, BrO and OClO measurements by Ground-Based UV-Vis spectrometers at the Andoya Rocket Range, Norway (69.3ºN, 16ºW), VINTERSOL/SOLVE II Meeting, Orlando, USA, October 2003
Vandaele, A.C., C. Fayt, F. Hendrick, C. Hermans, F. Humbled, M. Van Roozendael, M. Gil, M. Navarro, O. Puentedura, M. Yela, G. Braathen, K. Stebel, K. Tørnkvist, P. Johnston, K. Kreher, F. Goutail, A. Mieville, J.-P. Pommereau, S. Khaikine, A. Richter, H. Oetjen, F. Wittrock, S. Bugarski, U. Frie�, K. Pfeilsticker, R. Sinreich, T. Wagner, G. Corlett, R. Leigh, An intercomparison campaign of ground-based UV-Visible measurements of NO2, BrO, and OClO slant columns. I. NO2, In press 2005 J. Geophys. Res-Atmosphere.
Vanicek, K., and E. Cuevas, A Regional Brewer Calibration System for Total Ozone Observations in the RA-VI Region – Europe, GAW SAG-Ozone meeting, Toronto, September 2002.
Vilaplana, J.M., B.A. De la Morena, Ozone and UV measurements at “El Arenosillo” (37.1 N-6.7 W) Spain, 7th biennial Brewer meeting. Toronto, Canada, September 2002.
Yela, M., S. Rodriguez, M. Gil, R. Ozu, S. Diaz, M. Chipperfield (2000), Seasonal evolution of NO2 and O3 outside, at the edge, and inside the Antarctic polar vortex comparison with the SLIMCAT model , 2º SPARC General Assembly, Mar de Plata 2000.
Yela, M., S. Rodriguez, M. Gil, M.P. Chipperfield, C. Parrondo, R. Ozu (2000). NO2 and O3 in the core of the Antarctic vortex: Observations and modelling at Belgrano station. International Quadrennial Ozone Symposium, Sapporo, Japón, 3-8 Julio, 2000.

249
Yela,M., C. Parrondo, S. Rodríguez, M. Gil, J. Araujo, H. Ochoa, G. Deferrari y S. Díaz (2003), The 2002 Antarctic vortex splitting as observed by visible spectroscopy and ozonesoundings, EGS-AGU-EUG Joint Assembly, Niza, 2003.
Yela M., Gil M., Rodriguez S., Araujo J., Diaz S., Deferrari G. (2005), Unusual behaviour of stratospheric NO2 and ozone during splitting vortex event in the Antarctic winter 2002: Comparison with a 10-years NO2 climatology at three Antarctic and sub Antarctic sites, Proceedings of the Quadriennial Ozone Symposium, IOC, EC, 1-8 June 2004, Kos (EL), IOC, IAMAS (Publs.) – POS/PRO 454.
Yela, M., C. Parrondo, M. Gil, S. Rodríguez, J. Araujo, H. Ochoa, G. Deferrari and S. Díaz, The September 2002 Antarctic vortex major warming as observed by visible spectroscopy and ozonesoundings: In press 2005, International Journal of Remote Sensing.
PROJECTS AND COLLABORATION
INTA has participated in INOVO (INterhemispheric OClO Polar VOrtex Variability). This is an intensive campaign to test the new high-resolution spectrograph and carry out measurements of OClO and study the impact of high reflective surface (snowy surface) on the species retrieved during the winter of 2001 at the polar observatory of Sodankyla, Finland. The instrument was installed at Marambio Base, Antarctica in austral summer 2004. The campaign has been financed by the European Commission through the LAPBIAT infrastructure facility.
INTA and INM have participated in the STREAMER project coordinated by the DLR, Germany. It is a European project from the Earth Observation Programme devoted to forecasting ozone and UV-B in the European sector using the GOME/ESA instrument (and SCIAMACHI/ESA in ENVISAT in the future) and meteorological forecasting. The output is level – 3 products (maps) 24h forecasting of both ozone and UV-B on Internet, available to the public.
INM and INTA have actively participated in recent years in European projects related to ozone and UV research, which have recently finished or are still in progress. They are as follows:
REVUE (Reconstruction of Vertical Ozone Distribution from Umkehr Estimates), ENV4-CT95-0161)TRACAS (TRAnsport of Chemical species Across Subtropical tropopause) ENV4-CT97-0546.STREAMER (Small Scale Structure Early Warning and Monitoring in Atmospheric Ozone and Related Exposure to UV-B Radiation), ENV4-CT98-0756. QUILT (Quantification and Interpretation of Long Term UV-Visible Observations of the stratosphere) EVK2-CT2000-0059. Devoted to improvements of Spectroscopic data products (NO2, O3, BrO, OClO, IO), Revision of the data sets, Modeling and interpretation, etc.QUOBI (Quantitative Understanding of Ozone Losses by Bipolar Investigations) EVK2-CT-2001-00129 (2002-2004): The main objective of the project is to test our quantitative understanding of the chemical mechanisms that destroy ozone in wintertime Arctic stratosphere and springtime Antarctic and to improve the representation of these processes in chemical models of the atmosphere. SCOUT-O3 (Stratospheric-Climate Links with Emphasis on the UTLS); SCOUT-O3's aim is to provide predictions about the evolution of the coupled chemistry/climate system, with emphasis on ozone change in the lower stratosphere and the associated UV and climate impact, to provide vital information for society and policy use.
INM, INTA and the Universities of Barcelona, Valencia, Valladolid and La Laguna have participated in several large coordinated ozone&UV-related projects financed by the National R+D Plan of the Ministry of Science and Technology:
“Measurement and Modeling for the space-time distribution of the ultraviolet solar irradiance in Spain” (CLI97-0345-C05). DEPRUVISE (“Determination and forecasting of solar ultraviolet Radiation in Spain: influence of ozone, aerosol particles and cloudiness”), financed by the National R+D (Climate National Programme REN2000-0903-C08-02 CLI).

250
TROMPETA (“TROpical Monitoring Phase in the Atmosphere”), Reference CGL2004-03669/CLI, financed by the Diversity, Earth Sciences and Global Change R+D National Programme. EGEO (“Estudio de la GEnesis del agujero de Ozono y sus implicaciones sobre la radiación UV”), financed by the Diversity, Earth Sciences and Global Change R+D National Programme; Reference CGL2004-05419-C02-02ANT.
The “Veleta 2002” field campaign was held in July 2002, in the framework of the DEPRUVISE project, financed by the National R+D Plan of the Ministry of Science and Technology. This field campaign has been designed to obtain experimental data of elevation effects on solar ultraviolet irradiance. For this purpose different radiometers and spectroradiometers have been installed on both slopes of the Sierra Nevada Massif. The stations cover from sea level to 3400 m a. s.l. on the top of the Veleta Peak. This information has been used to evaluate the aerosol radiative forcing on the solar UV irradiance. Several groups from the Universities of Granada, Barcelona, Valencia, Valladolid, Malaga and La Laguna, and the INTA and INM have participated in the field campaign.
STREAMER. INTA has participated in a proposal of the European GMES (Global Monitoring the Environment and Security) Programme devoted to the elaboration of H+24 UV and ozone forecasted maps above Europe and research associated to the ozone layer. The new project will focus on operational aspects regarding data management (GIS, Web, etc), climatology of ozone related species and Streamer events on a global scale based on European satellites and 3D modeling. Validation exercises will also be performed to ensure the data and model quality.
Within the framework of the QUILT project, a NDSC intercomparison was held in the winter of 2002/2003 at the polar facility of Andoya, Norway, (68ºN). INTA has participated with its UV-VIS instrument. The purpose was to harmonize results and identify possible causes of discrepancy between instruments. Eleven European Institutes involved in QUILT have participated in this campaign. Unofficial comparison of BrO was carried out as well.
The effects of clouds and the cloud-sea on the spectral UV radiation has been investigated by INM and La Laguna University at the Izaña GAW observatory using radiative models (DISORT/UVSPEC) and in-situ observations made with double spectrophotometers Brewer and Bentham at sea level and 2400 m a.s.l., respectively.
Aerosol optical depth (AOD) at UV range is routinely obtained at Izaña Observatory from the Brewer spectrophotometer triad using the direct sun measurements.
Within the national R+D plan TROMPETA project, a micropulse aerosol lidar (INTA), a plane equipped with ozone and aerosol instruments, and ground-based ozone total column measurements by high quality NDSC (INM and INTA), have been used at the Izaña Observatory facilities (2400 m a.s.l. and sea level) during a heavy Saharan dust storm event was held on July 2005 to find out whether or not the retrieval of satellite operating in backscattering mode such as TOMS and GOME is severely affected by interferences from the absorbent characteristics of mineral aerosols.
INTA and INM contribute to the EU 6th framework programme SCOUT-O3 project (2003-2007) with activities carried out in the subtropical region around the Tenerife Island. O3, NO2 BrO measurements will be focus around the UTLS region.
INTA participates in the TASTE project (2003-2004) funded by the ESA for official validation of O3 and NO2 in ENVISAT Sciamachy onboard instrument. The project has been extended two more years within the TASTE-II (2005-2006) for a continuous validation during the satellite lifetime.

251
Spain has endorsed the EU Action COST 723 ("The Role of the Upper Troposphere and Lower Stratosphere in Global Change"; http://www.cost723.org/) with two delegates from INM and INTA.
Dr E Cuevas (INM) is member of the International Ozone Commission (http://ioc.atmos.uiuc.edu/) and Mr A. Redondas (INM) is member of the WMO Ozone Scientific Advisory Group (http://www.wmo.ch/web/arep/gaw/sag.html)
FUTURE PLANS
Cosine response calibration facilities for Brewer and UV broadband radiometers will be implemented at both, El Arenosillo and Izaña facilities during 2006.
The first GAW Regional Brewer Calibration Center-Europe (RBCC-E) intercomparison campaign of Brewer spectrophotometers will be held at the “El Arenosillo” Atmospheric Sounding Station, INTA (Huelva, Spain) from 9 to18 September 2005.
A joint collaboration of the National Institute for Aerospace Technology (INTA; Spain), The National Meteorological Institute (INM; Spain), the National Meteorological Service (SMN; Argentina) and the “Tierra del Fuego” Government (Argentina) is being managed in order to establish a permanent ozonesonde programme at the Ushuaia GAW station by the end 2005 or early 2006.
A second intensive campaign using an ozone and aerosol instrument-equipped plane, two aerosol lidars and NDSC instruments is planned to be held in Tenerife in July 2006.
NEEDS AND RECOMMENDATIONS
Satellite community should contribute to financing the ground ozone&UV observation system. Space-borne instruments must be calibrated on a continuous basis with reliable ground based instruments.
Monitoring system should pay special attention to Upper Troposphere- Lower Stratosphere (UTLS) region.
Strong efforts should be done by meteorological forecasting models to improve cloud forecasts. This is needed for a more realistic UVI prediction.
****

252
SWITZERLAND
OBSERVATIONAL ACTIVITIES
Column measurements of ozone and other gases/variables relevant to ozone loss
Total ozone is measured regularly at Arosa since 1926. Presently, the measurements are performed with two semi-automated Dobson spectrophotometers (D101 & D062) and three automatic Brewer instruments B040, B072 (Mark II) and B156 (Mark III).
Profile measurements of ozone and other gases/variables relevant to ozone loss
Balloon ozone soundings are measured from the Payerne Aerological Station three times per week since 1968. Until August 2002, Brewer-Mast ozone sondes were used while since September 2002 ECC (ENSCI – 0.5%) sensors are the operational instruments.
The Umkehr ozone profiles are recorded at sunrise and sunset since 1956. Originally, the measurements were manual and since 1989 an automated Dobson (D051) is dedicated to this task. In 1988, the Brewer (B040) Umkehr series have also been started,
Since 2001, ozone profiles (20 – 70 km) are retrieved from the millimetre wave radiometer SOMORA. Located at Payerne, this instrument delivers thirty minutes averaged profiles continuously.
UV measurements
The Swiss Atmospheric Radiation Monitoring programme (CHARM) consisting of 4 stations covering the altitude range of 366 to 3587 m.a.s.l was build up between 1995 and 2000.
The measurements programme consists of :
- Broadband measurements: the direct, diffuse and global components of the broad-band erythemal UV-ERY radiation (Solar Light UV-Biometers) are measured,
- Narrowband filter instruments: spectral direct irradiances are measured with Precision Filter Radiometers (PFR) at 16 wavelengths in the range 305 nm to 1024 nm.
Besides the direct measurements, the UV index, the AOD at various wavelengths as well as the Integrated Water Vapor (IW) are calculated from those data.
Spectral Brewer UV measurements
At Arosa, since 1994 spectral global UVB measurements are recorded with the Brewer instruments 072 on the range 290 nm – 325 nm. Since 1998, the Brewer Mark III 156 is in operation and it measures the range 286.5 - 363 nm.
Halocarbon measurements at the global GAW station Jungfraujoch
The high Alpine site of Jungfraujoch (3580 m asl) is one of a few stations covering the entire measurement programme of the GAW concerning greenhouse gases and reactive gases.
The measurements of halocarbons are a part of the SOGE – project (System for Observation of Halogenated Greenhouse Gases in Europe) which is related in terms of standard and quality assurance to the world-wide AGAGE programme (Advanced Global Atmospheric Gases Experiment).

253
Calibration activities
Regular calibration and maintenance are organised for the Arosa Brewers (every year) and Dobsons (every 4 years) traceable to the world standards for each instrument types.
Each ozone sonde is calibrated in the laboratory prior to the sounding.
The CHARM instruments are compared to reference instruments traceable to the world standards.
RESULTS FROM OBSERVATIONS AND ANALYSIS
Payerne ozone soundings: after a homogenization of the sounding series, the trends at different levels have been updated and the hypothesis of a change of trend at the end of the nineties has been tested. In Fig. 1, the long term trend profiles are given for different cases explained in the caption.
Figure 1:Trend profiles of the homogenized Payerne ozone sounding series. The green diamonds is the results given in the 98-WM trend assessment while the three others correspond to different selection data subsets used in the analysis (see Favaro et al. 2002 below).
Dobson Umkehr profiles: similarly, the Umkehr Arosa dataset have been homogenized and the trend evaluated. In Fig.2, the trend analysis results are reported and compared to other instruments like satellites (SAGE, SBUV) taken from the last WMO trend assessment.
Figure 2:Trend analysis of the Arosa Umkehr dataset before and after homogenization. No proxy beside time has been incorporated in the model and the time period considered is 1980-2000. Trend profiles from satellites (SAGE I+II, SBUV) as well as the mean Umkehr trend from the WMO-trend assessment are also reproduced.

254
The UV dataset measured at the CHARM station Davos has been extended back in time using a reconstruction method based on sunshine duration, snow cover and ozone amount [Lindford, 2005]. As seen in fig. 3, the last decades present an upward tendency compared to the reference period.
Figure 3: UV reconstructed series for the Davos site. The upper panel shows the deviation of the reconstructed UV dose and the lower panel, the main parameters used in the model.
For the localisation of potential European halocarbon source regions a trajectory model was used based on the Swiss Alpine Model, aLMo. Results of the temporal development of the emissions for HCFC 141b and HFC 152a, seen with the trajectory statistics, are shown in fig. 4. The estimated European emissions of the now forbidden HCFC 141b have declined. Those of HFC 152a (not restricted by the Montreal-Protocol) have increased (Reimann and al., 2004).
HCFC 141b
HFC 152a
2001 2002 2003
Figure 4:Source regions resulting from trajectory statistics of the HCFC 141b and the HFC 152a between 2001-2003 seen at Jungfraujoch. Units indicate averaged concentrations above the baseline [ppt], linked to trajectories that passed over the respective grid cell.

255
DISSEMINATION OF RESULTS
Data reporting
The ozone data from Arosa, respectively Payerne are regularly deposited at the WODC and at the NDSC data centers. They are also deposited at NILU data center for validation projects and measurements campaigns (Satellites, ECMWF, MATCH).
The radiation data from the CHARM Payerne station are deposited at the WRM-BSRN data center.
The SOMORA radiometer data are deposited at NDSC and NILU data centres.
Information to the public
The UV forecasts are issued daily during the summer months in many newspapers, on different web sites (public media, national institutions) and at the TV weather presentations. The alerts for high ozone concentration at surface level are also announced when necessary in the same information channels.
Relevant scientific papers
Brönnimann, S., J. Luterbacher, J. Staehelin and T. Svendby, 2004: An extreme anomaly in stratospheric ozone over Europe in 1940-1942, Geophys. Res. Lett., 31, Art. No. L08101.
Calisesi, Y., R. Stübi, N. Kaempfer and P. Viatte, 2003: Investigation of systematic uncertainties in Brewer-Mast ozone soundings using observations from a ground-based microwave radiometer, J. Atmos. Ocean. Tech., 20 (11), 1543-1551
Calisesi, Y., H. Wernli and N. Kämpfer, 2001: Midstratospheric ozone variability over Bern related to planetary wave activity during the winters 1994-1995 to 1998-1999, J. Geophys. Res., 106, 7903-7916.
Favaro, G., P. Jeannet and R. Stübi, 2002: Re-evaluation and trend analysis of the Payerne ozone soundings, Veröffentlichung Nr. 63, MeteoSchweiz, Zürich, Switzerland, 63, 99pp
Klausen, J., C. Zellweger, B. Buchmann and P. Hofer: 2003: Uncertainty and bias of surface ozone measurements at selected Global Atmosphere Watch sites, J. Geophys. Res., 108 (D19), Art. No. 4622, doi:10.1029/2003JD003710.
Koch, G., H. Wernli, C. Schwierz, J. Staehelin, and T. Peter (2005), A composite study on the structure and formation of ozone miniholes and minihighs over central Europe, Geophys. Res. Lett., 32, L12810, doi:10.1029/2004GL022062.
Koch, G., H. Wernli, J. Staehelin and T. Peter, 2002: A Lagrangian analysis of stratospheric ozone variability and long-term trends above Payerne (Switzerland) during 1970-2001, J. Geophys. Res., 107 (D19), Art. No. 4373.
Lehmann, A. A., 2001: Direct and diffuse components of erythemal irradiance: measurements and modeling for clear-sky conditions, PhD. thesis, Institute for Atmospheric and Climate Science, Swiss Federal Institute of Technology Zurich, Zurich, Switzerland.
Lindfors, A. and L. Vuilleumier (2005), Erythemal UV at Davos (Switzerland), 1926–2003, estimated using total ozone, sunshine duration, and snow depth, J. Geophys. Res., 110, D02104, doi:10.1029/2004JD005231
Meijer, Y. J., et al. (2004), Pole-to-pole validation of Envisat GOMOS ozone profiles using data from ground-based and balloon sonde measurements, J. Geophys. Res., 109, D23305, doi:10.1029/2004JD004834.
Müller, G., and Viatte, P., 2005: The Swiss contribution to the WMO Global Atmospheric Watch Programme – Achievments of the First Decade and Future Prospects, Veröffentlichung Nr. 70, MeteoSchweiz, Zürich, Switzerland, 70, 112pp.
Reimann, S., D. Schaub, K. Stemmler, D. Folini, M. Hill, P. Hofer, B. Buchmann, P.G. Simmonds, B.R. Greally and S. O'Doherty, 2004: Halogenated greenhouse gases at the Swiss High Alpine Site of Jungfraujoch (3580 m asl): Continuous measurements and their use for regional European source allocation, J. Geophys. Res.,109, Art. No. D05307.

256
Staehelin, J., J. Kerr, B. Evans and K. Vanicek, 2003: Comparison of total ozone measurements of Dobson and Brewer spectrophotometers and recommended transfer functions, GAW Report, 149.
Staehelin, J., A.J. Mäder, K. Weiss and C. Appenzeller, 2002: Causes of northern mid-latitude stratospheric ozone trends, Physics and Chemistry of the Earth, 27, 461-469.
Staehelin, J., and A.K. Weiss, 2001: Swiss history of atmospheric ozone research and results of long-term Swiss ozone measurements, Ozon - Sci. Eng., 23, 461-466.
Stübi, R, 2002: SONDEX/OZEX Campaigns of dual ozonesondes flights: report on the data analysis, Veröffentlichung Nr. 65, MeteoSchweiz, Zürich, Switzerland, 65, 76pp.
PROJECTS AND COLLABORATION
Besides of the activities in the framework of the national and international monitoring and research programmes, Switzerland contributes to the international WMO/GAW programme through the following services and cooperations:
support to the ozone sounding station Nairobi of the Kenyan Meteorological Institute, World Optical Depth Research Centre (WORCC) at Physikalisch-Meteorologisches Observatorium / World Radiation Centre (PMOD /WRC) in Davos World Calibration Centre (WCC) and Quality Assurance /Science Activity Centre (QA/SAC) for Surface Ozone, carbon monoxide and methane at the Swiss Federal Laboratories for Materials Testing and Research (EMPA) in Dübendorf. Support to the Jungfraujoch site which recently reached to the status of global GAW station
At the national level, there is an important cooperation between the national Weather and Climate office (MeteoSwiss) and the academic and research institutions. This collaboration organised within a national GAW-CH programme allows to support research projects for the development and improvement of the monitoring programme as well as for the data analysis.
Other participations are related to: satellites validations campaigns (ENVISAT, ODIN, AURA …) with the different instruments mentioned above, The development of Standard Operating Procedures for ECC ozone sondes, Participation to COST EU actions, …
FUTURE PLANS
Dobson and Brewer total ozone series difference will be further analyzed and the developed transfer functions will be made available for use in the operational measurements at Arosa, Update of the Dobson and Brewer Umkehr retrieval algorithm, Study of the long term tropospheric ozone series of Payerne and other sites using trajectory analysis, Use of the merged soundings and SOMORA ozone profiles to take profit of the high time resolution and high vertical coverage to investigate phenomena such as solar cycle, QBO (Quasi Biannual Oscillation), planetary waves, etc, Development of the Brewer data processing to get other parameters like aerosol optical depth (AOD) or the ozone layer effective temperature, Developing the capability of measuring the solar irradiance in other spectral bands within the CHARM network, Improve the link between the CHARM radiation measurements and future cloud detection systems, Integration of the Alpine Surface Radiation Budget (ASRB) network of 11 stations within the Alpine Arc to the radiation monitoring programme, WCC, QA/SAC (EMPA): development and maintenance of the meta-data information system GAWSIS at WMO will be carried on.
****

257
TURKEY
OZONE AND ULTRAVIOLE RADIATION OBSERVATIONS IN TURKEY
Ozone Observations
Ozone measurements have been made by an ozonesonde instrument at Ankara, Turkey since early 1994 by the Turkish State Meteorological Service. Ankara is located at 32° 53’ (E) Longitude and 39° 57’ (N) Latitude with an altitude of 891 m. Ankara is capital of Turkey and situated in the mid-northern part of the Central Anatolia Region. Ozone observations have been operated in every one or two weeks or sometimes a month since beginning. Therefore, daily measurements are not available. Total ozone column is detected with this operation. It is possible to find vertical ozone distribution, vertical ozone profile, in this way. Up to now, total 246 balloon have been launched and 222 daily total ozone column data have been obtained. The 24 observations could not be performed due to the different reasons such early exploding of the balloon.
The measured ozone data is sent to the ‘World Ozone and Ultraviolet Radiation Data Centre’ (WOUDC) in order to be archived and published. The station number of Ankara is 348 in WOUDC.
The quality of the ozone data obtained from ozonsonde instrument has been evaluated taking into account the Total Ozone Mapping Spectrometer (TOMS) data obtained aboard the Earth Probe Satellite. A preliminary comparison study was made by using the Ankara’s data and the TOMS’ data. Total 86 TOMS’ ozone data for Ankara location was obtained from the NASA Goddard Space Centre, and a correlation was found between the TOMS and the Ankara’s ozonsonde data. The rather, high correlation coefficient of 0.89 was detected in this study. This result is statistically significant and shows that there is a good agreement between these data set. At the same study, relative errors of the ozonsonde data were computed based on the TOMS data is reliable. The mean relative error was found as 2.4 percent. All results showed that ozone measurements in Turkey are reliable.
The ozone time series of Ankara was also analysed statistically and looked for trend at the evaluation studies of the Turkey’s ozone data. Any significant trend was detected, no clear decrease or increase. The extreme values in ozone time series were found as 232 DU and 450 DU. The mean total ozone column was computed as 315 DU. This values were very close to the values of documents of WMO and UNEP (The changing ozone layer, Rumen D. Bojkov,1995).
On the other hand, we have some doubt for our ozonsonde instrument. So, ozonsonde includes 2 part, transmitter and ozonsonde. Before every observation it is necessary to calibrate ozonsonde part of instrument with an ozonizer/test unit. However, maintenance of the current ozonizer/test unit has never been done since beginning.
Ozone Forecast
Turkish State Meteorological Service (TSMS) has given its attention to the ozone forecast for the last one year. Some ozone forecasting models have been evaluated in the Research Department of TSMS. It has been decided to use a statistical regression model originally given by Long et al.( Bull. Am. Met. Soc. Vol.77, 1996). This model uses geopotential height and temperature together for standard pressure levels (500, 100 and 50 hPa) in forecasting total ozone column. Firstly data set including daily ozone, upper atmospheric radiosonde data covering 500 and 100 hPa geopotential heights and 50 hPa temperature measurements obtained. TOMS ozone data was used in that study because of daily ozone data is not available in TSMS. Therefore, estimated ozone data have been obtained only for the period of January 2000 – March 2001.

258
Estimated and measured ozone data for each day have been compared. It has been found that this model can estimate total ozone column with an about 9 percent relative error. Although estimated data series exhibit an agreement with measured data, some discernible deviations are detected. It has been computed that the 11 percent of estimated data showed excess deviations. All results show that model could be used to forecast total ozone column.
On the other hand a new study has been started to improve ozone forecasting model. In this study the relationships between ozone and upper air meteorological parameters for Ankara, Turkey have been investigated. It was seen that geopotential height of 500 and 100 hpa levels and the temperature thickness of 300 and 200 hpa levels have rather high statistical significant relationship with the ozone. The regression model has been designed with these new parameters. It was seen that the early results of the new upgraded model have better results statistically. The studies on this model have been going on.
UV-B Observations
The B band of the ultraviolet radiation has been measured with an UV-B recorder named Model 501 in two one location, Ankara and Antalya (located on southern coast of Turkey and at 54 m. Altitude, 30° 44’ (E) Longitude and 36° 42’ (N) Latitude).
The UV-B observations were started on 3 January 1997 at Ankara, and on 21 May 1997 at Antalya. There is any problem on the UV-B time series of Ankara. However, time series of Antalya has some gaps and missing data. Uv-B recorder hasn’t work in Antalya from August 2003. But this year we are planning to establish new instrument.
UV-B data have never been evaluated climatologically and statistically because of the very short time series.
Although, this year has been started Uv-Index forecasting in Ankara by using Canadian Empirical Model.
PLANNED STUDIES
Planned studies for the period of 2005 – 2008 are as follows:
- To have more strong ozone and UV-B network in Turkey with three Spectrometers andtwenty UV-B recorders;
- To detect troposferik ozone profile; - To detect stratospheric ozone profil; - To product daily ozone forecast routinely; - To make UV index forecast routineliy; - To analyse time series of the ozone and the UV-B; - To evaluate effects of the changes in the ozone and UV-B time series on the climate.
****
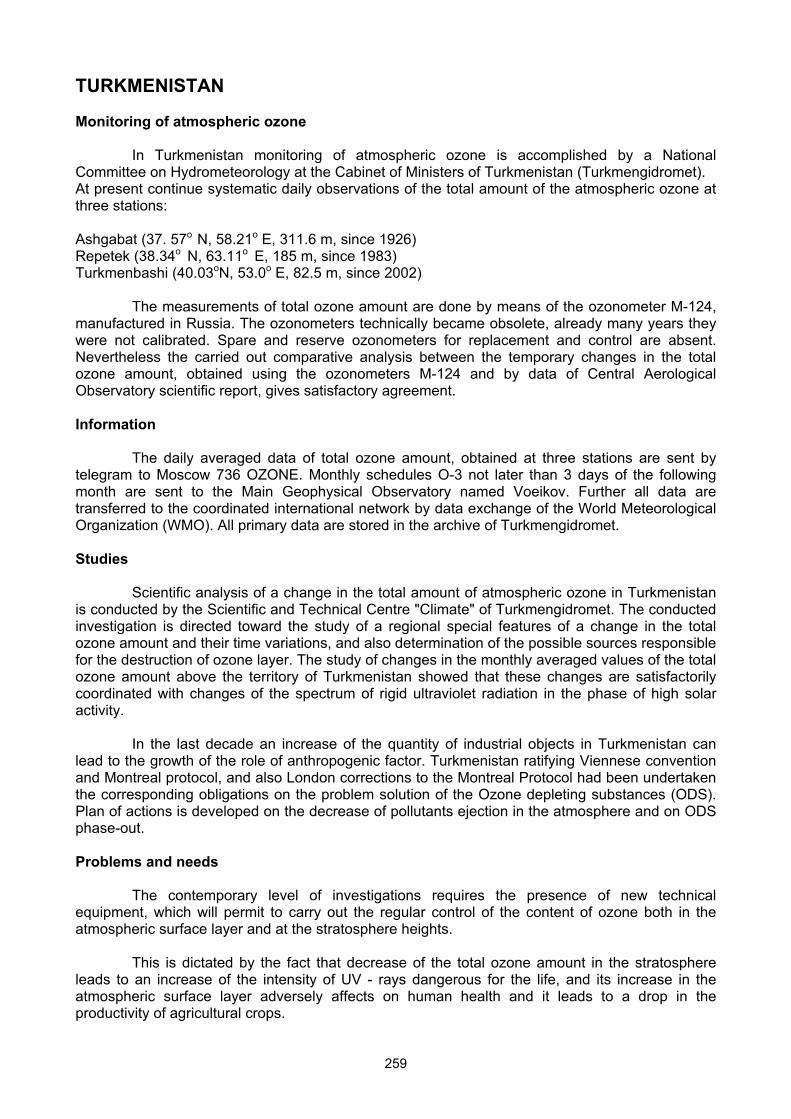
259
TURKMENISTAN
Monitoring of atmospheric ozone
In Turkmenistan monitoring of atmospheric ozone is accomplished by a National Committee on Hydrometeorology at the Cabinet of Ministers of Turkmenistan (Turkmengidromet). At present continue systematic daily observations of the total amount of the atmospheric ozone at three stations:
Ashgabat (37. 57 N, 58.21 , 311.6 m, since 1926) Repetek (38.34 N, 63.11 , 185 m, since 1983) Turkmenbashi (40.03 N, 53.0 , 82.5 m, since 2002)
The measurements of total ozone amount are done by means of the ozonometer M-124, manufactured in Russia. The ozonometers technically became obsolete, already many years they were not calibrated. Spare and reserve ozonometers for replacement and control are absent. Nevertheless the carried out comparative analysis between the temporary changes in the total ozone amount, obtained using the ozonometers M-124 and by data of Central Aerological Observatory scientific report, gives satisfactory agreement.
Information
The daily averaged data of total ozone amount, obtained at three stations are sent by telegram to Moscow 736 OZONE. Monthly schedules O-3 not later than 3 days of the following month are sent to the Main Geophysical Observatory named Voeikov. Further all data are transferred to the coordinated international network by data exchange of the World Meteorological Organization (WMO). All primary data are stored in the archive of Turkmengidromet.
Studies
Scientific analysis of a change in the total amount of atmospheric ozone in Turkmenistan is conducted by the Scientific and Technical Centre "Climate" of Turkmengidromet. The conducted investigation is directed toward the study of a regional special features of a change in the total ozone amount and their time variations, and also determination of the possible sources responsible for the destruction of ozone layer. The study of changes in the monthly averaged values of the total ozone amount above the territory of Turkmenistan showed that these changes are satisfactorily coordinated with changes of the spectrum of rigid ultraviolet radiation in the phase of high solar activity.
In the last decade an increase of the quantity of industrial objects in Turkmenistan can lead to the growth of the role of anthropogenic factor. Turkmenistan ratifying Viennese convention and Montreal protocol, and also London corrections to the Montreal Protocol had been undertaken the corresponding obligations on the problem solution of the Ozone depleting substances (ODS). Plan of actions is developed on the decrease of pollutants ejection in the atmosphere and on ODS phase-out.
Problems and needs
The contemporary level of investigations requires the presence of new technical equipment, which will permit to carry out the regular control of the content of ozone both in the atmospheric surface layer and at the stratosphere heights.
This is dictated by the fact that decrease of the total ozone amount in the stratosphere leads to an increase of the intensity of UV - rays dangerous for the life, and its increase in the atmospheric surface layer adversely affects on human health and it leads to a drop in the productivity of agricultural crops.

260
For obtaining more reliable information about the total ozone amount it is necessary to enlarge a network of regular daily observations, also widely use the data, obtained from the satellites. This can be carried out with the aid of the acting stations equipping by the contemporary instruments and opening of new stations with the technical support of international organizations.
In Turkmengidromet there is necessity in training of young specialists with purpose of effective usage of contemporary instruments for measuring the total amount of atmospheric ozone and ultraviolet radiation. It is also necessary to master the new mathematical models, utilized for the evaluation of local variations in the content of ozone and forecast of the ozone layer behaviour, to continue scientific studies for clarification of reasons, which lead to a change of total ozone amount.
****

261
UNITED KINGDOM
MONITORING STRATOSPHERIC AND BOUNDARY LAYER OZONE
Defra funds an on-going monitoring programme that records total values of stratospheric ozone at two UK locations. At the end of 2003 the measurements from the Dobson instruments at Camborne Observatory were replaced by a Brewer spectrophotometer in Reading. The UK Met Office continues to make measurements with the Dobson instrument at the Lerwick Observatory in the Shetland Islands. The spectrophometers are used to record daily values, except when weather conditions prevent values from being recorded and during the winter in Lerwick when the sun is too low in the sky.
The data are processed daily by the local operators and then quality checked and disseminated. A number of checks are performed in order to ensure the integrity of these data, including comparison of daily results with satellite measurements, and the nearest ground-based measurements. Dissemination involves uploading a ‘best daily average’ to a dedicated web page on the internet and issuing the results to the World Ozone and Ultra Violet Data Centre (WOUDC) Real-time Mapping Centre. Monthly data are submitted to the WOUDC for inclusion on their archive.
Days where the processed total ozone is below two standard deviations less than the long-term average mean for that month are designated as ‘low ozone’ events and are reported to the UK government immediately along with additional analysis.
The Reading Brewer 075 instrument (operated by Manchester University) was serviced and calibrated against a reference standard by IOS (International Ozone Services) in April 2004. It is intended to take both Brewer instruments to the first Regional Brewer Calibration Centre-Europe (RBCC-E) intercomparison exercise for the RA IV region at EL Arenosillo Spain in September 2005.
The Dobson spectrophotometer intercomparison, took place at the Regional Dobson Calibration Centre (MOHP), Hohenpeissenberg, Germany from 9th May 2004 to 29th May 2004. This forms part of the World Meteorological Organisation’s QA/QC programme to assure the quality of the measurements and to assess the performance of the instruments. All instruments are carefully maintained and checked monthly.
Manchester University has two ozone lidar instruments; a fixed system for upper troposphere/lower stratosphere, and a trailer-mounted system for boundary layer/lower troposphere. They are both used on a campaign basis to study particular scientific issues. Most of their recent ozone work has been concerned with the boundary layer.
STRATOSPHERIC OZONE RESEARCH
Defra funds a research project that analyses the ozone data collected at Reading and Lerwick. This research focuses on identifying low ozone events, and predicting how the frequency of low ozone events could alter as stratospheric levels change.
The Natural Environment Research Council (NERC) funds the Upper Troposphere/ Lower Stratosphere (UTLS) OZONE Programme, which commenced in 1999 and will continue for 7 years to 2006. The main aim is to improve understanding of the causes of ozone change in the UTLS in the past, present and future. This is a region where ozone has been changing but the causes still remain uncertain. To date, 43 scientific research projects have been funded which cover a wide variety of research topics. These range from transport of trace gases on annual and seasonal timescales, dynamical processes occurring on short-timescales, studies of chemical processes in the atmosphere and the laboratory and modelling studies of chemistry-climate interactions. This research has led to an improved understanding of chemical composition and structure in the UTLS

262
region between 6 and 20km and has resulted in 157 refereed publications to date. Results from the Programme have shown, in particular, that interactions between dynamics (meteorology) and chemistry in the atmosphere play an important role in governing the distribution of ozone and other trace gases in the UTLS.
The European Commission (EC) research programmes encourage collaborative projects involving research groups in different countries. The European Ozone Research Co-ordinating Unit (EORCU), which is based at the University of Cambridge was set up in 1989 to coordinate stratospheric ozone research in Europe from both the national research programmes and the European Union research programme. There are now many joint projects between European scientists. Those listed below are coordinated by UK institutions.
The UK Met Office was the coordinator of the EuroSPICE project (Stratospheric Processes and their impacts on Climate and the Environment) which completed in 2003 (other partners were: CNRS-SA, France, CNRS_LMD, France, Finnish Met. Inst., Finland, Free University of Berlin, Germany, University of Reading, UK, University of Buenos Aires, Argentina). The specific aim of the EuroSPICE project was to update the observed stratospheric trends in ozone, surface UV and temperature and simulate those trends using climate models with/without coupled chemistry. The simulations were then used to predict the behaviour of these parameters over the period 2000-2019, determining the likely cause of past stratospheric trends and developing understanding of the impact of stratospheric change.
Imperial College, London coordinated SOLICE (SOLar Impacts on Climate and the Environment) was funded under the 5th FP and completed in March 2003 (other partners were: Free University of Berlin, Germany, University of Oslo, Norway, CNRS-SA, France, University of Thessaloniki, Greece, CCLRC, UK, University of Arizona, USA, Goddard Institute for Space Sciences, USA). Objectives included the assessment of the impact of solar variability on stratospheric ozone, radiative forcing and surface UV using coupled chemistry-climate models and to produce 3-D measures of the solar signal in temperature, geopotential height and ozone over the next solar maximum.
The university of Cambridge coordinate SCENIC (Scenario of Aircraft emissions and impact studies on chemistry and climate), which is part of CORSAIRE a European research cluster used to coordinate stratospheric ozone research (5th FP funding) (other partners were Airbus, France, University of Oslo, Norway, Airbus GmbH, Germany, Centre National de Recherches Meteorologiques (CNRM), France, Deutsches Zentrum fur Luft- und Raumfahrt e.V (DLR), Germany, Office National d'Etudes et de Recherches Aerospatiales (ONERA), France, University of L'Aquila, Italy, Airbus, UK, Centre National de la Recherche Scientifique (CNRS), France). SCENIC is investigating the potential future impact of aviation on atmospheric composition and climate, and how possible environmental impacts may be reduced. These questions are addressed by performing modeling studies and will influence the detailed design and operation of a possible new supersonic fleet. Atmospheric researchers and the aviation community are collaborating closely in SCENIC. Specifically, this work package aims to study the direct impact of supersonic emissions of water vapour and NOx on ozone chemistry and transport in the UTLS, and secondly the feedback of climate change, due to supersonic aircraft emissions, on ozone chemistry and transport.
TROPOSPHERIC OZONE MONITORING AND RESEARCH
Ground-level ozone is recorded hourly at 73 automatic recording stations (52 urban and 19 rural) across the UK.
A number of research programmes both funded by Defra and NERC and looking into the impacts of tropospheric ozone on vegetation and the impact o the global carbon cycle. Research into the impacts of changing tropospheric ozone levels on vegetation has also been funded by Defra.

263
Tropospheric ozone modelling is carried out at the Met Office as part of the Climate Prediction Programme funded by Defra. Prediction of future climate requires predictions of radiatively-active trace gases such as ozone, and a coupled climate-chemistry model has been developed to fulfil these requirements. Work continues to develop and validate chemical and aerosol aspects of the model. Work is underway to validate the model against ozonesonde (a lightweight, balloon-borne instrument that is mated to a conventional meteorological radiosonde) and other measurements.
Defra also fund a project across a number of UK Universities to develop tropospheric ozone models. Forecasting the formation of ground-level ozone requires the use of sophisticated numerical models to understand the factors affecting its production and subsequent control. The objective of the project is to develop a modelling capability to treat ozone formation (a) on all spatial scales from urban areas at high spatial resolution to the global scale so that ozone production on the regional and global scales is linked and (b) from timescales of hours, to reproduce the diurnal behaviour of ozone to decades so that the influence of climate change can be assessed.
MONITORING OZONE-DEPLETING SUBSTANCES
Defra has provided support for projects that monitor ozone-depleting substances by analysing ground-based measurements at Mace Head (Ireland). Since 1987, high frequency, real time measurements of the principal halocarbons and radiatively active trace gases have been made at Mace Head, Ireland.
Using the Mace Head data and a Lagrangian dispersion model, NAME (Numerical Atmospheric dispersion Modelling Environment), driven by the output from the U.K. Met Office’s Numerical Weather Prediction model it is possible to estimate Northern Hemisphere baseline concentrations for each trace gas and their European and UK emission distributions. This verification work is consistent with good practice guidance issued by the Intergovernmental Panel on Climate Change (IPCC).
MONITORING AND RESEARCH INTO EFFECTS OF INCREASED UV-B RADIATION
Two UV monitoring sites are in operation – there is a green-field site at Reading, and a city site in Manchester. The Reading site spectroradiometer is calibrated on site and has been providing regular measurements since 1993. It provides hourly spectrums between sunrise and sunset in the 280-500nm range. Periodic international comparisons with other UV spectroradiometers have provided consistently good results. The Manchester instrument provides five minute averages in each of five narrow wavebands (305, 313, 320, 340, 380nm). Apart from calibration periods, the instrument has been in continuous operation since 1997, and provides a southern site in the Nordic network of GUV radiometers. The measurement data are submitted to the World Ozone and Ultraviolet Data Centre.
The solar UV index is measured at seven the sites in the UK by the Radiation Protection Division of the Health Protection Agency. The Department of Health provides support for UV monitoring performed by the National Radiological Protection Board (NRPB). The Solar Radiation Monitoring Project at NRPB provides information for the Global Solar UV Index in association with WHO, WMO, UNEP and the International Commission on Non-Ionizing Radiation Protection.
Commitment to future monitoring and research
At this stage Defra has not specified the areas that will receive direct government funding in the future. However, given the high priority of VCV/3 part (d), some research into stratospheric interactions and climate will be included in the contract funded by Defra at the Met Office. Monitoring of a comprehensive range of ODSs will be funded, for at least the next three years, in

264
line with VCV/3 part (a). The current basic level of ozone monitoring will be maintained, but any expansion of the monitoring activities will depend on budgetary constraints.
NERC are planning to support future ozone research through their UTLS (Upper Troposphere Lower Stratosphere) completing in 2006 www.utls.nerc.ac.uk.
Further information
Details of Defra funded research, including the full reports for scientific contracts, can be accessed from the Defra website at www.defra.gov.uk by following the links to the environment pages.
****

265
UNITED STATES OF AMERICA
OBSERVATIONAL ACTIVITIES
Column Measurements
Ozone
BUV/SBUV/SBUV-2 Satellite Instrument Series (8 Instruments)
The Backscatter Ultraviolet (BUV) and Solar Backscatter Ultraviolet (SBUV) instrument series has produced the longest satellite record for column ozone (April 1970 to the present, with a data gap between 1974 and 1978). NOAA plans to continue the SBUV-2 series on its Polar Orbiting Environmental Satellites (POES) through the end of this decade. Data from the NASA Nimbus-7 satellite and the NOAA POES have been recently reprocessed using the SBUV version 8 algorithm developed at NASA to achieve a cohesive data set standardized to Nimbus-7. The algorithm has been optimized for deriving trends, and for deriving accurate total ozone at large solar zenith angles (75˚ to 88˚), since it does simultaneous retrieval of ozone profile and total ozone. The data set consists of monthly average total ozone in 10 latitude bands from January 1979 to December 2004. (NOAA/CPC, NASA)
Total Ozone Mapping Spectrometer (TOMS) Instrument Series (4 Instruments)
The TOMS series of instruments has produced daily global maps of column ozone at solar zenith angles up to 84º since November 1978, with a data gap between April 1993 and July 1996. Data recently have been reprocessed using the TOMS version 8 algorithm, which minimizes aerosol effects and performs better at large solar zenith angles, though not as well as SBUV V8. Data quality of EP/TOMS has degraded since 2000 because of instrument problems. Corrections are being developed using SBUV-2. (NASA)
Ozone Monitoring Instrument (OMI) on the Aura Satellite
Built with collaboration between the Netherlands and Finland, and operating since August 2004 on the EOS Aura satellite, this hyperspectral imaging spectrometer continues the total column ozone record begun with the Nimbus-7 TOMS instrument. Two different total ozone algorithms are utilized, one based on the TOMS heritage and the other on the GOME/DOAS heritage. The algorithms agree well in cloud-free areas, but vary by up to 10% in cloudy areas and at large solar zenith angles. Lack of sufficient “ground-truth” for conditions where they differ makes the assessment of data quality difficult at the present time. (NASA)
Dobson Network
Dobson total column ozone measurements in the U.S. are done through the NOAA/CMDL Cooperative Network at 16 locations, including 10 national sites in the continental U.S. and Hawaii. Five other sites are collaborative international programmes (South Pole, Perth, Lauder, Samoa, OHP). Data are used for satellite validation and determining ozone trends for the WMO/UNEP Ozone Assessments. NASA also supports Dobson measurements within the U.S. under the auspices of the Network for the Detection of Stratospheric Change (NDSC, see Section 1.1.2.3) (NOAA/CMDL, NASA)
UVB Monitoring and Research Programme (UVMRP)
Direct-sun column ozone is retrieved by UV Multi-Filter Rotating Shadowband Radiometers (UV-MFRSRs) at 32 U.S. sites, 2 Canadian sites, and 1 New Zealand site within the U. S. Department of Agriculture (USDA) UV Monitoring and Research Programme (UVMRP). (USDA)
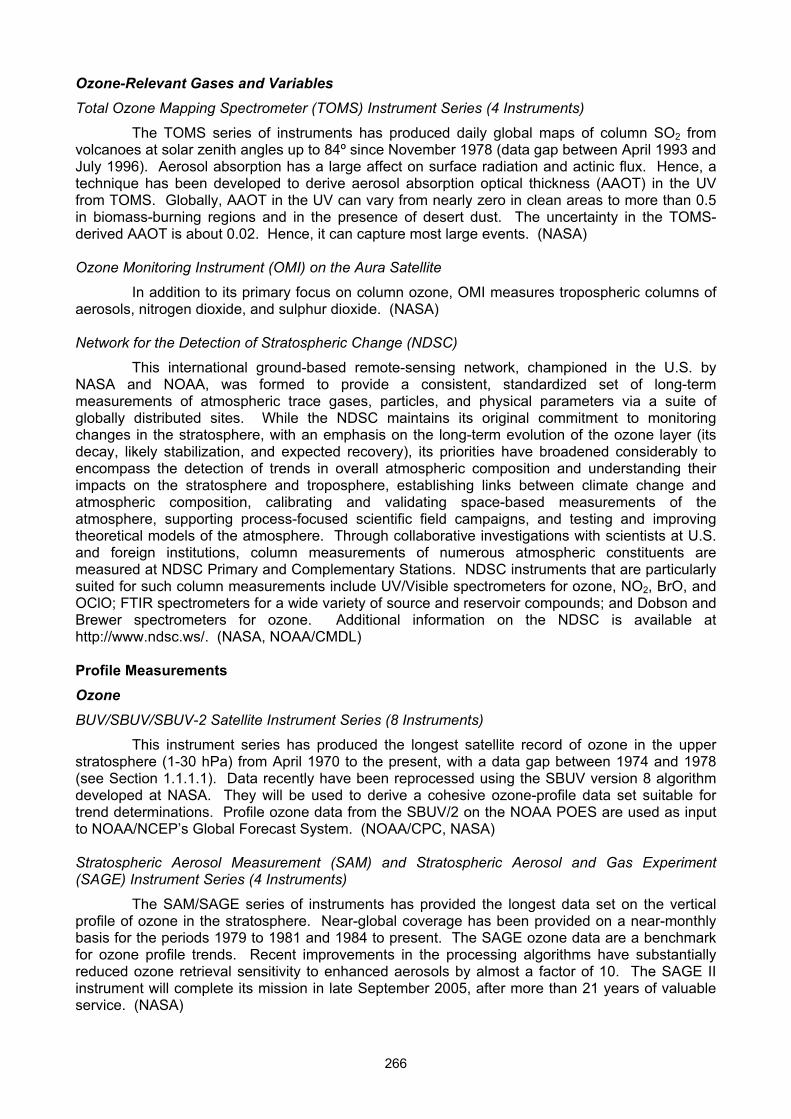
266
Ozone-Relevant Gases and Variables
Total Ozone Mapping Spectrometer (TOMS) Instrument Series (4 Instruments)
The TOMS series of instruments has produced daily global maps of column SO2 from volcanoes at solar zenith angles up to 84º since November 1978 (data gap between April 1993 and July 1996). Aerosol absorption has a large affect on surface radiation and actinic flux. Hence, a technique has been developed to derive aerosol absorption optical thickness (AAOT) in the UV from TOMS. Globally, AAOT in the UV can vary from nearly zero in clean areas to more than 0.5 in biomass-burning regions and in the presence of desert dust. The uncertainty in the TOMS-derived AAOT is about 0.02. Hence, it can capture most large events. (NASA)
Ozone Monitoring Instrument (OMI) on the Aura Satellite
In addition to its primary focus on column ozone, OMI measures tropospheric columns of aerosols, nitrogen dioxide, and sulphur dioxide. (NASA)
Network for the Detection of Stratospheric Change (NDSC)
This international ground-based remote-sensing network, championed in the U.S. by NASA and NOAA, was formed to provide a consistent, standardized set of long-term measurements of atmospheric trace gases, particles, and physical parameters via a suite of globally distributed sites. While the NDSC maintains its original commitment to monitoring changes in the stratosphere, with an emphasis on the long-term evolution of the ozone layer (its decay, likely stabilization, and expected recovery), its priorities have broadened considerably to encompass the detection of trends in overall atmospheric composition and understanding their impacts on the stratosphere and troposphere, establishing links between climate change and atmospheric composition, calibrating and validating space-based measurements of the atmosphere, supporting process-focused scientific field campaigns, and testing and improving theoretical models of the atmosphere. Through collaborative investigations with scientists at U.S. and foreign institutions, column measurements of numerous atmospheric constituents are measured at NDSC Primary and Complementary Stations. NDSC instruments that are particularly suited for such column measurements include UV/Visible spectrometers for ozone, NO2, BrO, and OClO; FTIR spectrometers for a wide variety of source and reservoir compounds; and Dobson and Brewer spectrometers for ozone. Additional information on the NDSC is available at http://www.ndsc.ws/. (NASA, NOAA/CMDL)
Profile Measurements
Ozone
BUV/SBUV/SBUV-2 Satellite Instrument Series (8 Instruments)
This instrument series has produced the longest satellite record of ozone in the upper stratosphere (1-30 hPa) from April 1970 to the present, with a data gap between 1974 and 1978 (see Section 1.1.1.1). Data recently have been reprocessed using the SBUV version 8 algorithm developed at NASA. They will be used to derive a cohesive ozone-profile data set suitable for trend determinations. Profile ozone data from the SBUV/2 on the NOAA POES are used as input to NOAA/NCEP’s Global Forecast System. (NOAA/CPC, NASA)
Stratospheric Aerosol Measurement (SAM) and Stratospheric Aerosol and Gas Experiment (SAGE) Instrument Series (4 Instruments)
The SAM/SAGE series of instruments has provided the longest data set on the vertical profile of ozone in the stratosphere. Near-global coverage has been provided on a near-monthly basis for the periods 1979 to 1981 and 1984 to present. The SAGE ozone data are a benchmark for ozone profile trends. Recent improvements in the processing algorithms have substantially reduced ozone retrieval sensitivity to enhanced aerosols by almost a factor of 10. The SAGE II instrument will complete its mission in late September 2005, after more than 21 years of valuable service. (NASA)

267
Upper Atmosphere Research Satellite (UARS) Instruments
The UARS HALOE instrument has measured profile ozone since September 1991. UARS measurements are scheduled for termination on 8 December 2005. EOS Aura instruments will continue to make most of these measurements (ozone, H2O, CH4, NO2, HCl, and temperature). (NASA)
Polar Ozone and Aerosol Measurement (POAM) Satellite Instrument Series
The POAM solar occultation instruments (POAM II, 1994 to 1996; POAM III, 1998 to present) continue to provide high-latitude (55oN to 71oN and 63oS to 88oS) measurements of ozone from the upper troposphere to the lower mesosphere. Through most of the POAM measurement period, it has been the only satellite instrument to provide continuous, high-vertical-resolution measurements of stratospheric ozone in the ozone hole region. Recently, this data record has been used to show a significant decrease in the amount of ozone loss at the top of the ozone hole in the past four years (2001 to 2004) relative to that observed during the first six POAM measurement years. (DoD/NRL, NASA)
Aura Satellite Instruments
Aura, the third and last of the NASA Earth Observing System (EOS) observatories, was launched on 15 July 2004, and was designed to make comprehensive stratospheric and tropospheric composition measurements from its four instruments, the High-Resolution Dynamics Limb Sounder (HIRDLS), the Microwave Limb Sounder (MLS), the Ozone Monitoring Instrument (OMI), and the Tropospheric Emission Spectrometer (TES). MLS, HIRDLS, and TES each were designed for measuring ozone profiles. MLS was turned on shortly after launch, and has been delivering ozone-profile data for the upper troposphere and stratosphere since that time. After activation, HIRDLS was found to have a blockage in the optical path. However, even with the 80% blockage, measurements at high vertical resolution still can be made at one scan angle, and ozone profile retrievals recently have been demonstrated. Nevertheless, HIRDLS will not have its designed horizontal coverage, nor will it be able to make measurements over the Antarctic. After launch, the TES translator mechanism began to show signs of bearing wear. The instrument was commanded to skip the limb-sounding modes in May 2005, and will not obtain ozone profiles via this mode of operation; however, some ozone profile information may be derived from the nadir measurements. (NASA)
Balloonborne Measurements
NOAA routinely conducts ozonesonde measurements at nine locations. These include five domestic sites (Hawaii, California, Colorado, Alabama, Rhode Island) and four international sites (South Pole, Fiji, Samoa, Galapagos). NASA supports the operations of the Southern Hemisphere Additional Ozonesonde (SHADOZ) network of ozonesonde launches from several locations in the tropics and southern subtropics. This network operates in collaboration with NOAA and numerous international partners. NASA also flies ozonesondes and an ozone photometer as components of near-annual, moderate-scale balloon campaigns. Additional ozone profiles are obtained during such campaigns using a submillimeter/millimeter-wave radiometer, an infrared spectrometer, and a far-infrared spectrometer. (NOAA/CMDL, NASA)
Dobson Umkehr
Profiles are obtained from six automated Dobson instruments using the Umkehr technique (Lauder, Perth, Hawaii, Boulder, OHP, Fairbanks). Through collaboration between NASA and NOAA, a new ozone-profile algorithm has been developed to process Dobson Umkehr data. This algorithm is similar to the SBUV V8 algorithm, and has been optimized for deriving trends. (NOAA/CMDL, NASA)
Network for the Detection of Stratospheric Change (NDSC)
Two of the remote sensing instruments designated as primary components of the NDSC are providing long-term profile measurements of ozone. These are the lidars (which measure in

268
both the troposphere and stratosphere) and the microwave radiometers (whose retrievals are limited primarily to the stratosphere). Ozonesondes routinely launched at many NDSC stations also provide ozone-profile data. In addition, several of the high-resolution FTIR spectrometers are beginning to yield ozone-profile information. (NASA, NOAA/CMDL)
Ozone-Relevant Gases and Variables
Stratospheric Aerosol Measurement (SAM) and Stratospheric Aerosol and Gas Experiment (SAGE) Instrument Series (4 Instruments)
The SAM/SAGE series of instruments has provided the longest data set on the vertical profile of aerosols in the stratosphere. Near-global coverage has been provided on a near-monthly basis for the periods 1979 to 1981 and 1984 to present. Recent improvements in the processing algorithms have produced a fully usable water vapour product for the first time. The SAGE II instrument will complete its mission in late September 2005, after more than 21 years of valuable service. (NASA)
Upper Atmosphere Research Satellite (UARS) Instruments
The UARS HALOE instrument has measured profile H2O, CH4, NO, NO2, HCl, HF, and temperature since September 1991. UARS measurements are scheduled for termination on 8 December 2005. EOS Aura instruments will continue to make most of these measurements (ozone, H2O, CH4, NO2, HCl, and temperature). The UARS SOLSTICE and SUSIM instruments measure UV light above the atmosphere between 115 and 410 nm, a wavelength range that impacts both the production and loss of ozone. These measurements started in September 1991, and are scheduled for termination in early August 2005. Instruments on the SORCE satellite will continue these measurements. The UARS PEM instrument measures proton and electron flux into the atmosphere. These measurements started in September 1991, and are scheduled for termination in early August 2005. Instruments on the NOAA GOES and POES satellites will continue these measurements. (NASA)
Polar Ozone and Aerosol Measurement (POAM) Satellite Instrument Series
The POAM instruments continue to provide high-latitude (55oN to 71oN and 63oS to 88oS) measurements of H2O, NO2, and aerosol extinction from the upper troposphere to the lower mesosphere. POAM measurements indicate that there were fewer polar stratospheric clouds (PSCs) between 2001 and 2004 at these altitudes, suggesting that the reduced ozone loss also observed is primarily the result of a change in meteorology (toward warmer conditions) in the Antarctic stratosphere over the past four winter seasons. (DoD/NRL, NASA)
Aura Satellite Instruments
In addition to ozone-profile measurements, the four Aura instruments were designed to provide profile measurements of numerous other atmospheric constituents and parameters in the stratosphere and troposphere. MLS has been delivering profiles of temperature, H2O, ClO, BrO, HCl, OH, HO2, HNO3, HCN, N2O, and CO since the instrument was activated. Despite the optical path blockage, HIRDLS likely will retrieve profiles of temperature, H2O, CH4, N2O, NO2, HNO3,N2O5, CF3Cl, CF2Cl2, ClONO2, and aerosols. Nevertheless, HIRDLS will not have its designed horizontal coverage, nor will it be able to make measurements over the Antarctic. Because of the issues discussed above for TES, no profile data will be obtained via limb scanning; however, some profile information may be derived from the nadir measurements of temperature, CO, H2O, and CH4. (NASA)
Balloonborne Measurements
NOAA monitors upper tropospheric and stratospheric water vapour using cryogenic, chilled-mirror hygrometers that are flown in combination with ozonesondes on a biweekly schedule in Boulder, CO, and at Lauder, New Zealand, in collaboration with NIWA. Water-vapour profiles also are obtained on a campaign basis in Indonesia, the Galapagos, and Hawaii. NASA supports the flights of several balloon instruments (primarily on a campaign basis) capable of providing

269
profile information for numerous atmospheric constituents. In situ measuring instruments include a whole-air sampler, gas chromatograph, and TDL and NDIR spectrometers. Over the last decade, near-annual deployments of a NOAA automated gas chromatograph on NASA’s Observations of the Middle Stratosphere (OMS) in situ balloon gondola have revealed distinct changes in the 0- to 32-km vertical profiles of ozone-depleting substances (ODSs) and other gases. Flights of remote-sensing instruments (a submillimeter/millimeter wave radiometer, an infrared spectrometer, and a far-infrared spectrometer) also have been conducted on an annual basis. It should be noted that the total column abundance for various atmospheric altitude regions can be derived from the profile data for a particular species. (NOAA/CMDL, NASA)
Airborne Measurements
NASA-sponsored airborne campaigns, using both medium- and high-altitude aircraft, have been conducted with NOAA, NSF, and university partnerships, with a focus on satellite validation and scientific study of ozone and climate change. While designed more for process study than for trend determinations, the airborne measurements have provided a unique view of changes in atmospheric composition at various altitudes in response to source forcings. For example, gas chromatographic measurements taken from high-altitude aircraft (ER-2, WB-57F) in the upper troposphere and lower stratosphere since 1991 have established a 14-year record of the amounts of chlorine and bromine entering the stratosphere, and the halogen loading in the lower stratosphere. (NASA, NOAA, NSF)
Network for the Detection of Stratospheric Change (NDSC)
Several of the remote sensing instruments designated as primary components of the NDSC provide profile data for a variety of ozone-relevant gases and variables. These include temperature, water vapour and aerosol measurements by lidars, and water vapour measurements by microwave radiometers. Aerosol-backscatter profiles obtained weekly by NOAA in Colorado, Hawaii, and Samoa are able to detect an increase in stratospheric particle surface area resulting from major volcanic eruptions and capable of affecting heterogeneous chemical ozone loss. The NRL ground-based Water Vapour Millimeterwave Spectrometer (WVMS) instruments measure 40- to 80-km water vapour at Lauder, New Zealand (1992 to present); Table Mountain, California (1993 to 1997, 2003 to present); and Mauna Loa, Hawaii (1996 to present). These measurements confirmed and validated the large increase in water vapour observed by the UARS HALOE instrument in the early 1990s, they show that this trend ceased in the mid-90s, and they demonstrate that there has been (at most) a very small (<0.5%) negative (decreasing) trend in upper stratospheric/lower mesospheric water vapour since late 1996. (NASA, NOAA/CMDL, DoD/NRL)
Ground-Based In Situ Measurement Networks
Weekly to bi-weekly flask samples are collected at 13 globally distributed sites and are analyzed on three instruments at NOAA/CMDL for a total of ~25 gases, most of which are involved in ozone depletion (including all of the gases regulated under the Montreal Protocol). NASA supports a flask sampling effort conducted by the University of California, Irvine (UCI), under which seasonal sampling is conducted at 40 to 50 sites ranging from 71ºN to 47ºS. These flask data provide the basis for determining global, tropospheric trends of these gases and for computation of effective equivalent chlorine (EECl) in the atmosphere. (NOAA/CMDL, NASA)
The NASA Advanced Global Atmospheric Gases Experiment (AGAGE) network conducts high-frequency measurements at five globally distributed sites of many of the halocarbons identified as ODSs, and it has the longest continuous observational record for such species, extending back more than 25 years for some CFCs. New advanced instrumentation now permits the monitoring of many of the CFC replacements, thereby enabling a tracking of such chemicals from their first appearance in the atmosphere. Similar instruments maintained at the four NOAA Baseline Observatories (South Pole, Samoa, Mauna Loa, Pt. Barrow) and at a remote, cooperative research site (Niwot Ridge, Colorado), obtain high-frequency measurements (~hourly) of 10 ozone-depleting gases, including all of the major ozone-depleting gases and most of the Group I and II ozone depleters. Measurement and standards intercomparisons between the AGAGE and

270
NOAA/CMDL networks and with other international collaborators are leading to an improved long-term database for many ozone- and climate-related gases. These measurements also provide independent records for verifying flask analyses and help to understand the processes that contribute to atmospheric variability of these gases. (NOAA/CMDL, NASA)
UV Irradiance Measurements
Broadband Measurements
SURFRAD Network
Seven Surface Radiation Budget Network (SURFRAD) sites operate Yankee Environmental Systems, Inc. (YES) UVB-1 broadband radiometers. The ISIS network of solar measurements includes broadband Solar Light 501 UVB biometers at each of nine sites. Other instrumentation (located at the Table Mountain test facility near Boulder, Colorado) includes a triad of calibration-reference YES UVB-1 broadband radiometers, and two calibration reference Solar Light 501 UVB biometers. Several other broadband UV radiometers also are operated at the Table Mountain site. These include a Scintec UV radiometer, two types of Kipp & Zonen broadband UV radiometers, an EKO UV radiometer, and a Solar Light 501 UVA biometer. (NOAA/SRRB)
CMDL Network
Supplemental measurements of UV-B using YES UVB-1 instruments continue at Boulder, Colorado and Mauna Loa, Hawaii, where high-resolution UV spectroradiometers also are operated and can be used to interpret accurately the broadband measurements. (NOAA/CMDL)
USDA UVB Monitoring and Research Programme (UVMRP)
Thirty-four YES UVB-1 radiometers are fielded under this programme (see Section 1.1.1.5). (USDA)
Narrowband Filter Measurements
SURFRAD Network
Currently operating at the Table Mountain test facility in Colorado are a Biospherical Instruments GUV-511 UV radiometer, a Smithsonian 18-channel UV narrow-band radiometer, and two YES UV-MFRSRs. A YES UV-MFRSR soon will be deployed at the Central Ultraviolet Calibration Facility’s High-Altitude Observatory at Niwot Ridge, Colorado. (NOAA/SRRB)
CMDL Network
Narrowband radiometers (Biospherical Instruments, GUV, 305 nm, 313 nm, 320 nm, and 380 nm) are used at three sites in Alaska. These sites were established in 1998 and operated for about two years with initial funding, but have been operated in a minimal-maintenance mode since. One site was discontinued in 2003 when it was determined that the combination of on-site support and data communications problems were prohibitive. Initial and subsequent calibrations of the instruments have been performed by the manufacturer. Due to reductions in personnel and funding, since 2001 the instrument calibration schedules have been reduced and adequate quality control has not yet been applied to the data. (NOAA/CMDL)
USDA UVB Monitoring and Research Programme (UVMRP)
UV-MFRSRs deployed within this network measure total and diffuse horizontal and direct normal irradiance at 300, 305, 311, 317, 325, 332, and 368 nm with a 2.0-nm bandpass. (USDA)
NSF UV Monitoring Network
Biospherical Instruments (BSI) GUV-511 moderate bandwidth multi-channel radiometers are deployed at five of the seven network sites (McMurdo and Palmer Station in Antarctica, San Diego California, Barrow Alaska, and Summit Greenland). A BSI GUV-514 radiometer is deployed at the South Pole. (NSF)

271
Spectroradiometer Measurements
Total Ozone Mapping Spectrometer (TOMS) Instrument Series
Data from this series of satellite instruments, originally designed for column ozone retrievals, have been used to produce daily global maps of spectral UVB and UVA since November 1978, with a data gap between April 1993 and July 1996. The data are most useful for tracking weekly and long-term variability of UVB/UVA at ~100-km spatial scales. The data recently have been reprocessed using an improved algorithm. Aerosol absorption (due to soot and mineral dust) and clouds over snow are the largest error sources. The NASA Goddard Space Flight Center (GSFC) and Finnish Meteorological Institute (FMI) are collaborating to develop advanced algorithms that correct these effects. (NASA)
Ozone Monitoring Instrument (OMI) on the Aura Satellite
The space-based UVB measurements begun with the TOMS instruments (see Section 1.3.3.1) will continue with OMI. FMI is responsible for producing the UVB product, and is collaborating with NASA GSFC on the algorithm development. (NASA)
SURFRAD Network
A high-precision UV spectroradiometer and a UV spectrograph are located at the Table Mountain Test Facility in Colorado under the auspices of this programme. (NOAA/SRRB)
Network for the Detection of Stratospheric Change (NDSC)
State-of-the-art, high-resolution spectroradiometric UV observations are conducted as a part of the NDSC at several primary and complementary sites. In particular, U.S. collaboration with NIWA (New Zealand) enables such measurements at Mauna Loa, HI and Boulder, CO. The measurements at Mauna Loa were started in 1995, those in Boulder began in 1998, and they continue to the present. (NOAA/CMDL)
NSF UV Monitoring Network
BSI SUV-100 high-resolution scanning spectroradiometers are deployed at all seven network sites (McMurdo Station, Palmer Station, and South Pole Station in Antarctica; San Diego California; Barrow, Alaska; Summit, Greenland; and Ushuaia, Argentina). A BSI SUV-150B spectroradiometer is also deployed at Summit, Greenland. (NSF)
UV-Net Programme
Brewer Mark IV spectrometers that measure the spectrum between 290 and 325 nm are deployed at all 21 network sites located in 14 U.S. national parks and 7 urban areas around the U.S. (EPA)
Calibration Activities
BUV/SBUV/SBUV-2 Satellite Instrument Series (8 Instruments)
To produce recently released V8 data, instruments were carefully cross-calibrated using internal methods. Derived trends are independent of ground-based network and other satellite data. (NOAA/CPC, NASA)
Total Ozone Mapping Spectrometer (TOMS) Instrument Series (4 Instruments)
The TOMS instruments have been cross-calibrated against the SBUV instrument series. Thus, the SBUV series provides the calibration, while TOMS provides the coverage. (NASA)

272
Ozone Monitoring Instrument (OMI) on the Aura Satellite
The OMI column ozone dataset released thus far is based on the TOMS V8 algorithm, which has been calibrated against SBUV. Future release, based on the DOAS algorithm, will be independent of SBUV. (NASA)
Dobson Network
World Standard Dobson No. 83 is maintained at NOAA/CMDL as part of the World Dobson Calibration Facility, and regularly participates in international intercomparisons of regional and national standards. (NOAA/CMDL)
Network for the Detection of Stratospheric Change (NDSC)
Several operational protocols have been developed to insure that NDSC data is of the highest long-term quality as possible within the constraints of measurement technology and retrieval theory at the time the data are taken and analyzed. Validation is a continuing process through which instruments and their associated data analysis methods must be validated before they are accepted in the NDSC and must be continuously monitored throughout their use. Several mobile intercomparators within the various NDSC instrument types exist to assist in such validation. (NASA, NOAA/CMDL)
Ground-Based In Situ Measurement Networks
Both the NOAA/CMDL and NASA/AGAGE networks independently develop and maintain highly accurate and precise calibration scales at ppt and ppb levels for the major and minor long-lived ozone-depleting gases. In addition, both networks are developing reliable calibration scales for the short-lived halogen-containing gases that have been introduced as CFC replacements. These new calibration scales support research which addresses the roles of the very short-lived gases that may help explain the apparent imbalance between bromine in the stratosphere and in the troposphere. The International Halocarbons in Air Comparison Experiment (IHALACE) is being supported and should help to form a basis for developing a homogeneous record of halocarbon atmospheric abundances derived from diverse international datasets. (NOAA/CMDL, NASA)
SURFRAD Network
The Central Ultraviolet Calibration Facility (CUCF) is located in NOAA’s David Skaggs Research Center in Boulder, Colorado. The CUCF calibrates more than 80 UV instruments per year for several U.S. Government agencies and other UV research concerns, both national and international. In addition to laboratory calibrations, the CUCF has developed a portable UV field-calibration system that allows laboratory-grade calibrations to be made at spectroradiometer field sites. The CUCF also produces secondary standards of spectral irradiance that are directly traceable to NIST primary standards. The secondary standards can be calibrated for operation in either the vertical or horizontal orientation. (NOAA/SRRB)
USDA UVB Monitoring and Research Programme (UVMRP)
NOAA CUCF lamp calibrations performed in horizontal and vertical position using NIST traceable 1000-W halogen lamps are used to calibrate 48 USDA UV-MFRSRs and 46 UVB-1
broadbands. A U-1000 1.0-m double Jobin Yvon with 0.1-nm resolution and 10-10 out-of-band rejection is used as a reference spectroradiometer to transfer lamp calibration to a broadband triad. The UV-MFRSR radiometer spectral response and its angular response (critical for direct beam retrieval) are measured. The Langley calibration method is employed to provide additional absolute calibration of UV-MFRSRs and to track radiometric stability in situ. (USDA)
UV-Net Programme
Collocating ultraviolet radiation (UVR) monitors of different types (e.g., multifilter and broadband instruments) is important for determining changing surface levels and their cause. This supports instrument calibration and data comparison among networks, and allows continuous data

273
collection should an instrument temporarily fail. Currently, only three network Brewers are collocated with other UVR monitors. The Table Mountain Test Facility in Colorado is host to numerous UVR instruments for data intercomparison and calibration. While some instruments remain there for years, others are transported there annually for intercomparison and calibration. The EPA Brewer in Big Bend National Park is 47 kilometres from USDA’s climatological station. The instruments at Big Bend have been compared since February 1997. Other UVR monitor collocations operate at Bondville, Illinois and Fort Peck, Montana with SURFRAD and USDA monitors. (EPA)
RESULTS FROM OBSERVATIONS AND ANALYSIS
Ozone
Trend Analyses
Merged Satellite Datasets
Merged total and profile ozone data sets have been created using V8 TOMS and SBUV data adjusted to a common calibration. The V8 data already have been cross-calibrated, so additional adjustments are small (no adjustments to the profile data). These data sets are easily accessible, and convenient for users who do not wish to analyze multiple instrument data sets. (NASA)
Ozonesonde Data
An analysis of Northern Hemisphere ozonesonde data utilizing a statistical model that includes the 1979 to 1996 trend, the trend-change in 1996, plus ancillary variables of solar cycle (f10.7), QBO, and AO/AAO has been completed. (NOAA/CPC)
A comparative analysis of South Pole and Syowa ozonesonde data going back to the 1960s has been completed. (NOAA/AL, NOAA/CMDL)
Ozone Depletion
Statistical analysis of the merged TOMS/SBUV profile ozone data set from 1979 to 1997 shows the largest negative trends in the upper stratosphere at high latitudes (-7% per decade at 47.5˚S and –6% per decade at 47.5˚N), and less negative trends in the tropics and below 30 hPa (-1 to -3% per decade), which is in general agreement with previous profile trend estimates from satellite and ground-based records. This total and profile ozone information also has been used extensively to study the morphology of the anomalous 2002 ozone hole. Further, these data have been used in a correlative study relating the Southern Hemisphere polar vortex to the depletion levels of springtime total ozone at high northern latitudes. An intriguing, though unexplained, connection was found between the strength and interannual variability of these features (correlation coefficient > 0.7). Ultimately, understanding these interactions will improve our ability to predict future ozone changes. (NASA)
Antarctic Ozone Hole
Since approximately 1997, the underlying trend of Antarctic ozone (i.e., the trend after removal of the effect of natural variability in vortex temperatures) has been zero. This cessation of the downward trend in ozone is consistently seen at 60ºS to 70ºS in TOMS total ozone columns, SAGE/HALOE stratospheric columns, ozonesonde ozone columns at Syowa (69ºS), and Dobson total column measurements at 65ºS and 69ºS. The size of the Antarctic ozone hole is primarily controlled by inorganic chlorine and bromine levels (effective equivalent stratospheric chlorine, EESC), and secondarily controlled by the temperature of the Antarctic vortex collar. Fits of the ozone-hole size to temperature and chlorine and bromine levels suggest that the ozone-hole size actually may be decreasing at a very slow rate. This slow decrease is masked by the large natural variability of the Antarctic stratosphere. (NASA)

274
Ozone Recovery
TOMS/SBUV and Dobson/Brewer total ozone columns and SAGE/HALOE columns above 18 km altitude show that ozone between 60ºN and 70ºS has ceased to decline since approximately 1997. Results derived from the worldwide network of ozonesonde measurements provide similar evidence. Such behaviour appears to be associated with the levelling off and gradual decline in stratospheric halogen loading. In contrast, most of the increase in ozone abundance between the tropopause and 18 km is inferred to be due to transport changes. The increase in this layer can explain approximately half of the post-1997 changes in the total ozone column. (NOAA/CMDL, NOAA/SRRB, NASA).
Ozone Maps
Daily maps of total ozone and monthly total ozone anomalies are being produced, as well as routine updates of the SBUV-2 total ozone change utilizing a statistical model that includes the 1979 to 1996 trend, the trend-change in 1996, plus ancillary variables of solar variation (f10.7), QBO, and AO/AAO. In addition, twice-yearly (Northern and Southern Hemisphere) winter summaries of selected indicators of stratospheric climate are generated. (NOAA/CPC)
Ozone-Related Gases and Variables
Trend Analyses
Upper Atmosphere Research Satellite (UARS) Data
UARS measurements have been used to analyze atmospheric trends in ozone, H2O, CH4,NOx (NO+NO2), HCl, HF, and temperature. These measurements also have been used to quantify UV light variations at wavelengths from 115 to 410 nm over the 27-day solar rotation period and an 11-year solar cycle period. (NASA)
Ozone-Related Chemistry
Effects of Large Solar Proton Events (SPEs)
Several satellite instruments (UARS HALOE; NOAA 14 and 16 SBUV-2; POAM III; Aura MLS; Envisat GOMOS, MIPAS, and SCIAMACHY; and Odin OSIRIS) have shown evidence in recent years of solar-particle-caused changes in polar atmospheric constituents. These include large enhancements in mesospheric NOx (>50 ppbv) as a result of the extremely large SPEs in solar cycle 23, significant stratospheric NOx enhancements (>20 ppbv) in the winter/fall polar regions after extremely large SPEs in July 2000 and October 2003, and polar mesospheric enhancements of OH (>50%) as a result of the SPE in January 2005. Very large polar mesospheric ozone decreases (>70%) were measured only during the SPEs of July 2000 and October 2003. Modest, but significant, polar upper stratospheric ozone decreases (>10%) persisted after the SPEs of October 2003. Total ozone decreases were computed to be less than 2%. (NASA)
Rate of Ozone Destruction by HOx
The rate of odd hydrogen production via the reactions of electronically excited oxygen atoms, O(1D), produced via photolysis of ozone, has been quantified. These data reduce the uncertainty in the computed rates of OH production and ozone destruction via HOx catalytic cycles. (NOAA/AL)
Chemical Reservoirs
New measurements of the formation rate for HO2NO2, a reservoir for HOx and NOx
species, have been made at temperatures below 250K. The new results have a significant effect on model calculations of HO2NO2 formation. (NASA)

275
The reactivity of HO2NO2, has been further elucidated by new measurements of its reaction rate coefficients; absorption cross-sections in the UV, visible, and near-IR; and the quantum yields for the dissociation. These results have led to an improved quantification of the calculated rates of ozone destruction. (NOAA/AL)
Research at the Jet Propulsion Laboratory (JPL) has focused on the rates and mechanisms of several important reactions that control the ozone budget. Rate constants for the OH + NO2 reaction, which produces the HNO3 reservoir for odd hydrogen and odd nitrogen radicals in the lower stratosphere, have been remeasured with higher accuracy and sensitivity than previously possible. These new results predict a smaller HNO3 formation rate. New studies in halogen oxide chemistry related to polar ozone depletion have improved the understanding of the chemistry of the ClO dimer (ClOOCl), a key intermediate in ozone destruction cycles. Finally, the photochemical mechanism for the oxidation of a key bromine-containing compound, bromoform, has been elucidated. Such information will assist in the understanding of the stratospheric bromine budget. (NASA)
Polar Stratospheric Clouds (PSCs)
Michelson Interferometer for Passive Atmospheric Sounding (MIPAS) Validation
SAGE III PSC data for the 2002-2003 Arctic winter have been used by to validate PSC sightings and thermodynamic-type classifications of the PSCs observed for that season by the MIPAS instrument on the Envisat platform. (NASA)
Coupling of Satellite and Aircraft Data
An analysis of SAGE III 1022-nm extinction versus the 1022-nm/449-nm extinction ratio has enabled the discrimination of PSCs in mixtures of background aerosol with very few large NAT particles, such as the NAT “rocks” observed in situ during the SAGE III Ozone Loss and Validation Experiment (SOLVE) airborne campaign. Thus, SAGE III can provide systematic observations of these clouds, which would greatly improve current understanding of how they form and lead to stratospheric denitrification and prolonged ozone destruction. (NASA)
SPARC PSC Assessment
SAGE III data will be a focus of the recently initiated SPARC PSC Assessment, which aims to bridge significant gaps that still exist in our knowledge of PSCs. These gaps are primarily in our understanding of solid PSC particle formation, limiting our ability to represent PSCs and their chemical effects in global models and to predict how these might differ in the stratosphere of the future. (NASA)
Stratospheric Ozone - Climate Connection
Antarctic Ozone and Climate
Recent observational analyses have added to our understanding of the ways stratospheric ozone depletion and tropospheric climate are linked. Specifically, an examination of the Antarctic stratospheric ozone and tropospheric climate during the period from 1979 through 2002 has been used to show that stratospheric variability is an important driver of surface climate variability. (NOAA/AL)
Aerosol Effects
Biomass-burning aerosol particles have been observed in the lower stratosphere. The ability of such species to be transported to the stratosphere can impact the chemistry and climate of this region. (NOAA/AL)
Ozone-Relevant Gases
A new precise and accurate method for measuring HCl and ClONO2 in the upper troposphere and lower stratosphere from aircraft platforms using chemical ionization mass

276
spectrometry has been demonstrated. Use of this methodology in the winter polar stratospheric vortices during periods of rapid ozone destruction will help better quantify and understand ozone destruction processes. The measurements of HCl, in particular, have been used to quantify the amount of stratospheric ozone in the upper troposphere. Expanded use of this method will lead to improved quantification of ozone transport from the stratosphere to the troposphere and the budget of stratospheric ozone. (NOAA/AL)
Oceanic Gas Fluxes
Data from seven research cruises in the past decade have allowed refinement of the atmospheric lifetime of methyl bromide and an improved understanding of the budget of this gas. The cruises provided the only widespread, combined atmospheric and ocean surface measurements of very short-lived gases to date. The most recent cruises took place in 2001 and 2004. (NOAA/CMDL)
UV
UV Trends
SURFRAD Network
Work has been initiated with the Colorado State University (CSU) UVB group to analyze some of the stations in their network for trends in solar UV irradiance. Three radiative transfer models in the UV are being run to compare to spectral direct normal and diffuse horizontal irradiance measurements made with the State University of New York (SUNY) at Albany UV rotating shadowband spectroradiometer on clear days. (NOAA/SRRB)
USDA UVB Monitoring and Research Programme (UVMRP)
Analysis of nine years of broadband data indicates no statistically significant trend in UVB. The difficulty in detecting the expected upward trend in UVB is due to calibration uncertainties, radiometric sensitivity drift, year-to-year variability due to changes in cloud cover, ozone, aerosols, albedo, etc. Improved quantification of these variables is essential for any trends analysis. (USDA)
The variation of ground-level UV irradiance with latitude, season, and elevation revealed by the UVB-1 broadband meter is broadly consistent with theoretical expectations. The large annual cycle in monthly integrated broadband UV irradiance usually peaks in July. During summer, lengthening duration of daylight with latitude poleward counteracts the increase in solar zenith angle at a fixed local time, providing a weaker latitudinal gradient in UV irradiance than at other times of the year. Under this circumstance, localized atmospheric conditions such as cloudiness and limited visibility can have a substantial influence on the differences in radiation levels between sites. (USDA)
UV Forecasts and Exposure
UV Alert System
NOAA/CPC is producing UV forecasts for the U.S., and is developing a UV Alert system with the EPA. The UV Alert system is designed to advise the public when UV levels are unusually high and represent an elevated risk to human health. The UV Alert system consists of a graphical map displaying the daily UV Alert areas, as well as additional information included in the EPA’s UV Index ZIP Code look-up web page and via the EPA’s AIRNow EnviroFlash e-mail notification system. The criteria for a UV Alert are that the noontime UV Index must be at least a 6 and must be 2 standard deviations above the daily climatology. (NOAA/CPC, EPA)
Effects of UVB Exposure
A major limitation in predicting the impacts of UVB irradiance on humans, plant leaves and flowers, and aquatic organisms is the difficulty in estimating exposure. An analysis of the spatial variability in the daily exposure to narrowband 300- and 368-nm and broadband 290- to 315-nm

277
(UVB) solar radiation between 12 paired locations in the USDA UVB Climate Network over two summer growing seasons has been completed. The spatial correlation of the UVB, 300- and 368-nm daily exposures between locations was approximately 0.7 to 0.8 for spacing distances of 100 km. The 300-nm daily exposure was typically more highly correlated between locations than the 368-nm daily exposure. (USDA)
THEORY, MODELING, AND OTHER RESEARCH
Ozone
Theory, Modelling, and Analysis
Model Comparisons
SBUV-2 total ozone data have been compared with 2-D Chemical Transport Models (CTMs) from the University of Illinois and GSFC. In addition, mechanisms to improve the ozone data assimilation within the NWS Global Forecast System are being developed. This includes the SBUV-2 data, as well as the data that may be available operationally from the NASA Aura satellite (e.g., OMI and HIRDLS) and the GOME2 instrument from METOP. (NOAA/CPC)
Multi-Fractal Analysis
Statistical multi-fractal analysis was used to produce a correlation between the rate of ozone photodissociation and the intermittency of temperature in the Arctic lower stratosphere, with potential implications for radiative transfer, turbulent dynamics, and chemistry. (NOAA/AL)
Photochemical Ozone Loss
The Match technique has been applied to five years of Antarctic data from POAM III, using trajectories obtained from the ECMWF, UKMO, and NCEP meteorological analyses for studying photochemical ozone loss. The results show that the Match ozone loss rates are sensitive to the choice of meteorological analysis. In late August and early September, when ozone loss rates peak near the South Pole, the ECMWF trajectories generally yield lower loss rates than those obtained with the UKMO and NCEP analyses. These differences are important because the NCEP- and UKMO-derived POAM loss rates are significantly higher than model results (using upper limit values for BrOx and ClOx and JPL 2002 kinetics), while ECMWF results show no significant measurement/model deficit. Because of its higher temporal and spatial resolution, it is reasonable to conclude that the ECMWF results may be more accurate. (DoD/NRL)
A recent modelling analysis suggests that the underestimation of the chemical loss of polar ozone by past photochemical model simulations may be due to two factors: 1) the presence in the atmosphere of much higher levels of bromine then is commonly assumed, due to a significant stratospheric influence of the decomposition products from very short-lived biogenic bromocarbons; and 2) the significantly faster photolysis of the ClO dimer than calculated using recommended cross-sections. It appears that models may provide more accurate simulations of seasonal and long-term ozone depletion due to a greater influence of chemical reactions involving bromine, and that the Montreal Protocol and its amendments are having the desired effect on ozone levels throughout the world. (NASA)
Ozone Forecasts
The Navy Operational Global Atmospheric Prediction System (NOGAPS) is being extended into the stratosphere and mesosphere for the development of an ozone forecast capability. The extended model (NOGAPS-ALPHA) was shown to provide reliable short-range stratospheric ozone forecasts during the second SAGE III Ozone Loss and Validation Experiment (SOLVE-II) campaign. (DoD/NRL)

278
Interannual Variability
In a study of ozone interannual variability, the GSFC 2-D model was forced with observed wind fields from NCEP and ECMWF global analyses over the period from 1970 to the present. By including the dynamical forcing, the 2-D model resolved most of the observed total ozone variability in time and latitude. Long-term 2-D model simulations with realistic dynamics will enhance understanding of past and predicted ozone change, and can be run using minimal computer resources and time. (NASA)
Decadal Analyses and Simulations
Several multi-decadal integrations of the GSFC 3-D CTM from 1975 to 2025 have been completed. The model includes observed and predicted changes in chlorine and bromine source gases, solar UV radiation, and volcanic aerosols (past only). Model transport is driven by winds from a general circulation model (GCM). To assess the influence of various factors on ozone, the model has been run with chlorine source gas fixed at 1979 levels and without volcanic aerosols. The model output is analyzed using the same statistical approach applied to observations. The ozone response to chlorine is found to be insensitive to interannual variability in time series longer than 25 years. Analysis of the simulations with and without volcanic aerosols suggests that current statistical techniques are unable to accurately separate the volcanic signal from interannual variability in ozone. (NASA)
A chemistry-climate coupled model has been developed and is currently being tested at GSFC. This model is being used to produce 20-year ‘time slice’ simulations with fixed trace-gas boundary conditions and a 150-year integration to study interactions between ozone, water vapour, other greenhouse gases, and climate. (NASA)
Total and profile ozone data from the NOAA 16 SBUV/2 satellite are used in a near-real-time ozone assimilation system at the GSFC GMAO. Data are combined with CTM ozone forecasts to produce global 3-D ozone estimates. Because of its coverage and longevity, SBUV data are commonly used in ozone and meteorological assimilation systems. Tests using MLS and OMI data from Aura in the assimilation system indicate better representation of total and stratospheric ozone using these data. (NASA)
TOMS total ozone is commonly used with a source of stratospheric profile ozone to estimate total column tropospheric ozone. Various methods have been used to construct long-term records of tropospheric ozone, particularly in the tropics. These records have been used in a series of variability and transport studies. (NASA)
Ozone-Related Gases and Variables
Validation Studies
Ground-Based Measurements
A ground-based programme for aerosols and trace gases has produced new results related to NO2 daily and diurnal variation and aerosol UV absorption. The results will be used for OMI validation and for climate studies. (NASA)
Actinic Flux Measurements
The National Center for Atmospheric Research (NCAR) CCD actinic flux spectroradiometer (CAFS) is being deployed on NASA airborne field experiments. The measurements are being used to determine ozone-column abundances above and below the aircraft for the validation of OMI data. (NSF, NOAA/SRRB)

279
Environmental Properties of Atmospheric Gases
CFC Substitutes
Laboratory studies of the atmospheric lifetimes and environmental fates of many CFC substitutes have been conducted, thereby permitting an evaluation of their “ozone friendliness.” These results provide important input parameters for model calculations of the future vulnerability of the ozone layer, and are used together with industrial production-and-use information to analyze the growth of such chemicals in the atmosphere. (NOAA/AL, NASA) Oceanic Gas Lifetimes
The partial lifetimes with respect to oceanic loss for more than 90 halogenated gases have been determined using a simple, coupled, ocean-atmosphere box model and the COADS data set for sea-surface temperature and wind speed. (NOAA/CMDL)
UV
UV Instrumentation
The temperature dependence of the Brewer UV spectrometer has been studied in order to improve the quality of data for UV trends. (NOAA/SRRB)
UV Effects
The UVMRP supports research studying UVB effects on plants and ecosystems. Numerous publications document the results of these studies. (USDA)
DISSEMINATION OF RESULTS
Data Reporting
Ozone
TOMS and SBUV Series
In June 2004, a 2-DVD set containing the entire TOMS V8 data set was released. The data cover the period from November 1978 through August 2003. Similarly, a DVD containing SBUV V8 ozone profile data was released. Data are from Nimbus 7 (1978 to 1993), NOAA 9 (1985 to 1998), NOAA 11 (1988 to 2001) and NOAA 16 (2000 to 2003). The Goddard Earth Sciences (GES) Data and Information Services Center (DISC) routinely distributes the data. (NASA)
POAM Data
Data from the POAM instrument is available via ftp at ftp://poamb.nrl.navy.mil/pub/poam3/ and also is submitted to the NASA Langley Distributed Active Archive Center (DAAC). (DoD/NRL)
OMI Data
TOMS-compatible total ozone data produced from OMI since September 2004 are available from the GSFC DAAC at http://daac.gsfc.nasa.gov/. Total ozone data produced using a DOAS algorithm will be available by the end of 2005. (NASA)
Umkehr Data
Dobson Umkehr data processed using an SBUV-like algorithm are available at http://www.srrb.noaa.gov/research/umkehr/. (NOAA/SRRB, NASA)

280
World Ozone and Ultraviolet Radiation Data Center (WOUDC)
Total ozone, Umkehr, and ozonesonde data are reported to the WOUDC from U.S. Government agencies and institutions. Ozone data from sites that are part of the NDSC and the SHADOZ network are available from the programme web sites (http://www.ndsc.ws/ and http://croc.gsfc.nasa.gov/shadoz/, respectively), and also are imported to WOUDC. (NOAA, NASA).
Maps
All daily SBUV/2 total ozone map analyses are available as images in png format on the Internet. The raw data from the SBUV/2 are available from NESDIS. Additionally, the total ozone analysis and forecast fields out to five days from the NCEP GFS are presented via a web page. (NOAA/CPC)
Assessments
2006 WMO/UNEP Scientific Assessment of Ozone Depletion
The latest assessment, mandated under the provisions of the Montreal Protocol, is underway and is expected to provide the Parties with the information in support of future decision-making. (NOAA, NASA)
Arctic Climate Impacts Assessment (ACIA)
Chapter 3: Ozone and Ultraviolet Radiation was completed for the latest ACIA. (NOAA/SRRB)
Ozone-Related Gases and Variables
TOMS Aerosol Data
A preliminary dataset of AAOT in the UV derived from TOMS data can be obtained from [email protected]. Public release of the data is planned for June 2006. (NASA)
Ozone-Depleting Substance Data
Long-term data from the NOAA/CMDL network are updated every six months on the NOAA/CMDL website (http://www.cmdl.noaa.gov/) and submitted annually to the World Data Centre and to the World Data Center for Atmospheric Trace Gases at the Carbon Dioxide Information Analysis Data Center (CDIAC). Data from field missions (firn-air studies, ocean flux studies), previously posted only upon publication, now are posted shortly after the field missions. Data on very short-lived gases from seven research cruises over the world’s oceans are posted and available for use on the NOAA/CMDL website. (NOAA/CMDL)
Long-term data from the NASA/AGAGE network are reviewed on a semi-annual basis by the Science Team, and are archived every six months with CDIAC. Data from the UCI flask-sampling network are archived similarly. (NASA)
UV Data
SURFRAD Network Data
UV data from the SURFRAD Network are available on the NOAA/SRRB website (http://www.srrb.noaa.gov/). (NOAA/SRRB)
USDA UVB Monitoring and Research Programme (UVMRP)
UVB-1 broadband data and UV-MFRSR data from this network are regularly submitted to the WOUDC. (USDA)

281
Information to the Public
Ozone
TOMS and OMI Data
Near-real-time ozone data from Earth Probe TOMS and from the OMI instrument on Aura are routinely distributed via the TOMS web site (http://toms.gsfc.nasa.gov/). Data from TOMS are usually available with 12 hours; data from OMI within 2 days. The site provides online access to TOMS data back to 1978. While used mostly by scientists, educators and students also use the site extensively. An Ozone Hole Watch web site is being developed to provide a single site for anyone interested in the Antarctic ozone hole. (NASA) Merged TOMS/SBUV Total and Profile Ozone Data
Merged TOMS/SBUV total and profile ozone data sets are available on the Internet (http://hyperion.gsfc.nasa.gov/Data_services/merged/index.html). (NASA)
UV
Forecasts
Noontime UV forecasts are made available to the public via several formats. One is a text bulletin for 58 cities for the U.S. The other is a gridded field that is made available via the NOAA/CPC and NOAA/NCEP ftp sites. (NOAA/CPC)
Advisories
The primary UVR advisory in the United States is the UV Index, operated jointly by NOAA and EPA. Currently, the UV Index computer model processes total global ozone satellite measurements, a rough cloud correction factor, and elevation to predict daily UVR levels on the ground and the resulting danger to human health. This model assumes zero pollution levels. UV Index reports are available in local newspapers and on television weather reports. The EPA also issues a UV Alert when the UV Index is predicted to have a high sun-exposure level and is unusually intense for the time of year. UV Alert notices can be found at EPA's SunWise web site (http://www.epa.gov/sunwise/uvindex.html), in local newspapers, and on television weather reports. (EPA)
Ozone-Depleting Gas Index
An ozone-depleting gas index (ODGI), based on Effective Equivalent Chlorine (EECl) measured globally in the NOAA/CMDL network, is being implemented. EECl is indexed to 1 on 1 January 1994, when it reached its maximum value. (NOAA/CMDL)
Relevant Scientific Papers
Ozone
Bhartia P. K., et al., Solar backscattered ultraviolet version 8 profile algorithm, Proceedings of the XX Quadrennial Ozone Symposium, 1-8 June 2004, Kos, Greece, edited by C. S. Zerefos, 295-296, Athens, Greece, 2004.
Chandra, S., J. R. Ziemke, and R. V. Martin, Tropospheric ozone at tropical and middle latitudes derived from TOMS/MLS residual: Comparison with a global model, J. Geophys. Res., 108 (D9), 4291, doi:10.1029/2002JD002912, 2003.
Fioletov, V. E., G. E. Bodeker, A. J. Miller, R. D. McPeters, and R. Stolarski, Global and zonal total ozone variations estimated from ground-based and satellite measurements: 1964-2000, J. Geophys. Res., 107, 4647, doi:10.1029/2001JD001350, 2002.
Fleming, E. L., C. H. Jackman, J. E. Rosenfield, and D. B. Considine, Two-dimensional model simulations of the QBO in ozone and tracers in the tropical stratosphere, J. Geophys. Res., 107, 4665, doi:10.1029/2001JD001146, 2002.
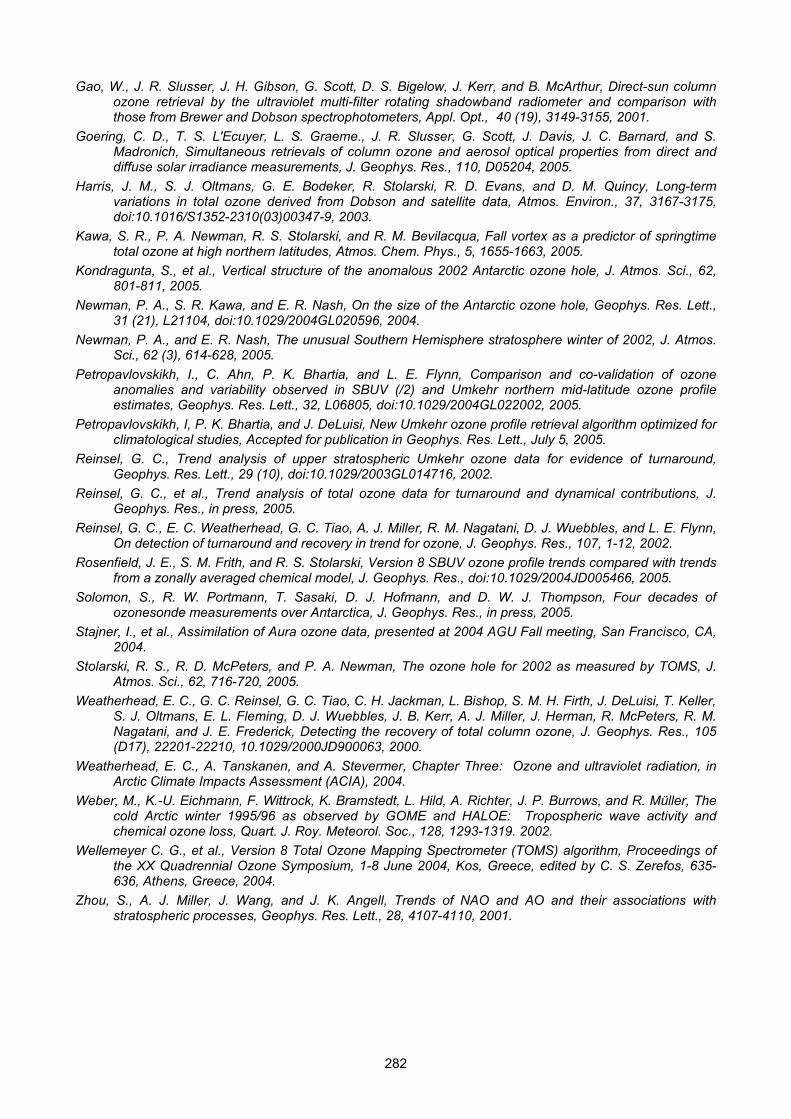
282
Gao, W., J. R. Slusser, J. H. Gibson, G. Scott, D. S. Bigelow, J. Kerr, and B. McArthur, Direct-sun column ozone retrieval by the ultraviolet multi-filter rotating shadowband radiometer and comparison with those from Brewer and Dobson spectrophotometers, Appl. Opt., 40 (19), 3149-3155, 2001.
Goering, C. D., T. S. L'Ecuyer, L. S. Graeme., J. R. Slusser, G. Scott, J. Davis, J. C. Barnard, and S. Madronich, Simultaneous retrievals of column ozone and aerosol optical properties from direct and diffuse solar irradiance measurements, J. Geophys. Res., 110, D05204, 2005.
Harris, J. M., S. J. Oltmans, G. E. Bodeker, R. Stolarski, R. D. Evans, and D. M. Quincy, Long-term variations in total ozone derived from Dobson and satellite data, Atmos. Environ., 37, 3167-3175, doi:10.1016/S1352-2310(03)00347-9, 2003.
Kawa, S. R., P. A. Newman, R. S. Stolarski, and R. M. Bevilacqua, Fall vortex as a predictor of springtime total ozone at high northern latitudes, Atmos. Chem. Phys., 5, 1655-1663, 2005.
Kondragunta, S., et al., Vertical structure of the anomalous 2002 Antarctic ozone hole, J. Atmos. Sci., 62, 801-811, 2005.
Newman, P. A., S. R. Kawa, and E. R. Nash, On the size of the Antarctic ozone hole, Geophys. Res. Lett., 31 (21), L21104, doi:10.1029/2004GL020596, 2004.
Newman, P. A., and E. R. Nash, The unusual Southern Hemisphere stratosphere winter of 2002, J. Atmos. Sci., 62 (3), 614-628, 2005.
Petropavlovskikh, I., C. Ahn, P. K. Bhartia, and L. E. Flynn, Comparison and co-validation of ozone anomalies and variability observed in SBUV (/2) and Umkehr northern mid-latitude ozone profile estimates, Geophys. Res. Lett., 32, L06805, doi:10.1029/2004GL022002, 2005.
Petropavlovskikh, I, P. K. Bhartia, and J. DeLuisi, New Umkehr ozone profile retrieval algorithm optimized for climatological studies, Accepted for publication in Geophys. Res. Lett., July 5, 2005.
Reinsel, G. C., Trend analysis of upper stratospheric Umkehr ozone data for evidence of turnaround, Geophys. Res. Lett., 29 (10), doi:10.1029/2003GL014716, 2002.
Reinsel, G. C., et al., Trend analysis of total ozone data for turnaround and dynamical contributions, J. Geophys. Res., in press, 2005.
Reinsel, G. C., E. C. Weatherhead, G. C. Tiao, A. J. Miller, R. M. Nagatani, D. J. Wuebbles, and L. E. Flynn, On detection of turnaround and recovery in trend for ozone, J. Geophys. Res., 107, 1-12, 2002.
Rosenfield, J. E., S. M. Frith, and R. S. Stolarski, Version 8 SBUV ozone profile trends compared with trends from a zonally averaged chemical model, J. Geophys. Res., doi:10.1029/2004JD005466, 2005.
Solomon, S., R. W. Portmann, T. Sasaki, D. J. Hofmann, and D. W. J. Thompson, Four decades of ozonesonde measurements over Antarctica, J. Geophys. Res., in press, 2005.
Stajner, I., et al., Assimilation of Aura ozone data, presented at 2004 AGU Fall meeting, San Francisco, CA, 2004.
Stolarski, R. S., R. D. McPeters, and P. A. Newman, The ozone hole for 2002 as measured by TOMS, J. Atmos. Sci., 62, 716-720, 2005.
Weatherhead, E. C., G. C. Reinsel, G. C. Tiao, C. H. Jackman, L. Bishop, S. M. H. Firth, J. DeLuisi, T. Keller, S. J. Oltmans, E. L. Fleming, D. J. Wuebbles, J. B. Kerr, A. J. Miller, J. Herman, R. McPeters, R. M. Nagatani, and J. E. Frederick, Detecting the recovery of total column ozone, J. Geophys. Res., 105 (D17), 22201-22210, 10.1029/2000JD900063, 2000.
Weatherhead, E. C., A. Tanskanen, and A. Stevermer, Chapter Three: Ozone and ultraviolet radiation, in Arctic Climate Impacts Assessment (ACIA), 2004.
Weber, M., K.-U. Eichmann, F. Wittrock, K. Bramstedt, L. Hild, A. Richter, J. P. Burrows, and R. Müller, The cold Arctic winter 1995/96 as observed by GOME and HALOE: Tropospheric wave activity and chemical ozone loss, Quart. J. Roy. Meteorol. Soc., 128, 1293-1319. 2002.
Wellemeyer C. G., et al., Version 8 Total Ozone Mapping Spectrometer (TOMS) algorithm, Proceedings of the XX Quadrennial Ozone Symposium, 1-8 June 2004, Kos, Greece, edited by C. S. Zerefos, 635-636, Athens, Greece, 2004.
Zhou, S., A. J. Miller, J. Wang, and J. K. Angell, Trends of NAO and AO and their associations with stratospheric processes, Geophys. Res. Lett., 28, 4107-4110, 2001.

283
Ozone-Relevant Gases and Variables
Aydin, M., E. S. Saltzman, W. J. De Bruyn, S. A. Montzka, J. H. Butler, and M. Battle, Atmospheric variability of methyl chloride during the last 300 years from an Antarctic ice core and firn air, Geophys. Res. Lett., 31, L02109, doi:10.1029/2003GL018750, 2004.
Hurst, D. F., P. A. Romashkin, J. W. Elkins, E. A. Oberländer, N. F. Elansky, I. B. Belikov, I. G. Granberg, G. S. Golitsyn, A. M. Grisenko, C. A. M. Brenninkmeijer, and P. J. Crutzen, Emissions of ozone-depleting substances in Russia during 2001, J. Geophys. Res., 109, D14303, doi:10.1029/2004JD004633, 2004.
Jackman, C. H., M. T. DeLand, G. J. Labow, E. L. Fleming, D. K. Weisenstein, M. K. W. Ko, M. Sinnhuber, and J. M. Russell, Neutral atmospheric influences of the solar proton events in October-November 2003, J. Geophys. Res., 110, A09S27, doi:10.1029/2004JA010888, 2005.
Jackman, C. H., M. T. DeLand, G. J. Labow, E. L. Fleming, D. K. Weisenstein, M. K. W. Ko, M. Sinnhuber, J. Anderson, and J. M. Russell, The influence of the several very large solar proton events in years 2000-2003 on the neutral middle atmosphere, Adv. Space Res., 35, 445-450, 2005.
King, D. B., J. H. Butler, S. A. Yvon-Lewis, and S. A. Cotton, Predicting oceanic methyl bromide saturation from SST, Geophys. Res. Lett., 29 (24), 2199, doi:10.1029/2002GL016091, 2002.
Krotkov, N. A., P. K. Bhartia, J. R. Herman, J. R. Slusser, G. Scott, G. Labow, A. Vasilkov, T. Eck, O. Dubovik, and B. Holben, Aerosol ultraviolet absorption experiment (2002 to 2004), Part 2: Absorption optical thickness, refractive index, and single scattering albedo, Opt. Eng., 44 (4), 041004, 2005.
Miller, A. J., R. M. Nagatani, L. E. Flynn, S. Kondragunta, E. Beach, R. Stolarski, R. McPeters, P. K. Bhartia, M. DeLand, C. H. Jackman , D. J. Wuebbles, K. O. Patten, and R. P. Cebula, A cohesive total ozone data from the SBUV(/2) satellite system, J. Geophys. Res., 107 (0), doi:10.1029/2001JD000853, 2002.
Miller, A. J., S. Zhou, and S. K. Yang, Relationship of the Arctic and Antarctic oscillation to the outgoing longwave radiation, J. Clim., 16, 1583-1592, 2003.
Montzka, S. A., J. H. Butler, B. D. Hall, D. J. Mondeel, and J. W. Elkins, A decline in tropospheric organic bromine, Geophys. Res. Lett., 30 (15), doi:10.1029/2003GL017745, 2003.
Montzka, S. A., M. Aydin, M. Battle, J. H. Butler, E. S. Saltzman, B. D. Hall, A. D. Clarke, D. Mondeel, and J. W. Elkins, A 350-year atmospheric history for carbonyl sulfide inferred from Antarctic firn air and air trapped in ice, J. Geophys. Res., 109, D22302, doi:10.1029/2004JD004686, 2004.
Natarajan, M., E. E. Remsberg, and L. E. Deaver, Anomalously high levels of NOx in the polar upper stratosphere during April 2004: Photochemical consistency of HALOE observations, Geophys. Res. Lett., 31, L15113, doi:10.1029/2004GL020566, 2004.
Nevison, C., J. H. Butler, and J. W. Elkins, Global distribution of N2O and the DN2O-AOU yield in the subsurface ocean, Global Biogeochem. Cycles, 17 (4), 1119, doi:10.1029/2003GB002068, 2003.
Newchurch, M. J., E.-S. Yang, D. M. Cunnold, G. C. Reinsel, J. M. Zawodny, and J. M. Russell III, Evidence for slowdown in stratospheric ozone loss: First stage of ozone recovery, J. Geophys. Res., 108, doi:10.1029/2003JD003471, 2003.
Pierce, R. R., J. Al-Saadi, T. D. Fairlie, M. Natarajan, V. L. Harvey, W. L. Grose, J. M. Russell III, R. Bevilacqua, S. D. Eckermann, D. Fahey, P. Popp, E. Richard, R. Stimpfle, G. C. Toon, C. R. Webster, and J. Elkins, Large-scale chemical evolution of the Arctic vortex during the 1999/2000 winter: HALOE/POAM III Lagrangian photochemical modeling for the SAGE III-Ozone loss and validation experiment (SOLVE) campaign, J. Geophys. Res., 108, doi:10.1029/2001JD001063, 2003.
Poole, L. R., C. R. Trepte, V. L. Harvey, G. C. Toon, and R. L. VanValkenburg, SAGE III observations of Arctic polar stratospheric clouds – December 2002, Geophys. Res. Lett., 30(23), 2216, doi:10.1029/2003GL018496, 2003.
Randall, C. E., V. L. Harvey, G. L. Manney, Y. Orsolini, M. Codrescu, C. Sioris, S. Brohede, C. S. Haley, L. L. Gordley, J. M. Zawodny, and J. M. Russell, Stratospheric effects of energetic particle precipitation in 2003-2004, Geophys. Res. Lett., 32, L05802, doi:10.1029/2004GL022003, 2005.
Randel, W. J., F. Wu, S. J. Oltmans, K. Rosenlof, and G. Nedoluha, Interannual changes of stratospheric water vapor and correlations with tropical tropopause temperatures, J. Atmos. Sci., 61, 2133-2148, 2004.
Remsberg, E., P. Bhatt, and L. Deaver, Seasonal and longer-term variations in middle atmosphere temperature from HALOE on UARS, J. Geophys. Res., 107, doi:10.1029/2001JD001366, 2002.
Rosenlof, K. H., Transport changes inferred from HALOE water and methane measurements, J. Meteorol. Soc. Japan, 80, 831-848, 2002.

284
Spang, R., J. J. Remedios, L. Kramer, L. R. Poole, M. D. Fromm, M. Müller, G. Baumgarten, and P. Konopka, Polar stratospheric cloud observations by MIPAS on ENVISAT: Detection method, validation, and analysis of the Northern Hemisphere winter 2002-3, Atmos. Chem. Phys., 5, 679-692, 2005.
Yvon-Lewis, S. A., and J. H. Butler, The effect of oceanic uptake on the atmospheric lifetime of selected trace gases, J. Geophys. Res., 107 (D20) 4414, doi:10.1029/2001JD001267, 2002.
UV
Bigelow, D. S., J. R. Slusser, A. F. Beaubien, and J. H. Gibson, The USDA Ultraviolet Radiation Monitoring Programme, Bull. Amer. Meteorol. Soc., 79, 601-615, 1998.
Bodhaine, B. A., R. L. McKenzie, P. V. Johnston, D. J. Hofmann, E. G. Dutton, R. C. Schnell, J. E. Barnes, S. C. Ryan, and M. Kotkamp, New ultraviolet spectrometer measurements at Mauna Loa Observatory, Geophys. Res. Lett., 23, 2121-2124, 1996.
Bodhaine, B. A., E. G. Dutton, D. J. Hofmann, R. L. McKenzie, and P. V. Johnston, UV measurements at Mauna Loa: July 1995 to July 1996, J. Geophys. Res., 102, 19265-19273, 1997.
Bodhaine, B. A., E. G. Dutton, R. L. McKenzie, and P. V. Johnston, Calibrating broadband UV instruments: Ozone and zenith angle dependence, J. Atmos. Oceanic. Technol., 15, 916-926, 1998.
Floyd, L., E., D. K. Prinz, P. C. Crane, and L. C. Herring, Solar UV irradiance variation during cycles 22 and 23, Adv. Space Res., 29, 1957-1962, 2002.
Frederick, J. E., J. R. Slusser, and D. S. Bigelow, Annual and interannual behavior of solar ultraviolet irradiance revealed by broadband measurements, Photochem. Photobiology, 72 (4), 488-496, 2000.
Grant, R. H., and J. Slusser, Spatial variability in UV radiation during the growing season across the continental USA, Theor. Appl. Climatol., 74, 167-177, 2003.
Harrison, L., J. Berndt, P. Kiedron, and P. Disterhoft, U. S. Department of Agriculture reference ultraviolet spectroradiometer: Current performance and operational experience at Table Mountain, Colorado, Opt. Eng., 41 (12), 3096-3103, 2002.
Lantz, K., P. Disterhoft, E. Early, A. Thompson, J. DeLuisi, J. Berndt, L. Harrison, P. Kiedron, J. Ehramjian, G. Bernhard, L. Cabasug, J. Robertson, W. Mou, T. Taylor, J. Slusser, D. Bigelow, B. Durham, G. Janson, D. Hayes, M. Beaubien, and A. Beaubien, The 1997 North American interagency intercomparison of Ultraviolet Spectroradiometers including narrowband filter radiometers, J. Res. Natl. Inst. Stand. Technol., 107 (1), 19-62, 2002.
Lantz, K. O., P. Disterhoft, J. J. DeLuisi, E. A. Early, A. Thompson, D. Bigelow, and J. Slusser, Methodology for deriving clear-sky erythemal calibration factors for UV broadband radiometers of the U.S. Central UV Calibration Facility, J. Atmos. Oceanic. Technol., 16, 1736-1752, 1999.
Slusser, J. R., J. H. Gibson, D. S. Bigelow, D. Kolinski, P. Disterhoft, K. Lantz, and A. Beaubien, Langley method of calibrating UV filter radiometers, J. Geophys. Res., 105, 4841-4849, 2000.
Weatherhead, E., D. Theisen, A. Stevermer, J. Enagonio, B. Rabinovitch, P. Disterhoft, K. Lantz, R. Meltzer, J. Sabburg, J. DeLuisi, J. Rives, and J. Shreffler, Temperature dependence of the Brewer ultraviolet data, J. Geophys. Res., 106 (D24), 34121-34130, doi:10.1029/2001JD000625, 2001.
Weatherhead, E. C., C. S. Long, A. J. Stevermer, and J. Enagonio, Using the erythemal ultraviolet radiation dose rate at noontime to approximate the time-integrated daily dose, J. Photochem. Photobiology, doi:10.1562/2003-11-18-RA-008, 2004.
PROJECTS AND COLLABORATION
NOAA/CMDL
The Dobson and ozonesonde measurements are included in the WMO Global Atmosphere Watch (GAW) and in the NDSC. Significant collaboration with federal agencies (NASA, DoE) and universities (University of Colorado, Harvard, Princeton, Humboldt State University, etc.) is maintained through both global monitoring and field missions.
NOAA/CPC
Activities include participation in several initiatives of Stratospheric Processes and their Relation to Climate (SPARC), i.e., stratospheric temperatures, ozone, UV, climate change; collaboration with the EPA on the UV Index and, recently, the UV Alert system; collaboration with NASA in ozone monitoring, calibration of the SBUV/2 instruments, and dynamical processes

285
influencing ozone changes; collaboration with the surface radiation monitoring efforts of NOAA/OAR and USDA-CSU for the validation of UV forecasts and NCEP GFS surface radiation products, and the NDSC Data Host Facility.
NOAA/SRRB
The CUCF is designated by a Memorandum of Understanding to be the national UV calibration facility by agreement among the following organizations: NOAA, USDA, EPA, NASA, National Institute of Standards and Technology (NIST), NSF, National Biological Service, and the Smithsonian Institution. The CUCF compared secondary standards of irradiance with the Joint Research Centre’s European Union UV Calibration Centre’s (ECUV) ultraviolet spectral irradiance scale in Ispra, Italy. The CUCF’s irradiance scale is directly traceable to the NIST spectral irradiance scale, while the ECUV’s irradiance scale is traceable to that of the German national standards laboratory, Physikalisch-Technische Bundesanstalt (PTB).
NASA
NASA collaborates extensively with several NOAA laboratories (AL, CMDL, CPC, SRRB) in all areas of ozone and UV research, including space-based, airborne, balloonborne, and ground-based measurements, as well as in various modelling and analysis activities. NASA often supports research activities within these laboratories in the aforementioned areas. The NDSC, which is championed by NASA and NOAA within the U.S., is a major contributor to WMO’s Global Ozone Observing System (GO3OS) within the frame of its Global Atmosphere Watch (GAW) Programme.
NASA is closely collaborating with KNMI (Netherlands) and FMI (Finland) on processing data from the Aura OMI instrument. Though NASA and KNMI are developing independent algorithms using TOMS and GOME heritage, respectively, the results are being compared carefully to assess the strengths and weaknesses of each algorithm.
USDA
USDA is actively collaborating with the NASA TOMS and AERONET groups on aerosol absorption using UV-MFRSR and Cimel instruments. USDA researchers are funded for participation in the NSF MIRAGE Mexico City air quality study scheduled for February/March 2006. Collaborations also exist with DoE for providing aerosol optical depths and column ozone data. Agency personnel participated in the Norwegian filter radiometer intercomparison held in Oslo in May 2005.
FUTURE PLANS
Ozone
Column Ozone from Dobson/ Brewer Zenith-Sky Measurements
The operational zenith-sky total ozone algorithm for Dobson and Brewer instruments is based on empirically derived tables. NASA has developed a TOMS-like algorithm to process these data, which has the potential to substantially improve data quality. There are plans, subject to availability of funds, to process all historical zenith-sky data using this algorithm. (NASA)
Brewer Umkehr Retrievals
An Umkehr retrieval capability similar to that developed for the Dobson instrument is being developed for the Brewer spectrometer. (NOAA/SRRB, NASA)
TOMS Data Reprocessing
TOMS data likely will be reprocessed before the 2008 Quadrennial Ozone Symposium, based on lessons learned by comparing TOMS with SBUV, GOME, SCIAMACHY, and OMI. (NASA)

286
Ozonesondes
A new ozonesonde programme has been established under the auspices of the NASA/SHADOZ programme in Costa Rica. Ozonesonde launches at Summit, Greenland will begin in collaboration with the NSF in late 2005. (NOAA/CMDL) Dynamical Forcings
An examination of the statistical relationship of tropospheric forcings (e.g., AO/AAO, tropopause pressure, etc.) to changes in total ozone and layer ozone will be undertaken. (NOAA/CPC)
Ozone-Relevant Gases/Variables
Improvements in sampling and analysis efficiency have enabled weekly vertical profiles of ~25 trace gases at numerous sites in the lower troposphere. Expansion of this network across North America will aid considerably in source attribution of new and old, short- and long-lived ODSs. Current and future measurement campaigns include multiple deployments of a new gas chromatograph (GC) aboard the Altair uninhabited aerial vehicle (UAV) and the operation of this same instrument onboard a Learjet in Brazil. Plans also include continued monitoring of ODSs from the NASA WB-57F high-altitude aircraft and the NASA OMS balloon gondola. Additional sampling of firn air is scheduled for Greenland as part of an overall firn and ice sampling effort to take place during the International Polar Year. These records continue to improve our understanding of the natural contributions of ODSs. Development and operation of an airborne 6-channel GCMS/ECD that measures approximately 20 important atmospheric trace gases whose changing burdens impact air quality, climate change, and stratospheric/tropospheric ozone will continue. (NOAA/CMDL)
Several aircraft, balloon, and ground-based measurement campaigns are in the planning and near-implementation stages. These campaigns, planned for bases within the U.S. and the subtropics, will provide important validation data for ozone and ozone- and climate-related trace gases and parameters for Aura and other satellite sensors. They also will address high-priority science questions associated with atmospheric ozone chemistry and transport. (NASA)
UV
UV Index Forecast
An algorithm enhancement will be operational beginning Fall 2005. Features of this enhancement are global coverage, hourly forecasts up to and beyond 72 hours, better cloud transmission estimates, more realistic aerosol depictions, and realistic increases over snow-covered surfaces. Forecasts will be generated on 0.5-degree grids and made available on NCEP’s ftp site. (NOAA/CPC)
Brewer Network
An interagency agreement is being negotiated for CUCF to operate a six-station network of Brewer spectroradiometers using instruments from the EPA network that closed in 2004. The primary emphasis will be on the effects of aerosols and clouds on UV radiation, but routine retrievals of ozone, ozone profiles from Umkehr, aerosol optical depth, and nitrogen dioxide also will be attempted. It is expected that the collaboration with the CSU UVB group will lead to further work with the data in their network. It also should be possible to improve on the current methods used to retrieve column ozone, which could lead to improvements in aerosol UV optical-depth retrievals below 368 nm. (NOAA/SRRB, EPA)
USDA UVB Monitoring and Research Programme (UVMRP)
A new site planned for Houston, TX, and the development of real-time data streams will be attempted within the network. New interagency collaborations will include participation in the NSF MIRAGE air-quality study in Mexico City (February/March 2006), and the generation of aerosol atmospheric corrections for a NASA/USGS invasive-species study. (UDSA)

287
NEEDS AND RECOMMENDATIONS
Ozone
Column Ozone
Column ozone data produced by satellite and ground-based instruments agree well in cloud-free conditions and at solar zenith angles less than 70º. However, the data quality of all measuring systems degrade under cloudy conditions and at large solar zenith angles, with differences of 10% or larger. Given the need for accurate ozone trends in the polar regions, it is important to improve the quality of ground-based data in these regions, and to focus future calibration and data intercomparison efforts accordingly. (NASA)
Profile Ozone
There is a vast amount of unprocessed Brewer Umkehr data residing in the archives. A concerted effort should be made to process these data using a common Dobson/Brewer algorithm, which is necessary for trend studies. (NASA)
The only currently planned U.S. space-based ozone-monitoring instrument in the post-Aura era will be the NPOESS OMPS instrument, a limb scattering measurement with very little heritage. In order to provide a calibration source for OMPS so that the data will be of sufficient quality for scientific studies and trend analysis, consideration should be given to adding a simple solar occultation instrument to NPOESS. (DoD/NRL)
Ozone-Relevant Gases and Variables
Aerosol Absorption Optical Thickness (AAOT)
There are currently no operational ground-based instruments that provide AAOT in UV. AAOT from the AERONET network is limited to wavelengths longer than 440 nm. NASA has improved a long-standing technique to derive AAOT in UV by combining measurements from AERONET and UV Shadowband radiometers. Efforts to utilize this methodology for deriving AAOT in the UV should be implemented. (NASA)
Ozone- and Climate-Related Trace-Gas Measurements
There is a need to maintain and expand the existing in situ networks, both geographically and with improved instrumentation. Current workforce limitations prevent the development and propagation of gas standards on as rapid a schedule as required by these networks to keep up with the increasing number of new chemicals of scientific interest. In addition, expanded efforts are needed for data analysis as more and more chemicals are being measured. (NASA, NOAA/CMDL)
UV
Geographical Measurement Coverage
UV monitoring in the tropics is very limited. Relatively inexpensive broadband UV instruments could be set up easily at installations launching ozonesondes (e.g., SHADOZ) in the tropical region. Such efforts should be coordinated with the NDSC. In this way, UV at the surface under aerosols/pollution can be linked with the ozone profiles measured by the ozonesondes and ground-based profiling instruments. (NOAA/CPC)
Only seven of the EPA Brewers are currently deployed in or near densely populated areas. Satellite-derived UVR is less reliable for urban locations, because satellite instruments do not adequately characterize pollutants at ground level. Because of the deficiency of current urban UVR data, health researchers conducting local studies are sometimes making their own UVR measurements as needed, with instruments that are often not easily compared with those from any of the existing UVR networks. Thus, better ground-level measurements collected in locations close to air-quality monitors are required. Finally, many sites have data gaps and inconsistencies. Only

288
a limited number of ground-based sites provide historically continuous UV records. More analyses of available data and improved calibration could fill gaps in coverage. (EPA)
Calibration and Validation
The WMO has requested that the CUCF become the WMO centre for UV calibrations. However, funding for this within and outside NOAA has yet to be identified. Efforts to accomplish this should continue. (NOAA/SRRB)
It is now well established that the ratio of UVB and UVA can be predicted accurately under both clear and cloudy conditions wherever quality column ozone data exist. Since total ozone measurements currently are being made globally with very high accuracy and precision by satellite and ground-based instruments, UVB levels can be ascertained, often more accurately than they can be directly measured, if UVA levels are known. However, the causes of UVA variability are poorly understood (clouds, NO2, aerosols), and satellite and ground-based estimates of UVA show poor correlation in the absence of ancillary data. Future measurements and intercomparisons should focus on this issue. (NASA)
Effects Research
Although the effects of UV exposure drive UV monitoring activities, only limited resources historically have been targeted towards UVB effects research. Expansion of UVMRP activities in this critical area is needed at a multi-agency level. (USDA)
Acronyms and Abbreviations
AAOT aerosol absorption optical thickness ACIA Arctic Climate Impacts Assessment AERONET Aerosol Robotic Network AGAGE Advanced Global Atmospheric Gases Experiment AL Aeronomy Laboratory (NOAA, U.S.) AO/AAO Arctic/Antarctic oscillation BSI Biospherical Instruments BUV Backscatter Ultraviolet CAFS CCD Actinic Flux Spectroradiometer CCD charge-coupled device CDIAC Carbon Dioxide Information Analysis Data Center CFC chlorofluorocarbon CMDL Climate Monitoring and Diagnostics Laboratory (NOAA, U.S.) COADS Comprehensive Ocean-Atmosphere Data Set CPC Climate Prediction Center (NOAA, U.S.) CSU Colorado State University (United States) CTMs chemical transport models CUCF Central Ultraviolet Calibration Facility DAAC Distributed Active Archive Center (NASA Langley, U.S.) DISC Data and Information Services Center (NASA Goddard, U.S.) DoD Department of Defense (United States) DoE Department of Energy (United States) DOAS Differential Optical Absorption Spectroscopy ECD electron capture detector ECMWF European Centre for Medium-Range Weather Forecasts (United Kingdom) ECUV European UV Calibration Center EECl effective equivalent chlorine EESC effective equivalent stratospheric chlorine EOS Earth Observing System EP Earth Probe EPA Environmental Protection Agency (United States) FMI Finnish Meteorological Institute (Finland)

289
FTIR Fourier transform infrared GAW Global Atmosphere Watch GC Gas Chromatograph GCM general circulation model GCMS Gas Chromatography Mass Spectrometry GES Goddard Earth Sciences GFS Global Forecast System GMAO Global Modeling Assimilation Office (NASA Goddard, U.S.) GOES Geostationary Operational Environmental Satellite GO3OS Global Ozone Observing System (WMO) GOME Global Ozone Monitoring Experiment GOMOS Global Ozone Monitoring by Occultation of Stars GSFC Goddard Space Flight Center (NASA, U.S.) HALOE Halogen Occultation Experiment HIRDLS High-Resolution Dynamics Limb Sounder IHALACE International Halocarbons in Air Comparison Experiment JPL Jet Propulsion Laboratory (United States) KNMI Koninklijk Nederlands Meteorologisch Institut (The Netherlands) MFRSRs Multi-Filter Rotating Shadowband Radiometers MIPAS Michelson Interferometer for Passive Atmospheric Sounding MIRAGE Megacity Impacts on Regional and Global Environments MLS Microwave Limb Sounder NASA National Aeronautics and Space Administration (United States) NAT nitric acid trihydrate NCAR National Center for Atmospheric Research (United States) NCEP National Centers for Environmental Prediction (NOAA, U.S.) NDIR non-dispersive infrared NDSC Network for the Detection of Stratospheric Change NESDIS National Environmental Satellite, Data, and Information Service (NOAA, U.S.) NIST National Institute of Standards and Technology (United States) NIWA National Institute of Water and Atmospheric Research (New Zealand) NOAA National Oceanic and Atmospheric Administration (United States) NOGAPS Navy Operational Global Atmospheric Prediction System NPOESS National Polar-Orbiting Operational Environmental Satellite System NRL Naval Research Laboratory (United States) NSF National Science Foundation (United States) NWS National Weather Service (NOAA, U.S.) ODGI ozone-depleting gas index ODSs ozone-depleting substances OHP Observatoire de Haute-Provence (France) OMI Ozone Monitoring Instrument OMPS Ozone Mapping and Profiler Suite (NPOESS) OMS Observations of the Middle Stratosphere OSIRIS Optical Spectrograph and Infrared Imaging System PEM Particle Environment Monitor POAM Polar Ozone and Aerosol Measurement POES Polar Orbiting Environmental Satellites PSCs polar stratospheric clouds PTB Physikalisch-Technische Bundesanstalt (Germany) QBO quasi-biennial oscillation SAGE Stratospheric Aerosol and Gas Experiment SAM Stratospheric Aerosol Measurement SBUV Solar Backscatter Ultraviolet SCIAMACHY Scanning Imaging Absorption Spectrometer for Atmospheric Cartography SHADOZ Southern Hemisphere Additional Ozonesonde (Network) SOLSTICE Solar Stellar Irradiance Comparison Experiment SOLVE SAGE III Ozone Loss and Validation Experiment SORCE Solar Radiation and Climate Experiment SPARC Stratospheric Processes and Their Role in Climate

290
SPEs solar proton events SRRB Surface Radiation Research Branch (NOAA, U.S.) SUNY State University of New York (United States) SURFRAD Surface Radiation Budget Network (NOAA, U.S.) SUSIM Solar Ultraviolet Spectral Irradiance Monitor TDL tunable diode laser TES Tropospheric Emission Spectrometer TOMS Total Ozone Mapping Spectrometer UARS Upper Atmosphere Research Satellite UAV uninhabited aerial vehicle UCI University of California, Irvine (United States) UKMO United Kingdom Meteorological Office UNEP United Nations Environment Programme USDA U. S. Department of Agriculture (United States) USGS U. S. Geological Survey (United States) UV ultraviolet UVMRP UV Monitoring and Research Programme UVR ultraviolet radiation WMO World Meteorological Organization WOUDC World Ozone and Ultraviolet Radiation Data Centre (Canada) WVMS Water Vapor Millimeterwave Spectrometer YES Yankee Environmental Services, Inc.
****

291
UZBEKISTAN
Ozone Monitoring
In Uzbekistan the monitoring of the total ozone content (TOC) and its surface concentrations is carried out by the Service of the Environment Monitoring at the Centre of Hydrometeorological Service at the Cabinet of Ministers of the Republic of Uzbekistan (Uzgidromet).
Currently, the regular daily observations of the total stratosphere ozone content are being conducted at two stations – Tashkent (37,1 N, 69,2 E, 478 m a.s.l.) and Termez (37,1 N, 67,2 E,311m a.s.l.).
Both stations operate since 1989. At Kumbel and Abramov glacier stations the observations were ceased because of the equipment failure and absence of financing for its restoration.
The observations of the total ozone content are being made with the filtering ozone measuring -124 device designed by Guschin P. (manufactured in Russian). Because of financial difficulties this device did not undergone calibration, but nevertheless, as it was confirmed by the Central Aerological Observatory (CAO) (Dolgoprudny town, Moscow region, Russia) the data on the stratospheric ozone content measured at Tashkent station, are highly compatible with satellite data.
Systematic observations on tropospheric ozone and other trace gases ( 2, , NO, NO2 and others) are being continued in all big cities of Uzbekistan. Samples are being taken 2 times a day – in the morning and midday, since April till October. The concentration of tropospheric ozone is made by photometric method based on the displacement of iodine by ozone when it is adsorbed by the solution of potassium iodide. The extracted iodine is estimated by the spectrophotometric measurement of the adsorption spectrum by the iodine ions with the wavelength of 352 nm.
According to the data of systematic observations the mean annual ozone concentration in surface layer in Tashkent in summer exceeds MAC (Maximum Admissible Concentration) from 1,3 to 3 times which corresponds 39-69 µg/m3. The mean daily MAC for Uzbekistan is 30 µg/m3. The highest tropospheric ozone content is recorded in Bekabad (2-3 MAC) and Chirchik (3-3,7 MAC) which is caused by the increased level of the atmospheric pollution with the ozone precursors. Every year the increase of the ozone concentration in surface layer is recorded since May to September, while in October the ozone content is slightly lower. The data of observations are being published in the yearly reviews on atmospheric pollution. In case of the increase ozone concentrations the information is being transferred to the relevant departments of the State Committee on Environment Protection following the pattern of the information exchange adopted in the Republic of Uzbekistan.
Information
The mean daily data on the stratospheric ozone content are transferred one time per month from Tashkent station to the Voeikov’s Main Geophysical Observatory (MGO) (Saint-Petersburg, Russia) for the further generalization and transfer to the World Centre of Ozone Data in Toronto (Canada). The results of the regular daily measurements of TOC are being transferred to the Central Aerological Observatory (CAO) (Dolgoprudny town, Moscow region, Russia) for the inclusion of this information to the international framework of the data exchange.

292
During winter period (December – March) a similar information is transferred 3 times a week to the University in Tessaloniki (Greece).
Information received from Termez station is being used for scientific studies. All primary information is stored in archive of Uzgidromet of the Republic of Uzbekistan.
At present the data base on stratospheric and surface (tropospheric) ozone is built up. The daily 2-times a day measurements of the surface ozone content in Almalyk (1992-2000), Tashkent (1991-2000), Chirchik (1992-1999), Fergana (1994-2000) cities and measurements of TOC over Tashkent measured by the surface methods and from satellites put the basis for such data base. The concentration of the surface ozone content was measured at 07am and 13pm of the local solar time by the known method and is expressed in µg/m3. As it is known the concentration of TOC is measured daily in Dobson units.
The values of ozone ( 3) measured in stratosphere and in surface layer are presented in PC readable form. The software designed for the archive data manipulation are written and debugged.
Scientific studies on the stratospheric and tropospheric ozone
Scientific and experimental studies related to the investigation of the current state of stratospheric and atmospheric ozone in the Republic of Uzbekistan are carried out at the Research Hydrometeorological Institute of Uzgidromet at the Laboratory of Ozonosphere and Ionosphere Studies and at the Department of Studies and Forecasting of the Environment Pollution.
The conducted studies are aimed to the solution of the following tasks:
to analyze the available information by the results of parallel measurements of stratospheric and tropospheric ozone to reveal their relationship, evaluation of the stratospheric ozone effect on the surface ozone concentration; to study the possible mechanisms of the ozone transfer from stratosphere to troposphere; to find out the main mechanisms of the ozone formation in the polluted atmosphere of the urbanized territories and the role of precursors;to develop regional models of the ozone formation, of its spatial-time distribution, flow in the conditions of rough orography and arid climate; to analyze the state of the measuring network of tropospheric and stratospheric ozone, work out a programme for the measuring network updating; to work out a methodology for the evaluation of the zone effect on the surface vegetation; to carry out experimental studies of the surface ozone concentrations on the localities between the settlements; elaboration of standard for the atmospheric pollution by ozone for the surface vegetation.
Main results
As it was mentioned before, for I, II point the data base was built up by the results of measurements of stratospheric and tropospheric ozone and precursors of the ozone formation. Statistical analysis of the obtained information allowed revealing the relationships between the surface and stratospheric ozone and Wolf numbers. The reference days when stratospheric ozone has undergone the extreme variations were found out. The method of the epoch’s superposition in relation to the reference dates was applied to the Wolf’ numbers. Thus, the situation on the Sun when stratospheric ozone has undergone an extreme sudden increase or decrease of concentrations was defined. On Figure 1 the upper curve corresponds to the positive sudden increase of TOC, while the lower one – to the extreme sudden decrease of TOC values. Table 1 presents the statistical parameters of the both groups along the columns. Despite the substantial discrepancy of statistic data the positive extreme increase of TOC values follow the enhancement of the solar activity while the minimum value of the ozone layer density in stratosphere

293
corresponds the lower spot number on the Solar disk. The both processes are about 24 h ahead the phenomena in stratosphere. The obtained result does not contradict the theoretical outlook on the nature of stratospheric ozone formation.
Let’s consider now the surface ozone and try to derive the relationship between the surface ozone and, consequently, the flow of the solar UV-rays. The mean annual values of the Wolf’s numbers and the averaged 3 values measured at Tashkent, Chirchik, Almalyk, Angren, Bekabad and Fergana stations were used. Figure 2 presents the correlation of these parameters. The density of the average monthly ozone values over the region is inversely proportional to the Wolf’s numbers and, consequently, to the flow of UV-rays. If this is right, then it is rather difficult to suppose that the surface ozone component is formed, mainly due to photochemical reactions in the polluted atmosphere.
In the course of investigation of the assessment of the tropospheric ozone effect onto the surface vegetation the important results were obtained.
The results of the conducted studies have revealed the possible negative effect of the nitrogen and ozone oxides on physiology of the vegetative cell. The existence of the manifested inverse relationship between the concentration of photosynthesis pigments and NO3
- content in vegetation fibers was detected. In this case NO3
- is the precursor of the ozone formation in the polluted atmosphere.
The studies on the ozone effect on the surface vegetation carried out at the Department of Investigations and forecasting of the Environment Pollution of NIGMI enabled to set up the ecological standard for annual plants - EcoMAC = 0,061 µg/m3, MACad (average daily)= 0,029 µg/m3 at departmental level.

294
Up
per
curv
e –
re
fere
nce
valu
es
were
se
lect
ed b
y m
axi
mum
TO
C.
Low
er
curv
e -
refe
rence
va
lues
were
sele
cted b
y m
imim
um
TO
C.
Ave
rag
ing
perio
d 1
99
2-2
00
2 y.
Fig
ure
1:
Avera
ged
vari
ati
on
s o
f th
e W
olf
`s n
um
bers
in
rela
tio
n t
o r
efe
ren
ce d
ate
s.

295
Table 1: Main statistics of the Wolf`s number groups.
W-grouping in relation to TOC maximum values W-grouping in relation to TOC minimum values
-2 -1 0 1 2 -2 -1 0 1 2
Mean value 105,2439 109,1852 107,35 105,2375 104,1829 103,3387 100,6452 100,3175 99,70968 97,8871
Statistic error 8,829128 9,085569 9,298481 8,977296 8,610847 9,477992 9,587226 9,601769 9,603685 9,532518
Median 85,5 99 94 89 87,5 85 86 83 95 88,5
Mode 0 0 0 0 0 73 11 79 41 11
Statisticdeviation
79,95115 81,77012 83,16814 80,29538 77,97453 74,62978 75,4899 76,21168 75,61949 75,05913
Dispersion 6392,187 6686,353 6916,939 6447,348 6080,028 5569,605 5698,724 5808,22 5718,308 5633,872
Excess -0,62463 -0,702 -0,45132 -0,56785 -0,4001 -0,54635 -0,08934 0,034573 0,243303 -0,3959
Asymmetry 0,56543 0,525671 0,608251 0,592944 0,642886 0,661969 0,856455 0,810723 0,77459 0,677018
Interval 320 315 320 288 289 277 291 298 342 297
Minimum 0 0 0 0 0 11 11 0 0 0
Maximum 320 315 320 288 289 288 302 298 342 297
Sun 8630 8844 8588 8419 8543 6407 6240 6320 6182 6069
Calculation 82 81 80 80 82 62 62 63 62 62
Ahead in days Referencedata
Delay in days Ahead in days Referencedata
Delay in days

296
Fig
ure
2:
Co
mp
ari
so
n o
f th
e a
ve
rag
e a
nn
ua
l W
olf
`s n
um
be
r w
ith
th
e a
ve
rag
e o
f a
ve
rag
e m
on
thly
valu
es
by
6 s
tati
on
s o
f th
e r
eg
ion
in
19
92
-200
0 y
.

297
Problems and needs of the ozone monitoring
The current level of scientific investigations implies the availability of the update equipment and instrumentation. However, under the present circumstances the instrumentation base does not meet the current needs. The filter ozone meters M-124 which are in use at the ozone monitoring stations of Uzbekistan are obsolete and out of date, besides they were not calibrated during many years and need to be calibrated. The last calibration of instruments was made in 1993. It is needed to have at least one Dobbson or Bruger spectrophotometer for the calibration of the network ozone meters.
For getting more comprehensive and reliable information on TOC it is required to extend the network of the regular daily observations which can be fulfilled with the relevant equipping of stations with the modern equipment and instrumentation and with the provision of financial support of international organizations.
Unfortunately, because of the absence of the relevant instruments we could not start the monitoring of solar UV-B radiation in parallel with TOC measurement as well as the cycle of activities designed at the experimental estimation of the reduction of the crop capacity of agricultural crops in relation to the increase of UV-B radiation.
Since January 2001 the station for satellite information receiving from NOAA satellites is in operation at Uzgidromet. It was supplied by USAID agency as humanitarian aid.
The problem urgent necessity is to carry out the training courses for the young specialists of the republic with the aim of practicing new technical means for the measurement of ozone and flow of UV-B rays, measurement of traces of halloid-hydrocarbons, studying of the new mathematical models linking the atmospheric chemistry and climate as well as training related to the issues of the forecasting of the ozone layer behaviour.
****

298
VIETNAM
Introduction
National Hydro – Meteorological Service of S.R. Vietnam (NHMS) have 3 ozone and UV-B observing stations. The observation is carried out since May1992 in Hanoi station (21001’N, 105051’E). From 1994, Sapa station (22o21’N, 103o49’E) and Tan Son Hoa station (10o47’N, 106o42’E in Ho Chi Minh City) also start observing regularly. All the management for the ozone and UV-B observation in NHMS is operated by the Aero – Meteorological Observatory (AMO).
Observational Activities
The Total amount of atmospheric ozone (TO3) and UV-B are measured by M124 filter instrument, manufactured in Russia. The TO3 is measured 7 times per day with the sun height is in between 20o and 70o . The UV-B is measured 11 times per days from 7h to 17h LT (within period of 1st May to 31st October), and 9 times per day from 8h to 16h LT (within period of 1st November to 30th April).
From 2002 to 2005, AMO have sent all M124 for calibration in GGO (Petersburg, Russia) 2 times, in July 2002 and in September 2004. Since the new filters of M124 were not available, so after the calibration few months, our M124 instruments could not give the data with high quality. Even though, all the 3 stations have to absorb TO3 and UV-B, following the National Guide for observation. AMO have sent 03 more instruments M124 for calibration but only coming September AMO would receive the calibrated one.
Results from observation and analysis
According to the Global Distribution of Total Ozone, measured by satellite, Vietnam is located in the region with the total amount of ozone is changed from 200DU to 300DU (1), minimum in winter and maximum in summer.
From 2003 to 6/2005, as indicated on the Table and Figure 1 the total ozone measured at Tan Son Hoa were changed in between 200DU to 280DU, accept from March of 2005 up to now the TO3 were less than 200. The trend of TO3 was not clear. In 2003 we have seen the maximum value of TO3 was in September (273DU). It seems irregular.
At the same time the TO3 measured in Hanoi was out of limits. AMO has reported to WOUDC the situation of fault data and stopped to submit the TO3 data measured in Hanoi since June of 2003. Only from November 2004 the M124 in Hanoi has been replaced by the calibrated one and the data has been submitted to WOUDC again (table and figure 2)
The TO3 measured at Sapa was out of limits too. The annual trend of TO3 was also opposite compare with the map of Global Distribution of TO3, measured by satellite. Maximum value of TO3 was observed in November or December of the year. The TO3 has been changed without stable trend. It is fault data since the M124 has been defected and only replaced by the newly calibrated one in January 2005. From Jan. 2005 to June 2005, the TO3 changes from 257DU to 301DU, within the limits. The highest value is observed in April 2005.

299
Table and Figure 1: Annual trend of TO3 measured at Tan Son Hoa.
Month Year 2003 Year 2004 Year 2005
1 251 234 216
2 247 243 205
3 249 261 199
4 254 263 185
5 257 267 184
6 243 266 183
7 248 269
8 260 263
9 273 260
10 267 256
11 238 229
12 241 225
150
170
190
210
230
250
270
290
1 2 3 4 5 6 7 8 9 10 11 12
Month
TO3
Year 2003
Year 2004
Year 2005

300
Table and Figure 2: Annual trend of TO3 measured at Hanoi.
Month Year 2003 Year 2004 Year 2005
1 288 373 274
2 290 390 284
3 322 439 310
4 360 424 310
5 385 454 308
6 417 478 291
7 422 376
8 377 365
9 450 314
10 431 297
11 431 257
12 412 267
250
300
350
400
450
500
1 2 3 4 5 6 7 8 9 10 11 12
Month
TO3
Year 2003
Year 2004
Year 2005

301
Table and Figure 3: Annual trend of TO3 measured at Sapa.
So, last two years 2003 and 2004 the TO3 data measured in Vietnam has not been qualified due to the fault M124 and we have no budget for calibrating the equipments in Russia every year.
Since the ozone data was not qualified, the UV-B would not qualified too. So the UV-B data would not be reported here.
Projects and collaboration
Since September 2004, in the framework of SOWER/Pacific project, NHMS has been carried out the ozonesounding by ECC ozonesonde once per month. All the equipments needed for observation supported by the project. The on - site training has been conducted by the Japanese experts.
Month Year 2003 Year 2004 Year 2005
1 291 382 274
2 313 370 257
3 342 425 263
4 377 452 301
5 354 444 292
6 352 390 279
7 352 459
8 353 436
9 365 419
10 335 460
11 373 454
12 330 538
250
300
350
400
450
500
1 2 3 4 5 6 7 8 9 10 11 12Month
TO3
Year 2003
Year 2004
Year 2005

302
Future Plan
Since the filters of M124 will not be produced NHMS plan to replace the new equipment for ozone and UV-B observation and to continue the international collaboration in this field.
Needs and recommendations
1. NHMS needs the financial support to replace the equipment for measuring the TO3 and UV-B to meet the requirement of the quality of data.
2. NHMS's personnel’s need the scientific and technical training and more international collaboration.
3. NHMS needs the financial support for exchange of visits amongst personnel from the monitoring stations of NHMS and other countries for improve our personnel’s operational skill and knowledge.
4. NHMS hope to receive the support to carry out the ozonesounding in Hanoi at least once a week since we conduct the radiosounding twice a day by the DigiCORA-RS sonde, manufactured by Vaisala Co., Finland.
Finally, I would like to thank to WMO/UNEP give me opportunity to attend this meeting and give the national report on ozone and UV-B monitoring activities in S.R. Vietnam and NHMS would expect more international support in this field.
References
D.W. Fahey (2002) Twenty Questions and Answers About the Ozone Layer.
Report of the Fifth Meeting of the Ozone Research Manager of the Parties to the Vienna Convention for the Protection of the Ozone Layer. Geneva, 25 -27 March, 2002.
National Guide for ozone and UV-B observation, 2002.
****

303
WMO GLOBAL OZONE RESEARCH AND MONITORING PROJECT REPORTS
1. Atmospheric Ozone - A Survey of the Current State (by R.D. Bojkov to the UNEP Meeting of Experts on the Ozone Layer (Washington, D.C. March 1977).
2. Report of the Meeting of Experts on Ozone Modelling and Stratospheric Tropospheric Exchange Processes (Geneva, April 1977).
3. Report of the Meeting of Experts on UV-B Monitoring and Research (Geneva, May 1977).
4. Report of the Meeting of Experts on Measurements of Rare Species Relevant to the Ozone Budget (Seattle, May 1977).
5. Report of the Meeting of Experts on Stratospheric Circulation Analysis and Ozone (Washington, D.C., July 1979).
6. Operations Handbook - Ozone Observations with a Dobson Spectrophotometer (by W.D. Komhyr).
7. Report of the WMO Meeting of Experts on 2-D Ozone Models (Toronto, November 1979).
8. Report of the WMO Meeting of Experts on Rare Atmospheric Constituents of Importance to the Ozone Layer, (Washington, D.C., February 1980).
9. Report of the Meeting of Experts on Assessment of Performance characteristics of Various Ozone Observing Systems (Boulder, July 1980).
10. Contribution of Ozone and Other Minor Gases to Atmospheric Radiation Regime and their Possible Effect on Global Climate Change (by E.L. Aleksandrov, I.L. Karol, A. Ch. Khrgian, L.R. Rakipova, Yu. S. Sedunov).
11. The Stratospheric 1981 Theory and Measurements (A Meeting of Experts on the State of the Stratosphere, Hampton, Virginia, May 1981).
12. Report of the Meeting of Experts on Sources of Errors in Detection of Ozone Trends (Toronto, April 1982).
13. Review of the Dobson Spectrophotometer and its Accuracy (by Reid E. Basher).
14. Report of the Meeting of Experts on Potential Climatic Effects of Ozone and Other Minor Trace Gases (Boulder, September 1982).
15. Report of the Meeting of Experts on Tropospheric Ozone, its Changes and Possible Radiative Effects (Shanghai, October 1984) (TD No. 156).
16. Atmospheric Ozone 1985 Assessment of our Understanding of the Processes Controlling its Present Distribution and Change (3 volumes).
17. Measurement of Atmospheric Ozone Profiles Using the Brewer/Mast Sonde - Preparation, Procedure, Evaluation (by H. Claude, R. Hartmannsgruber and U. Kohler) (TD No. 179).
18. WMO/NASA International Ozone Trends Panel Report - 1988 (2 volumes).
19. Survey of WMO-Sponsored Dobson Spectrophotometer Intercomparisons (by Reid E. Basher) (TD No. 657).

304
20. Scientific Assessment of Stratospheric Ozone - 1989 (2 volumes).
21. Report of the Preparatory Meeting of the Ozone Research Managers of the Parties to the Vienna Convention for the Protection of the Ozone Layer (Geneva, February 1990).
22. WMO Consultation on Brewer Ozone Spectrophotometer Operation Calibration and Data Reporting (Arosa, Switzerland, August 1990).
23. Report of the First Meeting of the Ozone Research Managers of the to the Vienna Convention for the Protection of the Ozone Layer (Geneva, March 1991).
24. Report of the International Workshop on Dobson Ozone Data Re-evaluation (Greenbelt, MD, September 1991 ) (TD No. 489).
25. Scientific Assessment of Ozone Depletion – 1991.
26. Report of the Meeting of Experts on Surface Ozone Data, their Analysis and Related Issues (Geneva, November 1991).
27. Third WMO Intercomparison of the Ozonesondes used in the G030S (Vanscoy, Canada, 13-24 May 1991 ) (TD No. 528).
28. Visible light Nigrogen Dioxide Spectrophotometer Intercomparison (Mt. Kobau, Canada, August 1991) (TD No. 835).
29. Handbook for Dobson Ozone Data Re-evaluation (TD No. 597).
30. Second WMO Consultation on Ozone Measurements by Brewer Spectrophotometer (Charlottesville, Virginia, 1-3 June 1992).
31. Atlas of Total Ozone G030S Maps for the European Arctic Stratospheric Ozone Experiment (November 1991 - March 1992). (Coordinated t R.D. Bojkov and Ch.S. Zerefos) (TD No. 517).
32. Report of the Second Meeting of the Ozone Research Managers of Parties to the Vienna Convention for the Protection of the Ozone Layer (Geneva, 10-12 March 1993).
33. Report of WMO Consultation on UV-B Monitoring and Functions of WMO Data Centre - Toronto (Toronto, 15-17 December 1992).
34. Atlas of G030S Total Ozone Maps for the Northern Hemisphere Winter-Spring of 1992-1993. (Coordinated by R.D. Bojkov and Ch.S. Zerefos) (TD No. 593).
35. WMO Meeting of Experts on Homogenizing Total Ozone Records for Ozone Assessments and Early Warning of Ozone Changes. Saloniki, 27-30 November 1993 (Preparation coordinated by R.D. Bojkov).
36. Report of WMO/NOAA Meetings on Ozone Data Re-evaluation and use of Dobsons and Brewers in the G030S (Tenerife, June 1994).
37. Scientific Assessment of Ozone Depletion – 1994.
38. Atlas of G030S Total Ozone Maps for the Northern Hemisphere Winter-Spring of 1993- 1994 and 1994-1995 (Coordinated by Rumen D. Bojkov and Ch.S. Zerefos).

305
39. Atlas of G030S Total Ozone Maps for the Northern Hemisphere W Spring of 1995-1996 and 1996-1997 (Co-ordinated by Rumen D. Dimitris S. Balis and Ch.S. Zerefos).
40. Consultation of Experts on Reactive Halogen Compounds and the Possible Effect on Ozone (Hradec Kralove, Czech Republic, 13-16 November 1995) (TD No. 798).
41. Report of the Third Meeting of the Ozone Research Managers of Parties to the Vienna Convention for the Protection of the Ozone Layer (Geneva, 19-21 March 1996).
42. Atlas of G030S Total Ozone Maps for the Northern Hemisphere Winter-Spring of 1997-1998 and 1998-1999 (preparation coordinated by Rumen D. Bojkov, Dimitrius S. Balis and Christos S. Zerefos).
43. SPARC/IOC/GAW Assessment of Trends in the Vertical Distribution of Ozone (Geneva, May 1998).
44. Assessment of the Scientific of Ozone Depletion: 1998.
45. Report of the Fourth Meeting of the Ozone Research Managers of the Parties to the Vienna Convention for the Protection of the Ozone Layer (Geneva, 28-30 April 1999).
46. Report of the Fifth Meeting of the Ozone Research Managers of the Parties to the Vienna Convention for the Protection of the Ozone Layer (Geneva, 25-27 March 2002) (Report with annexes A and B).
47. Scientific Assessment of Ozone Depletion: 2002 - Twenty Questions and Answers about the Ozone Layer.