net zero by 2030: where do we stand with the policies...
TRANSCRIPT

1
Net Zero by 2030: Where do we stand with the policies, programs and projects necessary to achieve this goal?
Dave Hewitt, New Buildings Institute Stacey Hobart, New Buildings Institute
Abstract
The quest to achieve net zero energy buildings by 2030 as a means to curb the impacts of
climate change may have lost some of its luster lately as programs and policies focus on efficiency efforts in existing building stock and whatever else that will spur job creation in the near term. But, the development of net zero energy projects, policies and programs has certainly not stopped.
Zero-energy targets for commercial buildings have been widely adopted by groups such as the U.S. Conference of Mayors, National Association of Counties and by hundreds of leading design and engineering firms through the 2030 Challenge and AIA 2030. ASHRAE is also actively tying its work focus and outcomes to the 2030 goal of net-zero-energy buildings. Massachusetts and California continue to pursue a net zero energy building agenda.
New Buildings Institute (NBI), the Zero Energy Commercial Buildings Consortium and the National Association of State Energy Officials (NASEO) completed a study in early 2012 examining the number, efficiency features and cost of net zero buildings across the United States. This paper builds on that study and includes: a look at the market, lessons learned from current projects on technologies and strategies applied, descriptions of some of the programs and policies that are supporting forward movement, and recommended next steps.
Introduction
Zero Energy Buildings (ZEBs), those that use no more energy over the course of the year
than they produce from on-site renewable sources, are increasingly specified in green building and public policy goals. With buildings accounting for nearly 40% of total domestic energy use1, there is clear potential for significant reductions in pollution and increased energy independence from efficiency in this sector. The ZEB concept provides a definitive end focus for a pathway that moves commercial buildings from current design practice to deep energy efficiency, and then to the final step of adding onsite renewables to supply remaining energy needs.
Documented cases of achieving zero energy, though still rare, are increasing, and more projects are in the planning stages. As the numbers of these extremely low-energy buildings rise, we advance toward the goal of zero energy building as a standard practice by 2030. But will we achieve it? A recent look by Architecture 2030 at the Annual Energy Outlook indicates things are headed in the right direction.
1 DOE Buildings Energy Data Book, March 2011. Commercial and residential total share of US primary energy.

2
“In 2005, the AEO forecast an increase in total U.S. building floor area of 51.9% from 2005 to 2030, with energy consumption and CO2 emissions increasing by 44.4% and 53.1% respectively. While the AEO 2011 projects a slightly lower building floor area increase of 38.6% over this same time period, the projected energy consumption and related CO2 emissions from the Building Sector are dramatically less than what was projected in 2005. The Building Sector is becoming less energy and carbon intensive.” (Architecture 2030)
Policies and programs working to advance highly efficient commercial buildings and
zero energy goals are progressing, however these remain limited. Efforts in California and Massachusetts are the most comprehensive and include strategic plans to achieve zero energy buildings by a target date. Continued innovation in public policy will be required including outcome-based codes and policies that address unregulated loads.
Some utility and public benefits programs, such as that of the Energy Trust of Oregon, are considering or have piloted financial incentives for zero energy commercial buildings. The Living Future Institute offers a Net Zero Energy Building Certification that recently announced its first two approved buildings. How Many ZEBs Are There?
In early 2012, NBI, the Zero Energy Commercial Building Consortium and NASEO released a research report summarizing the available literature on the technology and design measures used for ZEBs2 and incremental costs associated with those strategies.
That study identified a total of 99 buildings including 21 ZEBs and an additional 39 potential ZEBs that were either still under construction or could not provide enough data to verify zero-energy performance. Just over half of the ZEB projects were completed between 2008 and 2010. (Note: Buildings completed in 2011 were unverified because they lacked a full year of performance data.) Another 39 zero energy-capable buildings were also identified—
2 Other publications have provided broad overviews of zero energy buildings. See for example, the 2011 white paper from Building Design + Construction, which covers definitions, strategies, and some case examples of zero energy construction efforts.

3
highly efficient buildings that could be zero energy, but didn’t take the final step of installing on-site renewable resources.
The 2003 national average energy use intensity (EUI) of all U.S. commercial buildings is 93 kBtu/square foot (sf) (CBECS). The least efficient buildings in the study had an EUI of 35 kBtu/sf, while the most efficient used about 10% of the national average or 9 kBtu/sf.
This study focuses on cases in which the zero energy goal is achieved on a single site. Even though location, space constraints, and building activity type won’t always accommodate this goal, the single site lessons also inform the pathway to achieving zero energy goals on a district or regional basis. The policy benefits of ZEBs can be achieved with renewable resources located off-site, either in district systems or through the existing utility grid. Current Zero Energy Buildings
Table 1, on the next page, identifies the 21 occupied commercial buildings with either
measured net zero energy results (15 cases) or credible modeled3 expectations for such results (six cases).4 The cases without published measured results have been vetted by staff reviewing submissions to the U.S. Department of Energy’s (DOE) Zero Energy Buildings Database or other reliable sources.
Figure 1: Location of the 21 zero energy projects
3 Sophisticated computer modeling of anticipated energy use is common in designing high performance buildings, as a tool for evaluating and choosing among alternative efficiency measures. Modeling reflects the building’s performance goals and remains the only quantified estimate of performance until actual energy bills for at least one year of occupancy have been analyzed. The former, measured energy use gives the true indication the performance level achieved, and provides valuable feedback on successful strategies and areas of improvement. 4 Table includes all cases with less than 5 kBtu/sf of reported purchased annual energy. See for example, the 2011 white paper from Building Design + Construction, which covers definitions, strategies, and some case examples of zero energy construction efforts. (BD+C)

4
The current zero energy buildings are located in a variety of U.S. climates, as shown in Figure 1, above. Both California and Hawaii are well represented, with six and two buildings, respectively. The mild climates of these states certainly helps make ZEBs achievable. However, projects have also been completed in the harsher climates of Minnesota, Wisconsin, and New York.
With exception of two facilities completed in 2010 — Richardsville Elementary and the NREL facility — all ZEBs are less than 15,000 square feet, and half are less than 5,000 square feet. More large building examples will be helpful in expanding the ZNE impact. However, this relatively small building size is representative of the overall existing commercial building stock.
Table 1: Verified Zero Energy Buildings
5
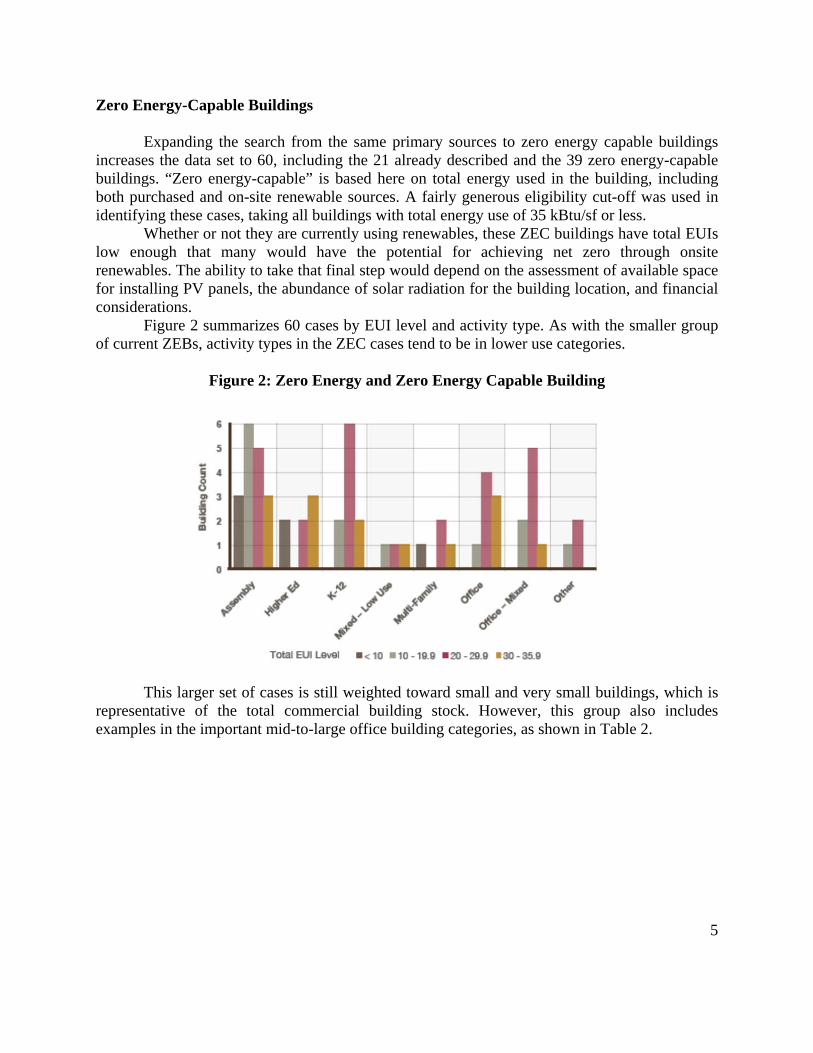
Zero Energy-Capable Buildings Expanding the search from the same primary sources to zero energy capable buildings
increases the data set to 60, including the 21 already described and the 39 zero energy-capable buildings. “Zero energy-capable” is based here on total energy used in the building, including both purchased and on-site renewable sources. A fairly generous eligibility cut-off was used in identifying these cases, taking all buildings with total energy use of 35 kBtu/sf or less.
Whether or not they are currently using renewables, these ZEC buildings have total EUIs low enough that many would have the potential for achieving net zero through onsite renewables. The ability to take that final step would depend on the assessment of available space for installing PV panels, the abundance of solar radiation for the building location, and financial considerations.
Figure 2 summarizes 60 cases by EUI level and activity type. As with the smaller group of current ZEBs, activity types in the ZEC cases tend to be in lower use categories.
Figure 2: Zero Energy and Zero Energy Capable Building
This larger set of cases is still weighted toward small and very small buildings, which is
representative of the total commercial building stock. However, this group also includes examples in the important mid-to-large office building categories, as shown in Table 2.

6
Table 2: Zero energy and zero energy-capable counts by type and size
Design Strategies Utilized
Figure 3 presents the technology penetration of 11 design strategy categories reported in
the buildings studied. At the literature review level of this study, a couple caveats are needed. First, the typical case study does not necessarily mention every efficiency measure used, nor does it clearly define the details of measures that are mentioned. Thus, this summary is primarily an indication of the types of strategies that have been considered noteworthy. In addition, these summaries represent the entire set of documented cases, across a wide range of climates. Climate responsive design is a necessary part of optimized design, but the current data set is not large enough to show differences by region in strategies used. As more documented examples are consolidated, important breakdowns such as analysis by climate will become possible.5
Figure 3: Technologies used in ZEB and Zero Energy-Capable Buildings
5 Note that it is possible to search NBI’s Getting to 50 Buildings Database by state or climate zone to find specific case studies in a particular area.

7
More than 85% of the studied cases report designs incorporating daylighting. Most reports, however, do not provide sufficient detail to know whether effective automated controls were installed to maximize the potential energy savings, nor how well the daylighting was balanced with an appropriately managed ratio of window to wall area. Approximately two-thirds reported high efficiency lighting, including occupancy-based controls and/or high efficiency lamps (68%). More than 50% of the buildings also report using a high performance envelope with increased insulation and well-insulated glazing. Half of the buildings use natural ventilation. These strategies align well with the proven design approach of starting with a good building envelope, access to natural light and ventilation, and an integrated design of building systems.
The most noteworthy characteristic of the reported strategies is that nearly all refer to measures and equipment that are commercially available today.
The common theme across these ZEBs is their focus on the goal: to build a building that puts at least as much energy into the grid than it uses. The clear statement of objectives at the beginning of the design process, as a guide to decisions and prioritizations throughout the project, is essential to optimized results. In terms of features, each building has taken an integrated, location-specific approach to achieving that goal of net zero energy use. These buildings demonstrate that net zero is feasible, with examples in many different U.S. climates. With this intent, a skilled design team and off-the-shelf building technology, these projects have demonstrated the feasibility of meeting that goal.
Incremental Costs Are Within Range
The design and construction process includes many iterations of changes and trade-offs to
balance owner wishes with budget limitations. Within this framework, quantifying the incremental cost of energy-saving features can be problematic. Incremental costs of efficiency measures in zero energy buildings were assessed from two perspectives. A number of modeling studies were reviewed (Cascadia, Hendricks and Upadhyaya, HOK and Weidt, Leach and Hirsch and Pless and Torcellini, Matthiessen and Morris, Packard, Thornton and Wang and Huang and Land and Liu, Thornton and Wang and Land and Rosenberg and Liu).
These studies indicate incremental costs for efficiency features of between 3% and 18% of baseline costs (not including renewable). Costs for achieving the levels of efficiency needed to support ZEB buildings appears to require only limited additional costs for some building types. In larger buildings, the costs of moving to advanced types of HVAC increased costs more significantly.
Deriving incremental costs from the few ZEBs that had data was difficult because of the limited information. However, the few reported ZEBs appear to show lower overall incremental costs than the modeled estimates. Those costs are between 0% and 10%. Payback periods, where mentioned are 11 years or less, except for one case where the PV system extended the period. Reoccurring themes in the actual cases include the use of creative trade-offs in the design and construction process to manage total project costs within budget.

8
Program and Policy Pathways for Moving to ZEBs
Emerging programs that support and recognize ZEBs in the market have already had noticeable impact, but remain extremely limited. Programs so far include: Net Zero Energy Building Certification by the Living Future Institute, which recently approved its first two buildings; a deeper savings version of the Savings by Design program of the California utilities; and a Path to Zero pilot for new construction conducted by the Energy Trust of Oregon.
Nationally, the Zero Energy Commercial Buildings Consortium works to coordinate a broad-based industry/ government collaborative of about 500 organizations to move the commercial sector to “net-zero” levels of energy performance. On the policy front, California and Massachusetts lead.
When considering the locations of identified ZEB or zero-energy capable buildings, the program and policy support of California and Oregon appear to be making a difference. Of the 99 buildings identified to date that are either ZEBs or approaching ZEB status, 23 projects are located in California and 9 are in Oregon.
In California, state agencies have adopted “BBEES – Big, Bold, Energy Efficiency Strategies” and goals of making all new commercial buildings zero net energy by 2030. This also includes making all new residential zero energy by 2020, and 50% of existing commercial buildings by 2030.
As part of this planning approach, the California Public Utilities Commission has used the following conceptual diagram depicted in Figure 4 which represents the diffusion of the zero net energy concept across the market.
Figure 4: Conceptual Market Diffusion for Zero Net Energy Targets
Innovators Early Adopters Early Majority Late Majority Laggards
As major building owners and managers of public building portfolios, state and local
governments can lead by example by becoming early adopters of advanced technologies and energy management practices. Indeed, the relatively high number of public ZEBs indicates the level of public sector commitment and market-leading capacity. Demonstration projects, public procurement policies, and public facility management practices can prove performance, generate a body of data, enhance industry capacity, and provide education and awareness-raising opportunities.

9
Policies, such as building energy codes, renewable portfolio standards, energy efficiency resource standards, and statewide energy efficiency or greenhouse gas reduction targets, define a floor for minimum performance. Additionally, states can also push the envelope through voluntary initiatives such as building energy reach codes and building energy rating and disclosure. These voluntary policies serve to establish expectation in the marketplace and in the industry for continuous energy efficiency improvements in the future—charting a predictable path towards net-zero energy goals.
The Commonwealth of Massachusetts is a prime example of how stretch codes can significantly advance market practice. The state set its stretch code in 2009 and within two years, over 100 “green” communities had adopted it. Utility programs in the state were aligned with the stretch code and offered incentives for buildings that followed it. The stretch code, which is based on NBI’s Core Performance Guide, ultimately served as the basis for the 2012 International Energy Conservation Code (IECC) approved in October 2010.
By the time the 2012 IECC becomes the base code for Massachusetts in early 2013, the next iteration of the state’s stretch code will be in place and the utility efficiency programs operating there will likely be incenting it. The alignment of utility program and stretch code specifications allows both for greater impact of both efforts to accelerate the market acceptance and adoption of more stringent energy efficiency codes in the future.
States can also play a key role in facilitating commercialization of new and emerging technologies through program investments. Through demonstration grant programs, revolving loan funds, credit enhancement mechanisms such as loan loss reserves or interest rate buy-downs, and state equity investments, the public sector has demonstrated the ability to successfully bridge the commercialization “valley of death” from applied research & development to deployment. This focus by states on policies and programs that can support and incent sustained market demand and supply for emerging clean energy technologies is a fertile area for more exploration in the transition to ZEBs. Needs & Next Steps
Despite the limitations of the data, it appears that ZEBs are beginning to be a realistic
option for smaller buildings especially in moderate climates. For larger or more complex buildings in more challenging climates, modeling studies are showing positive paybacks that, while outside the financial parameters of the general development community, might still appeal to a class of owner-occupiers. When looking at actual building projects, for which cases are limited, it is notable that ZEB efficiency levels were achievable within established budget parameters.
Soft costs related to the design and construction on these innovative buildings are not well documented; they would likely be higher than for conventional construction, though not to the degree that is often perceived. There is still much groundbreaking work to be done. Continued innovation and dedicated pursuit of ZEBs will create cost reductions over the long term, result in more ZEB and ZEC buildings entering the market, and move advanced practices more swiftly to standard practice improving the energy efficiency of the entire building stock over time.

10
Extending the goal of ZEBs to a broader range of building types, climates and use patterns will likely prove challenging. In dense urban areas, it may not be possible to locate sufficient PV (or other renewable) on each site, but the ZEC pathway still enables deep energy efficiency, making district and equivalent renewable strategies feasible.
To continue to accelerate the development of ZEBs and begin to integrate lessons from these buildings into general design and construction activities as well as policies and program efforts, the following actions are recommended:
Practical guidance to help identify opportunities: The marketplace needs clear summaries of the conditions where ZEB’s are most feasible (anticipated loads, climate), and the path to move toward those goals. Ongoing communication can be fostered by continually updating a set of case studies showing clear definition of the processes and techniques used, results, and lessons learned with varying climates, building types and settings. Clear studies of avoided costs (both initial design and construction savings and ongoing energy savings) from energy efficiency focused integrated design can help explain the potential and support needed financing of first costs.
Encourage measurement and communication of results: ZEBs are already entering a
“second generation” of more typical building types and ownership patterns, and lessons learned from these examples could accelerate the interest at both the market and policy levels towards zero energy and zero energy‑capable buildings. For the most useful lessons, ZEB owners must measure their total energy use in a way that gives insight into successful strategies and to areas for further improvement. Knowing the annual totals for on-site energy use and purchased energy is the essential first step. Submetering or other analysis to identify areas for further improvement is also required to put that information to good use. Communication of these results should extend beyond the owner/operator, going back to the design team for incorporation into their future efforts, and to program sponsors for evaluating overall results.
Develop a better basis for benchmarking performance: As more successful zero energy-capable buildings emerge, we can shift the benchmarking focus from a broad peer group based on past commercial building national average EUIs to a forward-looking target based on demonstrated results of industry leaders. Two things are needed to improve the relevance of this forward-looking basis. Clearly, a larger pool of documented very high performance results will help demonstrate achievable levels for a greater portion of building situations. Meaningful benchmarking also requires being able to identify true efficiency across buildings with a wide range of occupancy schedules and plug load requirements. (Eley, 2009)
Promote outcome-based codes and policies that address unregulated loads. The move to a zero-energy building stock will likely require a series of major shifts in the

11
structure of codes, both in the presentation of code requirements and in ensuring compliance. Current codes and standards do not take into account elevators and escalators (vertical transportation) or plug and process loads. Plug and process loads encompass energy used by equipment not included in the building during construction (such as computers, appliances and refrigeration). To control this expanding use, future codes must include them (ZECBC). Outcome-based codes and policies based on the actual energy performance of buildings rather than predictions will be required.
References 1. Architecture 2030, 2012. Mission Accomplished?
http://architecture2030.org/hot_topics/momentum 2. CBECS, Commercial Building Energy Consumption Survey of the U.S. Energy Information
Agency, 2003. http://www.eia.gov/consumption/commercial/ 3. (BD+C) Building Design + Construction, 2011. Zero and Net Zero Energy Buildings +
Homes. http://www.bdcnetwork.com/article/2011-zero-and-net-zero-energy-buildings-homes 4. Cascadia Green Building Council, 2009. Living Building Financial Study: The Effects of
Climate, Building Type and Incentives on Creating the Buildings of Tomorrow. http://ilbi.org/education/reports/financial-study
5. HOK and the Weidt Group, 2011. The Path to Net Zero Co2urt: Where form follows
performance. http:// netzerocourt.com/ (See also Chapter 6, Lessons from a Zero Carbon Prototype, in the BD+C white paper above.)
6. Leach, M, Lobato, C, Hirsch, A., Pless, S, and Torcellini, P., 2010. Technical Support
Document: Strategies for 50% Energy Savings in Large Office Buildings. National Renewable Energy Laboratory, NREL/TP-550- 49213
7. Matthiessen, LF and Morris, P, 2007. Cost of Green Revisited: Reexamining the Feasibility
and Cost Impact of Sustainable Design in the Light of Increased Market Adoption, Davis Langdon http://www.davislangdon. com/USA/Research/ResearchFinder/2007-The-Cost-of-Green-Revisited/
8. (Packard Foundation) David and Lucile Packard Foundation, 2002. Building for Sustainability
Report: Six Scenarios for The David and Lucile Packard Foundation Los Altos Project. 9. Thornton, BA, Wang, W, Huang, Y, Land, and Liu, B, 2010. Technical Support Document:
50% Energy Savings for Small Office Buildings. Pacific Northwest National Laboratory, PNNL-19341.

12
10. Thornton, BA, Wang, W, Land, MD, Rosenberg, MI, and Liu, B, 2009. Technical Support Document: 50% Energy Savings Design Technology Packages for Medium Office Buildings. Pacific Northwest National Laboratory, PNNL-19004.
11. Eley, Charles, 2009. Rethinking Percent Savings: The Problem with Percent Savings and the
New Scale for a Zero Net-Energy Future Report by the Architectural Energy Corporation to Southern California Edison. www.newbuildings.org/sites/default/files/Rethinking_Percent_Savings.pdf
12. Zero Energy Commercial Building Consortium, Analysis of Cost & Non-Cost Barriers and
Policy Solutions for Commercial Building, 2011. http://zeroenergycbc.org/wp-content/uploads/2011/07/CBC-Market-Policy-Report-2011.pdf