nestlÉ holdings, inc. and subsidiaries · the food industry as a whole is faced with the global...
TRANSCRIPT

NESTLÉ HOLDINGS, INC. AND SUBSIDIARIES
Annual Financial Report
Management Report
Responsibility Statement
Consolidated Financial Statements
December 31, 2012 and 2011
(With Independent Auditors’ Report Thereon)

NESTLÉ HOLDINGS, INC. AND SUBSIDIARIES
December 31, 2012 and 2011
2
Management Report
Nestlé Holdings, Inc. (NHI) (hereinafter, together with its subsidiaries, referred to as the “Company”) is a wholly owned subsidiary of NIMCO US, Inc., which is an indirectly wholly owned subsidiary of Nestlé S.A., incorporated in Switzerland, which is the holding company of the Nestlé group of companies (hereinafter, referred to as the “Nestlé Group”). NHI is the holding company for Nestlé S.A.’s principal operating subsidiaries in the United States, other than Nestlé Waters North America Inc. and Prometheus Laboratories, Inc. The Company manufactures food and beverages with a strategic focus on the areas of nutrition, health, and wellness. Its products are primarily distributed in the United States.
Key Figures
2012 2011 Change(Dollars in millions)
Sales $ 21,414.4 20,914.8 2.4%Growth excluding acquisitions and divestures 2.4% 2.7%Growth excluding acquisitions/divestures
and pricing 0.2% (1.3)%
Cost of goods (11,886.9) (11,614.9) 2.3%as a percentage of sales (55.5)% (55.5)%
Trading operating profit 2,803.5 2,714.7 3.3%as a percentage of sales 13.1% 13.0%
Net financing costs (404.7) (407.4) (0.7)%Income tax expense (620.3) (651.6) (4.8)%
Net income 1,769.6 1,644.9 7.6%as a percentage of sales 8.3% 7.9%
Operating cash flows 2,542.6 1,937.8 31.2%as a percentage of sales 11.9% 9.3%
Capital expenditures 758.8 784.3 (3.3)%as a percentage of sales 3.5% 3.7%
Overview
The U.S. economic environment in 2012 remained uncertain, after slipping into recession in 2009. There were continued concerns over consumer confidence and continued high unemployment. In this environment, the Company delivered solid sales and a relatively stable trading operating profit margin. The Company’s solid performance is due to the ongoing execution of its proven strategies, combined with the successful implementation of operational efficiencies through the Nestlé Continuous Excellence cost saving program. The Company has increased investment in its brands, people, and capabilities and has prepared for more challenges in the future.

NESTLÉ HOLDINGS, INC. AND SUBSIDIARIES
December 31, 2012 and 2011
3
Sales
For the years ended December 31, 2012 and 2011, consolidated sales totaled $21.4 billion and $20.9 billion, respectively. The main factors per segment are as follows:
• Nestlé USA Brands sales were $10.4 billion for the years ended December 31, 2012 and 2011. There was a decrease in sales in the frozen food business, partially offset by growth in sales in ice cream, coffee enhancers, and soluble coffee. The Company focused on increasing the value perception of its frozen food business, with improved recipes and nutritional profiles, a new promotional and communication strategy, while also prioritizing the higher value sections of the ice cream business. Ice cream sales grew in the higher value areas, super-premium and snacks, reflecting the Company’s strategy to optimize its category mix. The coffee and creamers businesses performed well in categories that are enjoying good growth. The Coffee-Mate liquid range, including Natural Bliss, was the highlight in creamers, while Nescafé Clásico was the growth driver in soluble coffee. Some prominent brands in this segment include Coffee-Mate, Juicy Juice, Nesquik, Stouffer’s, DiGiorno, Lean Cuisine, Nestlé Crunch, Nestlé Toll House, and Dreyer’s/Edy’s.
• Nestlé Purina PetCare sales were $6.6 billion and $6.2 billion for the years ended December 31, 2012 and 2011, respectively. Sales in PetCare continued to grow volume and improve market share, with a number of line extensions and product launches. Friskies Tasty Treasures for cats and Beneful Baked Delights for dogs were among the strong performing brands. Some notable brands in this segment include Beneful, Alpo, Purina ONE, Purina Dog Chow, Mighty Dog, Friskies, and Purina Cat Chow.
• Nutrition sales were $2.4 billion for the years ended December 31, 2012 and 2011. There was a decrease in the Jenny Craig weight management business, which continued to under-perform. This was partially offset by growth in the infant nutrition business, primarily due to the launch of the Gerber puree pouches, and growth in the life insurance business. Notable brands in this segment are Gerber, Jenny Craig, and Powerbar.
• Other business sales were $2.0 billion and $1.9 billion for the years ended December 31, 2012 and 2011, respectively. There was growth in the Nestlé Health Science business, the Nestlé Professional business, and the Nespresso brand coffee. The Nestlé Health Science business benefited from growth in aging medical care from product innovations and roll-outs. The growth in the Nestlé Professional business is due to growth in both the food and beverage businesses, offset by the decline in the culinary chilled business. Nespresso again delivered a strong performance with double-digit growth.
Profitability
Trading operating profit was $2.8 billion and $2.7 billion for the years ended December 31, 2012 and 2011, respectively. Despite the continued economic conditions in the United States, the Company was still able to deliver growth in trading operating profit margin. The major contributor to this performance is a reduction in distribution costs, partially offset by higher production, overhead, and promotional costs.
Cost of goods sold was $11.9 billion and $11.6 billion for the years ended December 31, 2012 and 2011, respectively, which is equal to 55.5% of sales for both years.
Distribution expenses were $2.0 billion and $2.1 billion for the years ended December 31, 2012 and 2011, respectively. The decline was due to a decrease in expenses on transport and handling of finished goods.

NESTLÉ HOLDINGS, INC. AND SUBSIDIARIES
December 31, 2012 and 2011
4
Marketing, general and administrative expenses were $3.5 billion and $3.2 billion for the years ended December 31, 2012 and 2011, respectively. The increase was primarily due to increases in marketing, media communication, and other general expenses, which were partially offset by lower spending on certain promotion related expenses and other fixed expenses.
Net other trading expenses were $16.3 million and $37.0 million for the years ended December 31, 2012 and 2011, respectively. The decrease was primarily due to decreases in restructuring expenses related to the rationalization of the Nestlé Direct Store Delivery network, the return on company-owned life insurance, and the decrease in impairment of tangible assets. Offsetting this, in part, was an increase in costs of deferred compensation plans, litigation, onerous contracts and product recalls.
Net Profit Margin – Other Items of Interest
Net financing costs decreased by $2.7 million in 2012 primarily due to lower interest rates on borrowings.
The Company’s income tax expense decreased by $31.3 million in 2012, primarily as a result of adjustments to prior years’ taxes and a non-recurring transfer to unrecognized deferred tax assets that occurred in 2011.
Cash Flow
Operating cash flow increased from $1.9 billion in 2011 to $2.5 billion in 2012. The change is primarily due to the effect of higher net income and the decrease in cash used for working capital, resulting from reductions in the net trade and other receivables and inventories.
Principal Risks and Uncertainties
Risk Management
At the Nestlé S.A. level, the Nestlé Group Enterprise Risk Management Framework (“ERM”) is designed to identify, communicate, and mitigate risks in order to minimize their potential impact on the Nestlé Group, including NHI. A “Top-Down” assessment occurs annually and focuses on the global risk portfolio. It involves the aggregation of individual assessments by the Zones, Globally Managed Businesses and all markets of the Nestlé Group. It is intended to provide a high-level mapping of Company risk and allows Company management to make sound decisions on the future operations of the Company. Risk assessments are the responsibility of line management; this applies equally to a business or a function, and any mitigating actions identified in the assessments are the responsibility of the individual line management. If Nestlé S.A. intervention is required, responsibility for mitigating actions will generally be determined by the Nestlé Group Executive Board. The results of the ERM are presented annually to the Nestlé Group Executive Board and to the Audit Committee of Nestlé S.A., and conclusions are reported to the Board of Directors of Nestlé S.A.
Factors Affecting Results
The Company’s reputation is based on consumers’ trust. Any major event triggered by a serious food safety or other compliance issue could have a negative effect on the Company’s reputation or brand image. The Company has policies, processes, and controls in place to prevent such events.
The success of the Company depends on its ability to anticipate consumer preferences and to offer high-quality, appealing products. The Company’s businesses are subject to some seasonality, and adverse weather conditions may impact the Company’s sales.

NESTLÉ HOLDINGS, INC. AND SUBSIDIARIES
December 31, 2012 and 2011
5
The food industry as a whole is faced with the global challenge of increasing obesity. The Company makes all of its products available in a range of sizes and varieties designed to meet all needs and all occasions.
The Company is dependent on the sustainable supply of a number of raw materials, packaging materials, and services/utilities. Any major event triggered by natural hazards (drought, flood, etc.), change in macro-economic environment (shift in production patterns, “biofuels”, excessive trading), resulting in input price volatilities and/or capacity constraints, could potentially impact the Company’s financial results. The Company has policies, processes, and controls in place to mitigate against such events.
The Company’s liquidities/liabilities (currency fluctuation, interest rate, derivatives and/or hedging, pension funding obligations/retirement benefits, banking/commercial credit, and cost of capital) could be impacted by any major event in the financial markets. The Company, along with its parent company, Nestlé S.A., has the appropriate risk mitigation measures in place.
The Company is dependent on the sustainable manufacturing/supply of finished goods for all product categories. A major event in one of the Company’s key plants, at a key supplier, contract manufacturers, co-packers, and/or warehouse facility could potentially lead to a supply disruption and impact upon the Company’s financial results. Business continuity plans are established and regularly maintained in order to mitigate against such an event.
The Company depends on accurate, timely information and numerical data from key software applications, without disruption, to enable day-to-day decision making.
The Company is subject to environmental regimes and has put controls in place to comply with legislation concerning the protection of the environment, including the use of natural resources, release of air emissions and waste-water, and the generation, storage, handling, transportation, treatment, and disposal of waste materials.
The Company is subject to health and safety regimes and has procedures in place to comply with legislation concerning the protection of the health and welfare of employees and contractors.
The Company is party to a variety of legal proceedings arising out of the normal course of business. The Company believes that there are valid defenses for the claims and intends to defend any such litigation.
Security, political stability, legal and regulatory, fiscal, macro-economic, foreign trade, labor, and/or infrastructure risks could potentially impact upon the Company’s ability to do business. Events such as an infectious disease could also impact upon the Company’s ability to operate. Any of these events could potentially lead to a supply disruption and impact upon the Company’s financial results. Regular monitoring and ad hoc business continuity plans are established in order to mitigate against such events.
Outlook
The purchasing power and decision-making of the typical U.S. consumer continue to be affected by fear of layoffs, high unemployment, a loss of wealth, and economic uncertainty. Economic recovery will likely take time to have a positive impact on the consumer and there are significant risks, both in terms of input costs and continued economic stagnancy. There is a risk of a very slow and volatile recovery of the U.S. economy.
Even though the environment looks to be every bit as challenging in 2013 as it was in 2012, it will again provide opportunities to leverage the Company’s competitive advantages, deliver on growth opportunities, and benefit from the drive for continuous improvement across the Company. We are committed to supporting the Nestlé

NESTLÉ HOLDINGS, INC. AND SUBSIDIARIES
December 31, 2012 and 2011
6
Group in achieving the Nestlé model in 2013: organic growth between 5% and 6%, together with an improved trading operating profit margin and underlying earnings per share in constant currency, as well as improvement in capital efficiency.
NESTLÉ HOLDINGS, INC. AND SUBSIDIARIES
December 31, 2012 and 2011
7
Responsibility Statement
Steve Presley, Chief Financial Officer, confirms that to the best of his knowledge:
(a) the financial statements, prepared in accordance with IFRS, give a true and fair view of the assets, liabilities, financial position and profit or loss of NHI, and the undertakings included in the consolidation taken as a whole; and
(b) the management report includes a fair review of the development and performance of the business and the position of NHI and the undertakings included in the consolidation taken as a whole, together with a description of the principal risks and uncertainties that they face.
March 27, 2013

8
NESTLÉ HOLDINGS, INC. AND SUBSIDIARIES
Table of Contents
Page
Independent Auditors’ Report 9
Consolidated Financial Statements 10
Notes to Consolidated Financial Statements 15

KPMG LLP Suite 2000 355 South Grand Avenue Los Angeles, CA 90071-1568
KPMG LLP is a Delaware limited liability partnership, the U.S. member firm of KPMG International Cooperative (“KPMG International”), a Swiss entity.
Independent Auditors’ Report
The Board of Directors Nestlé Holdings, Inc.:
We have audited the accompanying consolidated financial statements of Nestlé Holdings, Inc. (an indirectly wholly owned subsidiary of Nestlé S.A.) and subsidiaries, which comprise the consolidated balance sheet as of December 31, 2012 and 2011, and the related consolidated income statement and statement of comprehensive income, changes in equity, and cash flows for the years then ended, and the related notes to the consolidated financial statements.
Management’s Responsibility for the Financial Statements
Management is responsible for the preparation and fair presentation of these consolidated financial statements in accordance with International Financial Reporting Standards as issued by the International Accounting Standards Board; this includes the design, implementation, and maintenance of internal control relevant to the preparation and fair presentation of consolidated financial statements that are free from material misstatement, whether due to fraud or error.
Auditors’ Responsibility
Our responsibility is to express an opinion on these consolidated financial statements based on our audits. We conducted our audits in accordance with auditing standards generally accepted in the United States of America and International Standards on Auditing. Those standards require that we plan and perform the audit to obtain reasonable assurance about whether the consolidated financial statements are free from material misstatement.
An audit involves performing procedures to obtain audit evidence about the amounts and disclosures in the consolidated financial statements. The procedures selected depend on the auditors’ judgment, including the assessment of the risks of material misstatement of the consolidated financial statements, whether due to fraud or error. In making those risk assessments, the auditor considers internal control relevant to the entity's preparation and fair presentation of the consolidated financial statements in order to design audit procedures that are appropriate in the circumstances, but not for the purpose of expressing an opinion on the effectiveness of the entity's internal control. Accordingly, we express no such opinion. An audit also includes evaluating the appropriateness of accounting policies used and the reasonableness of significant accounting estimates made by management, as well as evaluating the overall presentation of the consolidated financial statements.
We believe that the audit evidence we have obtained is sufficient and appropriate to provide a basis for our opinion.
Opinion
In our opinion, the consolidated financial statements referred to above present fairly, in all material respects, the financial position of Nestlé Holdings, Inc. and subsidiaries as of December 31, 2012 and 2011, and the results of their operations and their cash flows for the years then ended in accordance with International Financial Reporting Standards as issued by the International Accounting Standards Board.
Los Angeles, California March 27, 2013

1010
i l li bili 13 8 401 11 9 26
NESTLÉ HOLDINGS, INC.AND SUBSIDIARIES
Consolidated Balance Sheet
December 31, 2012 and 2011
(Dollars in thousands, except capital stock par value and shares)
Assets Note(s) 2012 2011
Current assets:Cash and cash equivalents 13 $ 821,205 191,979 Short-term investments 13 4,897 5,512 Trade and other receivables, net 3/13 2,671,016 3,154,080 Inventories, net 4 1,559,927 1,624,254 Derivative assets 5/13 414,656 451,525 Assets held for sale 15 16,214 20,065 Prepayments 92,153 100,487
Total current assets 5,580,068 5,547,902
Non-current assets:Property, plant and equipment, net 7 4,984,635 4,786,987 Employee benefits assets 8 35,663 32,168 Investments in associated companies 9 6,645 13,067 Deferred tax assets 10 1,187,814 1,173,178 Financial assets 6/13 3,436,526 3,121,886 Goodwill 11 18,712,591 18,712,591 Intangible assets, net 12 956,089 908,875
Total non-current assets 29,319,963 28,748,752 Total assets $ 34,900,031 34,296,654
Liabilities and Equity
Current liabilities:Trade and other payables 13 $ 1,274,645 1,126,565 Fi i lFi a a tili bilitinanc es 13 8 746 401,746, 11 779 265,77 , 5 Provisions 17 103,198 90,343 Derivative liabilities 5/13 285,669 344,846 Accruals 16 1,360,128 1,458,281
Total current liabilities 11,770,041 14,799,300
Non-current liabilities:Financial liabilities 13 6,368,140 8,334,120 Employee benefits liabilities 8 2,264,166 2,123,403 Deferred tax liabilities 10 1,961,783 1,730,273 Provisions 17 66,733 104,813 Other accrued liabilities 1,703,503 1,837,607
Total non-current liabilities 12,364,325 14,130,216
Total liabilities 24,134,366 28,929,516
Equity:Capital stock, $100 par value. Authorized, issued, and outstanding,
1,000 shares 100 100 Additional paid-in capital 5,350,353 1,650,353 Other equity reserves (1,292,947) (1,221,868) Accumulated earnings 6,708,159 4,938,553
Total equity 10,765,665 5,367,138 Total liabilities and equity $ 34,900,031 34,296,654
See accompanying notes to consolidated financial statements.

1111
See accompanying notes to consolidated financial
NESTLÉ HOLDINGS, INC.AND SUBSIDIARIES
Consolidated Income Statement
Years ended December 31, 2012 and 2011
(Dollars in thousands)
Note 2012 2011
Sales $ 21,414,352 20,914,802 Cost of goods sold (11,886,894) (11,614,876) Distribution expenses (1,971,858) (2,118,758) Marketing, general and administrative expenses (3,530,672) (3,235,618) Royalties to affiliated company (1,205,132) (1,193,775) N set other trading expense 19 (16,346) (37,039)
Trading operating profit 2,803,450 2,714,736
Net other operating expenses 19 (12,709) (18,111)
Operating profit 2,790,741 2,696,625
Net financing costs 18 (404,656) (407,359) Share of results from associated companies 4,293 2,667
Income from continuing operations before income taxes 2,390,378 2,291,933
Income tax expense 20 (620,346) (651,634)
Income from continuing operations 1,770,032 1,640,299
(Loss) income from discontinued operations, net of taxes (426) 4,562 Net income $ 1,769,606 1,644,861
See accompanying notes to consolidated financial statements statements.

NESTLÉ HOLDINGS, INC.AND SUBSIDIARIES
Consolidated Statement of Comprehensive Income
Years ended December 31, 2012 and 2011
(Dollars in thousands)
Note 2012 2011
Net income $ 1,769,606 1,644,861
Other comprehensive income (loss):Fair value adjustments on cash flow hedges:
Recognized in other equity reserves (12,266) (329,529) Removed from other equity reserves 54,709 18,278 Income taxes on fair value adjustments on cash flow hedges 20 (16,551) 121,387
25,892 (189,864) Fair value adjustments on available-for-sale financial instruments:
Unrealized results 48,569 87,205 Recognition of realized results in the income statement 23,903 7,905 Income taxes on changes in fair value of available-for-sale assets 20 (25,367) (33,299)
47,105 61,811
Defined benefit plan actuarial loss 8 (237,018) (341,681) Income taxes on defined benefit plan actuarial losses 20 92,403 133,247
(144,615) (208,434) Foreign currency translation differences for foreign operations 539 (456)
Other comprehensive loss (71,079) (336,943) Total comprehensive income $ 1,698,527 1,307,918
See accompanying notes to consolidated financial statements.
1212

NESTLÉ HOLDINGS, INC.AND SUBSIDIARIES
Consolidated Statement of Changes in Equity
Years ended December 31, 2012 and 2011
(Dollars in thousands)
Capital Additional Other equity AccumulatedNote stock paid-in capital reserves earnings Total
Balance at December 31, 2010 $ 100 1,650,353 (884,925) 3,293,692 4,059,220 Net income — — — 1,644,861 1,644,861
Other comprehensive income (loss):Fair value adjustments on cash flow hedges 1 — — (311,251) — (311,251) Net change in fair value of available-for-sale assets 1 — — 95,110 — 95,110 Foreign currency translation differences for foreign
operations — — (456) — (456) Defined benefit plan actuarial loss 8 — — (341,681) — (341,681) Taxes on other comprehensive loss 20 — — 221,335 — 221,335
Total other comprehensive loss — — (336,943) — (336,943)
Total comprehensive income — — (336,943) 1,644,861 1,307,918 Balance at December 31, 2011 100 1,650,353 (1,221,868) 4,938,553 5,367,138
Net income — — — 1,769,606 1,769,606
Other comprehensive income (loss):Fair value adjustments on cash flow hedges 1 — — 42,443 — 42,443 Net change in fair value of available-for-sale assets 1 — — 72,472 — 72,472 Foreign currency translation differences for foreign
operations — — 539 — 539 Defined benefit plan actuarial loss 8 — — (237,018) — (237,018) Taxes on other comprehensive loss 20 — — 50,485 — 50,485
Total other comprehensive loss — — (71,079) — (71,079)
Total comprehensive income — — (71,079) 1,769,606 1,698,527
Debt assumed by parent — 3,700,000 — — 3,700,000 Balance at December 31, 2012 $ 100 5,350,353 (1,292,947) 6,708,159 10,765,665
See accompanying notes to consolidated financial statements.
1313

1414
12 (176 (170 880)
NESTLÉ HOLDINGS, INC.AND SUBSIDIARIES
Consolidated Statement of Cash Flows
Years ended December 31, 2012 and 2011
(Dollars in thousands)
Note(s) 2012 2011Cash flows from operating activities:
Net income $ 1,769,606 1,644,861 Adjustments to reconcile net income to net cash provided by operating activities:
Depreciation of property, plant, and equipment 7 531,383 520,429 Loss on sales of property, plant and equipment 26,537 8,497 Impairment of property, plant and equipment 7/19 7,146 21,824 Amortization of intangible assets 12 129,659 157,559 Loss (gain) on disposal of assets held for sale and other 1,611 (53) Increase in cash surrender value of Company-owned life insurance policies (57,894) (17,870) Decrease in provisions 17 (25,225) (34,938) Increase in deferred income taxes 20 216,874 252,597
Change in working capital (excluding effects from acquisitions and divestitures):Trade and other receivables, net (297,893) (572,389) Inventories, net 4 64,327 (138,466) Prepayments and other current assets 8,267 (15,874) Trade and other payables and other liabilities 263,636 276,967 Accruals (73,288) (140,005)
Decrease in working capital (34,951) (589,767)
Taxes on other comprehensive income 20 50,485 221,335 Share of results from investments in associated companies (5,595) (7,229) Distribution/dividends from associated companies 10,715 — Non-monetary movements on financial assets and liabilities 6,975 (65,879) Movements of trading derivatives 2,304 792 Movements of operating derivatives 12,685 80,701 Other employee benefits, net (99,750) (255,021)
Total adjustments 772,959 292,977
Net cash provided by operating activities 2,542,565 1,937,838
Cash flows from investing activities:Expenditure on property, plant and equipment 7 (758,752) (784,311) Proceeds from sale of property, plant and equipment 9,610 28,714 Disposals of assets held for sale and other 3,511 — Expenditure on intangible assets 12 ,873) (176 873) (170 880), Investments in non-current financial assets (211,552) (186,345) Other movements 615 895
Net cash used in investing activities (1,133,441) (1,111,927)
Cash flows from financing activities:Net (repayment) borrowings of commercial paper (727,554) 2,232,179 Net repayment of line of credit (63,123) (42,195) Bonds issued 2,259,611 644,099 Bonds repaid (722,293) (2,364,887) Loans to affiliates repaid (issued), net 25 496,137 (708,469) Notes to affiliates issued 25 2,905,000 3,400,000 Notes to affiliates repaid 25 (5,055,000) (3,950,000) Cash movement on derivatives hedging bond principal, net 116,569 120,778 Other changes in financial liabilities 10,216 (9,280)
Net cash used in financing activities (780,437) (677,775)
Net increase in cash and cash equivalents 628,687 148,136
Cash and cash equivalents at beginning of the year 191,979 44,302 Effect of exchange rate changes on opening balances 539 (459)
Cash and cash equivalents at end of the year $ 821,205 191,979
Supplemental information:Non-cash item - Debt assumed by parent $ 3,700,000 — Cash paid for:
Interest $ 345,364 418,079 Taxes 620,778 421,083
See accompanying notes to consolidated financial statements.

NESTLÉ HOLDINGS, INC. AND SUBSIDIARIES
Notes to Consolidated Financial Statements
December 31, 2012 and 2011
(Dollars in thousands)
15 (Continued)
(1) Significant Accounting Policies and Changes in Accounting Policies
Nestlé Holdings, Inc. (NHI) (hereinafter, together with its subsidiaries, referred to as the “Company”) is a wholly owned subsidiary of NIMCO US, Inc., which is an indirectly wholly owned subsidiary of Nestlé S.A., incorporated in Switzerland, which is the holding company of the Nestlé group of companies (hereinafter, referred to as the Nestlé Group). NHI is the holding company for Nestlé S.A.’s principal operating subsidiaries in the United States, other than Nestlé Waters North America Inc. and Prometheus Laboratories, Inc. NHI was incorporated in the State of Delaware in 1983 under registration number 833330118. NHI is a corporation and has unlimited duration. The address of the registered office of NHI is 1209 Orange Street, Wilmington, Delaware 19801.
The Company manufactures food and beverages, with a strategic focus on areas of nutrition, health, and wellness. Its products are primarily distributed in the United States. Such products include soluble coffee, chocolate-based drinks, dairy products, infant nutrition, healthcare nutrition, performance nutrition, ice cream, frozen and chilled food, culinary aids, and chocolate and confectionary. Other business activities include pet care products, juvenile life insurance, and weight management products.
The consolidated financial statements were authorized for issue by NHI’s directors on March 27, 2013.
(a) Significant Accounting Policies
Basis of Preparation
The consolidated financial statements of the Company have been prepared in accordance with International Financial Reporting Standards (IFRS) as issued by the International Accounting Standards Board (IASB) and with the Interpretations issued by the IFRS Interpretations Committee.
The consolidated financial statements have been prepared on an accrual basis and under the historical cost convention, except as noted specifically in the following significant accounting policies. All significant consolidated companies and associates have a December 31 accounting year-end.
The preparation of the consolidated financial statements requires Company management to exercise judgment and to make estimates and assumptions that affect the application of policies; the reported amounts of revenues, expenses, assets, and liabilities; and disclosures. These estimates and associated assumptions are based on historical experience and various other factors that are believed to be reasonable under the circumstances. Actual results could differ from these estimates.
The estimates and underlying assumptions are reviewed on an ongoing basis. Revisions to accounting estimates are recognized in the period in which the estimate is revised if the revision affects only that period or in the period of the revision and future periods if the revision affects both current and future periods. The areas affected by estimation include goodwill and intangible assets (notes 11 and 12), employee benefits (note 8), allowance for doubtful receivables (note 3), provisions (note 17), impairment tests (note 11), share-based payments (note 8), income taxes (note 20),

NESTLÉ HOLDINGS, INC. AND SUBSIDIARIES
Notes to Consolidated Financial Statements
December 31, 2012 and 2011
(Dollars in thousands)
16 (Continued)
financial assets and liabilities (notes 6 and 16), and key assumptions detailed in the related notes to the consolidated financial statements.
Scope of Consolidation
The consolidated financial statements comprise the financial statements of NHI and its subsidiaries. All material intercompany profits, transactions, and balances have been eliminated. The subsidiary companies, which are wholly and directly owned by NHI and incorporated in the United States, are as follows:
Gerber Products Company Jenny Craig Holdings, Inc. Nespresso USA, Inc. Nestlé Capital Corporation Nestlé HealthCare Nutrition, Inc. Nestlé Insurance Holdings, Inc. Nestlé Purina PetCare Company Nestlé USA, Inc. TSC Holdings, Inc.
Newly acquired companies are consolidated from the effective date of control using the acquisition method.
Associates
Investments in associated companies, including joint ventures, in which the Company either owns at least a 20% interest but less than a 50% interest, or where the Company owns less than a 20% interest but has significant influence but does not exercise control, are accounted for under the equity method. The net assets are adjusted to comply with the Company’s accounting policies. The carrying amount of goodwill arising from the acquisition of associates is included in the carrying amount of investments in associates. Investments in which the Company has less than a 20% interest and does not have significant influence are reported at cost.
Foreign Currency
For the Company, transactions in currencies other than the Company’s functional currency (U.S. dollars) are recorded at the rate of exchange at the transaction date. Monetary assets and liabilities that are denominated in foreign currencies are remeasured at the year-end rates. Any resulting exchange differences are recorded in the consolidated income statement.
On consolidation, assets and liabilities of the Company reported in their functional currencies are translated into U.S. dollars at year-end exchange rates. Income and expense items are translated into U.S. dollars at the annual weighted average rate of exchange or at the rate on the date of the transaction for significant items.
NESTLÉ HOLDINGS, INC. AND SUBSIDIARIES
Notes to Consolidated Financial Statements
December 31, 2012 and 2011
(Dollars in thousands)
17 (Continued)
Differences arising from the retranslation of opening net assets of the Company, together with differences arising from the restatement of the net results for the year of the Company from average or actual rates to year-end rates, are recognized in other comprehensive income.
Segment Reporting
Operating segments reflect the Company’s management structure and the way financial information is regularly reviewed by the chief operating decision maker (“CODM”). The CODM has been defined as a body comprising the members of the Nestlé Group Executive Board to whom the various operating segments report, since this is the level at which resources are allocated and results are assessed.
• The Company’s management structure is aligned with the Nestlé Group management structure and is organized around products.
• The Nestlé USA Brands segment forms part of the Nestlé Group Zone Americas segment. It consists primarily of beverages, confections, snacks, frozen prepared foods, pizza, ice cream, and other food products.
• The PetCare segment also forms part of the Nestlé Group Zone Americas segment, and sells products and services for domestic pets.
• The Nutrition segment is part of the Nestlé Nutrition Globally Managed Business (“GMB”) segment.
• The Other Segments category comprises other operating segments that do not meet the criteria for separate reporting, such as Nestlé Professional (forming part of the Nestlé Professional GMB), which sells products for the food services industry, Nestlé Health Sciences which provide pioneering science-based nutritional solutions to deliver improved personalized health care for people with medical conditions, and the Nespresso business unit. Both Nestlé Professional and Nespresso form part of the Nestlé Group Other Food and Beverage segment.
Segment assets are aligned with information reported to the CODM. Segment assets comprise property, plant and equipment, intangible assets, trade and other receivables, assets held for sale, inventories, and prepayments. Eliminations represent intercompany balances between the different segments.
Segment assets by operating segment represent the situation at the end of the year. Capital expenditures represent the investment in property, plant and equipment.
Depreciation of segment assets includes depreciation of property, plant and equipment and amortization of intangible assets. Impairment of assets includes impairment related to property, plant and equipment, and intangible assets.
Unallocated items represent non-specific items whose allocation to a segment would be arbitrary. They mainly comprise corporate expenses and related assets.

NESTLÉ HOLDINGS, INC. AND SUBSIDIARIES
Notes to Consolidated Financial Statements
December 31, 2012 and 2011
(Dollars in thousands)
18 (Continued)
The Company generates substantially all of its net sales within the United States.
Sales
Sales represent amounts received and receivable from third parties for goods supplied to the customers and for services rendered. Revenue from sales of goods is recognized in the consolidated income statement at the moment when the significant risks and rewards of ownership of the goods have been transferred to the buyer, which is mainly upon shipment. It is measured at the list price applicable to a given distribution channel after deduction of returns, sales taxes, pricing allowances, other trade discounts, and couponing and price promotions to consumers. Payments made to the customers for commercial services received are expensed.
Expenses
Cost of goods sold is determined on the basis of the cost of production or of purchase, adjusted for the variation of inventories. All other expenses, including those in respect of advertising and promotions, are recognized when the Company receives the risks and rewards of ownership of the goods or when it receives the services.
Net Other Trading Income or Expense
These mainly include restructuring costs, impairment of all assets except goodwill, litigation and onerous contracts, results of disposal of real estate, and specific other income and expenses that fall within the control of operating segments.
Restructuring costs are restricted to dismissal indemnities and employee benefits paid to terminated employees upon the reorganization of a business. Dismissal indemnities paid for normal attrition such as poor performance, professional misconduct, etc. are part of the expenses by functions.
Net Other Operating Income or Expense
These include results on disposals of businesses, acquisition-related costs and other income and expenses that fall beyond the control of operating segments and relate to events such as natural disasters.
Net Financing Costs
Net financing costs include the financial expenses on borrowings from third parties and affiliated companies as well as the financial income earned on funds invested outside the Company. Net financing costs also include other financial income and expenses, such as exchange differences on loans and borrowings, results on foreign currency, interest rate hedging instruments that are recognized in the consolidated income statement, and the unwinding of discounts on provisions. Certain borrowing costs are capitalized as explained under the section “Property, Plant and Equipment.” Others are expensed. Unwind of discount on provisions is presented in net financing costs.

NESTLÉ HOLDINGS, INC. AND SUBSIDIARIES
Notes to Consolidated Financial Statements
December 31, 2012 and 2011
(Dollars in thousands)
19 (Continued)
Taxation
Taxes and fiscal risks recognized in the consolidated financial statements reflect Company management’s best estimate of the outcome based on the facts known at the balance sheet date. These facts may include, but are not limited to, changes in tax laws and interpretations thereof in the United States. They may have an impact on the income tax as well as the resulting assets and liabilities. Any differences between tax estimates and final tax assessments are charged to the consolidated income statement in the period in which they are incurred, unless anticipated.
Taxes include current taxes on income and other taxes such as taxes on capital and adjustments relating to prior years. Income tax is recognized in the consolidated income statement, except to the extent that it relates to items directly taken to other comprehensive income.
Deferred taxation is the tax attributable to the temporary differences that appear when taxation authorities recognize and measure assets and liabilities with rules that differ from those of the consolidated financial statements.
Deferred taxes are calculated under the liability method at the rates of tax expected to prevail when the temporary differences reverse. Any changes of tax rates are recognized in the consolidated income statement unless related to items directly recognized in other comprehensive income. Deferred tax liabilities are recognized on all taxable temporary differences excluding non-deductible goodwill. Deferred tax assets are recognized on all deductible temporary differences provided that it is probable that future taxable income will be available.
Financial Instruments
Classes of Financial Instruments
The Company aggregates its financial instruments into classes based on their nature and characteristics. The details of financial instruments by class are disclosed in the notes.
Financial Assets
Financial assets are initially recognized at fair value plus directly attributable transaction costs. However, when a financial asset at fair value through profit or loss is recognized, the transaction costs are expensed immediately. Subsequent remeasurement of financial assets is determined by their classification that is revisited at each reporting date.
Derivatives embedded in other contracts are separated and treated as stand-alone derivatives when their risks and characteristics are not closely related to those of their host contracts and the respective host contracts are not carried at fair value.
At each balance sheet date, the Company assesses whether its financial assets are to be impaired. Impairment losses are recognized in the consolidated income statement where there is objective evidence of impairment such as where the issuer is in bankruptcy, default, or other significant financial difficulty. In addition, for an investment in an equity security, a significant or prolonged

NESTLÉ HOLDINGS, INC. AND SUBSIDIARIES
Notes to Consolidated Financial Statements
December 31, 2012 and 2011
(Dollars in thousands)
20 (Continued)
decline in its fair value below its cost is objective evidence of impairment. Impairment losses are reversed when the reversal can be objectively related to an event occurring after the recognition of the impairment loss. For debt instruments measured at amortized cost or fair value, the reversal is recognized in the consolidated income statement. For equity instruments classified as available-for-sale, the reversal is recognized in other comprehensive income. Impairment losses on financial assets carried at cost because their fair value cannot be reliably measured are never reversed.
Financial assets are derecognized (in full or partly) when substantially all of Company’s rights to cash flows from the respective assets have expired or have been transferred and the Company has neither exposure to substantially all the risks inherent in those assets nor entitlement to rewards from them.
The Company classifies its financial assets into the following categories: loans and receivables, financial assets at fair value through profit and loss, held-to-maturity investments, and available-for-sale assets.
Loans and Receivables
Loans and receivables are non-derivative financial assets with fixed or determinable payments that are not quoted in an active market. This category includes the following classes of financial assets: loans, trade, and other receivables and cash at bank and cash in hand.
Subsequent to initial measurement, loans and receivables are carried at amortized cost using the effective interest rate method less appropriate allowances for doubtful receivables.
Allowances for doubtful receivables represent the Company’s estimates of losses arising from the failure or inability of customers to make payments when due. These estimates are based on the ageing of customers’ balances, specific credit circumstances, and the Company’s historical bad receivables experience.
Loans and receivables are further classified as current and non-current depending whether these will be realized within twelve months after the balance sheet date or beyond.
Financial Assets at Fair Value through Profit and Loss
The Company does not apply the fair value option. Financial assets at fair value through profit and loss assets mainly include trading derivatives, which are derivatives for which hedge accounting is not applied because these are either not designated as hedging instruments or not effective as hedging instruments. Additional information can be found in the “Derivative Financial Instruments” section below.
Company-owned life insurance policies are categorized as financial assets at fair value through profit and loss. They are reported at their cash surrender value with any changes in cash surrender value being recognized in the consolidated income statement.

NESTLÉ HOLDINGS, INC. AND SUBSIDIARIES
Notes to Consolidated Financial Statements
December 31, 2012 and 2011
(Dollars in thousands)
21 (Continued)
Held-to-Maturity Investments
Held-to-maturity investments are non-derivative financial assets with fixed or determinable payments and fixed maturities. Currently, the Company does not have any investments in this category.
Available-for-Sale Assets
Available-for-sale assets are those non-derivative financial assets that are either designated as such upon initial recognition or are not classified in any of the other financial assets categories. This category includes the following classes of financial assets: bonds, equities, commercial paper and bills, time deposits, and other investments. They are included in non-current financial assets, unless an investment matures or management intends to dispose of it within twelve months of the end of the reporting period. In that case, it would be accounted for as a short-term investment, or cash and cash equivalent, as appropriate.
Subsequent to initial measurement, available-for-sale assets are stated at fair value with all unrealized gains or losses recognized in other comprehensive income until their disposal at which time such gains or losses are recognized in the consolidated income statement, except as noted below.
An investment in a foreign entity comprising unquoted equity securities in which the Company holds a non-controlling interest and no significant influence over operations is measured at cost.
Interest earned on available-for-sale assets is calculated using the effective interest rate method and is recognized in the consolidated income statement as part of interest income under net financing costs. Accrued interest on available-for-sale financial assets is included in prepayments and accrued income in the consolidated balance sheet.
Financial Liabilities at Amortized Cost
Financial liabilities are initially recognized at the fair value of consideration received less directly attributable transaction costs.
Subsequent to initial measurement, financial liabilities are recognized at amortized cost unless they are part of a fair value hedge relationship (refer to Fair Value Hedges below). The difference between the initial carrying amount of the financial liabilities and their redemption value is recognized in the consolidated income statement over the contractual terms using the effective interest rate method. This category includes the following classes of financial liabilities: trade, tax, and other payables, commercial paper, bonds, and other financial liabilities.
Financial liabilities at amortized cost are further classified as current and non-current depending whether these will fall due within twelve months after the balance sheet date or beyond.

NESTLÉ HOLDINGS, INC. AND SUBSIDIARIES
Notes to Consolidated Financial Statements
December 31, 2012 and 2011
(Dollars in thousands)
22 (Continued)
Financial liabilities are derecognized (in full or partly) when the Company is discharged from its obligation, when they expire, and when they are canceled or replaced by a new liability with substantially modified terms.
Derivative Financial Instruments
A derivative is a financial instrument that changes its values in response to changes in the underlying variable, requires no or little net initial investment, and is settled at a future date. Derivatives are mainly used to manage exposures to foreign exchange, interest rate, and commodity price risk.
Derivatives are initially recognized at fair value. These are subsequently remeasured at fair value on a quarterly basis. The fair value of exchange-traded derivatives is based on market prices, while the fair value of the over-the-counter derivatives is based on accepted mathematical models based on market data. Derivatives are carried as assets when their fair value is positive and as liabilities when their fair value is negative.
The Company’s derivatives mainly consist of currency forwards and swaps; commodity futures and options; and interest rate forwards and swaps.
The use of derivatives is governed by policies approved by the Board of Directors of Nestlé, S.A., which provide written principles on the use of derivatives consistent with the Company’s overall risk management strategy.
Hedge Accounting
The Company designates and documents certain derivatives as hedging instruments against changes in fair values of recognized assets and liabilities (fair value hedges) and highly probable forecast transactions (cash flow hedges). The effectiveness of such hedges is assessed at inception and verified on a quarterly basis, using prospective and retrospective testing.
Fair Value Hedges
The Company uses fair value hedges to mitigate foreign currency and interest rate risks of its recognized assets and liabilities.
The changes in fair values of hedging instruments are recognized in the consolidated income statement. Hedged items are stated at fair value in respect of the risk being hedged with any gain/loss being recognized in the consolidated income statement.
Cash Flow Hedges
The Company uses cash flow hedges to mitigate currency and/or commodity risks of highly probable forecast transactions, such as purchases of raw materials, finished goods and equipment, as well as the variability of expected interest payments and receipts.

NESTLÉ HOLDINGS, INC. AND SUBSIDIARIES
Notes to Consolidated Financial Statements
December 31, 2012 and 2011
(Dollars in thousands)
23 (Continued)
The effective part of the changes in fair value of hedging instruments are recognized in other comprehensive income, while any ineffective part is recognized immediately in the consolidated income statement. When the hedged item results in the recognition of a non-financial asset or liability, the gains or losses previously recognized in other comprehensive income are included in the measurement cost of the asset or the liability. Otherwise, the gains or losses previously recognized in other comprehensive income are removed and recognized in the consolidated income statement at the same time as the hedged transaction affects profit or loss.
Undesignated Derivatives
Undesignated derivatives comprise derivatives that are acquired in the frame of risk management policies for which hedge accounting is not applied because either the hedge is not effective or does not qualify under International Accounting Standard (IAS) 39, Financial Instruments: Recognition and Measurement (IAS 39).
Subsequent to initial measurement, undesignated derivatives are carried at fair value and all their gains and losses, realized and unrealized, are recognized in the consolidated income statement.
Fair Value
The Company determines the fair value of its financial instruments on the basis of the following hierarchy.
i. The fair value of financial instruments quoted in active markets is based on their quoted closing price at the balance sheet date. Examples include commodity derivative assets and liabilities and other financial assets such as investments in equity and debt securities.
ii. The fair value of financial instruments that are not traded in an active market is determined by using valuation techniques using observable market data. Such valuation techniques include discounted cash flows, standard valuation models based on market parameters, dealer quotes for similar instruments, and use of comparable arm’s length transactions. For example, the fair value of forward exchange contracts, currency swaps and interest rate swaps is determined by discounting estimated future cash flows using a risk-free interest rate.
iii. The fair value of financial instruments that is determined on the basis of entity-specific valuations using inputs that are not based on observable market data (unobservable inputs). When the fair value of unquoted instruments cannot be measured with sufficient reliability, the Company carries such instruments at cost less impairment, if applicable.
Cash and Cash Equivalents
Cash and cash equivalents include cash at bank and cash in hand and other short-term highly liquid investments with maturities of three months or less from the initial recognition.

NESTLÉ HOLDINGS, INC. AND SUBSIDIARIES
Notes to Consolidated Financial Statements
December 31, 2012 and 2011
(Dollars in thousands)
24 (Continued)
Short-Term Investments
Short-term investments include investments from the available-for-sale category if their maturity is more than three months from the initial recognition, and if they are due within a period of twelve months or less, or there is no maturity but the assets are expected to be realized within twelve months after the reporting period.
Inventories
Raw materials and purchased finished goods are valued at purchase cost. Work in progress and manufactured finished goods are valued at production cost. Production cost includes direct production costs and an appropriate proportion of production overheads and factory depreciation.
Raw material inventories and purchased finished goods are accounted for using the FIFO (first-in, first-out) method. The weighted average cost method is used for other inventories.
An allowance is established when the net realizable value of any inventory item is lower than the value calculated above.
Prepayments and Accrued Income
Prepayments and accrued income include payments made in advance relating to the following year, and income relating to the current year, which will not be invoiced until after the balance sheet date.
Property, Plant and Equipment
Property, plant and equipment are shown in the consolidated balance sheet at their historical cost. Depreciation is provided on components that have homogenous useful lives by using the straight-line method so as to depreciate the initial cost down to the residual value over the estimated useful lives. The residual values are 30% on head offices and nil for all other asset types. The useful lives are as follows:
Buildings and land improvements 10 – 40 yearsPlant and machinery 8 – 12.5 yearsTools, furniture, and sundry 5 yearsVehicles 5 – 10 yearsInformation technology equipment 3 years
Useful lives, components, and residual amounts are reviewed annually. Such a review takes into consideration the nature of the assets, their intended use including but not limited to the closure of facilities and the evolution of the technological and competitive pressures that may lead to their obsolescence.
Depreciation of property, plant and equipment is allocated to the appropriate headings of expenses by function in the consolidated income statement.

NESTLÉ HOLDINGS, INC. AND SUBSIDIARIES
Notes to Consolidated Financial Statements
December 31, 2012 and 2011
(Dollars in thousands)
25 (Continued)
Borrowing costs incurred during the course of construction are capitalized if the assets under construction are significant and if their construction requires a substantial period to complete (typically more than one year). The capitalization rate is determined on the basis of the short-term borrowing rate for the period of construction. Premiums capitalized for leasehold land or buildings are amortized over the length of the lease. Government grants are recognized in accordance with the deferral method, whereby the grant is set up as deferred income, which is released to the income statement over the useful life of the related assets. Grants that are not related to assets are credited to the income statement when they are received.
Leased Assets
Leasing agreements that transfer to the Company substantially all the benefits and risks of ownership of an asset are treated as finance leases. All other leases are classified as operating leases.
Assets acquired under finance leases are capitalized and depreciated in accordance with the Company’s policy on property, plant and equipment unless the lease term is shorter. Land and building leases are recognized separately provided an allocation of the lease payments between these categories is reliable. The associated obligations are included in financial liabilities. Leasehold improvements are amortized over their useful life or the lease term, whichever is shorter.
Rents payable under operating leases are charged to the consolidated income statement on a straight-line basis over the period of the lease.
The costs of the agreements that do not take the legal form of a lease but convey the right to use an asset are separated into lease payments and other payments if the Company has the control of the use or of the access to the asset or takes essentially all the output of the asset. Then, the Company determines whether the lease component of the agreement is a finance or an operating lease.
Goodwill
Goodwill is recorded when the sum of the fair value of the consideration transferred plus the fair value of any existing Nestlé Group ownership interest in the acquiree and any non-controlling interest exceeds the fair value of the acquiree’s net assets. If the fair value of the acquiree’s net assets exceeds these amounts, a gain is recognized in profit or loss after reassessing the net assets acquired. Goodwill is not amortized but tested for impairment at least annually and upon the occurrence of an indication of impairment. The impairment testing process is described in the appropriate section of these policies.
Intangible Assets
This heading includes intangible assets that are internally generated or acquired either separately or in a business combination when they are identifiable and can be reliably measured. Intangible assets are considered to be identifiable if they arise from contractual or other rights, or if they are separable (i.e., they can be disposed of either individually or together with other assets). Intangible assets comprise indefinite life intangible assets and finite life intangible assets. Internally generated

NESTLÉ HOLDINGS, INC. AND SUBSIDIARIES
Notes to Consolidated Financial Statements
December 31, 2012 and 2011
(Dollars in thousands)
26 (Continued)
intangible assets are capitalized; provided they generate future economic benefits and their costs are clearly identifiable. Borrowing costs incurred during the development of internally generated intangible assets are capitalized if the assets are significant and if their development requires a substantial period to complete (typically more than one year).
Indefinite life intangible assets are usually rights connected with a business activity. There is no foreseeable limit to their useful economic lives as they arise from contractual or other legal rights that can be renewed without significant cost and are the subject of continuous marketing support. They are not amortized but tested for impairment annually or more frequently if an impairment indicator is triggered. The assessment of the classification of intangible assets as indefinite is reviewed annually.
Finite life intangible assets are those for which there is an expectation of obsolescence that limits their useful economic lives or where the useful life of an intangible asset is limited by contractual or other terms. They are amortized over the shorter of their contractual or useful economic lives. They mainly comprise management information systems and rights and customer lists. Finite life intangible assets are amortized on a straight-line basis assuming a zero residual value: management information systems over a period ranging from 3 to 5 years; and other finite life intangible assets over 5 to 20 years. Useful lives and residual values are reviewed annually. Amortization of intangible assets is allocated to the appropriate headings of expenses by function in the income statement.
Impairment of Goodwill and Indefinite Life Intangible Assets
Goodwill and indefinite life intangible assets are tested for impairment at least annually and upon the occurrence of an indication of impairment. The annual impairment tests are performed at the same time each year and at the cash generating unit (“CGU”) level. The Company defines its CGU for goodwill impairment testing based on the way that it monitors and derives economic benefits from the acquired goodwill. For indefinite life intangible assets, the Company defines its CGU as the smallest identifiable group of assets that generates cash inflows that are largely independent of the cash inflows from other assets or groups of assets. The impairment tests are performed by comparing the carrying value of the assets of the CGU with their recoverable amount based on their future projected cash flows discounted at an appropriate rate of return. Usually, the cash flows correspond to estimates made by management in financial plans and business strategies covering a period of five years. They are then projected to 50 years using a steady or declining growth rate given that the CGUs are of a long-term nature. The Company assesses the uncertainty of these estimates by performing sensitivity analysis. The discount rate reflects the current assessment of the time value of money and the risks specific to the CGU (essentially country risk). The business risk is included in the determination of the cash flows. Both the cash flows and the discount rates exclude inflation. An impairment loss in respect of goodwill is never subsequently reversed.

NESTLÉ HOLDINGS, INC. AND SUBSIDIARIES
Notes to Consolidated Financial Statements
December 31, 2012 and 2011
(Dollars in thousands)
27 (Continued)
Impairment of Property, Plant and Equipment and Finite Life Intangible Assets
Consideration is given at each balance sheet date to determine whether there is any indication of impairment of the carrying amounts of the Company’s property, plant and equipment and finite life intangible assets. An indication could be unfavorable development of a business under competitive pressures or severe economic slowdown in a given market, as well as reorganization of the operations to leverage their scale. If any indication exists, an asset’s recoverable amount is estimated. An impairment loss is recognized whenever the carrying amount of an asset exceeds its recoverable amount. The recoverable amount is the greater of the fair value less cost to sell and value in use. In assessing value in use, the estimated future cash flows are discounted to their present value, based on the time value of money and the risks specific to the country where the assets are located. The risks specific to the asset are included in the determination of the cash flows. Assets that suffered an impairment are tested for possible reversal of the impairment at each reporting date if indications exist that impairment losses recognized in prior periods no longer exist or have decreased.
Assets Held for Sale
Non-current assets held for sale (and disposal groups) are presented separately in the current section of the balance sheet. On initial classification as held for sale, non-current assets held for sale (and disposal groups) are remeasured at the lower of their carrying amount or fair value less cost to sell. Non-current assets held for sale (and disposal groups) are no longer depreciated.
Provisions
Provisions include liabilities of uncertain timing or amount that arise from restructuring plans, environmental, litigation, and other risks. Provisions are recognized when a legal or constructive obligation exists stemming from a past event and when the future cash outflows can be reliably estimated. Obligations from restructuring plans are recognized when detailed formal plans have been established and when there is a valid expectation that such plans will be carried out by either starting to implement them or announcing their main features. Obligations under litigation reflect Company management’s best estimates of the outcomes based on the facts known at the balance sheet date.
Contingent Assets and Liabilities
Contingent assets and liabilities are possible rights and obligations that arise from past events and whose existence will be confirmed only by the occurrence or non-occurrence of one or more uncertain future events not fully within the control of the Company. They are disclosed in the notes to the consolidated financial statements.
Post-Employment Benefits
The liabilities of the Company arising from its defined benefit obligations in connection with pensions and post-employment medical benefits are determined using the projected unit credit method. The Company’s external actuaries perform valuations on an annual basis. Such plans are either externally funded, with the plan assets held separately from those of the Company in

NESTLÉ HOLDINGS, INC. AND SUBSIDIARIES
Notes to Consolidated Financial Statements
December 31, 2012 and 2011
(Dollars in thousands)
28 (Continued)
independently administered funds, or unfunded with the related liabilities recorded on the consolidated balance sheet.
For the funded defined benefit plans, the deficit or excess of the fair value of plan assets over the present value of the defined benefit obligation is recognized as a liability or an asset on the consolidated balance sheet, taking into account any unrecognized actuarial gains or losses and past service costs. However, an excess of assets is recognized only to the extent that it represents a future economic benefit that is actually available to the Company, for example in the form of refunds from the plan or reductions in future contributions to the plan. When these criteria are not met, it is not recognized but is disclosed in the notes to the consolidated financial statements. Impacts of minimum funding requirements in relation to past service are considered when determining pension obligations.
Actuarial gains and losses arise mainly from changes in actuarial assumptions and differences between actuarial assumptions and what has actually occurred. They are recognized in the period in which they occur in other comprehensive income.
For defined benefit plans, the pension cost charged to the consolidated income statement consists of current service cost, interest cost, expected return on plan assets, effects of early retirements, curtailments, or settlements, and past service cost. The past service cost for the enhancement of pension benefits is accounted for when such benefits vest or become a constructive obligation. The Company also provides for benefits under defined contribution plans. Contributions to these plans are charged to the consolidated income statement as incurred.
Full pensions and retirement benefit reporting is done twice a year in June and December, at which point actuarial gains and losses for the period are determined.
Share-Based Payments
Share-based payments are granted to certain key members of Company management. Liabilities arising from such transactions are recognized in the consolidated income statement over the vesting period. Share-based payments include share appreciation rights (“SARs”) and restricted stock units (“RSUs”).
Share Appreciation Rights
The Company granted SARs to key members of Company management, entitling employees to a cash payment. No SARs have been granted subsequent to July 2005 and the remaining SARs were paid in 2012. The amount of the cash payment is determined based on the increase in the price of Nestlé S.A. shares from grant date until exercise date. The fair value of the SARs liability is measured at each reporting date and is determined using the Black-Scholes option pricing model, taking into account the terms and conditions upon which the instruments were granted. The cost of such transactions is adjusted for the forfeitures of the participants’ rights that no longer satisfy the plan conditions, as well as for early vesting.
NESTLÉ HOLDINGS, INC. AND SUBSIDIARIES
Notes to Consolidated Financial Statements
December 31, 2012 and 2011
(Dollars in thousands)
29 (Continued)
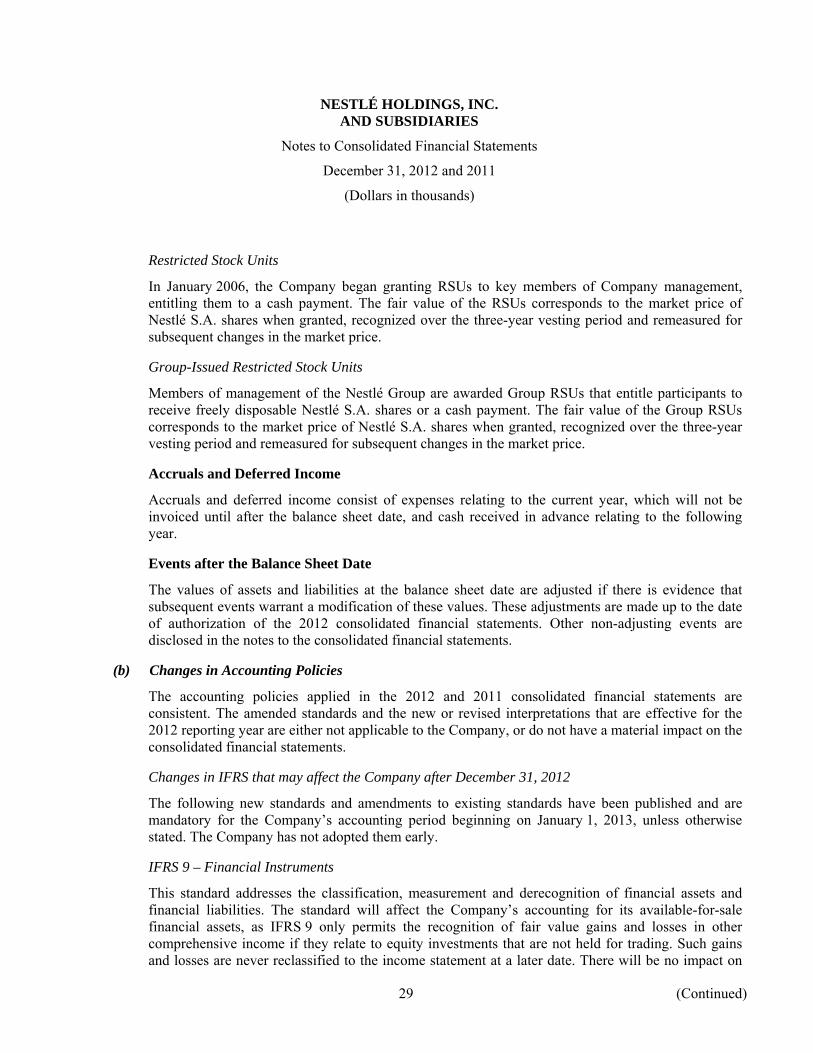
Restricted Stock Units
In January 2006, the Company began granting RSUs to key members of Company management, entitling them to a cash payment. The fair value of the RSUs corresponds to the market price of Nestlé S.A. shares when granted, recognized over the three-year vesting period and remeasured for subsequent changes in the market price.
Group-Issued Restricted Stock Units
Members of management of the Nestlé Group are awarded Group RSUs that entitle participants to receive freely disposable Nestlé S.A. shares or a cash payment. The fair value of the Group RSUs corresponds to the market price of Nestlé S.A. shares when granted, recognized over the three-year vesting period and remeasured for subsequent changes in the market price.
Accruals and Deferred Income
Accruals and deferred income consist of expenses relating to the current year, which will not be invoiced until after the balance sheet date, and cash received in advance relating to the following year.
Events after the Balance Sheet Date
The values of assets and liabilities at the balance sheet date are adjusted if there is evidence that subsequent events warrant a modification of these values. These adjustments are made up to the date of authorization of the 2012 consolidated financial statements. Other non-adjusting events are disclosed in the notes to the consolidated financial statements.
(b) Changes in Accounting Policies
The accounting policies applied in the 2012 and 2011 consolidated financial statements are consistent. The amended standards and the new or revised interpretations that are effective for the 2012 reporting year are either not applicable to the Company, or do not have a material impact on the consolidated financial statements.
Changes in IFRS that may affect the Company after December 31, 2012
The following new standards and amendments to existing standards have been published and are mandatory for the Company’s accounting period beginning on January 1, 2013, unless otherwise stated. The Company has not adopted them early.
IFRS 9 – Financial Instruments
This standard addresses the classification, measurement and derecognition of financial assets and financial liabilities. The standard will affect the Company’s accounting for its available-for-sale financial assets, as IFRS 9 only permits the recognition of fair value gains and losses in other comprehensive income if they relate to equity investments that are not held for trading. Such gains and losses are never reclassified to the income statement at a later date. There will be no impact on

NESTLÉ HOLDINGS, INC. AND SUBSIDIARIES
Notes to Consolidated Financial Statements
December 31, 2012 and 2011
(Dollars in thousands)
30 (Continued)
the Company’s accounting for financial liabilities, as the new requirements only affect the accounting for financial liabilities that are designated at fair value through profit or loss, and the Company does not have any such liabilities. This standard is effective for the Company’s accounting period beginning on January 1, 2015.
IFRS 10 –Consolidated Financial Statements
This standard introduces a new single control model as the basis for consolidation applicable to all investees. It also introduces a changed definition of control. It is not expected to have a material impact on the Company’s consolidated financial statements.
IFRS 11 –Joint Arrangements
This standard establishes principles for the financial reporting by parties to a joint arrangement. The standard will affect the Company’s accounting for companies over which the Company exercises joint control with partners. It is not expected to have a material impact on the Company’s consolidated financial statements.
IFRS 12 –Disclosure of Interests in Other Entities
This standard combines, enhances, and replaces disclosure requirements for subsidiaries, joint arrangements, associates, and unconsolidated structured entities. The Company will modify its disclosures accordingly.
IFRS 13 –Fair Value Measurement
This standard applies when other IFRS require or permit fair value measurements. It defines fair value, sets out in a single IFRS a framework for measuring fair value, and requires disclosures about fair value measurements. It is not expected to have a material impact on the Company’s consolidated financial statements.
IAS 19 Revised 2011 –Employee Benefits
The amendments that have the most significant impact are:
• the replacement of the expected return on plan assets and interests costs on the defined benefit obligation with a single net interest component. This net interest component will be calculated by applying the discount rate to the net defined benefit liability (or asset) and recognized with the net financing cost; and
• the immediate recognition of all past service costs.
These changes will affect the profit for the year by increasing employee benefit costs of the Company. They will also impact the amounts presented in other comprehensive income and the net employee benefits liabilities (assets) on the consolidated balance sheet.

NESTLÉ HOLDINGS, INC. AND SUBSIDIARIES
Notes to Consolidated Financial Statements
December 31, 2012 and 2011
(Dollars in thousands)
31 (Continued)
If these changes had been adopted by the Company in 2012, operating profit would have been lower by $106 million, net financing costs would have been higher by $50 million, and net income for the year would have been approximately $94 million lower than published. Other changes, including the impact on net assets, are not material for the Company.
Improvements and Other Amendments to IFRS/IAS
A number of standards have been modified on miscellaneous points. Such changes include IAS 1 – Presentation of Financial Statements, which requires entities to separate items presented in Other Comprehensive Income into two groups, based on whether or not they may be recycled to the income statement in the future. None of these amendments are expected to have a material effect on the Company’s consolidated financial statements.
(2) Segmental Information
Segmental information is as follows:
Brands (a) PetCare Nutrition (a) Other (a) Total
2012Sales $ 10,382,082 6,594,535 2,367,182 2,074,631 21,418,430 Trading operating profit (b) 1,126,440 1,240,568 295,778 120,663 2,783,449 Segment assets 4,225,448 2,636,388 1,841,433 973,635 9,676,904 Capital expenditures (c) 281,511 207,881 178,307 86,901 754,600 Depreciation and amortization
of segment assets (341,047) (181,504) (129,410) (20,530) (672,491) Impairment of segment
assets (c) (5,875) — — (1,271) (7,146)Restructuring costs 8,543 13,200 (444) (365) 20,934
2011Sales $ 10,389,393 6,241,031 2,412,122 1,877,683 20,920,229 Trading operating profit
(b) 1,118,519 1,240,907 318,220 41,419 2,719,065 Segment assets 4,406,314 2,587,222 1,994,807 936,180 9,924,523 Capital expenditures (c) 336,274 215,517 177,005 43,510 772,306 Depreciation and amortization
of segment assets (353,583) (176,022) (122,864) (22,177) (674,646) Impairment of segment
assets (c) (15,520) — (5,977) (327) (21,824)Restructuring costs (11,045) 11,660 (6,801) (4,975) (11,161)
(a) Nestlé USA Brands primarily consists of beverage, prepared foods, ice cream, confections and snacks,
and other food products. Nutrition primarily consists of baby foods and performance-related food products. Other consists of Nestlé Professional, Nespresso, and Nestlé Health Sciences, which do not meet the criteria for separate disclosure.

NESTLÉ HOLDINGS, INC. AND SUBSIDIARIES
Notes to Consolidated Financial Statements
December 31, 2012 and 2011
(Dollars in thousands)
32 (Continued)
(b) The Company determines trading operating profit by allocating corporate expenses to its operating segments based on activity-based cost drivers.
(c) See note 7.
Reconciliation of total segment trading operating profit to income from continuing operations before income taxes is as follows:
2012 2011
Total segment trading operating profit $ 2,783,449 2,719,065 Medicare drug prescription benefit 15,201 — Intangibles amortization 12,133 (3,342) Provisions for onerous lease contracts (2,631) (4,622) Valuation adjustment for group-issued RSUs (6,062) 3,019 Other 1,360 616
Trading operating profit 2,803,450 2,714,736
Net other operating expenses (12,709) (18,111)
Operating profit 2,790,741 2,696,625
Net financing costs (404,656) (407,359) Share of results from associated companies 4,293 2,667
Income from continuing operations before income taxes $ 2,390,378 2,291,933
Reconciliation of total segment assets to total assets is as follows:
2012 2011
Total segment assets $ 9,676,904 9,924,523 Classification of foreign subsidiaries as held for sale 16,214 17,246 Classification of tangible assets as held for sale — 2,819 Adjust useful lives of fixed assets (18,673) (22,015) Amortization of intangible assets (20,637) (32,770) Intragroup eliminations (42,518) (501,118) Unallocated assets 25,287,586 24,906,392 Other 1,155 1,577
Total assets $ 34,900,031 34,296,654

NESTLÉ HOLDINGS, INC. AND SUBSIDIARIES
Notes to Consolidated Financial Statements
December 31, 2012 and 2011
(Dollars in thousands)
33 (Continued)
Reconciliation of total segment sales to total sales is as follows:
2012 2011
Total segment sales $ 21,418,430 20,920,229 Classify franchising income as other income (4,078) (5,427)
Total sales $ 21,414,352 20,914,802
(3) Trade and Other Receivables, net
Trade and other receivables, net, are as follows:
2012 2011
By type:Trade, less allowances of $12,471 and $8,990, respectively $ 1,526,569 1,498,587 Due from Nestlé S.A. controlled companies 818,105 1,273,880 Due from associated companies 1,382 3,066 Other 324,960 378,547
Trade and other receivables, net $ 2,671,016 3,154,080
The Company’s largest trade customer represents 14% and 9% of trade and other receivables, net, at December 31, 2012 and 2011, respectively.
2012 2011
By payment status:Not past due $ 2,641,998 3,130,278 Past due 1-30 days 61,596 60,629 Past due 31-60 days 12,232 8,079 Past due 61-90 days 2,809 2,841 Past due 91-120 days 1,420 1,998 Past due more than 120 days 5,621 5,442 Unapplied credit memos (42,189) (46,197) Allowance for doubtful receivables (12,471) (8,990)
Trade and other receivables, net $ 2,671,016 3,154,080
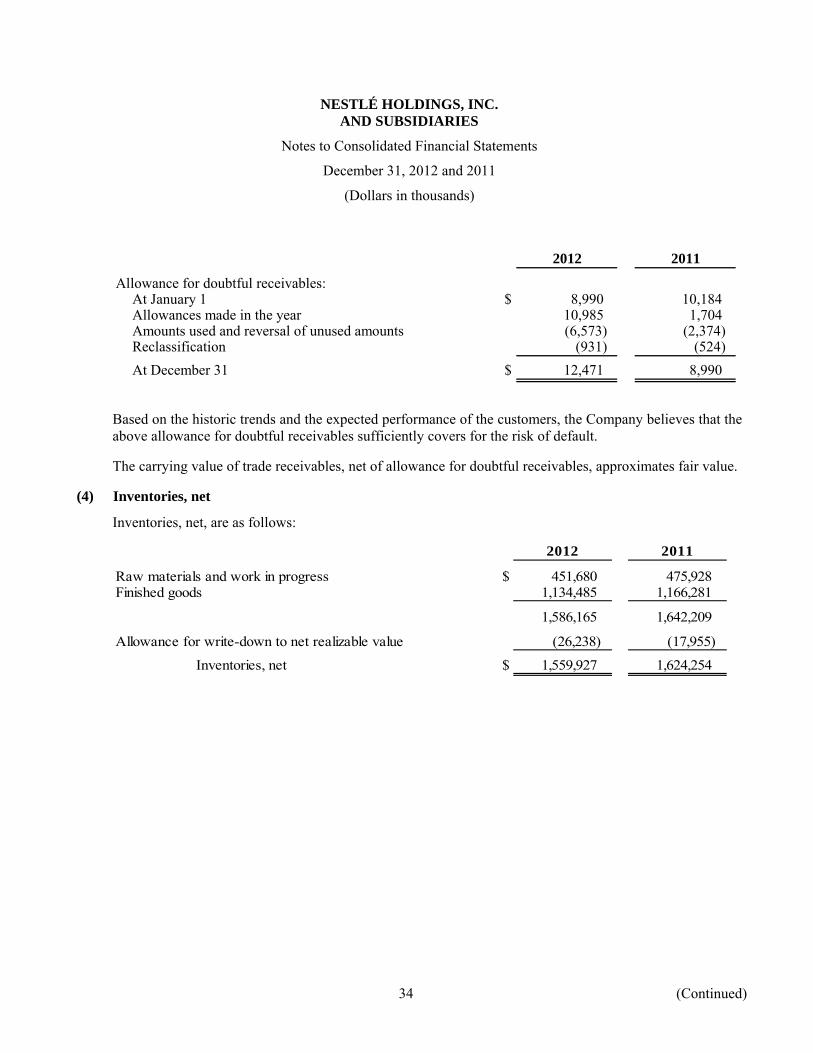
NESTLÉ HOLDINGS, INC. AND SUBSIDIARIES
Notes to Consolidated Financial Statements
December 31, 2012 and 2011
(Dollars in thousands)
34 (Continued)
2012 2011
Allowance for doubtful receivables:At January 1 $ 8,990 10,184 Allowances made in the year 10,985 1,704 Amounts used and reversal of unused amounts (6,573) (2,374) Reclassification (931) (524) At December 31 $ 12,471 8,990
Based on the historic trends and the expected performance of the customers, the Company believes that the above allowance for doubtful receivables sufficiently covers for the risk of default.
The carrying value of trade receivables, net of allowance for doubtful receivables, approximates fair value.
(4) Inventories, net
Inventories, net, are as follows:
2012 2011
Raw materials and work in progress $ 451,680 475,928 Finished goods 1,134,485 1,166,281
1,586,165 1,642,209
Allowance for write-down to net realizable value (26,238) (17,955)
Inventories, net $ 1,559,927 1,624,254

NESTLÉ HOLDINGS, INC. AND SUBSIDIARIES
Notes to Consolidated Financial Statements
December 31, 2012 and 2011
(Dollars in thousands)
35 (Continued)
(5) Derivative Assets and Liabilities
2012Contractual
Fair value Fair value or notionalassets liabilities amount
Fair value hedges:Interest rate swaps $ 2,306 — 125,000 Interest rate and currency swaps 314,714 — 1,229,623
Cash flow hedges:Currency forwards 4,286 250 87,292 Interest rate swaps — 264,785 2,690,000 Interest rate and currency swaps 86,154 — 1,286,844 Commodity futures and options 7,189 20,634 537,975
Trading:Commodity futures and options 7 — 41
Total derivatives $ 414,656 285,669 5,956,775
2011Contractual
Fair value Fair value or notionalassets liabilities amount
Fair value hedges:Interest rate swaps $ 7,091 3,362 400,229 Interest rate and currency swaps 370,915 — 1,748,776
Cash flow hedges:Currency forwards 422 10,183 142,311 Interest rate swaps — 266,060 2,904,326 Interest rate and currency swaps 62,538 — 514,938 Commodity futures and options 10,400 65,019 499,813
Trading:Commodity futures and options 159 222 5,407
Total derivatives $ 451,525 344,846 6,215,800

NESTLÉ HOLDINGS, INC. AND SUBSIDIARIES
Notes to Consolidated Financial Statements
December 31, 2012 and 2011
(Dollars in thousands)
36 (Continued)
Net loss recorded in the consolidated income statement for fair value hedges:
2012 2011
Hedged items $ (33,289) 19,768 Hedging instruments 33,289 (19,969)
Net loss $ — (201)
The ineffective portion of cash flow hedges recorded during the years ended December 31, 2012 and 2011 in the consolidated income statement was $1,849 and $21,356, respectively.
(6) Financial Assets
Non-current financial assets are as follows:
2012 2011
Available-for-sale securities $ 2,362,554 2,106,019 Cash surrender value of company-owned life insurance
policies 873,325 823,597 Loans to Nestlé S.A. controlled companies 90,000 90,000 Policy loans receivable 95,804 83,470 Other 14,843 18,800
Total financial assets $ 3,436,526 3,121,886
Available-for-sale securities primarily represent portfolio assets totaling $2,268,323 and $2,011,881 at December 31, 2012 and 2011, respectively. These portfolio assets include both debt and equity securities. Additionally, the Company owns 34,000 Class A voting convertible preferred shares of Nestlé Canada, representing a 12.9% non-controlling net investment in a foreign entity, which is classified as an available-for-sale equity security in accordance with IAS 39. The investment is recorded at its historical cost of $93,287 since the underlying equity instruments are not quoted on a public stock exchange.
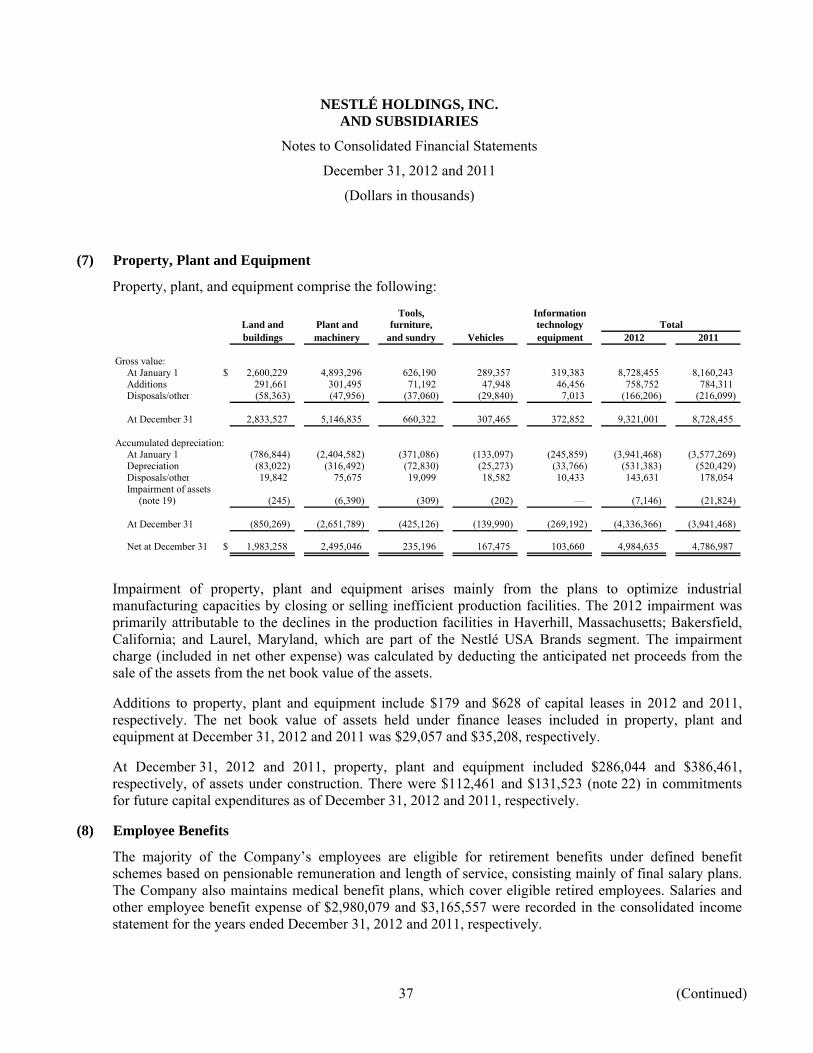
NESTLÉ HOLDINGS, INC. AND SUBSIDIARIES
Notes to Consolidated Financial Statements
December 31, 2012 and 2011
(Dollars in thousands)
37 (Continued)
(7) Property, Plant and Equipment
Property, plant, and equipment comprise the following:
Tools, InformationLand and Plant and furniture, technology Totalbuildings machinery and sundry Vehicles equipment 2012 2011
Gross value:At January 1 $ 2,600,229 4,893,296 626,190 289,357 319,383 8,728,455 8,160,243 Additions 291,661 301,495 71,192 47,948 46,456 758,752 784,311 Disposals/other (58,363) (47,956) (37,060) (29,840) 7,013 (166,206) (216,099)
At December 31 2,833,527 5,146,835 660,322 307,465 372,852 9,321,001 8,728,455
Accumulated depreciation:At January 1 (786,844) (2,404,582) (371,086) (133,097) (245,859) (3,941,468) (3,577,269)Depreciation (83,022) (316,492) (72,830) (25,273) (33,766) (531,383) (520,429)Disposals/othe
r 19,842 75,675 19,099 18,582 10,433 143,631 178,054 Impairment of assets
(note 19) (245) (6,390) (309) (202) — (7,146) (21,824)
At December 31 (850,269) (2,651,789) (425,126) (139,990) (269,192) (4,336,366) (3,941,468)
Net at December 31 $ 1,983,258 2,495,046 235,196 167,475 103,660 4,984,635 4,786,987
Impairment of property, plant and equipment arises mainly from the plans to optimize industrial manufacturing capacities by closing or selling inefficient production facilities. The 2012 impairment was primarily attributable to the declines in the production facilities in Haverhill, Massachusetts; Bakersfield, California; and Laurel, Maryland, which are part of the Nestlé USA Brands segment. The impairment charge (included in net other expense) was calculated by deducting the anticipated net proceeds from the sale of the assets from the net book value of the assets.
Additions to property, plant and equipment include $179 and $628 of capital leases in 2012 and 2011, respectively. The net book value of assets held under finance leases included in property, plant and equipment at December 31, 2012 and 2011 was $29,057 and $35,208, respectively.
At December 31, 2012 and 2011, property, plant and equipment included $286,044 and $386,461, respectively, of assets under construction. There were $112,461 and $131,523 (note 22) in commitments for future capital expenditures as of December 31, 2012 and 2011, respectively.
(8) Employee Benefits
The majority of the Company’s employees are eligible for retirement benefits under defined benefit schemes based on pensionable remuneration and length of service, consisting mainly of final salary plans. The Company also maintains medical benefit plans, which cover eligible retired employees. Salaries and other employee benefit expense of $2,980,079 and $3,165,557 were recorded in the consolidated income statement for the years ended December 31, 2012 and 2011, respectively.

NESTLÉ HOLDINGS, INC. AND SUBSIDIARIES
Notes to Consolidated Financial Statements
December 31, 2012 and 2011
(Dollars in thousands)
38 (Continued)
Reconciliation of assets and liabilities recognized in the consolidated balance sheet is as follows:
2012 2011Defined Post- Defined Post-benefit employment benefit employment
retirement medical retirement medicalplans benefits Total plans benefits Total
Present value of funded obligations $ 3,971,659 — 3,971,659 3,593,455 — 3,593,455 Fair value of plan assets (3,906,782) — (3,906,782) (3,567,719) — (3,567,719)
Excess of liabilities overassets on funded obligations 64,877 — 64,877 25,736 — 25,736
Present value of unfunded obligations 563,824 872,754 1,436,578 554,099 851,407 1,405,506 Unrecognized past service cost on
nonvested benefits
— 7,464 7,464 — 10,525 10,525 Unrecognized assets 16,772 — 16,772 12,061 — 12,061
Net liabilities relatedto defined benefits plan $ 645,473 880,218 1,525,691 591,896 861,932 1,453,828
Cash settled transactions liability 53,007 41,464 Other employee benefit assets — (4,422) Other employee benefit liabilities 649,805 600,365
Net liabilities $ 2,228,503 $ 2,091,235
Other employee benefit assets represent a receivable for a federal subsidy available to sponsors of retiree healthcare benefit plans that provide a benefit that is comparable to the Medicare Part D benefit. Other employee benefit liabilities primarily represent deferred compensation and executive savings plan liabilities.
The net liabilities reflected in the consolidated balance sheet are as follows:
2012 2011
Employee benefits assets $ (35,663) (32,168) Employee benefits liabilities 2,264,166 2,123,403
Net liabilities $ 2,228,503 2,091,235
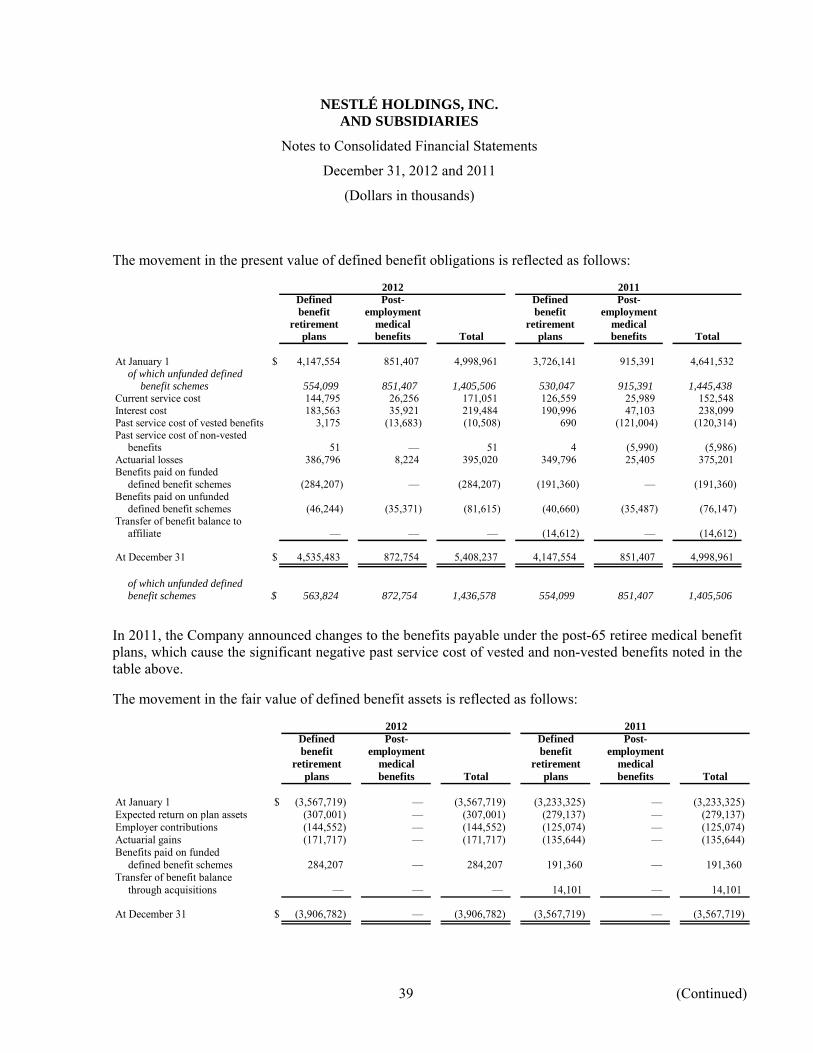
NESTLÉ HOLDINGS, INC. AND SUBSIDIARIES
Notes to Consolidated Financial Statements
December 31, 2012 and 2011
(Dollars in thousands)
39 (Continued)
The movement in the present value of defined benefit obligations is reflected as follows:
2012 2011Defined Post- Defined Post-benefit employment benefit employment
retirement medical retirement medicalplans benefits Total plans benefits Total
At January 1 $ 4,147,554 851,407 4,998,961 3,726,141 915,391 4,641,532 of which unfunded defined
benefit schemes 554,099 851,407 1,405,506 530,047 915,391 1,445,438 Current service cost 144,795 26,256 171,051 126,559 25,989 152,548 Interest cost 183,563 35,921 219,484 190,996 47,103 238,099 Past service cost of vested benefits 3,175 (13,683) (10,508) 690 (121,004) (120,314) Past service cost of non-vested
benefits 51 — 51 4 (5,990) (5,986) Actuarial losses 386,796 8,224 395,020 349,796 25,405 375,201 Benefits paid on funded
defined benefit schemes (284,207) — (284,207) (191,360) — (191,360) Benefits paid on unfunded
defined benefit schemes (46,244) (35,371) (81,615) (40,660) (35,487) (76,147)Transfer of benefit balance to
affiliate
— — — (14,612) — (14,612)
At December 31 $ 4,535,483 872,754 5,408,237 4,147,554 851,407 4,998,961
of which unfunded definedbenefit schemes $ 563,824 872,754 1,436,578 554,099 851,407 1,405,506
In 2011, the Company announced changes to the benefits payable under the post-65 retiree medical benefit plans, which cause the significant negative past service cost of vested and non-vested benefits noted in the table above.
The movement in the fair value of defined benefit assets is reflected as follows:
2012 2011Defined Post- Defined Post-benefit employment benefit employment
retirement medical retirement medicalplans benefits Total plans benefits Total
At January 1 $ (3,567,719) — (3,567,719) (3,233,325) — (3,233,325) Expected return on plan assets (307,001) — (307,001) (279,137) — (279,137) Employer contributions (144,552) — (144,552) (125,074) — (125,074) Actuarial gains (171,717) — (171,717) (135,644) — (135,644) Benefits paid on funded
defined benefit schemes 284,207 — 284,207 191,360 — 191,360 Transfer of benefit balance
through acquisitions — — — 14,101 — 14,101
At December 31 $ (3,906,782) — (3,906,782) (3,567,719) — (3,567,719)

NESTLÉ HOLDINGS, INC. AND SUBSIDIARIES
Notes to Consolidated Financial Statements
December 31, 2012 and 2011
(Dollars in thousands)
40 (Continued)
The major categories of plan assets as a percentage of total plan assets are as follows:
2012 2011
December 31:Equities 29.43% 32.20%Bonds 38.24 40.60Alternative investments 32.33 27.20
Total 100.00% 100.00%
Actuarial losses of defined benefit schemes recognized in the consolidated statement of comprehensive income are reflected as follows:
2012 2011Defined Post- Defined Post-benefit employment benefit employment
retirement medical retirement medicalplans benefits Total plans benefits Total
Experience adjustments onplan assets $ 171,717 — 171,717 135,644 — 135,644
Experience adjustments onplan liabilities (48,448) 66,238 17,790 (210) 74,530 74,320
Change of assumptions onplan liabilities (338,349) (74,462) (412,811) (349,587) (99,935) (449,522)
Transfer to unrecognized assets (4,710)
— (4,710) (960) — (960)
Actuarial losses onplan assets andplan liabilities $ (219,790) (8,224) (228,014) (215,113) (25,405) (240,518)
Change in fair value of MedicarePart D reimbursement asset (9,004) (101,163)
Total actuarial losses $ (237,018) $ (341,681)
In 2011, the Company announced that from 2013 it will be discontinuing participation in the program which entitles it to the federal subsidy noted above. Instead, it will switch to an employee group waiver program. As a result of this, the fair value of the Medicare Part D reimbursement asset has been reduced by $96,935 at December 31, 2011.
At December 31, 2012 and 2011, the net cumulative actuarial losses on defined benefit schemes recognized in equity were $2,123,834 and $1,886,816, respectively.
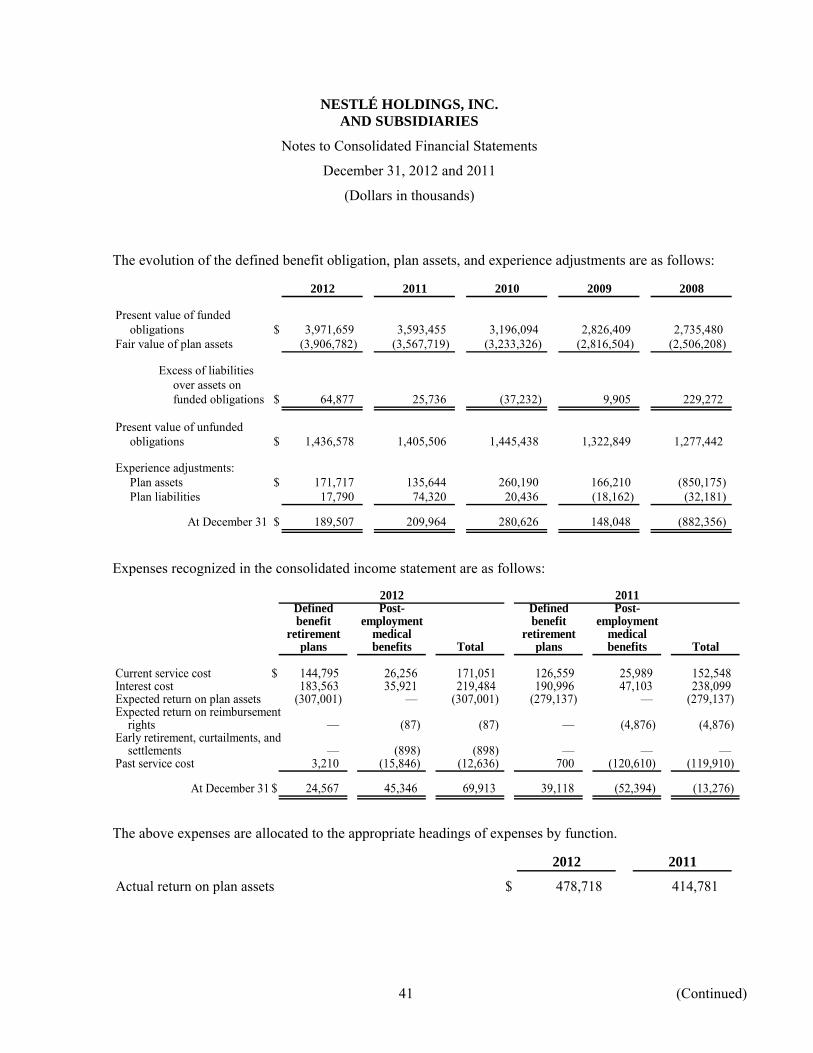
NESTLÉ HOLDINGS, INC. AND SUBSIDIARIES
Notes to Consolidated Financial Statements
December 31, 2012 and 2011
(Dollars in thousands)
41 (Continued)
The evolution of the defined benefit obligation, plan assets, and experience adjustments are as follows:
2012 2011 2010 2009 2008
Present value of fundedobligations $ 3,971,659 3,593,455 3,196,094 2,826,409 2,735,480
Fair value of plan assets (3,906,782) (3,567,719) (3,233,326) (2,816,504) (2,506,208)
Excess of liabilitiesover assets onfunded obligations $ 64,877 25,736 (37,232) 9,905 229,272
Present value of unfundedobligations $ 1,436,578 1,405,506 1,445,438 1,322,849 1,277,442
Experience adjustments:Plan assets $ 171,717 135,644 260,190 166,210 (850,175) Plan liabilities 17,790 74,320 20,436 (18,162) (32,181)
At December 31 $ 189,507 209,964 280,626 148,048 (882,356)
Expenses recognized in the consolidated income statement are as follows:
2012 2011Defined Post- Defined Post-benefit employment benefit employment
retirement medical retirement medicalplans benefits Total plans benefits Total
Current service cost $ 144,795 26,256 171,051 126,559 25,989 152,548 Interest cost 183,563 35,921 219,484 190,996 47,103 238,099 Expected return on plan assets (307,001) — (307,001) (279,137) — (279,137) Expected return on reimbursement
rights — (87) (87) — (4,876) (4,876) Early retirement, curtailments, and
settlements — (898) (898) — — — Past service cost 3,210 (15,846) (12,636) 700 (120,610) (119,910)
At December 31 $ 24,567 45,346 69,913 39,118 (52,394) (13,276)
The above expenses are allocated to the appropriate headings of expenses by function.
2012 2011
Actual return on plan assets $ 478,718 414,781
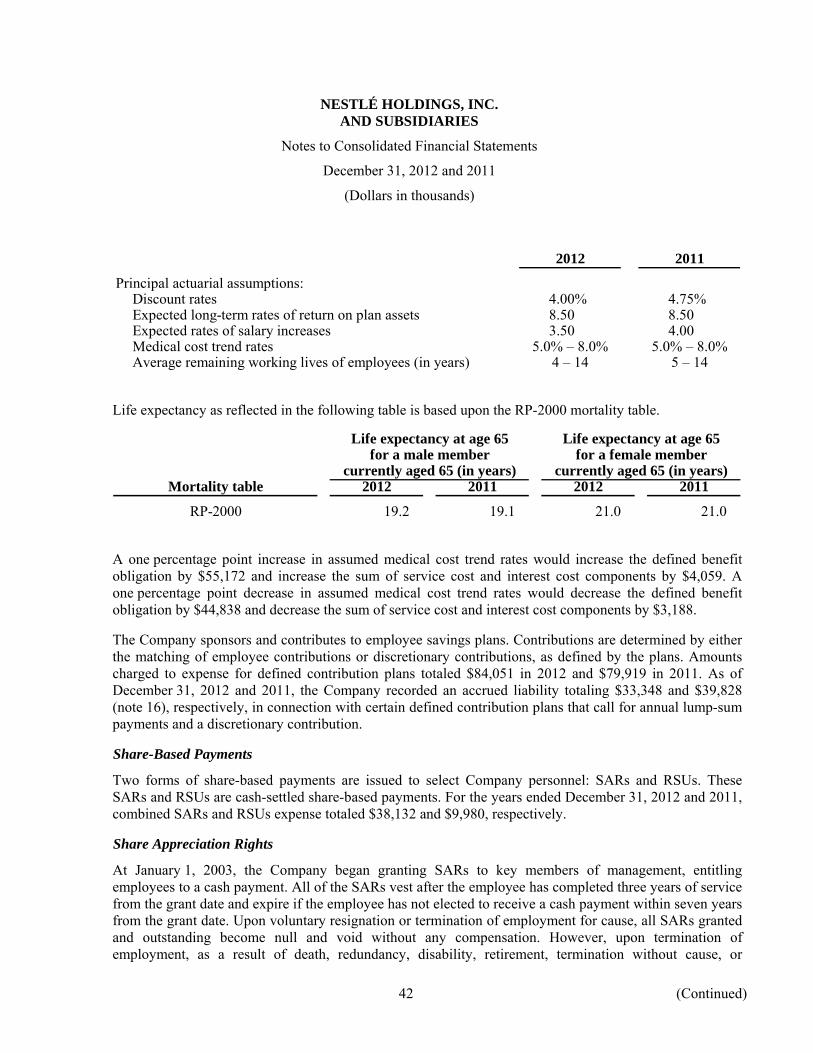
NESTLÉ HOLDINGS, INC. AND SUBSIDIARIES
Notes to Consolidated Financial Statements
December 31, 2012 and 2011
(Dollars in thousands)
42 (Continued)
2012 2011
Principal actuarial assumptions:Discount rates 4.00% 4.75%Expected long-term rates of return on plan assets 8.50 8.50Expected rates of salary increases 3.50 4.00Medical cost trend rates 5.0% – 8.0% 5.0% – 8.0%Average remaining working lives of employees (in years) 4 – 14 5 – 14
Life expectancy as reflected in the following table is based upon the RP-2000 mortality table.
Life expectancy at age 65 Life expectancy at age 65for a male member for a female member
currently aged 65 (in years) currently aged 65 (in years)Mortality table 2012 2011 2012 2011
RP-2000 19.2 19.1 21.0 21.0
A one percentage point increase in assumed medical cost trend rates would increase the defined benefit obligation by $55,172 and increase the sum of service cost and interest cost components by $4,059. A one percentage point decrease in assumed medical cost trend rates would decrease the defined benefit obligation by $44,838 and decrease the sum of service cost and interest cost components by $3,188.
The Company sponsors and contributes to employee savings plans. Contributions are determined by either the matching of employee contributions or discretionary contributions, as defined by the plans. Amounts charged to expense for defined contribution plans totaled $84,051 in 2012 and $79,919 in 2011. As of December 31, 2012 and 2011, the Company recorded an accrued liability totaling $33,348 and $39,828 (note 16), respectively, in connection with certain defined contribution plans that call for annual lump-sum payments and a discretionary contribution.
Share-Based Payments
Two forms of share-based payments are issued to select Company personnel: SARs and RSUs. These SARs and RSUs are cash-settled share-based payments. For the years ended December 31, 2012 and 2011, combined SARs and RSUs expense totaled $38,132 and $9,980, respectively.
Share Appreciation Rights
At January 1, 2003, the Company began granting SARs to key members of management, entitling employees to a cash payment. All of the SARs vest after the employee has completed three years of service from the grant date and expire if the employee has not elected to receive a cash payment within seven years from the grant date. Upon voluntary resignation or termination of employment for cause, all SARs granted and outstanding become null and void without any compensation. However, upon termination of employment, as a result of death, redundancy, disability, retirement, termination without cause, or

NESTLÉ HOLDINGS, INC. AND SUBSIDIARIES
Notes to Consolidated Financial Statements
December 31, 2012 and 2011
(Dollars in thousands)
43 (Continued)
divestiture, all SARs granted and outstanding vest immediately. As of December 31, 2012, all SARs vested were exercised.
The number and weighted average exercise prices of the SARs at December 31, 2012 and 2011 are listed in the following table. The weighted average Nestlé S.A. share price was CHF 51.70 in 2011. The weighted average prices below were translated from Swiss francs, the denomination currency of Nestlé S.A. shares, at the December 31, 2011; the exchange rates were 0.9401 USD/CHF.
2012 2011Average Average
Weighted remaining Weighted remainingaverage Number contractual average Number contractual
price of SARs life price of SARs life
Outstanding at beginning ofthe year $ 29.68 201,700 $ 29.73 471,760
Transfers during the year — — 29.62 (43,650) Forfeited during the year — — — — Exercised during the year 29.68 (201,700) 29.80 (226,410)
Outstanding at the end of the year — 29.68 201,700 0.01 years
Exercisable at the end of the year — — 29.68 201,700
The fair value of the SARs liability is determined based on the Black-Scholes model and is measured at each balance sheet date. The expected volatility is based upon the historical volatility of the Nestlé S.A. share price, adjusted for any expected changes to future volatility due to publicly available information. The assumptions and related SARs data at December 31, 2011 are as follows (share price and exercise price are not in thousands):
2011
Share price CHF 54.00Exchange rate (USD/CHF) 0.9401 Exercise price CHF 29.62 – 32.99Expected volatility % 33.4 – 95.6Expiry date 01/05/2012 – 07/01/2012Expected dividends % 0 – 7.38Risk-free interest rate % 0.05 – 0.18
As of December 31, 2012, there was no remaining SARs liability.
Restricted Stock Units
At January 1, 2006, the Company began granting RSUs to key members of management, entitling employees to a cash payment. The RSUs vest on the third anniversary of the grant date and may be redeemed on a date determined by the Company (generally within 2.5 months following vesting). The
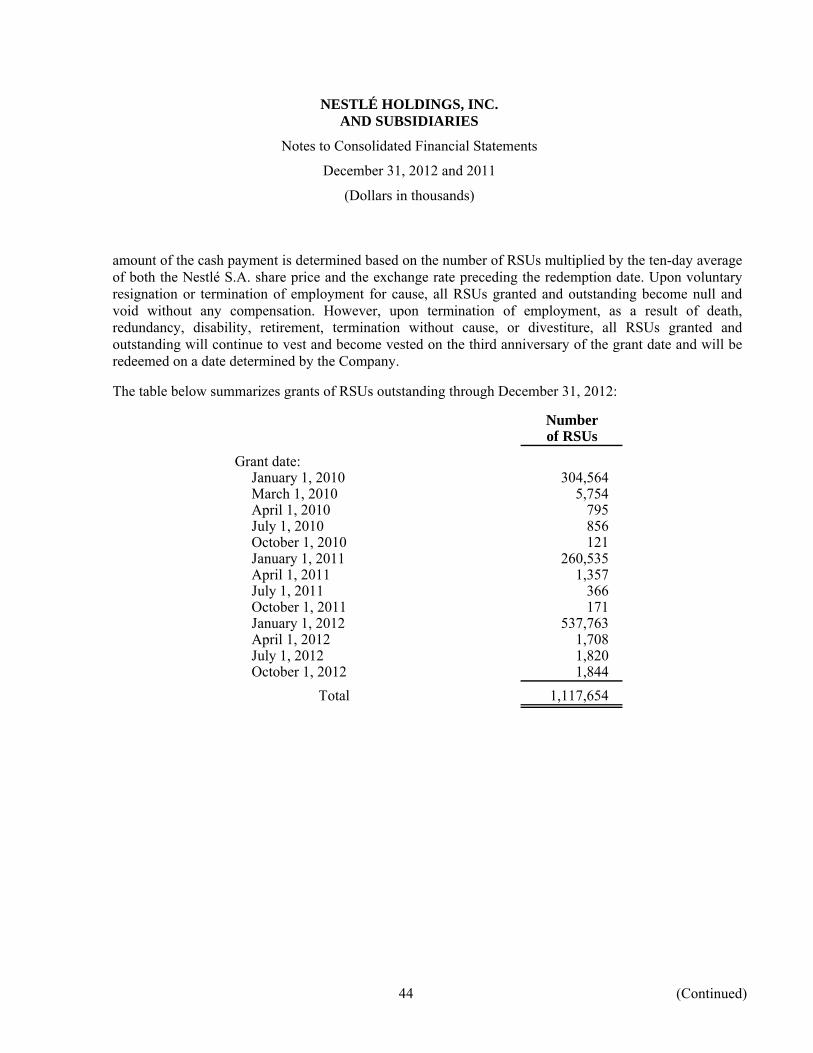
NESTLÉ HOLDINGS, INC. AND SUBSIDIARIES
Notes to Consolidated Financial Statements
December 31, 2012 and 2011
(Dollars in thousands)
44 (Continued)
amount of the cash payment is determined based on the number of RSUs multiplied by the ten-day average of both the Nestlé S.A. share price and the exchange rate preceding the redemption date. Upon voluntary resignation or termination of employment for cause, all RSUs granted and outstanding become null and void without any compensation. However, upon termination of employment, as a result of death, redundancy, disability, retirement, termination without cause, or divestiture, all RSUs granted and outstanding will continue to vest and become vested on the third anniversary of the grant date and will be redeemed on a date determined by the Company.
The table below summarizes grants of RSUs outstanding through December 31, 2012:
Numberof RSUs
Grant date:January 1, 2010 304,564 March 1, 2010 5,754 April 1, 2010 795 July 1, 2010 856 October 1, 2010 121 January 1, 2011 260,535 April 1, 2011 1,357 July 1, 2011 366 October 1, 2011 171 January 1, 2012 537,763 April 1, 2012 1,708 July 1, 2012 1,820 October 1, 2012 1,844
Total 1,117,654

NESTLÉ HOLDINGS, INC. AND SUBSIDIARIES
Notes to Consolidated Financial Statements
December 31, 2012 and 2011
(Dollars in thousands)
45 (Continued)
The table below summarizes the number and weighted average prices of the RSUs at December 31, 2012 and 2011:
2012 2011Average Average
Weighted remaining Weighted remainingaverage Number contractual average Number contractual
price of RSUs life price of RSUs life
Outstanding at beginning ofthe year $ 46.89 870,101 $ 43.42 902,328
Adjustment to the beginningbalance of the year 45.29 92,410 39.11 138
Forfeited during the year 53.60 (9,382) 47.31 (10,778) Exercised during the year 37.18 (381,694) 45.94 (268,744) Granted during the year 56.49 546,219 58.51 247,157
Outstanding at the end of the year 54.71 1,117,654 1.2 years 46.89 870,101 1.1 years
Exercisable at the end of the year 48.38 312,090 37.19 337,290
Group-issued Restricted Stock Units
Members of management of the Nestlé Group are awarded Group Restricted Stock Units (“GRSUs”) that entitle participants to receive freely disposable Nestlé S.A. shares or an equivalent amount in cash at the end of a three-year restriction period. For individuals transferred to the Company from another subsidiary of Nestlé S.A., the Company recognizes a liability to settle the obligation in cash. The amount of the cash payment is determined based on the number of GRSUs multiplied by the ten-day average of both the share price of Nestlé S.A. share price and the exchange rate preceding the redemption date.
The table below summarizes grants of GRSUs outstanding through December 31, 2012:
Numberof GRSUs
Grant date:March 5, 2010 43,913 March 3, 2011 34,858 March 1, 2012 23,012
Total 101,783
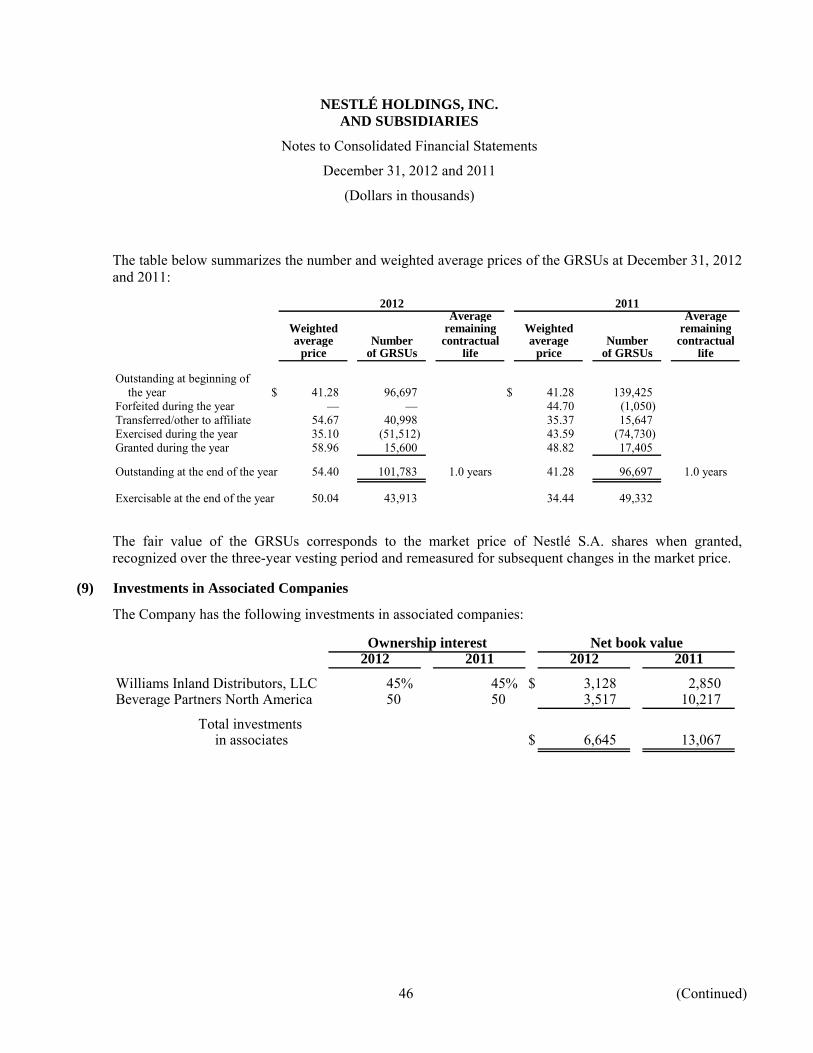
NESTLÉ HOLDINGS, INC. AND SUBSIDIARIES
Notes to Consolidated Financial Statements
December 31, 2012 and 2011
(Dollars in thousands)
46 (Continued)
The table below summarizes the number and weighted average prices of the GRSUs at December 31, 2012 and 2011:
2012 2011Average Average
Weighted remaining Weighted remainingaverage Number contractual average Number contractual
price of GRSUs life price of GRSUs life
Outstanding at beginning ofthe year $ 41.28 96,697 $ 41.28 139,425
Forfeited during the year — — 44.70 (1,050) Transferred/other to affiliate 54.67 40,998 35.37 15,647 Exercised during the year 35.10 (51,512) 43.59 (74,730) Granted during the year 58.96 15,600 48.82 17,405
Outstanding at the end of the year 54.40 101,783 1.0 years 41.28 96,697 1.0 years
Exercisable at the end of the year 50.04 43,913 34.44 49,332
The fair value of the GRSUs corresponds to the market price of Nestlé S.A. shares when granted, recognized over the three-year vesting period and remeasured for subsequent changes in the market price.
(9) Investments in Associated Companies
The Company has the following investments in associated companies:
Ownership interest Net book value2012 2011 2012 2011
Williams Inland Distributors, LLC 45% 45% $ 3,128 2,850 Beverage Partners North America 50 50 3,517 10,217
Total investmentsin associates $ 6,645 13,067

NESTLÉ HOLDINGS, INC. AND SUBSIDIARIES
Notes to Consolidated Financial Statements
December 31, 2012 and 2011
(Dollars in thousands)
47 (Continued)
(10) Deferred Taxes
Deferred tax assets by types of temporary differences are as follows:
2012 2011
Employee benefits $ 876,587 835,001 Inventories, receivables, payables, accruals, and provisions 182,252 167,970 Financial instruments 95,531 125,103 Net operating losses 5,676 5,676 Others 27,768 39,428
Total deferred taxes $ 1,187,814 1,173,178
Deferred tax liabilities by types of temporary differences are as follows:
2012 2011
Tangible fixed assets $ 666,509 606,676 Goodwill and other intangible assets 990,001 862,844 Financial instruments 83,021 56,794 Others 222,252 203,959
Total deferred taxes $ 1,961,783 1,730,273
At December 31, 2012 and 2011, deferred taxes were recognized for all temporary differences. Additionally, the Company had net operating losses and tax credits, which can be carried forward to the extent taxable income will be generated. During 2011, a portion of the net operating losses and tax credits that the Company does not expect to realize were transferred to unrecognized deferred tax assets. These unrecognized deferred tax assets total $21,690, all of which expire in more than five years. Excluding the unrecognized deferred tax assets, a benefit has been fully recognized based on the Company’s expectation of probable taxable profits before the unused tax losses expire.

NESTLÉ HOLDINGS, INC. AND SUBSIDIARIES
Notes to Consolidated Financial Statements
December 31, 2012 and 2011
(Dollars in thousands)
48 (Continued)
(11) Goodwill
Goodwill is as follows:
2012 2011
Gross goodwill at January 1 $ 18,919,181 18,919,181
At December 31 18,919,181 18,919,181
Accumulated impairments at January 1 (206,590) (206,590)
At December 31 (206,590) (206,590) Net goodwill, at December 31 $ 18,712,591 18,712,591
Impairment Testing for Cash Generating Units (“CGUs”) containing Goodwill
Impairment reviews have been conducted for goodwill allocated to nine CGUs, which is the lowest level at which the goodwill is monitored for internal management purposes. Detailed results of the impairment tests are presented below for the three main CGUs tested, representing 84% of the net book value at December 31, 2012. For purpose of the tests, they are the following CGUs: PetCare, Infant Nutrition, and Frozen Pizza and Ice Cream USA.
PetCare
Goodwill related to the 2001 acquisition of Ralston Purina has been allocated for the impairment test to the CGU of the product category PetCare. Following the September 2010 acquisition of Waggin’ Train, a specialty dog treat company, an additional $246,852 in goodwill was recognized. The carrying amounts of all goodwill items allocated to this CGU total $8,419,329 at December 31, 2012.
The recoverable amount of the CGU is higher than its carrying amount. The recoverable amount has been determined based upon a value-in-use calculation. Deflated cash flow projections covering the next 50 years, discounted at a pre-tax weighted average rate of 6.9%, were used in this calculation. The cash flows for the first five years were based upon financial plans approved by Company management; years six to ten were based upon Company management’s best expectations, which are consistent with the Company’s approved strategy for this period. Cash flows were assumed to be flat for years 11 to 50, although Company management expects continuing growth. Cash flows have been adjusted to reflect specific business risks.
Main assumptions, based on past experiences and current initiatives, were the following:
• Sales: annual growth between 4.0% and 4.5% over the first ten year period;
• Trading operating profit margin evolution: remain consistent with sales growth and portfolio rationalization.

NESTLÉ HOLDINGS, INC. AND SUBSIDIARIES
Notes to Consolidated Financial Statements
December 31, 2012 and 2011
(Dollars in thousands)
49 (Continued)
Assumptions used in the calculation are consistent with the expected long-term average growth rate of the PetCare business. The key sensitivity for the impairment test is the growth in sales and trading operating profit margin. Assuming no sales growth and no improvement in trading operating profit margin over the entire period would not result in the carrying amount exceeding the recoverable amount. An increase of 1% in the discount rate assumption would not change the conclusions of the impairment tests.
Infant Nutrition
Goodwill related to the 2007 acquisition of Gerber has been allocated for the impairment test to the CGU of the Infant Nutrition business. As of December 31, 2012, the carrying amounts of all goodwill items allocated to this CGU total $3,198,718.
The recoverable amount of the CGU is higher than its carrying amount. The recoverable amount has been determined based upon a value-in-use calculation. Deflated cash flow projections covering the next 50 years, discounted at a pre-tax weighted average rate of 6.9%, were used in this calculation. The cash flows for the first five years were based upon financial plans approved by Company management; years six to ten were based upon Company management’s best expectations, which are consistent with the Company’s approved strategy for this period. Cash flows were assumed to be flat for years 11 to 50, although Company management expects continuing growth. Cash flows have been adjusted to reflect specific business risks.
Main assumptions, based on past experiences and current initiatives, were the following:
• Sales: annual growth between 3.1% and 6.1% over the first ten year period;
• Trading operating profit margin evolution: steadily improving trading operating profit margin over the first ten year period.
The key sensitivity for the impairment test is the growth in sales or trading operating profit margin. Limiting sales growth to an average of 1.1% or decreasing the average trading operating profit margin over the first ten year period by 3.7% lower than forecast would not result in the carrying amount exceeding the recoverable amount. An increase of 1% in the discount rate assumption would not change the conclusions of the impairment tests.
Frozen Pizza and Ice Cream USA
Goodwill related to the 2003 acquisition of Dreyer’s Grand Ice Cream, Inc. as well as the former Nestlé Ice Cream Company were allocated to the Ice Cream CGU for the impairment test. Following the March 2010 acquisition of the Kraft Frozen Pizza business and the synergies in the selling and distribution networks, goodwill of the Ice Cream and Frozen Pizza businesses were aggregated and allocated to the Frozen Pizza and Ice Cream USA CGU. The carrying amounts of all goodwill items allocated to the Frozen Pizza and Ice Cream CGU total $4,119,950 at December 31, 2012.
The recoverable amount of the CGU is higher than its carrying amount. The recoverable amount has been determined based upon a value-in-use calculation. Deflated cash flow projections covering the next

NESTLÉ HOLDINGS, INC. AND SUBSIDIARIES
Notes to Consolidated Financial Statements
December 31, 2012 and 2011
(Dollars in thousands)
50 (Continued)
50 years, discounted at a pre-tax weighted average rate of 6.9%, were used in this calculation. The cash flows for the first five years were based upon financial plans approved by Company management; years six to ten were based upon Company management’s best expectations, which are consistent with the Company’s approved strategy for this period. Cash flows were assumed to grow 1% for years 11 to 50. Cash flows have been adjusted to reflect specific business risks.
Main assumptions, based on past experiences and current initiatives, were the following:
• Sales: annual growth between 4.6% and 5.2% over the first ten year period;
• Trading operating profit margin evolution: steadily improving trading operating profit margin over the first four year period, in a range of 1.3% to 1.7% and then from a range of 0.4% to 0.6% per year from year five to ten.
Assumptions used in the calculation are consistent with the expected long-term average growth rate of the Frozen Pizza and Ice Cream businesses. The key sensitivity for the impairment test is the growth in sales or trading operating profit margin. Decreasing the average sales growth by 1% or average trading operating margin by 1% over the first ten year period lower than forecast would not result in the carrying amount exceeding the recoverable amount. An increase of 0.5% in the discount rate assumption would not change the conclusions of the impairment tests.
(12) Intangible Assets
Intangible assets, which include acquired or internally developed intangible assets, primarily software and various rights connected with business activities, are as follows:
2012 2011
Gross intangible assets at January 1 $ 1,647,089 1,573,040 of which indefinite useful life 121,500 121,500
Additions 176,873 170,880 Disposals/others (37,859) (96,831)
At December 31 1,786,103 1,647,089
of which indefinite useful life 121,500 121,500
Accumulated amortization at January 1 (738,214) (677,486) Amortization of intangible assets (129,659) (157,559) Disposals/other 37,859 96,831
At December 31 (830,014) (738,214) Intangible assets, net at December 31 $ 956,089 908,875

NESTLÉ HOLDINGS, INC. AND SUBSIDIARIES
Notes to Consolidated Financial Statements
December 31, 2012 and 2011
(Dollars in thousands)
51 (Continued)
(13) Financial Instruments
2012 2011
By class:Cash and short-term investments (a) $ 826,102 197,491 Trade and other receivables, net 2,671,016 3,154,080 Derivative assets 414,656 451,525 Financial assets – non-current 3,436,526 3,121,886
Total financial assets 7,348,300 6,924,982
Trade and other payables 1,274,645 1,126,565 Financial liabilities – current 8,746,401 11,779,265 Derivative liabilities 285,669 344,846 Financial liabilities – non-current 6,368,140 8,334,120
Total financial liabilities 16,674,855 21,584,796 Net financial position $ (9,326,555) (14,659,814)
(a) The cash and short-term investments balance of $826,102 at December 31, 2012 is comprised of$670,994 in bank balances, $150,211 in time deposits and $4,897 in short-term investments. Thebalance of $197,491 at December 31, 2011 is comprised of $191,767 in bank balances, $212 in timedeposits and $5,512 in short-term investments.

NESTLÉ HOLDINGS, INC. AND SUBSIDIARIES
Notes to Consolidated Financial Statements
December 31, 2012 and 2011
(Dollars in thousands)
52 (Continued)
2012 2011
By category:Loans and receivables (a) $ 2,871,663 3,346,350 Derivative assets (b) 414,656 451,525 Financial assets at fair value through profit and loss 873,325 823,597 Available-for-sale assets (excluding cash and
short-term investments) 2,362,554 2,106,019 Cash and short-term investments 826,102 197,491
Total financial assets 7,348,300 6,924,982
Financial liabilities (a) 16,389,186 21,239,950 Derivative liabilities (b) 285,669 344,846
Total financial liabilities 16,674,855 21,584,796 Net financial position $ (9,326,555) (14,659,814)
of which at fair value (c) $ 3,471,978 3,131,403
(a) Carrying amount of these instruments is a reasonable approximation of their fair value.(b) Includes derivatives classified as trading (note 5).(c) Includes the following instruments: short-term investments, derivative assets, available-for-sale
assets, derivative liabilities, and financial assets at fair value through profit and loss.

NESTLÉ HOLDINGS, INC. AND SUBSIDIARIES
Notes to Consolidated Financial Statements
December 31, 2012 and 2011
(Dollars in thousands)
53 (Continued)
The Company does not apply the fair value option.
2012 2011
Fair value hierarchy of financial instruments:Short-term investments $ 4,897 5,512 Bonds 29,499 44,185 Equity instruments 54,148 42,348 Other financial assets — 34,812 Derivative assets 2,038 6,065 Derivative liabilities (16,483) (47,093)
Prices quoted in active markets (Level 1) 74,099 85,829
Bonds 2,196,770 2,028,152 Equity instruments 306,172 35,067 Other financial assets — 3,369 Investment funds — 164,191 Derivative assets 412,618 445,460 Derivative liabilities (269,186) (297,753)
Valuation techniques based on observablemarket data (Level 2) 2,646,374 2,378,486
Other financial assets 751,505 667,088
Valuation techniques based on unobservableinput (Level 3) 751,505 667,088
Total financial instruments at fair value $ 3,471,978 3,131,403

NESTLÉ HOLDINGS, INC. AND SUBSIDIARIES
Notes to Consolidated Financial Statements
December 31, 2012 and 2011
(Dollars in thousands)
54 (Continued)
In 2012, there were two significant transfers between fair value levels, which are explained on the Level 3 rollforward below.
Rollforward of financial instruments based on unobservable input (Level 3)
Beginning balance at January 1, 2012 $ 667,088 Gains (a) 26,302 Change in fair value (b) 603 Purchases 23,239 Transfers (c) 53,104 Settlement (18,831) Ending balance at December 31, 2012 $ 751,505
(a) Reported in net other expenses in the consolidated income statement.(b) Reported in other comprehensive income in the consolidated statement of comprehensive income.(c)
Consists of a Level 1 to Level 3 transfer of $35 million due to a change in valuation method andLevel 2 to Level 3 transfer of $14 million as a result of a change in valuation data.

NESTLÉ HOLDINGS, INC. AND SUBSIDIARIES
Notes to Consolidated Financial Statements
December 31, 2012 and 2011
(Dollars in thousands)
55 (Continued)
Bonds Interest rates
Coupon Effective Year of issue/ Carrying valueComments percentage percentage maturity 2012 2011
Eurobonds:CHF 200,000 (b) 3.00% 3.03% 2007-2012 $ — 217,459 CHF 150,000 (a) 3.00 2.72 2008-2012 — 159,854 CHF 325,000 (b) 3.00 2.72 2008-2012 — 353,230 CHF 450,000 (b) 2.50 2.57 2006-2013 500,818 498,012 USD 150,000 (d) 2.00 2.24 2009-2013 149,974 149,620 USD 125,000 (c) 2.00 2.29 2009-2013 125,137 126,348 AUD 350,000 (a) 6.00 6.24 2009-2013 362,698 353,980 USD 550,000 (d) 2.13 2.13 2010-2014 550,016 550,029 AUD 275,000 (b) 5.50 5.69 2011-2016 301,586 287,687 NOK 1,000,000 (b) 3.38 3.59 2011-2016 182,824 165,867 USD 200,000 (d) 2.00 2.06 2011-2016 199,592 199,494 USD 900,000 (d) 1.38 1.46 2012-2017 896,827 — NOK 2,500,000 (a) 2.50 2.65 2012-2017 444,800 — NOK 500,000 (a) 2.50 2.71 2012-2017 88,753 — AUD 150,000 (a) 4.00 4.13 2012-2017 154,895 — AUD 50,000 (a) 4.00 4.04 2012-2017 51,815 — NOK 1,000,000 (a) 2.25 2.31 2012-2017 178,447 — CHF 250,000 (b) 2.63 2.66 2007-2018 303,861 293,671 USD 500,000 (d) 1.25 1.32 2012-2018 498,394 —
Other bonds issued by Nestlé PurinaPetCare Company:
USD 47,680 7.75 6.25 1995 – 2015 49,496 50,032 USD 63,210 9.30 6.46 1991 – 2021 74,646 75,660 USD 78,963 8.63 6.46 1992 – 2022 90,583 91,499 USD 43,927 8.13 6.47 1993 – 2023 49,256 49,621 USD 51,164 7.88 6.45 1995 – 2025 57,332 57,641
Other Bonds 3,448 3,484
Total debt obligations 5,315,198 3,683,188
Less current portion (1,138,645) (730,543)
Non-current portion $ 4,176,553 2,952,645
Fair value of bonds $ 5,433,448 3,851,700
(a) Subject to an interest rate and currency swap that creates a U.S. dollar liability at fixed rates.(b) Subject to an interest rate and currency swap that creates a U.S. dollar liability at floating rates.(c) Subject to an interest rate swap that creates a U.S. dollar liability at floating rates.(d) Not subject to an interest rate or currency swap.
For the years ended December 31, 2012 and 2011, the related bond derivatives were shown under derivative assets for $403,174 and $440,544, respectively, and under derivative liabilities for $0 and ($3,362), respectively.

NESTLÉ HOLDINGS, INC. AND SUBSIDIARIES
Notes to Consolidated Financial Statements
December 31, 2012 and 2011
(Dollars in thousands)
56 (Continued)
(14) Financial Risks
In the course of its business, the Company is exposed to a number of financial risks: credit risk, liquidity risk, market risk (including foreign currency risk and interest rate risk), commodity price risk, and other risks (including equity price risk and settlement risk). This note presents the Company’s objectives, policies, and processes for managing its financial risk and capital.
Financial risk management is an integral part of the way the Company is managed. The Board of Directors of Nestlé S.A. determines the financial control principles as well as the principles of financial planning. The Chief Executive Officer organizes, manages, and monitors all financial asset and liability matters. A Nestlé S.A. Asset and Liability Management Committee (“ALMC”), under the supervision of the Chief Financial Officer of Nestlé S.A., is the governing body for the establishment and subsequent execution of Nestlé S.A.’s Financial Asset and Liability Management Policy. It ensures implementation of strategies and achievement of objectives of Nestlé S.A.’s Financial Asset and Liabilities Management Policy, which are executed by the Centre Treasury, the Regional Treasury Centres and, in specific local circumstances, by the affiliated companies. The activities of the Centre Treasury and of the Regional Treasury Centres are supervised by an independent Middle Office, which verifies the compliance of the strategies proposed and/or operations executed within the approved guidelines and limits set by the ALMC. Approved Treasury Management Guidelines define and classify risks as well as determine, by category of transaction, specific approval, limit, and monitoring procedures. In accordance with the aforementioned policies, the Company only enters into derivative transactions relating to assets, liabilities, or anticipated future transactions.
Credit Risk
Credit Risk Management
Credit risk arises because the counterparty may fail to perform its obligations. The Company is exposed to credit risk on financial instruments such as liquid assets, non-current financial assets, derivative assets, and trade receivable portfolios.
The Company’s objective is to set credit limits based on a counterparty value computed with its probability of default. The methodology used to set the list of counterparty limits includes Enterprise Value (“EV”), counterparty Credit Ratings (“CR”), and Credit Default Swaps (“CDS”). Evolution of counterparties is monitored daily, taking into consideration EV, CR, and CDS evolution by Nestlé S.A. As a result of this daily review, changes on investment limits and risk allocation are carried out.
The Company avoids the concentration of credit risk on its liquid assets by spreading them over several institutions and sectors.
Trade receivables are subject to credit limits, control, and approval procedures in all the affiliated companies. Due to its large geographic base and number of customers, the Company is not exposed to material concentrations of credit risk on its trade receivables (note 3). Nevertheless, commercial counterparties are constantly monitored following the same methodology used for financial counterparties.

NESTLÉ HOLDINGS, INC. AND SUBSIDIARIES
Notes to Consolidated Financial Statements
December 31, 2012 and 2011
(Dollars in thousands)
57 (Continued)
The maximum exposure to credit risk resulting from financial activities, without considering netting agreements and without taking into account any collateral held or other credit enhancements, is equal to the carrying amount of the Company’s financial assets.
Credit rating of financial assets (excluding loans and receivables):
2012 2011
Investment grade A- and above $ 3,365,023 2,809,903 Investment grade BBB+, BBB and BBB- 741,865 492,354 Non-investment grade (BB+ and below) 120,363 55,803 Not rated 351,601 310,168
Total financial assets (excluding loans and receivables) $ 4,578,852 3,668,228
The source of the credit ratings is Standard & Poor’s; if not available, the Company uses other credit rating equivalents. The Company deals mainly with financial institutions located in Switzerland, the European Union, and North America.
Liquidity Risk
Liquidity Risk Management
Liquidity risk arises when a company encounters difficulties to meet commitments associated with liabilities and other payment obligations. Such risk may result from inadequate market depth, disruption, or refinancing problems. The Company’s objective is to manage this risk by limiting exposures in instruments that may be affected by liquidity problems and by maintaining sufficient back-up facilities. The Company does not expect any refinancing issues.

NESTLÉ HOLDINGS, INC. AND SUBSIDIARIES
Notes to Consolidated Financial Statements
December 31, 2012 and 2011
(Dollars in thousands)
58 (Continued)
Maturity of financial instruments 2012
3rd to 5th After the 5th Impact of Contractual Carrying1st year 2nd year year year discounting amount amount
Financial assets(excluding derivatives):
Cash and short-term investments $ 826,102 — — — — 826,102 826,102 Trade and other receivables 2,671,016 — — — — 2,671,016 2,671,016 Other financial assets — 49,516 217,582 2,139,569 — 2,406,667 2,406,667
Total financial assetswith contractual maturities(excluding derivatives) 3,497,118 49,516 217,582 2,139,569 — 5,903,785 5,903,785
Financial assets withoutcontractual maturities — — — — — — 1,029,859
Total financial assets(excluding derivatives) 3,497,118 49,516 217,582 2,139,569 — 5,903,785 6,933,644
Financial liabilities(excluding derivatives):
Trade and other payables 1,274,645 — — — — 1,274,645 1,274,645 Commercial paper 7,479,855 — — — (8,547) 7,479,855 7,471,308 Bonds 1,300,411 663,216 3,292,485 621,489 (562,403) 5,877,601 5,315,198 Other financial liabilities 138,911 259,848 1,925,403 17,220 (13,347) 2,341,382 2,328,035
Total financial liabilitieswith contractual maturities(excluding derivatives) 10,193,822 923,064 5,217,888 638,709 (584,297) 16,973,483 16,389,186
Financial liabilities withoutcontractual maturities — — — — — — —
Total financial liabilities(excluding derivatives) 10,193,822 923,064 5,217,888 638,709 (584,297) 16,973,483 16,389,186
Non-currency and currencyderivative assets and liabilities:
Non-currency derivative assets 9,502 — — — — 9,502 9,502 Non-currency derivative liabilities (103,914) (46,586) (100,787) (39,551) 5,419 (290,838) (285,419) Gross amount receivable from
currency derivatives 1,031,460 54,698 1,530,277 280,497 (173,226) 2,896,932 2,723,706 Gross amount payable from
currency derivatives (788,289) (12,684) (1,364,286) (203,704) 50,161 (2,368,963) (2,318,802) Total net derivatives 148,759 (4,572) 65,204 37,242 (117,646) 246,633 128,987 Net financial position $ (6,547,945) (878,120) (4,935,102) 1,538,102 466,651 (10,823,065) (9,326,555)
Of which cash flow hedges:Derivative assets $ 505,426 25,754 1,000,718 — (126,870) 1,531,898 1,405,028 Derivative liabilities 525,360 57,396 1,009,359 39,551 (38,598) 1,631,666 1,593,068

NESTLÉ HOLDINGS, INC. AND SUBSIDIARIES
Notes to Consolidated Financial Statements
December 31, 2012 and 2011
(Dollars in thousands)
59 (Continued)
)
20113rd to 5th After the 5th Impact of Contractual Carrying
1st year 2nd year year year Discounting amount amount
Financial assets(excluding derivatives):
Cash and short-term investments $ 197,491 — — — — 197,491 197,491 Trade and other receivables 3,154,080 — — — — 3,154,080 3,154,080 Other financial assets — 68,063 233,222 1,852,777 — 2,154,062 2,154,062
Total financial assetswith contractual maturities(excluding derivatives) 3,351,571 68,063 233,222 1,852,777 — 5,505,633 5,505,633
Financial assets withoutcontractual maturities — — — — — — 967,824
Total financial assets(excluding derivatives) 3,351,571 68,063 233,222 1,852,777 — 5,505,633 6,473,457
Financial liabilities(excluding derivatives):
Trade and other payables 1,126,565 — — — — 1,126,565 1,126,565 Commercial paper 8,202,762 — — — (3,900) 8,202,762 8,198,862 Bonds 846,333 1,215,849 1,421,251 641,409 (441,654) 4,124,842 3,683,188 Other financial liabilities 2,852,250 909,321 3,024,832 1,451,808 (7,268) 8,238,211 8,230,943
Total financial liabilitieswith contractual maturities(excluding derivatives) 13,027,910 2,125,170 4,446,083 2,093,217 (452,822) 21,692,380 21,239,558
Financial liabilities withoutcontractual maturities — — — — — — 392
Total financial liabilities(excluding derivatives) 13,027,910 2,125,170 4,446,083 2,093,217 (452,822) 21,692,380 21,239,950
Non-currency and currencyderivative assets and liabilities:
Non-currency derivative assets 15,524 2,159 — — (33) 17,683 17,650 Non-currency derivative liabilities (152,982) (73,006) (81,926) (38,103) 11,354 (346,017) (334,663Gross amount receivable from
currency derivatives 801,051 895,438 529,599 279,959 (113,616) 2,506,047 2,392,431 Gross amount payable from
currency derivatives (640,005) (699,898) (468,233) (208,917) 48,314 (2,017,053) (1,968,739)Total net derivatives 23,588 124,693 (20,560) 32,939 (53,981) 160,660 106,679 Net financial position $ (9,652,751) (1,932,414) (4,233,421) (207,501) 398,841 (16,026,087) (14,659,814)
Of which cash flow hedges:Derivative assets $ 196,107 376,695 — — (28,706) 572,802 544,096 Derivative liabilities 303,917 401,421 81,926 38,103 (13,369) 825,367 811,998

NESTLÉ HOLDINGS, INC. AND SUBSIDIARIES
Notes to Consolidated Financial Statements
December 31, 2012 and 2011
(Dollars in thousands)
60 (Continued)
Market Risk
The Company is exposed to risks from movements in foreign currency exchange rates, interest rates, and market prices that affect its assets, liabilities, and anticipated future transactions.
Foreign Currency Risk
Foreign Currency Risk Management
The Company is exposed to foreign currency risk from transactions. Transaction exposure arises because affiliated companies undertake transactions in foreign currency. Transactional exposures are managed within a prudent and systematic hedging policy in accordance with the Company’s specific business needs.
The Company’s objective is to manage its foreign currency exposure through the use of currency forwards, futures, swaps, and options.
Financial Instruments by Currency 2012
USD CHF MXN NOK AUD EUR Other Total
Financial assets (excluding derivatives):
Cash and short-term investments $ 826,135 18 (98) — 1 — 46 Trade and other receivables 2,671,016
826,102 — — — — — — 2,671,016
Other financial assets 3,436,526 — — — — — — 3,436,526
Total financial assets(excluding derivatives) 6,933,677 18 (98) — 1 — 46 6,933,644
Financial liabilities(excluding derivatives):
Trade and other payables 1,246,331 2,948 9,501 — 230 11,075 4,560 1,274,645 Commercial paper 7,471,308 — — — — — — 7,471,308 Bonds 2,744,701 804,679 — 894,824 870,994 — — 5,315,198 Other financial liabilities 2,328,035 — — — — — — 2,328,035
Total financial liabilities(excluding derivatives) 13,790,375 807,627 9,501 894,824 871,224 11,075 4,560 16,389,186
Non-currency and currencyderivative assets and liabilities:
Non-currency derivative assets 9,502 — — — — — — 9,502 Non-currency derivative
liabilities (285,419) — — — — — — (285,419)Gross amount receivable
from currency derivatives 2,723,706 — — — — — — 2,723,706 Gross amount payable
from currency derivatives (2,318,802) — — — — — — (2,318,802)
Total net derivatives 128,987 — — — — — — Net financial position $ (6,727,711) (807,609) (9,599) (894,824) (871,223) (11,075) (4,514) (9,326,555)
128,987

NESTLÉ HOLDINGS, INC. AND SUBSIDIARIES
Notes to Consolidated Financial Statements
December 31, 2012 and 2011
(Dollars in thousands)
61 (Continued)
2011USD CHF CAD NOK AUD EUR Other Total
Financial assets (excluding derivatives):
Cash and short-term investments $ 197,027 (98) (48) — — 610 — 197,491Trade and other receivables 3,153,530 550
— — — — — 3,154,080
Other financial assets 3,121,886
— — — — — — 3,121,886
Total financial assets(excluding derivatives) 6,472,443 452 (48)
— — 610 — 6,473,457
Financial liabilities(excluding derivatives):
Trade and other payables 1,101,654 1,978 9,469
— 322 10,475 2,667 1,126,565Commercial pape
r 8,198,862 — — — — — — 8,198,862
Bonds 1,451,682 1,435,129
— 165,019 631,358 — — 3,683,188Other financial liabilities 8,231,335
— — — — — — 8,231,335
Total financial liabilities(excluding derivatives) 18,983,533 1,437,107 9,469 165,019 631,680 10,475 2,667 21,239,950
Non-currency and currencyderivative assets and liabilities:
Non-currency derivative assets 17,650
— — — — — — 17,650Non-currency derivative
liabilities (334,663)
— — — — — — (334,663)Gross amount receivable
from currency derivatives 2,392,431 — — — — — — 2,392,431Gross amount payable
from currency derivatives (1,968,739)
— — — — — — (1,968,739)
Total net derivatives 106,679 — — — — — — 106,679Net financial position $ (12,404,411) (1,436,655) (9,517) (165,019) (631,680) (9,865) (2,667) (14,659,814)
Interest Rate Risk
Interest Rate Risk
Interest rate risk comprises the interest price risk that results from borrowings at fixed rates and the interest cash flow risk that results from borrowings at variable rates.
Interest Rate Risk Management
The ALMC is responsible for setting the overall duration and interest management targets.
The Company’s objective is to manage its interest rate exposure through the use of interest rate forwards, futures, and swaps.

NESTLÉ HOLDINGS, INC. AND SUBSIDIARIES
Notes to Consolidated Financial Statements
December 31, 2012 and 2011
(Dollars in thousands)
62 (Continued)
Average Interest Rates (Excluding Derivatives)
2012 2011
Cash and cash equivalents 0.13% 0.11%Financial liabilities (excluding bonds (a) ) 1.63 1.90
(a) interest rates of bonds are disclosed in note 13.
Interest Structure of Non-current Financial Liabilities
2012 2011
Financial liabilities at fixed rates $ 5,579,859 5,662,144 Financial liabilities at variable rates 788,281 2,671,584 Other — 392
Total non-current financial liabilities $ 6,368,140 8,334,120
Commodity Price Risk
Commodity Price Risk
Commodity price risk arises from transactions on the world commodity markets for securing the supplies of green coffee, cocoa beans, and dairy commodities necessary for the manufacture of some of the Company’s products.
Commodity Price Risk Management
The Company’s objective is to minimize the impact of commodity price fluctuations and this exposure is hedged in accordance with the commodity risk management policies set by the Board of Directors of Nestlé S.A.
The regional Commodity Purchasing Competence Centre is responsible for managing commodity price risks on the basis of internal directives and centrally determined limits. They ensure that the Company benefits from guaranteed financial hedges through the use of exchange-traded commodity derivatives.
The commodity price risk exposure of anticipated future purchases is managed using a combination of future and option derivatives. The vast majority of these contracts are for physical delivery.
As a result of the short product business cycle of the Company, the majority of the anticipated future raw material transactions outstanding at the balance sheet date are expected to occur in the next period.
NESTLÉ HOLDINGS, INC. AND SUBSIDIARIES
Notes to Consolidated Financial Statements
December 31, 2012 and 2011
(Dollars in thousands)
63 (Continued)
Other Risks
Equity Price Risk
The Company is exposed to equity price risk on investments held as trading and available-for-sale assets. To manage the price risk arising from investments in securities, the Company diversifies its portfolios in accordance with the guidelines set by the Board of Directors of Nestlé S.A.
The Company’s external investments are primarily with publicly traded counterparties that have an investment-grade rating by one of the recognized rating agencies.
Settlement Risk
Settlement risk results from the fact that the Company may not receive financial instruments from its counterparties at the expected time. This risk is managed by monitoring counterparty activity and settlement limits.
Value at Risk (“VaR”)
Description of the Method
The VaR is a single measure to assess market risk. The VaR estimates the size of losses given current positions and possible changes in financial markets. The Company uses simulation to calculate VaR based on the historic data for a 250-day period.
The VaR calculation is based on a 95% confidence level and accordingly, does not take into account losses that might occur beyond this level of confidence.
The VaR is calculated on the basis of unhedged exposures outstanding at the close of business and does not necessarily reflect intra-day exposures.
Objective of the Method
The Company uses the described VaR analysis to estimate the potential one-day loss in the fair value of its financial and commodity instruments.
The Company cannot predict the actual future movements in market rates and commodity prices; therefore, the below VaR numbers neither represent actual losses nor consider the effects of favorable movements in underlying variables. Accordingly, these VaR numbers may only be considered indicative of future movements to the extent the historic market patterns repeat in the future.
VaR Figures
The VaR computation includes the Company’s financial assets and liabilities that are subject to foreign currency, interest rate, and price risk.

NESTLÉ HOLDINGS, INC. AND SUBSIDIARIES
Notes to Consolidated Financial Statements
December 31, 2012 and 2011
(Dollars in thousands)
64 (Continued)
The estimated potential one-day loss from the Company’s foreign currency, interest rate, and security price risk sensitive instruments, as calculated using the above-described historic VaR model, is $158 and $517 for the years ended December 31, 2012 and 2011, respectively.
The estimated potential one-day loss from the Company’s commodity price risk sensitive instruments, as calculated using the above described historic VaR model, is not significant.
Capital Risk Management
The Company’s capital risk management strategy is to maintain a sound capital base to support the continued development of the Company’s operations, utilizing various funding sources available to it. Substantially all of the Company’s debt is guaranteed by Nestlé S.A., which allows the Company to borrow from third parties at lower interest rates. In order to ensure that the return on invested capital is optimized, the Company establishes strict limits on annual additions of property, plant and equipment.
(15) Assets Held for Sale
2012 2011
Business units $ 16,214 17,246 Buildings — 2,819
Total assets held for sale $ 16,214 20,065
The business units held for sale balance in 2011 represents certain wholly owned foreign subsidiaries, which the Company acquired ownership of in connection with the purchase of Gerber in 2007, and the purchase of Ralston Purina in 2001. In 2012, the entity connected to Gerber was disposed; the remaining balance of $16,214 represents the entity connected to Ralston Purina. As of December 31, 2012, the Company was actively engaged in and progressing with the sale, transfer, or liquidation of the remaining subsidiary and expects its disposition or liquidation will be completed in 2013.
In 2012, the Houston distribution center for Dreyer’s was sold, which comprised the total buildings assets held for sale balance for 2011.

NESTLÉ HOLDINGS, INC. AND SUBSIDIARIES
Notes to Consolidated Financial Statements
December 31, 2012 and 2011
(Dollars in thousands)
65 (Continued)
(16) Accruals
Accruals are as follows:
2012 2011
Accrued payroll $ 410,413 510,762 Accrued trade spend and promotional expenses 425,754 398,117 Accrued life insurance policy reserves 163,274 157,057 Accrued interest 68,968 56,015 Accrued defined contribution expense (note 8) 33,348 39,828 Other accrued expenses 258,371 296,502
Total accruals $ 1,360,128 1,458,281
(17) Provisions and Contingent Liabilities
Provisions are as follows:
Restructuring Environmental Other Total
December 31, 2011 $ 104,529 17,902 72,725 195,156 Provisions made in the year 18,846 74 50,965 69,885 Amounts used (43,919) (1,433) (16,881) (62,2Unused amounts reversed (31,899)
33) — (2,484) (34,383)
Unwind of discount 215 181 1,110 1,506
December 31, 2012 $ 47,772 16,724 105,435 169,931
of which due within 12 months $ 47,427 4,181 51,590 103,198
Restructuring
Restructuring provisions arise from a number of projects. These include plans to optimize production, sales, and administration structures. Restructuring provisions are expected to result in future cash outflows when implementing the plans (usually over the following two to three years).
During 2012, the Company completed a reorganization of certain divisions within the Brands segment to reduce marketing, general and administrative expenses. As part of this effort, a restructuring provision of $10,925 was recorded. Additionally, the Ice Cream business within the Brands segment recorded a restructuring provision of $3,300 to integrate into the finance organization. This allowed the Company to gain synergies across the organization as well as reduce costs. The Company reversed $18,400, recorded in 2010, as a provision for the reorganization of its Direct Store Delivery division. In addition, the PetCare segment of the business reversed $8,000 for several projects no longer needed.

NESTLÉ HOLDINGS, INC. AND SUBSIDIARIES
Notes to Consolidated Financial Statements
December 31, 2012 and 2011
(Dollars in thousands)
66 (Continued)
Environmental
Situations where the Company is found liable for remediation or cleanup efforts by the U.S. environmental Protection Agency (“EPA”) or other governmental agencies on specific sites represent known liabilities. In these instances, it is the Company’s policy to accrue for environmental cleanup costs when they are assessed. As assessments and cleanups proceed, these liabilities are reviewed and adjusted as additional information becomes available regarding the nature and extent of contamination, methods of remediation required, other actions by governmental agencies or private parties, and the amount, if any, of available coverage by the Company’s insurance carriers.
Other Provisions
In 2012, the Company recorded provisions mainly concerning non-cancelable leases, service agreements and litigation.
Contingencies
(a) Litigation
The Company is exposed to a number of asserted claims and unasserted potential claims encountered in the normal course of business. In the opinion of Company management, the resolution of these matters will not have a material impact on the Company’s consolidated financial position.
(b) Exposure for Environmental Matters
The Company has contingent liabilities related to environmental matters where the Company has received “Notices of Potential Liability” from, or has been identified as a “Potentially Responsible Party” by, the EPA or other government agencies regarding the alleged disposal of hazardous material at various sites around the country that allegedly require environmental cleanup.
These proceedings are being vigorously defended or resolutions are being negotiated. Although the outcome of these proceedings is unknown, Company management does not believe that any resulting liability would be material to the consolidated financial position of the Company.
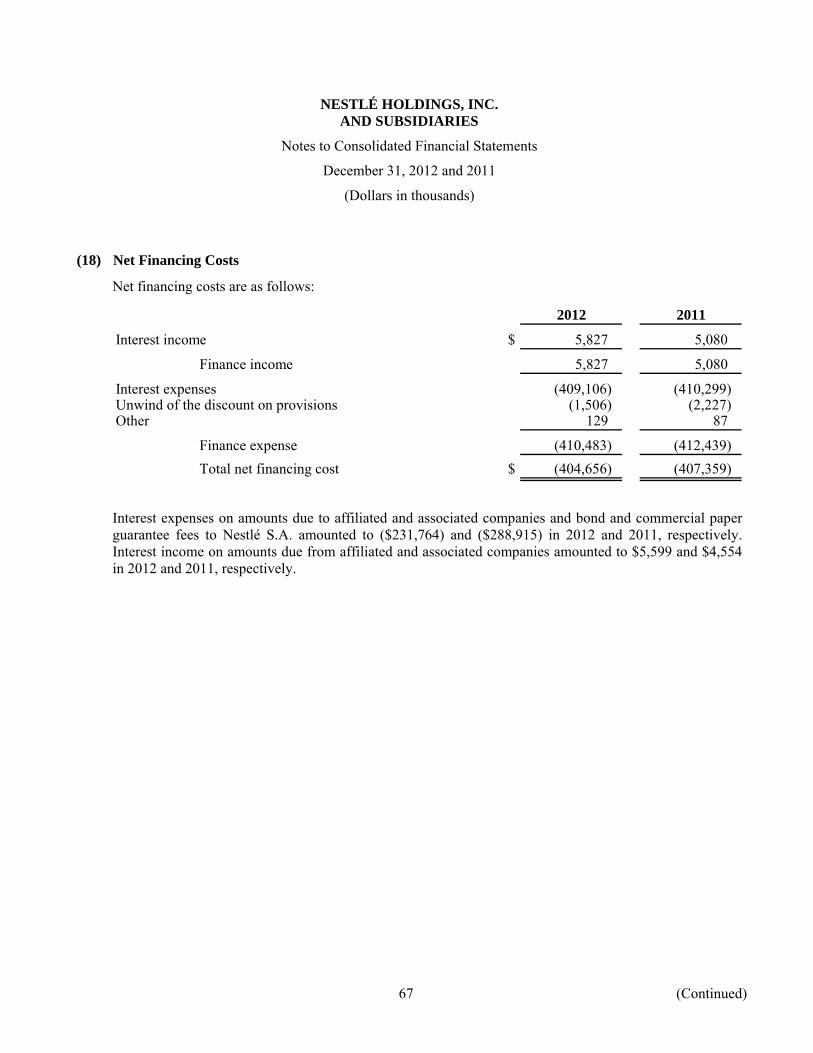
NESTLÉ HOLDINGS, INC. AND SUBSIDIARIES
Notes to Consolidated Financial Statements
December 31, 2012 and 2011
(Dollars in thousands)
67 (Continued)
(18) Net Financing Costs
Net financing costs are as follows:
2012 2011
Interest income $ 5,827 5,080
Finance income 5,827 5,080
Interest expenses (409,106) (410,299) Unwind of the discount on provisions (1,506) (2,227) Other 129 87
Finance expense (410,483) (412,439) Total net financing cost $ (404,656) (407,359)
Interest expenses on amounts due to affiliated and associated companies and bond and commercial paper guarantee fees to Nestlé S.A. amounted to ($231,764) and ($288,915) in 2012 and 2011, respectively. Interest income on amounts due from affiliated and associated companies amounted to $5,599 and $4,554 in 2012 and 2011, respectively.

NESTLÉ HOLDINGS, INC. AND SUBSIDIARIES
Notes to Consolidated Financial Statements
December 31, 2012 and 2011
(Dollars in thousands)
68 (Continued)
(19) Net Other Trading and Operating Expenses
Net other trading expense is as follows:
2012 2011
Return on company-owned life insurance $ 58,605 17,125 Reversal of restructuring 37,076 — Franchise and royalty income 16,660 17,463 Litigation settlement 1,800 — Profit on disposal of property, plant and equipment — 11 Product recalls — 2,034 Miscellaneous trading income 2,091 1,276
Other trading income 116,232 37,909
Losses (or cost) on deferred compensation (47,663) (5,197) Litigations and onerous contracts (37,086) (34,408) Product recall (23,000) — Restructuring expense (16,146) (11,161) Impairment of assets other than goodwill (7,146) (21,824) Infant formula packaging returns — (189) Miscellaneous trading expenses (1,537) (2,169)
Other trading expenses (132,578) (74,948) Net other trading expenses $ (16,346) (37,039)
Net other operating expense is as follows:
2012 2011
Dividend income $ 5,790 5,549 Gain on business divestitures 116 53 Miscellaneous operating income — 453
Other operating income 5,906 6,055
Natural disaster (6,409) (2,116) Other operating litigations (2,391) (3,761) Acquisition related costs (649) (3,309) Miscellaneous operating expenses (9,166) (14,980)
Other operating expenses (18,615) (24,166) Net other operating expenses $ (12,709) (18,111)

NESTLÉ HOLDINGS, INC. AND SUBSIDIARIES
Notes to Consolidated Financial Statements
December 31, 2012 and 2011
(Dollars in thousands)
69 (Continued)
(20) Income Tax Expense
The components of income tax (expense) from continuing operations are as follows:
2012 2011
Current tax $ (352,987) (177,702) Deferred tax (216,874) (252,597) Taxes recorded to other comprehensive loss (50,485) (221,335)
Income tax expense $ (620,346) (651,634)
The components of deferred tax (expense) benefit by type are as follows:
2012 2011
Tangible fixed assets $ (63,339) (112,930) Goodwill and other intangible assets (123,651) (136,123) Employee benefits 41,586 (3,454) Inventories, receivables, payables, accruals, and provisions 14,282 (7,020) Financial instruments (55,799) 82,374 Net operating losses — (45,738) Other (29,953) (29,706)
Deferred tax expense $ (216,874) (252,597)
Taxes recognized in other comprehensive loss:
2012 2011
Tax effect relating to:Fair value adjustments on cash flow hedges $ 16,551 (121,387) Fair value of available-for-sale assets 25,367 33,299 Defined benefit plan actuarial gains (92,403) (133,247)
Total taxes recognized $ (50,485) (221,335)

NESTLÉ HOLDINGS, INC. AND SUBSIDIARIES
Notes to Consolidated Financial Statements
December 31, 2012 and 2011
(Dollars in thousands)
70 (Continued)
Reconciliation of income from continuing operations before income taxes multiplied by the applicable tax rate to income tax (expense) is as follows:
2012 2011
Tax at theoretical rate $ (925,411) (887,271) Tax effect on non-deductible impairment and amortization
of goodwill and other intangible assets (116) (139) Permanent differences on company-owned life insurance
policies 30,037 14,152 Tax effect of non-deductible or non-taxable items 47,132 23,851 Prior years’ taxes 231,022 220,465 Transfers to unrecognized deferred tax assets — (21,690) Other taxes (3,010) (1,002)
Income tax expense $ (620,346) (651,634)
Effective tax rate 26% 28%
(21) Lease Commitments
The Company is obligated under various operating and finance leases primarily for buildings, distribution facilities, equipment, railroad, and agricultural properties as follows:
(a) Operating Leases
Futurevalue
Within one year $ 130,791 In the second year 111,506 In the third to fifth year inclusive 185,352 After the fifth year 76,877
Total operating leases $ 504,526
The Company recognized rent expense of $164,017 and $147,119 in 2012 and 2011, respectively, in the consolidated income statement. This expense was offset by sublease income of $6,317 and $5,460 in 2012 and 2011, respectively. Sublease payments of $2,205 are expected to be received in future years.
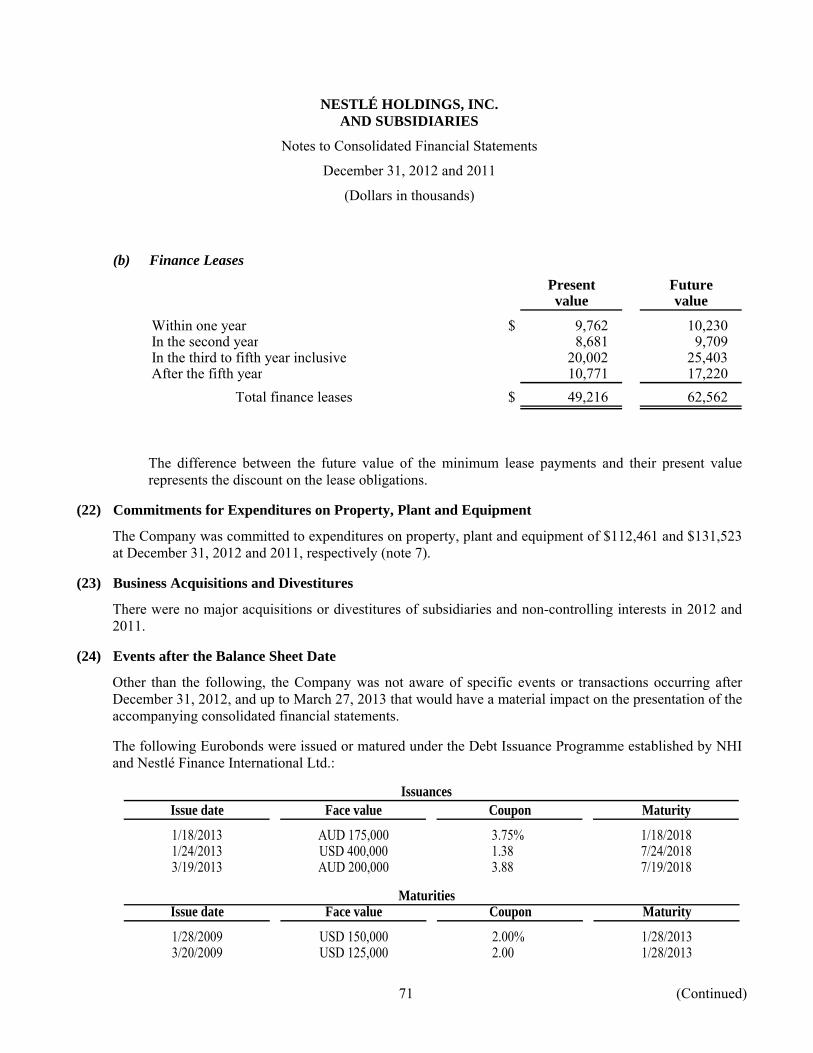
NESTLÉ HOLDINGS, INC. AND SUBSIDIARIES
Notes to Consolidated Financial Statements
December 31, 2012 and 2011
(Dollars in thousands)
71 (Continued)
(b) Finance Leases
Present Futurevalue value
Within one year $ 9,762 10,230 In the second year 8,681 9,709 In the third to fifth year inclusive 20,002 25,403 After the fifth year 10,771 17,220
Total finance leases $ 49,216 62,562
The difference between the future value of the minimum lease payments and their present value represents the discount on the lease obligations.
(22) Commitments for Expenditures on Property, Plant and Equipment
The Company was committed to expenditures on property, plant and equipment of $112,461 and $131,523 at December 31, 2012 and 2011, respectively (note 7).
(23) Business Acquisitions and Divestitures
There were no major acquisitions or divestitures of subsidiaries and non-controlling interests in 2012 and 2011.
(24) Events after the Balance Sheet Date
Other than the following, the Company was not aware of specific events or transactions occurring after December 31, 2012, and up to March 27, 2013 that would have a material impact on the presentation of the accompanying consolidated financial statements.
The following Eurobonds were issued or matured under the Debt Issuance Programme established by NHI and Nestlé Finance International Ltd.:
IssuancesIssue date Face value Coupon Maturity
1/18/2013 AUD 175,000 3.75% 1/18/20181/24/2013 USD 400,000 1.38 7/24/20183/19/2013 AUD 200,000 3.88 7/19/2018
MaturitiesIssue date Face value Coupon Maturity
1/28/2009 USD 150,000 2.00% 1/28/20133/20/2009 USD 125,000 2.00 1/28/2013

NESTLÉ HOLDINGS, INC. AND SUBSIDIARIES
Notes to Consolidated Financial Statements
December 31, 2012 and 2011
(Dollars in thousands)
72 (Continued)
(25) Transactions with Related Parties
Compensation of Key Company Management Personnel
Key Company management personnel comprise five high-ranking officers in each of the following subsidiaries: Nestlé USA, Inc., Nestlé Purina PetCare Company, and Gerber Products Company. These officers hold the positions of Chief Executive Officer, Chief Financial Officer, Head of Human Resources, General Counsel, and Head of Sales or Sales/Marketing. The Chief Executive Officer and the Chief Financial Officer of Nestlé USA, Inc. are directors of NHI. There are no non-executive directors.
The compensation paid or payable to key Company management for employee services is shown below:
2012 2011
Salaries and other short-term employee benefits $ 29,104 25,365 Share-based payments 4,755 2,356 Post-employment benefits 1,371 1,365
Total compensation $ 35,230 29,086

NESTLÉ HOLDINGS, INC. AND SUBSIDIARIES
Notes to Consolidated Financial Statements
December 31, 2012 and 2011
(Dollars in thousands)
73
Loans with Related Parties
2012 2011
Loans from Nestlé S.A.:At January 1 $ 7,700,018 8,250,000 Loans received during year 2,905,000 3,100,000 Accrued interest 366 18 Loan repayments (5,055,000) (3,650,000) Debt assumed by parent (a) (3,700,000) —
At December 31 $ 1,850,384 7,700,018
Loans from affiliates:At January 1 $ 300,013 300,000 Loans received during year 26,270 300,000 Accrued interest — 13 Loan repayments — (300,000)
At December 31 $ 326,283 300,013
Loans to affiliates:At January 1 $ 1,214,049 505,580 Loans granted during year 28,110 725,653 Loan repayments (497,611) (17,184)
At December 31 $ 744,548 1,214,049
The above loans with related parties are in the trade and other receivables and non-current financial liabilities balances of the consolidated balance sheet. (a) During 2012, Nestlé S.A. reorganized the ownership structure of its directly owned US subsidiaries. As
part of this reorganization, $3.7 billion of the Company’s related party debt was assigned and assumed by its new parent, NIMCO US, Inc.