nested graphs: a model to efficiently distribute multi
TRANSCRIPT
HAL Id: hal-02182826https://hal.archives-ouvertes.fr/hal-02182826
Submitted on 13 Jul 2019
HAL is a multi-disciplinary open accessarchive for the deposit and dissemination of sci-entific research documents, whether they are pub-lished or not. The documents may come fromteaching and research institutions in France orabroad, or from public or private research centers.
L’archive ouverte pluridisciplinaire HAL, estdestinée au dépôt et à la diffusion de documentsscientifiques de niveau recherche, publiés ou non,émanant des établissements d’enseignement et derecherche français ou étrangers, des laboratoirespublics ou privés.
Nested graphs: A model to efficiently distributemulti-agent systems on HPC clusters
Alban Rousset, Bénédicte Herrmann, Christophe Lang, Laurent Philippe,Hadrien Bride
To cite this version:Alban Rousset, Bénédicte Herrmann, Christophe Lang, Laurent Philippe, Hadrien Bride. Nestedgraphs: A model to efficiently distribute multi-agent systems on HPC clusters. Concurrency andComputation: Practice and Experience, Wiley, 2018, 30 (7), pp.e4407 (24). hal-02182826
Nested Graphs: a model to efficiently distribute multi-agent
systems on HPC clusters
Alban ROUSSET, Benedicte HERRMANN, Christophe LANG,Laurent PHILIPPE, Hadrien BRIDE
email: [email protected]
Femto-ST Institute, Univ. Bourgogne Franche-Comte/CNRS Besancon - France2017
Abstract
Computational simulation is becoming increasingly important in numerous research fields.Depending on the modeled system, several methods such as differential equations or Monte-Carlo simulations may be used to represent the system behavior. The amount of computationand memory needed to run a simulation depends on its size and precision and large simulationsusually lead to long runs thus requiring to adapt the model to a parallel system. Complexsystems are often simulated using Multi-agent systems (MAS). While linear system basedmodels benefit from a large set of tools to take advantage of parallel resources, multi-agentsystems suffer from a lack of platforms that ease the use of such resources. In this paper,we propose the use of Nested Graphs for a new modeling approach that allows the designof large, complex and multi-scale multi-agent models which can efficiently be distributedon parallel resources. Nested Graphs are formally defined and are illustrated on the well-known predator-prey model. We also introduce PDMAS (Parallel and Distributed Multi-Agent System) a platform that implements the Nested Graph modeling approach to ease thedistribution of multi-agent models on High Performance Computing clusters. Performanceresults are presented to validate the efficiency of the resulting models.
keywords
Multi-Agent Simulation, Parallel, Nested Graph, High Performance Computing
1 Introduction
Computational simulation is becoming increasingly important in numerous research fields likepsychology [7] or biology [30] but even in fields that do not traditionally use computational modelssuch as archaeology and anthropology. Depending on the characteristics of the modeled system,several methods such as differential equations or Monte-Carlo simulations may be used to representthe system behavior. Multi-agent systems (MAS) are often used to model and simulate complexsystems. In such systems the complexity of the dependencies between the phenomena that drivethe entities behavior makes it difficult to define a global law that models the entire system. Basedon a simple algorithmic description of individual behaviors, multi-agent systems provide a supportto observe global developments emerging from a set of interacting agents. Recently, the interestfor parallel multi-agent platforms has increased as parallel platforms offer more resources to runlarger agent simulations and thus allow to obtain results previously intractable using a smallernumber of agents (e.g. simulation of individual motions in a city/urban mobility).
Whatever the modeling approach used, increasing the size and the precision of a model increasesthe amount of computation and the size of memory used. More computing resources are thusneeded and centralized systems are often no longer sufficient to run these simulations, requiring theuse of parallel systems to avoid too long runs and to provide enough memory. While linear systems
1
based models benefit from a large set of parallel libraries to take advantage of many computingnodes and run large simulations, multi-agent systems suffer from a lack of platforms that easethe use of parallel systems. From the viewpoint of increasing the size or accuracy of simulations,multi-agent systems are constrained to the same rules as other modeling techniques. Only somesimple models may benefit from the approach used to parallelize linear systems and there is fewgeneric approaches available to efficiently run more general agent models on parallel machines suchas clusters. Due to less regular interactions and more dynamic behaviors of agents compared tolinear systems, parallelizing an agent-based model is usually difficult. The parallelization difficulty,however, depends on the modeling technique and the associated data structures. So we can raisethe question: do traditional ways to model MAS fit the parallelization step? Our aim is thento propose a simple way to model Parallel and Distributed Multi-Agent Systems (PDMAS) in amanner that allows them to be efficiently distributed and executed on parallel systems.
The contribution of this paper is to propose the use of Nested Graphs (NG) [28, 34] as adata structure to represent agent models and parallelize them more easily. We show that thisdata structure provides an elegant and efficient solution to distribute and parallelize simulationsat different levels. To demonstrate and validate the advantages of using Nested Graph datastructures we have implemented several models and assessed their performance on HPC resources.This paper extends and develops the results of a previous paper [34] mainly with more explanationson the modeling approach and experiment results, including a new model.
This article is organized as follows. In section 2, we give an overview and related work on theMulti-Agents Systems (MAS) and the Parallel and Distributed Multi-Agent platforms (PDMAS)context before identifying the limits regarding distribution in existing platforms. In section 3, wepresent our proposal of using Nested Graphs (NG) to model MAS, we illustrate its use on thewell-known prey-predator model in section 4 and we explain the advantages of using NG structuresto distribute a model in section 5. We present some execution results of our method in section 6.Finally, we present our conclusion and future work.
2 Context and related work
The concept of agent has been studied extensively for several years and in different domains. Oneof the first definitions of the agent concept is due to Ferber [17] :
“An agent is a real or virtual autonomous entity, operating in a environment, ableto perceive and act on it, which can communicate with other agents, which exhibitsan independent behavior, which can be seen as the consequence of his knowledge, itsinteractions with other agents and goals it needs to achieve”.
A multi-agent system, or MAS, is a platform which provides support to run simulations basedon several autonomous agents. These platforms implement functions that provide services suchas agent lifecycle management, communication between agents, agent perception or environmentmanagement. Among the most known platforms we can cite NetLogo [36], MadKit [19], Ma-son [26] and Gama [35]. There exist several papers that propose a survey on these multi-agentplatforms [37, 5, 2, 21]. These platforms are designed to run on only one computer and they do notnatively implement a support to run models in parallel. For large models, the memory space andcomputation power of only one computer are sometimes no longer sufficient to run the model. Forexample, this is the case if we want to simulate the individual behavior of urban mobility [10] in alarge city. Increasing the size or the precision of models could, however, bring emergent behaviorsthat we never expected or would never seen otherwise. Using parallel systems is a way to overcomethese limits in terms of computation power and memory space.
Possible approaches to distribute or parallelize a simulation include the development of adedicated model as in [38] or the implementation of a wrapper over an existing platform [3].These approaches are however complex as they require parallel programming skills while mostof multi-agent models are developed by non-specialist programmers. Parallel and DistributedMulti-Agent Platforms (PDMAS) exist that facilitate the implementation of parallel models. We
2
can cite RepastHPC [12], D-Mason [14], Pandora [1] and Flame [11]. All these platforms providea native support for parallel execution of Multi-Agent models but also important mechanismsof distribution, migration and load balancing for the simulation run. In [33] we survey existingPDMAS and compare them with a qualitative analysis and a performance evaluation.
Different types of platforms can be used to run parallel systems. Among them we can citeshared memory systems, Graphical Processing Units (GPU) or Many-Core processors (e.g XeonPhi) and HPC clusters. While shared memory systems are easier to program and benefit fromefficient tools (e.g. OpenMP) they usually provide a limited number of cores and memory spacewhich limits simulation scalability. GPU cards and Many-Core processors are known for theirefficiency on regular problems and have already been used for multi-agent simulations [25]. Theyhowever require specific development skills and their SIMD programming model only fits simpleagent behaviors with as little as possible conditions. For these reasons we concentrate our workon HPC clusters.
Several key points must, however, be enforced for an efficient parallel execution of a multi-agentsimulation on a HPC cluster: load balancing, agent migration, communication between agents andcoherency in agent vision to cite some of them. We highlight in the following the issues raised bythese key points
The load, between the processors which participate to the execution, must to be as balancedas possible in order to minimize the time spent by a processor waiting for the others. Multi-agent simulations are indeed synchronous simulations that are driven by time steps. To maintainthe overall consistency of the simulation, all the processors must run in the same time step andsynchronization barriers are necessary at the end of each time step. At each synchronizationbarrier, the processors wait until the overall synchronization is performed. In parallel multi-agentsimulations, the set of agents is distributed among the processors, each running at its own speed.Running one-time step may thus take more or less time depending on the number of agentsassigned to a processor and of the speed of this processor. Hence the simulation step is boundedby the slowest processor involved in the simulation and the load of the processors must then beas uniform as possible all along the simulation to be more efficient and improve running timeperformance. Note that balancing time steps is not specific to multi agent simulations but is alsoneeded for instance in synchronous iterative resolutions in linear algebra.
As previously stated, agents operate in an environment. Parallelizing a multi-agent simulationthus not only implies to distribute the agents but also the environment. In numerous multi-agentsimulations, agents are situated and mobile: they have a position in the environment and theycan move on the environment. When the environment is distributed among computing nodes,agents must be able to migrate between environment parts. Agent migration may impact bothload balancing and communication between agents. Migration may interfere with load balancingas agent migrations may generate imbalances. When an agent migrates, the system must followthe agent places in order to deliver messages [32].
Agents are able to perceive and to act on their environment. The perception field of anagent is usually limited to its neighborhood. In parallel simulations, due to the environmentdistribution, different parts of the simulation are run on several processors so that the perceptionfield of an agent could be cut between different nodes, i.e. parts of the perception field aremapped on different nodes. This can be managed, by hand, in the model implementation butits leads to complex algorithmic developments. For this reason, PDMAS usually tackle this issueby providing parallelized structures. These structures provide overlapping areas, parts of theenviornment situated on the distribution borders are replicated on the neighbor nodes, to limitcommunications when an agent accesses the remote parts of its perception field.
Currently, the most used structure for environments in PDMAS is the grid. Grids are agood base to represent a two-dimensional environment on which agents can move and evolve. Todistribute the model, most platforms use a Cartesian decomposition of the grid as presented onFigure 1.
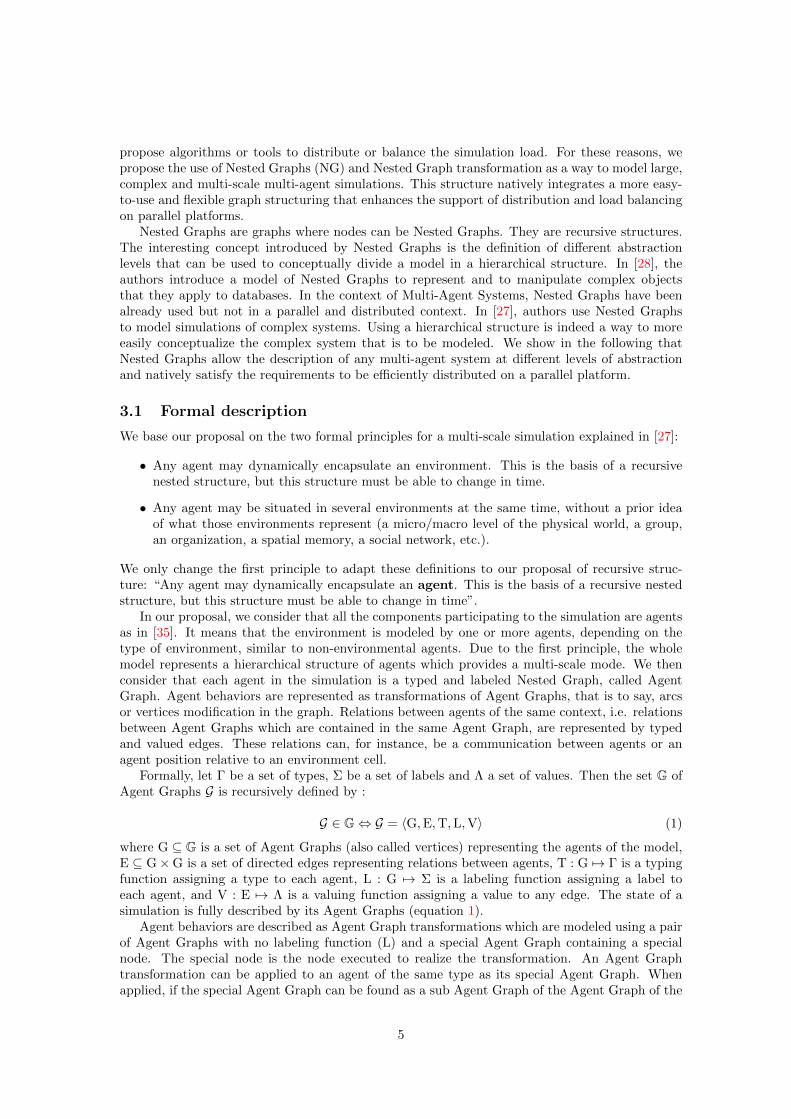
The Cartesian decomposition allows the distribution on one axis x or on two axes x and y asshown in Figures 2, 3. The problem is, even with a fine grain division of the grid as it is done inthe D-MASON platform [6], the decomposition structure may not be flexible enough to correctly
3
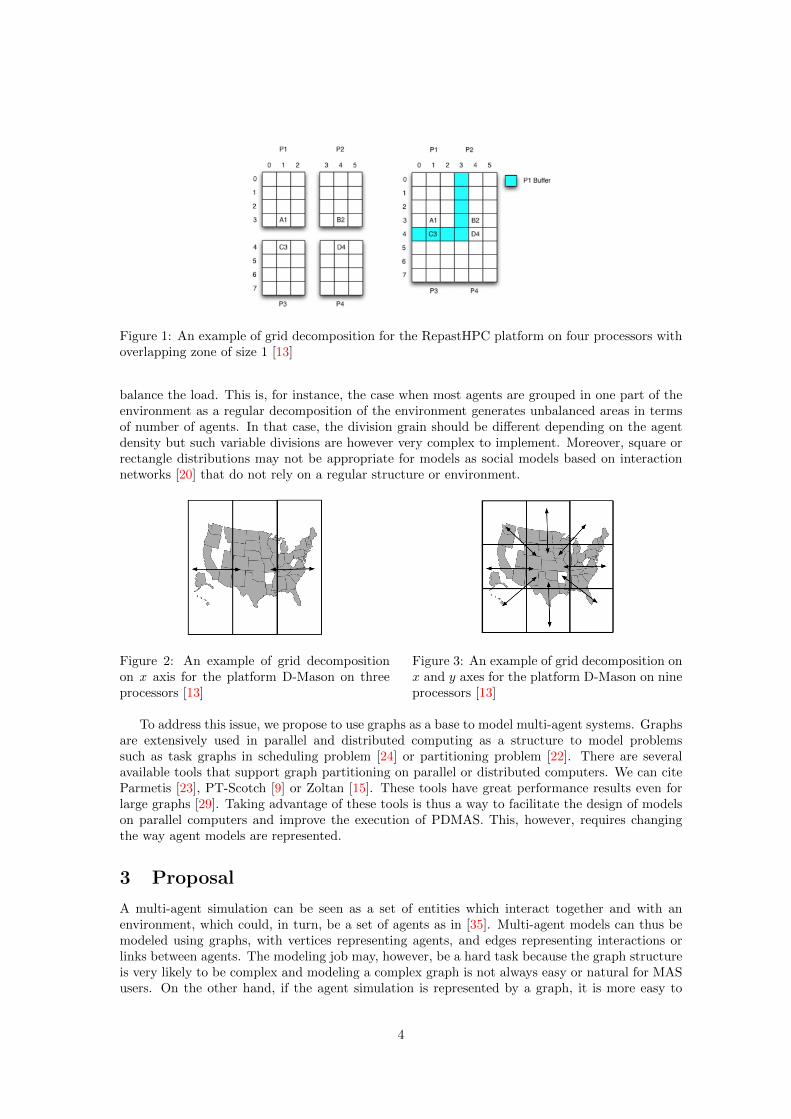
Figure 1: An example of grid decomposition for the RepastHPC platform on four processors withoverlapping zone of size 1 [13]
balance the load. This is, for instance, the case when most agents are grouped in one part of theenvironment as a regular decomposition of the environment generates unbalanced areas in termsof number of agents. In that case, the division grain should be different depending on the agentdensity but such variable divisions are however very complex to implement. Moreover, square orrectangle distributions may not be appropriate for models as social models based on interactionnetworks [20] that do not rely on a regular structure or environment.
Figure 2: An example of grid decompositionon x axis for the platform D-Mason on threeprocessors [13]
Figure 3: An example of grid decomposition onx and y axes for the platform D-Mason on nineprocessors [13]
To address this issue, we propose to use graphs as a base to model multi-agent systems. Graphsare extensively used in parallel and distributed computing as a structure to model problemssuch as task graphs in scheduling problem [24] or partitioning problem [22]. There are severalavailable tools that support graph partitioning on parallel or distributed computers. We can citeParmetis [23], PT-Scotch [9] or Zoltan [15]. These tools have great performance results even forlarge graphs [29]. Taking advantage of these tools is thus a way to facilitate the design of modelson parallel computers and improve the execution of PDMAS. This, however, requires changingthe way agent models are represented.
3 Proposal
A multi-agent simulation can be seen as a set of entities which interact together and with anenvironment, which could, in turn, be a set of agents as in [35]. Multi-agent models can thus bemodeled using graphs, with vertices representing agents, and edges representing interactions orlinks between agents. The modeling job may, however, be a hard task because the graph structureis very likely to be complex and modeling a complex graph is not always easy or natural for MASusers. On the other hand, if the agent simulation is represented by a graph, it is more easy to
4
propose algorithms or tools to distribute or balance the simulation load. For these reasons, wepropose the use of Nested Graphs (NG) and Nested Graph transformation as a way to model large,complex and multi-scale multi-agent simulations. This structure natively integrates a more easy-to-use and flexible graph structuring that enhances the support of distribution and load balancingon parallel platforms.
Nested Graphs are graphs where nodes can be Nested Graphs. They are recursive structures.The interesting concept introduced by Nested Graphs is the definition of different abstractionlevels that can be used to conceptually divide a model in a hierarchical structure. In [28], theauthors introduce a model of Nested Graphs to represent and to manipulate complex objectsthat they apply to databases. In the context of Multi-Agent Systems, Nested Graphs have beenalready used but not in a parallel and distributed context. In [27], authors use Nested Graphsto model simulations of complex systems. Using a hierarchical structure is indeed a way to moreeasily conceptualize the complex system that is to be modeled. We show in the following thatNested Graphs allow the description of any multi-agent system at different levels of abstractionand natively satisfy the requirements to be efficiently distributed on a parallel platform.
3.1 Formal description
We base our proposal on the two formal principles for a multi-scale simulation explained in [27]:
• Any agent may dynamically encapsulate an environment. This is the basis of a recursivenested structure, but this structure must be able to change in time.
• Any agent may be situated in several environments at the same time, without a prior ideaof what those environments represent (a micro/macro level of the physical world, a group,an organization, a spatial memory, a social network, etc.).
We only change the first principle to adapt these definitions to our proposal of recursive struc-ture: “Any agent may dynamically encapsulate an agent. This is the basis of a recursive nestedstructure, but this structure must be able to change in time”.
In our proposal, we consider that all the components participating to the simulation are agentsas in [35]. It means that the environment is modeled by one or more agents, depending on thetype of environment, similar to non-environmental agents. Due to the first principle, the wholemodel represents a hierarchical structure of agents which provides a multi-scale mode. We thenconsider that each agent in the simulation is a typed and labeled Nested Graph, called AgentGraph. Agent behaviors are represented as transformations of Agent Graphs, that is to say, arcsor vertices modification in the graph. Relations between agents of the same context, i.e. relationsbetween Agent Graphs which are contained in the same Agent Graph, are represented by typedand valued edges. These relations can, for instance, be a communication between agents or anagent position relative to an environment cell.
Formally, let Γ be a set of types, Σ be a set of labels and Λ a set of values. Then the set G ofAgent Graphs G is recursively defined by :
G ∈ G⇔ G = 〈G,E,T,L,V〉 (1)
where G ⊆ G is a set of Agent Graphs (also called vertices) representing the agents of the model,E ⊆ G×G is a set of directed edges representing relations between agents, T : G 7→ Γ is a typingfunction assigning a type to each agent, L : G 7→ Σ is a labeling function assigning a label toeach agent, and V : E 7→ Λ is a valuing function assigning a value to any edge. The state of asimulation is fully described by its Agent Graphs (equation 1).
Agent behaviors are described as Agent Graph transformations which are modeled using a pairof Agent Graphs with no labeling function (L) and a special Agent Graph containing a specialnode. The special node is the node executed to realize the transformation. An Agent Graphtransformation can be applied to an agent of the same type as its special Agent Graph. Whenapplied, if the special Agent Graph can be found as a sub Agent Graph of the Agent Graph of the
5

simulation, then the found sub Agent Graph is transformed into the second Agent Graph. Thespecial Agent Graph of the Agent Graph transformation can be seen as a pattern which have to berecognized before being transformed into the second Agent Graph. In another word, we can see anAgent Graph transformation as a conditional structure (if [we have this configuration] then [weneed to arrived to this configuration] end) so that the expected behavior can be performed. Whena type of agent has multiple behaviors, its Agent Graph transformations are applied according toa defined workflow as usually in multi-agent system simulations.
Based on these definitions, our proposal relies on on two main points:
• A modeling method where multi-agent systems are modeled using Agent Graphs. In thismethod, all elements of the multi-agent model are agents without difference between envi-ronment and agents. Agents and their relations are represented by Agent Graphs. Agentbehaviors are implemented based on Agent Graph transformations.
• An adapted PDMAS using Agent Graphs models is used to efficiently run the simulation onparallel platforms (see Section 5).
With this method, complex systems and complex behaviors can be modeled in a graphical waywhile providing a fully formal basis similar to Petri Nets [8]. It also encompasses multiple levelsof abstractions needed by the modelers. The proposal is illustrated in the following section.
3.2 Graphical notation
We introduce here some graphical notations. Agent Graphs nodes (Figure 4) are represented byellipses with labels of the form Label:Type (L,T) giving the label and type of the associated vertice.Edges between nodes (E) are represented by arrows with labels of the form Type:Value (T, V)giving the type and value of the associated edge.
Figure 4: Generic representation of an Agent Graphs
An Agent Graph transformation is described by two Agent Graphs linked by a large arrow asshown in Figure 5 . We denote by a bold ellipse the special node of an Agent Graph transformation.In other words, the special node represents the node concerned by the transformation and whichis executed.
4 Modeling method illustration
In this section, we illustrate the modeling method with two models the Wolf-Sheep PredationModel (WSP Model) [39] and the Virus model [40] which are classical Multi-Agent models. Wechoose these models as they include several representative patterns that can be found in numerousmodels, as mobile agents, distant interactions, concurrency between agents, etc.
4.1 Wolf-Sheep Predation Model
The environment of the Wolf-Sheep Predation Model is a grid composed of cells. It is the firstand highest level of abstraction of our representation. It is modeled using an Agent Graph in
6
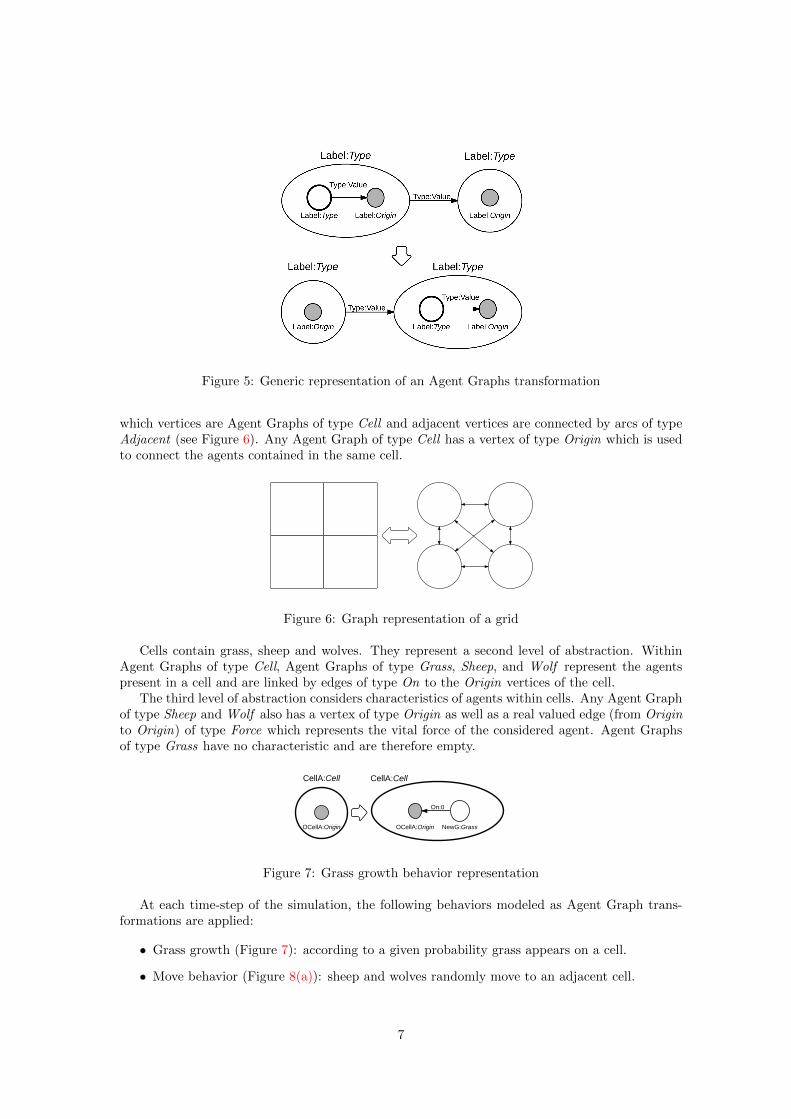
Figure 5: Generic representation of an Agent Graphs transformation
which vertices are Agent Graphs of type Cell and adjacent vertices are connected by arcs of typeAdjacent (see Figure 6). Any Agent Graph of type Cell has a vertex of type Origin which is usedto connect the agents contained in the same cell.
Figure 6: Graph representation of a grid
Cells contain grass, sheep and wolves. They represent a second level of abstraction. WithinAgent Graphs of type Cell, Agent Graphs of type Grass, Sheep, and Wolf represent the agentspresent in a cell and are linked by edges of type On to the Origin vertices of the cell.
The third level of abstraction considers characteristics of agents within cells. Any Agent Graphof type Sheep and Wolf also has a vertex of type Origin as well as a real valued edge (from Originto Origin) of type Force which represents the vital force of the considered agent. Agent Graphsof type Grass have no characteristic and are therefore empty.
CellA:Cell
OCellA:Origin
CellA:Cell
OCellA:Origin
On:0
NewG:Grass
Figure 7: Grass growth behavior representation
At each time-step of the simulation, the following behaviors modeled as Agent Graph trans-formations are applied:
• Grass growth (Figure 7): according to a given probability grass appears on a cell.
• Move behavior (Figure 8(a)): sheep and wolves randomly move to an adjacent cell.
7
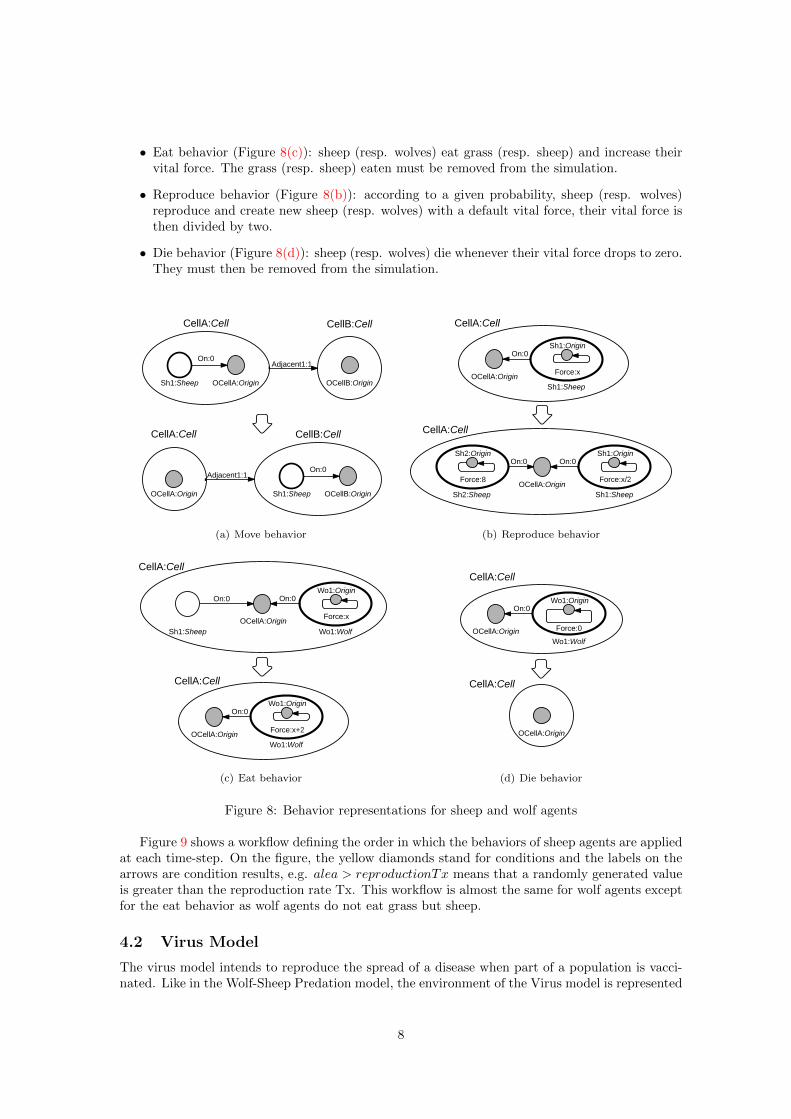
• Eat behavior (Figure 8(c)): sheep (resp. wolves) eat grass (resp. sheep) and increase theirvital force. The grass (resp. sheep) eaten must be removed from the simulation.
• Reproduce behavior (Figure 8(b)): according to a given probability, sheep (resp. wolves)reproduce and create new sheep (resp. wolves) with a default vital force, their vital force isthen divided by two.
• Die behavior (Figure 8(d)): sheep (resp. wolves) die whenever their vital force drops to zero.They must then be removed from the simulation.
CellB:CellCellA:Cell
OCellB:OriginOCellA:Origin
On:0
Sh1:Sheep
CellA:Cell CellB:Cell
OCellA:Origin OCellB:Origin
On:0
Sh1:Sheep
Adjacent1:1
Adjacent1:1
(a) Move behavior
CellA:Cell
OCellA:Origin
Sh1:Origin
Force:x
On:0
Sh1:Sheep
CellA:Cell
OCellA:Origin
Sh1:Origin
Force:x/2
On:0
Sh1:Sheep
Sh2:Origin
Force:8
Sh2:Sheep
On:0
(b) Reproduce behavior
CellA:Cell
OCellA:Origin
Wo1:Origin
Force:x+2
On:0
Wo1:Wolf
CellA:Cell
OCellA:Origin
Wo1:Origin
Force:x
On:0
Wo1:WolfSh1:Sheep
On:0
(c) Eat behavior
CellA:Cell
OCellA:Origin
CellA:Cell
OCellA:Origin
Wo1:Origin
Force:0
On:0
Wo1:Wolf
(d) Die behavior
Figure 8: Behavior representations for sheep and wolf agents
Figure 9 shows a workflow defining the order in which the behaviors of sheep agents are appliedat each time-step. On the figure, the yellow diamonds stand for conditions and the labels on thearrows are condition results, e.g. alea > reproductionTx means that a randomly generated valueis greater than the reproduction rate Tx. This workflow is almost the same for wolf agents exceptfor the eat behavior as wolf agents do not eat grass but sheep.
4.2 Virus Model
The virus model intends to reproduce the spread of a disease when part of a population is vacci-nated. Like in the Wolf-Sheep Predation model, the environment of the Virus model is represented
8

Move
Eat Grass
Reproduce
Have Grass
No
Die
Energie = 0
No
alea>reproduction Tx
No
Figure 9: Diagram state transition of a sheep agent behavior
by a grid composed of cells. In the model, the cells represent the first and highest level of abstrac-tion of the simulation. The cells contain persons which represent a second level of abstraction.Within Agent Graphs of type Cell, Agent Graphs of type Person represent the agents presentin a cell and are linked by edges of type On to the Origin vertices of the cell (for example seeFigure 10(a)).
Like in the Wolf-Sheep Predation model, the third level of abstraction considers characteristicsof agents within cells. Any Agent Graph of type Person also has a vertex of type Origin as wellas real valued edges (from Origin to Origin) of type Force (see Figure 10(b) for example) andInfected (see Figure 10(c) for example) which respectively represent the vital force and the stateof the considered agent regarding infection.
At each time-step of the simulation, the following behaviors modeled as Agent Graph trans-formations are applied:
• Move behavior (Figure 10(a)): persons randomly move to an adjacent cell.
• Infectious behavior (Figure 10(c)): according to a given probability, a contaminated personcan infect other persons in his neighborhood.
• Reproduce behavior (Figure 10(b)): according to a given probability, persons reproduce andcreate new persons.
• Die behavior (Figure 10(d)): persons die whenever their vital force drops to zero. They mustthen be removed from the simulation.
As previously described for the WSP model, Figure 11 shows a workflow which defines theorder in which the behaviors of person agents are applied at each time-step.
5 Simulation distribution using Nested Graphs
We have presented the use of Nested Graphs to model agents and agent behaviors, we now focuson the other advantage of this method: the distribution of a model on parallel or distributedplatforms. In this section we first detail the formal basis of the distribution, then we illustrate thedistribution with the WSP model and we compare the method to classical grid modeling.
5.1 Formal description
The distribution of the simulation is based on a weight assigned to each agent. Formally, thiscorresponds to the definition of a weight function W : τ → N assigning to each agent a weight.This weight function is actually defined by the modeler which assigns a weight to each type ofagent. To perform the distribution we compute a density for each vertex with respect to theweights associated with the agents it contains. The density of a Agent Graph a = 〈G,A,T,L,V〉is defined by the following density function W∗ : G 7→ N such that:
9

CellB:CellCellA:Cell
OCellB:OriginOCellA:Origin
On:0
Pers1:Person
CellA:Cell CellB:Cell
OCellA:Origin OCellB:Origin
On:0
Pers1:Person
Adjacent1:1
Adjacent1:1
(a) Move behavior
CellA:Cell
OCellA:Origin
Pers1:Origin
Force:x
On:0
Pers1:Person
CellA:Cell
OCellA:Origin
Pers1:Origin
Force:x
On:0
Pers1:Person
Pers2:Origin
Force:rand(x)
Pers2:Person
On:0
(b) Reproduce behavior
CellA:Cell
OCellA:Origin
Pers1:Origin
Infected
On:0
Pers1:Person
Pers2:Origin
Infected
Pers2:Person
On:0
CellA:Cell
OCellA:Origin
Pers1:Origin
Infected
On:0
Pers1:Person
Pers2:Origin
Pers2:Person
On:0
(c) Infectious behavior
CellA:Cell
OCellA:Origin
CellA:Cell
OCellA:Origin
Pers1:Origin
Force:0
On:0
Pers1:Person
(d) Die behavior
Figure 10: Diagram state transition of a person agent behavior in the virus model
Move Is Infected
Infectious
Reproduce
YesNo
Die
Energie = 0
No
alea>reproduction Tx
No
Figure 11: Behavior representation of a person agent behavior in the virus model
W∗(a) = Σn∈GW∗(n) +W(a) (2)
This is illustrated in the WSP model where there are three levels of abstraction as shownin Figure 12. The higher level of abstraction represents the parts of the simulation which areexecuted on each processor. This level of abstraction is necessary to support the distribution of
10
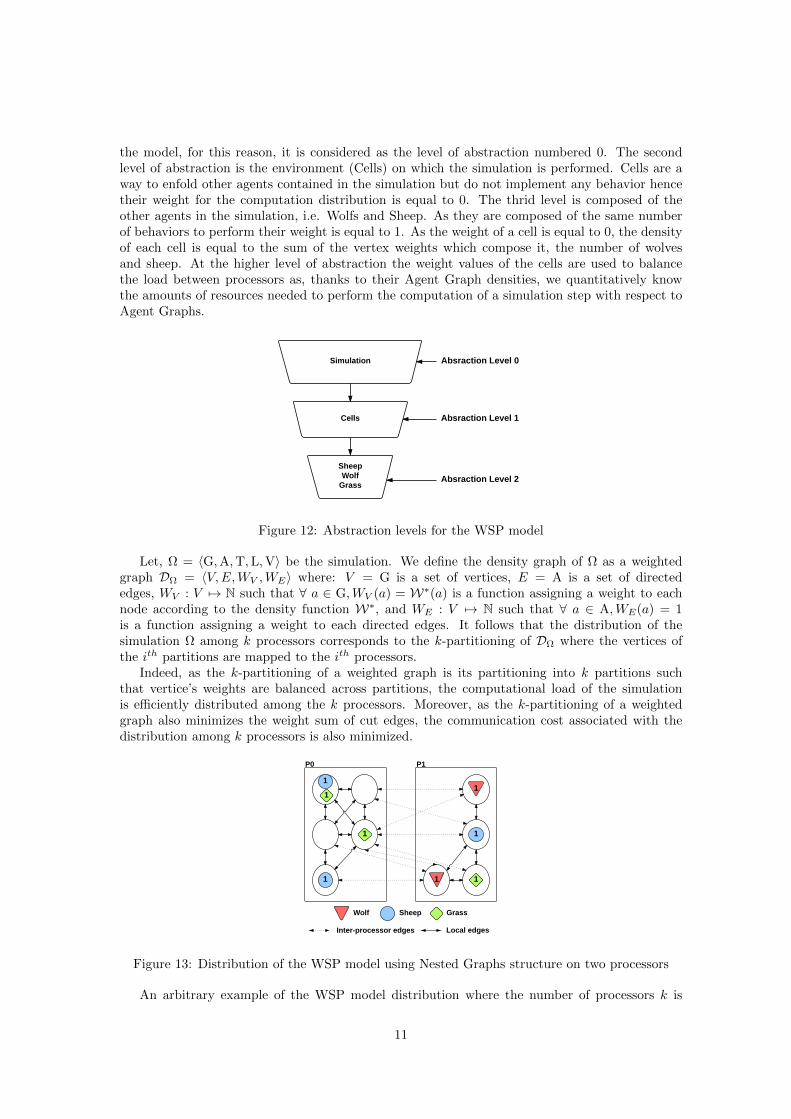
the model, for this reason, it is considered as the level of abstraction numbered 0. The secondlevel of abstraction is the environment (Cells) on which the simulation is performed. Cells are away to enfold other agents contained in the simulation but do not implement any behavior hencetheir weight for the computation distribution is equal to 0. The thrid level is composed of theother agents in the simulation, i.e. Wolfs and Sheep. As they are composed of the same numberof behaviors to perform their weight is equal to 1. As the weight of a cell is equal to 0, the densityof each cell is equal to the sum of the vertex weights which compose it, the number of wolvesand sheep. At the higher level of abstraction the weight values of the cells are used to balancethe load between processors as, thanks to their Agent Graph densities, we quantitatively knowthe amounts of resources needed to perform the computation of a simulation step with respect toAgent Graphs.
Simulation
Cells
Sheep Wolf
Grass
Absraction Level 0
Absraction Level 1
Absraction Level 2
Figure 12: Abstraction levels for the WSP model
Let, Ω = 〈G,A,T,L,V〉 be the simulation. We define the density graph of Ω as a weightedgraph DΩ = 〈V,E,WV ,WE〉 where: V = G is a set of vertices, E = A is a set of directededges, WV : V 7→ N such that ∀ a ∈ G,WV (a) = W∗(a) is a function assigning a weight to eachnode according to the density function W∗, and WE : V 7→ N such that ∀ a ∈ A,WE(a) = 1is a function assigning a weight to each directed edges. It follows that the distribution of thesimulation Ω among k processors corresponds to the k-partitioning of DΩ where the vertices ofthe ith partitions are mapped to the ith processors.
Indeed, as the k-partitioning of a weighted graph is its partitioning into k partitions suchthat vertice’s weights are balanced across partitions, the computational load of the simulationis efficiently distributed among the k processors. Moreover, as the k-partitioning of a weightedgraph also minimizes the weight sum of cut edges, the communication cost associated with thedistribution among k processors is also minimized.
Wolf Sheep Grass
Inter-processor edges Local edges
P0 P1
1
1
1
1 1
1
1
1
Figure 13: Distribution of the WSP model using Nested Graphs structure on two processors
An arbitrary example of the WSP model distribution where the number of processors k is
11
equal to 2 is presented in Figure 13.
5.2 Distribution illustration
Wolf Sheep Grass
(a) Grid based structure
Wolf Sheep Grass
(b) Nested Graph based structure
Figure 14: Initial configurations of the WSP model
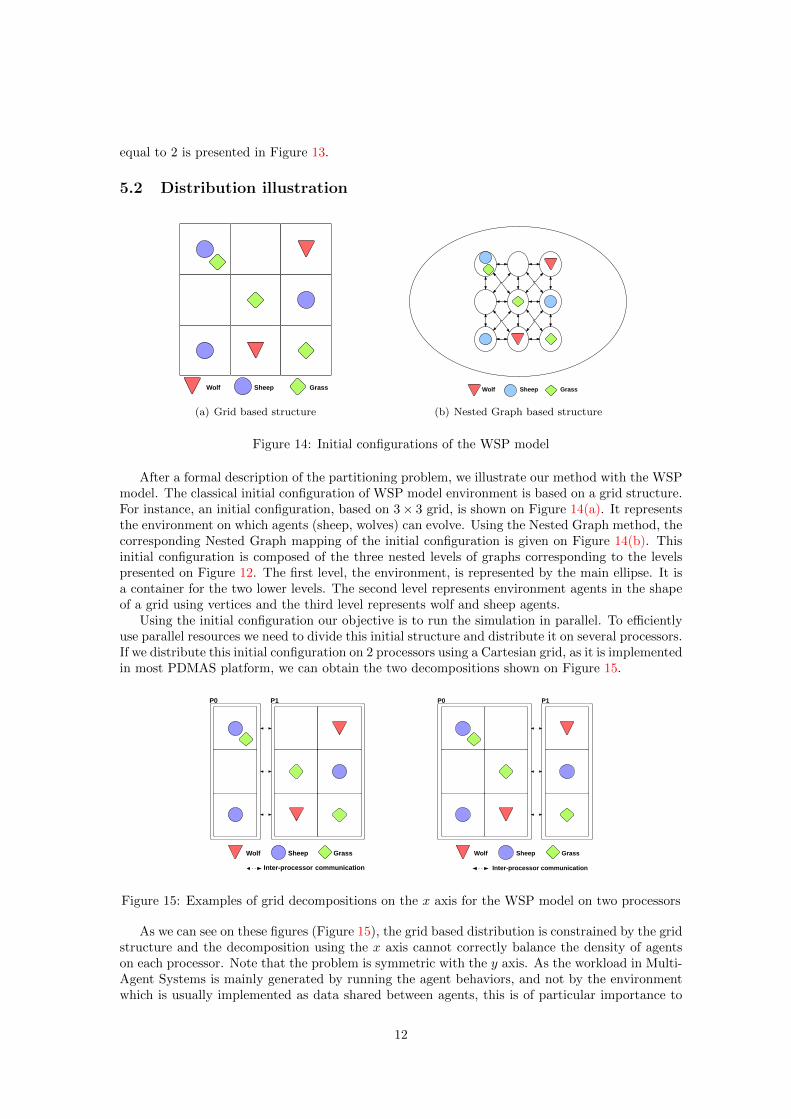
After a formal description of the partitioning problem, we illustrate our method with the WSPmodel. The classical initial configuration of WSP model environment is based on a grid structure.For instance, an initial configuration, based on 3× 3 grid, is shown on Figure 14(a). It representsthe environment on which agents (sheep, wolves) can evolve. Using the Nested Graph method, thecorresponding Nested Graph mapping of the initial configuration is given on Figure 14(b). Thisinitial configuration is composed of the three nested levels of graphs corresponding to the levelspresented on Figure 12. The first level, the environment, is represented by the main ellipse. It isa container for the two lower levels. The second level represents environment agents in the shapeof a grid using vertices and the third level represents wolf and sheep agents.
Using the initial configuration our objective is to run the simulation in parallel. To efficientlyuse parallel resources we need to divide this initial structure and distribute it on several processors.If we distribute this initial configuration on 2 processors using a Cartesian grid, as it is implementedin most PDMAS platform, we can obtain the two decompositions shown on Figure 15.
Wolf Sheep Grass
P0
P1
Inter-processor communication
Wolf Sheep Grass
P0
P1
Inter-processor communication
Figure 15: Examples of grid decompositions on the x axis for the WSP model on two processors
As we can see on these figures (Figure 15), the grid based distribution is constrained by the gridstructure and the decomposition using the x axis cannot correctly balance the density of agentson each processor. Note that the problem is symmetric with the y axis. As the workload in Multi-Agent Systems is mainly generated by running the agent behaviors, and not by the environmentwhich is usually implemented as data shared between agents, this is of particular importance to
12
correctly balance the global load. As noted previously this has a direct impact on the performancedue to the synchronous execution of time steps.
Wolf Sheep Grass
P0
P1
Inter-processor communication
P2 P3
Wolf Sheep Grass
P0
P1
Inter-processor communication
P2 P3
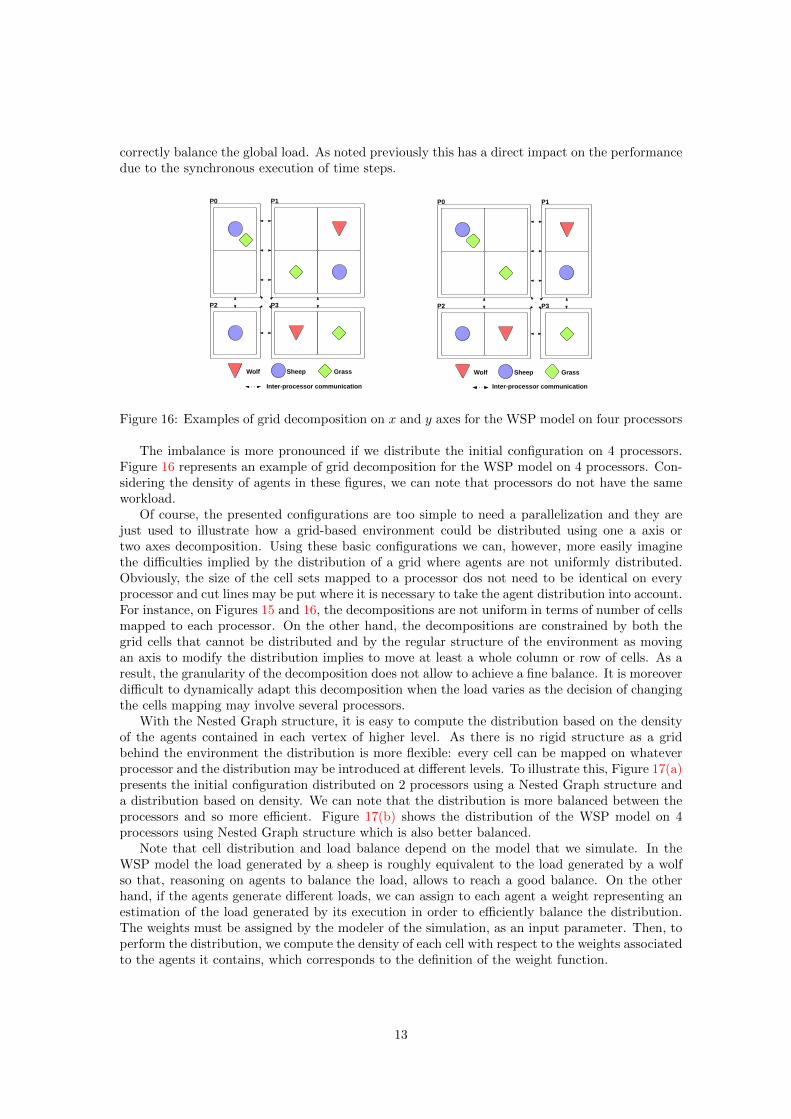
Figure 16: Examples of grid decomposition on x and y axes for the WSP model on four processors
The imbalance is more pronounced if we distribute the initial configuration on 4 processors.Figure 16 represents an example of grid decomposition for the WSP model on 4 processors. Con-sidering the density of agents in these figures, we can note that processors do not have the sameworkload.
Of course, the presented configurations are too simple to need a parallelization and they arejust used to illustrate how a grid-based environment could be distributed using one a axis ortwo axes decomposition. Using these basic configurations we can, however, more easily imaginethe difficulties implied by the distribution of a grid where agents are not uniformly distributed.Obviously, the size of the cell sets mapped to a processor dos not need to be identical on everyprocessor and cut lines may be put where it is necessary to take the agent distribution into account.For instance, on Figures 15 and 16, the decompositions are not uniform in terms of number of cellsmapped to each processor. On the other hand, the decompositions are constrained by both thegrid cells that cannot be distributed and by the regular structure of the environment as movingan axis to modify the distribution implies to move at least a whole column or row of cells. As aresult, the granularity of the decomposition does not allow to achieve a fine balance. It is moreoverdifficult to dynamically adapt this decomposition when the load varies as the decision of changingthe cells mapping may involve several processors.
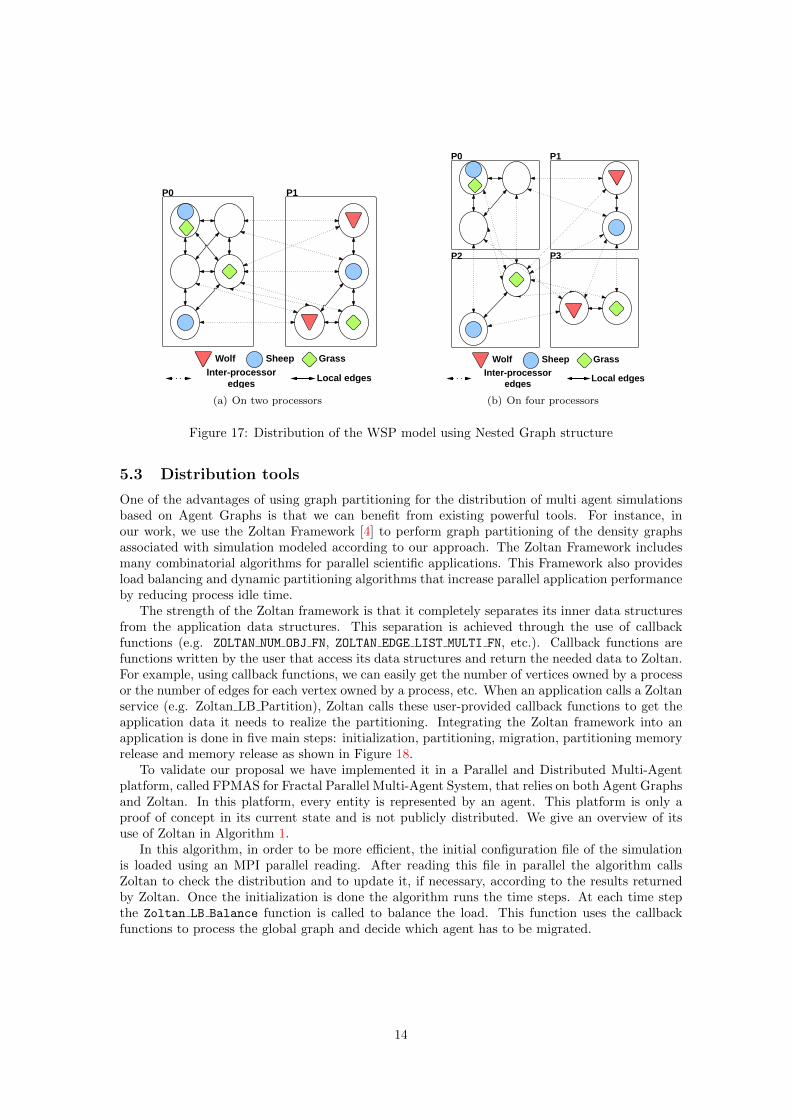
With the Nested Graph structure, it is easy to compute the distribution based on the densityof the agents contained in each vertex of higher level. As there is no rigid structure as a gridbehind the environment the distribution is more flexible: every cell can be mapped on whateverprocessor and the distribution may be introduced at different levels. To illustrate this, Figure 17(a)presents the initial configuration distributed on 2 processors using a Nested Graph structure anda distribution based on density. We can note that the distribution is more balanced between theprocessors and so more efficient. Figure 17(b) shows the distribution of the WSP model on 4processors using Nested Graph structure which is also better balanced.
Note that cell distribution and load balance depend on the model that we simulate. In theWSP model the load generated by a sheep is roughly equivalent to the load generated by a wolfso that, reasoning on agents to balance the load, allows to reach a good balance. On the otherhand, if the agents generate different loads, we can assign to each agent a weight representing anestimation of the load generated by its execution in order to efficiently balance the distribution.The weights must be assigned by the modeler of the simulation, as an input parameter. Then, toperform the distribution, we compute the density of each cell with respect to the weights associatedto the agents it contains, which corresponds to the definition of the weight function.
13
Wolf Sheep Grass
Inter-processor edges
Local edges
P0 P1
(a) On two processors
P0 P1
P2 P3
Wolf Sheep Grass
Inter-processor edges
Local edges
(b) On four processors
Figure 17: Distribution of the WSP model using Nested Graph structure
5.3 Distribution tools
One of the advantages of using graph partitioning for the distribution of multi agent simulationsbased on Agent Graphs is that we can benefit from existing powerful tools. For instance, inour work, we use the Zoltan Framework [4] to perform graph partitioning of the density graphsassociated with simulation modeled according to our approach. The Zoltan Framework includesmany combinatorial algorithms for parallel scientific applications. This Framework also providesload balancing and dynamic partitioning algorithms that increase parallel application performanceby reducing process idle time.
The strength of the Zoltan framework is that it completely separates its inner data structuresfrom the application data structures. This separation is achieved through the use of callbackfunctions (e.g. ZOLTAN NUM OBJ FN, ZOLTAN EDGE LIST MULTI FN, etc.). Callback functions arefunctions written by the user that access its data structures and return the needed data to Zoltan.For example, using callback functions, we can easily get the number of vertices owned by a processor the number of edges for each vertex owned by a process, etc. When an application calls a Zoltanservice (e.g. Zoltan LB Partition), Zoltan calls these user-provided callback functions to get theapplication data it needs to realize the partitioning. Integrating the Zoltan framework into anapplication is done in five main steps: initialization, partitioning, migration, partitioning memoryrelease and memory release as shown in Figure 18.
To validate our proposal we have implemented it in a Parallel and Distributed Multi-Agentplatform, called FPMAS for Fractal Parallel Multi-Agent System, that relies on both Agent Graphsand Zoltan. In this platform, every entity is represented by an agent. This platform is only aproof of concept in its current state and is not publicly distributed. We give an overview of itsuse of Zoltan in Algorithm 1.
In this algorithm, in order to be more efficient, the initial configuration file of the simulationis loaded using an MPI parallel reading. After reading this file in parallel the algorithm callsZoltan to check the distribution and to update it, if necessary, according to the results returnedby Zoltan. Once the initialization is done the algorithm runs the time steps. At each time stepthe Zoltan LB Balance function is called to balance the load. This function uses the callbackfunctions to process the global graph and decide which agent has to be migrated.
14
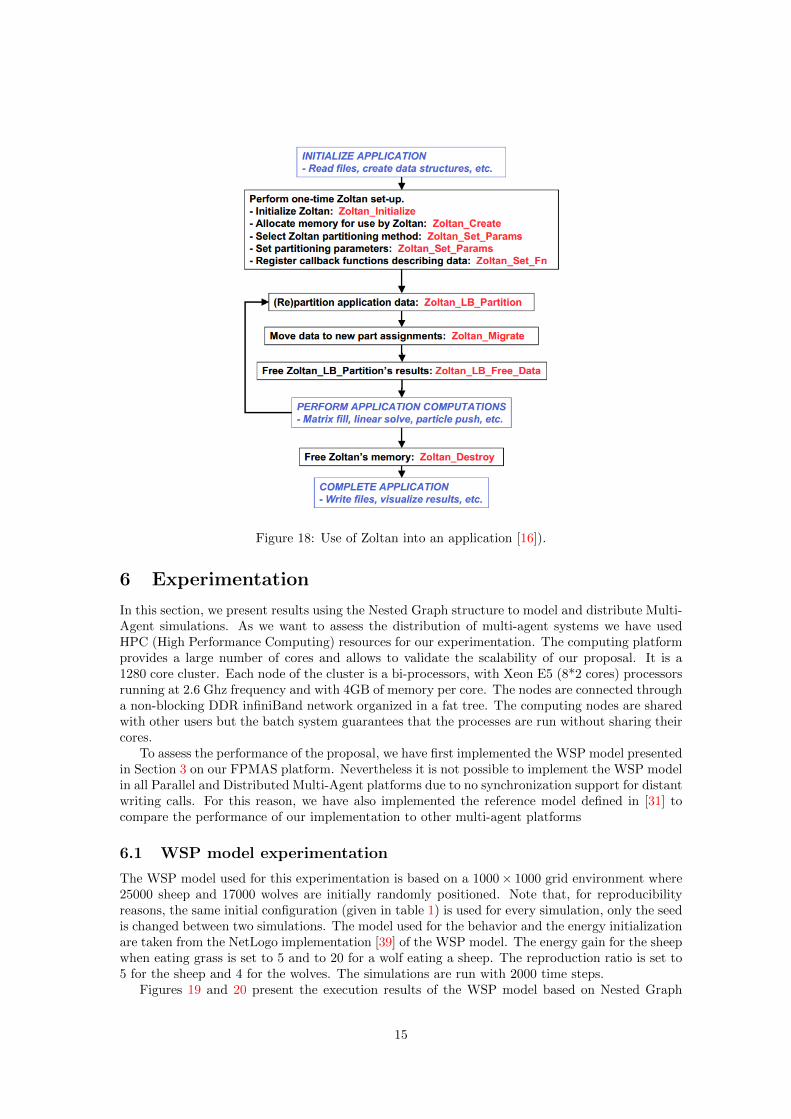
Figure 18: Use of Zoltan into an application [16]).
6 Experimentation
In this section, we present results using the Nested Graph structure to model and distribute Multi-Agent simulations. As we want to assess the distribution of multi-agent systems we have usedHPC (High Performance Computing) resources for our experimentation. The computing platformprovides a large number of cores and allows to validate the scalability of our proposal. It is a1280 core cluster. Each node of the cluster is a bi-processors, with Xeon E5 (8*2 cores) processorsrunning at 2.6 Ghz frequency and with 4GB of memory per core. The nodes are connected througha non-blocking DDR infiniBand network organized in a fat tree. The computing nodes are sharedwith other users but the batch system guarantees that the processes are run without sharing theircores.
To assess the performance of the proposal, we have first implemented the WSP model presentedin Section 3 on our FPMAS platform. Nevertheless it is not possible to implement the WSP modelin all Parallel and Distributed Multi-Agent platforms due to no synchronization support for distantwriting calls. For this reason, we have also implemented the reference model defined in [31] tocompare the performance of our implementation to other multi-agent platforms
6.1 WSP model experimentation
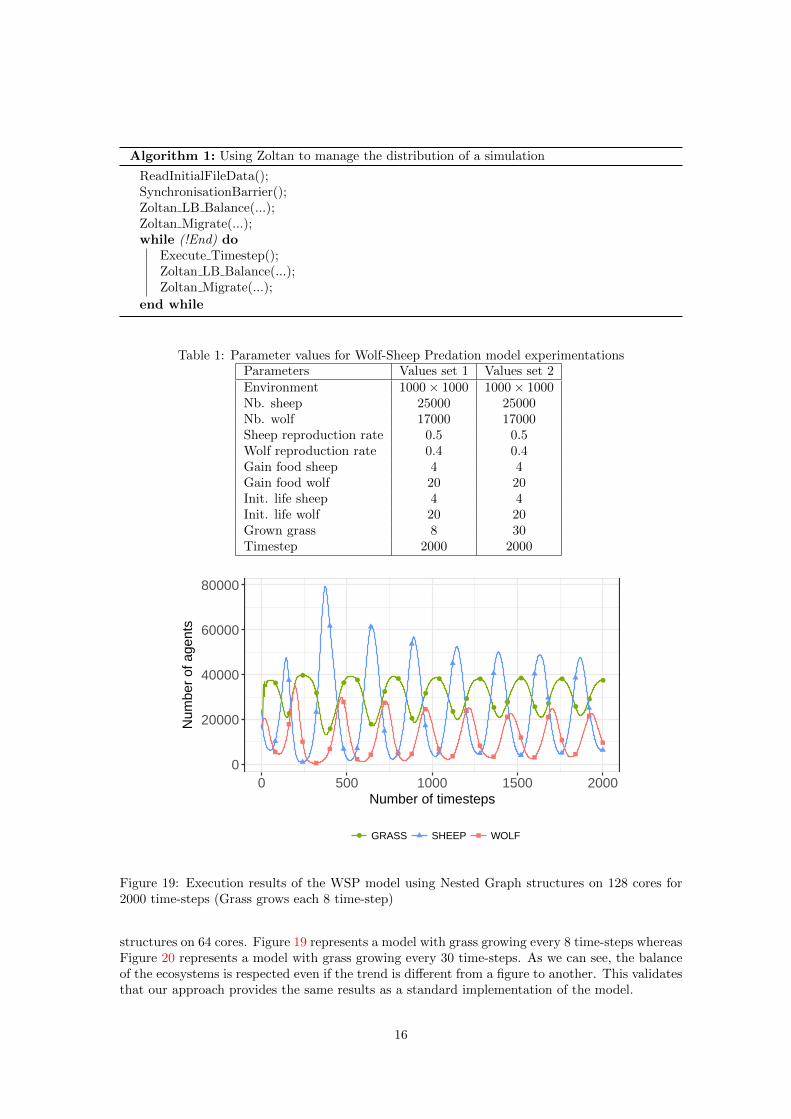
The WSP model used for this experimentation is based on a 1000× 1000 grid environment where25000 sheep and 17000 wolves are initially randomly positioned. Note that, for reproducibilityreasons, the same initial configuration (given in table 1) is used for every simulation, only the seedis changed between two simulations. The model used for the behavior and the energy initializationare taken from the NetLogo implementation [39] of the WSP model. The energy gain for the sheepwhen eating grass is set to 5 and to 20 for a wolf eating a sheep. The reproduction ratio is set to5 for the sheep and 4 for the wolves. The simulations are run with 2000 time steps.
Figures 19 and 20 present the execution results of the WSP model based on Nested Graph
15
Algorithm 1: Using Zoltan to manage the distribution of a simulation
ReadInitialFileData();SynchronisationBarrier();Zoltan LB Balance(...);Zoltan Migrate(...);while (!End) do
Execute Timestep();Zoltan LB Balance(...);Zoltan Migrate(...);
end while
Table 1: Parameter values for Wolf-Sheep Predation model experimentationsParameters Values set 1 Values set 2Environment 1000× 1000 1000× 1000Nb. sheep 25000 25000Nb. wolf 17000 17000Sheep reproduction rate 0.5 0.5Wolf reproduction rate 0.4 0.4Gain food sheep 4 4Gain food wolf 20 20Init. life sheep 4 4Init. life wolf 20 20Grown grass 8 30Timestep 2000 2000
0
20000
40000
60000
80000
0 500 1000 1500 2000Number of timesteps
Num
ber
of a
gent
s
GRASS SHEEP WOLF
Figure 19: Execution results of the WSP model using Nested Graph structures on 128 cores for2000 time-steps (Grass grows each 8 time-step)
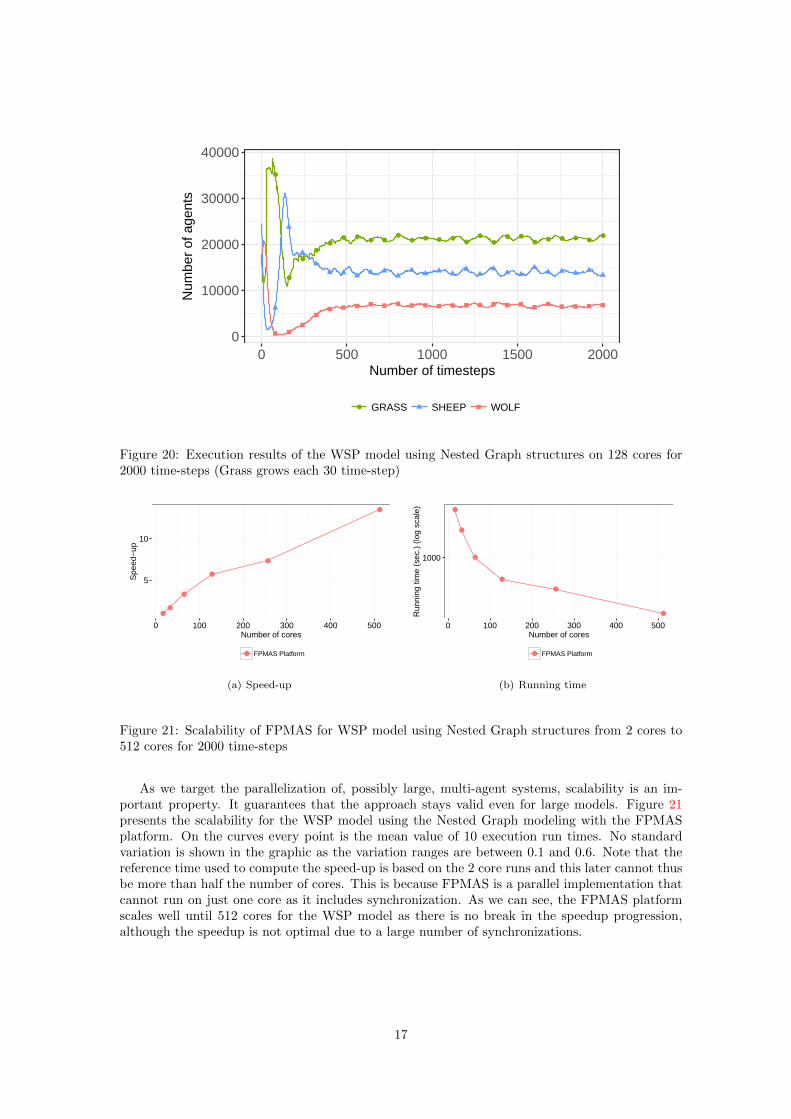
structures on 64 cores. Figure 19 represents a model with grass growing every 8 time-steps whereasFigure 20 represents a model with grass growing every 30 time-steps. As we can see, the balanceof the ecosystems is respected even if the trend is different from a figure to another. This validatesthat our approach provides the same results as a standard implementation of the model.
16
0
10000
20000
30000
40000
0 500 1000 1500 2000Number of timesteps
Num
ber
of a
gent
s
GRASS SHEEP WOLF
Figure 20: Execution results of the WSP model using Nested Graph structures on 128 cores for2000 time-steps (Grass grows each 30 time-step)
5
10
0 100 200 300 400 500Number of cores
Spe
ed−
up
FPMAS Platform
(a) Speed-up
1000
0 100 200 300 400 500Number of cores
Run
ning
tim
e (s
ec.)
(lo
g sc
ale)
FPMAS Platform
(b) Running time
Figure 21: Scalability of FPMAS for WSP model using Nested Graph structures from 2 cores to512 cores for 2000 time-steps
As we target the parallelization of, possibly large, multi-agent systems, scalability is an im-portant property. It guarantees that the approach stays valid even for large models. Figure 21presents the scalability for the WSP model using the Nested Graph modeling with the FPMASplatform. On the curves every point is the mean value of 10 execution run times. No standardvariation is shown in the graphic as the variation ranges are between 0.1 and 0.6. Note that thereference time used to compute the speed-up is based on the 2 core runs and this later cannot thusbe more than half the number of cores. This is because FPMAS is a parallel implementation thatcannot run on just one core as it includes synchronization. As we can see, the FPMAS platformscales well until 512 cores for the WSP model as there is no break in the speedup progression,although the speedup is not optimal due to a large number of synchronizations.
17
6.2 Virus model experimentation
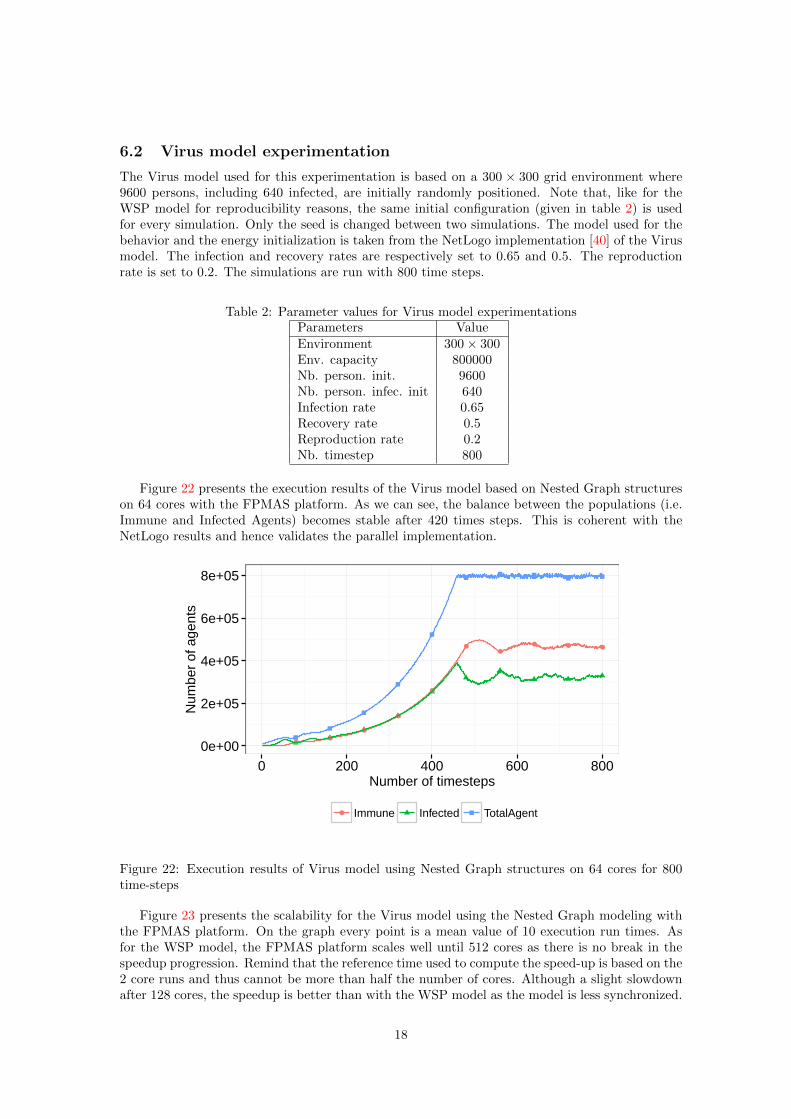
The Virus model used for this experimentation is based on a 300 × 300 grid environment where9600 persons, including 640 infected, are initially randomly positioned. Note that, like for theWSP model for reproducibility reasons, the same initial configuration (given in table 2) is usedfor every simulation. Only the seed is changed between two simulations. The model used for thebehavior and the energy initialization is taken from the NetLogo implementation [40] of the Virusmodel. The infection and recovery rates are respectively set to 0.65 and 0.5. The reproductionrate is set to 0.2. The simulations are run with 800 time steps.
Table 2: Parameter values for Virus model experimentationsParameters ValueEnvironment 300× 300Env. capacity 800000Nb. person. init. 9600Nb. person. infec. init 640Infection rate 0.65Recovery rate 0.5Reproduction rate 0.2Nb. timestep 800
Figure 22 presents the execution results of the Virus model based on Nested Graph structureson 64 cores with the FPMAS platform. As we can see, the balance between the populations (i.e.Immune and Infected Agents) becomes stable after 420 times steps. This is coherent with theNetLogo results and hence validates the parallel implementation.
0e+00
2e+05
4e+05
6e+05
8e+05
0 200 400 600 800Number of timesteps
Num
ber
of a
gent
s
Immune Infected TotalAgent
Figure 22: Execution results of Virus model using Nested Graph structures on 64 cores for 800time-steps
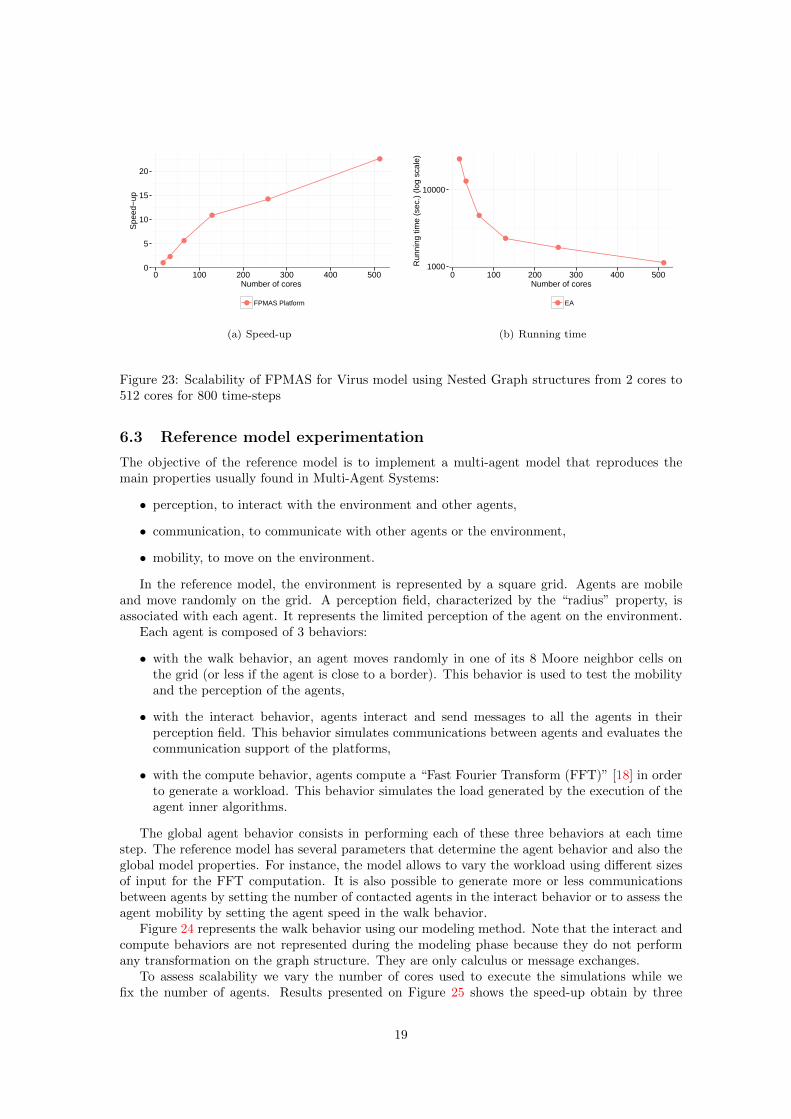
Figure 23 presents the scalability for the Virus model using the Nested Graph modeling withthe FPMAS platform. On the graph every point is a mean value of 10 execution run times. Asfor the WSP model, the FPMAS platform scales well until 512 cores as there is no break in thespeedup progression. Remind that the reference time used to compute the speed-up is based on the2 core runs and thus cannot be more than half the number of cores. Although a slight slowdownafter 128 cores, the speedup is better than with the WSP model as the model is less synchronized.
18
0
5
10
15
20
0 100 200 300 400 500Number of cores
Spe
ed−
up
FPMAS Platform
(a) Speed-up
1000
10000
0 100 200 300 400 500Number of cores
Run
ning
tim
e (s
ec.)
(lo
g sc
ale)
EA
(b) Running time
Figure 23: Scalability of FPMAS for Virus model using Nested Graph structures from 2 cores to512 cores for 800 time-steps
6.3 Reference model experimentation
The objective of the reference model is to implement a multi-agent model that reproduces themain properties usually found in Multi-Agent Systems:
• perception, to interact with the environment and other agents,
• communication, to communicate with other agents or the environment,
• mobility, to move on the environment.
In the reference model, the environment is represented by a square grid. Agents are mobileand move randomly on the grid. A perception field, characterized by the “radius” property, isassociated with each agent. It represents the limited perception of the agent on the environment.
Each agent is composed of 3 behaviors:
• with the walk behavior, an agent moves randomly in one of its 8 Moore neighbor cells onthe grid (or less if the agent is close to a border). This behavior is used to test the mobilityand the perception of the agents,
• with the interact behavior, agents interact and send messages to all the agents in theirperception field. This behavior simulates communications between agents and evaluates thecommunication support of the platforms,
• with the compute behavior, agents compute a “Fast Fourier Transform (FFT)” [18] in orderto generate a workload. This behavior simulates the load generated by the execution of theagent inner algorithms.
The global agent behavior consists in performing each of these three behaviors at each timestep. The reference model has several parameters that determine the agent behavior and also theglobal model properties. For instance, the model allows to vary the workload using different sizesof input for the FFT computation. It is also possible to generate more or less communicationsbetween agents by setting the number of contacted agents in the interact behavior or to assess theagent mobility by setting the agent speed in the walk behavior.
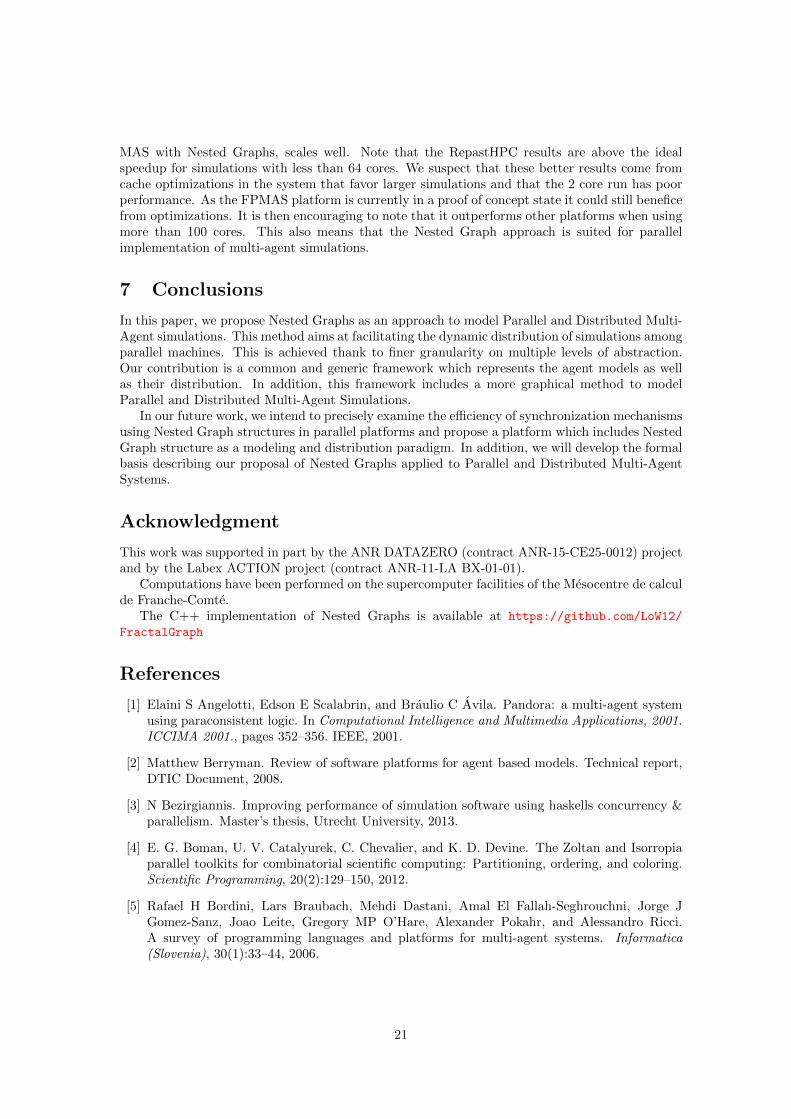
Figure 24 represents the walk behavior using our modeling method. Note that the interact andcompute behaviors are not represented during the modeling phase because they do not performany transformation on the graph structure. They are only calculus or message exchanges.
To assess scalability we vary the number of cores used to execute the simulations while wefix the number of agents. Results presented on Figure 25 shows the speed-up obtain by three
19
CellB:CellCellA:Cell
OCellB:OriginOCellA:Origin
On:0
Agt1:Agent
CellA:Cell CellB:Cell
OCellA:Origin OCellB:Origin
On:0
Agt1:Agent
Adjacent1
Adjacent1
Figure 24: Walk behavior representation of an agent
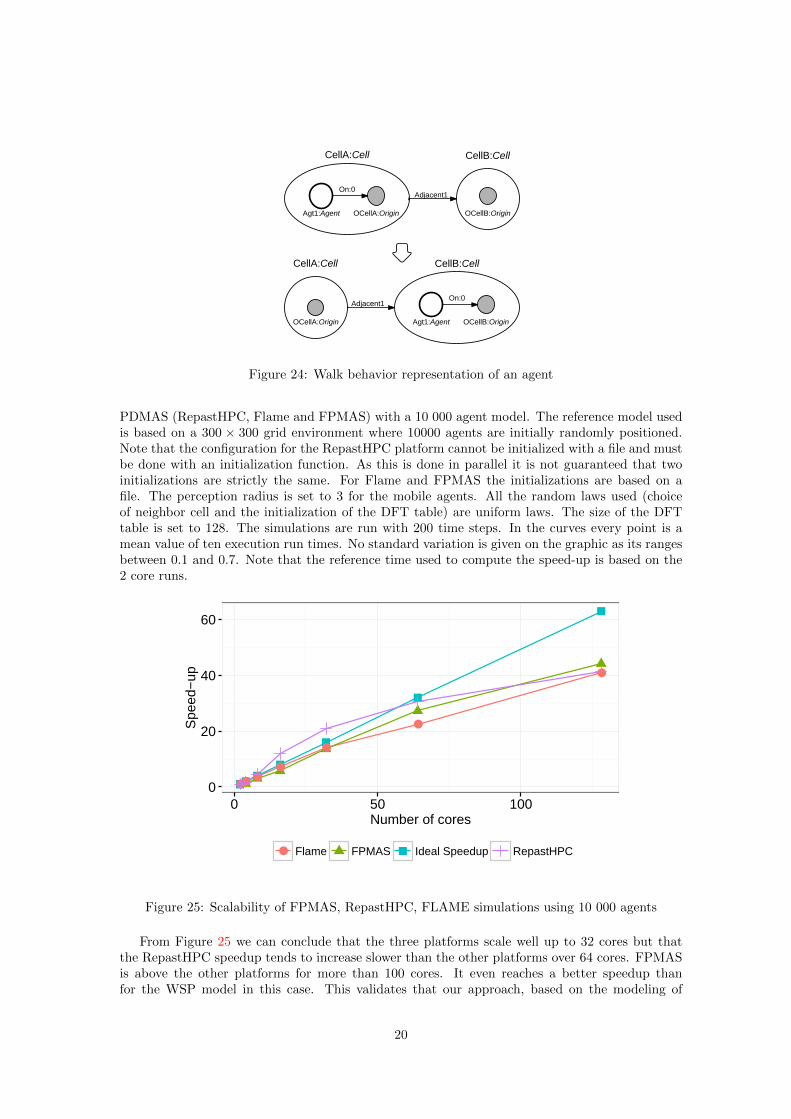
PDMAS (RepastHPC, Flame and FPMAS) with a 10 000 agent model. The reference model usedis based on a 300 × 300 grid environment where 10000 agents are initially randomly positioned.Note that the configuration for the RepastHPC platform cannot be initialized with a file and mustbe done with an initialization function. As this is done in parallel it is not guaranteed that twoinitializations are strictly the same. For Flame and FPMAS the initializations are based on afile. The perception radius is set to 3 for the mobile agents. All the random laws used (choiceof neighbor cell and the initialization of the DFT table) are uniform laws. The size of the DFTtable is set to 128. The simulations are run with 200 time steps. In the curves every point is amean value of ten execution run times. No standard variation is given on the graphic as its rangesbetween 0.1 and 0.7. Note that the reference time used to compute the speed-up is based on the2 core runs.
0
20
40
60
0 50 100Number of cores
Spe
ed−
up
Flame FPMAS Ideal Speedup RepastHPC
Figure 25: Scalability of FPMAS, RepastHPC, FLAME simulations using 10 000 agents
From Figure 25 we can conclude that the three platforms scale well up to 32 cores but thatthe RepastHPC speedup tends to increase slower than the other platforms over 64 cores. FPMASis above the other platforms for more than 100 cores. It even reaches a better speedup thanfor the WSP model in this case. This validates that our approach, based on the modeling of
20
MAS with Nested Graphs, scales well. Note that the RepastHPC results are above the idealspeedup for simulations with less than 64 cores. We suspect that these better results come fromcache optimizations in the system that favor larger simulations and that the 2 core run has poorperformance. As the FPMAS platform is currently in a proof of concept state it could still beneficefrom optimizations. It is then encouraging to note that it outperforms other platforms when usingmore than 100 cores. This also means that the Nested Graph approach is suited for parallelimplementation of multi-agent simulations.
7 Conclusions
In this paper, we propose Nested Graphs as an approach to model Parallel and Distributed Multi-Agent simulations. This method aims at facilitating the dynamic distribution of simulations amongparallel machines. This is achieved thank to finer granularity on multiple levels of abstraction.Our contribution is a common and generic framework which represents the agent models as wellas their distribution. In addition, this framework includes a more graphical method to modelParallel and Distributed Multi-Agent Simulations.
In our future work, we intend to precisely examine the efficiency of synchronization mechanismsusing Nested Graph structures in parallel platforms and propose a platform which includes NestedGraph structure as a modeling and distribution paradigm. In addition, we will develop the formalbasis describing our proposal of Nested Graphs applied to Parallel and Distributed Multi-AgentSystems.
Acknowledgment
This work was supported in part by the ANR DATAZERO (contract ANR-15-CE25-0012) projectand by the Labex ACTION project (contract ANR-11-LA BX-01-01).
Computations have been performed on the supercomputer facilities of the Mesocentre de calculde Franche-Comte.
The C++ implementation of Nested Graphs is available at https://github.com/LoW12/
FractalGraph
References
[1] Elaini S Angelotti, Edson E Scalabrin, and Braulio C Avila. Pandora: a multi-agent systemusing paraconsistent logic. In Computational Intelligence and Multimedia Applications, 2001.ICCIMA 2001., pages 352–356. IEEE, 2001.
[2] Matthew Berryman. Review of software platforms for agent based models. Technical report,DTIC Document, 2008.
[3] N Bezirgiannis. Improving performance of simulation software using haskells concurrency ¶llelism. Master’s thesis, Utrecht University, 2013.
[4] E. G. Boman, U. V. Catalyurek, C. Chevalier, and K. D. Devine. The Zoltan and Isorropiaparallel toolkits for combinatorial scientific computing: Partitioning, ordering, and coloring.Scientific Programming, 20(2):129–150, 2012.
[5] Rafael H Bordini, Lars Braubach, Mehdi Dastani, Amal El Fallah-Seghrouchni, Jorge JGomez-Sanz, Joao Leite, Gregory MP O’Hare, Alexander Pokahr, and Alessandro Ricci.A survey of programming languages and platforms for multi-agent systems. Informatica(Slovenia), 30(1):33–44, 2006.
21
[6] Michele Carillo, Gennaro Cordasco, Rosario De Chiara, Francesco Raia, Vittorio Scarano, andFlavio Serrapica. Enhancing the performances of d-mason - a motivating example. In NunoPina, Janusz Kacprzyk, and Mohammad S. Obaidat, editors, SIMULTECH, pages 137–143.SciTePress, 2012.
[7] Gregory Carslaw. Agent based modelling in social psychology. PhD thesis, University ofBirmingham, 2013.
[8] Jose R Celaya, Alan Desrochers, Robert J Graves, et al. Modeling and analysis of multi-agentsystems using petri nets. In Systems, Man and Cybernetics, 2007. ISIC. IEEE InternationalConference on, pages 1439–1444. IEEE, 2007.
[9] Cedric Chevalier and Francois Pellegrini. Pt-scotch: A tool for efficient parallel graph order-ing. CoRR, abs/0907.1375, 2009.
[10] Sebastien Chipeaux, Fabrice Bouquet, Christophe Lang, and Nicolas Marilleau. Modelling ofcomplex systems with aml as realized in miro project. 2014 IEEE/WIC/ACM InternationalJoint Conferences on Web Intelligence (WI) and Intelligent Agent Technologies (IAT), 3:159–162, 2011.
[11] Simon Coakley, Marian Gheorghe, Mike Holcombe, Shawn Chin, David Worth, and ChrisGreenough. Exploitation of hpc in the flame agent-based simulation framework. In Proceedingsof the 2012 IEEE 14th Int. Conf. on HPC and Communication & 2012 IEEE 9th Int. Conf.on Embedded Software and Systems, HPCC ’12, pages 538–545, Washington, DC, USA, 2012.IEEE Computer Society.
[12] Nicholson Collier and Michael North. Repast HPC: A platform for large-scale agentbasedmodeling. Wiley, 2011.
[13] Nick Collier. Repast hpc manual, 2010.
[14] Gennaro Cordasco, Rosario Chiara, Ada Mancuso, Dario Mazzeo, Vittorio Scarano, andCarmine Spagnuolo. A Framework for Distributing Agent-Based Simulations. In Euro-Par2011: Parallel Processing Workshops, volume 7155 of Lecture Notes in Computer Science,pages 460–470, 2011.
[15] Karen Devine, Erik Boman, Robert Heaphy, Bruce Hendrickson, and Courtenay Vaughan.Zoltan data management services for parallel dynamic applications. Computing in Science &Engineering, 4(2):90–96, 2002.
[16] Karen D Devine, Erik G Boman, Lee Ann Riesen, Umit V Catalyurek, and Cedric Chevalier.Getting started with zoltan: A short tutorial. Sandia National Labs Tech Report SAND2009-0578C, 2009.
[17] Jacques Ferber and Jean-Francois Perrot. Les systemes multi-agents: vers une intelligencecollective. InterEditions Paris, 1995.
[18] Matteo Frigo and Steven G Johnson. The design and implementation of fftw3. Proceedingsof the IEEE, 93(2):216–231, 2005.
[19] Olivier Gutknecht and Jacques Ferber. Madkit: A generic multi-agent platform. In Proceed-ings of the fourth international Conf. on Autonomous agents, pages 78–79. ACM, 2000.
[20] Lynne Hamill and Nigel Gilbert. Simulating large social networks in agent-based models: Asocial circle model. Emergence: Complexity and Organization, 12:78–94, 2010.
[21] Brian Heath, Raymond Hill, and Frank Ciarallo. A survey of agent-based modeling practices(january 1998 to july 2008). JASSS, 12(4):9, 2009.
22
[22] Bruce Hendrickson and Tamara G Kolda. Graph partitioning models for parallel computing.Parallel computing, 26(12):1519–1534, 2000.
[23] George Karypis, Kirk Schloegel, and Vipin Kumar. Parmetis. Parallel graph partitioning andsparse matrix ordering library. Version, 2, 2003.
[24] Mehmet Can Kurt, Sriram Krishnamoorthy, Kunal Agrawal, and Gagan Agrawal. Fault-tolerant dynamic task graph scheduling. In High Performance Computing, Networking, Stor-age and Analysis, SC14: International Conference for, pages 719–730. IEEE, 2014.
[25] Guillaume Laville, Christophe Lang, Benedicte Herrmann, Laurent Philippe, Kamel Mazouzi,and Nicolas Marilleau. Mcmas: A toolkit for developing agent-based simulations on many-corearchitectures. Multiagent and Grid Systems, 11(1):15–31, 2015.
[26] Sean Luke, Claudio Cioffi-Revilla, Liviu Panait, and Keith Sullivan. MASON: A New Multi-Agent Simulation Toolkit. Simulation, 81(7):517–527, July 2005.
[27] Sebastien Picault and Philippe Mathieu. An interaction-oriented model for multi-scale sim-ulation. In IJCAI’2011–Barcelona (Spain)–July, 16-22 2011, pages 332–337. AAAI Press,2011.
[28] Alexandra Poulovassilis and Mark Levene. A nested-graph model for the representationand manipulation of complex objects. ACM Transactions on Information Systems (TOIS),12(1):35–68, 1994.
[29] Sivasankaran Rajamanickam and Erik G Boman. An evaluation of the zoltan parallel graphand hypergraph partitioners. Technical report, Sandia National Laboratories (SNL-NM),Albuquerque, NM (United States), 2012.
[30] Vincent Rodin, Abdessalam Benzinou, Anne Guillaud, Pascal Ballet, Fabrice Harrouet,Jacques Tisseau, and Jean Le Bihan. An immune oriented multi-agent system for biolog-ical image processing. Pattern Recognition, 37(4):631–645, 2004.
[31] Alban Rousset, Benedicte Herrmann, Christophe Lang, and Laurent Philippe. A Survey onParallel and Distributed Multi-Agent Systems, pages 371–382. Springer International Pub-lishing, 2014.
[32] Alban Rousset, Benedicte Herrmann, Christophe Lang, and Laurent Philippe. A communi-cation schema for parallel and distributed multi-agent systems based on mpi. In Euro-Par2015: Parallel Processing Workshops, pages 442–453. Springer, 2015.
[33] Alban Rousset, Benedicte Herrmann, Christophe Lang, and Laurent Philippe. A survey onparallel and distributed multi-agent systems for high performance computing simulations.Computer Science Review, 22:27–46, 2016.
[34] Alban Rousset, Benedicte Herrmann, Christophe Lang, Laurent Philippe, and Hadrien Bride.Using nested graphs to distribute parallel and distributed multi-agent systems. In 24th Eu-romicro International Conference on Parallel, Distributed, and Network-Based Processing,PDP 2016, Heraklion, Crete, Greece, February 17-19, 2016, pages 710–717, 2016.
[35] Patrick Taillandier, Duc-An Vo, Edouard Amouroux, and Alexis Drogoul. GAMA: A Simu-lation Platform That Integrates Geographical Information Data, Agent-Based Modeling andMulti-scale Control. In Nirmit Desai, Alan Liu, and Michael Winikoff, editors, Principles andPractice of Multi-Agent Systems, volume 7057 of Lecture Notes in Computer Science, pages242–258. Springer Berlin Heidelberg, 2012.
[36] Seth Tisue and Uri Wilensky. Netlogo: Design and implementation of a multi-agent modelingenvironment. In Proceedings of Agent, volume 2004, pages 7–9, 2004.
23
[37] Robert Tobias and Carole Hofmann. Evaluation of free java-libraries for social-scientific agentbased simulation. JASS, 7(1), 2004.
[38] Stephane Vialle, Eugen Dedu, and Claude Timsit. Parcel-5/parssap: A parallel programmingmodel and library for easy development and fast execution of simulations of situated multi-agent systems. In Proceedings of SNPD02 International Conference on Software EngineeringApplied to Networking and Parallel/Distributed Computing, 2002.
[39] U Wilensky. Netlogo wolf sheep predation model. Center for connected learning andcomputer-based modeling, Northwestern University, Evanston, IL. Available at: http:
//ccl.northwestern.edu/netlogo/models/WolfSheepPredation [Accessed April 4, 2017],1997.
[40] U Wilensky. Netlogo virus model. Center for connected learning and computer-based model-ing, Northwestern University, Evanston, IL. Available at: http://ccl.northwestern.edu/
netlogo/models/Virus [Accessed April 4, 2017], 1998.
24