neso sojic - bordeaux.udppc.asso.fr
TRANSCRIPT

Neso Sojic [email protected]
«Un peu de soleil dans la mer ou comment des réactions
redox conduisent à la détection ultrasensible »

ECL…..diagnostics…
D. M. Rissin et al., Nat. Biotech., 2010, 28, 595
● Cancer: a 1-mm3 tumor composed of a million cells that each secrete
5,000 proteins into 5 liters of circulating blood translates to a
concentration of ~2 × 10⁻¹⁵ M (or 2 fM).
● Infection: serum from individuals recently infected with HIV contains
10–3,000 virions per ml, resulting in estimated concentrations of the
p24 capsid antigen ranging from 50 × 10−18 M (50 aM) to 15 × 10−15 M
(15 fM).
Detection of protein biomarkers ► to differentiate between healthy
and disease states, and to monitor disease progression.
𝒄𝒐𝒏𝒄𝒆𝒏𝒕𝒓𝒂𝒕𝒊𝒐𝒏 = 𝒂𝒎𝒐𝒖𝒏𝒕
𝒗𝒐𝒍𝒖𝒎𝒆

Global Immunoassays Market:
by applications: by technology:
Oncology
Infectious Diseases
Inflammatory Diseases
Cardiology
Neurology
Bone and Mineral
Endocrinology
Autoimmunity
Toxicology
Hematology (Anemia)
Neonatal Screening Neurology
…

Electrogenerated ChemiLuminescence (ECL)
Immunoassays Commercialised for clinical applications:
Immunology
Toxicology
Metabolic Application
Inflammation
Alzheimer’s Disease
Meso Scale Discovery, www.mesoscale.com
Roche Diagnostic Corp., www.roche.com 4
Roche commercializes more than 130 immunoassay tests for cardiac and
infectious diseases, maternal care, thyroid, and tumor markers, etc.
1,300,000,000 Elecsys tests based on ECL
technology sold in 2013. Source: Roche
Diagnostics-Business Overview 2014 Report

July 25th, 2003
Roche Buys Igen in $1.4 Billion Deal; Creates New Company
Roche has settled its patent dispute with Igen by agreeing to buy the company for $1.4 billion and
creating a new subsidiary. The deal gives Roche full rights to Igen's electrochemiluminescence (ECL)
technology, which had been the object of contention between the companies.
According to Roche, it will pay Igen shareholders $47.25 in cash and one share of the newly formed
company for each share of the old Igen stock. The new company will hold Igen's patents and operations
in life sciences, clinical testing and other industries. Roche will receive non-exclusive, perpetual rights
to use ECL in the in-vitro diagnostics market and sell ECL-based immunochemistry to point-of-
care and doctors' offices. Additionally, Roche will retain improvements it makes to ECL technology.
The deal settles a long-running dispute that culminated in a court decision handed about two weeks ago.
In it, the U.S. Court of Appeals had struck down a $486 million ruling against Roche but affirmed Igen's
right to terminate a licensing agreement to Roche. The litigation was inherited by Roche when it
acquired Boehringer Mannheim in 1998, which had an existing agreement with Igen. By settling with
Igen, Roche's diagnostic business, the largest in the world, assured that it would continue to have access
to the ECL technology, which accounted for $404 million of Roche's clinical diagnostic sales.

•Photoluminescence, a result of absorption of photons
•Fluorescence
•Phosphorescence
•Bioluminescence, emission by a living organism
•Chemiluminescence, a result of a chemical reaction
•Electrochemiluminescence (or electrogenerated chemiluminescence), a result of an
electrochemical reaction
•Crystalloluminescence, produced during crystallization
•Electroluminescence, radiative recombination of electrons and holes in a material, usually a
semiconductor
•Cathodoluminescence, a result of being struck by an electron
•Radioluminescence, a result of bombardment by ionizing radiation
•Sonoluminescence, a result of imploding bubbles in a liquid when excited by sound
•Thermoluminescence, the re-emission of absorbed light when a substance is heated
•Mechanoluminescence, a result of a mechanical action on a solid
•Triboluminescence, generated when bonds in a material are broken when that material
is scratched, crushed, or rubbed
•Fractoluminescence, generated when bonds in certain crystals are broken by fractures
•Piezoluminescence, produced by the action of pressure on certain solids
Different types of luminescence:

Internal
conversion
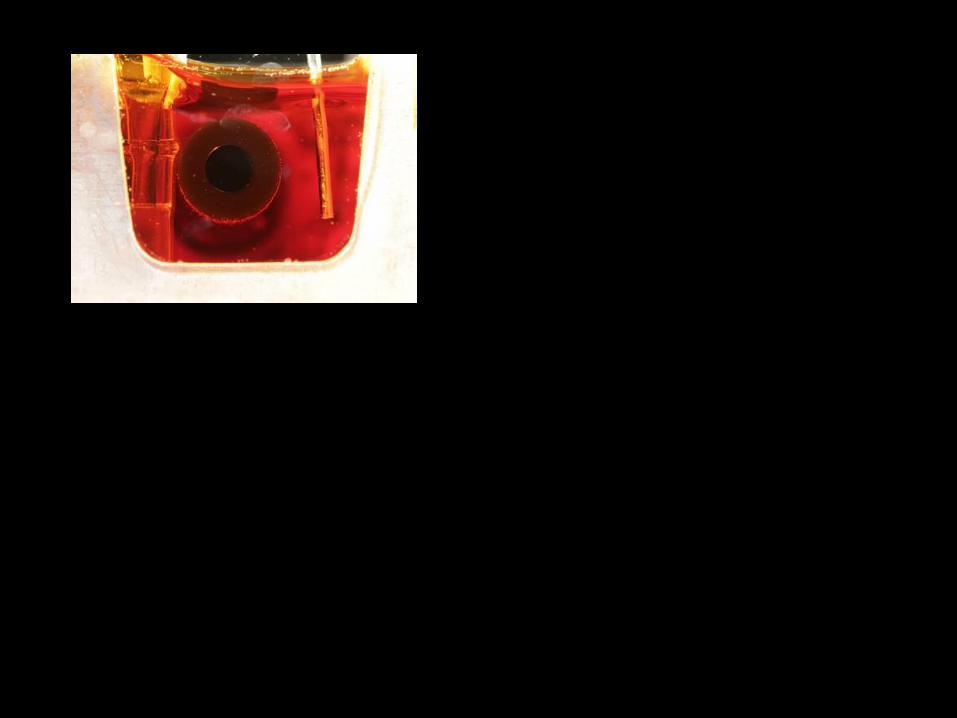


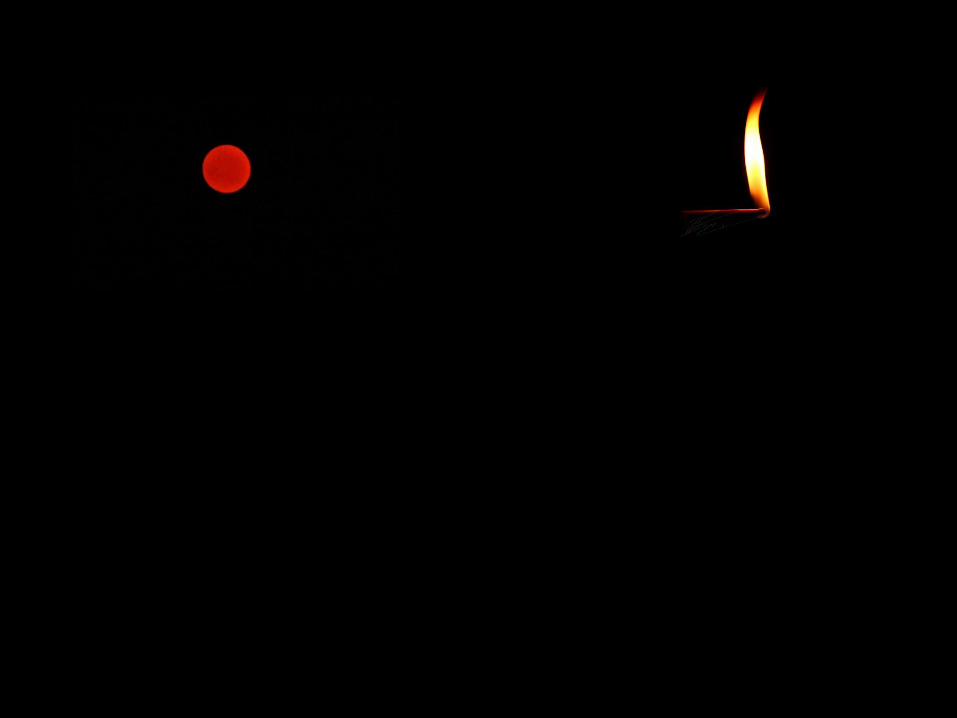

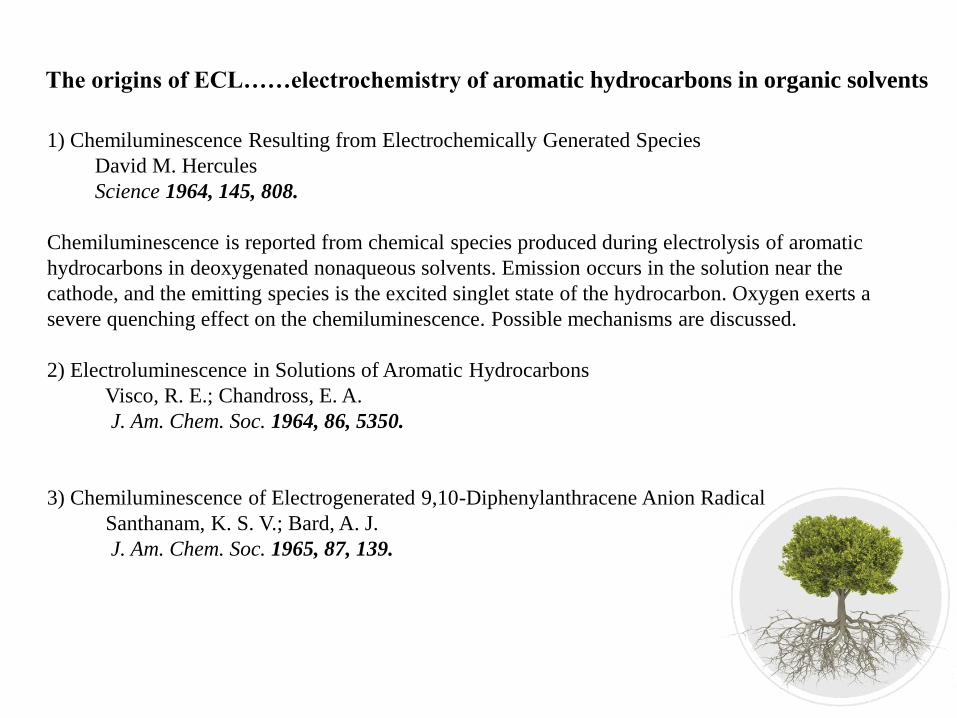
1) Chemiluminescence Resulting from Electrochemically Generated Species
David M. Hercules
Science 1964, 145, 808.
Chemiluminescence is reported from chemical species produced during electrolysis of aromatic
hydrocarbons in deoxygenated nonaqueous solvents. Emission occurs in the solution near the
cathode, and the emitting species is the excited singlet state of the hydrocarbon. Oxygen exerts a
severe quenching effect on the chemiluminescence. Possible mechanisms are discussed.
2) Electroluminescence in Solutions of Aromatic Hydrocarbons
Visco, R. E.; Chandross, E. A.
J. Am. Chem. Soc. 1964, 86, 5350.
3) Chemiluminescence of Electrogenerated 9,10-Diphenylanthracene Anion Radical
Santhanam, K. S. V.; Bard, A. J.
J. Am. Chem. Soc. 1965, 87, 139.
The origins of ECL……electrochemistry of aromatic hydrocarbons in organic solvents

L’oxydo-réduction……un grand “mystère”…
réducteur
oxydant
réduction
oxydation
anode
cathode
intensité
courant
potentiel
tension
Faraday
pile
batterie
électrolyse
Ox + e- → Red
forme oxydée
forme réduite
Ox1 + Red2 → Red1 + Ox2

Marcus model for the electron-transfer reaction
Rudolph A. Marcus. Nobel prize 1992
Rudolph A. Marcus developed an original theory to explain the rate of electron-transfer
reactions, linking the thermodynamics of the process to its kinetics.
His original article (1956) referred to the self exchange
reaction in aqueous solution :
Fe2+ + Fe3+ → Fe3+ + Fe2+
where the reorganization energy is solely due to
reorganization of water dipoles around solvated ions.
ELECTRON TRANSFER REACTIONS IN
CHEMISTRY: THEORY AND EXPERIMENT
R. A. Marcus - Nobel Lecture, December 8, 1992
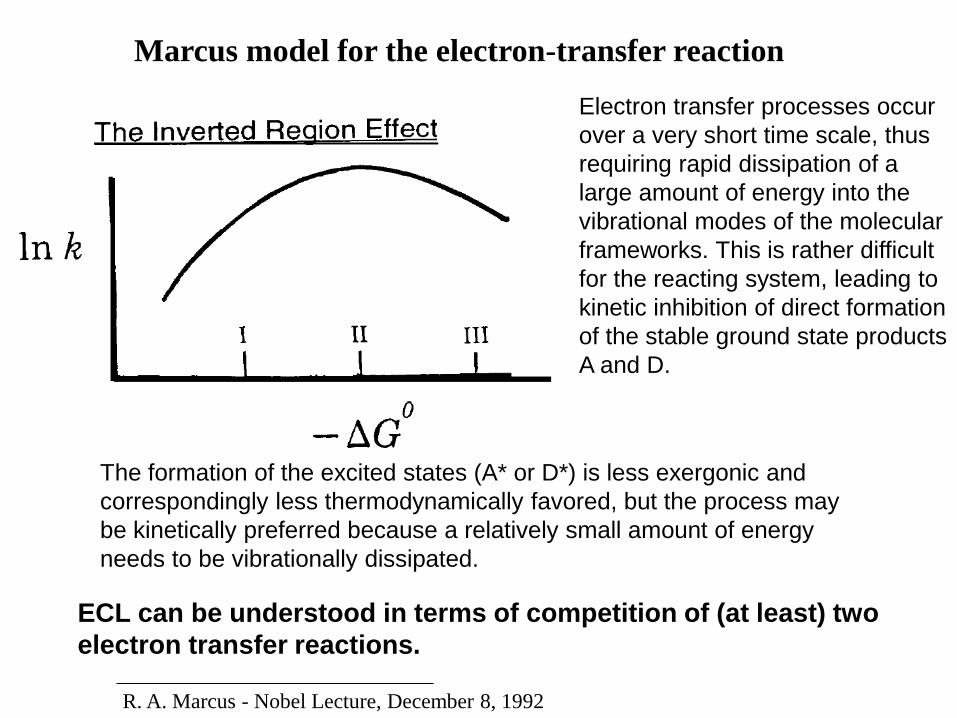
Marcus model for the electron-transfer reaction
R. A. Marcus - Nobel Lecture, December 8, 1992
Electron transfer processes occur
over a very short time scale, thus
requiring rapid dissipation of a
large amount of energy into the
vibrational modes of the molecular
frameworks. This is rather difficult
for the reacting system, leading to
kinetic inhibition of direct formation
of the stable ground state products
A and D.
The formation of the excited states (A* or D*) is less exergonic and
correspondingly less thermodynamically favored, but the process may
be kinetically preferred because a relatively small amount of energy
needs to be vibrationally dissipated.
ECL can be understood in terms of competition of (at least) two
electron transfer reactions.
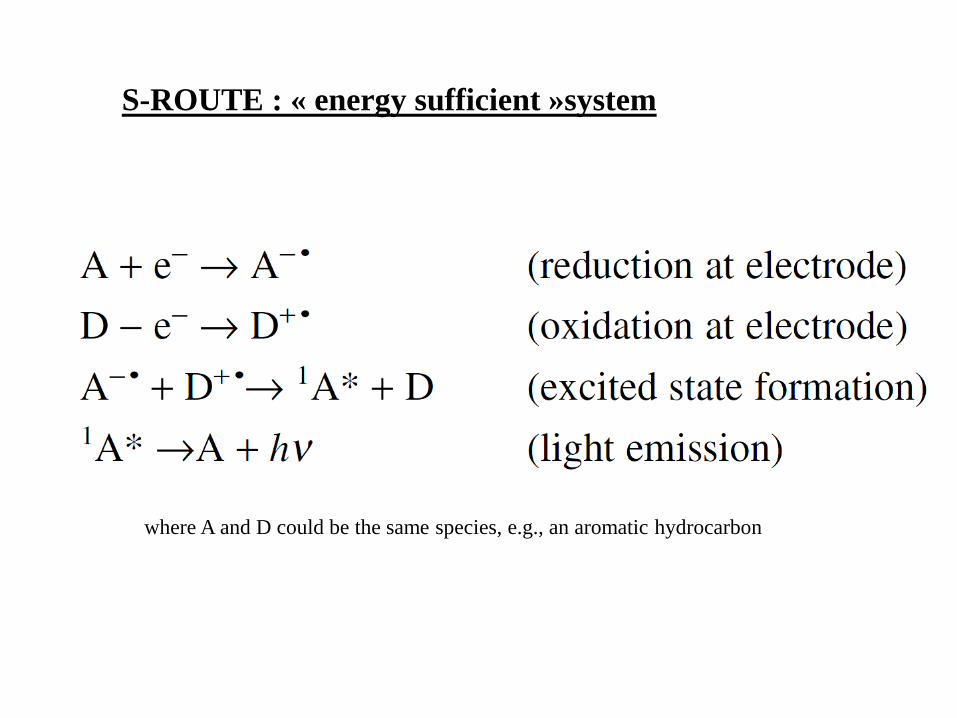
where A and D could be the same species, e.g., an aromatic hydrocarbon
S-ROUTE : « energy sufficient »system

Energy Requirements
The energy of the electron transfer reaction governs which excited states are
produced. Because the excitation energy is fundamentally closest to a
thermodynamic internal energy, the usual energy criterion for production of an
excited singlet state of energy ES (in electronvolts) is:
Frequently the criterion is given based on CV peak potentials (in volts) at T 298 K as:
Such reactions are sometimes called “energy sufficient,” and the reaction is said to
follow the S route.

Electrochemistry and ECL of aromatic molecules in organic solvents

Analytical signal: light intensity Cyclic amplification of the signal The intensity of the light emitted correlates with the concentration of Ru(bpy)3
2+ and of the co-reactant (TPA). Extremely sensitive detection technique.
Simplified mechanism: LIGHT (λ=615 nm)
The discovery of ECL in water with sacrificial co-reactant species

Mechanism?
Behave differently depending on concentration, pH, electrode materials,…
W. Miao, J.-P. Choi, A. J. Bard J. Am. Chem. Soc. 2002, 124, 14478
M. Zhou, J. Heinze,K. Borgwarth, C. P. Grover ChemPhysChem 2003, 4, 1241
R. M. Wightman, S. P. Forry, R. Maus, D. Badocco, P. Pastore J. Phys. Chem. B 2004, 108, 19119
A) B)
C)
Competitive mechanistic pathways leading to ECL
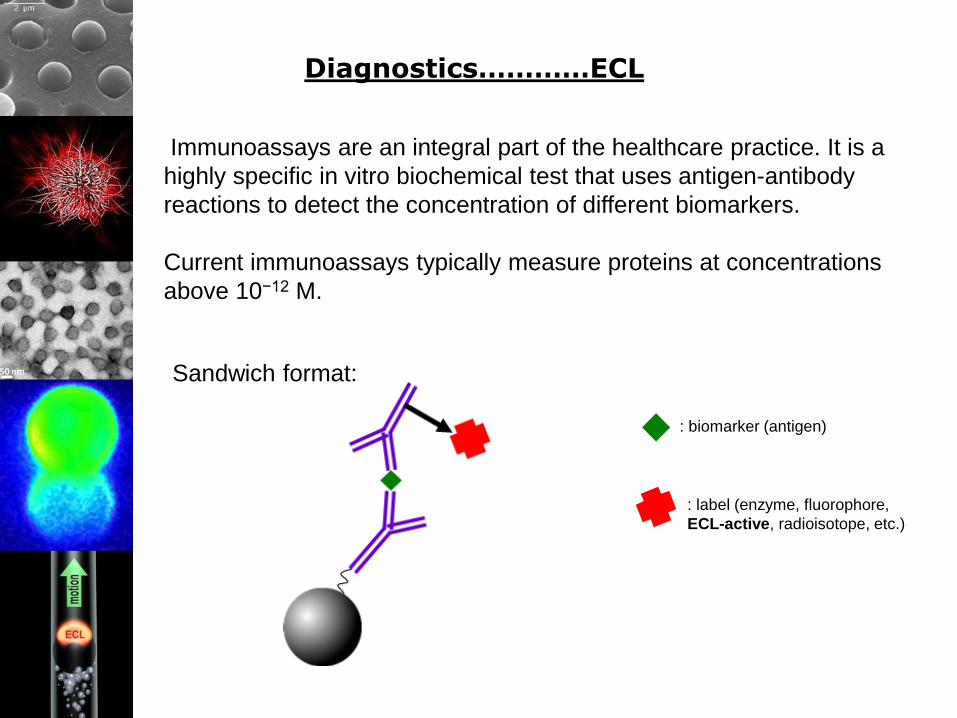
Diagnostics…………ECL
Immunoassays are an integral part of the healthcare practice. It is a
highly specific in vitro biochemical test that uses antigen-antibody
reactions to detect the concentration of different biomarkers.
Current immunoassays typically measure proteins at concentrations
above 10−12 M.
Sandwich format:
: label (enzyme, fluorophore,
ECL-active, radioisotope, etc.)
: biomarker (antigen)

Ru-TAGTM labels, beads, antibodies, and analytes are mixed in solution
and driven into the flow cell by simple fluidic path flow.
The flow cell is at the heart of the 2nd generation of Igen technology:

The complex molecules (made of Ru-TAG labels, antibodies, analyte, and
biotin) are captured by the magnetic beads coated with streptavidin.
Igen technology:

The magnetic field is applied to bring the beads closer to the electrode.
Igen technology:

When the electrical potential is applied to the electrode, ECL takes place.
The amount of light which depends on the analyte amount is measured by
the light detector.
Igen technology:
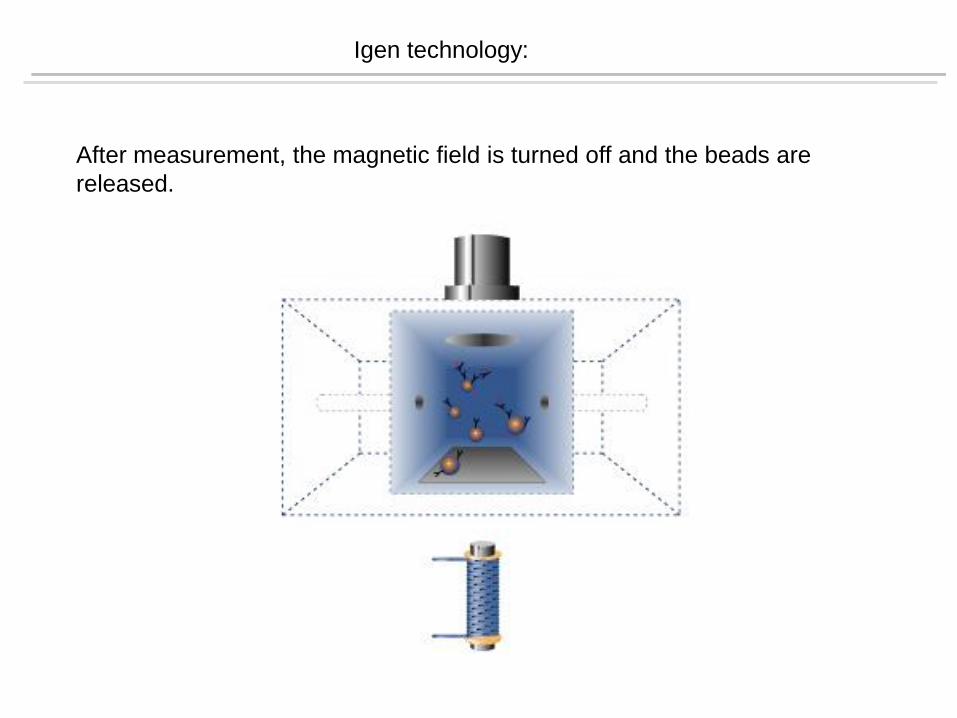
After measurement, the magnetic field is turned off and the beads are
released.
Igen technology:

After the beads are evacuated, the flow cell is washed and ready for
another measurement.
Igen technology:
No multiplexing (one analyte per test)

Time line of ECL
W. Miao Chem. Rev., 2008, 108, 2506
1964–1965: First experiments
1965: Theory
1966: Transients
1969: Magnetic field effects
1972: Ru(bpy)32+
1977: Oxalate
1981: Aqueous
1982: Ru(bpy)32+ polymer
1984: Ru(bpy)32+ label
1987: Tri-n-propylamine (TPrA)
1989: Bioassay
1993: Ultramicroelectrodes
2002: Semiconductive nanocrystals
2014: 3D ECL?

1 – Multiplexed bead-based ECL immunoassays
2 – Mechanism of bead-based ECL immunoassays
3 – ECL immunosensing at nanoelectrode arrays
4 – Stimuli-responsive ECL microgels
5 – Light-emitting swimmers and 3D ECL

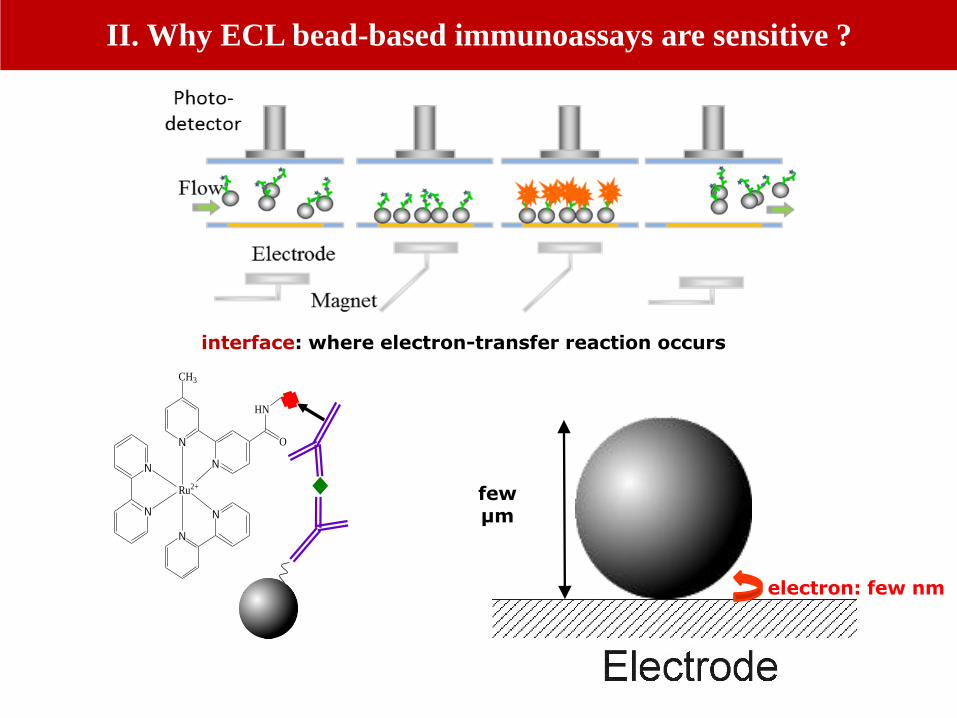
sample
antigen
biotinylated
detection Ab
SA-Ru
complex
TPA
redox 3 mm
bead
Ru(bpy)3+2
gold electrode
antibody
antigen
biotin
streptavidin
The principle: ECL imaging as readout mechanism
Deiss, F.; LaFratta, C. N.; Symer, M.; Blicharz, T. M.; Sojic, N.; Walt, D. R. J. Am. Chem. Soc. 2009, 131, 6088
I. Multiplexed ECL Sandwich Immunoassays
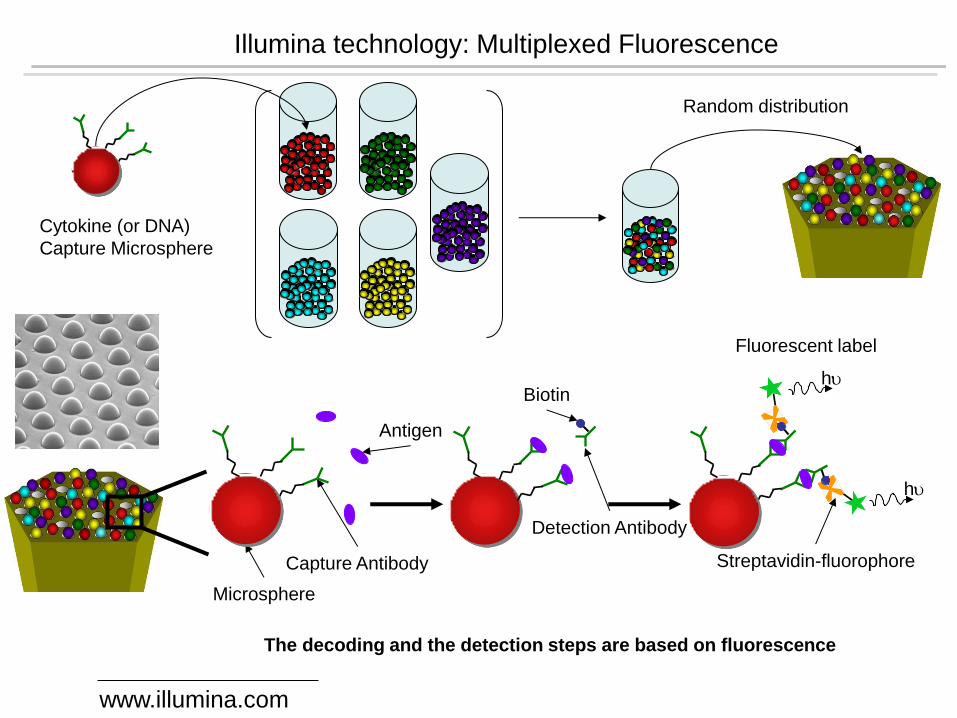
Illumina technology: Multiplexed Fluorescence
Capture Antibody
Detection Antibody
Antigen
Biotin h
h
Microsphere
Streptavidin-fluorophore
Cytokine (or DNA)
Capture Microsphere
Random distribution
www.illumina.com
The decoding and the detection steps are based on fluorescence
Fluorescent label

Optical fiber bundle: Chemical etching:
Microstructured gold-coated electrode comprising 50 000 microwells
I. Multiplexed ECL Sandwich Immunoassays
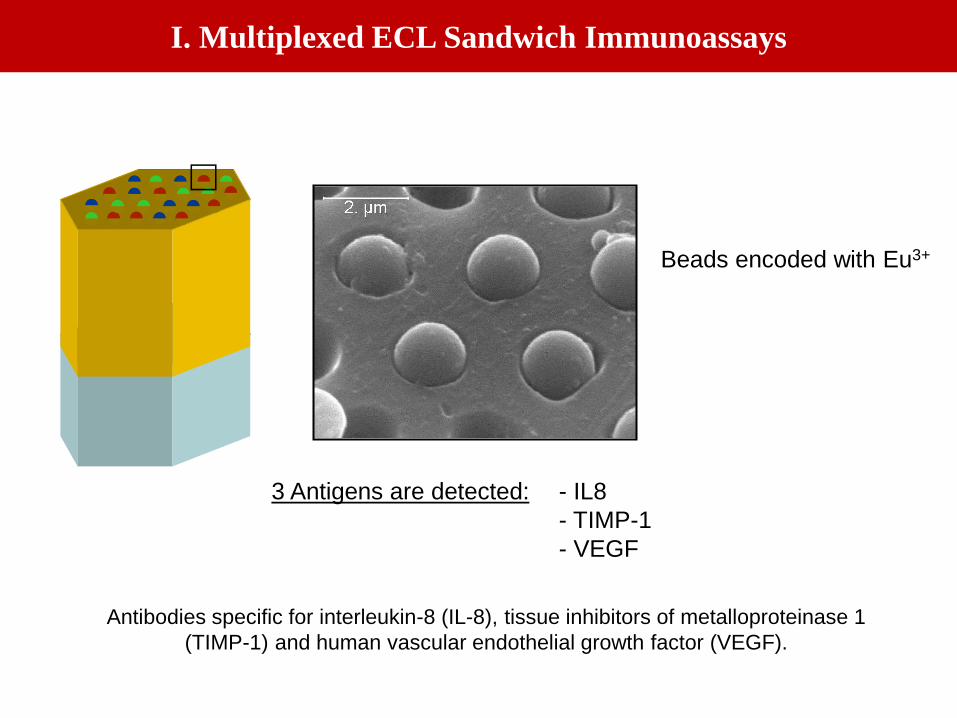
3 Antigens are detected: - IL8
- TIMP-1
- VEGF
Beads encoded with Eu3+
Antibodies specific for interleukin-8 (IL-8), tissue inhibitors of metalloproteinase 1
(TIMP-1) and human vascular endothelial growth factor (VEGF).
I. Multiplexed ECL Sandwich Immunoassays
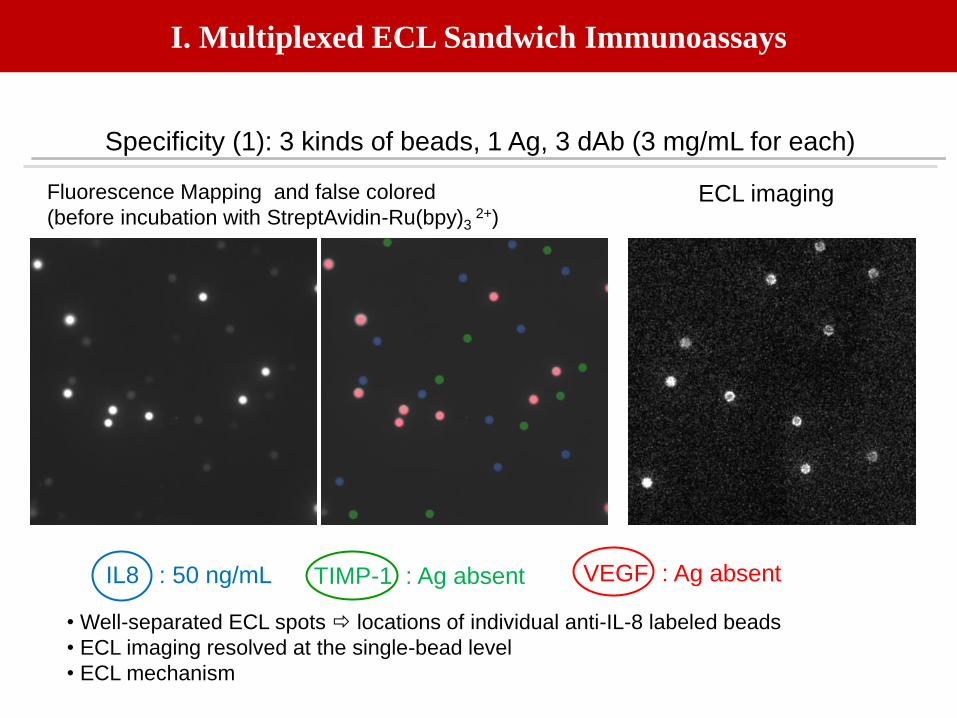
Fluorescence Mapping and false colored
(before incubation with StreptAvidin-Ru(bpy)3 2+)
Specificity (1): 3 kinds of beads, 1 Ag, 3 dAb (3 mg/mL for each)
IL8 : 50 ng/mL
TIMP-1 : Ag absent VEGF : Ag absent
ECL imaging
• Well-separated ECL spots locations of individual anti-IL-8 labeled beads
• ECL imaging resolved at the single-bead level
• ECL mechanism
I. Multiplexed ECL Sandwich Immunoassays

Cross reactivity
Ag Mw
(kDa)
C
(ng/mL)
C
(nmol/L)
IL8 8 50 6
VEGF 42 1000 24
TIMP-1 28 100 4
3 mg/mL for each dAb in cocktail
IL8
VEGF
TIMP-1
-0.2
0
0.2
0.4
0.6
0.8
1
IL 8 (50ng/mL)
VEGF (1μg/mL)
TIMP-1 (100ng/mL)
IL8
VEGF
TIMP-1
I. Multiplexed ECL Sandwich Immunoassays

Triplex : 3 kinds of beads, 3 Ag, 3 dAb
• ECL imaging as readout mechanism for multiplex sandwich assay
Fluorescence ECL
IL8 : 50 ng/mL TIMP-1 : 1.5 μg/mL VEGF : 1.5 µg/mL
Deiss, F.; LaFratta, C. N.; Symer, M.; Blicharz, T. M.; Sojic, N.; Walt, D. R. J. Am. Chem. Soc. 2009, 131, 6088
I. Multiplexed ECL Sandwich Immunoassays
N
N
N
NN
N
Ru2+
HN
O
CH3
interface: where electron-transfer reaction occurs
II. Why ECL bead-based immunoassays are sensitive ?
few µm
electron: few nm
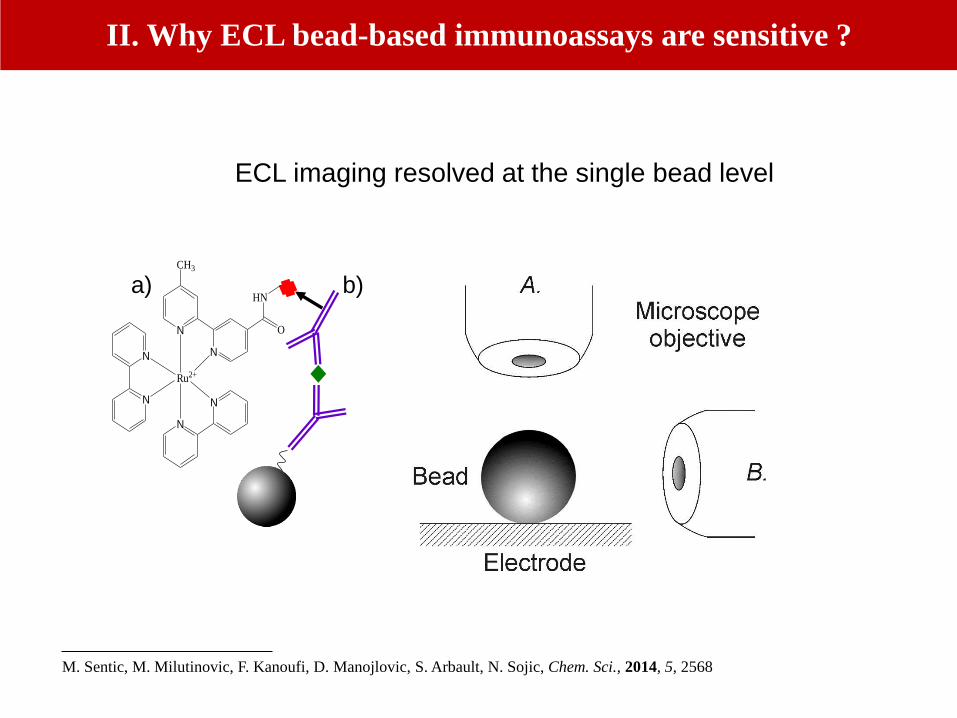
ECL imaging resolved at the single bead level
N
N
N
NN
N
Ru2+
HN
O
CH3
a) b) c)
M. Sentic, M. Milutinovic, F. Kanoufi, D. Manojlovic, S. Arbault, N. Sojic, Chem. Sci., 2014, 5, 2568
II. Why ECL bead-based immunoassays are sensitive ?

Top view:
ECL imaging resolved at the single bead level
PL ECL a)
b)
0.7 V 0.83 V 0.9 V 1.1 V
PS beads:
Magnetic
beads:
II. Why ECL bead-based immunoassays are sensitive ?
►The bead acts as an efficient lens focusing the light at their center.
► It concentrates the analytical signal and contributes to the sensitivity.
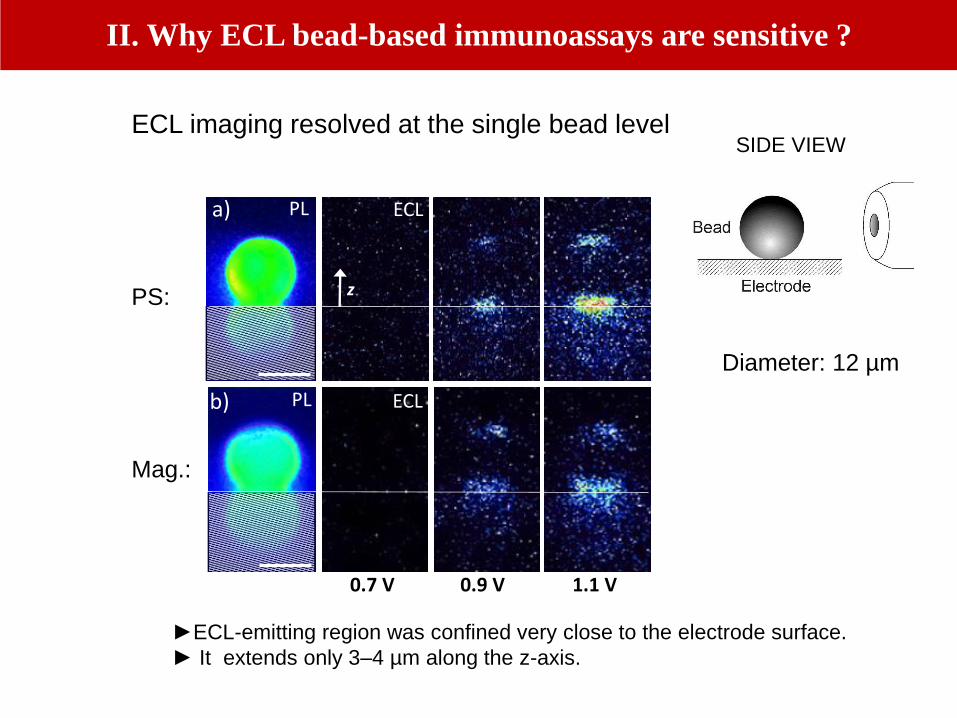
SIDE VIEW ECL imaging resolved at the single bead level
PL a)
ECL
PL b)
0.7 V 0.9 V 1.1 V
ECL
z PS:
Mag.:
II. Why ECL bead-based immunoassays are sensitive ?
Diameter: 12 µm
►ECL-emitting region was confined very close to the electrode surface.
► It extends only 3–4 µm along the z-axis.
ECL imaging resolved at the single bead level
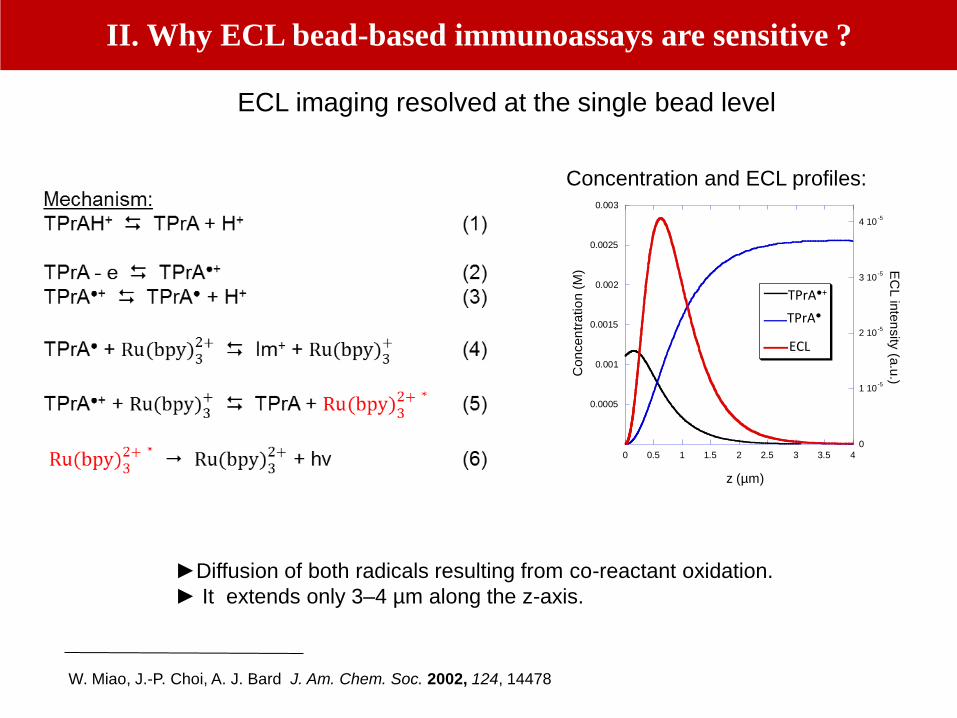
0.0005
0.001
0.0015
0.002
0.0025
0.003
0
1 10-5
2 10-5
3 10-5
4 10-5
0 0.5 1 1.5 2 2.5 3 3.5 4
TPrA
TPrA
E
ECL intensity
EC
L in
ten
sity
(a.u
.)Co
nce
ntr
atio
n (
M)
z (µm)
TPrA●+ TPrA● ECL
II. Why ECL bead-based immunoassays are sensitive ?
Concentration and ECL profiles:
►Diffusion of both radicals resulting from co-reactant oxidation.
► It extends only 3–4 µm along the z-axis.
W. Miao, J.-P. Choi, A. J. Bard J. Am. Chem. Soc. 2002, 124, 14478
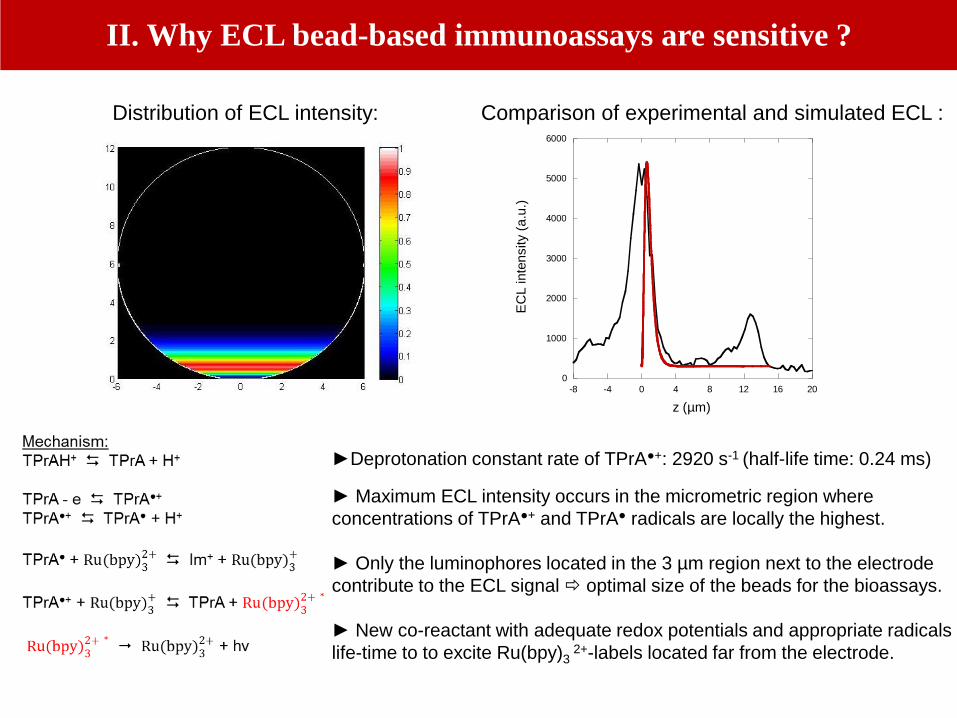
0
1000
2000
3000
4000
5000
6000
-8 -4 0 4 8 12 16 20
EC
L in
ten
sity (
a.u
.)
z (µm)
►Deprotonation constant rate of TPrA●+: 2920 s-1 (half-life time: 0.24 ms)
► Maximum ECL intensity occurs in the micrometric region where
concentrations of TPrA●+ and TPrA● radicals are locally the highest.
► Only the luminophores located in the 3 µm region next to the electrode
contribute to the ECL signal optimal size of the beads for the bioassays.
► New co-reactant with adequate redox potentials and appropriate radicals
life-time to to excite Ru(bpy)3 2+-labels located far from the electrode.
II. Why ECL bead-based immunoassays are sensitive ?
Distribution of ECL intensity: Comparison of experimental and simulated ECL :

Application: diagnosis of Celiac Disease (CD)
• Chronic, auto-immune disorder damaging Villi
of small intestine
• Genetically determined
• Affects bout 1% of the world population
• Triggered by ingestion of Gluten foods
US Pharmacist 2012
III. ECL immunosensing at nanoelectrode arrays
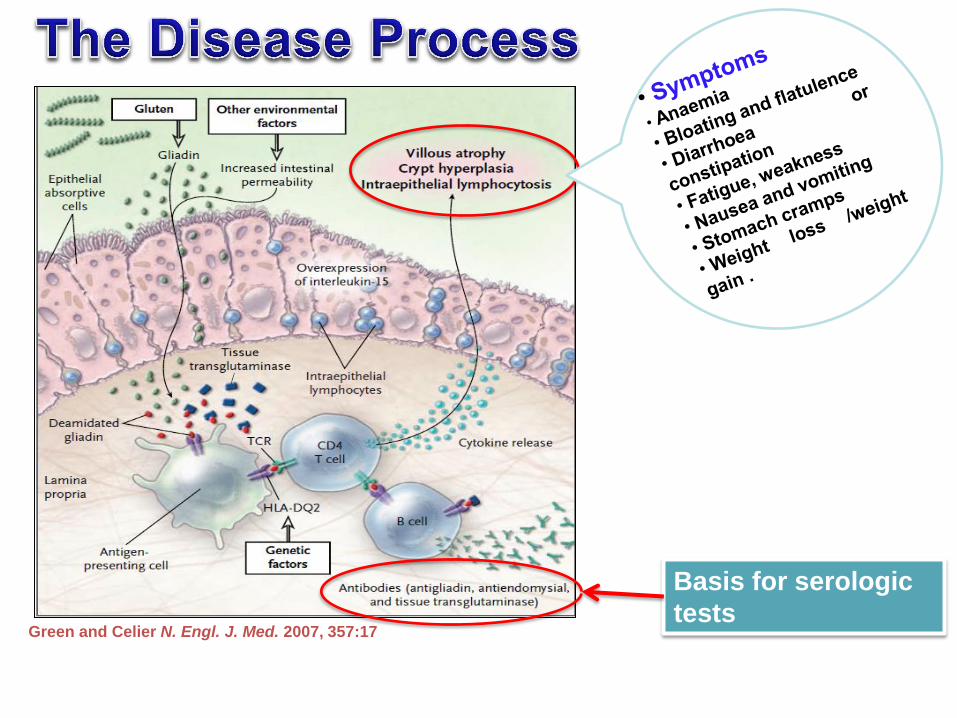
Green and Celier N. Engl. J. Med. 2007, 357:17
Basis for serologic
tests
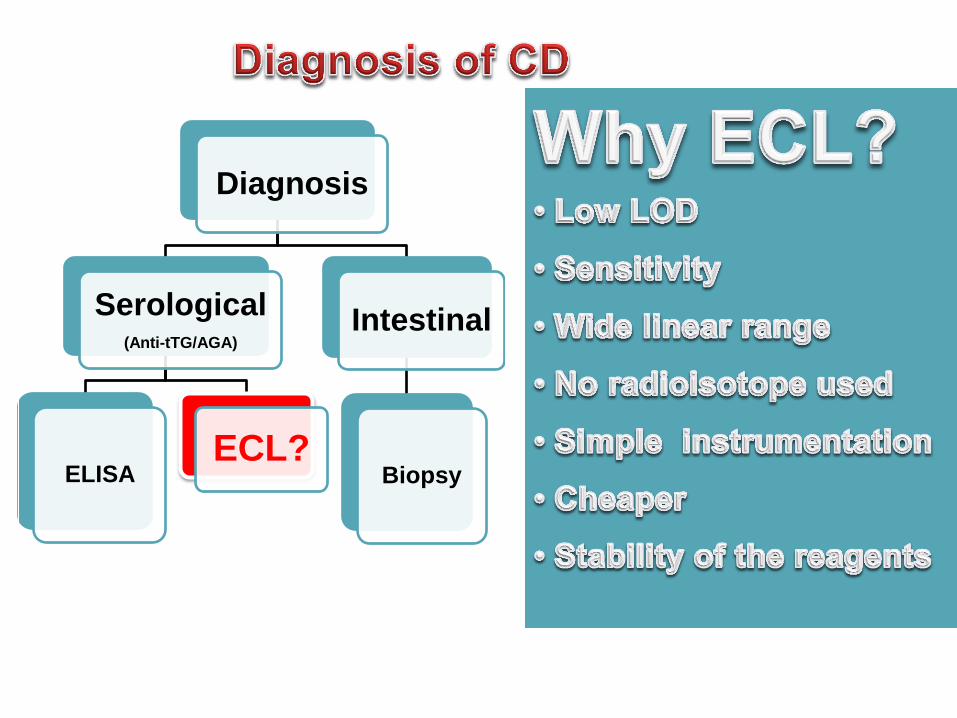
Diagnosis
Serological (Anti-tTG/AGA)
ELISA ECL?
Intestinal
Biopsy

• Transducer – PC* templated Au NEEs
• tTG (tissue TransGlutaminase) immobilized on the PC
• Anti-tTG captured by tTG (in the sample)
• Biot-secondary Ab reacted with Anti-tTG
*PC- track-etched polycarbonate membrane
III. ECL immunosensing at nanoelectrode arrays
Au nanoelectrode arrays:

Analyte (Anti-tTG) conc. vs ECL
• ECL recorded for different [anti-tTG]
• Calibration surve:
• linear from 1 ng/mL to 5 µg/mL
• with R2 of 0.9944
• Better reproducibility :
• minimal surface oxide formation when scan is reversed at < 1.0 V
•Tests on real samples
III. ECL immunosensing at nanoelectrode arrays

III. ECL immunosensing at nanoelectrode arrays
A) ECL signals of
representative serum
samples
B) Bar graph showing ECL
intensity vs serum samples
from 5 CD patients

50
IV. Stimuli-Responsive ECL Microgels
- Optical properties
- Porosity
- Water content
- Electrochemical properties
Modification of the physical properties:
Stimuli-responsive microgels: “smart” nanomaterials

51
Stimulus
OFF
ON
Swelling ratio depends on 3 parameters:
• Solvent-polymer interactions
• Cross-linking density
• Charge density
Microgels: 3-dimensional networks with the particle size of 100-1000 nm
IV. Responsive Microgels: Dynamic Systems
Phase transition is accompanied by a reversible, discontinuous volume change
in response to infinitesimal changes in environmental conditions (t°, pH,
composition, light, etc.).
Swollen state
Collapsed state

Example of poly(N-isopropylacrylamide) (pNIPAM)
Cross-linked pNIPAM
DT
T < VPTT
Hydrophilic
Swollen state
T > VPTT
Hydrophobic
Collapsed state
Hydrophobic
group
Hydrophilic
group
Linear pNIPAM
IV. Thermo-Responsive Hydrogels

IV. Synthesis of the ECL Microgels
N
N
H3C
N
NN
N
Ru
2+/3+
O
HN
R1
O
HN
HN
O
+ +
R2
x % y %
Radical
polymerization N
N
H3C
N
N
N
N
Ru
CH2 CH
O
NH
CH
H3C CH3
CH2 CH
O
NH
CH2
NH
O
CHCH2
CH2 CH
2+/3+
1-x-y x y
x
Sample R1 R2 x in feed
(mol. %)
y in feed
(mol. %)
y in
microgel
(mol. %)
VPTT
dH (nm)
in the swollen state
(PDI)
dH (nm)
in the collapsed
state
pNIPAM-1 Isopropyl H 1.6 1.3 0.59 33°C 130
(0.07) 65
F. Pinaud, L. Russo, S. Pinet, I. Gosse, V. Ravaine, N. Sojic. J. Am. Chem. Soc. 2013, 135, 5517

IV. ECL of the Thermo-Responsive Microgels
Cyclic voltammetry (a) and ECL signal (b)of pNIPAM microgels in PBS and 10
mM TPA at 25 °C (blue) and 37 °C (red). The Ru concentration is 50 µM.
-1.00E-05
0.00E+00
1.00E-05
2.00E-05
3.00E-05
4.00E-05
5.00E-05
0.2 0.4 0.6 0.8 1 1.2 1.4
-1000
0
1000
2000
3000
4000
5000
6000
7000
0.2 0.4 0.6 0.8 1 1.2 1.4
Current: ECL:
►Small increase of the oxidation waves after VPTT
►ECL emission at the oxidation potential of Ruthenium centers (1.1 V)
►ECL and PL spectra are identical same MLCT excited state
►Large enhancement of the ECL intensity in collapsed state
F. Pinaud, L. Russo, S. Pinet, I. Gosse, V. Ravaine, N. Sojic. J. Am. Chem. Soc. 2013, 135, 5517

►Reversible enhancement of the ECL signal
0
1 104
2 104
3 104
4 104
5 104
6 104
7 104
0 1 2 3 4 5 6 7 8
EC
L in
ten
sity (
a.u
.)
Collapsed state ( > VPTT)
Swollen state ( < VPTT)
IV. ECL of the Thermo-Responsive Microgels

IV. Characterization of the Microgel Particles
56
dH (nm)
Sample R1 R2 % Ru
(mol%)
VPTT (oC)
< VPTT > VPTT
pNNPAM n-propyl H 1.74 20 160 100
pNIPAM-1 Isopropyl H 0.59 33 130 65
pNIPAM-2 Isopropyl H 1.99 33 150 80
pNIPAM / pNIPMAM
Isopropyl H/CH3 0.5 40 195 105
60
80
100
120
140
160
180
200
10 15 20 25 30 35 40 45 50
Temperature (°C)
Dia
me
ter
(nm
)
IV. ECL of the Thermo-Responsive Microgels
60
80
100
120
140
160
180
20010 15 20 25 30 35 40 45 50
Dia
me
ter
(nm
)
a)
0
20
40
60
80
100
10 15 20 25 30 35 40 45 50
No
rma
lize
d E
CL
sig
na
l
Temperature (°C)
b)
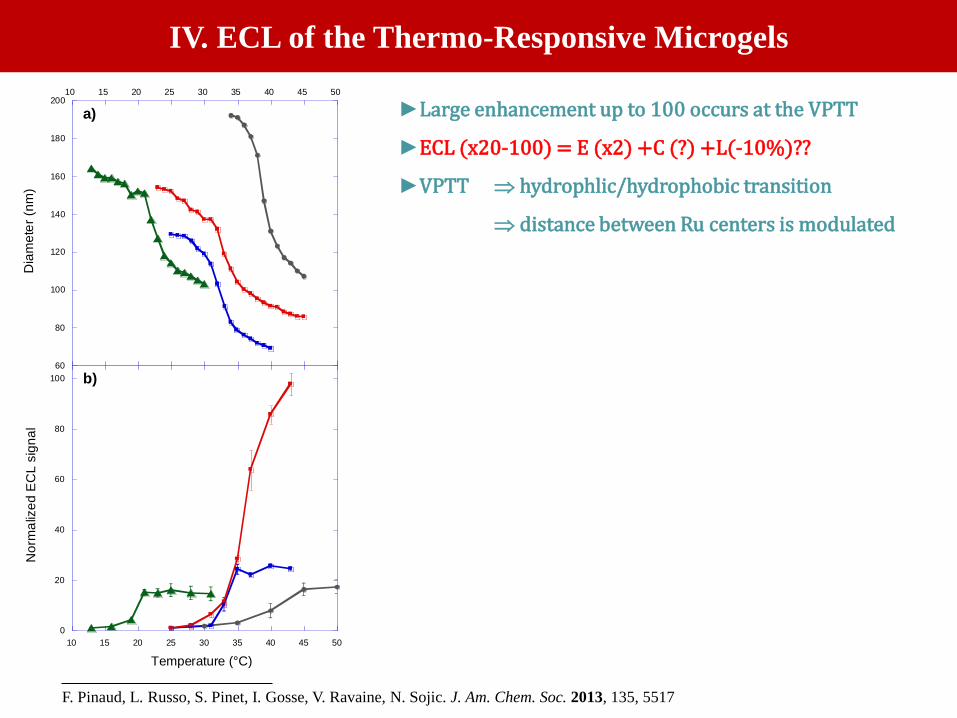
►Large enhancement up to 100 occurs at the VPTT
►ECL (x20-100) = E (x2) +C (?) +L(-10%)??
►VPTT hydrophlic/hydrophobic transition
distance between Ru centers is modulated
F. Pinaud, L. Russo, S. Pinet, I. Gosse, V. Ravaine, N. Sojic. J. Am. Chem. Soc. 2013, 135, 5517

IV. ECL of the Thermo-Responsive Microgels
60
80
100
120
140
160
180
20010 15 20 25 30 35 40 45 50
Dia
me
ter
(nm
)
a)
0
20
40
60
80
100
10 15 20 25 30 35 40 45 50
No
rma
lize
d E
CL
sig
na
l
Temperature (°C)
b)
0
0.5
1
1.5
2
2.5
3
3.5
2 3 4 5 6 7 8 9 10
pNIPAM-1pNIPAM-2
NIPMAMNNPAM
No
rma
lized
EC
L in
ten
sity
(a
.u.)
Distance (nm)
►Electron-hopping in the microgels?
► Chemical step? Bimolecular reactions to generate the
excited ECL state?
►Large enhancement up to 100 occurs at the VPTT
►ECL (x20-100) = E (x2) +C (?) +L(-10%)??
►VPTT hydrophlic/hydrophobic transition
distance between Ru centers is modulated
F. Pinaud, L. Russo, S. Pinet, I. Gosse, V. Ravaine, N. Sojic. J. Am. Chem. Soc. 2013, 135, 5517

59
• ECL-Resonance Energy Transfer
Donor Accepto
r
d >> 1-10 nm
No energy transfer
Spectral overlap
ECL
Donor
Accepto
r
d ≈ 1-10 nm
Energy transfer
dipole-dipole interaction
400 500 600 700 800
0,0
0,2
0,4
0,6
0,8
1,0
wavelenth (nm)
Donor:
Ru complex
Acceptor:
Cyanine 5
F. Pinaud, R. Millereux, P. Vialar-Trarieux, B. Catargi, S. Pinet, I. Gosse, N. Sojic,V. Ravaine
J. Phys. Chem. B 2015, DOI: 10.1021/acs.jpcb.5b06920
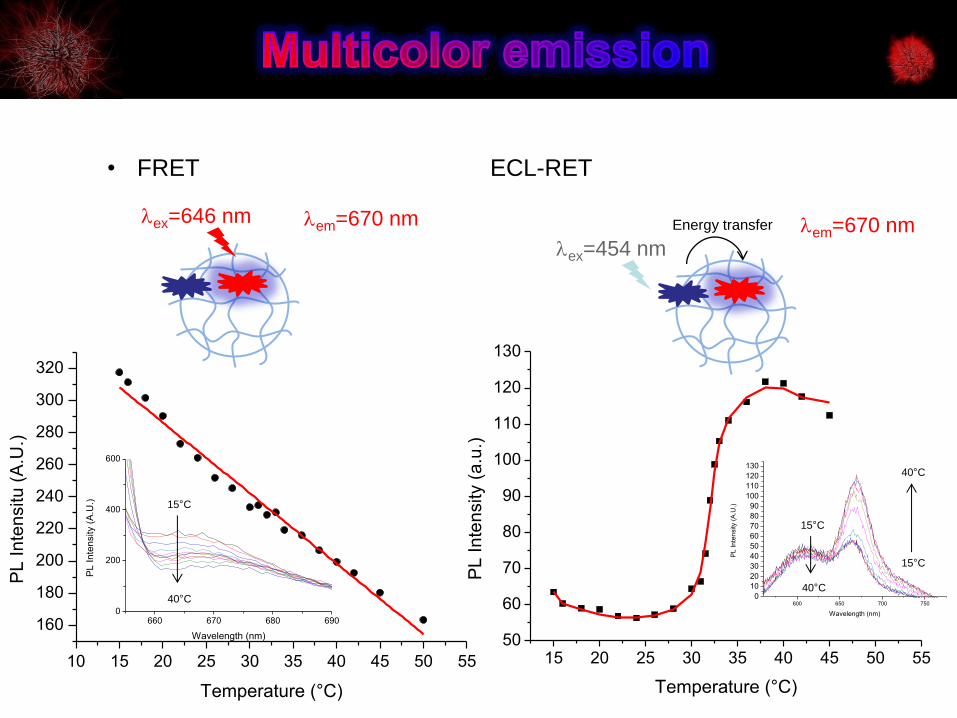
• FRET ECL-RET
10 15 20 25 30 35 40 45 50 55
160
180
200
220
240
260
280
300
320
PL
In
ten
situ
(A
.U.)
Temperature (°C)
lex=646 nm lem=670 nm lem=670 nm lex=454 nm
Energy transfer
600 650 700 750
0
10
20
30
40
50
60
70
80
90
100
110
120
130
PL
In
ten
sity (
A.U
.)
Wavelength (nm)
15°C
40°C
15°C
40°C
660 670 680 6900
200
400
600
PL
In
ten
sity (
A.U
.)
Wavelength (nm)
15°C
40°C
15 20 25 30 35 40 45 50 5550
60
70
80
90
100
110
120
130
PL
In
ten
sity (
a.u
.)
Temperature (°C)

V. Light-Emitting Swimmers
(1966)

« Swimmers » – Controlled dynamic system
Design of micro- and nano-objets depends on the strategy chosen to drive the motion.
Chemical fueling: based on the use of a chemical fuel (H2O2)
Conical microengine
Gao W.; Sattayasamitsathis S.; Orozco J.; Wang J.; J. Am. Chem. Soc. 2011, 133, 11862
V. Light-Emitting Swimmers
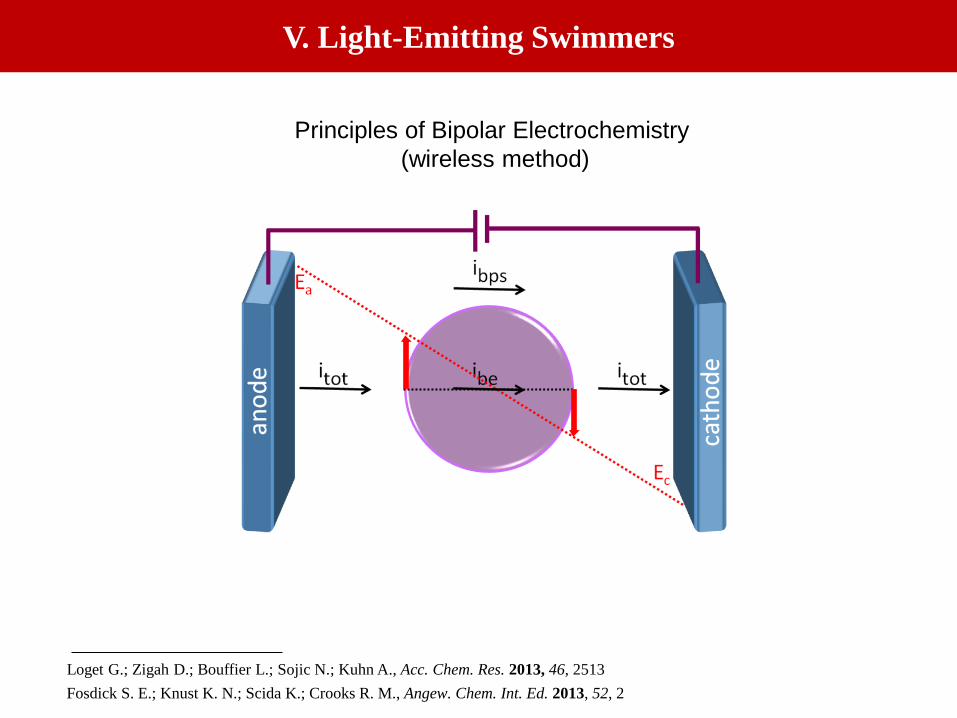
Principles of Bipolar Electrochemistry
(wireless method)
V. Light-Emitting Swimmers
Loget G.; Zigah D.; Bouffier L.; Sojic N.; Kuhn A., Acc. Chem. Res. 2013, 46, 2513
Fosdick S. E.; Knust K. N.; Scida K.; Crooks R. M., Angew. Chem. Int. Ed. 2013, 52, 2
Principles of Bipolar Electrochemistry
(wireless method)
V. Light-Emitting Swimmers
L
d DVmax = E.d/ L
Polarization of conducting object, exposed to an electric field, combine in a synergetic
way two redox reactions on at the extremities of the object , if ΔVmax is important
enough. This phenomenon can be used for propulsion of micro- and nano-objects.
Maximum polarization:
Loget G.; Zigah D.; Bouffier L.; Sojic N.; Kuhn A., Acc. Chem. Res. 2013, 46, 2513
Fosdick S. E.; Knust K. N.; Scida K.; Crooks R. M., Angew. Chem. Int. Ed. 2013, 52, 2

V. Light-Emitting Swimmers
Asymmetric light-emitting electrochemical swimmer
Scheme of the set-up used for levitation experiments.
Cyclic voltammogram (blue) and ECL signal (red) of 0.5
mM Ru(bpy)32+ in the presence of 100 mM TPrA with
100 mM phosphate buffer (pH=7.4) on a home-made
glassy carbon electrode. Scan rate: 100 mV/s.

V. Light-Emitting Swimmers
Asymmetric light-emitting electrochemical swimmer
The synergetic reduction of H2O at the
cathodic pole (bottom of the bead) and
oxidation of the ECL reagents at the anodic
pole (top of the bead) induces simultaneous
motion and light emission of the glassy
carbon bead in a capillary.
M. Sentic, G. Loget, D. Manojlovic, A. Kuhn, N. Sojic, Angew. Chem. Int. Ed. 2012, 51, 11284
H2O(l) + e- → ½ H2(g) + OH-(l)

V. Light-Emitting Swimmers
Bipolar levitation of an ECL-emitting bead
V. Light-Emitting Swimmers
Bipolar levitation of an ECL-emitting glassy carbon bead
Series of optical images showing
a GC bead emitting ECL at
different times during its motion.
It is exposed to an external
electric field of 25.5 V cm-1.
The bead is placed in a U-shaped
cell, filled with 100 mM PBS
containing 0.5 mM Ru(bpy)32+,
100 mM TPrA and a few drops
of surfactant.
Inset: Plot showing the height evolution h as a function of time t.
M. Sentic, G. Loget, D. Manojlovic, A. Kuhn, N. Sojic, Angew. Chem. Int. Ed. 2012, 51, 11284
CATHODE (–)
ANODE (+)
δ–
δ+
ECL (425 nm)
H2O
H2O2
H2O2 O2 Luminol
3-Aminophthalate*
MO
TIO
N
Luminol ECL – blue emitting ’’swimmer’’
L. Bouffier, D. Zigah, C. Adam, M. Sentic , Z. Fattah, D. Manojlovic, A. Kuhn, N. Sojic, ChemElectroChem, 2014, 1, 95
Tuning the wavelenght of light emission - luminophore
the motion (horizontal & vertical)
V. Light-Emitting Swimmers
1s 4s 7s
MOTION

V. Light-Emitting Swimmers
Electrochemiluminescent swimmers for dynamic glucose sensing
M. Sentic, S. Arbault, B. Goudeau, D. Manojlovic, A. Kuhn, L. Bouffier, N. Sojic. Chem. Comm., 2014, 20, 10161

V. Light-Emitting Swimmers
Switching-on of ECL during the swimmer motion
in a vertical glucose concentration gradient

V. Light-Emitting Swimmers
Switching-on of ECL during the swimmer motion
in a vertical glucose concentration gradient

L
d
VI. 3D ECL
ECL
(Left) Optical image showing 30-µm diameter GC beads immobilized in a gel inside a
6-mm long capillary. (Right) Bulk ECL generated by all the beads.
ECL emission by the carbon beads in a capillary.

VI. 3D ECL
(Left) White-light image showing a dispersion of CNTs in a 6-mm long capillary.
(Right) Bulk ECL generated by the CNTs.
VI. Dual-color 3D ECL: Ru(bpy)32+ / Luminol
O2
Ru(bpy)32+
δ+ δ-
Ru(bpy)32+ *
H2O
DBAE
O2
Luminol δ+ δ-
3-Aminophthalate*
H2O
H2O2
O2
+
(A)
P
1 mm
(C) (B)
white light in the dark
A. de Poulpiquet, B. Diez-Buitrago, M. Milutinovic, B. Goudeau, L. Bouffier, S. Arbault, A. Kuhn, N. Sojic
ChemElectroChem 2015, DOI: 10.1002/celc.201500402

76
VI. Bi-enzymatic 3D ECL detection
2 H+
H2
Glucose
Glucono-
lactone
NAD+
NADH
Ru(bpy)32+*
Ru(bpy)32+
(B)
δ+ δ-
GDH
Choline
Betaine
O2
H2O2
3-Aminophthalate*
Luminol
(C)
H2O2
H2O
δ+ δ-
(A)
Graphite feeder electrodes
Glass capillary (ø 6 mm)
δ+ δ- e-
oxidation reduction
Ch.Ox. 3D ECL produced by a bi-enzymatic system in a suspension of
carbon microbeads. Images of the system under white light
before application of the electric field and ECL image in the dark.

• ECL swimmers
• Control of the ECL shapes
• Multiplexed ECL immunoassays
• ECL imaging resolved at the single-bead level
• Decorrelation of the decoding (fluorescence) and detection (ECL) processes
• Stimuli-responsive ECL microgel nanoparticles
•Biosensing swimmers
•Dynamic ECL immunoassays
•ECL mechanism at the single-bead level
•ECL-RET microgels
Conclusions & Perspectives
M. SENTIC, G. LOGET,
M. MILUTINOVIC, C. ADAM, F. PINAUD,
A. KUHN, V. RAVAINE, L. BOUFFIER, D. ZIGAH, S. ARBAULT
D. MANOJLOVIC
H. B. HABTAMU, P. UGO
D. R. WALT
F. KANOUFI
COLLABORATIONS