nesdc economic report · 2019-02-18 · the thai economy in the fourth quarter of 2018 nesdc...
TRANSCRIPT

NESDC ECONOMIC REPORT NESDC ECONOMIC REPORT
www.nesdb.go.th 962 Krung Kasem Road, Pomprab, Bangkok 10100 Office of the National Economic and Social Development Council (NESDC)
Press Release 9.30 a.m. Feb 18, 2019
Thai Economic Performance in Q4 and 2018 and Outlook for 2019
Macroeconomic Strategy and Planning Office
The Thai economy in the fourth quarter of 2018 expanded by 3.7 percent (%YoY), accelerating from 3.2 percent in the previous quarter. After seasonally adjusted, the economy grew by 0.8 percent from the third quarter (%QoQ sa).
On the expenditure side, the expansion was supported by the speed up in private consumption and private investment, and the improvement of export of goods and services, while government consumption softened. On the production side, the manufacturing, the wholesale and retail trade, the hotel and restaurants, and the transportation and communication sectors accelerated while the agriculture, and construction sectors slowed down.
In 2018, The Thai economy expanded by 4.1 percent, up from 4.0 percent in 2017 and was recorded as the fastest expansion in 6 years. Export value grew by 7.7 percent while private consumption and total investment grew by 4.6 and 3.8 percent, respectively. Headline inflation averaged at 1.1 percent and the current account recorded a surplus of 7.4 percent of GDP.
The Thai economy in 2019 is projected to grow in the range of 3.5 – 4.5 percent, supported by (i) a favorable growth momentum of private consumption, (ii) an improvement of private investment attributed by rising capacity utilization and increased BOI’s investment applications, (iii) an acceleration of public investment following progresses of key public infrastructure projects, (iv) a recovery of tourism sector in line with normalizing trend of tourist numbers and receipts, (v) a clearer redirection of global trade, production, and investment which will help ease the impacts from global slowdown. All in all, it is expected that export value will grow by 4.1 percent, and private consumption and total investment will grow by 4.2 and 5.1 percent, respectively. Headline inflation is forecasted to be in the range of 0.5 – 1.5 percent and the current account will record a surplus of 6.2 percent of GDP.
Economic management for the year 2019 should prioritize (1) Fostering export sector to reach not less than 5.0 percent growth rate by focusing on (i) supporting export products that would benefit from the trade protection measures and assisting affected exporters as well as monitoring changes in key import products subjected to the tariffs imposed by the US and China, (ii) operating foreign trade policies to abide closely by the world trade rules and key trading partners’ regulations, (iii) negotiating new trade agreement, especially with the regional countries, and (iv) promoting hedging strategy among exporters as to reduce risks from exchange rate volatility together with reducing cost and facilitating the exporting process. (2) Promoting a recovery of tourism sector by restoring tourists’ perception on safety standard, accommodating tourists activities and reducing congestion in major tourist destination, promoting tourism packages targeted at high-income and long-distance tourists, improving distribution of tourism revenue to secondary cities and local communities, as well as connecting with other key destinations in the region and campaigning Thais to travel within the country. (3) Maintaining economic momentum from government expenditure and public investment by (i) expediting disbursements of the FY2019 government’s capital budget, the state-owned enterprises’ capital budget, and the carry-over budget to reach the disbursement rates of no less than 70.0, 80.0 and 75.0 percent, respectively. (4) Supporting expansion of private investment by (i) fostering export growth to propel higher capacity utilization rate which will drive investment in manufacturing sector, (ii) encouraging entrepreneurs especially those affected by trade protection measures to increase their production capacity in Thailand and motivating affected foreign investors to relocate their production bases to Thailand, (iii) steering public investment projects. (5) Supporting small farmers, low income groups, SMEs and local economies. (6) Preparing the labor force, both in terms of quantity and quality, to adequately support economic expansion, especially target industries and those that can potentially leverage opportunities from international manufacturing facility relocation.
Economic Projection of 2019
(%YoY)
2017 2018 Projection
Year Year Q3 Q4 2019
GDP (CVM) 4.0 4.1 3.2 3.7 3.5 – 4.5
Investment1/ 1.8 3.8 3.9 4.2 5.1
Private 2.9 3.9 3.8 5.5 4.7
Public -1.2 3.3 4.2 -0.1 6.2
Private Consumption 3.0 4.6 5.2 5.3 4.2
Government Consumption 0.1 1.8 1.9 1.4 2.2
Export of Goods2/ 9.8 7.7 2.6 2.3 4.1
Volume2/ 6.0 4.2 -0.4 0.7 3.1
Import of Goods2/ 13.2 14.3 17.0 7.5 6.1
Volume2/ 7.2 8.2 10.2 4.6 4.6
Current Account to 11.0 7.4 3.4 6.6 6.2
GDP (%)
Inflation 0.7 1.1 1.5 0.8 0.5 – 1.5
Note: 1/ Investment means Gross Fixed Capital Formation 2/ base on the Bank of Thailand’s data

Macroeconomic Strategy and Planning Office
NESDC Economic Outlook
Feb 18, 2019 2
Private consumption expenditure favorably expanded, in line with the more broad-based expansion
of the overall economic activities and income conditions, low inflation and interest rates, and
government measures to support low income group. In the fourth quarter of 2018, private consumption
expenditure firmly expanded by 5.3 percent, compared with a 5.2 percent growth in the previous quarter.
The private consumption expenditure of durable goods increased, aligned with the expansion of passenger
car sales by 9.8 percent. Besides, consumption for other consumer goods, particularly semi-durable goods
and non-durable goods also accelerated as seen from sales of semi-durables index, the import of textile
index, sales of benzene, gasohol & diesel index, and household electricity consumption index, which grew
by 6.8, 23.2, 5.8 and 7.8 percent, respectively. The expansion of private consumption expenditure in this
quarter was supported by (i) the favorable improvement of overall income conditions, which was in line
with the strengthening employment conditions as observed in the fourth quarter of 2018 that the employ
persons has been increasing for 3 consecutive quarters, and therefore unemployment rate declined to the
lowest level in 12 quarters, (ii) the more broad-based expansion for the overall economic activities, (iii)
consistently low inflation and interest rates, and (iv) government measures to support low income group.
Consumer Confidence Index pertaining the overall economic situation stood at 67.4.
In 2018, private consumption expenditure expanded by 4.6 percent, the highest pace in 6 years, compared
with 3.0 percent in 2017.
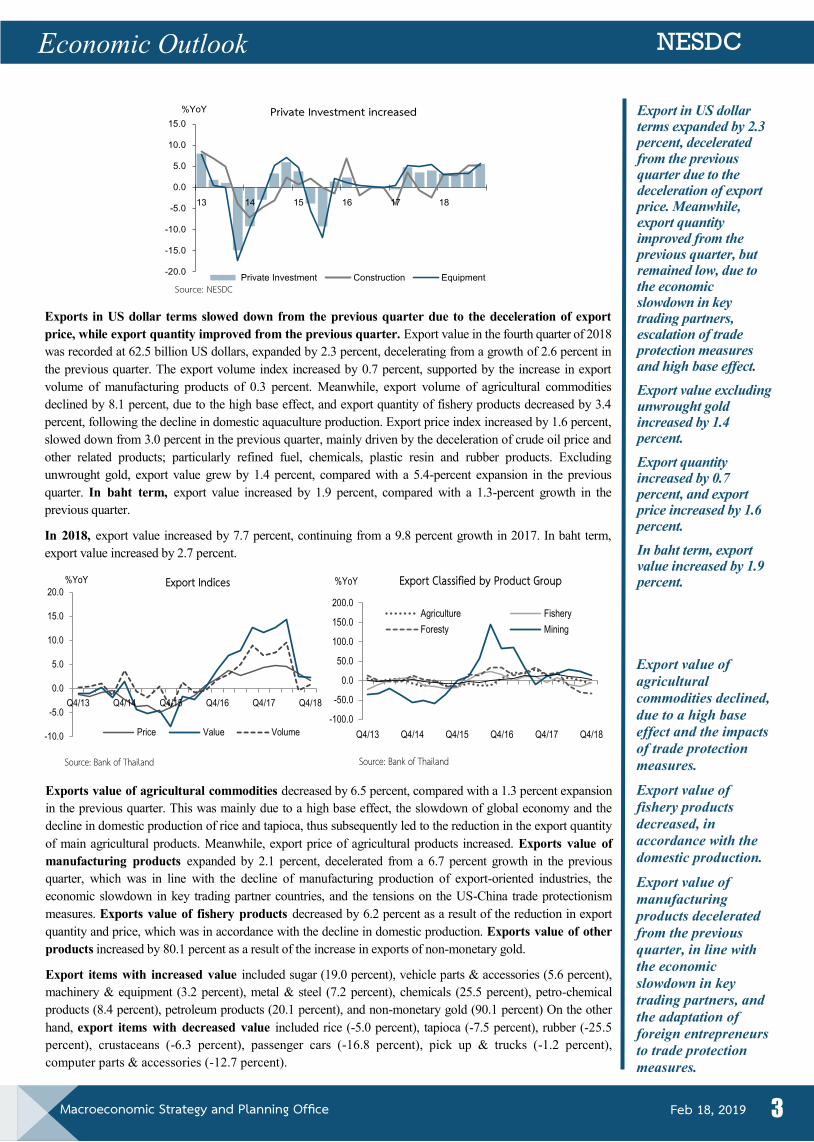
Private investment accelerated, supported by the acceleration of investment in machinery and
equipment, which continued to accelerate for four consecutive quarters, together with the continual
expansion of investment in construction. In the fourth quarter of 2018, private investment grew by 5.5
percent, accelerated from a 3.8 percent growth in the previous quarter. The investment in machinery and
equipment grew by 5.6 percent, accelerated from 3.4 percent in the previous quarter. This was consistent
with 4.9, 6.9, and 2.7 percent growth of domestic machinery sales (in 2010 price), newly registered motor
vehicles for investment purposes, and import of capital goods (in 2010 price) respectively. The expansion
of investment in machinery and equipment was in accordance with the increased in capacity utilization
rate of manufacturing sectors, and the improvement of business sentiment, as observed in the fourth
quarter that the total value of projects applied for the investment promotion made to Board of Investment
was recorded at 528 billion baht, increased by 103.9 percent, in particular, the value of projects applied for
the investment promotion in Eastern Economic Corridor (EEC), which increased by 146.5 percent.
The investment in construction maintained its strong growth momentum of 5.1 percent, compared with a
5.2 percent growth in the previous quarter, in line with a 7.9 percent increase of the sales of construction
materials, together with the progress of public infrastructure of infrastructure projects. The Business
Sentiment Index (BSI) stood at 50.7.
In 2018, private investment expanded by 3.9 percent, the highest pace in 6 years, where investment in
machinery and equipment expanded by 3.9 percent, and investment in construction increased by 4.1
percent.
1. The Thai Economy in Q4/2018 and 2018
In the fourth quarter of 2018, private consumption expenditure favorably grew, private investment continually accelerated. Meanwhile, export of goods and services improved from the previous quarter.
Expenditure side:
Private consumption
expenditure favorably
grew, in line with the
more broad - based
expansion of overall
income conditions, low
inflation and interest
rates, and government
measures to support
low income group.
Private consumption
expenditure of durable
goods increased,
aligned with the
expansion of passenger
car sales. Besides,
consumption of semi-
durable goods and
non-durable goods
accelerated.
Consumer Confidence
Index stood at 67.4.
Private investment increased by 5.5 percent, supported by the acceleration of investment in machinery and equipment, together with the continual expansion of investment in construction. This was in accordance with the increased in capacity utilization rate of manufacturing sectors, the improvement of business sentiment, and the progress of public infrastructure projects.
40
45
50
55
60
65
70
75
80
-6
-4
-2
0
2
4
6
8
Index%YoY
Private Consumption Expenditure grew
Private consumption expenditure (LHS)
Consumer Confidence Index (RHS)
Source: NESDC, University of the Thai Chamber of Commerce Source: NESDC, BOT, Department of Energy Business
-100.0
-50.0
0.0
50.0
100.0
150.0
-6.0
-4.0
-2.0
0.0
2.0
4.0
6.0
8.0
%YoY
Private Consumption Expenditure and Key Indicators
Private Consumption Expenditure (LHS)
Sales of benzene, gasohol and diesel index
Household electricity consumption index
Sales of passenger cars
Macroeconomic Strategy and Planning Office
NESDC Economic Outlook
Feb 18, 2019 3
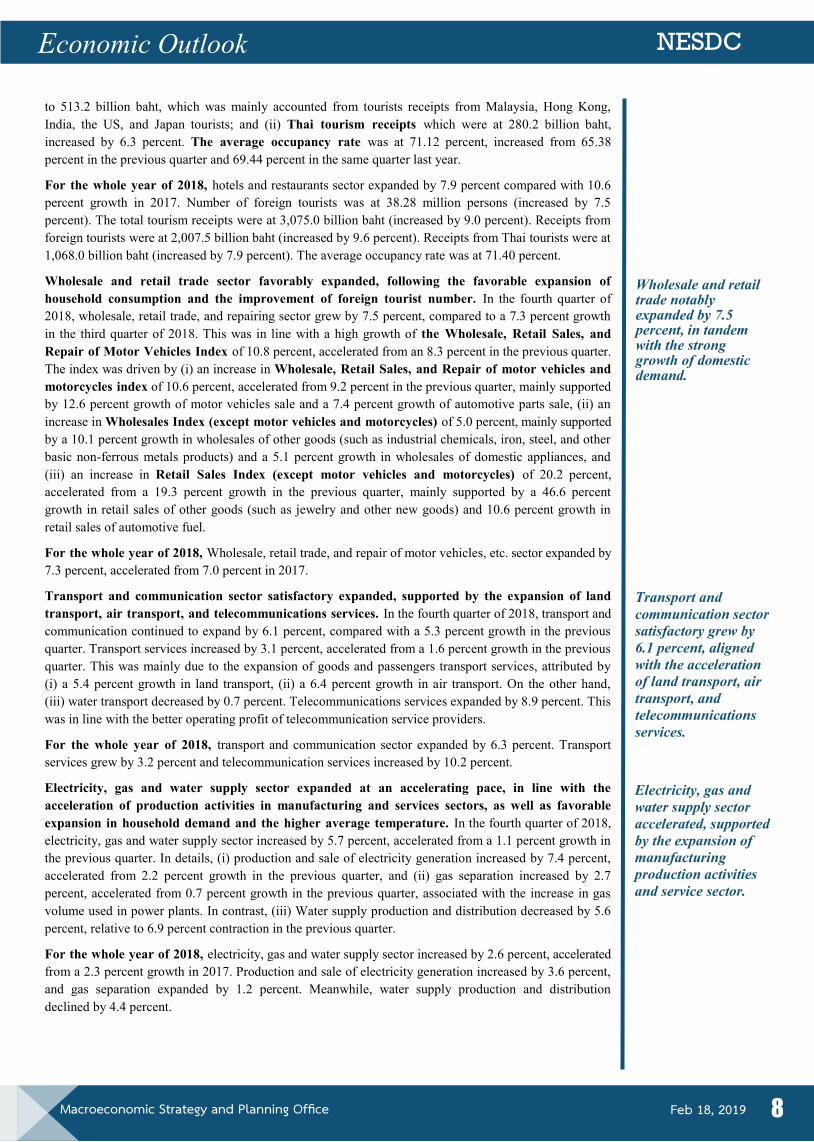
Exports in US dollar terms slowed down from the previous quarter due to the deceleration of export
price, while export quantity improved from the previous quarter. Export value in the fourth quarter of 2018
was recorded at 62.5 billion US dollars, expanded by 2.3 percent, decelerating from a growth of 2.6 percent in
the previous quarter. The export volume index increased by 0.7 percent, supported by the increase in export
volume of manufacturing products of 0.3 percent. Meanwhile, export volume of agricultural commodities
declined by 8.1 percent, due to the high base effect, and export quantity of fishery products decreased by 3.4
percent, following the decline in domestic aquaculture production. Export price index increased by 1.6 percent,
slowed down from 3.0 percent in the previous quarter, mainly driven by the deceleration of crude oil price and
other related products; particularly refined fuel, chemicals, plastic resin and rubber products. Excluding
unwrought gold, export value grew by 1.4 percent, compared with a 5.4-percent expansion in the previous
quarter. In baht term, export value increased by 1.9 percent, compared with a 1.3-percent growth in the
previous quarter.
In 2018, export value increased by 7.7 percent, continuing from a 9.8 percent growth in 2017. In baht term,
export value increased by 2.7 percent.
Exports value of agricultural commodities decreased by 6.5 percent, compared with a 1.3 percent expansion
in the previous quarter. This was mainly due to a high base effect, the slowdown of global economy and the
decline in domestic production of rice and tapioca, thus subsequently led to the reduction in the export quantity
of main agricultural products. Meanwhile, export price of agricultural products increased. Exports value of
manufacturing products expanded by 2.1 percent, decelerated from a 6.7 percent growth in the previous
quarter, which was in line with the decline of manufacturing production of export-oriented industries, the
economic slowdown in key trading partner countries, and the tensions on the US-China trade protectionism
measures. Exports value of fishery products decreased by 6.2 percent as a result of the reduction in export
quantity and price, which was in accordance with the decline in domestic production. Exports value of other
products increased by 80.1 percent as a result of the increase in exports of non-monetary gold.
Export items with increased value included sugar (19.0 percent), vehicle parts & accessories (5.6 percent),
machinery & equipment (3.2 percent), metal & steel (7.2 percent), chemicals (25.5 percent), petro-chemical
products (8.4 percent), petroleum products (20.1 percent), and non-monetary gold (90.1 percent) On the other
hand, export items with decreased value included rice (-5.0 percent), tapioca (-7.5 percent), rubber (-25.5
percent), crustaceans (-6.3 percent), passenger cars (-16.8 percent), pick up & trucks (-1.2 percent),
computer parts & accessories (-12.7 percent).
Export in US dollar terms expanded by 2.3 percent, decelerated from the previous quarter due to the deceleration of export price. Meanwhile, export quantity improved from the previous quarter, but remained low, due to the economic slowdown in key trading partners, escalation of trade protection measures and high base effect.
Export value excluding unwrought gold increased by 1.4 percent.
Export quantity increased by 0.7 percent, and export price increased by 1.6 percent.
In baht term, export value increased by 1.9 percent.
Export value of
agricultural
commodities declined,
due to a high base
effect and the impacts
of trade protection
measures.
Export value of
fishery products
decreased, in
accordance with the
domestic production.
Export value of
manufacturing
products decelerated
from the previous
quarter, in line with
the economic
slowdown in key
trading partners, and
the adaptation of
foreign entrepreneurs
to trade protection
measures.
Source: Bank of Thailand
-10.0
-5.0
0.0
5.0
10.0
15.0
20.0
Q4/13 Q4/14 Q4/15 Q4/16 Q4/17 Q4/18
%YoY Export Indices
Price Value Volume
Source: Bank of Thailand
-100.0
-50.0
0.0
50.0
100.0
150.0
200.0
Q4/13 Q4/14 Q4/15 Q4/16 Q4/17 Q4/18
%YoY Export Classified by Product Group
Agriculture Fishery
Foresty Mining
Source: NESDC-20.0
-15.0
-10.0
-5.0
0.0
5.0
10.0
15.0
%YoY Private Investment increased
Private Investment Construction Equipment

Macroeconomic Strategy and Planning Office
NESDC Economic Outlook
Feb 18, 2019 4
Export markets: exports to the US, Japan, and ASEAN (9), expanded, while exports to China, EU (15),
Australia, and the Middle East (15) declined. Exports to the US increased by 6.7 percent improving from a
0.01-percent contraction in the previous quarter, supported by the US economic expansion and the positive
impacts from the US trade protection measures against China. Exports to Japan expanded by 8.4 percent
(continually expanded for 7 consecutive quarters), close to an 8.7-percent growth in the previous quarter.
Similarly, exports to ASEAN (9) increased by 9.4 percent as a result of the expansion of exports to CLMV
countries by 9.9 percent (continually expanded for 9 consecutive quarters), and exports to ASEAN (5) by 9.0
percent (continually expanded for 7 consecutive quarters). However, exports to China decreased for 2
consecutive quarters by 4.6 percent, following the contraction in exports of rubber, computer parts &
accessories, and woods & wood products. This was due to the slowdown of the Chinese economy and the
negative supply chain effects from trade protectionism measures. Similarly, exports to EU (15) decreased for
the first time in 10 quarters by 3.7 percent, due to the contraction in exports of vehicles, parts & accessories,
and solar cells. Meanwhile, exports to the Middle East (15) and Australia contracted by 6.7 and 6.3 percent,
respectively, mainly due to a contraction in exports of vehicles, parts & accessories.
Exports to the US
accelerated, in line
with the strong
expansion of the US
economy and the
change in trade
direction. Meanwhile,
exports to china
continued to decrease,
due to the slowdown
of the Chinese
economy and the
negative supply chain
effects of trade
protectionism
measures.
Exports to the US,
Japan and ASEAN
(9) expanded.
Meanwhile, exports to
China, EU (15),
Australia and the
Middle East (15)
declined.
Export Value of Major Product in US Dollar Term
%YoY 2017 2018 Share Q4/18 (%) Year Q1 Q2 Q3 Q4 Q1 Q2 Q3 Year Q4
Agriculture 20.2 20.6 19.4 28.9 13.5 -1.5 7.9 1.3 7.2 0.1 -6.5 Rice 17.6 -7.1 19.6 45.1 20.9 21.2 14.7 7.6 2.4 8.3 -5.0 Rubber 35.5 78.5 38.1 23.0 10.6 -34.9 -13.6 -17.0 1.7 -23.6 -25.5 Tapioca -6.1 -18.1 -11.9 6.6 3.4 28.1 4.9 2.3 0.9 6.8 -7.5
Manufacturing 10.2 5.8 12.2 9.9 12.9 14.6 11.0 6.7 89.0 8.4 2.1 Sugar 12.5 -7.6 32.8 31.2 -6.5 -7.1 -4.1 2.3 0.9 0.5 19.0 Crustaceans canned, prepared, or preserved 4.6 13.0 11.6 4.7 -5.8 -6.0 -14.1 -20.1 0.4 -14.1 -14.0 Rubber products 41.3 51.6 32.5 37.2 44.3 -2.8 19.4 2.6 2.4 4.1 -1.2 Apparels and Textile Materials 3.9 3.1 1.1 4.0 7.4 8.5 8.4 6.3 2.9 6.4 2.4 Electronics 14.0 10.0 16.5 11.3 18.2 13.6 11.2 3.6 14.8 5.0 -6.2 - Computer parts & accessories 5.7 -0.8 4.4 2.5 16.4 16.1 16.8 7.4 5.6 5.9 -12.7
- Integrated circuits & parts 7.1 11.8 11.1 3.4 3.6 7.3 6.4 -3.9 3.2 0.8 -5.4 - Printed circuits 10.5 13.9 9.7 4.0 15.9 1.0 2.5 8.2 0.6 3.4 1.2 - Telecommunication equipment 51.0 21.5 71.7 49.6 60.4 37.9 2.5 -0.4 2.6 6.2 -4.7
Electrical appliances 6.2 9.5 4.1 3.0 8.5 9.6 3.6 -3.4 4.9 1.7 -3.6 Metal & steel 14.3 16.1 15.9 8.6 17.2 18.7 19.8 7.4 4.7 13.0 7.2 Automotive 6.3 2.5 2.3 2.6 18.1 15.9 14.6 6.2 15.1 8.0 -2.9
- Passenger car -7.1 -19.1 -9.8 -10.8 13.5 18.7 12.4 1.5 4.1 2.7 -16.8 - Pick up and trucks 11.8 15.8 4.3 -1.8 30.2 2.1 24.8 11.7 3.3 8.3 -1.2 - Vehicle parts & accessories 13.6 13.2 9.6 14.5 16.9 15.4 13.3 7.8 6.9 10.3 5.6
Machinery & equipment 7.2 3.9 11.5 13.2 0.7 13.0 7.7 4.1 8.6 6.9 3.2 Chemicals 22.9 23.1 14.5 33.1 21.4 28.4 28.6 12.2 3.8 23.4 25.5 Petro-chemical products 10.1 7.4 11.2 11.1 10.7 17.9 22.7 16.3 5.6 16.2 8.4 Petroleum products 32.5 43.0 36.6 29.7 26.0 41.1 30.9 32.5 4.4 30.1 20.1
Fishery 4.1 -0.6 10.4 11.2 -4.2 9.2 -9.7 -15.4 0.8 -6.5 -6.2 Crustaceans 7.0 -4.8 8.4 17.3 4.2 13.5 -12.9 -20.4 0.5 -8.7 -6.3
Other Exports -19.5 -35.0 -44.3 49.9 -43.0 -32.7 36.0 -63.4 1.9 -21.2 80.1 Non-monetary gold (excl. articles of goldsmiths) -20.7 -37.5 -45.4 52.7 -46.6 -33.8 37.3 -65.9 1.8 -22.8 90.1
Total Exports (Customs basis) 9.9 4.8 10.7 12.3 11.6 11.7 10.9 3.0 100.0 6.7 2.0 Exports, f.o.b. (BOP basis) 9.8 6.8 7.9 12.8 11.6 12.6 14.4 2.6 100.3 7.7 2.3 Export Value (exclude gold) 10.9 9.2 9.8 11.5 12.8 14.1 14.0 5.4 98.5 8.5 1.4 Source: Bank of Thailand
Export Value to Key Markets in US Dollar Term %YOY 2017 2018 Share
Q4/18 (%) Year Q1 Q2 Q3 Q4 Q1 Q2 Q3 Year Q4 Total Exports (Mil US$) (Customs basis) 236,635 56,427 56,965 62,065 61,178 63,022 63,170 63,918 100.0 252,486 62,376 (%YoY) 9.9 4.8 10.7 12.3 11.6 11.7 10.9 3.0 6.7 2.0
United States 8.5 7.6 7.2 8.3 10.7 9.1 6.7 -0.01 11.7 5.4 6.7 Japan 7.7 -3.6 16.4 10.4 9.1 24.7 11.3 8.7 10.2 13.0 8.4 EU (15) 8.1 8.7 5.5 6.8 11.3 10.6 11.2 2.5 8.7 5.0 -3.7 China 24.0 37.0 26.6 22.0 14.1 2.6 15.8 -2.8 12.4 2.3 -4.6 ASEAN (9) 8.9 0.4 14.9 9.6 11.2 14.8 12.8 22.3 27.8 14.7 9.4 - ASEAN (5)* 6.1 -8.5 17.1 5.2 13.2 15.7 8.2 21.0 15.4 13.4 9.0 - CLMV** 12.9 15.6 11.7 16.3 8.9 13.6 19.8 24.2 12.4 16.6 9.9 Middle East (15) -5.0 -22.5 -0.3 0.7 6.2 11.4 -5.7 2.0 3.2 0.1 -6.7 Australia 1.9 -3.0 -4.8 -0.1 17.2 14.4 10.3 -5.7 4.1 2.6 -6.3 Hong Kong 7.2 5.9 13.1 7.7 2.8 1.4 9.5 2.7 4.5 1.8 -6.2 India 25.6 17.7 13.0 27.4 46.3 31.7 27.3 13.8 2.8 17.3 -0.2 South Korea 14.4 23.2 24.1 11.8 0.7 5.3 11.1 2.1 1.8 4.9 0.8 Taiwan 19.0 16.4 22.7 24.9 11.9 11.4 1.50 -11.2 1.5 -1.3 -5.5
Note: * ASEAN (5) consist of Brunei, Indonesia, Malaysia, Philippines, and Singapore ** CLMV consist of Cambodia, Laos, Myanmar, and Vietnam Source: Bank of Thailand

Macroeconomic Strategy and Planning Office
NESDC Economic Outlook
Feb 18, 2019 5
Import value in US dollar term in the fourth quarter of 2018 was recorded at 58.1 billion US dollars,
expanded by 7.5 percent, slowed down from a 17.0-percent growth in the previous quarter. Import price
and quantity increased by 2.7 percent and 4.6 percent, respectively. The import volume of raw materials
& intermediate goods as well as consumer goods increased by 9.9 and 8.4 percent, respectively,
associated with the expansion of exports and domestic demand. Import value excluding unwrought gold
expanded by 11.9 percent. In Thai baht term, the import value increased by 7.0 percent.
In 2018, import value increased by 14.3 percent, compared with a 13.2-percent increase in 2017. In Thai
baht term, import value increased by 9.0 percent, compared with an 8.7-percent increase in 2017.
Import value in US
dollar terms grew by
7.5 percent, aligned
with the expansion of
exports and domestic
demand.
Overall, import value of raw materials and intermediate goods, and consumer goods increased, while
those of capital goods and other import goods declined. Import value of raw materials and
intermediate goods grew by 14.9 percent, associated with the expansion of manufacturing production.
Import value of capital goods fell by 0.6 percent, as a result of the decrease in imports of aircrafts, ships,
floating structures & locomotive that declined by 41.3 percent. However, import value of machinery,
equipment & supplies continually expanded by 4.9 percent. Import value of consumer goods increased
by 9.2 percent, in line with the favorable expansion of household demand. Import value of other goods
decreased by 21.5 percent as a result of the decrease in the import of non-monetary gold.
Import items with increased value included crude oil (39.1 percent), petroleum products (17.4 percent),
chemicals (10.3 percent), materials of base metal (6.9 percent), other machinery & mechanical appliances
& parts (6.1 percent), automotive (15.0 percent), food, beverage, & dairy products (5.5 percent), animal &
fishery products (3.7 percent), On the other hand, import items with decreased value included aircrafts
(-43.4 percent), ships (-81.1 percent) power-generating machinery & parts (-19.6 percent),
telecommunication equipment (-1.6 percent), and non-monetary gold (-50.1 percent).
Import quantity of
consumer goods as
well as raw materials
& intermediate goods
increased, whereas
the import of capital
goods decreased.
Term of trade decreased from the same period last year, as export price increased by 1.6 percent,
slower than the increase in import price of 2.7 percent. Thus, the term of trade slightly decreased from
109.7 in the same quarter last year to 108.4 in the fourth quarter of 2018.
In 2018, term of trade stood at 108.2, decreased from 110.5 in the previous year. Import price increased
by 5.6 percent and export price increased by 3.4 percent.
Term of trade
decreased, compared
with the same period
last year.
-20.0
-10.0
0.0
10.0
20.0
Q4/13 Q4/14 Q4/15 Q4/16 Q4/17 Q4/18
%YoY Import Indices
Price Value Volume
Source: Bank of Thailand Source: Bank of Thailand
-30.0
-20.0
-10.0
0.0
10.0
20.0
30.0
Q4/13 Q4/14 Q4/15 Q4/16 Q4/17 Q4/18
%YoYImport Classified by Economic Classification
Consumer goods
Raw materials and intermediate goods
Capital goods
Total
Import Value of Major Product in US Dollar Term
%YoY 2017 2018 Share
Q4/18 (%) Year Q1 Q2 Q3 Q4 Year Q1 Q2 Q3 Q4 Consumer goods 7.5 1.7 7.7 7.5 12.9 12.2 20.4 13.1 7.1 9.2 10.7
Raw materials and intermediate goods 15.7 19.7 14.5 12.4 16.6 18.8 18.8 20.2 21.3 14.9 56.7
Capital goods 8.5 7.2 13.0 8.6 5.7 1.0 6.9 4.2 -5.9 -0.6 23.1
Other Imports 27.9 19.2 24.8 46.5 23.3 9.0 25.9 4.3 35.3 -21.5 9.5
Total Imports (Customs basis) 14.1 14.1 14.3 13.8 14.1 12.5 16.6 13.9 14.5 5.8 100.0
Imports, f.o.b. (BOP basis) 13.2 14.3 12.6 12.4 13.4 14.3 17.5 15.8 17.0 7.5 92.6
Source: Bank of Thailand

Macroeconomic Strategy and Planning Office
NESDC Economic Outlook
Feb 18, 2019 6
Trade balance recorded a surplus of 4.4 billion US dollars (equivalent to 144.3 billion baht), compared
with a surplus of 3.4 billion US dollars (equivalent to 112.5 billion baht) in the previous quarter, and a
surplus of 7.0 billion US dollars (equivalent to 231.8 billion baht) in the same quarter of last year.
In 2018, trade balance stood at 23.6 billion US dollars (equivalent to 758.8 billion baht), lower than a
surplus of 34.2 billion US dollars (equivalent to 1,158.3 billion baht) in 2017.
Agriculture sector slowed down from the previous quarter, following declines in paddy and
sugarcane production due to unfavorable weather condition in some production areas. In the fourth
quarter of 2018, agricultural sector expanded by 1.4 percent, decelerated from a 2.7 percent growth in the
previous quarter. This deceleration was in line with a reduction of livestock production index of 4.1
percent and a low growth of crops production index of 0.7 percent. However, the fishery production index
rebounded by 2.6 percent. Major agricultural products with production contraction included (i) poultry
(-9.1 percent), partially due to a lower price that reduced production incentive, (ii) sugarcane (-11.2
percent), following decreases in both yield per area and price, and (iii) paddy (-0.4 percent), especially the
contraction of Hommali paddy of 11.4 percent due to the droughts in some production areas. In contrast,
major agricultural products with production expansion included (i) rubber (2.9 percent), (ii) fruits (3.8
percent), (iii) cassava (12.2 percent), (iv) white shrimp (2.6 percent), and (v) maize (2.5 percent).
Agricultural Price Index decreased by 1.2 percent, mainly due to (i) the decline of rubber price, caused by
the decline of rubber demand in China, Malaysia, and Japan, (ii) lower sugarcane price, as a result of
excess supply of sugar in the world market and the increase of domestic sugar stock, (iii) lower white
shrimp price, due to the rising production in various countries, especially India and Indonesia, and (iv)
lower oil palm price that was in line with the decline of crude palm oil price in the world market and the
level of Thailand’s crude palm oil stocks remained high. In contrast, agricultural products with the
increased price index consisted of paddy (13.0 percent), cassava (45.0 percent), and swine (13.5 percent).
The slowdown of agricultural production index, together with the decline in agricultural price index thus
led to the decrease of Farm Income Index by 1.2 percent.
Thus, in 2018, agricultural sector expanded by 5.0 percent. Agricultural Production Index increased by
5.5 percent, while Agricultural Price Index declined by 5.7 percent. As a result, Farm Income Index
decreased by 0.4 percent.
Manufacturing, wholesale, retail trade and repairing, hotels and restaurants, and transport and communication sector expanded at an accelerated rate. Meanwhile, agricultural and construction sectors slowed down.
Agricultural sector decelerated, mainly due to unfavorable weather condition in some production areas.
Production side:
Manufacturing sector accelerated in tandem with the favorable domestic demand condition and the improvement of export volume.
Manufacturing Production Index of the industries with 30-60 percent export share to total production expanded by 8.1 percent.
The domestic-oriented industries grew by 2.7 percent. Meanwhile, the export-oriented industries declined by -4.8 percent, following the decline of some key productions.
The average capacity utilization rate stood at 68.4 percent, increased from 67.4 percent in the same quarter last year.
Trade surplus was
higher than that of
the previous quarter
but lower than the
same period last year.
-30
-20
-10
0
10
20
30
15 16 17 18
(%YoY)
Agr. production index Agr. price indexFarm income index
Source: Office of Agricultural Economics
Farm Income Index decreased by 1.2 percent due to the decrease of agricultural production index
and agricultural price index
-75-50-25
0255075
100125
Q4/14 Q4/15 Q4/16 Q4/17 Q4/18
(%YoY) Paddy CassavaUnsmoked Sheet no.3 oil palmSugarcane
The prices of cassava and paddy increased while prices of rubber, sugarcane, and oil palm declined.
Source: Office of Agricultural Economics
Manufacturing sector accelerated in line with the favorable expansion of domestic demand and the
slow recovery of export volume. In the fourth quarter of 2018, manufacturing sector expanded by 3.3
percent, improved from 1.6 percent growth in previous quarter. This was in line with a 2.4 percent
increase in Manufacturing Production Index (MPI), compared with a 0.9 percent growth in the previous
quarter. Manufacturing Production Index of the domestic-oriented industries (with export share of
less than 30 percent to total production) increased by 2.7 percent, improved from a 0.6 percent
contraction in the previous quarter. The improvement was caused by increase in the production of major
industries, such as tobacco (41.0 percent), refined petroleum products (8.8 percent), and non-alcohol
beverage products (10.0 percent). Manufacturing Production Index of the industries with 30-60
percent export share to total production grew by 8.1 percent accelerated from a 2.2 percent growth in
the previous quarter. The acceleration was mainly attributed by an increase in the production of vehicle of

Macroeconomic Strategy and Planning Office
NESDC Economic Outlook
Feb 18, 2019 7
Hotels and restaurants sector accelerated ,supported by the strong expansion of household consumption and the improvement in the number of foreign tourists. The average occupancy rate was at 71.12 percent, increasing from 65.38 percent in the previous quarter and 69.44 percent in the same quarter last year.
13.5 percent, which also accelerated from a 2.6 percent growth in the previous quarter, particularly the
production for domestic sales which favorably expanded in response to new models launched during the
last quarter of 2018. Besides, there was also a strong expansion of sugar production of 54.4 percent as a
consequence of an early sugarcane extraction period. Meanwhile, production of electric motors and
generators declined by 12.0 percent. Manufacturing Production Index of export-oriented industries
(with export share of more than 60 percent to total production) decreased by 4.8 percent, due mainly
to the contraction in major export industries, including production of other rubber products (-22.4 percent)
and computers and peripheral equipment (-11.5 percent). Meanwhile, production of other general-purpose
machinery together with electronic components grew by 13.7 percent and 3.3 percent, respectively. The
average capacity utilization rate stood at 68.4 percent, increased from 66.4 percent in the previous quarter
and 67.4 percent in the same quarter last year. In addition, among 23 major industries, the industries with
capacity utilization rate of higher than 90 percent were plastics and synthetics rubber (99.0 percent)
and vehicles (97.4 percent). The industries with capacity utilization rate between 80-90 percent were
refined petroleum products (88.4 percent) and processing and preserving of meat (83.8 percent), and the
industries with capacity utilization rate between 70-80 percent, were computers and peripheral equipment
(76.1 percent), electronic components and boards (75.6 percent), and motorcycles (74.0 percent).
Manufacturing Production Index with positive growth included vehicles (13.5 percent), sugar (54.4
percent), luggage and handbags (131.4 percent), tobacco (41.0 percent), other general-purpose machinery
(13.7 percent), refined petroleum products (8.8 percent), electronic components (3.3 percent), soft drinks
(10.0 percent), processing and preserving of fish (4.5 percent), and concrete and cement (7.0 percent), etc.
Manufacturing Production Index with negative growth included other rubber products (-22.4 percent),
computer and peripheral equipment (-11.5 percent), electric motor and generator (-12.0 percent),
vegetable and animal oils and fats (-10.7 percent), and domestic appliances (-7.3 percent), etc.
Thus, in 2018, manufacturing sector expanded by 3.0 percent, Manufacturing Production Index increased
by 2.8 percent, and the average capacity utilization rate stood at 68.5 percent.
Hotels and restaurants sector accelerated, in accordance with the increased in average occupancy
rate, due to the improvement in the number of tourists and tourism receipts, and favorable
expansion of household consumption. In the fourth quarter of 2018, hotels and restaurants sectors
expanded by 5.3 percent, improved from a 4.1 percent increase in the previous quarter. The total number
of foreign tourists increased by 4.3 percent to 9.74 million persons, improved from a 1.9 percent growth in
the previous quarter. This improvement was partly due to a fading impact of capsized boat accident and
the implementation of government measures to promote tourism sector, together with the promoting
campaign from the Tourism Authority of Thailand (TAT). The expansion in the number of tourists was
mainly from Malaysia (32.4 percent), India (15.2 percent), Hong Kong (19.3 percent), and Japan (9.2
percent). The improvement of tourism sector in this quarter was also supported by the rebounded in the
number of a Russian tourist by 1.4 percent and the recovery of Chinese tourist which started to expand by
2.8 percent in December. When combined with the acceleration in the number of Thai tourists, supported
by the improved performance of the domestic economy and the implementation of the Amazing Thailand
Go Local campaign by the government, the total amount of tourism revenue rose by 5.6 percent to 793.4
billion baht, comparing with a 2.7 percent increase in the previous quarter. This was attributed by
(i) foreign tourism receipts accelerated by 5.2 percent from a 1.3 percent growth in the previous quarter
Manufacturing Production Index increased by 2.4 percent and the capacity utilization rate averaged at 68.4 percent.
Source : Office of Industrial Economics
0.0
20.0
40.0
60.0
80.0
-10.0
-5.0
0.0
5.0
10.0
Q4/14 Q4/15 Q4/16 Q4/17 Q4/18
MPI Export<30%
Export 30-60% Export>60%
%Cap U (RHS)
(%YoY) %
0
20
40
60
0
100
200
300
400
500
600
15 16 17 18
%Billion baht
Tourism receipts %YoY (RHS)
Visa
on
Arriv
al fe
e w
aived
Visa
on
Arriv
al fe
e w
aived
Income from foreign tourists for Q4/2018 stood at 513.2 billion baht or grew by 5.2 percent.
Source: Ministry of Tourism and Sports
The
blas
t in
7 pr
ovinc
es
of so
uthe
rn T
haila
nd
Illeg
al to
urism
so
lutio
n
Caps
ized
boat
acc
iden
tin
Phu
ket
Ratc
hapr
ason
gBo
mb
Macroeconomic Strategy and Planning Office
NESDC Economic Outlook
Feb 18, 2019 8
to 513.2 billion baht, which was mainly accounted from tourists receipts from Malaysia, Hong Kong,
India, the US, and Japan tourists; and (ii) Thai tourism receipts which were at 280.2 billion baht,
increased by 6.3 percent. The average occupancy rate was at 71.12 percent, increased from 65.38
percent in the previous quarter and 69.44 percent in the same quarter last year.
For the whole year of 2018, hotels and restaurants sector expanded by 7.9 percent compared with 10.6
percent growth in 2017. Number of foreign tourists was at 38.28 million persons (increased by 7.5
percent). The total tourism receipts were at 3,075.0 billion baht (increased by 9.0 percent). Receipts from
foreign tourists were at 2,007.5 billion baht (increased by 9.6 percent). Receipts from Thai tourists were at
1,068.0 billion baht (increased by 7.9 percent). The average occupancy rate was at 71.40 percent.
Wholesale and retail trade sector favorably expanded, following the favorable expansion of
household consumption and the improvement of foreign tourist number. In the fourth quarter of
2018, wholesale, retail trade, and repairing sector grew by 7.5 percent, compared to a 7.3 percent growth
in the third quarter of 2018. This was in line with a high growth of the Wholesale, Retail Sales, and
Repair of Motor Vehicles Index of 10.8 percent, accelerated from an 8.3 percent in the previous quarter.
The index was driven by (i) an increase in Wholesale, Retail Sales, and Repair of motor vehicles and
motorcycles index of 10.6 percent, accelerated from 9.2 percent in the previous quarter, mainly supported
by 12.6 percent growth of motor vehicles sale and a 7.4 percent growth of automotive parts sale, (ii) an
increase in Wholesales Index (except motor vehicles and motorcycles) of 5.0 percent, mainly supported
by a 10.1 percent growth in wholesales of other goods (such as industrial chemicals, iron, steel, and other
basic non-ferrous metals products) and a 5.1 percent growth in wholesales of domestic appliances, and
(iii) an increase in Retail Sales Index (except motor vehicles and motorcycles) of 20.2 percent,
accelerated from a 19.3 percent growth in the previous quarter, mainly supported by a 46.6 percent
growth in retail sales of other goods (such as jewelry and other new goods) and 10.6 percent growth in
retail sales of automotive fuel.
For the whole year of 2018, Wholesale, retail trade, and repair of motor vehicles, etc. sector expanded by
7.3 percent, accelerated from 7.0 percent in 2017.
Transport and communication sector satisfactory expanded, supported by the expansion of land
transport, air transport, and telecommunications services. In the fourth quarter of 2018, transport and
communication continued to expand by 6.1 percent, compared with a 5.3 percent growth in the previous
quarter. Transport services increased by 3.1 percent, accelerated from a 1.6 percent growth in the previous
quarter. This was mainly due to the expansion of goods and passengers transport services, attributed by
(i) a 5.4 percent growth in land transport, (ii) a 6.4 percent growth in air transport. On the other hand,
(iii) water transport decreased by 0.7 percent. Telecommunications services expanded by 8.9 percent. This
was in line with the better operating profit of telecommunication service providers.
For the whole year of 2018, transport and communication sector expanded by 6.3 percent. Transport
services grew by 3.2 percent and telecommunication services increased by 10.2 percent.
Electricity, gas and water supply sector expanded at an accelerating pace, in line with the
acceleration of production activities in manufacturing and services sectors, as well as favorable
expansion in household demand and the higher average temperature. In the fourth quarter of 2018,
electricity, gas and water supply sector increased by 5.7 percent, accelerated from a 1.1 percent growth in
the previous quarter. In details, (i) production and sale of electricity generation increased by 7.4 percent,
accelerated from 2.2 percent growth in the previous quarter, and (ii) gas separation increased by 2.7
percent, accelerated from 0.7 percent growth in the previous quarter, associated with the increase in gas
volume used in power plants. In contrast, (iii) Water supply production and distribution decreased by 5.6
percent, relative to 6.9 percent contraction in the previous quarter.
For the whole year of 2018, electricity, gas and water supply sector increased by 2.6 percent, accelerated
from a 2.3 percent growth in 2017. Production and sale of electricity generation increased by 3.6 percent,
and gas separation expanded by 1.2 percent. Meanwhile, water supply production and distribution
declined by 4.4 percent.
Wholesale and retail trade notably expanded by 7.5 percent, in tandem with the strong growth of domestic demand.
Transport and
communication sector
satisfactory grew by
6.1 percent, aligned
with the acceleration
of land transport, air
transport, and
telecommunications
services.
Electricity, gas and
water supply sector
accelerated, supported
by the expansion of
manufacturing
production activities
and service sector.

Macroeconomic Strategy and Planning Office
NESDC Economic Outlook
Feb 18, 2019 9
Construction sector slowed down in tandem with the public construction. In the fourth quarter of
2018, construction sector increased by 3.4 percent, decelerated from a 4.5 percent growth in the third
quarter 2018. The public construction expanded by 2.0 percent (the state-owned enterprise construction
increased by 6.9 percent, while the government construction declined by 0.4 percent). The private
construction increased by 5.1 percent, compared with 5.2 percent expansion in previous quarter.
Construction Materials Price Index increased by 1.0 percent, following a rise in prices of steel and steel
products (1.6 percent), other construction materials (1.4 percent), tile and composite materials (3.5
percent), and cements (1.0 percent), especially.
For the whole year of 2018, construction sector increased by 2.7 percent, improved from a 2.8 percent
contraction in 2017. Public and private construction expanded by 1.9 percent and 4.1 percent, respectively.
Employment satisfactory and broadly expanded, covering both agricultural and non-agricultural
sector, while unemployment declined to the lowest rate in 12 quarters. In the fourth quarter of 2018,
the employment increased by 1.9 percent, accelerated from a 1.7 percent growth in the third quarter 2018.
Agricultural employment increased by 2.4 percent, a continuous expansion seen in four consecutive
quarters, aligned with an expansion of major agricultural production, such as fruits and cassava, etc.
In addition, non-agricultural employment increased by 1.7 percent, continued from a 1.6 percent growth
in the previous quarter, following a 4.6 percent growth in employment of manufacturing sector, which
increased continually for three consecutive quarters, in line with the expansion of manufacturing
production, together with the increase in employment of wholesale and retail trade sector by 1.5 percent,
aligned with the expansion in wholesale and retail trade sector. The employment of construction sector
increased by 5.0 percent, in line with the expansion of construction sector. The constant improvement of
employment brought down the unemployment rate to 0.9 percent, the lowest rate seen in 12 quarters.
For the whole year of 2018, unemployment was registered at 400,000 persons and the unemployment
rate was at 1.1 percent.
Construction sector
slowed down in
tandem with the
deceleration of public
construction.
Meanwhile, private
construction
favorably expanded by
5.1 percent.
Employment
continually and
broadly improved, in
line with the more
broad-based
production expansion,
and brought down
unemployment to the
lowest rate in 12
quarters.
0.0
0.2
0.4
0.6
0.8
1.0
1.2
1.4
36.5
37.0
37.5
38.0
38.5
15 16 17 18
Employment Unemployment rate (RHS) (%)(Million Persons)
Employment increased by 1.9 percent, following an expansion of employment in agriculture sector and non - agriculture sector.
Unemployment rate was low at 0.9 percent.
Source: National Statistics Office
Employed Persons by Industry
%YOY Share Q4/18
2017 2018 Year Q1 Q2 Q3 Q4 Q1 Q2 Q3 Year Q4
Employed 100.00 -0.6 -0.6 0.4 -1.6 -0.6 -0.2 0.9 1.7 1.1 1.9 - Agricultural 32.22 0.3 -1.4 6.3 -1.2 -2.0 6.0 3.0 1.9 3.3 2.4 - Non-Agricultural 67.78 -1.0 -0.3 -2.1 -1.8 0.1 -2.8 -0.01 1.6 0.1 1.7
Manufacturing 16.62 -2.9 -1.5 -4.2 -4.0 -1.8 -0.03 2.6 2.8 2.5 4.6 Construction 5.44 -8.2 -8.7 -11.8 -6.8 -4.3 -11.8 -2.7 2.6 -2.2 5.0 Wholesale and retail trade; repair of motor vehicles and motorcycles
16.66 -0.2 0.9 1.0 -2.6 0.02 -2.8 -2.2 0.9 -0.69 1.5
Accommodation and food service activities 7.53 1.8 4.2 -2.7 -1.0 6.8 -1.3 5.7 3.0 1.8 -0.02 Total labor force (Million persons) 38.1 38.2 38.3 38.2 37.7 38.1 38.5 38.7 38.4 38.4 employed (Million persons) 37.5 37.4 37.5 37.6 37.2 37.4 37.9 38.3 37.9 37.9 Unemployment (Hundred thousand persons) 4.5 4.6 4.6 4.5 4.2 4.7 4.1 3.7 4.0 3.6 Unemployment Rate (%) 1.2 1.2 1.2 1.2 1.1 1.2 1.1 1.0 1.1 0.9 Source : National Statistical Office (NSO)

Macroeconomic Strategy and Planning Office
NESDC Economic Outlook
Feb 18, 2019 10
On the revenue side, in the first quarter of the fiscal year 2019 (October - December 2018), the net
government revenue collection stood at 588.9 billion baht, increased by 7.5 percent compared to the same
quarter last year. The key contributing components included: (i) the revenue from state-owned enterprises
(SOEs) were significantly higher than the same period last year due to the dividend paid by PTT Public
Company Limited; (ii) the revenue from petroleum income tax increased, due to tax payment from the
transfer of petroleum concessions and (iii) the revenue collected from VAT and excise tax, on
consumption tax base, rose by 7.0 percent and 11.6 percent, respectively.
The net government revenue collection increased by 7.5 percent.
Fiscal Conditions:
On the expenditure side, the total budget disbursement in the first quarter of fiscal year 2019 was at
1,034.3 billion baht1, increased by 1.1 percent compared with the same quarter of FY2018.
Classified by sources of funds, the government disbursements were as follows: (i) the 2019 annual
budget disbursement stood at 893.0 billion baht, declined from the same quarter last year by 0.5 percent.
The disbursement rate was at 29.8 percent, lower than the target of 30.3 percent, but higher than the rate
of 29.4 percent in the same quarter last year.
In details, the current expenditure disbursement amounted to 817.7 billion baht, expanded by 0.9 percent
from the same quarter in the previous year. The disbursement rate was at 34.8 percent, greater than the
rate of 32.3 percent in the same quarter last year. The capital expenditure disbursement marked at 75.2
billion baht, dropped from the same quarter last year by 13.8 percent. The rate of disbursement was at
11.6 percent, lower than the target of 21.1 percent and a rate of 16.2 percent in the same quarter last year.
The disbursements of the annual budget and the off-budget loans declined. In contrast, the carry-over budget and the State-owned enterprises’ capital expenditure budget expanded.
The rate of annual budget disbursement was at 29.8 percent owing to rates of the current expenditure disbursement and the capital expenditure disbursement of 34.8 percent and 11.6 percent, respectively.
1 The total budget disbursement means the disbursement of the grand total of annual budget, the carry-over budget, the off-budget loans, and the State-
owned enterprises’ capital expenditure budget. 2 The number was included the 3,277.7 million baht of the capital spending allocated from the annual budget.
Government Revenue
Fiscal Year 2017 2019 2018
Year Q1 Q2 Q3 Q4 Year Q1 Q2 Q3 Q4 Q1 Net Government Revenue 2,355.7 548.2 500.1 689.9 617.5 2,536.9 547.6 532.5 754.1 702.8 588.9
YOY (%) -1.6 -6.5 1.5 -3.8 3.1 7.7 -0.1 6.5 9.3 13.8 7.5 Source: Ministry of Finance
-40
-20
0
20
40
60
80
100
-400,000
-200,000
0
200,000
400,000
600,000
800,000
1,000,000
YOY (%)Million THB
Source: GFMIS
Annual Budget Disbursement
Capital Exp. (LHS)
Current Exp. (LHS)
Annual budget disbursement Growth Rates (RHS)
0
10
20
30
40
%
Source: GFMIS
The 1st Quarter Annual Budget Disbursement and Target Rates
Total Annual Exp. Disbursement Rate
Capital Exp. Disbursement Rate
Total Annual Exp. Target
Capital Exp. Target
(ii) The carry-over budget disbursement stood at 70.8 billion baht, increased from the first quarter of
FY2018 by 1.5 percent. The disbursement rate was at 19.3 percent, smaller than the rate of 21.5 percent in
the same quarter last year. (iii) State-owned enterprises’ capital expenditure budget (excluding PTT)
was anticipated to be disbursed at 73.5 billion baht2, rose from the same period last year by 24.9 percent
and (iv) The off-budget loans were disbursed at 279.7 million baht due to a 185.7 million baht
disbursement on the Water Resource Management and Road Transport System Project’s loans and a 94.0
million baht disbursement on the Development Policy Loan (DPL).

Macroeconomic Strategy and Planning Office
NESDC Economic Outlook
Feb 18, 2019 11
Public Debt: at the end of December 2018, it was accumulated at 6.8 trillion baht, equivalent to 41.9
percent of GDP. The public debt was comprised of domestic loans of 6.6 trillion baht (40.3 percent of
GDP) and foreign loans of 254.8 billion baht (1.6 percent of GDP).
Fiscal Balance: in the first quarter of fiscal year 2019, the budgetary balance and non-budgetary balance
recorded deficits of 350.7 billion baht and 24.6 billion baht, respectively. In the meantime, the
government conducted a cash balance management through borrowing of 121.8 billion baht. Therefore,
the cash balance after debt financing recorded a net deficit of 253.5 billion baht. At the end of the first
quarter of fiscal year 2019, the treasury reserve stood at 379.9 billion baht.
The public debt
remained under the
fiscal prudential
framework at 41.9
percent of GDP.
At the end of the first
quarter of fiscal year
2019, the treasury
reserve stood at 379.9
billion baht.
The policy rate increased by 25 basis points to 1.75 percent per annum in the fourth quarter of 2018
In the meeting on 19th December 2018, the Monetary Policy Committee (MPC) decided to raise policy
rate by 0.25 percentage point from 1.50 percent per annum to 1.75 percent per annum. The assessment
was based on (i) the continual expansion of the Thai economy owing to strong domestic demand and
(ii) the need for reducing the risk of financial instability and building up policy space for the future
monetary policy movement. Similarly, major economies continued to implement monetary policy
normalization. The Federal Reserve (Fed) raised its policy rate to a range of 2.25 - 2.50 percent per
annum in the meeting on 18th - 19th December 2018, which was the fourth increase in 2018. This decision
was made under the conditions that the US economy continued to expand at a stable pace, an inflation rate
was close to the target rate at 2.00 percent and the unemployment rate sustained at a low level. Bank of
Canada increased its policy rate to 1.75 percent per annum. Likewise, Bank of Russia increased its policy
rate to 7.75 percent per annum in response to rising inflationary pressure. Moreover, European Central
Bank (ECB) halted Quantitative Easing at the end of December 2018. For regional economies, Indonesia
and South Korea, for instance, increased their policy rates by 25 basis points to 6.00 and 1.75 percent per
annum, respectively.
Overall in 2018, the MPC decided to raise the policy rate totaling by 0.25 percent, in the December 2018
meetings. As a result, the policy rate was increased from 1.50 percent per annum at the end of 2017, to
1.75 percent per annum at the end of 2018.
In January 2019, Fed has signaled that it would slow down rate hikes in 2019, and consider adjusting
any of the details for completing balance sheet normalization in light of economic and financial
developments.
Financial Conditions:
Policy rate increased
to 1.75 percent per
annum, in line with
monetary policy
direction of major
countries and other
countries in region.
0
50,000
100,000
150,000
200,000
250,000
300,000
0
100,000
200,000
300,000
400,000
500,000
600,000
700,000
10 11 12 13 14 15 16 17 18 19
Source: MOF
Statement of Government OperationsTreasury Reserve (LHS)
Financing (RHS)Million Baht
Million Baht
0
5
10
15
20
25
30
35
40
45
50
0
1,000
2,000
3,000
4,000
5,000
6,000
7,000
8,000
% of GDPBillion Baht
Source: PDMO and NESDC
Public Debt (Accumulated)
foreign loans domestic loans Total Accumulated Debt to GDP (RHS)

Macroeconomic Strategy and Planning Office
NESDC Economic Outlook
Feb 18, 2019 12
Average deposit and lending rates of major commercial banks remained unchanged from the
previous quarter while Specialized Financial Institutions (SFIs) raised deposit rate. In the fourth
quarter of 2018, the average 12-month deposit rate and the average lending rate of five major commercial
banks remained stable at 1.37 and 6.28 percent per annum, respectively. However, one of SFIs raised its
deposit rate by 0.25 percent. As a result, the average 12-month deposit rate of SFIs was increased by 0.08
percent from the previous quarter to 1.60 percent per annum. On the contrary, SFIs kept the average
lending rate stable at 6.58 percent per annum. Moreover, the real deposit and lending rates increase
following a lessened headline inflation rate
In 2018, the average deposit and lending rates of major commercial banks remained unchanged at 1.37
and 6.28 percent per annum, respectively. However, the average deposit rate of SFIs increased by 0.08
percent from the previous year, while the average lending rate remained stable.
In January 2019, two major commercial banks decided to increase deposit rates by 0.25 percent. As a result,
the average 12-month deposit rate of major commercial banks increased to 1.42 percent per annum. However,
SFIs held their deposit as well as lending rates steady at the same level as in the fourth quarter in 2018
Private loan (excluding accrued interest) of depository corporations favorably expanded with the
acceleration of household loan, while business loan decelerated. At the end of the fourth quarter of
2018, an outstanding of private loan from depository corporations grew by 5.8 percent, decelerated from a
6.2-percent growth in the previous quarter, owing to the deceleration of business loan, in particular, loan
for manufacturing and agriculture, forestry, fishing and mining sectors. In contrast, household loan
accelerated from the previous quarter following the expansion in hire purchase loan and housing loan,
though household loan of SFIs slowed down. In the fourth quarter of 2018, loan’s quality improved from
the third quarter, as non-performing loan to total outstanding loan ratio slightly decreased to 2.94.
In 2018, an outstanding of private loan from depository corporations grew by 5.8 percent, accelerating
from the expansion of 4.3 percent in 2017. The loan expansion was mainly supported by the increase of
business loan and household loan. In details, business loan expansion was attributed by loans for
wholesale & retail and real estate activities. Likewise, household loan accelerated, due to the expansion of
housing loan and hire purchase loan.
An average deposit
and lending rates of
five major
commercial banks
remained stable.
Private loan
(excluding accrued
interest) of depository
corporations
favorably expanded
with the acceleration
of household loan,
while business loan
decelerated.
Policy Interest Rate (%)
At the end of period
2017 2019 2018 Year Q1 Q2 Q3 Q4 Year Q1 Q2 Q3 Q4 Jan.
USA 1.25-1.50 0.75-1.00 1.00-1.25 1.00-1.25 1.25-1.50 2.25-2.50 1.50-1.75 1.75-2.00 2.00-2.25 2.25-2.50 2.25-2.50 EU 0.00 0.00 0.00 0.00 0.00 0.00 0.00 0.00 0.00 0.00 0.00 England 0.50 0.25 0.25 0.25 0.50 0.75 0.50 0.50 0.75 0.75 0.75 Japan -0.10 -0.10 -0.10 -0.10 -0.10 -0.10 -0.10 -0.10 -0.10 -0.10 -0.10 Canada 1.00 0.50 0.50 1.00 1.00 1.75 1.25 1.25 1.50 1.75 1.75 Australia 1.50 1.50 1.50 1.50 1.50 1.50 1.50 1.50 1.50 1.50 1.50 New Zealand 1.75 1.75 1.75 1.75 1.75 1.75 1.75 1.75 1.75 1.75 1.75 Russia 7.75 9.75 9.00 8.50 7.75 7.75 7.25 7.25 7.50 7.75 7.75 China 4.35 4.35 4.35 4.35 4.35 4.35 4.35 4.35 4.35 4.35 4.35 Korea, South 1.50 1.25 1.25 1.25 1.50 1.75 1.50 1.50 1.50 1.75 1.75 India 6.00 6.25 6.25 6.00 6.00 6.50 6.00 6.25 6.50 6.50 6.50 Indonesia 4.25 4.75 4.75 4.25 4.25 6.00 4.25 5.25 5.75 6.00 6.00 Philippines 3.00 3.00 3.00 3.00 3.00 4.50 3.00 3.50 4.50 4.50 4.50 Malaysia 3.00 3.00 3.00 3.00 3.00 3.25 3.25 3.25 3.25 3.25 3.25 Thailand 1.50 1.50 1.50 1.50 1.50 1.75 1.50 1.50 1.50 1.75 1.75 Source: Collected by NESDC
0
2
4
6
8
10
0
2
4
6
8
10
14 15 16 17 18
% YOY% YOYprivate loan (excluding accrued interest)
Business loan (RHS)
Household loan (RHS)
Private loan (excluding accrued interest) of depository corporations favorably expanded
Source: Bank of Thailand

Macroeconomic Strategy and Planning Office
NESDC Economic Outlook
Feb 18, 2019 13
SET index fluctuated
in a downward trend,
which was influenced
by the concern over
global economic
slowdown and the
political uncertainty
in major countries.
Thai Baht against US Dollar appreciated. In the fourth quarter of 2018, an average exchange rate was at
32.82 baht per US dollar, appreciating 0.5 percent from the previous quarter. This was in line with a capital
inflow in Thai bond market and a surplus of current account. Regional currencies, however, mostly
depreciated from the previous quarter. The appreciation of Thai Baht in the fourth quarter was partly
supported by Fed’s policy signal that posted uncertainty in future interest rate increase. This was also the
major factor causing US dollar to be depreciated. Besides, Thai baht was also supported by an increase in
policy rate on December 2018. In the fourth quarter of 2018, Thai baht against trading partners (NEER)3
appreciated on average by 1.6 percent from the previous quarter. This was consistent with a 1.4-percent
appreciated of the real effective exchange rate (REER).
In 2018, Thai baht was at an average of 32.32 baht per US dollar, appreciating by 4.7 percent from the
2017 average rate. The appreciation was in line with currencies of regional countries with strong
economic fundamentals, such as Japan, South Korea, and Malaysia. In addition, main supporting factors
of Thai baht appreciation were a foreign inflow in Thai bond market and a surplus of current account.
In January 2019, the Thai baht was at an average of 31.81 baht per US dollar, appreciating by 2.7
percent from previous month, as the downside risks for the US economic expansion increased. This
causes uncertainty on future Fed’s policy rate hike. In addition, Thai baht appreciation has been supported
by a relatively strong Thailand’s economic and financial fundamentals.
SET index had a downward trending which was influenced by both internal and external factors.
Throughout, the fourth quarter, SET Index as well as the other regional stock markets experienced a
subdued growth. The key contributing factors to the volatility of SET index were (i) the concern over the
Thai and global economic conditions, (ii) investors’ expectation on the increases in federal fund rate and
Thai policy rate, and (iii) the ending of ECB’s Quantitative Easing. Moreover, the downward trend of
SET Index was pressured by the subdued oil price in global market, the uncertainty over the US and
Chinese trade policies, and Government Shutdown in the US. Altogether, SET index at the end of the
fourth quarter of 2018 closed at 1,563.9 points. This was a reduction of 10.96 percent from the previous
quarter with average daily trading volume of 45.3 billion baht, declined from 52.0 billion baht per day in
the previous quarter. In this quarter, foreign investors continually imposed a net sell position of 78.6
billion baht.
Overall in 2018, SET index markedly declined from 1,753.7 points in the end of 2017 to 1,563.9 in the
end of 2018, equaling to a 10.8-percent drop from 2017. This was resulted from the monetary policy
tightening in many countries, the escalation of trade protection measures between the US and China as
well as the US government shutdown and the Brexit uncertainty. Thoroughly, an average trading volume
stood at 56.4 billion baht per day, increased by 18.2 percent from 2017, with more pronounced foreign
investors’ net-sell position at 287.5 billion baht
In January 2019, SET Index picked up to 1,641.7 points, equaling to a 5.0-percent expansion from
December 2018. This was resulted from the expected slowdown in the US policy rate hikes, Chinese
economic stimulus measures, a recovery in global oil prices, and the improvement of political sentiment
in Thailand after the election date was announced.
Thai baht against US
dollar appreciated in
line with a capital
inflow in Thai bond
market and a surplus
of current account.
3 The BOT began using the new NEER and REER in March 2014. The base year would also be changed to 2012, that the indicators could capture the true
structure of trade in line with changing international dynamics.
Thai Baht appreciated against US dollar from the previous quarter
Source : CEIC, Bank of Thailand
31.0
32.0
33.0
34.0
35.0
36.095
100
105
110
115
120
Jan 17 Apr 17 Jul 17 Oct 17 Jan 18 Apr 18 Jul 18 Oct 18 Jan 19
Index
NEER REER Baht/US dollar (RHS)
Baht US dollar

Macroeconomic Strategy and Planning Office
NESDC Economic Outlook
Feb 18, 2019 14
Government bond
index increased in
line with decreasing
average bond yield.
Foreign investors
continuously
registered a net buy
position.
Capital and financial
account recorded a
net outflow due to
Thai direct
investment as well as
Thai portfolio
investment.
Capital and financial account recorded a net outflow of 4.3 billion US dollars in the fourth quarter of
2018. This was caused by a net outflow of Thai outbound investment, in terms of (i) Thai direct
investment, (ii) Thai portfolio investment and (iii) other investments such as derivatives investment, loan,
and deposit. Furthermore, there was an outflow of a net sell position from foreign investors in stock
market. However, there were a foreign inflow into Thai bond market in this quarter.
In 2018, Capital and financial account registered a net outflow of 21.6 billion US dollars, which was
mainly due to investment abroad of Thais and a net sell position from foreign investors in stock market.
Bond trading volume declined, while foreign investors continuously registered a net buy position.
Daily average outright trading in the fourth quarter of 2018 recorded at 69 billion baht. Foreign investors
had a net buy of 33.6 billion baht. In details, foreign investors accounted for a net buy position of long-
term bond while selling short-term bond. This was due to expected slower growth of global economy as
well as increasing US-China trade tension. In addition, Thailand's bond market was considered as a safe
haven among other countries in the region. Therefore, long-term bonds’ demand increased and, as a
result, its long-term yield (TTM > 1Y) declined by 14 - 30 basis point. However, the yield for short-term
maturity (TTM ≤ 1Y) increased by 1- 31 basis point following policy interest rate increased.
In 2018, a daily average outright trading volume was at 78.8 billion baht, lowered from an average of
90.4 billion baht in 2017. Foreign investors posted a net buy position at 131.3 billion baht. Government
bond index fell by 2.3 percent, resulting to a decline in government bond yield in all maturities.
In January 2019, foreign investors registered a net buy of long-term bond while selling short-term bonds.
As a result, government bond yield with short-term maturities continuously increased, and bond yield
with long-term maturities declined.
0
200
400
600
800
1000
1200
1400
1600
1800
2000
0
10,000
20,000
30,000
40,000
50,000
60,000
70,000
80,000
90,000
IndexMillion Baht
Value
SET Index (RHS)
SET Index move downward and trading volume decreased from the previous quarter
Source: SET
Government bond yield with long-term maturity declined, while its short-term yield increased
Source: ThaiBMA
0.0
0.5
1.0
1.5
2.0
2.5
3.0
3.5
4.0
1M 6M 2Y 4Y 6Y 8Y 10Y 12Y 14Y 16Y 18Y 20Y 22Y 24Y 26Y 28Y
percent
Q3/61
Q4/61
Jan-19
Capital Flow (Billion USD) 2017 2018
Year Q1 Q2 Q3 Q4 Year Q1 Q2 Q3 Q4 Nov. Dec. - Direct Investment -10.6 0.2 -2.7 -1.9 -6.1 -5.7 -0.4 -3.1 -2.4 0.3 0.1 -0.1
Thai investor -18.6 -2.2 -4.5 -4.1 -7.8 -18.1 -5.1 -5.4 -5.6 -2.0 -0.7 -0.8 Foreign investor 8.0 2.4 1.7 2.2 1.7 12.5 4.6 2.3 3.2 2.3 0.8 0.7
- Portfolio Investments -2.1 -1.3 -1.2 2.4 -2.0 -5.4 -3.0 -4.0 1.2 0.3 1.8 0.0 Thai investor -11.6 -3.6 -2.7 -3.0 -2.3 -2.2 -2.1 1.6 -1.4 -0.4 -0.3 0.4 Foreign investor 9.4 2.3 1.5 5.4 0.2 -3.2 -0.9 -5.7 2.6 0.7 2.1 -0.5
Others 0.3 -3.9 -0.8 2.2 2.9 -10.5 -0.3 -2.4 -3.0 -4.9 -2.3 -1.9 Capital and financial account -12.4 -5.1 -4.8 2.7 -5.3 -21.6 -3.7 -9.5 -4.2 -4.3 -0.3 -2.0 Source: BOT

Macroeconomic Strategy and Planning Office
NESDC Economic Outlook
Feb 18, 2019 15
Producer Price Index
(PPI) increased by 0.7
percent, decelerated
from the previous
quarter due to the
deceleration of price
of manufactured
products and mining
products.
Current account
registered a lower
surplus than the same
period last year.
Current account registered a surplus of 8.5 billion US dollars (280.1 billion baht). This was a result of
a trade surplus of 4.4 billion US dollars and a surplus in services, and primary and secondary income of
4.1 billion US dollars.
In 2018, current account registered a surplus of 37.7 billion US dollars (equivalent to 1,210.6 billion
baht), compared with a surplus of 50.2 billion US dollars (equivalent to 1,702.5 billion baht) in 2017.
International reserve at the end of December 2018 stood at 205.6 billion US dollars (excluding net forward
position of 33.7 billion US dollars), which was equivalent to 3.3 times of short-term foreign debt, equivalent to
an import value of 10.6 months (given the average of import value in the fourth quarter of 2018).
Producer Price Index (PPI): In the fourth quarter of 2018, Producer Price Index increased by 0.7
percent, decelerated from 1.7 percent in the previous quarter. The price of manufactured products
increased by 0.3 percent, decelerated from 1.6 percent in the previous quarter as price of petroleum
products declined. The price of mining products increased by 9.5 percent, decelerated from 12.0 percent
in the previous quarter as price of lignite, petroleum, & natural gas decreased. Meanwhile, the price of
agriculture products increased by 1.1 percent, accelerated from 0.1 percent in the previous quarter as price
of crops and live-stocks increased.5
In 2018, producer price index increased by 0.4 percent.
4 In January 2019, headline inflation was 0.3 percent, Core inflation was 0.7 percent. 5 In January 2019, Producer Price Index (PPI) decreased by 1.1 percent.
Headline inflation: In the fourth quarter of 2018, headline inflation was averaged at 0.8 percent,
decelerated from 1.5 percent in the previous quarter. Food-and-Beverage price index increased by 0.7
percent, compared with a 0.4 percent in the previous quarter, due to an increase in prices of rice, flour &
cereal products, fish and aquatic animals, eggs and diary products, and seasonings and condiments. Non-
Food and Beverage price index increased by 0.9 percent, decelerated from 2.2 percent in the previous
quarter as the domestic retail fuel price slowed down, which caused energy index to increase by 3.4
percent, decelerated from 9.1 percent in the previous quarter. Core inflation was average at 0.7 percent,
compared with 0.8 percent in the previous quarter.4
In 2018, headline inflation was averaged at 1.1 percent. Core inflation was averaged at 0.7 percent.
International reserve
at the end of
December 2018 stood
at 205.6 billion US
dollars.
Source: Bank of Thailand
-10,000
-5,000
0
5,000
10,000
15,000
20,000
Q4/13 Q4/14 Q4/15 Q4/16 Q4/17 Q4/18
Mil. USD
Current account balance, Trade balance,Net services, primary income and secondary income
Current account balance
Trade balance
Net services, primary income and secondary income
Source: Ministry of Commerce
-6
-4
-2
0
2
4
Q4/13 Q4/14 Q4/15 Q4/16 Q4/17 Q4/18
%YoYHeadline inflation in the fourth quarter of 2018
was at 0.8 percent
Headline Inflation
Core Inflation
PPI
Headline inflation
was at 0.8 percent,
decelerated from the
previous quarter due
to the deceleration of
Non-Food and
Beverage price index.

Macroeconomic Strategy and Planning Office
NESDC Economic Outlook
Feb 18, 2019 16
2. Crude Oil price in Q4 of 2018
The crude oil price in the global market decreased from the previous quarter, but increased from
the same previous last year. In the fourth quarter of 2018, the average crude oil price in the 4 major
markets (Dubai, Oman, Brent, and WTI) stood at 65.47 USD per barrel, increased from the same period
last year by 11.3 percent, but decreased from the previous quarter by 11.0 percent.
The major factors contributed to the year on year increase of global crude oil price included (i) the
continual expansion of global economy that consequently raised demand for crude oil, in particular, those
in the US and China, while demand in Europe and Japan decreased, (ii) growing tensions between the
U.S. and Saudi Arabia over the disappearance of a Saudi journalist, and the US sanction against Iran, and
(iii) the persistent geopolitical tensions, including the political turmoil in Syria.
In 2018, the average crude oil price in the 4 major markets stood at 68.78 USD per barrel, or an increase
of 29.7 percent, higher than 53.01 USD per barrel in 2017.
The crude oil price
increased due to the
continual of demand
expansion, the
tensions between the
U.S. and Saudi
Arabia, the US
sanction against Iran,
and the influence of
geopolitical tensions.
Crude oil price
Year USD per Barrel (%YoY)
OMAN DUBAI BRENT WTI Average OMAN DUBAI BRENT WTI Average 2016 Year 43.10 45.04 41.40 41.71 42.81 -11.7 -16.0 -18.6 -18.5 -16.3
2017
Q1 51.90 54.60 53.00 53.44 53.24 59.9 55.6 69.4 71.3 63.7 Q2 48.31 50.92 49.55 49.80 49.65 5.9 8.4 15.1 15.0 11.0 Q3 48.20 52.22 50.34 50.55 50.33 7.1 11.1 16.8 15.8 12.6 Q4 55.42 61.55 59.18 59.20 58.84 12.4 20.4 22.8 21.6 19.3
Year 50.96 54.82 53.02 53.24 53.01 18.2 21.7 28.1 27.7 23.8
2018
Q1 62.90 67.18 63.71 64.04 64.46 21.2 23.0 20.2 19.8 21.1 Q2 67.89 74.91 71.90 71.93 71.66 40.5 47.1 45.1 44.4 44.3 Q3 69.61 75.99 74.12 74.41 73.53 44.4 45.5 47.2 47.2 46.1 Q4 58.77 68.12 67.28 67.70 65.47 6.1 10.7 13.7 14.4 11.3
Year 64.79 71.55 69.25 69.52 68.78 27.2 30.5 30.6 30.6 29.7 Oct. 70.81 80.68 79.27 79.95 77.68 37.2 39.9 42.9 44.0 41.1 Nov. 56.56 65.95 65.67 65.96 63.54 -0.3 4.9 8.2 8.8 5.5 Dec. 48.94 57.73 56.88 57.18 55.18 -15.5 -9.9 -7.4 -6.9 -9.8
2019 Jan. 51.65 60.24 58.94 59.20 57.51 -18.9 -12.8 -10.8 -10.5 -13.2 Source: Thaioil Plc and EPPO.

Macroeconomic Strategy and Planning Office
NESDC Economic Outlook
Feb 18, 2019 17
The world economy in the fourth quarter of 2018 softened manifestly from the previous quarter,
following the downtrend of the business cycle in major advanced economies, policy interest rates
increases, as well as the additional effects from the intensifying trade protectionist measures, and the
worsened business sentiment regarding risk factors over the world economy and the financial market.
Such constraints resulted in an extensive slowdown of economic growth in several key economies,
including the US, the Eurozone (growth being the lowest in 20 quarters), China (112 quarters), and Japan
(16 quarters), as well as the NIEs, namely Taiwan (10 quarters) and Singapore (12 quarters).
Nevertheless, following the above-potential growth rates, heightened inflationary pressures, and capital
outflows from economies with weak fundamentals, the central banks of advanced and some developing
economies continually normalized their monetary policy settings. The US’s Fed decided to increase
policy rates by 25 basis points and conducting its balance sheet normalization. Similarly, the Bank of
Canada raised its rate by 25 basis points, while the ECB halted its monthly asset purchases since the end
of December 2018. The slowdown of key economies amidst the continual monetary normalization as well
as increases in trade protectionist measures, together with other key risks had instigated volatilities within
the global economic and financial system throughout the quarter.
The US economy is expected to expand by 2.4 percent, decelerating from 3.0 percent in the previous quarter.
This was in line with the decelerations in manufacturing production and exports, as reflected by decline in the
Purchasing Managers' Index (PMI), reported by the Institute for Supply Management (ISM), from 59.6 in the
previous quarter to 56.9 in the fourth quarter. In addition, exports growth softened with a growth rate of 5.7
percent in the first two months of the fourth quarter, compared with 8.1 percent in the previous quarter.
Nevertheless, the US economic expansion was still supported by private consumption, which could be seen
from the growth of retail sales of 5.3 percent during the first two months of the quarter, compared with a 4.8-
percent growth in the previous quarter, consistent with the improvement of the labor market and wages, where
the unemployment rate stood at 3.6 percent in the quarter, declining from 3.9 percent in the third quarter and the
average hourly wage increased by 3.3 percent, the highest growth rate in 39 quarters. Meanwhile, the core PCE
inflation in the first two months of the quarter was at 1.9 percent. Under such conditions of above-potential
growth amid strengthened labor market with higher wage rate and close-to-target inflation rate, the Federal
Open Markey Committee (FOMC) decided to raise the target range for the federal funds rate by 0.25 basis
point to 2.25 – 2.50 percent in the meeting on December 18 – 19, 2018. For the whole 2018, the US economy
is expected to grow by 2.8 percent, accelerating from 2.2 percent in 2017. The inflation rate was at 2.1 percent,
compared with 1.8 percent in 2017.
The Eurozone economy expanded by 1.2 percent, softened from 1.6 percent from the previous quarter, and
was the lowest rate in 20 quarters. This was mainly due to the slowdowns in manufacturing and service sectors,
in line with the weaker Composite Purchasing Managers’ Index (Composite PMI). However, domestic
consumption accelerated, in line with an improvement in employment conditions which resulted in 10-year
lowest rate of unemployment at 7.9 percent. This was despite the fact that consumption confidence weakened
due to concerns over possible No-Deal Brexit outturn and weak economic conditions in Italy. Meanwhile, the
headline inflation was lower from 2.1 percent in the previous quarter to 1.9 percent, following a reduction in
energy price. With those conditions, in the meeting on January 24, 2019, the ECB decided to keep its policy
rate unchanged at least until mid-2019 and ceased its Asset Purchase Programme (APP) at the end of December
2018. For the whole 2018, the Eurozone economy expanded by 1.8 percent, decelerating from 2.5 percent in
2017, while the inflation rate was at 1.7 percent, compared with 1.5 percent in 2017.
The Japanese economy plateaued from the third quarter as a result of a negative contribution from net exports,
following the slowdown in exports and the acceleration of imports. Nevertheless, private consumption
improved, consistent with strong labor market as reflected by the 2.4-percent unemployment rate, the lowest
level in 8 years. Another key contributor to private consumption growth was due to accelerated spending before
the consumption tax hike in October 2019. Inflation was at 0.9 percent, down from 1.1 percent in the previous
quarter, remaining lower than the 2-percent target rate. As a result, the BOJ decided to maintain the policy rate
and its level of asset purchases in their meeting on January 23, 2019. For the whole 2018, the Japanese
economy expanded by 0.7 percent, decelerating from 1.9 percent in 2017. The inflation rate was at 1.0
percent, compared with 0.5 percent in 2017.
The US economy tends
to decelerate. However,
the growth remained
higher than its potential
and employment
conditions remained
strong, causing wage
rate to accelerate.
Inflation rate was close
to its target level. Thus
the Fed hiked the policy
rate as well as reduced
its balance sheet.
3. The World Economy in Q4 and the year 2018
The world economy
exhibited clearer and
more extensive
slowdowns during the
last quarter. This
followed the downtrend
of business cycles in
major economics,
monetary policy
normalization, and the
intensifying trade
protectionist measures.
Nonetheless, growth
rates in several
economies remained
above-potential. The
rising inflationary
pressures resulted in a
continual monetary
policy normalization in
many economies.
The Eurozone economy
slowed down to the
lowest rate in 20
quarters, following the
deceleration in
manufacturing and
service sectors. However,
domestic consumption
accelerated, in line with
the lowest
unemployment rate in 10
years.
The Japanese economy plateaued from the previous quarter, due to the negative contribution from net exports. Nonetheless, private consumption expanded well, consistent with the low unemployment rate. Inflation was still below the policy target.

Macroeconomic Strategy and Planning Office
NESDC Economic Outlook
Feb 18, 2019 18
The Chinese economy expanded by 6.4 percent, decelerated from 6.5 percent in the previous quarter, and
was the lowest rate in 28 years. The slowdown was mainly due to slowdown of the agriculture and
services sectors, as well as the lessened contribution from net exports due to the increased import tariffs
by the US. Exports growth was only at 4.4 percent in the fourth quarter of 2018, lowest in 7 quarters.
Similarly, imports expanded by 4.8, which was the lowest in 2 years, and was consistent with the
increased import tariffs on US’s products and the slowdown of the overall economy. Investment in fixed
assets decreased for the first time in 24 years in line with economic restructuring measures, stricter
regulation on commercial banks’ loan provision, and slowdown of private investment in order to wait for
clearer trade policy directions. In terms of economic stability, corporate debt to GDP remained high at
155.1 percent, and both household and government debt ratios also continued to increase. Foreign
exchange reserves decreased to 3,073 billion USD at the end of December 2018, the lowest in 6 quarters
which was consistent with the 5 consecutive quarters of capital outflows and correspondingly Yuan
depreciation at the end of 2018 by 5.6 percent compared with at the end of 2017. Because of the
deceleration of the economy with increasing pressures from the unresolved stability risks, the PBOC cut
its reserve requirement ratio (RRR) for the fourth time in a year, to 13.5 percent on January 4, 2019,
which was effective since the 25th of January in order to increase liquidity in the economy and promote
small businesses. For the whole 2018, the Chinese economy expanded by 6.6 percent, slowing from 6.9
percent in 2017. The inflation rate averaged at 2.1 percent, compared with 1.6 percent in 2018.
The NIEs slowed down from the previous quarter. In detail, the economies of Taiwan and Singapore
expanded by 1.8 and 1.9 percent, in comparison with the third quarter rates of 2.4 and 2.4 percent,
respectively. Such slowdowns were mainly due to softened manufacturing production and exports. On the
other hand, the South Korea economy grew by 3.1 percent, highest in 5 quarters and accelerating from 2.0
percent in the preceding quarter. The 7-year-high expansion in exports in the fourth quarter was the key
contributor. For the whole 2018, the economies of Taiwan, Singapore, and South Korea expanded by 2.6,
3.2, and 2.7 percent, decelerated from the 2017 rates of 3.1, 3.9, and 3.1 percent, respectively. As for
the ASEAN economies, most economies favorably expanded, driven by better growth paces of domestic
consumption and investment, in line with the improvement in the labor market conditions as reflected by
low rates of unemployment. However, exports continually slowed down. The economies of Malaysia,
the Philippines, and Vietnam grew by 4.7, 6.1, and 7.3 percent, accelerating from the preceding quarter’s
growth rates of 4.4, 6.0, and 6.8 percent, respectively. The Indonesia economy grew by 5.2 percent, the
same pace as the third quarter. Inflation largely lowered from the third quarter, following the decline in
energy and transportation prices. For the whole 2018, the economies of Vietnam and Indonesia expanded
by 7.1 and 5.2 percent, accelerating from the 2017 rates of 6.8 and 5.1 percent, respectively. On the other
hand, the economies of Malaysia and Philippines expanded by 4.7 and 6.2 percent, and were lower than
the 2017 rates of 5.9 and 6.7 percent, respectively.
The Chinese economy
expanded with a
lowest rate in 28
years, from slower
growths of
agricultural
production, services,
and net exports. In
addition, investment
in fixed assets
declined. Amidst
higher pressures from
economic slowdown
and intensifying trade
tension, the central
The NIEs mostly
slowed down
following softened
growth pace of
exports and
manufacturing
production. The
ASEAN economies
largely well expanded
following stronger
domestic demand,
while exports
decelerated.
GDP growth, Inflation, and Export growth in several key economies
Export (%YoY) GDP (%YoY) Inflation (%YoY)
2017 2018 2017 2018 2017 2018 Year Year Q3 Q4 Year Year Q3 Q4 Year Year Q3 Q4
USA 6.6 8.5* 8.1 5.7** 2.2 - 3.0 - 1.8 2.1* 2.2 1.9** EU 9.4 8.3 3.6 0.5 2.5 1.8 1.6 1.2 1.5 1.7 2.1 1.9 Japan 8.3 5.7 2.4 1.5 1.9 0.7 0.1 0.0 0.5 1.0 1.1 0.8 China 6.7 9.7 11.6 4.4 6.8 6.6 6.5 6.4 1.6 2.1 2.3 2.2 Hong Kong 7.6 6.8 8.7 2.1 3.8 - 2.9 - 1.5 2.4 2.5 2.6 India 13.1 8.8 10.0 5.7 6.2 - 7.1 - 3.3 4.0 3.9 2.6 Indonesia 16.3 6.7 8.5 -0.7 5.1 5.2 5.2 5.2 3.8 3.2 3.1 3.2 South Korea 15.8 5.4 1.7 7.7 3.1 2.7 2.0 3.1 1.9 1.5 1.5 1.8 Malaysia 14.7 13.6 9.5 7.8 5.9 4.7 4.4 4.7 3.8 1.0 0.5 0.3 Philippines 19.7 -1.8 1.5 -2.1 6.7 6.2 6.0 6.1 2.9 5.2 6.2 5.9 Singapore 10.4 10.3 12.1 5.5 3.9 3.2 2.4 1.9 0.6 0.4 0.7 0.5 Taiwan 13.2 5.9 3.0 0.1 3.1 2.6 2.4 1.8 0.6 1.4 1.7 0.5 Thailand 9.8 7.7 2.6 2.3 4.0 4.1 3.2 3.7 0.7 1.1 1.5 0.8 Vietnam 21.8 13.0 14.3 6.4 6.8 7.1 6.8 7.3 3.5 3.5 4.1 3.4 Source: CEIC, Collected by NESDC Note: * averaged over the first 11 months of 2018
** averaged over October and November 2018

Macroeconomic Strategy and Planning Office
NESDC Economic Outlook
Feb 18, 2019 19
The world economy in 2019 is expected to slow down further from the latter half of 2018, leading by
adjustments to the downtrend of the US economic cycle, as well as the deceleration of the Chinese and the
Eurozone economies, while other countries have been underway of the adaptation phase against the
escalating trade tensions. As such the economic growth of developing countries and the global trade
volume are seen to slowly lose its pace further from 2018. Under the baseline scenario, the world
economy and the global trade volume are projected to grow by 3.8 and 3.8 percent, slowing from 3.9
and 4.0 percent in 2018, respectively.
However, key risks looming economic activities and the financial system in major countries and the
overall global economy are still high. With the risks together with the declined inflationary pressures
following the downtrend of oil and primary commodities’ prices, combined with the downtrend of the
economic cycle, it is expected that major economies will start to become more cautious and considers
adjusting their monetary normalization more slowly compared with last year. Under the baseline scenario,
the Fed is expected to hike its funds rate for 1 – 2 times in 2019, a slower pace than 4 times in 2018,
together with a possibility to reconsider its balance sheet reduction measures if risks to the US economic
growth loom even more. The central banks of Japan, Canada, and the Eurozone, are expected to maintain
their monetary stance, while the PBOC is seen to relax its monetary settings further as well as let the
currency to gradually depreciate in order to support its economic growth and pillow the effects of the
trade protectionist measures.
The US economy is expected to expand by 2.6 percent, a decelerated pace from 2.8 percent in 2017. The
economy will be constrained by above-full-employment economic conditions, diminishing contribution
from measures under the Tax Cuts and Jobs Act, as well as the impacts of trade protection measures.
However, the US economic growth tends to remain higher than its potential level which, in turn, will
cause the unemployment rate to decline unceasingly. This will push upward pressure on wage and thus
inflation to be in a range of 2.0 – 2.3 percent, which is slightly higher than the target rate. As a result, this
would be one of the supporting reasons for the Fed to continually hike its policy rates. Nevertheless,
under the volatilities within the financial and capital markets, and the risk of possible deceleration in the
US and global economies, it is likely that the Fed will become more cautious and may slow the policy rate
hike compared with the previous year. Under the baseline scenario, it is expected that the Fed will
increase the rate 1 – 2 times in June and/or December 2019, compared with 4 increases in 2018. However,
it is possible that the Fed would increase the policy rate slower than the base case and reconsider its
balance sheet reduction policy, if the risks of capital market volatility and the signs of economic
slowdown significantly increase.
The Eurozone economy is estimated to grow by 1.6 percent, decelerating from a 1.8-percent growth in
2018. The expected slowdown trend is in tandem with tighter monetary policy settings after the end of the
ECB’s Asset Purchase Programme (APP) in December 2018, the high uncertainty surrounding Brexit
negotiations, the continuing effects of trade protectionist measures, the effects of the newly implemented
emission standards in Germany, and weak economic fundamentals in Italy. This view is also consistent
with the January 2019 Composite Purchasing Managers’ Index (Composite PMI) which dropped to 51.0,
the lowest level in 66 months. Consequently, it is expected that the ECB will continue to maintain its
expansionary policy stance.
The Japanese economy is expected to expand by 0.9 percent, which is close to 0.7-percent growth in
2018. The picking up pace will be supported by accelerating domestic production and investment of
businesses in order to adjust to the trade protectionist measures, the larger labor force following measures
to attract foreign workers beginning April 2019 onwards as a solution to labor shortages, and the
acceleration of domestic demand before the consumption tax hike, which will be effective from October
2019. Nonetheless, exports are likely to slow down in line with the economic deceleration of trading
partners and remain under risks from the rising US’s import tariffs on automobile and automotive parts, if
the investigation under Section 232 of the US trade law concludes that importing such products is a threat
to the US security. In addition, inflation is likely to remain below the policy target. It is thus expected that
the Bank of Japan will continue maintaining its monetary policy.
The Chinese economy is estimated to expand by 6.3 percent, slowing from 6.6-percent growth in 2018,
owing to the slowdown trend in exports and manufacturing which will be affected further by the US’s
tariff measure, and will consequently lead to a slowdown in domestic demand as well. Under economic
constraints from high corporate and household debt, together with its financial stabilization and economic
restructuring, it is expected that the PBOC will continue to affirm accommodative monetary policy in
order to boost economic activities and cushion impacts from the US’ tariff measures by gradually let the
Yuan depreciate further and alleviate impacts from the tightening financial markets through SFIs credit
lending and continually cut banks’ reserve requirement ratio (RRR).
4. The World Economic Outlook for 2019

Macroeconomic Strategy and Planning Office
NESDC Economic Outlook
Feb 18, 2019 20
The NIEs tend to moderate further from the second of 2018, following the slowdown of global growth
and effects of the US-China trade protectionist measures which will cause export growth to slow down
during the initial phase of trade redirection and supply chain adjustments. Nevertheless, it is expected that
the trade redirection, coupled with manufacturing facility relocation, will increasingly crystalize and
cushion the impacts from the global slowdown and the trade protection measures during the latter half of
2019. The growth rates of the Hong Kong, Singapore, South Korea, and Taiwan economies are estimated
to rise by 3.4, 3.0, 2.5, and 2.4 percent, respectively, sequentially from the growth rates of 3.5, 3.2, 2.7,
and 2.6 percent in 2018. Similarly, the ASEAN economies are expected to decelerate due to the
deceleration of exports, following the slower economic growths of trading partners, especially the US and
China. In addition, domestic demand is likely to face headwinds from the 2018 policy interest hikes
aiming to curb down inflationary pressures and to stabilize the currency. Nevertheless, it is expected that
changes in international trade direction and global supply chain as a result of the implemented trade
protectionist measures will generate some positive spillovers and will be able to mitigate the negative
impacts from the trading partners’ slowdown and the effects of the trade measures through the ASEAN-China
supply chain network. In the base case, the Philippines, Malaysia, Vietnam, and Indonesia are estimated
to grow by 6.0, 4.6, 6.8, and 5.2 percent, slower from the 2018 rates of 6.2, 4.7, 7.1, and 5.2 percent,
respectively.
Notwithstanding, downside risks from volatilities in the global financial system remain high compared
with 2018 which may make the global economic and trade volume growths, as well as monetary policy
directions, to diverge from the baseline assumptions. Key risks that are needed to be consistently
monitored are as follows: (i) the uncertainties revolving around the US-China trade negotiations and their
subsequent trade policy directions, after the two countries’ agreement to temporarily hold off on
additional tariffs on each others for 90 days but will terminate on March 1st, 2019; (ii) the possibility of
additional trade protectionist measures with other countries, especially after the conclusion of section 232
investigation into the imports of motor vehicles and automotive parts on the US’s security which is
scheduled to conclude on February 17th, 2019; (iii) the progress of the UK’s Brexit negotiations with the
EU, before its planned departure on March 29th,2019; (iv) the slowdown of the Chinese economy amid its
instability risks posed by economic imbalances, which will be intensified by the trade tension as well as
capital outflows and production relocation; (v) stability risks in several emerging markets and developing
economics with weak economic fundamentals (for example, Venezuela, Argentina, Turkey, and South
Africa); (vi) non-aligned US’s policies directions, which will obstruct the 2019 budgeting process and the
debt ceiling resolutions due on March 1st as well as the 2020 budgeting process during the last quarter of
2019; (vii) volatilities in the financial market from investors’ expectations and their investment direction
adjustments following key economies’ monetary policy direction and growth prospects; and (viii) the
unresolved geopolitical conflicts, particularly the Saudi Arabia – Iran in Yemen civil war, the US’ withdrawal
from the Intermediate-range Nuclear Forces (INF) treaty, and Venezuela’s domestic political unease.

Macroeconomic Strategy and Planning Office
NESDC Economic Outlook
Feb 18, 2019 21
The Thai economy in 2019 is inclined to face with increased limitations and downside risks posed by
global economic and financial volatilities. Under the baseline scenario, it is nevertheless expected that the
Thai economy will grow at a favorable pace, driven primarily by the improving domestic demand,
particularly private consumption and investment, as well as the recovering tourism sector and the positive
impact from the redirection of international trade. All of which will ease the strains from the global
economic slowdown, which has slowly been dragging on Thai economic and exports growth since the
second half of 2018. However, the volatile global economic condition, as well as the domestic political
sentiment and policy directions after the election, still needs close monitoring.
5. Thai Economic Outlook for 2019
Supporting factors for the economic growth:
1) Private consumption tends to keep its strong growth momentum, and continually support the overall
economic expansion. Particularly, in 2018 it grew at a strong rate of 4.6 percent, which accelerated from
the 2017 rate of 3.0 percent and was the highest rate in 6 years. These improvements were buttressed by:
(i) the overall improvement of income base, generated from diverse sectors especially those related to
tourism, exports, and manufacturing sectors, in addition to the expansion of certain key agricultural outputs
and prices; (ii) the stronger employment conditions as evident by the continual growth throughout the year
of both agricultural and non-agricultural employment. In the fourth quarter of 2018, the employed persons
in the agricultural sector rose, for four consecutive quarters, by 2.4 percent. Similarly, the non-agricultural
sector showed a growth of 1.7 percent, accelerating from 1.6 percent in the third quarter and was the
second period of consecutive accelerations. By industry, the number of employed persons grew by 5.0
percent in construction (10-quarter highest), 4.6 percent in manufacturing (45-quarter highest), and 1.5
percent in retail and wholesale trades (8-quarter highest). As such, the improvement of the employment
condition resulted in the lowest unemployment rate in 12 quarters, at 0.9 percent; (iii) the currently low
rates of interest and inflation; (iv) the new car model launches, amidst the end of the five-year ownership
requirement under the first-car buyer scheme; and (v) the government’s continual measures to support the
low-income citizens. As such, it is expected that, throughout the year 2019, the improved income base,
better employment conditions, low inflation and interest rates, and the government’s measures targeting the
low income, together with additional spending during the election, will jointly support the growth
dynamics of private consumption. Nevertheless, the high growth base of passenger car sales tends to pose
some constraints on the expansion of durable goods spending, and inevitably cause private consumption
growth soften from 2018.
2) Private investment has been on a more-pronounced recovery pace, especially in machinery and
equipment. Investment in machinery and equipment continues to expand following continued export
growths which have been driving the capacity utilization rate of key export-oriented industries to increase
further and thus enter into a period of investment expansion aiming to expand the production capacity.
Particularly, the capacity utilization rate in the fourth quarter of 2018 was at 68.46 percent, higher than 67.4
percent in the same period last year. On the other hand, investments in construction tend to expand
correspondingly with the progresses of major public infrastructure projects as well as the overall economic
recovery. As for 2019, private investment tends to grow more pronouncedly, following: (i) high capacity
utilization rates in key industries, which will encourage production industries to expand their investments;
(ii) better domestic investors’ sentiment, in line with the increases in total value of investment applications
received via the Board of Investment (BOI). In 2018, there were investment application values of 901
billion baht, an increase by 42.8 percent. Particularly, values of 683.9 billion baht were those applied to
invest in the Eastern Economic Corridor (EEC) area, which increased by 137.4 percent from the value in
2017. Some of these projects are expected to start their investments within 2019; (iii) the progresses of
major investment projects, both key infrastructure and the development of EEC; and (iv) the production
and investments relocation in response to the escalated US-China trade tension.
6 In the fourth quarter of 2018, the average capacity utilization rate stood at 68.4%, an increase from 66.4% in the third quarter of 2018 and 67.4% in the
fourth quarter of 2017. Among the 23 key industries, 2 industries exhibited above-90 percent capacity utilization rates, namely: rubber and plastics
products (99.0%) and motor vehicles (97.4%). Other 2 industries had 80 – 90 percent capacity utilization rates, which are consisted of refined petroleum
products (88.4%) and processing and preserving of meat (83.8%). In addition, there were 3 industries with 70 – 80 percent capacity utilization rates,

Macroeconomic Strategy and Planning Office
NESDC Economic Outlook
Feb 18, 2019 22
3) Public investment tends to accelerate, despite the below-than-expected growth in 2018 which was
due to: (i) the smaller FY2018 government’s capital budget framework relative to that of FY2017 by
0.4 percent, which means that the growth of government investment will depend on higher
disbursement rate; and (ii) the lower-than-expected disbursement rate of capital budget in the last
quarter of 2018. Nevertheless, the investments of the state-owned enterprises expanded at a
satisfactory rate of 8.7 percent. This was in line with the progresses of major infrastructure projects,
which tends to support the overall economic growth. For the year 2019, public investment is expected
to accelerate due to: (i) the increase of the FY2019 and FY2020 capital budget (which will be
disbursed within the last quarter of CY2019) framework by 19.9 percent and 6.9 percent,
respectively; (ii) the increase of the FY2019 carry-over budget by 13.1 percent; (iii) the progresses of
key infrastructure projects, particularly those 14 projects under the Transport Action Plan Year 2016
that have been under construction (with 723,109 million baht investment value), compared with 9
projects in the same period last year (with 522,280 million baht), of which the operation and
disbursement are expected to accelerate. This is especially the projects that are intended to be
completed their constructions and to start their operations by the year 2020 – 2021.
Major public infrastructure investment
projects’ progresses have been satisfactory,
and it is expected that the disbursement
figures for these projects will keep rising
accordingly. As of 4th February 2019, there
are 20 projects, with the total budget of
728,669 million baht, under the 2016
Transport Action Plan (20 projects in total),
the 2017 Transport Action Plan (36 projects
in total), and the 2018 Transport Action Plan
(9 projects in total), which have been
proceeded into the construction phase. They
are divided into: (i) 14 projects under the
2016 Transport Action Plan with the total
investment value of 723,109 million baht;
(ii) 5 projects under the 2017 Transport
Action Plan with the total investment value
of 3,517 million baht; and (iii) 1 project
under the 2018 Transport Action Plan with
the total investment value of 2,043 million
baht.
As for key infrastructure investment
projects under the Eastern Economic
Corridor Plan (EEC) (the high speed train
project linking 3 major airports (Don Muang
- Suvarnabhumi - U Tapao, the U Tapao
Airport and Eastern Airport City project, the
3rd phase of Laem Chabang (LCB) Port
project, the 3rd phase of Map Ta Put
Industrial Port Development project, and the
Aircraft Maintenance, Repair and Overhaul
(MRO) project), all of them are already
approved by the cabinet. The projects are
under the process of bidding and negotiating
with the potential private partners, are
conceivable to be signed as soon as the
second quarter of 2019.
Progresses of Key Public Infrastructure Investment Projects
Under Construction723,109 MB.
Project Budget(MB.)
Progress(Percent)
Dual-track rail: Jira – Khon Kaen 23,803 94.2
Coastal port (Port A)at Laem Chabang Port 1,864 100.0
Container depotat Laem Chabang: Stage I 2,031 98.8
Intercity motorway:Pattaya – Map Ta Phut 17,819 96.7
Intercity Motorway:Bang Pa In – Nakhon Ratchasima 76,600 59.9
Mass Rapid Transit Orange Line: Thailand Cultural Centre – Minburi 109,541 27.0
Meter gauge (1 meter) rail development Prachuab – Chumporn 36,023 16.2
Meter gauge (1 meter) rail development Mab Kabao – Jira 30,729 7.4
Meter gauge (1 meter) rail development Lopburi – Pak Nam Pho 22,328 4.9
Train route: Bangkok – NakhonRatchasima (Thai – China Cooperation) 179,413 Construction
started Intercity Motorway: Bang Yai –Kanchanaburi 49,120 18.2
Mass Rapid Transit Pink Line:Khae Rai – Minburi 56,691 Rigjts
allocation, civil and
system workMass Rapid Transit Yellow Line:Lat Phrao – Samrong 54,644
Suvarnabhumi airport: Stage II 62,503 93.5Source: Ministry of Transport as of 4 February 2019
Bidding Process399,706 MB.
MOT / SEPO / NESDB
Consideration Process
94,673 MB.
MRT Light Red Lineand Dark Red Line
44,158MB.
MRT Purple Line: Tao Pun – Rat Burana
131,004MB.
The High-Speed Rail Linked 3 Airport Project
(Don Muang – Suvarnabhumi –U-Tapao)
224,544MB.
High-speed train route: Bangkok – Hua Hin
94,673 .
High-speed train route: Bangkok – Phitsanulok
(Thai – Japan Cooperation)N/A
Initially 1,796,385 MB. from 1 Dec 2015 cabinet decisions Includes the High-speed train route: Bangkok – Rayong project
Progress of 20 Public Investment Projects under the Transport Action Plan Year 2016 (1,383,938.89 MB. Budget*)
Progress of 36 Public Investment Projects under the Transport Action Plan Year 2017 (895,757.55 MB. Budget*)
Source: Ministry of Transport as of 4 February 2019
Study / Survey / EIA / PPP
257,566 MB.
Under Construction
3,517 MB.
MOT / SEPO / NESDB
Consideration Process
464,634 MB.
In Service738 MB.
Bidding Process42,687 MB.
Cabinet ApprovalProcess 85,345 MB.
Project Budget (MB.)
Ferry Service across Gulf of Thailand N/ACommon Ticket System 738Truck rest area on the main routes 480
Intermodal Facility at Chiang Khong, Chiang Rai 2,219
Regional airport: Mae Sod, Tak 369Regional airport: Betong, Yala 338Regional airport: Sakon Nakorn 111Express Way Rama 3 – Dao Kanong – Outer Ring (West) 31,244
Baggage System Upgrade at Suvarnabhumi airport 3,264
Krabi Airport 3,876 Aircraft Maintenance, Repair, and Overhaul Facility Development at U-Tapao Airport 4,303
Dual Track Rail: Den Chai – Chiang Rai – Chiang Khong 85,345
Regional Logistics Center in 7 border cities 8,121
Regional Logistics Center in 5 regional cities 8,606
MRT Orange Line:Taling Chan – Thailand Cultural Centre 120,459
Mass Transit in Phuket 30,155Lam Cha Bang port: Phase 3 91
Development of Ferry Terminal, Golf ofThailand 982
Project Budget (MB.)Cross-border Logistics Center, Nakorn Phanom 1,169Intercity Motorway (Nakorn Phatom – Cha Am) 80,600Expressway Kratu – Patong, Phuket 14,177Dual Track Rail: Paknampho – Den Chai 62,614Dual Track Rail: Jira – Ubonratchathani 37,524
Dual Track Rail: Khonkaen – Nong Khai 26,654Dual Track Rail: Chumporn – Surat Thani 24,287Dual Track Rail: Surat Thani – Songkhla 57,369Dual Track Rail: Hat Yai – Padang Beza 8,116Dual Track Rail: Den Chai – Chiang Mai 59,915Dual Track Rail: Ban Pai –Nakorn Phanom 67,965Commuter Train Dark Red Line: Rangsit –Thammasat University Rangsit 6,570
MRT Light Red Line Extension: Taling Chan – Siriraj and Taling Chan – Salaya 17,672
Public Bus Procurement and Stations 572MRT Blue Line: Bang kae – Sai 4 21,197MRT Dark Green Line: Samutprakarn – Bang Pu 9,530MRT Dark Green Line: Kukot – Lumluka 9,803Mass Rapid Transit: Dark Green Samutprakarn – Bang Pu 30,500
Northern Route N2 and E-W Corridor, and Route N1 replacement 23,215
13 Dec 2016 cabinet decisions **Double Track Rail Network: Huahin – Prachuap Khiri Khan in reported in AP 2016
In Service1,891 MB.
Study / Survey / EIA / PPP
481,225 .
Construction2,043 MB.
Progress of 9 Public Investment Projects under the Transport Action Plan Year 2018 (489,366.30 MB. Budget)
489 NGV Public buses 1 1,891 MB.
43,000 MB.
272,226 MB.
107,233MB.
13,593 MB.
13,947 MB.
1,826 MB.
29,400 MB.
Regional airport development: Khon Kaen02 2,043
MB.
Source: Ministry of Transport as of 4 February 2019
Intercity Motorway: Rangsit – Bang Pa-In
Intercity Motorway: Thonburi – Pak Tho
High-speed train route: Bangkok – Chiang Mai
Mass Transit in Chiang Mai
Mass Transit inNakhon Ratchasima
Mass Transit inKhon Kaen
Dry Port Khon Kaen

Macroeconomic Strategy and Planning Office
NESDC Economic Outlook
Feb 18, 2019 23
4) A recovery in the tourism sector will contribute more to the overall economy. Although the number
of tourists’ growth in 2018 were hindered by temporary factors including the 2018 FIFA World Cup
organized in Russia during June – July 2018 and the Phuket boat capsize incident in July which were a
major setback to the economic growth in the latter half of 2018. The number of foreign tourists has been
recovering evidently through the 4.5- and 7.7-percent growth in November and December, respectively,
which were accelerations from 1.9 percent in the third quarter and 0.5 percent in October. The number
of Russian and European tourists expanded by 1.4 and 0.9 percent in the fourth quarter of 2018, a clear
recovery from the contractions of 7.8 and 2.1 percent in the preceding quarter, respectively. Similarly,
the December number of Chinese tourists expanded for the first time in 6 months. Moreover, the latest
January 2019 data on visitors through 5 main airports showed a clear improvement, with a 6.0-percent
growth. Following the ongoing trend, it is expected that the tourism sector will return to its normal trend
and further bolster Thailand economic growth throughout 2019.
5) Redirection of international trade, global manufacturing production, and foreign investment
will become more apparent, and as a result will cushion the effects of the global economic
slowdown. The slowdown of export value from 13.5 percent growth in the first half of 2018 to 2.4
percent in the second half was consistent with the shift in global economic cycle that passed through
its peak period and started to be on its slowdown trend, and was also a result of the further intensified
trade protectionist measures of the key countries. Notwithstanding those occurrences, data in the last
quarter of 2018 suggested that Thai exports to the US and China has been benefiting from those
measures in many export items. In addition, investment data also provided some signs of the changes
in trade direction and supply chain outward from the affected countries, and are expected to further
materialize if the US-China trade tensions escalate. Such redirections will not only pillow the effect of
global economic slowdown, but will also be an important opportunity for Thailand to stimulate export
and investment in order to further drive potential economic growth.
Limitation and Risk Factors:
1) The global economy could expand less than expected while risks over the fluctuations in the
economic and financial system remain high. Under the base case scenario, it is expected that the
world growth will be 3.8 percent, gradually slowing down from the 3.9-percent growth in 2018. Key
risk factors to the outlook include: (i) outcome of the US-China trade negotiations dated on March 1st, 2019,
as well as the trade policy direction afterwards; (ii) possible escalation of the US’s trade protectionist
measures to other countries especially after the conclusion of the section 232 investigation on the
US’s imports of motor vehicles and automotive parts due in February 2019 that will determine the
trade policy direction, which may include additional trade protectionist measures; (iii) slower-than-
expected Chinese economy and increasing instability risks from the continual built up of imbalances,
which might also be aggravated by trade protectionist measures, together with capital outflows and
production relocation; (iv) the risk that the UK may not be able to reach an agreement on the exit
from EU (No-Deal Brexit) by March 29th, 2019; (v) non-aligned US’s political policy directions
between the Democratic and Republican parties, which would hinder the budget bill’s approval
process and the resolution of the US public debt ceiling; and (vi) unsettled geopolitical conflicts,
including the Iran-Saudi Arabia tension, US’s withdrawal from the Intermediate-Range Nuclear
Forces (INF) Treaty, and Venezuela domestic political unease.
2) Post-election political sentiment and the future government’s policy direction are to be
monitored. Although it is expected that the political transition will be smooth and the key policies
will continue, the political sentiment both during- and post-election periods as well as new
government policy direction may pose some impacts on overall economic sentiment as well as
investors’ and tourists’ confidence. Moreover, the FY2020 budget process and some investment
approval could possibly be delayed.

Macroeconomic Strategy and Planning Office
NESDC Economic Outlook
Feb 18, 2019 24
1) The world economy in 2019 is expected to grow by 3.8 percent, decelerating from a 3.9-percent
growth rate in 2018, as assumed in the preceding projection. This follows the slowdown of key
economies, particularly the US, China, the Eurozone, and the Newly Industrialized Economics (NIEs).
Latest data on the fourth quarter of 2018 exhibited a deceleration trend with lowest growth rates in
many countries, partly as a result of the trade protectionist measures between the US and China which
has resulted in weaker exports performance in several economies and thus slower trade volume growth.
In the case that there is no additional US’ trade protectionist measures and China’s counter measures,
the world trade volume is projected to expand by 3.8 percent, which is a slowdown from 4.0
percent in 2018 (but maintained from the previous projection assumption). Nevertheless, there are
some risks that could contribute to a lower world economic and trade volume expansion than assumed,
and need close surveillance.
2) The average value of Thai baht in 2019 is expected to be in the range of 31.5 – 32.5 baht per US
dollar, appreciated from 32.3 baht per US dollar in 2018 and 32.5 – 33.5 baht per US dollar in the
previous projection, following: (i) the likely slower pace of the Fed’s policy rate hikes and long-term
US treasury yield increases compared with the previous assumption. Under the baseline scenario, it is
expected that the Fed will raise its policy rate for 1 – 2 times during 2019 and that the average yield on
10-year Treasury notes in the last quarter of 2019 will be at the same level as it was in the last quarter of
2018. This is different from the previous forecast assumptions which assumed that the Fed will raise its
rate for 2 – 3 times and the average yield will be higher than it was in the last quarter of 2018; and
(ii) the intensified risks in key countries which would dampen investors’ confidence towards the
slowdown trend of major economies, which thus would affect business profitability and lower returns
on those economies’ equities.
3) The average Dubai crude oil price in 2019 is expected to be in the range of 62.0 – 72.0 US dollar per
barrel, lower than 69.3 US dollar per barrel in 2018, and was a downward revision from 70.0 - 80.0
US dollar per barrel. This was to be consistent with the decreases in oil prices during the fourth
quarter of 2018, specifically from 79.3 and 65.8 US dollar per barrel in October and November,
respectively, to average only 56.9 US dollar per barrel in December. Supporting factors for the lower oil
prices are: (i) concerns on oversupply as Saudi Arabia and Russia provided signals on raising oil
production, in order to alleviate the effects of Iranian crude oil supply reduction (under the US Sanction
against Iran). However, US issued a temporary relieving measure to 8 countries allowing them to
import Iranian oil for 180 days, which will expire on May 3rd, 2019; (ii) the faster-than-expected crude
oil production increases of the US; and (iii) the intensifying of risks in major countries, which worsen
investors’ concerns over the global slowdown and thus would cause the oil demand to increase at
slower pace than expected. Nevertheless, there are still factors that will support oil prices to increase
gradually over the remainder of the year, including: (i) oil production reduction from both OPEC and
non-OPEC countries, totaling 1.2 million barrel per day, from January – June, 2019; (ii) the expiration
of the waiver to 8 countries importing crude oil from Iran on May 3rd , 2019, which will lead to the
reduction of Iran’s crude oil production; and (iii) the likely decline of crude oil supply from Venezuela,
as a consequence of the US’s sanction.
Key assumptions for 2019 economic projection:
World Economic Projection
Actual Data Projection for 2019 2017 2018 Nov 19, 2018 Feb 18, 2019
World Economic Growth (%)1 4.1 3.9 3.8 3.8 USA 2.2 2.82 2.6 2.6 EU 2.5 1.8 1.9 1.6 Japan 1.9 0.7 0.9 0.9 China 6.8 6.6 6.3 6.3
World Trade Volume (%) 5.1 4.0 3.8 3.8 Exchange Rate (Baht/US dollar) 33.9 32.3 32.5 – 33.5 31.5 – 32.5 Dubai Crude Oil (US Dollar/Barrel) 53.0 69.3 70.0 – 80.0 62.0 – 72.0 Export Price (US Dollar) (%) 3.6 3.4 1.0 – 2.0 0.5 – 1.5 Import Price (US Dollar) (%) 5.5 5.6 1.5 – 2.5 1.0 – 2.0 Income from Tourism (Trillion baht) 1.93 2.05 2.24 2.24 Source: NESDC 1 World economic calculated by trade weight of key economic partners in 2017 (15 economies) 2 Forecasted, since the data available is only up to the 3rd quarter of 2018.

Macroeconomic Strategy and Planning Office
NESDC Economic Outlook
Feb 18, 2019 25
Thai exports in the last quarter of 2018 continued to grow though at slower
rate, in line with the more broad-based deceleration in exports growth of major
countries in the region, particularly, the exports of those countries with high
export share to China. The export slowdown was also consistent with the
deceleration in world economic expansion amid increasing pressures from trade
tensions and the slowdown of Chinese economy with the lowest growth rate in
the past 28 years. However, Thai export goods, in particular those listed on the
tariff lists announced under the US and China’s trade protection measures, grew
by 4.8 percent and were actually the main supporter of the overall Thai export
expansion in this quarter. In contrast, Thai exports, in which their categories
were not included on the tariff lists, declined by 1.1 percent (Table 1). In
addition, it was found that the Thai export goods that expanded well in the US
market, mostly were those under the same categories as those on the US tariff
lists imposed on Chinese imports (Table 2). Similarly, the Thai export goods
that could expand in the Chinese market mostly were the ones under the same
categories as those on the Chinese tariff lists imposed on the US imports (Table
3). On the other hand, the Thai export goods that declined in the Chinese market
were mostly the ones with the same categories as those on the tariff lists that the
US imposed on Chinese imports. This result clearly illustrated how trade
protection measures could impact Thai exports through the linkage of the Thai-
Chinese supply chain (Table 4). Nevertheless, the impacts through the linkage
of the Thai–US supply chain, particularly the US goods manufactured for
exporting to China using Thai intermediate goods, remained not yet clear.
The data revealed three important facts including: (i) the deceleration of
world economic growth started to impact on Thai exports and experience some
declines, as reflected by the decline in exports of those outside the trade
protection measures, (ii) trade protection measures between the US and China
posed negative impacts on Thai exports through the linkage of the Thai-Chinese
supply chain where Thai intermediate goods were used for manufacturing
Chinese goods and, later on, exporting to the US, and (iii) the positive benefits
from change in trade direction caused by the trade protection measures were
likely to outweigh the negative effects that occurred through the supply chain
linkage. Under such data and information, policy for driving Thai exports in
2019 should thus focus mainly on : (i) promoting Thai exports that could benefit
from the trade protection measures in both the US and China markets.
According to the data collected by the NESDC, it was found that of total 6,847
Chinese products including on the US tariff lists (value of 250 million USD), by
using the 8-digit Harmonized System Code, there were 2,556 products (value of
22.1 million USD) of Thai export products to the US market with the same
categories as those Chinese products. Similarly, of total 5,865 US products
including on the Chinese tariff lists (value of 110 million USD), there were
3,042 Thai products exporting the China (value of 31.5 million USD) that were
in the same categories as those US products, of (ii) providing assistance
measure for exporters impacted by the trade protection measures through the
supply chain, especially those exporters who export their products to China and
re-export to the US in order to diversify their exports to other markets, and (iii)
monitoring on changes in key import products which are subjected to the tariffs
imposed by the US and/or China, as they could be re-channeled to the Thai
market
Thai exports under the global slowdown and the trade protection measures: Opportunities and Policy Implications
Table 1 Current situation of Thai export goods and trade barrier between US and China
%YoY 2017 2018 Year Q1 Q2 Q3 Q4
Total Exports (Customs basis) 9.9 6.7 11.7 10.9 3.0 2.0 Under US measures applied to China 18.3 10.3 17.7 11.2 6.9 6.3 Under China measures applied to US -6.4 4.1 8.5 2.8 1.8 3.5
Under trade barrier measures between US and China 3.0 6.8 12.5 6.4 4.0 4.8 Outside trade barrier 19.2 6.6 10.8 16.6 1.7 -1.1 Source: MOC calculated by NESDC
Table 2 Examples of Thai exports to the US with positive Changes (YoY%)
HS Items 2018 Year Q1 Q2 Q3 Q4
IP
2931 Organo - inorganic compounds 59.9 52.2 59.4 63.2 62.8 3907 Polyacetals, other polyethers and
epoxide resins, in primary forms 73.2 46.9 50.5 43.6 44.9 5503 Synthetic staple fibres 166.7 140.8 163.8 139.8 215.9 7205 Granules and powders, of pig iron,
spiegeleisen, iron or steel 74.2 64.9 31.8 17.1 207.6 8708 Parts and accessories of the motor
vehicles 46.2 46.9 50.5 43.6 44.9
FP
4011 New pneumatic tyres, of rubbery used on motor cars 29.1 43.6 26.8 19.3 28.9
7307 Tube or pipe fittings of iron or steel 81.7 110.5 19.2 96.6 124.8 8512 Electrical lighting or signalling equipment
used for cycles or motor vehicles 70.2 56.7 89.5 49.6 86.8 8517 Electrical apparatus forline telephony 29.4 -52.4 10.9 74.5 108.9 8543 Electrical machines and apparatus 26.7 -84.3 0.5 84.9 238.0
Source: MOC calculated by NESDC Table 3 Examples of Thai Exports to China with positive changes (YoY%)
HS Items 2018 Year Q1 Q2 Q3 Q4
IP
2309 Preparations of a kind used in animal feeding 102.8 129.0 120.1 61.6 111.3
2520 Gypsum; anhydrite; plasters 32.7 12.6 86.5 8.2 32.1 2902 Cyclic hydrocbons 128.4 98.3 114.9 125.4 175.4 2918 Carboxylic acids with additional oxygen
function 87.8 105.3 92.3 112.7 63.0 3903 Polymers of styrene, in primary forms 101.6 73.4 131.1 133.9 73.2 3907 Polyacetals, other polyethers and epoxide
resins, in primary forms 26.6 26.8 51.2 24.0 9.8 4003 Reclaimed rubber in primary forms 87.5 56.8 95.9 107.0 89.1 8503 Parts suitable for use solely or principally
with machines 52.1 62.3 112.5 47.7 15.6 8525 Transmission apparatus for
radio-telegraphy 283.9 585.9 388.7 459.4 182.4 8541 Diodes, transistors and similar
semiconductor devices 91.4 134.9 73.0 65.7 108.3 Source: MOC calculated by NESDC
Table 4 Examples of Thai Exports to China with negative changes (YoY%) HS Items 2018
Year Q1 Q2 Q3 Q4
IP
2708 Pitch and pitch coke -27.4 -19.9 -36.6 -47.5 0.8 3916 Monofilament of which any cross-sectional
dimension -84.4 -82.9 -93.2 -84.4 -72.1 4007 Vulcanised rubber thread and cord 2.5 11.5 24.2 -8.7 -11.7 4410 Particle board and similar board -0.6 6.8 152.0 -32.8 -43.4 5503 Synthetic staple fibers, not carded 42.0 5.3 180.6 61.0 -23.8 5505 Waste of man-made fibers -33.9 -48.5 -22.9 -29.8 -36.3 5603 Nonwovens or not impregnated, coated, coverd or
Iaminated -15.9 -5.3 -40.5 23.0 -36.3 8472 Other office machines 2.1 58.7 18.5 3.0 -37.9 8542 Electronic integrated circuits and microassembies -16.8 13.4 12.8 -49.1 -24.3
FP
8413 Pumps for liquid -29.6 -13.0 -29.4 -40.5 -30.1 8414 Air or vacuum pumps -41.3 -16.2 -17.3 -28.1 -70.8 8481 Taps, cocks, valves and similar appliances -9.5 58.7 43.7 -43.9 -59.1 8483 Transmission shafts and cranks -17.1 -14.3 -1.2 -27.9 -23.2 9002 Lenses, prisms, mirrors and other optical ele-
ments -29.6 -16.1 -9.4 -30.2 -46.6 Source: MOC calculated by NESDC
Table 5 Opportunities of Thai exports from trade protection measures between US and China US Market China Market
Items under US measures applied to China (detailed by 8 - digit HS Code)
Thai export items with the same items of
measures Items under US measures applied to
China (detailed by 8 - digit HS Code) Thai export items with
the same items of measures
Package Items Value (Bil USD) Items Value
(Bil USD) Package Items Value (Bil USD) Items Value
(Bil USD) 16 bil USD 284 16 152 1.9 16 bil USD 114 16 63 2.6 34 bil USD 818 34 460 5.6 34 bil USD 545 34 131 3.8 200 bil USD 5,745 200 1,944 14.5 200 bil USD 5,206 60 2,848 25.1 Total 6,847 250 2,556 22.1 Total 5,865 110 3,042 31.5 Source: MOC calculated by NESDC

Macroeconomic Strategy and Planning Office
NESDC Economic Outlook
Feb 18, 2019 26
4) The export and import prices in US dollar term are expected to increase by 0.5 – 1.5 and 1.0 – 2.0
percent, slower from 3.4 and 5.6 percent in 2018, respectively and downwardly revised from 1.0 – 2.0
and 1.5 – 2.5 percent previously assumed. This is in line with the downward revision of world crude
oil price assumption in 2019 with expected decline rate of 3.3 percent from 2018, compared with the
6.5 percent growth in the previous assumption. The assumption revision implies that oil-related
mineral, energy, and manufacturing export prices will increase at a slower rate than previously
assumed, similarly for the prices of oil-related import products including energy, raw material, and
intermediate goods.
5) Revenues from foreign tourists in 2019 are expected to reach 2.24 trillion baht, increasing by 9.2
percent from 2.05 trillion baht in 2018. The assumption remains unchanged from the previous
projection, with the following supporting factors: (i) the return to the normal trend of tourists from
Russian and European countries, after unusual low growths during 2018 due to the June – July 2018
FIFA World Cup organized in Russia which brought European tourists to change their destination from
other countries and travel more to Russia. The recovery is evident since the fourth quarter of 2018, as
the number of tourists from Russia and Europe grew by 1.4 and 0.9 percent, respectively. Similarly,
another key supporting factor include the normalizing trend of Chinese tourists after experienced with
boat capsizing incident in Phuket on July 5th, 2018. This is evident by the data in December showing
that the number of Chinese tourists grew for the first time in 6 months at 2.8 percent. In addition, the
data on visitors to the 5 main airports in January 2019 also exhibited a stronger growth of 6.0 percent.
All the factors are in line with the previous assumption that the number of tourist arrivals will normalize
in the first quarter of 2019; (ii) the government’s continual measures to promote tourism sector, especially
the extension of the temporary waiver on the visa-on-arrival (VOA) fee to end on April 30th, 2 0 1 9 ,
secondary city tourism promotions, market seeking on potentially new tourist markets, and marketing
campaigns to attract first-time visitors; and (iii) image of Thailand regarded as one of the world’s most
important tourism destinations.
6) The budget disbursement assumptions are as follows: (i) the FY2019 annual budget disbursement
rate of 92.0 percent of overall budget (downwardly revised from 93.0 percent in the previous
projection), compared with 91.5 percent in the FY2018. Specifically, the current and capital budgets
are assumed to be disbursed by 98.0 percent (same as in the previous projection) and 70.0 percent
(downwardly revised from 75.0 percent previously assumed, following the below-than-expected
disbursement performance in the first quarter of FY2019), compared with 96.1 percent and 70.5
percent in the FY2018, respectively; (ii) state-owned enterprises’ capital budget disbursement of 80.0
percent; (iii) carry-over budget disbursement of 75.0 percent; and (iv) annual budget disbursement in
the first quarter of FY2020 (October – December 2019) of 30.3 percent.

Macroeconomic Strategy and Planning Office
NESDC Economic Outlook
Feb 18, 2019 27
The Thai economy is projected to expand in the range of 3.5 – 4.5 percent (with the midpoint of 4.0
percent), from 4.1 percent in 2018. Headline inflation is estimated to be in the range of 0.5 – 1.5
percent and the current account balance is forecasted to register a surplus of 6.2 percent of GDP.
In the press release dated on February 18th
, 2019, NESDC forecasted that the Thai economy in 2019
will expand in the range of 3.5 – 4.5 percent (with the midpoint of 4.0 percent), unchanged from the
forecast in the press release dated on November 19th, 2018. Although there were some revisions on
crude oil price and exchange rate assumptions, which caused alterations to the import and export
prices, as well as current accounts, and inflation rate projection, the revisions did not significantly
affect the economic growth and its components forecasts. Nevertheless, there are more risks looming
to the outlook than in the previous forecast and thus are in need of close surveillance and assessment.
(1) The volatilities of the global economy and financial markets are still depending on: (i) the outcome of
the US-China trade negotiations planned on March 1st, 2019, as well as the economic and trade policy
direction afterwards; (ii) the conclusion of the section 232 investigation into the imports of motor
vehicles and automotive parts in February 2019 that will determine the US government’s resulted
policy direction; (iii) the slowdown of the Chinese economy and its instability risks, which might be
aggravated by additional trade protectionist measures, together with capital outflows and production
relocation; (iv) the risk that the UK may not be able to reach an agreement on the exit from EU
(No-Deal Brexit); (v) obstacles to the US federal budgeting process and the debt ceiling problem; and
(vi) key unsettled geopolitical conflicts.
(2) Although it is expected that the political transition will be well-ordered and the long-term key
policies will continue, investors’ confidence and overall economic sentiment may be sensitive to the
during-election and post-election political conditions. In addition, the FY2020 budget consideration
process and investment project approvals could possibly be delayed.
Economic Projection for 2019:
Key components of the economic growth :
1) Consumption: Private consumption expenditure is expected to grow by 4.2 percent, the same as
previously estimated. However, private consumption decelerated from a 4.6-percent growth in 2018 due to
a high base effect, especially in consumption of durable goods. Nevertheless, private consumption tends to
exhibit a favorable expansion supported by: (i) the satisfactory improvement of overall income conditions
which is in line with the improvement in employment conditions, in both agricultural and non-agricultural
sector, since the first quarter of 2018. This, in turn, caused a reduction in unemployment rate of 0.9 percent
in the last quarter of 2018, which is the lowest rate in 12 quarters. Moreover, it is expected that the income
bases of tourism-related and service sectors would grow at accelerated rates, while those in manufacturing,
export, and agricultural sectors would grow moderately; (ii) interest and inflation continue to remain low;
and (iii) the government measures to assist low-income people. Government consumption expenditure
is anticipated to expand by 2.2 percent, the same as previously estimated, accelerating from 1.8 percent in
2018. This is in line with an increase in budget framework and expected higher disbursement rates.
2) Total investment is expected to grow at 5.1 percent, the same as previously estimated, accelerated from
3.8 percent in 2018. Public investment is projected to expand by 6.2 percent, same as previously
estimated, accelerated from 3.3 percent in 2018. The main supporting factors are increase in the FY2019
annual capital budget framework of 19.9 percent, compared to a reduction of 0.4 percent in the FY2018,
and favorable progress of infrastructure projects, which have continued to enter into the construction phase
and would help speed up budget disbursement of state-owned enterprises, especially the projects that are
targeted to finish and operate during 2020 – 2021. Private investment is expected to expand by 4.7
percent, the same as previously estimated, accelerated from 3.9 percent 2018. The supporting factors are
(i) an increase in capacity utilization rate, which is in line with increases in exports and domestic demand.
This, in turn, will encourage more investments as to increase production capacity, especially in those
industries with capacity utilization rate higher than 75.0 percent as well as those industries that tend to have
greater opportunity from the trade tension between the US and China; (ii) the progress of Public-Private
Partnership (PPP) infrastructure projects which has begun to further support constructions of private sector
and would also improve confidence of private sector as well as encourage further private investment;

Macroeconomic Strategy and Planning Office
NESDC Economic Outlook
Feb 18, 2019 28
(iii) higher value of investment promotion applications in 2018 which reached 901 billion baht, increased
by 42.8 percent from previous year, especially the application in the Eastern Economic Corridor (EEC)
where the application value expanded by 137.4 percent in 2018, and (iv) the likelihood of manufacturing
base relocation of foreign firms to Thailand due to escalating trade protection measures between the US
and China.
3) Export value of goods in US dollar term is anticipated to grow by 4.1 percent, compared with a 7.7-percent
growth in 2018. This is a downward revision from 4.6 percent in the previous assumption, due to a
reduction in the assumption of export prices from 1.0 – 2.0 percent to 0.5 – 1.5 percent. This is in line
with the downward revision of crude oil price assumption. While the export volume is expected to
increase by 3.1 percent, the same as previously projected. Service exports tend to continually grow at a
satisfactory pace in line with the continual rising revenues from tourists. It is thus projected that export
quantity of goods and services will expand by 3.9 percent, compared with 4.2 percent in 2018.
4) Import value of goods in US dollar term is expected to expand by 6.1 percent, compared with a
14.3-percent growth in 2018. This is a downward revision from 6.5 percent in the previous projection.
It was due to a downward revision on the growth of import price from 1.5 – 2.5 to 1.0 – 2.0 percent due
to the decreasing in crude oil price assumption, which, in turn, causes the import price of raw
material and energy to be lower. However, the import quantity tends to slightly rise by 4.6 percent,
instead of 4.5 percent from the preceding projection, due to the revision exchange rate assumption.
Combining with import of services, it is projected that import quantity of goods and services will
expand by 4.3 percent, compared with 8.6 percent in 2018.
5) Trade balance is estimated to register a surplus of 20.0 billion US dollars, lower than a surplus of
23.6 billion US dollars in 2018. After combining with projection on service account surplus from the
increasing revenues from tourist, the current account is projected to register a surplus of
approximately 33.5 billion US dollars or 6.2 percent of GDP, compared with a surplus of 7.4 percent
of GDP in 2018.
6) Economic stability will remain sound: the headline inflation rate in 2019 is expected to be in the
range of 0.5 – 1.5 percent, compare with 1.1 percent in 2018. This is lower than the range of 0.7 – 1.7
percent in the previous projection consistent with a downward revision on the crude oil price and
exchange rate assumption.
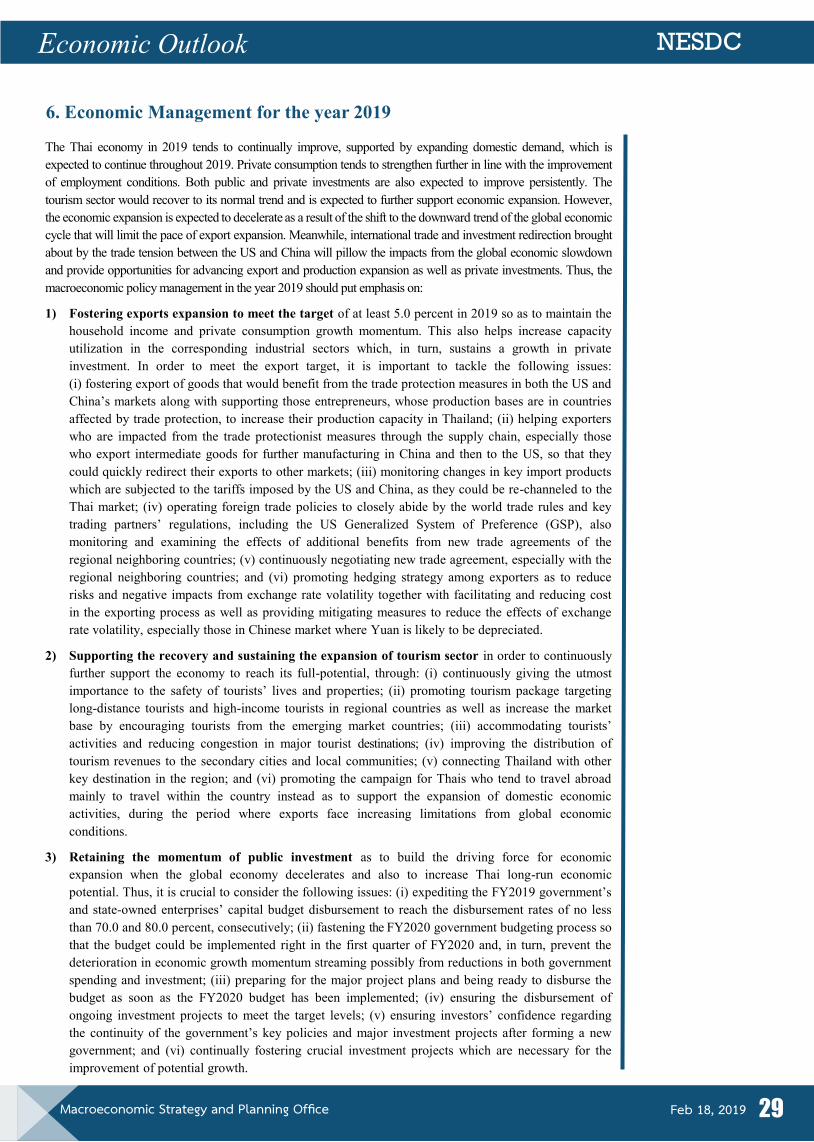
Macroeconomic Strategy and Planning Office
NESDC Economic Outlook
Feb 18, 2019 29
The Thai economy in 2019 tends to continually improve, supported by expanding domestic demand, which is
expected to continue throughout 2019. Private consumption tends to strengthen further in line with the improvement
of employment conditions. Both public and private investments are also expected to improve persistently. The
tourism sector would recover to its normal trend and is expected to further support economic expansion. However,
the economic expansion is expected to decelerate as a result of the shift to the downward trend of the global economic
cycle that will limit the pace of export expansion. Meanwhile, international trade and investment redirection brought
about by the trade tension between the US and China will pillow the impacts from the global economic slowdown
and provide opportunities for advancing export and production expansion as well as private investments. Thus, the
macroeconomic policy management in the year 2019 should put emphasis on:
1) Fostering exports expansion to meet the target of at least 5.0 percent in 2019 so as to maintain the
household income and private consumption growth momentum. This also helps increase capacity
utilization in the corresponding industrial sectors which, in turn, sustains a growth in private
investment. In order to meet the export target, it is important to tackle the following issues:
(i) fostering export of goods that would benefit from the trade protection measures in both the US and
China’s markets along with supporting those entrepreneurs, whose production bases are in countries
affected by trade protection, to increase their production capacity in Thailand; (ii) helping exporters
who are impacted from the trade protectionist measures through the supply chain, especially those
who export intermediate goods for further manufacturing in China and then to the US, so that they
could quickly redirect their exports to other markets; (iii) monitoring changes in key import products
which are subjected to the tariffs imposed by the US and China, as they could be re-channeled to the
Thai market; (iv) operating foreign trade policies to closely abide by the world trade rules and key
trading partners’ regulations, including the US Generalized System of Preference (GSP), also
monitoring and examining the effects of additional benefits from new trade agreements of the
regional neighboring countries; (v) continuously negotiating new trade agreement, especially with the
regional neighboring countries; and (vi) promoting hedging strategy among exporters as to reduce
risks and negative impacts from exchange rate volatility together with facilitating and reducing cost
in the exporting process as well as providing mitigating measures to reduce the effects of exchange
rate volatility, especially those in Chinese market where Yuan is likely to be depreciated.
2) Supporting the recovery and sustaining the expansion of tourism sector in order to continuously
further support the economy to reach its full-potential, through: (i) continuously giving the utmost
importance to the safety of tourists’ lives and properties; (ii) promoting tourism package targeting
long-distance tourists and high-income tourists in regional countries as well as increase the market
base by encouraging tourists from the emerging market countries; (iii) accommodating tourists’
activities and reducing congestion in major tourist destinations; (iv) improving the distribution of
tourism revenues to the secondary cities and local communities; (v) connecting Thailand with other
key destination in the region; and (vi) promoting the campaign for Thais who tend to travel abroad
mainly to travel within the country instead as to support the expansion of domestic economic
activities, during the period where exports face increasing limitations from global economic
conditions.
3) Retaining the momentum of public investment as to build the driving force for economic
expansion when the global economy decelerates and also to increase Thai long-run economic
potential. Thus, it is crucial to consider the following issues: (i) expediting the FY2019 government’s
and state-owned enterprises’ capital budget disbursement to reach the disbursement rates of no less
than 70.0 and 80.0 percent, consecutively; (ii) fastening the FY2020 government budgeting process so
that the budget could be implemented right in the first quarter of FY2020 and, in turn, prevent the
deterioration in economic growth momentum streaming possibly from reductions in both government
spending and investment; (iii) preparing for the major project plans and being ready to disburse the
budget as soon as the FY2020 budget has been implemented; (iv) ensuring the disbursement of
ongoing investment projects to meet the target levels; (v) ensuring investors’ confidence regarding
the continuity of the government’s key policies and major investment projects after forming a new
government; and (vi) continually fostering crucial investment projects which are necessary for the
improvement of potential growth.
6. Economic Management for the year 2019

Macroeconomic Strategy and Planning Office
NESDC Economic Outlook
Feb 18, 2019 30
4) Encouraging private investment by: (i) fostering continual expansion in export sectors as to
increase capacity utilization in the corresponding industries; (ii) supporting those entrepreneurs,
whose production bases are in the countries affected by the trade protection, to increase their
production capacity in Thailand; (iii) facilitating and motivating investors from other countries, who
have been affected by the trade protection measures and are considering to move their production
base, to invest in Thailand, by publicizing investment privileges, competency of transport and logistic
infrastructure, readiness and capability of the economic zones; and (iv) continuously fostering public
investment projects in both infrastructures and special economic zones.
5) Supporting small farmers, low income groups, and strengthening the SMEs, local enterprises,
and local economies through: (1) Agricultural Production and Income, by: (i) solving problems
on agricultural products whose prices remain low and tend not to recover soon enough, especially
rubber, due to slowdown in global economy and softened demand for automobiles and rubber
products as a result from trade protection, palm oil, due to high level of inventory, the EU’s plan to
reduce palm oil as bioenergy sources, and the low sugarcane price, in line with a reduction in sugar
price in the global market; (ii) supporting large-scale farming; (iii) supporting and providing markets
for selling agricultural products in each community; (iv) supporting the development of agricultural
and fresh food products standard so as to increase value-added; and (v) managing water resources for
agriculture during the drought periods as to alleviate risks of limited water supply for farming;
(2 ) Supporting Low Incomes, Local Economies and SMEs, by: (i) pursuing the ongoing social
welfare smart card project; and (ii) providing financial measures to attenuate debt burdens and lessen
constraints on fund accessibility for small farmers, low income groups, local enterprises, and SMEs;
and (3) Assist and develop Affected SMEs from changes in business models, disruptive
technologies, consumer preferences, and demography, as well as foreign exchange volatility, by
emphasizing: (i) encouraging SMEs to fully utilize benefits from government’s measures on financial
credit provisioning, currency appreciation impact mitigation, and SMEs promotion and development;
(ii) supporting SMEs, especially the newly established SMEs, with the necessary knowledge and
information; (iii) encouraging SMEs to improve their processes particularly on production,
managerial, and marketing development towards more advance technology, as well as developing
their products and services to match with the market demand; and (iv) establishing linkages between
SMEs and larger-scale businesses.
6) Preparing the labor force, both in terms of quantity and quality, to adequately support further
economic expansion and investment, especially for those industries with rising capacity utilization.
The measures should also target industries leveraging opportunities from international manufacturing
facility relocation as well as Thailand’s target industries.

Macroeconomic Strategy and Planning Office
NESDC Economic Outlook
Feb 18, 2019 31
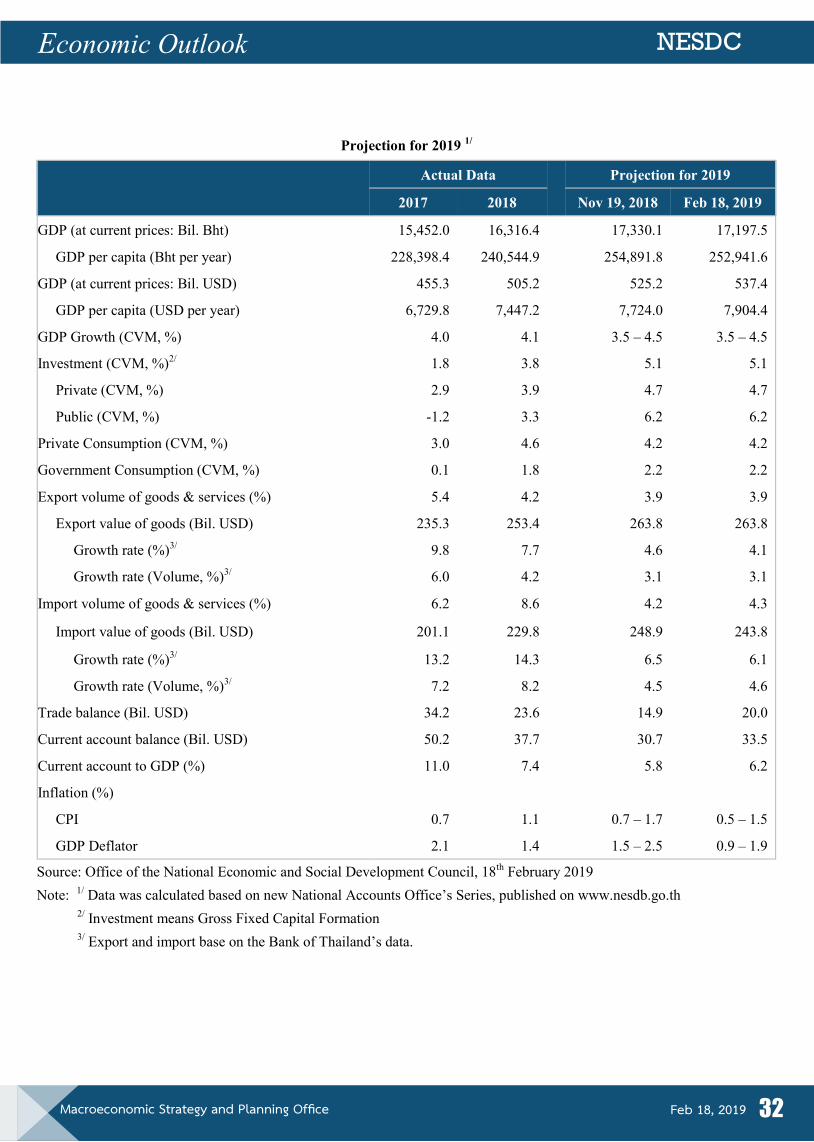
Macroeconomic Strategy and Planning Office
NESDC Economic Outlook
Feb 18, 2019 32
Projection for 2019 1/
Actual Data
Projection for 2019
2017 2018 Nov 19, 2018 Feb 18, 2019
GDP (at current prices: Bil. Bht) 15,452.0 16,316.4 17,330.1 17,197.5
GDP per capita (Bht per year) 228,398.4 240,544.9 254,891.8 252,941.6
GDP (at current prices: Bil. USD) 455.3 505.2 525.2 537.4
GDP per capita (USD per year) 6,729.8 7,447.2 7,724.0 7,904.4
GDP Growth (CVM, %) 4.0 4.1 3.5 – 4.5 3.5 – 4.5
Investment (CVM, %)2/ 1.8 3.8 5.1 5.1
Private (CVM, %) 2.9 3.9 4.7 4.7
Public (CVM, %) -1.2 3.3 6.2 6.2
Private Consumption (CVM, %) 3.0 4.6 4.2 4.2
Government Consumption (CVM, %) 0.1 1.8 2.2 2.2
Export volume of goods & services (%) 5.4 4.2 3.9 3.9
Export value of goods (Bil. USD) 235.3 253.4 263.8 263.8
Growth rate (%)3/ 9.8 7.7 4.6 4.1
Growth rate (Volume, %)3/ 6.0 4.2 3.1 3.1
Import volume of goods & services (%) 6.2 8.6 4.2 4.3
Import value of goods (Bil. USD) 201.1 229.8 248.9 243.8
Growth rate (%)3/ 13.2 14.3 6.5 6.1
Growth rate (Volume, %)3/ 7.2 8.2 4.5 4.6
Trade balance (Bil. USD) 34.2 23.6 14.9 20.0
Current account balance (Bil. USD) 50.2 37.7 30.7 33.5
Current account to GDP (%) 11.0 7.4 5.8 6.2
Inflation (%)
CPI 0.7 1.1 0.7 – 1.7 0.5 – 1.5
GDP Deflator 2.1 1.4 1.5 – 2.5 0.9 – 1.9
Source: Office of the National Economic and Social Development Council, 18th February 2019
Note: 1/ Data was calculated based on new National Accounts Office’s Series, published on www.nesdb.go.th
2/ Investment means Gross Fixed Capital Formation
3/ Export and import base on the Bank of Thailand’s data.