nepal public debt sustainability analysis · nepal public debt sustainability analysis ... finish...
TRANSCRIPT
NRM Working Paper No. 5
NEPALPUBLIC DEBT SUSTAINABILITY ANALYSIS
Mohiuddin Alamgir and Sungsup Ra
October 2005
Mohiuddin Alamgir is an Asian Development Bank Staff Consultant, and Sungsup Ra is Head,Macroeconomic, Finance, Governance, Regional and External Relations and Senior CountryPrograms Specialist in the Nepal Resident Mission.
Copyright: Asian Development Bank 2005
All rights reserved.
The views expressed in this book are those of the authors and do not necessarily reflect the viewsand policies of the Asian Development Bank, or its Board of Governors or the governments theyrepresent.
The Asian Development Bank does not guarantee the accuracy of the data included in thispublication an accepts no responsibility for any consequence of their use.
Use of the term “country” does not imply any judgement by the authors or the Asian DevelopmentBank as to the legal or other status of any territorial entity.
ISSN 1816-3416
Published and printed by the Asian Development Bank, 2005.
ii
PREFACE
In Nepal, public debt, both domestic and foreign, has played an important role in financingoverall budget deficit and public development expenditure. Hindered by the escalating insurgencythat has directly contributed to a slowdown in tourism and other economic activities throughout thenation, economic growth has been significantly lower than envisaged by the Ninth Five Year Plan(FY1997–FY2002) and the Tenth Five Year Plan (FY2003–FY2007). This could exacerbate thealready narrow base for domestic resource mobilization. It is therefore imperative to continuouslymonitor the sustainability of public debt of Nepal.
The study on Nepal Public Debt Sustainability Analysis was undertaken by the AsianDevelopment Bank (ADB) in 2001 to analyze the public debt sustainability of Nepal. The outcomeof the study was intended to improve debt management by the Government of Nepal and to provideinputs for the Tenth Five Year Plan and other long-term perspective plans. It was also intended toassist the ADB to articulate its lending policy for Nepal based on country risk analysis.
Although a few years have elapsed since the study was completed, the findings are stillrelevant as Nepal reviews its eligibility for Highly Indebted Poor Countries (HIPC) initiatives.
The study was carried out by Mohiuddin Alamgir, ADB Staff Consultant and Sungsup Ra,Head, Macroeconomics, Finance, Governance, Regional, and External Relations, and SeniorCountry Programs Specialist, Nepal Resident Mission (NRM). The editorial assistance of Arun S.Rana is appreciated, and thanks are due to Kavita Sherchan, External Relations and Civil SocietyLiaison Officer, NRM for finalizing the report.
Sultan Hafeez RahmanCountry DirectorNepal Resident MissionAsian Development Bank
iii
CURRENCY EQUIVALENTS
(as of 31 October 2001)
Currency Unit = Nepalese Rupees (NRe/NRs)Nre 1.00 = $0.1315$1.00 = NRs76.05
(i) The Nepalese rupee is pegged to the Indian rupee (Re) at NRs1.60 to Re 1.00 andis fully convertible on all current account transactions.
(ii) The exchange rate used to determine the dollar equivalent of Nepalese rupee valuesin the text is the end of the period rate.
ABBREVIATIONS
ADB – Asian Development BankAPP – Agriculture Perspective planASYCUDA – Automatic System of Customs DataAUG – Auditor General’s OfficeBOP – balance of paymentsCS-DRMS – Commonwealth Secretariat Debt Recording and Management
SystemDFID – Department for International Development, United KingdomDMU – Debt Management UnitDOD – disbursed outstanding debtDPMU – Debt Policy Management UnitEEC – European Economic CommunityEKPF – EksportfinanceFCGO – Financial Comptroller General’s OfficeFDI – foreign direct investmentFEC – Finish Export Credit LimitedFMP – Financial Management ProjectGDP – gross domestic productGNP – gross national productHIPC – heavily indebted poor countriesICOR – Incremental capital output ratioIDA – International Development AssociationIFAD – International Fund for Agricultural DevelopmentIFC – International Finance CorporationIMF – International Monetary FundIPRSP – Interim Poverty Reduction Strategy PaperKFAD – Kuwait Fund for Arab Economic Development
iv
M1 – Narrow MoneyM2 – Broad MoneyMFCL – Mitsui Fudosan Company LimitedMOF – Ministry of FinanceMTBF – Medium Term Budget Framework ProjectNADC – Norwegian Agency for Development CooperationNDF – Nordic Development FundNPC – National Planning CommissionNPV – net present valueNRB – Nepal Rastra BankOPEC Fund – OPEC Fund for International DevelopmentPDD – Public Debt DepartmentPRSP – Poverty Reduction Strategy PaperSAFD – Saudi Fund for DevelopmentSDR – special drawing rightsUNCD – United Nations Capital Development Fund
NOTES
(i) The fiscal year (FY) of the Government ends on 15 July. FY before a calendar yeardenotes the year in which the fiscal year ends, e.g., FY2002 ends on 15 July 2002.
(ii) In this report, “$” refers to US dollars.
v
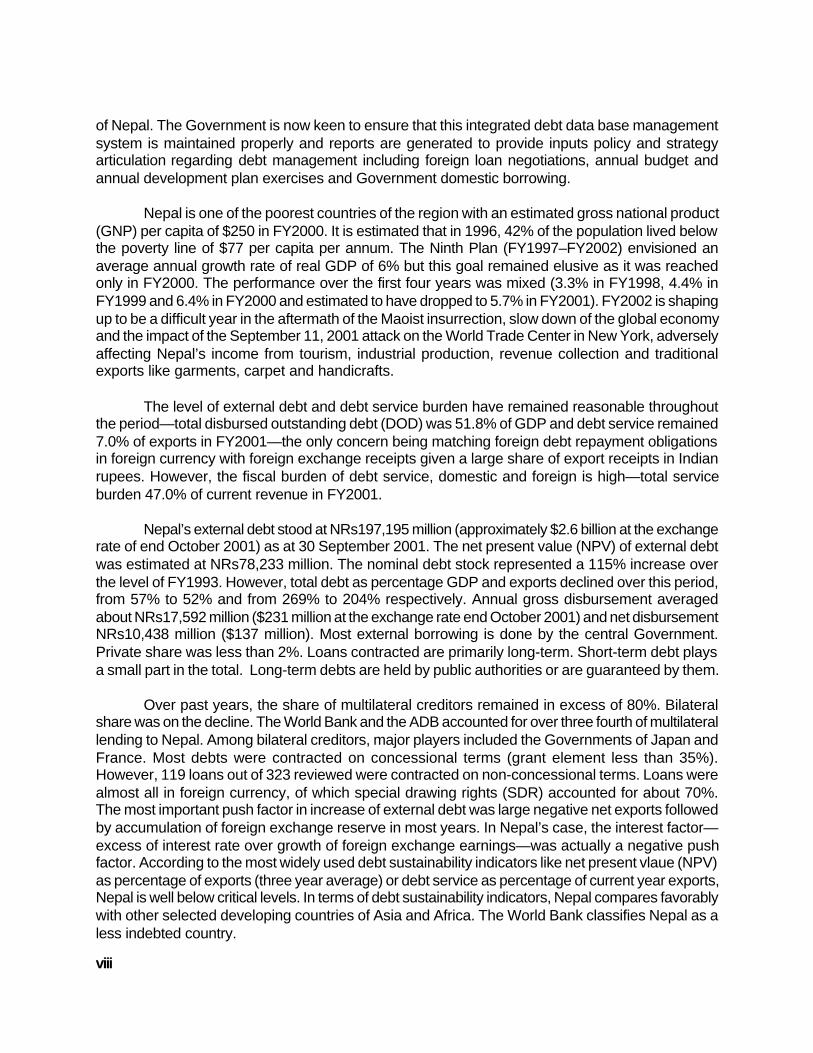
CONTENTS
Page
EXECUTIVE SUMMARY i
I. EXTERNAL DEBT 1
A. Review of Current External Debt Position 1B. External Debt Sustainability Analysis 33
II. PUBLIC DEBT 51
A. Review of Current Public Debt Position 51B. Public Debt Sustainability Analysis 63
III. THE COMMONWEALTH SECRETARIAT DEBT RECORDINGAND MANAGEMENT SYSTEM (CS-DRMS) 68
A. Current Status 68B. Options for the Future 69
IV. POLICY IMPLICATIONS 72
A. Policy Recommendatyions for the Government 72B. Policy Implications for ADB Operation 73
V. CONCLUSIONS 74
Appendix 78
BIBLIOGRAPHY 81
vi
EXECUTIVE SUMMARY
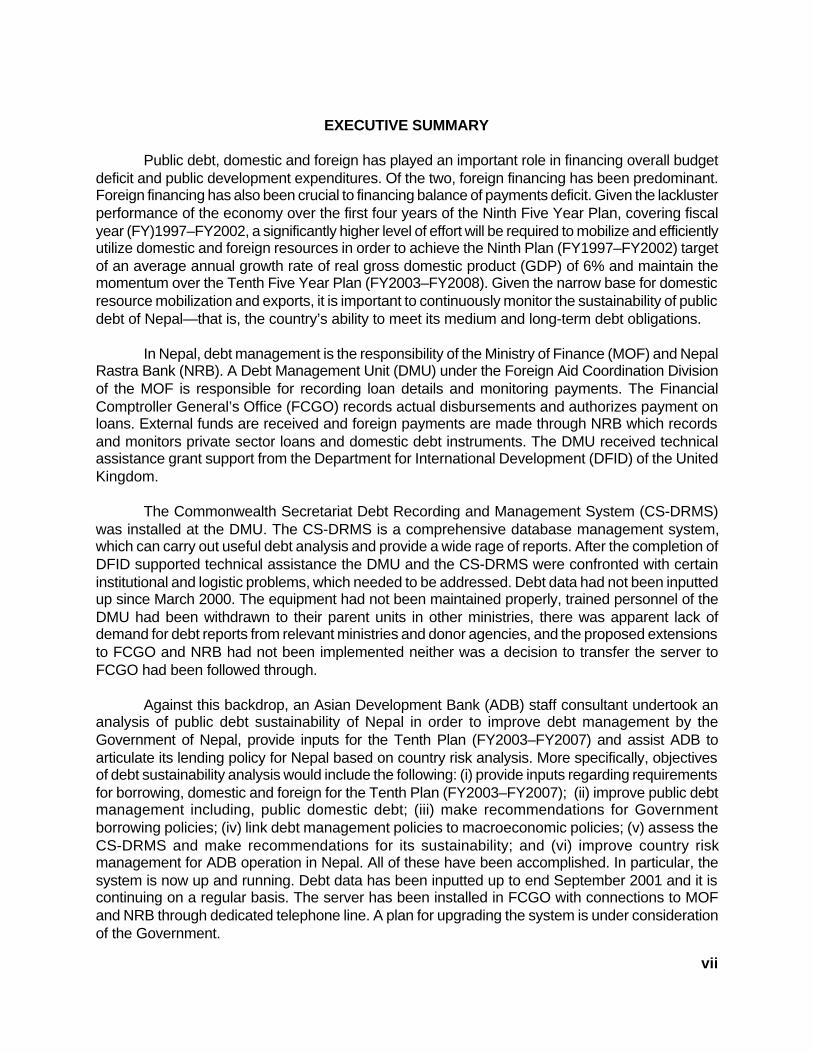
Public debt, domestic and foreign has played an important role in financing overall budgetdeficit and public development expenditures. Of the two, foreign financing has been predominant.Foreign financing has also been crucial to financing balance of payments deficit. Given the lacklusterperformance of the economy over the first four years of the Ninth Five Year Plan, covering fiscalyear (FY)1997–FY2002, a significantly higher level of effort will be required to mobilize and efficientlyutilize domestic and foreign resources in order to achieve the Ninth Plan (FY1997–FY2002) targetof an average annual growth rate of real gross domestic product (GDP) of 6% and maintain themomentum over the Tenth Five Year Plan (FY2003–FY2008). Given the narrow base for domesticresource mobilization and exports, it is important to continuously monitor the sustainability of publicdebt of Nepal—that is, the country’s ability to meet its medium and long-term debt obligations.
In Nepal, debt management is the responsibility of the Ministry of Finance (MOF) and NepalRastra Bank (NRB). A Debt Management Unit (DMU) under the Foreign Aid Coordination Divisionof the MOF is responsible for recording loan details and monitoring payments. The FinancialComptroller General’s Office (FCGO) records actual disbursements and authorizes payment onloans. External funds are received and foreign payments are made through NRB which recordsand monitors private sector loans and domestic debt instruments. The DMU received technicalassistance grant support from the Department for International Development (DFID) of the UnitedKingdom.
The Commonwealth Secretariat Debt Recording and Management System (CS-DRMS)was installed at the DMU. The CS-DRMS is a comprehensive database management system,which can carry out useful debt analysis and provide a wide rage of reports. After the completion ofDFID supported technical assistance the DMU and the CS-DRMS were confronted with certaininstitutional and logistic problems, which needed to be addressed. Debt data had not been inputtedup since March 2000. The equipment had not been maintained properly, trained personnel of theDMU had been withdrawn to their parent units in other ministries, there was apparent lack ofdemand for debt reports from relevant ministries and donor agencies, and the proposed extensionsto FCGO and NRB had not been implemented neither was a decision to transfer the server toFCGO had been followed through.
Against this backdrop, an Asian Development Bank (ADB) staff consultant undertook ananalysis of public debt sustainability of Nepal in order to improve debt management by theGovernment of Nepal, provide inputs for the Tenth Plan (FY2003–FY2007) and assist ADB toarticulate its lending policy for Nepal based on country risk analysis. More specifically, objectivesof debt sustainability analysis would include the following: (i) provide inputs regarding requirementsfor borrowing, domestic and foreign for the Tenth Plan (FY2003–FY2007); (ii) improve public debtmanagement including, public domestic debt; (iii) make recommendations for Governmentborrowing policies; (iv) link debt management policies to macroeconomic policies; (v) assess theCS-DRMS and make recommendations for its sustainability; and (vi) improve country riskmanagement for ADB operation in Nepal. All of these have been accomplished. In particular, thesystem is now up and running. Debt data has been inputted up to end September 2001 and it iscontinuing on a regular basis. The server has been installed in FCGO with connections to MOFand NRB through dedicated telephone line. A plan for upgrading the system is under considerationof the Government.
vii
of Nepal. The Government is now keen to ensure that this integrated debt data base managementsystem is maintained properly and reports are generated to provide inputs policy and strategyarticulation regarding debt management including foreign loan negotiations, annual budget andannual development plan exercises and Government domestic borrowing.
Nepal is one of the poorest countries of the region with an estimated gross national product(GNP) per capita of $250 in FY2000. It is estimated that in 1996, 42% of the population lived belowthe poverty line of $77 per capita per annum. The Ninth Plan (FY1997–FY2002) envisioned anaverage annual growth rate of real GDP of 6% but this goal remained elusive as it was reachedonly in FY2000. The performance over the first four years was mixed (3.3% in FY1998, 4.4% inFY1999 and 6.4% in FY2000 and estimated to have dropped to 5.7% in FY2001). FY2002 is shapingup to be a difficult year in the aftermath of the Maoist insurrection, slow down of the global economyand the impact of the September 11, 2001 attack on the World Trade Center in New York, adverselyaffecting Nepal’s income from tourism, industrial production, revenue collection and traditionalexports like garments, carpet and handicrafts.
The level of external debt and debt service burden have remained reasonable throughoutthe period—total disbursed outstanding debt (DOD) was 51.8% of GDP and debt service remained7.0% of exports in FY2001—the only concern being matching foreign debt repayment obligationsin foreign currency with foreign exchange receipts given a large share of export receipts in Indianrupees. However, the fiscal burden of debt service, domestic and foreign is high—total serviceburden 47.0% of current revenue in FY2001.
Nepal’s external debt stood at NRs197,195 million (approximately $2.6 billion at the exchangerate of end October 2001) as at 30 September 2001. The net present value (NPV) of external debtwas estimated at NRs78,233 million. The nominal debt stock represented a 115% increase overthe level of FY1993. However, total debt as percentage GDP and exports declined over this period,from 57% to 52% and from 269% to 204% respectively. Annual gross disbursement averagedabout NRs17,592 million ($231 million at the exchange rate end October 2001) and net disbursementNRs10,438 million ($137 million). Most external borrowing is done by the central Government.Private share was less than 2%. Loans contracted are primarily long-term. Short-term debt playsa small part in the total. Long-term debts are held by public authorities or are guaranteed by them.
Over past years, the share of multilateral creditors remained in excess of 80%. Bilateralshare was on the decline. The World Bank and the ADB accounted for over three fourth of multilaterallending to Nepal. Among bilateral creditors, major players included the Governments of Japan andFrance. Most debts were contracted on concessional terms (grant element less than 35%).However, 119 loans out of 323 reviewed were contracted on non-concessional terms. Loans werealmost all in foreign currency, of which special drawing rights (SDR) accounted for about 70%.The most important push factor in increase of external debt was large negative net exports followedby accumulation of foreign exchange reserve in most years. In Nepal’s case, the interest factor—excess of interest rate over growth of foreign exchange earnings—was actually a negative pushfactor. According to the most widely used debt sustainability indicators like net present vlaue (NPV)as percentage of exports (three year average) or debt service as percentage of current year exports,Nepal is well below critical levels. In terms of debt sustainability indicators, Nepal compares favorablywith other selected developing countries of Asia and Africa. The World Bank classifies Nepal as aless indebted country.
viii
Foreign loans were contracted for a wide range of activities across many sectors. Implicitprioritization seems to have had favored agriculture and rural development (including irrigation)and electricity. Broadly defined, the share of agriculture in total external debt increased from 27%in FY1992 to 36% in FY2002, the change being explained entirely by a significant shift of emphasistowards irrigation in accordance with the 20-year Agriculture Perspective Plan (APP).
As for domestic debt, total DOD stood at NRs56,576 million as at end FY2001. BetweenFY1993 and FY2001, domestic DOD as percentage of GDP remained unchanged at 14%, but aspercentage of central Government current revenue it declined from 161% to 120%. Bonds accountedfor 32.2% of total domestic DOD in FY2001, deposits 23.5%, treasury bills 14.9% and other securities29.4%. Among holders of domestic debt instruments, the share of the central bank was 16.0%, ofwhich commercial banks held 23.0%, public 1.2%, and others 58.0%. Domestic debt serviceburden was high at 3–4% throughout the 1990s and at 33–35% of central Government currentrevenue. Debt and debt service burden turns out to be heavier if one looks together at both domesticand external debt although there was a marked improvement between FY1992 and FY2001. Atend FY2001, total public debt stood at NRs248,313 million. The most important push factorcontributing to increase of public debt was the primary deficits, especially discretionary primarybalance. Other push factors included were interest payment and exchange rate valuation adjustmentof the foreign currency denominated debt. The growth factor was a pull factor. Total public debt aspercentage of GDP declined from 71% in FY1992 to 65% in FY2001, and as percentage of revenuefrom 794% to 527%. During the 1990s, total public debt service burden was estimated at 4–6% ofGDP and 47–49% of central Government current revenue.
Projections for the future have been made based on two alternative growth assumptions,one high growth scenario and the other, low growth scenario. The high growth is a relatively optimisticscenario based on the assumption of rapid recovery from the aftermath of world economicslowdown and September 11, 2001 terrorist attack in New York. The agriculture sector growth isassumed to follow projections under the APP although there will be structural shift in favor oftourism and service sectors. The Government of Nepal is expected to pursue policies consistentwith continued macroeconomic stability, low inflation (3% per annum), increased share of revenuein GDP (from 12% in 2002 to 18% in FY2020), pruning of public expenditure to reflect efficiencyand effectiveness of public investments, and money supply growth reflecting growth of production,monetization, and capacity utilization. Both gross domestic savings and total investment rates areprojected to grow substantially from their current modest levels—from 16% of GDP in FY2002 to19% in FY2020, and from 25% to 38%, respectively. For foreign grants and loans, the Governmentof Nepal will aggressively seek to obtain at least 45% in grants and loans on concessional terms(grant element > 35%). In financing of the budget deficit, it is assumed that the share of internalborrowing will be retained at 35% mostly through medium term instruments. An enabling policyenvironment will be kept in place to ensure growing participation of the private sector includingforeign private investments in the economy. The role of the public sector will be limited to areas ofcomparative advantage away from direct production and distribution. The low growth scenario, onthe other hand, assumes lingering hangover of the global economic slowdown and the impact ofthe events of September 11, 2001. It is assumed in general that the negative impact on tourism,industrial production, revenue collection and traditional exports like garments, carpet and handicraftswill persist and the economy will at best recover to follow the past trend. Under the high growth
ix
scenario, average annual rate of growth of GDP in constant 1985 prices is projected to increasefrom 5.6% during the Tenth Plan (FY2003–FY2007) period to 8.5% during FY2017–FY2020 period.The corresponding rates under the low growth scenario are 5.6% and 5.9%. What are theimplications of alternative growth scenarios for public debt sustainability and country riskmanagement?
Requirements for external and domestic borrowing will differ significantly depending ongrowth assumptions. Under the high growth scenario, the nominal value of total public debt isprojected to increase from NRs248,313 million in FY2001 to NRs1,677,188 million in FY2020. Ofthis, external debt is projected to go up to NRs1,576,970 million from NRs1,919,737, and domesticdebt to NRs100,219 million from NRs56,576 million. Total public debt/GDP ratio declines slightlyfrom 65% to 63%, domestic from 15% to 4%, but external debt ratio increases from 50% to 60%.As percentage of central Government current revenue, total public debt declines from 527% to319% between FY2001 and FY2020. The corresponding ratios for domestic and external debt areprojected to be 121% and 19% and 407% and 300%, respectively. All the ratios are lower for thelow growth scenario. The external debt burden will clearly be increasing substantially if the countrywere to realize the high growth assumptions. A good part of the external borrowing is to fill thebalance of payments deficit, which is likely to increase from 4% of GDP to 13% of GDP. Much ofthe country risk is linked to this aspect of macroeconomic vulnerability.
Public debt service burden is projected to decline slightly from 5.3% of GDP and 38.0% ofcentral Government current revenue in FY2002 to 5.1% and 26.0%, respectively, in FY 2020 underthe high growth scenario. In case Nepal is trapped along the low growth path the end year debtratios will be much lower, 3.7% and 20.0%, respectively. The patterns for external and domesticdebt ratios are similar. NPV of total national debt, on the other hand, is projected to increase fromNRs103,584 million in FY2001 to NRs491,189 million in FY2020 under high growth, and NRs318,555under low growth scenario. NPV of both domestic external debts is projected to grow almost fivetimes by FY2020 under high growth scenario, the increase as expected being lower for low growthscenario. Under both scenarios, the projected NPV of external debt as percentage of exportsremain well below the critical level of 150% as defined by the World Bank/International MonetaryFund as the cut off threshold for Heavily Indebted Poor Countries (HIPC). However, the secondrelevant indicator in this context, external debt service as percentage of current year exports isprojected to exceed the cut off value of 15% in FY2020 under both scenarios. Hence, there iscause for concern, caution and surveillance.
Relevant indicators suggest that in the foreseeable future, there is no solvency risk withregard to the external debt burden of Nepal although as mentioned earlier, close monitoring of thedebt service burden in relation to exports would be in order beyond FY2012. The current accountdeficit as percentage of GDP is projected to triple between FY2001 and FY2020 to reach a level of15% under both scenarios. Nepal may also face both solvency and liquidity constraint due to itslarge holdings of Indian currency as reserves. The current yield on Indian currency reserve is low(4.5% and 91 day treasury bill rate), and Nepal does not have access right to the Indian foreignexchange market. There is no repudiation risk as Nepal has never been in arrears in meeting itsdebt obligations. The projected evolution of the fiscal balance of the Government raises seriousquestion about future macroeconomic stability as fiscal deficit worsens as percentage of GDPfrom 4.5% in FY2001 to 7.6% in FY2020 under the high growth scenario. The situation appears
x
more manageable under the low growth scenario as the ratio remains around 3.0% by the endperiod of projection. Total public debt would continue to impose some burden on the Nepaleseeconomy under both scenarios although projections suggest an improvement over time in allrelevant indicators. One area of particular concern is the loan delinquent status of public enterprises.As on July 15, 2001, the total amount of outstanding external loans on-lent to selected publicenterprises was estimated at NRs48,924 million and that on internal loans at NRs502 million.
A number of policy recommendations are made for consideration of the Government ofNepal and ADB: (i) broadly speaking, Nepal should closely monitor the evolution of debt stock, debtservice burden and the development of fiscal and external repayment capacity; (ii) the debt strategyshould seek coordination with monetary and fiscal policies, and adhere to the principles oftransparency, public disclosure, and accountability; (iii) the Government should seek grant andconcessional loans with grant element greater than 35%; (iv) a careful review of non-concessionalloans is in order to determine which could be eliminated or for which a softer term could berenegotiated; (v) Government of Nepal should soon enter into a dialogue with the Government ofIndia to yield and convertibility of its Indian currency reserves; (vi) Nepal should continue to pursuestrong policies to preserve the current macroeconomic stability; (vii) a concerted effort needs to bemade to improve revenue generation so as to generate primary surplus; (viii) public expenditurereview should be an ongoing exercise with special emphasis on the fiscal, foreign exchange, andpoverty impact of all investments; (ix) new external debt should be contracted only if it is consistentwith the Tenth Plan (FY2003–FY2007), the medium term expenditure framework (MTEF), and alonger term perspective plan; (x) export diversification in terms of both commodity composition anddestination (away from India) should be at the top of Government agenda; (xi) existing constraintsto increases in foreign direct investment should be carefully analyzed and countervailing measuresbe put into operation; (xii) the private sector should be promoted and the Government shouldguarantee private sector loans after careful scrutiny of proposed activities; (xiii) the Governmentshould move forward with structural reforms (e.g., the recently legislated land reform), and sectorreforms, especially financial sector reform and good governance; (xiv) in light of the specialrelationship, Nepal should harmonize its own monetary policies with India in order to ensure stabilityof its foreign exchange regime; and (xv) maturity on domestic debt should be increased.
In addition to the above, a number of specific recommendations are made regarding debtmanagement including the CS-DRMS. It is recommended that debt management and debtinformation system management be made the joint responsibility of the MOF, FCGO and the NRB.This would be critical to guarantee the sustainability of the system. MOF will be responsible foroverall strategy and policy articulation, coordination, and implementation, FCGO for external andpublic enterprise debt information system management and timely debt repayment, and NRB formanagement of domestic debt operations, information on domestic debt, private external loans,and foreign exchange rates. The DMU could be renamed as the Debt Policy Management Unit(DPMU) with revised terms of reference. The DPMU will be responsible for assisting MOF ininitiation, articulation, and implementation of future borrowing (domestic and external) policies,and debt management strategies in conjunction with other divisions of MOF, FCGO, NRB andother relevant agencies of the Government of Nepal. It will liaise, in collaboration with FCGO, otherrelevant sections of MOF and NRB, and with the National Planning Commission (NPC) to facilitatepreparation and evaluation of five-year and long-term perspective plans, especially with regard tofinancing development expenditures through domestic and foreign borrowing. The DPMU will alsoassist in assessing debt-financing requirement underlying annual development plans and annual
xi
budgets. Another responsibility of the unit would be preparation and dissemination of reports,electronic and otherwise, and in this context, developing, maintaining, and updating of a CS-DRMSwebsite in collaboration with FCGO.
It is expected that the Government will allocate necessary budgetary resources for thepurpose. The Government of Nepal should mobilize technical and financial assistance of externaldonors, which need to be used for upgrading and enhancement of the system, including local andwider area networking, website development, system security, integration of different databasemanagement systems, and staff development. Alternatives to the current system of networkingthrough dedicated telephone lines should be revisited at an appropriate time to effect changeoverto a more efficient, speedy, and reliable networking system. It is paramount to avoid data duplicationin the future thereby allowing the maintenance of a secure and unique set of data on domestic andexternal debt. Steps need to be taken to (i) assign specific staff to CS-DRMS; (ii) ensure regularinputting of data; (iii) ensure compatibility of hardware and software configuration in different locations;(iv) homogenize logistic support; (v) induce demand for outputs of the system and online use; (vi)follow a specific timeline for implementation of all steps agreed upon; (vii) promote staff development;(viii) as given below, ensure (ix) complete system security including eliminating the risk of datamanipulation by unauthorized persons; (x) inculcate a sense of ownership among all principalactors, especially MOF, FCGO and NRB; and finally, (xi) maintain only two data entry points, namely,FCGO (external debt), and NRB (domestic debt, foreign exchange rates and private loans).
FCGO should be the focal point for (i) coordination and management of the debt informationmanagement system; (ii) inputting, editing, validation, and reconciliation of data on external andpublic enterprise debt; (iii) reconciliation of external debt data with records of lenders; (iv)reconciliation of public enterprise debt data with records of these enterprises; (v) databasemanagement; (vi) linking up of CS-DRMS with the Financial Management Project, Medium-TermBudget Framework Project, and the domestic debt database of NRB, to allow interactive dialoguebetween systems; (vii) provision of guidance to and coordination of data integration and systemcompatibility; (viii) CS-DRMS network, hardware and software system maintenance, upgrading,backup and security which will include procurement, testing and operationalization of new releasesof CS-DRMS software, other software and new equipment; (ix) staff development; and (x)preparation and dissemination of periodic reports as appropriate.
NRB, on the other hand, should be responsible for (i) management of information ondomestic debt, private external debt and foreign exchange rates; (ii) inputting, editing, validation,and reconciliation of data on public domestic debt; (iii) management of domestic debt database ofthe CS-DRMS; (iv) monitoring of domestic debt situation; (v) formulation and operationalization ofpublic domestic debt strategies and policies, and advising MOF on internal borrowing; and (vi)preparation and dissemination of periodic reports on public domestic debt.
The implications for ADB operations are the following: (i) Given its large portfolio, ADBshould carefully review its future exposure; (ii) Greater emphasis should be given to capacitybuilding and improvement of governance, transparency, and accountability at all levels; (iii) Theperformance of the portfolios need to be closely monitored with regard to impact on productivity,export growth and diversification, and alleviation of poverty; (iv) Internally, ADB should strengthenits country economic work, particularly macroeconomic modeling; (v) ADB should consider extending
xii
technical assistance to the Government of Nepal for institution building regarding debt policymanagement and debt information system management; (vi) Related to (iv) and (v), ADB shouldconsider support for analytic work linked to the development of a consistent macroeconomicframework, bringing together Financial Management Project, medium term expenditure framework,five-year plans, perspective plans, the budget exercise, as well as debt; (vii) ADB should assist theborrower to improve disbursement and maintain positive net aid flow; (viii) ADB should review itsmix of lending instruments in order to develop packages consistent with the long term repaymentcapacity of member developing countries; (ix) Requests for additional financing should be consideredfavorably if the situation warrants it; (x) ADB should support the development of the capital market,especially the secondary market, for domestic debt instruments; (xi) ADB should continue itssupport for financial sector reform, public enterprise reform, governance reform, and the TenthPlan (FY2003–FY2007); (xii) Commensurate with its status as the lead donor institution in thecountry, ADB should take the lead at donor coordination relating to resource management, database management, and all related analytic work; (xiii) ADB needs to improve its disbursementstatement formats sent to borrowers; and finally, (xiv) The currency composition of loan,disbursement and repayment should be carefully orchestrated to provide maximum flexibility tothe borrower to meet debt obligations without unnecessary stress.
xiii
I. EXTERNAL DEBT
A. Review of Current External Debt Situation
1. Introduction
Nepal has launched preparatory work on the Tenth Five Year Plan, covering fiscal year(FY)2003–FY2007 with technical assistance from the Asian Development Bank (ADB).ADB plan fielded an inception mission for the Tenth Plan exercise during 23 September–3
November 2001. Public debt, domestic and foreign, has played an important role in financingoverall budget deficit and public development expenditures. Of the two, foreign financing has beenpredominant. Foreign financing has also been crucial in financing balance of payments deficit.Given the lackluster performance of the economy over the first four years of the Ninth Five YearPlan (FY1997–FY2002), a significantly higher level of effort will be required to mobilize and efficientlyutilize domestic and foreign resources in order to achieve the Ninth Plan (FY1997–FY2002) targetof an average annual growth rate of real gross domestic product (GDP) of 6% and maintain themomentum over the Tenth Plan (FY2003–FY2007).
Given the narrow base for domestic resource mobilization and exports, it is important tocontinuously monitor the sustainability of public debt of Nepal—that is, the country’s ability to meetits medium and long-term debt obligations. The three key determinants of long-term debtsustainability are (i) the existing stock of debt and its repayment terms; (ii) the development offiscal and external repayment capacity which is linked to economic growth, exports, and fiscalrevenues; and (iii) the availability and concessionality of new external financing (growth, mix ofgrants and loans, and terms). Debt sustainability depends on formulation and implementation of acomprehensive set of macroeconomic and sectoral policies geared towards efficient mobilizationand utilization of resources including borrowed resources (domestic and external), achievingsustainable economic growth with poverty reduction, and sound debt management. The latterwould require periodic analysis of the debt situation, finance for development (access to adequateconcessional flows), and the state of debt sustainability, together with an efficient organization fordebt management and an effective debt information system.
In Nepal, debt management is the responsibility of the Ministry of Finance (MOF) and NepalRastra Bank (NRB). A Debt Management Unit (DMU) under the Foreign Aid Coordination Divisionof the MOF is responsible for recording loan details and monitoring payments. The FinancialComptroller General’s Office (FCGO) records actual disbursements and authorizes payment onloans. External funds are received and foreign payments are made through NRB which recordsand monitors private sector loans and domestic debt instruments. The DMU received technicalassistance grant support from the Department for International Development (DFID) of the UnitedKingdom. The Commonwealth Secretariat Debt Recording and Management System (CS-DRMS)was installed at the DMU with proposed extensions to FCGO and NRB. The CS-DRMS is acomprehensive database management system, which can carry out useful debt analysis andprovide a wide rage of reports. The challenge is how to ensure sustainability of the system interms of maintenance and updating of hardware and software and debt data. At present,
October 2005
Nepal Public Debt Sustainability Analysis
debt data has been inputted up to March 2000. The data has to be updated continuously to makeanalysis meaningful and to articulate sound debt management strategies and policies. The DMUand the CS-DRMS are confronted with certain institutional and logistic problems, which need to beaddressed. Otherwise, data updating, analysis, report production and policy formulation will beproblematic. The actual task of inputting new debt information since March 2000 will have to beaccomplished within the context of the proposed study.
Against this backdrop, Dr. Mohiuddin Alamgir, an ADB staff consultant and Sungsup Ra,Economist, Programs West 1, undertook an analysis of public debt sustainability of Nepal in orderto improve debt management by the Government of Nepal, provide inputs for the Tenth Plan(FY2003–FY2007) and assist ADB articulate its lending policy for Nepal based on country riskanalysis. More specifically, objectives of debt sustainability analysis include (i) providing inputsregarding requirements for borrowing, domestic and foreign, for the Tenth Plan; (ii) improvingpublic debt management, including public domestic debt; (iii) making recommendations forGovernment borrowing policies; (iv) linking debt management policies to macroeconomic policies;(v) assessing the CS-DRMS and making recommendations for its sustainability; and (vi) improvingcountry risk management for ADB operation in Nepal.
2. Recent Economic Performance and Trends
Nepal is one of the poorest countries of the region with an estimated gross national product(GNP) per capita of $250 in FY2000. It is estimated that in 1996, 42% of the population lived belowthe poverty line of $77 per capita per annum. The Ninth Plan (FY1997–FY2002) envisioned anaverage annual growth rate of GDP of 6.0%, but this goal remained elusive as it was reached onlyin FY2000. The performance over the first four years was mixed (3.3% in FY1998, 4.4% in FY1999and 6.4% in FY2000 and estimated to have dropped to 5.7% in FY2001). FY2002 is shaping up tobe a difficult year in the aftermath of the Maoist insurrection, slow down of the global economy andthe impact of the September 11, 2001 attack on the World Trade Center in New York, adverselyaffecting Nepal’s income from tourism, industrial production, revenue collection, and traditionalexports like garments, carpet, and handicrafts. The relatively poor performance of the economyover the Ninth Plan period was a major reason for non-attainment of the poverty reduction objectiveof the plan, from 42% to 32%. On the contrary, according to some estimates, the percentage ofpopulation living below the poverty line has increased to 51% during the first three years of theNinth Plan period (FY1997–FY2002). Nepal would have to raise real GDP growth rate substantiallyover coming years, thus creating a solid foundation for the forthcoming Tenth Plan (FY2003–FY2007), and the subsequent plans. This in turn can only happen if the rate of investment is raisedwell above the recent trend of 22% of GDP at market prices. With domestic savings stagnantaround 16% of GDP in late 1990s—gross national saving is higher by 1–3% of GDP—the futuregrowth and poverty reduction prospect depends heavily on mobilization and efficient utilization ofboth domestic and external resources.
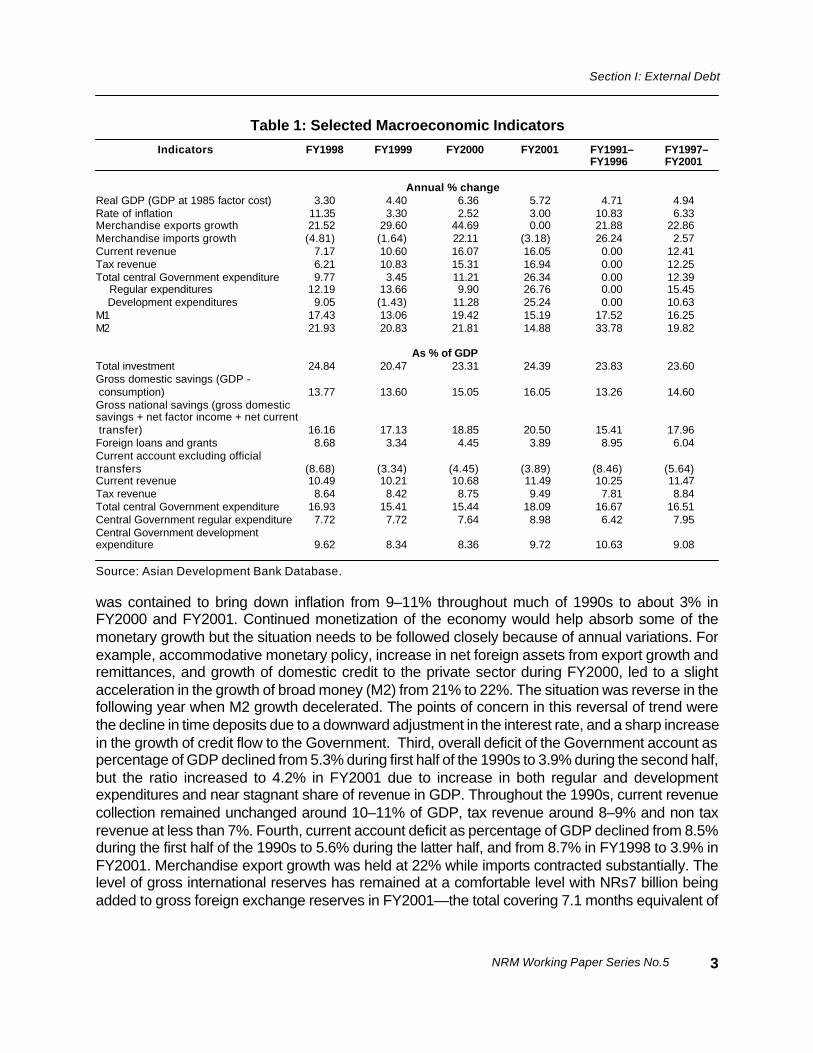
Other aspects of macroeconomic management raise several issues, both positive andnegative (Table 1). First, many macroeconomic variables and parameters showed stability orimprovement between FY1992–FY1996 and FY1997–FY2001 periods, but there were some negativesigns over the past two years. Second, growth of monetary aggregatesand the overall budget
2
NRM Working Paper Series No.5
Section I: External Debt
was contained to bring down inflation from 9–11% throughout much of 1990s to about 3% inFY2000 and FY2001. Continued monetization of the economy would help absorb some of themonetary growth but the situation needs to be followed closely because of annual variations. Forexample, accommodative monetary policy, increase in net foreign assets from export growth andremittances, and growth of domestic credit to the private sector during FY2000, led to a slightacceleration in the growth of broad money (M2) from 21% to 22%. The situation was reverse in thefollowing year when M2 growth decelerated. The points of concern in this reversal of trend werethe decline in time deposits due to a downward adjustment in the interest rate, and a sharp increasein the growth of credit flow to the Government. Third, overall deficit of the Government account aspercentage of GDP declined from 5.3% during first half of the 1990s to 3.9% during the second half,but the ratio increased to 4.2% in FY2001 due to increase in both regular and developmentexpenditures and near stagnant share of revenue in GDP. Throughout the 1990s, current revenuecollection remained unchanged around 10–11% of GDP, tax revenue around 8–9% and non taxrevenue at less than 7%. Fourth, current account deficit as percentage of GDP declined from 8.5%during the first half of the 1990s to 5.6% during the latter half, and from 8.7% in FY1998 to 3.9% inFY2001. Merchandise export growth was held at 22% while imports contracted substantially. Thelevel of gross international reserves has remained at a comfortable level with NRs7 billion beingadded to gross foreign exchange reserves in FY2001—the total covering 7.1 months equivalent of
Table 1: Selected Macroeconomic Indicators
Indicators FY1998 FY1999 FY2000 FY2001 FY1991– FY1997– FY1996 FY2001
Annual % changeReal GDP (GDP at 1985 factor cost) 3.30 4.40 6.36 5.72 4.71 4.94Rate of inflation 11.35 3.30 2.52 3.00 10.83 6.33Merchandise exports growth 21.52 29.60 44.69 0.00 21.88 22.86Merchandise imports growth (4.81) (1.64) 22.11 (3.18) 26.24 2.57Current revenue 7.17 10.60 16.07 16.05 0.00 12.41Tax revenue 6.21 10.83 15.31 16.94 0.00 12.25Total central Government expenditure 9.77 3.45 11.21 26.34 0.00 12.39 Regular expenditures 12.19 13.66 9.90 26.76 0.00 15.45 Development expenditures 9.05 (1.43) 11.28 25.24 0.00 10.63M1 17.43 13.06 19.42 15.19 17.52 16.25M2 21.93 20.83 21.81 14.88 33.78 19.82
As % of GDPTotal investment 24.84 20.47 23.31 24.39 23.83 23.60Gross domestic savings (GDP - consumption) 13.77 13.60 15.05 16.05 13.26 14.60Gross national savings (gross domesticsavings + net factor income + net current transfer) 16.16 17.13 18.85 20.50 15.41 17.96Foreign loans and grants 8.68 3.34 4.45 3.89 8.95 6.04Current account excluding officialtransfers (8.68) (3.34) (4.45) (3.89) (8.46) (5.64)Current revenue 10.49 10.21 10.68 11.49 10.25 11.47Tax revenue 8.64 8.42 8.75 9.49 7.81 8.84Total central Government expenditure 16.93 15.41 15.44 18.09 16.67 16.51Central Government regular expenditure 7.72 7.72 7.64 8.98 6.42 7.95Central Government developmentexpenditure 9.62 8.34 8.36 9.72 10.63 9.08
Source: Asian Development Bank Database.
3
October 2005
Nepal Public Debt Sustainability Analysis
imports. However, there are signs of weakening of commodity exports, and income from tourismand remittances, the latter due to movement of some Nepalese overseas workers from the Gulfcountries to Malaysia, which is a relatively lower wage country. Fifth, the level of external debt anddebt service burden have remained reasonable throughout the period—disbursed outstanding debt(DOD) 51.8% of GDP, and debt service 7.0 % of exports in FY2001—the only concern being matchingforeign debt repayment obligations in foreign currency with foreign exchange receipts given a largeshare of export receipts in Indian rupees. However, the fiscal burden of debt service, domestic andforeign is high (total service burden 47.0% of current revenue in FY2001).
3. Overview of External Debt Position
Nepal’s external debt and external debt burden is manageable. According to a World Bankclassification, Nepal is a less indebted country.1 The size of DOD increased more than two foldbetween FY1993 and FY2001. Annual gross disbursement averaged about NRs17,592 million($231 million at the exchange rate end October 2001) and net disbursement NRs10,438 million($137 million). Most external borrowing is done by the central Government. Private share was lessthan 2%. Loans contracted are primarily long-term. Short-term debt plays a small part in the total.Long-term debts are held by public authorities or are guaranteed by them. In Nepal, public enterprisescan receive external loans only through an on-lending arrangement with the Government underwhich the external creditor offer the loan credit to the Government which in turn lends it to publicenterprises. The contractual agreement for external debt servicing is between the Governmentand the creditor.
Over past years, the share of multilateral creditors remained in excess of 80% while thebilateral share declined. The World Bank and the ADB accounted for over three fourth of multilaterallending to Nepal. Among bilateral creditors, major players included the Governments of Japan andFrance. Most debts were contracted on concessional terms (grant element less than 35%).However, 119 loans out of 323 reviewed were contracted on non-concessional terms. Loans werealmost all in foreign currency, of which special drawing rights (SDR) accounted for about 70%.According to the most widely used debt sustainability indicators like net present value (NPV) aspercentage of exports (three year average), or debt service as percentage of current year exports,Nepal is well below critical levels.
4. Nepal’s External Debt during the 1990s
a. Level of External Debt
The level of external debt was modest and critical ratios improved. Nepal’s external debtstood at NRs197,195 million (approximately $2.6 billion at the exchange rate of end October 2001)as at 30 September 2001. This represented a 115% increase over the level of FY1993. However,total debt as percentage GDP and exports declined over this period, from 57% to 52% and from
1 According to the World Bank’s World Development Indicators 2001, in 1999, countries with a present value of debtservice greater than 220% of exports or 80% of gross national income were classified as severely indebted (S);countries that were not severely indebted but whose present value of debt service exceeded 132% of exports or48% of gross national income were classified as moderately indebted (M); and countries that did not fall into theabove two groups were classified as less indebted (L).
4
NRM Working Paper Series No.5
Section I: External Debt
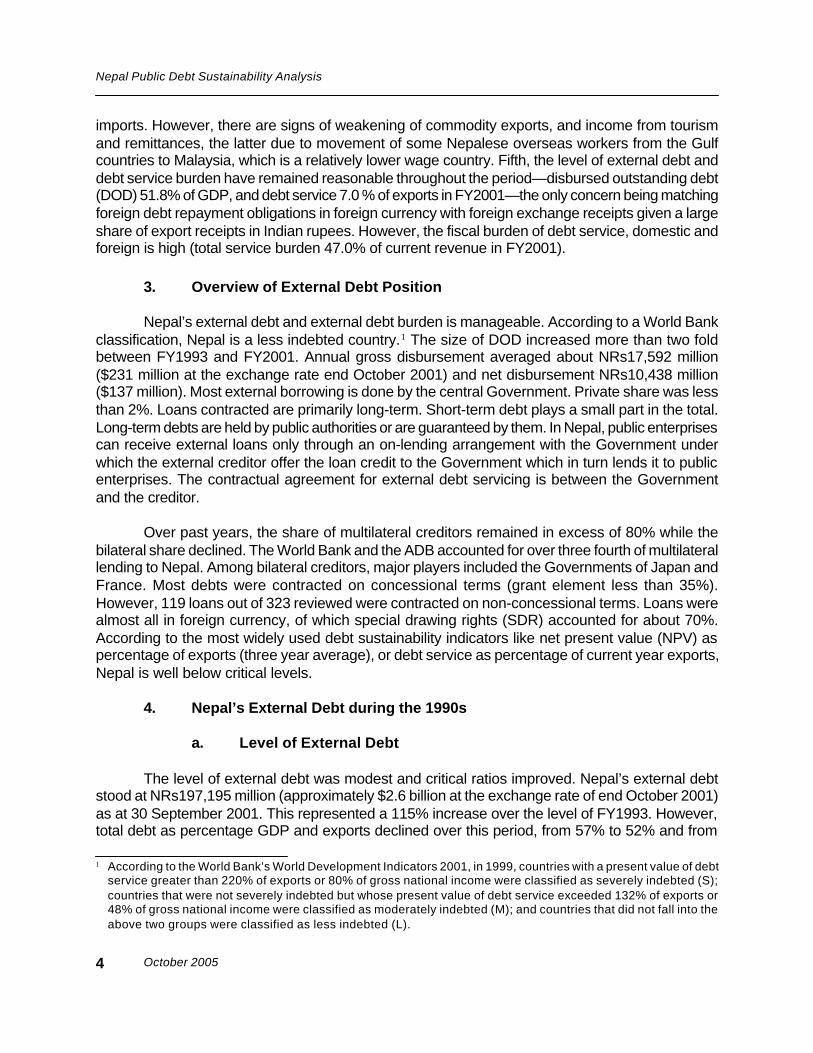
269% to 204% respectively (Table 2). Long-term public and publicly guaranteed loans dominatedthe picture with a share of about 99%. Both short-term credit and long-term private non-guaranteeddebt played a minor role in Nepal during the period under consideration.
5
a Public, publicly guaranteed, and private non-guaranteed long-term debt, use of International Monetary Fund (IMF)credit and short-term debt. Gross external debt, at any given time, is the outstanding amount of those current, notcontingent (arrangements under which one or more conditions must be fulfilled before a financial transaction cantake place) liabilities that require payment(s) of interest and/or principal by the debtor (resident) at some point(s) inthe future and that are owed to non-residents. Totals do not add up to individual components due to errors andomission. Data shown is at fiscal year-end (15 July) and covers all loans disbursed up to 30 September 2001.b Long-term external obligations of public debtors including the national Government and political subdivisions andautonomous public bodies, and external obligations of private debtors that are guaranteed by a public entity.c Long-term external obligations of private debtors that are not guaranteed for repayment by a public entity.d Repurchase obligations to the IMF for all uses of IMF resources (credit tranches, including enlarged accessresources, all special facilities such as buffer stock, compensatory financing, extended fund, and oil facilities, trustfund loans, and operations under structural adjustment and enhanced structural adjustment facilities) excludingthose resulting from drawings on the reserve tranche.e All debt having an original maturity of one year or less and interest in arrears on long-term debt.Source: CS-DRMS.
Table 2: Nepal: Evolution of the Disbursed Outstanding External Debt (DOD)By Type for the Financial Years FY1992–FY2001
(NRs Millions)
Level of disbursed outstanding external debt
Fiscal Year Total disbursed Long-term Public and Long-term Private(at fiscal year outstanding publicly guaranteed and non-guaranteed Use of IMF Short-term end 15 July) external debta debtb debtc creditd credite
FY 1993 91,658 91,268 390 (42.50) 18.4FY 1994 106,877 106,434 443 (495.80) 18.6FY 1995 121,296 120,830 467 (763.40) 25.6FY 1996 133,358 131,740 1,618 (20.80) 61.3FY 1997 138,627 135,503 3,124 365.90 80.6FY 1998 167,174 162,680 4,495 467.70 60.5FY 1999 183,688 178,962 4,727 193.10 59.9FY 2000 194,052 188,734 5,318 391.70 8.9FY 2001 197,195 191,737 5,549 353.10 47.7
As % of GDPFYY 1993 56.66 56.42 0.24 (0.03) 0.01FY 1994 57.12 56.88 0.24 (0.26) 0.01FY 1995 59.19 58.97 0.23 (0.37) 0.01FY 1996 57.12 56.43 0.69 (0.01) 0.03FY 1997 52.80 51.61 1.19 0.14 0.03FY 1998 59.30 57.71 1.59 0.17 0.02FY 1999 57.31 55.83 1.47 0.06 0.02FY 2000 54.70 53.20 1.50 0.11 0.00FY 2001 51.81 50.37 1.46 0.09 0.01
As % of exportsFY 1993 268.5 267.4 1.1 (0.1) 0.1FY 1994 243.7 242.7 1.0 (1.1) 0.0FY 1995 233.2 232.3 0.9 (1.5) 0.0FY 1996 219.4 199.7 2.2 (0.0) 0.1FY 1997 210.1 205.4 4.7 0.6 0.1FY 1998 227.3 221.2 6.1 0.6 0.1FY 1999 232.5 226.6 6.0 0.2 0.1FY 2000 220.4 214.3 6.0 0.4 0.0FY 2001 204.1 198.5 5.7 0.4 0.0
October 2005
Nepal Public Debt Sustainability Analysis
b. Creditor Composition of External Debt
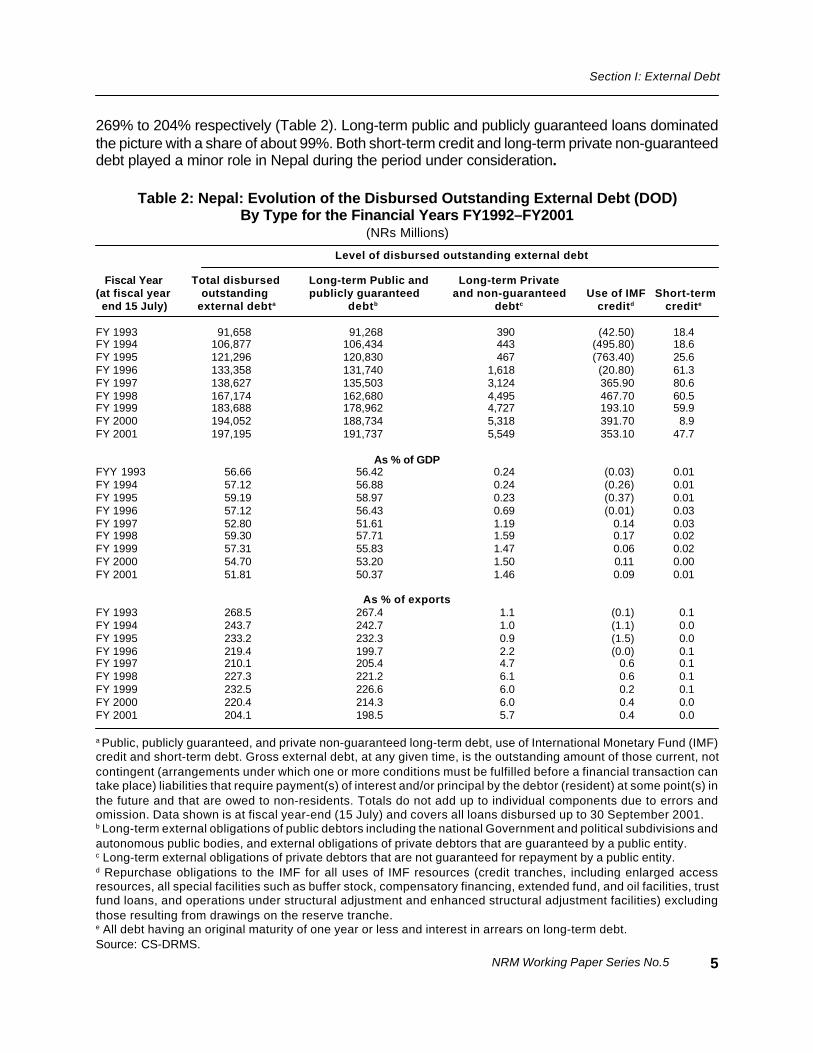
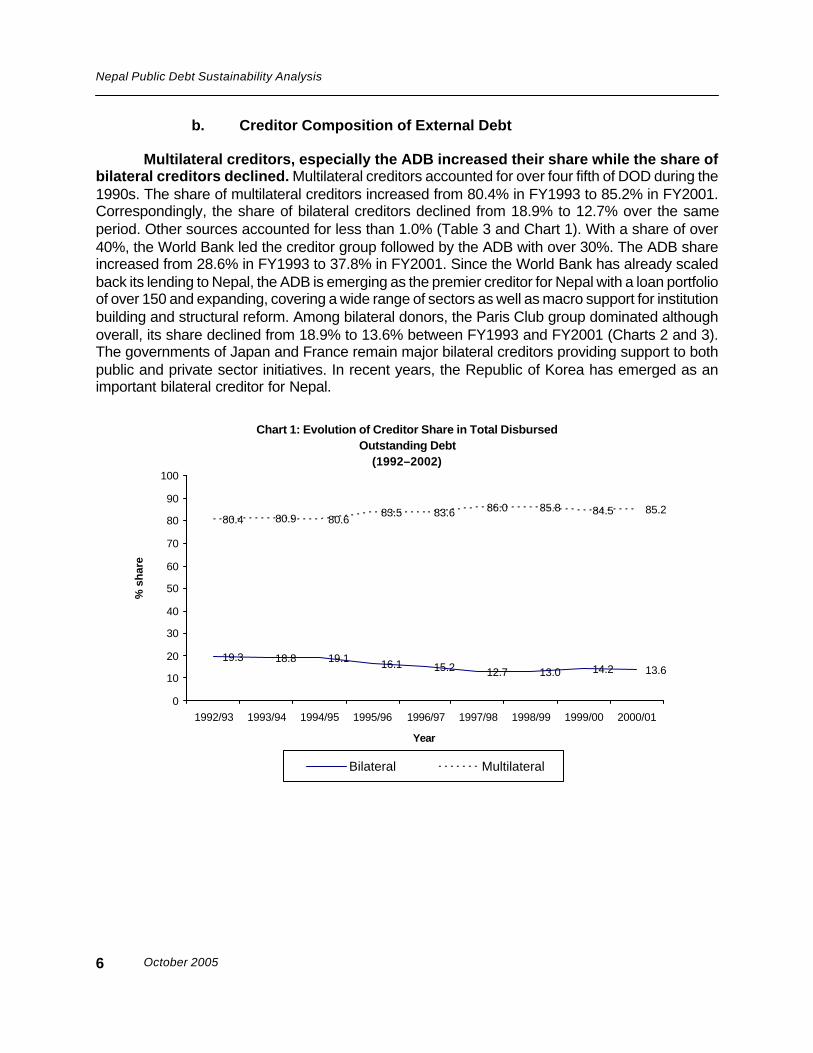
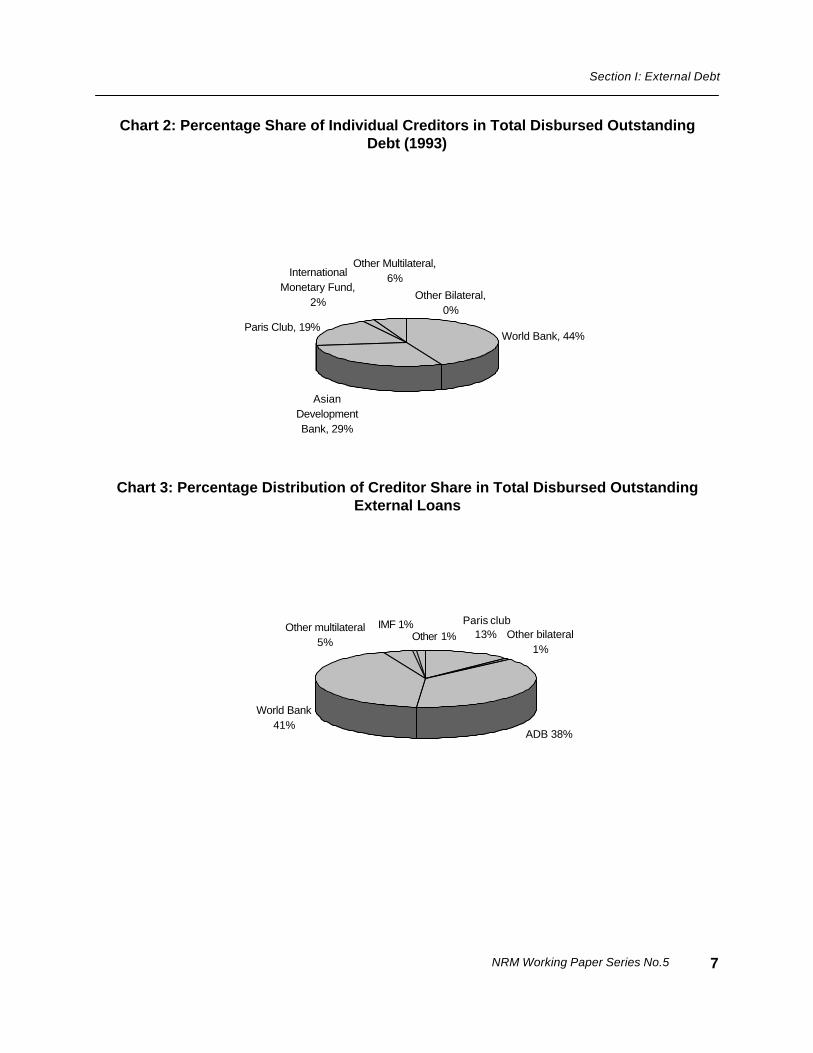
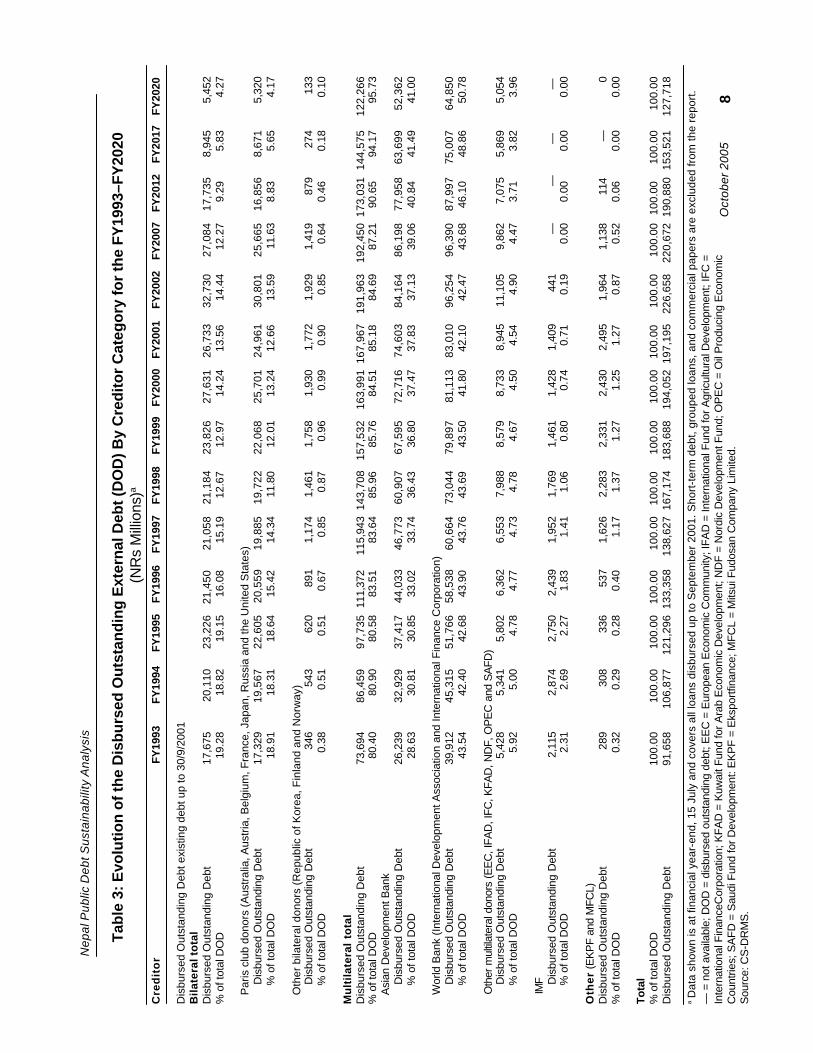
Multilateral creditors, especially the ADB increased their share while the share ofbilateral creditors declined. Multilateral creditors accounted for over four fifth of DOD during the1990s. The share of multilateral creditors increased from 80.4% in FY1993 to 85.2% in FY2001.Correspondingly, the share of bilateral creditors declined from 18.9% to 12.7% over the sameperiod. Other sources accounted for less than 1.0% (Table 3 and Chart 1). With a share of over40%, the World Bank led the creditor group followed by the ADB with over 30%. The ADB shareincreased from 28.6% in FY1993 to 37.8% in FY2001. Since the World Bank has already scaledback its lending to Nepal, the ADB is emerging as the premier creditor for Nepal with a loan portfolioof over 150 and expanding, covering a wide range of sectors as well as macro support for institutionbuilding and structural reform. Among bilateral donors, the Paris Club group dominated althoughoverall, its share declined from 18.9% to 13.6% between FY1993 and FY2001 (Charts 2 and 3).The governments of Japan and France remain major bilateral creditors providing support to bothpublic and private sector initiatives. In recent years, the Republic of Korea has emerged as animportant bilateral creditor for Nepal.
Chart 1: Evolution of Creditor Share in Total Disbursed Outstanding Debt
(1992–2002)
19.3 18.8 19.1 16.1 15.2 12.7 13.0 14.2 13.6
80.4 80.9 80.683.5 83.6 86.0 85.8 84.5 85.2
0
10
20
30
40
50
60
70
80
90
100
1992/93 1993/94 1994/95 1995/96 1996/97 1997/98 1998/99 1999/00 2000/01
Year
% s
har
e
Bilateral Multilateral
6
NRM Working Paper Series No.5
Section I: External Debt
Chart 2: Percentage Share of Individual Creditors in Total Disbursed OutstandingDebt (1993)
7
Chart 3: Percentage Distribution of Creditor Share in Total Disbursed OutstandingExternal Loans
World Bank, 44%
Asian Development Bank, 29%
Paris Club, 19%
International Monetary Fund,
2%
Other Multilateral, 6%
Other Bilateral, 0%
World Bank41%
Other multilateral5%
ADB 38%
Other bilateral1%
Paris club13%Other 1%
IMF 1%
Oct
ober
200
5
Nep
al P
ublic
Deb
t Sus
tain
abili
ty A
naly
sis
Cre
dit
or
FY19
93FY
1994
FY19
95FY
1996
FY19
97FY
1998
FY19
99FY
2000
FY20
01FY
2002
FY20
07FY
2012
FY20
17FY
2020
Dis
burs
ed O
utst
andi
ng D
ebt e
xist
ing
debt
up
to 3
0/9/
2001
Bila
tera
l to
tal
Dis
burs
ed O
utst
andi
ng D
ebt
17,
675
20,1
1023
,226
21,4
5021
,058
2
1,18
4
23,
826
2
7,63
1
26,7
33
32,
730
2
7,08
4
17,7
35
8,
945
5,45
2%
of t
otal
DO
D19
.28
18.8
219
.15
16.0
815
.19
12.6
712
.97
14.2
413
.56
14.4
412
.27
9.29
5.83
4.27
P
aris
clu
b do
nors
(A
ustr
alia
, Aus
tria
, Bel
gium
, Fra
nce,
Jap
an, R
ussi
a an
d th
e U
nite
d S
tate
s)
D
isbu
rsed
Out
stan
ding
Deb
t
1
7,32
9
19,
567
2
2,60
5
20,5
59
19,
885
19
,722
2
2,06
8
25,
701
24
,961
3
0,80
1
25,
665
16
,856
8,67
1
5,
320
% o
f tot
al D
OD
18.9
118
.31
18.6
415
.42
14.3
411
.80
12.0
113
.24
12.6
613
.59
11.6
38.
835.
654.
17
O
ther
bila
tera
l don
ors
(Rep
ublic
of K
orea
, Fin
land
and
Nor
way
)
D
isbu
rsed
Out
stan
ding
Deb
t
34
6
543
62
0
8
91
1,
174
1
,461
1,75
8
1,
930
1
,772
1,92
9
1,
419
879
27
4
133
% o
f tot
al D
OD
0.38
0.51
0.51
0.67
0.85
0.87
0.96
0.99
0.90
0.85
0.64
0.46
0.18
0.10
Mu
ltil
ater
al t
ota
lD
isbu
rsed
Out
stan
ding
Deb
t
7
3,69
4
86,
459
9
7,73
5 1
11,3
72 1
15,9
43 1
43,7
08 1
57,5
32 1
63,9
91 1
67,9
67 1
91,9
63 1
92,4
50 1
73,0
31 1
44,5
75 1
22,2
66%
of t
otal
DO
D80
.40
80.9
080
.58
83.5
183
.64
85.9
685
.76
84.5
185
.18
84.6
987
.21
90.6
594
.17
95.7
3
Asi
an D
evel
opm
ent B
ank
Dis
burs
ed O
utst
andi
ng D
ebt
26,
239
3
2,92
9
37,
417
44
,033
4
6,77
3
60,9
07
67,
595
7
2,71
6
74,6
03
84,
164
8
6,19
8
77,9
58
63,
699
5
2,36
2
%
of t
otal
DO
D28
.63
30.8
130
.85
33.0
233
.74
36.4
336
.80
37.4
737
.83
37.1
339
.06
40.8
441
.49
41.0
0
W
orld
Ban
k (In
tern
atio
nal D
evel
opm
ent A
ssoc
iatio
n an
d In
tern
atio
nal F
inan
ce C
orpo
ratio
n)
D
isbu
rsed
Out
stan
ding
Deb
t
3
9,91
2
45,
315
5
1,76
6
58,5
38
60,
664
73
,044
7
9,89
7
81,
113
83
,010
9
6,25
4
96,
390
87
,997
7
5,00
7
64,
850
% o
f tot
al D
OD
43.5
442
.40
42.6
843
.90
43.7
643
.69
43.5
041
.80
42.1
042
.47
43.6
846
.10
48.8
650
.78
O
ther
mul
tilat
eral
don
ors
(EE
C, I
FAD
, IFC
, KFA
D, N
DF,
OP
EC
and
SA
FD)
Dis
burs
ed O
utst
andi
ng D
ebt
5,
428
5,34
1
5,
802
6
,362
6,55
3
7,9
88
8,
579
8,73
3
8,9
45
11,
105
9,86
2
7,0
75
5,
869
5,05
4
%
of t
otal
DO
D5.
925.
004.
784.
774.
734.
784.
674.
504.
544.
904.
473.
713.
823.
96
IM
F
D
isbu
rsed
Out
stan
ding
Deb
t
2,11
5
2,
874
2,75
0
2,4
39
1,
952
1
,769
1,46
1
1,
428
1
,409
44
1
—
—
—
—
% o
f tot
al D
OD
2.31
2.69
2.27
1.83
1.41
1.06
0.80
0.74
0.71
0.19
0.00
0.00
0.00
0.00
Oth
er (E
KP
F an
d M
FCL)
Dis
burs
ed O
utst
andi
ng D
ebt
289
30
8
336
537
1,62
6
2,2
83
2,
331
2,43
0
2,4
95
1,
964
1,13
8
1
14
—
0%
of t
otal
DO
D0.
320.
290.
280.
401.
171.
371.
271.
251.
270.
870.
520.
060.
000.
00
Tota
l%
of t
otal
DO
D10
0.00
100.
0010
0.00
100.
0010
0.00
100.
0010
0.00
100.
0010
0.00
100.
0010
0.00
100.
0010
0.00
100.
00D
isbu
rsed
Out
stan
ding
Deb
t91
,658
106
,877
121
,296
133
,358
138
,627
167
,174
183
,688
194
,052
197
,195
226
,658
220
,672
190
,880
153
,521
127
,718
a Dat
a sh
own
is a
t fin
anci
al y
ear-
end,
15
July
and
cov
ers
all l
oans
dis
burs
ed u
p to
Sep
tem
ber
2001
. Sho
rt-t
erm
deb
t, gr
oupe
d lo
ans,
and
com
mer
cial
pap
ers
are
excl
uded
from
the
repo
rt.
Tab
le 3
: Evo
luti
on
of t
he
Dis
bu
rsed
Ou
tsta
nd
ing
Ext
ern
al D
ebt (
DO
D) B
y C
red
ito
r C
ateg
ory
for
the
FY
1993
–FY
2020
(NR
s M
illio
ns)a
— =
not
ava
ilabl
e; D
OD
= d
isbu
rsed
out
stan
ding
deb
t; E
EC
= E
urop
ean
Eco
nom
ic C
omm
unity
; IFA
D =
Inte
rnat
iona
l Fun
d fo
r Agr
icul
tura
l Dev
elop
men
t; IF
C =
Inte
rnat
iona
l Fin
ance
Cor
pora
tion;
KFA
D =
Kuw
ait F
und
for A
rab
Eco
nom
ic D
evel
opm
ent;
ND
F =
Nor
dic
Dev
elop
men
t Fun
d; O
PE
C =
Oil
Pro
duci
ng E
cono
mic
Cou
ntrie
s; S
AFD
= S
audi
Fun
d fo
r Dev
elop
men
t: E
KP
F =
Eks
portf
inan
ce; M
FCL
= M
itsui
Fud
osan
Com
pany
Lim
ited.
Sou
rce:
CS
-DR
MS
.
8
NRM Working Paper Series No.5
Section I: External Debt
c. The Debtor Composition of External Debt
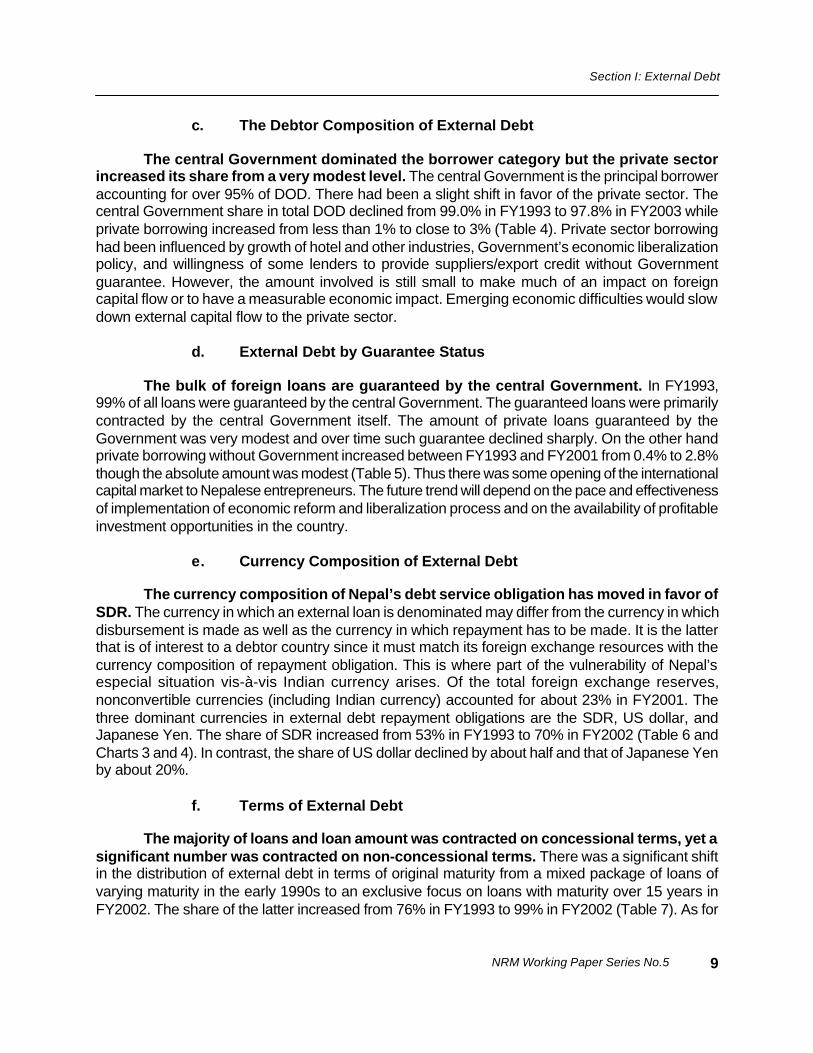
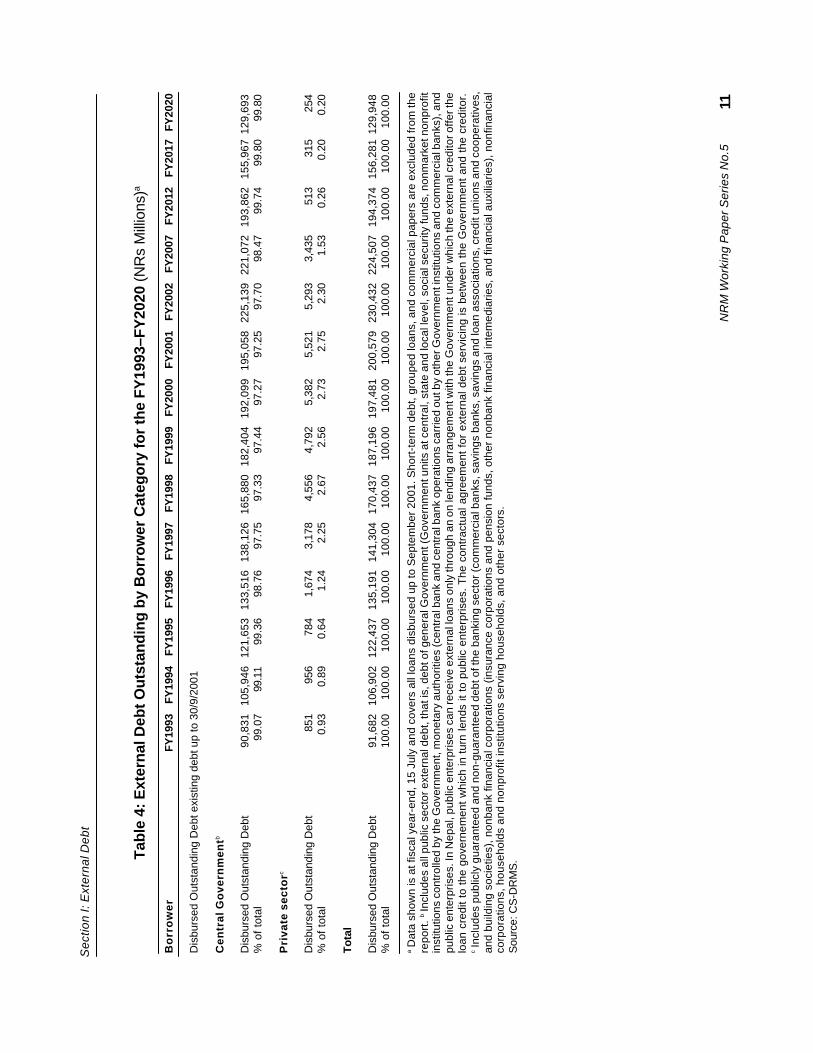
The central Government dominated the borrower category but the private sectorincreased its share from a very modest level. The central Government is the principal borroweraccounting for over 95% of DOD. There had been a slight shift in favor of the private sector. Thecentral Government share in total DOD declined from 99.0% in FY1993 to 97.8% in FY2003 whileprivate borrowing increased from less than 1% to close to 3% (Table 4). Private sector borrowinghad been influenced by growth of hotel and other industries, Government’s economic liberalizationpolicy, and willingness of some lenders to provide suppliers/export credit without Governmentguarantee. However, the amount involved is still small to make much of an impact on foreigncapital flow or to have a measurable economic impact. Emerging economic difficulties would slowdown external capital flow to the private sector.
d. External Debt by Guarantee Status
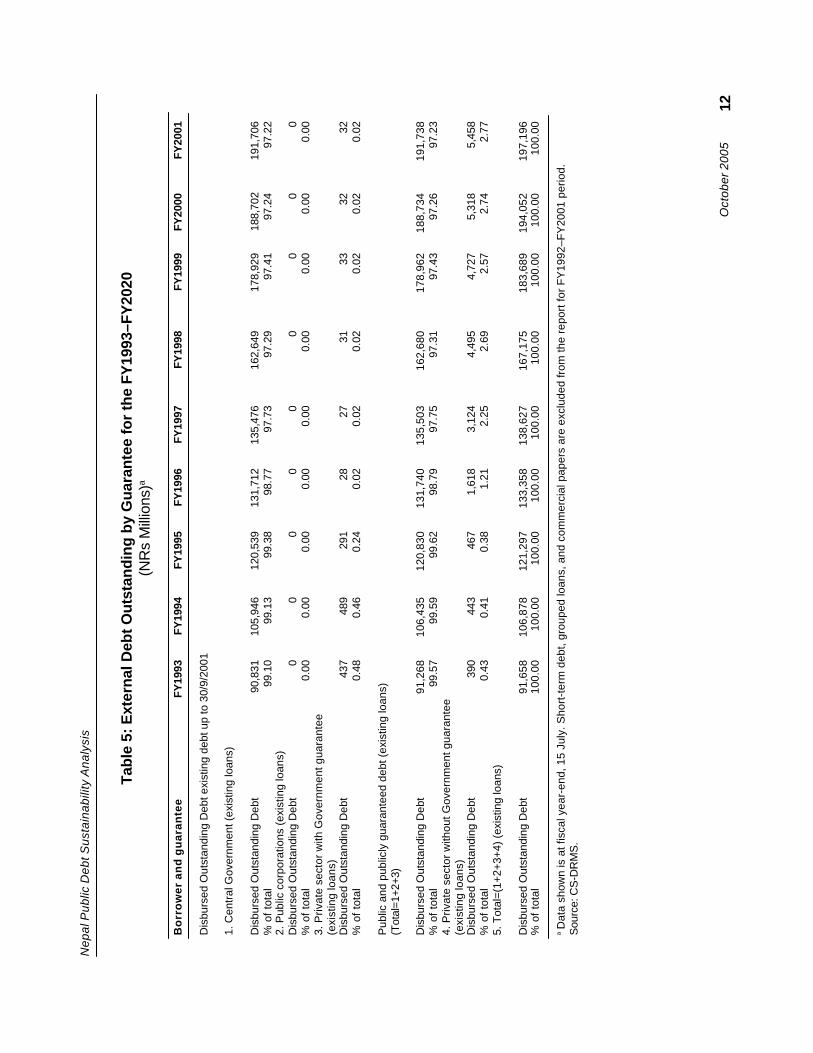
The bulk of foreign loans are guaranteed by the central Government. In FY1993,99% of all loans were guaranteed by the central Government. The guaranteed loans were primarilycontracted by the central Government itself. The amount of private loans guaranteed by theGovernment was very modest and over time such guarantee declined sharply. On the other handprivate borrowing without Government increased between FY1993 and FY2001 from 0.4% to 2.8%though the absolute amount was modest (Table 5). Thus there was some opening of the internationalcapital market to Nepalese entrepreneurs. The future trend will depend on the pace and effectivenessof implementation of economic reform and liberalization process and on the availability of profitableinvestment opportunities in the country.
e. Currency Composition of External Debt
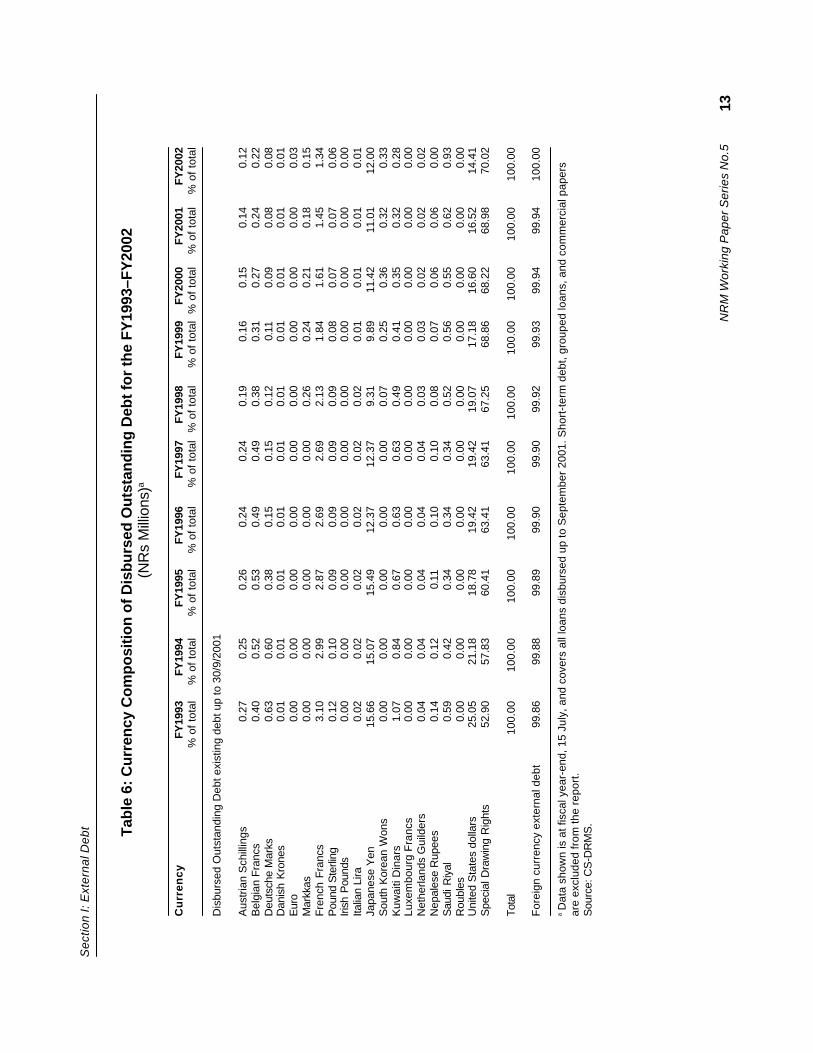
The currency composition of Nepal’s debt service obligation has moved in favor ofSDR. The currency in which an external loan is denominated may differ from the currency in whichdisbursement is made as well as the currency in which repayment has to be made. It is the latterthat is of interest to a debtor country since it must match its foreign exchange resources with thecurrency composition of repayment obligation. This is where part of the vulnerability of Nepal’sespecial situation vis-à-vis Indian currency arises. Of the total foreign exchange reserves,nonconvertible currencies (including Indian currency) accounted for about 23% in FY2001. Thethree dominant currencies in external debt repayment obligations are the SDR, US dollar, andJapanese Yen. The share of SDR increased from 53% in FY1993 to 70% in FY2002 (Table 6 andCharts 3 and 4). In contrast, the share of US dollar declined by about half and that of Japanese Yenby about 20%.
f. Terms of External Debt
The majority of loans and loan amount was contracted on concessional terms, yet asignificant number was contracted on non-concessional terms. There was a significant shiftin the distribution of external debt in terms of original maturity from a mixed package of loans ofvarying maturity in the early 1990s to an exclusive focus on loans with maturity over 15 years inFY2002. The share of the latter increased from 76% in FY1993 to 99% in FY2002 (Table 7). As for
9
October 2005
Nepal Public Debt Sustainability Analysis
terms, central Government loans were contracted mostly at interest rates 1% or less, with averagematurity period increasing from 23 years in FY1992 to 39 years in FY2000 and grace period remainingstable at 10 years. Average grant element increased from 24% in FY1993 to 40% in FY2000 (Table8). Private sector loans were contracted at much more unfavorable terms, so much as to yieldnegative grant element, implying that interest rates charged were higher than the market referencerate. The term structure and grant element of total debt was similar to that of central Governmentdebt. What comes out clearly is that in some years (e.g., FY1993, FY1995 and FY1996), averageborrowing terms yielded a grant element well below the threshold for concessional loans (35%). Insome years, bilateral terms were more favorable than multilateral, while in others the reverse wastrue (Table 9). However, a more in-depth investigation of 323 loans revealed that as of 30 September2001, 119 were contracted at non-concessional terms, 22 yielding negative grant element (Table10). The bulk of these loans were contracted between 1985 and 1990. In terms of loan volume, theGovernment of Japan was one major source of non-concessional loans (77%). Future loannegotiations should keep these findings in perspective.
10
NR
M W
orki
ng P
aper
Ser
ies
No.
5
Sec
tion
I: E
xter
nal D
ebt
Tab
le 4
: Ext
ern
al D
ebt O
uts
tan
din
g b
y B
orr
ow
er C
ateg
ory
for
the
FY
1993
–FY
2020
(NR
s M
illio
ns)a
B
orr
ow
er
FY19
93FY
1994
FY19
95FY
1996
FY19
97FY
1998
FY19
99FY
2000
FY20
01FY
2002
FY20
07FY
2012
FY20
17FY
2020
Dis
burs
ed O
utst
andi
ng D
ebt e
xist
ing
debt
up
to 3
0/9/
2001
Cen
tral
Go
vern
men
tb
Dis
burs
ed O
utst
andi
ng D
ebt
90,8
3110
5,94
612
1,65
313
3,51
613
8,12
616
5,88
018
2,40
419
2,09
919
5,05
822
5,13
922
1,07
219
3,86
215
5,96
712
9,69
3%
of t
otal
99.0
799
.11
99.3
698
.76
97.7
597
.33
97.4
497
.27
97.2
597
.70
98.4
799
.74
99.8
099
.80
Pri
vate
sec
torc
Dis
burs
ed O
utst
andi
ng D
ebt
851
956
784
1,67
43,
178
4,55
64,
792
5,38
25,
521
5,29
33,
435
513
315
254
% o
f tot
al0.
930.
890.
641.
242.
252.
672.
562.
732.
752.
301.
530.
260.
200.
20
Tota
l
Dis
burs
ed O
utst
andi
ng D
ebt
91,6
8210
6,90
212
2,43
713
5,19
114
1,30
417
0,43
718
7,19
619
7,48
120
0,57
923
0,43
222
4,50
719
4,37
415
6,28
112
9,94
8%
of t
otal
100.
0010
0.00
100.
0010
0.00
100.
0010
0.00
100.
0010
0.00
100.
0010
0.00
100.
0010
0.00
100.
0010
0.00
a Dat
a sh
own
is a
t fis
cal y
ear-
end,
15
July
and
cov
ers
all l
oans
dis
burs
ed u
p to
Sep
tem
ber
2001
. Sho
rt-t
erm
deb
t, gr
oupe
d lo
ans,
and
com
mer
cial
pap
ers
are
excl
uded
from
the
repo
rt. b I
nclu
des
all p
ublic
sec
tor e
xter
nal d
ebt,
that
is, d
ebt o
f gen
eral
Gov
ernm
ent (
Gov
ernm
ent u
nits
at c
entr
al, s
tate
and
loca
l lev
el, s
ocia
l sec
urity
fund
s, n
onm
arke
t non
prof
itin
stitu
tions
con
trol
led
by th
e G
over
nmen
t, m
onet
ary
auth
oriti
es (c
entr
al b
ank
and
cent
ral b
ank
oper
atio
ns c
arrie
d ou
t by
othe
r Gov
ernm
ent i
nstit
utio
ns a
nd c
omm
erci
al b
anks
), a
ndpu
blic
ent
erpr
ises
. In
Nep
al, p
ublic
ent
erpr
ises
can
rece
ive
exte
rnal
loan
s on
ly th
roug
h an
on
lend
ing
arra
ngem
ent w
ith th
e G
over
nmen
t und
er w
hich
the
exte
rnal
cre
dito
r offe
r the
loan
cre
dit t
o th
e go
vern
emen
t whi
ch in
turn
lend
s it
to p
ublic
ent
erpr
ises
. The
con
trac
tual
agr
eem
ent f
or e
xter
nal d
ebt s
ervi
cing
is b
etw
een
the
Gov
ernm
ent a
nd th
e cr
edito
r.c I
nclu
des
publ
icly
gua
rant
eed
and
non-
guar
ante
ed d
ebt o
f the
ban
king
sec
tor (
com
mer
cial
ban
ks, s
avin
gs b
anks
, sav
ings
and
loan
ass
ocia
tions
, cre
dit u
nion
s an
d co
oper
ativ
es,
and
build
ing
soci
etie
s), n
onba
nk fi
nanc
ial c
orpo
ratio
ns (
insu
ranc
e co
rpor
atio
ns a
nd p
ensi
on fu
nds,
oth
er n
onba
nk fi
nanc
ial i
ntem
edia
ries,
and
fina
ncia
l aux
iliar
ies)
, non
finan
cial
corp
orat
ions
, hou
seho
lds
and
nonp
rofit
inst
itutio
ns s
ervi
ng h
ouse
hold
s, a
nd o
ther
sec
tors
.S
ourc
e: C
S-D
RM
S.
11
Oct
ober
200
5
Nep
al P
ublic
Deb
t Sus
tain
abili
ty A
naly
sis
Tab
le 5
: Ext
ern
al D
ebt O
uts
tan
din
g b
y G
uar
ante
e fo
r th
e F
Y19
93–F
Y20
20(N
Rs
Mill
ions
)a
Bo
rro
wer
an
d g
uar
ante
eFY
1993
FY19
94FY
1995
FY19
96FY
1997
FY19
98FY
1999
FY20
00FY
2001
Dis
burs
ed O
utst
andi
ng D
ebt e
xist
ing
debt
up
to 3
0/9/
2001
1. C
entr
al G
over
nmen
t (ex
istin
g lo
ans)
Dis
burs
ed O
utst
andi
ng D
ebt
90,
831
105
,946
120
,539
131
,712
135
,476
162
,649
178
,929
188
,702
191
,706
% o
f tot
al99
.10
99.1
399
.38
98.7
797
.73
97.2
997
.41
97.2
497
.22
2. P
ublic
cor
pora
tions
(ex
istin
g lo
ans)
Dis
burs
ed O
utst
andi
ng D
ebt
00
00
00
00
0%
of t
otal
0.00
0.00
0.00
0.00
0.00
0.00
0.00
0.00
0.00
3. P
rivat
e se
ctor
with
Gov
ernm
ent g
uara
ntee
(exi
stin
g lo
ans)
Dis
burs
ed O
utst
andi
ng D
ebt
437
489
291
2827
3133
3232
% o
f tot
al0.
480.
460.
240.
020.
020.
020.
020.
020.
02
Pub
lic a
nd p
ublic
ly g
uara
ntee
d de
bt (
exis
ting
loan
s)(T
otal
=1+2
+3)
Dis
burs
ed O
utst
andi
ng D
ebt
91
,268
106
,435
120
,830
131
,740
135
,503
162
,680
178
,962
188
,734
191
,738
% o
f tot
al99
.57
99.5
999
.62
98.7
997
.75
97.3
197
.43
97.2
697
.23
4. P
rivat
e se
ctor
with
out G
over
nmen
t gua
rant
ee(e
xist
ing
loan
s)D
isbu
rsed
Out
stan
ding
Deb
t
3
90
443
46
7
1,
618
3,12
4
4,
495
4,72
7
5,
318
5,45
8%
of t
otal
0.43
0.41
0.38
1.21
2.25
2.69
2.57
2.74
2.77
5. T
otal
=(1+
2+3+
4) (e
xist
ing
loan
s)
Dis
burs
ed O
utst
andi
ng D
ebt
91
,658
106
,878
121
,297
133
,358
138
,627
167
,175
183
,689
194
,052
197
,196
% o
f tot
al10
0.00
100.
0010
0.00
100.
0010
0.00
100.
0010
0.00
100.
0010
0.00
a Dat
a sh
own
is a
t fis
cal y
ear-
end,
15
July
. Sho
rt-t
erm
deb
t, gr
oupe
d lo
ans,
and
com
mer
cial
pap
ers
are
excl
uded
from
the
repo
rt fo
r F
Y19
92–F
Y20
01 p
erio
d.S
ourc
e: C
S-D
RM
S.
12
NR
M W
orki
ng P
aper
Ser
ies
No.
5
Sec
tion
I: E
xter
nal D
ebt Tab
le 6
: Cu
rren
cy C
om
po
sitio
n o
f Dis
bu
rsed
Ou
tsta
nd
ing
Deb
t fo
r th
e F
Y19
93–F
Y20
02 (N
Rs
Mill
ions
)a
Cu
rren
cyFY
1993
FY19
94FY
1995
FY19
96FY
1997
FY19
98FY
1999
FY20
00FY
2001
FY20
02%
of t
otal
% o
f tot
al%
of t
otal
% o
f tot
al%
of t
otal
% o
f tot
al%
of t
otal
% o
f tot
al%
of t
otal
% o
f tot
al
Dis
burs
ed O
utst
andi
ng D
ebt e
xist
ing
debt
up
to 3
0/9/
2001
Aus
tria
n S
chill
ings
0.27
0.25
0.26
0.24
0.24
0.19
0.16
0.15
0.14
0.12
Bel
gian
Fra
ncs
0.40
0.52
0.53
0.49
0.49
0.38
0.31
0.27
0.24
0.22
Deu
tsch
e M
arks
0.63
0.60
0.38
0.15
0.15
0.12
0.11
0.09
0.08
0.08
Dan
ish
Kro
nes
0.01
0.01
0.01
0.01
0.01
0.01
0.01
0.01
0.01
0.01
Eur
o0.
000.
000.
000.
000.
000.
000.
000.
000.
000.
03M
arkk
as0.
000.
000.
000.
000.
000.
260.
240.
210.
180.
15F
renc
h F
ranc
s3.
102.
992.
872.
692.
692.
131.
841.
611.
451.
34P
ound
Ste
rling
0.12
0.10
0.09
0.09
0.09
0.09
0.08
0.07
0.07
0.06
Irish
Pou
nds
0.00
0.00
0.00
0.00
0.00
0.00
0.00
0.00
0.00
0.00
Italia
n Li
ra0.
020.
020.
020.
020.
020.
020.
010.
010.
010.
01Ja
pane
se Y
en15
.66
15.0
715
.49
12.3
712
.37
9.31
9.89
11.4
211
.01
12.0
0S
outh
Kor
ean
Won
s0.
000.
000.
000.
000.
000.
070.
250.
360.
320.
33K
uwai
ti D
inar
s1.
070.
840.
670.
630.
630.
490.
410.
350.
320.
28Lu
xem
bour
g F
ranc
s0.
000.
000.
000.
000.
000.
000.
000.
000.
000.
00N
ethe
rland
s G
uild
ers
0.04
0.04
0.04
0.04
0.04
0.03
0.03
0.02
0.02
0.02
Nep
ales
e R
upee
s0.
140.
120.
110.
100.
100.
080.
070.
060.
060.
00S
audi
Riy
al0.
590.
420.
340.
340.
340.
520.
560.
550.
620.
93R
oubl
es0.
000.
000.
000.
000.
000.
000.
000.
000.
000.
00U
nite
d S
tate
s do
llars
25.0
521
.18
18.7
819
.42
19.4
219
.07
17.1
816
.60
16.5
214
.41
Spe
cial
Dra
win
g R
ight
s52
.90
57.8
360
.41
63.4
163
.41
67.2
568
.86
68.2
268
.98
70.0
2
Tota
l10
0.00
100.
0010
0.00
100.
0010
0.00
100.
0010
0.00
100.
0010
0.00
100.
00
For
eign
cur
renc
y ex
tern
al d
ebt
99.8
699
.88
99.8
999
.90
99.9
099
.92
99.9
399
.94
99.9
410
0.00
a Dat
a sh
own
is a
t fis
cal y
ear-
end,
15
July
, and
cov
ers
all l
oans
dis
burs
ed u
p to
Sep
tem
ber
2001
. Sho
rt-t
erm
deb
t, gr
oupe
d lo
ans,
and
com
mer
cial
pap
ers
are
excl
uded
from
the
repo
rt.
Sou
rce:
CS
-DR
MS
.
13
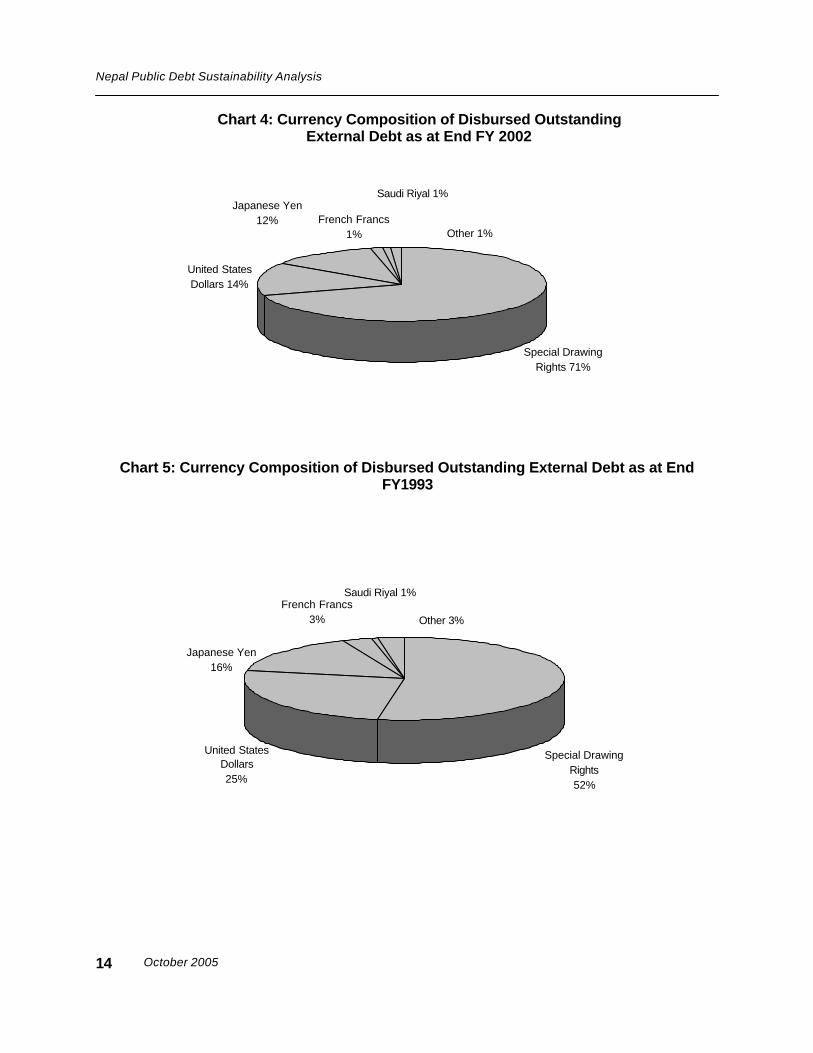
October 2005
Nepal Public Debt Sustainability Analysis
Chart 4: Currency Composition of Disbursed OutstandingExternal Debt as at End FY 2002
14
United States Dollars 14%
Japanese Yen12% French Francs
1%
Saudi Riyal 1%
Other 1%
Special Drawing Rights 71%
Chart 5: Currency Composition of Disbursed Outstanding External Debt as at EndFY1993
Saudi Riyal 1%
Other 3%French Francs
3%
Japanese Yen16%
Special Drawing Rights52%
United States Dollars25%
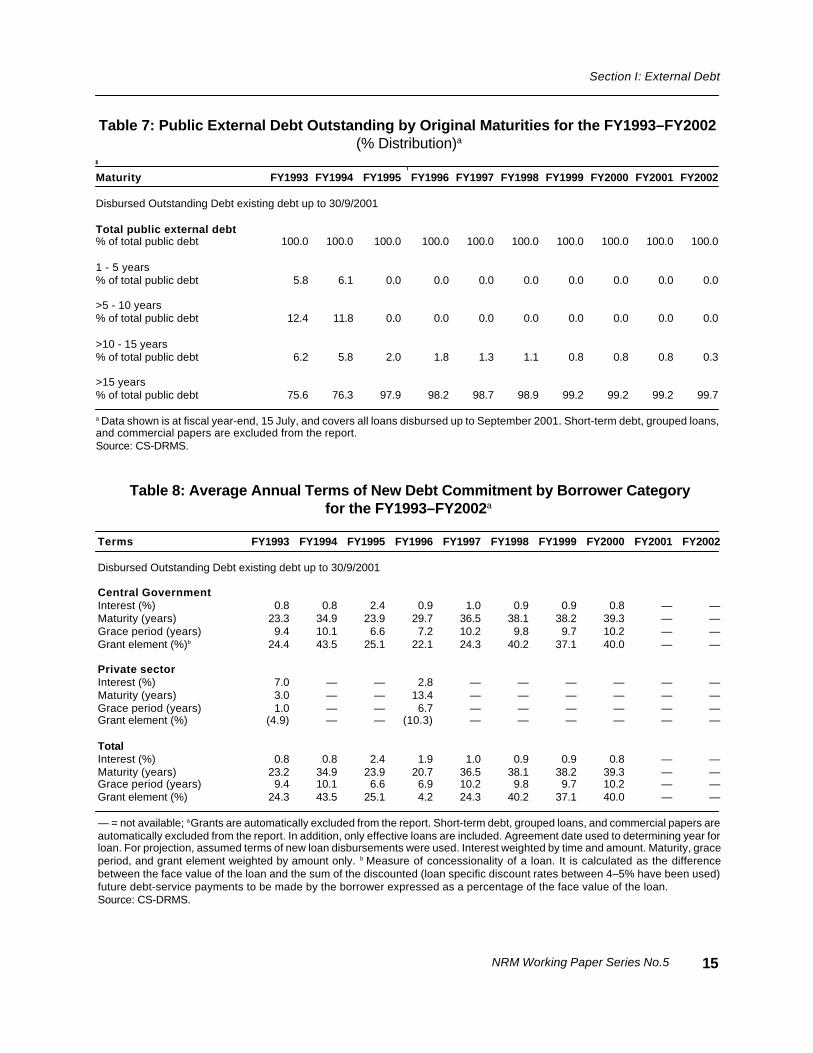
NRM Working Paper Series No.5
Section I: External Debt
Table 8: Average Annual Terms of New Debt Commitment by Borrower Categoryfor the FY1993–FY2002a
Terms FY1993 FY1994 FY1995 FY1996 FY1997 FY1998 FY1999 FY2000 FY2001 FY2002
Disbursed Outstanding Debt existing debt up to 30/9/2001
Central GovernmentInterest (%) 0.8 0.8 2.4 0.9 1.0 0.9 0.9 0.8 — —Maturity (years) 23.3 34.9 23.9 29.7 36.5 38.1 38.2 39.3 — —Grace period (years) 9.4 10.1 6.6 7.2 10.2 9.8 9.7 10.2 — —Grant element (%)b 24.4 43.5 25.1 22.1 24.3 40.2 37.1 40.0 — —
Private sectorInterest (%) 7.0 — — 2.8 — — — — — —Maturity (years) 3.0 — — 13.4 — — — — — —Grace period (years) 1.0 — — 6.7 — — — — — —Grant element (%) (4.9) — — (10.3) — — — — — —
TotalInterest (%) 0.8 0.8 2.4 1.9 1.0 0.9 0.9 0.8 — —Maturity (years) 23.2 34.9 23.9 20.7 36.5 38.1 38.2 39.3 — —Grace period (years) 9.4 10.1 6.6 6.9 10.2 9.8 9.7 10.2 — —Grant element (%) 24.3 43.5 25.1 4.2 24.3 40.2 37.1 40.0 — —
— = not available; a Grants are automatically excluded from the report. Short-term debt, grouped loans, and commercial papers areautomatically excluded from the report. In addition, only effective loans are included. Agreement date used to determining year forloan. For projection, assumed terms of new loan disbursements were used. Interest weighted by time and amount. Maturity, graceperiod, and grant element weighted by amount only. b Measure of concessionality of a loan. It is calculated as the differencebetween the face value of the loan and the sum of the discounted (loan specific discount rates between 4–5% have been used)future debt-service payments to be made by the borrower expressed as a percentage of the face value of the loan.Source: CS-DRMS.
15
Table 7: Public External Debt Outstanding by Original Maturities for the FY1993–FY2002 (% Distribution)a
Maturity FY1993 FY1994 FY1995 FY1996 FY1997 FY1998 FY1999 FY2000 FY2001 FY2002
Disbursed Outstanding Debt existing debt up to 30/9/2001
Total public external debt% of total public debt 100.0 100.0 100.0 100.0 100.0 100.0 100.0 100.0 100.0 100.0
1 - 5 years% of total public debt 5.8 6.1 0.0 0.0 0.0 0.0 0.0 0.0 0.0 0.0
>5 - 10 years% of total public debt 12.4 11.8 0.0 0.0 0.0 0.0 0.0 0.0 0.0 0.0
>10 - 15 years% of total public debt 6.2 5.8 2.0 1.8 1.3 1.1 0.8 0.8 0.8 0.3
>15 years% of total public debt 75.6 76.3 97.9 98.2 98.7 98.9 99.2 99.2 99.2 99.7
a Data shown is at fiscal year-end, 15 July, and covers all loans disbursed up to September 2001. Short-term debt, grouped loans,and commercial papers are excluded from the report.Source: CS-DRMS.
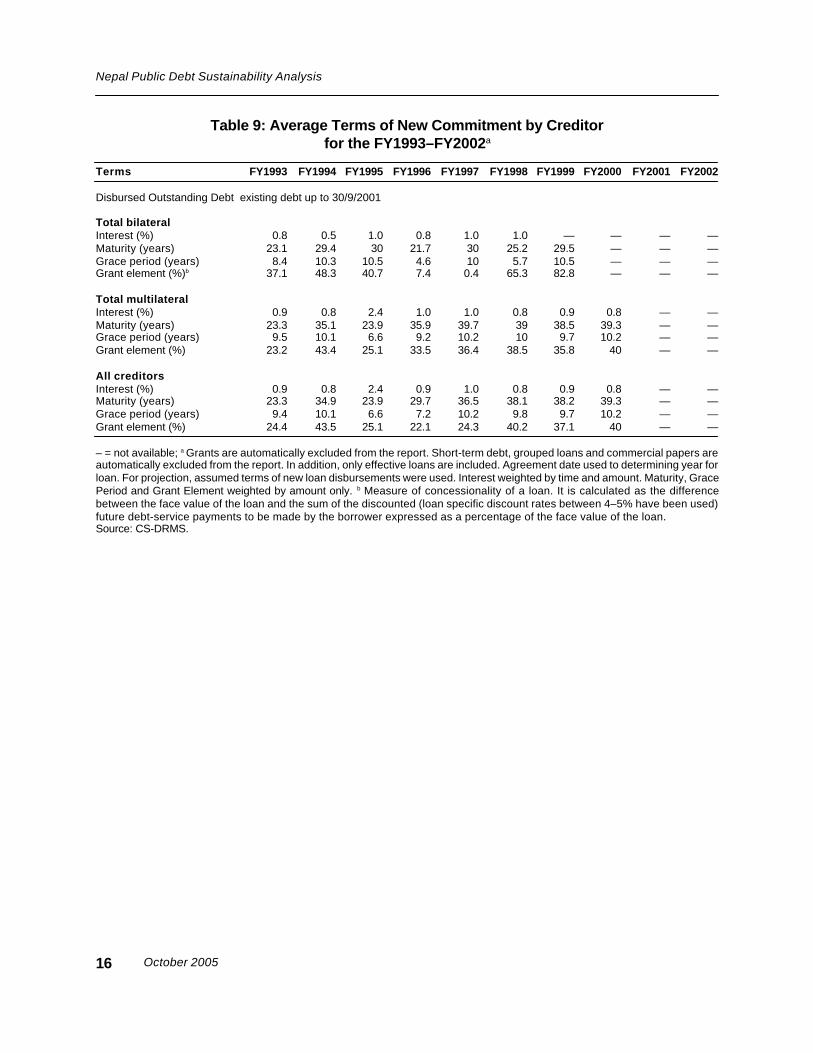
October 2005
Nepal Public Debt Sustainability Analysis
Table 9: Average Terms of New Commitment by Creditorfor the FY1993–FY2002a
Terms FY1993 FY1994 FY1995 FY1996 FY1997 FY1998 FY1999 FY2000 FY2001 FY2002
Disbursed Outstanding Debt existing debt up to 30/9/2001
Total bilateralInterest (%) 0.8 0.5 1.0 0.8 1.0 1.0 — — — —Maturity (years) 23.1 29.4 30 21.7 30 25.2 29.5 — — —Grace period (years) 8.4 10.3 10.5 4.6 10 5.7 10.5 — — —Grant element (%)b 37.1 48.3 40.7 7.4 0.4 65.3 82.8 — — —
Total multilateralInterest (%) 0.9 0.8 2.4 1.0 1.0 0.8 0.9 0.8 — —Maturity (years) 23.3 35.1 23.9 35.9 39.7 39 38.5 39.3 — —Grace period (years) 9.5 10.1 6.6 9.2 10.2 10 9.7 10.2 — —Grant element (%) 23.2 43.4 25.1 33.5 36.4 38.5 35.8 40 — —
All creditorsInterest (%) 0.9 0.8 2.4 0.9 1.0 0.8 0.9 0.8 — —Maturity (years) 23.3 34.9 23.9 29.7 36.5 38.1 38.2 39.3 — —Grace period (years) 9.4 10.1 6.6 7.2 10.2 9.8 9.7 10.2 — —Grant element (%) 24.4 43.5 25.1 22.1 24.3 40.2 37.1 40 — —
– = not available; a Grants are automatically excluded from the report. Short-term debt, grouped loans and commercial papers areautomatically excluded from the report. In addition, only effective loans are included. Agreement date used to determining year forloan. For projection, assumed terms of new loan disbursements were used. Interest weighted by time and amount. Maturity, GracePeriod and Grant Element weighted by amount only. b Measure of concessionality of a loan. It is calculated as the differencebetween the face value of the loan and the sum of the discounted (loan specific discount rates between 4–5% have been used)future debt-service payments to be made by the borrower expressed as a percentage of the face value of the loan.Source: CS-DRMS.
16
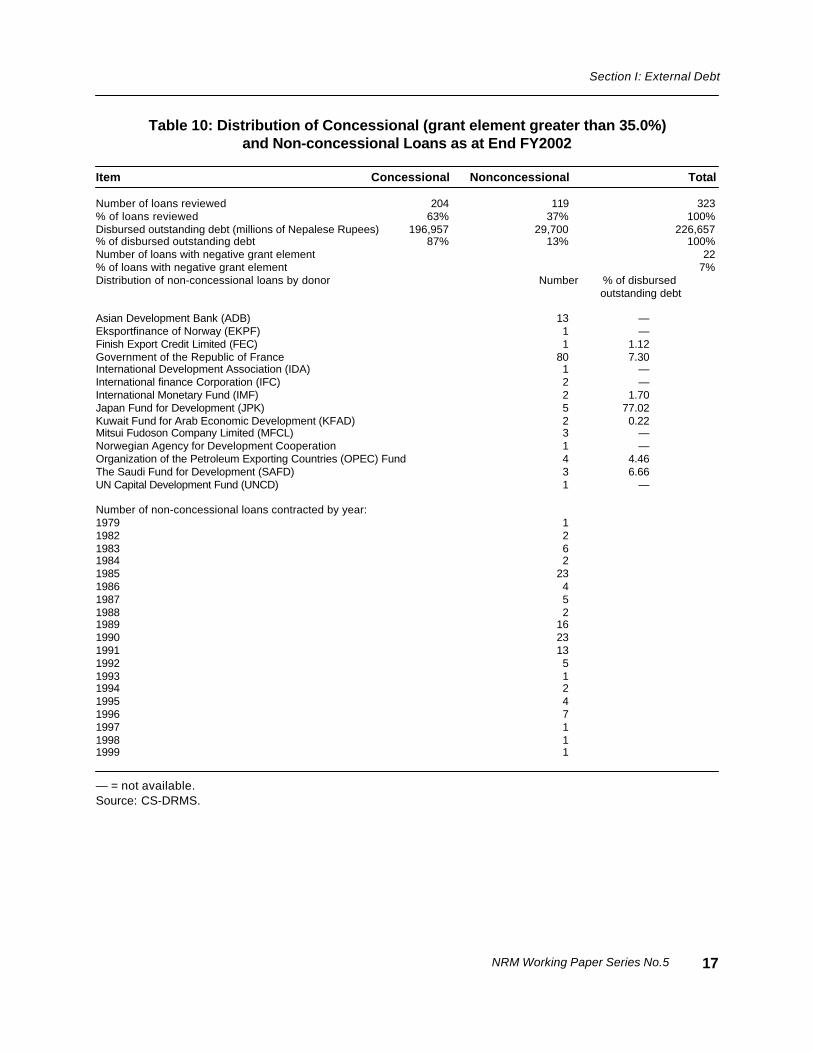
NRM Working Paper Series No.5
Section I: External Debt
Table 10: Distribution of Concessional (grant element greater than 35.0%)and Non-concessional Loans as at End FY2002
Item Concessional Nonconcessional Total
Number of loans reviewed 204 119 323% of loans reviewed 63% 37% 100%Disbursed outstanding debt (millions of Nepalese Rupees) 196,957 29,700 226,657% of disbursed outstanding debt 87% 13% 100%Number of loans with negative grant element 22% of loans with negative grant element 7%Distribution of non-concessional loans by donor Number % of disbursed
outstanding debt
Asian Development Bank (ADB) 13 —Eksportfinance of Norway (EKPF) 1 —Finish Export Credit Limited (FEC) 1 1.12Government of the Republic of France 80 7.30International Development Association (IDA) 1 —International finance Corporation (IFC) 2 —International Monetary Fund (IMF) 2 1.70Japan Fund for Development (JPK) 5 77.02Kuwait Fund for Arab Economic Development (KFAD) 2 0.22Mitsui Fudoson Company Limited (MFCL) 3 —Norwegian Agency for Development Cooperation 1 —Organization of the Petroleum Exporting Countries (OPEC) Fund 4 4.46The Saudi Fund for Development (SAFD) 3 6.66UN Capital Development Fund (UNCD) 1 —
Number of non-concessional loans contracted by year:1979 11982 21983 61984 21985 231986 41987 51988 21989 161990 231991 131992 51993 11994 21995 41996 71997 11998 11999 1
— = not available.Source: CS-DRMS.
17
October 2005
Nepal Public Debt Sustainability Analysis
g. External Debt Composition by Economic Sector
The agriculture sector, including irrigation and rural development, dominated theforeign loan portfolio of the Government. Foreign loans were contracted for a wide range ofactivities across many sectors (Table 11). Implicit prioritization seems to have had favoredagriculture and rural development (including irrigation) and electricity. Broadly defined, the share ofagriculture in total external debt increased from 27% in FY1992 to 36% in FY2002, the changebeing explained entirely by a significant shift of emphasis towards irrigation in accordance with thetwenty-year Agriculture Perspective Plan (APP). Productivity of agriculture as measured by outputper hectare of major crops has increased but the potential output gap is still high and more attentionhas to be given to realize the yield increase potential due to irrigation and other inputs. In a sense,Nepal’s debt repayment capacity will remain contingent upon efficient utilization of foreign capitalin the agriculture sector. Productivity increase, especially in food crops like paddy, and cash cropslike sugarcane, will have to play the key role since the land frontier is limited. Paddy output perhectare increased by about 8% per annum during the Ninth Plan (FY1997–FY2002) period, but thispace could not be maintained during the on-going Tenth Plan (FY2003–FY2007) period. Reductionin the use of fertilizer as a result of removal of subsidy played a role in the change of pace inproductivity growth. The share of electricity in total external capital remained stable around a fifth.This is far below the level that could be utilized to tap more of the immense hydropower potential ofNepal (83,000 MW). At present, total exploitation has only reached 0.5% of total potential (367.9MW) with the completion of 36 MW Upper Bhote Koshi and 14 MW Modi Khola hydroelectricprojects. The ADB financed 144 MW Kali Gandaki ‘A’ is expected to be completed next fiscal year.A number of other smaller projects are under way. Given the large investment requirements in theenergy sector, the Government has made concerted effort to attract private investments, bothlocal and foreign, particularly for small independent power plants to serve local communities.However, the progress has been miniscule. Shortage and unreliability of power supply outside ofmajor urban centers served by the national grid has seriously constrained development, andoperation of export oriented and other economic activities. This in turn may have serious implicationsfor debt servicing capacity of the Government over the medium to long-term.
18
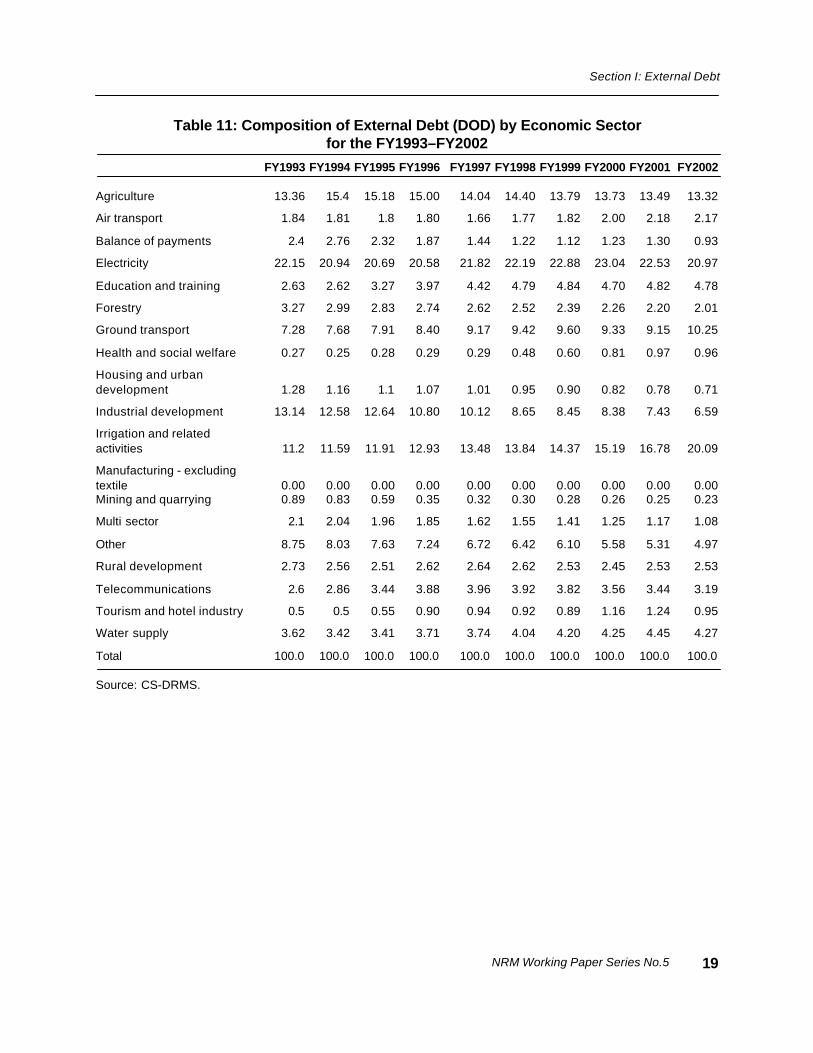
NRM Working Paper Series No.5
Section I: External Debt
Table 11: Composition of External Debt (DOD) by Economic Sectorfor the FY1993–FY2002
FY1993 FY1994 FY1995 FY1996 FY1997 FY1998 FY1999 FY2000 FY2001 FY2002
Agriculture 13.36 15.4 15.18 15.00 14.04 14.40 13.79 13.73 13.49 13.32
Air transport 1.84 1.81 1.8 1.80 1.66 1.77 1.82 2.00 2.18 2.17
Balance of payments 2.4 2.76 2.32 1.87 1.44 1.22 1.12 1.23 1.30 0.93
Electricity 22.15 20.94 20.69 20.58 21.82 22.19 22.88 23.04 22.53 20.97
Education and training 2.63 2.62 3.27 3.97 4.42 4.79 4.84 4.70 4.82 4.78
Forestry 3.27 2.99 2.83 2.74 2.62 2.52 2.39 2.26 2.20 2.01
Ground transport 7.28 7.68 7.91 8.40 9.17 9.42 9.60 9.33 9.15 10.25
Health and social welfare 0.27 0.25 0.28 0.29 0.29 0.48 0.60 0.81 0.97 0.96
Housing and urbandevelopment 1.28 1.16 1.1 1.07 1.01 0.95 0.90 0.82 0.78 0.71
Industrial development 13.14 12.58 12.64 10.80 10.12 8.65 8.45 8.38 7.43 6.59
Irrigation and relatedactivities 11.2 11.59 11.91 12.93 13.48 13.84 14.37 15.19 16.78 20.09
Manufacturing - excludingtextile 0.00 0.00 0.00 0.00 0.00 0.00 0.00 0.00 0.00 0.00Mining and quarrying 0.89 0.83 0.59 0.35 0.32 0.30 0.28 0.26 0.25 0.23
Multi sector 2.1 2.04 1.96 1.85 1.62 1.55 1.41 1.25 1.17 1.08
Other 8.75 8.03 7.63 7.24 6.72 6.42 6.10 5.58 5.31 4.97
Rural development 2.73 2.56 2.51 2.62 2.64 2.62 2.53 2.45 2.53 2.53
Telecommunications 2.6 2.86 3.44 3.88 3.96 3.92 3.82 3.56 3.44 3.19
Tourism and hotel industry 0.5 0.5 0.55 0.90 0.94 0.92 0.89 1.16 1.24 0.95
Water supply 3.62 3.42 3.41 3.71 3.74 4.04 4.20 4.25 4.45 4.27
Total 100.0 100.0 100.0 100.0 100.0 100.0 100.0 100.0 100.0 100.0
Source: CS-DRMS.
19

October 2005
Nepal Public Debt Sustainability Analysis
h. The Debt Service Burden of External Debt
The share of multilateral creditors in total debt service on existing external loanshas increased over time. Total debt service burden on existing debts is shown in Table 12 andthe percentage distribution is revealed in Table 13. In absolute terms, total debt service increasedfrom NRs2,051 million in FY1993 to NRs13,000 million in FY2001. Debt service owed to bilateralcreditors amounted between one fourth and one fifth of total service burden. Correspondingly, theshare of multilateral creditors fluctuated between three fourths and four fifths. Bilateral debt serviceconsisted primarily of payments to the Paris Club group. Among multilateral creditors, the ADBhad the largest share of external debt service burden coming ahead of the World Bank althoughthe amount of loans was lower. This is largely explained by the more favorable terms offered by theInternational Development Association (IDA) of the World Bank. Chart 6 presents the evolution ofdebt service on existing loans by creditor over the FY1993–FY2020 period. The chart clearlyindicates the increase in the share of multilateral creditors. Data in Table 14 suggest that throughoutthe period under consideration, the central Government accounted for most of the external debtservice obligations. Nepal has always been very particular in meeting its external debt serviceobligations. It has never had arrears in payment. Neither has it ever defaulted on any loan.
i. Debt Related Capital Flow
Debt related capital flow was modest during the 1990s but could increasesubstantially in the coming years. Both gross and net external debt related capital flows haveimportant implications for the contribution foreign debt could make in filling macroeconomic deficits,meeting debt service obligations, and in providing the much needed capital and foreign exchangesupport to the country’s development effort. During the 1990s, gross external debt related capitalflows fluctuated annually between NRs14,793 million ($194.5 million) in FY1993 and NRs11,110million ($146 million) in FY2001 (Table 15). The net flow on the other hand, fluctuated betweenNRs7,639 million ($100.5 million) and NRs3,946 ($51.9) million over the same period. Annualaverage gross disbursements averaged about NRs17,592 million ($231 million) for the period andnet disbursements NRs10,438 million ($137 million). These levels are projected to increasesubstantially over the next two decades with gross flow reaching an annual level of NRs261,367million ($2,363 million) in FY2020 under the high growth scenario and NRs224,926 million ($2,033million) under the low growth scenario. These are indeed very high levels of fund release andutilization, which few countries can manage efficiently. Nepal would have to strengthen institutionalarrangements for ensuring greater absorption of foreign capital inflow. Net external debt relatedcapital flows would continue to contribute to the build-up of foreign exchange reserves and alsocover debt service obligations. Under the high growth scenario, gross flow would amount to 459%of debt service in FY2020, up from 165% in FY2001. Both gross and net flow as percentage offoreign exchange receipts would increase from 13% and 5% respectively, in FY2001, to 33% and28% in FY2020. The corresponding levels are lower under the low growth scenario but the patternis the same. These are of course anticipated flows. Much depends on the performance of theeconomy and Nepal’s capacity to negotiate the required amount of foreign financing at the mostfavorable terms possible.
20
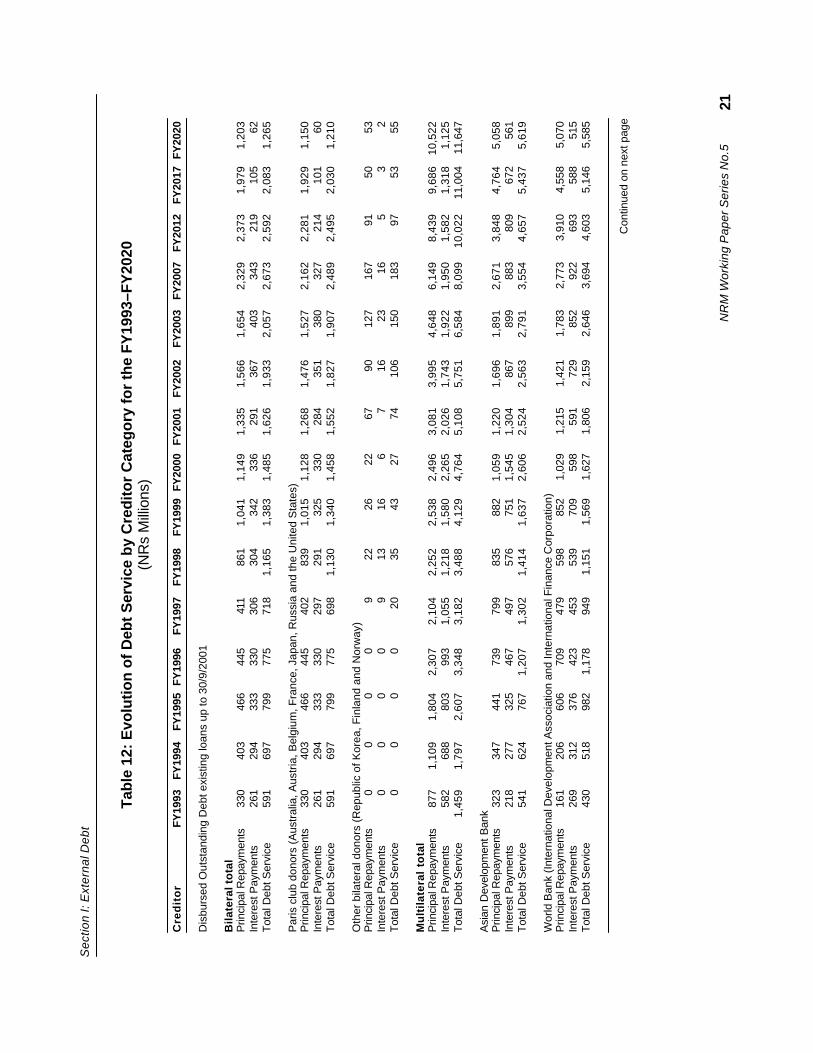
NR
M W
orki
ng P
aper
Ser
ies
No.
5
Sec
tion
I: E
xter
nal D
ebt
Tab
le 1
2: E
volu
tion
of
Deb
t S
ervi
ce b
y C
red
itor
Cat
ego
ry f
or
the
FY
1993
–FY
2020
(NR
s M
illio
ns)
Cre
dit
or
FY19
93FY
1994
FY19
95FY
1996
FY19
97FY
1998
FY19
99FY
2000
FY20
01FY
2002
FY20
03FY
2007
FY20
12FY
2017
FY20
20
Dis
burs
ed O
utst
andi
ng D
ebt e
xist
ing
loan
s up
to 3
0/9/
2001
Bila
tera
l to
tal
Prin
cipa
l Rep
aym
ents
330
403
466
445
411
861
1,
041
1,
149
1,
335
1,
566
1,
654
2
,329
2
,373
1
,979
1
,203
Inte
rest
Pay
men
ts
26
1
29
4
33
3
33
0
30
6
30
4
34
2
33
6
29
1
36
7
40
3
3
43
2
19
1
05
62T
otal
Deb
t Ser
vice
591
697
799
775
718
1,
165
1,
383
1,
485
1,
626
1,
933
2,
057
2
,673
2
,592
2
,083
1
,265
Par
is c
lub
dono
rs (
Aus
tral
ia, A
ustr
ia, B
elgi
um, F
ranc
e, J
apan
, Rus
sia
and
the
Uni
ted
Sta
tes)
Prin
cipa
l Rep
aym
ents
330
403
466
445
402
839
1,
015
1,
128
1,
268
1,
476
1,
527
2
,162
2
,281
1
,929
1
,150
Inte
rest
Pay
men
ts
26
1
29
4
33
3
33
0
29
7
29
1
32
5
33
0
28
4
35
1
38
0
3
27
2
14
1
01
60T
otal
Deb
t Ser
vice
591
697
799
775
698
1,
130
1,
340
1,
458
1,
552
1,
827
1,
907
2
,489
2
,495
2
,030
1
,210
Oth
er b
ilate
ral d
onor
s (R
epub
lic o
f Kor
ea, F
inla
nd a
nd N
orw
ay)
Prin
cipa
l Rep
aym
ents
00
00
922
2622
6790
127
167
9150
53In
tere
st P
aym
ents
00
00
913
166
716
2316
53
2T
otal
Deb
t Ser
vice
00
00
2035
4327
7410
615
018
397
5355
Mu
ltil
ater
al t
ota
lP
rinci
pal R
epay
men
ts
87
7
1,10
9
1,80
4
2,30
7
2,10
4
2,25
2
2,53
8
2,49
6
3,08
1
3,99
5
4,64
8
6,1
49
8,4
39
9,6
86 1
0,52
2In
tere
st P
aym
ents
582
688
803
993
1,
055
1,
218
1,
580
2,
265
2,
026
1,
743
1,
922
1
,950
1
,582
1
,318
1
,125
Tot
al D
ebt S
ervi
ce
1,45
9
1,79
7
2,60
7
3,34
8
3,18
2
3,48
8
4,12
9
4,76
4
5,10
8
5,75
1
6,58
4
8,0
99 1
0,02
2 1
1,00
4 1
1,64
7
Asi
an D
evel
opm
ent B
ank
Prin
cipa
l Rep
aym
ents
323
347
441
739
799
835
882
1,
059
1,
220
1,
696
1,
891
2
,671
3
,848
4
,764
5
,058
Inte
rest
Pay
men
ts
21
8
27
7
32
5
46
7
49
7
57
6
75
1
1,54
5
1,30
4
86
7
89
9
8
83
8
09
6
72
5
61T
otal
Deb
t Ser
vice
541
624
767
1,
207
1,
302
1,
414
1,
637
2,
606
2,
524
2,
563
2,
791
3
,554
4
,657
5
,437
5
,619
Wor
ld B
ank
(Int
erna
tiona
l Dev
elop
men
t Ass
ocia
tion
and
Inte
rnat
iona
l Fin
ance
Cor
pora
tion)
Prin
cipa
l Rep
aym
ents
161
206
606
709
479
598
852
1,02
91,
215
1,42
11,
783
2,77
33,
910
4,55
85,
070
Inte
rest
Pay
men
ts26
931
237
642
345
353
970
959
859
172
985
292
269
358
851
5T
otal
Deb
t Ser
vice
430
518
982
1,17
894
91,
151
1,56
91,
627
1,80
62,
159
2,64
63,
694
4,60
35,
146
5,58
5
Con
tinue
d on
nex
t pag
e
21
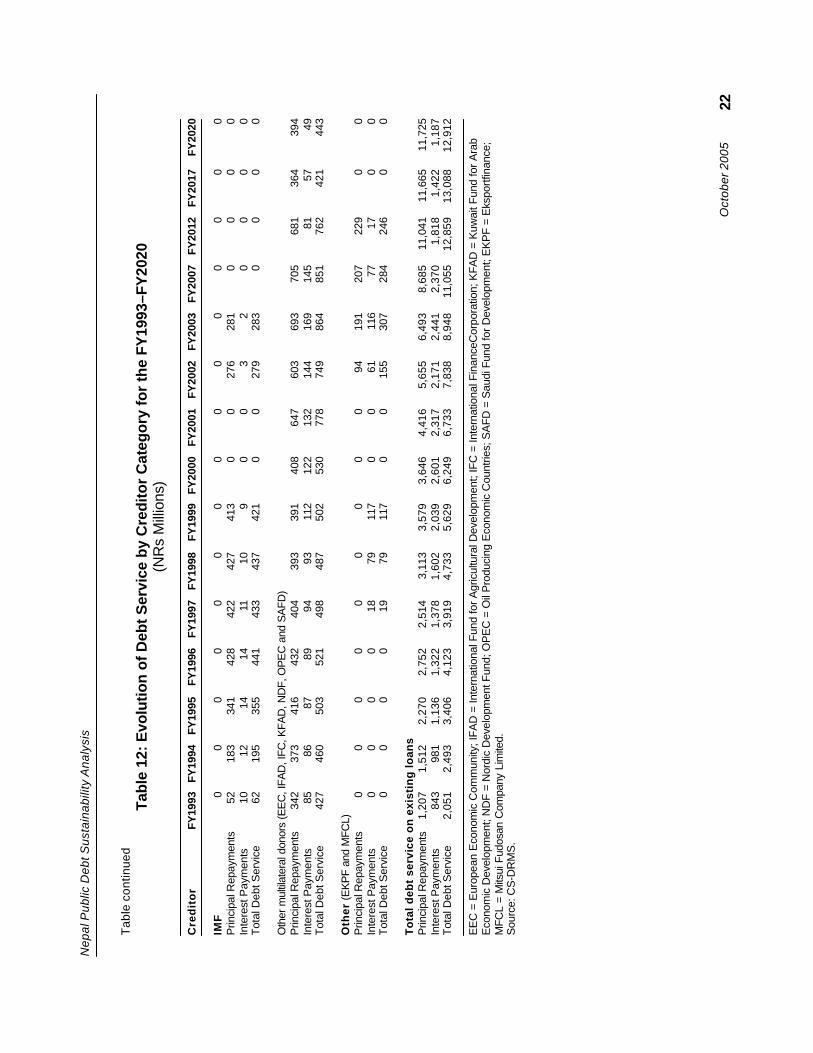
Oct
ober
200
5
Nep
al P
ublic
Deb
t Sus
tain
abili
ty A
naly
sis
Tab
le c
ontin
ued
Tab
le 1
2: E
volu
tion
of
Deb
t S
ervi
ce b
y C
red
itor
Cat
ego
ry f
or
the
FY
1993
–FY
2020
(NR
s M
illio
ns)
Cre
dit
or
FY19
93FY
1994
FY19
95FY
1996
FY19
97FY
1998
FY19
99FY
2000
FY20
01FY
2002
FY20
03FY
2007
FY20
12FY
2017
FY20
20
IMF
00
00
00
00
00
00
00
0P
rinci
pal R
epay
men
ts52
183
341
428
422
427
413
00
276
281
00
00
Inte
rest
Pay
men
ts10
1214
1411
109
00
32
00
00
Tot
al D
ebt S
ervi
ce62
195
355
441
433
437
421
00
279
283
00
00
Oth
er m
ultil
ater
al d
onor
s (E
EC
, IFA
D, I
FC, K
FAD
, ND
F, O
PE
C a
nd S
AFD
)P
rinci
pal R
epay
men
ts34
237
341
643
240
439
339
140
864
760
369
370
568
136
439
4In
tere
st P
aym
ents
8586
8789
9493
112
122
132
144
169
145
8157
49T
otal
Deb
t Ser
vice
427
460
503
521
498
487
502
530
778
749
864
851
762
421
443
Oth
er (E
KP
F an
d M
FCL)
Prin
cipa
l Rep
aym
ents
00
00
00
00
094
191
207
229
00
Inte
rest
Pay
men
ts0
00
018
7911
70
061
116
7717
00
Tot
al D
ebt S
ervi
ce0
00
019
7911
70
015
530
728
424
60
0
To
tal
deb
t se
rvic
e o
n e
xist
ing
lo
ans
Prin
cipa
l Rep
aym
ents
1,
207
1,
512
2,
270
2,
752
2,
514
3,
113
3,
579
3,
646
4,
416
5,
655
6,
493
8
,685
11,
041
11,
665
11,
725
Inte
rest
Pay
men
ts
84
3
98
1
1,13
6
1,32
2
1,37
8
1,60
2
2,03
9
2,60
1
2,31
7
2,17
1
2,44
1
2,3
70
1,8
18
1,4
22
1,1
87T
otal
Deb
t Ser
vice
2,
051
2,
493
3,
406
4,
123
3,
919
4,
733
5,
629
6,
249
6,
733
7,
838
8,
948
11,
055
12,
859
13,
088
12,
912
EE
C =
Eur
opea
n E
cono
mic
Com
mun
ity; I
FAD
= In
tern
atio
nal F
und
for A
gric
ultu
ral D
evel
opm
ent;
IFC
= In
tern
atio
nal F
inan
ceC
orpo
ratio
n; K
FAD
= K
uwai
t Fun
d fo
r Ara
bE
cono
mic
Dev
elop
men
t; N
DF
= N
ordi
c D
evel
opm
ent F
und;
OP
EC
= O
il P
rodu
cing
Eco
nom
ic C
ount
ries;
SA
FD =
Sau
di F
und
for D
evel
opm
ent;
EK
PF
= E
kspo
rtfin
ance
;M
FCL
= M
itsui
Fud
osan
Com
pany
Lim
ited.
Sou
rce:
CS
-DR
MS
.
22
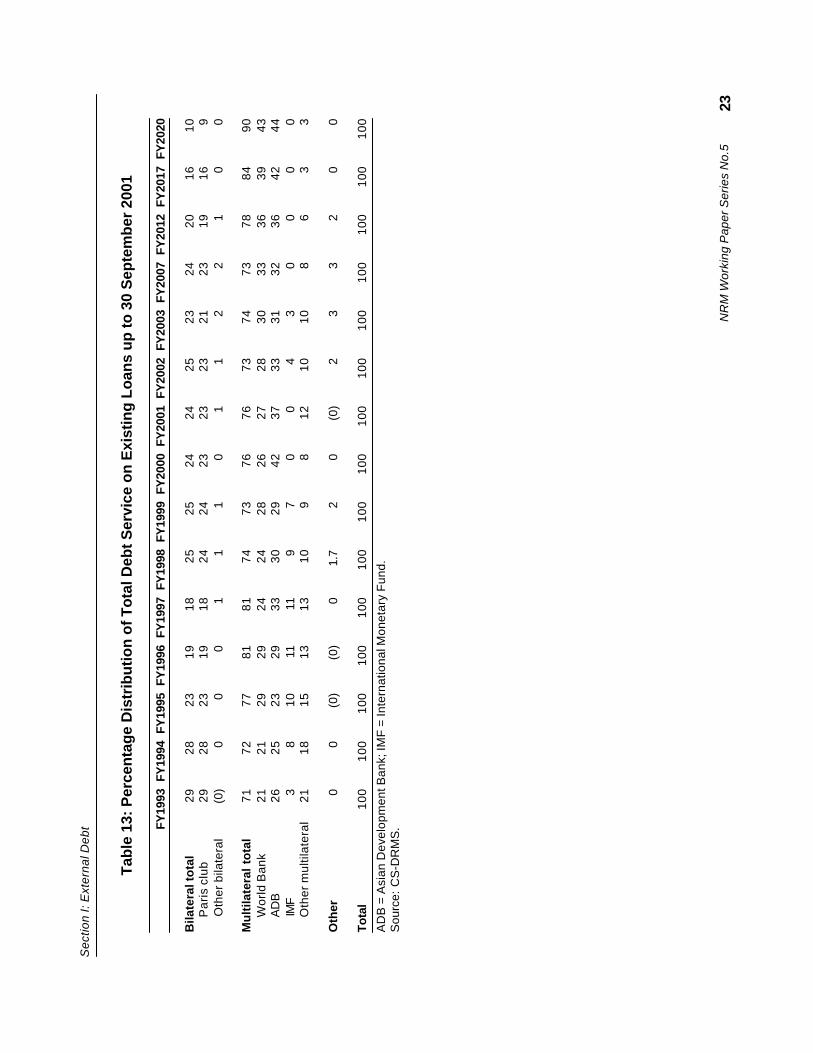
NR
M W
orki
ng P
aper
Ser
ies
No.
5
Sec
tion
I: E
xter
nal D
ebt
Tab
le 1
3: P
erce
nta
ge
Dis
trib
uti
on
of T
ota
l Deb
t Ser
vice
on
Exi
stin
g L
oan
s u
p to
30
Sep
tem
ber
200
1
FY
1993
FY19
94FY
1995
FY19
96FY
1997
FY19
98FY
1999
FY20
00FY
2001
FY20
02FY
2003
FY20
07FY
2012
FY20
17FY
2020
Bila
tera
l to
tal
2928
2319
1825
2524
2425
2324
2016
10
Par
is c
lub
2928
2319
1824
2423
2323
2123
1916
9
Oth
er b
ilate
ral
(0)
00
01
11
01
12
21
00
Mu
ltila
tera
l to
tal
7172
7781
8174
7376
7673
7473
7884
90
Wor
ld B
ank
2121
2929
2424
2826
2728
3033
3639
43
AD
B26
2523
2933
3029
4237
3331
3236
4244
I
MF
38
1011
119
70
04
30
00
0
Oth
er m
ultil
ater
al21
1815
1313
109
812
1010
86
33
Oth
er0
0(0
)(0
)0
1.7
20
(0)
23
32
00
Tota
l10
010
010
010
010
010
010
010
010
010
010
010
010
010
010
0
AD
B =
Asi
an D
evel
opm
ent B
ank;
IMF
= In
tern
atio
nal M
onet
ary
Fun
d.S
ourc
e: C
S-D
RM
S.
23
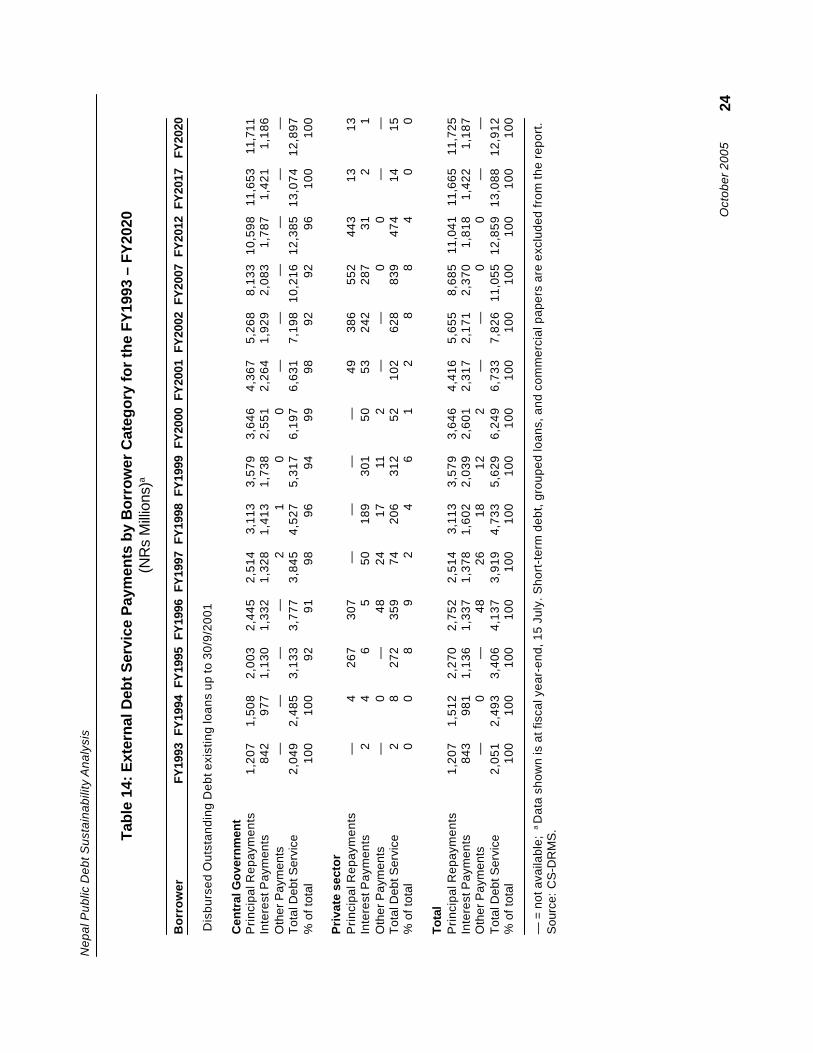
Oct
ober
200
5
Nep
al P
ublic
Deb
t Sus
tain
abili
ty A
naly
sis
Tabl
e 14
: Ext
erna
l Deb
t Ser
vice
Pay
men
ts b
y B
orro
wer
Cat
egor
y fo
r th
e FY
1993
– F
Y20
20(N
Rs
Mill
ions
)a
Bo
rro
wer
FY19
93FY
1994
FY19
95FY
1996
FY19
97FY
1998
FY19
99FY
2000
FY20
01FY
2002
FY20
07FY
2012
FY20
17FY
2020
Dis
burs
ed O
utst
andi
ng D
ebt e
xist
ing
loan
s up
to 3
0/9/
2001
Cen
tral
Go
vern
men
tP
rinci
pal R
epay
men
ts
1,20
7
1,50
8
2,00
3
2,44
5
2,51
4
3,11
3
3,57
9
3,64
6
4,3
67
5,2
68
8,13
3 1
0,59
8 1
1,65
3 1
1,71
1In
tere
st P
aym
ents
8
42
977
1,
130
1,
332
1,
328
1,
413
1,
738
2,
551
2
,264
1
,929
2,
083
1,
787
1,
421
1,
186
Oth
er P
aym
ents
—
—
—
—
2
1
0
0
—
—
—
—
—
—
Tot
al D
ebt S
ervi
ce
2,04
9
2,48
5
3,13
3
3,77
7
3,84
5
4,52
7
5,31
7
6,19
7
6,6
31
7,1
98 1
0,21
6 1
2,38
5 1
3,07
4 1
2,89
7%
of t
otal
1
00
100
92
91
98
96
94
99
98
92
92
96
100
100
Pri
vate
sec
tor
Prin
cipa
l Rep
aym
ents
—
4
267
3
07
—
—
—
—
4
9
38
6
55
2
44
3
1
3
1
3In
tere
st P
aym
ents
2
4
6
5
50
1
89
301
50
53
242
287
31
2
1
Oth
er P
aym
ents
—
0
—
48
24
17
11
2
—
—
0
0
—
—
Tot
al D
ebt S
ervi
ce
2
8
272
3
59
7
4
206
3
12
5
2
10
2
62
8
83
9
47
4
1
4
1
5%
of t
otal
0
0
8
9
2
4
6
1
2
8
8
4
0
0
Tota
lP
rinci
pal R
epay
men
ts
1,20
7
1,51
2
2,27
0
2,75
2
2,51
4
3,11
3
3,57
9
3,64
6
4,4
16
5,6
55
8,68
5 1
1,04
1 1
1,66
5 1
1,72
5In
tere
st P
aym
ents
8
43
981
1,
136
1,
337
1,
378
1,
602
2,
039
2,
601
2
,317
2
,171
2,
370
1,
818
1,
422
1,
187
Oth
er P
aym
ents
—
0
—
48
26
18
12
2
—
—
0
0
—
—
Tot
al D
ebt S
ervi
ce
2,05
1
2,49
3
3,40
6
4,13
7
3,91
9
4,73
3
5,62
9
6,24
9
6,7
33
7,8
26 1
1,05
5 1
2,85
9 1
3,08
8 1
2,91
2%
of t
otal
1
00
100
1
00
100
1
00
100
1
00
100
100
100
100
100
100
100
— =
not
ava
ilabl
e; a
Dat
a sh
own
is a
t fis
cal y
ear-
end,
15
July
. Sho
rt-t
erm
deb
t, gr
oupe
d lo
ans,
and
com
mer
cial
pap
ers
are
excl
uded
from
the
repo
rt.
Sou
rce:
CS
-DR
MS
.
24
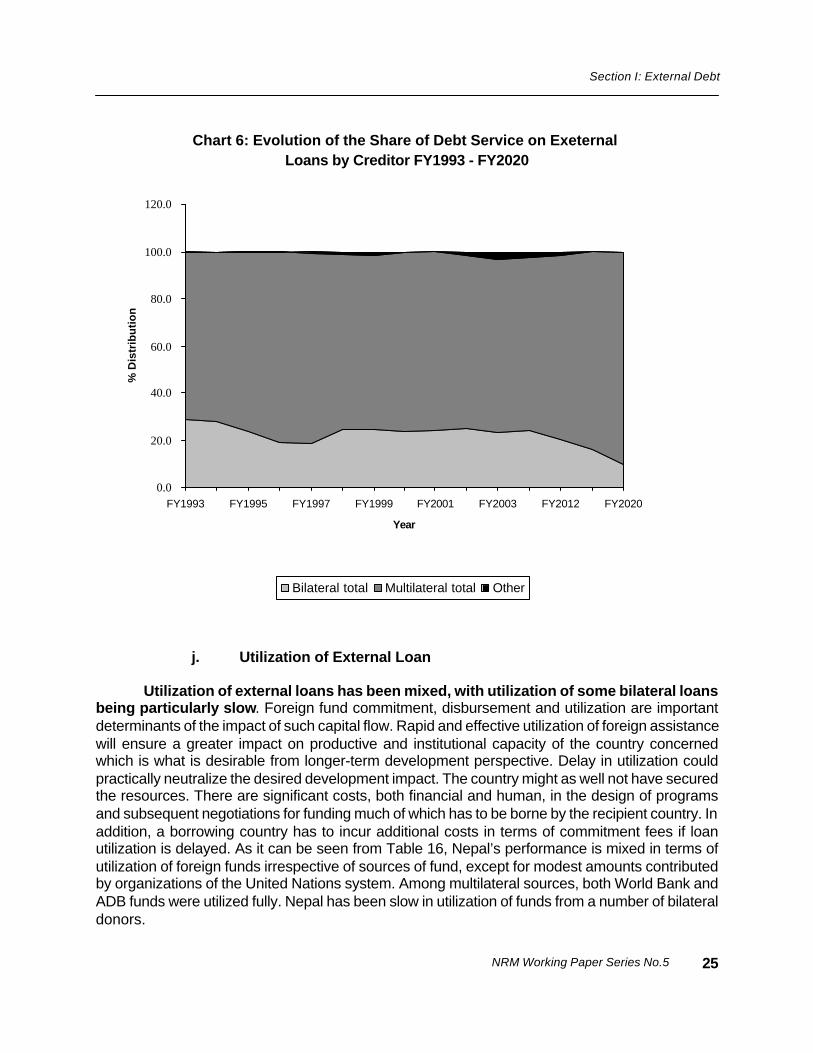
NRM Working Paper Series No.5
Section I: External Debt
Chart 6: Evolution of the Share of Debt Service on Exeternal Loans by Creditor FY1993 - FY2020
0.0
20.0
40.0
60.0
80.0
100.0
120.0
FY1993 FY1995 FY1997 FY1999 FY2001 FY2003 FY2012 FY2020
Year
% D
istr
ibu
tio
n
Bilateral total Multilateral total Other
j. Utilization of External Loan
Utilization of external loans has been mixed, with utilization of some bilateral loansbeing particularly slow. Foreign fund commitment, disbursement and utilization are importantdeterminants of the impact of such capital flow. Rapid and effective utilization of foreign assistancewill ensure a greater impact on productive and institutional capacity of the country concernedwhich is what is desirable from longer-term development perspective. Delay in utilization couldpractically neutralize the desired development impact. The country might as well not have securedthe resources. There are significant costs, both financial and human, in the design of programsand subsequent negotiations for funding much of which has to be borne by the recipient country. Inaddition, a borrowing country has to incur additional costs in terms of commitment fees if loanutilization is delayed. As it can be seen from Table 16, Nepal’s performance is mixed in terms ofutilization of foreign funds irrespective of sources of fund, except for modest amounts contributedby organizations of the United Nations system. Among multilateral sources, both World Bank andADB funds were utilized fully. Nepal has been slow in utilization of funds from a number of bilateraldonors.
25
October 2005
Nepal Public Debt Sustainability Analysis
k. NPV of External Debt
Multilateral lenders account for the bulk of NPV external debt. NPV of external debtwas estimated at NRs78,233 million ($1,029 million) in as at 30/9/2001 (Table 17). Multilateralinstitutions accounted for 77%, bilateral 22%, and the balance, other sources and short-term debt.Among multilateral donors, ADB was the most important with a 33% share of the total NPV externaldebt followed by the World Bank with 29%. In nominal terms however, the share of the World Bank(42%) exceeds that of ADB (38%). The role reversal in NPV terms is due to ADB emerging as thedominant player in recent years in terms of lending to Nepal. The World Bank has very limitedportfolio in the pipeline. Traditionally, a wide rage of bilateral donors have been very active in Nepaland these continue to be so. Paris Club creditors contributed 13% to total lending to Nepal innominal terms and 18% in NPV terms, which is also linked to a reduced role of the World Bank.The role of IMF as a lender had been rather modest. Short-term borrowing too has been modest atbest.
26
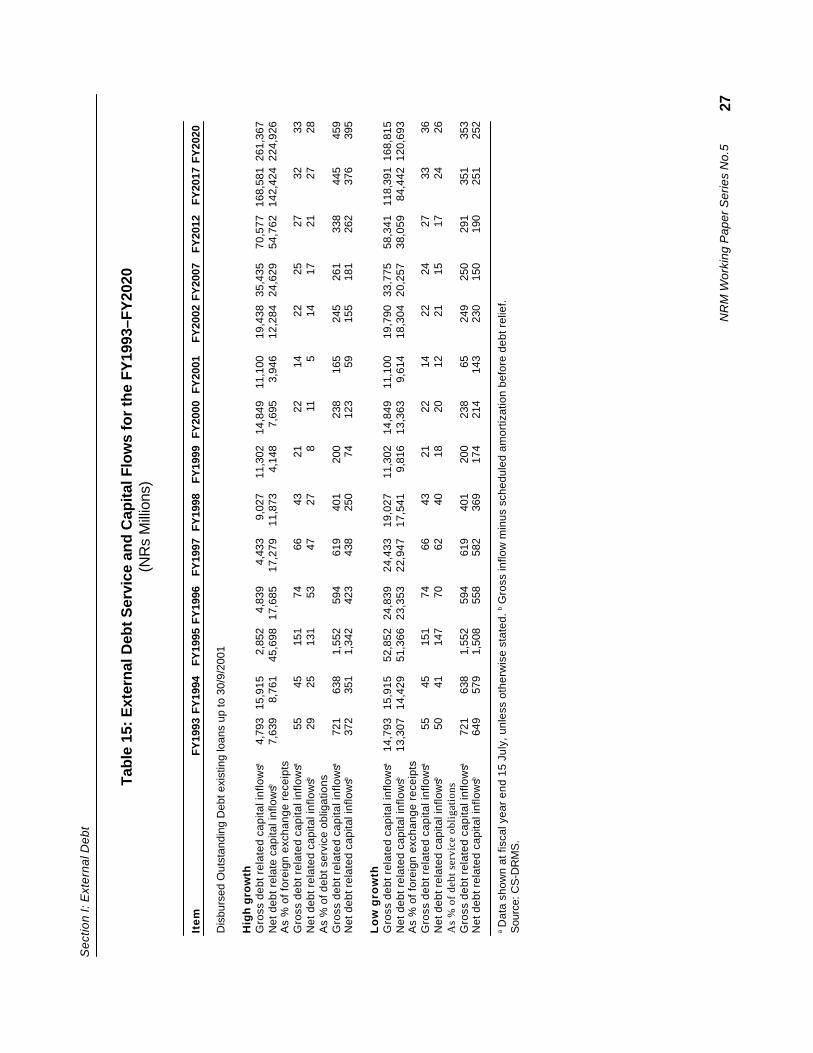
NR
M W
orki
ng P
aper
Ser
ies
No.
5
Sec
tion
I: E
xter
nal D
ebt
Tab
le 1
5: E
xter
nal
Deb
t Ser
vice
an
d C
apita
l Flo
ws
for
the
FY
1993
–FY
2020
(NR
s M
illio
ns)
Ite
mFY
1993
FY19
94FY
1995
FY19
96FY
1997
FY19
98FY
1999
FY20
00FY
2001
FY20
02FY
2007
FY20
12FY
2017
FY20
20
Dis
burs
ed O
utst
andi
ng D
ebt e
xist
ing
loan
s up
to 3
0/9/
2001
Hig
h g
row
thG
ross
deb
t rel
ated
cap
ital i
nflo
wsa
4,79
315
,915
2,85
24,
839
4,43
39,
027
11,3
0214
,849
11,1
0019
,438
35,4
3570
,577
168,
581
261,
367
Net
deb
t rel
ate
capi
tal i
nflo
wsb
7,
639
8,76
145
,698
17,6
8517
,279
11,8
734,
148
7,69
53,
946
12,2
8424
,629
54,7
6214
2,42
422
4,92
6A
s %
of f
orei
gn e
xcha
nge
rece
ipts
Gro
ss d
ebt r
elat
ed c
apita
l inf
low
sa55
4515
174
6643
2122
1422
2527
3233
Net
deb
t rel
ated
cap
ital i
nflo
wsb
2925
131
5347
278
115
1417
2127
28A
s %
of d
ebt s
ervi
ce o
blig
atio
nsG
ross
deb
t rel
ated
cap
ital i
nflo
wsa
721
638
1,55
259
461
940
120
023
816
524
526
133
844
545
9N
et d
ebt r
elat
ed c
apita
l inf
low
sb37
235
11,
342
423
438
250
7412
359
155
181
262
376
395
Lo
w g
row
thG
ross
deb
t rel
ated
cap
ital i
nflo
wsa
14,7
9315
,915
52,8
5224
,839
24,4
3319
,027
11,3
0214
,849
11,1
0019
,790
33,7
7558
,341
118,
391
168,
815
Net
deb
t rel
ated
cap
ital i
nflo
wsb
13,3
0714
,429
51,3
6623
,353
22,9
4717
,541
9,81
613
,363
9,61
418
,304
20,2
5738
,059
84,4
4212
0,69
3A
s %
of f
orei
gn e
xcha
nge
rece
ipts
Gro
ss d
ebt r
elat
ed c
apita
l inf
low
sa55
4515
174
6643
2122
1422
2427
3336
Net
deb
t rel
ated
cap
ital i
nflo
wsb
5041
147
7062
4018
2012
2115
1724
26A
s %
of
debt
ser
vice
obl
igat
ions
Gro
ss d
ebt r
elat
ed c
apita
l inf
low
sa72
163
81,
552
594
619
401
200
238
6524
925
029
135
135
3N
et d
ebt r
elat
ed c
apita
l inf
low
sb64
957
91,
508
558
582
369
174
214
143
230
150
190
251
252
a Dat
a sh
own
at fi
scal
yea
r en
d 15
Jul
y, u
nles
s ot
herw
ise
stat
ed. b G
ross
inflo
w m
inus
sch
edul
ed a
mor
tizat
ion
befo
re d
ebt r
elie
f.S
ourc
e: C
S-D
RM
S.
27
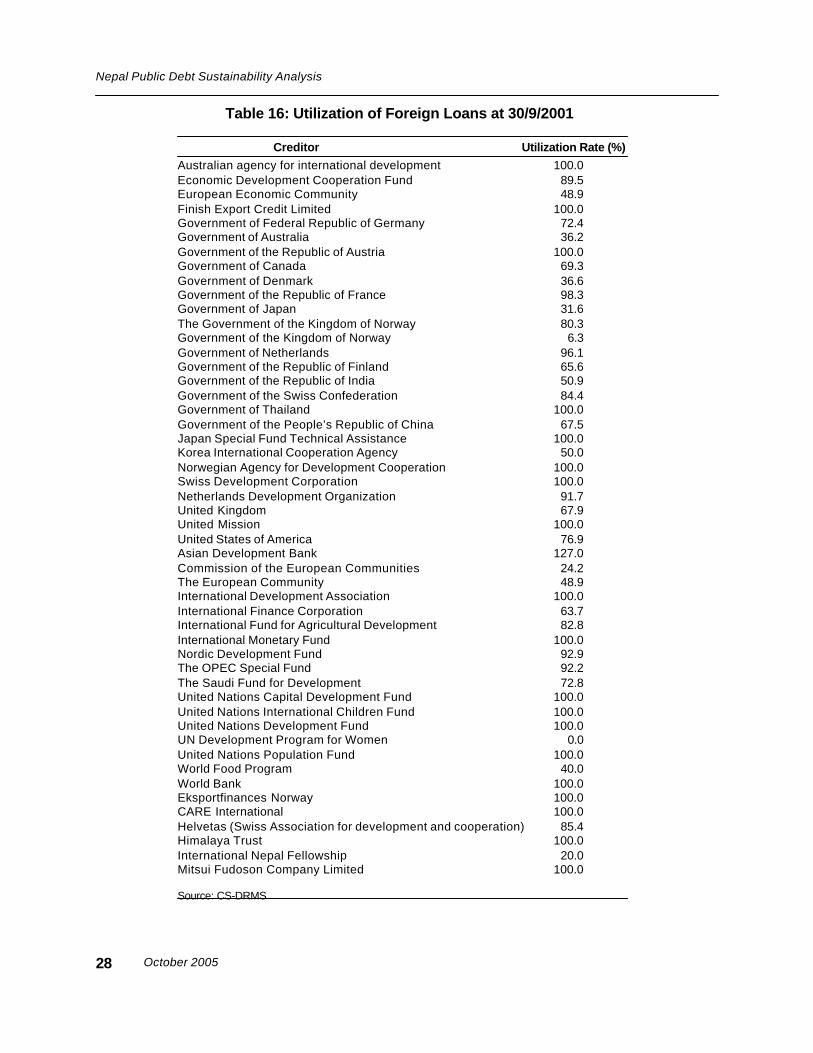
October 2005
Nepal Public Debt Sustainability Analysis
Table 16: Utilization of Foreign Loans at 30/9/2001
Creditor Utilization Rate (%)Australian agency for international development 100.0Economic Development Cooperation Fund 89.5European Economic Community 48.9Finish Export Credit Limited 100.0Government of Federal Republic of Germany 72.4Government of Australia 36.2Government of the Republic of Austria 100.0Government of Canada 69.3Government of Denmark 36.6Government of the Republic of France 98.3Government of Japan 31.6The Government of the Kingdom of Norway 80.3Government of the Kingdom of Norway 6.3Government of Netherlands 96.1Government of the Republic of Finland 65.6Government of the Republic of India 50.9Government of the Swiss Confederation 84.4Government of Thailand 100.0Government of the People’s Republic of China 67.5Japan Special Fund Technical Assistance 100.0Korea International Cooperation Agency 50.0Norwegian Agency for Development Cooperation 100.0Swiss Development Corporation 100.0Netherlands Development Organization 91.7United Kingdom 67.9United Mission 100.0United States of America 76.9Asian Development Bank 127.0Commission of the European Communities 24.2The European Community 48.9International Development Association 100.0International Finance Corporation 63.7International Fund for Agricultural Development 82.8International Monetary Fund 100.0Nordic Development Fund 92.9The OPEC Special Fund 92.2The Saudi Fund for Development 72.8United Nations Capital Development Fund 100.0United Nations International Children Fund 100.0United Nations Development Fund 100.0UN Development Program for Women 0.0United Nations Population Fund 100.0World Food Program 40.0World Bank 100.0Eksportfinances Norway 100.0CARE International 100.0Helvetas (Swiss Association for development and cooperation) 85.4Himalaya Trust 100.0International Nepal Fellowship 20.0Mitsui Fudoson Company Limited 100.0
Source: CS-DRMS
28
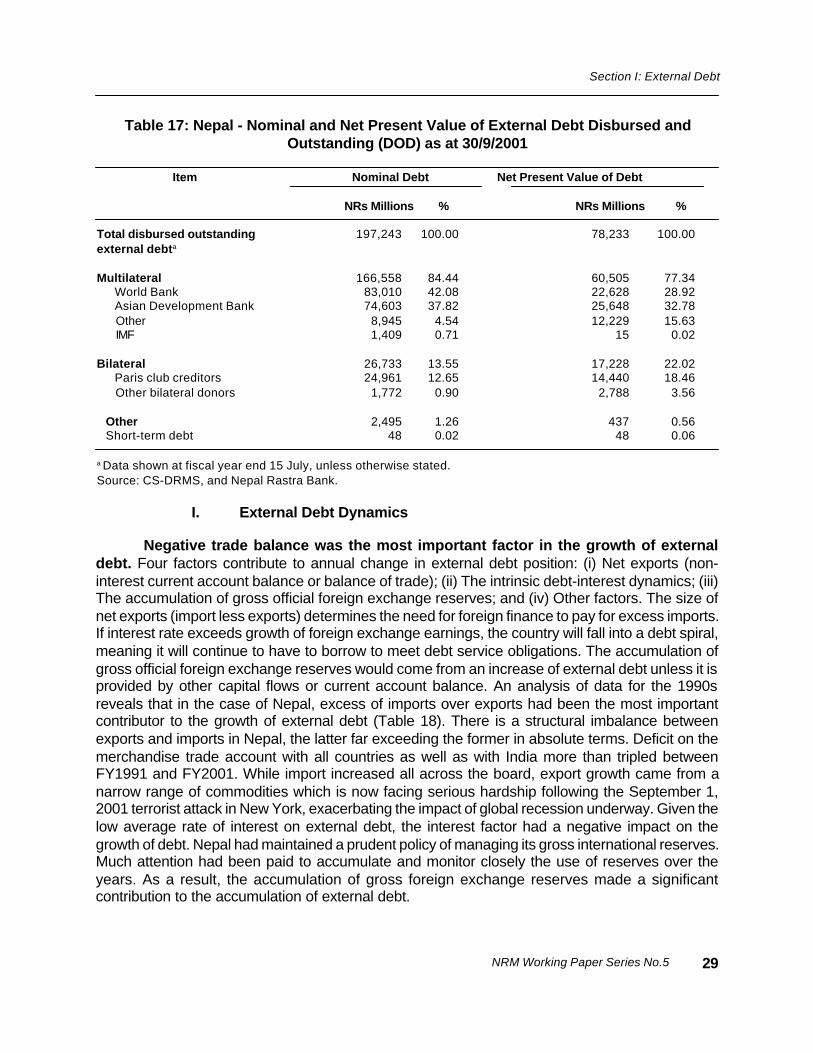
NRM Working Paper Series No.5
Section I: External Debt
Table 17: Nepal - Nominal and Net Present Value of External Debt Disbursed andOutstanding (DOD) as at 30/9/2001
Item Nominal Debt Net Present Value of Debt
NRs Millions % NRs Millions %
Total disbursed outstanding 197,243 100.00 78,233 100.00external debta
Multilateral 166,558 84.44 60,505 77.34 World Bank 83,010 42.08 22,628 28.92 Asian Development Bank 74,603 37.82 25,648 32.78 Other 8,945 4.54 12,229 15.63 IMF 1,409 0.71 15 0.02
Bilateral 26,733 13.55 17,228 22.02 Paris club creditors 24,961 12.65 14,440 18.46 Other bilateral donors 1,772 0.90 2,788 3.56
Other 2,495 1.26 437 0.56 Short-term debt 48 0.02 48 0.06
a Data shown at fiscal year end 15 July, unless otherwise stated.Source: CS-DRMS, and Nepal Rastra Bank.
I. External Debt Dynamics
Negative trade balance was the most important factor in the growth of externaldebt. Four factors contribute to annual change in external debt position: (i) Net exports (non-interest current account balance or balance of trade); (ii) The intrinsic debt-interest dynamics; (iii)The accumulation of gross official foreign exchange reserves; and (iv) Other factors. The size ofnet exports (import less exports) determines the need for foreign finance to pay for excess imports.If interest rate exceeds growth of foreign exchange earnings, the country will fall into a debt spiral,meaning it will continue to have to borrow to meet debt service obligations. The accumulation ofgross official foreign exchange reserves would come from an increase of external debt unless it isprovided by other capital flows or current account balance. An analysis of data for the 1990sreveals that in the case of Nepal, excess of imports over exports had been the most importantcontributor to the growth of external debt (Table 18). There is a structural imbalance betweenexports and imports in Nepal, the latter far exceeding the former in absolute terms. Deficit on themerchandise trade account with all countries as well as with India more than tripled betweenFY1991 and FY2001. While import increased all across the board, export growth came from anarrow range of commodities which is now facing serious hardship following the September 1,2001 terrorist attack in New York, exacerbating the impact of global recession underway. Given thelow average rate of interest on external debt, the interest factor had a negative impact on thegrowth of debt. Nepal had maintained a prudent policy of managing its gross international reserves.Much attention had been paid to accumulate and monitor closely the use of reserves over theyears. As a result, the accumulation of gross foreign exchange reserves made a significantcontribution to the accumulation of external debt.
29
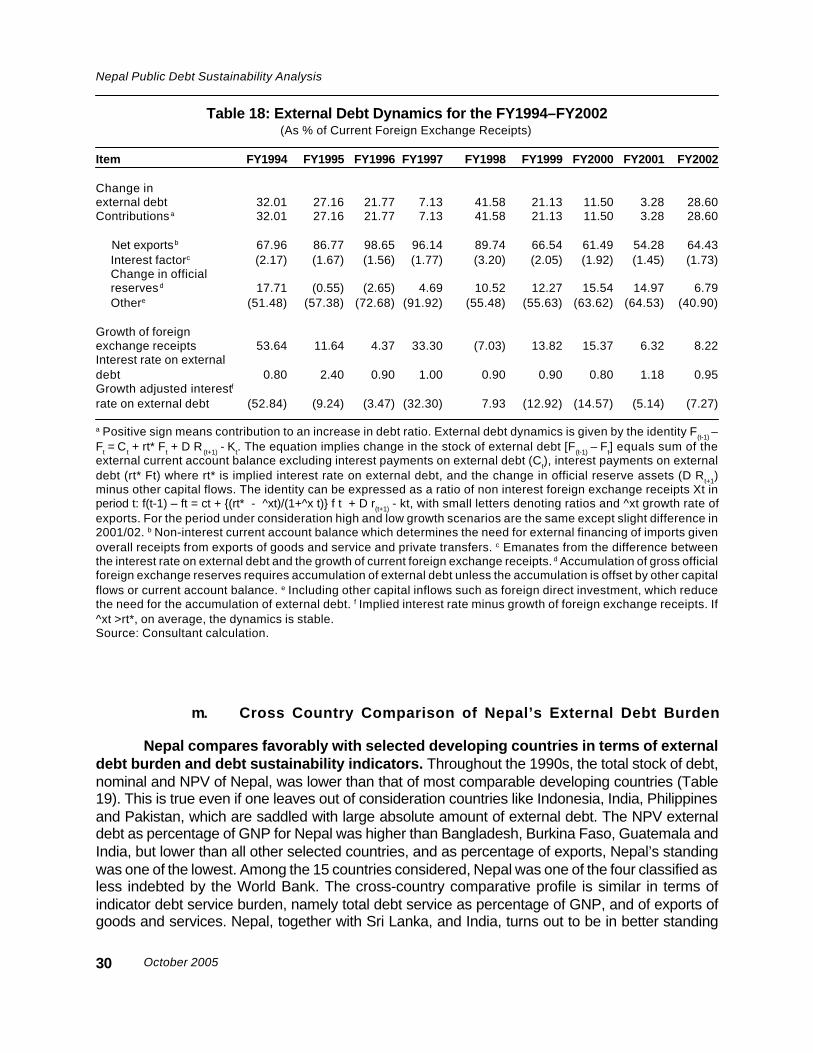
October 2005
Nepal Public Debt Sustainability Analysis
Table 18: External Debt Dynamics for the FY1994–FY2002(As % of Current Foreign Exchange Receipts)
Item FY1994 FY1995 FY1996 FY1997 FY1998 FY1999 FY2000 FY2001 FY2002
Change inexternal debt 32.01 27.16 21.77 7.13 41.58 21.13 11.50 3.28 28.60Contributions a 32.01 27.16 21.77 7.13 41.58 21.13 11.50 3.28 28.60
Net exportsb 67.96 86.77 98.65 96.14 89.74 66.54 61.49 54.28 64.43 Interest factorc (2.17) (1.67) (1.56) (1.77) (3.20) (2.05) (1.92) (1.45) (1.73) Change in official reserves d 17.71 (0.55) (2.65) 4.69 10.52 12.27 15.54 14.97 6.79 Othere (51.48) (57.38) (72.68) (91.92) (55.48) (55.63) (63.62) (64.53) (40.90)
Growth of foreignexchange receipts 53.64 11.64 4.37 33.30 (7.03) 13.82 15.37 6.32 8.22Interest rate on externaldebt 0.80 2.40 0.90 1.00 0.90 0.90 0.80 1.18 0.95Growth adjusted interestf
rate on external debt (52.84) (9.24) (3.47) (32.30) 7.93 (12.92) (14.57) (5.14) (7.27)
a Positive sign means contribution to an increase in debt ratio. External debt dynamics is given by the identity F(t-1) –Ft = C t + rt* Ft + D R (t+1) - Kt. The equation implies change in the stock of external debt [F(t-1) – Ft] equals sum of theexternal current account balance excluding interest payments on external debt (Ct), interest payments on externaldebt (rt* Ft) where rt* is implied interest rate on external debt, and the change in official reserve assets (D Rt+1)minus other capital flows. The identity can be expressed as a ratio of non interest foreign exchange receipts Xt inperiod t: f(t-1) – ft = ct + {(rt* - ^xt)/(1+^x t)} f t + D r(t+1) - kt, with small letters denoting ratios and ^xt growth rate ofexports. For the period under consideration high and low growth scenarios are the same except slight difference in2001/02. b Non-interest current account balance which determines the need for external financing of imports givenoverall receipts from exports of goods and service and private transfers. c Emanates from the difference betweenthe interest rate on external debt and the growth of current foreign exchange receipts. d Accumulation of gross officialforeign exchange reserves requires accumulation of external debt unless the accumulation is offset by other capitalflows or current account balance. e Including other capital inflows such as foreign direct investment, which reducethe need for the accumulation of external debt. f Implied interest rate minus growth of foreign exchange receipts. If^xt >rt*, on average, the dynamics is stable.Source: Consultant calculation.
m. Cross Country Comparison of Nepal’s External Debt Burden
Nepal compares favorably with selected developing countries in terms of externaldebt burden and debt sustainability indicators. Throughout the 1990s, the total stock of debt,nominal and NPV of Nepal, was lower than that of most comparable developing countries (Table19). This is true even if one leaves out of consideration countries like Indonesia, India, Philippinesand Pakistan, which are saddled with large absolute amount of external debt. The NPV externaldebt as percentage of GNP for Nepal was higher than Bangladesh, Burkina Faso, Guatemala andIndia, but lower than all other selected countries, and as percentage of exports, Nepal’s standingwas one of the lowest. Among the 15 countries considered, Nepal was one of the four classified asless indebted by the World Bank. The cross-country comparative profile is similar in terms ofindicator debt service burden, namely total debt service as percentage of GNP, and of exports ofgoods and services. Nepal, together with Sri Lanka, and India, turns out to be in better standing
30
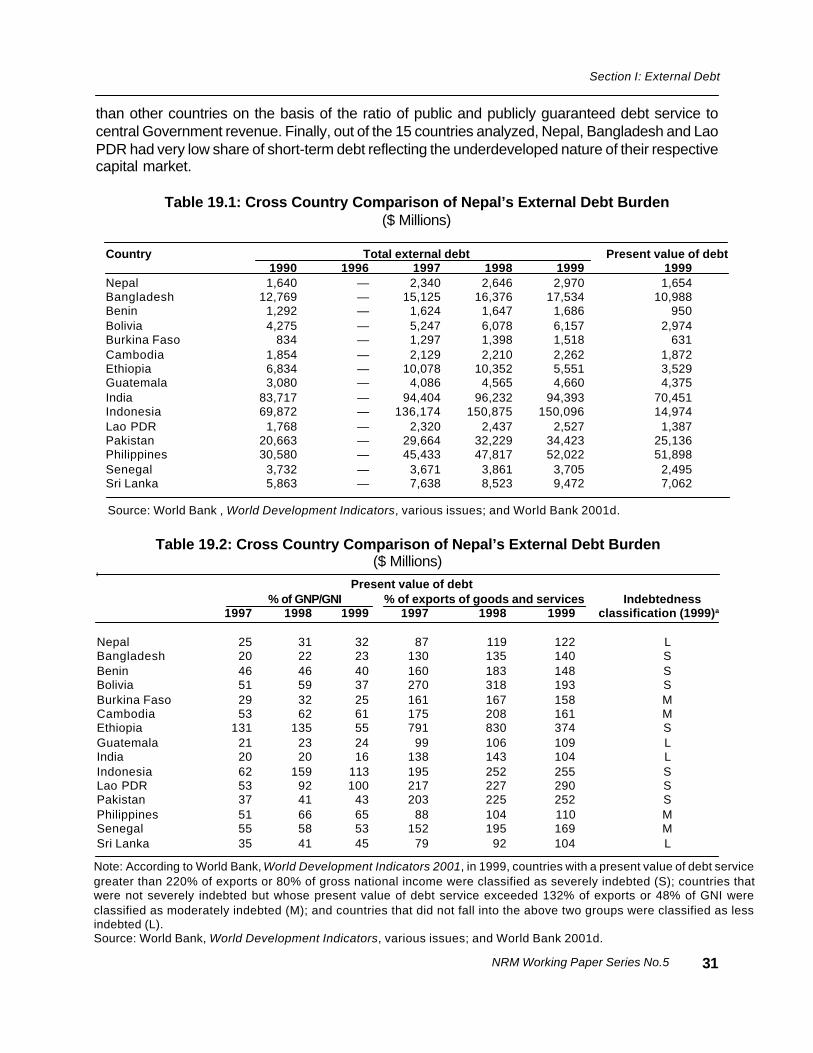
NRM Working Paper Series No.5
Section I: External Debt
than other countries on the basis of the ratio of public and publicly guaranteed debt service tocentral Government revenue. Finally, out of the 15 countries analyzed, Nepal, Bangladesh and LaoPDR had very low share of short-term debt reflecting the underdeveloped nature of their respectivecapital market.
Source: World Bank , World Development Indicators, various issues; and World Bank 2001d.
Note: According to World Bank, World Development Indicators 2001, in 1999, countries with a present value of debt servicegreater than 220% of exports or 80% of gross national income were classified as severely indebted (S); countries thatwere not severely indebted but whose present value of debt service exceeded 132% of exports or 48% of GNI wereclassified as moderately indebted (M); and countries that did not fall into the above two groups were classified as lessindebted (L).Source: World Bank, World Development Indicators, various issues; and World Bank 2001d.
Table 19.2: Cross Country Comparison of Nepal’s External Debt Burden($ Millions)
Present value of debt % of GNP/GNI % of exports of goods and services Indebtedness
1997 1998 1999 1997 1998 1999 classification (1999)a
Nepal 25 31 32 87 119 122 LBangladesh 20 22 23 130 135 140 SBenin 46 46 40 160 183 148 SBolivia 51 59 37 270 318 193 SBurkina Faso 29 32 25 161 167 158 MCambodia 53 62 61 175 208 161 MEthiopia 131 135 55 791 830 374 SGuatemala 21 23 24 99 106 109 LIndia 20 20 16 138 143 104 LIndonesia 62 159 113 195 252 255 SLao PDR 53 92 100 217 227 290 SPakistan 37 41 43 203 225 252 SPhilippines 51 66 65 88 104 110 MSenegal 55 58 53 152 195 169 MSri Lanka 35 41 45 79 92 104 L
31
Table 19.1: Cross Country Comparison of Nepal’s External Debt Burden($ Millions)
Country Total external debt Present value of debt 1990 1996 1997 1998 1999 1999Nepal 1,640 — 2,340 2,646 2,970 1,654Bangladesh 12,769 — 15,125 16,376 17,534 10,988Benin 1,292 — 1,624 1,647 1,686 950Bolivia 4,275 — 5,247 6,078 6,157 2,974Burkina Faso 834 — 1,297 1,398 1,518 631Cambodia 1,854 — 2,129 2,210 2,262 1,872Ethiopia 6,834 — 10,078 10,352 5,551 3,529Guatemala 3,080 — 4,086 4,565 4,660 4,375India 83,717 — 94,404 96,232 94,393 70,451Indonesia 69,872 — 136,174 150,875 150,096 14,974Lao PDR 1,768 — 2,320 2,437 2,527 1,387Pakistan 20,663 — 29,664 32,229 34,423 25,136Philippines 30,580 — 45,433 47,817 52,022 51,898Senegal 3,732 — 3,671 3,861 3,705 2,495Sri Lanka 5,863 — 7,638 8,523 9,472 7,062
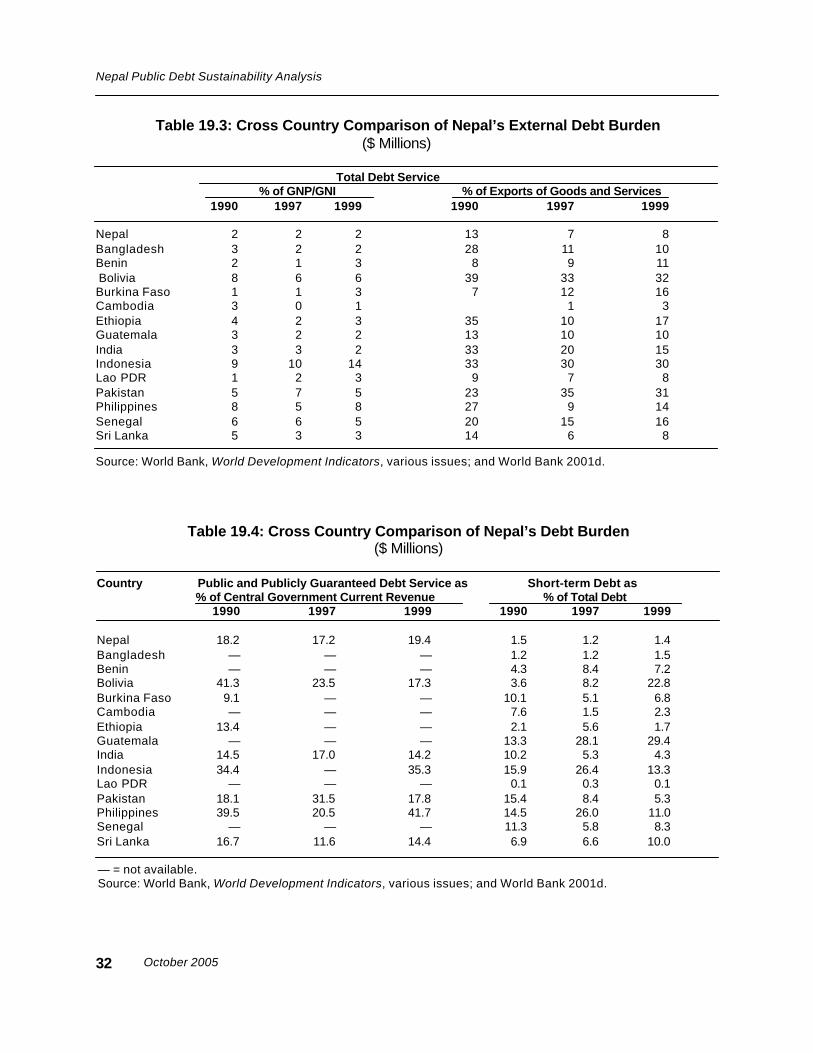
October 2005
Nepal Public Debt Sustainability Analysis
Table 19.3: Cross Country Comparison of Nepal’s External Debt Burden ($ Millions)
Total Debt Service % of GNP/GNI % of Exports of Goods and Services
1990 1997 1999 1990 1997 1999
Nepal 2 2 2 13 7 8Bangladesh 3 2 2 28 11 10Benin 2 1 3 8 9 11 Bolivia 8 6 6 39 33 32Burkina Faso 1 1 3 7 12 16Cambodia 3 0 1 1 3Ethiopia 4 2 3 35 10 17Guatemala 3 2 2 13 10 10India 3 3 2 33 20 15Indonesia 9 10 14 33 30 30Lao PDR 1 2 3 9 7 8Pakistan 5 7 5 23 35 31Philippines 8 5 8 27 9 14Senegal 6 6 5 20 15 16Sri Lanka 5 3 3 14 6 8
Source: World Bank, World Development Indicators, various issues; and World Bank 2001d.
Table 19.4: Cross Country Comparison of Nepal’s Debt Burden($ Millions)
Country Public and Publicly Guaranteed Debt Service as Short-term Debt as % of Central Government Current Revenue % of Total Debt
1990 1997 1999 1990 1997 1999
Nepal 18.2 17.2 19.4 1.5 1.2 1.4Bangladesh — — — 1.2 1.2 1.5Benin — — — 4.3 8.4 7.2Bolivia 41.3 23.5 17.3 3.6 8.2 22.8Burkina Faso 9.1 — — 10.1 5.1 6.8Cambodia — — — 7.6 1.5 2.3Ethiopia 13.4 — — 2.1 5.6 1.7Guatemala — — — 13.3 28.1 29.4India 14.5 17.0 14.2 10.2 5.3 4.3Indonesia 34.4 — 35.3 15.9 26.4 13.3Lao PDR — — — 0.1 0.3 0.1Pakistan 18.1 31.5 17.8 15.4 8.4 5.3Philippines 39.5 20.5 41.7 14.5 26.0 11.0Senegal — — — 11.3 5.8 8.3Sri Lanka 16.7 11.6 14.4 6.9 6.6 10.0
— = not available.Source: World Bank, World Development Indicators, various issues; and World Bank 2001d.
32
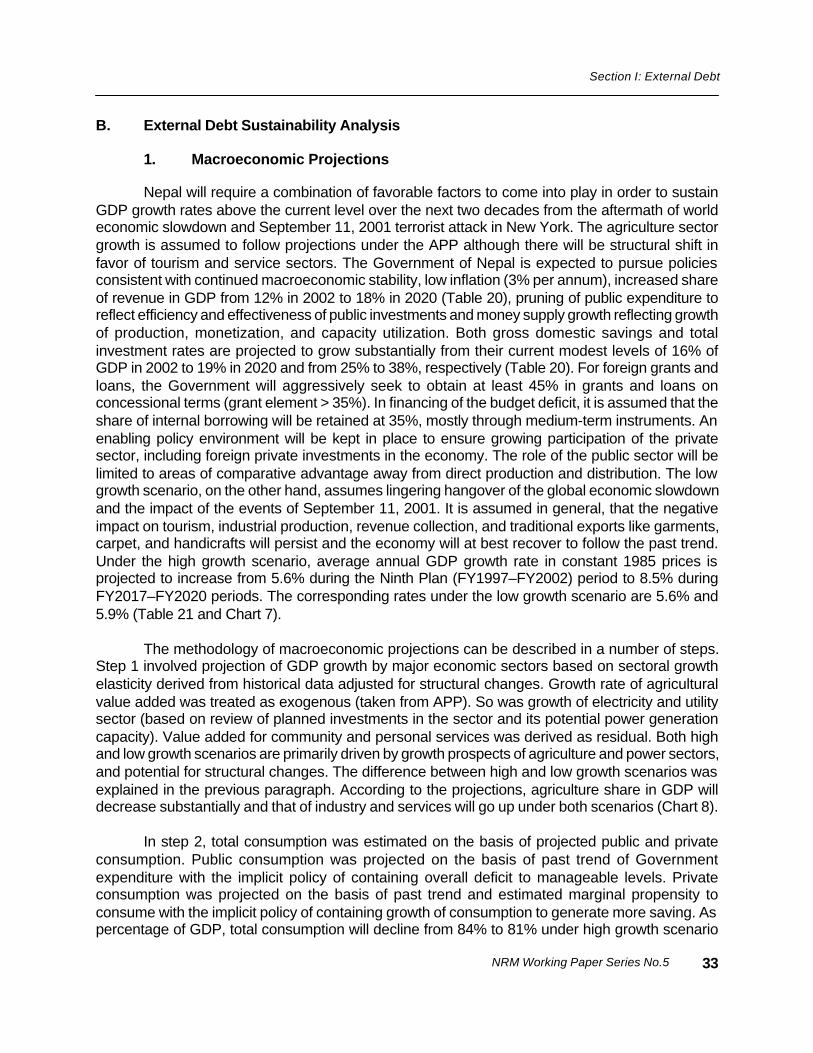
NRM Working Paper Series No.5
Section I: External Debt
B. External Debt Sustainability Analysis
1. Macroeconomic Projections
Nepal will require a combination of favorable factors to come into play in order to sustainGDP growth rates above the current level over the next two decades from the aftermath of worldeconomic slowdown and September 11, 2001 terrorist attack in New York. The agriculture sectorgrowth is assumed to follow projections under the APP although there will be structural shift infavor of tourism and service sectors. The Government of Nepal is expected to pursue policiesconsistent with continued macroeconomic stability, low inflation (3% per annum), increased shareof revenue in GDP from 12% in 2002 to 18% in 2020 (Table 20), pruning of public expenditure toreflect efficiency and effectiveness of public investments and money supply growth reflecting growthof production, monetization, and capacity utilization. Both gross domestic savings and totalinvestment rates are projected to grow substantially from their current modest levels of 16% ofGDP in 2002 to 19% in 2020 and from 25% to 38%, respectively (Table 20). For foreign grants andloans, the Government will aggressively seek to obtain at least 45% in grants and loans onconcessional terms (grant element > 35%). In financing of the budget deficit, it is assumed that theshare of internal borrowing will be retained at 35%, mostly through medium-term instruments. Anenabling policy environment will be kept in place to ensure growing participation of the privatesector, including foreign private investments in the economy. The role of the public sector will belimited to areas of comparative advantage away from direct production and distribution. The lowgrowth scenario, on the other hand, assumes lingering hangover of the global economic slowdownand the impact of the events of September 11, 2001. It is assumed in general, that the negativeimpact on tourism, industrial production, revenue collection, and traditional exports like garments,carpet, and handicrafts will persist and the economy will at best recover to follow the past trend.Under the high growth scenario, average annual GDP growth rate in constant 1985 prices isprojected to increase from 5.6% during the Ninth Plan (FY1997–FY2002) period to 8.5% duringFY2017–FY2020 periods. The corresponding rates under the low growth scenario are 5.6% and5.9% (Table 21 and Chart 7).
The methodology of macroeconomic projections can be described in a number of steps.Step 1 involved projection of GDP growth by major economic sectors based on sectoral growthelasticity derived from historical data adjusted for structural changes. Growth rate of agriculturalvalue added was treated as exogenous (taken from APP). So was growth of electricity and utilitysector (based on review of planned investments in the sector and its potential power generationcapacity). Value added for community and personal services was derived as residual. Both highand low growth scenarios are primarily driven by growth prospects of agriculture and power sectors,and potential for structural changes. The difference between high and low growth scenarios wasexplained in the previous paragraph. According to the projections, agriculture share in GDP willdecrease substantially and that of industry and services will go up under both scenarios (Chart 8).
In step 2, total consumption was estimated on the basis of projected public and privateconsumption. Public consumption was projected on the basis of past trend of Governmentexpenditure with the implicit policy of containing overall deficit to manageable levels. Privateconsumption was projected on the basis of past trend and estimated marginal propensity toconsume with the implicit policy of containing growth of consumption to generate more saving. Aspercentage of GDP, total consumption will decline from 84% to 81% under high growth scenario
33
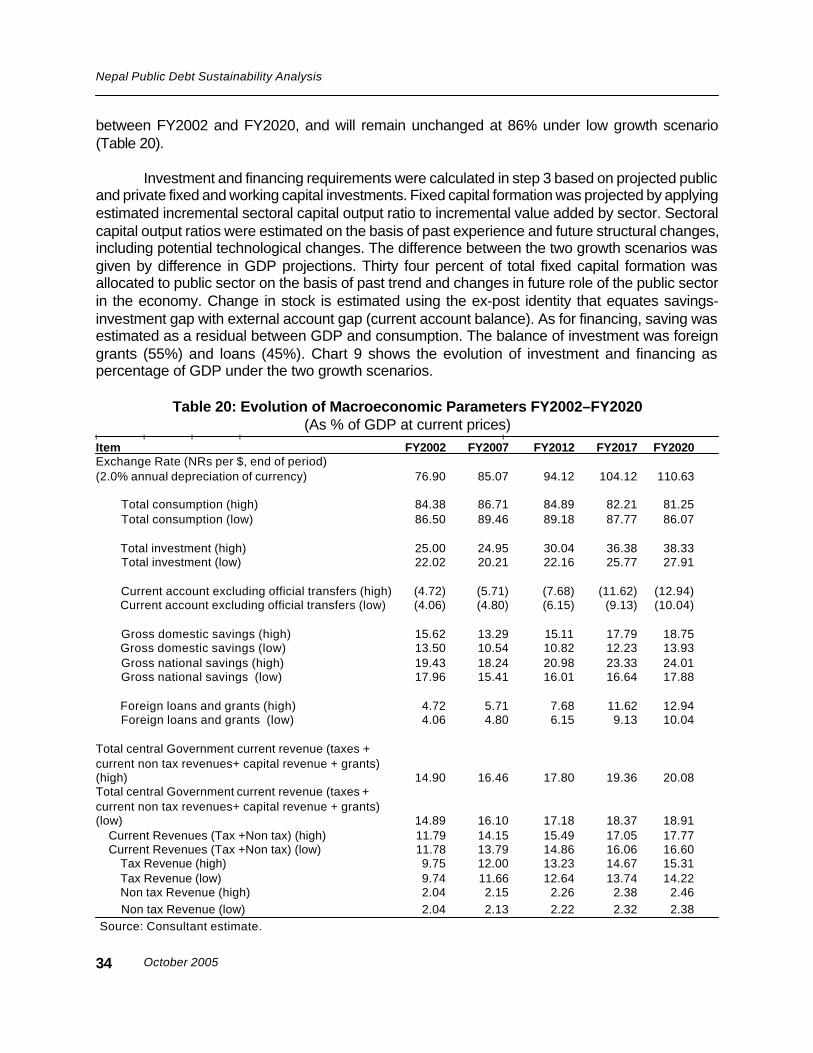
October 2005
Nepal Public Debt Sustainability Analysis
between FY2002 and FY2020, and will remain unchanged at 86% under low growth scenario(Table 20).
Investment and financing requirements were calculated in step 3 based on projected publicand private fixed and working capital investments. Fixed capital formation was projected by applyingestimated incremental sectoral capital output ratio to incremental value added by sector. Sectoralcapital output ratios were estimated on the basis of past experience and future structural changes,including potential technological changes. The difference between the two growth scenarios wasgiven by difference in GDP projections. Thirty four percent of total fixed capital formation wasallocated to public sector on the basis of past trend and changes in future role of the public sectorin the economy. Change in stock is estimated using the ex-post identity that equates savings-investment gap with external account gap (current account balance). As for financing, saving wasestimated as a residual between GDP and consumption. The balance of investment was foreigngrants (55%) and loans (45%). Chart 9 shows the evolution of investment and financing aspercentage of GDP under the two growth scenarios.
Table 20: Evolution of Macroeconomic Parameters FY2002–FY2020(As % of GDP at current prices)
Item FY2002 FY2007 FY2012 FY2017 FY2020Exchange Rate (NRs per $, end of period)(2.0% annual depreciation of currency) 76.90 85.07 94.12 104.12 110.63
Total consumption (high) 84.38 86.71 84.89 82.21 81.25 Total consumption (low) 86.50 89.46 89.18 87.77 86.07
Total investment (high) 25.00 24.95 30.04 36.38 38.33 Total investment (low) 22.02 20.21 22.16 25.77 27.91
Current account excluding official transfers (high) (4.72) (5.71) (7.68) (11.62) (12.94) Current account excluding official transfers (low) (4.06) (4.80) (6.15) (9.13) (10.04)
Gross domestic savings (high) 15.62 13.29 15.11 17.79 18.75 Gross domestic savings (low) 13.50 10.54 10.82 12.23 13.93 Gross national savings (high) 19.43 18.24 20.98 23.33 24.01 Gross national savings (low) 17.96 15.41 16.01 16.64 17.88
Foreign loans and grants (high) 4.72 5.71 7.68 11.62 12.94 Foreign loans and grants (low) 4.06 4.80 6.15 9.13 10.04
Total central Government current revenue (taxes +current non tax revenues+ capital revenue + grants)(high) 14.90 16.46 17.80 19.36 20.08Total central Government current revenue (taxes +current non tax revenues+ capital revenue + grants)(low) 14.89 16.10 17.18 18.37 18.91 Current Revenues (Tax +Non tax) (high) 11.79 14.15 15.49 17.05 17.77 Current Revenues (Tax +Non tax) (low) 11.78 13.79 14.86 16.06 16.60 Tax Revenue (high) 9.75 12.00 13.23 14.67 15.31 Tax Revenue (low) 9.74 11.66 12.64 13.74 14.22 Non tax Revenue (high) 2.04 2.15 2.26 2.38 2.46 Non tax Revenue (low) 2.04 2.13 2.22 2.32 2.38 Source: Consultant estimate.
34

NR
M W
orki
ng P
aper
Ser
ies
No.
5
Sec
tion
I: E
xter
nal D
ebt
Tabl
e 21
: M
acro
econ
omic
Sce
nari
o FY
1992
–FY
2020
: Hig
h G
row
th(A
t Con
stan
t 198
5 P
rices
)
An
nu
al R
ate
of
Gro
wth
FY19
92FY
1997
FY20
02FY
2007
FY20
12FY
2017
FY20
2019
92-9
719
97-0
220
02-0
720
07-1
220
12-1
720
17-2
0
Rea
l GD
P61
,266
77,3
3810
1,71
813
9,08
819
9,65
129
4,20
337
5,45
44.
85.
66.
57.
58.
18.
5To
tal C
onsu
mpt
ion
57,5
0271
,091
91,8
3913
0,07
918
4,78
626
7,58
234
1,22
64.
35.
37.
27.
37.
78.
4To
tal I
nves
tmen
t13
,642
20,9
3827
,208
37,4
2365
,395
118,
401
160,
993
8.9
5.4
6.6
11.8
12.6
10.8
Gro
ss d
omes
ticsa
ving
s (G
DP
–co
nsum
ptio
n)6,
992
11,5
3516
,999
19,9
3032
,884
57,8
9078
,760
10.5
8.1
3.2
10.5
12.0
10.8
Pro
duce
r Pric
esa
8,37
113
,205
22,0
7128
,864
48,6
6980
,565
106,
667
9.5
10.8
5.5
11.0
10.6
9.8
Fore
ign
loan
s an
dgr
ants
5,27
07,
733
5,13
86,
715
11,3
6222
,552
29,7
698.
0(7
.9)
5.5
11.1
14.7
9.7
Mer
chan
dise
trad
eba
lanc
e(7
,879
)(2
0,91
3)(1
6,03
7)(3
2,22
1)(6
4,33
7)(1
22,6
14)
(181
,408
)21
.6(5
.2)
15.0
14.8
13.8
13.9
Cur
rent
acc
ount
bala
nce
excl
udin
g tr
ansf
er(5
,076
)(7
,732
)(5
,138
)(8
,559
)(1
6,72
7)(3
7,83
6)(5
4,32
6)8.
8(7
.9)
10.7
14.3
17.7
12.8
Fore
ign
loan
s(n
ew b
orro
win
g)3,
758
3,30
94,
431
7,36
212
,688
26,1
4337
,092
(2.5
)6.
010
.711
.515
.612
.4G
ross
inte
rnat
iona
lre
serv
es8,
494
10,8
6821
,519
29,7
1247
,562
80,5
7211
2,76
15.
114
.66.
79.
911
.111
.9In
mon
ths
of im
ports
of g
oods
and
ser
vice
s6.
04.
27.
16.
36.
16.
16.
0T
otal
Gov
ernm
ent c
urre
ntre
venu
e ex
cl. g
rant
s5,
646
8,69
214
,037
21,2
4633
,736
55,5
0274
,643
9.0
10.1
8.6
9.7
10.5
10.4
Tot
al G
over
nmen
t cur
rent
reve
nue
incl
. gra
nts
6,35
510
,456
17,4
4824
,696
38,7
4362
,988
84,3
0310
.510
.87.
29.
410
.210
.2To
tal G
over
nmen
tex
pend
iture
10,6
9313
,669
21,7
7431
,915
51,0
2985
,374
112,
813
5.0
9.8
7.9
9.8
10.8
9.7
Ove
rall
defic
it(4
,338
)(3
,213
)(4
,325
)(7
,219
)(1
2,28
6)(2
2,38
6)(2
8,51
0)(5
.8)
6.1
10.8
11.2
12.7
8.4
Tota
l deb
tou
tsta
ndin
gb
(mill
ions
of N
Rs)
39,5
4640
,833
54,7
6060
,506
92,9
3815
9,30
223
0,54
70.
66.
02.
09.
011
.413
.1N
et p
rese
nt v
alue
of
debt
(N
Rs
mill
ions
)40
,595
71,1
8810
0,25
315
9,75
122
9,27
533
6,80
343
6,44
111
.97.
19.
87.
58.
09.
0G
DP
def
lato
r(1
985=
100)
231.
833
9.5
413.
947
9.8
556.
364
4.9
704.
67.
94.
03.
03.
03.
03.
0
Not
e: F
igur
e fo
r to
tal d
ebt o
utst
andi
ng s
how
n ag
ains
t FY
1992
ref
er to
FY
1993
.a G
ross
dom
estic
sav
ings
+ n
et fa
ctor
inco
me
+ ne
t cur
rent
tran
sfer
.b E
xist
ing
+ ne
w lo
ans.
Sou
rce:
Con
sulta
nt e
stim
ate.
35
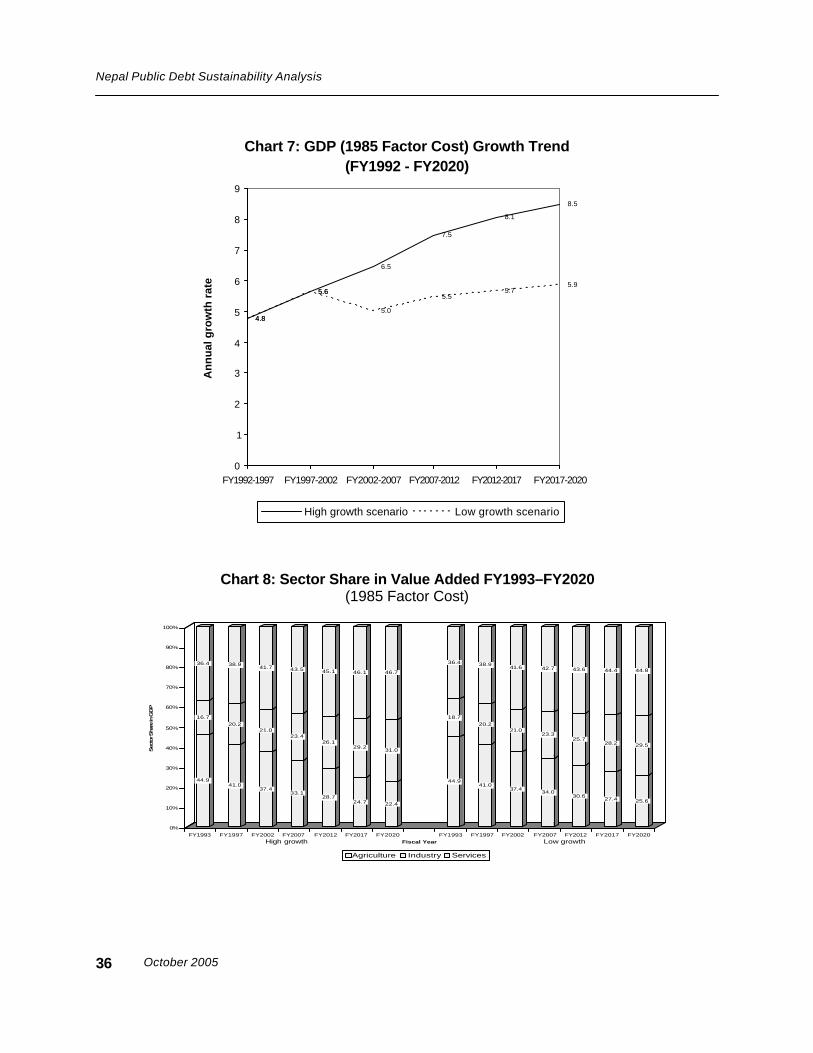
October 2005
Nepal Public Debt Sustainability Analysis
Chart 8: Sector Share in Value Added FY1993–FY2020(1985 Factor Cost)
44.9
16.7
36.4
41.0
20.2
38.9
37.4
21.0
41.7
33.1
23.4
43.5
28.7
26.1
45.1
24.7
29.2
46.1
22.4
31.0
46.7
44.9
18.7
36.4
41.0
20.2
38.9
37.4
21.0
41.6
34.0
23.3
42.7
30.6
25.7
43.6
27.4
28.2
44.4
25.6
29.5
44.8
0%
10%
20%
30%
40%
50%
60%
70%
80%
90%
100%
Sec
tor S
har
e in
GD
P
FY1993 FY1997 FY2002 FY2007 FY2012 FY2017 FY2020 FY1993 FY1997 FY2002 FY2007 FY2012 FY2017 FY2020Fiscal Year
Agriculture Industry Services
High growth Low growth
36
Chart 7: GDP (1985 Factor Cost) Growth Trend (FY1992 - FY2020)
4.8
5.6
7.5
8.1
8.5
4.8
5.6
5.0
5.55.7
5.9
6.5
0
1
2
3
4
5
6
7
8
9
FY1992-1997 FY1997-2002 FY2002-2007 FY2007-2012 FY2012-2017 FY2017-2020
An
nu
al g
row
th r
ate
High growth scenario Low growth scenario
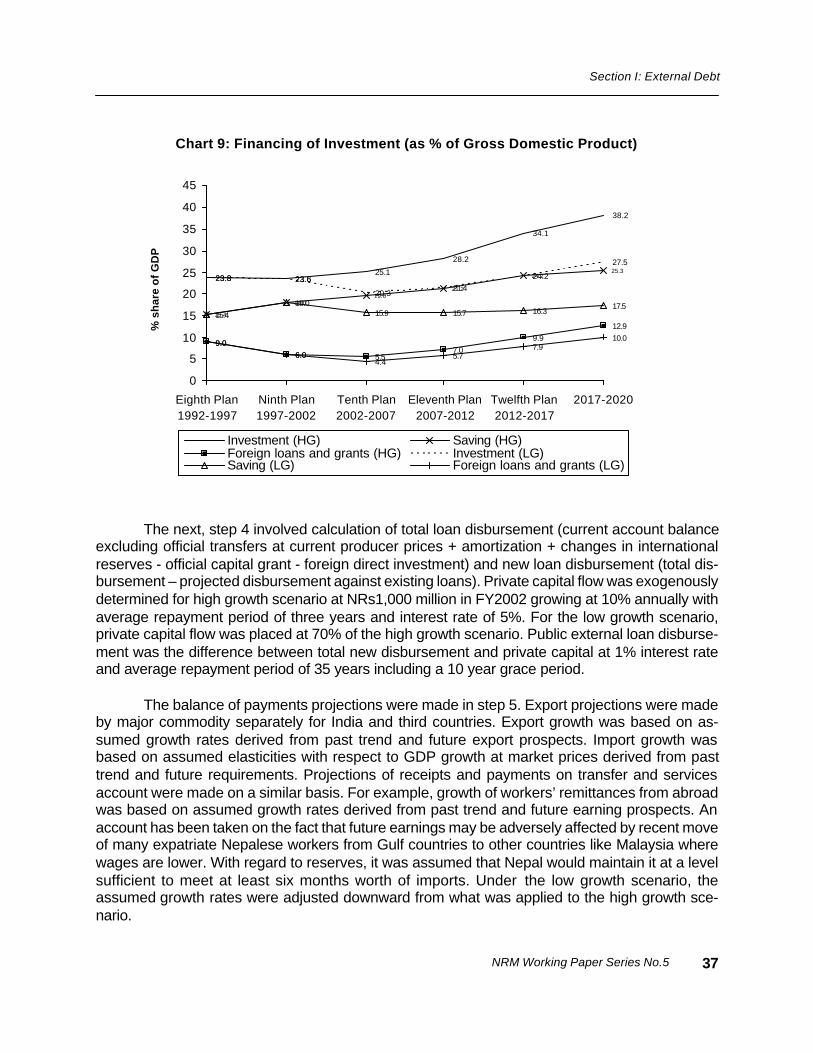
NRM Working Paper Series No.5
Section I: External Debt
Chart 9: Financing of Investment (as % of Gross Domestic Product)
23.8 23.625.1
28.2
34.1
38.2
15.4
18.019.6
21.2
24.225.3
9.06.0 5.5
7.09.9
12.9
23.8 23.6
20.321.4
24.2
27.5
15.418.0
15.9 15.7 16.317.5
9.06.0
4.45.7
7.910.0
0
5
10
15
20
25
30
35
40
45
Eighth Plan1992-1997
Ninth Plan1997-2002
Tenth Plan2002-2007
Eleventh Plan2007-2012
Twelfth Plan2012-2017
2017-2020
% s
har
e o
f G
DP
Investment (HG) Saving (HG)Foreign loans and grants (HG) Investment (LG)Saving (LG) Foreign loans and grants (LG)
The next, step 4 involved calculation of total loan disbursement (current account balanceexcluding official transfers at current producer prices + amortization + changes in internationalreserves - official capital grant - foreign direct investment) and new loan disbursement (total dis-bursement – projected disbursement against existing loans). Private capital flow was exogenouslydetermined for high growth scenario at NRs1,000 million in FY2002 growing at 10% annually withaverage repayment period of three years and interest rate of 5%. For the low growth scenario,private capital flow was placed at 70% of the high growth scenario. Public external loan disburse-ment was the difference between total new disbursement and private capital at 1% interest rateand average repayment period of 35 years including a 10 year grace period.
The balance of payments projections were made in step 5. Export projections were madeby major commodity separately for India and third countries. Export growth was based on as-sumed growth rates derived from past trend and future export prospects. Import growth wasbased on assumed elasticities with respect to GDP growth at market prices derived from pasttrend and future requirements. Projections of receipts and payments on transfer and servicesaccount were made on a similar basis. For example, growth of workers’ remittances from abroadwas based on assumed growth rates derived from past trend and future earning prospects. Anaccount has been taken on the fact that future earnings may be adversely affected by recent moveof many expatriate Nepalese workers from Gulf countries to other countries like Malaysia wherewages are lower. With regard to reserves, it was assumed that Nepal would maintain it at a levelsufficient to meet at least six months worth of imports. Under the low growth scenario, theassumed growth rates were adjusted downward from what was applied to the high growth sce-nario.
37
October 2005
Nepal Public Debt Sustainability Analysis
Projections of the Government account were made in step 6. Tax revenue was projectedon the basis of estimated GDP share of taxes derived from the relationship between share oftaxes in GDP and tax revenue elasticity and the rate of growth of GDP. In the same way, non taxrevenue was projected on the basis of estimated GDP share of non tax revenue derived from therelationship between share of non tax revenue in GDP and non tax revenue elasticity and the rateof growth of GDP. It was noted that the Government is taking steps to increase revenue andreduce leakage. A capital gains tax is under active consideration. Under a new income tax bill, allincome generating activities will be covered which could lead to 5–10% growth in revenue, ifadministered properly. Recently, distillery and liquor sector has been adversely affected by politicallymotivated agitation against these units resulting in an estimated shortfall of revenue of over NRs220million in a two month period. The Excise Act will be revised to cover imports, electricity, andtransport. Also, the long list of exemptions from value added tax (VAT) will be pared down. There isa large gap between potential VAT collection and actual receipt estimated at about NRs20 billion.Steps will be taken to fill this gap. Regular expenditure is projected on the basis of assumedgrowth rates derived from expenditure elasticity with respect to GDP at current prices and growthof GDP at current prices. Expenditure elasticities were based on historical data adjusted for newpolicy shift to contain growth of budget expenditures. Central Government development expenditurewas estimated as 1.5 times estimated public investment.
Finally, monetary aggregates were estimated in step 7. What are the implications of alternativegrowth scenarios for public debt sustainability and country risk management?
2. External Debt Sustainability
Relevant indicators suggest Nepal’s external debt burden is sustainable but vigilance iscalled for to avoid unexpected debt trap. In 1985 prices, new loan disbursements will increasefrom NRs4,431 million in FY2002 to NRs37,092 million in 2020 under high growth scenario. Underlow growth scenario, new disbursements will reach the level of NRs23,957 million (Table 21). Innominal terms, external DOD is projected to increase from NRs238,947 million in FY2002 toNRs1,576,970 million in FY2020 under high growth scenario and from NRs239,599 million toNRs1,270,239 million under low growth scenario (Table 22 and Chart 10). As percentage of GDP,external DOD will increase from 57% to 60% under high growth scenario, but it will decrease to48% under low growth scenario. External DOD as percentage of Government revenue is projectedto decline under both scenarios, from 411% to 300% under high growth scenario, and to 242%under low growth scenario (Table 22).
In nominal terms, external debt service burden is projected to increase from NRs7,838million in FY2002 to NRs56,888 million in FY2020 under high growth scenario, and to NRs47,863million under low growth scenario (Table 23). As percentage of GDP, external debt service burdenwill increase from 1.9% to 2.2% under high growth scenario, and to 2.6% under low growth scenario.External debt service as percentage of Government revenue is projected to decline from 14% to11% under high growth scenario, and will remain stable around 13% under low growth scenario(Table 23). The debt service burden was estimated on the basis of projected terms shown inTables 23 and 24.
38
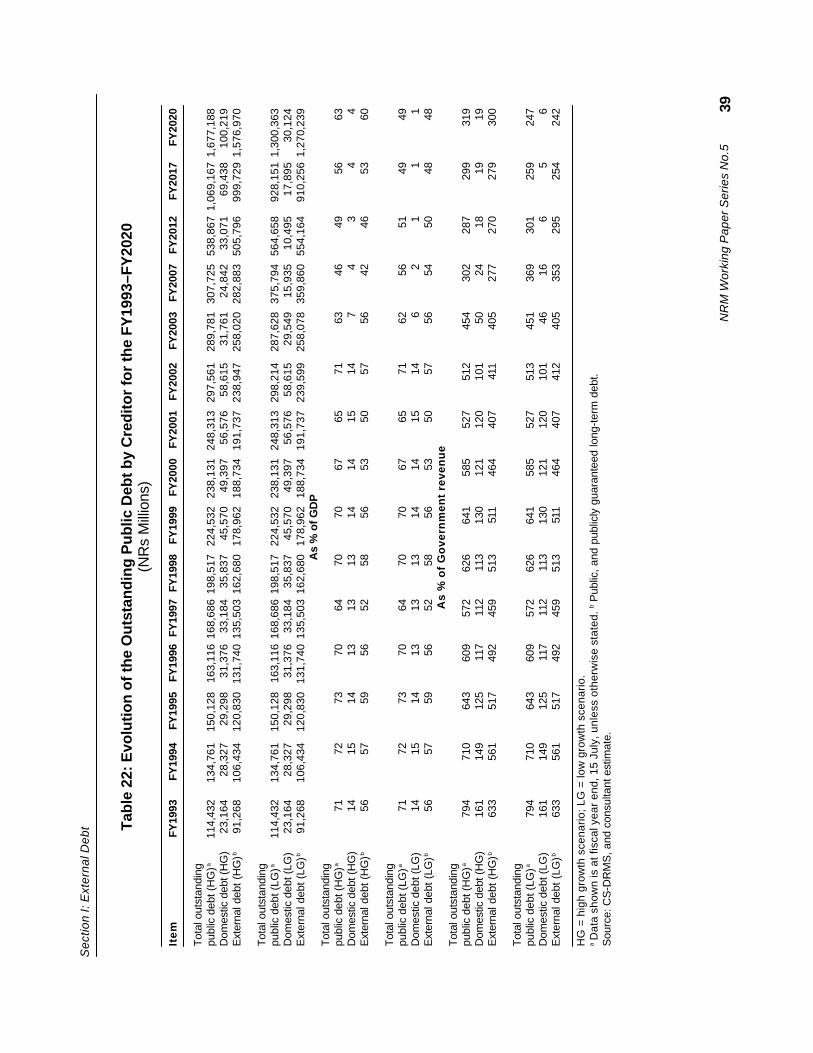
NR
M W
orki
ng P
aper
Ser
ies
No.
5
Sec
tion
I: E
xter
nal D
ebt T
able
22:
Evo
lutio
n o
f th
e O
uts
tan
din
g P
ub
lic D
ebt b
y C
red
itor
for
the
FY
1993
–FY
2020
(NR
s M
illio
ns)
Ite
mFY
1993
FY19
94FY
1995
FY19
96FY
1997
FY19
98FY
1999
FY20
00FY
2001
FY20
02FY
2003
FY20
07FY
2012
FY20
17
FY
2020
Tota
l out
stan
ding
publ
ic d
ebt (
HG
)a11
4,43
213
4,76
115
0,12
816
3,11
616
8,68
619
8,51
722
4,53
223
8,13
124
8,31
329
7,56
128
9,78
130
7,72
553
8,86
71,
069,
167
1,67
7,18
8D
omes
tic d
ebt (
HG
)23
,164
28,3
2729
,298
31,3
7633
,184
35,8
3745
,570
49,3
9756
,576
58,6
1531
,761
24,8
4233
,071
69,4
3810
0,21
9E
xter
nal d
ebt (
HG
)b91
,268
106,
434
120,
830
131,
740
135,
503
162,
680
178,
962
188,
734
191,
737
238,
947
258,
020
282,
883
505,
796
999,
729
1,57
6,97
0
Tota
l out
stan
ding
publ
ic d
ebt (
LG)a
114,
432
134,
761
150,
128
163,
116
168,
686
198,
517
224,
532
238,
131
248,
313
298,
214
287,
628
375,
794
564,
658
928,
151
1,30
0,36
3D
omes
tic d
ebt (
LG)
23,1
6428
,327
29,2
9831
,376
33,1
8435
,837
45,5
7049
,397
56,5
7658
,615
29,5
4915
,935
10,4
9517
,895
30,1
24E
xter
nal d
ebt (
LG)b
91,2
6810
6,43
412
0,83
013
1,74
013
5,50
316
2,68
017
8,96
218
8,73
419
1,73
723
9,59
925
8,07
835
9,86
055
4,16
491
0,25
61,
270,
239
As
% o
f GD
PTo
tal o
utst
andi
ngpu
blic
deb
t (H
G)a
7172
7370
6470
7067
6571
6346
4956
63D
omes
tic d
ebt (
HG
)14
1514
1313
1314
1415
147
43
44
Ext
erna
l deb
t (H
G)b
5657
5956
5258
5653
5057
5642
4653
60
Tota
l out
stan
ding
publ
ic d
ebt (
LG)a
7172
7370
6470
7067
6571
6256
5149
49D
omes
tic d
ebt (
LG)
1415
1413
1313
1414
1514
62
11
1E
xter
nal d
ebt (
LG)b
5657
5956
5258
5653
5057
5654
5048
48A
s %
of
Go
vern
men
t re
ven
ue
Tota
l out
stan
ding
publ
ic d
ebt (
HG
)a79
471
064
360
957
262
664
158
552
751
245
430
228
729
931
9D
omes
tic d
ebt (
HG
)16
114
912
511
711
211
313
012
112
010
150
2418
1919
Ext
erna
l deb
t (H
G)b
633
561
517
492
459
513
511
464
407
411
405
277
270
279
300
Tota
l out
stan
ding
publ
ic d
ebt (
LG)a
794
710
643
609
572
626
641
585
527
513
451
369
301
259
247
Dom
estic
deb
t (LG
)16
114
912
511
711
211
313
012
112
010
146
166
56
Ext
erna
l deb
t (LG
)b63
356
151
749
245
951
351
146
440
741
240
535
329
525
424
2
HG
= h
igh
grow
th s
cena
rio; L
G =
low
gro
wth
sce
nario
.a D
ata
show
n is
at f
isca
l yea
r en
d, 1
5 Ju
ly, u
nles
s ot
herw
ise
stat
ed. b P
ublic
, and
pub
licly
gua
rant
eed
long
-term
deb
t.S
ourc
e: C
S-D
RM
S, a
nd c
onsu
ltant
est
imat
e.
39
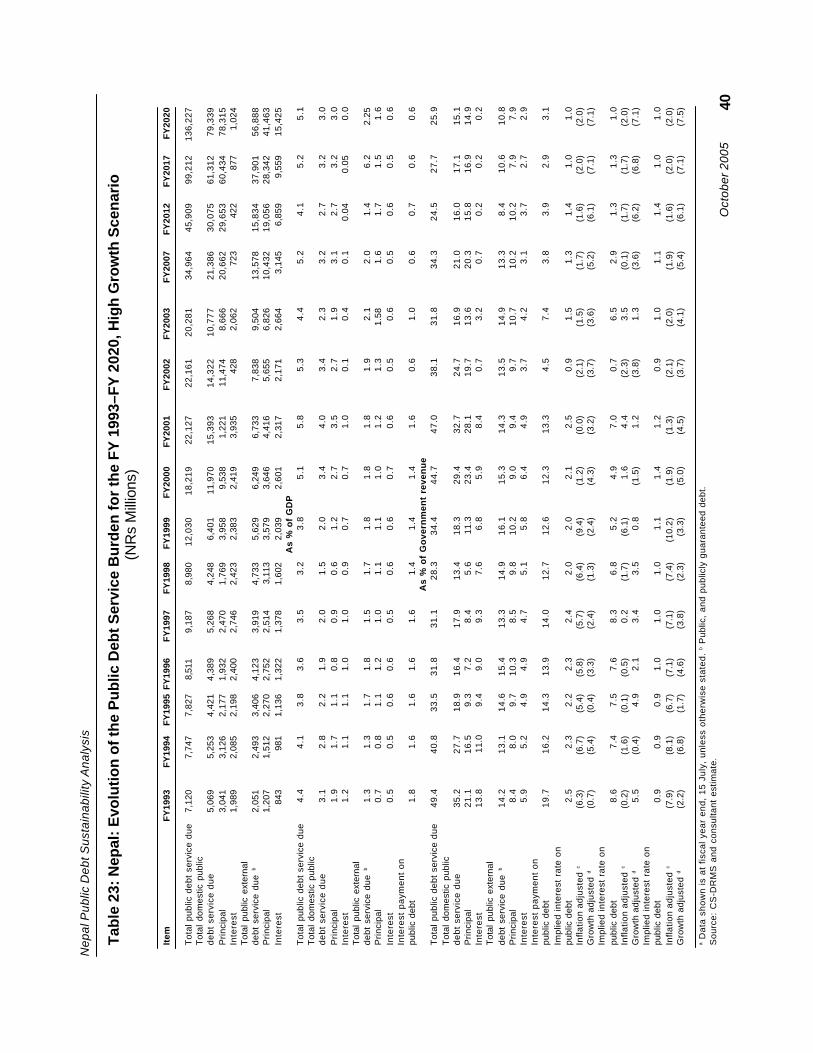
Oct
ober
200
5
Nep
al P
ublic
Deb
t Sus
tain
abili
ty A
naly
sis
Tab
le 2
3: N
epal
: Evo
luti
on
of t
he
Pu
blic
Deb
t Ser
vice
Bu
rden
for
the
FY
199
3–F
Y 2
020,
Hig
h G
row
th S
cen
ario
(NR
s M
illio
ns)
Item
FY
1993
FY
1994
FY
1995
FY
1996
FY
1997
FY
1998
FY
1999
FY
2000
FY
2001
FY
2002
FY
2003
FY
2007
FY
2012
FY
2017
FY
2020
Tot
al p
ublic
deb
t se
rvic
e du
e7,
120
7,74
77,
827
8,51
19,
187
8,98
012
,030
18,2
1922
,127
22,1
6120
,281
34,9
6445
,909
99,2
1213
6,22
7T
otal
dom
estic
pub
licde
bt s
ervi
ce d
ue5,
069
5,25
34,
421
4,38
95,
268
4,24
86,
401
11,9
7015
,393
14,3
2210
,777
21,3
8630
,075
61,3
1279
,339
Prin
cipa
l3,
041
3,12
62,
177
1,93
22,
470
1,76
93,
958
9,53
81,
221
11,4
748,
666
20,6
6229
,653
60,4
3478
,315
Inte
rest
1,98
92,
085
2,19
82,
400
2,74
62,
423
2,38
32,
419
3,93
542
82,
062
723
422
877
1,02
4T
otal
pub
lic e
xter
nal
debt
ser
vice
due
b2,
051
2,49
33,
406
4,12
33,
919
4,73
35,
629
6,24
96,
733
7,83
89,
504
13,5
7815
,834
37,9
0156
,888
Prin
cipa
l1,
207
1,51
22,
270
2,75
22,
514
3,11
33,
579
3,64
64,
416
5,65
56,
826
10,4
3219
,056
28,3
4241
,463
Inte
rest
843
981
1,13
61,
322
1,37
81,
602
2,03
92,
601
2,31
72,
171
2,66
43,
145
6,85
99,
559
15,4
25A
s %
of
GD
PT
otal
pub
lic d
ebt
serv
ice
due
4.4
4.1
3.8
3.6
3.5
3.2
3.8
5.1
5.8
5.3
4.4
5.2
4.1
5.2
5.1
Tot
al d
omes
tic p
ublic
debt
ser
vice
due
3.1
2.8
2.2
1.9
2.0
1.5
2.0
3.4
4.0
3.4
2.3
3.2
2.7
3.2
3.0
Prin
cipa
l1
.91
.71
.10
.80
.90
.61
.22
.73
.52
.71
.93
.12
.73
.23
.0In
tere
st1
.21
.11
.11
.01
.00
.90
.70
.71
.00
.10
.40
.10.
040.
050
.0T
otal
pub
lic e
xter
nal
debt
ser
vice
due
b1
.31
.31
.71
.81
.51
.71
.81
.81
.81
.92
.12
.01
.46
.22.
25P
rinci
pal
0.7
0.8
1.1
1.2
1.0
1.1
1.1
1.0
1.2
1.3
1.58
1.6
1.7
1.5
1.6
Inte
rest
0.5
0.5
0.6
0.6
0.5
0.6
0.6
0.7
0.6
0.5
0.6
0.5
0.6
0.5
0.6
Inte
rest
pay
men
t on
publ
ic d
ebt
1.8
1.6
1.6
1.6
1.6
1.4
1.4
1.4
1.6
0.6
1.0
0.6
0.7
0.6
0.6
As
% o
f G
ove
rnm
ent
reve
nu
eT
otal
pub
lic d
ebt
serv
ice
due
49.4
40.8
33.5
31.8
31.1
28.3
34.4
44.7
47.0
38.1
31.8
34.3
24.5
27.7
25.9
Tot
al d
omes
tic p
ublic
debt
ser
vice
due
35.2
27.7
18.9
16.4
17.9
13.4
18.3
29.4
32.7
24.7
16.9
21.0
16.0
17.1
15.1
Prin
cipa
l21
.116
.59
.37
.28
.45
.611
.323
.428
.119
.713
.620
.315
.816
.914
.9In
tere
st13
.811
.09
.49
.09
.37
.66
.85
.98
.40
.73
.20
.70
.20
.20
.2T
otal
pub
lic e
xter
nal
debt
ser
vice
due
b14
.213
.114
.615
.413
.314
.916
.115
.314
.313
.514
.913
.38
.410
.610
.8P
rinci
pal
8.4
8.0
9.7
10.3
8.5
9.8
10.2
9.0
9.4
9.7
10.7
10.2
10.2
7.9
7.9
Inte
rest
5.9
5.2
4.9
4.9
4.7
5.1
5.8
6.4
4.9
3.7
4.2
3.1
3.7
2.7
2.9
Inte
rest
pay
men
t on
publ
ic d
ebt
19.7
16.2
14.3
13.9
14.0
12.7
12.6
12.3
13.3
4.5
7.4
3.8
3.9
2.9
3.1
Impl
ied
inte
rest
rat
e on
publ
ic d
ebt
2.5
2.3
2.2
2.3
2.4
2.0
2.0
2.1
2.5
0.9
1.5
1.3
1.4
1.0
1.0
Infla
tion
adju
sted
c(6
.3)
(6.7
)(5
.4)
(5.8
)(5
.7)
(6.4
)(9
.4)
(1.2
)(0
.0)
(2.1
)(1
.5)
(1.7
)(1
.6)
(2.0
)(2
.0)
Gro
wth
adj
uste
d d
(0.7
)(5
.4)
(0.4
)(3
.3)
(2.4
)(1
.3)
(2.4
)(4
.3)
(3.2
)(3
.7)
(3.6
)(5
.2)
(6.1
)(7
.1)
(7.1
)Im
plie
d in
tere
st r
ate
onpu
blic
deb
t8
.67
.47
.57
.68
.36
.85
.24
.97
.00
.76
.52
.91
.31
.31
.0In
flatio
n ad
just
ed c
(0.2
)(1
.6)
(0.1
)(0
.5)
0.2
(1.7
)(6
.1)
1.6
4.4
(2.3
)3
.5(0
.1)
(1.7
)(1
.7)
(2.0
)G
row
th a
djus
ted
d5
.5(0
.4)
4.9
2.1
3.4
3.5
0.8
(1.5
)1
.2(3
.8)
1.3
(3.6
)(6
.2)
(6.8
)(7
.1)
Impl
ied
inte
rest
rat
e on
publ
ic d
ebt
0.9
0.9
0.9
1.0
1.0
1.0
1.1
1.4
1.2
0.9
1.0
1.1
1.4
1.0
1.0
Infla
tion
adju
sted
c(7
.9)
(8.1
)(6
.7)
(7.1
)(7
.1)
(7.4
)(1
0.2)
(1.9
)(1
.3)
(2.1
)(2
.0)
(1.9
)(1
.6)
(2.0
)(2
.0)
Gro
wth
adj
uste
d d
(2.2
)(6
.8)
(1.7
)(4
.6)
(3.8
)(2
.3)
(3.3
)(5
.0)
(4.5
)(3
.7)
(4.1
)(5
.4)
(6.1
)(7
.1)
(7.5
)
a D
ata
show
n is
at
fisca
l yea
r en
d, 1
5 Ju
ly,
unle
ss o
ther
wis
e st
ated
. b
Pub
lic,
and
publ
icly
gua
rant
eed
debt
.S
ourc
e: C
S-D
RM
S a
nd c
onsu
ltant
est
imat
e.
40
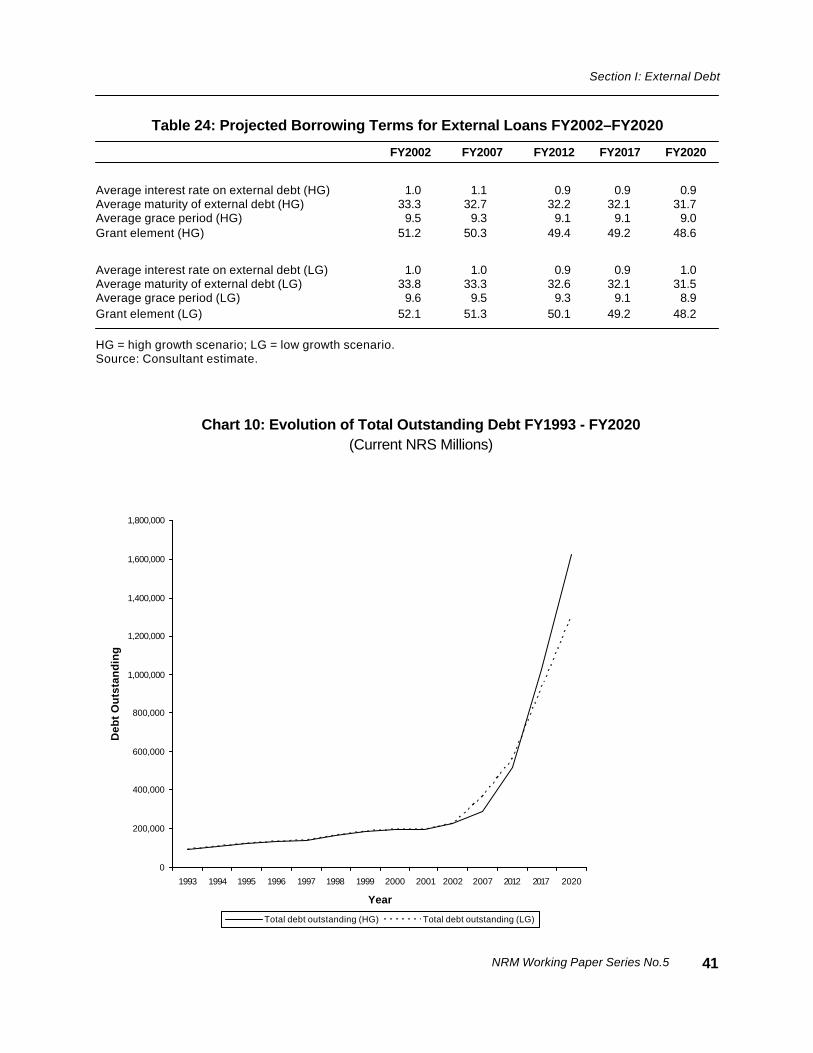
NRM Working Paper Series No.5
Section I: External Debt
Table 24: Projected Borrowing Terms for External Loans FY2002–FY2020
FY2002 FY2007 FY2012 FY2017 FY2020
Average interest rate on external debt (HG) 1.0 1.1 0.9 0.9 0.9Average maturity of external debt (HG) 33.3 32.7 32.2 32.1 31.7Average grace period (HG) 9.5 9.3 9.1 9.1 9.0Grant element (HG) 51.2 50.3 49.4 49.2 48.6
Average interest rate on external debt (LG) 1.0 1.0 0.9 0.9 1.0Average maturity of external debt (LG) 33.8 33.3 32.6 32.1 31.5Average grace period (LG) 9.6 9.5 9.3 9.1 8.9Grant element (LG) 52.1 51.3 50.1 49.2 48.2
HG = high growth scenario; LG = low growth scenario.Source: Consultant estimate.
41
Chart 10: Evolution of Total Outstanding Debt FY1993 - FY2020(Current NRS Millions)
0
200,000
400,000
600,000
800,000
1,000,000
1,200,000
1,400,000
1,600,000
1,800,000
1993 1994 1995 1996 1997 1998 1999 2000 2001 2002 2007 2012 2017 2020
Year
Deb
t O
uts
tan
din
g
Total debt outstanding (HG) Total debt outstanding (LG)
October 2005
Nepal Public Debt Sustainability Analysis
It is projected that NPV external debt would quadruple between FY2002 and FY2020 underhigh growth scenario and it would triple under low growth scenario (Table 25 and Chart 11). NPVexternal debt as percentage of GDP is projected to decline from 24% in FY2002 to 17% in FY2020under high growth scenario and to 16% under low growth scenario. As percentage of centralGovernment revenue, NPV external debt is projected to decline from 173% in FY2002 to 83%under high growth scenario and 87% under low growth scenario.
External debt sustainability has been examined from the point of view of solvency, liquidityand public sector operations, and results are presented in Table 26. Notes to the table explainimplications of each indicator. Solvency indicators show a country’s ability to discharge foreignexchange obligations on a continuing basis. The general conclusion one can draw is that in theforeseeable future, external debt burden of Nepal does not present a serious solvency risk underalternative growth scenarios. However, close monitoring of the debt service burden in relation toexports beyond FY2012 would be in order. The current account deficit as percentage of GDP isprojected to triple between FY2001 and FY2020 to reach a level of 15% under both scenarios(Table 26). Although interest rate, average maturity and grace period will remain relatively favorable,interest payment as percentage of exports is projected to increase from 2.1% in FY2002 to 3.5%in FY2020 under high growth scenario and from 2.2% to 4.2% under low growth scenario. Similarly,external DOD as percentage of three year moving average of exports is projected to increase from219% in FY2002 to 373% in FY2020 under high growth scenario and 449% under low growthscenario. The problem is that three-year moving average of exports as percentage of GDP isprojected to decline between FY2002 and FY2020 under both scenarios. Two critical ratios monitoredclosely by multilateral lenders to determine a country’s heavily indebted poor countries (HIPC)status are NPV external debt as percentage of three-year moving average of exports and externaldebt service as percentage of exports. For Nepal, these ratios are projected to increase substantiallybetween FY2002 and FY2020. However, NPV external debt as percentage of exports remainsbelow the critical level of 150% during the period under consideration (Chart 12). This is not thecase with the external debt service as percentage of exports, which exceeds the critical value of15% by FY2020 (Chart 13)—hence, the reason for caution. Clearly, a lack of dynamism in exportsand dependence on the Indian market may come back to haunt Nepal in not so a distant future.There is however, potential in other indicators such as NPV external debt as percentage of GDP orcentral Government current revenue, multilateral debt service as percentage of current year exportsand grant element of loans. Nepal should be able to bargain with lenders to maintain the currentaverage level of grant element in external debt.
42
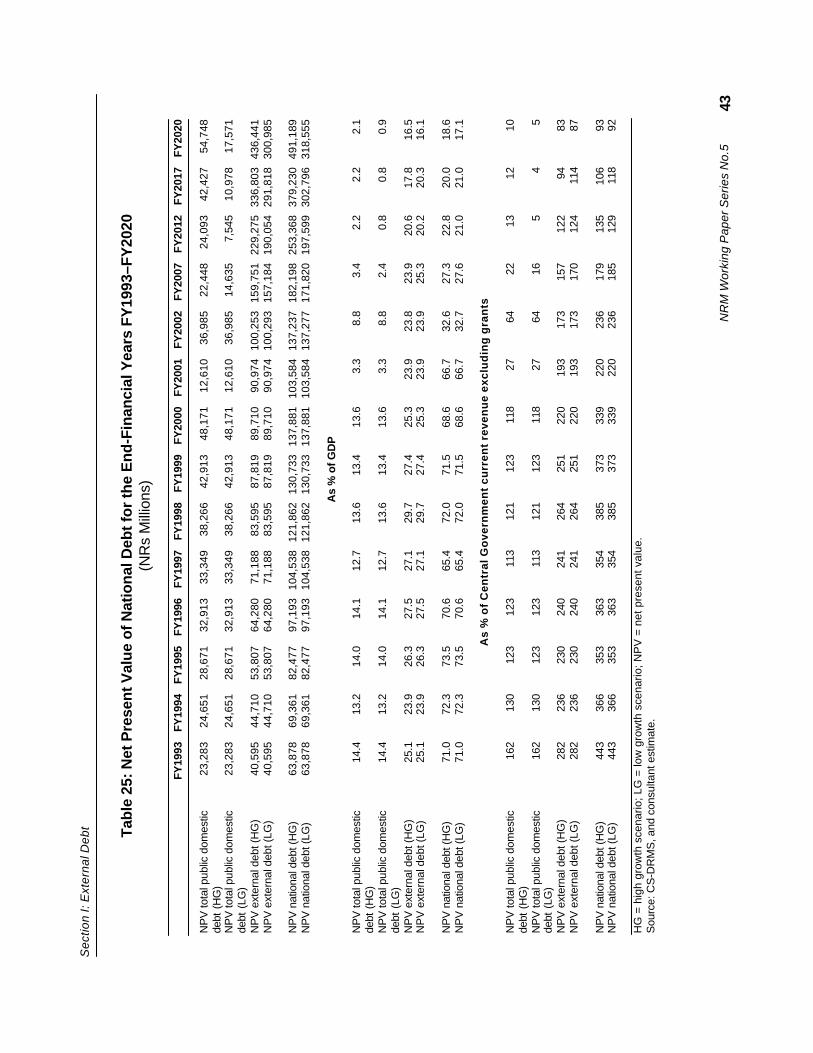
NR
M W
orki
ng P
aper
Ser
ies
No.
5
Sec
tion
I: E
xter
nal D
ebt Tab
le 2
5: N
et P
rese
nt V
alu
e o
f Nat
ion
al D
ebt f
or
the
En
d-F
inan
cial
Yea
rs F
Y19
93–F
Y20
20(N
Rs
Mill
ions
)
FY
1993
FY19
94FY
1995
FY19
96FY
1997
FY19
98FY
1999
FY20
00FY
2001
FY20
02FY
2007
FY20
12FY
2017
FY20
20
NP
V to
tal p
ublic
dom
estic
23,2
83 2
4,65
1 2
8,67
1 3
2,91
3
33,
349
3
8,26
6
42,
913
4
8,17
1
12,
610
3
6,98
5
22,
448
2
4,09
3
42,
427
5
4,74
8de
bt (
HG
)N
PV
tota
l pub
lic d
omes
tic 2
3,28
3 2
4,65
1 2
8,67
1 3
2,91
3
33,
349
3
8,26
6
42,
913
4
8,17
1
12,
610
3
6,98
5
14,
635
7,54
5
10,
978
1
7,57
1de
bt (
LG)
NP
V e
xter
nal d
ebt (
HG
) 4
0,59
5 4
4,71
0 5
3,80
7 6
4,28
0
71,
188
8
3,59
5
87,
819
8
9,71
0
90,
974
100
,253
159
,751
229
,275
336
,803
436
,441
NP
V e
xter
nal d
ebt (
LG)
40,
595
44,
710
53,
807
64,
280
7
1,18
8
83,
595
8
7,81
9
89,
710
9
0,97
4 1
00,2
93 1
57,1
84 1
90,0
54 2
91,8
18 3
00,9
85
NP
V n
atio
nal d
ebt (
HG
) 6
3,87
8 6
9,36
1 8
2,47
7 9
7,19
3 1
04,5
38 1
21,8
62 1
30,7
33 1
37,8
81 1
03,5
84 1
37,2
37 1
82,1
98 2
53,3
68 3
79,2
30 4
91,1
89N
PV
nat
iona
l deb
t (LG
) 6
3,87
8 6
9,36
1 8
2,47
7 9
7,19
3 1
04,5
38 1
21,8
62 1
30,7
33 1
37,8
81 1
03,5
84 1
37,2
77 1
71,8
20 1
97,5
99 3
02,7
96 3
18,5
55
As
% o
f GD
P
NP
V to
tal p
ublic
dom
estic
14.4
13.2
14.0
14.1
12.7
13.6
13.4
13.6
3.3
8.8
3.4
2.2
2.2
2.1
debt
(H
G)
NP
V to
tal p
ublic
dom
estic
14.4
13.2
14.0
14.1
12.7
13.6
13.4
13.6
3.3
8.8
2.4
0.8
0.8
0.9
debt
(LG
)N
PV
ext
erna
l deb
t (H
G)
25.1
23.9
26.3
27.5
27.1
29.7
27.4
25.3
23.9
23.8
23.9
20.6
17.8
16.5
NP
V e
xter
nal d
ebt (
LG)
25.1
23.9
26.3
27.5
27.1
29.7
27.4
25.3
23.9
23.9
25.3
20.2
20.3
16.1
NP
V n
atio
nal d
ebt (
HG
)71
.072
.373
.570
.665
.472
.071
.568
.666
.732
.627
.322
.820
.018
.6N
PV
nat
iona
l deb
t (LG
)71
.072
.373
.570
.665
.472
.071
.568
.666
.732
.727
.621
.021
.017
.1
As
% o
f C
entr
al G
ove
rnm
ent
curr
ent
reve
nu
e ex
clu
din
g g
ran
ts
NP
V to
tal p
ublic
dom
estic
162
130
123
123
113
121
123
118
2764
2213
1210
debt
(H
G)
NP
V to
tal p
ublic
dom
estic
162
130
123
123
113
121
123
118
2764
165
45
debt
(LG
)N
PV
ext
erna
l deb
t (H
G)
282
236
230
240
241
264
251
220
193
173
157
122
9483
NP
V e
xter
nal d
ebt (
LG)
282
236
230
240
241
264
251
220
193
173
170
124
114
87
NP
V n
atio
nal d
ebt (
HG
)44
336
635
336
335
438
537
333
922
023
617
913
510
693
NP
V n
atio
nal d
ebt (
LG)
443
366
353
363
354
385
373
339
220
236
185
129
118
92
HG
= h
igh
grow
th s
cena
rio; L
G =
low
gro
wth
sce
nario
; NP
V =
net
pre
sent
val
ue.
Sou
rce:
CS
-DR
MS
, and
con
sulta
nt e
stim
ate.
43
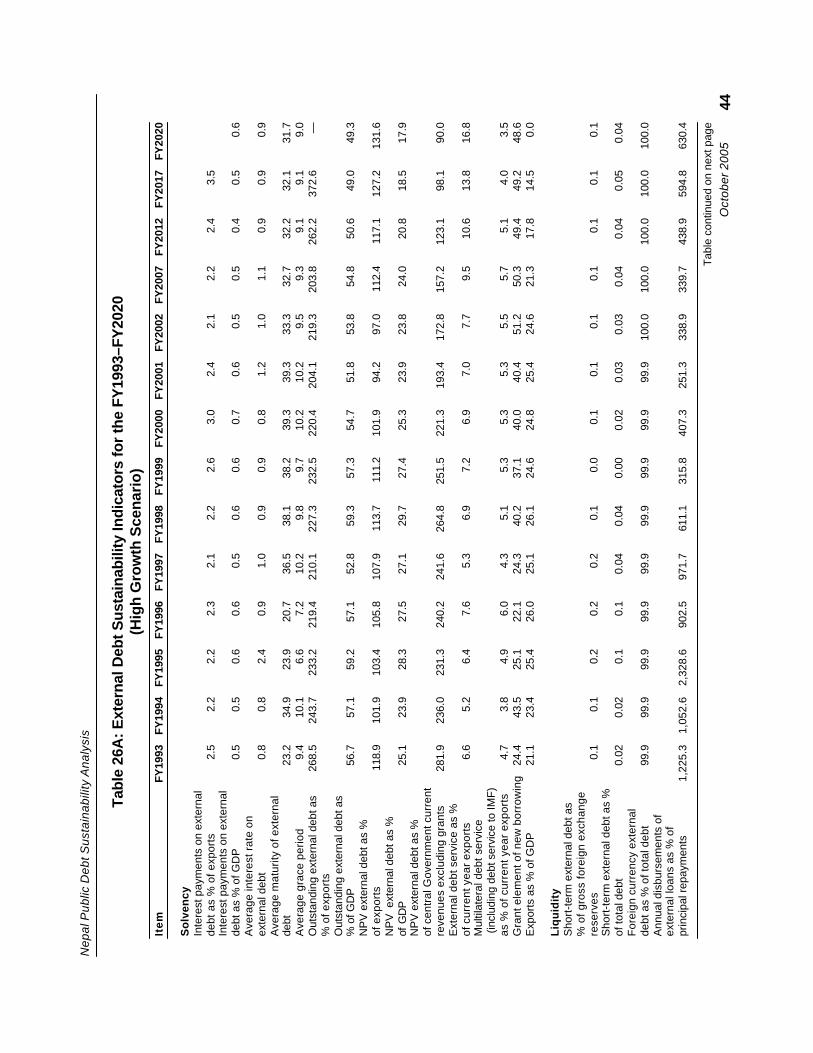
Oct
ober
200
5
Nep
al P
ublic
Deb
t Sus
tain
abili
ty A
naly
sis
Tabl
e 26
A: E
xter
nal D
ebt S
usta
inab
ility
Indi
cato
rs fo
r th
e FY
1993
–FY
2020
(Hig
h G
row
th S
cen
ario
)It
em
FY19
93FY
1994
FY19
95FY
1996
FY19
97FY
1998
FY19
99FY
2000
FY20
01FY
2002
FY20
07FY
2012
FY20
17FY
2020
So
lven
cyIn
tere
st p
aym
ents
on
exte
rnal
debt
as
% o
f exp
orts
2.5
2.2
2.2
2.3
2.1
2.2
2.6
3.0
2.4
2.1
2.2
2.4
3.5
Inte
rest
pay
men
ts o
n ex
tern
alde
bt a
s %
of G
DP
0.5
0.5
0.6
0.6
0.5
0.6
0.6
0.7
0.6
0.5
0.5
0.4
0.5
0.6
Ave
rage
inte
rest
rat
e on
exte
rnal
deb
t0.
80.
82.
40.
91.
00.
90.
90.
81.
21.
01.
10.
90.
90.
9A
vera
ge m
atur
ity o
f ext
erna
lde
bt23
.234
.923
.920
.736
.538
.138
.239
.339
.333
.332
.732
.232
.131
.7A
vera
ge g
race
per
iod
9.4
10.1
6.6
7.2
10.2
9.8
9.7
10.2
10.2
9.5
9.3
9.1
9.1
9.0
Out
stan
ding
ext
erna
l deb
t as
268.
524
3.7
233.
221
9.4
210.
122
7.3
232.
522
0.4
204.
121
9.3
203.
826
2.2
372.
6—
% o
f exp
orts
Out
stan
ding
ext
erna
l deb
t as
% o
f GD
P56
.757
.159
.257
.152
.859
.357
.354
.751
.853
.854
.850
.649
.049
.3N
PV
ext
erna
l deb
t as
%of
exp
orts
118.
910
1.9
103.
410
5.8
107.
911
3.7
111.
210
1.9
94.2
97.0
112.
411
7.1
127.
213
1.6
NP
V e
xter
nal d
ebt a
s %
of G
DP
25.1
23.9
28.3
27.5
27.1
29.7
27.4
25.3
23.9
23.8
24.0
20.8
18.5
17.9
NP
V e
xter
nal d
ebt a
s %
of c
entr
al G
over
nmen
t cur
rent
reve
nues
exc
ludi
ng g
rant
s28
1.9
236.
023
1.3
240.
224
1.6
264.
825
1.5
221.
319
3.4
172.
815
7.2
123.
198
.190
.0E
xter
nal d
ebt s
ervi
ce a
s %
of c
urre
nt y
ear
expo
rts
6.6
5.2
6.4
7.6
5.3
6.9
7.2
6.9
7.0
7.7
9.5
10.6
13.8
16.8
Mul
tilat
eral
deb
t ser
vice
(inc
ludi
ng d
ebt s
ervi
ce to
IMF
)as
% o
f cur
rent
yea
r ex
port
s4.
73.
84.
96.
04.
35.
15.
35.
35.
35.
55.
75.
14.
03.
5G
rant
ele
men
t of n
ew b
orro
win
g24
.443
.525
.122
.124
.340
.237
.140
.040
.451
.250
.349
.449
.248
.6E
xpor
ts a
s %
of G
DP
21.1
23.4
25.4
26.0
25.1
26.1
24.6
24.8
25.4
24.6
21.3
17.8
14.5
0.0
Liq
uid
ity
Sho
rt-t
erm
ext
erna
l deb
t as
% o
f gro
ss fo
reig
n ex
chan
gere
serv
es0.
10.
10.
20.
20.
20.
10.
00.
10.
10.
10.
10.
10.
10.
1S
hort
-ter
m e
xter
nal d
ebt a
s %
of to
tal d
ebt
0.02
0.02
0.1
0.1
0.04
0.04
0.00
0.02
0.03
0.03
0.04
0.04
0.05
0.04
For
eign
cur
renc
y ex
tern
alde
bt a
s %
of t
otal
deb
t99
.999
.999
.999
.999
.999
.999
.999
.999
.910
0.0
100.
010
0.0
100.
010
0.0
Ann
ual d
isbu
rsem
ents
of
exte
rnal
loan
s as
% o
fpr
inci
pal r
epay
men
ts1,
225.
31,
052.
62,
328.
690
2.5
971.
761
1.1
315.
840
7.3
251.
333
8.9
339.
743
8.9
594.
863
0.4
Tab
le c
ontin
ued
on n
ext p
age
44
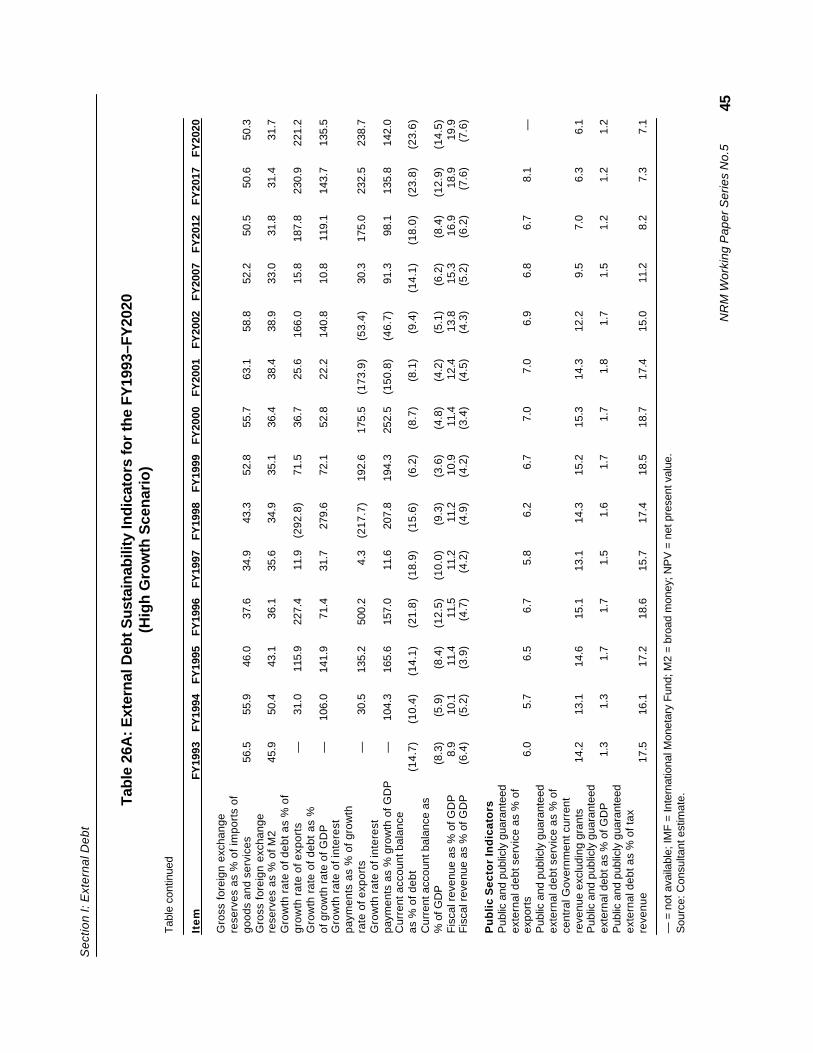
NR
M W
orki
ng P
aper
Ser
ies
No.
5
Sec
tion
I: E
xter
nal D
ebt
Tabl
e 26
A: E
xter
nal D
ebt S
usta
inab
ility
Indi
cato
rs fo
r th
e FY
1993
–FY
2020
(Hig
h G
row
th S
cen
ario
)
Tabl
e co
ntin
ued
Ite
mFY
1993
FY19
94FY
1995
FY19
96FY
1997
FY19
98FY
1999
FY20
00FY
2001
FY20
02FY
2007
FY20
12FY
2017
FY20
20
Gro
ss f
orei
gn e
xcha
nge
rese
rves
as
% o
f im
port
s of
good
s an
d se
rvic
es56
.555
.946
.037
.634
.943
.352
.855
.763
.158
.852
.250
.550
.650
.3G
ross
for
eign
exc
hang
ere
serv
es a
s %
of M
245
.950
.443
.136
.135
.634
.935
.136
.438
.438
.933
.031
.831
.431
.7G
row
th r
ate
of d
ebt a
s %
of
grow
th r
ate
of e
xpor
ts—
31.0
115.
922
7.4
11.9
(292
.8)
71.5
36.7
25.6
166.
015
.818
7.8
230.
922
1.2
Gro
wth
rat
e of
deb
t as
%of
gro
wth
rat
e of
GD
P—
106.
014
1.9
71.4
31.7
279.
672
.152
.822
.214
0.8
10.8
119.
114
3.7
135.
5G
row
th r
ate
of in
tere
stpa
ymen
ts a
s %
of g
row
thra
te o
f exp
orts
—30
.513
5.2
500.
24.
3(2
17.7
)19
2.6
175.
5(1
73.9
)(5
3.4)
30.3
175.
023
2.5
238.
7G
row
th r
ate
of in
tere
stpa
ymen
ts a
s %
gro
wth
of G
DP
—10
4.3
165.
615
7.0
11.6
207.
819
4.3
252.
5(1
50.8
)(4
6.7)
91.3
98.1
135.
814
2.0
Cur
rent
acc
ount
bal
ance
as %
of d
ebt
(14.
7)(1
0.4)
(14.
1)(2
1.8)
(18.
9)(1
5.6)
(6.2
)(8
.7)
(8.1
)(9
.4)
(14.
1)(1
8.0)
(23.
8)(2
3.6)
Cur
rent
acc
ount
bal
ance
as
% o
f GD
P(8
.3)
(5.9
)(8
.4)
(12.
5)(1
0.0)
(9.3
)(3
.6)
(4.8
)(4
.2)
(5.1
)(6
.2)
(8.4
)(1
2.9)
(14.
5)F
isca
l rev
enue
as
% o
f GD
P8.
910
.111
.411
.511
.211
.210
.911
.412
.413
.815
.316
.918
.919
.9F
isca
l rev
enue
as
% o
f GD
P(6
.4)
(5.2
)(3
.9)
(4.7
)(4
.2)
(4.9
)(4
.2)
(3.4
)(4
.5)
(4.3
)(5
.2)
(6.2
)(7
.6)
(7.6
)
Pu
bli
c S
ecto
r In
dic
ato
rsP
ublic
and
pub
licly
gua
rant
eed
exte
rnal
deb
t ser
vice
as
% o
fex
port
s6.
05.
76.
56.
75.
86.
26.
77.
07.
06.
96.
86.
78.
1—
Pub
lic a
nd p
ublic
ly g
uara
ntee
dex
tern
al d
ebt s
ervi
ce a
s %
of
cent
ral G
over
nmen
t cur
rent
reve
nue
excl
udin
g gr
ants
14.2
13.1
14.6
15.1
13.1
14.3
15.2
15.3
14.3
12.2
9.5
7.0
6.3
6.1
Pub
lic a
nd p
ublic
ly g
uara
ntee
dex
tern
al d
ebt a
s %
of G
DP
1.3
1.3
1.7
1.7
1.5
1.6
1.7
1.7
1.8
1.7
1.5
1.2
1.2
1.2
Pub
lic a
nd p
ublic
ly g
uara
ntee
dex
tern
al d
ebt a
s %
of t
axre
venu
e17
.516
.117
.218
.615
.717
.418
.518
.717
.415
.011
.28.
27.
37.
1
— =
not
ava
ilabl
e; IM
F =
Inte
rnat
iona
l Mon
etar
y Fu
nd; M
2 =
broa
d m
oney
; NP
V =
net
pre
sent
val
ue.
Sou
rce:
Con
sulta
nt e
stim
ate.
45
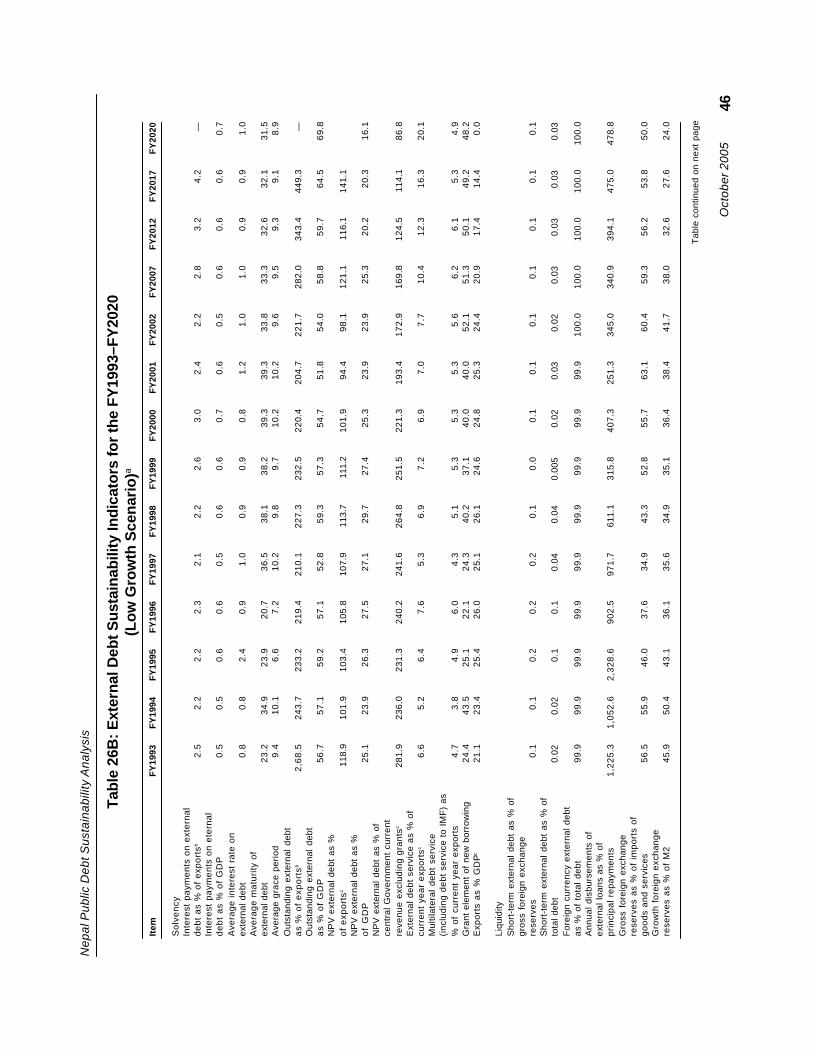
Oct
ober
200
5
Nep
al P
ublic
Deb
t Sus
tain
abili
ty A
naly
sis
Tabl
e 26
B: E
xter
nal D
ebt S
usta
inab
ility
Indi
cato
rs fo
r th
e FY
1993
–FY
2020
(Lo
w G
row
th S
cen
ario
)a
Item
FY
1993
FY
1994
FY
1995
FY
1996
FY
1997
FY
1998
FY
1999
FY
2000
FY
2001
FY
2002
FY
2007
FY
2012
FY
2017
FY
2020
Sol
venc
yIn
tere
st p
aym
ents
on
exte
rnal
debt
as
% o
f ex
port
sb2
.52
.22
.22
.32
.12
.22
.63
.02
.42
.22
.83
.24
.2—
Inte
rest
pay
men
ts o
n et
erna
ld
eb
t a
s %
of
GD
P0
.50
.50
.60
.60
.50
.60
.60
.70
.60
.50
.60
.60
.60
.7A
vera
ge in
tere
st r
ate
onex
tern
al d
ebt
0.8
0.8
2.4
0.9
1.0
0.9
0.9
0.8
1.2
1.0
1.0
0.9
0.9
1.0
Ave
rage
mat
urity
of
exte
rnal
deb
t23
.234
.923
.920
.736
.538
.138
.239
.339
.333
.833
.332
.632
.131
.5A
vera
ge g
race
per
iod
9.4
10.1
6.6
7.2
10.2
9.8
9.7
10.2
10.2
9.6
9.5
9.3
9.1
8.9
Out
stan
ding
ext
erna
l de
bta
s %
of
exp
ort
sb2
,68
.524
3.7
233.
221
9.4
210.
122
7.3
232.
522
0.4
204.
722
1.7
282.
034
3.4
449.
3—
Out
stan
ding
ext
erna
l de
bta
s %
of
GD
P56
.757
.159
.257
.152
.859
.357
.354
.751
.854
.058
.859
.764
.569
.8N
PV
ext
erna
l deb
t as
%of
exp
orts
c11
8.9
101.
910
3.4
105.
810
7.9
113.
711
1.2
101.
994
.498
.112
1.1
116.
114
1.1
NP
V e
xter
nal d
ebt
as %
of
GD
P25
.123
.926
.327
.527
.129
.727
.425
.323
.923
.925
.320
.220
.316
.1N
PV
ext
erna
l de
bt a
s %
of
cent
ral G
over
nmen
t cu
rren
tre
venu
e ex
clud
ing
gran
tsc
281.
923
6.0
231.
324
0.2
241.
626
4.8
251.
522
1.3
193.
417
2.9
169.
812
4.5
114.
186
.8E
xter
nal d
ebt
serv
ice
as %
of
curr
ent
year
exp
orts
c6
.65
.26
.47
.65
.36
.97
.26
.97
.07
.710
.412
.316
.320
.1M
ultil
ater
al d
ebt
serv
ice
(inc
ludi
ng d
ebt
serv
ice
to I
MF
) as
% o
f cu
rren
t ye
ar e
xpor
ts4
.73
.84
.96
.04
.35
.15
.35
.35
.35
.66
.26
.15
.34
.9G
rant
ele
men
t of
new
bor
row
ing
24.4
43.5
25.1
22.1
24.3
40.2
37.1
40.0
40.0
52.1
51.3
50.1
49.2
48.2
Exp
orts
as
% G
DPc
21.1
23.4
25.4
26.0
25.1
26.1
24.6
24.8
25.3
24.4
20.9
17.4
14.4
0.0
Liqu
idity
Sho
rt-t
erm
ext
erna
l de
bt a
s %
of
gros
s fo
reig
n ex
chan
gere
serv
es0
.10
.10
.20
.20
.20
.10
.00
.10
.10
.10
.10
.10
.10
.1S
hort
-ter
m e
xter
nal
debt
as
% o
fto
tal d
ebt
0.02
0.02
0.1
0.1
0.04
0.04
0.00
50.
020.
030.
020.
030.
030.
030.
03F
orei
gn c
urre
ncy
exte
rnal
deb
tas
% o
f to
tal
debt
99.9
99.9
99.9
99.9
99.9
99.9
99.9
99.9
99.9
100.
010
0.0
100.
010
0.0
100.
0A
nnua
l dis
burs
emen
ts o
fex
tern
al lo
ans
as %
of
prin
cipa
l rep
aym
ents
1,22
5.3
1,05
2.6
2,32
8.6
902.
597
1.7
611.
131
5.8
407.
325
1.3
345.
034
0.9
394.
147
5.0
478.
8G
ross
for
eign
exc
hang
ere
serv
es a
s %
of
impo
rts
ofgo
ods
and
serv
ices
56.5
55.9
46.0
37.6
34.9
43.3
52.8
55.7
63.1
60.4
59.3
56.2
53.8
50.0
Gro
wth
for
eign
exc
hang
ere
serv
es a
s %
of
M2
45.9
50.4
43.1
36.1
35.6
34.9
35.1
36.4
38.4
41.7
38.0
32.6
27.6
24.0
Tab
le c
ontin
ued
on n
ext
page
46
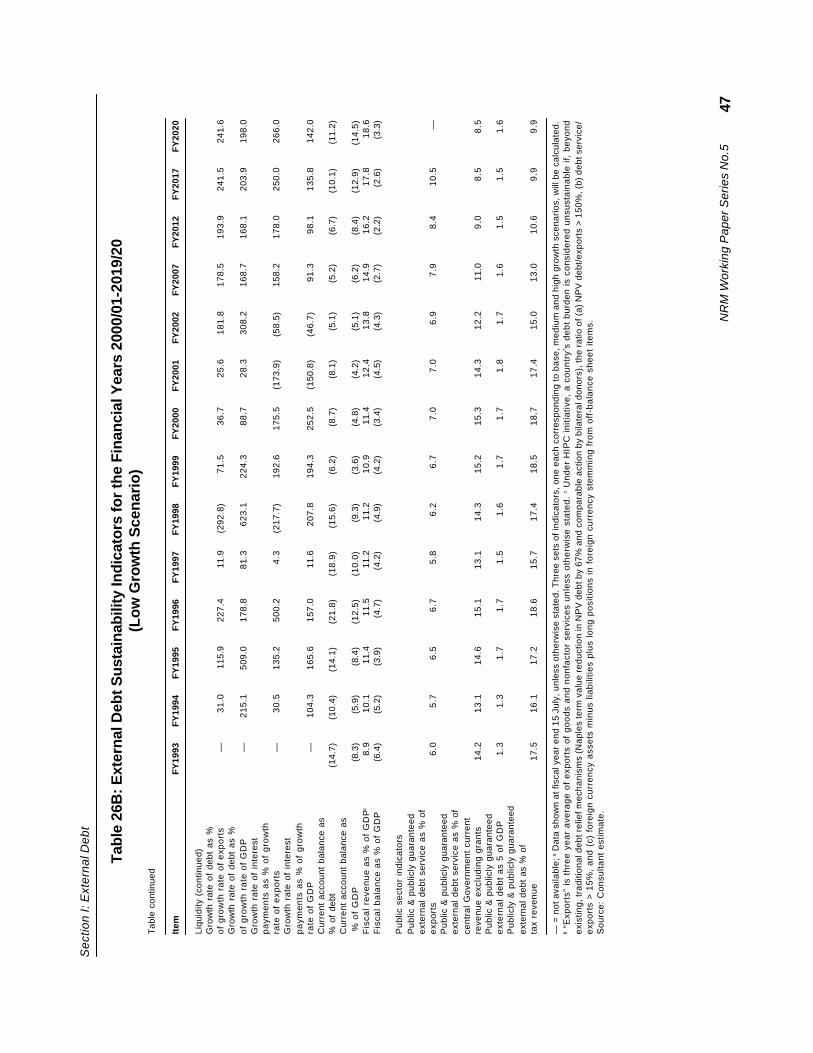
NR
M W
orki
ng P
aper
Ser
ies
No.
5
Sec
tion
I: E
xter
nal D
ebt
Tabl
e 26
B: E
xter
nal D
ebt S
usta
inab
ility
Indi
cato
rs fo
r th
e Fi
nanc
ial Y
ears
200
0/01
-201
9/20
(Lo
w G
row
th S
cen
ario
)T
able
con
tinue
d
Item
FY
1993
FY
1994
FY
1995
FY
1996
FY
1997
FY
1998
FY
1999
FY
2000
FY
2001
FY
2002
FY
2007
FY
2012
FY
2017
FY
2020
Liqu
idity
(co
ntin
ued)
Gro
wth
rat
e of
deb
t as
%of
gro
wth
rat
e of
exp
orts
—31
.011
5.9
227.
411
.9(2
92.8
)71
.536
.725
.618
1.8
178.
519
3.9
241.
524
1.6
Gro
wth
rat
e of
deb
t as
%of
gro
wth
rat
e of
GD
P—
215.
150
9.0
178.
881
.362
3.1
224.
388
.728
.330
8.2
168.
716
8.1
203.
919
8.0
Gro
wth
rat
e of
int
eres
tpa
ymen
ts a
s %
of
grow
thra
te o
f ex
port
s—
30.5
135.
250
0.2
4.3
(217
.7)
192.
617
5.5
(173
.9)
(58.
5)15
8.2
178.
025
0.0
266.
0G
row
th r
ate
of i
nter
est
paym
ents
as
% o
f gr
owth
rate
of
GD
P—
104.
316
5.6
157.
011
.620
7.8
194.
325
2.5
(150
.8)
(46.
7)91
.398
.113
5.8
142.
0C
urre
nt a
ccou
nt b
alan
ce a
s%
of
debt
(14.
7)(1
0.4)
(14.
1)(2
1.8)
(18.
9)(1
5.6)
(6.2
)(8
.7)
(8.1
)(5
.1)
(5.2
)(6
.7)
(10.
1)(1
1.2)
Cur
rent
acc
ount
bal
ance
as
% o
f G
DP
(8.3
)(5
.9)
(8.4
)(1
2.5)
(10.
0)(9
.3)
(3.6
)(4
.8)
(4.2
)(5
.1)
(6.2
)(8
.4)
(12.
9)(1
4.5)
Fis
cal r
eve
nu
e a
s %
of
GD
Pc
8.9
10.1
11.4
11.5
11.2
11.2
10.9
11.4
12.4
13.8
14.9
16.2
17.8
18.6
Fis
cal b
alan
ce a
s %
of
GD
P(6
.4)
(5.2
)(3
.9)
(4.7
)(4
.2)
(4.9
)(4
.2)
(3.4
)(4
.5)
(4.3
)(2
.7)
(2.2
)(2
.6)
(3.3
)
Pub
lic s
ecto
r in
dica
tors
Pub
lic &
pub
licly
gua
rant
eed
exte
rnal
deb
t se
rvic
e as
% o
fex
port
s6
.05
.76
.56
.75
.86
.26
.77
.07
.06
.97
.98
.410
.5—
Pub
lic &
pub
licly
gua
rant
eed
exte
rnal
deb
t se
rvic
e as
% o
fce
ntra
l Gov
ernm
ent
curr
ent
reve
nue
excl
udin
g gr
ants
14.2
13.1
14.6
15.1
13.1
14.3
15.2
15.3
14.3
12.2
11.0
9.0
8.5
8.5
Pub
lic &
pub
licly
gua
rant
eed
exte
rnal
deb
t as
5 o
f G
DP
1.3
1.3
1.7
1.7
1.5
1.6
1.7
1.7
1.8
1.7
1.6
1.5
1.5
1.6
Pub
licly
& p
ublic
ly g
uara
ntee
dex
tern
al d
ebt
as %
of
tax
reve
nue
17.5
16.1
17.2
18.6
15.7
17.4
18.5
18.7
17.4
15.0
13.0
10.6
9.9
9.9
— =
not
ava
ilabl
e; a D
ata
show
n at
fisc
al y
ear
end
15 J
uly,
unl
ess
othe
rwis
e st
ated
. Thr
ee s
ets
of in
dica
tors
, one
eac
h co
rres
pond
ing
to b
ase,
med
ium
and
hig
h gr
owth
sce
nari
os, w
ill b
e ca
lcul
ated
.b
“Exp
orts
” is
thr
ee y
ear
aver
age
of e
xpor
ts o
f go
ods
and
nonf
acto
r se
rvic
es u
nles
s ot
herw
ise
stat
ed.
c U
nder
HIP
C in
itiat
ive,
a c
ount
ry’s
deb
t bu
rden
is c
onsi
dere
d un
sust
aina
ble
if, b
eyon
dex
istin
g, tr
aditi
onal
deb
t rel
ief m
echa
nism
s (N
aple
s te
rm v
alue
red
uctio
n in
NP
V d
ebt b
y 67
% a
nd c
ompa
rabl
e ac
tion
by b
ilate
ral d
onor
s), t
he r
atio
of (
a) N
PV
deb
t/ex
port
s >
150
%, (
b) d
ebt s
ervi
ce/
expo
rts
> 1
5%,
and
(c)
fore
ign
curr
ency
ass
ets
min
us li
abili
ties
plus
long
pos
ition
s in
for
eign
cur
renc
y st
emm
ing
from
off
-bal
ance
she
et it
ems.
Sou
rce:
Con
sulta
nt e
stim
ate.
47
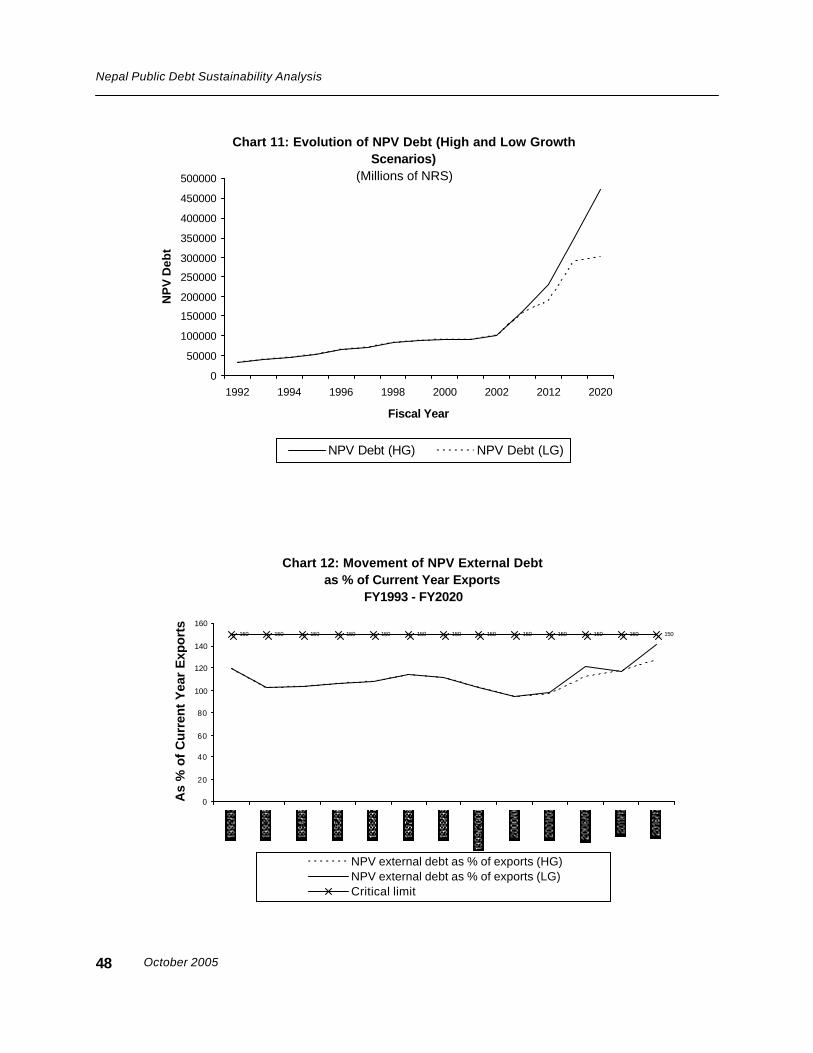
October 2005
Nepal Public Debt Sustainability Analysis
Chart 11: Evolution of NPV Debt (High and Low Growth Scenarios)
(Millions of NRS)
0
50000
100000
150000
200000
250000
300000
350000
400000
450000
500000
1992 1994 1996 1998 2000 2002 2012 2020
Fiscal Year
NP
V D
ebt
NPV Debt (HG) NPV Debt (LG)
Chart 12: Movement of NPV External Debt as % of Current Year Exports
FY1993 - FY2020
150 150 150 150 150 150 150 150 150 150 150 150150
0
20
40
60
80
100
120
140
160
Year
As
% o
f C
urre
nt Y
ear
Exp
orts
NPV external debt as % of exports (HG)NPV external debt as % of exports (LG)Critical limit
48

NRM Working Paper Series No.5
Section I: External Debt
Chart 13: Movement of External Debt Service as % of Current Year Exports FY1993 - FY2020
0
5
10
15
20
25
1992/93 1994/95 1996/97 1998/99 2000/01 2006/07 2016/17
Fiscal Year
As
% o
f Cu
rren
t Yea
r E
xpo
rts
External debt service as % of current year exports (HG)External debt service as % of current year exports (3)Critical limit
Liquidity indicators present a generally favorable picture under both growth scenarios. Short-term debt obligations would remain very modest in relation to term borrowing by the public sector.Annual loan disbursements are likely to be far in excess of gross flow. Gross foreign exchangereserves would be maintained at a reasonable level ensuring coverage of at least six monthsworth of imports. Gross foreign exchange reserves as percentage of M2 remains in excess of30%. This indicator measures external vulnerability in a crisis, showing the potential impact of aloss of confidence in the domestic currency, leading to capital flight by residents. The measure isrelevant for countries with a weak banking sector and unreliable exchange regime. Nepal’s bank-ing system is indeed weak although the exchange rate regime is working with a reasonable degreeof stability that now faces the threat of political unrest following Maoist attack on the Governmentand subsequent declaration of a state of emergency. The attack destroyed the Coca Cola plantand has seriously hampered production of domestic liquor—two important sources of excise rev-enue. Even without such extraordinary events, fiscal deficit is projected to worsen significantlybetween now and FY2020. Nepal may also face both solvency and liquidity constraint due to itslarge holdings of Indian currency as reserves. The current yield on Indian currency reserve is low(4.5% and 91 day treasury bill rate) and Nepal does not have access right to the Indian foreignexchange market. There is no repudiation risk as Nepal has never been in arrears in meeting itsdebt obligations.
49
October 2005
Nepal Public Debt Sustainability Analysis
In terms of external debt obligations of the public sector, the trend basically follows that oftotal external debt, because much of it is contracted by the Government or guaranteed by it. Theratio of public and publicly guaranteed public debt to exports increases from 7% in FY2002 to over8% by the end of the period. However, there is an improvement in terms of indicators relating toexternal public DOD to GDP, central Government current revenue and tax revenue (Table 26).
II. PUBLIC DEBT
A. Review of Current Public Debt Position
1. Overview of Public Debt Position
Nepal’s public debt position is projected to remain manageable but vigilance will be prudenton account of questions related to fiscal sustainability and currency composition of exports andforeign reserves. At end FY2001, total public debt stood at NRs248,313 million (Table 22). Externaldebt component of public debt has been discussed above. As for domestic debt, total DOD stoodat NRs56,576 million as at end FY2000. Between FY1993 and FY2001, domestic DOD aspercentage of GDP remained unchanged at 14%, but as percentage of central Government currentrevenue it declined from 161% to 120%. Bonds accounted for a third of total domestic DOD inFY2001, deposits about a quarter, treasury bills 15% and the balance, other securities. Amongholders of domestic debt instruments, the share of the banking system was close to 40%, littleover 1% public, and the balance, other holders. Domestic debt service burden was high at 3–4%of GDP throughout the 1990s and at about a third of central Government current revenue. Debtand debt service burden turns out to be heavier if one looks together at both domestic and externaldebt although there was a marked improvement between FY1993 and FY2001. The most importantpush factor contributing to increase of public debt was the primary deficits, especially discretionaryprimary balance. Other push factors included interest payment and exchange rate valuationadjustment of the foreign currency denominated debt. The growth factor was a pull factor. Totalpublic debt as percentage of GDP declined marginally between FY1993 and FY2001, but as apercentage of revenue, it declined by a third. During the 1990s, total public debt service burdenwas estimated at 4–6% of GDP and 47–49% of central Government current revenue. Futurerequirements for external and domestic borrowing will differ significantly depending on growthassumptions. Under the high growth scenario, the nominal value of total public debt is projected toincrease by a factor of seven, mostly external. Total public debt/GDP ratio is projected to declineslightly, but domestic ration by 80% while the external debt ratio would actually increase by 20%from 50% to 60%. As percentage of central Government current revenue, total public debt isprojected to decline by about half to 319% between FY2001 and FY2020. All the ratios are lower forthe low growth scenario. The external debt burden will clearly be increasing substantially if thecountry were to realize the high growth assumptions. A good part of the external borrowing is to fillthe balance of payments deficit, which is likely to increase threefold as percentage of GDP to 13%.Much of the country risk is linked to external vulnerability. NPV total national debt is projected toincrease from NRs103,584 million in FY2001 to NRs491,189 million in 2020 under high growth andNRs318,555 under low growth assumption. NPV of both domestic and external debts is projectedto grow almost five times by FY2020 under high growth assumption, the increase as expectedbeing lower for low growth scenario.
50
NRM Working Paper Series No.5
Section II: Public Debt
2. Nepal’s Public Domestic Debt During the 1990s
a. The Level of Public Domestic Debt
Public domestic debt increased substantially during the 1990s but as percentageof GDP it remained stable. Public domestic debt increased two and half times between FY1993and FY2001 from NRs23,164 million to NRs56,576 million (Table 27). As percentage of GDP,public domestic debt remained stable around 14% throughout the 1990s. On the other hand, aspercentage of Government revenue, public domestic debt declined from 161% in FY1993 to 120%in FY2001. The Government has, in the past, followed a prudent policy with regard to domesticborrowing. New borrowing was kept below 1% of GDP, which is undertaken after a very carefulreview of the anticipated revenue expenditure gap. An annual ceiling set by the parliament acts asa restraint on domestic borrowing. In Nepal, crowding out effect of domestic borrowing is minimal.Actually, Government borrowing helps to mop up excess liquidity, which has limited outlet due topoor business climate. A narrow rage of well designed instruments is used to mobilize domesticresources. These include treasury bills, special bonds, development bonds and national savingscertificates. Issuance of prize bonds has been discontinued. The Government is considering issuinga new instrument called the citizenship certificate for individual public. NRB advises the Governmenton the timing of borrowing linked to interest rate and the Government overdraft with the bankingsystem.
b. Public Domestic Debt by Instrument
Bonds as an instrument of domestic borrowing are declining in importance whileshares of treasury bills and savings certificates are on the rise. At present, on behalf of MOF,NRB issues five different types of debt instruments to mobilize resources. These instrumentsinclude treasury bills, development bonds, national savings certificates and special bonds.Domestic debt instruments help mobilize resources to finance development as well as to promotecapital markets. Treasury bills, for example, are important short-term instruments that promotedevelopment of active money market allowing transactions with a minimum cost. In Nepal, treasurybills were the fist type of debt instrument issued in 1961 and has been a regular conduit of internaldebt since 1964. These bills have maturities of 91 days and 364 days. Both are sold throughauctions. Prior to FY1990, treasury bills were sold at fixed interest rates (1%, 3% and 5%). Normally,treasury bills are issued each Tuesday of the week, in the denomination of NRs25,000 and multiplesthereof. Fifteen percent of treasury bills are reserved for non-competitive buyers. The bills are soldat a discount and the full face value is paid to the holder on maturity. The difference representsyield on investment. A treasury bill is transferable by endorsement like a promissory note. It can besold to any person, firm, or corporate body. Although treasury bills are very liquid, in view of theirshort maturity, low yield, and large volume requirement to make money, individuals shy away fromthese. Dealings in this type of security are usually confined to institutional investors like banks,insurance companies, and business firms.
Development bonds are popular among commercial banks, financial institutions,development banks and individuals. It was first floated in Nepal on Feb. 12, 1964, and amounted toNRs13.1 million, carrying an interest rate of 5% per annum. Bonds were issued with maturity
51
October 2005
Nepal Public Debt Sustainability Analysis
ranging from one to five years. It is now available for up to three years. NRB sells developmentbonds at face value. Minimum buying unit of this type of bond is NRs251 and maximum is amultiple of NRs251 up to offered amount. The interest is payable semi-annually but the principalamount is paid at the redemption date. The bonds are transferable to other investors. Paymentsare based on registration. Development bonds are taxable.
For small savers, national saving certificates are most popular as an instrument of savings.Individuals, Trusts, trading houses, financial companies and development banks hold thesecertificates. Prior to 1984, development bonds were issued under this category. In 1984, the 15-year national saving certificate was introduced. Unless otherwise stipulated by the NRB, anyonecan buy a minimum denomination of NRs100 and multiples thereof up to the offered amount. Thenational saving certificate is a tax free instrument. Occasionally, NRB may require holders to paytaxes. Until recently, national savings certificates were available for a maturity ranging from 3 to 15years. The maximum maturity is now 5 years. The shortening of maturity was linked to the difficultyin projecting evolution of interest rate over the longer term. In light of the popularity of nationalsavings certificates with the public, the Government is contemplating the introduction of a citizenshipsavings certificate geared towards individual small savers alone.
The Government for the amount of funds used from the central bank, commercial banksand others, issues special bonds. The maturity is 1 to 5 years.
In line with the Government’s policy to develop capital and money market, steps have beentaken to promote the development of secondary market for treasury bills and other debt instruments.The NRB through its nine branches and commercial banks are authorized to buy and sell treasurybills. The NRB, its branches, commercial banks, 24 finance companies and selected cooperativesare authorized to transact other instruments. Each intermediary receives a commission dependingon the volume of transaction. Owners of debt instruments can redeem their holding before maturitydirectly through NRB or through the secondary market. For example, treasury bills can be redeemedat the inter-bank transaction or at the secondary window facility of NRB which has been availablefor the past 6 years. Bonds can be sold through endorsement or transacted (bought and sold)through secondary market at authorized institutions known as the market maker of the bond.
The Public Debt Department of NRB is the secretariat for public domestic debt management.It is responsible for the issuance of Government securities, interest payment and redemption. TheDepartment performs two distinct functions, issuance of debt instruments and policy articulationon behalf of the monetary authority, pursuing very specific targets through its dealings in thesecondary market for such securities. Under the management of the Public Debt Department, thedomestic debt operation seems to be moving rather smoothly. Yield structure is balanced andproperly aligned with other alternatives available to the savers in the market. Although the maturitystructure has been shortened, it has worked very well and no quarter has raised any issue. Thethree-year development bonds have usually been oversubscribed.
In terms of distribution of domestic debt by instruments, bonds remain the most importantelement although its share in total has dwindled from 60% in FY1993 to about a third in FY2001(Table 27 and Chart 14). The share of treasury bills increased from 19% to 29% and that of savingscertificates (deposits), from 21% to 24% over the same period. More significant gain has been
52
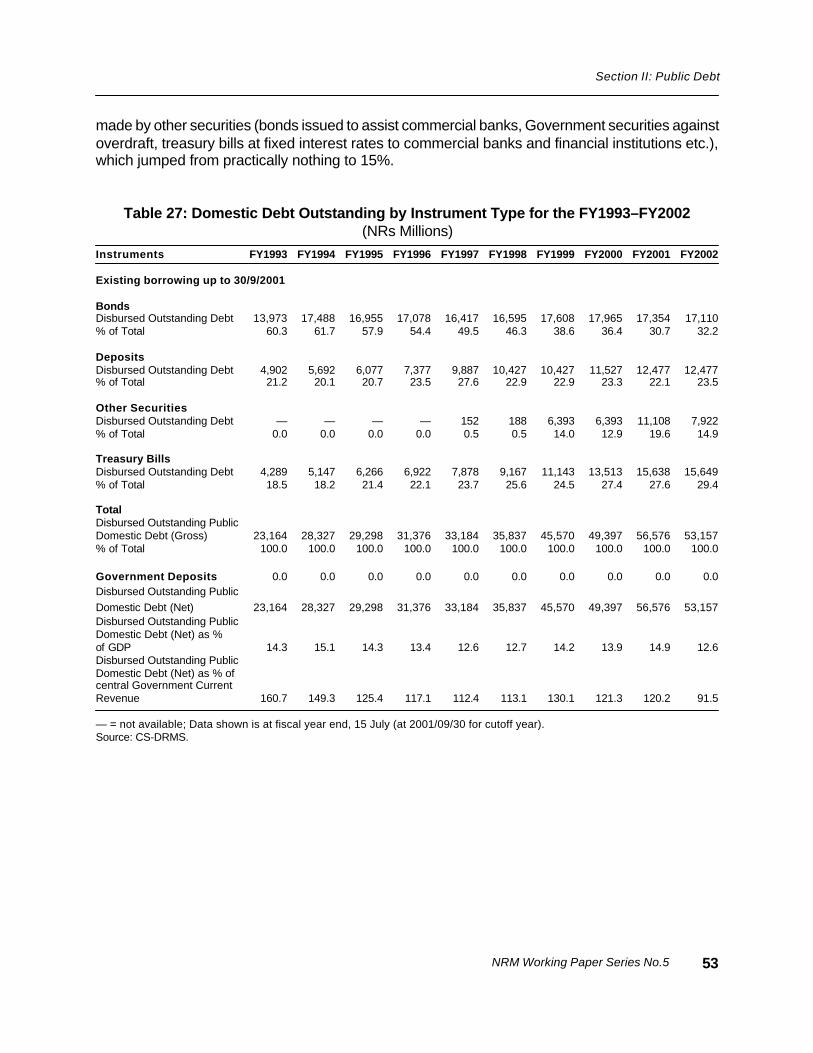
NRM Working Paper Series No.5
Section II: Public Debt
made by other securities (bonds issued to assist commercial banks, Government securities againstoverdraft, treasury bills at fixed interest rates to commercial banks and financial institutions etc.),which jumped from practically nothing to 15%.
Table 27: Domestic Debt Outstanding by Instrument Type for the FY1993–FY2002(NRs Millions)
Instruments FY1993 FY1994 FY1995 FY1996 FY1997 FY1998 FY1999 FY2000 FY2001 FY2002
Existing borrowing up to 30/9/2001
BondsDisbursed Outstanding Debt 13,973 17,488 16,955 17,078 16,417 16,595 17,608 17,965 17,354 17,110% of Total 60.3 61.7 57.9 54.4 49.5 46.3 38.6 36.4 30.7 32.2
DepositsDisbursed Outstanding Debt 4,902 5,692 6,077 7,377 9,887 10,427 10,427 11,527 12,477 12,477% of Total 21.2 20.1 20.7 23.5 27.6 22.9 22.9 23.3 22.1 23.5
Other SecuritiesDisbursed Outstanding Debt — — — — 152 188 6,393 6,393 11,108 7,922% of Total 0.0 0.0 0.0 0.0 0.5 0.5 14.0 12.9 19.6 14.9
Treasury BillsDisbursed Outstanding Debt 4,289 5,147 6,266 6,922 7,878 9,167 11,143 13,513 15,638 15,649% of Total 18.5 18.2 21.4 22.1 23.7 25.6 24.5 27.4 27.6 29.4
TotalDisbursed Outstanding PublicDomestic Debt (Gross) 23,164 28,327 29,298 31,376 33,184 35,837 45,570 49,397 56,576 53,157% of Total 100.0 100.0 100.0 100.0 100.0 100.0 100.0 100.0 100.0 100.0
Government Deposits 0.0 0.0 0.0 0.0 0.0 0.0 0.0 0.0 0.0 0.0Disbursed Outstanding PublicDomestic Debt (Net) 23,164 28,327 29,298 31,376 33,184 35,837 45,570 49,397 56,576 53,157Disbursed Outstanding PublicDomestic Debt (Net) as %of GDP 14.3 15.1 14.3 13.4 12.6 12.7 14.2 13.9 14.9 12.6Disbursed Outstanding PublicDomestic Debt (Net) as % ofcentral Government CurrentRevenue 160.7 149.3 125.4 117.1 112.4 113.1 130.1 121.3 120.2 91.5
— = not available; Data shown is at fiscal year end, 15 July (at 2001/09/30 for cutoff year).Source: CS-DRMS.
53
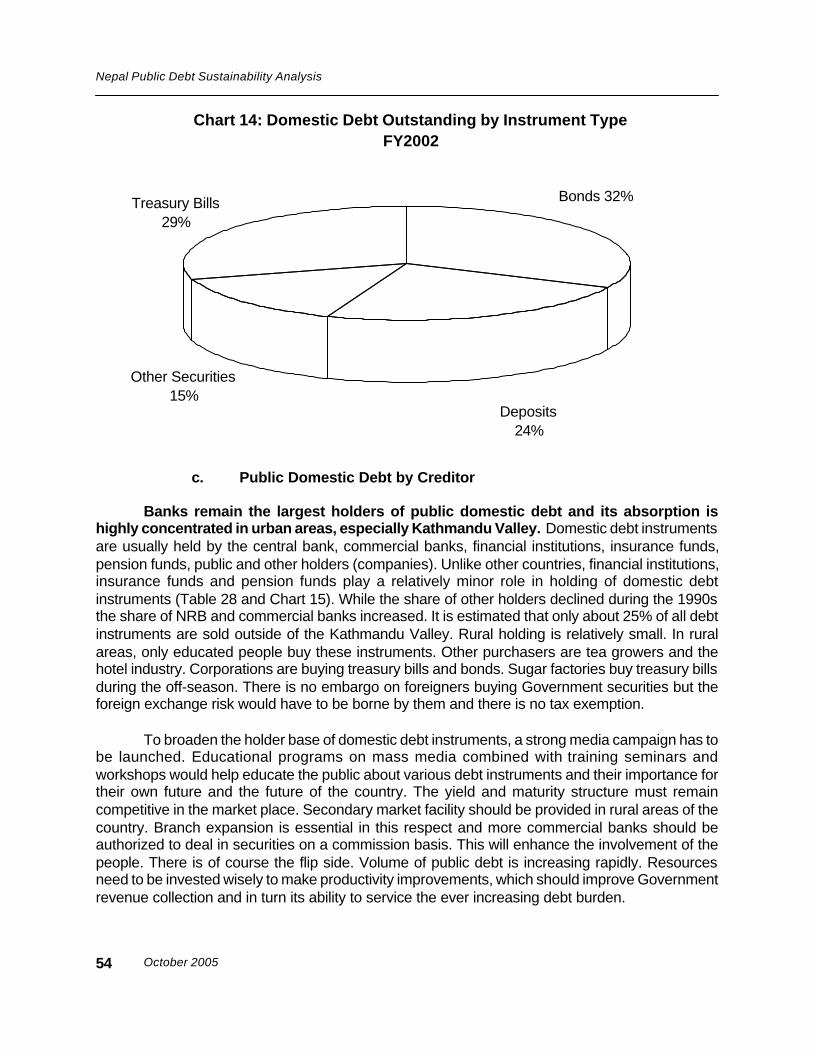
October 2005
Nepal Public Debt Sustainability Analysis
Chart 14: Domestic Debt Outstanding by Instrument Type FY2002
Deposits24%
Other Securities15%
Bonds 32%Treasury Bills29%
c. Public Domestic Debt by Creditor
Banks remain the largest holders of public domestic debt and its absorption ishighly concentrated in urban areas, especially Kathmandu Valley. Domestic debt instrumentsare usually held by the central bank, commercial banks, financial institutions, insurance funds,pension funds, public and other holders (companies). Unlike other countries, financial institutions,insurance funds and pension funds play a relatively minor role in holding of domestic debtinstruments (Table 28 and Chart 15). While the share of other holders declined during the 1990sthe share of NRB and commercial banks increased. It is estimated that only about 25% of all debtinstruments are sold outside of the Kathmandu Valley. Rural holding is relatively small. In ruralareas, only educated people buy these instruments. Other purchasers are tea growers and thehotel industry. Corporations are buying treasury bills and bonds. Sugar factories buy treasury billsduring the off-season. There is no embargo on foreigners buying Government securities but theforeign exchange risk would have to be borne by them and there is no tax exemption.
To broaden the holder base of domestic debt instruments, a strong media campaign has tobe launched. Educational programs on mass media combined with training seminars andworkshops would help educate the public about various debt instruments and their importance fortheir own future and the future of the country. The yield and maturity structure must remaincompetitive in the market place. Secondary market facility should be provided in rural areas of thecountry. Branch expansion is essential in this respect and more commercial banks should beauthorized to deal in securities on a commission basis. This will enhance the involvement of thepeople. There is of course the flip side. Volume of public debt is increasing rapidly. Resourcesneed to be invested wisely to make productivity improvements, which should improve Governmentrevenue collection and in turn its ability to service the ever increasing debt burden.
54
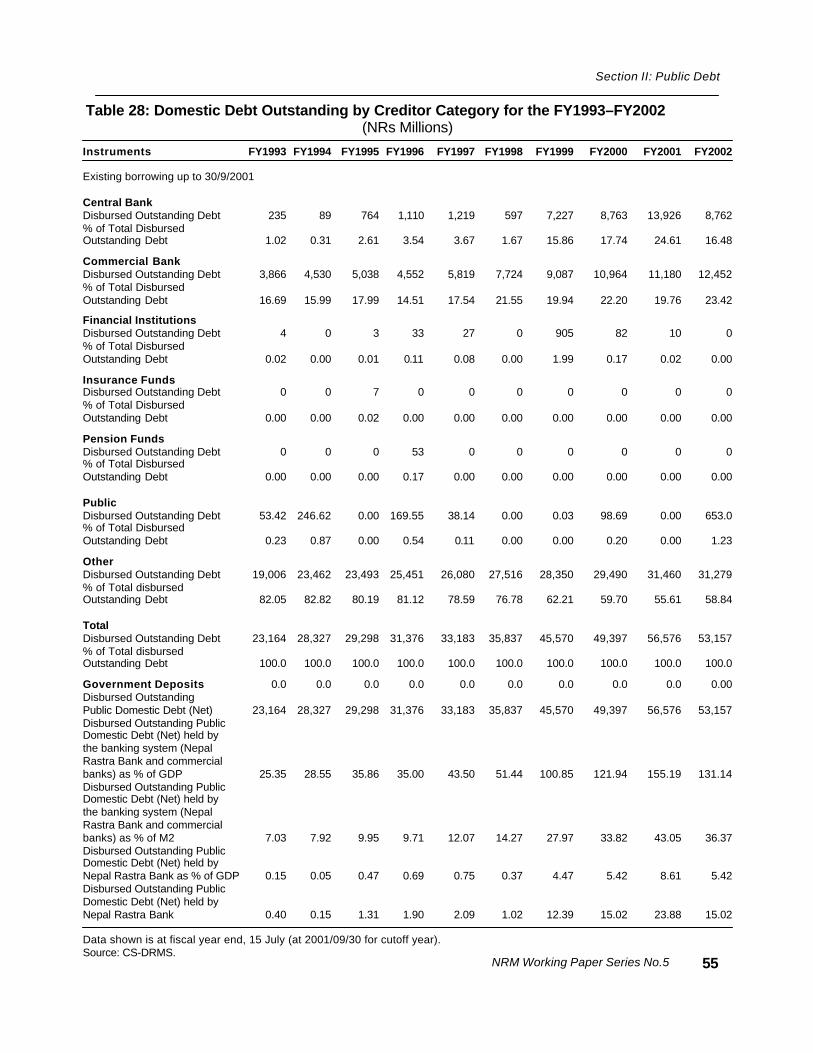
NRM Working Paper Series No.5
Section II: Public Debt
Table 28: Domestic Debt Outstanding by Creditor Category for the FY1993–FY2002(NRs Millions)
Instruments FY1993 FY1994 FY1995 FY1996 FY1997 FY1998 FY1999 FY2000 FY2001 FY2002
Existing borrowing up to 30/9/2001
Central BankDisbursed Outstanding Debt 235 89 764 1,110 1,219 597 7,227 8,763 13,926 8,762% of Total DisbursedOutstanding Debt 1.02 0.31 2.61 3.54 3.67 1.67 15.86 17.74 24.61 16.48
Commercial BankDisbursed Outstanding Debt 3,866 4,530 5,038 4,552 5,819 7,724 9,087 10,964 11,180 12,452% of Total DisbursedOutstanding Debt 16.69 15.99 17.99 14.51 17.54 21.55 19.94 22.20 19.76 23.42
Financial InstitutionsDisbursed Outstanding Debt 4 0 3 33 27 0 905 82 10 0% of Total DisbursedOutstanding Debt 0.02 0.00 0.01 0.11 0.08 0.00 1.99 0.17 0.02 0.00
Insurance FundsDisbursed Outstanding Debt 0 0 7 0 0 0 0 0 0 0% of Total DisbursedOutstanding Debt 0.00 0.00 0.02 0.00 0.00 0.00 0.00 0.00 0.00 0.00
Pension FundsDisbursed Outstanding Debt 0 0 0 53 0 0 0 0 0 0% of Total DisbursedOutstanding Debt 0.00 0.00 0.00 0.17 0.00 0.00 0.00 0.00 0.00 0.00
PublicDisbursed Outstanding Debt 53.42 246.62 0.00 169.55 38.14 0.00 0.03 98.69 0.00 653.0% of Total DisbursedOutstanding Debt 0.23 0.87 0.00 0.54 0.11 0.00 0.00 0.20 0.00 1.23
OtherDisbursed Outstanding Debt 19,006 23,462 23,493 25,451 26,080 27,516 28,350 29,490 31,460 31,279% of Total disbursedOutstanding Debt 82.05 82.82 80.19 81.12 78.59 76.78 62.21 59.70 55.61 58.84
TotalDisbursed Outstanding Debt 23,164 28,327 29,298 31,376 33,183 35,837 45,570 49,397 56,576 53,157% of Total disbursedOutstanding Debt 100.0 100.0 100.0 100.0 100.0 100.0 100.0 100.0 100.0 100.0
Government Deposits 0.0 0.0 0.0 0.0 0.0 0.0 0.0 0.0 0.0 0.00Disbursed OutstandingPublic Domestic Debt (Net) 23,164 28,327 29,298 31,376 33,183 35,837 45,570 49,397 56,576 53,157Disbursed Outstanding PublicDomestic Debt (Net) held bythe banking system (NepalRastra Bank and commercialbanks) as % of GDP 25.35 28.55 35.86 35.00 43.50 51.44 100.85 121.94 155.19 131.14Disbursed Outstanding PublicDomestic Debt (Net) held bythe banking system (NepalRastra Bank and commercialbanks) as % of M2 7.03 7.92 9.95 9.71 12.07 14.27 27.97 33.82 43.05 36.37Disbursed Outstanding PublicDomestic Debt (Net) held byNepal Rastra Bank as % of GDP 0.15 0.05 0.47 0.69 0.75 0.37 4.47 5.42 8.61 5.42Disbursed Outstanding PublicDomestic Debt (Net) held byNepal Rastra Bank 0.40 0.15 1.31 1.90 2.09 1.02 12.39 15.02 23.88 15.02
Data shown is at fiscal year end, 15 July (at 2001/09/30 for cutoff year).Source: CS-DRMS.
55
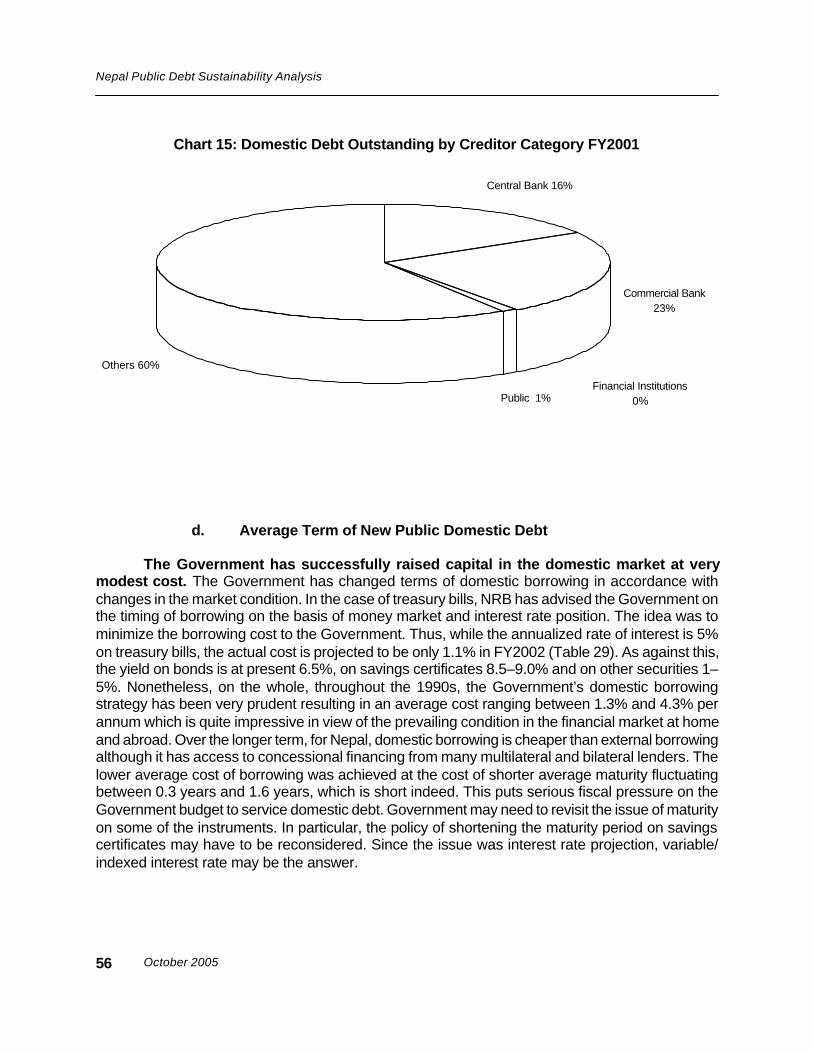
October 2005
Nepal Public Debt Sustainability Analysis
Chart 15: Domestic Debt Outstanding by Creditor Category FY2001
Public 1%Financial Institutions
0%
Commercial Bank23%
Central Bank 16%
Others 60%
d. Average Term of New Public Domestic Debt
The Government has successfully raised capital in the domestic market at verymodest cost. The Government has changed terms of domestic borrowing in accordance withchanges in the market condition. In the case of treasury bills, NRB has advised the Government onthe timing of borrowing on the basis of money market and interest rate position. The idea was tominimize the borrowing cost to the Government. Thus, while the annualized rate of interest is 5%on treasury bills, the actual cost is projected to be only 1.1% in FY2002 (Table 29). As against this,the yield on bonds is at present 6.5%, on savings certificates 8.5–9.0% and on other securities 1–5%. Nonetheless, on the whole, throughout the 1990s, the Government’s domestic borrowingstrategy has been very prudent resulting in an average cost ranging between 1.3% and 4.3% perannum which is quite impressive in view of the prevailing condition in the financial market at homeand abroad. Over the longer term, for Nepal, domestic borrowing is cheaper than external borrowingalthough it has access to concessional financing from many multilateral and bilateral lenders. Thelower average cost of borrowing was achieved at the cost of shorter average maturity fluctuatingbetween 0.3 years and 1.6 years, which is short indeed. This puts serious fiscal pressure on theGovernment budget to service domestic debt. Government may need to revisit the issue of maturityon some of the instruments. In particular, the policy of shortening the maturity period on savingscertificates may have to be reconsidered. Since the issue was interest rate projection, variable/indexed interest rate may be the answer.
56
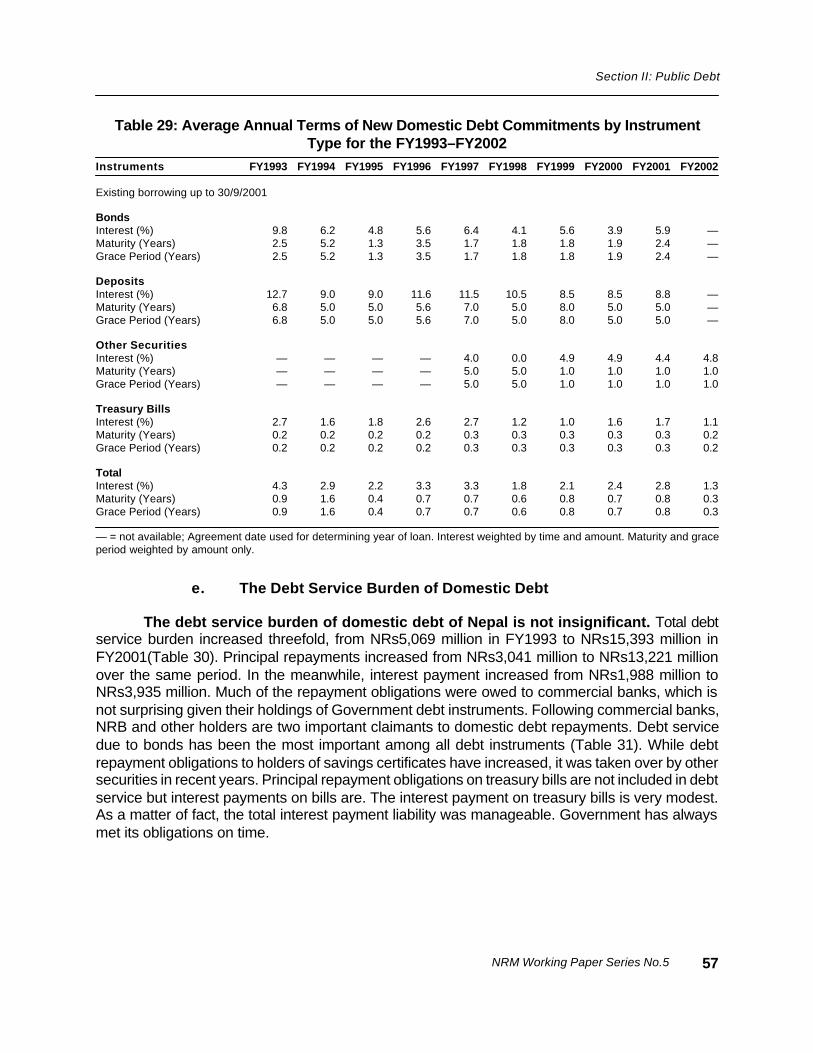
NRM Working Paper Series No.5
Section II: Public Debt
Table 29: Average Annual Terms of New Domestic Debt Commitments by InstrumentType for the FY1993–FY2002
Instruments FY1993 FY1994 FY1995 FY1996 FY1997 FY1998 FY1999 FY2000 FY2001 FY2002
Existing borrowing up to 30/9/2001
BondsInterest (%) 9.8 6.2 4.8 5.6 6.4 4.1 5.6 3.9 5.9 —Maturity (Years) 2.5 5.2 1.3 3.5 1.7 1.8 1.8 1.9 2.4 —Grace Period (Years) 2.5 5.2 1.3 3.5 1.7 1.8 1.8 1.9 2.4 —
DepositsInterest (%) 12.7 9.0 9.0 11.6 11.5 10.5 8.5 8.5 8.8 —Maturity (Years) 6.8 5.0 5.0 5.6 7.0 5.0 8.0 5.0 5.0 —Grace Period (Years) 6.8 5.0 5.0 5.6 7.0 5.0 8.0 5.0 5.0 —
Other SecuritiesInterest (%) — — — — 4.0 0.0 4.9 4.9 4.4 4.8Maturity (Years) — — — — 5.0 5.0 1.0 1.0 1.0 1.0Grace Period (Years) — — — — 5.0 5.0 1.0 1.0 1.0 1.0
Treasury BillsInterest (%) 2.7 1.6 1.8 2.6 2.7 1.2 1.0 1.6 1.7 1.1Maturity (Years) 0.2 0.2 0.2 0.2 0.3 0.3 0.3 0.3 0.3 0.2Grace Period (Years) 0.2 0.2 0.2 0.2 0.3 0.3 0.3 0.3 0.3 0.2
TotalInterest (%) 4.3 2.9 2.2 3.3 3.3 1.8 2.1 2.4 2.8 1.3Maturity (Years) 0.9 1.6 0.4 0.7 0.7 0.6 0.8 0.7 0.8 0.3Grace Period (Years) 0.9 1.6 0.4 0.7 0.7 0.6 0.8 0.7 0.8 0.3
— = not available; Agreement date used for determining year of loan. Interest weighted by time and amount. Maturity and graceperiod weighted by amount only.
e. The Debt Service Burden of Domestic Debt
The debt service burden of domestic debt of Nepal is not insignificant. Total debtservice burden increased threefold, from NRs5,069 million in FY1993 to NRs15,393 million inFY2001(Table 30). Principal repayments increased from NRs3,041 million to NRs13,221 millionover the same period. In the meanwhile, interest payment increased from NRs1,988 million toNRs3,935 million. Much of the repayment obligations were owed to commercial banks, which isnot surprising given their holdings of Government debt instruments. Following commercial banks,NRB and other holders are two important claimants to domestic debt repayments. Debt servicedue to bonds has been the most important among all debt instruments (Table 31). While debtrepayment obligations to holders of savings certificates have increased, it was taken over by othersecurities in recent years. Principal repayment obligations on treasury bills are not included in debtservice but interest payments on bills are. The interest payment on treasury bills is very modest.As a matter of fact, the total interest payment liability was manageable. Government has alwaysmet its obligations on time.
57
October 2005
Nepal Public Debt Sustainability Analysis
3. Domestic Debt Projections
a. Evolution of Domestic Debt
Projections for the future indicate a significant increase in new domesticborrowing. New domestic debt will increase twenty fold between FY2002 and FY2020, fromNRs5,458 million to NRs100,219 million under the high growth scenario and six fold to NRs30,124million under the low growth scenario. Such a growth of public domestic debt under both scenarioswould imply that new borrowing would be well in excess of 1% of GDP, which the authorities hadbeen trying to maintain. As percentage of GDP at current prices, new domestic debt would increasefrom 1.2% in FY2002 to 3.4% in FY2020 under high growth scenario and 1.4% under low growthscenario (Table 32). However in terms of total domestic debt there will be an improvement as DODwould only double over the period under high growth scenario and would actually decline by almost50% under the low growth scenario. The share of domestic DOD in GDP at current prices woulddecline substantially under both scenarios, from 15% to 4% and 1% respectively, under high andlow growth scenarios (Table 22).
b. Evolution of Domestic Debt Service
Domestic debt service burden though increasing would remain modest over theperiod under consideration. Domestic debt service obligation would increase from NRs14,322million in FY2002 to NRs79,339 million in FY2020 under the high growth scenario, a five and halffold increase (Table 23). Under the low growth scenario, debt service is projected to double overthe same period. Future debt service was calculated assuming that past changes in the structureof debt by instrument would continue. As percentage of GDP, total domestic debt service wouldremain stable around 3% under high growth scenario. As percentage of Government revenue, onthe other hand, domestic debt service would decline from 38% to 26%. The correspondingpercentages are significantly lower for the low growth scenario.
58

NR
M W
orki
ng P
aper
Ser
ies
No.
5
Sec
tion
II: P
ublic
Deb
t Tabl
e 30
: Dom
estic
Deb
t Ser
vice
Pay
men
ts b
y C
redi
tor
Cat
egor
y fo
r th
e FY
199
3–FY
2012
(NR
s M
illio
ns)
Cre
dit
or
FY
1993
FY
1994
FY
1995
FY
1996
FY
1997
FY
1998
FY
1999
FY
2000
FY
2001
FY
2002
FY
2007
FY
2012
Deb
t se
rvic
e pa
ymen
ts o
n ex
istin
g de
bt u
p to
30/
9/20
01
Cen
tral
Ban
kP
rinc
ipal
Rep
aym
ents
2
,06
3.4
4
04.8
2
,44
3.8
7
,59
3.1
3
,47
6.9
3
,97
7.5
4
,56
5.2
8
,19
5.7
10
,42
4.8
6
,60
3.2
0.0
0.0
Inte
rest
Pay
men
ts
5
4.3
9
.7
4
4.4
1
91.3
1
04.8
84.
7
49
.4
324
.4
571
.4
115
.60.
00.
0T
otal
Deb
t S
ervi
ce
2,1
17.8
4
14.5
2
,48
8.2
7
,78
4.5
3
,58
1.9
4
,06
2.5
4
,62
1.9
8
,53
4.2
11,
003.
4
6,7
88
.90.
00.
0
Co
mm
erci
al b
ank
Pri
ncip
al R
epay
men
ts 1
2,5
17
.3 1
7,1
82
.6 1
6,3
35
.1 1
4,3
81
.0 1
9,1
23
.7 2
1,5
19
.2 2
4,0
97
.8 2
9,4
13
.3 3
3,6
59
.5
4,9
41
.50.
00.
0In
tere
st P
aym
ents
3
48.8
3
30.6
2
66.4
3
35.2
5
56.9
2
85.1
2
02.2
3
99.8
6
14.8
4
,94
1.5
0.0
0.0
Tot
al D
ebt
Ser
vice
12
,86
6.1
17
,51
3.2
16
,60
1.5
14
,71
6.2
19
,68
0.6
21
,80
4.3
24
,30
0.0
29
,81
4.7
34
,27
4.3
5
,00
1.0
0.0
0.0
Fin
anci
al in
stit
uti
on
Pri
ncip
al R
epay
men
ts
1
0.2
6
.8
6.4
49.
0
201.
9
27
.5
316
.7
916
.5
9
2.0
9.
50.
00.
0In
tere
st P
aym
ents
0
.3
0.2
0
.1
1.4
5
.8
1.0
11.
5
50
.9
2.0
0.0
0.0
0.0
Tot
al D
ebt
Ser
vice
10.
5
7.0
6
.5
5
0.4
20
7.7
28.5
3
28.2
9
67.4
94.
00.
00.
00.
0
Insu
ran
ce f
un
ds
Pri
ncip
al R
epay
men
ts0.
00.
00.
00.
0
14
.60.
00.
00.
00.
00.
00.
00.
0In
tere
st P
aym
ents
0.0
0.0
0.0
0.0
0.
40.
00.
00.
00.
00.
00.
00.
0T
otal
Deb
t S
ervi
ce0.
00.
00.
00.
0
15
.00.
00.
00.
00.
00.
00.
00.
0
Pen
sio
n f
un
ds
Pri
ncip
al R
epay
men
ts0.
0
183
.30.
0
5
5.2
18
5.8
0.0
0.0
49
5.5
0.0
0.0
0.0
0.0
Inte
rest
Pay
men
ts0.
0
3.7
0.0
1
.8
5.5
0.0
0.0
4.
20.
00.
00.
00.
0T
otal
Deb
t S
ervi
ce0.
0
187
.00.
0
5
7.0
19
1.3
0.0
0.0
49
9.7
0.0
0.0
0.0
0.0
Pu
bli
cP
rinc
ipal
Rep
aym
ents
85.
4
215
.4
770
.0
650
.2
1,0
23
.9
3
8.1
0.0
0.0
1
,31
3.0
6
53.3
0.0
0.0
Inte
rest
Pay
men
ts
2.6
4
.6
1
2.3
17.
6
29
.6
0.9
0.0
0.0
17.
00.
00.
00.
0T
otal
Deb
t S
ervi
ce
8
8.0
2
20.0
7
82.3
6
67.8
1
,05
3.5
39.
00.
00.
0
1,3
30
.00.
00.
00.
0
Oth
erP
rinc
ipal
Rep
aym
ents
3
,22
6.1
3
,84
6.8
3
,14
7.8
4
,41
3.2
6
,77
5.7
5
,00
1.5
7
,77
7.8
8
,62
0.3
12
,53
7.7
9
84.7
1
,86
0.0
0.0
Inte
rest
Pay
men
ts
1,5
82
.9
1,7
36
.5
1,8
74
.3
1,8
52
.8
2,0
42
.5
2,0
51
.3
2,1
19.5
1
,63
9.5
2
,72
9.5
1
83.1
47
5.8
0.0
Tot
al D
ebt
Ser
vice
4
,84
8.3
5
,62
5.6
5
,06
8.5
6
,32
2.8
8
,87
0.9
7
,10
8.5
9
,95
0.6
10
,28
8.8
15
,28
9.9
1
,16
7.8
2
,35
4.0
0
.6
To
tal
deb
t se
rvic
e o
n e
xist
ing
pu
blic
do
mes
tic
deb
tP
rinc
ipal
Rep
aym
ents
3
,04
0.7
3
,12
5.7
2
,17
7.1
1
,93
1.8
2
,46
9.6
1
,76
8.6
3
,95
7.9
9
,53
8.2
13
,22
0.7
11,
474.
2
1,8
60
.00.
0In
tere
st P
aym
ents
1
,98
8.9
2
,08
5.3
2
,19
7.6
2
,40
0.1
2
,74
5.6
2
,42
2.9
2
,38
2.7
2
,41
8.8
3
,93
4.7
4
28.2
47
5.8
0.0
Tot
al D
ebt
Ser
vice
5
,06
8.9
5
,25
3.3
4
,42
1.0
4
,38
8.8
5
,26
8.1
4
,24
7.6
6
,40
1.1
11,
969.
6 1
5,3
93
.3 1
4,3
22
.5
2,3
35
.80.
0
Tot
al d
ebt s
ervi
ce e
xclu
des
repa
ymen
t of t
reas
ury
bills
. As
shor
t-te
rm d
ebt (
less
than
one
yea
r), o
nly
inte
rest
pay
men
t on
this
inst
rum
ent i
s co
nsid
ered
in to
tal d
ebt
serv
ice.
Sou
rce:
CS
-DR
MS
.
59
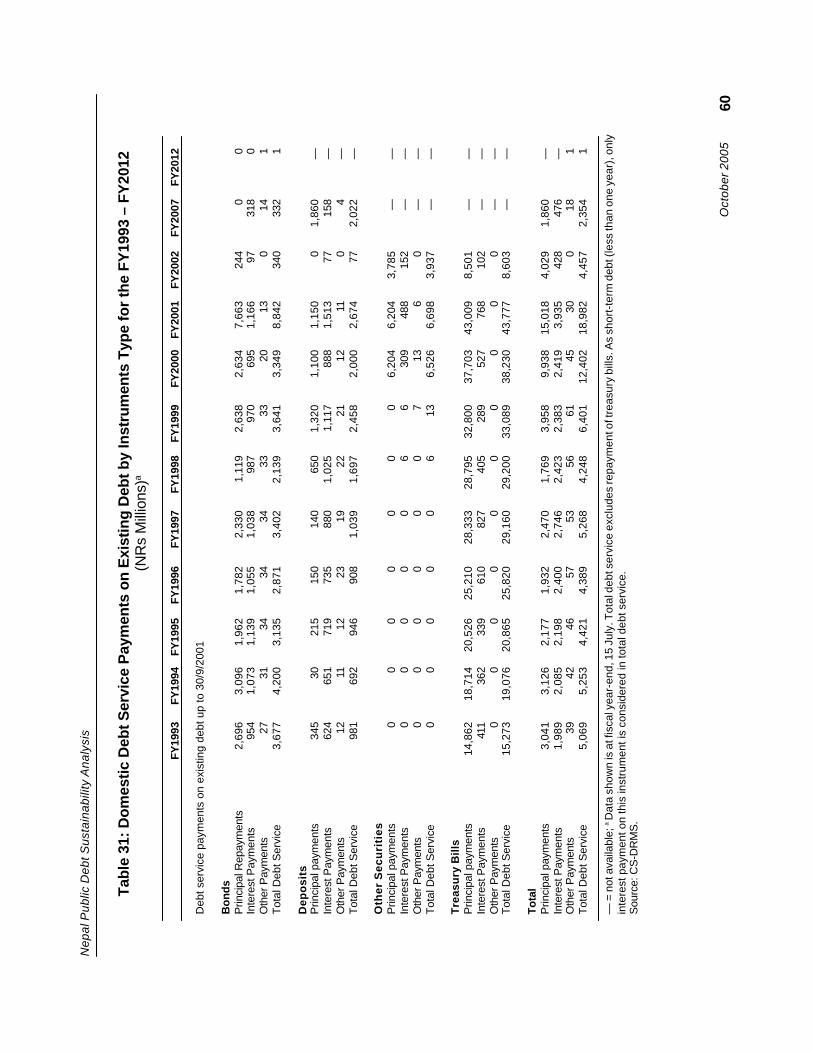
Oct
ober
200
5
Nep
al P
ublic
Deb
t Sus
tain
abili
ty A
naly
sis
Tabl
e 31
: Dom
estic
Deb
t Ser
vice
Pay
men
ts o
n E
xist
ing
Deb
t by
Inst
rum
ents
Typ
e fo
r th
e FY
1993
– F
Y20
12(N
Rs
Mill
ions
)a
FY
1993
FY19
94FY
1995
FY19
96FY
1997
FY19
98FY
1999
FY20
00FY
2001
FY20
02FY
2007
FY20
12
Deb
t ser
vice
pay
men
ts o
n ex
istin
g de
bt u
p to
30/
9/20
01
Bo
nd
sP
rinci
pal R
epay
men
ts
2,6
96
3,0
96
1,9
62
1,7
82
2,3
30
1,1
19
2,6
38
2,6
34
7,6
6324
40
0In
tere
st P
aym
ents
954
1
,073
1
,139
1
,055
1
,038
987
970
695
1
,166
9731
80
Oth
er P
aym
ents
27
31
34
34
34
33
33
20
13
014
1T
otal
Deb
t Ser
vice
3
,677
4
,200
3
,135
2
,871
3
,402
2
,139
3
,641
3
,349
8
,842
340
332
1
Dep
osi
tsP
rinci
pal p
aym
ents
345
30
215
150
140
650
1
,320
1
,100
1
,150
0
1,86
0—
Inte
rest
Pay
men
ts
6
24
6
51
7
19
7
35
8
80
1,0
25
1,1
17
8
88
1,5
1377
158
—O
ther
Pay
men
ts
12
11
12
23
19
22
21
12
110
4
—T
otal
Deb
t Ser
vice
981
692
946
908
1
,039
1
,697
2
,458
2
,000
2
,674
77
2,02
2—
Oth
er S
ecu
riti
esP
rinci
pal p
aym
ents
00
00
00
0
6,2
04
6,2
04
3,78
5—
—In
tere
st P
aym
ents
00
00
06
6
3
09
4
88
15
2—
—O
ther
Pay
men
ts0
00
00
07
13
6
0—
—T
otal
Deb
t Ser
vice
00
00
06
13
6,5
26
6,6
98
3,93
7—
—
Tre
asu
ry B
ills
Prin
cipa
l pay
men
ts 1
4,86
2 1
8,71
4 2
0,52
6 2
5,21
0 2
8,33
3 2
8,79
5 3
2,80
0 3
7,70
3 4
3,00
9
8,50
1—
—In
tere
st P
aym
ents
411
362
339
610
827
405
289
527
768
102
——
Oth
er P
aym
ents
00
00
00
00
00
——
Tot
al D
ebt S
ervi
ce 1
5,27
3 1
9,07
6 2
0,86
5 2
5,82
0 2
9,16
0 2
9,20
0 3
3,08
9 3
8,23
0 4
3,77
7
8,60
3—
—
Tota
lP
rinci
pal p
aym
ents
3
,041
3
,126
2
,177
1
,932
2
,470
1
,769
3
,958
9
,938
15,
018
4,
029
1,
860
—In
tere
st P
aym
ents
1
,989
2
,085
2
,198
2
,400
2
,746
2
,423
2
,383
2
,419
3
,935
428
476
—O
ther
Pay
men
ts
39
42
46
57
53
56
61
45
300
18
1
Tot
al D
ebt S
ervi
ce
5,0
69
5,2
53
4,4
21
4,3
89
5,2
68
4,2
48
6,4
01 1
2,40
2 1
8,98
2
4,45
7
2,35
4
1
— =
not
ava
ilabl
e; a D
ata
show
n is
at f
isca
l yea
r-en
d, 1
5 Ju
ly. T
otal
deb
t ser
vice
exc
lude
s re
paym
ent o
f tre
asur
y bi
lls. A
s sh
ort-
term
deb
t (le
ss th
an o
ne y
ear)
, onl
yin
tere
st p
aym
ent o
n th
is in
stru
men
t is
cons
ider
ed in
tota
l deb
t ser
vice
.S
ourc
e: C
S-D
RM
S.
60
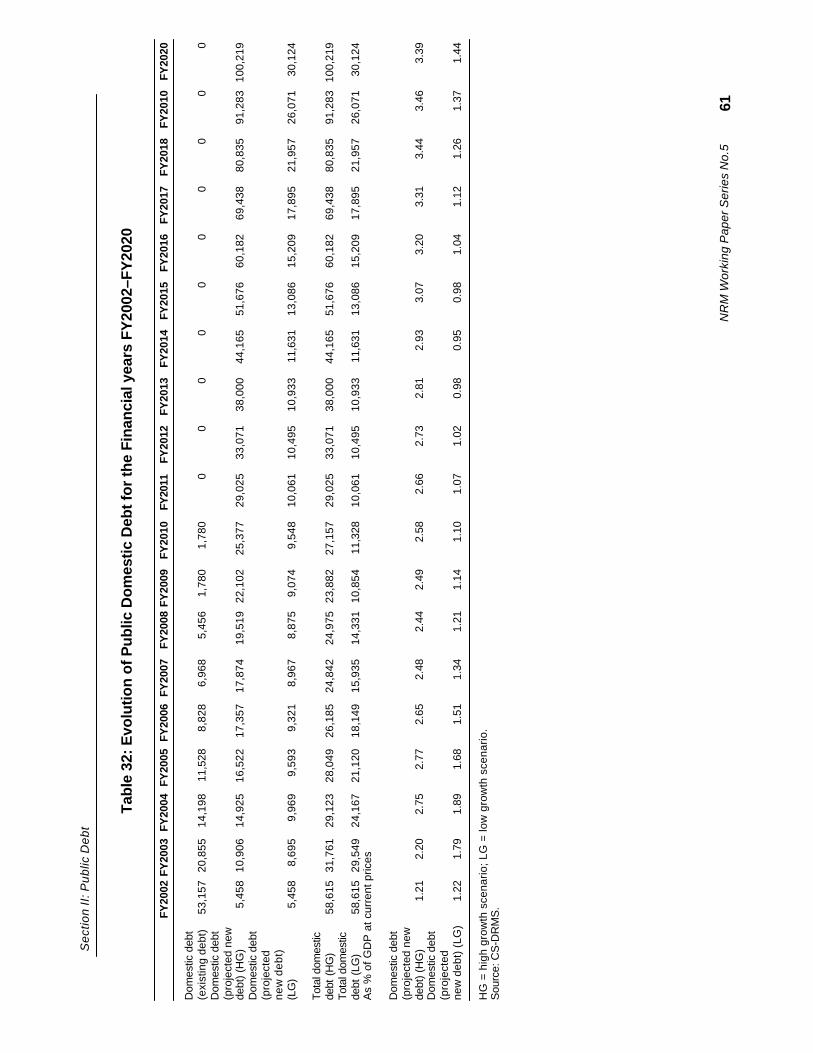
NR
M W
orki
ng P
aper
Ser
ies
No.
5
Sec
tion
II: P
ublic
Deb
t
Tabl
e 32
: Evo
lutio
n of
Pub
lic D
omes
tic D
ebt f
or th
e Fi
nanc
ial y
ears
FY
2002
–FY
2020
FY
2002
FY20
03FY
2004
FY20
05FY
2006
FY20
07FY
2008
FY20
09FY
2010
FY20
11FY
2012
FY20
13FY
2014
FY20
15FY
2016
FY20
17FY
2018
FY20
10FY
2020
Dom
estic
deb
t(e
xist
ing
debt
) 5
3,15
7 2
0,85
5 1
4,19
8 1
1,52
8
8,8
28
6,9
68
5,4
56
1,7
80
1,7
800
00
00
00
00
0D
omes
tic d
ebt
(pro
ject
ed n
ewde
bt) (
HG
)
5,4
58 1
0,90
6 1
4,92
5 1
6,52
2 1
7,35
7 1
7,87
4 1
9,51
9 2
2,10
2 2
5,37
7 2
9,02
5 3
3,07
1 3
8,00
0 4
4,16
5 5
1,67
6 6
0,18
2 6
9,43
8 8
0,83
5 9
1,28
3 1
00,2
19D
omes
tic d
ebt
(pro
ject
edne
w d
ebt)
(LG
)
5,4
58
8,6
95
9,9
69
9,5
93
9,3
21
8,9
67
8,8
75
9,0
74
9,5
48 1
0,06
1 1
0,49
5 1
0,93
3 1
1,63
1 1
3,08
6 1
5,20
9 1
7,89
5 2
1,95
7 2
6,07
1
30,
124
Tota
l dom
estic
debt
(H
G)
58,
615
31,
761
29,
123
28,
049
26,
185
24,
842
24,
975
23,
882
27,
157
29,
025
33,
071
38,
000
44,
165
51,
676
60,
182
69,
438
80,
835
91,
283
100
,219
Tota
l dom
estic
debt
(LG
) 5
8,61
5 2
9,54
9 2
4,16
7 2
1,12
0 1
8,14
9 1
5,93
5 1
4,33
1 1
0,85
4 1
1,32
8 1
0,06
1 1
0,49
5 1
0,93
3 1
1,63
1 1
3,08
6 1
5,20
9 1
7,89
5 2
1,95
7 2
6,07
1
30,
124
As
% o
f GD
P a
t cur
rent
pric
es
Dom
estic
deb
t(p
roje
cted
new
debt
) (H
G)
1.21
2.20
2.75
2.77
2.65
2.48
2.44
2.49
2.58
2.66
2.73
2.81
2.93
3.07
3.20
3.31
3.44
3.46
3.39
Dom
estic
deb
t(p
roje
cted
new
deb
t) (
LG)
1.22
1.79
1.89
1.68
1.51
1.34
1.21
1.14
1.10
1.07
1.02
0.98
0.95
0.98
1.04
1.12
1.26
1.37
1.44
HG
= h
igh
grow
th s
cena
rio; L
G =
low
gro
wth
sce
nario
.S
ourc
e: C
S-D
RM
S.
61
October 2005
Nepal Public Debt Sustainability Analysis
c. NPV Public Domestic Debt
NPV domestic debt is much lower than NPV external debt. As at end FY2002, NPVdomestic debt stood at NRs46,380 million as compared with NRs100,253 million for NPV externaldebt under the high growth scenario (Table 25). NPV domestic debt would increase by only 17% byFY2020. Under low growth scenario, NPV domestic debt is projected to decline sharply toNRs17,571 million. As percentage of GDP, NPV domestic debt would decline from 11.0% in FY2002to 2.1% in FY2020 under the high growth scenario and to less than 1.0% under the low growthscenario. As percentage of central Government revenue, the decline is from 80% to 10% under thehigh growth, and to 5% under the low growth scenario.
B. Public Debt Sustainability Analysis
1. Public Debt Projections
a. Evolution of Public Debt
The level of public debt of Nepal is quite substantial and it is likely to increasefurther in the coming years. Public debt is the sum of domestic debt and external debt. Duringthe 1990s, public debt increased only two fold from NRs114,432 million in FY1993 to NRs248,313million in FY2001 (Table 22). The implications of the two growth scenarios are markedly different.Public debt is projected to grow seven fold under high growth scenario and five fold under lowgrowth scenario. As percentages of GDP and Government revenue, the trend is favorable—GDPrelated figure moving from 71% in FY1993 to 65% in FY2001 and 63% in FY2020. The correspondingfigures for low growth scenario and revenue percentage moving from 794% to 527% and 319%,respectively.
b. Evolution of Public Debt Service Burden
Public debt service would continue to claim a substantial share (between a quarterand a fifth) of fiscal revenue by FY2020. Public debt service burden is projected to declineslightly from 5.3% of GDP and 38.0% of central Government current revenue in FY2002, to 5.1%and 26.0% respectively, in FY2020 under the high growth scenario (Table 23). In case Nepal istrapped along the low growth path, the end year debt ratios will be much lower, 3.7% and 20.0%respectively. Despite decline in critical ratios, the fiscal burden remains substantial. Implied interestrate on public debt was estimated at 2.5% in FY1993 and FY2001. It is projected to decline to 1.0%in FY2020 under high growth scenario and to 0.99% under low growth scenario. Interest paymenton public debt as percentage of GDP, declined from 1.8% in FY1993 to 1.6% in FY2001and isprojected to further decline to 0.6% under high growth scenario and 0.7% under low growth scenario.Interest payment on public debt as percentage of central Government revenue declined from 19.7%in FY1993 to 13.3% in FY2001. It is projected to further decline to 3.1% under high growth scenarioand 3.7% under low growth scenario.
62

NRM Working Paper Series No.5
Section II: Public Debt
c. Public Debt Dynamics
Discretionary primary fiscal balance is the most important push factor for increasein public debt. At end FY2001, total public debt stood at NRs248,313 million. The most importantpush factor contributing to increase of public debt during the 1990s was the primary deficits (Table33), especially discretionary primary balance. Other push factors included interest payment andexchange rate valuation adjustment of the foreign currency denominated debt. The growth factorwas a pull factor.
d. NPV of National Debt
NPV public debt as percentage of GDP would decline substantially between FY2001 andFY2020. At the end of FY2001 NPV national debt was estimated at NRs103,584 million (Table 25).It is projected to increase about five fold by FY2020 under high growth scenario and three foldunder low growth scenario. NPV national debt as percentage of GDP declined from 71% in FY1993to 67% in FY2001. It is projected to further decline to 19% under high growth scenario and 17%under low growth scenario.
2. Public Debt Sustainability and Country Risk
a. Public Debt Sustainability Indicators
Projected public debt sustainability indicators for Nepal show an improving trendbut there are areas of concern, which need to be monitored closely. Public debt sustainabilityindicators are presented in Table 34. By and large, past trend and future projections show animprovement. Despite improvement in all ratios, public debt as percentage of GDP would stillremain 50% or more of GDP under alternative growth scenarios in FY2020. Similarly, as percentageof central Government revenue, public debt would remain 250% or more. Public debt service aspercentage of GDP is projected to fluctuate between 3% and 5% under both scenarios. Thesepercentages are not out of line with selected countries for which data were compiled in Table 19,but these call for continuous monitoring and surveillance. NPV national debt as percentage ofGDP and central Government revenue would remain quite manageable. As indicated earlier, publicdebt service as percentage of central Government revenue may cause some concern. It appearspublic debt service would claim a fifth or more of Government revenue. For a country like Nepalthis may be source of trouble. The projected evolution of the fiscal balance of the Governmentraises serious question about future macroeconomic stability as fiscal deficit worsens as percentageof GDP from 4.5% in FY2001 to 7.6% in FY2020 under the high growth scenario. The situationappears more manageable under the low growth scenario as the ratio remains around 3.0% bythe end period of projection. Total public debt would continue to impose some burden on theNepalese economy under both scenarios although projections suggest an improvement over timein all relevant indicators. The areas of concern, mentioned earlier, are several: (i) fiscal sustainability;(ii) relatively large share of Indian currency in foreign reserve; (iii) potential for underachievement inkey foreign exchange earners like tourism, workers’ remittances, and export of carpets, handicraftsand readymade garments; (iv) public enterprise loan arrears (see below); (v) burgeoning fiscaldeficit; (vi) productivity of public investments; (vii) relatively short average maturity of domesticdebt; and (viii) narrow holder base of domestic debt.
63
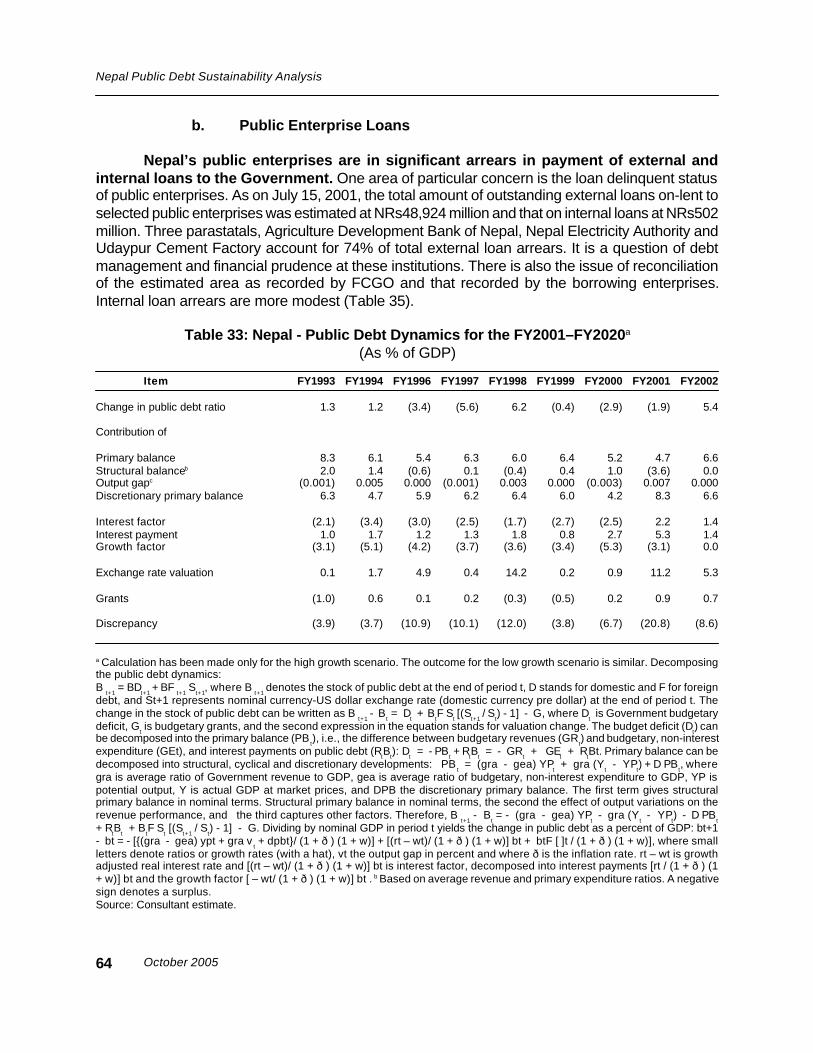
October 2005
Nepal Public Debt Sustainability Analysis
b. Public Enterprise Loans
Nepal’s public enterprises are in significant arrears in payment of external andinternal loans to the Government. One area of particular concern is the loan delinquent statusof public enterprises. As on July 15, 2001, the total amount of outstanding external loans on-lent toselected public enterprises was estimated at NRs48,924 million and that on internal loans at NRs502million. Three parastatals, Agriculture Development Bank of Nepal, Nepal Electricity Authority andUdaypur Cement Factory account for 74% of total external loan arrears. It is a question of debtmanagement and financial prudence at these institutions. There is also the issue of reconciliationof the estimated area as recorded by FCGO and that recorded by the borrowing enterprises.Internal loan arrears are more modest (Table 35).
Table 33: Nepal - Public Debt Dynamics for the FY2001–FY2020a
(As % of GDP)
Item FY1993 FY1994 FY1996 FY1997 FY1998 FY1999 FY2000 FY2001 FY2002
Change in public debt ratio 1.3 1.2 (3.4) (5.6) 6.2 (0.4) (2.9) (1.9) 5.4
Contribution of
Primary balance 8.3 6.1 5.4 6.3 6.0 6.4 5.2 4.7 6.6Structural balanceb 2.0 1.4 (0.6) 0.1 (0.4) 0.4 1.0 (3.6) 0.0Output gapc (0.001) 0.005 0.000 (0.001) 0.003 0.000 (0.003) 0.007 0.000Discretionary primary balance 6.3 4.7 5.9 6.2 6.4 6.0 4.2 8.3 6.6
Interest factor (2.1) (3.4) (3.0) (2.5) (1.7) (2.7) (2.5) 2.2 1.4Interest payment 1.0 1.7 1.2 1.3 1.8 0.8 2.7 5.3 1.4Growth factor (3.1) (5.1) (4.2) (3.7) (3.6) (3.4) (5.3) (3.1) 0.0
Exchange rate valuation 0.1 1.7 4.9 0.4 14.2 0.2 0.9 11.2 5.3
Grants (1.0) 0.6 0.1 0.2 (0.3) (0.5) 0.2 0.9 0.7
Discrepancy (3.9) (3.7) (10.9) (10.1) (12.0) (3.8) (6.7) (20.8) (8.6)
a Calculation has been made only for the high growth scenario. The outcome for the low growth scenario is similar. Decomposingthe public debt dynamics:B
t+1 = BD
t+1 + BF
t+1 S
t+1, where B
t+1 denotes the stock of public debt at the end of period t, D stands for domestic and F for foreign
debt, and St+1 represents nominal currency-US dollar exchange rate (domestic currency pre dollar) at the end of period t. Thechange in the stock of public debt can be written as B
t+1 - B
t = D
t + B
tF S
t [(S
t+1 / S
t) - 1] - G, where D
t is Government budgetary
deficit, Gt is budgetary grants, and the second expression in the equation stands for valuation change. The budget deficit (D
t) can
be decomposed into the primary balance (PBt), i.e., the difference between budgetary revenues (GR
t) and budgetary, non-interest
expenditure (GEt), and interest payments on public debt (RtB
t): D
t = - PB
t + R
tB
t = - GR
t + GE
t + R
tBt. Primary balance can be
decomposed into structural, cyclical and discretionary developments: PBt = (gra - gea) YP
t + gra (Y
t - YP
t) + D PB
t, where
gra is average ratio of Government revenue to GDP, gea is average ratio of budgetary, non-interest expenditure to GDP, YP ispotential output, Y is actual GDP at market prices, and DPB the discretionary primary balance. The first term gives structuralprimary balance in nominal terms. Structural primary balance in nominal terms, the second the effect of output variations on therevenue performance, and the third captures other factors. Therefore, B
t+1 - B
t = - (gra - gea) YP
t - gra (Y
t - YP
t) - D PB
t+ R
tB
t + B
tF S
t [(S
t+1 / S
t) - 1] - G. Dividing by nominal GDP in period t yields the change in public debt as a percent of GDP: bt+1
- bt = - [{(gra - gea) ypt + gra vt + dpbt}/ (1 + ð ) (1 + w)] + [(rt – wt)/ (1 + ð ) (1 + w)] bt + btF [ ]t / (1 + ð ) (1 + w)], where small
letters denote ratios or growth rates (with a hat), vt the output gap in percent and where ð is the inflation rate. rt – wt is growthadjusted real interest rate and [(rt – wt)/ (1 + ð ) (1 + w)] bt is interest factor, decomposed into interest payments [rt / (1 + ð ) (1+ w)] bt and the growth factor [ – wt/ (1 + ð ) (1 + w)] bt . b Based on average revenue and primary expenditure ratios. A negativesign denotes a surplus.Source: Consultant estimate.
64
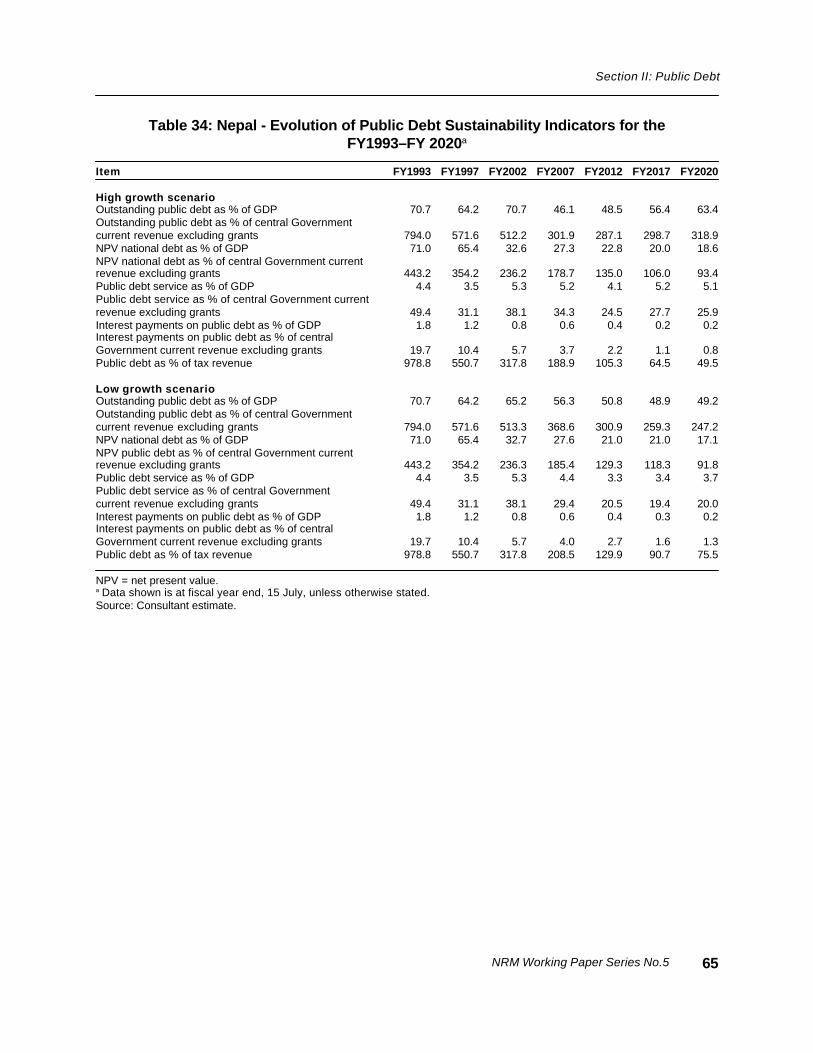
NRM Working Paper Series No.5
Section II: Public Debt
Table 34: Nepal - Evolution of Public Debt Sustainability Indicators for theFY1993–FY 2020a
Item FY1993 FY1997 FY2002 FY2007 FY2012 FY2017 FY2020
High growth scenarioOutstanding public debt as % of GDP 70.7 64.2 70.7 46.1 48.5 56.4 63.4Outstanding public debt as % of central Governmentcurrent revenue excluding grants 794.0 571.6 512.2 301.9 287.1 298.7 318.9NPV national debt as % of GDP 71.0 65.4 32.6 27.3 22.8 20.0 18.6NPV national debt as % of central Government currentrevenue excluding grants 443.2 354.2 236.2 178.7 135.0 106.0 93.4Public debt service as % of GDP 4.4 3.5 5.3 5.2 4.1 5.2 5.1Public debt service as % of central Government currentrevenue excluding grants 49.4 31.1 38.1 34.3 24.5 27.7 25.9Interest payments on public debt as % of GDP 1.8 1.2 0.8 0.6 0.4 0.2 0.2Interest payments on public debt as % of centralGovernment current revenue excluding grants 19.7 10.4 5.7 3.7 2.2 1.1 0.8Public debt as % of tax revenue 978.8 550.7 317.8 188.9 105.3 64.5 49.5
Low growth scenarioOutstanding public debt as % of GDP 70.7 64.2 65.2 56.3 50.8 48.9 49.2Outstanding public debt as % of central Governmentcurrent revenue excluding grants 794.0 571.6 513.3 368.6 300.9 259.3 247.2NPV national debt as % of GDP 71.0 65.4 32.7 27.6 21.0 21.0 17.1NPV public debt as % of central Government currentrevenue excluding grants 443.2 354.2 236.3 185.4 129.3 118.3 91.8Public debt service as % of GDP 4.4 3.5 5.3 4.4 3.3 3.4 3.7Public debt service as % of central Governmentcurrent revenue excluding grants 49.4 31.1 38.1 29.4 20.5 19.4 20.0Interest payments on public debt as % of GDP 1.8 1.2 0.8 0.6 0.4 0.3 0.2Interest payments on public debt as % of centralGovernment current revenue excluding grants 19.7 10.4 5.7 4.0 2.7 1.6 1.3Public debt as % of tax revenue 978.8 550.7 317.8 208.5 129.9 90.7 75.5
NPV = net present value.a Data shown is at fiscal year end, 15 July, unless otherwise stated.Source: Consultant estimate.
65
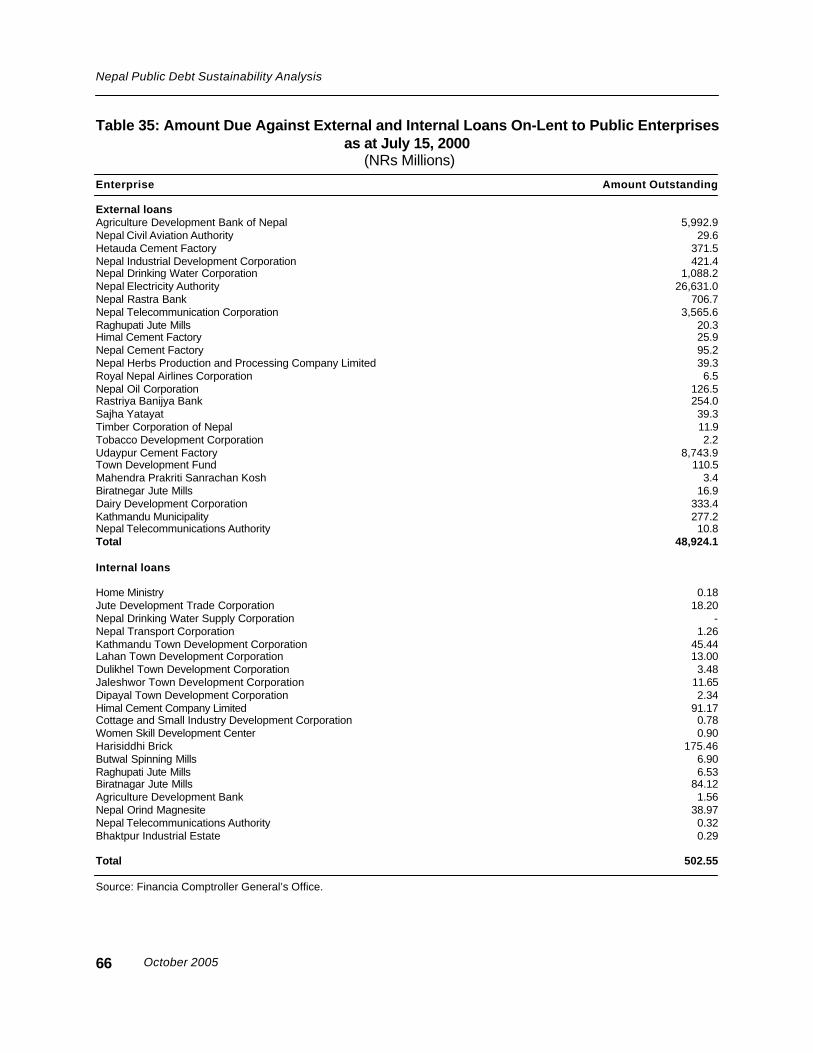
October 2005
Nepal Public Debt Sustainability Analysis
Table 35: Amount Due Against External and Internal Loans On-Lent to Public Enterprisesas at July 15, 2000
(NRs Millions)
Enterprise Amount Outstanding
External loansAgriculture Development Bank of Nepal 5,992.9Nepal Civil Aviation Authority 29.6Hetauda Cement Factory 371.5Nepal Industrial Development Corporation 421.4Nepal Drinking Water Corporation 1,088.2Nepal Electricity Authority 26,631.0Nepal Rastra Bank 706.7Nepal Telecommunication Corporation 3,565.6Raghupati Jute Mills 20.3Himal Cement Factory 25.9Nepal Cement Factory 95.2Nepal Herbs Production and Processing Company Limited 39.3Royal Nepal Airlines Corporation 6.5Nepal Oil Corporation 126.5Rastriya Banijya Bank 254.0Sajha Yatayat 39.3Timber Corporation of Nepal 11.9Tobacco Development Corporation 2.2Udaypur Cement Factory 8,743.9Town Development Fund 110.5Mahendra Prakriti Sanrachan Kosh 3.4Biratnegar Jute Mills 16.9Dairy Development Corporation 333.4Kathmandu Municipality 277.2Nepal Telecommunications Authority 10.8Total 48,924.1
Internal loans
Home Ministry 0.18Jute Development Trade Corporation 18.20Nepal Drinking Water Supply Corporation -Nepal Transport Corporation 1.26Kathmandu Town Development Corporation 45.44Lahan Town Development Corporation 13.00Dulikhel Town Development Corporation 3.48Jaleshwor Town Development Corporation 11.65Dipayal Town Development Corporation 2.34Himal Cement Company Limited 91.17Cottage and Small Industry Development Corporation 0.78Women Skill Development Center 0.90Harisiddhi Brick 175.46Butwal Spinning Mills 6.90Raghupati Jute Mills 6.53Biratnagar Jute Mills 84.12Agriculture Development Bank 1.56Nepal Orind Magnesite 38.97Nepal Telecommunications Authority 0.32Bhaktpur Industrial Estate 0.29
Total 502.55
Source: Financia Comptroller General’s Office.
66
NRM Working Paper Series No.5
Section III: The Commonwealth Secretariat Debt Recording and Management System (CS-DRMS)
III. THE COMMONWEALTH SECRETARIATS DEBT RECORDING AND MANAGEMENTSYSTEM (CS-DRMS)
A. Current Status
In Nepal, debt management is the responsibility of the Foreign Aid Coordination Divisionand DMU of MOF, FCGO and NRB, and the CS-DRMS provides the backbone of the debt informationmanagement. The Foreign Aid Coordination Division of the MOF coordinates debt policy inconsultation with the National Planning Commission (NPC) and the NRB. Other agencies involvedinclude divisions of MOF, Budget, Revenue, Administration and Legal, and Economic Affairs andPolicy Analysis Division. The “Loans and Guarantees Act” outlines the legal authority for borrowingand the “Authorization to Raise Internal Loans for Deficit Management Act” lays down annual ceilingsfor borrowing adjusted as appropriate by the Parliament. A DMU under the Economic Affairs andPolicy Analysis Division of the MOF is responsible for recording loan details and monitoringpayments. The FCGO records actual disbursements and authorizes payment on loans. Externalfunds are received and foreign payments are made through NRB which records and monitorsprivate sector loans and domestic debt instruments.
The DMU received technical assistance grant support from the DFID of the United Kingdom.The CS-DRMS was installed at the DMU. The CS-DRMS is a comprehensive databasemanagement system, which can carry out useful debt analysis and provide a wide rage of reports.After the completion of DFID supported technical assistance, the DMU and the CS-DRMS wereconfronted with certain institutional and logistic problems, which needed to be addressed. Debtdata had not been inputted since March 2000. The equipment had not been maintained properly,trained personnel of the DMU had been withdrawn to their parent units in other ministries, therewas apparent lack of demand for debt reports from relevant ministries and donor agencies, andthe proposed extensions to FCGO and NRB had not been implemented. Neither had the decisionto transfer the server to FCGO been followed through. Against this backdrop, an assessment ofthe CS-DRMS was undertaken to recommend measures that would ensure its sustainability.
At present MOF is responsible for borrowing policies, inputting of debt information into theCS-DRMS system, and preparation and dissemination of reports. FCGO is responsible for recordingexternal and public enterprise debt transactions and timely repayment of principal and interest onexternal debt. Within FCGO the loan and investment section is responsible for this role. At presentthe Public Debt Department of NRB carries out public debt operations and maintains records ofdomestic debt transactions while the Foreign Exchange Department maintains records of foreignexchange rates and private external loans.
The CS-DRMS was found to be in good shape. With minor equipment repair, the systemwas up and running. Debt data was inputted up to end September 2001 and it is continuing on aregular basis. The present study was entirely based on the output generated by the CS-DRMS.The server has been installed in FCGO with connections to MOF and NRB through dedicatedtelephone lines. A plan for upgrading the system is under consideration by the Government. TheGovernment is now keen to ensure that this integrated debt data base management system ismaintained properly and reports are generated to provide inputs on policy and strategy articulationregarding debt management including foreign loan negotiations, annual budget and annual
67
October 2005
Nepal Public Debt Sustainability Analysis
development plan exercises, and Government domestic borrowing.
B. Options for the Future
Debt management and debt information system management should be made the jointresponsibility of the MOF, FCGO and the NRB, and DMU should be restructured as the Debt PolicyManagement Unit (DPMU). A number of specific recommendations are made regarding debtmanagement including the CS-DRMS. It is recommended that debt management and debtinformation system management be made the joint responsibility of the MOF, FCGO and the NRB.This would be critical to guarantee the sustainability of the system. MOF will be responsible foroverall strategy and policy articulation, coordination and implementation, FCGO for external andpublic enterprise debt information system management and timely debt repayment, and NRB formanagement of domestic debt operations, information on domestic debt, private external loansand foreign exchange rates.
It is expected that the Government will allocate necessary budgetary resources for thepurpose. The Government should mobilize technical and financial assistance from external donorswhich need to be used for upgrading and enhancement of the system including local and widerarea networking, website development, system security, integration of different databasemanagement systems and staff development. Alternatives to the current system of networkingthrough dedicated telephone lines should be revisited at an appropriate time to effect change overto a more efficient and speedy and reliable networking system. It is paramount to avoid dataduplication in the future, thereby allowing the maintenance of a secure and unique set of data ondomestic and external debt. Steps need to be taken to (i) assign specific staff to CS-DRMS; (ii)ensure regular inputting of data; (iii) ensure compatibility of hardware and software configuration indifferent locations; (iv) homogenize logistic support; (v) induce demand for outputs of the systemand online use; (vi) follow a specific timeline for implementation of all steps agreed upon; (vii)promote staff development; (viii) as given below, ensure (ix) complete system security includingeliminating the risk of data manipulation by unauthorized persons; (x) inculcate a sense of ownershipamong all principal actors, especially MOF, FCGO and NRB; and finally, (xi) maintain only two dataentry points, namely FCGO (external debt) and NRB (domestic debt, foreign exchange rates andprivate loans). Some critical aspects of future development are outlined below.
The Role of FCGO: FCGO should be the focal point for (i) coordination and managementof the debt information management system; (ii) inputting, editing, validation, and reconciliation ofdata on external and public enterprise debt; (iii) reconciliation of external debt data with records oflenders; (iv) reconciliation of public enterprise debt data with records of these enterprises; (v)database management; (vi) linking up of CS-DRMS with the Financial Management Project, Medium-Term Budget Framework Project and the domestic debt database of the NRB, to allow interactivedialogue between systems; (vii) provision of guidance to and coordination of data integration andsystem compatibility; (viii) CS-DRMS network, hardware and software system maintenance,upgrading, backup and security which will include procurement, testing and operationalization ofnew releases of CS-DRMS software, other software and new equipment; (ix) staff development;and (x) preparation and dissemination of periodic reports as appropriate.
The Role of NRB: NRB, on the other hand, should be responsible for (i) management of
68
NRM Working Paper Series No.5
Section III: The Commonwealth Secretariat Debt Recording and Management System (CS-DRMS)
information on domestic debt, private external debt and foreign exchange rates; (ii) inputting, editing,validation, and reconciliation of data on public domestic debt; (iii) management of domestic debtdatabase of the CS-DRMS; (iv) monitoring of domestic debt situation; (v) formulation andoperationalization of public domestic debt strategies and policies and advising MOF on internalborrowing; and (vi) preparation and dissemination of periodic reports on public domestic debt.
The Role of MOF: MOF will be responsible for overall strategy and policy articulation,coordination and implementation. The DMU could be renamed as the DPMU with revised terms ofreference. The DPMU will be responsible for assisting MOF in initiation, articulation andimplementation of future borrowing (domestic and external) policies and debt managementstrategies in conjunction with other divisions of MOF, FCGO, NRB and other relevant agencies ofthe Government. It will liaise, in collaboration with FCGO, other relevant sections of MOF, NRB,and NPC to facilitate preparation of five-year and long-term perspective plans and evaluation ofthese plans, especially with regard to financing development expenditures through domestic andforeign borrowing. The DPMU will also assist in assessing debt-financing requirement underlyingannual development plans and annual budgets. Another responsibility of the unit would be preparationand dissemination of reports, electronic and otherwise, and in this context, developing, maintainingand updating of a CS-DRMS website in collaboration with FCGO.
Equipment and Networking: A thorough assessment of the equipment needs of the systemand participating agencies needs to be undertaken. A preliminary review indicated the followingrequirements: at MOF (i) two terminals linked to the CS-DRMS network, one to be placed at theDPMU, and one in Foreign Aid Coordination Division; (ii) terminals to be upgraded in terms ofprocessor, storage and RAM and other necessary accessories and software; (iii) internal networkingwithin MOF to connect principal nodes; (iv) other equipment to be upgraded as appropriate; (v) onephotocopier; (vi) one laser printer; (vii) continue the CS-DRMS maintenance agreement with theCrown Agents Financial Services Limited by paying annual fees in order to continue to use thesystem and also to be entitled to receive all enhancements to the system and to get hotline support;and (viii) enter into an agreement with a local vendor for services related to installation andmaintenance of networking and other equipment, software and general system support. At FCGO(i) one laser printer; (ii) one dot matrix printer; (iii) the server to be upgraded to accommodate moreterminals (presently ten terminals can be linked up to the server), and add storage, memory andhigh speed processor; (iv) evaluate alternative modes for connecting different locations (e.g.,dedicated high speed cable connection between locations); (v) additional dedicated telephonelines as appropriate although leasing of dedicated cable line from Nepal TelecommunicationsCompany may be a superior alternative for networking of FCGO with MOF and NRB; (vi) onephotocopier; (vii) link up NPC, Auditor General’s Office, FCGO’s Financial Management Projectand the upcoming Medium-Term Budget Framework Project system, ADB, World Bank, IMF andother interested bilateral and multilateral donors with CS-DRMS; (viii) develop a CS-DRMS websiteand put up selected reports and data for the international community; (ix) Procure the MS windowsversion of the CS-DRMS software and obtain on a continuing basis the latest releases under alicensing arrangement/agreement; and (x) Networking equipment as needed to establish an efficientsystem. At NRB (i) link with the CS-DRMS system should be upgraded—this will complete thetask of establishing an integrated computerized Debt Data Management System for Nepal; (ii)provide the Public Debt Department of NRB and the Foreign Exchange Department with two stateof the art computer terminals together with two laser printers, two photocopiers, and two dedicated
69
October 2005
Nepal Public Debt Sustainability Analysis
telephone lines; and (iii) link up CS-DRMS network with the existing server of the Public DebtDepartment. Alternative options for hardware and networking configurations are presented in Annex1.
System Awareness: Awareness of the capability and utility of the CS-DRMS system seemsto be weak among potential clients of the system. However, this has changed recently with thetransfer of the server and two terminals to FCGO and with senior officials of MOF taking directinterest in the management, operation, upkeep and sustainability of the system. No less importanthas been the initiative taken by ADB to place a consultant in Nepal to undertake debt sustainabilityand country risk analysis and evaluation of the CS-DRMS system. The study has been completed.Proposed actions to build awareness include strengthening the dissemination of information aboutthe CS-DRMS network through a proposed web site. Furthermore, a brochure and monthly newslettermay be considered and other measures will include periodic coordination meetings among majorclients. With all major users of the output of the system accepting to be part of an integratednetwork and responsible for data inputting, management and system maintenance, a sound basisfor broad based awareness of the CS-DRMS network will be established.
Demand: As for demand, interest in obtaining up to data on external and internal debtexists among MOF, NRB, FCGO, Auditor General’s office, ADB, IMF, International Bank forReconstruction and Development, and bilateral donors as well as the private sector. This interesthas not been adequately articulated by potential clients and thus has not been translated intoregular demand for output of CS-DRMS. Discussions need to be held at an appropriate levelbetween representatives of MOF, FCGO and NRB to assess demand and specify types of reportrequired by clients or access to data sought.
Reporting: Without the preparation of regular reports which meet client requirements, it isdifficult to sustain interest in any system, computerized or otherwise. The CS-DRMS system canautomatically generate a wide range reports. More reports can be customized for specificrequirement of users. A number of reports were produced and distributed under the DFID CS-DRMS project. Hard copies of some of these reports are available in the DMU. The current systemfor generation and dissemination of standard reports is weak and needs to be reviewed. Stepsshould be taken to (i) prepare, publish and disseminate regular reports as agreed upon by majorclients; (ii) prepare, publish and disseminate customized reports on demand; and (iii) make reportsavailable electronically.
Data inputting: Until recently, loan transaction data were not inputted regularly into the CSDRMS. MOF, FCGO and NRB will henceforth assume responsibility for inputting debt data regularly.
Staff: DMU at MOF has one trained (in the CS-DRMS) staff deputed from NRB. Two trainedstaff of DMU have returned to their respective parent departments. These three together with twosenior members of MOF and a number of other staff of FCGO assisted the ADB staff consultantwith debt sustainability analysis, specifically with updating the debt database of CS-DRMS andproduction of standard reports from the system. NRB does not have any staff assigned to the CS-DRMS. With the recent transfer of the server and two terminals to FCGO, the office has assignedseven staff to the CS-DRMS (Joint Financial Comptroller General, Appropriation Division, DeputyComptroller General, Loan and Investment Section, and five accounts officers of the loans andinvestment section). Adequate staff of appropriate skill and level need to be assigned on a dedicated
70
NRM Working Paper Series No.5
Section IV: Policy Implication
basis to CS-DRMS work by MOF, FCGO and the NRB. The staff should include, among others,one database manager and a network system manager. Other staff will be required for inputting ofinformation, editing and reconciliation of data, debt accounting, production and dissemination ofperiodic reports. The two staff members of NPC and the Department of Water should be assignedback to CS-DRMS at FCGO.
Staff Development: Under the DFID project, several staff members of DMU were trainedin the operation and maintenance of the system. No plan is on hand for further training of these orother staff members who may be involved in the CS-DRMS work. Recommended actions include(i) on the job training of FCGO and NRB staff by the three trained DMU staff; (ii) development andexecution of a training program by DMU in consultation with MOF, FCGO, NRB and other interestedparties—training should be made a part of ongoing job; and (iii) the Government needs to put inplace a broad based human resource development program related to computerized integratedfinancial system management.
System Security: The system is now double password protected. A multilevel authorizationallows the system administrator to restrict availability of facilities to selected users. Audit trails areactivated to track all access by users to menus and to record details of changes made to the maindatabase. The equipment is located in a relatively insecure environment, which is not disasterproof. Data backup system consists of storage in cartridge tape kept in a fireproof safe in DMU. Nosystem is in place to periodically review the status of the system and to upgrade, if necessary, thecomputers, server and the networking equipment, and to obtain new software including procuringnew releases of the CS-DRMS. Few interim measures to deal with these would include the following:(i) a computer security expert should be consulted on firewall; (ii) MOF, FCGO and NRB will placeequipment in secure environment; (iii) consideration may be given to the use of an external datastorage facility; (iv) back up of data should be done by FCGO and NRB on tapes on a daily basis;(v) back up data tapes should be made by MOF, FCGO and NRB in duplicate and secured inseparate locations; and (vi) the Government should make necessary budget provision for periodicupgrading of computer, server and networking equipment, and software including procurement ofnew releases of the CS-DRMS.
IV. POLICY IMPLICATIONS
A. Policy Recommendations for the Government
A number of policy recommendations are made for consideration of the Government ofNepal and ADB.
(i) Broadly speaking, Nepal should closely monitor the evolution of debt stock, debtservice burden, and the development of fiscal and external repayment capacity;
(ii) The debt strategy should seek coordination with monetary and fiscal policies, andadhere to the principles of transparency, public disclosure and accountability;
(iii) The Government should seek grant and concessional loans with grant elementgreater than 35%;
71
October 2005
Nepal Public Debt Sustainability Analysis
(iv) A careful review of non-concessional loans is in order to determine which could beeliminated or for which a softer term could be renegotiated;
(v) The Government of Nepal should enter into a dialogue with the Government of Indiato yield and convertibility of its Indian currency reserves soon;
(vi) Nepal should continue to pursue strong policies to preserve the currentmacroeconomic stability;
(vii) A concerted effort needs to be made to improve revenue generation so as to generateprimary surplus;
(viii) Public expenditure review should be an ongoing exercise with special emphasis onthe fiscal, foreign exchange and poverty impact of all investments;
(ix) New external debt should be contracted only if it is consistent with the Tenth Plan,the medium-term expenditure framework and a longer term perspective plan;
(x) Export diversification in terms of both commodity composition and destination (awayfrom India) should be at the top of Government agenda;
(xi) Existing constraints to increases in foreign direct investment should be carefullyanalyzed and countervailing measures be put into operation;
(xii) The private sector should be promoted and the Government should guarantee privatesector loans after careful scrutiny of proposed activities;
(xiii) The Government should move forward with structural reforms (e.g., the recentlylegislated land reform) and sector reforms especially financial sector reform andgood governance;
(xiv) In light of the special relationship, Nepal should harmonize its own monetary policieswith India in order to ensure stability of its foreign exchange regime;
(xv) To broaden the holder base of domestic debt instruments, a strong media campaignhas to be launched. Educational programs on mass media combined with trainingseminars and workshops would help educate the public about various debtinstruments and their importance for their own future and the future of the country.The yield and maturity structure must remain competitive in the market place.Secondary market facility should be provided in rural areas of the country. Branchexpansion is essential in this respect and more commercial banks should beauthorized to deal in securities on a commission basis; and
(xvi) The policy of shortening the maturity period on savings certificates may have tobe reconsidered. Since the issue was interest rate projection, variable/indexedinterest rate may be the answer.
B. Policy Implications for ADB Operations
The implications for ADB operations are the following:
(i) Given its large portfolio, ADB should carefully review its future exposure;(ii) Greater emphasis should be given to capacity building and the improvement of
governance, transparency and accountability at all levels;(iii) The performance of the portfolio needs to be closely monitored with regard to impact
on productivity, export growth and diversification and poverty alleviation;(iv) Internally, ADB should strengthen its country economic work, particularly
macroeconomic modeling;
72
NRM Working Paper Series No.5
Section V: Conclusion
(v) ADB should consider extending technical assistance to the Government of Nepalfor institution building regarding debt policy management and debt information systemmanagement;
(vi) Related to (iv) and (v) ADB should consider support for analytic work linked to thedevelopment of a consistent macroeconomic framework bringing together FinancialManagement Project, medium-term expenditure framework, five-year plans,perspective plans, the budget exercise, as well as debt;
(vii) ADB should assist the borrower to improve disbursement and maintain positive netaid flow;
(viii) ADB should review its mix of lending instruments in order to develop packagesconsistent with the long-term repayment capacity of member developing countries;
(ix) Requests for additional financing should be considered favorably if the situationwarrants it;
(x) ADB should support the development of the capital market, especially the secondarymarket for domestic debt instruments;
(xi) ADB should continue its support for financial sector reform, public enterprise reform,governance reform and the Tenth Plan;
(xii) Commensurate with its status as the lead donor institution in the country, ADBshould take the lead at donor coordination relating to resource management, database management and all related analytic work;
(xiii) ADB needs to improve its disbursement statement formats sent to borrowers; andfinally,
(xiv) The currency composition of loan, disbursement and repayment should be carefullyorchestrated to provide maximum flexibility to the borrower to meet debt obligationswithout unnecessary hardship.
V. CONCLUSIONS
Given the narrow base for domestic resource mobilization and exports for Nepal, it isimportant to monitor continuously the sustainability of public debt—that is, the country’s ability tomeet its medium and long-term debt obligations.
The performance over the first four years was mixed. FY2002 is shaping up to be a difficultyear in the aftermath of the Maoist insurrection, slow down of the global economy and the impactof the September 11, 2001 attack on the World Trade Center in New York, adversely affectingNepal’s income from tourism, industrial production, revenue collection and traditional exports likegarments, carpet and handicrafts.
Nepal would have to raise real GDP growth rate substantially over coming years, raisingthe rate of investment well above the recent trend of 22% of GDP at market prices to be financedby a combination of increased savings and borrowing, domestic and external.
Nepal’s external debt and external debt burden is manageable. The level of external debtwas modest and critical ratios improved during the 1990s. Long-term public and publicly guaranteedloans dominated the picture with a share of about 99%.
73
October 2005
Nepal Public Debt Sustainability Analysis
Multilateral creditors, especially the ADB, increased their share while the share of bilateralcreditors declined. Multilateral creditors accounted for over four fifth of DOD during the 1990s.
The central Government dominated the borrower category but the private sector increasedits share from a very modest level. Central Government is the principal borrower accounting forover 95% of DOD.
The bulk of foreign loans are guaranteed by the central Government, though borrowingwithout Government guarantee increased from 0.4% in FY1993 to 2.8% in FY2001.
Most loans are contracted in foreign exchange, specially the SDR, but in FY2001, 23% ofreserves were in nonconvertible currencies, mostly in Indian currency.
The majority of loans and loan amount was contracted on concessional terms, yet asignificant number was contracted on non-concessional terms. An in-depth investigation of 323loans revealed that as of 30 September 2001, 119 were contracted at non-concessional terms, 22yielding negative grant element.
The agriculture sector including irrigation and rural development dominated the foreignloan portfolio of the Government.
The share of multilateral creditors in total debt service on existing external loans increasedover time.
Debt related capital flow was modest during the 1990s but could increase substantially inthe coming years.
Utilization of external loans has been mixed, with utilization of some bilateral loans beingparticularly slow.
Multilateral lenders account for the bulk of NPV external debt. NPV of external debt wasestimated at NRs78,233 million ($1,029 million) as at 30 September 2001. Multilateral institutionsaccounted for 77%.
Negative trade balance was the most important factor in the growth of external debt.
Nepal compares favorably with selected developing countries in terms of external debtburden and debt sustainability indicators.
Nepal will require a combination of favorable factors to come into play in order to sustainGDP growth rates above the current level over the next two decades from the aftermath of worldeconomic slowdown, and September 11, 2001 terrorist attack in New York.
Relevant indicators suggest Nepal’s external debt burden is sustainable but vigilance iscalled for to avoid unexpected debt trap.
74
NRM Working Paper Series No.5
Section V: Conclusion
Nepal does not present a serious solvency risk under alternative growth scenarios. However,close monitoring of the debt service burden in relation to exports beyond 2012 would be in order.
The current account deficit as percentage of GDP is projected to triple between FY2001and FY2020 to reach a level of 15% under both high and low growth scenarios. Fiscal deficit isprojected to worsen significantly between now and FY2020.
Nepal may also face both solvency and liquidity constraint due to its large holdings of Indiancurrency as reserves. The current yield on Indian currency reserve is low (4.5% and 91 day treasurybill rate) and Nepal does not have access right to the Indian foreign exchange market. There is norepudiation risk as Nepal has never been in arrears in meeting its debt obligations.
The general conclusion emerging is that Nepal’s public debt position is projected to remainmanageable but vigilance will be prudent on account of questions related to fiscal sustainabilityand currency composition of exports and foreign reserves.
Public domestic debt increased substantially during the 1990s but as percentage of GDP,it remained stable.
Public domestic debt increased two and half times between FY1993 and FY2001 fromNRs23,164 million to NRs56,576 million. As percentage of GDP, public domestic debt remainedstable around 14% throughout 1990s.
Bonds as an instrument of domestic borrowing are declining in importance while shares oftreasury bills and savings certificates are on the rise.
Banks remain the largest holders of public domestic debt and its absorption is highlyconcentrated in urban areas, especially the Kathmandu Valley.
The Government has successfully raised capital in the domestic market at very modestcost.
The debt service burden of domestic debt of Nepal is not insignificant although interestpayment obligation was manageable.
Projections for the future indicate a significant increase in new domestic borrowing. Aspercentage of GDP at current prices, new domestic debt would increase from 1.2% in FY2002 to3.4% in FY2020 under high growth and 1.4% under low growth scenario.
Domestic debt service burden, though increasing, would remain modest over the periodunder consideration.
NPV domestic debt is much lower than NPV external debt. As at end FY2002, NPV domesticdebt stood at NRs46,380 million as compared with NRs100,253 million for external debt under thehigh growth scenario.
75
October 2005
Nepal Public Debt Sustainability Analysis
The level of public debt (external plus domestic) of Nepal is quite substantial and it is likely toincrease further in the coming years.
Public debt service would continue to claim a substantial share (between a quarter and afifth) of fiscal revenue by FY2020. However, public debt service burden is projected to declineslightly from 5.3% of GDP and 38.0% of central Government current revenue in FY2002 to 5.1%and 26.0% respectively, in FY2020 under the high growth scenario.
Discretionary primary fiscal balance is the most important push factor for increase in publicdebt.
NPV public debt as percentage of GDP would decline substantially between FY2001 andFY2020.
Nepal’s public enterprises are in significant arrears in payment of external and internalloans to the Government.
Projected public debt sustainability indicators for Nepal show an improving trend but thereare areas of concern which need to be monitored closely. The areas of concern are (i) fiscalsustainability; (ii) relatively large share of Indian currency in foreign reserve; (iii) potential forunderachievement in key foreign exchange earners like tourism, workers’ remittances, and exportof carpets, handicrafts and readymade garments; (iv) public enterprise loan arrears (see below);(v) burgeoning fiscal deficit; (vi) productivity of public investments; (vii) relatively short averagematurity of domestic debt; and (viii) narrow holder base of domestic debt.
The CS-DRMS provides the backbone of debt information management. The CS-DRMS isa comprehensive database management system which can carry out useful debt analysis andprovide a wide rage of reports. The CS-DRMS was found to be in good shape. With minor equipmentrepair, the system was up and running. Debt data was inputted up to end September 2001 and it iscontinuing on a regular basis. The present study was entirely based on the output generated by theCS-DRMS.
Debt management and debt information system management should be made the jointresponsibility of the MOF, FCGO and the NRB, and DMU should be restructured as the DPMU.The role and responsibilities of each have been delineated carefully. Specific recommendationshave been made for equipment and networking options.
Nepal should seek more concessional aid while closely monitoring the evolution of thestock of debt, debt service burden and the development of fiscal and external payment capacity. Anumber of other policy actions are also recommended above for both Nepal and ADB.
76
NRM Working Paper Series No.5
Appendix
APPENDIX: PROPOSED UPGRADE FOR DEBT MANAGEMENT UNIT
A. Hardware Configuration - Central/Server Specification
High End Server either Sun Micro System, IBM or HPMin configuration:Processor: 2GHz Dual ProcessorMemory: 2GB MemoryHard Disk: 300GB Fastest Available at the time of acquisitionOperating System: Sun OS or Windows 2000 Advanced ServerOther Software: Firewall/Security SoftwareBest quality router and switch with 100Mbps or Gigabit speedData Backup Tape drive and Cartridges
Recommended:
One Backup Server/Mirror server with same or less configuration – to take over in case of failureof the main server
B. Hardware Configuration – Remote Site (NRB & MOF)
PCs with latest at the time of acquisitionMinimum configuration:Processor: P4 2GHzMemory: 512MB MemoryHard Disk: 40GB Fastest Available at the time of acquisitionOperating System: Windows 2000ProfessionalOther Software: Firewall/Security SoftwareRouter and Hub with 100BaseT or Gigabit SpeedData Backup Tape drive and Cartridges
C. Connectivity Options
Option 1: Upgrade the following to speed up the connectivity with existing server and PCs
Net sharing equipment in MOF and NRB with built in hub with 56K modemDial on Demand LAN of MOF DMU and NRB DMU will be connected with FCGOUpgrade 3 modems in FCGO RAS (Remote Access Server) to 56Kbps
77
October 2005
Appendix
D. Future Connectivity Recommendations:
The present dialup connectivity is not reliable and will be costly in long term. For the permanent,uninterrupted connectivity and smooth work, either of the following is recommended:
Option 1: Leased line (copper connection) and TCP/IP connectivity between FCGO, MOF andNRB
Required Equipment:
Leased Line Modem in MOF –1, NRB – 1 and FCGO – 2Router in Each StationHub in Each Station
Advantage:Low Initial InvestmentDedicated Connection
Disadvantage:Carrier DependentLow speedRecurring Cost for ConnectivityLong Time for Expansion
Option 2: Wireless Connectivity
(a) Requirement: Server Station
Omni Directional Antenna andBroadcasting Equipment capable up to 11Mbps for each station
(b) Requirement: Client Station (MOF and NRB)
Radio Modem (Delay no more than 4ms)RouterHub 100 BaseT or Gigabit
Advantage:Speed up to 11MbpsHigher uptimeIndependent Network ManagementNo recurring costFast Expansion - Additional location could be connected within 24 hours
78
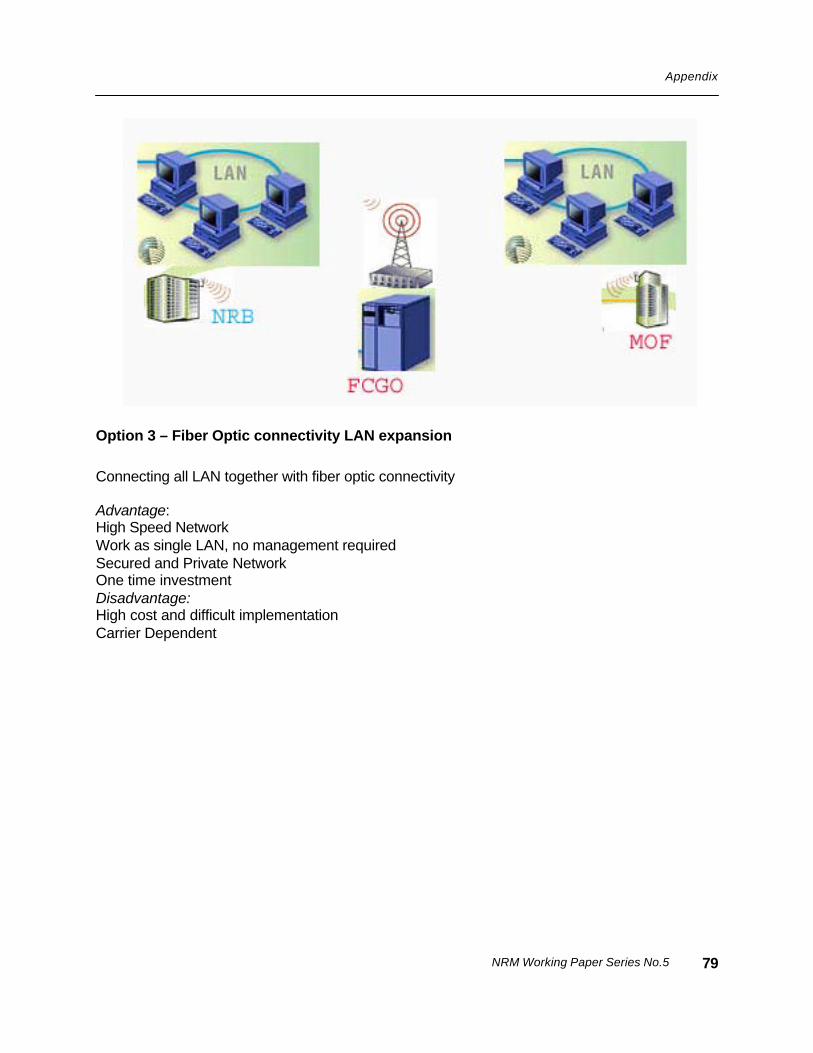
NRM Working Paper Series No.5
Appendix
Option 3 – Fiber Optic connectivity LAN expansion
Connecting all LAN together with fiber optic connectivity
Advantage:High Speed NetworkWork as single LAN, no management requiredSecured and Private NetworkOne time investmentDisadvantage:High cost and difficult implementationCarrier Dependent
79
October 2005
Bibliography
ADB. 2000. ADB’s Country Strategy for Poverty Reduction [Nepal]. Manila.
_______. 2000b. Country Economic Review: Nepal. November, 2000. Manila.
_______. 2000c. NEP: Poverty Situation Analysis. Programs Department (West) Division 1.September 29, 2000. Manila
_______. 2001. ADB’s Country Strategy for Poverty Reduction [Nepal]. Manila.
_______. 2001b. Country Assistance Plans – Nepal.Available: www.adb.org/Documents/CAPs/NEP/0101.asp
_______. 2001c. Country Strategy and Program Update (2002–2004): Nepal. Manila.
Bangladesh Institute of Development Studies (BIDS). 1998. An Input-Output Table for BangladeshEconomy 1993–1994. Dhaka.
Bangura, Sheku, Damoni Kitabire, and Robert Powell. 2000. External Debt Management in Low-Income Countries. IMF Working Paper WP/00/196. Washington, D.C.: International Monetary Fund.
Blejer, Mario I., and Liliana Schumacher. 1998. Central Bank Vulnerability and the Credibility ofCommitments: A Value-at Risk Approach to Currency Crisis. IMF Working Paper. Washington,D.C.: International Monetary Fund.Available:http://wbln0018.worldbank.org/eap/eap.nsf/Attachments/PER+II-References/$File/per2ref.pdf
Budget Speech of the Fiscal Year 2001/2002.2001. Delivered by Ram Sharan Mahat, FinanceMinister to the Twentieth Session of the Parliament, 9 July 2001. Nepal: Ministry of Finance. Available:www.facd.gov.np/BSpeech58.htm
Cooper, Richard N., and Jeffrey D. Sachs.1985. “Borrowing Abroad: The Debtor’s Perspective.” InInternational Debt and the Developing Countries. Washington, D.C.: The World Bank. 21–60.
Crown Agents Financial Services Limited. 1999. Nepal Debt Management Project Debt PortfolioReview & Sustainability Analysis. Nepal: Ministry of Finance Economic Affairs and Policy AnalysisDivision. (Activity no. 36).
CS-DRMS Website. 2001. Online Presentation from the Commonwealth Secretariat.Available: www.csdrms.co.uk/demo/welcome.htm
Dornbusch, Rudiger. 1985. “External Debt, Budget Deficits, and Disequilibrium Exchange Rates”.In International Debt and the Developing Countries. Washington, D.C.: The World Bank. 213–219.
Government of Nepal. Central Bureau of Statistics. 2000. National Accounts of Nepal, 2000.Kathmandu.
80
NRM Working Paper Series No.5
_____. Central Bureau of Statistics. 2001. Statistical Year Book of Nepal 2001. Kathmandu.
_____. Ministry of Finance. 1999. Budget Speech of the Fiscal Year 1999–2000. Kathmandu.
_____. Ministry of Finance. 2000. Budget Speech of the fiscal year 2000–2001. Kathmandu.
_____. Ministry of Finance. 2001. Economic Survey Fiscal Year 2001/2001.Available: www.facd.gov.np/second.htm
______ Public Expenditure Review Commission. 2001. Report of Public Expenditure ReviewCommission of 2000: Executive Summary. Kathmandu.
Government of Nepal and the Asian Development Bank. 2001. Poverty Reduction PartnershipAgreement. Manila.
_____. National Planning Commission and the Asian Development Bank. 2001. [Tenth Five-YearPlan] Inception Report 25 Sept. 2001. Manila.
Hawkins, John and Philip Turner. 2000. Managing Foreign Debt and Liquidity Risks in EmergingEconomies: An Overview. Bank for International Settlements (BIS). Policy Paper no. 8. Paperpresented at conference in December 1999.Available: www.bis.org/publ/plcy08.htm
International Development Association (IDA). 2001. The Challenge of Maintaining Long-Term ExternalDebt Sustainability. Washington, D.C.: The World Bank. March 20, 2001.
International Fund for Agricultural Development (IFAD). 2000. IFAD’s Participation in the EnhancedHeavily indebted Poor Countries Debt Initiative (HIPC DI). Executive Board- Seventieth Session.Document no. 110581. Rome, Italy.
_____. 2000. IFAD’s Participation in the Enhanced Heavily indebted Poor Countries Debt Initiative(HIPC DI): Benin, Burkina Faso, Honduras, Mali and Senegal. Executive Board - SeventiethSession. Document no. 136182. Rome, Italy.
International Monetary Fund (IMF). 2000. External Debt Management in Low-Income Countries.By Sheku Bangura, et al. Washington, D.C.
_____. 2001. Debt and Debt Sustainability Issues in Pakistan. Prepared by Thomas Helbling.Washington, D.C.
_____. 2001b. External Debt Statistics: Guide for Compilers and Users. Draft, February 2001.Available: www.imf.org/np/sta/ed/guide.htm
_____. 2001c. Financial Soundness Indicators: Policy Paper. Washington, D.C.: Monetary andExchange Affairs Department and the Statistics Department. June 4, 2001.
81
October 2005
_____. 2001d. Guidelines for Public Debt Management. Washington, D.C.Available: www.imf.org/external/np/mae/pdebt/2000/eng/intro.htm
_____. 2001e. Nepal. Table B. Data Categories and Indicators. Socio-demographic Data. Available: dsbb.imf.org/gddsweb/country/npl/nplsocdcpopc0.htm
International Monetary Fund (IMF) and International Development Association (IDA). 1997. BeninHIPC Initiative: Debt Sustainability Analysis. Washington, D.C.
_____. 1998. Senegal HIPC Initiative: Debt Sustainability Analysis. In International Debt and theDeveloping Countries. 1985. Edited by Gordon W. Smith and John T. Cuddington. Washington,D.C.: The World Bank. (A World Bank Symposium).
Joshi, Neeraj N., and Sarba Raj Khadka. 2001. Nepal. Country’s General Background in Relationto Social Development. Social Watch Website.Available: www.socialwatch.org/2001/eng/national%20reports/nepal2001_eng.htm
Klein, Thomas M. 1994. External Debt Management: an introduction. World Bank technical paper245. Washington D.C.: The World Bank.
_____. ed. 1992. Managing External Dept in Developing Countries. Proceedings of a Joint Seminar,Jeddah, May 1990. Washington, D.C.: The World Bank in cooperation with the Islamic Researchand Training Institute, Islamic Development Bank.
McFadden, Daniel et al. 1985. “Is There Life after Debt? An Econometric Analysis of theCreditworthiness of Developing Countries.” In International Debt and the Developing Countries.Washington, D.C.: The World Bank. 149–209.
Nepal Rastra Bank (NRB). 2001. Overall Economic Situation.Available: www.nrb.org.np
Oxfam International. 2001. Poor Country Debt Relief: False Dawn or New Hope for PovertyReduction? Position Paper.Available: www.oxfamamerica.org/advocacy/falsedawn.html
Radstam, Bengt. 1992. “The Management of the External Debt- the Approach Taken by the SwedishNational Debt Office.” In Managing External Dept in Developing Countries. Washington, D.C.:The World Bank, 64–71.
Reddy, Y.V. 2000. Managing Foreign Debt and Liquidity: India’s Experience. Policy Paper no. 8Paper presented at conference in December 1999. Bank for International Settlements (BIS).Available: www.bis.org/publ/plcy08.htm
Research Institute of Development Assistance (RIDA) and Overseas Economic Cooperation Fund(OECF). 1997. The Future Challenges for Nepalese Economy: Focused on Debt Servicing Capacity.OECF Research Papers No.15. Tokyo, Japan: OECF.
82
NRM Working Paper Series No.5
United Nations Development Program (UNDP) Nepal. 2000. Development Co-operation Report2000, Nepal.Available: http://www.undp.org.np
Williamson, John.1999. Implications of the East Asian Crisis for Debt Management.. Paperpresented to a conference on External Debt Management organized by the Reserve Bank of India,the Indian Ministry of Finance, and the World Bank Kovalam, Kerala 7–9 January 1999. India:Institute for International Economics (IIE).Available: www.iie.com/papers/williamson0199-2.htm
World Bank (International Bank for Reconstruction and Development).1999. World DevelopmentIndicators 1999. New York: Oxford University Press.
_____. 1999a. World Development Report 1998/99. “Knowledge for Development”. New York:Oxford University Press.
_____. 2000. Indonesia: Managing Government Debt and Its Risks. Washington, D.C.: East Asiaand Pacific Region, Poverty Reduction and Economic Management Sector Unit.
_____. 2001a. World Development Report 1999/2000.”Entering the 21st Century. New York: OxfordUniversity Press.
_____. 2001b. World Development Indicators 2001. New York: Oxford University Press.
_____. 2001c. World Development Report 2000/2001 “Attacking Poverty”. New York: OxfordUniversity Press.
_____. 2001d. The Little Data Book 2001. Washington, D.C.
Yogi, Bhagirath. 2001. Poverty Reduction: More Rhetoric than Substance. Mahila Web. Available:www.panasia.org.sg/nepalnet/mahilaweb/footer/publications/articles/poverty_reduction_splight.htm
83
NRM WORKING PAPER SERIES
(Published in-house; available through ADB/NRM and online at www. adb.org/nrm;free of charge)
No. 1 Nepal Macroeconometric Model—Sungsup Ra and Chang Yong Rhee, June 2005
No. 2 Measuring the Economic Costs of Conflict: The Effect of Declining DevelopmentExpenditures on Nepal’s Economic Growth—Sungsup Ra and Bipul Singh, July 2005
No. 3 Nepal Regional Strategy for Development—Harka Gurung, August 2005
No. 4 Ethnic and Caste Diversity: Implications for Development—Rajendra Pradhan and Ava Shrestha, September 2005
No. 5 Nepal Public Debt Sustainability Analysis—Mohiuddin Alamgir and Sungsup Ra, October 2005
No. 6 Managing the Debt: An Assessment of Nepal’s Public Debt Sustainability—Sungsup Ra and Chang Yong Rhee, forthcoming