neonatal care in northern ireland, 2014716701,en.pdf · with senior member of neonatal team....
TRANSCRIPT
0 | P a g e
Neonatal Intensive Care Outcomes Research
& Evaluation (NICORE)
Neonatal Care in
Northern Ireland, 2014
DATA TABLES
Produced on behalf of the Neonatal Network Northern Ireland (NNNI) by:
Ms Emma McCall Dr David Millar
Research Fellow Consultant Neonatologist
NICORE Clinical Information Lead (NNNI) & NICORE Chair
School of Nursing & Midwifery
Queen’s University Belfast
Medical Biology Centre (MBC)
97 Lisburn Road, Belfast,
BT9 7BL
Northern Ireland
Tel: 0044 (0) 2890 972993. Email: [email protected]
Published July 2016, NICORE
1 | P a g e
NNNI DATA REPORT SCOPE
This report provides information and analyses for all infants who were born between 1st
January 2014 (00:01) and 31st December 2014 (23:59) and admitted to a neonatal unit (NNU)
in Northern Ireland (NI) for intensive care (IC), high dependency care (HDC) or special care
(SC). This report excludes neonatal unit (NNU) admissions during 2014 where the infant was
born in 2013 and includes NNU admissions during 2015 for those infants born in 2014.
NNU Abbreviations: Altnagelvin Area Hospital (ALT), Antrim Area Hospital (ANT),
Craigavon Area Hospital (CAH), Daisy Hill Hospital (DH), Royal Maternity Hospital
(RMH), South West Acute Hospital (SWAH), Ulster Hospital (ULST) and Neonatal Network
Northern Ireland (NNNI).
This report should be read in conjunction with the Vermont Oxford Network (VON) report
for your NNU, particularly for nosocomial sepsis rates, cranial ultrasounds on or before 28
days of life and screening for retinopathy of prematurity (ROP). For data definitions you
should refer to BadgerNet Neonatal System (BNNS) data dictionary which is available via
the BadgerNet™ platform.
DATA QUALITY SUMMARY
Regionally, 96.9% of admissions were registered on BNNS. This ranged from 78.1%
to 100% across NNUs. Care must be taken to avoid duplicate entries.
Overall, 97.9% of admissions registered were also discharged on BNNS.
In total, 96.5% of infants had a complete infant journey (i.e. all episodes of
care/admissions) recorded on BNNS.
Health & Care Numbers were not entered for 57 admissions. This created problems
with data linkage. Checking H&C Numbers prior to data download is of paramount
importance at NNU level.
There has been a decrease in the number of coding errors for ‘Normal Care’ from
1364 days (2013) to 1171 days (2014). Improvements in coding should be more
evident in subsequent data reports.
Discharge destinations after first admission to neonatal care were missing for 39
(2.2%) cases.
2 | P a g e
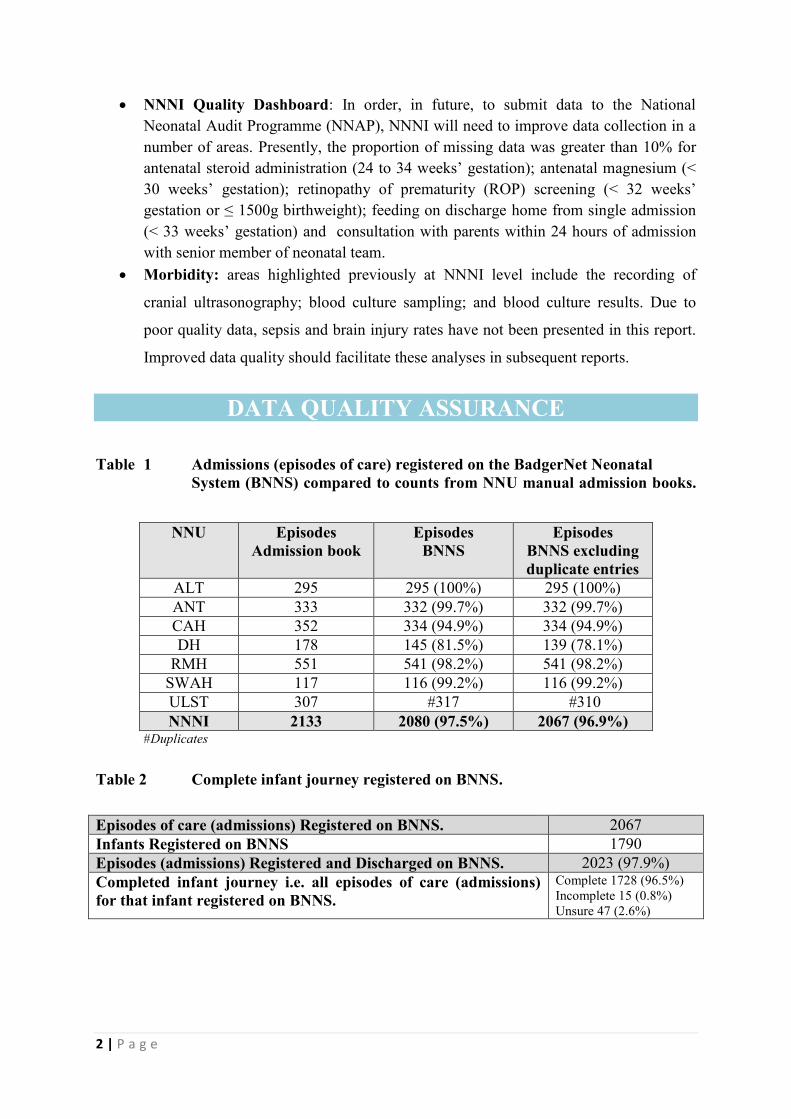
NNNI Quality Dashboard: In order, in future, to submit data to the National
Neonatal Audit Programme (NNAP), NNNI will need to improve data collection in a
number of areas. Presently, the proportion of missing data was greater than 10% for
antenatal steroid administration (24 to 34 weeks’ gestation); antenatal magnesium (<
30 weeks’ gestation); retinopathy of prematurity (ROP) screening (< 32 weeks’
gestation or ≤ 1500g birthweight); feeding on discharge home from single admission
(< 33 weeks’ gestation) and consultation with parents within 24 hours of admission
with senior member of neonatal team.
Morbidity: areas highlighted previously at NNNI level include the recording of
cranial ultrasonography; blood culture sampling; and blood culture results. Due to
poor quality data, sepsis and brain injury rates have not been presented in this report.
Improved data quality should facilitate these analyses in subsequent reports.
DATA QUALITY ASSURANCE
Table 1 Admissions (episodes of care) registered on the BadgerNet Neonatal
System (BNNS) compared to counts from NNU manual admission books.
NNU Episodes
Admission book
Episodes
BNNS
Episodes
BNNS excluding
duplicate entries
ALT 295 295 (100%) 295 (100%)
ANT 333 332 (99.7%) 332 (99.7%)
CAH 352 334 (94.9%) 334 (94.9%)
DH 178 145 (81.5%) 139 (78.1%)
RMH 551 541 (98.2%) 541 (98.2%)
SWAH 117 116 (99.2%) 116 (99.2%)
ULST 307 #317 #310
NNNI 2133 2080 (97.5%) 2067 (96.9%) #Duplicates
Table 2 Complete infant journey registered on BNNS.
Episodes of care (admissions) Registered on BNNS. 2067
Infants Registered on BNNS 1790
Episodes (admissions) Registered and Discharged on BNNS. 2023 (97.9%)
Completed infant journey i.e. all episodes of care (admissions)
for that infant registered on BNNS.
Complete 1728 (96.5%)
Incomplete 15 (0.8%)
Unsure 47 (2.6%)

3 | P a g e
Health & Care Numbers: 57 Admissions had a ‘Temporary Number’ i.e. no Health & Care
Number. This means that where the infant had multiple admissions there was no unique key
to link admissions to that infant. This resulted in manual linking of episodes where possible,
based on gestation, birthweight and transfer pattern.
NEONATAL ACTIVITY
Table 3 Live born infants in NI & number of infants admitted to neonatal care by
gestation (completed weeks).
Gestation
*Live born infants
NI
Infants
receiving neonatal care
<22 8 0
22 9 1
23 16 7
24 10 ~12
25 13 12
26 18 ~19
27 22 20
Sub-total EPT 96 71 (74.0%)
28 30 29
29 43 41
30 48 45
31 57 58
Sub-total VPT 178 173 (97.2%)
32 79 80
33 128 127
Sub-total MPT 207 207 (100%)
34 225 169
35 406 156
36 723 151
Sub-total LPT 1354 476 (35.2%)
# ≥ 37 T 22775 862 (3.8%)
NK 0 1
Total 24610 1790 (7.3%)
*NIMATS via Business Objects (PHA, Health Intelligence), January 2016, ~ Discrepancies across data sources
Gestational age categories1
Extremely preterm (less than 28 weeks’ gestation) EPT
Very preterm (28 to 31 weeks’ gestation ) VPT
Moderately preterm (32 to 33 weeks’ gestation) MPT
Late preterm (34 to 36 weeks’ gestation) LPT
Term (greater than or equal to 37 weeks’ gestation) T 1
March of Dimes, PMNCH, Save the Children, WHO. (2012) Born too soon: the global action report on preterm birth. World Health
Organization. Geneva. [Online]. Available at: http://www.who.int/pmnch/media/news/2012/preterm_birth_report/en/index.html (Accessed: 12 March 2016).

4 | P a g e
Table 4 NNNI admission type (category of care at the time of start of episode):
first admissions, subsequent admissions and all admissions to NC.
First Admissions Subsequent
Admissions
All
Admissions
Medical IC 747 (41.7%) 58 (20.9%) 805 (38.9%)
Medical HDC 575 (32.1%) 99 (35.7%) 674 (32.6%)
Medical SC 430 (24.0%) 96 (34.7%) 526 (25.4%)
Surgical care 3 (0.2%) 3 (1.1%) 6 (0.3%)
Cardiac care 15 (0.8%) 3 (1.1%) 18 (0.9%)
Tertiary specialist investigation 2 (0.1%) 0 2 (0.1%)
Social care 7 (0.4%) 0 7 (0.3%)
Back transfer continuing medical IC 0 1 (0.4%) 1 (0.1%)
Back transfer continuing medical HDC 0 5 (1.8%) 5 (0.2%)
Back transfer for continuing medical SC 0 9 (3.2%) 9 (0.4%)
Transitional Care 1 (0.1%) 3 (1.1%) 4 (0.2%)
Other 10 (0.6%) 0 10 (0.5%)
NNNI 1790 277 2067
Table 5 NNNI NC admissions (episodes) & activity (Levels of care days BAPM
2011) by neonatal unit (NNU) – all admissions to neonatal care.
NNU Infants Episodes
Level 1
(IC)
days
*Level 2
(HDC)
days
Level 3
(SC)
days
Normal
Care
days
Total
LOC
days
ALT 291 295 449 1105 2123 0 3677
ANT 322 332 430 610 3102 199 4341
CAH 323 334 362 784 3285 196 4627
DH 134 139 19 326 245 69 659
RMH 531 541 2810 2531 3279 155 8775
SWA 115 116 4 108 1096 0 1208
ULST 301 310 358 1095 2298 552 4303 NNNI *1790 2067 4432 6559 15428 1171 27590
*Multiple admissions across NNUs. * Babies awaiting bacteriological screening results have been coded
level 2 in ULST.
Table 6 NNNI NC admissions & activity (Levels of care days BAPM 2011) by
neonatal unit (NNU) – first admissions to neonatal care.
NNU Infants Level 1
(IC) days
*Level 2
(HDC) days
Level 3
(SC) days
Normal
Care days
ALT 275 405 849 1829 0
ANT 278 400 453 2065 143
CAH 288 294 440 2336 158
DH 102 11 142 146 49
RMH 498 2537 2337 3166 151
SWA 99 4 36 815 0
ULST 250 288 626 1520 418
NNNI 1790 3939 4883 11877 919 * Babies awaiting bacteriological screening results have been coded level 2 in ULST.
5 | P a g e
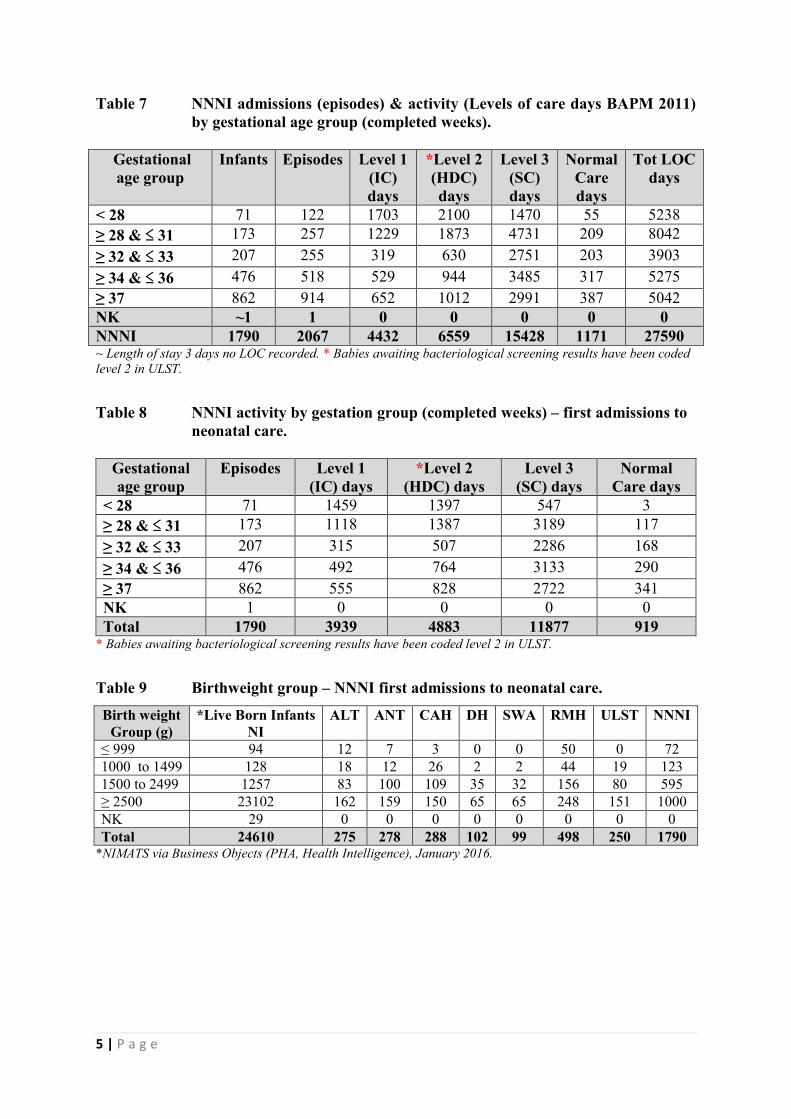
Table 7 NNNI admissions (episodes) & activity (Levels of care days BAPM 2011)
by gestational age group (completed weeks).
Gestational
age group
Infants Episodes
Level 1
(IC)
days
*Level 2
(HDC)
days
Level 3
(SC)
days
Normal
Care
days
Tot LOC
days
< 28 71 122 1703 2100 1470 55 5238
≥ 28 & ≤ 31 173 257 1229 1873 4731 209 8042
≥ 32 & ≤ 33 207 255 319 630 2751 203 3903
≥ 34 & ≤ 36 476 518 529 944 3485 317 5275
≥ 37 862 914 652 1012 2991 387 5042
NK ~1 1 0 0 0 0 0
NNNI 1790 2067 4432 6559 15428 1171 27590 ~ Length of stay 3 days no LOC recorded. * Babies awaiting bacteriological screening results have been coded
level 2 in ULST.
Table 8 NNNI activity by gestation group (completed weeks) – first admissions to
neonatal care.
Gestational
age group
Episodes
Level 1
(IC) days
*Level 2
(HDC) days
Level 3
(SC) days
Normal
Care days
< 28 71 1459 1397 547 3
≥ 28 & ≤ 31 173 1118 1387 3189 117
≥ 32 & ≤ 33 207 315 507 2286 168
≥ 34 & ≤ 36 476 492 764 3133 290
≥ 37 862 555 828 2722 341
NK 1 0 0 0 0
Total 1790 3939 4883 11877 919 * Babies awaiting bacteriological screening results have been coded level 2 in ULST.
Table 9 Birthweight group – NNNI first admissions to neonatal care.
Birth weight
Group (g)
*Live Born Infants
NI
ALT ANT CAH DH SWA RMH ULST NNNI
≤ 999 94 12 7 3 0 0 50 0 72
1000 to 1499 128 18 12 26 2 2 44 19 123
1500 to 2499 1257 83 100 109 35 32 156 80 595
≥ 2500 23102 162 159 150 65 65 248 151 1000
NK 29 0 0 0 0 0 0 0 0
Total 24610 275 278 288 102 99 498 250 1790 *NIMATS via Business Objects (PHA, Health Intelligence), January 2016.

6 | P a g e
NEONATAL UNIT ACTIVITY
Altnagelvin Neonatal Unit (ALT)
Table 10 Neonatal activity by gestational age group (completed weeks) - all
admissions ALT.
Gestational age
group
Infants Episodes
Level 1
(IC)
days
Level 2
(HDC)
days
Level 3
(SC)
days
Normal
Care
days
< 28 14 15 157 350 151 0
≥ 28 & ≤ 31 26 27 206 608 603 0
≥ 32 & ≤ 33 32 32 25 39 387 0
≥ 34 & ≤ 36 73 74 20 63 510 0
≥ 37 146 147 41 45 472 0
Total 291 295 449 1105 2123 0
Table 11 Neonatal activity by gestational age group (completed weeks) – first
admissions ALT.
Gestational age
group
Episodes
Level 1
(IC) days
Level 2
(HDC) days
Level 3
(SC) days
Normal
Care days
< 28 11 124 275 95 0
≥ 28 & ≤ 31 19 199 443 397 0
≥ 32 & ≤ 33 29 23 33 370 0
≥ 34 & ≤ 36 71 18 53 500 0
≥ 37 145 41 45 467 0
Total 275 405 849 1829 0

7 | P a g e
Antrim Neonatal Unit (ANT)
Table 12 Neonatal activity by gestational age group (completed weeks) - all
admissions ANT.
Gestational age
group
Infants Episodes
Level 1
(IC)
days
Level 2
(HDC)
days
Level 3
(SC)
days
Normal
Care
days
< 28 13 17 36 132 332 12
≥ 28 & ≤ 31 37 38 133 205 990 34
≥ 32 & ≤ 33 30 30 53 46 449 18
≥ 34 & ≤ 36 101 102 108 135 791 81
≥ 37 140 144 100 92 540 54
NK 1 1 0 0 0 0
Total 322 332 430 610 3102 199
Table 13 Neonatal activity by gestational age group (completed weeks) – first
admissions ANT.
Gestational age
group
Episodes
Level 1
(IC) days
Level 2
(HDC) days
Level 3
(SC) days
Normal
Care days
< 28 8 32 45 94 0
≥ 28 & ≤ 31 16 119 150 434 11
≥ 32 & ≤ 33 24 53 46 359 14
≥ 34 & ≤ 36 95 103 129 736 70
≥ 37 134 93 83 442 48
NK 1 0 0 0 0
Total 278 400 453 2065 143

8 | P a g e
Craigavon Neonatal Unit (CAH)
Table 14 Neonatal activity by gestational age group (completed weeks) - all
admissions CAH.
Gestational age
group
Infants Episodes
Level 1
(IC)
days
Level 2
(HDC)
days
Level 3
(SC)
days
Normal
Care
days
< 28 15 18 55 289 427 20
≥ 28 & ≤ 31 58 61 137 217 1390 58
≥ 32 & ≤ 33 47 47 28 78 467 35
≥ 34 & ≤ 36 98 102 53 131 629 55
≥ 37 105 106 89 69 372 28
Total 323 334 362 784 3285 196
Table 15 Neonatal activity by gestational age group (completed weeks) – first
admissions CAH.
Gestational age
group
Episodes
Level 1
(IC) days
Level 2
(HDC) days
Level 3
(SC) days
Normal
Care days
< 28 4 27 27 45 1
≥ 28 & ≤ 31 47 116 156 1061 45
≥ 32 & ≤ 33 45 27 75 446 35
≥ 34 & ≤ 36 92 46 117 439 51
≥ 37 100 78 65 345 26
Total 288 294 440 2336 158
9 | P a g e
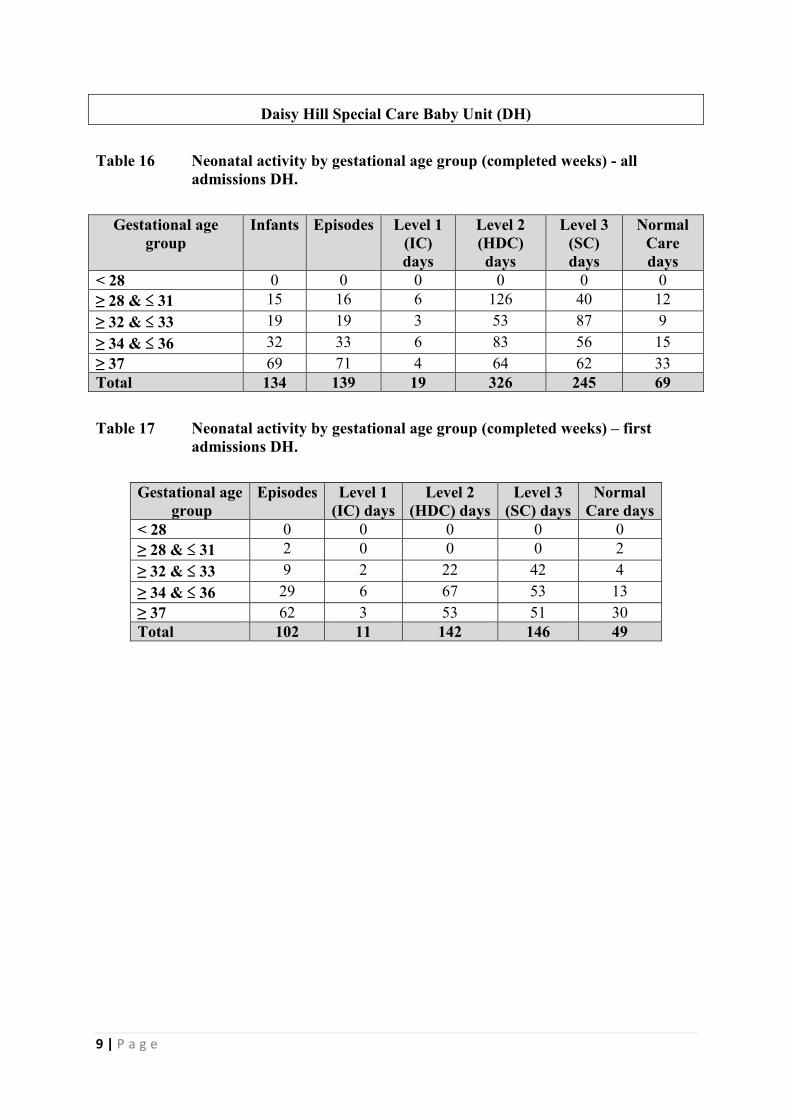
Daisy Hill Special Care Baby Unit (DH)
Table 16 Neonatal activity by gestational age group (completed weeks) - all
admissions DH.
Gestational age
group
Infants Episodes
Level 1
(IC)
days
Level 2
(HDC)
days
Level 3
(SC)
days
Normal
Care
days
< 28 0 0 0 0 0 0
≥ 28 & ≤ 31 15 16 6 126 40 12
≥ 32 & ≤ 33 19 19 3 53 87 9
≥ 34 & ≤ 36 32 33 6 83 56 15
≥ 37 69 71 4 64 62 33
Total 134 139 19 326 245 69
Table 17 Neonatal activity by gestational age group (completed weeks) – first
admissions DH.
Gestational age
group
Episodes
Level 1
(IC) days
Level 2
(HDC) days
Level 3
(SC) days
Normal
Care days
< 28 0 0 0 0 0
≥ 28 & ≤ 31 2 0 0 0 2
≥ 32 & ≤ 33 9 2 22 42 4
≥ 34 & ≤ 36 29 6 67 53 13
≥ 37 62 3 53 51 30
Total 102 11 142 146 49

10 | P a g e
Royal Maternity Neonatal Unit (RMH)
Table 18 Neonatal activity by gestational age group (completed weeks) - all
admissions RMH.
Gestational age
group
Infants Episodes
Level 1
(IC)
days
Level 2
(HDC)
days
Level 3
(SC)
days
Normal
Care
days
< 28 54 55 1420 1174 352 3
≥ 28 & ≤ 31 71 73 589 491 933 16
≥ 32 & ≤ 33 61 61 169 217 548 16
≥ 34 & ≤ 36 99 102 305 287 672 47
≥ 37 246 250 327 362 774 73
Total 531 541 2810 2531 3279 155
Table 19 Neonatal activity by gestational age group (completed weeks) – first
admissions RMH.
Gestational age
group
Episodes
Level 1
(IC) days
Level 2
(HDC) days
Level 3
(SC) days
Normal
Care days
< 28 43 1269 1050 313 2
≥ 28 & ≤ 31 68 538 466 923 15
≥ 32 & ≤ 33 60 169 217 539 16
≥ 34 & ≤ 36 94 286 249 639 47
≥ 37 233 275 355 752 71
Total 498 2537 2337 3166 151

11 | P a g e
South West Acute Special Care Baby Unit (SWA)
Table 20 Neonatal activity by gestational age group (completed weeks) - all
admissions SWA.
Gestational age
group
Infants Episodes
Level 1
(IC)
days
Level 2
(HDC)
days
Level 3
(SC)
days
Normal
Care
days
< 28 4 4 2 8 36 0
≥ 28 & ≤ 31 3 3 0 9 52 0
≥ 32 & ≤ 33 14 15 0 49 277 0
≥ 34 & ≤ 36 36 36 1 30 468 0
≥ 37 58 58 1 12 263 0
Total 115 116 4 108 1096 0
Table 21 Neonatal activity by gestational age group (completed weeks) – first
admissions SWA.
Gestational age
group
Episodes
Level 1
(IC) days
Level 2
(HDC) days
Level 3
(SC) days
Normal
Care days
< 28 2 2 0 0 0
≥ 28 & ≤ 31 1 0 1 0 0
≥ 32 & ≤ 33 5 0 8 113 0
≥ 34 & ≤ 36 34 1 20 440 0
≥ 37 57 1 7 262 0
Total 99 4 36 815 0

12 | P a g e
Ulster Neonatal Unit (ULST)
Table 22 Neonatal activity by gestational age group (completed weeks) - all
admissions ULST.
Gestational age
group
Infants Episodes
Level 1
(IC)
days
*Level 2
(HDC)
days
Level 3
(SC)
days
Normal
Care
days
< 28 9 13 33 147 172 20
≥ 28 & ≤ 31 35 39 158 217 723 89
≥ 32 & ≤ 33 50 51 41 148 536 125
≥ 34 & ≤ 36 69 69 36 215 359 119
≥ 37 138 138 90 368 508 199
Total 301 310 358 1095 2298 552
Table 23 Neonatal activity by gestational age group (completed weeks) – first
admissions ULST.
Gestational age
group
Episodes
Level 1
(IC) days
*Level 2
(HDC) days
Level 3
(SC) days
Normal
Care days
< 28 3 5 0 0 0
≥ 28 & ≤ 31 20 146 171 374 44
≥ 32 & ≤ 33 35 41 106 417 99
≥ 34 & ≤ 36 61 32 129 326 109
≥ 37 131 64 220 403 166
Total 250 288 626 1520 418
* Babies awaiting bacteriological screening results have been coded level 2 for two days.
13 | P a g e
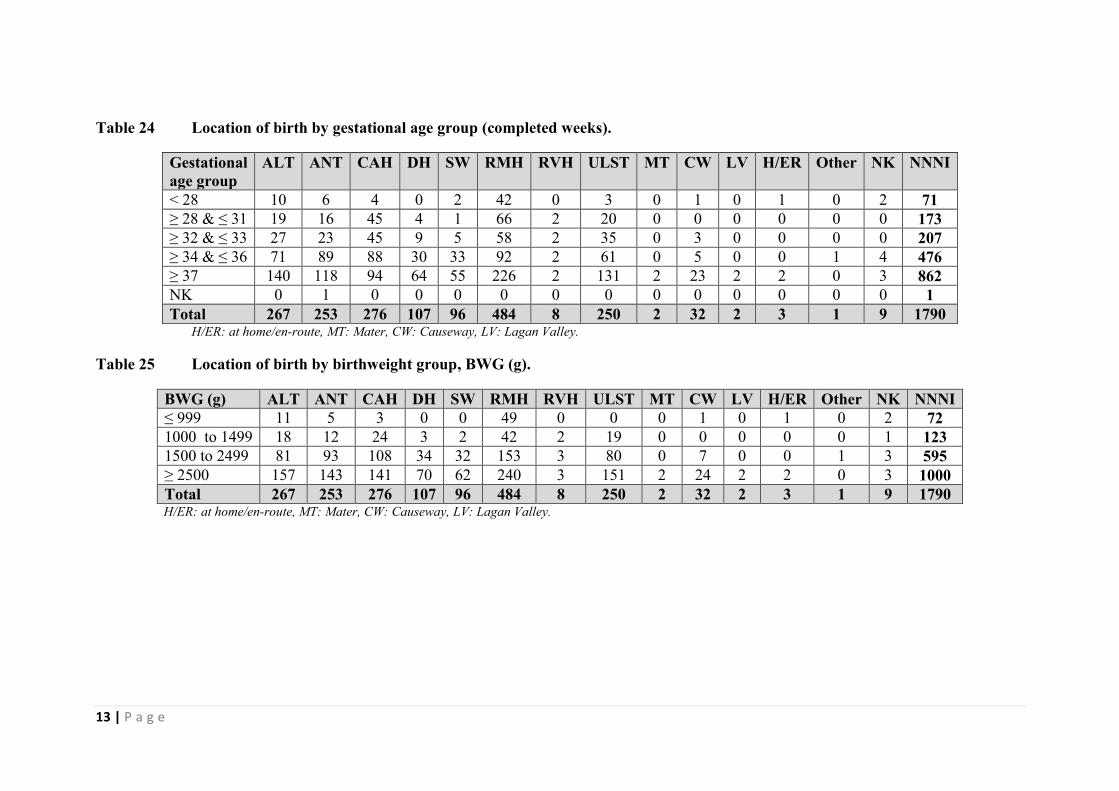
Table 24 Location of birth by gestational age group (completed weeks).
Gestational
age group
ALT ANT CAH DH SW RMH RVH ULST MT CW LV H/ER Other NK NNNI
< 28 10 6 4 0 2 42 0 3 0 1 0 1 0 2 71
≥ 28 & ≤ 31 19 16 45 4 1 66 2 20 0 0 0 0 0 0 173
≥ 32 & ≤ 33 27 23 45 9 5 58 2 35 0 3 0 0 0 0 207
≥ 34 & ≤ 36 71 89 88 30 33 92 2 61 0 5 0 0 1 4 476
≥ 37 140 118 94 64 55 226 2 131 2 23 2 2 0 3 862
NK 0 1 0 0 0 0 0 0 0 0 0 0 0 0 1
Total 267 253 276 107 96 484 8 250 2 32 2 3 1 9 1790 H/ER: at home/en-route, MT: Mater, CW: Causeway, LV: Lagan Valley.
Table 25 Location of birth by birthweight group, BWG (g).
BWG (g) ALT ANT CAH DH SW RMH RVH ULST MT CW LV H/ER Other NK NNNI
≤ 999 11 5 3 0 0 49 0 0 0 1 0 1 0 2 72
1000 to 1499 18 12 24 3 2 42 2 19 0 0 0 0 0 1 123
1500 to 2499 81 93 108 34 32 153 3 80 0 7 0 0 1 3 595
≥ 2500 157 143 141 70 62 240 3 151 2 24 2 2 0 3 1000
Total 267 253 276 107 96 484 8 250 2 32 2 3 1 9 1790 H/ER: at home/en-route, MT: Mater, CW: Causeway, LV: Lagan Valley.

14 | P a g e
Table 26 Discharge destination after first admission to neonatal care.
Discharge destination
First admission to NC) Infants
Home 877 (50.1%) Foster care 10 (0.6%) Ward 487 (27.8%) Died 42 (2.4%) Transfer to another hospital for continuing care 255 (14.6%) Transfer to another hospital for specialist care 16 (0.9%) Transfer to another hospital for surgical care 40 (2.3%) Transfer to another hospital for cardiac care 24 (1.4%)
Total 1751
NK 39
Total 1790
15 | P a g e
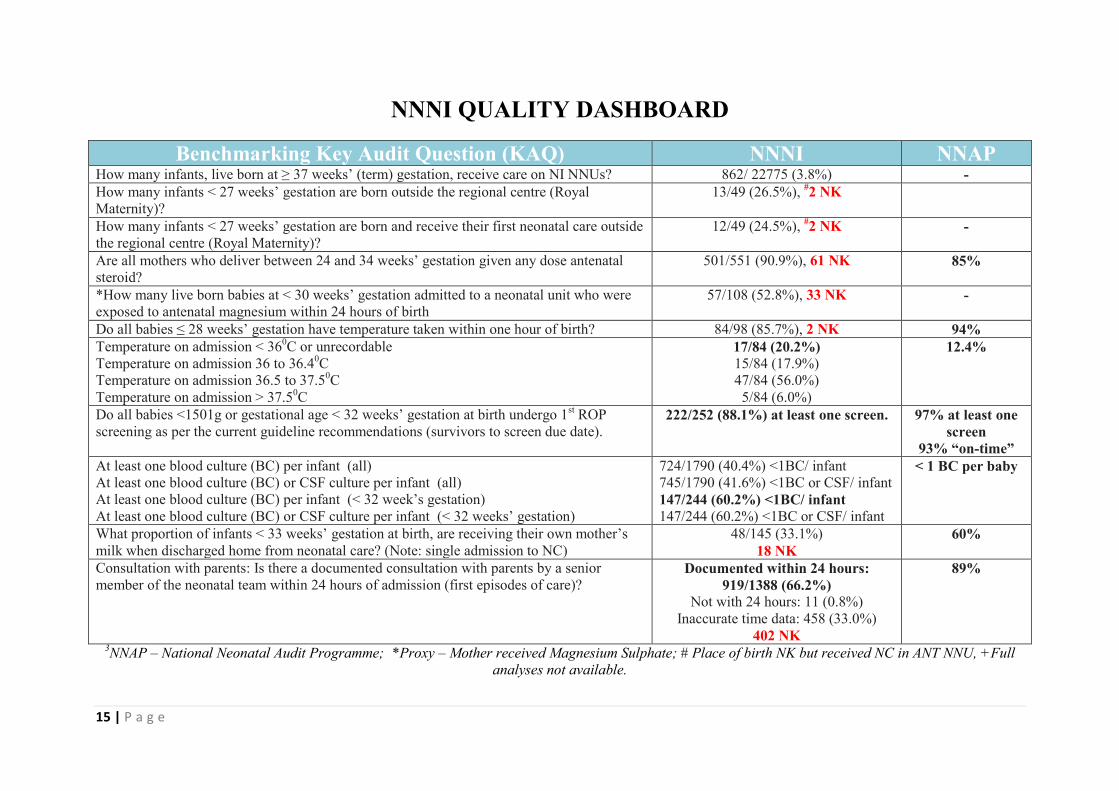
NNNI QUALITY DASHBOARD
Benchmarking Key Audit Question (KAQ) NNNI NNAP How many infants, live born at ≥ 37 weeks’ (term) gestation, receive care on NI NNUs? 862/ 22775 (3.8%) -
How many infants < 27 weeks’ gestation are born outside the regional centre (Royal
Maternity)?
13/49 (26.5%), #2 NK
How many infants < 27 weeks’ gestation are born and receive their first neonatal care outside
the regional centre (Royal Maternity)?
12/49 (24.5%), #2 NK -
Are all mothers who deliver between 24 and 34 weeks’ gestation given any dose antenatal
steroid?
501/551 (90.9%), 61 NK 85%
*How many live born babies at < 30 weeks’ gestation admitted to a neonatal unit who were
exposed to antenatal magnesium within 24 hours of birth
57/108 (52.8%), 33 NK -
Do all babies ≤ 28 weeks’ gestation have temperature taken within one hour of birth? 84/98 (85.7%), 2 NK 94%
Temperature on admission < 360C or unrecordable
Temperature on admission 36 to 36.40C
Temperature on admission 36.5 to 37.50C
Temperature on admission > 37.50C
17/84 (20.2%)
15/84 (17.9%)
47/84 (56.0%)
5/84 (6.0%)
12.4%
Do all babies <1501g or gestational age < 32 weeks’ gestation at birth undergo 1st ROP
screening as per the current guideline recommendations (survivors to screen due date). 222/252 (88.1%) at least one screen.
97% at least one
screen
93% “on-time”
At least one blood culture (BC) per infant (all)
At least one blood culture (BC) or CSF culture per infant (all)
At least one blood culture (BC) per infant (< 32 week’s gestation)
At least one blood culture (BC) or CSF culture per infant (< 32 weeks’ gestation)
724/1790 (40.4%) <1BC/ infant
745/1790 (41.6%) <1BC or CSF/ infant
147/244 (60.2%) <1BC/ infant
147/244 (60.2%) <1BC or CSF/ infant
< 1 BC per baby
What proportion of infants < 33 weeks’ gestation at birth, are receiving their own mother’s
milk when discharged home from neonatal care? (Note: single admission to NC)
48/145 (33.1%)
18 NK
60%
Consultation with parents: Is there a documented consultation with parents by a senior
member of the neonatal team within 24 hours of admission (first episodes of care)? Documented within 24 hours:
919/1388 (66.2%)
Not with 24 hours: 11 (0.8%)
Inaccurate time data: 458 (33.0%)
402 NK
89%
3NNAP – National Neonatal Audit Programme; *Proxy – Mother received Magnesium Sulphate; # Place of birth NK but received NC in ANT NNU, +Full
analyses not available.
16 | P a g e
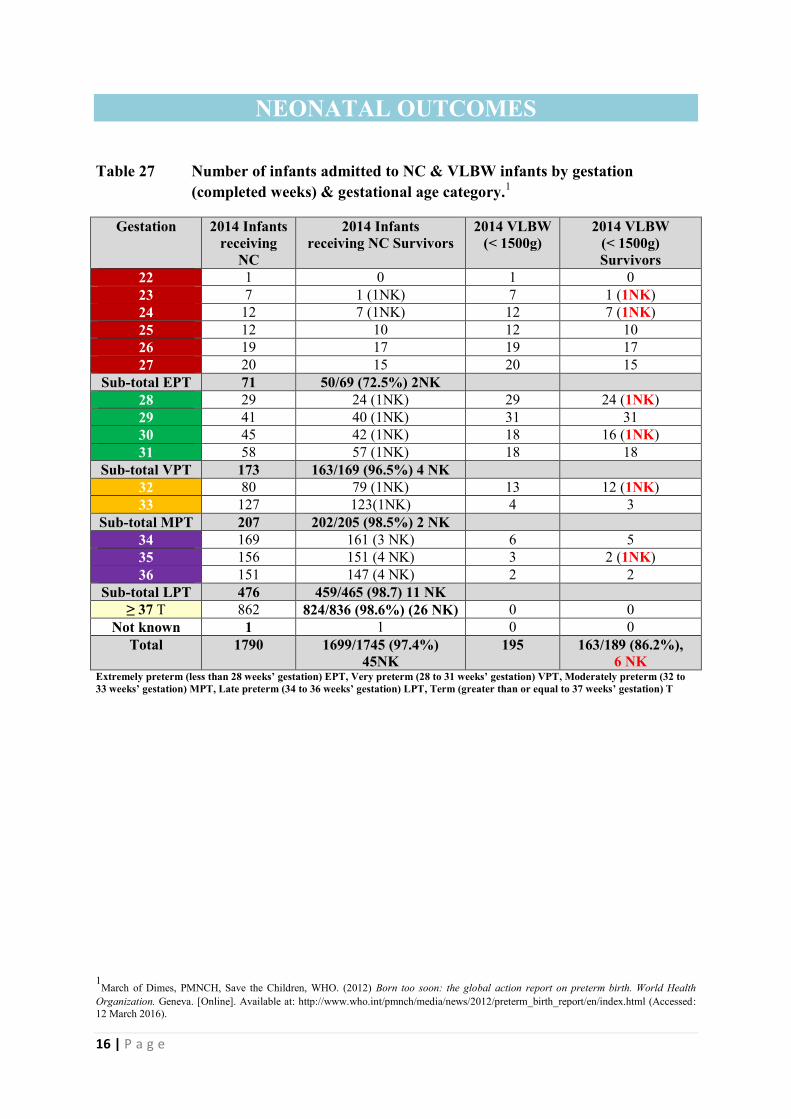
NEONATAL OUTCOMES
Table 27 Number of infants admitted to NC & VLBW infants by gestation
(completed weeks) & gestational age category.1
Gestation
2014 Infants
receiving
NC
2014 Infants
receiving NC Survivors
2014 VLBW
(< 1500g)
2014 VLBW
(< 1500g)
Survivors
22 1 0 1 0
23 7 1 (1NK) 7 1 (1NK)
24 12 7 (1NK) 12 7 (1NK)
25 12 10 12 10
26 19 17 19 17
27 20 15 20 15
Sub-total EPT 71 50/69 (72.5%) 2NK
28 29 24 (1NK) 29 24 (1NK)
29 41 40 (1NK) 31 31
30 45 42 (1NK) 18 16 (1NK)
31 58 57 (1NK) 18 18
Sub-total VPT 173 163/169 (96.5%) 4 NK
32 80 79 (1NK) 13 12 (1NK)
33 127 123(1NK) 4 3
Sub-total MPT 207 202/205 (98.5%) 2 NK
34 169 161 (3 NK) 6 5
35 156 151 (4 NK) 3 2 (1NK)
36 151 147 (4 NK) 2 2
Sub-total LPT 476 459/465 (98.7) 11 NK
≥ 37 T 862 824/836 (98.6%) (26 NK) 0 0
Not known 1 1 0 0
Total 1790 1699/1745 (97.4%)
45NK
195 163/189 (86.2%),
6 NK Extremely preterm (less than 28 weeks’ gestation) EPT, Very preterm (28 to 31 weeks’ gestation) VPT, Moderately preterm (32 to
33 weeks’ gestation) MPT, Late preterm (34 to 36 weeks’ gestation) LPT, Term (greater than or equal to 37 weeks’ gestation) T
1March of Dimes, PMNCH, Save the Children, WHO. (2012) Born too soon: the global action report on preterm birth. World Health
Organization. Geneva. [Online]. Available at: http://www.who.int/pmnch/media/news/2012/preterm_birth_report/en/index.html (Accessed:
12 March 2016).

17 | P a g e
Table 28 Cause of death.
During 2014, there were 46 reported deaths prior to discharge from neonatal care. This
excludes delivery room deaths.
Cause of death – contributing factors Infants
Other neonatal reason 16 Congenital abnormality 11 Prematurity 10 Other fetal reason 8 Infection 7 Intraventricular haemorrhage 7 Necrotising enterocolitis 5 Birth asphyxia 5 Re-orientation of care 2 Antepartum haemorrhage 1 Other maternal reason 1 Not recorded (infants) 6
Total deaths *46
* Multiple causes per infant.

18 | P a g e
Table 29 Neonatal morbidity outcomes.
Respiratory System Infant (%)
Supplemental Oxygen at 36 weeks’ corrected gestational age for
infants ≤ 32 weeks’ gestation.
53/324 (16.4%)
~Supplemental Oxygen on discharge from neonatal care (home). 7/998 (0.7%)
1075 NK
Gastrointestinal System
Necrotizing Enterocolitis (NEC) - confirmed
(Infants ≤ 34 weeks’ gestation or < 1500g birth weight)
17/619 (2.8%)
6 NK
NEC Treatment for suspected or confirmed
(Infants ≤ 34 weeks’ gestation or < 1500g birth weight)
5 infants
Central Nervous System
Infants undergoing cranial imaging (CI) on or before day 28 of life
(< 32 weeks’ gestation) * USS recorded in procedures
120/244 (49.2%)
Head Scan first Result first episode recorded (< 32 weeks’ gestation) Abnormal 49
Normal 98
NK 98
Periventricular-intraventricular haemorrhage
(P-IVH) present (< 32 weeks’ gestation)
Worst grade (P-IVH) (< 32 weeks’ gestation)
Cystic-periventricular leukomalacia (CPVL) (<32 weeks’ gestation)
Hypoxic ischaemic encephalopathy (HIE), for infants ≥ 36 weeks’
69/1013 (6.8%)
Hypoxic ischaemic encephalopathy (HIE), for infants ≥ 35 weeks’
71/1169 (6.1%)
Therapeutic hypothermia ≥ 35 weeks’ gestation 42/1169 (3.6%)
Seizures (all infants) 44/1790 (2.5%)
Retinopathy of prematurity (ROP)
Infants Eligible for ROP screening 273/1789 (15.3%), 1NK
Survivors to Screen Due date 252/273 (92.3%)
Screened (before or after discharge) 222/252(88.1%)
ROP present 46/222 (20.7%)
Worst grade ROP Stage 1: 16
Stage 2: 13
Stage 3: 10
Stage 5: 1
Stage not specified: 6
ROP Treatment (cryosurgery and/or laser) 9/222(4.1%)
Anti – VEGF therapy
(Not collated an individual variable 2014 download)
Not Available 2014
Surgery
# Major Surgery as defined by VON 18/1772 (1.0%)
Discharges – other information on surgical cases.
50 infants transferred other hospital for surgical care.
27 infants transferred other hospital for cardiac care.
67 RBHSC
7 Birmingham Children’s
Hospital Cardiac
6 Guy’s and St Thomas
1 Great Ormond Street. ~ Requiring intermittent or continuing supplementation with oxygen on the day of discharge and to be continued
following discharge.

19 | P a g e
Table 30 Categories of congenital malformations.
Category of congenital malformation Infants
Recognised trisomy/chromosomal syndromes 16
Respiratory system (e.g. pulmonary hypoplasia, diaphragmatic hernia, other respiratory) 10
Cardiovascular system 31
Central nervous system
(e.g. neural tube defect, other)
22
Gastrointestinal
(e.g. gastroschisis, exompholos, other)
20
Recognised malformation syndromes
(e.g. vater, CAA, potter’s sequence)
1
Genito-urinary 8
Musculo-skeletal 2
Undiagnosed dysmorphic syndromes 1
Hydrops fetalis
(non-immune, iso-immunisation)
0
Endocrine 0
Uncategorised 11
Total number of malformations 122
Total number of infants with at least one of the above congenital malformations NI. 105/1790
(5.9%)
Note: Congenital Malformations were categorised manually by the NNNI Clinical
Information Lead.