nejm predimed2018suppl corrected · use of the national death index and alternative analyses to...
TRANSCRIPT

Supplementary Appendix
This appendix has been provided by the authors to give readers additional information about their work.
Supplement to: Estruch R, Ros E, Salas-Salvadó J, et al. Primary prevention of cardiovascular disease with a Mediterranean diet supplemented with extra-virgin olive oil or nuts. N Engl J Med. DOI: 10.1056/NEJMoa1800389

2
Page 1. PREDIMED Investigators 4 2. List of changes introduced in the new (2018) manuscript 6 3. Randomization procedures and deviations from protocol 8 4. Adjustment for baseline risk factors Fig. S1: Propensity scores: predicted probabilities of allocation Fig. S2: Sensitivity analyses with different procedures to control for con-founding.
12 13
17 5. Trial enrollment criteria 18 6. Dietary intervention protocol 20 7. Biomarkers of compliance 25 8. Diagnostic criteria for trial end points 26 9. Use of the National Death Index and alternative analyses to address
potential selection bias due to attritions Fig. S3: examples of censoring dates in non-cases
28
29 10. Dealing with losses to follow-up
Fig. S4: Additional sensitivity analyses to address dropouts Table S1. Absolute risks and absolute risks differences
30 31 35
11. Estimating the per-protocol effect via inverse probability weighting Fig. S5. Absolute risk of the primary end-point
36 38
12. Adverse events 38 13. Fig. S6. Power curves, sample size and statistical power conside-
rations 39
14. Fig. S7. Trial profile (CONSORT diagram- flow chart) 40 15. Compliance with the dietary intervention
Fig. S8: Changes in mean adherence to the Mediterranean diet during follow-up
41
16. Fig. S9. Urinary hydroxytyrosol concentrations at baseline and at 1, 3 and 5 years of follow-up
42
17. Fig. S10. Plasma alpha-linolenic acid (%) in the three arms of the trial at baseline and at 1, 3 and 5 years of follow-up
43
18. Fig. S11. Kaplan-Meier estimates of incidence of each separate component of the primary end point
44
19. Fig. S12. Subgroup analyses 47 20. Comparison of predicted cardiovascular risk in each arm of the trial
Fig. S13. Baseline comparability of the 3 arms of the trial according to the Framingham predictive equation of cardiovascular events
48
21. Table S2. Allocation by recruitment site: total enrollment, allocation to each arm overall and for each stratum
49
22. Table S3. Distribution of non-randomized couples by site, arm and stratum
50
23. Table S4. Quantitative score of compliance with the Mediterranean diet 51 24. Table S5. Quantitative score of compliance with the control (low-fat)
diet 52
25. General recommendations to follow a low-fat diet 53 26. Table S6. Use of medication (%) during follow-up in each arm of the
trial. 54
27. Table S7. Participants with a positive answer (%) to each of the 14 items in the Mediterranean score in each arm during follow-up
55

3
28. Table S8. Mean baseline values and changes in the consumption of key food items in the three arms of the study
56
29. Table S9. Mean nutrient intake at baseline and the end of the trial in the three arms of the study
57
30. Table S10. Mean baseline values and changes in energy and nutrient intake in the three arms of the study
58
31. Table S11. Systematic reviews on Mediterranean diet and cardiovascular disease
59
32. Randomization tables: Table S12 and Table S13 62 33. Mode A of using randomization tables. Tables S14-S17 78 34. Mode B of using randomization tables. Tables S18-S21 80 35. Table S22. Mode of using randomization tables in each site 82 36. Table S23. Additional baseline characteristics of participants in the
three arms of the trial 83
37. Table S24. Losses to follow-up by year. 88 38. Table S25. Sensitivity analysis to address hypothetical unmeasured or
unknown confounding 89
39. Data sharing plan 93 40. References 94
Corresponding author: Prof. Miguel A. Martínez-González, [email protected]
4
PREDIMED INVESTIGATORS Steering Committee — MA Martínez-González, J. Salas-Salvadó, D. Corella, R. Estruch, M.I. Covas (replaced by M. Fitó in 2013), E. Ros. University of Navarra, Primary Care Centres, Pamplona, Spain: A. Sánchez-Tainta, B. Sanjulián, E. Toledo, M. Bes-Rastrollo, M. Ruiz-Canela, A. Martí, C. Razquin, P. Buil-Cosiales, M. Serrano-Martínez, J. Díez-Espino, A. García-Arellano, I. Zazpe, F.J. Basterra-Gortari, E.H. Martínez-Lapiscina, N. Ortuño, N. Berrade, V. Extremera-Urabayen, C. Arroyo-Azpa, L García-Pérez, J. Villanueva Tellería, F. Cortés Ugalde, T. Sagredo Arce, Mª D. García de la Noceda Montoy, Mª D. Vigata López, Mª T. Arceiz Campo, A. Urtasun Samper, Mª V. Gueto Rubio, and B. Churio Beraza. University Rovira i Virgili, Reus, Spain: M. Bulló, R. González, C. Molina, F. Márquez, N. Babio, M. Sorli, J. García Roselló, F. Martin, R. Tort, A. Isach, B. Costa, J.J. Cabré, and J. Fernández-Ballart. University of Valencia, Valencia, Spain: P. Carrasco, R. Osma, M. Guillén, P. Guillem-Saiz, O. Portolés, V. Pascual, C. Riera, J. Valderrama, A. Serrano, E. Lázaro, A. Sanmartín, A. Girbés, V. Santamaría, C. Sánchez, Z. Plá, E. Sánchez, C. Ortega-Azorín, J.I. González, C. Saiz, O.Coltell and E.M. Asensio. University of Málaga, Málaga, Spain: R. Benítez Pont, M. Bianchi Alba, J. Fernández-Crehuet Navajas, R. Gómez-Huelgas, J. Martínez-González, V. Velasco García, J. de Diego Salas, A. Baca Osorio, J. Gil Zarzosa, J.J. Sánchez Luque, and E. Vargas López. Institute of Health Sciences IUNICS, University of Balearic Islands, and Hospital Son Espases, Palma de Mallorca, Spain: M. García-Valdueza, M. Moñino, A. Proenza, R. Prieto, G. Frontera, M. Ginard, F. Fiol, A. Jover, and J. García. Hospital Clinic, Institut d’Investigacions Biomèdiques August Pi i Sunyer, Barcelona, Spain: M. Serra, A. Pérez-Heras, C. Viñas, R. Casas, L. de Santamaría, S. Romero, J.M. Baena, M. García, M. Oller, J. Amat, I. Duaso, Y. García, C. Iglesias, C. Simón, Ll. Quinzavos, Ll. Parra, M. Liroz, J. Benavent, J. Clos, I. Pla, M. Amorós, M.T. Bonet, M.T. Martin, M.S. Sánchez, J. Altirriba, E. Manzano, A. Altés, M. Cofán, C. Valls-Pedret, A. Sala-Vila, M. Doménech, R. Gilabert, and N. Bargalló. Department of Family Medicine, Primary Care Division of Sevilla, Sevilla, Spain: M. Leal, E. Martínez, J.M. Santos, M. Ortega-Calvo, P. Román, F. José García, P. Iglesias, Y. Corchado, E. Mayoral, and C. Lama. IMIM-Institut Hospital del Mar d’ Investigacions Mèdiques, Barcelona, Spain: S. Tello, J. Vila, H. Schröder, R. De la Torre, D. Muñoz-Aguayo, R. Elosúa, J. Marrugat, M. Farré-Albaladejo, N. Molina, M.A. Rovira, E. Maestre, and O. Castañer. University Hospital of Alava, Vitoria, Spain: I. Salaverría, T. del Hierro, J. Algorta, S. Francisco, A. Alonso, J. San Vicente, E. Sanz, I. Felipe, A. Alonso Gómez, and A. Loma-Osorio.
5
Instituto de la Grasa, Consejo Superior de Investigaciones Científicas, Sevilla, Spain: J. Sánchez Perona, E. Montero Romero, A. García García, and E. Jurado Ruiz. School of Pharmacy, University of Barcelona, Barcelona, Spain: M.C. López-Sabater, A.I. Castellote-Bargallo, A. Medina-Remón, and A. Tresserra-Rimbau. Primary Care Division, Catalan Institute of Health, Barcelona, Spain: C. Cabezas, E. Vinyoles, M.A. Rovira, L. García, G. Flores, J.M. Verdú, P. Baby, A. Ramos, L. Mengual, P. Roura, M.C. Yuste, A. Guarner, A. Rovira, M.I. Santamaría, M. Mata, C. de Juan, and A. Brau. University of Las Palmas de Gran Canaria, Las Palmas, Spain: J. Álvarez-Pérez, E. Díez Benítez, I. Bautista Castaño, I. Maldonado Díaz, A. Sánchez-Villegas, F. Sarmiendo de la Fe, C. Simón García, I. Falcón Sanabria, B. Macías Gutiérrez, and A.J. Santana Santana. Hospital Universitario de Bellvitge, Hospitalet de Llobregat, Barcelona, Spain: E. de la Cruz, A. Galera, Y. Soler, F. Trías, I. Sarasa, E. Padres, and E. Corbella. Other investigators of the PREDIMED network: M.T. Mitjavila (University of Barcelona), M.P. Portillo (University of Basque Country), G. Sáez (University of Valencia), and J. Tur (University of Balearic Islands). Clinical End Point Committee — F. Arós (chair), M. Aldamiz, A. Alonso, J. Berjón, L. Forga, J. Gállego, M. A. García Layana, A. Larrauri, J. Portu, J. Timiraus, and M. Serrano-Martínez. Dietary Intervention Committee — E. Ros (chair), M.I. Covas, M.A. Martínez-González, A. Pérez-Heras, J. Salas-Salvadó, and M. Serra, INDEPENDENT DATA AND SAFETY MONITORING BOARD X. Pi-Sunyer (chair), C.A. González, F.B. Hu, J. Sabaté.

6
LIST OF CHANGES INTRODUCED IN THE NEW (2018) MANUSCRIPT A) Issues related to randomization • In the Methods section, we now highlight key information on randomization
procedures, including: o A statement that randomization was stratified in 4 strata of sex and age. o An explanation that randomization was concealed with use of closed envelopes
during part of the pilot phase of the trial, but concealed randomization was not used after the pilot study.
o Information about small imbalances in baseline covariates and how this was addressed.
o An acknowledgement that members of some households of enrolled participants were included in the study and assigned the same intervention as the partner, but not randomized.
o A brief description of the protocol deviations in a subset or participants at site D with allocation by cluster (clinics) instead of individual allocation
o Brief description of some doubts on the use of randomization tables at site B. • In this Supplementary Appendix, we include:
o Copies of the 2 randomization tables provided to the 11 recruitment sites. o A description of the 2 methods for using the randomization tables, (methods A
and B) together with an illustration depicting how the tables were used and a table that lists the method used at each of the 11 sites.
o The number of household members (and percentage of total sample) assigned the intervention of their previous enrolled partner at each site by arm of the trial.
o A table that displays for each site: total enrollment, allocation to each arm overall and for each stratum.
o A statement about site B where the actual allocation by intervention arm and the allocation that would have resulted from the expected use of the randomization table did not match. We also show the expected versus observed numbers for each arm in site B.
B) Issues related to other methodological aspects • In the Methods section, we have included:
o A clarification of the dates when the PREDIMED study was open to enrollment, based on the dates the first and last patient were enrolled and a correction on the beginning date used in medical record review when ascertaining endpoints. The starting dates vary from those reported in the original manuscript that mistakenly stated that enrollment began in October 2003 (which was the date when most sites started).
o A statement that the time to event analysis was counted as time from baseline visit to the end of follow-up instead of using time from randomization to the end of follow-up (the exact date of randomization was not recorded).
• In this Supplementary Appendix, we include: o A brief description of the procedures used for delivering interventions at Site I. o A report that control patients were less likely to have clinic visits. o A clarification of the calculation of censoring dates for participants who did not
experience an event including a diagram illustrating censoring procedures. C) Issues related to analytical methods • We have rerun our analyses after excluding Sites D and household members who
were not randomized, and also after additionally excluding Site B.
7
• We have added a per-protocol analysis to adjust for adherence via inverse probability weighting (main text and pages 36-38 of this Supplement).
• Former Fig. 2 (subgroup analysis) has been moved to this supplementary appendix (now Fig. S12).
• In this Supplementary Appendix, we include: o A detailed explanation of the methods used to deal with potential confounding
by baseline covariables (propensity scores and sensitivity analyses with different approaches for multivariable control of multiple variables, Fig. S2).
o A detailed explanation of the methodological aspects of causal inference methods (causal intention-to-treat and causal per-protocol analyses).
o A detailed explanation of the censoring procedures and the alternative censoring approaches used in sensitivity analyses.
o A detailed explanation of the multiple imputation procedures used to replace missing values in censoring times and events related to attritions.
o Additional sensitivity analyses (Fig. S4) including: § Analyses that defined losses to follow-up as participants for whom there
was no contact for one year or longer and used only participants who were not lost to follow-up (complete case analysis).
§ Analyses performed under strong assumptions about the absence of events up to December 2010 among participants who were lost to follow-up and for whom we had no information on the occurrence of events after they were lost; these analyses were carried out for all alive participants who did not experience events by censoring them on December 2010 instead of at the date when the last follow-up information (from medical records or visits) was collected.
§ Information on the number of expected events by arm of the trial only in participants who were lost to follow, according to the predicted absolute risk by the Framingham equation.
§ Analyses to address potential selection bias due to losses to follow-up, using multiple imputations for follow-up times and events.
§ Analyses to address potential selection bias due to losses to follow-up, using inverse probability methods.
§ Data sharing plan. D) Other changes • We have included an estimation of the expected absolute risk of cardiovascular events
in the three arms of the trial according to baseline variables using the Framingham prediction equation to show the baseline similarity of the 3 arms (Fig. S13).
• A summary of the findings of systematic reviews on the association between adherence to the Mediterranean diet and cardiovascular disease is also included (Table S11).
• We have added a new analysis about hypothetical unmeasured confounders that could provide alternative explanations for our findings (Table S25).

8
RANDOMIZATION PROCEDURES AND DEVIATIONS FROM PROTOCOL Carlisle (1-3) examined the distribution of continuous baseline variables in more than 5000 published randomized trials and identified the PREDIMED trial as having distributions that were significantly different from the distributions expected from randomization. This assessment was based on two assumptions that are not met in PREDIMED. First, the method used by Carlisle (1-3) assumed uncorrelated variables, but there were actually very strong correlations among several continuous variables at baseline in PREDIMED; second, it also assumed simple randomization, whereas we used stratified randomization. However, that report prompted us to take the initiative to contact the editors of the Journal and to conduct a thorough review of the randomization procedures in each of the 11 PREDIMED recruiting sites. During this review process, we identified irregularities in the allocation procedures, which we describe and address in this updated report. We also conducted a wide set of new ancillary and sensitivity analyses (some of them included here) that, despite these irregularities, strongly confirmed the robustness of our original findings. The results of all these analyses have been supportive of the original conclusion. The answers to our research questions remained essentially unaltered (or trends became even stronger) with or without the data that suffered deviations from the protocol of allocation. Therefore, we provide convincing arguments and conclusions when it comes to a non-substantial impact on the hazard ratios of interest through the deviations from the protocol of allocation. Below, we describe the randomization irregularities in detail and report analyses suggesting that these protocol deviations did not create between-group imbalances in cardiovascular risk factors that could threaten the validity of the trial results. Enrollment of non-randomized household members After the trial was in progress, the Steering Committee approved the enrollment of household members of already enrolled participants, without randomization. The protocol was not amended to reflect this change and the original report of the trial did not explain this change to the protocol. If fulfilling entry criteria, members of the household of randomized participants were invited to participate and allocated to the same intervention group as their household member. This was done to allow recruitment of household members and to avoid assigning members of the same household to different diets. Assigning all participants in a household to the same diet was viewed as the best approach to achieve dietary changes in the household (4-5). The second enrolled partners of a previous participant represented 5.7% of PREDIMED participants, with a slightly lower proportion in the control group (4.82%) than in the Mediterranean diet group + extra virgin olive oil (6.72%) or the Mediterranean diet group + nuts (5.54%). In a sensitivity analysis, we included only one participant (the first randomized partner) per household. The Hazard Ratios (HR) for the primary end-point were similar to those previously published: 0.70 (0.53-0.93) for the Mediterranean diet + extra virgin olive oil (EVOO) and 0.67 (0.50-0.90) for the Mediterranean diet + nuts compared with the control diet group. Randomization tables used during the trial. Initially all PREDIMED recruitment sites used a sample table generated for 1000 participants (250 per stratum) which was included in the manual of operations (Table S12). By chance, the initial portion of this table had fewer numbers allocated to Mediterranean diet + nuts for
9
the 2 female strata, which led to a smaller number of women allocated to this arm. Female sex was a strong predictor of lower risk of the primary event in the PREDIMED trial (hazard ratio = 0.50, 95% confidence interval: 0.40-0.64). There was a slightly higher percentage of women in the control group (5.7% higher in control than in the Mediterranean diet+nuts group and 1% higher in control than in the Mediterranean diet+extra-virgin olive oil group) and this small imbalance may have reduced the risk of events in the control group. Consequently, it could not provide an alternative explanation of our findings because in fact it worked against the hypothesis of the trial. The use of the initial section of the same randomization tables in most sites further contributed to a progressive accrual of imbalances with time. Starting in 2004, a new randomization table was provided to the sites to be used thereafter to attempt to correct the lack of balance of the original table regarding the number of subjects initially allocated to each group (Table S13). The 11 different recruitment sites used these 2 Tables in two different ways, as explained in Tables S14 to S22.
• In some sites, only the stratum to which the participant belonged was considered when applying the randomization tables, regardless of the number of participants that had been previously randomized in the other strata. Thus, the tables were used completely (mode A, please see Tables S14 to S17 for a more detailed explanation).
• In an alternative use of the randomization tables each recruited participant “occupied” one full row. Thus, after correctly allocating the participant, the whole row would be crossed out and not used for future participants (mode B), as shown in Tables S18 to S21.
Some sites used mode A and others used mode B (Table S22). In any case, regardless of the mode used, the sequences of numbers included in Tables S12 and S13 were a true random sequence for each stratum. Because the same repeated sequences were used in several sites our analyses include site as a stratifying variable. The use of shared frailty models allowing for random effects for sites rendered very similar results for the primary cardiovascular endpoint: HR=0.72 (0.54-0.97), for Mediterranean diet + extra virgin olive oil and HR=0.65 (0.48-0.89) for Mediterranean diet + nuts, after excluding the second partners and participants enrolled at 11 clinics of site D where individual randomization was not used. As specified in the protocol, the randomization was done after the first screening visit. Therefore, the participants were randomized to one of three diet groups before the second screening visit, which was the baseline visit. Participants were told which group they were assigned to at the baseline visit. All 7447 participants randomized/allocated to an intervention attended their baseline visit. Departure from the randomization protocol at Site D In reviewing the randomization procedures by site, the Steering Committee noticed in July 2017 that one of the PREDIMED recruitment sites (site D) showed a large imbalance of different baseline characteristics among the three trial arms. In order to understand these imbalances, the Steering Committee conducted several inquiries and analyses and observed that the rate of inclusion of participants by intervention group in site D did not follow the expected distribution. In response to the Steering Committee’s questions, the PI of the site D disclosed that, during the trial, individual allocation was partly replaced by clinic allocation. The PI explained that after some time recruiting participants and randomizing

10
them on an individual basis, they stopped following the randomization tables because they realized that there were compliance issues. Participants in the control group in small rural areas were not likely to be compliant when they saw that other participants in their same clinic received olive oil and nuts at no cost. The Steering Committee was not informed of this protocol change until July of 2017. In site D, 185 participants in 3 clinics were allocated individually and 467 participants (6.2% of total PREDIMED participants) in 11 clinics (2 allocated to Mediterranean diet + virgin olive oil, 5 allocated to Mediterranean diet + nuts and 4 allocated to control) were assigned in clusters, with the clinic being the unit of allocation. Results were similar in analyses removing the second members of households and the entire site D (Table 3 and Fig. 2 in the main manuscript, and Fig. S2 on page 17). In addition to the stratification by site, all Cox regression models that include all 7447 participants, calculated estimates after stratifying by site and use robust variances estimator to adjust for intra-cluster correlated observations in households and clinics. Actual allocation by intervention arm and the allocation that would have resulted from expected use of randomization table: site B An attempt was made to compare actual allocation to the 3 arms during the trial with expected allocation if the randomization tables were used appropriately. As described above, there were 2 methods used by the sites in completing the randomization tables, and 2 different randomization tables were used. Owing to the long time that has elapsed since the trial was conducted, limited primary documentation is available. The printed randomization tables completed by the nutritionists are not available for most sites. In addition, for sites that used Mode B in completing the tables, the date of randomization would be necessary to determine expected allocation, but the date of randomization was not recorded. For sites that switched tables during the study, the date of the switch would be needed but was not documented. There were 2 sites that used Mode A and did not switch tables (Sites B and K). For these 2 sites, it was possible to determine the allocation that should have resulted if the randomization tables had been consistently used as planned. For site K there were relatively small differences between the allocation that should have resulted from the randomization table (Olive Oil=63, Nuts=97, Control=70) and the actual allocation in the trial (Olive Oil=58, Nuts=95, Control=77). Note that the completed paper randomization tables were available for Site K and indicate that page 1 of the randomization table was not used and allocation began with the first row of the second page (row 36 of “Table 250”, see Table S12). For Site B there were relatively large differences between the allocation that should have resulted from use of the randomization table (Olive Oil=184, Nuts=195, Control=167) and the actual allocation into the trial (Olive Oil=182, Nuts=132, Control=232). The reasons for this large discrepancy are not known. This discrepancy raised doubts about the application of the randomization procedure in that site. However, the predicted probabilities of cardiovascular events were similar among the three groups in site B according to the Framingham equation1 estimated with the baseline values of the risk
1 www.framinghamheartstudy.org/risk-functions/cardiovascular-disease/10-year-risk.php (last consulted March 4, 2018)
11
factors (p=0.15 in ANOVA, p=0.395 in Kruskal-Wallis test) or according to the predictions by >50 baseline covariates (p=0.19 in ANOVA, p=0.71 in Kruskal-Wallis test). The between-center differences in hazard ratios were small when the other sites of the PREDIMED trial were combined with site B (in the test for heterogeneity we found p=0.48 for Mediterranean diet+extra virgin olive oil and p=0.16 for Mediterranean diet+nuts, with respective I2 values of 0% and 30.9%). For pooling these hazard ratios of all sites, we used standard methods for meta-analysis, as follows. We merged sites J+K due to their very small number of events. Therefore, we performed the pooling of 10 estimates, using inverse of the variance and random-effects (Der Simonian-Laird) methods. We used the 10 estimates obtained within each of the 10 sites, adjusting for propensity scores, stratified for sex and education and adjusted for other covariates as in the main model, previously detailed. For this analysis we excluded second partners of couples.
• For the analyses of the Mediterranean diet with extra-virgin olive oil versus control, the pooled hazard ratio across centers was 0.69 (95% CI: 0.52-0.93, identical in the fixed-effect and in the random-effect models), with heterogeneity Q statistic = 8.53 (9 degrees of freedom), and tau2=0. Therefore, I2 = 0, indicating no heterogeneity. Please take into account that the numerator of both tau2 and I2 is Q–df and it was negative here (8.53 – 9 = – 0.47). By convention it is assumed to be equal to 0 when the numerator renders a negative value.
• For the analyses of the Mediterranean diet with nuts versus control, the pooled hazard ratio across centers was 0.72 (95% CI: 0.53-0.98, identical in the fixed-effect and in the random-effect models), with heterogeneity Q statistic = 13.0 (9 degrees of freedom). Therefore, I2 = 30.9, indicating a small degree of heterogeneity.
We repeated the main analyses after excluding all participants from site B together with all participants from site D and all the second members of the same household. After all these exclusions, the results regarding the primary outcome were similar to the results of the primary analyses. (Fig. S2, page 17).
Participant allocation in site I In site I the number of clinics was much larger (37 clinics) than in other sites and many of the clinics were small. Among them, 11 clinics (with a total of 247 participants, 22.6% in this site) conducted the intervention on participants for only one arm of the trial in each clinic. This was not a departure from the protocol, because participants were randomly allocated at the individual level and then aggregated in nearby clinics by intervention groups in order to make the intervention more feasible and avoid reduced adherence among participants in the same clinics allocated to control. We conducted a conservative sensitivity analysis by additionally removing these 247 participants (plus the second members of the households, plus the entire site D) and the estimates of the intervention effects did not change, with multivariable-adjusted HR = 0.627 (95% CI: 0.446-0.881, p=0.007) for the Mediterranean diet+extra virgin olive oil and HR = 0.682 (0.484-0.961, p=0.029) for the Mediterranean diet+nuts compared to the control diet group (main model, also adjusted for propensity scores).
12
ADJUSTMENT FOR BASELINE RISK FACTORS Because of the irregularities in the randomization procedures, we re-analyzed our data to estimate the associations between the interventions and outcomes, using methods that do not exclusively rely on the assumption that all patients had been randomly assigned to the treatment groups. Our analyses attempt to account for potential imbalances in baseline participant characteristics across the 3 arms of the trial that may have introduced confounding in our effect estimates. The two largest observed differences (see Table 2 of the main manuscript and Table S23 in this Supplement) were 5.7% for female sex (higher in the control group than in the Mediterranean diet + nuts) and 5.3% for high levels of low-density-lipoprotein cholesterol (lower in the control group than in the Mediterranean diet + extra virgin olive oil). Incidentally, both differences would operate in any case against the hypothesis of the trial. Our main analysis includes all participants in the trial with adjustments for multiple cardiovascular risk factors, as well as propensity scores estimating each participant’s probability of allocation to each treatment arm. As pre-specified in the statistical analysis plan in our protocol, we fitted a Cox model stratified by site and sex and with the baseline covariates age, smoking, hypertension, dyslipidemia, diabetes, family history of premature coronary heart disease, body mass index (linear), waist-to-height ratio (linear) and physical activity (quintiles). In addition, we included as covariates propensity scores estimating the probability of assignment to each of the intervention arms of the trial. These propensity scores were estimated by using a multinomial logistic model with the allocation (3 arms) of the trial as the outcome (dependent variable, with 3 categories) and the following 30 baseline variables as predictors of the allocation (independent variables): ethnicity, marital status (3 categories), living alone, unemployment, retirement, housewife as the only occupation, presence of any disability, years of education (continuous), dyspnea, history of non-atherosclerotic cardiovascular disease, history of kidney disease, history of chronic lung disease, history of depression, cataracts, history of obstructive sleep apnea, history of cancer, use of vitamin/mineral supplements, use of angiotensin-converting enzyme inhibitors, use of diuretics, use of other anti-hypertensive medication, use of statins, use of other lipid-lowering medication, use of insulin, use of oral antidiabetic agents, use of aspirin/antiplatelet therapy, score of psychological tension (continuous, 0 to 10), fasting plasma glucose (continuous), ratio of blood total cholesterol to HDL-cholesterol (continuous), blood LDL-cholesterol levels (continuous) and blood triglycerides (continuous). After fitting this multinomial logistic model, we retained the post-estimation predicted probabilities to be allocated to each of the two active intervention diets (P1=probability of allocation to the Mediterranean diet with extra-virgin olive oil and P2=probability of allocation to the Mediterranean diet with nuts). The propensity score to be allocated to the control group (P3) is the complementary of the sum of P1+P2, i.e., the sum P1+P2+P3 should always be 1 for each participant. Therefore, P3 would be redundant and there is no need to include it in the model. In a subsequent step, we added the 2 estimated propensity scores for the intervention (P1 and P2) as continuous covariates (independent variables) in the Cox model in order to adjust for the predicted probability to be allocated to each of the two active interventions. To further control for potential confounding by socio-economic status (suggested by the editors), we stratified the models by educational level (5 categories).
13
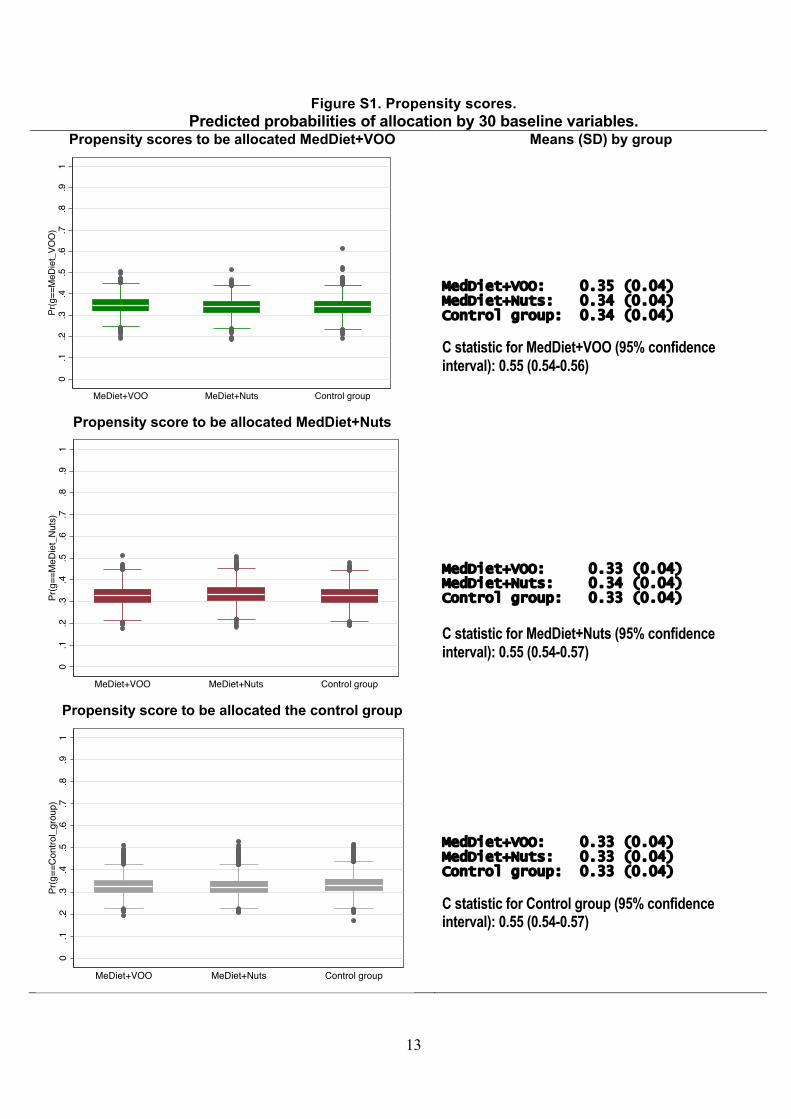
Figure S1. Propensity scores. Predicted probabilities of allocation by 30 baseline variables.
Propensity scores to be allocated MedDiet+VOO Means (SD) by group
MedDiet+VOO: 0.35 (0.04) MedDiet+Nuts: 0.34 (0.04) Control group: 0.34 (0.04)
C statistic for MedDiet+VOO (95% confidence interval): 0.55 (0.54-0.56)
Propensity score to be allocated MedDiet+Nuts
MedDiet+VOO: 0.33 (0.04) MedDiet+Nuts: 0.34 (0.04) Control group: 0.33 (0.04)
C statistic for MedDiet+Nuts (95% confidence interval): 0.55 (0.54-0.57)
Propensity score to be allocated the control group
MedDiet+VOO: 0.33 (0.04) MedDiet+Nuts: 0.33 (0.04) Control group: 0.33 (0.04)
C statistic for Control group (95% confidence interval): 0.55 (0.54-0.57)
0.1
.2.3
.4.5
.6.7
.8.9
1Pr
(g==
MeD
iet_
VOO
)
MeDiet+VOO MeDiet+Nuts Control group
0.1
.2.3
.4.5
.6.7
.8.9
1Pr
(g==
MeD
iet_
Nuts
)
MeDiet+VOO MeDiet+Nuts Control group
0.1
.2.3
.4.5
.6.7
.8.9
1Pr
(g==
Cont
rol_
grou
p)
MeDiet+VOO MeDiet+Nuts Control group
14
This analysis, adjusted for the propensity score variables and 12 other covariates (3 stratification variables and 9 additional covariates) is the primary analysis (main model) reported in the main body of the paper. The adjustment did not change the hazard ratio estimate (unadjusted: 0.700; adjusted: 0.703 for both Mediterranean diet groups combined versus the control group), suggesting that the protocol deviations did not introduce substantial imbalances in the measured confounders. Of note, the distribution of the estimated propensity scores is nearly identical across groups (Fig. S1).
For additional confirmation of the validity of our estimates, we conducted a number of sensitivity analyses described below (Fig. S2).
1. Adjusted analysis after excluding 1042 subjects (non-randomized members of
households and site D): model 1 in Fig. S2.
2. Adjusted analysis after excluding 1588 subjects (non-randomized members of households, site D and site B): model 2 in Fig. S2.
3. Adjusted analysis using inverse probability (IP) weights. A participant’s IP
weight is, informally, the inverse of the probability of being allocated to the group where she/he was actually allocated. This probability was estimated via a multinomial logistic model with the same 30 baseline covariates used in the main model: models 3a, 3b and 3c in Fig. S2.
a. In the entire study population b. After excluding 1042 subjects (non-randomized members of households
and site D) c. After excluding 1588 subjects (non-randomized members of households,
site D and site B).
4. Adjusted analysis with a propensity score estimated using 70 baseline predictor terms: major cardiovascular risk factors (age, quadratic term for age, smoking [3 categories, 2 dummy variables], hypertension, dyslipidemia, type 2 diabetes, family history of premature coronary heart disease, body mass index, a quadratic term for body mass index, waist-to-height ratio, 5 quintiles of leisure-time physical activity [4 dummy variables], and sex), 10 dummy variables for 11 recruitment sites, socio-demographic variables (5 categories of educational level [4 dummy variables], ethnicity, marital status in 3 categories [2 dummy variables], living alone, unemployment, retirement, and housewife as the only occupation), co-morbidities (presence of any disability, psychological tension [continuous, 0 to 10 score], dyspnea, history of non-atherosclerotic cardiovascular disease, history of kidney disease, history of chronic lung disease, history of depression, cataracts, history of sleep obstructive apnea and history of cancer), medication (vitamin/mineral supplements, angiotensin-converting enzyme inhibitors, diuretics, other anti-hypertensive medication, statins, other lipid-lowering medication, insulin, oral antidiabetic agents, and
15
aspirin/antiplatelet therapy), additional continuous variables related to cardiovascular risk factors (physical activity as a continuous variable, fasting plasma glucose, a quadratic term for fasting plasma glucose, total blood cholesterol, a quadratic term for total blood cholesterol, blood triglycerides, a quadratic term for blood triglycerides, low density lipoprotein-cholesterol, a quadratic term for low density lipoprotein-cholesterol, high-density lipoprotein-cholesterol, a quadratic term for high density lipoprotein-cholesterol and the ratio of total cholesterol to high density lipoprotein-cholesterol) and additional dichotomous variables related to cardiovascular risk factors (obesity, fasting plasma glucose equal or higher than 100 mg/dl, total blood cholesterol equal or higher than 240 mg/dl , triglycerides equal or higher than 150 mg/dl, for low density lipoprotein-cholesterol equal or higher than 130 mg/dl and high density lipoprotein-cholesterol lower than 40 mg/dl): models 4a, 4b and 4c in Fig. S2.
a. In the entire study population b. After excluding 1042 subjects (non-randomized members of households
and site D) c. After excluding 1588 subjects (non-randomized members of households,
site D and site B).
5. Adjusted analysis using inverse probability weights (see above) by the propensity score (instead of including the propensity score as a continuous covariate) and the propensity score was estimated using all above-mentioned 70 baseline predictor terms: models 5a, 5b and 5c in Fig. S2.
a. In the entire study population b. After excluding 1042 subjects (non-randomized members of households
and site D) c. After excluding 1588 subjects (non-randomized members of households,
site D and site B).
6. Adjusted analysis with Framingham score2 (please see Fig. S13) included as a continuous covariate: models 6a, 6b and 6c in Fig. S2.
a. In the entire study population b. After excluding 1042 subjects (non-randomized members of households
and site D) c. After excluding 1588 subjects (non-randomized members of households,
site D and site B)
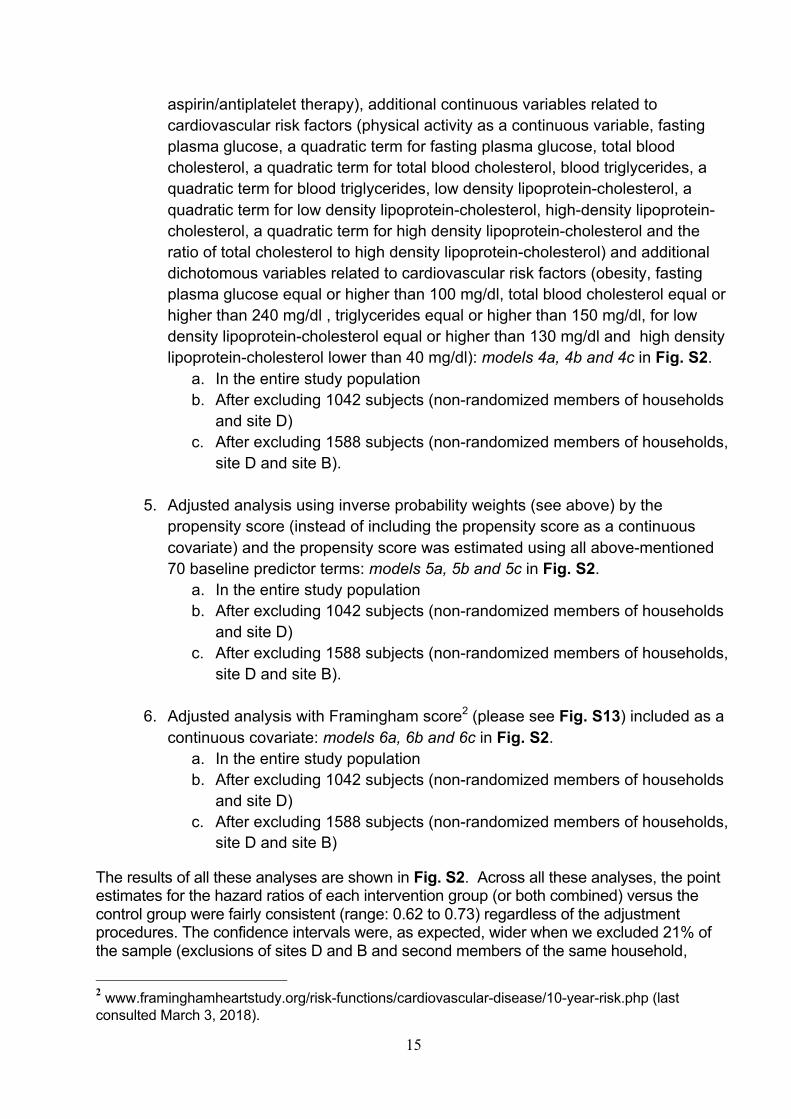
The results of all these analyses are shown in Fig. S2. Across all these analyses, the point estimates for the hazard ratios of each intervention group (or both combined) versus the control group were fairly consistent (range: 0.62 to 0.73) regardless of the adjustment procedures. The confidence intervals were, as expected, wider when we excluded 21% of the sample (exclusions of sites D and B and second members of the same household,
2 www.framinghamheartstudy.org/risk-functions/cardiovascular-disease/10-year-risk.php (last consulted March 3, 2018).

16
models 2, 3c, 4c, 5c and 6c). These findings strongly suggest that our results are unlikely to be explained by baseline confounding. Legends for Fig. S2.
MedDiet: Mediterranean diet. VOO: extra virgin olive oil. HR: Hazard Ratio. 95% CI: 95% confidence interval.
17
Figure S2. Sensitivity analyses with different procedures to control for confounding.
18
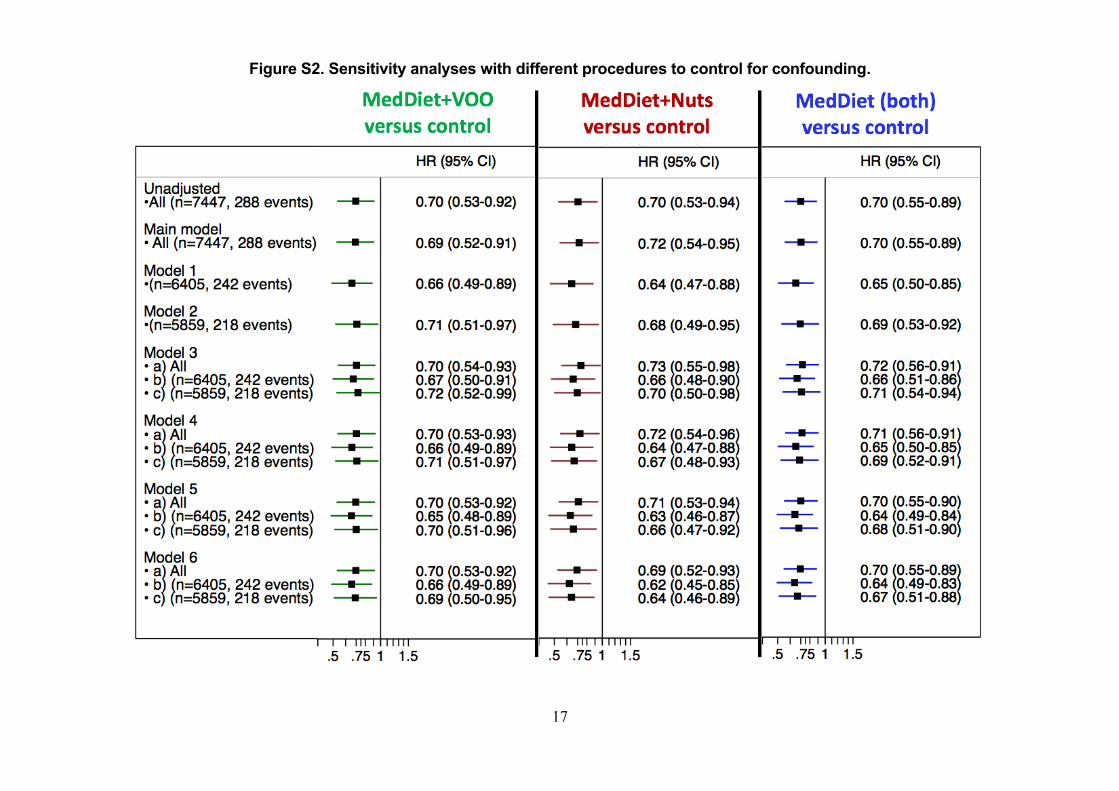
TRIAL ENROLLMENT CRITERIA Trial participants were community-dwelling high-risk persons, with ages 55 to 80
years for men and 60 to 80 years for women. They should be free of cardiovascular disease and meet at least one of the two inclusion criteria. Inclusion criteria. Either a) or b) should be met:
a) Type 2 diabetes. Diagnosis of diabetes was based on at least one of the following criteria: - Current treatment with insulin or oral hypoglycemic drugs. - Fasting glucose > 126 mg/dl (fasting is defined as no caloric intake at least for 8
hours). - Casual glucose > 200 mg/dl with polyuria, polydipsia, or unexplained weight loss. - Glucose > 200 mg/dl in two measurements after an oral glucose tolerance test OR
b) Three or more of the following risk factors: - Current smoker (>1 cig/day during the last month) - Hypertension (systolic blood pressure >=140 mm Hg or diastolic blood pressure >=90
mmHg or under antihypertensive medication) - LDL-cholesterol >= 160 mg/dl - HDL-cholesterol <= 40 mg/dl independently of lipid-lowering therapy - Body mass index >=25 kg/m2 - Family history of premature CHD (definite myocardial infarction or sudden death
before 55 years in father or male 1st-degree relative, or before 65 years in mother or female 1st-degree relative)
- If the HDL-cholesterol level was >=60 mg/dL, one risk factor was subtracted.
Exclusion criteria. Major exclusion criteria were:
- Documented history of previous cardiovascular disease, including CHD (angina, myocardial infarction, coronary revascularization procedures or existence of abnormal Q waves in the electrocardiogram (EKG)), stroke (either ischemic or hemorrhagic, including transient ischemic attacks), or clinical peripheral artery disease with symptoms of intermittent claudication.
- Severe medical condition that may impair the ability of the person to participate in a nutrition intervention study (e.g. digestive disease with fat intolerance, advanced malignancy, or major neurological, psychiatric or endocrine disease)
- Any other medical condition thought to limit survival to less than 1 year. - Immunodeficiency or HIV-positive status. - Illegal drug use, chronic alcoholism or problematic use of alcohol or total daily
alcohol intake >80 g/d. - Body mass index > 40 kg/m2. - Difficulties or major inconvenience to change dietary habits - Impossibility to follow a Mediterranean-type diet, for religious reasons or due to the
presence of disorders of chewing or swallowing (e.g., difficulties to consume nuts) - A low predicted likelihood to change dietary habits according to the Prochaska and
DiClemente stages of change model (6).

19
- History of food allergy with hypersensitivity to any of the components of olive oil or nuts.
- Participation in any drug trial or use of any investigational drug within the last year. - Institutionalized patients for chronic care, those who lacked autonomy, were
unable to walk, lacked a stable address, or were unable to attend visits in the Primary Care Health clinics every 3 months.
- Illiteracy. - Patients with an acute infection or inflammation (e.g., pneumonia) were allowed to
participate in the study 3 months after the resolution of their condition.
20
DIETARY INTERVENTION PROTOCOL Generalities The PREDIMED trial was designed as a large controlled, randomized clinical trial in a high-risk population aimed to assess whether Mediterranean diets enriched with extra-virgin olive oil or mixed nuts prevent cardiovascular diseases in comparison with a Control group where participants receive advice to follow a low-fat diet. As secondary outcomes, we will also assess diet effects on all-cause mortality and the incidence of heart failure, diabetes, cancer, cognitive decline, and other neurodegenerative disorders.
The PREDIMED dietary intervention followed a behavioral strategy focused on modifying the way an individual views the dietary pattern, appraises its meaning, and makes informed choices. We applied common cognitive behavioral techniques, including goal setting, self-monitoring, feedback and reinforcement, self-efficacy enhancement, incentives, problem solving, relapse prevention, and motivational interviewing in quarterly individual and group sessions throughout the duration of the trial. Measurable realistic goals easily identifiable by the participant and attainable in specified time frames were set. The provision of extra-virgin olive oil and nuts contributes to a higher compliance with the overall food pattern of the Mediterranean diet in the corresponding groups. Even if the Mediterranean diet itself contains both olive oil and nuts, the supplementation with either virgin olive oil or nuts increases the intake of fat coming from natural vegetable sources. This also increases the palatability of the diet and represents an incentive for participants to maintain an adequate long-term compliance with the intended dietary changes. In addition, this approach ensures that the variety of olive oil consumed in the first group corresponds to a polyphenol-rich extra-virgin olive oil, and a high amount of nuts is consumed in the second group. Critical to this aspect of the study is the fact that we could assure the generous donation of these food items throughout the trial. Due to the difficulty to choose amongst the wide variety of low-fat foods and to budget restraints, participants in the Control diet group received only small non-food gifts, such as kitchenware, tableware, aprons, or shopping bags to promote retention into the trial.
From a public health perspective, a behavioral intervention coupled with an easy (free) access to representative healthy foods is a realistic test of the effectiveness to be attained with official policies and health promotion activities. The PREDIMED trial attempts to obtain relevant information for public health use because the nutritional intervention is undertaken in free-living persons who receive information, motivation, support and empowerment to modify their food habits in a real-life context, i.e., they continue to buy their foods and cook their meals. Such an intervention provides a real-life scenario that may be easily applied to public health policies. Given that the palatability of meals is critical to ensure compliance, the PREDIMED protocol included the quarterly delivery of shopping lists, menus, and recipes with these characteristics to participants in the three study groups.
The rationale for comparing 2 Mediterranean diet groups (one with supplemental extra-virgin olive oil and one with supplemental nuts) instead of one to the Control diet group was as follows. Besides being a rich source of monounsaturated fatty acids, extra-virgin olive oil used in one arm of the study is a good source of phenolic antioxidants. One-half the dose of the nuts used in another arm of the study was made up of walnuts, thus containing sizeable amounts of polyunsaturated fatty acids, particularly linoleic acid and alpha-linolenic acid, the plant-derived omega-3 fatty acid, in addition to polyphenols. The other half of nut doses was almonds and hazelnuts, both rich in monounsaturated fatty acids and polyphenols. Thus, one Mediterranean diet was enriched in monounsaturated fatty acids and polyphenols and the other Mediterranean diet was enriched in n-9, n-6 and n-3
21
polyunsaturated fatty acids as well as polyphenols. Although having the same general food pattern of the Mediterranean diet, the two arms of the study differed in the intake of two foods (extra-virgin olive oil and nuts) and two nutrients (monounsaturated fatty acids and polyunsaturated fatty acids, including alpha-linolenic acid) that are all felt to be important in cardiovascular prevention and might have differential beneficial effects.
The main focus of the PREDIMED Study was to change the dietary pattern instead of focusing on changes in macronutrients. As opposed to recommendations to participants allocated the Control diet, total fat intake for the 2 Mediterranean diet groups was ad libitum (a high fat intake was allowed, as long as most fat was derived from fatty fish and vegetable sources, particularly olive oil and nuts). There were no specific energy restrictions for any study arm. Importantly, caution was taken to minimize the possibility that participants with obesity, diabetes, hypertension or dyslipidemia received contradictory dietary advice from other health professionals external to the PREDIMED trial.
Registered dietitians were directly responsible for all aspects of the dietary intervention at each site. All PREDIMED dietitians were trained and certified to deliver the intervention protocol. Before implementation of the protocol, training consisted of: 1. approximately 24 hours of initial theoretical and practical group discussion with experts in nutrition education; and 2) discussion in between 3 to 5 conference calls to review and improve the protocol. During these calls each dietitian discussed his/her practice sessions with the team in order to identify problems and find solutions in the implementation of the protocol. Feedback and discussion also took place among the dietitians and the site coordinators. These calls were continued quarterly throughout the study. In addition, a yearly 1-day conference with attendance of all the dietitians and Dietary Intervention Committee members was scheduled. This meeting dealt, amongst others, with the following critical points: 1. update on personnel and affiliations in all participating sites; 2. assessment of site-specific needs regarding personnel and/or study materials; 3. review of food frequency and physical activity questionnaires collected per site and online updating procedures; 4. evaluation of the appropriateness of dietary instructions per treatment group made by the Dietary Intervention Committee and posted quarterly online in the PREDIMED website; 5. review of the adherence to the intervention, diet-related adverse effects and solutions thereof; 6. appraisal of the quality of supplemental foods last shipped per site; 7. update on protocols of shipping and storage of biological samples; and 8. site-specific problems with follow-up and how to solve them.
Description of the Interventions First visit with the dietitian. At screening visit 1, participants signed informed consent and thereafter were randomized to one of three diet groups. Therefore, randomization occurred prior to the baseline visit. At screening visit 2 (baseline visit) participants were informed of their treatment assignment and the following procedures were implemented during an individual visit with the dietitian of at least 1-h duration: a) In a face-to-face interview with the candidate, the dietitian explained in detail the purpose and anticipated development of the study. b) The dietitian reviewed (and completed with the participant if needed) the food frequency and physical activity questionnaires that were provided at screening visit 1. Alternatively, the participant who had difficulties to fill in the questionnaires at home did it during the visit with continuous help by the dietitian. c) During the same visit, the study nurse filled in a general medical questionnaire, performed anthropometrical and blood pressure measurements, determined the ankle-arm blood pressure index, performed an electrocardiogram, and obtained pre-specified biological samples.
22
Individual motivational interview. After screening visit 2, participants randomized to any of the three study arms had a face-to-face interview with the dietitian that comprised the following points: a) Administration of the validated 14-item questionnaire of adherence to the Mediterranean diet (Table S4), including a point-by-point review and construction of the individual score. b) Personal individual recommendations for changes to be introduced in the participant’s diet in order to achieve a personalized goal depending on group assignment. The dietitian provided a comprehensive number of reasons to adopt a Mediterranean diet or a low-fat diet, highlighting the advantages of following this diet rather than the risks of not adhering to it, and transmitting a positive message with stress on the particular benefits for the high cardiovascular risk status of the participants. The dietitian personalized the message by adapting it to the participant’s clinical condition, preferences, and beliefs. The training of the PREDIMED dietitians emphasized the holistic approach to lifestyle change in order to tailor the intervention to nutritional assessment and individual needs. A contracting procedure was used and a negotiated change in diet was the targeted goal, working with the subject to determine what he or she considered an attainable goal. The focus could be shifted from changing portion sizes to frequency of intake or cooking methods. c) The participant was scheduled for a group session in the next 1 to 2 weeks. The visit ended with an agreement to participate in the group session. Group sessions. The PREDIMED dietitians run the group sessions, which were scheduled quarterly and attended by up to 20 participants per session. Separate sessions were organized for each of the three study groups (Mediterranean diet with extra-virgin olive oil, Mediterranean diet with nuts, and Control diet). Each group session included: a) Informative talk with recall of the dietary goals for the particular study arm, with open discussion. b) Description of the following written material, with printed copies given to each participant:
-Elaborate descriptions of 4 to 5 foods typical of the dietary pattern corresponding to the particular arm of the study and adapted to the season of the year. -A quantitative 1-week shopping list of food items, according to the season of the year (see: www.predimed.es). -A weekly plan of meals (with detailed menus) corresponding to the shopping list (see: www.predimed.es). -The recipes for preparing the meals of the suggested menus.
c) Clarifications of any doubts regarding the instructions provided. d) Depending on group assignment, 3-month allotments of supplemental foods were provided to participants in the Mediterranean diet groups, together with instructions about their use and conservation. Alternatively, non-food gifts were given to participants in the Control diet group during the corresponding session. e) The session ended with an agreement to participate in the next visit 3 months later. Follow-up visits and reiteration of individual and group sessions. The individual motivational interviews and group sessions were repeated every 3 months with the same contents. Each visit included three steps: assessment, intervention, and future directions. Peculiarities of the intervention by group assignment. 1. Mediterranean diet groups. In these two groups the 14-item questionnaire of adherence to the Mediterranean diet (Table S4) was instrumental for the intervention. Based on the last assessment of individual Mediterranean diet scores, the dietitian gave personalized dietary advice to each participant, with recommendations on the desired frequency of intake of specific foods directed to upscale the score. Accomplishments in the previous months, even if minor (i.e., a one point increase in the score), were considered as support to provide further empowerment and self-reward.
23
The general guidelines to follow the Mediterranean diet that dietitians provided to participants included the following positive recommendations: a) abundant use of olive oil for cooking and dressing dishes; b) consumption of ≥ 2 daily servings of vegetables (at least one of them as fresh vegetables in a salad), discounting side dishes; c) ≥ 2-3 daily servings of fresh fruits (including natural juices); d) ≥ 3 weekly servings of legumes; e) ≥ 3 weekly servings of fish or seafood (at least one serving of fatty fish); f) ≥ 1 weekly serving of nuts or seeds; g) select white meats (poultry without skin or rabbit) instead of red meats or processed meats (burgers, sausages); h) cook regularly (at least twice a week) with tomato, garlic and onion adding or not other aromatic herbs, and dress vegetables, pasta, rice and other dishes with tomato, garlic and onion adding or not aromatic herbs. This sauce is made by slowly simmering the minced ingredients with abundant olive oil. Negative recommendations are also given to eliminate or limit the consumption of cream, butter, margarine, cold meat, pate, duck, carbonated and/or sugared beverages, pastries, industrial bakery products (such as cakes, donuts, or cookies), industrial desserts (puddings, custard), French fries or potato chips, and out-of-home pre-cooked cakes and sweets.
The dietitians insisted that two main meals per day should be eaten (seated at a table, lasting more than 20 minutes). For usual drinkers, the dietitian’s advice was to use wine as the main source of alcohol (maximum 300 ml, 1-3 glasses of wine per day). If wine intake was customary, a recommendation to drink a glass of wine per day (bigger for men, 150 ml, than for women, 100 ml) during meals was given. Ad libitum consumption was allowed for the following food items: nuts (raw and unsalted), eggs, fish (recommended for daily intake), seafood, low-fat cheese, chocolate (only black chocolate, with more than 50% cocoa), and whole-grain cereals. Limited consumption (£1 serving per week) was advised for cured ham, red meat (after removing all visible fat), and cured or fatty cheeses.
Depending on group allocation, either a 15-liter (1 liter per week for 15 weeks) supply of extra-virgin olive oil (ÒHojiblanca and ÒFundación Patrimonio Comunal Olivarero, both from Spain) or 3-month allowances of nuts consisting of 1,350 g (15 g per day) sachets of walnuts (ÒCalifornia Walnut Commission, Sacramento, CA), 675 g (7.5 g per day) sachets of almonds (ÒBorges SA, Reus, Spain), and 675 g (7.5 g per day) sachets of hazelnuts (ÒLa Morella Nuts, Reus, Spain) were delivered to participants in the corresponding Mediterranean diet groups during each quarterly group session. Individualized methods of supplemental food delivery were devised for occasions in which participants needed to have their 3-month session rescheduled. Provisions were made to improve participants’ compliance. Thus, the extra-virgin olive oil allowance (1 liter per week) took into account the needs of the whole family, while additional 1000 g packs of mixed nuts were provided quarterly for each family unit.
In the Mediterranean diet with nuts group we offered participants three types of tree nuts, walnuts, hazelnuts and almonds. As stronger evidence supports that alpha-linolenic acid-rich walnuts might offer special advantages in cardiovascular prevention, we supplied a higher amount of walnuts than of almonds and hazelnuts. Fatty foods such as olive oil and nuts, even if rich in unsaturated fatty acids, are still perceived as fattening by some nutrition experts. Due to this, it was particularly important to allay the fear of an eventual weight gain that might have both the person who is on a weight-management program and his/her nutritionist. This was done by a comprehensive exposition of recent scientific evidence suggesting that these foods do not promote weight gain and might even help to lose weight. In the case of nuts, consistent evidence indicates that their lack of a fattening effect is mainly due to satiety with subsequent food compensation. For this reason, the dietitian specifically pointed out that nuts could be eaten anytime during the day except after dinner, when food compensation in the next meal could not reasonable take place.
24
2. Control diet group. The focus in the control group was to reduce all types of fat, with particular emphasis in recommending the consumption of lean meats, low-fat dairy products, cereals, potatoes, pasta, rice, fruits and vegetables. In the Control group, advice on vegetables, red meat and processed meats, high-fat dairy products, and sweets concurred with the recommendations of the Mediterranean diet, but use of olive oil for cooking and dressing and consumption of nuts, fatty meats, sausages, and fatty fish were discouraged. A 9-item quantitative score of compliance with the low-fat control diet was constructed (Table S5) as an instrument for dietitians to assess and modify the participant’s dietary pattern. The last assessment of the 9-item score helped dietitians to give personalized advice in order to upgrade it in a similar way than the 14-item Mediterranean diet score was instrumental to enhance the Mediterranean diet in the corresponding intervention groups. Similarly, accomplishments in the previous months were used as support to provide further empowerment and self-reward. Cooking instructions were also given to participants in the control group about the preparation of foods to avoid frying and using instead steaming, broiling, or microwaving. The initial dietary protocol for the Control group started with the delivery of a leaflet (see page 53) summarizing the recommendations to follow a low-fat diet and scheduled one yearly visit. In October 2006, 3 years into the trial, we realized that such a low-grade intervention might potentially represent a weakness of the trial and amended the protocol to include quarterly individual and group sessions with delivery of food descriptions, shopping lists, meal plans and recipes (adapted to the low-fat diet) in such a way that the intensity of the intervention was similar to that of the Mediterranean diet groups, except for the provision of supplemental foods for free. This amendment of the protocol in no way meant a change in the quality and specific goals of the recommendations to the control group; it was only an enhancement in the eagerness of the intervention to make it similar to that delivered to participants in the Mediterranean diet groups.

25
BIOMARKERS OF COMPLIANCE Methods At 1, 3, and 5 years of follow-up we determined objective biomarkers of adherence to the supplemental foods in random samples of participants (urinary hydroxytyrosol, the main phenolic compound in extra-virgin olive oil, by gas chromatography–mass spectrometry, and the plasma proportion of alpha-linolenic acid by gas-chromatography, as a measure of adherence to walnut consumption).
26
DIAGNOSTIC CRITERIA FOR TRIAL END POINTS (Version July, 2005 – Modified December, 2006) 1. Primary end point The primary end point is a composite end point that is defined as the first occurrence of cardiovascular death, myocardial infarction, or stroke. All of these components of the primary end point are also secondary end points as defined below. 2. Secondary end points
A. Myocardial infarction (MI)
Criteria for acute, evolving or recent MI
Either one of the following criteria satisfies the diagnosis of acute MI (7): • Typical rise or gradual fall (troponin) or more rapid rise and fall (CK-MB) of
biochemical markers of myocardial necrosis with at least one of the following: o Ischemic symptoms: Include chest, epigastric, arm, wrist or jaw discomfort with
exertion or rest, that usually lasts at least for 20 min and may be associated with unexplained nausea and vomiting, persistent shortness of breath, weakness, dizziness, lightheadedness or syncope, or a combination of these.
o Development of pathologic Q waves in the ECG: Any Q waves in leads V1 through V3 or Q wave higher or equal to 30 ms (0.03 s) in leads I, II, aVL, aVF, V4, V5 or V6. The Q wave changes must be present in any two contiguous leads, and be above or equal to 1 mm in depth;
o ECG changes indicative of ischemia (ST segment elevation or depression): § New or presumed new ST segment elevation at the J point in two or more
contiguous leads with the cutoff points ≥ 0.2 mV in leads V1, V2 or V3 and ≥ 0.1 mV in other leads.
§ ST segment depression in at least two contiguous leads. § T wave inversion ≥ 0.1 mV in at least two contiguous leads.
o Coronary artery intervention (e.g., coronary angioplasty) • Findings of acute MI at pathological examination.
Established MI Myocardial necrosis or clinically established MI (7) is defined from standard 12-lead ECG criteria in the absence of QRS confounders (e.g., bundle branch block, left ventricular hypertrophy or Wolff-Parkinson-White syndrome) when the following QRS changes are present:
• Any Q waves in leads V1 through V3 or • Q wave higher or equal to 30 ms (0.03 s) in leads I, II, aVL, aVF, V4, V5 or V6. The Q
wave changes must be present in any two contiguous leads, and be higher or equal to 1 mm in depth.
B. Stroke Acute neurological deficit lasting more than 24 hours caused by an abrupt impairment of brain function due to blockage of blood flow in a particular artery supplying the brain

27
(thrombosis or arterial embolism) or a cerebral hemorrhage This definition does not include the transient ischemic attack (TIA). To exclude other diagnosis such as hypoglycemia or seizures, a brain imaging technique (computed tomography [CT] or magnetic resonance imaging [MRI]) should demonstrate a cerebral infarction or hemorrhage (8-10). C. Cardiovascular death For the purpose of this study, cardiovascular death included the following causes of death: coronary heart disease deaths (i.e., acute myocardial infarction, unstable angina pectoris, and other forms of chronic ischemic heart disease), stroke, arrhythmias, congestive heart failure, pulmonary edema, pulmonary embolisms, and ruptured aortic aneurysm (11,12). D. All-cause mortality This end point includes all causes of death, including cardiovascular and non-cardiovascular causes. All deaths should be confirmed by reviewing the National Death Index.
28
USE OF THE NATIONAL DEATH INDEX AND ALTERNATIVE ANALYSES TO ADDRESS POTENTIAL SELECTION BIAS DUE TO SELECTIVE ATTRITIONS. We reviewed the medical records of all participants in the PREDIMED trial on a yearly basis. This was our most important source of information on hard clinical events. In order to confirm deaths and their causes, we also examined both the Spanish National Death Index (S-NDI) and the files from the National Statistics Institute (NSI). Please see Molist et al. (13) for a comparison between these two sources of information on mortality. The S-NDI, started in 2000, is the standard source of data for assessing deaths in cohort studies in Spain. The NSI is more accurate and, because it includes personal identifiers, can be directly linked to research databases upon signing of an agreement between the NSI and the research institution (the University of Navarra in our case). S-NDI and NSI, used as additional information sources, have a high positive predictive value (see below), but a lower negative predictive value because: 1) they only capture fatal cases and 65% of primary end-points in PREDIMED were non-fatal,�2) they do not include deaths that occur abroad, and 3) they have a reporting delay that can exceed 2 years in some cases (13). Therefore, we only used the S-NDI and NSI to confirm fatal cases as their use would have resulted in false negatives for the primary endpoint. For the same reason, loss to follow-up was defined based on clinic visits and medical records review rather than on the use of S-NDI. For instance, a participant who did not return for clinic visits 2 years post-randomization but whose medical records were reviewed 4 years from randomization was considered lost to follow-up on the last annotation in the medical record. Fig. S3 depicts how we counted the follow-up time for non-cases (participants without a documented endpoint or death) when we analyzed the primary end-point. For participants without death or event, we used as censoring date either the last annotation in the medical record (patient 1) or the last clinic visit (patient 2), whichever corresponded to a longer follow-up. Participants of the control group were less likely to have clinic visits (please see below Table S24). In each case, the censoring date was whichever came last. In Fig. S3, the follow-up time for participant 1 would be 27 months (according to medical record), but the follow-up time would only be 24 months for participant 2 (according to clinic visits). The alternative of using the time between the last annotation and the date when our team of physicians reviewed the medical record (i.e., the line after the dashed line) as part of the follow-up period would impose additional assumptions in our survival analyses. The reason is that the absence of any annotation (or any recorded visit) in the medical record will have a very low negative predictive value for the primary end-point. We can never exclude that the patient did have an event during that period (after the last annotation in the medical record) but he/she might have received medical care at another hospital in a different Spanish region or in another country. This was the reason why we censored participants without events at the date of their last annotation recorded in their medical records. This was done to ensure that the follow-up times that we used in our analyses were not likely to miss events. In fact, the possibility of missing events was remote, given that at the end of follow-up there was an annotation in the medical record and therefore that participant continued receiving her medical care at that specific hospital until that date. Please note that Spain does not have a single National Health System, but 17 independent (fully autonomous) Health Services under the authority of each of the 17 Regional Governments (Autonomous Communities) (14). There is no exchange of
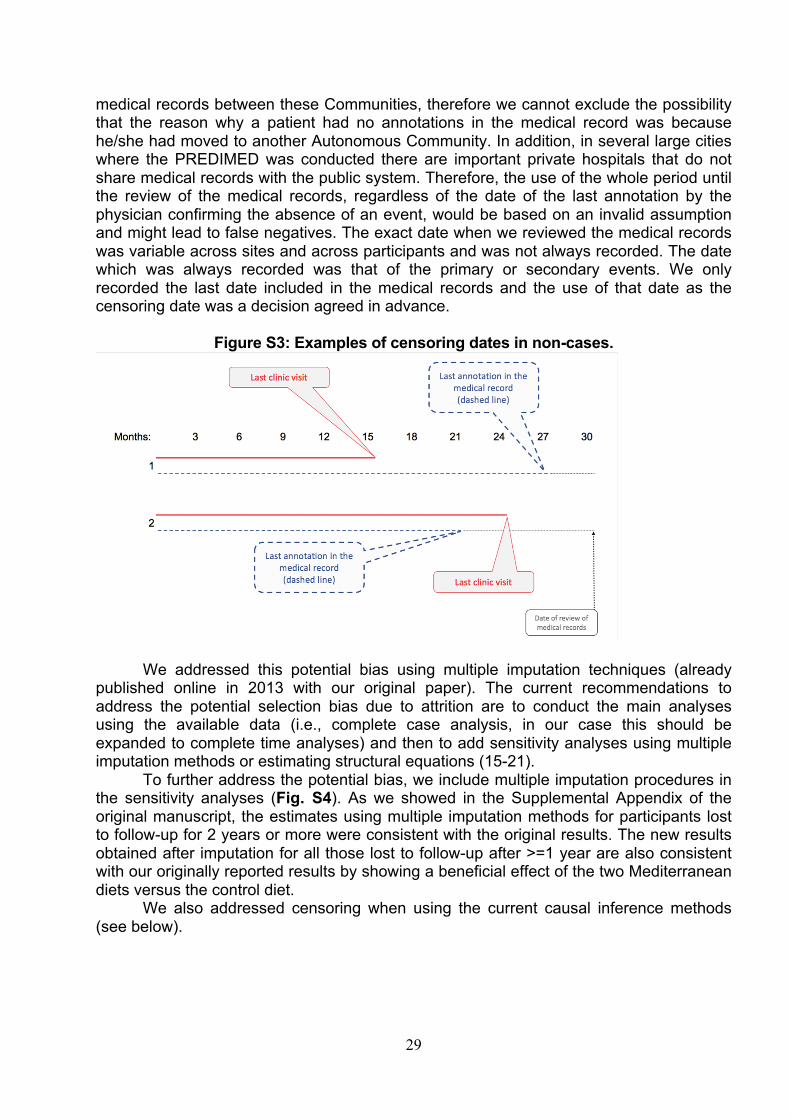
29
medical records between these Communities, therefore we cannot exclude the possibility that the reason why a patient had no annotations in the medical record was because he/she had moved to another Autonomous Community. In addition, in several large cities where the PREDIMED was conducted there are important private hospitals that do not share medical records with the public system. Therefore, the use of the whole period until the review of the medical records, regardless of the date of the last annotation by the physician confirming the absence of an event, would be based on an invalid assumption and might lead to false negatives. The exact date when we reviewed the medical records was variable across sites and across participants and was not always recorded. The date which was always recorded was that of the primary or secondary events. We only recorded the last date included in the medical records and the use of that date as the censoring date was a decision agreed in advance.
Figure S3: Examples of censoring dates in non-cases.
We addressed this potential bias using multiple imputation techniques (already published online in 2013 with our original paper). The current recommendations to address the potential selection bias due to attrition are to conduct the main analyses using the available data (i.e., complete case analysis, in our case this should be expanded to complete time analyses) and then to add sensitivity analyses using multiple imputation methods or estimating structural equations (15-21).
To further address the potential bias, we include multiple imputation procedures in the sensitivity analyses (Fig. S4). As we showed in the Supplemental Appendix of the original manuscript, the estimates using multiple imputation methods for participants lost to follow-up for 2 years or more were consistent with the original results. The new results obtained after imputation for all those lost to follow-up after >=1 year are also consistent with our originally reported results by showing a beneficial effect of the two Mediterranean diets versus the control diet.
We also addressed censoring when using the current causal inference methods (see below).

30
DEALING WITH LOSSES TO FOLLOW-UP The intention-to-treat effect is the effect of being assigned to a Mediterranean diet versus low-fat diet on the risk of cardiovascular disease under complete follow-up. We defined losses to follow-up as the absence of any contact for 2 years or longer (see Fig. S7), with contact defined as a follow-up visit, a dietary consultation, a family physician query, the last date found in the review of medical records, or the date of death recorded in the National Death Index. Because 7.0% of participants were lost to follow-up according to this definition, we conducted several analyses to explore the possible impact of these losses on our estimates. Alternative definitions of loss to follow-up using 1 year or longer without any recorded visit or annotation in the medical record did not materially affect these estimates. Figure S4 shows the hazard ratio estimates under the following analyses (Fig. S4):
A) “Original analysis”: the unadjusted analysis presented in our original publication of 2013.
B) Adjusted analysis” included in this publication. C) “Drop if ³1 y missing”: complete case analysis restricted to individuals not lost to
follow-up. D) “Follow-up carried forward to Dec. 2010”: all participants lost to follow-up were
assumed to having been successfully followed-up and remain totally free of any event of the primary end-point through December 2010. This is an extreme scenario that is unlikely to reflect reality.
E) “Multiple imputation if ³2 y missing”: multiple imputation of outcome value among 523 participants lost to follow-up for 2 years or longer. Twenty data sets with imputed outcomes were created. We allowed for several scenarios of cumulative absolute incidence rates of the major end-point ranging approximately from 0.01 to 0.10 among the subset of participants who dropped out. The results were pooled by using standard techniques, also taking into account the variation between imputed data sets (20,21).
F) “Multiple imputation if ³1 y missing”: same for the 810 participants lost to follow-up for 1 year or longer.

31
CVD: cardiovascular disease ITT: Intention to treat EVOO: extra virgin olive oil
A) Original ITT analysis (crude)• MedDiet (both)• MedDiet+EVOO• MedDiet+Nuts
B) Main model (current version)• MedDiet (both)• MedDiet+EVOO• MedDiet+Nuts
C) Drop if >=1 y missing• MedDiet (both)• MedDiet+EVOO• MedDiet+Nuts
D) Follow-up carried forward Dec. 2010• MedDiet (both)• MedDiet+EVOO• MedDiet+Nuts
E) Multiple imputation if >=2 y missing• MedDiet+EVOO• MedDiet+Nuts
F) Multiple imputation if >=1 y missing• MedDiet+EVOO• MedDiet+Nuts
179/499796/254383/2454
179/499796/254383/2454
179/458396/235583/2228
179/499796/254383/2454
99/254386/2454
101/254386/2454
events/NIntervention:
109/2450109/2450109/2450
109/2450109/2450109/2450
109/2054109/2054109/2054
109/2450109/2450109/2450
124/2450124/2450
136/2450136/2450
events/NControl:
0.71 (0.56-0.90)0.70 (0.54-0.93)0.72 (0.54-0.96)
0.70 (0.55-0.89)0.69 (0.53-0.91)0.72 (0.54-0.95)
0.67 (0.52-0.85)0.66 (0.50-0.88)0.67 (0.50-0.90)
0.80 (0.63-1.02)0.80 (0.61-1.06)0.79 (0.59-1.06)
0.70 (0.52-0.93)0.70 (0.52-0.95)
0.65 (0.48-0.88)0.65 (0.48-0.89)
HR (95% CI)
0.71 (0.56-0.90)0.70 (0.54-0.93)0.72 (0.54-0.96)
0.70 (0.55-0.89)0.69 (0.53-0.91)0.72 (0.54-0.95)
0.67 (0.52-0.85)0.66 (0.50-0.88)0.67 (0.50-0.90)
0.80 (0.63-1.02)0.80 (0.61-1.06)0.79 (0.59-1.06)
0.70 (0.52-0.93)0.70 (0.52-0.95)
0.65 (0.48-0.88)0.65 (0.48-0.89)
HR (95% CI)
1.25 .5 .75 1 1.5
Hazard Ratios (HR) versus control for primary CVD end-point
Figure S4. Additional sensitivity analysesto address dropouts.

32
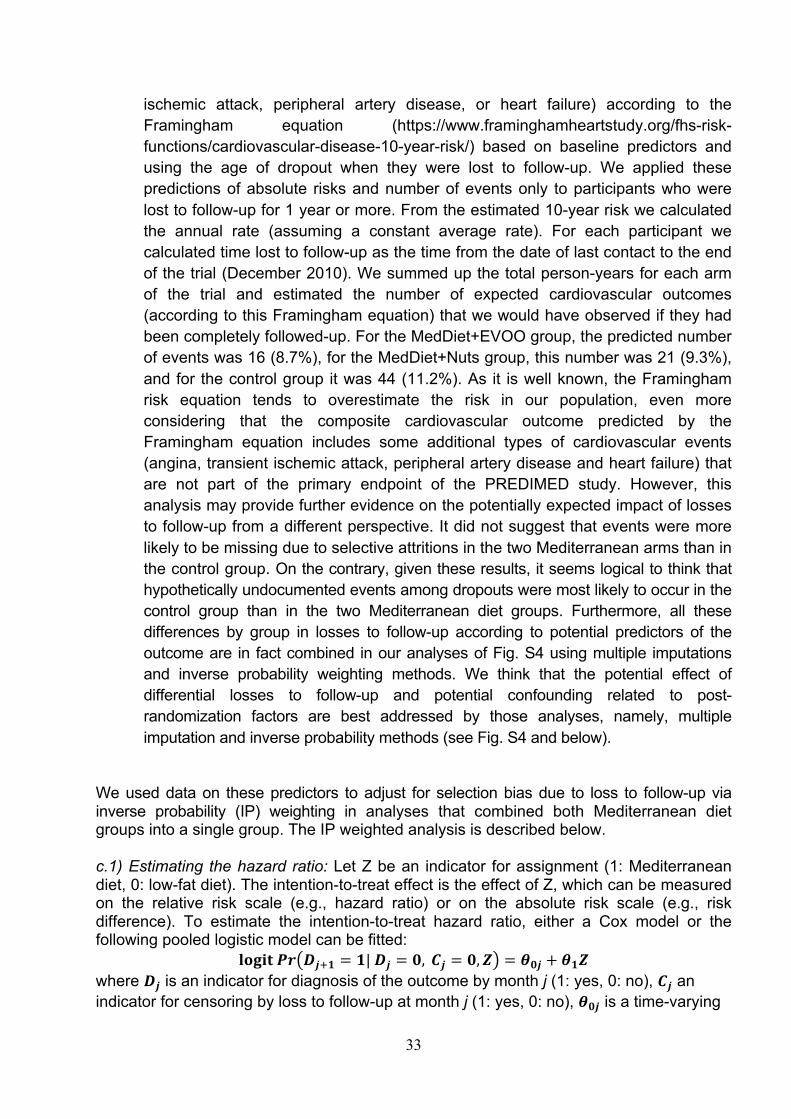
In addition, to go even deeper in ruling out a potential selection bias related to differential predictors of dropouts among the three arms of the trial, we assessed predictors of attritions by fitting multivariable-adjusted logistic regression models, separated for each of the 3 groups, using losses to follow-up for 1 year or more as the outcome (1=lost, 0=retained). The observed predictors of losses to follow-up (odds ratio [95% confidence interval]) in each arm of the trial were as follows.
• In the MedDiet + extra-virgin olive oil group, the only variable independently associated with higher odds of attrition was a higher waist-to-height ratio (OR=1.27 [1.00-1.60] for each 0.1 increment), whereas job retirement (0.69 [0.48-0.99]), use of oral antidiabetic agents (0.67 [0.47-0.95]), older age (0.86 [0.75-0.99] for each 5-year increment in age) and higher psychological tension (0.81 [0.70-0.93] for each 2-point increment in a 0 to 10 score) were independently associated with a lower risk of attrition. The most important variable here was older age, strongly associated with the primary end-point and with a higher probability of remaining in the trial (in this group). Therefore, as losses to follow-up in this group were younger (mean age=65.7 in attritions versus 67.1 in participants retained in the trial in this group), dropouts in this group had a lower expected risk of experiencing the primary event.
• In the MedDiet + nuts group, the variables independently associated with higher odds of attrition were a higher fasting plasma glucose (OR=1.04 [1.00-1.08] for each 10 mg/dl increment) and a higher baseline body mass index (OR=1.04 [1.00-1.08] for each 5 kg/m2 increment). On the contrary, a family history of premature coronary heart disease (0.57 [0.39-0.83]) and older age (0.77 [0.68-0.87], for each 5-year increment in age) were the 2 variables more strongly associated with permanence in the trial within this arm. Other variables also associated with lower likelihood of attrition within this arm were type 2 diabetes (0.65 [0.46-0.91]) and higher levels of LDL-cholesterol (0.95 [0.90-1.00] for each 10 mg/dl increment) with the same expected effect. Again, these differences suggest that dropouts in this active intervention group had a lower expected risk of experiencing the primary event.
• In the control group, the variables independently associated with higher odds of
attrition were higher levels of LDL-cholesterol (1.05 [1.01-1.09] for each 10 mg/dl increment), higher fasting plasma glucose (OR=1.04 [1.02-1.07] for each 10 mg/dl increment), and a higher waist-to-height ratio (OR=1.22 [1.04-1.44] for each 0.1 increment). On the contrary, a history of cataracts (0.57 [0.39-0.83]), of depression (0.57 [0.39-0.83]) and higher levels of triglycerides (0.95 [0.90-1.00] for each 10 mg/dl increment) were independently associated with lower odds of attrition. Interestingly, in the control group age, the strongest predictor of events, was not differentially associated with attrition.
• As another complementary approach, we calculated only for dropouts their predicted 10-year risk of CVD (defined as coronary death, myocardial infarction, coronary insufficiency, angina, ischemic stroke, hemorrhagic stroke, transient
33
ischemic attack, peripheral artery disease, or heart failure) according to the Framingham equation (https://www.framinghamheartstudy.org/fhs-risk-functions/cardiovascular-disease-10-year-risk/) based on baseline predictors and using the age of dropout when they were lost to follow-up. We applied these predictions of absolute risks and number of events only to participants who were lost to follow-up for 1 year or more. From the estimated 10-year risk we calculated the annual rate (assuming a constant average rate). For each participant we calculated time lost to follow-up as the time from the date of last contact to the end of the trial (December 2010). We summed up the total person-years for each arm of the trial and estimated the number of expected cardiovascular outcomes (according to this Framingham equation) that we would have observed if they had been completely followed-up. For the MedDiet+EVOO group, the predicted number of events was 16 (8.7%), for the MedDiet+Nuts group, this number was 21 (9.3%), and for the control group it was 44 (11.2%). As it is well known, the Framingham risk equation tends to overestimate the risk in our population, even more considering that the composite cardiovascular outcome predicted by the Framingham equation includes some additional types of cardiovascular events (angina, transient ischemic attack, peripheral artery disease and heart failure) that are not part of the primary endpoint of the PREDIMED study. However, this analysis may provide further evidence on the potentially expected impact of losses to follow-up from a different perspective. It did not suggest that events were more likely to be missing due to selective attritions in the two Mediterranean arms than in the control group. On the contrary, given these results, it seems logical to think that hypothetically undocumented events among dropouts were most likely to occur in the control group than in the two Mediterranean diet groups. Furthermore, all these differences by group in losses to follow-up according to potential predictors of the outcome are in fact combined in our analyses of Fig. S4 using multiple imputations and inverse probability weighting methods. We think that the potential effect of differential losses to follow-up and potential confounding related to post-randomization factors are best addressed by those analyses, namely, multiple imputation and inverse probability methods (see Fig. S4 and below).
We used data on these predictors to adjust for selection bias due to loss to follow-up via inverse probability (IP) weighting in analyses that combined both Mediterranean diet groups into a single group. The IP weighted analysis is described below. c.1) Estimating the hazard ratio: Let Z be an indicator for assignment (1: Mediterranean diet, 0: low-fat diet). The intention-to-treat effect is the effect of Z, which can be measured on the relative risk scale (e.g., hazard ratio) or on the absolute risk scale (e.g., risk difference). To estimate the intention-to-treat hazard ratio, either a Cox model or the following pooled logistic model can be fitted:
!"#$%'( )*+, = ,|)* = /, 1* = /, 2 = 3/* + 3,2 where )* is an indicator for diagnosis of the outcome by month j (1: yes, 0: no), 1* an indicator for censoring by loss to follow-up at month j (1: yes, 0: no), 3/* is a time-varying
34
intercept (modeled via linear and quadratic terms for month), and 3, is the log odds ratio, which closely approximates the log hazard ratio because the monthly probability of having the outcome was small (22). c.2) Definition of loss to follow-up: Censoring 1* due to loss to follow-up can be defined in several ways. For the purposes of estimating the intention-to-treat effect, we need accurate data on both assignment (which is obviously known for all participants) and time of occurrence of the outcome. An implication is that participants need to be considered lost to follow-up, and thus censored in the analysis, when their outcome would not have been ascertained had it occurred. Otherwise, some participants who did develop the outcome would be misclassified as non-events because they were lost to follow-up. Unfortunately, in the absence of continuous monitoring, there is no perfectly valid definition of loss to follow-up. In the intention-to-treat analysis presented in the main paper, a participant was considered lost to follow-up when the study staff last contacted them, with contact defined as a follow-visit, a dietary consultation, a family physician query, the last date found in the medical records review, or date of death found in the consultation of the National Death Index. Had we allowed all events learned after randomization into the analysis, the analysis would have included 7365 individuals (after excluding 82 participants with no dietary information at baseline), 31,853 person-years, and 284 cases and would have resulted in an intention-to-treat hazard ratio of 0.71 (95% CI: 0.56-0.90), which is essentially identical to the one reported in Table 3 of the main paper, using a Cox regression model.
Because adjustment needs to rely on post-randomization data updated at annual visits, we censored individuals the first time that 18 months elapsed without a study visit. Events that were learned by the investigators after censoring (e.g., via linkages with the National Death Index) were therefore excluded. c.3) IP weight estimation: The analyses described above may be biased if censoring by incomplete follow-up introduces bias. To try to reduce this potential bias, we fit the above model with each person-month’s contribution weighted by an IP weight (19,23). The subject-specific, time-varying stabilized IP weights are defined as:
56*1 =
78 19+, = /|19 ≠ ,, 2, ;78 19+, = /|19 ≠ ,, 2, <9
*
9=/
always defined when Dj=0, where V is a vector of baseline covariates and <9 =(</, <, …<9) is the history of covariates through month m, which we summarized by V and the vector <9 of the time-varying covariates at m. The probabilities in the numerator and denominator are 1 by definition for all person-months of an individual, except for those exactly 18 months after his/her last visit, because Cj (censoring) can only take value 1 exactly 18 months after the last visit; the probability of censoring is by definition 0 for all person-months except for those that are exactly 18 months after the last visit. To estimate the probability of remaining uncensored at 18 months we fitted the logistic regression models to the 5,219 person-months that are exactly 18 months after the last visit
!"#$%'( 1*+, = /|2, ; = A/* + A,2 + ABC ;DEF !"#$%'( 1*+, = /|2, ;, <* = G/* + G,2 + GBC ; + GHC <*
for the numerator and denominator of the IP weights, respectively. The baseline covariates V are sex, age (linear and quadratic terms), family history of early coronary heart disease, and recruitment site (11 categories); and the time-varying covariates were
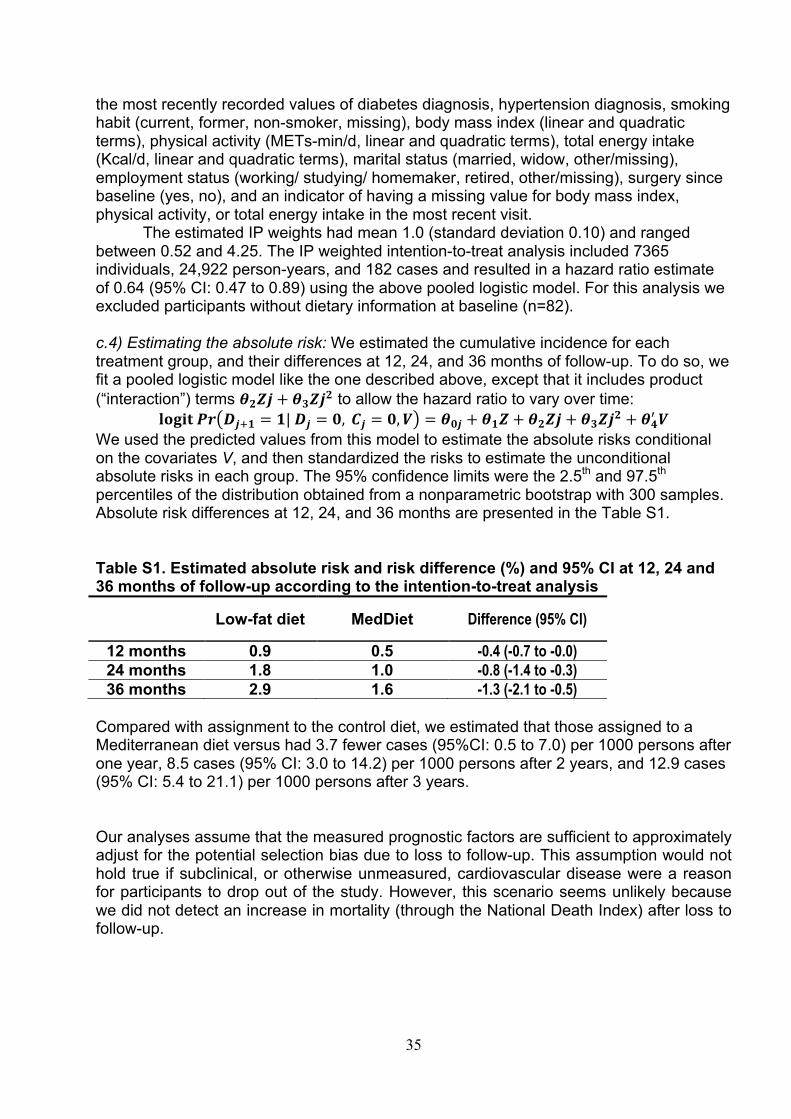
35
the most recently recorded values of diabetes diagnosis, hypertension diagnosis, smoking habit (current, former, non-smoker, missing), body mass index (linear and quadratic terms), physical activity (METs-min/d, linear and quadratic terms), total energy intake (Kcal/d, linear and quadratic terms), marital status (married, widow, other/missing), employment status (working/ studying/ homemaker, retired, other/missing), surgery since baseline (yes, no), and an indicator of having a missing value for body mass index, physical activity, or total energy intake in the most recent visit.
The estimated IP weights had mean 1.0 (standard deviation 0.10) and ranged between 0.52 and 4.25. The IP weighted intention-to-treat analysis included 7365 individuals, 24,922 person-years, and 182 cases and resulted in a hazard ratio estimate of 0.64 (95% CI: 0.47 to 0.89) using the above pooled logistic model. For this analysis we excluded participants without dietary information at baseline (n=82). c.4) Estimating the absolute risk: We estimated the cumulative incidence for each treatment group, and their differences at 12, 24, and 36 months of follow-up. To do so, we fit a pooled logistic model like the one described above, except that it includes product (“interaction”) terms 3B2* + 3H2*B to allow the hazard ratio to vary over time:
!"#$%'( )*+, = ,|)* = /, 1* = /, ; = 3/* + 3,2 + 3B2* + 3H2*B + 3IC ; We used the predicted values from this model to estimate the absolute risks conditional on the covariates V, and then standardized the risks to estimate the unconditional absolute risks in each group. The 95% confidence limits were the 2.5th and 97.5th percentiles of the distribution obtained from a nonparametric bootstrap with 300 samples. Absolute risk differences at 12, 24, and 36 months are presented in the Table S1. Table S1. Estimated absolute risk and risk difference (%) and 95% CI at 12, 24 and 36 months of follow-up according to the intention-to-treat analysis
Low-fat diet MedDiet Difference (95% CI)
12 months 0.9 0.5 -0.4 (-0.7 to -0.0) 24 months 1.8 1.0 -0.8 (-1.4 to -0.3) 36 months 2.9 1.6 -1.3 (-2.1 to -0.5)
Compared with assignment to the control diet, we estimated that those assigned to a Mediterranean diet versus had 3.7 fewer cases (95%CI: 0.5 to 7.0) per 1000 persons after one year, 8.5 cases (95% CI: 3.0 to 14.2) per 1000 persons after 2 years, and 12.9 cases (95% CI: 5.4 to 21.1) per 1000 persons after 3 years. Our analyses assume that the measured prognostic factors are sufficient to approximately adjust for the potential selection bias due to loss to follow-up. This assumption would not hold true if subclinical, or otherwise unmeasured, cardiovascular disease were a reason for participants to drop out of the study. However, this scenario seems unlikely because we did not detect an increase in mortality (through the National Death Index) after loss to follow-up.
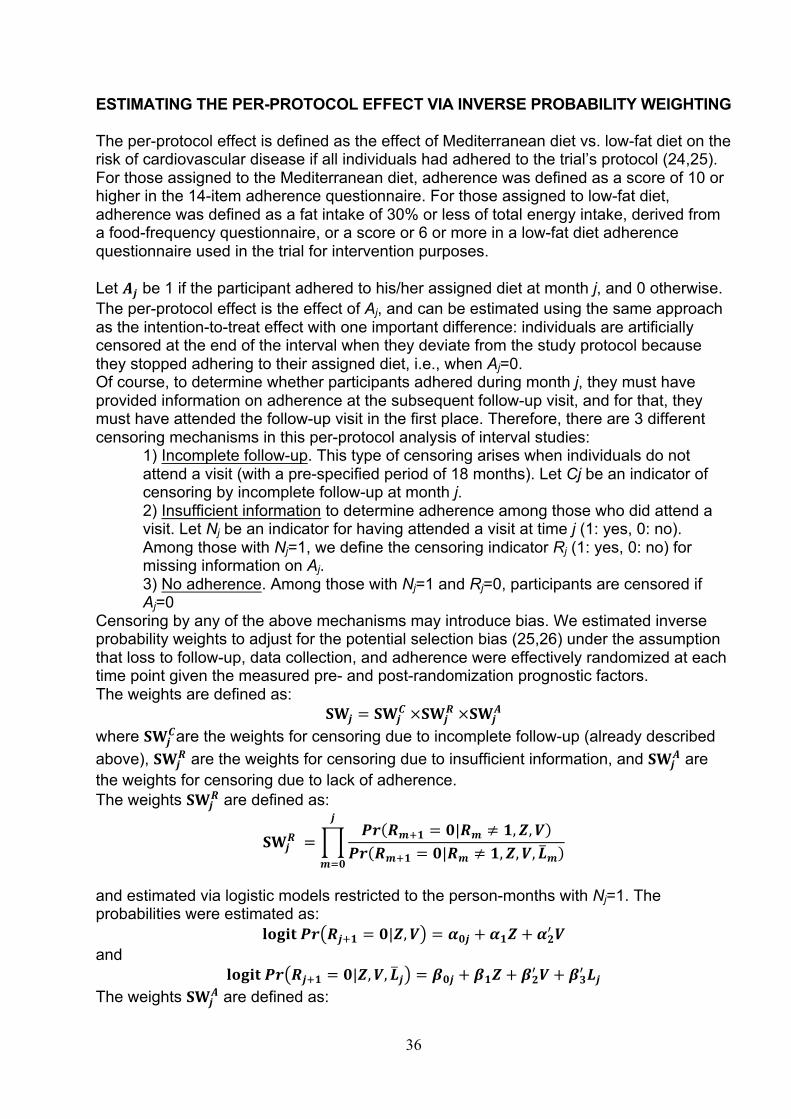
36
ESTIMATING THE PER-PROTOCOL EFFECT VIA INVERSE PROBABILITY WEIGHTING The per-protocol effect is defined as the effect of Mediterranean diet vs. low-fat diet on the risk of cardiovascular disease if all individuals had adhered to the trial’s protocol (24,25). For those assigned to the Mediterranean diet, adherence was defined as a score of 10 or higher in the 14-item adherence questionnaire. For those assigned to low-fat diet, adherence was defined as a fat intake of 30% or less of total energy intake, derived from a food-frequency questionnaire, or a score or 6 or more in a low-fat diet adherence questionnaire used in the trial for intervention purposes. Let J* be 1 if the participant adhered to his/her assigned diet at month j, and 0 otherwise. The per-protocol effect is the effect of Aj, and can be estimated using the same approach as the intention-to-treat effect with one important difference: individuals are artificially censored at the end of the interval when they deviate from the study protocol because they stopped adhering to their assigned diet, i.e., when Aj=0. Of course, to determine whether participants adhered during month j, they must have provided information on adherence at the subsequent follow-up visit, and for that, they must have attended the follow-up visit in the first place. Therefore, there are 3 different censoring mechanisms in this per-protocol analysis of interval studies:
1) Incomplete follow-up. This type of censoring arises when individuals do not attend a visit (with a pre-specified period of 18 months). Let Cj be an indicator of censoring by incomplete follow-up at month j. 2) Insufficient information to determine adherence among those who did attend a visit. Let Nj be an indicator for having attended a visit at time j (1: yes, 0: no). Among those with Nj=1, we define the censoring indicator Rj (1: yes, 0: no) for missing information on Aj. 3) No adherence. Among those with Nj=1 and Rj=0, participants are censored if Aj=0
Censoring by any of the above mechanisms may introduce bias. We estimated inverse probability weights to adjust for the potential selection bias (25,26) under the assumption that loss to follow-up, data collection, and adherence were effectively randomized at each time point given the measured pre- and post-randomization prognostic factors. The weights are defined as:
56* = 56*1×56*
L×56*J
where 56*1are the weights for censoring due to incomplete follow-up (already described
above), 56*L are the weights for censoring due to insufficient information, and 56*
J are the weights for censoring due to lack of adherence. The weights 56*
L are defined as:
56*L =
'( L9+, = /|L9 ≠ ,, 2, ;'( L9+, = /|L9 ≠ ,, 2, ;, <9
*
9=/
and estimated via logistic models restricted to the person-months with Nj=1. The probabilities were estimated as:
!"#$%'( L*+, = /|2, ; = A/* + A,2 + ABC ; and
!"#$%'( L*+, = /|2, ;, <* = G/* + G,2 + GBC ; + GHC <* The weights 56*
J are defined as:
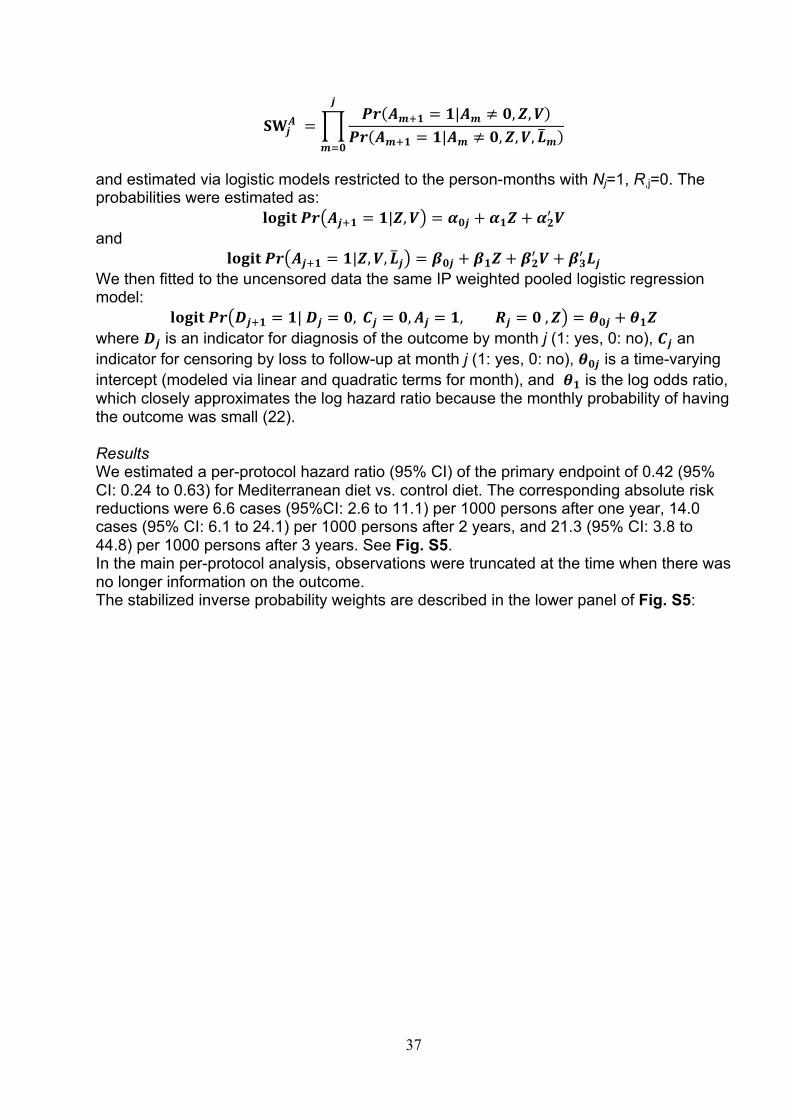
37
56*J =
'( J9+, = ,|J9 ≠ /, 2, ;'( J9+, = ,|J9 ≠ /, 2, ;, <9
*
9=/
and estimated via logistic models restricted to the person-months with Nj=1, R,j=0. The probabilities were estimated as:
!"#$%'( J*+, = ,|2, ; = A/* + A,2 + ABC ; and
!"#$%'( J*+, = ,|2, ;, <* = G/* + G,2 + GBC ; + GHC <* We then fitted to the uncensored data the same IP weighted pooled logistic regression model:
!"#$%'( )*+, = ,|)* = /, 1* = /, J* = ,, L* = /, 2 = 3/* + 3,2 where )* is an indicator for diagnosis of the outcome by month j (1: yes, 0: no), 1* an indicator for censoring by loss to follow-up at month j (1: yes, 0: no), 3/* is a time-varying intercept (modeled via linear and quadratic terms for month), and 3, is the log odds ratio, which closely approximates the log hazard ratio because the monthly probability of having the outcome was small (22). Results We estimated a per-protocol hazard ratio (95% CI) of the primary endpoint of 0.42 (95% CI: 0.24 to 0.63) for Mediterranean diet vs. control diet. The corresponding absolute risk reductions were 6.6 cases (95%CI: 2.6 to 11.1) per 1000 persons after one year, 14.0 cases (95% CI: 6.1 to 24.1) per 1000 persons after 2 years, and 21.3 (95% CI: 3.8 to 44.8) per 1000 persons after 3 years. See Fig. S5. In the main per-protocol analysis, observations were truncated at the time when there was no longer information on the outcome. The stabilized inverse probability weights are described in the lower panel of Fig. S5:
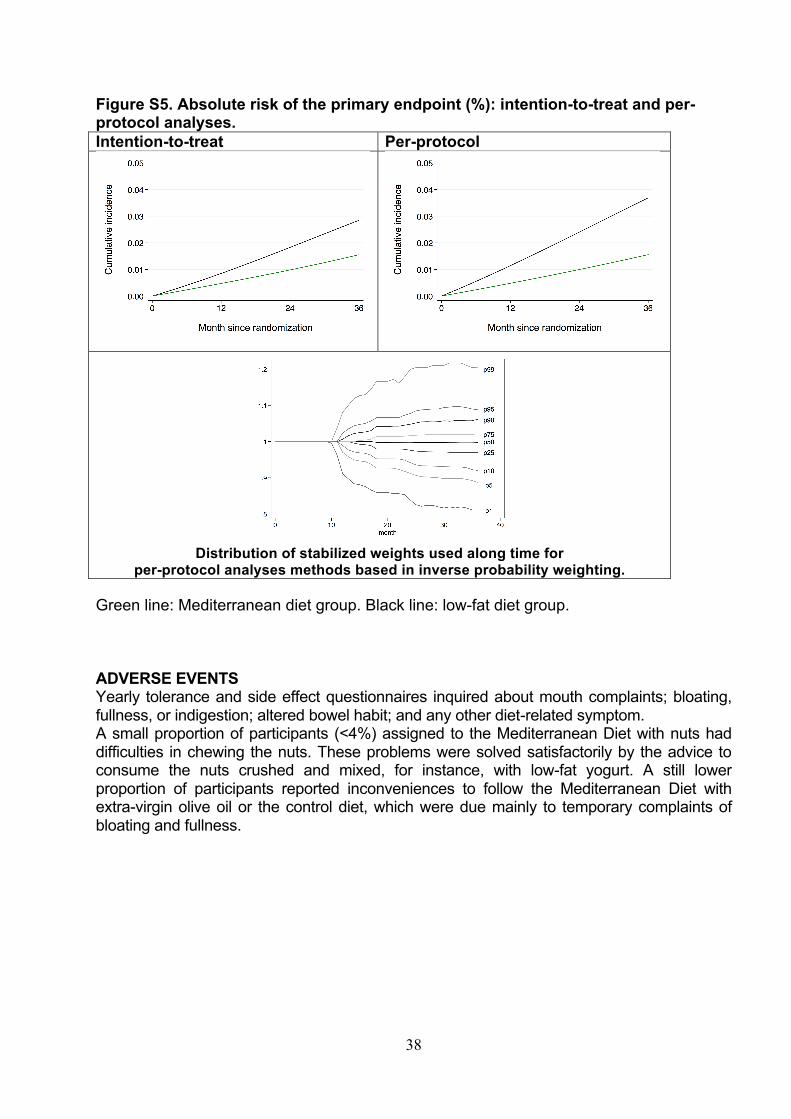
38
Figure S5. Absolute risk of the primary endpoint (%): intention-to-treat and per-protocol analyses. Intention-to-treat Per-protocol
Distribution of stabilized weights used along time for
per-protocol analyses methods based in inverse probability weighting. Green line: Mediterranean diet group. Black line: low-fat diet group. ADVERSE EVENTS Yearly tolerance and side effect questionnaires inquired about mouth complaints; bloating, fullness, or indigestion; altered bowel habit; and any other diet-related symptom. A small proportion of participants (<4%) assigned to the Mediterranean Diet with nuts had difficulties in chewing the nuts. These problems were solved satisfactorily by the advice to consume the nuts crushed and mixed, for instance, with low-fat yogurt. A still lower proportion of participants reported inconveniences to follow the Mediterranean Diet with extra-virgin olive oil or the control diet, which were due mainly to temporary complaints of bloating and fullness.
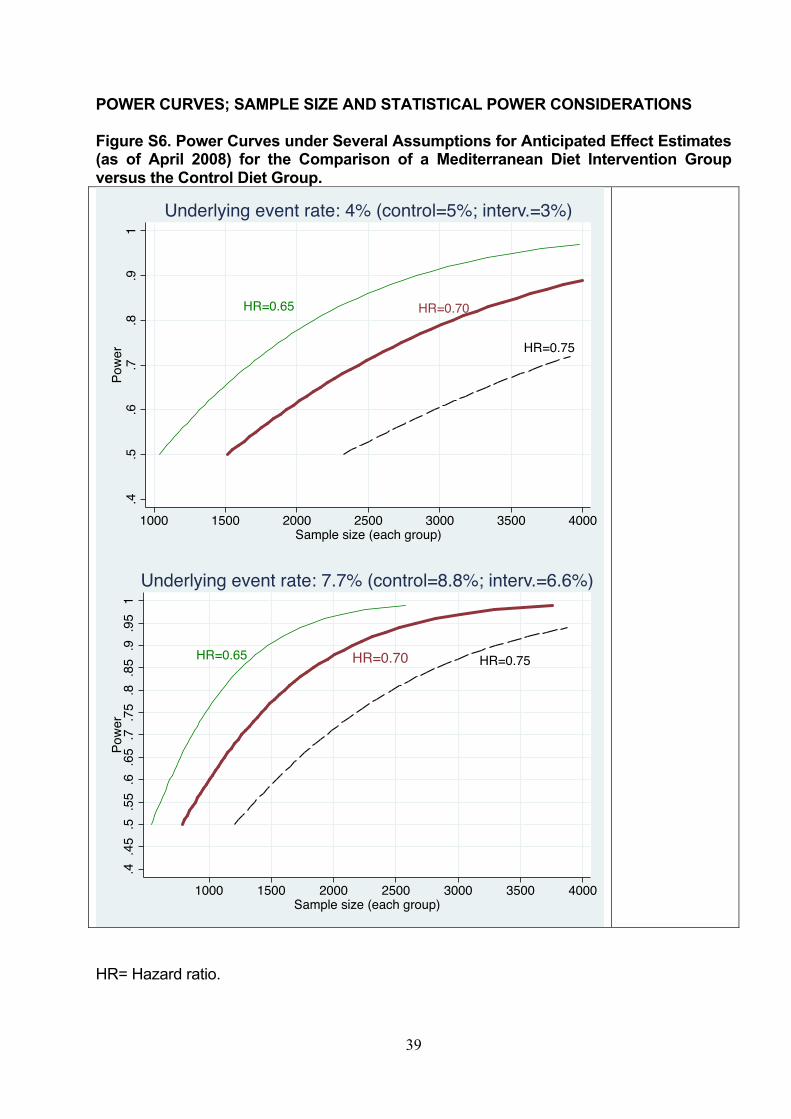
39
POWER CURVES; SAMPLE SIZE AND STATISTICAL POWER CONSIDERATIONS Figure S6. Power Curves under Several Assumptions for Anticipated Effect Estimates (as of April 2008) for the Comparison of a Mediterranean Diet Intervention Group versus the Control Diet Group.
HR= Hazard ratio.
HR=0.65 HR=0.70
HR=0.75
.4.5
.6.7
.8.9
1Po
wer
1000 1500 2000 2500 3000 3500 4000Sample size (each group)
Underlying event rate: 4% (control=5%; interv.=3%)
HR=0.65 HR=0.70 HR=0.75
.4.4
5.5
.55
.6.6
5.7
.75
.8.8
5.9
.95
1Po
wer
1000 1500 2000 2500 3000 3500 4000Sample size (each group)
Underlying event rate: 7.7% (control=8.8%; interv.=6.6%)

40
Figure S7. Trial Profile.
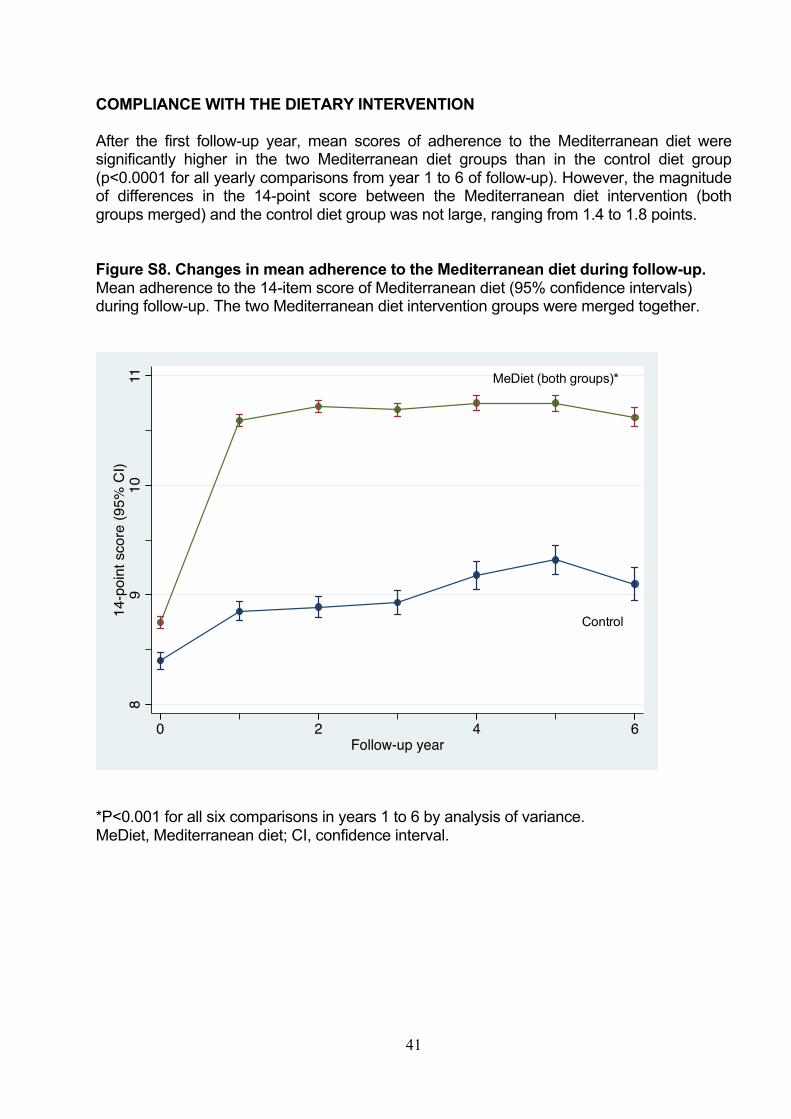
41
COMPLIANCE WITH THE DIETARY INTERVENTION After the first follow-up year, mean scores of adherence to the Mediterranean diet were significantly higher in the two Mediterranean diet groups than in the control diet group (p<0.0001 for all yearly comparisons from year 1 to 6 of follow-up). However, the magnitude of differences in the 14-point score between the Mediterranean diet intervention (both groups merged) and the control diet group was not large, ranging from 1.4 to 1.8 points. Figure S8. Changes in mean adherence to the Mediterranean diet during follow-up. Mean adherence to the 14-item score of Mediterranean diet (95% confidence intervals) during follow-up. The two Mediterranean diet intervention groups were merged together.
*P<0.001 for all six comparisons in years 1 to 6 by analysis of variance. MeDiet, Mediterranean diet; CI, confidence interval.
89
1011
14-p
oint
sco
re (9
5% C
I)
0 2 4 6Follow-up year
MeDiet (both groups)*
Control
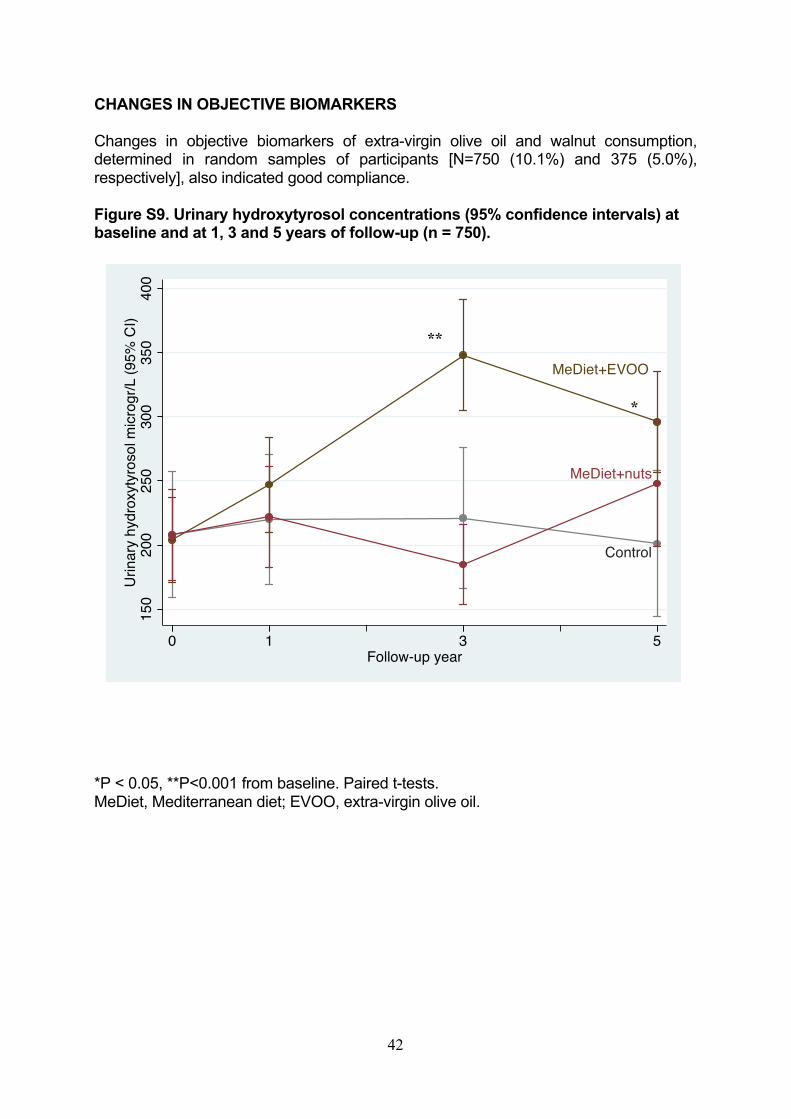
42
CHANGES IN OBJECTIVE BIOMARKERS Changes in objective biomarkers of extra-virgin olive oil and walnut consumption, determined in random samples of participants [N=750 (10.1%) and 375 (5.0%), respectively], also indicated good compliance. Figure S9. Urinary hydroxytyrosol concentrations (95% confidence intervals) at baseline and at 1, 3 and 5 years of follow-up (n = 750). *P < 0.05, **P<0.001 from baseline. Paired t-tests. MeDiet, Mediterranean diet; EVOO, extra-virgin olive oil.
MeDiet+EVOO
Control
MeDiet+nuts
150
200
250
300
350
400
Urin
ary
hydr
oxyt
yros
ol m
icrog
r/L (9
5% C
I)
0 1 3 5Follow-up year
**
*
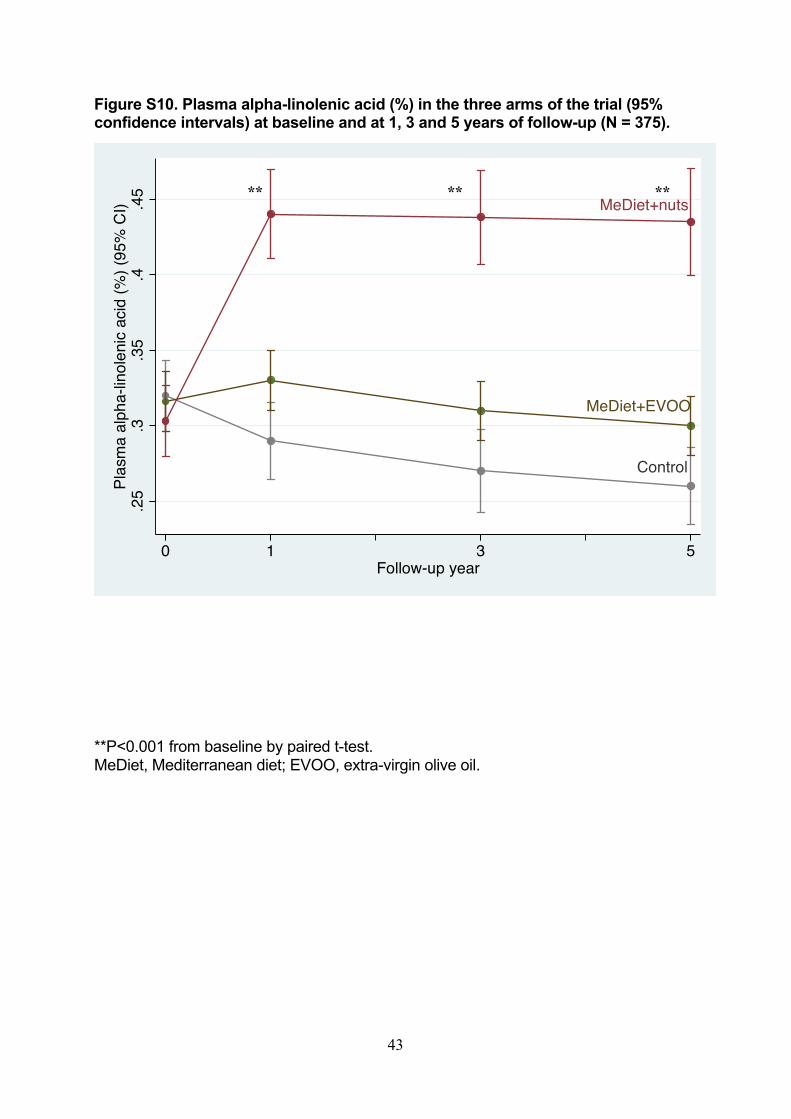
43
Figure S10. Plasma alpha-linolenic acid (%) in the three arms of the trial (95% confidence intervals) at baseline and at 1, 3 and 5 years of follow-up (N = 375). **P<0.001 from baseline by paired t-test. MeDiet, Mediterranean diet; EVOO, extra-virgin olive oil.
MeDiet+nuts
MeDiet+EVOO
Control
.25
.3.3
5.4
.45
Plas
ma
alph
a-lin
olen
ic ac
id (%
) (95
% C
I)
0 1 3 5Follow-up year
** ** **
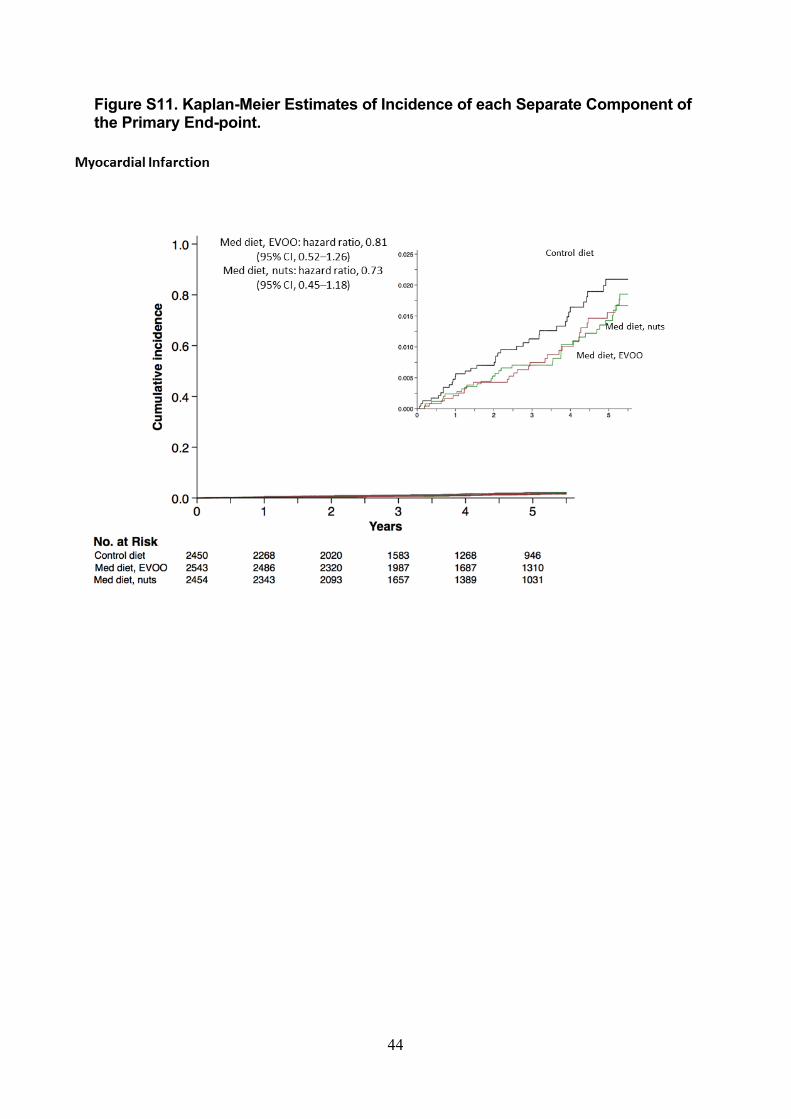
44
Figure S11. Kaplan-Meier Estimates of Incidence of each Separate Component of the Primary End-point.
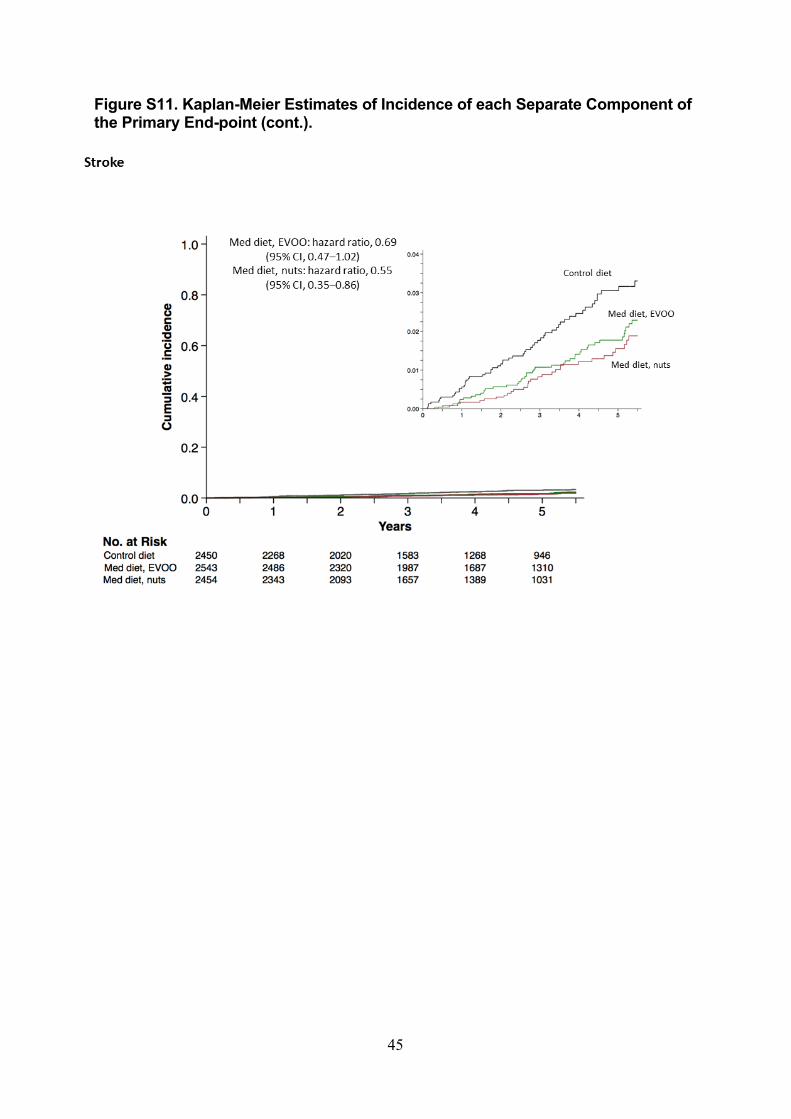
45
Figure S11. Kaplan-Meier Estimates of Incidence of each Separate Component of the Primary End-point (cont.).
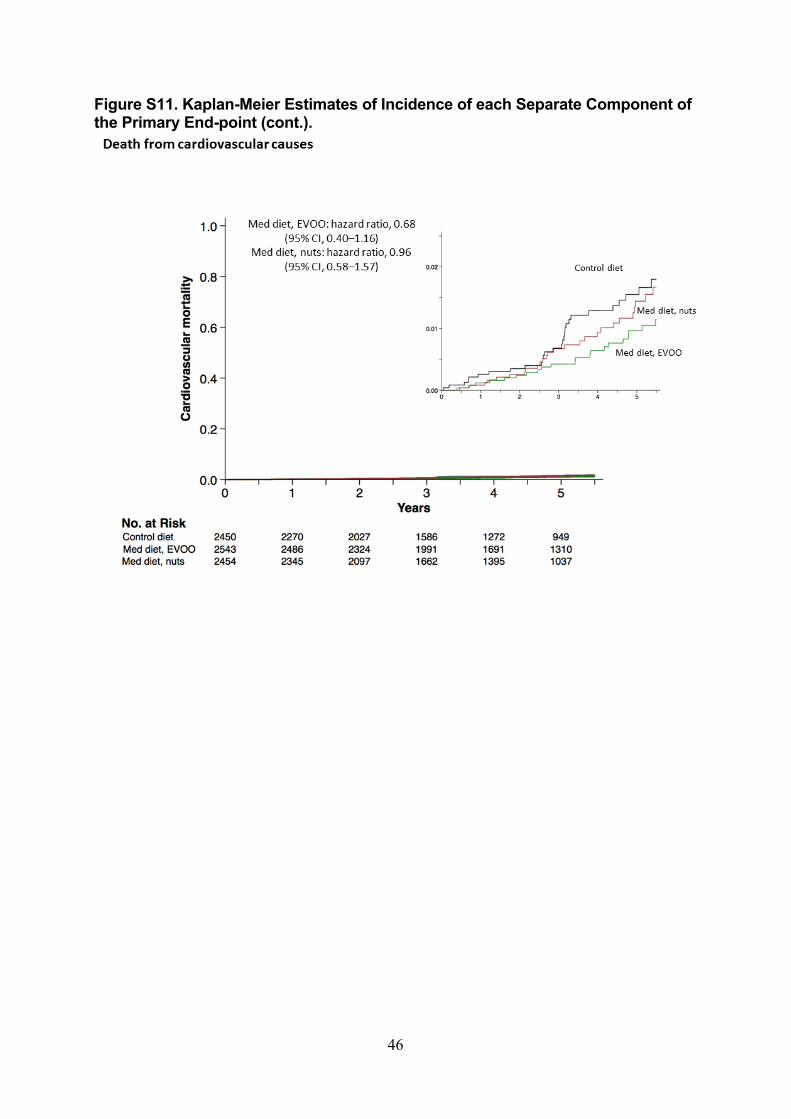
46
Figure S11. Kaplan-Meier Estimates of Incidence of each Separate Component of the Primary End-point (cont.).
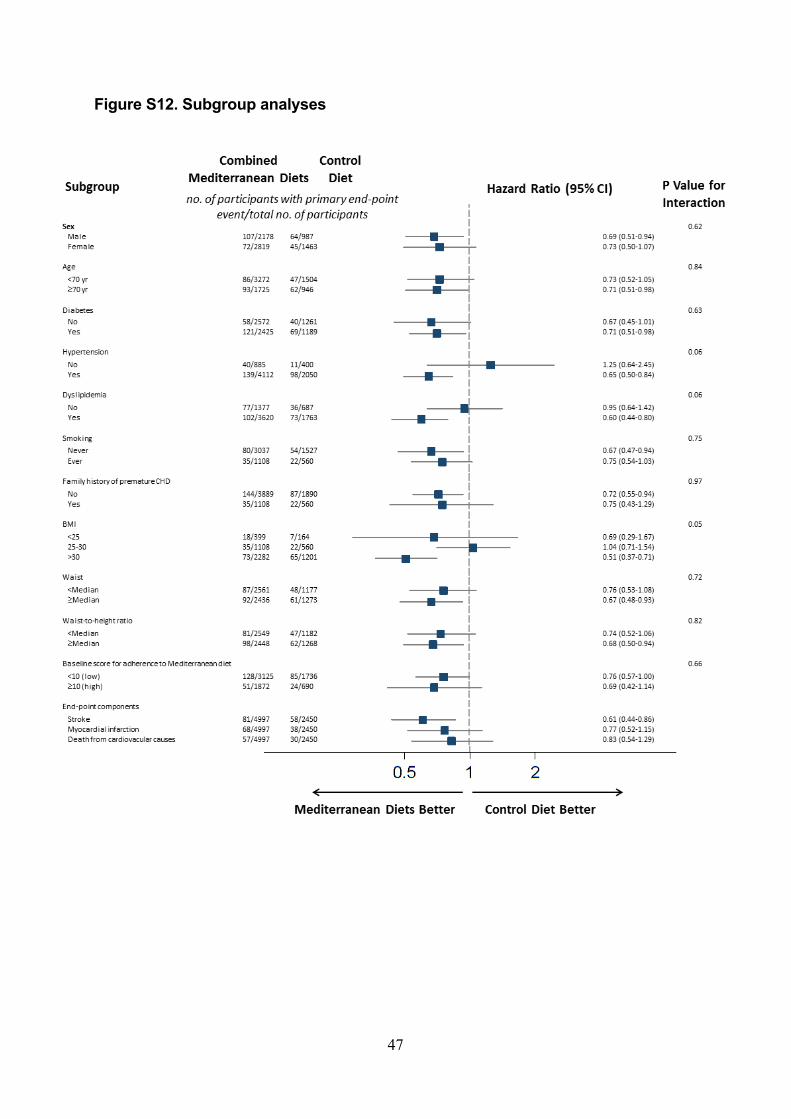
47
Figure S12. Subgroup analyses
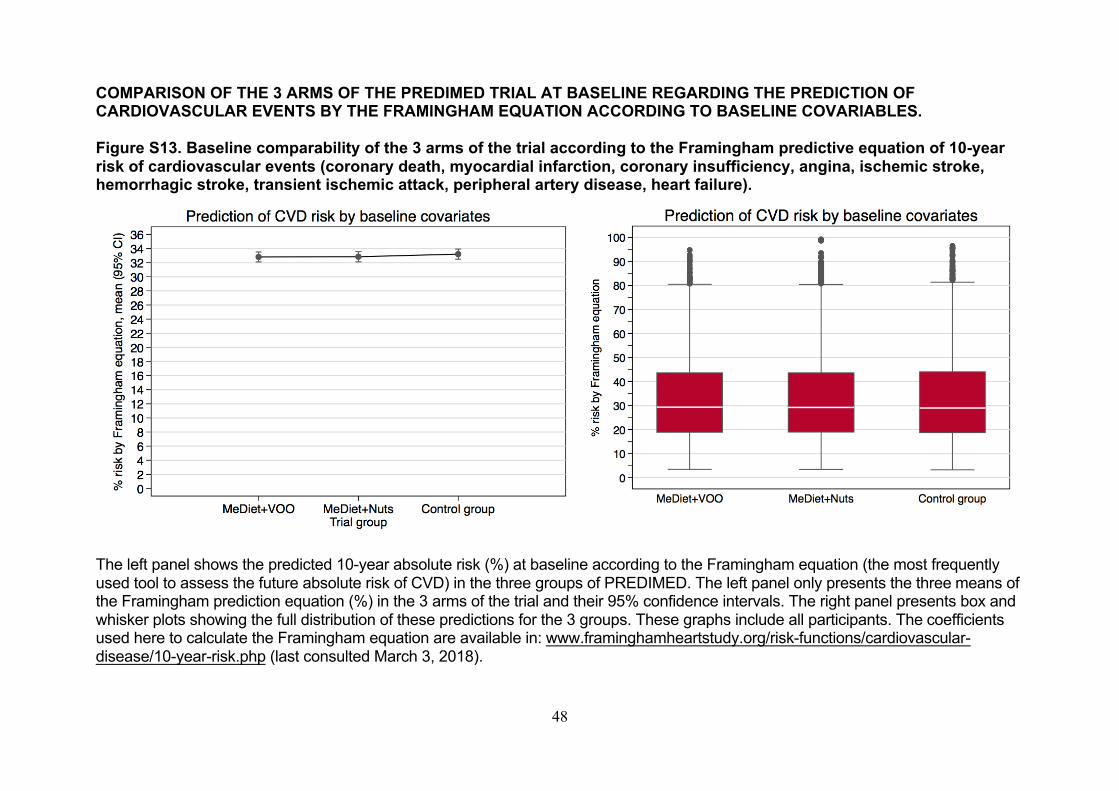
48
COMPARISON OF THE 3 ARMS OF THE PREDIMED TRIAL AT BASELINE REGARDING THE PREDICTION OF CARDIOVASCULAR EVENTS BY THE FRAMINGHAM EQUATION ACCORDING TO BASELINE COVARIABLES. Figure S13. Baseline comparability of the 3 arms of the trial according to the Framingham predictive equation of 10-year risk of cardiovascular events (coronary death, myocardial infarction, coronary insufficiency, angina, ischemic stroke, hemorrhagic stroke, transient ischemic attack, peripheral artery disease, heart failure).
The left panel shows the predicted 10-year absolute risk (%) at baseline according to the Framingham equation (the most frequently
used tool to assess the future absolute risk of CVD) in the three groups of PREDIMED. The left panel only presents the three means of
the Framingham prediction equation (%) in the 3 arms of the trial and their 95% confidence intervals. The right panel presents box and
whisker plots showing the full distribution of these predictions for the 3 groups. These graphs include all participants. The coefficients
used here to calculate the Framingham equation are available in: www.framinghamheartstudy.org/risk-functions/cardiovascular-
disease/10-year-risk.php (last consulted March 3, 2018).
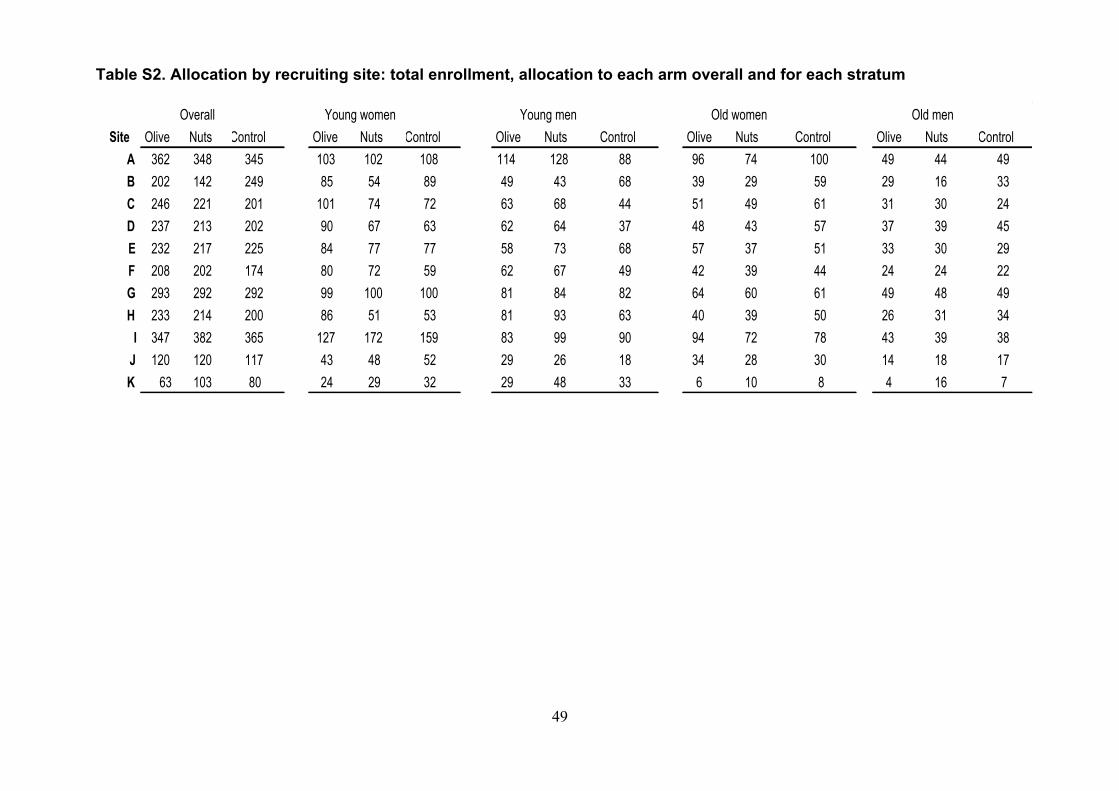
49
Table S2. Allocation by recruiting site: total enrollment, allocation to each arm overall and for each stratum
Overall Young women Young men Old women Old menSite Olive Nuts Control Olive Nuts Control Olive Nuts Control Olive Nuts Control Olive Nuts Control
A 362 348 345 103 102 108 114 128 88 96 74 100 49 44 49B 202 142 249 85 54 89 49 43 68 39 29 59 29 16 33C 246 221 201 101 74 72 63 68 44 51 49 61 31 30 24D 237 213 202 90 67 63 62 64 37 48 43 57 37 39 45E 232 217 225 84 77 77 58 73 68 57 37 51 33 30 29F 208 202 174 80 72 59 62 67 49 42 39 44 24 24 22G 293 292 292 99 100 100 81 84 82 64 60 61 49 48 49H 233 214 200 86 51 53 81 93 63 40 39 50 26 31 34
I 347 382 365 127 172 159 83 99 90 94 72 78 43 39 38J 120 120 117 43 48 52 29 26 18 34 28 30 14 18 17K 63 103 80 24 29 32 29 48 33 6 10 8 4 16 7
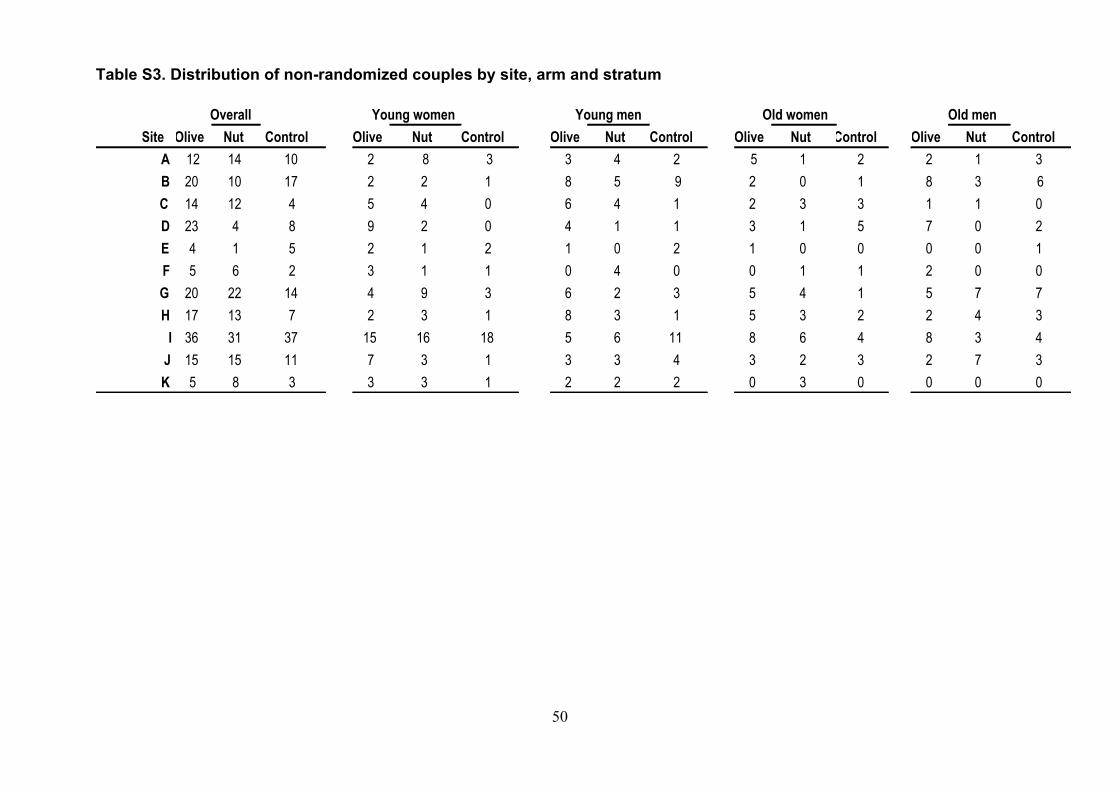
50
Table S3. Distribution of non-randomized couples by site, arm and stratum
Overall Young women Young men Old women Old menSite Olive Nut Control Olive Nut Control Olive Nut Control Olive Nut Control Olive Nut Control
A 12 14 10 2 8 3 3 4 2 5 1 2 2 1 3B 20 10 17 2 2 1 8 5 9 2 0 1 8 3 6C 14 12 4 5 4 0 6 4 1 2 3 3 1 1 0D 23 4 8 9 2 0 4 1 1 3 1 5 7 0 2E 4 1 5 2 1 2 1 0 2 1 0 0 0 0 1F 5 6 2 3 1 1 0 4 0 0 1 1 2 0 0G 20 22 14 4 9 3 6 2 3 5 4 1 5 7 7H 17 13 7 2 3 1 8 3 1 5 3 2 2 4 3
I 36 31 37 15 16 18 5 6 11 8 6 4 8 3 4J 15 15 11 7 3 1 3 3 4 3 2 3 2 7 3K 5 8 3 3 3 1 2 2 2 0 3 0 0 0 0

51
Table S4. Quantitative 14-item Score of Compliance with the Mediterranean Diet.
Foods and frequency of consumption Criteria for 1 point* 1 Do you use olive oil as main culinary fat? Yes
2 How much olive oil do you consume in a given day (including oil used for frying,
salads, out of house meals, etc.)?
4 or more tablespoons
3 How many vegetable servings do you consume per day?
(1 serving = 200g - consider side dishes as 1/2 serving) 2 or more (at least 1 portion raw or as salad)
4 How many fruit units (including natural fruit juices) do you consume per day? 3 or more
5 How many servings of red meat, hamburger, or meat products (ham, sausage,
etc.) do you consume per day? (1 serving = 100-150 g) Less than 1
6 How many servings of butter, margarine, or cream do you consume per day? (1 serving = 12 g)
Less than 1
7 How many sweet/carbonated beverages do you drink per day? Less than 1
8 How much wine do you drink per week? 7 or more glasses
9 How many servings of legumes do you consume per week?
(1 serving = 150 g) 3 or more
10 How many servings of fish or shellfish do you consume per week?
(1 serving: 100-150 g fish, or 4-5 units or 200 g shellfish)
3 or more
11 How many times per week do you consume commercial sweets or pastries (not
homemade), such as cakes, cookies, biscuits, or custard?
Less than 3
12 How many servings of nuts (including peanuts) do you consume per week?
(1 serving = 30 g) 3 or more
13 Do you preferentially consume chicken, turkey or rabbit meat instead of veal, pork,
hamburger or sausage?**
Yes
14 How many times per week do you consume vegetables, pasta, rice, or other dishes
seasoned with sofrito (sauce made with tomato and onion, leek, or garlic,
simmered with olive oil)?
2 or more
* 0 points if these criteria are not met.
** 1 point for vegetarians.
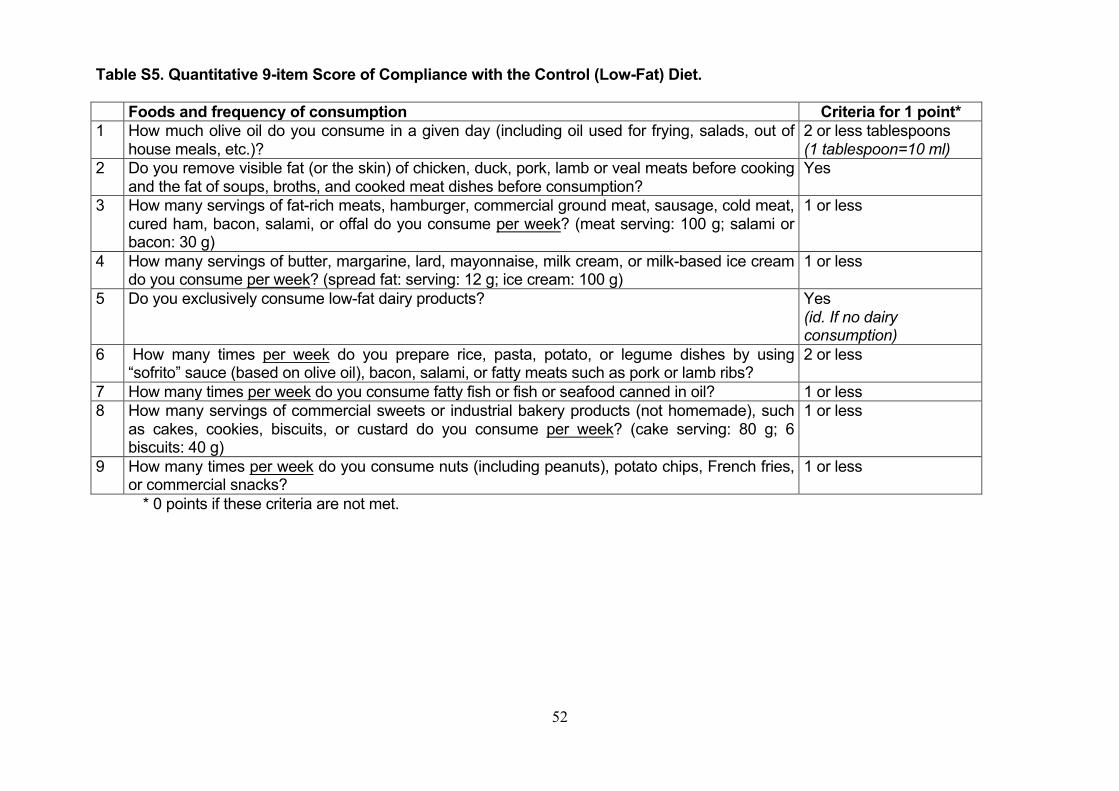
52
Table S5. Quantitative 9-item Score of Compliance with the Control (Low-Fat) Diet. Foods and frequency of consumption Criteria for 1 point* 1 How much olive oil do you consume in a given day (including oil used for frying, salads, out of
house meals, etc.)?
2 or less tablespoons
(1 tablespoon=10 ml) 2 Do you remove visible fat (or the skin) of chicken, duck, pork, lamb or veal meats before cooking
and the fat of soups, broths, and cooked meat dishes before consumption?
Yes
3 How many servings of fat-rich meats, hamburger, commercial ground meat, sausage, cold meat,
cured ham, bacon, salami, or offal do you consume per week? (meat serving: 100 g; salami or
bacon: 30 g)
1 or less
4 How many servings of butter, margarine, lard, mayonnaise, milk cream, or milk-based ice cream
do you consume per week? (spread fat: serving: 12 g; ice cream: 100 g)
1 or less
5 Do you exclusively consume low-fat dairy products? Yes
(id. If no dairy consumption)
6 How many times per week do you prepare rice, pasta, potato, or legume dishes by using
“sofrito” sauce (based on olive oil), bacon, salami, or fatty meats such as pork or lamb ribs?
2 or less
7 How many times per week do you consume fatty fish or fish or seafood canned in oil? 1 or less
8 How many servings of commercial sweets or industrial bakery products (not homemade), such
as cakes, cookies, biscuits, or custard do you consume per week? (cake serving: 80 g; 6
biscuits: 40 g)
1 or less
9 How many times per week do you consume nuts (including peanuts), potato chips, French fries,
or commercial snacks?
1 or less
* 0 points if these criteria are not met.

53
General Recommendations to Follow a Low-Fat Diet. Bread, pasta, rice, fruit, vegetables, legumes and salads are part of a healthy diet. Prepare these foods in a healthy way and help you and your family eat less fat. BUY LOW-FAT FOODS
• Bread
• Cereals and pasta
• Rice
• Potatoes
• Fruit and vegetables
• Beans, lentils, chick-peas
• Low-fat milk, cheese, and other dairy products
• Lean fish and seafood
• Chicken and duck meat with the skin removed
• Meat cuts low in fat instead of high-fat ones such as beacon, beef and lamb
COOK WITH LESS FAT
• Avoid using oil, butter or fat-based sauces
• Dress dishes with the least possible oil
• Employ simple cooking methods, such as boiling, baking or broiling. Avoid stewing, frying, breading and use of “sofrito”
• Use the least possible amount of oil in the frying pan, enough to avoid sticking of food
REMOVE FAT
• Do not smear bread or toast with butter, margarine, oil or other fat spreads
• Remove all visible fat from meat before cooking
• Remove all fat released from meat while cooking
• Cool soups and broths to remove fat layer on top before heating
WHICH FOODS CONTAIN MOST FAT AND SHOULD NOT BE CONSUMED?
• Oils and oil-based dressings
• Butter, margarine, lard
• Fat-enriched dairy products, heavy cream, custard, ice cream
• Fatty meats, sausages, cold cuts, beacon, cracklings
• Liver, kidney and offal in general
• Fried foods
• Commercial sauces, mayonnaise
• Commercially cooked foods
• Tree nuts and peanuts
• Sunflower seeds, French fries and other salty snacks
• Cakes, pies, pastries, cookies, crackers
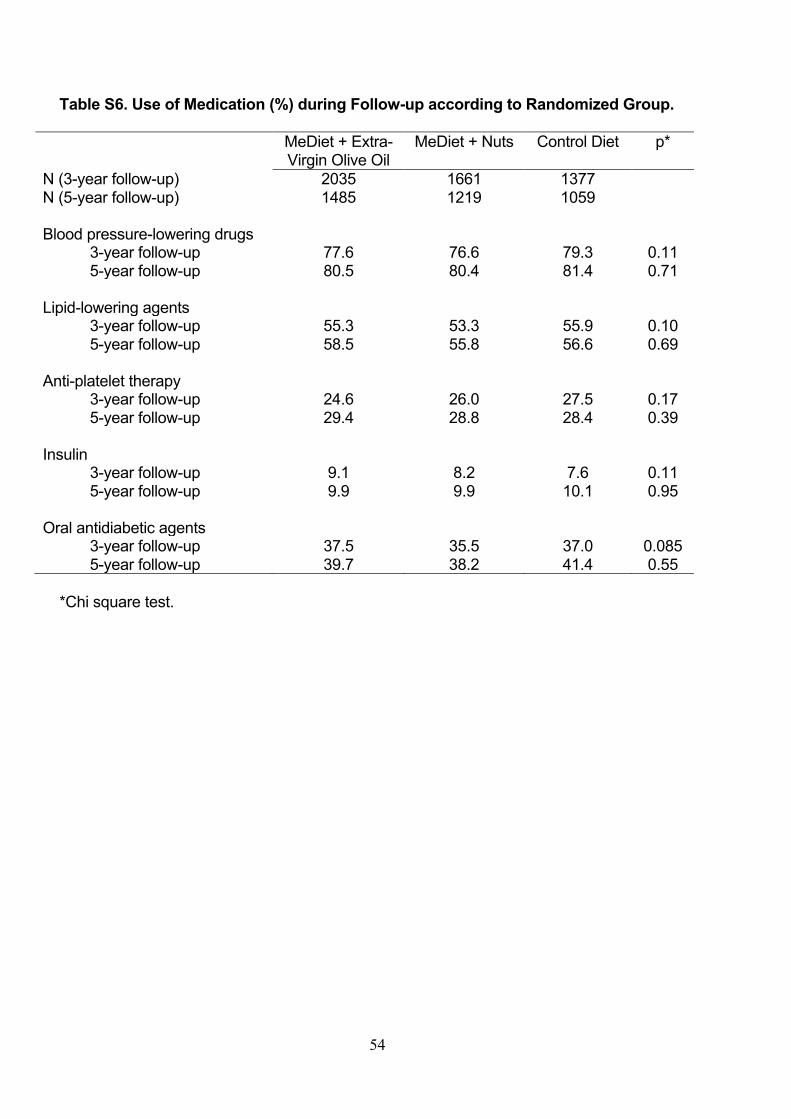
54
Table S6. Use of Medication (%) during Follow-up according to Randomized Group.
MeDiet + Extra- Virgin Olive Oil
MeDiet + Nuts Control Diet p*
N (3-year follow-up) 2035 1661 1377 N (5-year follow-up) 1485 1219 1059 Blood pressure-lowering drugs 3-year follow-up 77.6 76.6 79.3 0.11 5-year follow-up 80.5 80.4 81.4 0.71 Lipid-lowering agents 3-year follow-up 55.3 53.3 55.9 0.10 5-year follow-up 58.5 55.8 56.6 0.69 Anti-platelet therapy 3-year follow-up 24.6 26.0 27.5 0.17 5-year follow-up 29.4 28.8 28.4 0.39 Insulin 3-year follow-up 9.1 8.2 7.6 0.11 5-year follow-up 9.9 9.9 10.1 0.95 Oral antidiabetic agents 3-year follow-up 37.5 35.5 37.0 0.085 5-year follow-up 39.7 38.2 41.4 0.55
*Chi square test.
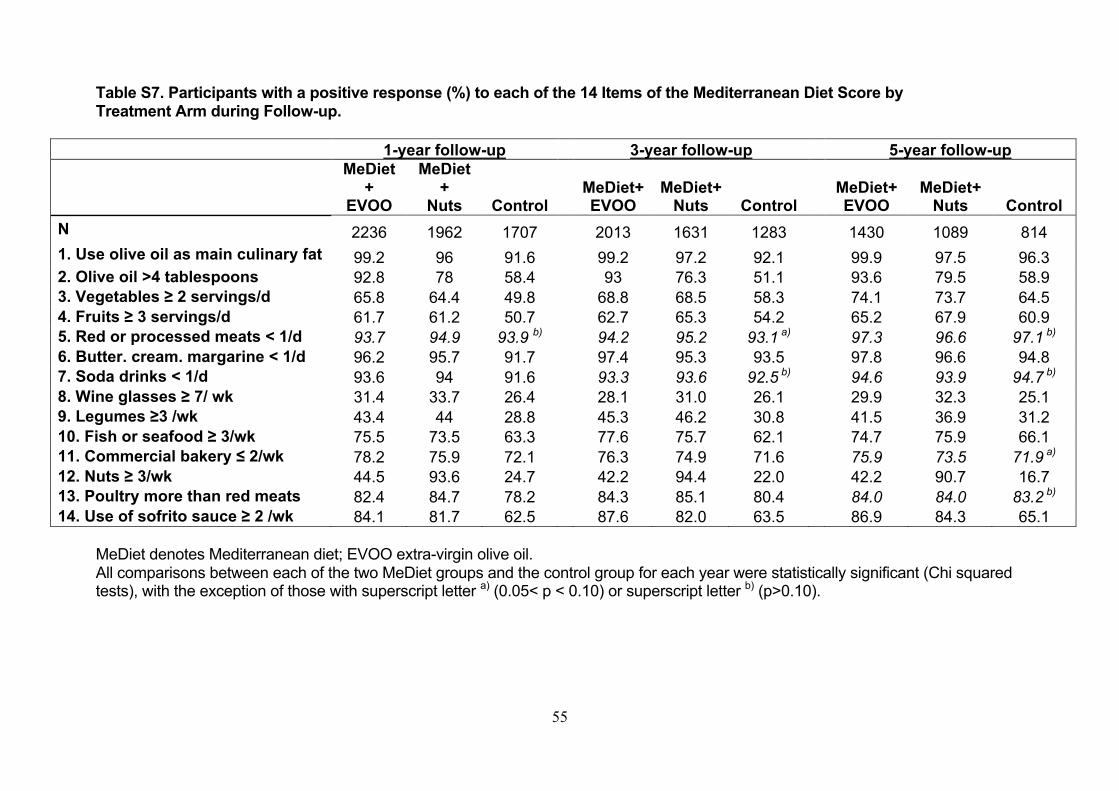
55
Table S7. Participants with a positive response (%) to each of the 14 Items of the Mediterranean Diet Score by Treatment Arm during Follow-up.
1-year follow-up 3-year follow-up 5-year follow-up
MeDiet+
EVOO
MeDiet+
Nuts Control MeDiet+ EVOO
MeDiet+ Nuts Control
MeDiet+ EVOO
MeDiet+ Nuts Control
N 2236 1962 1707 2013 1631 1283 1430 1089 814
1. Use olive oil as main culinary fat 99.2 96 91.6 99.2 97.2 92.1 99.9 97.5 96.3 2. Olive oil >4 tablespoons 92.8 78 58.4 93 76.3 51.1 93.6 79.5 58.9 3. Vegetables ≥ 2 servings/d 65.8 64.4 49.8 68.8 68.5 58.3 74.1 73.7 64.5 4. Fruits ≥ 3 servings/d 61.7 61.2 50.7 62.7 65.3 54.2 65.2 67.9 60.9 5. Red or processed meats < 1/d 93.7 94.9 93.9 b) 94.2 95.2 93.1 a) 97.3 96.6 97.1 b) 6. Butter. cream. margarine < 1/d 96.2 95.7 91.7 97.4 95.3 93.5 97.8 96.6 94.8 7. Soda drinks < 1/d 93.6 94 91.6 93.3 93.6 92.5 b) 94.6 93.9 94.7 b) 8. Wine glasses ≥ 7/ wk 31.4 33.7 26.4 28.1 31.0 26.1 29.9 32.3 25.1 9. Legumes ≥3 /wk 43.4 44 28.8 45.3 46.2 30.8 41.5 36.9 31.2 10. Fish or seafood ≥ 3/wk 75.5 73.5 63.3 77.6 75.7 62.1 74.7 75.9 66.1 11. Commercial bakery ≤ 2/wk 78.2 75.9 72.1 76.3 74.9 71.6 75.9 73.5 71.9 a) 12. Nuts ≥ 3/wk 44.5 93.6 24.7 42.2 94.4 22.0 42.2 90.7 16.7 13. Poultry more than red meats 82.4 84.7 78.2 84.3 85.1 80.4 84.0 84.0 83.2 b) 14. Use of sofrito sauce ≥ 2 /wk 84.1 81.7 62.5 87.6 82.0 63.5 86.9 84.3 65.1
MeDiet denotes Mediterranean diet; EVOO extra-virgin olive oil. All comparisons between each of the two MeDiet groups and the control group for each year were statistically significant (Chi squared tests), with the exception of those with superscript letter a) (0.05< p < 0.10) or superscript letter b) (p>0.10).
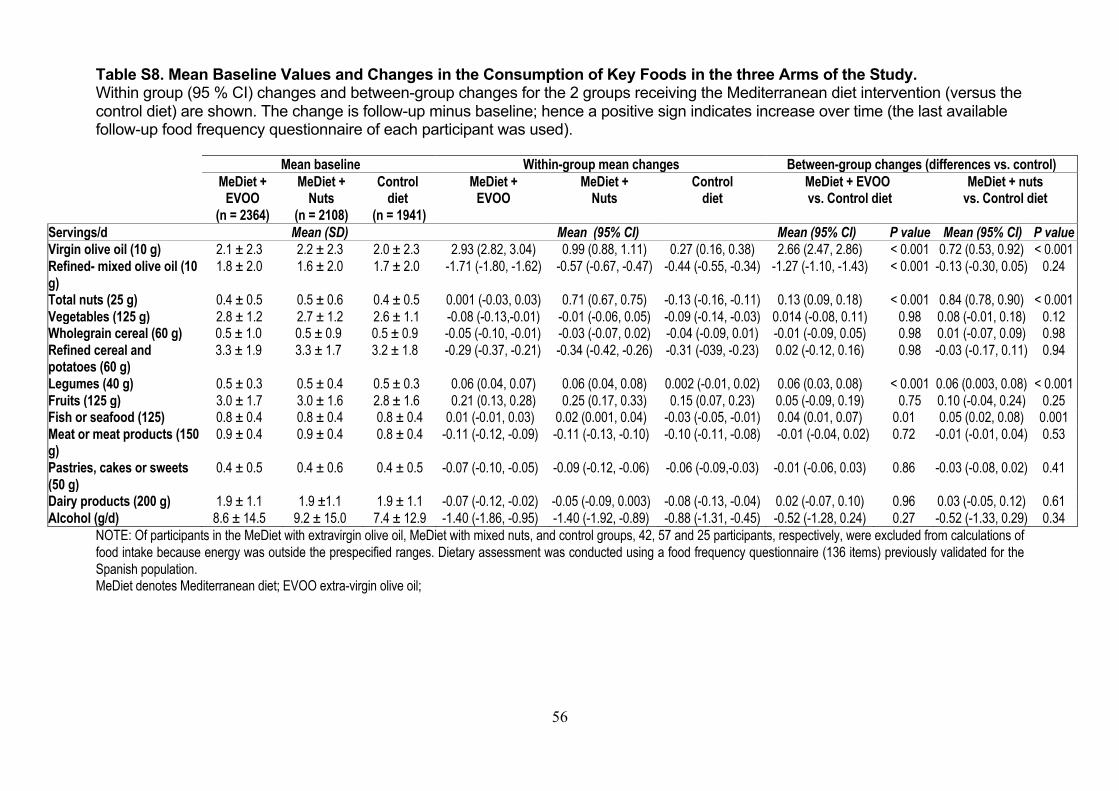
56
Table S8. Mean Baseline Values and Changes in the Consumption of Key Foods in the three Arms of the Study. Within group (95 % CI) changes and between-group changes for the 2 groups receiving the Mediterranean diet intervention (versus the control diet) are shown. The change is follow-up minus baseline; hence a positive sign indicates increase over time (the last available follow-up food frequency questionnaire of each participant was used).
Mean baseline Within-group mean changes Between-group changes (differences vs. control) MeDiet +
EVOO (n = 2364)
MeDiet + Nuts
(n = 2108)
Control diet
(n = 1941)
MeDiet + EVOO
MeDiet + Nuts
Control diet
MeDiet + EVOO vs. Control diet
MeDiet + nuts vs. Control diet
Servings/d Mean (SD) Mean (95% CI) Mean (95% CI) P value Mean (95% CI) P value Virgin olive oil (10 g) 2.1 ± 2.3 2.2 ± 2.3 2.0 ± 2.3 2.93 (2.82, 3.04) 0.99 (0.88, 1.11) 0.27 (0.16, 0.38) 2.66 (2.47, 2.86) < 0.001 0.72 (0.53, 0.92) < 0.001 Refined- mixed olive oil (10 g)
1.8 ± 2.0 1.6 ± 2.0 1.7 ± 2.0 -1.71 (-1.80, -1.62) -0.57 (-0.67, -0.47) -0.44 (-0.55, -0.34) -1.27 (-1.10, -1.43) < 0.001 -0.13 (-0.30, 0.05) 0.24
Total nuts (25 g) 0.4 ± 0.5 0.5 ± 0.6 0.4 ± 0.5 0.001 (-0.03, 0.03) 0.71 (0.67, 0.75) -0.13 (-0.16, -0.11) 0.13 (0.09, 0.18) < 0.001 0.84 (0.78, 0.90) < 0.001 Vegetables (125 g) 2.8 ± 1.2 2.7 ± 1.2 2.6 ± 1.1 -0.08 (-0.13,-0.01) -0.01 (-0.06, 0.05) -0.09 (-0.14, -0.03) 0.014 (-0.08, 0.11) 0.98 0.08 (-0.01, 0.18) 0.12 Wholegrain cereal (60 g) 0.5 ± 1.0 0.5 ± 0.9 0.5 ± 0.9 -0.05 (-0.10, -0.01) -0.03 (-0.07, 0.02) -0.04 (-0.09, 0.01) -0.01 (-0.09, 0.05) 0.98 0.01 (-0.07, 0.09) 0.98 Refined cereal and potatoes (60 g)
3.3 ± 1.9 3.3 ± 1.7 3.2 ± 1.8 -0.29 (-0.37, -0.21) -0.34 (-0.42, -0.26) -0.31 (-039, -0.23) 0.02 (-0.12, 0.16) 0.98 -0.03 (-0.17, 0.11) 0.94
Legumes (40 g) 0.5 ± 0.3 0.5 ± 0.4 0.5 ± 0.3 0.06 (0.04, 0.07) 0.06 (0.04, 0.08) 0.002 (-0.01, 0.02) 0.06 (0.03, 0.08) < 0.001 0.06 (0.003, 0.08) < 0.001 Fruits (125 g) 3.0 ± 1.7 3.0 ± 1.6 2.8 ± 1.6 0.21 (0.13, 0.28) 0.25 (0.17, 0.33) 0.15 (0.07, 0.23) 0.05 (-0.09, 0.19) 0.75 0.10 (-0.04, 0.24) 0.25 Fish or seafood (125) 0.8 ± 0.4 0.8 ± 0.4 0.8 ± 0.4 0.01 (-0.01, 0.03) 0.02 (0.001, 0.04) -0.03 (-0.05, -0.01) 0.04 (0.01, 0.07) 0.01 0.05 (0.02, 0.08) 0.001 Meat or meat products (150 g)
0.9 ± 0.4 0.9 ± 0.4 0.8 ± 0.4 -0.11 (-0.12, -0.09) -0.11 (-0.13, -0.10) -0.10 (-0.11, -0.08) -0.01 (-0.04, 0.02) 0.72 -0.01 (-0.01, 0.04) 0.53
Pastries, cakes or sweets (50 g)
0.4 ± 0.5 0.4 ± 0.6 0.4 ± 0.5 -0.07 (-0.10, -0.05) -0.09 (-0.12, -0.06) -0.06 (-0.09,-0.03) -0.01 (-0.06, 0.03) 0.86 -0.03 (-0.08, 0.02) 0.41
Dairy products (200 g) 1.9 ± 1.1 1.9 ±1.1 1.9 ± 1.1 -0.07 (-0.12, -0.02) -0.05 (-0.09, 0.003) -0.08 (-0.13, -0.04) 0.02 (-0.07, 0.10) 0.96 0.03 (-0.05, 0.12) 0.61 Alcohol (g/d) 8.6 ± 14.5 9.2 ± 15.0 7.4 ± 12.9 -1.40 (-1.86, -0.95) -1.40 (-1.92, -0.89) -0.88 (-1.31, -0.45) -0.52 (-1.28, 0.24) 0.27 -0.52 (-1.33, 0.29) 0.34
NOTE: Of participants in the MeDiet with extravirgin olive oil, MeDiet with mixed nuts, and control groups, 42, 57 and 25 participants, respectively, were excluded from calculations of food intake because energy was outside the prespecified ranges. Dietary assessment was conducted using a food frequency questionnaire (136 items) previously validated for the Spanish population. MeDiet denotes Mediterranean diet; EVOO extra-virgin olive oil;
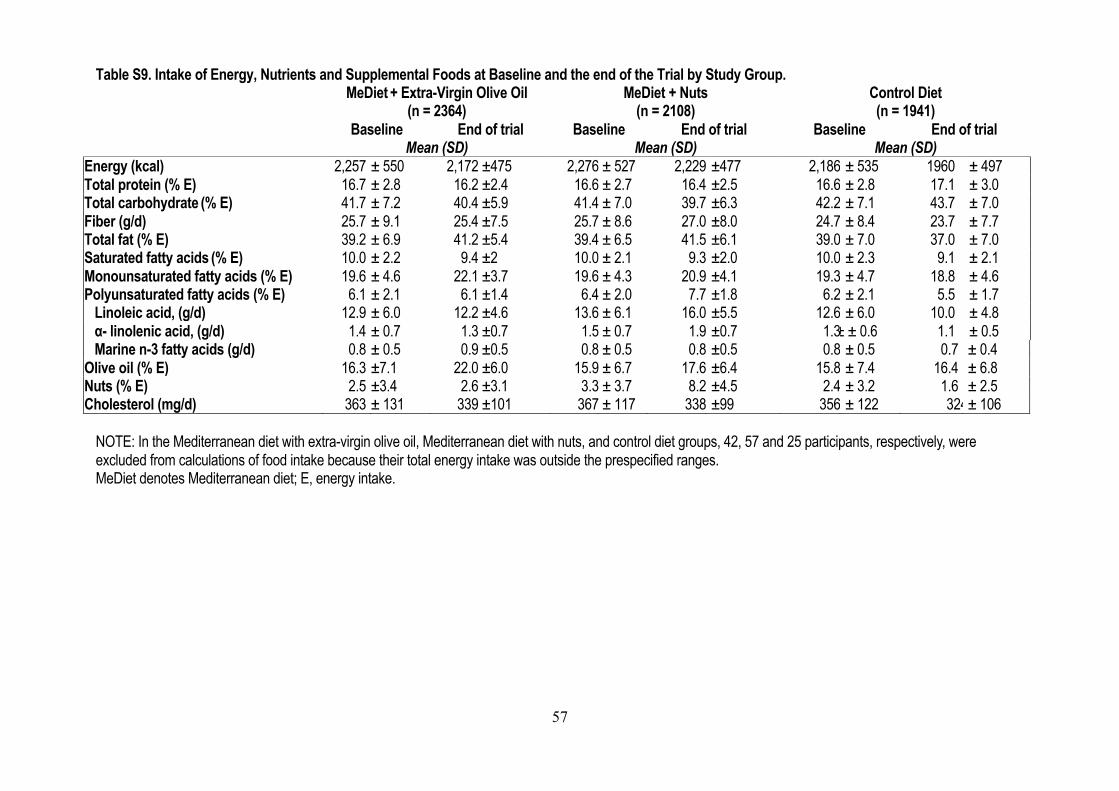
57
Table S9. Intake of Energy, Nutrients and Supplemental Foods at Baseline and the end of the Trial by Study Group. MeDiet + Extra-Virgin Olive Oil
(n = 2364) MeDiet + Nuts
(n = 2108) Control Diet (n = 1941)
Baseline End of trial Baseline End of trial Baseline End of trial Mean (SD) Mean (SD) Mean (SD) Energy (kcal) 2,257 ± 550 2,172 ±475 2,276 ± 527 2,229 ±477 2,186 ± 535 1960 ± 497 Total protein (% E) 16.7 ± 2.8 16.2 ±2.4 16.6 ± 2.7 16.4 ±2.5 16.6 ± 2.8 17.1 ± 3.0 Total carbohydrate (% E) 41.7 ± 7.2 40.4 ±5.9 41.4 ± 7.0 39.7 ±6.3 42.2 ± 7.1 43.7 ± 7.0 Fiber (g/d) 25.7 ± 9.1 25.4 ±7.5 25.7 ± 8.6 27.0 ±8.0 24.7 ± 8.4 23.7 ± 7.7 Total fat (% E) 39.2 ± 6.9 41.2 ±5.4 39.4 ± 6.5 41.5 ±6.1 39.0 ± 7.0 37.0 ± 7.0 Saturated fatty acids (% E) 10.0 ± 2.2 9.4 ±2 10.0 ± 2.1 9.3 ±2.0 10.0 ± 2.3 9.1 ± 2.1 Monounsaturated fatty acids (% E) 19.6 ± 4.6 22.1 ±3.7 19.6 ± 4.3 20.9 ±4.1 19.3 ± 4.7 18.8 ± 4.6 Polyunsaturated fatty acids (% E) 6.1 ± 2.1 6.1 ±1.4 6.4 ± 2.0 7.7 ±1.8 6.2 ± 2.1 5.5 ± 1.7 Linoleic acid, (g/d) 12.9 ± 6.0 12.2 ±4.6 13.6 ± 6.1 16.0 ±5.5 12.6 ± 6.0 10.0 ± 4.8 α- linolenic acid, (g/d) 1.4 ± 0.7 1.3 ±0.7 1.5 ± 0.7 1.9 ±0.7 1.3 ± ± 0.6 1.1 ± 0.5 Marine n-3 fatty acids (g/d) 0.8 ± 0.5 0.9 ±0.5 0.8 ± 0.5 0.8 ±0.5 0.8 ± 0.5 0.7 ± 0.4 Olive oil (% E) 16.3 ±7.1 22.0 ±6.0 15.9 ± 6.7 17.6 ±6.4 15.8 ± 7.4 16.4 ± 6.8 Nuts (% E) 2.5 ±3.4 2.6 ±3.1 3.3 ± 3.7 8.2 ±4.5 2.4 ± 3.2 1.6 ± 2.5 Cholesterol (mg/d) 363 ± 131 339 ±101 367 ± 117 338 ±99 356 ± 122 324 ± 106
NOTE: In the Mediterranean diet with extra-virgin olive oil, Mediterranean diet with nuts, and control diet groups, 42, 57 and 25 participants, respectively, were excluded from calculations of food intake because their total energy intake was outside the prespecified ranges. MeDiet denotes Mediterranean diet; E, energy intake.
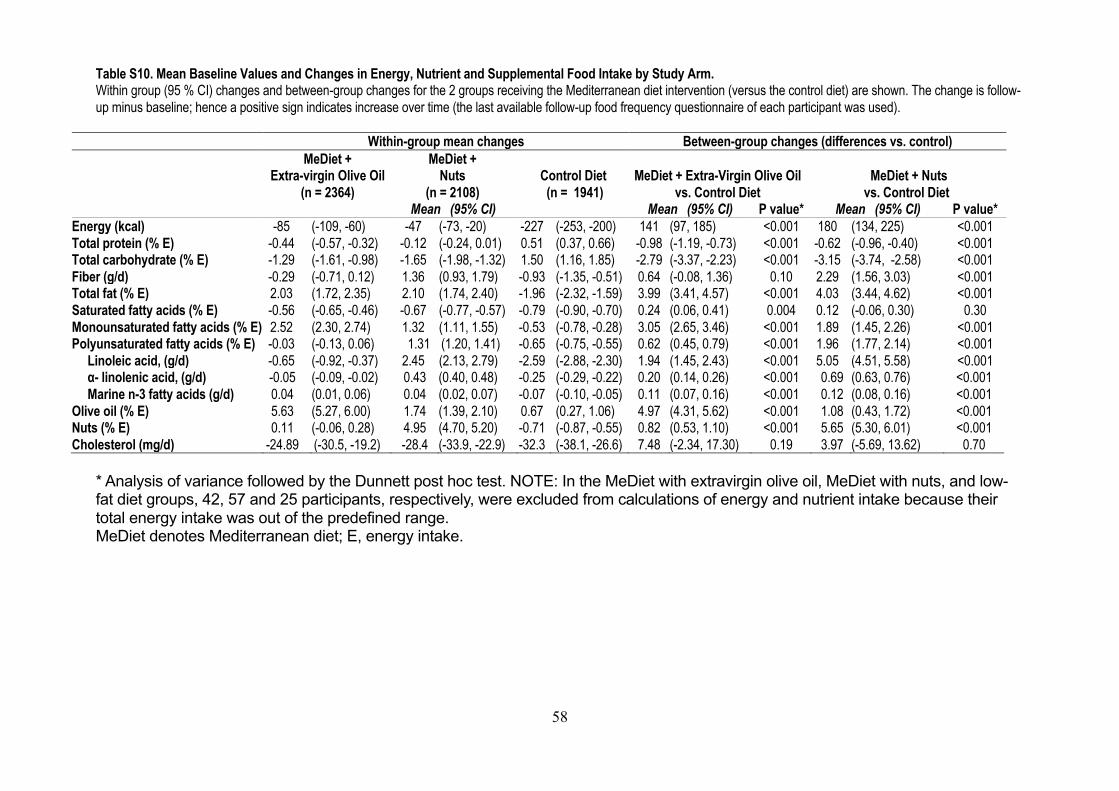
58
Table S10. Mean Baseline Values and Changes in Energy, Nutrient and Supplemental Food Intake by Study Arm. Within group (95 % CI) changes and between-group changes for the 2 groups receiving the Mediterranean diet intervention (versus the control diet) are shown. The change is follow-up minus baseline; hence a positive sign indicates increase over time (the last available follow-up food frequency questionnaire of each participant was used).
Within-group mean changes Between-group changes (differences vs. control) MeDiet +
Extra-virgin Olive Oil (n = 2364)
MeDiet + Nuts
(n = 2108)
Control Diet (n = 1941)
MeDiet + Extra-Virgin Olive Oil
vs. Control Diet
MeDiet + Nuts
vs. Control Diet Mean (95% CI) Mean (95% CI) P value* Mean (95% CI) P value* Energy (kcal) -85 (-109, -60) -47 (-73, -20) -227 (-253, -200) 141 (97, 185) <0.001 180 (134, 225) <0.001 Total protein (% E) -0.44 (-0.57, -0.32) -0.12 (-0.24, 0.01) 0.51 (0.37, 0.66) -0.98 (-1.19, -0.73) <0.001 -0.62 (-0.96, -0.40) <0.001 Total carbohydrate (% E) -1.29 (-1.61, -0.98) -1.65 (-1.98, -1.32) 1.50 (1.16, 1.85) -2.79 (-3.37, -2.23) <0.001 -3.15 (-3.74, -2.58) <0.001 Fiber (g/d) -0.29 (-0.71, 0.12) 1.36 (0.93, 1.79) -0.93 (-1.35, -0.51) 0.64 (-0.08, 1.36) 0.10 2.29 (1.56, 3.03) <0.001 Total fat (% E) 2.03 (1.72, 2.35) 2.10 (1.74, 2.40) -1.96 (-2.32, -1.59) 3.99 (3.41, 4.57) <0.001 4.03 (3.44, 4.62) <0.001 Saturated fatty acids (% E) -0.56 (-0.65, -0.46) -0.67 (-0.77, -0.57) -0.79 (-0.90, -0.70) 0.24 (0.06, 0.41) 0.004 0.12 (-0.06, 0.30) 0.30 Monounsaturated fatty acids (% E) 2.52 (2.30, 2.74) 1.32 (1.11, 1.55) -0.53 (-0.78, -0.28) 3.05 (2.65, 3.46) <0.001 1.89 (1.45, 2.26) <0.001 Polyunsaturated fatty acids (% E) -0.03 (-0.13, 0.06) 1.31 ( (1.20, 1.41) -0.65 (-0.75, -0.55) 0.62 (0.45, 0.79) <0.001 1.96 (1.77, 2.14) <0.001 Linoleic acid, (g/d) -0.65 (-0.92, -0.37) 2.45 (2.13, 2.79) -2.59 (-2.88, -2.30) 1.94 (1.45, 2.43) <0.001 5.05 (4.51, 5.58) <0.001 α- linolenic acid, (g/d) -0.05 (-0.09, -0.02) 0.43 (0.40, 0.48) -0.25 (-0.29, -0.22) 0.20 (0.14, 0.26) <0.001 0.69 (0.63, 0.76) <0.001 Marine n-3 fatty acids (g/d) 0.04 (0.01, 0.06) 0.04 (0.02, 0.07) -0.07 (-0.10, -0.05) 0.11 (0.07, 0.16) <0.001 0.12 (0.08, 0.16) <0.001 Olive oil (% E) 5.63 (5.27, 6.00) 1.74 (1.39, 2.10) 0.67 (0.27, 1.06) 4.97 (4.31, 5.62) <0.001 1.08 (0.43, 1.72) <0.001 Nuts (% E) 0.11 (-0.06, 0.28) 4.95 (4.70, 5.20) -0.71 (-0.87, -0.55) 0.82 (0.53, 1.10) <0.001 5.65 (5.30, 6.01) <0.001 Cholesterol (mg/d) -24.89 ( (-30.5, -19.2) -28.4 (-33.9, -22.9) -32.3 (-38.1, -26.6) 7.48 (-2.34, 17.30) 0.19 3.97 (-5.69, 13.62) 0.70
* Analysis of variance followed by the Dunnett post hoc test. NOTE: In the MeDiet with extravirgin olive oil, MeDiet with nuts, and low-fat diet groups, 42, 57 and 25 participants, respectively, were excluded from calculations of energy and nutrient intake because their total energy intake was out of the predefined range. MeDiet denotes Mediterranean diet; E, energy intake.
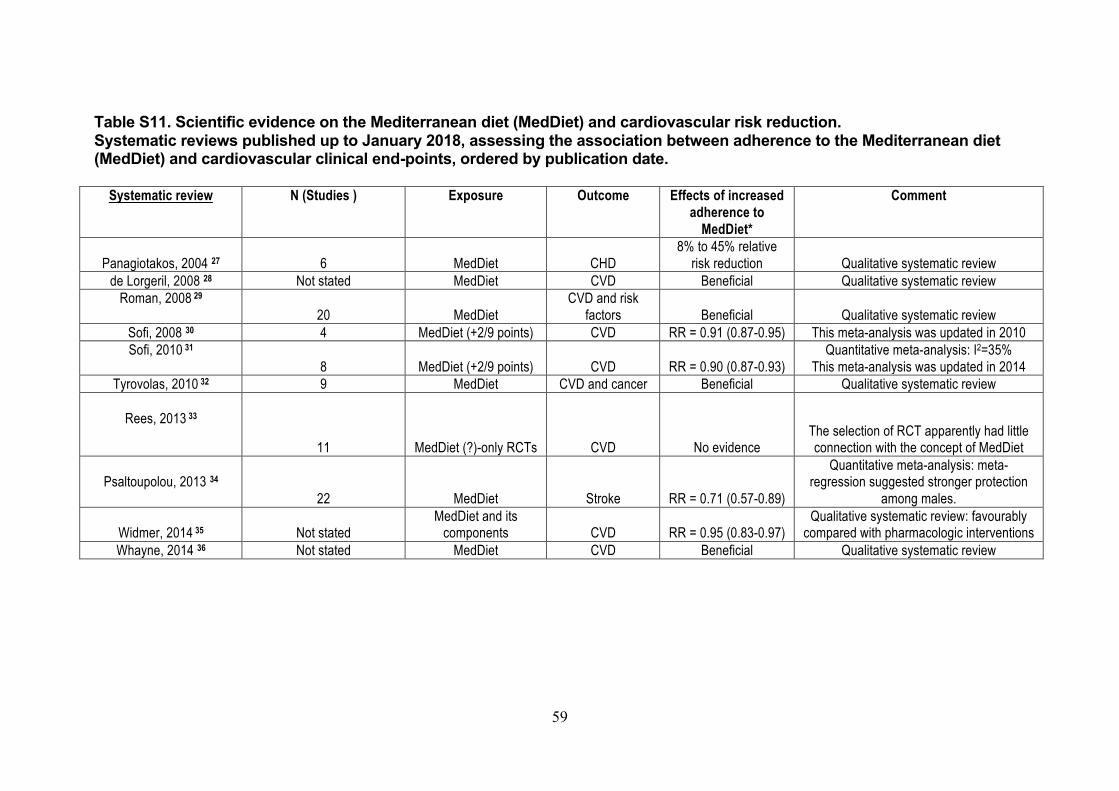
59
Table S11. Scientific evidence on the Mediterranean diet (MedDiet) and cardiovascular risk reduction. Systematic reviews published up to January 2018, assessing the association between adherence to the Mediterranean diet (MedDiet) and cardiovascular clinical end-points, ordered by publication date.
Systematic review N (Studies ) Exposure Outcome Effects of increased adherence to
MedDiet*
Comment
Panagiotakos, 2004 27 6 MedDiet CHD
8% to 45% relative risk reduction Qualitative systematic review
de Lorgeril, 2008 28 Not stated MedDiet CVD Beneficial Qualitative systematic review Roman, 2008 29
20 MedDiet CVD and risk
factors Beneficial Qualitative systematic review Sofi, 2008 30 4 MedDiet (+2/9 points) CVD RR = 0.91 (0.87-0.95) This meta-analysis was updated in 2010 Sofi, 2010 31
8 MedDiet (+2/9 points) CVD RR = 0.90 (0.87-0.93) Quantitative meta-analysis: I2=35%
This meta-analysis was updated in 2014 Tyrovolas, 2010 32 9 MedDiet CVD and cancer Beneficial Qualitative systematic review
Rees, 2013 33
11 MedDiet (?)-only RCTs CVD No evidence The selection of RCT apparently had little connection with the concept of MedDiet
Psaltoupolou, 2013 34
22 MedDiet Stroke RR = 0.71 (0.57-0.89)
Quantitative meta-analysis: meta-regression suggested stronger protection
among males.
Widmer, 2014 35 Not stated MedDiet and its
components CVD RR = 0.95 (0.83-0.97) Qualitative systematic review: favourably
compared with pharmacologic interventions Whayne, 2014 36 Not stated MedDiet CVD Beneficial Qualitative systematic review
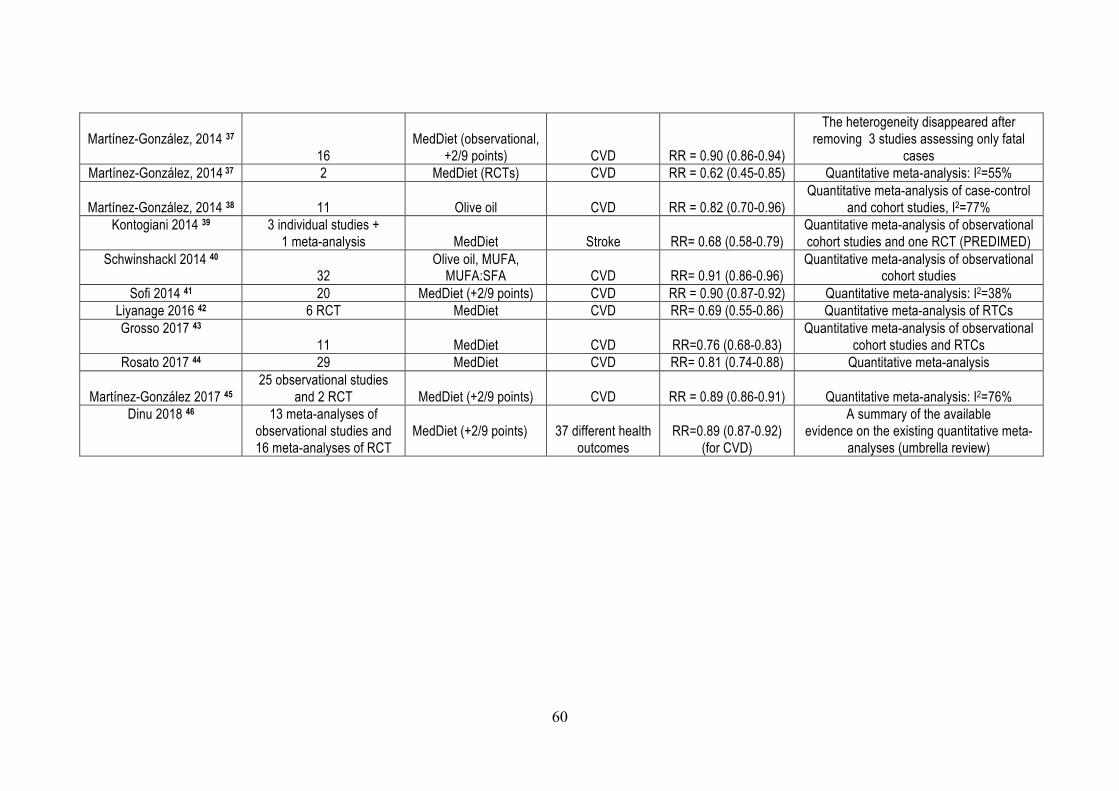
60
Martínez-González, 2014 37
16 MedDiet (observational,
+2/9 points) CVD RR = 0.90 (0.86-0.94)
The heterogeneity disappeared after removing 3 studies assessing only fatal
cases Martínez-González, 2014 37 2 MedDiet (RCTs) CVD RR = 0.62 (0.45-0.85) Quantitative meta-analysis: I2=55%
Martínez-González, 2014 38 11 Olive oil CVD RR = 0.82 (0.70-0.96)
Quantitative meta-analysis of case-control and cohort studies, I2=77%
Kontogiani 2014 39 3 individual studies + 1 meta-analysis MedDiet Stroke RR= 0.68 (0.58-0.79)
Quantitative meta-analysis of observational cohort studies and one RCT (PREDIMED)
Schwinshackl 2014 40 32
Olive oil, MUFA, MUFA:SFA CVD RR= 0.91 (0.86-0.96)
Quantitative meta-analysis of observational cohort studies
Sofi 2014 41 20 MedDiet (+2/9 points) CVD RR = 0.90 (0.87-0.92) Quantitative meta-analysis: I2=38% Liyanage 2016 42 6 RCT MedDiet CVD RR= 0.69 (0.55-0.86) Quantitative meta-analysis of RTCs Grosso 2017 43
11 MedDiet CVD RR=0.76 (0.68-0.83) Quantitative meta-analysis of observational
cohort studies and RTCs Rosato 2017 44 29 MedDiet CVD RR= 0.81 (0.74-0.88) Quantitative meta-analysis
Martínez-González 2017 45
25 observational studies and 2 RCT MedDiet (+2/9 points) CVD RR = 0.89 (0.86-0.91) Quantitative meta-analysis: I2=76%
Dinu 2018 46 13 meta-analyses of observational studies and 16 meta-analyses of RCT
MedDiet (+2/9 points)
37 different health outcomes
RR=0.89 (0.87-0.92)
(for CVD)
A summary of the available evidence on the existing quantitative meta-
analyses (umbrella review)
61
MedDiet: Mediterranean diet (+2/9 points): effects associated with increasing 2 points in a 0 to 9 score of adherence to the MedDiet. CVD: Cardiovascular Disease CHD: Coronary Heart Disease MUFA: Monounsaturated Fatty Acids RCT: Randomized Controlled Trial RR: Relative Risk (95% Confidence Intervals) SFA: monounsaturated fatty acids I2: index to quantify heterogeneity in meta-analyses, please check Higgins et al. BMJ 2003;327:557–60. *Risk ratios in meta-analyses of epidemiologic studies, usually adjusted for multiple confounders, compared the highest versus the lowest category of adherence to the MedDiet. Outcome changes describe the mean changes for the MedDiet versus comparator diets in meta-analyses of RCTs; only statistically significant changes are shown. Values between brackets are 95% confidence intervals.
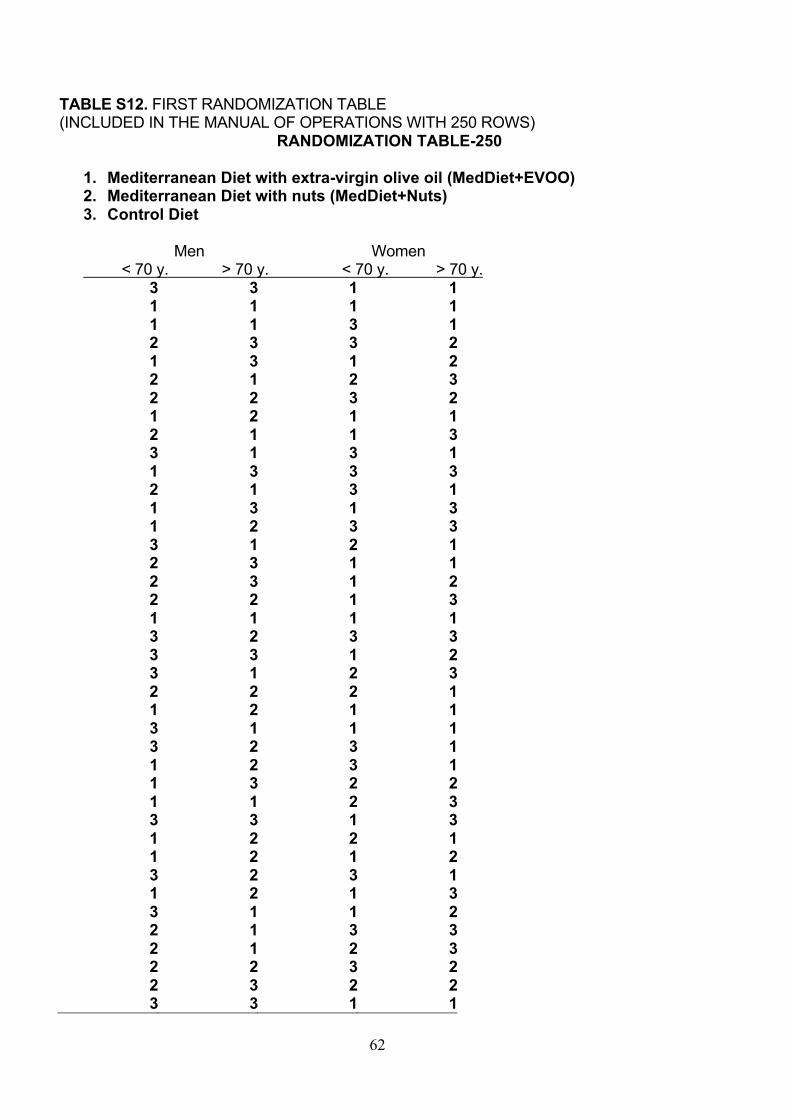
62
TABLE S12. FIRST RANDOMIZATION TABLE
(INCLUDED IN THE MANUAL OF OPERATIONS WITH 250 ROWS)
RANDOMIZATION TABLE-250
1. Mediterranean Diet with extra-virgin olive oil (MedDiet+EVOO) 2. Mediterranean Diet with nuts (MedDiet+Nuts) 3. Control Diet
Men Women
< 70 y. > 70 y. < 70 y. > 70 y.
3 3 1 1 1 1 1 1 1 1 3 1 2 3 3 2 1 3 1 2 2 1 2 3 2 2 3 2 1 2 1 1 2 1 1 3 3 1 3 1 1 3 3 3 2 1 3 1 1 3 1 3 1 2 3 3 3 1 2 1 2 3 1 1 2 3 1 2 2 2 1 3 1 1 1 1 3 2 3 3 3 3 1 2 3 1 2 3 2 2 2 1 1 2 1 1 3 1 1 1 3 2 3 1 1 2 3 1 1 3 2 2 1 1 2 3 3 3 1 3 1 2 2 1 1 2 1 2 3 2 3 1 1 2 1 3 3 1 1 2 2 1 3 3 2 1 2 3 2 2 3 2 2 3 2 2 3 3 1 1
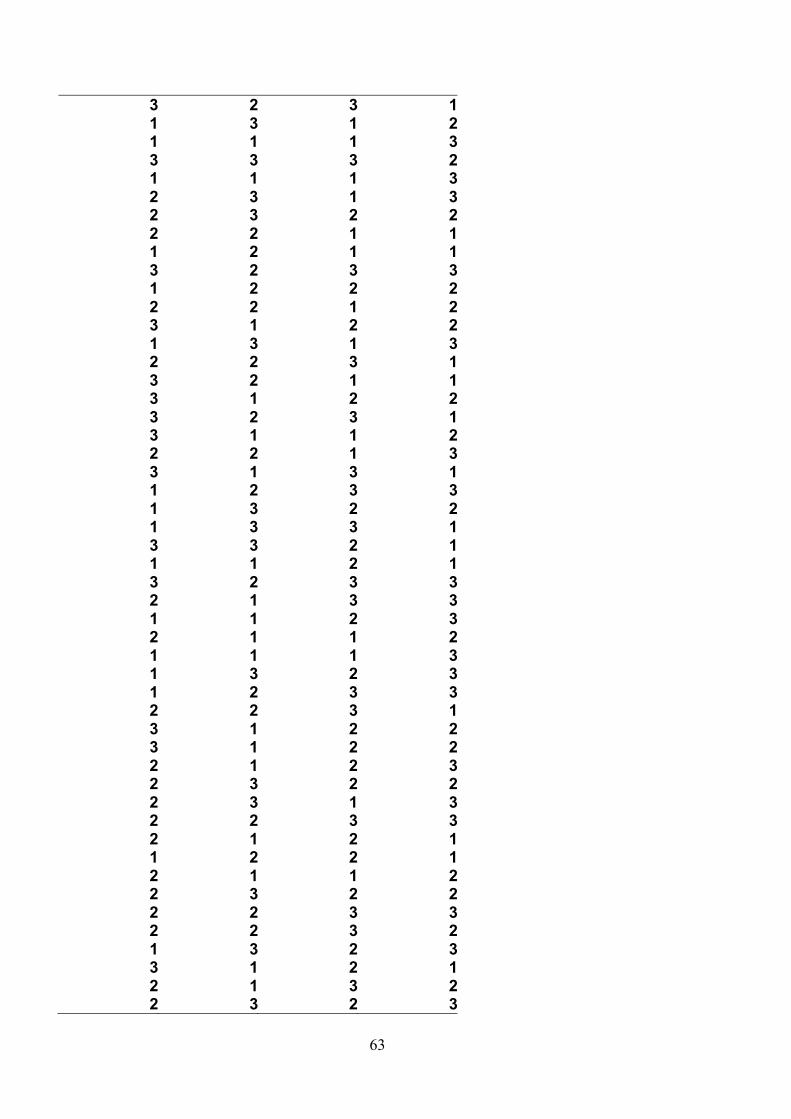
63
3 2 3 1 1 3 1 2 1 1 1 3 3 3 3 2 1 1 1 3 2 3 1 3 2 3 2 2 2 2 1 1 1 2 1 1 3 2 3 3 1 2 2 2 2 2 1 2 3 1 2 2 1 3 1 3 2 2 3 1 3 2 1 1 3 1 2 2 3 2 3 1 3 1 1 2 2 2 1 3 3 1 3 1 1 2 3 3 1 3 2 2 1 3 3 1 3 3 2 1 1 1 2 1 3 2 3 3 2 1 3 3 1 1 2 3 2 1 1 2 1 1 1 3 1 3 2 3 1 2 3 3 2 2 3 1 3 1 2 2 3 1 2 2 2 1 2 3 2 3 2 2 2 3 1 3 2 2 3 3 2 1 2 1 1 2 2 1 2 1 1 2 2 3 2 2 2 2 3 3 2 2 3 2 1 3 2 3 3 1 2 1 2 1 3 2 2 3 2 3
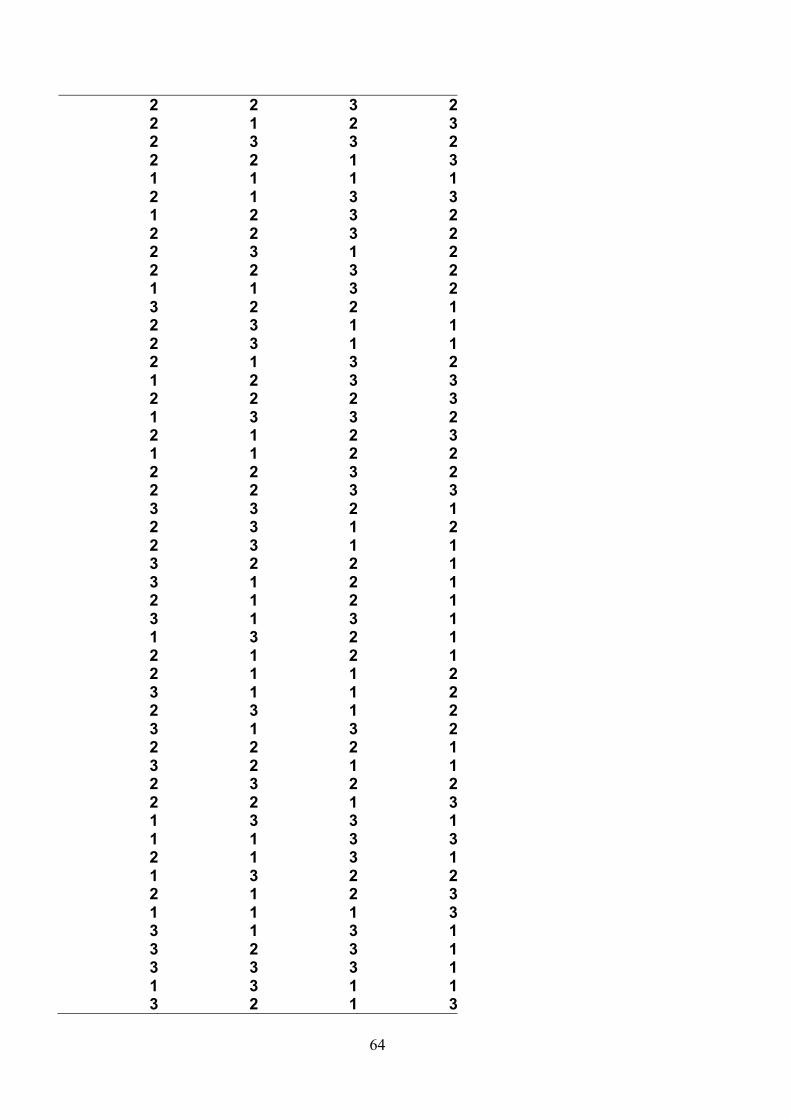
64
2 2 3 2 2 1 2 3 2 3 3 2 2 2 1 3 1 1 1 1 2 1 3 3 1 2 3 2 2 2 3 2 2 3 1 2 2 2 3 2 1 1 3 2 3 2 2 1 2 3 1 1 2 3 1 1 2 1 3 2 1 2 3 3 2 2 2 3 1 3 3 2 2 1 2 3 1 1 2 2 2 2 3 2 2 2 3 3 3 3 2 1 2 3 1 2 2 3 1 1 3 2 2 1 3 1 2 1 2 1 2 1 3 1 3 1 1 3 2 1 2 1 2 1 2 1 1 2 3 1 1 2 2 3 1 2 3 1 3 2 2 2 2 1 3 2 1 1 2 3 2 2 2 2 1 3 1 3 3 1 1 1 3 3 2 1 3 1 1 3 2 2 2 1 2 3 1 1 1 3 3 1 3 1 3 2 3 1 3 3 3 1 1 3 1 1 3 2 1 3
65
3 1 3 3 1 3 3 3 2 3 1 1 1 2 2 1 2 1 1 3 1 2 3 3 3 2 1 1 3 3 2 3 1 2 2 1 3 1 2 2 1 3 1 2 2 2 3 3 3 3 2 2 1 3 2 1 2 3 2 3 2 2 2 1 2 2 3 1 3 1 1 2 1 3 3 3 3 2 1 2 2 3 1 3 3 3 1 2 1 2 1 2 1 1 1 1 1 2 1 3 2 1 2 3 2 1 2 3 2 2 2 2 3 3 3 1 1 1 2 3 2 2 1 3 1 2 2 2 2 2 1 2 3 3 3 1 1 2 2 1 2 1 1 3 2 2 2 2 3 3 3 2 2 1 1 2 3 1 3 2 1 1 1 3 2 3 2 3 3 1 1 1 1 3 2 1 1 1 3 1 2 2 1 1 3 2 3 1 2 2 3 2 2 2 1 1 1 1 2 3
66
2 3 1 2 3 2 2 1 2 3 1 1 2 2 2 3 3 3 3 2 3 3 3 1 2 1 2 2 1 3 3 2 3 1 2 1 2 1 3 2 1 2 3 2 2 2 2 2 3 2 3 2 1 3 3 3 2 3 1 1 2 2 3 2 1 2 3 1 1 1 2 2 3 2 2 2 3 1 1 1 1 1 1 1 3 2 2 3 3 1 3 1 2 2 3 1 3 2 3 2 3 2 1 1 3 1 1 1 2 1 1 3 1 1 1 1 2 1 2 3 1 2 1 1 2 3 1 2 1 1 1 3 3 3 1 1 3 3 3 1 3 2 1 2 1 3 3 3 1 2 1 3 1 2 1 3 1 1 2 2 2 3 1 2 2 1 2 3 3 1 2 3 3 2 1 2 1 3 2 1 2 3 3 1 3 1 3 3 3 3 1 3 2 2 2 2 1 2 3 2

67
1 3 3 3 3 1 2 2 3 2 2 3 1 2 1 3 1 3 2 2 1 1 3 3 1 3 1 1 3 2 2 2 1 2 2 3 1 2 1 3
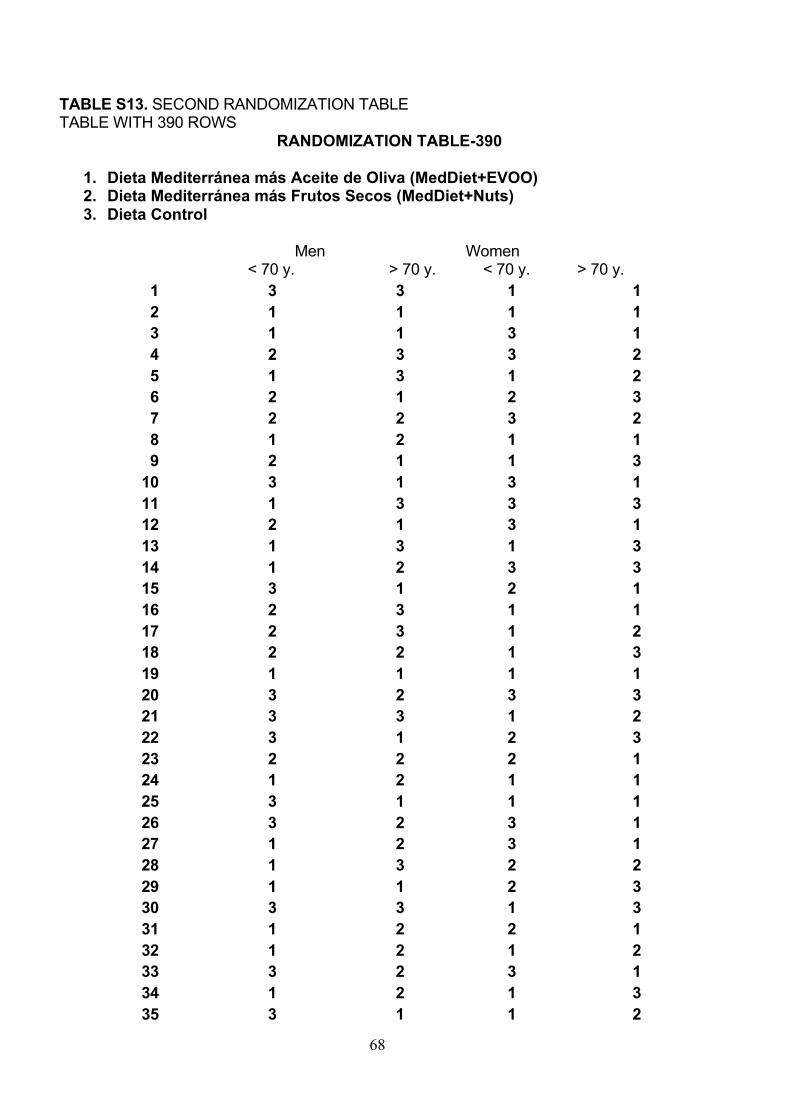
68
TABLE S13. SECOND RANDOMIZATION TABLE
TABLE WITH 390 ROWS
RANDOMIZATION TABLE-390
1. Dieta Mediterránea más Aceite de Oliva (MedDiet+EVOO) 2. Dieta Mediterránea más Frutos Secos (MedDiet+Nuts) 3. Dieta Control
Men Women
< 70 y. > 70 y. < 70 y. > 70 y.
1 3 3 1 1 2 1 1 1 1 3 1 1 3 1 4 2 3 3 2 5 1 3 1 2 6 2 1 2 3 7 2 2 3 2 8 1 2 1 1 9 2 1 1 3
10 3 1 3 1 11 1 3 3 3 12 2 1 3 1 13 1 3 1 3 14 1 2 3 3 15 3 1 2 1 16 2 3 1 1 17 2 3 1 2 18 2 2 1 3 19 1 1 1 1 20 3 2 3 3 21 3 3 1 2 22 3 1 2 3 23 2 2 2 1 24 1 2 1 1 25 3 1 1 1 26 3 2 3 1 27 1 2 3 1 28 1 3 2 2 29 1 1 2 3 30 3 3 1 3 31 1 2 2 1 32 1 2 1 2 33 3 2 3 1 34 1 2 1 3 35 3 1 1 2

69
36 2 1 3 3 37 2 1 2 3 38 2 2 3 2 39 2 3 2 2 40 3 3 2 1 41 3 2 3 3 42 2 3 2 2 43 1 1 3 3 44 3 3 3 2 45 1 1 1 3 46 2 3 3 3 47 2 3 2 2 48 2 1 2 1 49 1 3 2 2 50 3 3 3 3 51 1 2 2 2 52 2 2 1 2 53 3 1 2 2 54 1 3 2 3 55 2 2 3 2 56 3 3 2 1 57 3 1 2 2 58 3 2 3 1 59 3 1 2 2 60 2 2 1 3 61 3 1 3 1 62 1 2 1 3 63 3 3 2 2 64 1 3 3 1 65 3 3 1 3 66 1 1 2 1 67 3 2 3 3 68 2 1 3 1 69 1 3 2 3 70 2 1 1 2 71 1 1 1 3 72 1 2 2 2 73 1 2 3 3 74 2 3 3 1 75 3 2 2 2 76 3 3 1 2 77 1 1 2 1 78 3 3 2 1
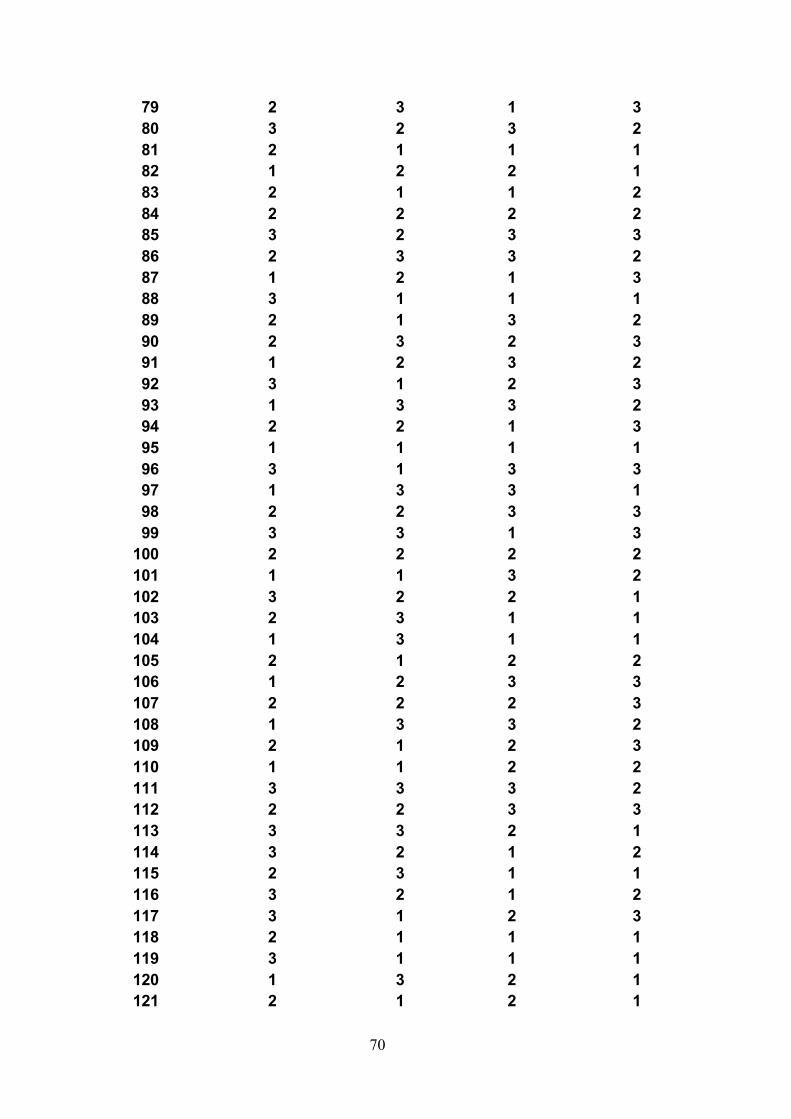
70
79 2 3 1 3 80 3 2 3 2 81 2 1 1 1 82 1 2 2 1 83 2 1 1 2 84 2 2 2 2 85 3 2 3 3 86 2 3 3 2 87 1 2 1 3 88 3 1 1 1 89 2 1 3 2 90 2 3 2 3 91 1 2 3 2 92 3 1 2 3 93 1 3 3 2 94 2 2 1 3 95 1 1 1 1 96 3 1 3 3 97 1 3 3 1 98 2 2 3 3 99 3 3 1 3
100 2 2 2 2 101 1 1 3 2 102 3 2 2 1 103 2 3 1 1 104 1 3 1 1 105 2 1 2 2 106 1 2 3 3 107 2 2 2 3 108 1 3 3 2 109 2 1 2 3 110 1 1 2 2 111 3 3 3 2 112 2 2 3 3 113 3 3 2 1 114 3 2 1 2 115 2 3 1 1 116 3 2 1 2 117 3 1 2 3 118 2 1 1 1 119 3 1 1 1 120 1 3 2 1 121 2 1 2 1
71
122 2 1 1 2 123 3 1 2 2 124 2 3 1 2 125 3 1 3 2 126 2 2 2 1 127 3 2 1 1 128 2 3 2 2 129 2 2 1 3 130 1 3 3 1 131 1 1 3 3 132 2 1 3 1 133 1 3 2 2 134 2 1 2 3 135 1 2 1 3 136 3 3 3 1 137 1 2 3 2 138 3 3 3 1 139 1 3 1 2 140 3 2 1 3 141 3 1 3 3 142 1 3 3 3 143 2 3 1 1 144 1 2 2 2 145 2 1 1 3 146 1 2 3 3 147 3 2 1 1 148 3 3 2 3 149 1 2 2 1 150 3 1 2 2 151 1 3 1 2 152 2 2 3 3 153 3 3 2 2 154 1 3 2 1 155 2 3 2 3 156 1 1 2 1 157 2 2 3 1 158 3 1 1 2 159 1 3 3 3 160 3 2 1 1 161 2 3 1 3 162 3 3 3 1 163 1 2 1 2 164 1 1 3 1
72
165 1 2 1 3 166 2 1 2 3 167 3 1 3 3 168 2 2 2 2 169 3 3 3 1 170 1 1 2 3 171 2 2 1 3 172 1 2 2 1 173 2 1 1 2 174 3 3 3 1 175 1 2 2 1 176 3 1 1 3 177 2 2 2 2 178 3 3 3 2 179 2 1 1 2 180 3 1 3 2 181 1 1 1 3 182 2 3 2 3 183 3 1 1 1 184 1 3 2 1 185 1 1 3 3 186 2 2 1 1 187 3 1 3 3 188 2 3 3 2 189 3 2 1 1 190 1 1 2 3 191 2 3 1 2 192 3 2 2 3 193 1 3 1 1 194 2 2 2 3 195 3 3 1 2 196 3 3 3 1 197 2 1 2 2 198 1 3 3 2 199 3 1 2 1 200 2 1 3 2 201 1 2 1 3 202 2 2 2 2 203 3 2 3 3 204 1 3 3 3 205 2 3 1 1 206 2 2 3 2 207 1 2 3 1
73
208 1 1 2 2 209 3 2 2 2 210 3 1 1 1 211 1 1 1 1 212 3 2 2 3 213 3 1 3 2 214 2 2 3 1 215 3 2 3 2 216 2 2 1 1 217 3 1 1 1 218 2 1 2 3 219 1 3 1 1 220 2 1 2 3 221 1 2 1 1 222 2 3 2 2 223 1 1 3 3 224 3 3 1 1 225 2 3 3 1 226 3 2 1 2 227 1 3 3 3 228 1 2 2 2 229 1 3 1 3 230 1 1 2 2 231 2 3 1 2 232 2 1 2 3 233 3 1 2 3 234 3 2 3 2 235 1 3 2 1 236 2 3 3 1 237 3 1 3 3 238 3 3 1 3 239 2 2 2 2 240 1 2 3 2 241 1 3 3 3 242 3 1 2 2 243 3 2 2 3 244 1 2 1 3 245 2 3 2 2 246 1 1 3 3 247 1 3 1 1 248 3 2 2 2 249 1 1 2 3 250 1 2 1 3

74
251 1 1 1 1 252 2 1 3 1 253 3 2 3 2 254 3 3 3 3 255 2 3 2 2 256 2 2 1 1 257 1 1 2 2 258 1 2 3 3 259 2 3 2 2 260 3 2 1 1 261 3 1 2 2 262 2 2 1 3 263 2 3 1 2 264 3 2 3 1 265 1 1 3 2 266 2 1 2 1 267 3 1 1 1 268 2 3 1 3 269 2 3 3 1 270 3 3 3 1 271 1 1 2 3 272 2 2 2 2 273 3 3 3 1 274 3 2 3 2 275 1 1 2 3 276 2 2 1 2 277 3 3 1 1 278 2 2 1 3 279 1 1 3 3 280 2 2 2 2 281 3 3 1 2 282 2 2 1 1 283 1 1 2 1 284 1 2 3 2 285 2 3 3 3 286 3 2 2 1 287 3 2 2 2 288 2 3 2 3 289 1 1 1 1 290 2 1 1 2 291 3 1 1 1 292 2 3 3 3 293 1 3 3 1
75
294 1 2 3 3 295 2 1 3 2 296 1 1 2 1 297 3 1 1 3 298 3 3 2 2 299 1 3 1 3 300 3 3 3 1 301 1 1 2 3 302 2 2 2 2 303 3 3 3 1 304 3 2 3 2 305 1 1 2 3 306 2 2 1 2 307 3 3 1 1 308 2 2 1 3 309 1 1 3 3 310 2 2 2 2 311 3 3 1 2 312 2 2 1 1 313 1 1 2 1 314 1 2 3 2 315 2 3 3 3 316 3 2 2 1 317 3 2 2 2 318 2 3 2 3 319 1 1 1 1 320 2 1 1 2 321 3 1 1 1 322 2 3 3 3 323 1 3 3 1 324 1 2 3 3 325 2 1 3 2 326 1 1 2 1 327 3 1 1 3 328 3 3 2 2 329 1 3 1 3 330 3 3 3 1 331 1 1 2 3 332 2 2 2 2 333 3 3 3 1 334 3 2 3 2 335 1 1 2 3 336 2 2 1 2

76
337 3 3 1 1 338 2 2 1 3 339 1 1 3 3 340 2 2 2 2 341 3 3 1 2 342 2 2 1 1 343 1 1 2 1 344 1 2 3 2 345 2 3 3 3 346 3 2 2 1 347 3 2 2 2 348 2 3 2 3 349 1 1 1 1 350 2 1 1 2 351 3 1 1 1 352 2 3 3 3 353 1 3 3 1 354 1 2 3 3 355 2 1 3 2 356 1 1 2 1 357 3 1 1 3 358 3 3 2 2 359 1 3 1 3 360 3 3 3 1 361 1 1 2 3 362 2 2 2 2 363 3 3 3 1 364 3 2 3 2 365 1 1 2 3 366 2 2 1 2 367 3 3 1 1 368 2 2 1 3 369 1 1 3 3 370 2 2 2 2 371 3 3 1 2 372 2 2 1 1 373 1 1 2 1 374 1 2 3 2 375 2 3 3 3 376 3 2 2 1 377 3 2 2 2 378 2 3 2 3 379 1 1 1 1

77
380 2 1 1 2 381 3 1 1 1 382 2 3 3 3 383 1 3 3 1 384 1 2 3 3 385 2 1 3 2 386 1 1 2 1 387 3 1 1 3 388 3 3 2 2 389 1 3 1 3 390 3 3 3 1
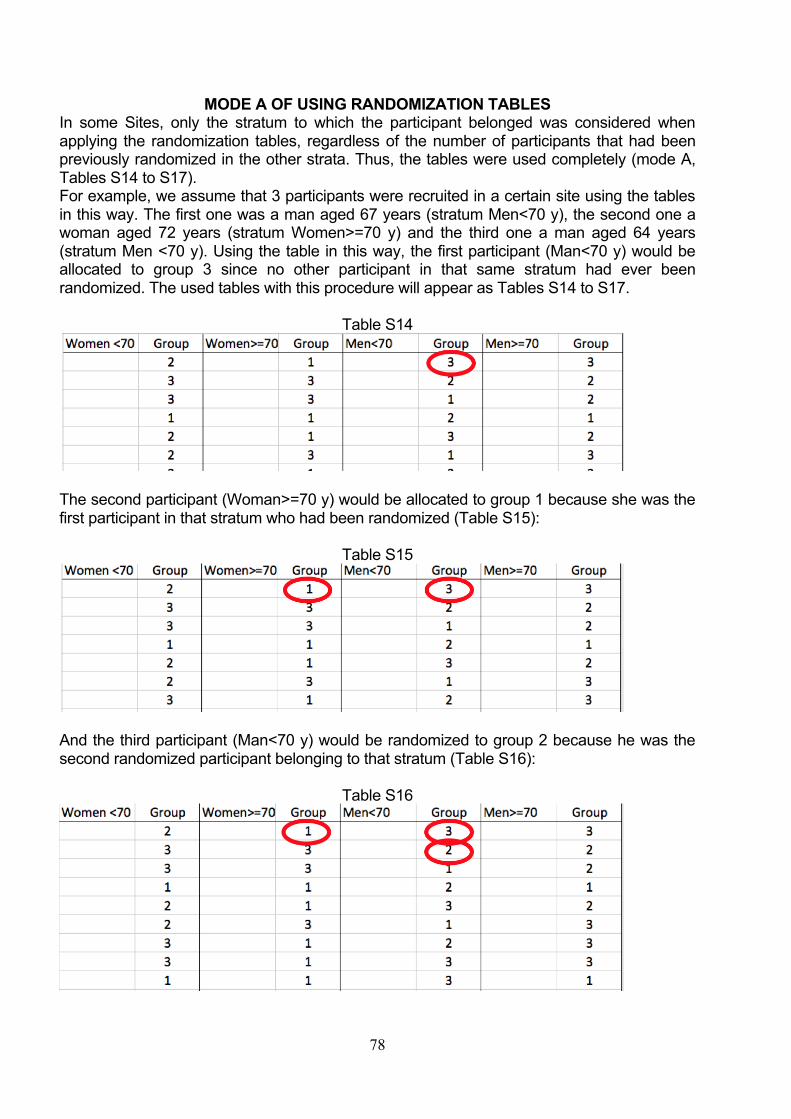
78
MODE A OF USING RANDOMIZATION TABLES In some Sites, only the stratum to which the participant belonged was considered when
applying the randomization tables, regardless of the number of participants that had been
previously randomized in the other strata. Thus, the tables were used completely (mode A,
Tables S14 to S17).
For example, we assume that 3 participants were recruited in a certain site using the tables
in this way. The first one was a man aged 67 years (stratum Men<70 y), the second one a
woman aged 72 years (stratum Women>=70 y) and the third one a man aged 64 years
(stratum Men <70 y). Using the table in this way, the first participant (Man<70 y) would be
allocated to group 3 since no other participant in that same stratum had ever been
randomized. The used tables with this procedure will appear as Tables S14 to S17.
Table S14
The second participant (Woman>=70 y) would be allocated to group 1 because she was the
first participant in that stratum who had been randomized (Table S15):
Table S15
And the third participant (Man<70 y) would be randomized to group 2 because he was the
second randomized participant belonging to that stratum (Table S16):
Table S16
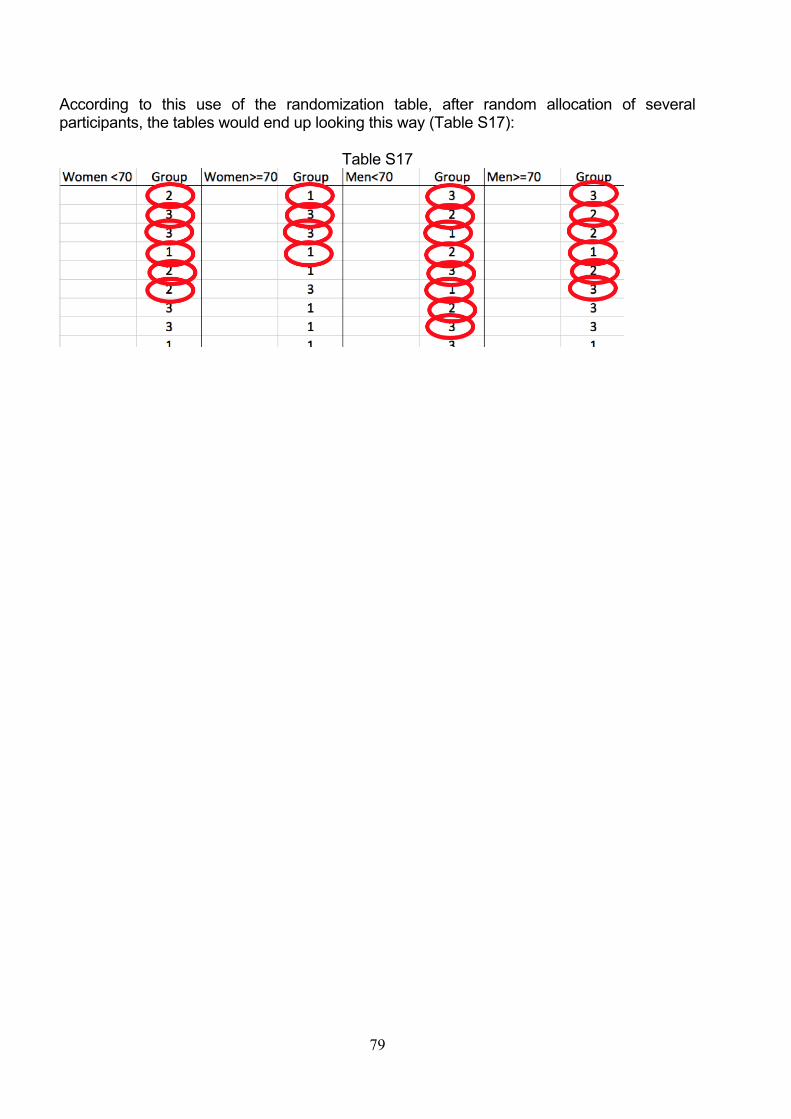
79
According to this use of the randomization table, after random allocation of several
participants, the tables would end up looking this way (Table S17):
Table S17

80
MODE B OF USING RANDOMIZATION TABLES An alternative use of the randomization tables consisted in assigning each recruited
participant to a full row, so each participant “occupied” one full row. Thus, after correctly
allocating the participant, the whole row would be crossed out and not used for future
participants (mode B), as shown in Tables S18 to S21.
Thus, the field workers would have done as follows in the case of the previous example: 1)
man aged 67 years (stratum Men<70 y), 2) woman aged 72 years (stratum Women>=70 y)
and 3) man aged 64 years (stratum Men <70 y).
The first participant (Man<70 y) would be allocated to group 3 and then the rest of the row
would be crossed out and not taken into consideration any more for the next recruited
participants:
Table S18
The second participant (Woman>=70 y) would be allocated to group 3 and the rest of the
row would be considered as “consumed”.
Table S19
The third participant (Man<70 y) would be allocated this time to group 1 because two
participants had been recruited before and the two first rows would be considered as already
used:
Table S20
After randomization of several participants, the table would have ended up looking like the
Table S21 shows:

81
Table S21

82
TABLE S22. MODE OF USING RANDOMIZATION TABLES IN EACH SITE
SITE
RANDOMIZATION LISTS USED
MODE OF USING THE
RANDOMIZATION TABLES
A Manual operations (250) and later another
list
A
B Manual operations (250) A
C Manual operations (250) B
D Not available
E Manual operations (250) and later a
second list (390)
B
F Manual operations (250) and later a
second list
B
G Manual operations (250) and later another
list
A
H Second list (390) B
I Manual operations (250) and later a
second list (390)
B
J Manual operations (250) B
K Manual operations (250) A
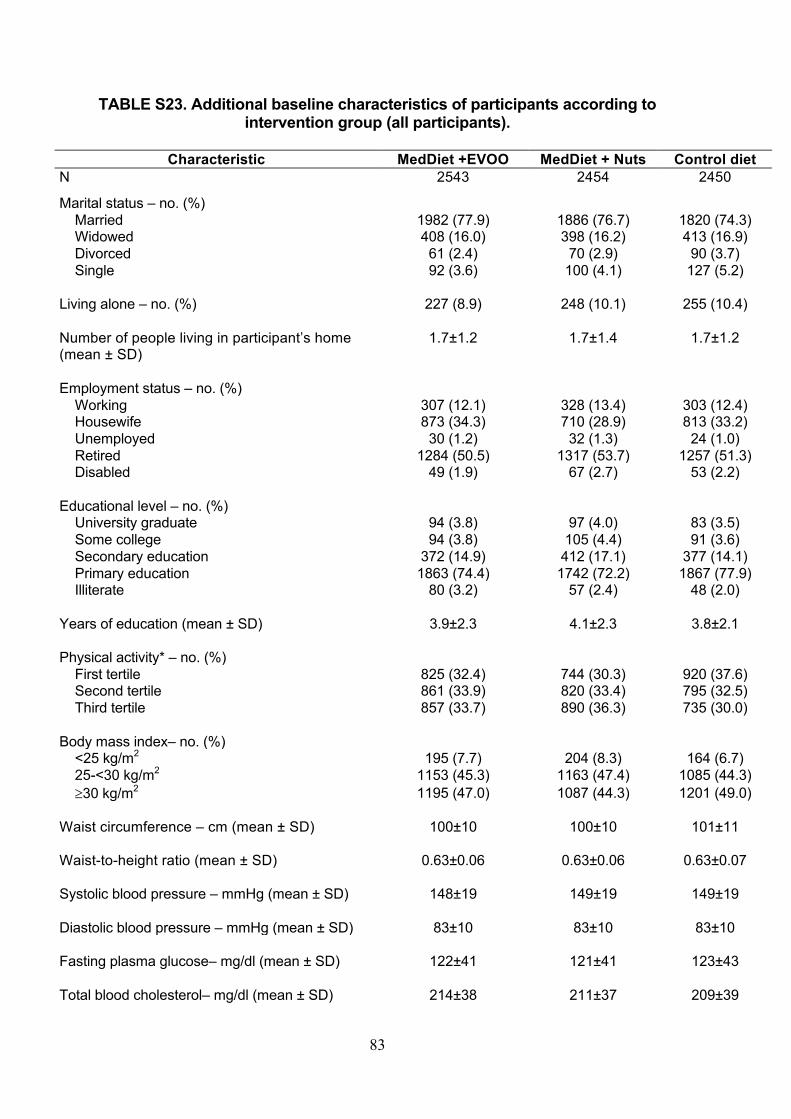
83
TABLE S23. Additional baseline characteristics of participants according to intervention group (all participants).
Characteristic MedDiet +EVOO MedDiet + Nuts Control diet
N 2543 2454 2450
Marital status – no. (%)
Married 1982 (77.9) 1886 (76.7) 1820 (74.3)
Widowed 408 (16.0) 398 (16.2) 413 (16.9)
Divorced 61 (2.4) 70 (2.9) 90 (3.7)
Single 92 (3.6) 100 (4.1) 127 (5.2)
Living alone – no. (%) 227 (8.9) 248 (10.1) 255 (10.4)
Number of people living in participant’s home
(mean ± SD)
1.7±1.2 1.7±1.4 1.7±1.2
Employment status – no. (%)
Working 307 (12.1) 328 (13.4) 303 (12.4)
Housewife 873 (34.3) 710 (28.9) 813 (33.2)
Unemployed 30 (1.2) 32 (1.3) 24 (1.0)
Retired 1284 (50.5) 1317 (53.7) 1257 (51.3)
Disabled 49 (1.9) 67 (2.7) 53 (2.2)
Educational level – no. (%)
University graduate 94 (3.8) 97 (4.0) 83 (3.5)
Some college 94 (3.8) 105 (4.4) 91 (3.6)
Secondary education 372 (14.9) 412 (17.1) 377 (14.1)
Primary education 1863 (74.4) 1742 (72.2) 1867 (77.9)
Illiterate 80 (3.2) 57 (2.4) 48 (2.0)
Years of education (mean ± SD) 3.9±2.3 4.1±2.3 3.8±2.1
Physical activity* – no. (%)
First tertile 825 (32.4) 744 (30.3) 920 (37.6)
Second tertile 861 (33.9) 820 (33.4) 795 (32.5)
Third tertile 857 (33.7) 890 (36.3) 735 (30.0)
Body mass index– no. (%)
<25 kg/m2 195 (7.7) 204 (8.3) 164 (6.7)
25-<30 kg/m2 1153 (45.3) 1163 (47.4) 1085 (44.3)
³30 kg/m2 1195 (47.0) 1087 (44.3) 1201 (49.0)
Waist circumference – cm (mean ± SD) 100±10 100±10 101±11
Waist-to-height ratio (mean ± SD) 0.63±0.06 0.63±0.06 0.63±0.07
Systolic blood pressure – mmHg (mean ± SD) 148±19 149±19 149±19
Diastolic blood pressure – mmHg (mean ± SD) 83±10 83±10 83±10
Fasting plasma glucose– mg/dl (mean ± SD) 122±41 121±41 123±43
Total blood cholesterol– mg/dl (mean ± SD) 214±38 211±37 209±39

84
Triglycerides– mg/dl (mean ± SD) 138±82 136±78 138±76
LDL-cholesterol – mg/dl (mean ± SD) 132±33 130±33 129±35
HDL-cholesterol– mg/dl (mean ± SD) 54±14 54±14 54±14
Previous diagnosis of arrhythmia– no. (%) 189 (7.4) 201 (8.2) 198 (8.1)
Prior pulmonary embolism– no. (%) 13 (0.51) 10 (0.41) 11 (0.45)
Diagnosis of heart failure– no. (%) 16 (0.63) 10 (0.41) 18 (0.73)
Previous deep venous thrombosis– no. (%) 24 (0.94) 25 (1.02) 32 (1.31)
History of osteoporotic fracture– no. (%) 445 (17.5) 450 (18.3) 474 (19.4)
Retinopathy– no. (%) 62 (2.4) 67 (2.7) 58 (2.4)
Dyspnea– no. (%) 141 (5.5) 108 (4.4) 146 (6.0)
Cataracts– no. (%) 545 (21.4) 539 (22.0) 556 (22.7)
Obstructive sleep apnea – no. (%) 41 (1.6) 46 (1.9) 46 (1.9)
Psychological tension score– (mean ± SD) 5.4±2.2 5.4±2.1 5.5±2.1
Non-atherosclerotic CVD – no. (%) 57 (2.2) 61 (2.5) 72 (2.9)
Kidney disease – no. (%) 68 (2.7) 65 (2.7) 66 (2.7)
Depression – no. (%) 464 (18.3) 408 (16.6) 458 (18.7)
History of cancer – no. (%) 66 (2.6) 83 (3.4) 67 (2.7)
Family history of hypercholesterolemia– no. (%) 699 (36.3) 674 (36.7) 614 (34.2)
Family history of hypertension– no. (%) 1060 (51.5) 1022 (52.5) 1006 (52.3)
Family history of cancer– no. (%) 1288 (53.8) 1201 (52.3) 1173 (51.7)
Antidepressant use– no. (%) 616 (24.2) 590 (24.0) 673 (27.5)
Use of nonsteroidal anti-inflammatory drugs 288 (11.3) 257 (10.5) 268 (10.9)
Use of calcium channel blockers– no. (%) 318 (12.5) 311 (12.7) 363 (14.8)
Use of beta-blockers– no. (%) 301 (11.8) 298 (12.1) 283 (11.6)
Use of alfa-blockers– no. (%) 106 (4.2) 101 (4.1) 112 (4.6)
Vitamin/Mineral Supplements – no. (%) 272 (10.7) 243 (9.9) 294 (12.0)
Alcohol intake– g/d (mean ± SD) 8.6±14.4 9.2±14.9 7.5±13.1
MedDiet Adherence score║ (mean ± SD) 8.7±2.0 8.7±2.0 8.4±2.1

85
*Physical activity was categorized in tertiles from lowest (T1) to higher (T3) levels of lesirure-time
physical activity. The cut-off points were 735 metabolic equivalents (METS)-min/wk and 1800 METS-
min/wk.
║Mediterranean diet adherence (MedDiet) score based on the 14-item dietary screener shown in
Supplementary Appendix Table S4 (minimum adherence = 0 points; maximum adherence = 14
points). This score was assessed only after randomization.

86
Table S23 (2nd part) Baseline characteristics by intervention group (after excluding site D, site B and the non-randomized members of households)
Characteristic
Mediterranean
diet with EVOO
N= 1976
Mediterranean
diet with nuts
N= 1977
Control diet
N= 1906
Female sex – (%) 58.7 53.7 60.3
Age – yr (mean ± SD) 67.0±6.1 66.5±6.1 67.3±6.3
Ethnic group – (%)
European whites 97.8 98.1 97.8
Marital status – (%)
Married 77.6 75.7 74.0
Divorced 2.4 3.0 3.8
Living alone – (%) 9.8 11.0 10.7
Employment status – (%)
Housewife 33.1 27.8 33.2
Unemployed 1.1 1.3 0.8
Retired 51.4 53.8 50.5
Disabled 1.8 2.7 2.4
Years of education (mean ± SD) 3.9±2.3 4.1±2.4 3.9±2.2
Smoking – (%)
Former smoker 23.1 26.3 23.4
Current smoker 13.8 14.3 13.5
Body mass index (mean ± SD) 29.9±3.7 29.7±3.8 30.1±3.9
Waist-to-height ratio (mean ± SD) 0.63±0.06 0.63±0.06 0.63±0.07
Obesity (BMI>30) – (%) 46.7 44.7 47.4
Leisure time physical activity METS-min/wk–
(mean ± SD)
1684 (1621) 1748 (1666) 1566 (1669)
Physical activity >500 METS-min/wk– (%)
77.0 77.2 73.2
Family history of premature CHD – (%)
23.3 21.9 22.1
Hypertension – (%)
81.6 82.9 83.6
Type-2 diabetes – (%)
49.0 46.2 48.2
Dyslipidemia – (%)
71.7 73.8 72.1
Dyspnea – (%) 5.5 4.5 5.6
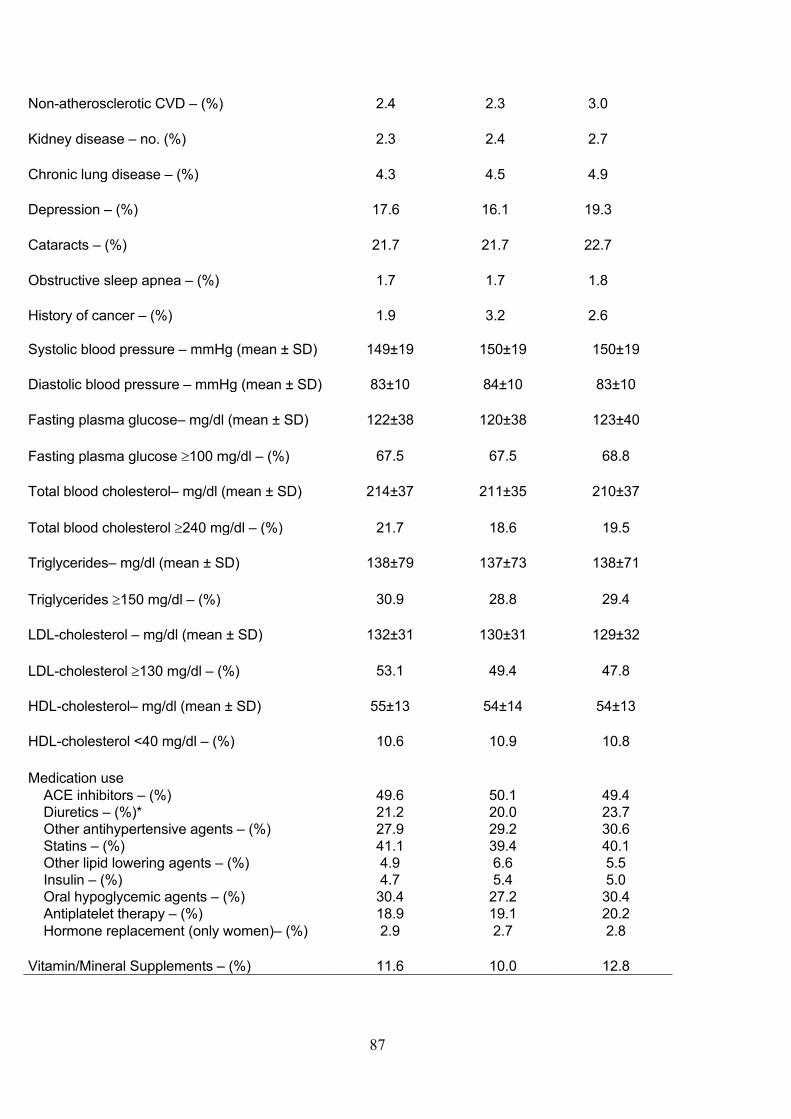
87
Non-atherosclerotic CVD – (%) 2.4 2.3 3.0
Kidney disease – no. (%) 2.3 2.4 2.7
Chronic lung disease – (%) 4.3 4.5 4.9
Depression – (%) 17.6 16.1 19.3
Cataracts – (%) 21.7 21.7 22.7
Obstructive sleep apnea – (%) 1.7 1.7 1.8
History of cancer – (%) 1.9 3.2 2.6
Systolic blood pressure – mmHg (mean ± SD) 149±19 150±19 150±19
Diastolic blood pressure – mmHg (mean ± SD) 83±10 84±10 83±10
Fasting plasma glucose– mg/dl (mean ± SD) 122±38 120±38 123±40
Fasting plasma glucose ³100 mg/dl – (%) 67.5 67.5 68.8
Total blood cholesterol– mg/dl (mean ± SD) 214±37 211±35 210±37
Total blood cholesterol ³240 mg/dl – (%) 21.7 18.6 19.5
Triglycerides– mg/dl (mean ± SD) 138±79 137±73 138±71
Triglycerides ³150 mg/dl – (%) 30.9 28.8 29.4
LDL-cholesterol – mg/dl (mean ± SD) 132±31 130±31 129±32
LDL-cholesterol ³130 mg/dl – (%) 53.1 49.4 47.8
HDL-cholesterol– mg/dl (mean ± SD) 55±13 54±14 54±13
HDL-cholesterol <40 mg/dl – (%) 10.6 10.9 10.8
Medication use
ACE inhibitors – (%) 49.6 50.1 49.4
Diuretics – (%)* 21.2 20.0 23.7
Other antihypertensive agents – (%) 27.9 29.2 30.6
Statins – (%) 41.1 39.4 40.1
Other lipid lowering agents – (%) 4.9 6.6 5.5
Insulin – (%) 4.7 5.4 5.0
Oral hypoglycemic agents – (%) 30.4 27.2 30.4
Antiplatelet therapy – (%) 18.9 19.1 20.2
Hormone replacement (only women)– (%) 2.9 2.7 2.8
Vitamin/Mineral Supplements – (%) 11.6 10.0 12.8
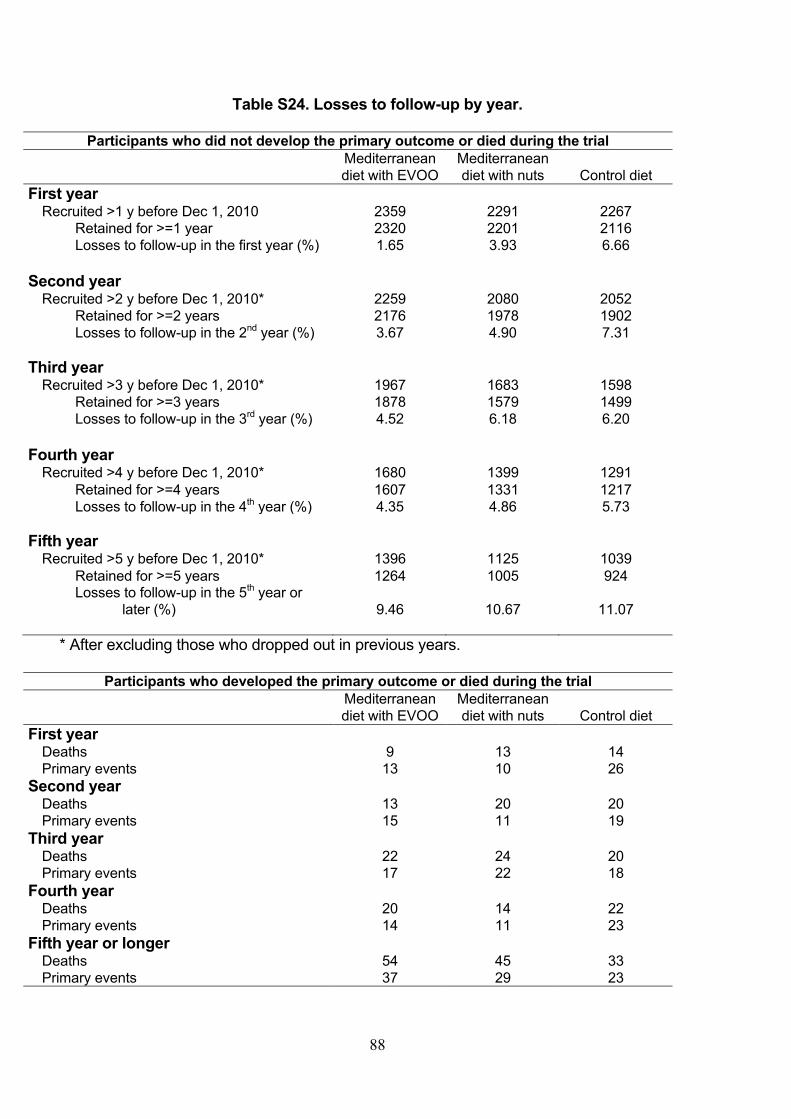
88
Table S24. Losses to follow-up by year.
Participants who did not develop the primary outcome or died during the trial
Mediterranean
diet with EVOO
Mediterranean
diet with nuts Control diet
First year
Recruited >1 y before Dec 1, 2010 2359 2291 2267
Retained for >=1 year 2320 2201 2116
Losses to follow-up in the first year (%) 1.65 3.93 6.66
Second year Recruited >2 y before Dec 1, 2010* 2259 2080 2052
Retained for >=2 years 2176 1978 1902
Losses to follow-up in the 2nd
year (%) 3.67 4.90 7.31
Third year
Recruited >3 y before Dec 1, 2010* 1967 1683 1598
Retained for >=3 years 1878 1579 1499
Losses to follow-up in the 3rd year (%) 4.52 6.18 6.20
Fourth year
Recruited >4 y before Dec 1, 2010* 1680 1399 1291
Retained for >=4 years 1607 1331 1217
Losses to follow-up in the 4th year (%) 4.35 4.86 5.73
Fifth year
Recruited >5 y before Dec 1, 2010* 1396 1125 1039
Retained for >=5 years 1264 1005 924
Losses to follow-up in the 5th year or
later (%) 9.46 10.67 11.07
* After excluding those who dropped out in previous years.
Participants who developed the primary outcome or died during the trial
Mediterranean
diet with EVOO
Mediterranean
diet with nuts Control diet
First year
Deaths 9 13 14
Primary events 13 10 26
Second year Deaths 13 20 20
Primary events 15 11 19
Third year
Deaths 22 24 20
Primary events 17 22 18
Fourth year Deaths 20 14 22
Primary events 14 11 23
Fifth year or longer
Deaths 54 45 33
Primary events 37 29 23
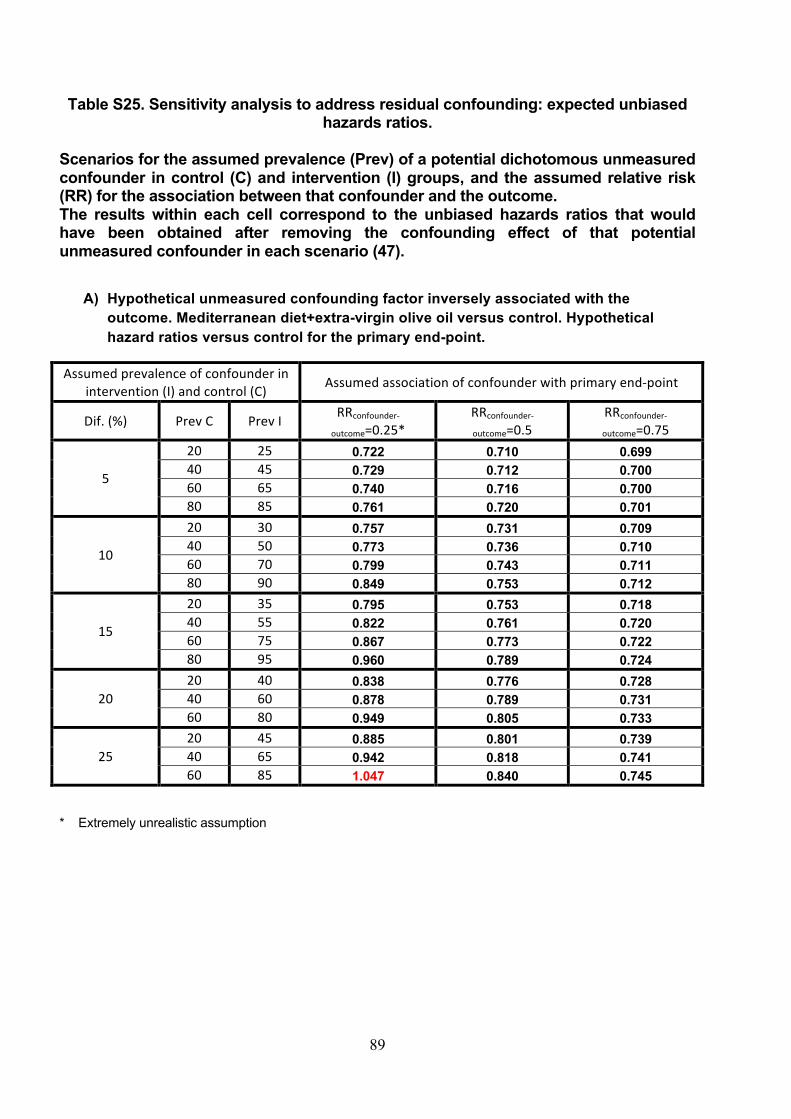
89
Table S25. Sensitivity analysis to address residual confounding: expected unbiased hazards ratios.
Scenarios for the assumed prevalence (Prev) of a potential dichotomous unmeasured confounder in control (C) and intervention (I) groups, and the assumed relative risk (RR) for the association between that confounder and the outcome. The results within each cell correspond to the unbiased hazards ratios that would have been obtained after removing the confounding effect of that potential unmeasured confounder in each scenario (47).
A) Hypothetical unmeasured confounding factor inversely associated with the
outcome. Mediterranean diet+extra-virgin olive oil versus control. Hypothetical hazard ratios versus control for the primary end-point.
Assumedprevalenceofconfounderinintervention(I)andcontrol(C) Assumedassociationofconfounderwithprimaryend-point
Dif.(%) PrevC PrevI RRconfounder-
outcome=0.25*RRconfounder-
outcome=0.5RRconfounder-
outcome=0.75
5
20 25 0.722 0.710 0.69940 45 0.729 0.712 0.70060 65 0.740 0.716 0.70080 85 0.761 0.720 0.701
10
20 30 0.757 0.731 0.70940 50 0.773 0.736 0.71060 70 0.799 0.743 0.71180 90 0.849 0.753 0.712
15
20 35 0.795 0.753 0.71840 55 0.822 0.761 0.72060 75 0.867 0.773 0.72280 95 0.960 0.789 0.724
2020 40 0.838 0.776 0.72840 60 0.878 0.789 0.73160 80 0.949 0.805 0.733
2520 45 0.885 0.801 0.73940 65 0.942 0.818 0.74160 85 1.047 0.840 0.745
* Extremely unrealistic assumption
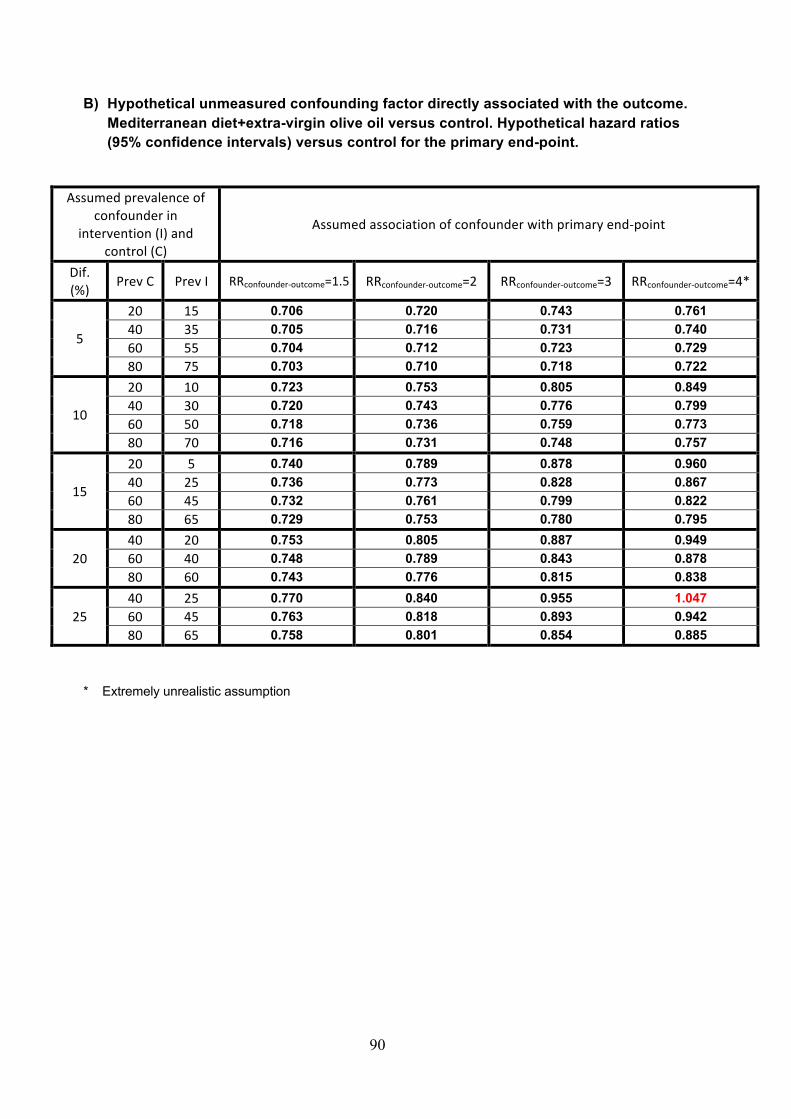
90
B) Hypothetical unmeasured confounding factor directly associated with the outcome. Mediterranean diet+extra-virgin olive oil versus control. Hypothetical hazard ratios (95% confidence intervals) versus control for the primary end-point.
Assumedprevalenceofconfounderin
intervention(I)andcontrol(C)
Assumedassociationofconfounderwithprimaryend-point
Dif.(%) PrevC PrevI RRconfounder-outcome=1.5 RRconfounder-outcome=2 RRconfounder-outcome=3 RRconfounder-outcome=4*
5
20 15 0.706 0.720 0.743 0.76140 35 0.705 0.716 0.731 0.74060 55 0.704 0.712 0.723 0.72980 75 0.703 0.710 0.718 0.722
10
20 10 0.723 0.753 0.805 0.84940 30 0.720 0.743 0.776 0.79960 50 0.718 0.736 0.759 0.77380 70 0.716 0.731 0.748 0.757
15
20 5 0.740 0.789 0.878 0.96040 25 0.736 0.773 0.828 0.86760 45 0.732 0.761 0.799 0.82280 65 0.729 0.753 0.780 0.795
2040 20 0.753 0.805 0.887 0.94960 40 0.748 0.789 0.843 0.87880 60 0.743 0.776 0.815 0.838
2540 25 0.770 0.840 0.955 1.04760 45 0.763 0.818 0.893 0.94280 65 0.758 0.801 0.854 0.885
* Extremely unrealistic assumption

91
C) Hypothetical unmeasured confounding factor inversely associated with the outcome. Mediterranean diet+nuts versus control. Hypothetical hazard ratios (95% confidence intervals) versus control for the primary end-point.
Assumedprevalenceofconfounderinintervention(I)andcontrol(C) Assumedassociationofconfounderwithprimaryend-point
Dif.(%) PrevC PrevI RRconfounder-
outcome=0.25*RRconfounder-
outcome=0.5RRconfounder-
outcome=0.75
5
20 25 0.753 0.741 0.73040 45 0.761 0.743 0.73060 65 0.773 0.747 0.73180 85 0.794 0.751 0.731
10
20 30 0.790 0.762 0.73940 50 0.806 0.768 0.74160 70 0.834 0.775 0.74280 90 0.886 0.785 0.743
15
20 35 0.830 0.785 0.75040 55 0.858 0.794 0.75160 75 0.905 0.806 0.75380 95 1.002 0.823 0.755
2020 40 0.874 0.810 0.76040 60 0.916 0.823 0.76260 80 0.990 0.840 0.765
2520 45 0.924 0.836 0.77140 65 0.983 0.853 0.77460 85 1.092 0.877 0.777
* Extremely unrealistic assumption
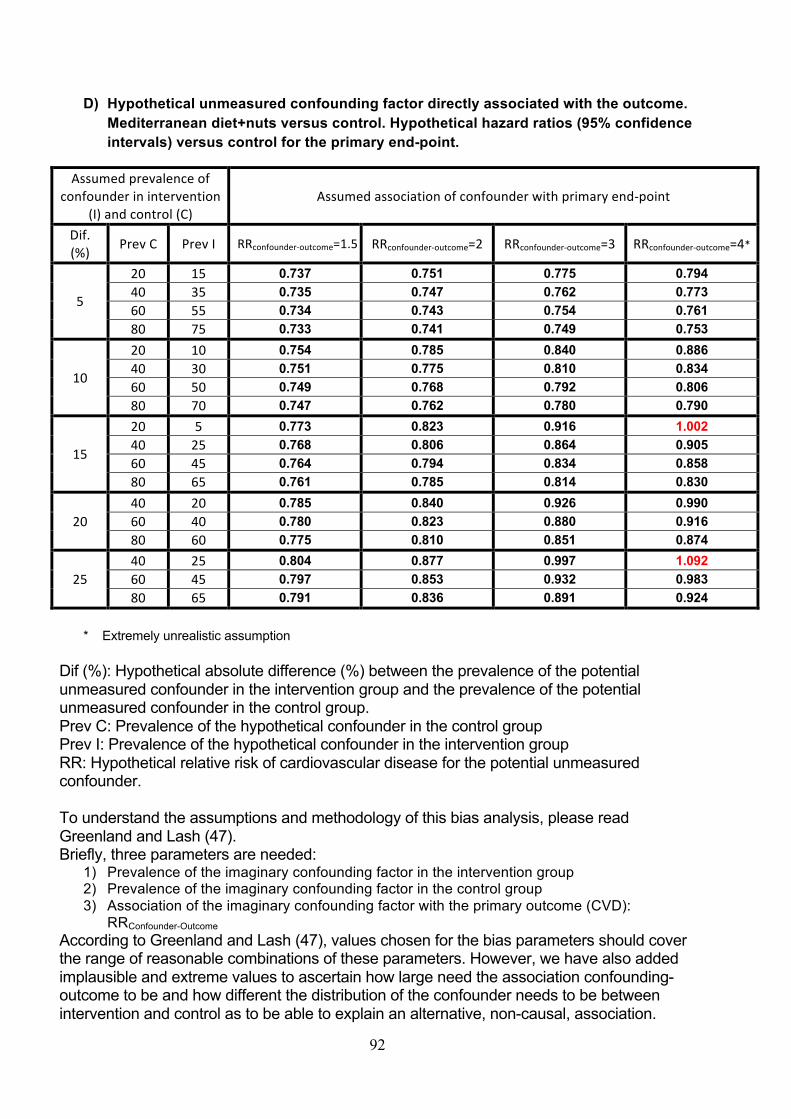
92
D) Hypothetical unmeasured confounding factor directly associated with the outcome. Mediterranean diet+nuts versus control. Hypothetical hazard ratios (95% confidence intervals) versus control for the primary end-point.
Assumedprevalenceofconfounderinintervention
(I)andcontrol(C)Assumedassociationofconfounderwithprimaryend-point
Dif.(%) PrevC PrevI RRconfounder-outcome=1.5 RRconfounder-outcome=2 RRconfounder-outcome=3 RRconfounder-outcome=4*
5
20 15 0.737 0.751 0.775 0.79440 35 0.735 0.747 0.762 0.77360 55 0.734 0.743 0.754 0.76180 75 0.733 0.741 0.749 0.753
10
20 10 0.754 0.785 0.840 0.88640 30 0.751 0.775 0.810 0.83460 50 0.749 0.768 0.792 0.80680 70 0.747 0.762 0.780 0.790
15
20 5 0.773 0.823 0.916 1.00240 25 0.768 0.806 0.864 0.90560 45 0.764 0.794 0.834 0.85880 65 0.761 0.785 0.814 0.830
2040 20 0.785 0.840 0.926 0.99060 40 0.780 0.823 0.880 0.91680 60 0.775 0.810 0.851 0.874
2540 25 0.804 0.877 0.997 1.09260 45 0.797 0.853 0.932 0.98380 65 0.791 0.836 0.891 0.924
* Extremely unrealistic assumption
Dif (%): Hypothetical absolute difference (%) between the prevalence of the potential
unmeasured confounder in the intervention group and the prevalence of the potential
unmeasured confounder in the control group.
Prev C: Prevalence of the hypothetical confounder in the control group
Prev I: Prevalence of the hypothetical confounder in the intervention group
RR: Hypothetical relative risk of cardiovascular disease for the potential unmeasured
confounder.
To understand the assumptions and methodology of this bias analysis, please read
Greenland and Lash (47).
Briefly, three parameters are needed:
1) Prevalence of the imaginary confounding factor in the intervention group
2) Prevalence of the imaginary confounding factor in the control group
3) Association of the imaginary confounding factor with the primary outcome (CVD):
RRConfounder-Outcome
According to Greenland and Lash (47), values chosen for the bias parameters should cover
the range of reasonable combinations of these parameters. However, we have also added
implausible and extreme values to ascertain how large need the association confounding-
outcome to be and how different the distribution of the confounder needs to be between
intervention and control as to be able to explain an alternative, non-causal, association.

93
DATA SHARING PLAN We will be happy to provide access to the Predimed dataset (including data dictionaries),
making possible the replication of the main analyses used for the present article. Due to the
restrictions imposed by the Informed Consent and the Institutional Review Board, bona fide
investigators interested in analyzing the Predimed dataset used for the present article may
submit a brief proposal and statistical analysis plan to the corresponding author. Upon
approval from the Predimed Steering Committee and Institutional Review Boards, the data
will be made available to them using an onsite secure access data enclave.
94
REFERENCES
1. Carlisle JB. Data fabrication and other reasons for non-random sampling in 5087
randomised, controlled trials in anaesthetic and general medical journals. Anaesthesia
2017;72:944-52.
2. Mascha EJ1, Vetter TR, Pittet JF. An Appraisal of the Carlisle-Stouffer-Fisher Method for
Assessing Study Data Integrity and Fraud. Anesth Analg 2017;125:1381-5.
3. Stouffer SA, Suchman EA, DeVinney LC, Star SA, Williams RM Jr. The American
Soldier, Vol. 1: Adjustment during Army Life. Princeton: Princeton University Press,
1949.
4. Minneboo M, Lachman S, Snaterse M, et al. RESPONSE-2 Study Group. Community-
Based Lifestyle Intervention in Patients With Coronary Artery Disease: The
RESPONSE-2 Trial. J Am Coll Cardiol 2017;70:318-327.
5. Rajaram S, Valls-Pedret C, Cofán M, et al. The Walnuts and Healthy Aging Study
(WAHA): Protocol for a Nutritional Intervention trial with walnuts on brain aging. Front
Aging Neurosci 2017;8:333.
6. Nigg Cr, Burbank PM, Padula C, et al. Stages of change across ten health risk
behaviors for older adults. Gerontologist 1999;39:473-82.
7. Myocardial infarction redefined. A consensus document of the Joint European Society of
Cardiology/American College of Cardiology Committee for the redefinition of myocardial
infarction. The Joint European Society of Cardiology/American College of Cardiology
Committee. J Am Coll Cardiol 2000;36:959-69.
8. The European Stroke Organisation (ESO) Executive Committee and the ESO Writing
Committee. Guidelines for Management of Ischaemic Stroke and Transient Ischaemic
Attack 2008. Cerebrovasc Dis 2008;25:457-507.
95
9. Morgenstern LB, Hemphil JC III, Anderson C, et al. Guidelines for the management of
spontaneous intracerebral hemorrhage. A Guideline for Healthcare Professionals from
the American Heart Association/American Stroke Association. Stroke 2010;41:2108-29.
10. Kidwell CS, Chadela JA, Saver JL, et al. Comparison of MRI and CT for detection of
acute cerebral hemorrhage. JAMA 2004;292:1823-30.
11. Zipes DP, Camm AJ, Borggrefe M, et al. ACC/AHA/ESC 2006 guidelines for
management of patients with ventricular arrhythmias and prevention of sudden cardiac
death. J AM Coll Cardiol 2006;48:247-346.
12. Maradit-Kremers H, Nicola PJ, Crowson CS, Ballman KV, Gabriel SE. Cardiovascular
death in rheumatoid arthritis. A population-based study. Arthritis Rheum 2005;52:722-
32.
13. Molist G, Barrio G, Santos S, et al. Quality deficits in the Spanish National Death Index:
lessons learned from studying the mortality of two cohorts of people admitted to drug
abuse treatment. Gac Sanit 2012;26:261-6.
14. Martin-Moreno JM, Alonso P, Claveria A, Gorgojo L, Peiró S. Spain: a decentralized
health system in constant flux. BMJ 2009;338:b1170.
15. Groenwold RH, Donders AR, Roes KC, Harrell FE Jr, Moons KG. Dealing with missing
outcome data in randomized trials and observational studies. Am J Epidemiol
2012;175:210-7.
16. Johnston BC, Guyatt GH. Best (but oft-forgotten) practices: intention-to-treat, treatment
adherence, and missing participant outcome data in the nutrition literature. Am J Clin
Nutr 2016;104:1197-1201.
17. Little RJ, D’Agostino R, Cohen ML, et al. The prevention and treatment of missing data
in clinical trials. N Engl J Med 2012;367:1355-60.
96
18. Robins JM, Finkelstein DM. Correcting for noncompliance and dependent censoring in
and AIDS clinical trial with inverse probability of censoring weighted (IPCV) log-rank
tests. Biometrics 2000;56:779-88.
19. Hernán MA, Hernández-Díaz S, Robins JM. A structural approach to selection bias.
Epidemiology 2004;15:615-25.
20. Raghunathan TE. What do we do with missing data? Some options for analysis of
incomplete data. Annu Rev Public Health 2004;25:99-117.
21. Carpenter JR, Kenward MG. Multiple imputation and its application. London: John Wiley
& Sons, 2013.
22. Thompson WA Jr. On the treatment of grouped observations in life studies. Biometrics
1977;33:463-70.
23. Robins JM, Finkelstein DM. Correcting for noncompliance and dependent censoring in
an AIDS Clinical Trial with inverse probability of censoring weighted (IPCW) log-rank
tests. Biometrics 2000;56:779-88.
24. Hernán MA, Robins JM. Per-protocol analyses of pragmatic trials. N Engl J Med
2017;377:1391-8.
25. Hernán MA, Hernández-Díaz S, Robins JM. Randomized trials analyzed as
observational studies. Ann Intern Med 2013;159:560-2.
26. Hernán MA, Robins JM. Causal inference. Boca Raton, FL: Chapman & Hall/CRC (in
press).
27. Panagiotakos DB, Pitsavos C, Polychronopoulos E, Chrysohoou C, Zampelas A,
Trichopoulou A. Can a Mediterranean diet moderate the development and clinical
progression of coronary heart disease? A systematic review. Med Sci Monit
2004;10:RA193-8.
97
28. de Lorgeril M, Salen P. The Mediterranean diet: rationale and evidence for its benefit.
Curr Atheroscler Rep 2008;10:518-22.
29. Roman B, Carta L, Martínez-González MA, Serra-Majem L. Effectiveness of the
Mediterranean diet in the elderly. Clin Interv Aging 2008;3:97-109.
30. Sofi F, Cesari F, Abbate R, Gensini GF, Casini A. Adherence to Mediterranean diet and
health status: meta-analysis. BMJ 2008;337:a1344.
31. Sofi F, Abbate R, Gensini GF, Casini A. Accruing evidence on benefits of adherence to
the Mediterranean diet on health: an updated systematic review and meta-analysis. Am
J Clin Nutr 2010;92:1189-96.
32. Tyrovolas S, Panagiotakos DB. The role of Mediterranean type of diet on the
development of cancer and cardiovascular disease, in the elderly: a systematic review.
Maturitas 2010;65:122-30.
33. Rees K, Hartley L, Flowers N, et al. 'Mediterranean' dietary pattern for the primary
prevention of cardiovascular disease. Cochrane Database Syst Rev 2013;8:CD009825.
34. Psaltopoulou T, Sergentanis TN, Panagiotakos DB, Sergentanis IN, Kosti R, Scarmeas
N. Mediterranean diet, stroke, cognitive impairment, and depression: A meta-analysis.
Ann Neurol 2013;74:580-91.
35. Widmer RJ, Flammer AJ, Lerman LO, Lerman A. The Mediterranean Diet, its
Components, and Cardiovascular Disease. Am J Med 2015;128:229-38.
36. Whayne TF Jr. Ischemic heart disease and the Mediterranean diet. Curr Cardiol Rep
2014;16:491.
37. Martinez-Gonzalez MA, Bes-Rastrollo M. Dietary patterns, Mediterranean diet, and
cardiovascular disease. Curr Opin Lipidol 2014;25:20-6. Erratum in: Curr Opin Lipidol.
2014;25:326.
98
38. Martínez-González MA, Dominguez LJ, Delgado-Rodríguez M. Olive oil consumption
and risk of CHD and/or stroke: a meta-analysis of case-control, cohort and intervention
studies. Br J Nutr 2014;112:248-59.
39. Kontogianni MD, Panagiotakos DB. Dietary patterns and stroke: a systematic review
and re-meta-analysis. Maturitas 2014;79:41-7.
40. Schwingshackl L, Hoffmann G. Monounsaturated fatty acids, olive oil and health status:
a systematic review and meta-analysis of cohort studies. Lipids Health Dis 2014;13:154.
41. Sofi F, Macchi C, Abbate R, Gensini GF, Casini A. Mediterranean diet and health status:
an updated meta-analysis and a proposal for a literature-based adherence score. Public
Health Nutr 2014;17:2769-82.
42. Liyanage T, Ninomiya T, Wang A, et al. Effects of the Mediterranean Diet on
Cardiovascular Outcomes-A Systematic Review and Meta-Analysis. PLoS One
2016;11:e0159252.
43. Grosso G, Marventano S, Yang J, et al. A comprehensive meta-analysis on evidence of
Mediterranean diet and cardiovascular disease: Are individual components equal? Crit
Rev Food Sci Nutr 2017;57:3218-32.
44. Rosato V, Temple NJ, La Vecchia C, Castellan G, Tavani A, Guercio V. Mediterranean
diet and cardiovascular disease: a systematic review and meta-analysis of observational
studies. Eur J Nutr 2017 Nov 25. [Epub ahead of print].
45. Martínez-González MÁ, Hershey MS, Zazpe I, Trichopoulou A. Transferability of the
Mediterranean Diet to Non-Mediterranean Countries. What Is and What Is Not the
Mediterranean Diet. Nutrients 2017;9:1226.
46. Dinu M, Pagliai G, Casini A, Sofi F. Mediterranean diet and multiple health outcomes: an
umbrella review of meta-analyses of observational studies and randomised trials. Eur J
Clin Nutr 2018;72:30-43.

99
47. Greenland S, Lash TL. Bias analysis. In: Rothman KJ, Greenland S, Lash TL, eds.
Modern epidemiology. 3rd ed. Philadelphia, PA, USA: Lippincott Williams & Wilkins,
2012:348-52.