neighbourhood change in halifax regional municipality...
TRANSCRIPT
Neighbourhood Change in Halifax Regional Municipality, 1970 to 2010: Applying the “Three Cities” Model
Victoria Prouse, Jill L Grant, Martha Radice, Howard Ramos, Paul Shakotko With assistance from Malcolm Shookner, Kasia Tota, Siobhan Witherbee January 2014

2 Neighbourhood Change in Halifax Regional Municipality,

3 Neighbourhood Change in Halifax Regional Municipality,
Neighbourhood Change in Halifax Regional Municipality, 1970 to 2010: Applying the “Three Cities” Model
Victoria Prouse, Jill L Grant, Martha Radice, Howard Ramos, Paul Shakotko
With assistance from Malcolm Shookner, Kasia Tota, Siobhan Witherbee [Three Cities data provided by J David Hulchanski and Richard Maraanen] The Neighbourhood Change Research Partnership is funded through a Partnership Grant from the Social Sciences and Humanities Research Council. The Halifax team has received valued contributions from community partners: United Way Halifax, Halifax Regional Municipality, and the Province of Nova Scotia (Community Counts). Visit the national project’s web site: http://neighbourhoodchange.ca/ Visit the Halifax project web site: http://theoryandpractice.planning.dal.ca/neighbourhood/index.html

4 Neighbourhood Change in Halifax Regional Municipality,
•
The Neighbourhood Change Research Partnership (NCRP) is conducting a national study comparing trends in individual incomes for a 30 to 40 year period in several Canadian cities. We seek to identify and interpret trends in income to determine whether socio-spatial polarization—a gap between rich and poor expressed in the geography of the city—has been increasing. In examining income trends from 1970 to 2005, Hulchanski (2010) concluded that the City of Toronto revealed a pattern of “Three Cities”. City #1 included predominantly higher income census tracts that saw average individual incomes rise compared to the Census Metropolitan Area (CMA) average over the years: the census tracts in this category tended to be centrally located and clustered near subway lines. City #3 included lower income census tracts where individual incomes declined relative to the city average over time: these areas clustered in the north east and north west of Toronto. Between those was City #2: mostly middle-income areas that stayed near the city average in individual income over time. Hulchanski (2010) found that the number of middle-income census tracts shrank over the period, while poverty generally moved from the centre of Toronto toward older suburban areas along the edges. The NCRP, which was founded after the release of the initial Toronto study, is examining comparable data to the Toronto case to consider the applicability of the “Three Cities” model to other Canadian cities. Reports have already been released on studies completed in Montreal (Rose and Twigge-Molecey, 2013) and Vancouver (Ley and Lynch, 2012); studies on Winnipeg, Calgary, and Halifax are in progress. In this report, we examine income trends in Halifax Regional Municipality to consider whether inequality and social polarization may be increasing or decreasing over time and to understand how patterns in incomes are spatially ordered in Halifax. We work with average individual incomes at the census tract level, and then draw on additional variables and knowledge of the urban context to assist in interpreting the results. For purposes of the analysis we define income inequality as implying
significant disparities in average individual income levels. Inequality is a relative condition, ranging from a limited difference in available resources to a considerable gap. Social polarization – a “vanishing middle class” (MacLachlan and Sawada, 1997, 384) – implies a pattern of increasing income inequality which results in growing numbers of census tracts with very high and very low individual income levels, and few tracts showing middle income levels: polarization may be localized or dispersed across an urban region. The NCRP is especially interested in identifying socio-spatial polarization: areas of cities where concentrations of individuals of very high and very low socioeconomic status contrast significantly at a neighbourhood scale. For that reason we are examining whether Three Cities appear in a range of Canadian cities, including Halifax. For the study reported here we analyze average individual income at census tract-level relative to the Halifax CMA average in the years 1970, 1980, 1990, 1995, 2000, 2005, and 2010. All income data derive from the Canadian Census of Population except for the 2010 information: to provide comprehensive income information for that year, the Toronto team obtained from Canada Revenue Agency’s Taxfiler Data. Since census tract boundaries have remained relatively constant since 1980, we use the census tract as a proxy for neighbourhood boundaries. In conducting the analysis, we considered several research questions:
• Is there income inequality in Halifax? If so, how has it changed over time?
• To what extent has income inequality increased in Halifax?
• Is there evidence for income polarization in Halifax from 1980 to 2010? If so, does it have a distinct spatial distribution?
• To what extent does the Three Cities model help explain Halifax’s changing geography of income distribution?
• What socioeconomic factors help account for changes in Halifax’s geography of income distribution?
EXECUTIVE SUMMARY

5 Neighbourhood Change in Halifax Regional Municipality,
At the census tract level, we found limited evidence of increasing income inequality or spatially concentrated social polarization in Halifax. Average individual incomes are lower in Halifax than in the other cities studied, but census tracts are less polarized. For instance, while the Toronto study identified some census tracts with very low average individual incomes, the Halifax data showed only a single census tract in one of the census years (2005) that fell into the “very low” income category. Income distribution certainly shifted between 1970 and 2010, but generally speaking the range of individual incomes and census tract averages in Halifax has been narrower than that found in other cities in the national study. In other words, Halifax has fewer very high income earners and very low income earners compared to other Canadian cities in the NCRP study. It may also have many census tracts inhabited by individuals with a broad range of income levels. Halifax Regional Municipality covers a diverse geographic area. Urban and suburban settlement is concentrated on the Halifax Peninsula and on the Mainland in Dartmouth and Bedford. In 2010 many census tracts on the Halifax Peninsula and in Bedford showed high average individual incomes, and the number of census tracts with individual incomes below the CMA average had declined from the situation in 1970. To a certain extent, average individual incomes in census tracts on the Halifax Peninsula seemed to be moving toward City #1of the Three Cities model: that is, they have higher than average income and increasing incomes. Some older areas revealed indications of gentrification, with extensive infilling of new condominium development bringing more affluent residents into formerly lower income districts. Explaining income trends in Bedford, however, requires an understanding of patterns of land ownership and development, political decisions about highway expansion, the distribution of employment opportunities in the region, and local cultural preferences. Off-Peninsula, the patterns of income change prove mixed and challenging to accommodate with the model developed from the City of Toronto experience. For instance, the distribution of stable, declining, middle, or lower income census
tracts reflects a unique geography and cultural history. Parts of the urban core and suburban districts with high proportions of public housing and rental accommodations showed low average individual incomes over the entire period studied. Some suburbs built after the 1950s declined relative to the CMA average over the years, while others held their ground: 1970s and 1980s-era developments have seen incomes decrease relative to the mean. Census tracts near particular bodies of water (such as the Northwest Arm) increased in average individual incomes, but those tracts also benefitted from easy proximity to universities, hospitals, and major parks. Tracts bordering other waterways showed no such pattern. Because of the fragmented development patterns generated by the geography of Halifax, it is not easy to summarize trends in a simple model. Although we were able to apply the Three Cities model to Halifax, we conclude that it is not a good fit. Our study findings generated more questions than answers. We hope to continue to explore related themes as we move to the next stages of the research. First, we conclude that the census tract may not be an appropriate proxy for neighbourhood in smaller cities like Halifax. Census tracts may not be the most effective scale to measure neighbourhood change in smaller cities. In Halifax, concentrations of low-income and high-income housing are relatively small and may be mixed within census tracts. In the next stages of our work we intend to examine Halifax data at the finer scale of the Dissemination Area to determine whether that analysis may reveal evidence of income inequality and polarization masked by the size of the census tract used here to investigate change. Second, we see the need to explore the varying trajectories of particular neighbourhoods in greater detail. We need to understand the effect of certain adjacencies, such as public housing and upscale condominium housing within neighbourhoods. We hope to gain insights into the nature of neighbourhood change through detailed neighbourhood studies.

6 Neighbourhood Change in Halifax Regional Municipality,
TABLE OF CONTENTS 1.0 Studying inequality in Halifax…………………………………………………………………
1.1 The “Three Cities” model …………………………………………………………… 1.2 Income inequality in urban Canada …………………………………………………… 1.3 Halifax: The character of the city……………………………………………………..
1.3.1 Historic context………………………………………………………… 1.3.2 Halifax during and between the wars………………………………….. 1.3.3 Post-war suburbanization ……………………………………………… 1.3.4 Urban renewal and slum clearance……………………………………… 1.3.5 Suburbanization continued……………………………………………… 1.3.6 Change and trends ……………………………………………………….
1.4 Amalgamation of Halifax Regional Municipality (HRM) ………………………… 1.5 Halifax today ………………………………………………………………………… 1.6 Neighbourhood Change in Halifax ……………………………………………………
2.0 Overview of income change and polarization in Halifax Regional Municipality, 1970-2010.. 2.1 Income distribution trends in Halifax, 1970-2010…………………………………… 2.2 The “Three Cities” of Halifax ……………………………………………………….
3.0 Understanding Halifax’s changing geography of income distribution 1970-2010………… 3.1 Analyzing neighbourhood change in Halifax through the Three Cities model ….. 3.2 Profile of Halifax’s “Three Cities”: Selected Characteristics……………………..
3.2.1 Population and Income ……………………………………………… 3.2.2 Housing tenure and affordability ……………………………………. 3.2.3 Education and employment …………………………………………. 3.2.4 Immigrants and visible minorities ………………………………….. 3.2.5 Transportation habits ………………………………………………..
3.3 Explaining income distribution trends on the Halifax Peninsula ………………… 3.4 Explaining income distribution trends in the Halifax suburbs (Off-Peninsula) …..
4.0 Discussing the findings …………………………………………………………………… 4.1 To what extent does income polarization exist in Halifax? …………………….. 4.2 To what extent does the “Three Cities” methodology aid our understanding of Halifax’s
changing geography of income? ……………………………………… 4.2.1 Scale and local context………………………………………………
5.0 Toward understanding neighbourhood change in Halifax ……………………………… 6.0 Works Cited………………………………………………………………………………

7 Neighbourhood Change in Halifax Regional Municipality,
LIST OF TABLES 1.1 Overview of population, area, income, age, and density……………………........................... 1.2 Halifax conditions in 1980 and 2010………………………………………………………….. 3.1 Percent of census tracts captured by different cut-offs ……………………………………….. 3.2 Proportion of census tracts and median age for Three Cities, 2010…………………………… 3.3 Some indicators of vulnerability (some 2005 and 2010) ……………………………………… 3.4 Movers during the past five years (1980 and 2005) …………………………………………… 3.5 Densities in the Three Cities, 1980 and 2010………………………………………………… 3.6 Housing characteristics in the Three Cities, 1980 to 2010……………………………………. 3.7 Housing costs in the Three Cities, 1980 to 2005 ……………………………………………… 3.8 Occupations and education, 1980-2005……………………………………………………….. 3.9 Immigrants and visible minorities in the Three Cities, 2005 …………………………………. 3.10 Modes of travel (2005) ……………………………………………..………………………… 5.1 Comparing percentage of census tracts experiencing 20% or greater change: Toronto and Halifax…………………………………………………………………………….
LIST OF FIGURES 1.1 Population growth by community……………………………………………………………… 1.2 HRM’s settlement areas ………………………………………………………………………. 1.3 Land use map of Halifax ………………………………………………………………………. 1.4 Some neighbourhoods in Halifax……………………………………………………………… 2.1 Distribution of census tracts by income category of individuals aged 15 and over, 1970-2010.. 2.2 Regional proportion of Halifax’s “Three Cities” ……………………………………………… 2.3 Population Proportion of Halifax’s “Three Cities” …………………………………………… 3.1 Average individual income by census tract, 1970……………………………………………… 3.2 Average individual income by census tract, 1980……………………………………………… 3.3 Average individual income by census tract, 1990……………………………………………… 3.4 Average individual income by census tract, 2000……………………………………………… 3.5 Average individual income by census tract, 2005……………………………………………… 3.6 Average individual income by census tract, 2010……………………………………………… 3.7 Change in census tract average individual income, 1980-2010………………………………... 3.8 Map of CT09…………………………………………………………………………………… 3.9 Anti-gentrification graffiti in the North End…………………………………………………… 3.10 Map of CT10…………………………………………………………………………………. 3.11 Suburban cartoon ……………………………………………………………………………. 4.1 Gini Coefficient for Canadian CMAs ………………………………………………………… 4.2 Changes in population density ……………………………………………………………….. 4.3 Settlement density of HRM, 2012……………………………………………………………. 4.4 Population growth nodes identified in the Regional Municipal Planning Strategy …………. 4.5 Future designated growth sites………………………………………………………………. 7.1 Average individual income by census tract, 1970…………………………………………….. 7.2 Average individual income by census tract, 1980……………………………………………..

8 Neighbourhood Change in Halifax Regional Municipality,
9 Neighbourhood Change in Halifax Regional Municipality,
1.0 STUDYING INEQUALITY IN HALIFAX Change is a constant in urban life. New neighbourhoods appear as a city grows, and older neighbourhoods change as people age and uses come and go. Concern about the character of neighbourhood change grew in the scholarly literature in recent years as cities have become more socially and spatially polarized (Bunting and Filion, 2001; Marcuse and Van Kempen, 2000). Divergence between the “haves” and “have-nots” increasingly characterizes relationships between and within countries, regions, cities, and neighbourhoods.
Cities in the 21st century are paradoxical by nature; they are the sites of unparalleled wealth production, yet also contain areas of unprecedented socioeconomic polarization and systemic poverty (Sassen, 1991). The global networks defining today’s economies inextricably link the fates of metropolitan areas and their residents to diverse local, national, and international forces. The cycle of accumulation spurs economic growth in particular geographic areas. A thriving region does not, however, guarantee prosperity for all residents. Disadvantaged individuals may find themselves increasingly vulnerable to economic fluctuations that restrict their residential, occupational, and educational choices.
1.1 The “Three Cities” model In 2010, the Cities Centre at the University of Toronto released the Three Cities of Toronto, a landmark report documenting socio-spatial patterns of income polarization in neighbourhoods in the City of Toronto relative to the Toronto Census Metropolitan Area (CMA) from 1970 to 2005 (Hulchanski, 2010). Using individual income to determine levels of income inequality, the study revealed a dichotomized landscape with significant decline in the number of middle-income neighbourhoods. The loss of the middle has intensified the growing gap between the city’s rich and poor areas. The report concluded that the degree of socio-spatial polarization in Toronto created conditions where low-income residents are limited in residential choice; upward market trends have restricted the access of less affluent Torontonians to neighbourhoods where high-income residents have access to robust services and community infrastructure.
Hulchanski (2010) produced a model to enhance understanding of the study findings: the model suggests that Toronto’s geography of income inequality is best conceptualized as “Three Cities within a City”. Three types of neighbourhoods reveal a highly demarcated spatial pattern that did not exist in 1970. “City #1” defines areas that increased in average individual income by more than 20% against the Toronto CMA average throughout the study period: in other words, these areas improved more than income grew in the city overall. “City #2” identifies census tracts that increased or decreased less than 20% more or less than the region: that is, they remained relatively stable near the CMA average. “City #3” represents census tracts that experienced a decline in average individual income of more than 20% against the CMA average: some of these tracts started out as high average incomes while others were low relative to the region, but over the period all fared poorly compared with growth in income in the city overall.
The Toronto study served as a springboard for broad questions relating to the nature of neighbourhood change in Canadian municipalities. For example, to what extent can the “Three Cities” model explain neighbourhood change and income inequality across the Canadian urban system? What local forces have propelled changes in income distribution? The Toronto research team identified the need for a Canada-wide comparative investigation of the patterns and processes of neighbourhood change. Studies were subsequently completed in Montréal (Rose and Twigge-

10 Neighbourhood Change in Halifax Regional Municipality,
Molecey, 2013) and Vancouver (Ley and Lynch, 2012) exploring changing income patterns in those cities. Following similar lines of inquiry established in the Montréal and Vancouver studies, our Halifax based research team began to investigate and explain neighbourhood change in Halifax Regional Municipality (HRM or Halifax).
In this report we provide an account of Halifax’s geography of income inequality over the period from 1970 to 2010. Our findings contribute to the body of knowledge on neighbourhood change in Halifax while also providing a case study for the comparative investigations of the NCRP. Neighbourhood change has been a concern in Halifax for many years, yet few researchers had tackled longitudinal or detailed case studies on the issue. The Neighbourhood Change Research Partnership provides an opportunity to investigate the trends and causes of Halifax’s changing geography of income distribution, to assess the goodness-of-fit of the Three Cities model for the Halifax context, and to instigate subsequent research on neighbourhood inequality and polarization in Halifax. By defining income inequality as the increasing dispersion of income levels in a particular area and income polarization as the degree of dispersion, we examine local, regional, national, and global factors that have influenced the patterns of neighbourhood transformation from 1970 to 2010 (but with particular attention on the period 1980 to 2010 in order to assure comparability of data).
1.2 Income inequality in urban Canada
The 2009 recession prompted renewed concern about the ramifications of urban income inequality. The momentum gained by the “Occupy” movement surprised many (Spiotta, 2012), exposing localized fractures across the urban system created by worldwide economic trends that produced a widening gap between rich and poor in global cities like London and New York. Walks (2011) noted that income inequality also increased in Canadian cities, with the country changing from being primarily middle-income in the mid-20th century to a bifurcated landscape of affluence and poverty by 2011.
Inequality is growing in Canada. The Organization for Economic Cooperation and Development suggested that Canada had the second-fastest growing Gini Coefficient of all member countries from the mid-1990s to mid-2000s (OECD, 2008). The Gini Coefficient measures the degree of income inequality: a high score indicates greater income disparity in the economy. Walks (2011) identified increasing socio-spatial disparity and inequalities at multiple scales of analysis in the country’s five largest cities. At the municipal level, income inequality directly influences individuals’ daily lives.
Two major factors transformed Canadian urban areas over recent decades (Bourne et al, 2011), revealing social, economic, and physical fault lines inscribed on the urban landscape. In the 1980s, austerity measures began to trickle down from the federal government. By the 1990s fiscal restraint had become the mainstream ethos informing municipal governance. Municipalities promoted efficiency through tax reductions and rolling back the social safety net.
Gentrification (i.e., the gradual process of neighbourhood change wherein affluent residents displace working-class populations in previously run-down inner city areas) and planned urban revitalization (where new development is deliberately introduced into older districts by public or para-public agencies) have contributed to neighbourhood change in urban Canada. That is, both gentrification and urban revitalization can create conditions in which affluent residents live nearby less affluent households. Over recent decades city living has increased in popularity for affluent residents eager to enjoy urban amenities and to avoid lengthy suburban commutes. Consequently, many inner city neighbourhoods have become vulnerable to upward market pressure on rent and living expenses. If

11 Neighbourhood Change in Halifax Regional Municipality,
more affluent households move into neighbourhoods, average incomes increase over time. If higher income households tend to locate in clusters apart from lower income households, then socio-spatial polarization may occur.
Kesteloot (2004) indicated that socio-spatial polarization occurs at different scales, with different implications across the urban system. Although Canadian municipalities experienced complex social, spatial, and economic restructuring in the second half of the 20th century, small and mid-size cities faced additional challenges. Filion and Gad (2006) found that the downtowns of mid-size cities suffered significantly greater economic decline than Canada’s larger cities during the era of urban renewal: the lack of a critical mass of capital and smaller markets caused suburban growth to shift traditional urban forms. Despite a positive correlation between city size and the degree of income inequality (Baum-Snow and Pavan, 2012), poverty also occurs in smaller metropolitan areas. The lack of extreme income levels may mask the severity or the character of the problem in smaller cities. Indeed, the Conference Board of Canada (2013) recently acknowledged that the precarious state of many of Canada’s smaller CMAs, which are regional rather than national centres, is a serious threat to the health of the Canadian urban system. Thus, examining Halifax’s unique history, culture, and socioeconomic conditions is crucial for understanding the city’s geography of income inequality and polarization.
1.3 Halifax: The character of the city 1.3.1 Historic context Halifax was founded in 1749 as a British naval base. Its geographic features make the site one of the largest natural harbours in the world. A glacial drumlin located in the centre of the Peninsula provided a special defensive advantage for the British and an ideal location for a citadel fortress, which overlooks the city, the harbour, and Bedford Basin. Charles Morris, Nova Scotia’s first chief surveyor, laid out Halifax’s grid using the British town planning model that gives downtown Halifax some of the narrowest streets and smallest blocks in North America. A year later, Dartmouth was established across the harbour; it developed as an industrial town and agricultural outpost for Halifax.
Halifax’s contemporary geography of income has longstanding historical roots. Expansion beyond Morris’ compact initial grid occurred as population rose steadily in the colony’s early years. The southern portion of the Peninsula became the location of colonial leaders’ expansive estates. Mansions were also built in the north end of the city along the waterfront, but that area quickly transformed to a thriving working class residential district with fine-grained local retail (Melles, 2003). In the far north of the Peninsula the African-Canadian settlement of Africville grew along the shore of the Bedford Basin in the 19th century, while another black settlement developed on the Dartmouth side of the harbour in the Prestons (Clairmont and Magill, 1987; Fingard et al, 1999; Nelson, 2008).
In the late-nineteenth century, the arrival of the electric streetcar in Halifax catalyzed the city’s geographic expansion (Gillis, 2007). Suburban communities developed off streetcar thoroughfares, such as Spring Garden Road, Quinpool Road, and Gottingen Street, which eventually emerged as main commercial streets. Willow Park, Windsor and Cunard, and Robie and Coburg streets became key corridors for early peninsular suburban development (Gillis, 2007).
Barrington Street, Halifax, NS.
12 Neighbourhood Change in Halifax Regional Municipality,
1.3.2 Halifax during and between the wars The mid-19th and early 20th century was an era of prosperity for Halifax with steady population increase and economic gains through shipbuilding and industry (Fingard et al, 1999). However, the city stagnated economically in the aftermath of the First World War. In December 1917 a collision between two ships, the Mont Blanc and the Imo, resulted in a massive explosion, which decimated the city’s North End, leaving 1500 dead, 9000 injured, and 6000 people without homes. Halifax’s southern districts were left relatively unscathed from the blast because they were protected by Citadel Hill.
The North End’s Richmond District (a working-class neighbourhood adjacent to the naval yards) was completely destroyed. Esteemed British planner Thomas Adams, employed by the federal Commission of Conservation, became involved in the plan to redevelop the area and house explosion victims (Simpson, 1985). With local architects, Adams helped design the Hydrostone District (completed in 1920), a compact neighbourhood inspired by the garden city planning model, and characterized by back service lanes, uniform row housing, and wide boulevards with tree-lined medians.
The physical expanse of Halifax and Dartmouth remained relatively constrained until the outbreak of World War II. WWII precipitated a population boom for the Halifax area (Fingard et al, 1999). Its location and industrial capacity allowed Halifax to prosper as a manufacturing hub and depot for war supplies, with Allied convoys forming in the Bedford Basin. Approximately 100,000 navy personnel were stationed in the city (White, 1991). Through assistance from Wartime Housing Limited (a federal Crown Corporation), local authorities responded to the population influx by building large swaths of prefabricated homes in the North End, Ardmore, and Dartmouth (Millward, 1983).
1.3.3 Post-war suburbanization Changes in federal policies towards housing, mortgage lending, and homeownership during the interwar years laid the foundation for significant postwar suburban expansion. The 1935 Dominion Housing Act (DHA) committed the federal government to supporting the housing sector by reducing the risk to mortgage lenders. The 1938 National Housing Act built upon the DHA framework by funding new public housing (CMHC, 2011). In 1946, the federal government established the Central (later Canada) Mortgage and Housing Corporation (CMHC), opening access to mortgage funds for the new housing stock being built. In 1954, CMHC implemented an insurance program for mortgage loans, making homeownership a feasible option for more households and thus stimulating suburban growth (Harris, 2004). A low-cost, uniform housing stock typified the postwar development landscape. Areas such as Kline Heights, Spryfield, and Fairview built in the post-war period are examples of developments that were financed through CMHC programs.
The opening of the MacDonald Bridge in 1955 linked Halifax to Dartmouth and facilitated suburbanization at an unprecedented rate and scale. From 1951 to 1961, Dartmouth’s population grew more than 210% (from 15,000 to 45,000). Dartmouth began to annex land, which fostered suburban expansion along the Eastern Shore. On the Halifax side of the harbour, Bayers Road and the Halifax Shopping Centre served as suburban magnets attracting growth.
1.3.4 Urban renewal and slum clearance Another area of urban policy that significantly changed the urban landscape in the second half of the 20th century was large-scale urban renewal (Filion and Bunting, 1990). Urban renewal reflected two motivations: to develop inner cores to ensure all properties were put to their “highest and best use”, thereby maximizing economic gains; and to mitigate the squalor that policymakers saw as the cause

13 Neighbourhood Change in Halifax Regional Municipality,
of social degeneration. In Halifax, urban renewal and suburbanization were mutually reinforcing. The 1945 Halifax Master Plan recommended slum clearance for several neighbourhoods. These recommendations were reiterated in the 1950 Master Plan, a 10-year strategy for redevelopment.
Using funds available under the 1956 National Housing Act, which encouraged communities to remove “blighted” areas and replace them with new growth, Halifax hired University of Toronto professor Gordon Stephenson to conduct a housing survey, review the state of the downtown, and offer recommendations for dealing with neighbourhoods requiring renewal. Completed in 1957, the Stephenson study – A Redevelopment Study of Halifax – received national recognition as “a model for many others to follow” (Grant and Paterson, 2012, 7). Stephenson linked social problems such as juvenile delinquency, alcoholism, and poverty to poor living conditions. He recommended the City clear slum areas. The city centre would become an area of commercial and office uses while the City should build modern public housing for those displaced. The study supported policy decisions that in some ways delineated Halifax’s contemporary geography of income and class.
Stephenson’s (1957) report focused on the mixed-use northern portion of the downtown where poverty was concentrated. From 1958-1963, the city excised blight by expropriating land, evicting residents, and destroying homes, factories, shops, and churches in the area. It exceeded Stephenson’s recommendations that 8.8 acres needed renewal, instead razing 16 acres of dense housing in the newly designated “Central Redevelopment Area” located at the northern end of the downtown (Pacey, 1979). Some 1,600 people were displaced. CMHC helped build large-scale, low-cost rental housing to house the increasing number of individuals unable to afford “decent, safe, and sanitary market rental housing” (CMHC, 2011, 130). Some residents displaced in the central city were re-housed in the newly built Mulgrave Park public housing project further north on the Peninsula, but others were left to find their own accommodations. The overall effect of the clearance of the central redevelopment area was to move poverty out of the urban core to pockets of public housing and to scattered sites of suburban low-rent housing.
Stephenson’s report called for a downtown mixed-use complex, which was achieved with the development of Scotia Square in 1967. The retail, office, and residential complex, connected by internal pedestrian walkways, represented a concerted attempt to subvert commercial and retail suburbanization trends. New housing built in the city centre aimed at smaller and more affluent households than those displaced with urban renewal.
The Stephenson Report provided evidence that supported the 1945 Master Plan’s recommendation to clear Africville and use the area for other purposes. Stephenson (1957) was concerned about poor living conditions in the area, and noted that the City would eventually want to redevelop the area for industrial and harbour operations.
In the late 1960s the City initiated a second round of clearance with the eviction of residents of Africville (Clairmont and Magill, 1987). Africville was a historic, informal, black settlement established by Black Loyalists following the War of 1812. Following national and international condemnation of racial segregation and concentrated poverty just outside the urban core, city council voted to provide funds to relocate residents and demolish what they saw as substandard homes. Some evicted residents moved into the newly built Uniacke Square public housing complex on Gottingen Street, while others found their own homes. The clearance of Africville left a lingering wound in Halifax. Calls to address racism and discrimination toward African Nova Scotians persist to this day (Nelson, 2008).
With the opening of the nearby bridge to Dartmouth in the 1950s, the renewal of the downtown and the construction of a large public housing development in the area in the 1960s, the Gottingen Street

14 Neighbourhood Change in Halifax Regional Municipality,
commercial district began a social and economic transition from one of Halifax’s busiest shopping streets to an area that came to be known for crime, vacancy, and poverty (Melles, 2003). The northern suburb of the early city had transitioned from an affluent neighbourhood in the early 19th century to an area of concentrated disadvantage by the 1970s. By the early 2000s, this part of the North End was described as Halifax’s “most feared neighbourhood” (Benjamin, 2010), but it also enjoyed a concentration of artists and musicians attracted by a low-rent area close to the city centre.
In 1969, the City had plans to demolish historic buildings along the waterfront to make way to build an urban expressway to port facilities at the end of the Peninsula. In 1970, the Cogswell Interchange—connecting Cogswell Street to several north-south streets—was completed. At that point, however, protests erupted and heritage advocates convinced city council to cancel the waterfront expressway (HRM, 2012). Heritage issues continue to play a major role in debates about intensification of residential and other uses in the downtown area. Large-scale renewal projects had, however, come to an end by 1971, and residential growth stalled in the city centre for several decades.
1.3.5 Suburbanization continued The 1963 Halifax Housing Survey or Coblentz Report (Coblentz, 1963) and the 1975 Regional Development Plan provided foundations for suburban development in the latter part of the 20th century. The survey identified sites for large-scale residential and industrial development. The provincial government subsequently purchased large tracts of land in designated areas. The regional plan encouraged planned satellite communities on conglomerations of government land: major suburban development projects resulted.
The Coblentz Report established the regulatory framework and resources required to facilitate as-of-right development in previously unregulated exurban and rural areas of Halifax County. It marked the province’s first attempt at implementing a regional land-use planning model in Halifax County. In 1969, the Province of Nova Scotia produced a new planning act, which sought to recognize that “regional planning is the key to effective, coordinated planning” and “the province had to play a stronger role in regional planning” (Grant, 1989, 275). Subsequently, the Metropolitan Area Planning Committee was formed. It received $2 million from the federal government’s Department of Regional Economic Expansion to facilitate regional planning in the area. The federal government promoted regional planning through a growth-pole development paradigm, characterized by the concentration of services in Halifax and Dartmouth. This focus contributed to the resource disparity between the Halifax area and the rest of Nova Scotia. Halifax and Dartmouth developed a strong industrial, service, and infrastructural base that favoured urban areas over rural (Grant, 1989).
Suburbanization gained momentum in this period. In 1969, the Municipality of the County of Halifax annexed Armdale, Fairview, Spryfield, and Rockingham. Between 1971 and 1996, suburban areas grew twice as rapidly as the city overall: their population increased by 68% (versus 31%). The rural-urban fringe grew four times as rapidly as the overall municipality (experiencing a population increase of 111%) (Millward, 2002, 40). In the 1970s, further impetus for suburban expansion came from major infrastructural projects: the MacKay Bridge (a second cross-harbour bridge linking the northern tip of the Halifax Peninsula to Dartmouth), Highway 102 / Bicentennial Drive, and the Dartmouth Circumferential Highway (Hwy 111). These capital projects strengthened suburban growth magnets for commercial decentralization. Dartmouth’s MicMac Mall was completed in 1973, and the 970-hectare Burnside Industrial Park grew rapidly following the opening of the bridge. Residential areas in Dartmouth (including the Albro Lake area and Crichton Park) and Clayton Park on the Halifax mainland grew concurrently with commercial expansion stimulated by infrastructure improvements.

15 Neighbourhood Change in Halifax Regional Municipality,
The Canadian Urban Institute (2012) suggested that regulations adopted in the 1970s to protect views, and hence limit heights in some areas of central Halifax and Dartmouth, may have stifled commercial growth downtown. A range of factors, including the cost of land and the availability of parking, played important roles in drawing developers to build office and retail complexes in the periphery. While the city centre remained the preferred location for companies building high-rise structures, many businesses that once saw central city locations as advantageous increasingly looked for lower rents in suburban office parks. Retail investment generally suburbanized. As people and jobs increasingly suburbanized, development of Halifax’s urban core slowed.
1.3.6 Change and trends Although high-income areas persisted in the South End of the Halifax Peninsula through the 20th and into the 21st century, other parts of the region experienced considerable neighbourhood change over time. Since the late 1950s, the region’s geography of housing developed such that new high-value housing located in suburban and exurban areas with attractive natural amenities and good access to highways. The unique constraints of Halifax’s peninsular layout have meant that large developments of low-value housing were also constructed on the urban fringe (Millward, 1983).
Policy shifts at various levels of government in the 1970s suggested a growing awareness of the need to assist declining areas and facilitate community engagement. The Neighbourhood Improvement Program (NIP) launched in 1975 helped residents plan to enhance community facilities and the public realm in select neighbourhoods: older districts with significant proportions of run-down properties. The Residential Rehabilitation Assistance Program offered residents loans and grants to improve homes in need of major repairs (Pomeroy, 2005). These programs worked concurrently to contribute to neighbourhood upgrading in the identified communities. In the 1970s, indications of changing neighbourhood conditions and types began to emerge in the central city. Halifax and Dartmouth both had several neighbourhoods funded for improvement through NIP to provide resources to address decline. NIP neighbourhoods subsequently experienced varying degrees of gentrification. Bunting and Millward (1999) noted renewed urban vitality in Halifax by the late 1970s. Ley (1986) distinguished Halifax as having the highest “gentrification index” among Canadian CMAs from 1971 to 19811. Millward and Davis (1986) pinpointed an important dynamic of Halifax’s neighbourhood change and residential renovation on the Peninsula, with two distinct types of transformation. Gentrification was concentrated in the South End. In the North End, Millward and Davis identified some gentrification but mostly incumbent upgrading – a process where physical improvement by residents occurs at a substantial rate with no significant change in the socioeconomic status or characteristics of the population.
The period from 1945 to the 1980s was a transformative era for Halifax, Dartmouth, and the surrounding area. Rapid growth and policy decisions that precipitated reordering of the city’s built form and social fabric created foundations which continue to influence Halifax’s contemporary geography of income.
1.4 Amalgamation of Halifax Regional Municipality (HRM)
On 1 April 1996, the province amalgamated the City of Halifax, City of Dartmouth, Town of Bedford, and Municipality of the County of Halifax to form Halifax Regional Municipality (HRM). The amalgamation realized an old idea. In 1974 Nova Scotia’s Royal Commission on Education, 1 Ley (1986) operationalized gentrification by measuring changing household social status through census data indicators (chiefly occupation, income, and education variables) at the census tract level.

16 Neighbourhood Change in Halifax Regional Municipality,
Public Services, and Provincial-Municipal Relations advocated a single municipality in the area (Sancton, 2005). In 1992, the province released its Report of the Task Force on Local Government. The report recommended a unitary government for Halifax County, where reallocation of services and administrative restructuring would permit efficient local government and yield financial benefits. HRM’s high-level governance model affected service provision at the neighbourhood level. In a jurisdiction where the urban core dominates the economy but the rural fringe constitutes a huge area, some tensions developed over access to services and amenities. Equitable division of community services, especially public transportation, can be challenging. HRM’s allocation of services may influence contemporary patterns of neighbourhood change.
1.5 Halifax today HRM (Halifax) covers an area larger than Prince Edward Island and comprises over 200 officially designated “communities” (Table 1.1), including fishing villages, farming communities, suburban districts, and urban centres. Halifax’s settlement patterns changed significantly over the latter part of the 20th century, and many formerly rural areas were absorbed into suburban Halifax. Figure 1.1 shows the proportion of the region’s population in different parts of HRM from 1871 onwards: it illustrates the rapid acceleration and expansion of development in fringe areas. Over the years, managing sprawl has proven to be a chronic problem for policymakers. For planning purposes, staff defined districts of the HRM into Regional Core, Suburban, and Rural (see Figure 1.2). The 2006 Regional Municipal Plan sought to reduce sprawl by channelling new growth over a 25-year period: 25% to the urban core, 50% to suburban areas, and 25% for rural areas. Recent evidence indicated the challenges HRM may face in meeting those targets. In the first five years after the plan was adopted, only 16% of new growth occurred in urban areas, while suburban areas (56%) and rural areas (28%) exceeded long-range targets (Our HRM Alliance, 2012). Figure 1.3 shows current land uses in HRM.
Table1.1: Overview of population, area, income, age, and density Population (2011) 390,328 (13th largest Canadian CMA) Land Area 5,495 km2 (4th largest Canadian CMA) Average Individual Income (2010) $41,877 Median Age (2011) 39.9 years (compared to the national average of 40.6 and
provincial average of 43.7) Population Density (2011) 71.1 persons per square kilometre
Source: Statistics Canada, 2013a
Figure 1.1 Proportional population growth in Halifax, 1871-2011 (Stantec, 2013)

17 Neighbourhood Change in Halifax Regional Municipality,
Income disparity may be less severe in Halifax than in other Canadian cities. Housing and property costs are cheaper in Halifax than in many larger Canadian cities. The cost of living is high, however. Halifax’s Consumer Price Index value for 2012 (using 2002 as the base year) at 123.8 was higher than in Toronto (121.8), Montréal (120.4), Winnipeg (119.9), and Vancouver (119.0) (Statistics Canada, 2013b). However, Halifax’s CPI is comparable to other Maritime cities including St. John’s (123.8), Charlottetown-Summerside (124.7), and Saint John (122.1) (Statistics Canada, 2013). In 2005, 14.3% of Halifax’s population was categorized as low-income before taxes. While this percentage is relatively low compared to Toronto’s (24.5%), Montréal’s (21.1%), and Vancouver’s (20.8%) populations, it is similar to that in smaller cities such as Victoria (13.2%), London (13.7%), and Saint John (14.7%). The City of Winnipeg, somewhat larger than Halifax, has a higher proportion (18.8%) of low-income residents (Statistics Canada, 2009).
Figure 1.2 HRM's Settlement Areas (Halifax Regional Municipality, 2006)
Figure 1.3 Land use map of Halifax CMA, 2012
18 Neighbourhood Change in Halifax Regional Municipality,
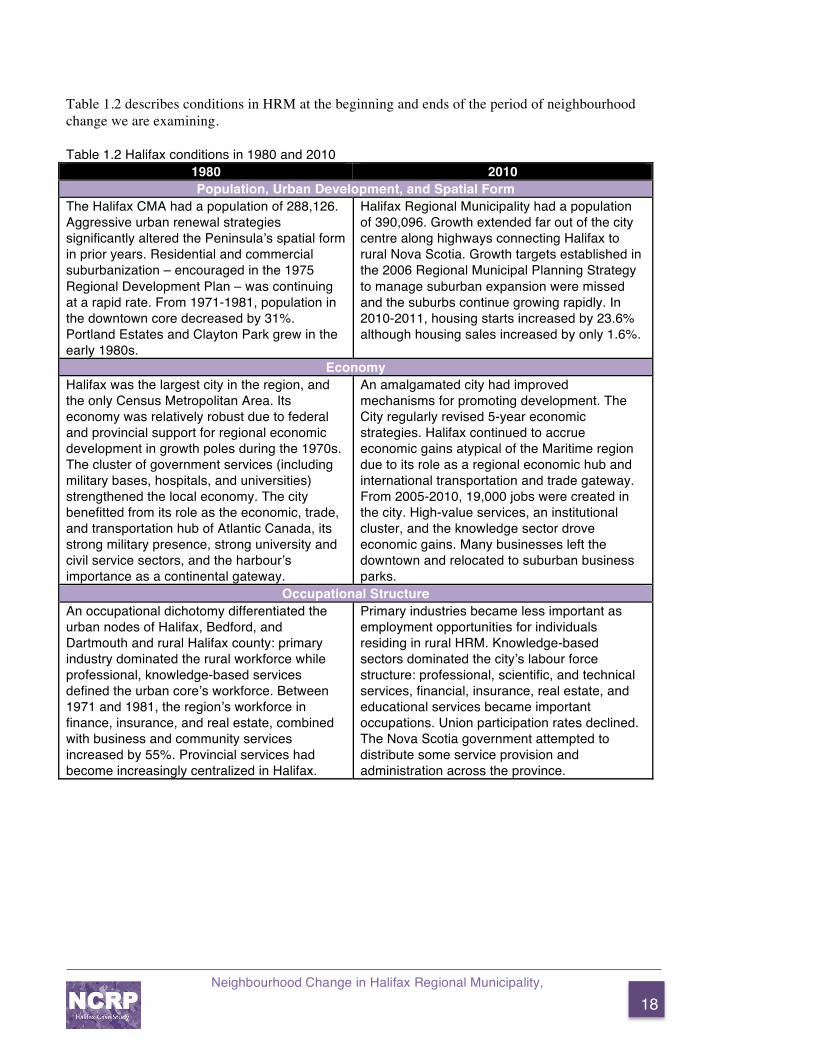
Table 1.2 describes conditions in HRM at the beginning and ends of the period of neighbourhood change we are examining.
Table 1.2 Halifax conditions in 1980 and 2010
1980 2010 Population, Urban Development, and Spatial Form
The Halifax CMA had a population of 288,126. Aggressive urban renewal strategies significantly altered the Peninsula’s spatial form in prior years. Residential and commercial suburbanization – encouraged in the 1975 Regional Development Plan – was continuing at a rapid rate. From 1971-1981, population in the downtown core decreased by 31%. Portland Estates and Clayton Park grew in the early 1980s.
Halifax Regional Municipality had a population of 390,096. Growth extended far out of the city centre along highways connecting Halifax to rural Nova Scotia. Growth targets established in the 2006 Regional Municipal Planning Strategy to manage suburban expansion were missed and the suburbs continue growing rapidly. In 2010-2011, housing starts increased by 23.6% although housing sales increased by only 1.6%.
Economy Halifax was the largest city in the region, and the only Census Metropolitan Area. Its economy was relatively robust due to federal and provincial support for regional economic development in growth poles during the 1970s. The cluster of government services (including military bases, hospitals, and universities) strengthened the local economy. The city benefitted from its role as the economic, trade, and transportation hub of Atlantic Canada, its strong military presence, strong university and civil service sectors, and the harbour’s importance as a continental gateway.
An amalgamated city had improved mechanisms for promoting development. The City regularly revised 5-year economic strategies. Halifax continued to accrue economic gains atypical of the Maritime region due to its role as a regional economic hub and international transportation and trade gateway. From 2005-2010, 19,000 jobs were created in the city. High-value services, an institutional cluster, and the knowledge sector drove economic gains. Many businesses left the downtown and relocated to suburban business parks.
Occupational Structure An occupational dichotomy differentiated the urban nodes of Halifax, Bedford, and Dartmouth and rural Halifax county: primary industry dominated the rural workforce while professional, knowledge-based services defined the urban core’s workforce. Between 1971 and 1981, the region’s workforce in finance, insurance, and real estate, combined with business and community services increased by 55%. Provincial services had become increasingly centralized in Halifax.
Primary industries became less important as employment opportunities for individuals residing in rural HRM. Knowledge-based sectors dominated the city’s labour force structure: professional, scientific, and technical services, financial, insurance, real estate, and educational services became important occupations. Union participation rates declined. The Nova Scotia government attempted to distribute some service provision and administration across the province.
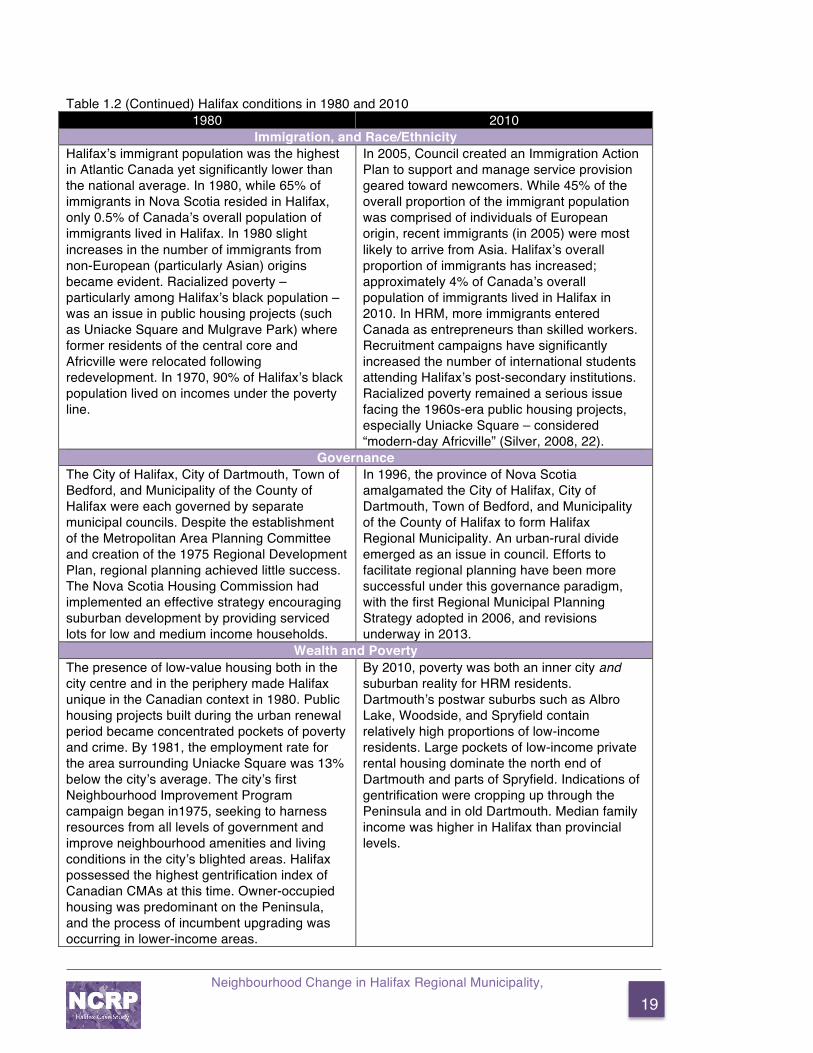
19 Neighbourhood Change in Halifax Regional Municipality,
Table 1.2 (Continued) Halifax conditions in 1980 and 2010 1980 2010
Immigration, and Race/Ethnicity Halifax’s immigrant population was the highest in Atlantic Canada yet significantly lower than the national average. In 1980, while 65% of immigrants in Nova Scotia resided in Halifax, only 0.5% of Canada’s overall population of immigrants lived in Halifax. In 1980 slight increases in the number of immigrants from non-European (particularly Asian) origins became evident. Racialized poverty – particularly among Halifax’s black population – was an issue in public housing projects (such as Uniacke Square and Mulgrave Park) where former residents of the central core and Africville were relocated following redevelopment. In 1970, 90% of Halifax’s black population lived on incomes under the poverty line.
In 2005, Council created an Immigration Action Plan to support and manage service provision geared toward newcomers. While 45% of the overall proportion of the immigrant population was comprised of individuals of European origin, recent immigrants (in 2005) were most likely to arrive from Asia. Halifax’s overall proportion of immigrants has increased; approximately 4% of Canada’s overall population of immigrants lived in Halifax in 2010. In HRM, more immigrants entered Canada as entrepreneurs than skilled workers. Recruitment campaigns have significantly increased the number of international students attending Halifax’s post-secondary institutions. Racialized poverty remained a serious issue facing the 1960s-era public housing projects, especially Uniacke Square – considered “modern-day Africville” (Silver, 2008, 22).
Governance The City of Halifax, City of Dartmouth, Town of Bedford, and Municipality of the County of Halifax were each governed by separate municipal councils. Despite the establishment of the Metropolitan Area Planning Committee and creation of the 1975 Regional Development Plan, regional planning achieved little success. The Nova Scotia Housing Commission had implemented an effective strategy encouraging suburban development by providing serviced lots for low and medium income households.
In 1996, the province of Nova Scotia amalgamated the City of Halifax, City of Dartmouth, Town of Bedford, and Municipality of the County of Halifax to form Halifax Regional Municipality. An urban-rural divide emerged as an issue in council. Efforts to facilitate regional planning have been more successful under this governance paradigm, with the first Regional Municipal Planning Strategy adopted in 2006, and revisions underway in 2013.
Wealth and Poverty The presence of low-value housing both in the city centre and in the periphery made Halifax unique in the Canadian context in 1980. Public housing projects built during the urban renewal period became concentrated pockets of poverty and crime. By 1981, the employment rate for the area surrounding Uniacke Square was 13% below the city’s average. The city’s first Neighbourhood Improvement Program campaign began in1975, seeking to harness resources from all levels of government and improve neighbourhood amenities and living conditions in the city’s blighted areas. Halifax possessed the highest gentrification index of Canadian CMAs at this time. Owner-occupied housing was predominant on the Peninsula, and the process of incumbent upgrading was occurring in lower-income areas.
By 2010, poverty was both an inner city and suburban reality for HRM residents. Dartmouth’s postwar suburbs such as Albro Lake, Woodside, and Spryfield contain relatively high proportions of low-income residents. Large pockets of low-income private rental housing dominate the north end of Dartmouth and parts of Spryfield. Indications of gentrification were cropping up through the Peninsula and in old Dartmouth. Median family income was higher in Halifax than provincial levels.
20 Neighbourhood Change in Halifax Regional Municipality,
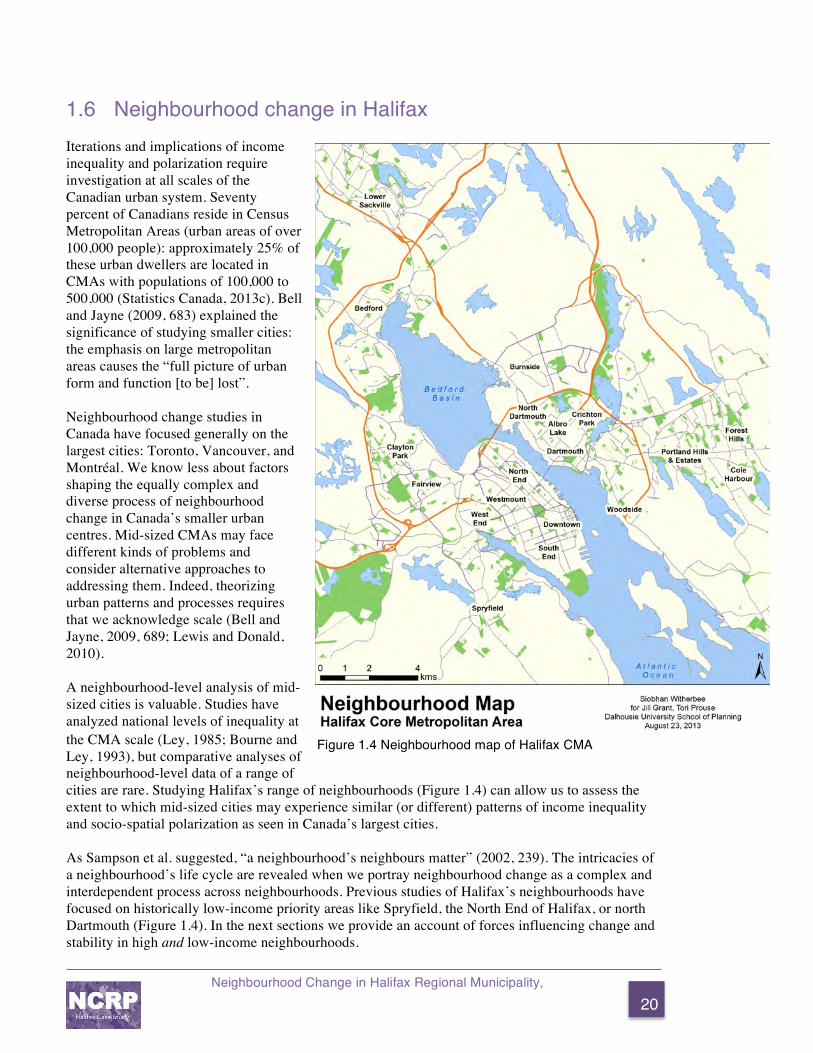
1.6 Neighbourhood change in Halifax Iterations and implications of income inequality and polarization require investigation at all scales of the Canadian urban system. Seventy percent of Canadians reside in Census Metropolitan Areas (urban areas of over 100,000 people): approximately 25% of these urban dwellers are located in CMAs with populations of 100,000 to 500,000 (Statistics Canada, 2013c). Bell and Jayne (2009, 683) explained the significance of studying smaller cities: the emphasis on large metropolitan areas causes the “full picture of urban form and function [to be] lost”.
Neighbourhood change studies in Canada have focused generally on the largest cities: Toronto, Vancouver, and Montréal. We know less about factors shaping the equally complex and diverse process of neighbourhood change in Canada’s smaller urban centres. Mid-sized CMAs may face different kinds of problems and consider alternative approaches to addressing them. Indeed, theorizing urban patterns and processes requires that we acknowledge scale (Bell and Jayne, 2009, 689; Lewis and Donald, 2010). A neighbourhood-level analysis of mid-sized cities is valuable. Studies have analyzed national levels of inequality at the CMA scale (Ley, 1985; Bourne and Ley, 1993), but comparative analyses of neighbourhood-level data of a range of cities are rare. Studying Halifax’s range of neighbourhoods (Figure 1.4) can allow us to assess the extent to which mid-sized cities may experience similar (or different) patterns of income inequality and socio-spatial polarization as seen in Canada’s largest cities. As Sampson et al. suggested, “a neighbourhood’s neighbours matter” (2002, 239). The intricacies of a neighbourhood’s life cycle are revealed when we portray neighbourhood change as a complex and interdependent process across neighbourhoods. Previous studies of Halifax’s neighbourhoods have focused on historically low-income priority areas like Spryfield, the North End of Halifax, or north Dartmouth (Figure 1.4). In the next sections we provide an account of forces influencing change and stability in high and low-income neighbourhoods.
Figure 1.4 Neighbourhood map of Halifax CMA

21 Neighbourhood Change in Halifax Regional Municipality,
2.0 OVERVIEW OF INCOME CHANGE AND POLARIZATION IN HALIFAX REGIONAL MUNICIPALITY, 1970-2010
2.1 Income distribution trends in Halifax, 1970-2010 The research team examined neighbourhood change at the regional level by analyzing average individual incomes at the census tract level. The resulting categories of CTs provide a framework for interpreting socioeconomic rise and decline within and across neighbourhoods, in relation to the average for the CMA as a whole. First, we indicate changes in overall census tract proportions. Subsequently, we discuss spatial patterns in the changes.
Based on protocols developed for the Toronto Three Cities project, we adopted the following categories for each interval from 1970 to 2010.2
• Census tracts with an average (mean) individual income more than 140% of the CMA average individual income (identified as “Very High income census tracts”)
• Census tracts with an average individual income 120 to 139.9% of the CMA average individual income (“High income tracts”)
• Census tracts with an average individual income 80-119.9% of the CMA average individual income (“Middle income tracts”)
• Census tracts with an average individual income 60-79.9% of the CMA average individual income (“Low income tracts”)
• Census tracts with an average individual income less than 59.9% of the CMA average individual income (“Very Low income tracts”)
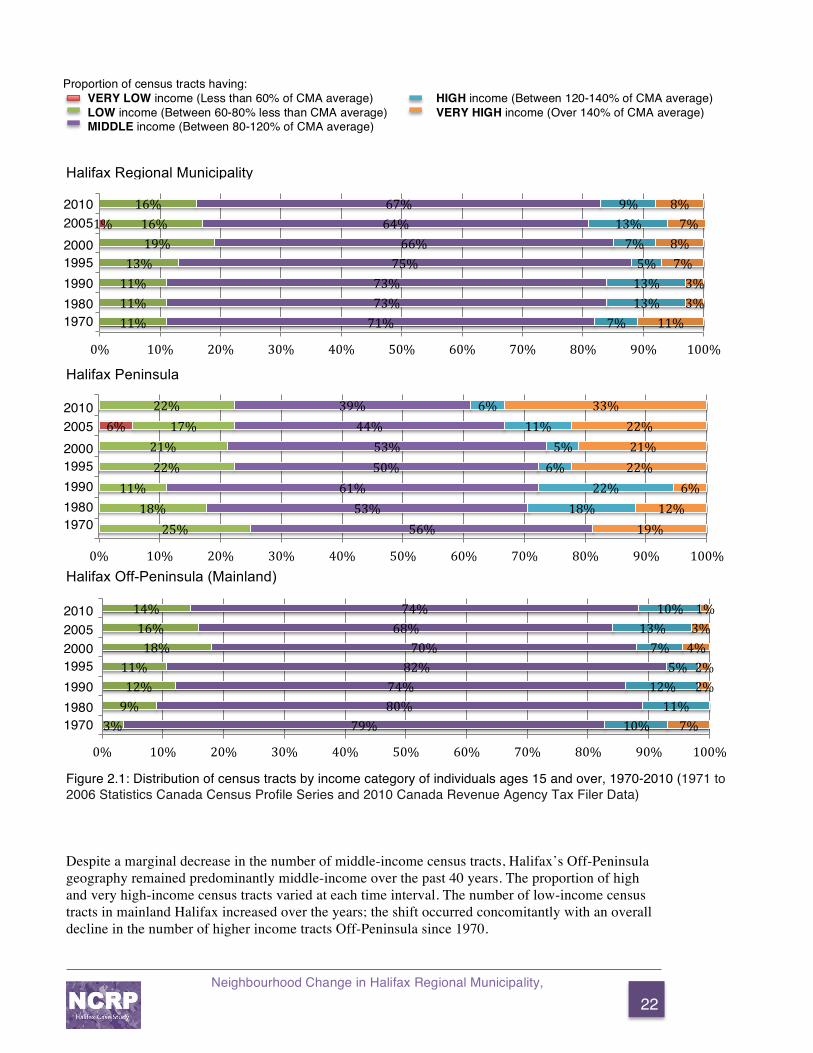
Figure 2.1 groups the information by geographic area, showing the changing proportions of census tracts falling under each income category in the HRM CMA, the Halifax Peninsula, and Off-Peninsula. Overall, the number of middle-income census tracts declined slightly in the CMA during the period. The ratio of “low” and “very low” census tracts to “high” and “very high” census tracts remained relatively constant. Halifax had more “high” and “very high” income census tracts in 1970 than in 2010. Given that the middle held its ground and very high tracts did not increase, the data do not provide strong indications of increasing income polarization in HRM. The Halifax Peninsula contains the greatest census tract diversity in the region. The proportion of middle-income census tracts decreased there, while census tracts categorized as having high and very high income levels increased. The fluctuation in the number of low-income census tracts on the Peninsula is large, ranging from 25% of peninsular census tracts in 1970 to a low of 11% in 1990. Many census tracts fall on the cusp of the income level that differentiates low and middle-income categories. HRM’s only “Very Low Income” designated census tract was identified on the Peninsula in 2005. CT10, containing Uniacke Square public housing complex, had an average individual income (57% of the CMA average) slightly below the upper boundary of the very low-income category (a cut-off of 60% of the CMA average).
2 Categories established by the Cities Centre, University of Toronto.
22 Neighbourhood Change in Halifax Regional Municipality,
Halifax Regional Municipality Halifax Peninsula Halifax Off-Peninsula (Mainland) Figure 2.1: Distribution of census tracts by income category of individuals ages 15 and over, 1970-2010 (1971 to 2006 Statistics Canada Census Profile Series and 2010 Canada Revenue Agency Tax Filer Data)
Despite a marginal decrease in the number of middle-income census tracts, Halifax’s Off-Peninsula geography remained predominantly middle-income over the past 40 years. The proportion of high and very high-income census tracts varied at each time interval. The number of low-income census tracts in mainland Halifax increased over the years; the shift occurred concomitantly with an overall decline in the number of higher income tracts Off-Peninsula since 1970.
3% 9% 12% 11%
18% 16% 14%
79% 80% 74% 82% 70%
68% 74%
10% 11%
12% 5%
7% 13%
10%
7%
2% 2% 4% 3% 1%
0% 10% 20% 30% 40% 50% 60% 70% 80% 90% 100%
1971 1981 1991 1996 2001 2006 2011
Proportion of census tracts having: VERY LOW income (Less than 60% of CMA average) HIGH income (Between 120-140% of CMA average) LOW income (Between 60-80% less than CMA average) VERY HIGH income (Over 140% of CMA average) MIDDLE income (Between 80-120% of CMA average)
6%
25% 18%
11% 22% 21%
17% 22%
56% 53%
61% 50% 53%
44% 39%
18% 22%
6% 5%
11% 6%
19% 12%
6% 22% 21% 22%
33%
0% 10% 20% 30% 40% 50% 60% 70% 80% 90% 100%
1971 1981 1991 1996 2001 2006 2011
1%
11% 11% 11% 13%
19% 16% 16%
71% 73% 73%
75% 66%
64% 67%
7% 13% 13% 5%
7% 13% 9%
11% 3% 3%
7% 8% 7%
8%
0% 10% 20% 30% 40% 50% 60% 70% 80% 90% 100%
1971 1981 1991 1996 2001 2006 2011 2010
2005
2000
1995
1990
1980
1970
2010
2005
2000
1995
1990
1980
1970
2010
2005
2000
1995
1990
1980
1970

23 Neighbourhood Change in Halifax Regional Municipality,
Considerable change occurred between 1990 and 1995. The proportion of middle-income census tracts declined on the Peninsula and increased in other areas. Suburban growth in Clayton Park West, expansion of the Portland Estates and development of Portland Hills and Lancaster Ridge neighbourhoods of Dartmouth, and wide-scale suburban development in the Bedford region influenced the geography of affluence.
Major fluctuations occurred from 1995 to 2000, when the number of middle-income census tracts decreased by 9% of the CMA’s overall average and approximately 12% of Off-Peninsula census tracts. The shift is likely explained by Halifax’s amalgamation in 1996; CMA boundaries expanded to absorb former Halifax Subdivisions (not counted in the CMA prior to 1996), and census tract boundaries were adjusted within HRM.
HRM may not be experiencing large increases in income polarization. However, socioeconomic geography changed markedly throughout the study period. A shift in the geography of income distribution in the region more accurately captures the nature of changes occurring in the city. Halifax’s overall shares of low, middle, and high-income census tracts remained relatively stable, but the spatial proportions of these groupings altered. Over the years, high and very-high income census tracts came to characterize greater areas of the Peninsula, and low-income census tracts increased Off-Peninsula, especially in North Dartmouth, Woodside, and the Spryfield area.
2.2 The “Three Cities” of Halifax
Figures 2.2 and 2.3 illustrate Halifax’s geography of individual income by census tracts through the “Three City” paradigm, indicating areas where relative individual income levels increased, decreased, and remained stable from 1980 to 2010. To reveal income trajectories, the model separates “City #3” into two categories. City #3–L includes census tracts experiencing income decline that have average incomes that were low or very low income in 2010: these lower income areas have declined over time. City #3–MH contains census tracts with income decline that were middle, high, or very high income in 2010: these are comfortable areas facing declining incomes. Halifax had a distinctively higher proportion of income decline in middle to very high-income census tracts than in low-income census tracts. Overall, most of Halifax’s census tracts are defined as “City #2”: these districts maintained relatively stable income levels throughout the study period. Figure 2.2 illustrates the aggregate groupings of census tracts by general geographic area, and Figure 2.3 displays the population distribution within each of Halifax’s “Three Cities” in 2010.
0.5882!
0.1333!
0.26!
0.3529!
0.4!
0.39!
0.0588!
0.1333!
0.11!
0!
0.3333!
0.24!
0%! 20%! 40%! 60%! 80%! 100%!
!PENINSULA!
!OFF-PENINSULA!
CMA OVERALL!
CITY #1: Income increase of 10% to 60% !
CITY #2: Income increase or decrease is less than 10%!
CITY #3-L: Income decrease of 10% to 26% and are low/very low income in 2010!
CITY #3-MH: Income decrease of 10% to 29% and are middle/high/very high income in 2010!
Figure 2.2 – Regional proportion of Halifax’s “Three Cities”

24 Neighbourhood Change in Halifax Regional Municipality,
Juxtaposing the census tract and population distribution of the Three Cities shown in Figures 2.2 and 2.3 reveals some differences in patterns. The income trajectories on the Peninsula demonstrate the disparity most effectively. Census tract proportions indicate that City #1 (improving incomes) occupies 59% of the Peninsula’s census tracts. City #2 (stable incomes) comprises 35% of the Peninsula’s census tracts. However, population counts reveal that City #1 contains only 40% of the Peninsula’s population, while City #2 comprises 52% of the Peninsula’s population. In other words, maps based on the census tract geography show larger areas of increasing wealth than would maps based on the location of individual income earners. As we consider how to interpret income inequality and polarization in Halifax we must remain cognizant of the kinds of patterns produced by the census geography.
40%! 15%!
21%!
52%!
38%!
41%!
8%!
11%! 10%!
36%! 28%!
0!
20000!
40000!
60000!
80000!
100000!
120000!
140000!
PENINSULA! OFF-PENINSULA!
CMA OVERALL!
CITY #1!
CITY #2!
CITY #3 - L!
CITY #3 - MH!
Figure 2.3: Population by CT of Halifax's "Three Cities", 2010
25 Neighbourhood Change in Halifax Regional Municipality,
3.0 UNDERSTANDING HALIFAX’S CHANGING GEOGRAPHY OF INCOME DISTRIBUTION 1970-2010
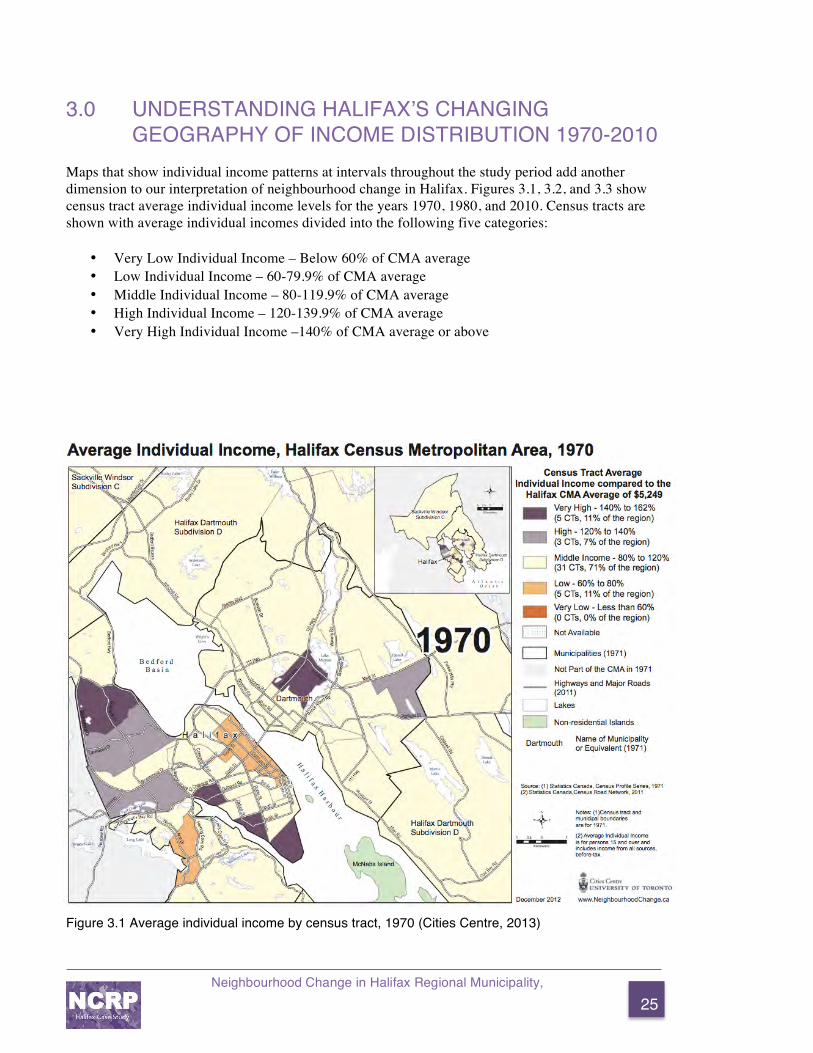
Maps that show individual income patterns at intervals throughout the study period add another dimension to our interpretation of neighbourhood change in Halifax. Figures 3.1, 3.2, and 3.3 show census tract average individual income levels for the years 1970, 1980, and 2010. Census tracts are shown with average individual incomes divided into the following five categories:
• Very Low Individual Income – Below 60% of CMA average • Low Individual Income – 60-79.9% of CMA average • Middle Individual Income – 80-119.9% of CMA average • High Individual Income – 120-139.9% of CMA average • Very High Individual Income –140% of CMA average or above
Figure 3.1 Average individual income by census tract, 1970 (Cities Centre, 2013)

26 Neighbourhood Change in Halifax Regional Municipality,
In 1970, incomes were distributed along a steady gradation throughout the Halifax CMA. On the Peninsula, the geography of income distribution echoed historic neighbourhood development. The affluent South End and the area near the Northwest Arm contained some of Halifax’s “very high income” CTs. North end Peninsula census tracts along the harbour were homogeneously low-income. The areas between these extremes were middle-income areas.
The census tracts encompassing then new suburbs of Crichton Park in Dartmouth and Rockingham on the Halifax mainland were also very high-income areas at this time. Other suburbs such as Woodlawn, Armdale, and the south part of Clayton Park were high-income areas. Generally, however, the suburban and exurban fringe of the region was in the middle income range.
Off-Peninsula, Spryfield (an area of farm and industrial land until residential growth in the postwar period) had average individual incomes in the “low-income” range. It contained a corridor of relatively low-rent apartments and a large number of small homes. By 1970, authorities had erected several large public housing projects through the city (Millward, 1983, 182): Mulgrave Park and Uniacke Square in the North End, Bayers Road in the western part of the city, Greystone in Spryfield, and along Victoria Road in Dartmouth near the MacDonald Bridge. Those areas contained pockets of disadvantage, often near middle-class neighbourhoods.
Figure 3.2 Average individual income by census tract, 1980 (Cities Centre, 2013)
27 Neighbourhood Change in Halifax Regional Municipality,
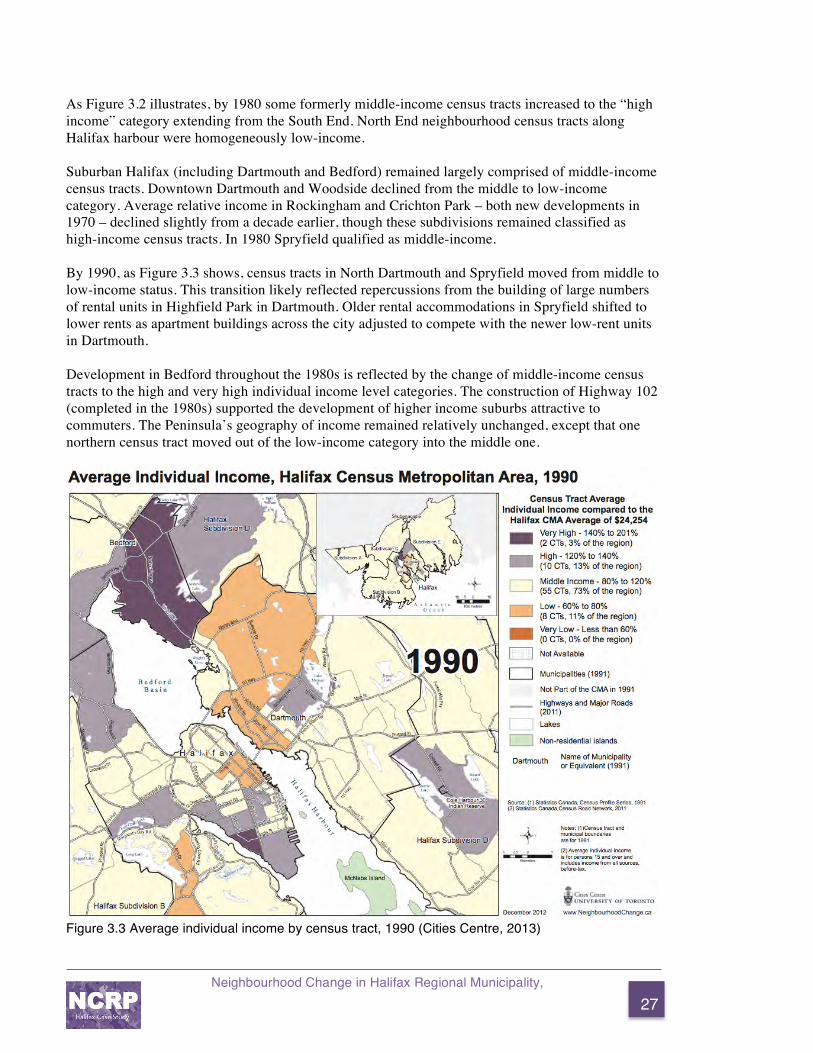
As Figure 3.2 illustrates, by 1980 some formerly middle-income census tracts increased to the “high income” category extending from the South End. North End neighbourhood census tracts along Halifax harbour were homogeneously low-income.
Suburban Halifax (including Dartmouth and Bedford) remained largely comprised of middle-income census tracts. Downtown Dartmouth and Woodside declined from the middle to low-income category. Average relative income in Rockingham and Crichton Park – both new developments in 1970 – declined slightly from a decade earlier, though these subdivisions remained classified as high-income census tracts. In 1980 Spryfield qualified as middle-income. By 1990, as Figure 3.3 shows, census tracts in North Dartmouth and Spryfield moved from middle to low-income status. This transition likely reflected repercussions from the building of large numbers of rental units in Highfield Park in Dartmouth. Older rental accommodations in Spryfield shifted to lower rents as apartment buildings across the city adjusted to compete with the newer low-rent units in Dartmouth. Development in Bedford throughout the 1980s is reflected by the change of middle-income census tracts to the high and very high individual income level categories. The construction of Highway 102 (completed in the 1980s) supported the development of higher income suburbs attractive to commuters. The Peninsula’s geography of income remained relatively unchanged, except that one northern census tract moved out of the low-income category into the middle one.
Figure 3.3 Average individual income by census tract, 1990 (Cities Centre, 2013)
28 Neighbourhood Change in Halifax Regional Municipality,
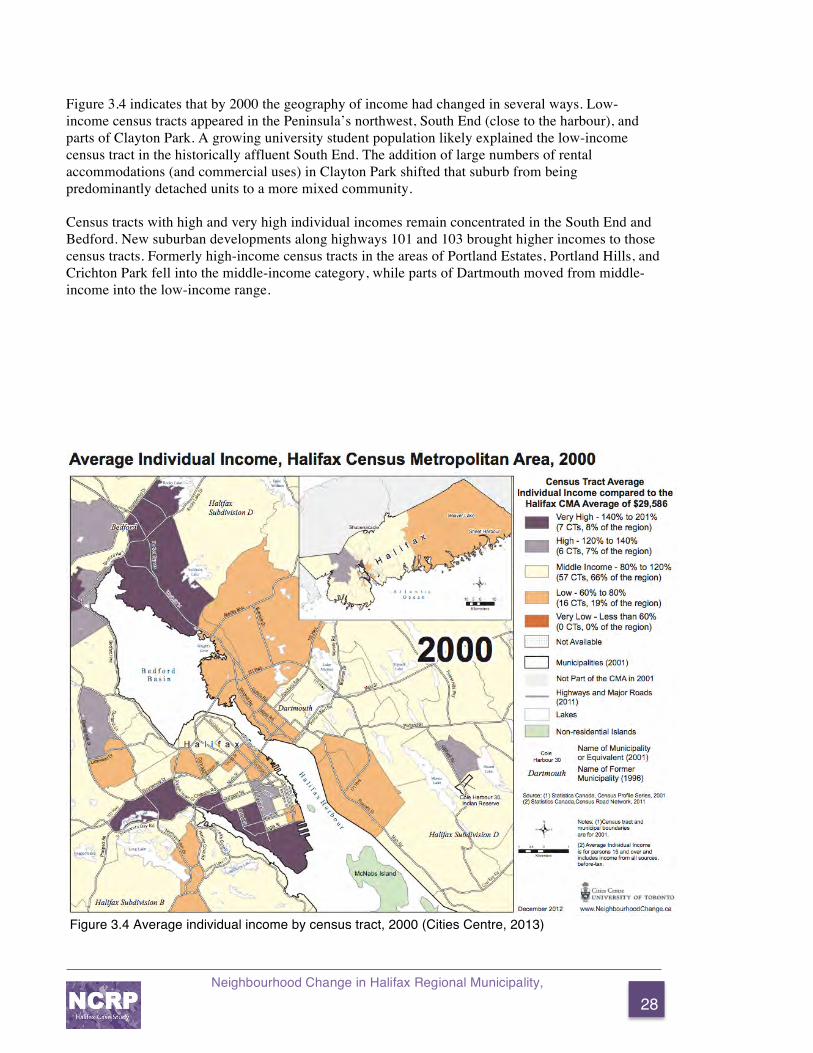
Figure 3.4 indicates that by 2000 the geography of income had changed in several ways. Low-income census tracts appeared in the Peninsula’s northwest, South End (close to the harbour), and parts of Clayton Park. A growing university student population likely explained the low-income census tract in the historically affluent South End. The addition of large numbers of rental accommodations (and commercial uses) in Clayton Park shifted that suburb from being predominantly detached units to a more mixed community. Census tracts with high and very high individual incomes remain concentrated in the South End and Bedford. New suburban developments along highways 101 and 103 brought higher incomes to those census tracts. Formerly high-income census tracts in the areas of Portland Estates, Portland Hills, and Crichton Park fell into the middle-income category, while parts of Dartmouth moved from middle-income into the low-income range.
Figure 3.4 Average individual income by census tract, 2000 (Cities Centre, 2013)
29 Neighbourhood Change in Halifax Regional Municipality,
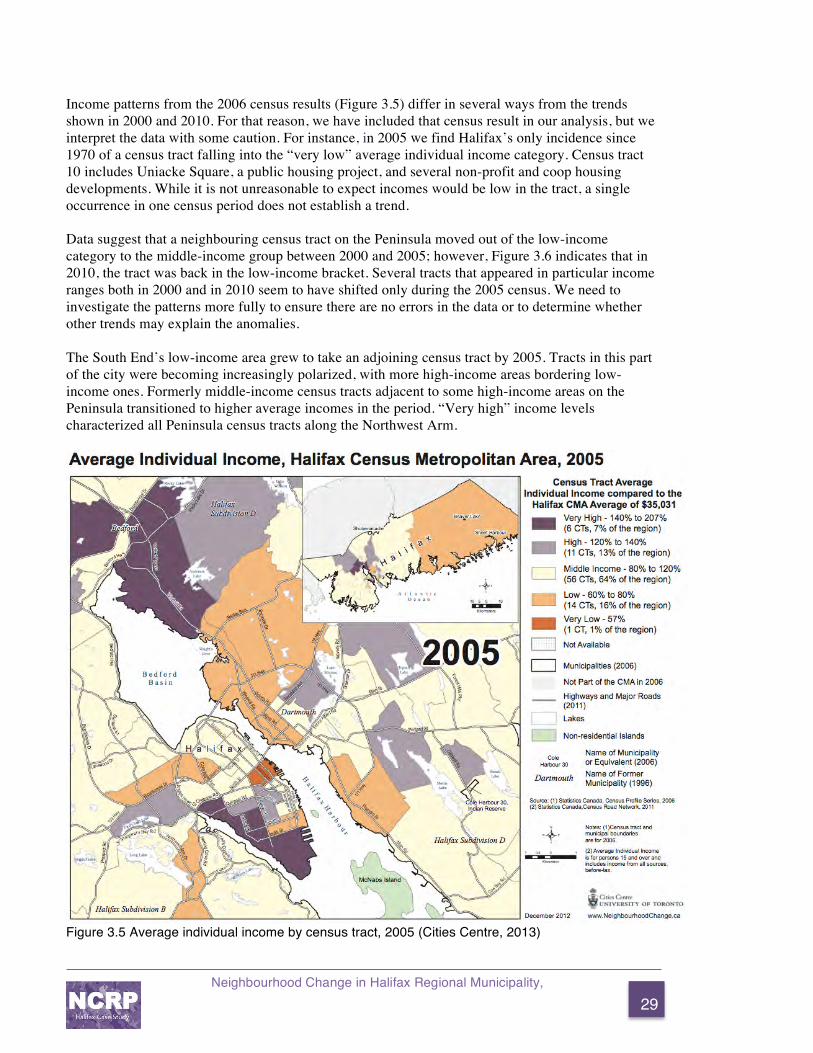
Income patterns from the 2006 census results (Figure 3.5) differ in several ways from the trends shown in 2000 and 2010. For that reason, we have included that census result in our analysis, but we interpret the data with some caution. For instance, in 2005 we find Halifax’s only incidence since 1970 of a census tract falling into the “very low” average individual income category. Census tract 10 includes Uniacke Square, a public housing project, and several non-profit and coop housing developments. While it is not unreasonable to expect incomes would be low in the tract, a single occurrence in one census period does not establish a trend. Data suggest that a neighbouring census tract on the Peninsula moved out of the low-income category to the middle-income group between 2000 and 2005; however, Figure 3.6 indicates that in 2010, the tract was back in the low-income bracket. Several tracts that appeared in particular income ranges both in 2000 and in 2010 seem to have shifted only during the 2005 census. We need to investigate the patterns more fully to ensure there are no errors in the data or to determine whether other trends may explain the anomalies. The South End’s low-income area grew to take an adjoining census tract by 2005. Tracts in this part of the city were becoming increasingly polarized, with more high-income areas bordering low-income ones. Formerly middle-income census tracts adjacent to some high-income areas on the Peninsula transitioned to higher average incomes in the period. “Very high” income levels characterized all Peninsula census tracts along the Northwest Arm.
Figure 3.5 Average individual income by census tract, 2005 (Cities Centre, 2013)
30 Neighbourhood Change in Halifax Regional Municipality,
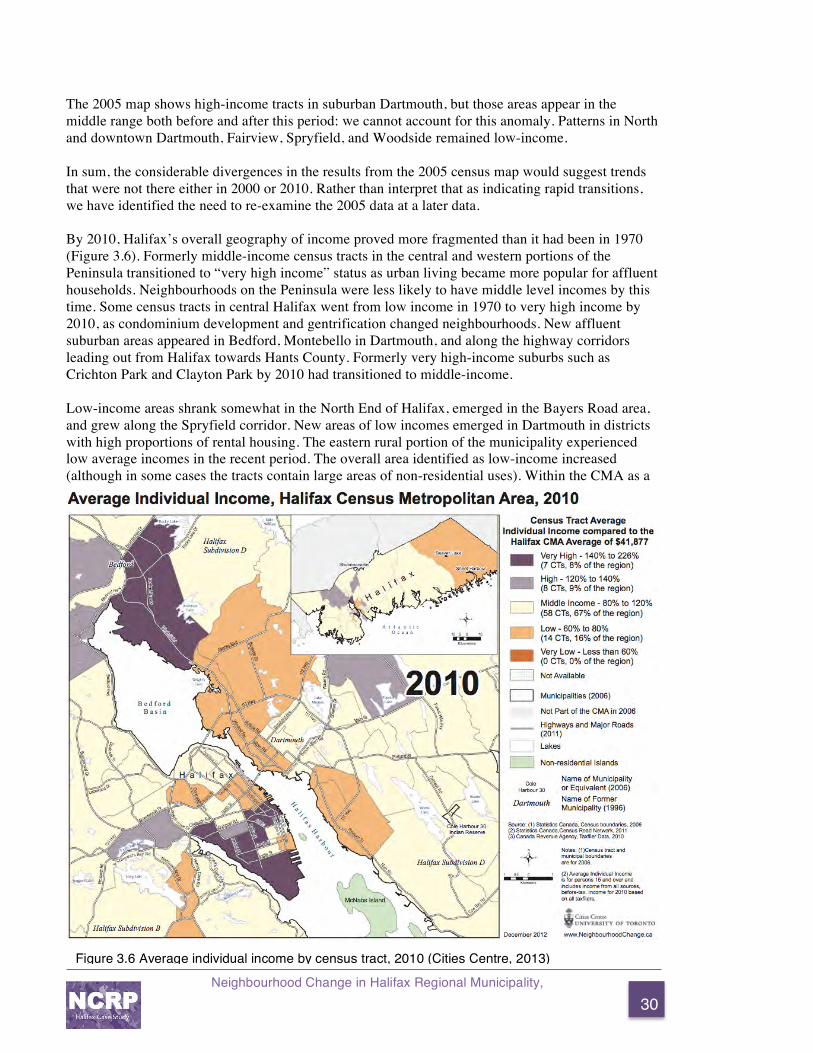
The 2005 map shows high-income tracts in suburban Dartmouth, but those areas appear in the middle range both before and after this period: we cannot account for this anomaly. Patterns in North and downtown Dartmouth, Fairview, Spryfield, and Woodside remained low-income. In sum, the considerable divergences in the results from the 2005 census map would suggest trends that were not there either in 2000 or 2010. Rather than interpret that as indicating rapid transitions, we have identified the need to re-examine the 2005 data at a later data. By 2010, Halifax’s overall geography of income proved more fragmented than it had been in 1970 (Figure 3.6). Formerly middle-income census tracts in the central and western portions of the Peninsula transitioned to “very high income” status as urban living became more popular for affluent households. Neighbourhoods on the Peninsula were less likely to have middle level incomes by this time. Some census tracts in central Halifax went from low income in 1970 to very high income by 2010, as condominium development and gentrification changed neighbourhoods. New affluent suburban areas appeared in Bedford, Montebello in Dartmouth, and along the highway corridors leading out from Halifax towards Hants County. Formerly very high-income suburbs such as Crichton Park and Clayton Park by 2010 had transitioned to middle-income.
Low-income areas shrank somewhat in the North End of Halifax, emerged in the Bayers Road area, and grew along the Spryfield corridor. New areas of low incomes emerged in Dartmouth in districts with high proportions of rental housing. The eastern rural portion of the municipality experienced low average incomes in the recent period. The overall area identified as low-income increased (although in some cases the tracts contain large areas of non-residential uses). Within the CMA as a
Figure 3.6 Average individual income by census tract, 2010 (Cities Centre, 2013)
31 Neighbourhood Change in Halifax Regional Municipality,
whole, however, the proportion of census tracts located in the low-income cluster decreased as suburbanization increased the total number of census tracts in the region.
A mosaic of census tracts with diverse income trajectories replaced the relatively simple income geography seen Off-Peninsula in 1970. New areas in Bedford, Keystone Village, and Fairmount had generally higher average individual incomes than districts built between 1970 and 1980. Thus we see that older suburban areas declined in average individual income toward the mean over time. Suburban growth and demographic transformations occurred in Bedford, Cole Harbour, and the Eastern Shore, dramatically altering these communities’ traditional form and character from what existed in 1970.
Analysis at the census tract level reveals the discontinuous nature of residential development Off-Peninsula. Until recently, much of mainland Halifax was rural in character. Development is constrained and fragmented by the geography of the region. Large numbers of lakes, outcrops of bedrock, acidic slates, and undulating topography makes infrastructure servicing difficult, and leaves large areas undeveloped. Prior to 1996 four separate jurisdictions were processing development permits and trying to ensure they got their fair share of growth: the process distributed suburban and exurban development widely. Such factors contributed to an urban geography that dispersed advantage and disadvantage in sometimes unpredictable patterns.
Areas defined as the “rural-urban fringe” grew four times more rapidly from 1971 to 1996 than the rest of the CMA (Millward, 2002, 40). Large portions of some census tracts remained clear of residential development as of 2013. Hence, we must draw conclusions about the changing income levels in residential neighbourhoods in suburban Halifax with caution.
3.1 Analyzing neighbourhood change in Halifax through the Three Cities model Figure 3.7 summarized changing average income patterns over the period from 1980 to 2010. Although we have income data for 1970, at that time much of the periphery of the city was not yet developed. Those areas transitioned from rural to suburban during the study period. To ensure better comparability of conditions within census tracts, the map instead illustrates transitions in income levels between 1980 and 2010. Using 1980 census tract boundaries, the map indicates whether census tracts increased or decreased in average individual income compared with the CMA average individual income as a whole. The map applies the Three Cities concept to Halifax. Areas shown in purple – City #1 – experienced increases in income of more than 10% against the city’s average: in 1980 some may have been low-income areas and some may have been high-income areas, but all rose against the city average by 2010. Just over one-quarter of census tracts fell in this category, largely in a horseshoe shape extending from the south part of the Peninsula into Bedford and the commuting fringe districts of the city. Areas in white—City #2—had remained within plus or minus 10% of the city-wide average over the 30 years. Almost 40% of census tracts fell in this category. Such districts proved relatively rare on the Peninsula, but were common in suburban and rural parts of HRM. Areas in brownish orange—City #3-L—were low-income areas in 2010 that had experienced declines in average individual incomes of more than 10% relative to their position in 1980. About 11% of census tracts-- including parts of the Bayers Road area, Dartmouth, and Spryfield-- fell into

32 Neighbourhood Change in Halifax Regional Municipality,
this category. Many of the districts contain large parcels of public housing or affordable rental units. Some areas have modest homes built in the 1940s and 1950s. Areas in tan—City #3-MH—were middle or high-income areas in 2010 that experienced declines in individual income of more than 10% against the city average since 1980. These included large areas of Dartmouth, Cole Harbour, and Clayton Park. Many census tracts are post-war suburbs with households that aged over the years. Six census tracts that had middle and high-average individual incomes in 1980 experienced income decline greater than 10% against the average; three low-income census tracts experienced such decline by 2010. Clayton Park contained the census tract with the greatest magnitude of income decrease: extensive development of multi-family housing in the area over the last decade likely accounted for much of the change.
Applying the Three Cities model reveals some spatial patterns of income rise and decline across the CMA between 1980 and 2010. In general it appears that neighbourhoods on the Peninsula gained in average individual income against the Halifax mean: low-income census tracts grew less common and more isolated. Fringe areas gained in average income against the mean as they transitioned from rural to suburban status. Postwar suburban areas off the Halifax Peninsula appeared more likely to be declining in income against the city average, with the exception of Bedford, which transitioned to a high-income area as the small town developed popular new suburbs.
Change in Census Tract Average Individual Income, 1980-2010
Halifax Census Metropolitan Area
Source: (1) Statistics Canada, Census Profile Series, 1981
(2) Canada Revenue Agency, Taxfiler data, 2010
March 2013
1980-2010
H a l i f a x
www.NeighbourhoodChange.ca
Municipalities (1981)
Highways and Major Roads
(2011)
Not Available in 1980 or 2010
Lakes
Not Part of the CMA in 1981
B e d f o r d B a s i n
H a l i f a x H a r b o u r
Dartmouth
Bedford
Halifax Subdivision B
Cole Harbour 30,
Indian Reserve
Dartmouth
Halifax
Subdivision D
Name of Municipality
or Equivalent (1981)
Halifax Subdivision D
Non-residential Islands
1 0 10.5
Kilometers
Windmill Rd
Akerley Blvd
111 Hwy
Victoria Rd Woodlan
d Ave
111 Hwy
Portland St
Main St
Pleasant St
Main Rd
Caldwell Rd
Bicen
tennia
l Dr
Bicentennial Dr
Hollis StRobie St
North S
t
Barrington St
Quinpool RdChebucto Rd
Inglis StSouth St
Novalea Dr
Bicentennial Dr
Rock
y Lak
e Dr
Burnside Dr
Windmill Rd
McNabs Island
Northwest Arm Dr
Purcell's Cove R
d
Connaugh t Ave
Barrington St
Gottingen StBaye
rs Rd Young
St
Wav
erly
Rd118 H
wy
Wyse Rd
Ochterlo
ney St
Prince
Albert Rd
Cow Bay Rd
103 Hwy
Lacewoo d Dr
Dunba ck S t
Bedfo
rd Hw y
Pros
pect
Rd
Brae
mar D
r
Forest Hi lls P ky
Bedford Bypass
B edfor d Hwy
Oxford St
Jos eph Howe Dr
Williams Lak e Rd
Herring C ove Rd
111 Hwy
Bell Rd
Long Lake
St Margaret's Bay RdFirst C
hain Lake
Williams Lake
Morris Lake
BissettLake
TopsailLake
LakeMicmac
AndersonLake
Rocky Lake Lake William
Ragged Lake
Wright's Cove
10 0 105
KilometersA t l a n t i c
O c e a n
Subdivision E
Subdivision C
Subdivision A
Subdivision B
Halifax
Shubenacadie
Dartmouth
Notes: (1)Census tract and municipal
boundaries are for 1981. Analysis
excludes CT that have no income
available for 1980 or 2010.
(2) Average Individual Income in 1980
is for persons 15 and over and includes
income from all sources, before-tax.
Income in 2010 is for all taxfilers and
includes income from all sources,
before-tax.
Change in Census Tract Average
Individual Income as a percentage of the
Halifax CMA Average, 1980-2010
Income Increase of 10% to 60%
(26% of the region's CTs)
Income Increase or Decrease is
Less than 10%
(39% of the region's CTs)
Income Decrease of 10% to 26%
and are low/very low income
in 2010 (11% of the region's CTs)
City #1
City #2
City #3-L
Income Decrease of 10% to 29%
and are middle/high/very high
income in 2010
(24% of the region's CTs)
City #3-MH
Figure 3.7 Change in census tract average individual income, 1980-2010
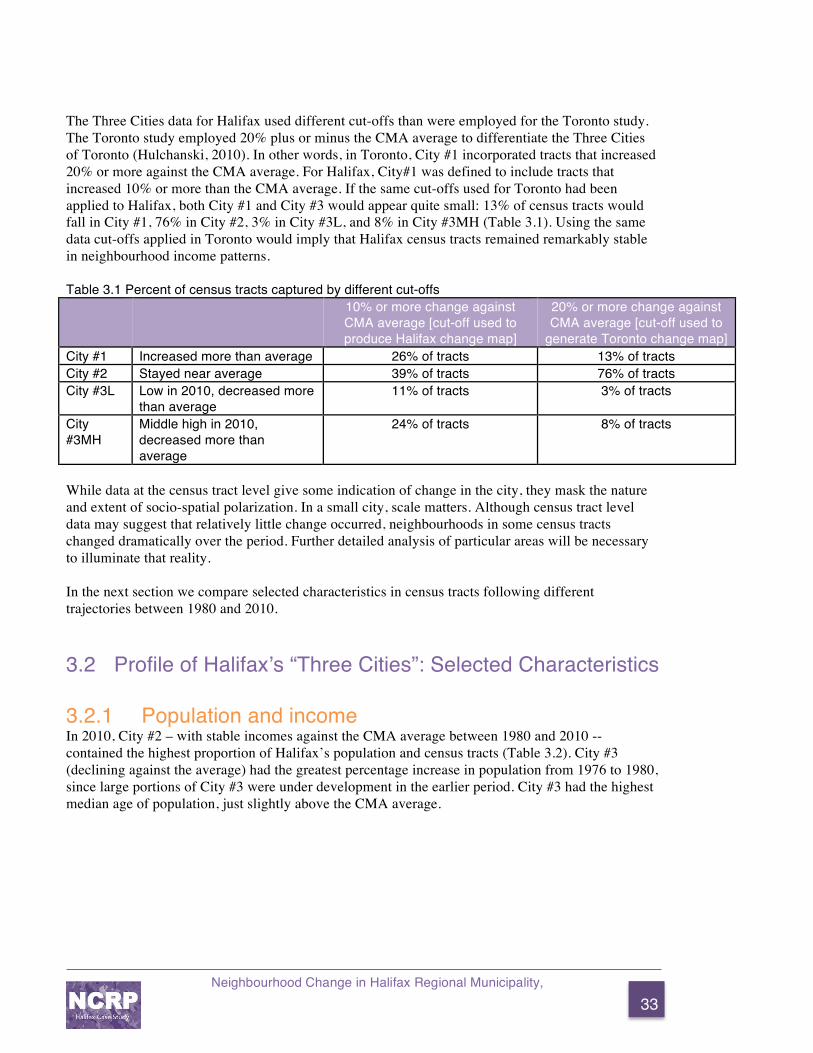
33 Neighbourhood Change in Halifax Regional Municipality,
The Three Cities data for Halifax used different cut-offs than were employed for the Toronto study. The Toronto study employed 20% plus or minus the CMA average to differentiate the Three Cities of Toronto (Hulchanski, 2010). In other words, in Toronto, City #1 incorporated tracts that increased 20% or more against the CMA average. For Halifax, City#1 was defined to include tracts that increased 10% or more than the CMA average. If the same cut-offs used for Toronto had been applied to Halifax, both City #1 and City #3 would appear quite small: 13% of census tracts would fall in City #1, 76% in City #2, 3% in City #3L, and 8% in City #3MH (Table 3.1). Using the same data cut-offs applied in Toronto would imply that Halifax census tracts remained remarkably stable in neighbourhood income patterns.
Table 3.1 Percent of census tracts captured by different cut-offs 10% or more change against
CMA average [cut-off used to produce Halifax change map]
20% or more change against CMA average [cut-off used to
generate Toronto change map] City #1 Increased more than average 26% of tracts 13% of tracts City #2 Stayed near average 39% of tracts 76% of tracts City #3L Low in 2010, decreased more
than average 11% of tracts 3% of tracts
City #3MH
Middle high in 2010, decreased more than average
24% of tracts 8% of tracts
While data at the census tract level give some indication of change in the city, they mask the nature and extent of socio-spatial polarization. In a small city, scale matters. Although census tract level data may suggest that relatively little change occurred, neighbourhoods in some census tracts changed dramatically over the period. Further detailed analysis of particular areas will be necessary to illuminate that reality.
In the next section we compare selected characteristics in census tracts following different trajectories between 1980 and 2010.
3.2 Profile of Halifax’s “Three Cities”: Selected Characteristics 3.2.1 Population and income In 2010, City #2 – with stable incomes against the CMA average between 1980 and 2010 -- contained the highest proportion of Halifax’s population and census tracts (Table 3.2). City #3 (declining against the average) had the greatest percentage increase in population from 1976 to 1980, since large portions of City #3 were under development in the earlier period. City #3 had the highest median age of population, just slightly above the CMA average.
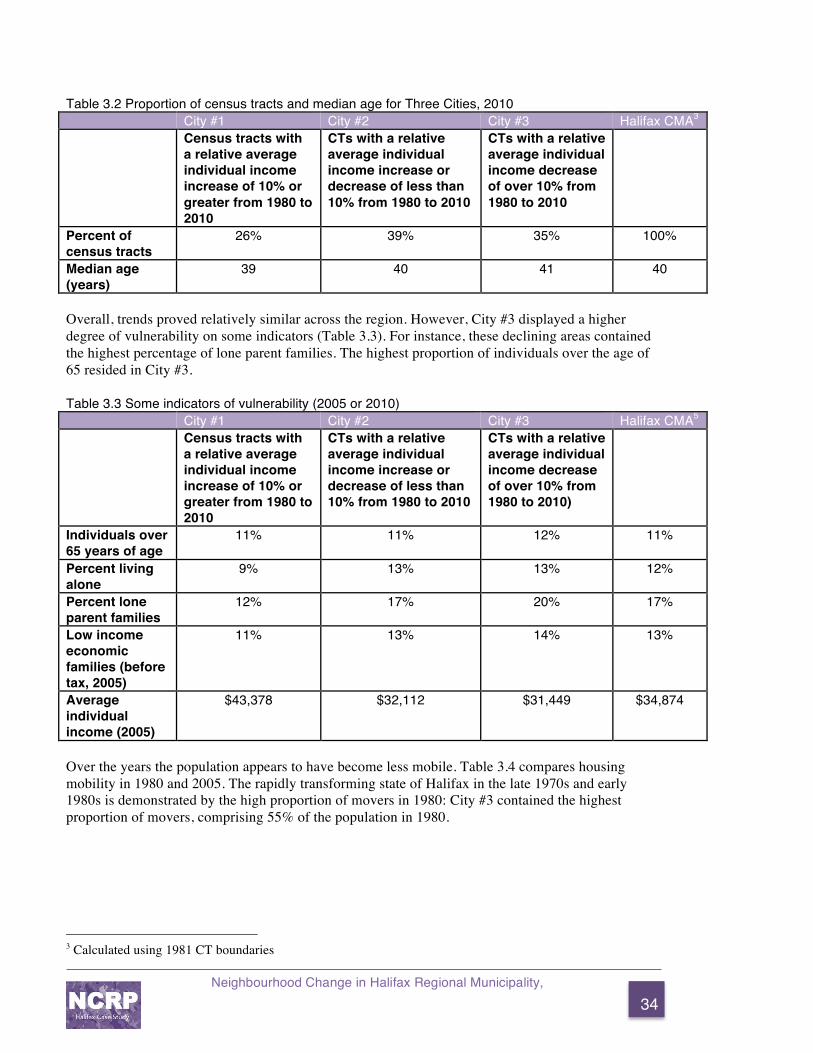
34 Neighbourhood Change in Halifax Regional Municipality,
Table 3.2 Proportion of census tracts and median age for Three Cities, 2010 City #1 City #2 City #3 Halifax CMA3 Census tracts with
a relative average individual income increase of 10% or greater from 1980 to 2010
CTs with a relative average individual income increase or decrease of less than 10% from 1980 to 2010
CTs with a relative average individual income decrease of over 10% from 1980 to 2010
Percent of census tracts
26% 39% 35% 100%
Median age (years)
39 40 41 40
Overall, trends proved relatively similar across the region. However, City #3 displayed a higher degree of vulnerability on some indicators (Table 3.3). For instance, these declining areas contained the highest percentage of lone parent families. The highest proportion of individuals over the age of 65 resided in City #3.
Table 3.3 Some indicators of vulnerability (2005 or 2010) City #1 City #2 City #3 Halifax CMA5 Census tracts with
a relative average individual income increase of 10% or greater from 1980 to 2010
CTs with a relative average individual income increase or decrease of less than 10% from 1980 to 2010
CTs with a relative average individual income decrease of over 10% from 1980 to 2010)
Individuals over 65 years of age
11% 11% 12% 11%
Percent living alone
9% 13% 13% 12%
Percent lone parent families
12% 17% 20% 17%
Low income economic families (before tax, 2005)
11% 13% 14% 13%
Average individual income (2005)
$43,378 $32,112 $31,449 $34,874
Over the years the population appears to have become less mobile. Table 3.4 compares housing mobility in 1980 and 2005. The rapidly transforming state of Halifax in the late 1970s and early 1980s is demonstrated by the high proportion of movers in 1980: City #3 contained the highest proportion of movers, comprising 55% of the population in 1980.
3 Calculated using 1981 CT boundaries

35 Neighbourhood Change in Halifax Regional Municipality,
Table 3.4 Movers during previous five years, 1980 and 2005 City #1 City #2 City #3 Halifax CMA5 Census tracts with a
relative average individual income increase of 10% or greater from 1980 to 2010
CTs with a relative average individual income increase or decrease of less than 10% from 1980 to 2010
CTs with a relative average individual income decrease of over 10% from 1980 to 2010)
Percent that moved in past five years (1980)
46% 47% 55% 50%
Percent that moved in past five years (2005)
40% 41% 43% 42%
3.2.2 Housing tenure and affordability In 2010, Cities #1 and #2 had similar population and dwelling unit densities. The low values reflect the sprawling character of high and middle income areas (Table 3.5). Cities #1 and #2 both contain large, predominantly rural census tracts with smaller populations. City #3, where incomes declined relative to the CMA average since 1980, had higher population and dwelling unit densities.
Table 3.5 Densities in the Three Cities, 1980 and 2010 City #1 City #2 City #3 Halifax CMA5 Census tracts with a
relative average individual income increase of 10% or greater from 1980 to 2010
CTs with a relative average individual income increase or decrease of less than 10% from 1980 to 2010
CTs with a relative average individual income decrease of over 10% from 1980 to 2010)
Population density (per sq km) 1980
65 78 733 111
Population density (per sq km) 2010
107 102 921 151
Dwelling unit density (per sq km) 2010
46 46 420 68
Table 3.6 describes some housing characteristics of the Three Cities. City # 3 had a low proportion of detached housing, and the highest proportion of people living in apartment buildings with five or fewer storeys. City #1 experienced the greatest change in people living in rented versus owned dwellings from 1980 to 2010; in 1980 all areas had similar ownership rates. By 2010, however, residents in City #1 enjoyed high ownership rates while residents in areas that had decreased in income relative to the average lived in rental accommodations in the same proportion as in 1980. To the extent that home ownership marks economic status or improvement, households in City #1 and City #2 “moved up in the world” over the period.

36 Neighbourhood Change in Halifax Regional Municipality,
Table 3.6 Housing characteristics in the Three Cities, 1980 to 2010 City #1 City #2 City #3 Halifax
CMA5 Census tracts with a
relative average individual income increase of 10% or greater from 1980 to 2010
CTs with a relative average individual income increase or decrease of less than 10% from 1980 to 2010
CTs with a relative average individual income decrease of over 10% from 1980 to 2010)
Percent of detached housing 2010
61% 52% 41% 50%
Percent living in apartment buildings under 5 storeys 2010
16% 17% 31% 22%
Percent of rented dwellings 1980
42% 47% 43% 44%
Percent of rented dwellings 2005
29% 36% 43% 37%
Data on the proportion of income that households spend on housing may paint a different picture: households across the region find their resources stretched to pay for housing. Between 1980 and 2005 drastic increases occurred in the proportion of residents spending a significant proportion of household income on gross rent (Table 3.7). In 1980 only a small proportion of HRM residents paid more than 25% of their income on housing. By 2005 a shocking 47% of City #1 and #2’s residents paid more than 30% of their income on housing. Rather than painting a portrait of growing affluence over time, data suggest that Haligonians in all income brackets became increasingly stretched to meet housing costs. The value of dwellings increased most substantially in City #1 while declining the largest amount in City #3. In City #2 and #3, the relative values of dwelling and average gross rent declined from being comparable to the CMA average to below the CMA average over the period. Table 3.7 Housing costs in the Three Cities, 1980 to 2005 City #1 City #2 City #3 Halifax CMA5 Census tracts
with a relative average individual income increase of 10% or greater from 1980 to 2010
CTs with a relative average individual income increase or decrease of less than 10% from 1980 to 2010
CTs with a relative average individual income decrease of over 10% from 1980 to 2010)
Percent of households spending 25% or more of
household income on gross rent 1980
6% 8% 9% 8%
Percent of households spending 30% or more on
gross rent (2005)
47% 47% 41% 43%
Average value of dwelling to CMA average 1980
131% 93% 99% 100%
Average value of dwelling to CMA average 2005
145% 91% 77% 100%
Average value of dwelling 2005
$331,495 $207,943 $176,996 $228,846

37 Neighbourhood Change in Halifax Regional Municipality,
3.2.3 Education and employment Changes in the structure of the local economy over the period are reflected in all parts of the city. Some differences do characterize neighbourhoods with different trajectories. In 2005, City #1 contained the highest proportion of individuals in managerial and professional occupations and the highest number of individuals obtaining at least a bachelor’s degree. City #3 had the highest proportion of individuals working in sales and service and clerical and secretarial occupations. The highest concentration of blue-collar workers was found in City #2. In 1980 and 2005, unemployment rates were similar across the Three Cities. Unemployment levels declined slightly over the 25-year period. Table 3.8 Occupations and education, 1980-2005 City #1 City #2 City #3 Halifax CMA5 Census tracts with a
relative average individual income increase of 10% or greater from 1980 to 2010
CTs with a relative average individual income increase or decrease of less than 10% from 1980 to 2010
CTs with a relative average individual income decrease of over 10% from 1980 to 2010)
Managerial, professional and related occupations
% of total 1980
25% 18% 21% 21%
Managerial, professional and related occupations
% of total 2005
46% 36% 35% 38%
Sales and service 2005 22% 27% 29% 27% Clerical and secretarial
2005 14% 16% 18% 16%
Population 25 and over with a university
certificate or degree 2005
51% 25% 23% 27%
3.2.4 Immigrants and visible minorities Halifax’s immigrant population has remained relatively small. Areas appear relatively stable in overall composition since 1980, although immigration patterns have changed in recent years. City #1 attracted larger proportions of immigrants, but lower proportions of visible minorities. City #3 accommodated a larger proportion of the Chinese and South Asian visible minorities than other areas of HRM. City #1 had the largest percentage of the Arab community. The largest proportion of Halifax’s black population lives in census tracts located in City #2: relatively stable against the average over time.
Table 3.9 Immigrants and visible minorities in the Three Cities, 2005 City #1 City #2 City #3 Halifax CMA5 Census tracts with a
relative average individual income increase of 10% or greater from 1980 to 2010
CTs with a relative average individual income increase or decrease of less than 10% from 1980 to 2010
CTs with a relative average individual income decrease of over 10% from 1980 to 2010)
Percent immigrants 2005
9% 6% 8% 8%
Percent visible minorities 2005
6% 8% 9% 8%
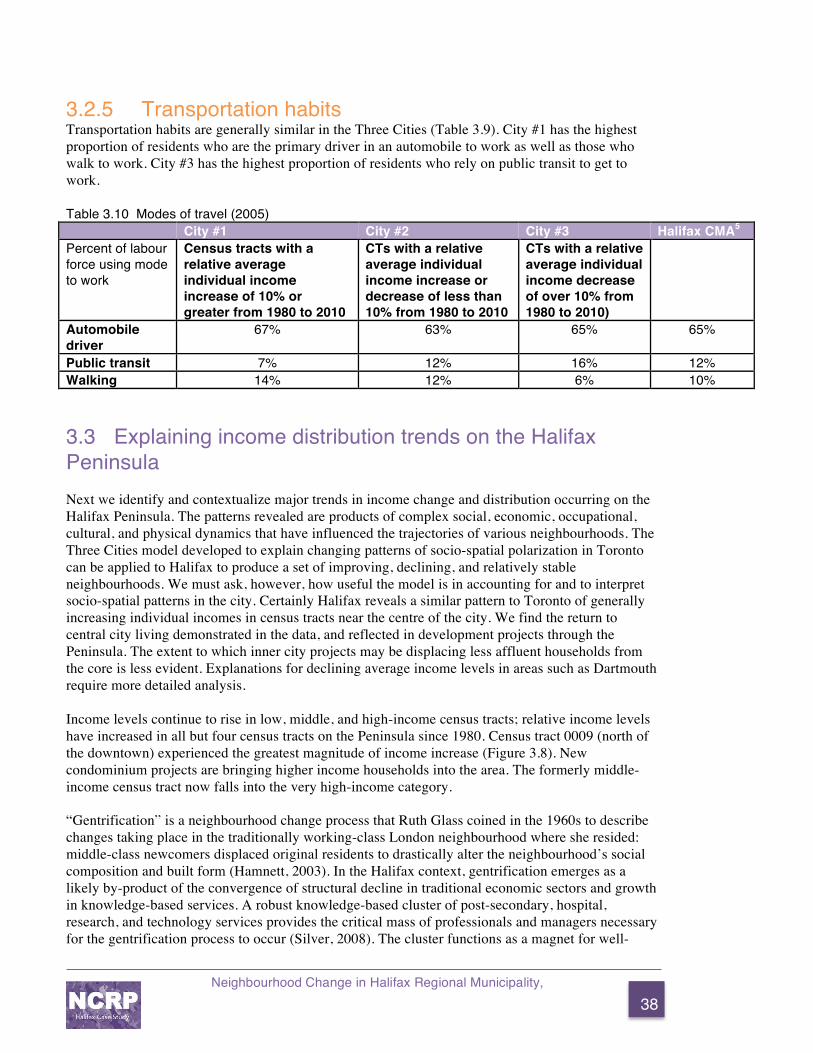
38 Neighbourhood Change in Halifax Regional Municipality,
3.2.5 Transportation habits Transportation habits are generally similar in the Three Cities (Table 3.9). City #1 has the highest proportion of residents who are the primary driver in an automobile to work as well as those who walk to work. City #3 has the highest proportion of residents who rely on public transit to get to work.
Table 3.10 Modes of travel (2005) City #1 City #2 City #3 Halifax CMA5 Percent of labour force using mode to work
Census tracts with a relative average individual income increase of 10% or greater from 1980 to 2010
CTs with a relative average individual income increase or decrease of less than 10% from 1980 to 2010
CTs with a relative average individual income decrease of over 10% from 1980 to 2010)
Automobile driver
67% 63% 65% 65%
Public transit 7% 12% 16% 12% Walking 14% 12% 6% 10%
3.3 Explaining income distribution trends on the Halifax Peninsula Next we identify and contextualize major trends in income change and distribution occurring on the Halifax Peninsula. The patterns revealed are products of complex social, economic, occupational, cultural, and physical dynamics that have influenced the trajectories of various neighbourhoods. The Three Cities model developed to explain changing patterns of socio-spatial polarization in Toronto can be applied to Halifax to produce a set of improving, declining, and relatively stable neighbourhoods. We must ask, however, how useful the model is in accounting for and to interpret socio-spatial patterns in the city. Certainly Halifax reveals a similar pattern to Toronto of generally increasing individual incomes in census tracts near the centre of the city. We find the return to central city living demonstrated in the data, and reflected in development projects through the Peninsula. The extent to which inner city projects may be displacing less affluent households from the core is less evident. Explanations for declining average income levels in areas such as Dartmouth require more detailed analysis.
Income levels continue to rise in low, middle, and high-income census tracts; relative income levels have increased in all but four census tracts on the Peninsula since 1980. Census tract 0009 (north of the downtown) experienced the greatest magnitude of income increase (Figure 3.8). New condominium projects are bringing higher income households into the area. The formerly middle-income census tract now falls into the very high-income category. “Gentrification” is a neighbourhood change process that Ruth Glass coined in the 1960s to describe changes taking place in the traditionally working-class London neighbourhood where she resided: middle-class newcomers displaced original residents to drastically alter the neighbourhood’s social composition and built form (Hamnett, 2003). In the Halifax context, gentrification emerges as a likely by-product of the convergence of structural decline in traditional economic sectors and growth in knowledge-based services. A robust knowledge-based cluster of post-secondary, hospital, research, and technology services provides the critical mass of professionals and managers necessary for the gentrification process to occur (Silver, 2008). The cluster functions as a magnet for well-

39 Neighbourhood Change in Halifax Regional Municipality,
educated and affluent individuals throughout Atlantic Canada. Economic conditions positioned the Halifax Peninsula as receptive to gentrification earlier than seen in other cities of similar size. Millward (1983) identified evidence of gentrification in the South End as early as the 1970s. Ley (1985) flagged Halifax as having the highest rate of gentrification of Canadian CMAs from 1971 to 1981, with the magnitude of the gentrification being “far above that predicted from a range of independent variables” (1985, 40). The increasing proportion of high-income census tracts on the Peninsula indicates the trends have not subsided. High demand for limited space has created market conditions where the North End and West End neighbourhoods – historically predominantly working-class – are being reconsidered as desirable residential neighbourhoods for white collar workers to live close to the urban core.
Gentrification of areas of the Peninsula – demonstrated by income increases above CMA average from 1980 to 2010 – implies impending transformations in the form and makeup of these neighbourhoods. Sections of the North End are experiencing condominium infill and a considerable increase in housing and rental prices. Condominium prices in the North End increased by 18.4% (compared to a 5.4% increase in the South End) from the first quarter of 2010 to the first quarter of 2011 (Royal LePage, 2011). In 2005, the percentage of residents with a university-level education in the Peninsula North municipal electoral district was approximately 32%, slightly higher than the HRM average of 30%. The 1981 Census reported slightly lower than CMA-average proportion of university-level educated residents for the district. These changes have not been unanimously welcomed by neighbourhood residents in areas subject to gentrification (Figure 3.9).
Figure 3.8 Census Tract 9 (Statistics Canada, 2011)

40 Neighbourhood Change in Halifax Regional Municipality,
Figure 3.9– Anti-gentrification graffiti in North End (The Coast, 2007)
The section of middle-income census tracts in the South End – including the solitary low-income census tract4– is explained by the high prevalence of students residing in the area. It seems likely that students are moderating upward pressure on incomes in the neighbourhood. The area’s demographics and built form contrast with the South End’s enduring reputation as an idyllic, affluent enclave for Halifax’s elite. A journalist described conditions in the South End as a neighbourhood where “penniless students rub shoulders … with the city’s upper crust, and families with small children live down the street from elderly pensioners” (Gray, 2005 September 6). Concern about perpetual infiltration of students into the historically exclusive neighbourhood is growing; the media report residents’ concern over the transformation of their neighbourhood into “slums” (Ross, 2011) and “student ghettos” (Maher, 2003). Some residents fear for the “total destruction of the Old South End” (Ross, 2011).
Though we could not obtain information on off-campus student residence patterns in Halifax, we know that five of the city’s six postsecondary institutions are located in or within walking distance of the South End. Apartment buildings and multifamily dwellings are interspersed throughout the historic single-detached dwelling housing stock. The average age of residents in the South End’s middle and low-income census tracts is 27.3 years, compared to the HRM average of 39.9 (2005). Approximately 70% of households in these census tracts were classified as “non-family” – much higher than the HRM total of 33% (2005). The South End also contains four of the five census tracts with the highest proportions of immigrants (although in Halifax that often means individuals born in the US or Europe). The spread of high and very high income census tracts across the Peninsula suggests that the mixed income character of the South End may be threatened; market demand may make it less feasible for students and other lower-income residents to reside there in the future.
4 This census tract had an average individual income of 79% of the CMA overall average individual income: this is a mere 1% below the “middle-income” category cutoff of 80%.

41 Neighbourhood Change in Halifax Regional Municipality,
While income trajectories suggest neighbourhood upgrading dominates the North End, the longevity of low-income census tracts cannot be ignored, particularly in the neighbourhoods surrounding the Peninsula’s public housing projects (such as Uniacke Square and Mulgrave Park). These pockets of low-income provide indications of concentrated poverty. Conditions in Census Tract 10 elucidate the enduring severity of the problem in Halifax (Figure 3.10). Its proportion of low-income residents (approximately 33%) is over three times greater than the HRM average, and the unemployment rate (12.2%) is nearly double the HRM average. Census Tract 10 contains Uniacke Square, the public housing complex where many individuals expropriated from Africville were relocated (Nelson, 2008). Identified by the media as an “inner city ghetto” (Melles, 2003, 1), Gottingen Street (the neighbourhood’s commercial thoroughfare) has been plagued with high incidence of violent crime (Benjamin, 2010). While CT10 had Halifax’s only incidence of very low income during the study period – obtaining that designation in 2005—the Three Cities analysis classified it as City #2: an area with negligible relative income change from 1980 to 2010. Thus we must be cautious not to interpret City #2 as if stable implied middle-income areas, or to interpret City #3—the areas with declining average incomes-- as sites of poverty in the city. We discuss the geography and scale of Halifax’s low-income neighbourhoods further in Section 4.0.
Figure 3.10 Census Tract 10 (Statistics Canada, 2011)

42 Neighbourhood Change in Halifax Regional Municipality,
3.4 Explaining income distribution trends in the Halifax suburbs (Off-Peninsula) Multiple factors contribute to the fragmented geography of income in HRM off the Peninsula. Throughout the second half of the 20th century, development across the commuter shed and rural areas of the former census subdivisions and Halifax County occurred sporadically, due to the City’s weak development regulations, municipal policy, and the region’s topography (Millward, 2006). The geography of lakes, hills, and coastline channelled residential development into specific areas (such as Cole Harbour and Lower Sackville in the 1960s), leaving other areas undeveloped (Millward, 2006). Consequently, Halifax’s suburban fabric developed as pockets of distinct subdivisions (Millward, 2006).
Income distribution patterns in suburban Halifax suggest three primary groups of neighbourhoods of similar form: postwar suburbs experiencing income decline, sprawling subdivisions developed in the 1970s and 1980s with diverse income distribution trends, and recently built suburban developments characterized by high individual incomes.
Income decline characterized most census tracts containing suburbs built between the 1950s and 1970s. These census tracts align with “City #3L” in Figure 3.4 (neighbourhoods having greater than 10% income decline and low average individual income in 2010). They include north Dartmouth, Albro Lake, Woodside, and Spryfield. A large proportion of HRM’s affordable and low-rent housing complexes are located in such neighbourhoods: they include Highfield Park and Pinecrest, Spryfield, and the apartments off Victoria Road in Dartmouth. Fairview – a neighbourhood that experienced formative suburban growth during the early postwar era – remains middle income yet is undergoing similar (albeit less severe) trends as other postwar neighbourhoods. Figure 3.11, a 1976 political cartoon from the Spryfield News, indicates the long-term public concern of the impact of housing projects on the form and vitality of neighbourhoods. Socioeconomic indicators suggest that residents of suburban City #3L are living in increasingly precarious conditions. Incomes declined despite the unemployment rate remaining relatively stable since 1990. Census tract level analysis revealed these neighbourhoods have relatively high
Figure 3.11 Anti-public housing political cartoon (Spryfield News, 1976)

43 Neighbourhood Change in Halifax Regional Municipality,
percentages of individuals employed in sales, service, clerical, and administrative occupations, and relatively low percentages of individuals employed in white-collar occupations. The occupational breakdown suggested residents are employed in lower-paying jobs. The proportion of people living alone, incidence of low income, and the number of lone parent families were significantly higher in these areas than the HRM average. Residents in the census tracts have a higher rate of geographic mobility than in Halifax overall, implying residents are more transient, or that the area is transitioning as households get older, smaller, and less affluent. Approximately 88% of dwelling units in the census tract encompassing Dartmouth North – the location of Highfield Park (low-rental private market housing primarily built in the late 1980s and early 1990s), Pinecrest, Albro Lake, and Victoria Road neighbourhoods – were rented properties in 2005.
The aging population of postwar suburbs seems a likely factor contributing to neighbourhood income decrease against the CMA average. Indeed, in 1970, approximately 29% of the population was between the ages of 20 and 34, and only about 11% of the population was between 45-59 years. In 2010, while 27% of the population remained in the 20-34 years category, nearly one-quarter of the population was between 45 and 59 years. In 1970, only 1.5% of individuals were over 70 years of age; in 2010, that age group encompassed around 7% of the population. The changing age structure of these neighbourhoods provides some explanation for why income may have declined despite unemployment levels remaining relatively stable; retired persons may have left the workforce and thus are not factored into unemployment calculations.
Another group of neighbourhoods experiencing declining average income (relative to the CMA) are those suburbs where most building occurred in the 1970s and 1980s. Portland Estates, Forest Hills, Lower Sackville, Crichton Park, the southern part of Clayton Park, and Ellenvale experienced considerable development during that time frame. They comprise “City #3-MH”: middle and high-income census tracts in 2010 that experienced a decline in income from 1980 to 2010. In 1980, these census tracts experienced significantly higher population growth from 1975 compared to the CMA average. By 2005, all but one census tract (Census Tract 27 – immediately south of Bedford along the Bedford Highway, with a population increase of 37% from 2000 to 2005) displayed slight population increases, no growth, or population decline. The average family size and average number of children for these census tracts was higher than the CMA average in 1980 but those values have since fallen, to the CMA average in 2005. Indicators were relatively stable throughout the study period. The proportion of population aged 65 and over in these census tracts increased from below the CMA average in 1980 to above the CMA average in 2005. Thus, it appears that the original population of these neighbourhoods may be aging in place. Census tract 27 is an anomaly among such neighbourhoods: it is likely experiencing spillover growth from the rapidly expanding Bedford region. Declining trajectories among 1970s and 1980s suburbs reflect investment shifts that advantage more recently developed areas.
Bedford is one region that benefited from channelled residential and commercial investment in recent years. It contains a large concentration of new development. It is largely demarcated by areas that increased in average income by over 10% (City #1). The population of the Bedford area – West Bedford in particular –exploded in recent decades, causing substantial changes in census tract boundaries. Most of Bedford’s housing stock was built in the past 25 years. It has a homeownership rate significantly higher than the HRM average and a diverse dwelling stock comprised of single-detached houses and mid-rise condominiums. It possessed a relatively high immigrant population, with the census tract encompassing West Bedford including 15% immigrants in 2005: the HRM average of that year was 7% immigrants. It appears that wealthier immigrant households buy in Bedford.
Indicators suggest Bedford transformed from a village to an affluent suburban bedroom community

44 Neighbourhood Change in Halifax Regional Municipality,
in the study period. From 1980 to 2005, the Bedford area’s population with a university degree increased from approximately 7% to 34%. The proportion of residents with white-collar occupations also increased substantially to higher than the HRM average by 2005. Bedford became a magnet for residential, economic, and commercial development, with capital projects such as the BMO Centre and construction of Innovation Drive in the Bedford Business Park, where Blackberry/RIM and IBM established offices. The increase in amenities and employment opportunities for the white-collar work force are likely contributors to the allure of newly built neighbourhoods such as “The Ravines of Bedford West,” and the subsequent increase in housing prices. The average price in Bedford for an executive two-storey dwelling from April to June 2013 was approximately $397,900, compared to select Halifax/Dartmouth neighbourhood ranges from $283,000 to $377,000 (Royal Le Page, 2013). Developer investment decisions and consumer choice have made Bedford among the most affluent suburban areas in the municipality.

45 Neighbourhood Change in Halifax Regional Municipality,
4.0 DISCUSSING THE FINDINGS
4.1 To what extent does income polarization exist in Halifax?
The Three Cities of Toronto study revealed striking evidence of Toronto’s transformation from a predominantly middle-class to a polarized city from 1970 to 2005. It showed a city with few stable-income neighbourhoods and a rapidly declining middle-income population. Our study sought to determine whether—despite great differences from Toronto in demographic profile, size, form, and economy—similar processes occurred in Halifax. Descriptive analysis failed to reveal strong evidence for an increase in income inequality and polarization in Halifax overall, but we do see partial evidence for the utility of the model in understanding neighbourhood change on the city’s Peninsula. In sum, however, the findings are inconclusive.
The proportion of Halifax’s middle-income census tracts declined slightly (4%) from 1970 to 2010. The percentage of high and very high-income census tracts also declined while, inversely, the proportion of low-income census tracts underwent a small increase. Figure 4.1 compares inequality and polarization in Canadian CMAs. Halifax has a lower Gini Coefficient of income inequality than other cities profiled: that is, income in Halifax is more evenly distributed than is the case in many cities. Halifax shows less extreme income polarization than other major cities in Canada. Halifax’s Gini Coefficient had the smallest relative increase from 1970 levels across all study cities: its 2010 value was 1.10 larger than in 1970, while other cities became much more unequal and polarized over time. The absolute value of the Gini Coefficient is also the smallest in Halifax across the cities (0.1177 in 2010). Income shifting more accurately captures Halifax’s changing geography of income, rather than increase or decline in specific areas. While HRM overall does not reveal strong indications that average income levels have gravitated to very high and very low extremes, the geographic distribution of residents with very high and very low income levels has changed, and some formerly low-income neighbourhoods have become much more mixed as the region has grown.
Figure 4.1 Gini Coefficient for six Canadian CMAS (Cities Centre, 2013)

46 Neighbourhood Change in Halifax Regional Municipality,
Restricting analysis to within the Peninsula reveals evidence of income polarization in some areas. Income levels are rising in formerly low and middle-income census tracts, yet pockets of low incomes remain concentrated in neighbourhoods with large proportions of public housing. Clusters of high and very high-income census tracts have encroached on formerly middle and low-income areas. The proportion of low-income census tracts off the Peninsula has increased reciprocally with persistent income increases and increase in very high-income census tracts on the Peninsula. Income levels in Off-Peninsula census tracts are more mixed due to the large size of census tracts and the rapid rate at which new neighbourhoods have developed throughout HRM. 4.2 To what extent does the “Three Cities” methodology aid our understanding of Halifax’s changing geography of income? To understand the significance and implications of study findings fully, we must assess the usefulness of the Three Cities model for Halifax. In Toronto, the model revealed explicit patterns of gentrification and decline. Such stark patterns readily informed policy recommendations. In the Halifax CMA, the landscape appears uncertain. An upward trend in income on the Peninsula is clear (excluding the few low-income neighbourhoods containing two large-scale public housing projects – where income remains steady or in decline). Dartmouth’s inner suburbs show a downward trend in income. Overall, however, CMA findings are varied and ambiguous. The trends are not easily generalized and each area requires investigation of changes to explain transformations in the socioeconomic profile of the area.
Figure 4.2 Changes in Population Density (Witherbee, 2013)
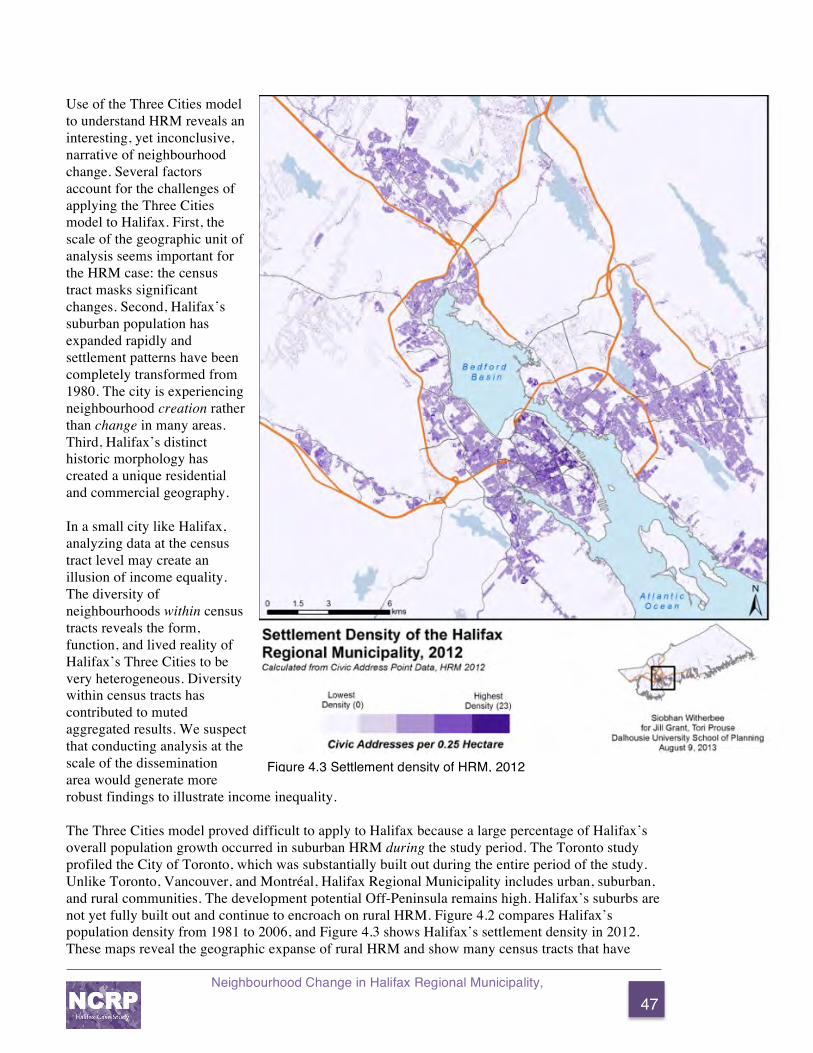
47 Neighbourhood Change in Halifax Regional Municipality,
Use of the Three Cities model to understand HRM reveals an interesting, yet inconclusive, narrative of neighbourhood change. Several factors account for the challenges of applying the Three Cities model to Halifax. First, the scale of the geographic unit of analysis seems important for the HRM case: the census tract masks significant changes. Second, Halifax’s suburban population has expanded rapidly and settlement patterns have been completely transformed from 1980. The city is experiencing neighbourhood creation rather than change in many areas. Third, Halifax’s distinct historic morphology has created a unique residential and commercial geography. In a small city like Halifax, analyzing data at the census tract level may create an illusion of income equality. The diversity of neighbourhoods within census tracts reveals the form, function, and lived reality of Halifax’s Three Cities to be very heterogeneous. Diversity within census tracts has contributed to muted aggregated results. We suspect that conducting analysis at the scale of the dissemination area would generate more robust findings to illustrate income inequality. The Three Cities model proved difficult to apply to Halifax because a large percentage of Halifax’s overall population growth occurred in suburban HRM during the study period. The Toronto study profiled the City of Toronto, which was substantially built out during the entire period of the study. Unlike Toronto, Vancouver, and Montréal, Halifax Regional Municipality includes urban, suburban, and rural communities. The development potential Off-Peninsula remains high. Halifax’s suburbs are not yet fully built out and continue to encroach on rural HRM. Figure 4.2 compares Halifax’s population density from 1981 to 2006, and Figure 4.3 shows Halifax’s settlement density in 2012. These maps reveal the geographic expanse of rural HRM and show many census tracts that have
Figure 4.3 Settlement density of HRM, 2012

48 Neighbourhood Change in Halifax Regional Municipality,
insignificant amounts of residential development. Settlement is concentrated on the Peninsula, in the Dartmouth core, and towards Bedford.
In many of Halifax’s census tracts, changes in socioeconomic indicators identified in the study are not by-products of neighbourhood change, but rather reveal neighbourhood creation. These processes have different socioeconomic consequences and policy implications. Census tracts across suburban and exurban HRM may contain diverse neighbourhoods developed at different times. Figure 4.4 shows HRM’s present and future growth sites identified in the Regional Plan. Changing income distributions give only a partial picture of the transformations occurring or planned Halifax’s distinct historic growth patterns and subsequent social, geographical, and political conditions provide a strong case for a fine-grained analysis of dynamics of income distribution and polarization both across and within Halifax’s neighbourhoods. HRM has 88 census tracts with an average size of 59 square kilometres (sizes range from 0.48 square kilometres to 1,749 square kilometres). By contrast, Toronto has 533 census tracts with an average size of 5.43 square kilometres (sizes ranging from 0.01 square kilometres to 278 square kilometres). In other words, the average area covered by a census tract is ten times larger in Halifax than the average one in Toronto. While census tract analysis helps illustrate changes over time, dissemination areas appear to offer a more appropriate size and scale to assess the magnitude of neighbourhood polarization and to forecast future trajectories in Halifax.
Figure 4.4 Population growth nodes identified in the Regional Plan (HRM, 2006)

49 Neighbourhood Change in Halifax Regional Municipality,
4.2.1 Scale and local context We suggest that at least four factors contribute to why the Three Cities model does not work well in the case of HRM. These factors affect how income inequality and polarization should be interpreted in the city. Governance structure and policy directives As Millward (2006, 483) argued, “Halifax lacks a well-defined development boundary, and displays weak development control in the urban fringe”. Historically, the region has struggled to enforce development boundaries. Growth targets established in the most recent Regional Plan for urban, suburban, and rural settlement were not met. Prior to amalgamation, Bedford, Dartmouth, and Halifax competed for commercial and industrial investment (Sancton, 2005), thereby cultivating sporadic and weakly regulated development. Scattered growth patterns distribute poverty and affluence widely throughout HRM. This remains a challenge for municipal government. Geographic constraints Halifax’s unique topography begets diverse patterns of development that create large and unusually shaped census tracts which do not represent neighbourhoods. The region’s natural terrain contains marketable features that entice suburban developments. It is difficult to build in some rugged areas. Dartmouth is nicknamed the “City of Lakes”: lakes, forested areas, rugged terrain, steep slopes, and other natural features act as boundaries between neighbourhoods within census tracts. Consequently, many neighbourhoods have an insular character because the street system is disjointed and separated by natural barriers. Inconsistent CT boundaries Statistics Canada’s CT boundary delineations are inconsistent in the Halifax context. Because of the significant growth of suburban areas, Statistics Canada continually changed census tract boundaries. Inconsistencies among CTs are of particular concern in areas identified by HRM as “Rural Commuter Centres.” Changing boundaries make longitudinal comparison of data challenging because the geographic units of analysis are inconsistent. Scale of geographic unit For purposes of the neighbourhood change study, the NCRP defined the census tract as a proxy for neighbourhood. Neighbourhood is a contested concept and difficult to define at the best of times. Our analysis suggests that in the Halifax case, the CT is poorly suited as a proxy for a neighbourhood. Halifax’s political, geographical, and jurisdictional setting makes CTs too large to represent neighbourhoods and to reveal the character or extent of socio-spatial polarization. While Halifax exhibits similar general trends in neighbourhood change as those occurring in other cities, at the scale of the CT the trends and magnitude of change are obscured. In most circumstances, Halifax’s CTs encompass multiple neighbourhoods and complex landscapes.

50 Neighbourhood Change in Halifax Regional Municipality,
5.0 TOWARD UNDERSTANDING NEIGHBOURHOOD CHANGE IN HALIFAX
Our study begins to explore new ground as we look at longitudinal trends in socio-spatial polarization in Halifax. Although it is clear that Halifax has pockets of poverty and disadvantage, and that individual incomes have been increasing on the Peninsula, our application of the Three Cities model to census data for Halifax suggests that at the census tract level Halifax does not appear as starkly polarized as Toronto or Vancouver. Halifax is not a “divided city”, although it does have areas of poverty and affluence in close proximity. Longitudinal analysis offers limited evidence to support the premise that trends in socio-spatial inequality have worsened dramatically in Halifax over the last 30 years. Unlike large cities that have experienced significant growth in areas of extreme poverty and extreme affluence, Halifax has seen subtle but meaningful neighbourhood change.
Our results need to be interpreted with an understanding of at least three differences in methods used by the Toronto team, which provided Halifax data for the Halifax team to analyze the Three Cities model, and difference between Toronto and Halifax as cities.
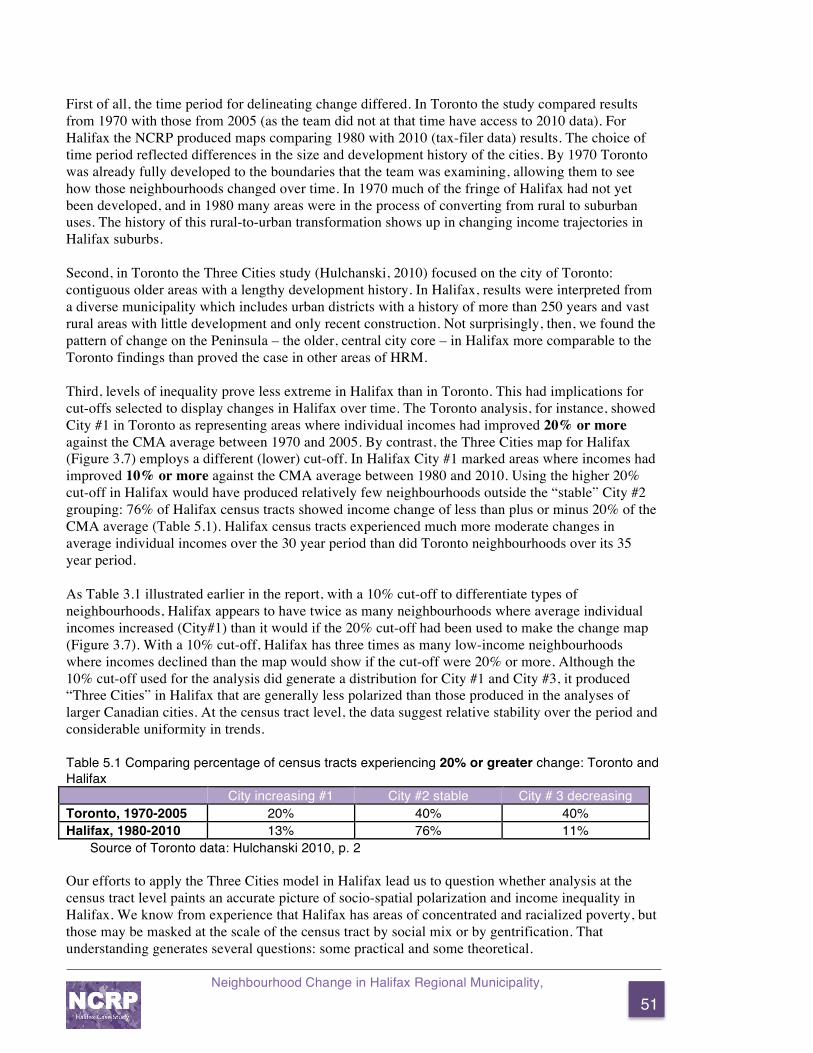
51 Neighbourhood Change in Halifax Regional Municipality,
First of all, the time period for delineating change differed. In Toronto the study compared results from 1970 with those from 2005 (as the team did not at that time have access to 2010 data). For Halifax the NCRP produced maps comparing 1980 with 2010 (tax-filer data) results. The choice of time period reflected differences in the size and development history of the cities. By 1970 Toronto was already fully developed to the boundaries that the team was examining, allowing them to see how those neighbourhoods changed over time. In 1970 much of the fringe of Halifax had not yet been developed, and in 1980 many areas were in the process of converting from rural to suburban uses. The history of this rural-to-urban transformation shows up in changing income trajectories in Halifax suburbs. Second, in Toronto the Three Cities study (Hulchanski, 2010) focused on the city of Toronto: contiguous older areas with a lengthy development history. In Halifax, results were interpreted from a diverse municipality which includes urban districts with a history of more than 250 years and vast rural areas with little development and only recent construction. Not surprisingly, then, we found the pattern of change on the Peninsula – the older, central city core – in Halifax more comparable to the Toronto findings than proved the case in other areas of HRM. Third, levels of inequality prove less extreme in Halifax than in Toronto. This had implications for cut-offs selected to display changes in Halifax over time. The Toronto analysis, for instance, showed City #1 in Toronto as representing areas where individual incomes had improved 20% or more against the CMA average between 1970 and 2005. By contrast, the Three Cities map for Halifax (Figure 3.7) employs a different (lower) cut-off. In Halifax City #1 marked areas where incomes had improved 10% or more against the CMA average between 1980 and 2010. Using the higher 20% cut-off in Halifax would have produced relatively few neighbourhoods outside the “stable” City #2 grouping: 76% of Halifax census tracts showed income change of less than plus or minus 20% of the CMA average (Table 5.1). Halifax census tracts experienced much more moderate changes in average individual incomes over the 30 year period than did Toronto neighbourhoods over its 35 year period.
As Table 3.1 illustrated earlier in the report, with a 10% cut-off to differentiate types of neighbourhoods, Halifax appears to have twice as many neighbourhoods where average individual incomes increased (City#1) than it would if the 20% cut-off had been used to make the change map (Figure 3.7). With a 10% cut-off, Halifax has three times as many low-income neighbourhoods where incomes declined than the map would show if the cut-off were 20% or more. Although the 10% cut-off used for the analysis did generate a distribution for City #1 and City #3, it produced “Three Cities” in Halifax that are generally less polarized than those produced in the analyses of larger Canadian cities. At the census tract level, the data suggest relative stability over the period and considerable uniformity in trends.
Table 5.1 Comparing percentage of census tracts experiencing 20% or greater change: Toronto and Halifax City increasing #1 City #2 stable City # 3 decreasing Toronto, 1970-2005 20% 40% 40% Halifax, 1980-2010 13% 76% 11%
Source of Toronto data: Hulchanski 2010, p. 2
Our efforts to apply the Three Cities model in Halifax lead us to question whether analysis at the census tract level paints an accurate picture of socio-spatial polarization and income inequality in Halifax. We know from experience that Halifax has areas of concentrated and racialized poverty, but those may be masked at the scale of the census tract by social mix or by gentrification. That understanding generates several questions: some practical and some theoretical.
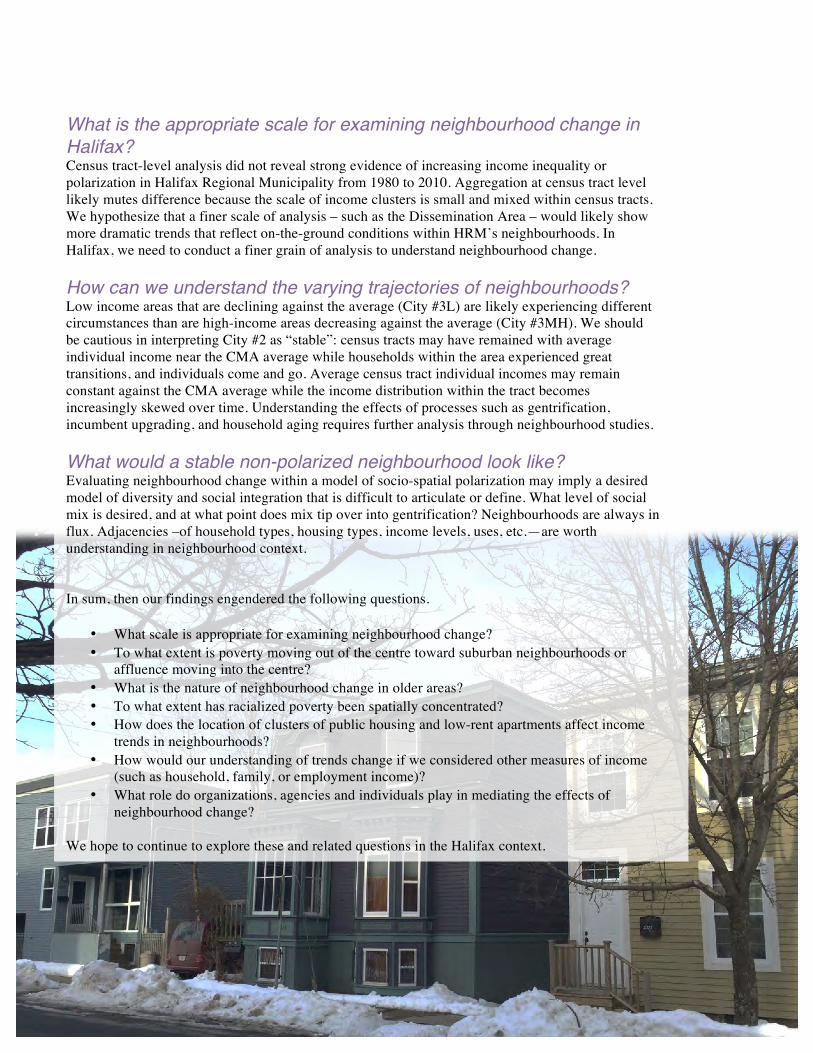
52 Neighbourhood Change in Halifax Regional Municipality,
What is the appropriate scale for examining neighbourhood change in Halifax? Census tract-level analysis did not reveal strong evidence of increasing income inequality or polarization in Halifax Regional Municipality from 1980 to 2010. Aggregation at census tract level likely mutes difference because the scale of income clusters is small and mixed within census tracts. We hypothesize that a finer scale of analysis – such as the Dissemination Area – would likely show more dramatic trends that reflect on-the-ground conditions within HRM’s neighbourhoods. In Halifax, we need to conduct a finer grain of analysis to understand neighbourhood change.
How can we understand the varying trajectories of neighbourhoods? Low income areas that are declining against the average (City #3L) are likely experiencing different circumstances than are high-income areas decreasing against the average (City #3MH). We should be cautious in interpreting City #2 as “stable”: census tracts may have remained with average individual income near the CMA average while households within the area experienced great transitions, and individuals come and go. Average census tract individual incomes may remain constant against the CMA average while the income distribution within the tract becomes increasingly skewed over time. Understanding the effects of processes such as gentrification, incumbent upgrading, and household aging requires further analysis through neighbourhood studies.
What would a stable non-polarized neighbourhood look like? Evaluating neighbourhood change within a model of socio-spatial polarization may imply a desired model of diversity and social integration that is difficult to articulate or define. What level of social mix is desired, and at what point does mix tip over into gentrification? Neighbourhoods are always in flux. Adjacencies –of household types, housing types, income levels, uses, etc.—are worth understanding in neighbourhood context.
In sum, then our findings engendered the following questions.
• What scale is appropriate for examining neighbourhood change? • To what extent is poverty moving out of the centre toward suburban neighbourhoods or
affluence moving into the centre? • What is the nature of neighbourhood change in older areas? • To what extent has racialized poverty been spatially concentrated? • How does the location of clusters of public housing and low-rent apartments affect income
trends in neighbourhoods? • How would our understanding of trends change if we considered other measures of income
(such as household, family, or employment income)? • What role do organizations, agencies and individuals play in mediating the effects of
neighbourhood change?
We hope to continue to explore these and related questions in the Halifax context.

53 Neighbourhood Change in Halifax Regional Municipality,
6.0 WORKS CITED Baum-Snow, N. and Pavan, R. 2012. Inequality and City Size. Working Paper, Brown University
Department of Economics. Online. Available at: http://www.econ.brown.edu/fac/nathaniel_baum-snow/ineq_citysize.pdf.
Bell, D., and M. Jayne. 2009. Small cities? Towards a research agenda. International Journal of Urban and Regional Research. 33(3), pp. 683-699.
Benjamin, C. 2010. Rebuilding Halifax’s most feared neighbourhood, one project at a time. The Globe and Mail. Online. Available at: http://www.theglobeandmail.com/news/national/rebuilding-halifaxs-most-feared-neighbourhood-one-project-at-a-time/article4327055/.
Bohdanow, S. 2006. The Gottingen Street Neighbourhood: Issues, opportunities, and actions in community development. Master’s Project. Dalhousie University, School of Planning.
Bourne, L. and D. Ley (Eds). 1993. The Changing Social Geography of Canadian Cities. Montréal: McGill-Queens Press.
Bourne, L.S., Hutton, T., Shearmur, R., and Simmons, J. (Eds). 2011. Canadian Urban Regions: Trajectories of growth and change. Toronto: Oxford University Press.
Bunting, T., and P. Filion. 2001. Uneven cities: addressing rising inequality in the twenty-first century. The Canadian Geographer 54(1), pp. 126-131.
Bunting, T. and H. Millward. 1998. A tale of two CBDs I: The decline and revival (?) of downtown retailing in Halifax and Kitchener. Canadian Journal of Urban Research (8), pp. 139-166.
Canadian Urban Institute. 2012. The Value of Investing in Canadian Downtowns. Report produced for the Canadian Task Force of the International Downtown Association. Online. Available: http://www.canurb.com/cui-news/the-value-of-investing-in-canadian-downtowns.html.
Citizens for Halifax. No date. HRM – The Urban-Rural Question. Citizens for Halifax. Online. Available: http://www.citizensforhalifax.ca/site-cfh/media/citizensforhalifax/Urban-RuralSplit.pdf.
Cities Centre, University of Toronto. 2013. Gini Coefficients for study cities. Personal communication.
Clairmont, D. and D. Magill. 1987. Africville: The Life and Death of a Canadian Black Community. Toronto: McClelland and Stewart Limited.
CMHC (Canada Mortgage and Housing Corporation). 2011. The evolution of social housing. Canadian Housing Observer. Online. Available at http://www.cmhc-schl.gc.ca/en/corp/about/cahoob/upload/Chapter_9_EN_W.pdf
Coblentz, H. 1963. Halifax Region Housing Survey: A planning and housing study of the Halifax and Dartmouth metropolitan area, 1960-1963. Halifax: Metropolitan Regional Planning Commission.
Conference Board of Canada. 2013. Mid-Sized Cities Outlook 2013: Economic performances and trends. Online. Available: http://www.conferenceboard.ca/e-library/abstract.aspx?did=5487.
Craswell, H. 2011. Halifax Regional Municipality: An overview of development trends. Online. Available at http://theoryandpractice.planning.dal.ca/pdf/suburbs/development_trends/hrm_trends.pdf.
Filion, P. and T. Bunting.1990. Socio-economic change within the older housing stock of Canadian cities. Housing Studies 5(2), pp. 75-91.
Filion, P., and G. Gad. 2006. Urban and suburban downtowns: Trajectories of growth and decline, in T. Bunting and P. Filion (Eds.) Canadian Cities in Transition: Local through global perspectives. Toronto: Oxford University Press. pp. 171-191.
Fingard, J., J. Guildford, and D. Sutherland. 1999. Halifax: The First 250 Years. Halifax: Formac Publishing.

54 Neighbourhood Change in Halifax Regional Municipality,
Gillis, S. 2007. Halifax’s Streetcars: Connections between Transportation and Urban Form. Master’s Project. Dalhousie University School of Planning. Available at http://theoryandpractice.planning.dal.ca/pdf/history/sgillis_thesis.pdf.
Grant, J. 1989. Hard luck: The failure of regional planning in Nova Scotia. Canadian Journal of Regional Science 12(2), pp. 273-284.
Grant, J. and M. Paterson. 2012. Scientific cloak/romantic heart: Gordon Stephenson and the redevelopment study of Halifax, 1957. The Town Planning Review 83(3), pp. 319-336.
Gray, I. 2005. One South End, five universities. Halifax Chronicle Herald: Metro Edition. September 6, 2005, p. 31.
Hamnett, C. 2003. Gentrification and the Middle-Class Remaking of Inner London. Urban Studies 40(12), pp, 2401-2426.
HRM (Halifax Regional Municipality). 2006. Regional Plan. Available at http://www.halifax.ca/regionalplanning/FinalRegPlan.html.
HRM. 2012. History. Cogswell Interchange History. Online. Available: http://www.halifax.ca/PropertyPlanning/CogswellHistory.html.
Hulchanski, D. (with L. S. Bourne, R. Egan, M. Fair, R. Maaranen, R. A. Murdie, and R. A. Walks). 2010. The Three Cities within Toronto: Income Polarization among Toronto’s Neighbourhoods, 1970-2005. Toronto: University of Toronto, Cities Centre. Online. Available: http://www.urbancentre.utoronto.ca/pdfs/curp/tnrn/Three-Cities-Within-Toronto-2010-Final.pdf.
Lewis, N. M. and Donald, B. 2010. A new rubric for ‘creative city’ potential in Canada’s smaller cities. Urban Studies 47(1), pp. 29-54.
Ley, D. 1985. Gentrification in Canadian Inner Cities: Patterns, Analysis, Impacts and Policy. Ottawa: CMHC.
Ley, D. 1986. Alternative Explanations for inner-city gentrification: A Canadian assessment. Annals of the Association of American Geographers 76(4), pp. 521-535.
Ley, D. and N. Lynch. 2012. Divisions and disparities in lotus-land: Socio-spatial income polarization in Greater Vancouver, 1970-2005. Research Paper 223. Cities Centre, University of Toronto. http://www.citiescentre.utoronto.ca/Assets/Cities+Centre+2013+Digital+Assets/Cities+Centre/Cities+Centre+Digital+Assets/pdfs/publications/Research+Papers/223+Ley+Lynch+2012+Vancouver+Income+Polarization.pdf.
Maher, S. 2003 (7 September). When the going gets slow, the hungry leave. Halifax Chronicle Herald. September 7, 2003, B1.
Marcuse, P. and R. Van Kempen. 2000. Globalizing Cities: A New Spatial Order? Oxford: Blackwell.
Melles, B. 2003. The Relationship Between Policy, Planning, and Neighbourhood Change: The Case of the Gottingen Street Neighbourhood, 1950-2000. Master’s Thesis. Dalhousie University, School of Planning.
Millward, H. 1983. Single-family house values in Metropolitan Halifax, 1981. The Canadian Geographer 27(2), pp. 178-183.
Millward, H. 2002. Peri-urban residential development in the Halifax Region 1960-2000: Magnets, constraints, and planning policies. The Canadian Geographer 46(1), pp. 33-47.
Millward, H. 2006. Urban containment strategies: A case-study appraisal of plans and policies in Japanese, British, and Canadian cities. Land Use Policy 23, pp. 473-485.
Millward, H. and D. Davis. 1986. Housing renovation in Halifax: ‘Gentrification’ or ‘incumbent upgrading’? Plan Canada 26, pp. 148-155.
Nelson, J. 2008. Razing Africville: A Geography of Racism. Toronto: University of Toronto Press. OECD. 2008. Growing Unequal: Income Distribution and Poverty in OECD Countries. Available at
http://www.oecd.org/els/soc/growingunequalincomedistributionandpovertyinoecdcountries.htm.

55 Neighbourhood Change in Halifax Regional Municipality,
Our HRM Alliance. 2012. Greenbelting solution: In brief. OurHRMAlliance. Online. Available: http://www.ourhrmalliance.ca/greenbelting-solution-in-brief.
Pacey, E. 1979. The Battle of Citadel Hill. Hantsport, NS: Lancelot Press. Pomeroy, S. 2005. Neighbourhood Change through a Housing Lens. Caledon Institute of Social
Policy, Action for Neighbourhood Change. Online. Available: http://www.caledoninst.org/Publications/PDF/554ENG.pdf.
Rose, D. and A. Twigge-Molecey. 2013. A City-Region Growing Apart? Taking Stock of Income Disparity in Greater Montréal, 1970-2005. Research Paper 222. Cities Centre, University of Toronto. http://neighbourhoodchange.ca/publications/research-papers/montreal-neighbourhoods/.
Ross, S. 2011. Dal residence plan raises concerns; South-enders fear ramifications of change. Halifax Chronicle Herald, September 8, 2011, A9.
Royal Le Page, 2011. Royal LePage House Price Survey. First Quarter 2011 (55). Online. Available: http://docs.rlpnetwork.com/rlp.ca/hps/Q1_2011_HPS_EN.pdf.
Royal Le Page, 2013. Royal LePage House Price Survey. Second Quarter 2013 (64). Online. Available: http://docs.rlpnetwork.com/rlp.ca/hps/Q2_2013_HPS_EN.pdf.
Sampson, R., J. Morenoff, and T. Gannon-Rowley. 2002. Assessing ‘neighbourhood effects’: Social processes and new directions in research. Annual Review of Sociology 28, pp. 443-478.
Sancton, A. 2003. Why municipal amalgamations? Halifax, Toronto, Montréal. Prepared for Municipal-Provincial-Federal Relations in Canada Conference, Institute of Intergovernmental Relations, Queen’s University, May 9-10, 2003. Online. Available: http://www.queensu.ca/iigr/conf/Arch/03/03-2/Sancton.pdf.
Sancton, A. 2005. The governance of metropolitan areas in Canada. Public Administration and Development 25, pp. 317-327.
Sassen, S. 1991. The Global City: New York, London, Tokyo. Princeton, NJ: Princeton University Press.
Silver, J. 2008. Public Housing Risks and Alternatives – Uniacke Square in North End Halifax. Winnipeg: Canadian Centre for Policy Alternatives.
Simpson, M. 1985. Thomas Adams and the Modern Planning Movement: Britain, Canada, and the United States. London: Alexandrine Books.
Spiotta, D. 2012. In the name itself. In A. Schrager Lang and D. Lang/Levistky (Eds.) Dreaming in Public: The Building of the Occupy Movement. Peoria, IL: Versa Press, pp. 201-204
Stantec Consulting. 2013. Quantifying the Costs and Benefits to HRM, Residents, and the Environment of Alternate Growth Scenarios. Online. Available: http://www.halifax.ca/boardscom/documents/HRMGrowthScenariosFinalReportApril292013.pdf .
Statistics Canada. 2013a. Census metropolitan area of Halifax, Nova Scotia. Focus on Geography Series, 2011 Census. Online. Available: https://www12.statcan.gc.ca/census-recensement/2011/as-sa/fogs-spg/Facts-cma-eng.cfm?LANG=Eng&GK=CMA&GC=205.
Statistics Canada. 2013b. Consumer Price Index, by city. Online. Available: http://www.statcan.gc.ca/tables-tableaux/sum-som/l01/cst01/econ45a-eng.htm .
Statistics Canada. 2013c. Population of census metropolitan areas. Online. Available: http://www.statcan.gc.ca/tables-tableaux/sum-som/l01/cst01/demo05a-eng.html.
Statistics Canada. 2009. Census Trends: Geography selection for census subdivisions (CSDs) with 5000+ population – Municipalities. Online. Available: http://www12.statcan.gc.ca/census-recensement/2006/dp-pd/92-596/P1-1.cfm?Lang=eng&T=CSD&TID=0.
Stephenson, G. 1957. A Redevelopment Study of Halifax, Nova Scotia. Toronto: University of Toronto Press.
Walks, R. A. 2011. Economic restructuring and trajectories of socio-spatial polarization in the twenty-first century Canadian city. In Bourne, L.S., Hutton, T., Shearmur, R. and Simmons, J.

56 Neighbourhood Change in Halifax Regional Municipality,
(Eds). Canadian Urban Regions: Trajectories of Growth and Change. Toronto: Oxford University Press, pp. 125-159.
White, J. 1991. Halifax, Nova Scotia in World War II: An allied staging area. In Stadte im Zweiten Weltkrieg: Ein Internationalader Vergleich, Marlene P. Hiller, Eberhard Jackel, and Jurgen Rohwer (eds.), pp. 168-183. Eissen: Klartext Verlag.