neighborhood densities and mobility in venice€¦ · web viewwe, as americans who are appalled...
TRANSCRIPT

P a g e | 1
NEIGHBORHOOD DENSITIES AND MOBILITY IN VENICE
By Sherman Lewis and Dustyn Bindel, July 24, 2014To the Venice planning department, journal editors, Venipedia.org and
Dr. Carrera, and all other interested parties: Many thanks to the Venetians who looked at us sideways but were still
willing to help us out. Please read our report, comment, and send on. We are looking for
anyone who is interested, not publication. We are operating without a network. Is anyone else doing similar research anywhere? Our literature search came up empty. Please contact Sherman Lewis at [email protected]. The files on our research are in the Venice Dropbox at https://www.dropbox.com/sh/ty01bv4nasbiwvj/AACkGndHnBZ2mXsfatF98ikza.
The purpose of this study is to quantify the walkable densities of residential neighborhoods in Venice, as a case study of what works to reach the goals of a high standard of living, walking, local business, transit, and extremely limited local use of autos. Walkable density considers residential density over an area defined by walking distance and the threshold of density needed to support those goals.
Most attention is paid to Venice because of its history, urbanism, fashion, canals, and tourism, not to mention the fact that it is sinking. Hardly any attention is paid because of how it works as a neighborhood system for the people who live there. A neighborhood system consists of residential land use, neighborhood-serving land uses, neighborhood mobility, and transportation pricing. Neighborhood-serving land uses are those needed for daily life with frequent trips, such as for groceries typically needed over a week to a month. “Local business” means business which serves neighborhood residents and is located in the neighborhood. “Neighborhood mobility” refers to trips to get daily needs and longer important trips, like to work, school, or a frequent family obligation.
We, as Americans who are appalled by our car culture, are intrigued: how can a Venetian actually live there without driving a car every day? We believe that Venetian neighborhoods are more walkable than most neighborhoods in the U.S., and a lot more sustainable because of having no cars. They emit a fraction of the global warming gases, have cleaner air, support more walking for health, have fewer accidents, and are pleasant to live in.

P a g e | 2
The Problem for ResearchThe Hayward Area Planning Association (HAPA) is interested in how
neighborhood systems work along a spectrum from low to high density. A dense, but not high-rise, pedestrian system is an alternative to suburbia. Planners believe that high density, mixed used neighborhoods designed for walking, transportation demand management, and transit can provide mobility comparable to dispersed, car-dependent suburbia.
The hypothesis, however, has not been quantified and tested. For example, local business for daily needs within walking distance can have a travel time comparable to driving to suburban business, but different neighborhood types have not been measured and compared. It takes a fairly large number of people in a small area to make a pedestrian system work. Density over area must have economies of scale to achieve a critical mass for significant mode shift. There may be an inflection point at which mode shifts dramatically, and where the presence of cars and traffic makes the system work less efficiently and less pleasantly.
An opportunity arose for Dustyn Bindel to study densities on-location in Venice, with help from Venetian experts and the Direzione Mobilità e Trasporti. We assumed that Venetians make about the same number of trips per day, for similar purposes, with similar trip durations as suburban Italians. The main difference with suburbia is in mode of travel.
Venice, internally, has only walking and water transit trips since there are almost no streets for cars. However, the west side of old Venice, in Santa Croce and Dorsoduro, has large modern docks, some streets, parking, a parking structure, and a bus depot. Car parking has penetrated deeply into this area. There seems to be parking for over 1,000 cars in surface lots, along streets, and in courtyards. Cars can go by bridge to Mestre on the mainland to the north. A rail bridge also goes up to Mestre. Transit among islands is by waterbus called vaporetto on the Grand Canal and in the Lagoon.
MethodsWe were able to estimate neighborhood densities using population from
the 2001 census and good maps from the Comune di Venezia’s website. (The 2011 census is not available until later in 2014.) Based on our previous research, neighborhoods range from about 1,000 to 20,000 people, with 2,000 to 5,000 being typical. In Venice, the geographical classification with the best fit was the località.
The apparent density of the whole area of each of the località is only weakly indicative of walkable density because it typically includes non-neighborhood land uses that are not part of the walking routes used in daily life. If a non-neighborhood use is not along typical walking routes, it needs to be subtracted from the area used for walkable density. Apparent

P a g e | 3
density minus external non-neighborhood uses off the main routes equals walkable density.
In the case of Venice, there are some areas that serve no daily purpose for neighborhood inhabitants, such as areas used for governmental, industrial, office, institutional, cultural, or commercial purposes (like fashion), water bodies, docks, cemeteries, large parks, beaches, uninhabited areas along the waterfront, and predominantly tourist areas. Venice has an amazing number of visitors, by one estimate an annual average of 3 per local resident, and they are highly concentrated. If one manages to get off the heavily beaten track, there are very few people around and it gets very quiet, a phenomenon experienced by both authors. Another unusual aspect of how Venice works is its freight system. Goods are moved mostly by small motorboats using the Grand Canal as well as narrow canals, called canaletti. An amazing variety of goods, from heavy machinery to flats of soda pop, are hoisted or thrown up from small building docks. Finally, Venetians seem to close everything in order to have lunch.
To estimate the area of non-neighborhood uses we looked at sezioni, which are blocks within the località. Maps of the località with their sezioni are available online at the Comune di Venezia website and were downloaded into the Venice Dropbox. Sample sezione numbers are shown on the maps below.
We estimated land uses by looking at street and block patterns, building outlines, map labels, Google maps, Google Earth, and on-the-scene observation. For example, Cannaregio’s large train yard and Lido’s beaches serve no neighborhood function and have therefore been deducted from the original area. We made notes about the most outstanding area adjustments. Our adjustments are reviewable in the Venice Dropbox file “Venice demography and area stats by sezione to Col. S worksheet.xlsx.”
We estimated non-neighborhood areas and deducted them, shown in the spreadsheet as adjusted area. From there, we calculated adjusted population per hectare and per acre to get walkable density.
Here are examples of our analysis of two località, one with mostly neighborhood land uses and one with large non-neighborhood areas.
P a g e | 4
San PoloSan Polo, on the east side of the Grand Canal, has half of the famous
Ponte di Rialto and is right in the middle of old Venice. San Polo seemed to have the least non-neighborhood uses of those studied on the main islands. The map from the Municipalitá seems to show buildings in orange, courtyards in light orange, parks in green, and paved areas and public squares in grey.
Looking at a Google street map adds more information about San Polo. The map below shows the whole neighborhood, but zooming in (not shown) to more details reveals more labels, numerous small streets sometimes called calles (Venetians have many words for the different types of streets), passages under second stories, and building shapes.
The satellite view yields even more detail. The view below is zoomed in to show the area from the Rialto Bridge to the Campo San Polo, with its sea of red roofs and

P a g e | 5
boats tied up along the water. It shows that Venice achieves density with four story buildings with very little room for streets.
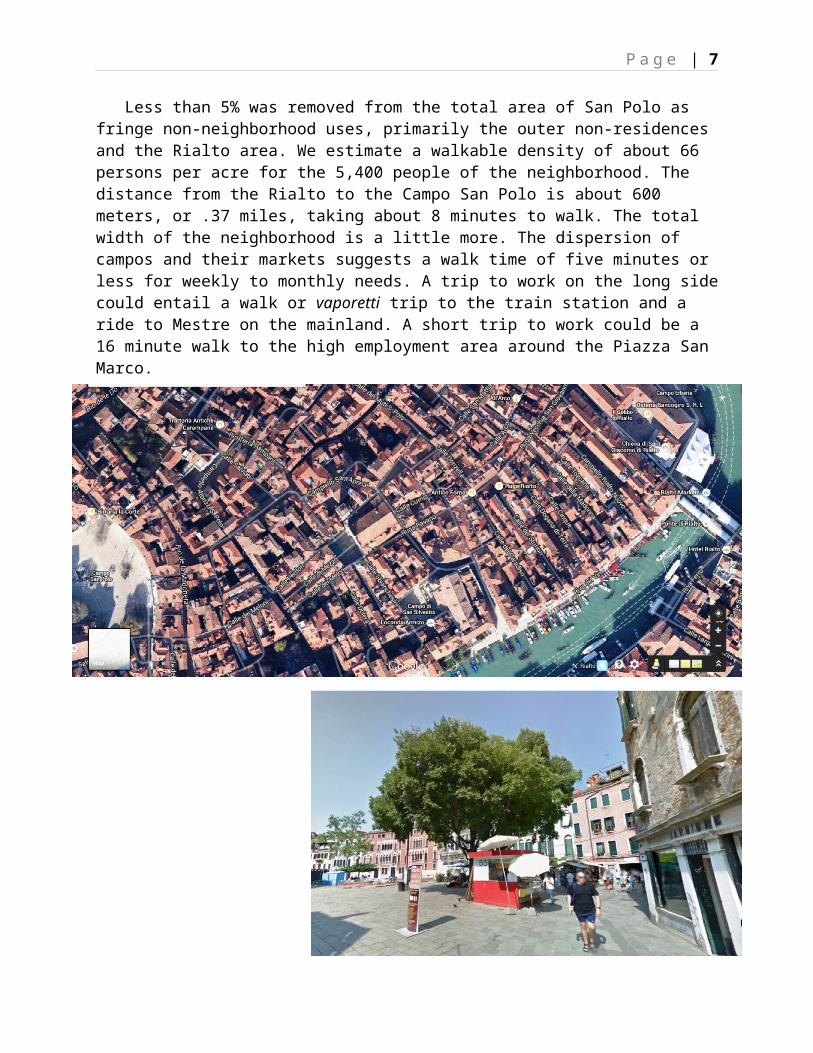
Street view takes us in even closer, too close, in fact, to have the time to move along every street and guess the land uses. Street view is also tricky to use. The picture shows a plaza. I tried to get a view of the Campo San Polo, but I’m not sure what I got. The view shows that the occasional open plaza can provide some spaciousness in an otherwise densely built area and be a central location for local business.
Less than 5% was removed from the total area of San Polo as fringe non-neighborhood uses, primarily the outer non-residences and the Rialto area. We estimate a walkable density of about 66 persons per acre for the 5,400 people of the neighborhood. The distance from the Rialto to the Campo San Polo is about 600 meters, or .37 miles, taking about 8 minutes to walk. The total width of the neighborhood is a little more. The dispersion of campos

P a g e | 6
and their markets suggests a walk time of five minutes or less for weekly to monthly needs. A trip to work on the long side could entail a walk or vaporetti trip to the train station and a ride to Mestre on the mainland. A short trip to work could be a 16 minute walk to the high employment area around the Piazza San Marco.
Sacca FisolaOne località with
many non-neighborhood uses off the main routes was Sacca Fisola, which is a small, isolated island at the end of the long island of Giudecca. Both islands are on the south side of the main islands. The access is by vaporetto on the north side and a pedestrian bridge to Giudecca on the west.
We also stumbled on Venice’s newest land fill. The località includes San Biagio, which consists of four little islands created from garbage and being developed as a history and theme park.
P a g e | 7
(http://it.wikipedia.org/wiki/Sacca_San_Biagio ) Some tennis courts are already visible in satellite view. On the Sacca Fisola località map they show up as sezioni 1162 to 1165 (the number 1162, for the light pink island on the left, is not shown on the map). This area, as well as some park area and the water, accounted for most of the subtraction of non-neighborhood uses.
The località map for Sacca Fisola shows the familiar colors of San Polo, but a very different pattern of buildings, squares, and courtyards. Sacca Fisola turns out to be a modern (for Venice) residential area built on landfill.
The Google street map is also different, showing much bigger blocks and empty spaces. We needed satellite view to get a better sense of the layout for walking. It shows familiar red roofs, larger parks, and large paved areas with white lines, not to mention about a dozen trucks with no place to drive. (Street view, however, shows no trucks.) It also shows a lack of business and un-Venetian modern five story residential buildings. Street view reveals no local business; the area seems purely residential. Evidently, people use the vaporetto or, most probably, walk into Giudecca to shop. Sacca Fisola is the smallest of the neighborhoods, but would still seem to have enough people for some business.
To verify the lack of business, I looked at the sezione 2001 census data, which had 19 variables for housing and only one for other buildings, “Buildings and building complexes for hotels, offices, commerce and industry, communications and transport.” The census confirmed street view; zero buildings for local business. However, looking at other neighborhoods, the census may have excluded business uses of ground floors of residential buildings. We hypothesize there is at least one store in Sacca Fisola, wherever it may be. Nevertheless, Sacca Fisola seems to have the least mobility of the località studied due to its small size, lack of local business, and the time it takes to reach other areas.

P a g e | 8
FindingsExceptions
Lido and Murano are exceptions. Lido has cars and streets and is served by a motor vehicle ferry. Even after deductions from its original area, its walkable density is still considerably less than that of the main islands and Burano, and way below the threshold that we hypothesize works for full walkability. Lido has a different feel, more spacious because of narrow width, real beaches, more trees, and more detached buildings.
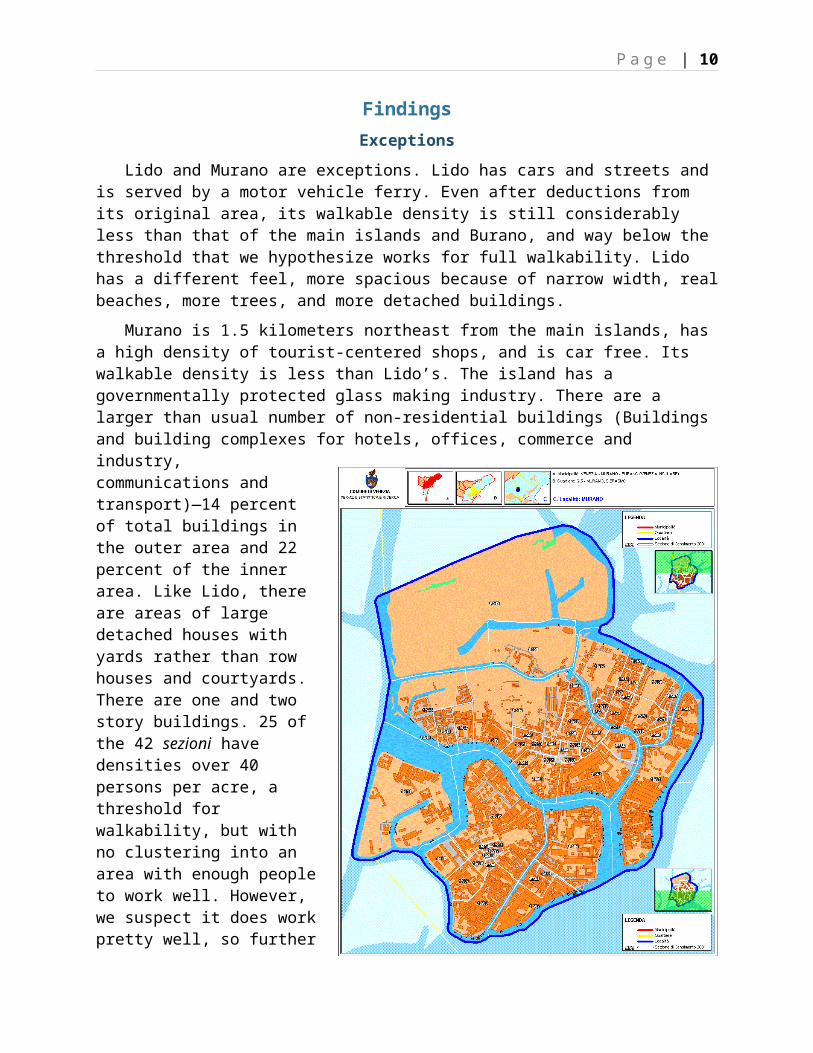
Murano is 1.5 kilometers northeast from the main islands, has a high density of tourist-centered shops, and is car free. Its walkable density is less than Lido’s. The island has a governmentally protected glass making industry. There are a larger than usual number of non-residential buildings (Buildings and building complexes for hotels, offices, commerce and industry, communications and transport)—14 percent of total buildings in the outer area and 22 percent of the inner area. Like Lido, there are areas of large detached houses with yards rather than row houses and courtyards. There are one and two story buildings. 25 of the 42 sezioni have densities over 40 persons per acre, a threshold for walkability, but with no clustering into an area with enough people to work well. However, we suspect it does work pretty well, so further research should see if the old islands have more mobility than Murano in some way that can be quantified. The main neighborhoods
P a g e | 9
All land uses necessary for a functioning neighborhood seem to be provided within the località: primary schools, food stores, places to eat, other neighborhood shopping, neighborhood services, etc. Internal mobility is accomplished by walking. Longer trips outside the neighborhood are completed by walking and by vaporetto.
The walkable density for the nine località of the main islands plus Burano, a 221 square kilometer island some distance from Venice, was 44 to 77 persons per walkable acre, with an average of 59 per acre. This density is consistent with research we have done in Toronto and other neighborhoods. These densities are achieved by buildings less than five stories, efficient block sizes, narrow street widths, and a compact land use pattern.
Gaps and Next StepsItaly has extensive census data on many topics. However, we could not
find specific personal trip information on Venice of the kind found in Neighborhood Density in Venice, Italy, 2001
Localita populationgross area
(m2)pop/
hecatrepop/ acre
adjusted area (m2)
adj. pop /hectare
adj. pop /acre
% adjust-ment major area adjustments
Denser neighborhoods, main islands + Burano
Sacca Fisola 1,748 187,564 93 38 97,104 180 73 48.2%outer parks, water, Sacca San Biagio
Sant'Elena 2,132 408,477 52 21 112,718 189 77 72.4% water, parks
Burano island* 3,276 221,019 148 60 180,068 182 74 18.5%Outer parks, outer roads, small shipyard
San Polo 5,358 341,894 157 63 326,105 164 66 4.6% outer non-residencesCannaregio 18,107 1,429,109 127 51 1,123,829 161 65 21.4% Train yard
Castello 14,213 1,472,954 96 39 940,984 151 61 36.1%water, outer non-residences, outer parks
Santa Croce 5,842 531,181 110 45 411,868 142 57 22.5%outer piazza, outer non-residences
Giudecca 4,681 625,842 75 30 349,687 134 54 44.1%shipyard, outer parks, outer non-residences
Dorsoduro 7,441 966,384 77 31 625,835 119 48 35.2%train yard, outer industrial areas, outer parks, hotels
San Marco 4,462 540,135 83 33 413,467 108 44 23.5% outer piazzaTotal 65,512 6,536,995 100 41 4,484,561 146 59 31.4%
Less dense neighborhoodOuter Murano 3,436 1,173,517 29 12 480,480 72 29 59.1% outer non-residences, waterInner Murano 1,532 357,805 43 17 296,876 52 21 17.0% outer non-residences, waterMurano island 4,968 1,531,322 32 13 777,356 64 26 49.2% outer non-residences, water
Neighborhood using cars and served by a car ferry
Lido island 15,881 4,781,372 33 13 2,026,641 78 32 57.6%beaches, outer parks, outer non-residences*
hectare = 10,000 m2 = 2.471 acres*Burano is off to the northeast, not close to Venice, on the far edge of the Lagoon.
P a g e | 10
American household travel surveys, despite an exhaustive search aided by Italian experts. We need a household travel survey to better quantify the systemic aspects of Venetian performance relative to American suburbia. More research, like a household survey of travel and spending, could begin to quantify the relationships among density, mobility, and economy.
We could improve our area estimates by putting the località lines on a map, a design CAD image, or a Google Earth image that calculates area. We could then draw the perimeter of the neighborhood walking area and measure its size.
We need information about how much local business there is and where it is located (including which floor and even floor area).
The census has several column variables with counts of different building types, but only two on surface area, one for housing and one for occupied housing. It would help to have major land use areas by use for “hotels, offices, commerce and industry, communications and transport” (a census category), housing, mixed use, streets and plazas, interior courtyards, and parks, to equal the sezioni area.
This data, combined with pedestrian flow patterns would help quantify walkable densities.
A complicating factor in the analysis of Venice, a major world tourist center, is the large visitor population that has much the same needs as residents for accommodations. While residents shop for food and go to work and school, visitors shop for souvenirs and fashion, eat at restaurants, and go to tourist sites. Venetians walk and ride vaporetti; tourists walk because they have to, and use vaporetti and water taxis. The less informed or more romantic ride in gondolas. We think the visitors have little impact on the neighborhood system of mobility and local business.
ConclusionVenice, by historical accident, shows that density, low-rise buildings,
and little area used for cars can function as well as suburbia with far lower external costs. Venice seems to have a system of mobility that works well without cars and has done so for hundreds of years. The ancient system is just as walkable today as it was then. Venice is not some exception that needs to be fixed. It is just as modern as it needs to be, and should be preserved, appreciated, and better understood as a model. This research made some progress on only one aspect of the analysis— walkable density.